Life Cycle Analysis of Natural Gas Extraction and Power Generation May 29, 2014 DOE/NETL-2014/1646 OFFICE OF FOSSIL ENERGY National Energy Technology Laboratory

Welcome message from author
This document is posted to help you gain knowledge. Please leave a comment to let me know what you think about it! Share it to your friends and learn new things together.
Transcript

Life Cycle Analysis of Natural Gas Extraction and Power Generation
May 29, 2014 DOE/NETL-2014/1646
OFFICE OF FOSSIL ENERGY
National Energy Technology Laboratory

Disclaimer This report was prepared as an account of work sponsored by an agency of the United States Government. Neither the United States Government nor any agency thereof, nor any of their employees, makes any warranty, express or implied, or assumes any legal liability or responsibility for the accuracy, completeness, or usefulness of any information, apparatus, product, or process disclosed, or represents that its use would not infringe privately owned rights. Reference therein to any specific commercial product, process, or service by trade name, trademark, manufacturer, or otherwise does not necessarily constitute or imply its endorsement, recommendation, or favoring by the United States Government or any agency thereof. The views and opinions of authors expressed therein do not necessarily state or reflect those of the United States Government or any agency thereof.

Author List:
National Energy Technology Laboratory (NETL)
Timothy J. Skone, P.E. Senior Environmental Engineer
Strategic Energy Analysis and Planning Division
Energy Sector Planning and Analysis (ESPA)
James Littlefield, Dr. Joe Marriott, Greg Cooney, Matt Jamieson, Jeremie Hakian, and Greg Schivley
Booz Allen Hamilton, Inc.
This report was prepared by Energy Sector Planning and Analysis (ESPA) for the United States Department of Energy (DOE), National Energy Technology Laboratory (NETL). This work was completed under DOE NETL Contract Number DE-FE0004001. This work was performed under ESPA Tasks 150.02 and 150.08.
The authors wish to acknowledge the excellent guidance, contributions, and cooperation of the NETL staff, particularly:
Erik Shuster, NETL Technical Monitor
DOE Contract Number DE-FE0004001

This page intentionally left blank.

Life Cycle Analysis of Natural Gas Extraction and Power Generation
Table of Contents Executive Summary ............................................................................................................................... 1 1 Introduction ......................................................................................................................................... 5 2 Inventory Method and Assumptions ................................................................................................... 5
2.1 Boundaries .................................................................................................................................. 5 2.2 Basis of Comparison (Functional Unit) ...................................................................................... 6
2.2.1 Global Warming Potential .................................................................................................. 6 2.3 Representativeness of Inventory Results .................................................................................... 7
2.3.1 Temporal ............................................................................................................................. 7 2.3.2 Geographic .......................................................................................................................... 7 2.3.3 Technological ...................................................................................................................... 8
2.4 Model Structure .......................................................................................................................... 8 3 Upstream Data .................................................................................................................................. 10
3.1 Natural Gas ............................................................................................................................... 10 3.1.1 Sources of Natural Gas ..................................................................................................... 10
3.1.1.1 Onshore ..................................................................................................................... 11 3.1.1.2 Offshore .................................................................................................................... 11 3.1.1.3 Associated ................................................................................................................. 11 3.1.1.4 Tight Gas ................................................................................................................... 12 3.1.1.5 Shale .......................................................................................................................... 12 3.1.1.6 Coal Bed Methane ..................................................................................................... 12 3.1.1.7 Imported Liquefied Natural Gas (LNG) ................................................................... 12
3.1.2 Natural Gas Composition .................................................................................................. 13 3.1.3 Natural Gas Extraction ...................................................................................................... 13
3.1.3.1 Well Construction and Installation ........................................................................... 13 3.1.3.2 Well Completion ....................................................................................................... 14 3.1.3.3 Liquid Unloading ...................................................................................................... 14 3.1.3.4 Workovers ................................................................................................................. 15 3.1.3.5 Other Point Source Emissions................................................................................... 15 3.1.3.6 Other Fugitive Emissions .......................................................................................... 15 3.1.3.7 Valve Fugitive Emissions (Extraction) ..................................................................... 17 3.1.3.8 Production Rate ......................................................................................................... 18
3.1.4 Natural Gas Processing ..................................................................................................... 19 3.1.4.1 Acid Gas Removal .................................................................................................... 19 3.1.4.2 Dehydration ............................................................................................................... 20 3.1.4.3 Valve Fugitive Emissions ......................................................................................... 20 3.1.4.4 Other Point Source Emissions................................................................................... 21 3.1.4.5 Other Fugitive Emissions .......................................................................................... 21 3.1.4.6 Natural Gas Compression ......................................................................................... 22
3.1.5 Venting and Flaring .......................................................................................................... 23 3.1.6 Natural Gas Transport ....................................................................................................... 24
3.1.6.1 Natural Gas Transport Construction ......................................................................... 24 3.1.6.2 Natural Gas Transport Operations ............................................................................ 24
3.2 Coal Acquisition and Transport ................................................................................................ 25 3.2.1 Powder River Basin Coal Extraction ................................................................................ 26
3.2.1.1 Equipment and Mine Site .......................................................................................... 26 3.2.1.2 Overburden Blasting and Removal ........................................................................... 26
i

Life Cycle Analysis of Natural Gas Extraction and Power Generation
3.2.1.3 Coal Recovery ........................................................................................................... 27 3.2.1.4 Coal Bed Methane Emissions ................................................................................... 27
3.2.2 Illinois No. 6 Coal Extraction ........................................................................................... 28 3.2.2.1 Equipment and Mine Site .......................................................................................... 28 3.2.2.2 Coal Mine Operations ............................................................................................... 28 3.2.2.3 Coal Bed Methane ..................................................................................................... 28
3.2.3 Coal Transport .................................................................................................................. 29 3.3 Data for Energy Conversion Facilities ...................................................................................... 29 3.4 Natural Gas Combined Cycle (NGCC) ..................................................................................... 30 3.5 Gas Turbine Simple Cycle (GTSC) .......................................................................................... 30 3.6 U.S. 2009 Average Baseload Natural Gas ................................................................................ 30 3.7 Integrated Gasification Combined Cycle (IGCC) ..................................................................... 31 3.8 Supercritical Pulverized Coal (SCPC) ...................................................................................... 31 3.9 Existing Pulverized Coal (EXPC) ............................................................................................. 31 3.10 U.S. 2009 Average Baseload Coal .......................................................................................... 32
3.10.1 Summary of Key Model Parameters ............................................................................... 32 4 Inventory Results .............................................................................................................................. 34
4.1 Upstream Inventory Results for Average Natural Gas Production ........................................... 34 4.1.1 Sensitivity Analysis .......................................................................................................... 38
4.2 Upstream Inventory Results for Marginal Natural Gas Production .......................................... 41 4.3 GHG Mitigation Options .......................................................................................................... 43 4.4 Comparison to Other Fossil Energy Sources ............................................................................ 46 4.5 Role of Energy Conversion ....................................................................................................... 46 4.6 Non-GHG Emissions ................................................................................................................ 49 4.7 Water Use .................................................................................................................................. 55 4.8 Water Quality ............................................................................................................................ 59
5 Land Use Calculation Method .......................................................................................................... 61 5.1 Transformed Land Area ............................................................................................................ 62
5.1.1 Extraction .......................................................................................................................... 62 5.1.2 Transmission Pipeline ....................................................................................................... 62 5.1.3 Natural Gas Power Plant ................................................................................................... 63 5.1.4 CO2 Pipeline ..................................................................................................................... 63 5.1.5 Saline Aquifer CO2 Sequestration Site ............................................................................. 63
5.2 Greenhouse Gas Emissions from Land Use .............................................................................. 66 5.3 Land Use Results ...................................................................................................................... 66
6 Status of Current Natural Gas Research ........................................................................................... 70 6.1 Other Natural Gas LCAs ........................................................................................................... 70 6.2 Natural Gas Research on Key Modeling Data .......................................................................... 72
6.2.1 Methane Leakage .............................................................................................................. 72 6.2.2 Estimated Ultimate Recovery ........................................................................................... 73
6.3 Data Limitations ........................................................................................................................ 73 6.3.1 Data Uncertainty ............................................................................................................... 73 6.3.2 Data Availability ............................................................................................................... 74
6.4 Recommendations for Improvement ......................................................................................... 75 6.4.1 Reducing the GHG Emissions of Natural Gas Extraction and Delivery .......................... 75 6.4.2 Reducing the GHG Emissions of Natural Gas and Coal-fired Electricity ........................ 75
7 Conclusions ....................................................................................................................................... 75 8 References ......................................................................................................................................... 77
ii

Life Cycle Analysis of Natural Gas Extraction and Power Generation
Appendix A: Unit Process Maps for Upstream Natural Gas ............................................................. A-1 Appendix B: Unit Process Maps for PRB Coal Extraction through Power Generation .................... B-1 Appendix C: Unit Process Maps for Illinois No. 6 Coal Extraction through Power Generation ...... C-1 Appendix D: Inventory Results in Alternate Units and Comprehensive LCA Metrics ..................... D-1
Figures Figure ES-1: Natural Gas and Coal GHG Emissions Comparison (Using 2007 IPCC GWPs) ............ 1 Figure ES-2: Cradle-to-Gate Reduction in Delivered Natural Gas for 2010 ......................................... 2 Figure 2-1: Life Cycle Stages and Boundary Definitions ...................................................................... 6 Figure 2-2: Natural Gas LCA Modeling Structure ................................................................................ 9 Figure 3-1: Fleet Baseload Heat Rates for Coal and Natural Gas in 2009 (EPA, 2012a) ................... 30 Figure 4-1: Upstream Cradle-to-gate Natural Gas GHG Emissions by Source ................................... 34 Figure 4-2: Upstream Cradle-to-gate Natural Gas GHG Emissions by Source and GWP .................. 35 Figure 4-3: Cradle-to-Gate Reduction in Extracted Natural Gas ......................................................... 36 Figure 4-4: Expanded Greenhouse Gas Results for Onshore Conventional Natural Gas .................... 37 Figure 4-5: Expanded Greenhouse Gas Results for Marcellus Shale Gas ........................................... 38 Figure 4-6: Sensitivity of Onshore Natural Gas GHG Emissions to Changes in Parameters .............. 39 Figure 4-7: Sensitivity of Marcellus Shale Natural Gas GHG Emissions to Changes in Parameters.. 39 Figure 4-8: Sensitivity of GHGs Results to Pipeline Distance ............................................................ 40 Figure 4-9: Uncertainty Contributions to Onshore Natural Gas GHGs ............................................... 41 Figure 4-10: Uncertainty Contributions to Marcellus Shale GHGs ..................................................... 41 Figure 4-11: Effect of NSPS on New or Modified Conventional Onshore Natural Gas Wells ........... 44 Figure 4-12: Effect of NSPS on New or Modified Marcellus Shale Natural Gas Wells ..................... 45 Figure 4-13: Comparison of Upstream GHG Emissions for Various Feedstocks ............................... 46 Figure 4-14: Life Cycle GHG Emissions for Electricity Production ................................................... 47 Figure 4-15: Comparison of Power Production GHG Emissions on 100- and 20-year GWPs ........... 48 Figure 4-16: Upstream CO Emissions for Natural Gas ....................................................................... 51 Figure 4-17: Upstream NOX Emissions for Natural Gas ..................................................................... 52 Figure 4-18: Life Cycle CO Emissions for Natural Gas Power Using Domestic Natural Gas Mix .... 54 Figure 4-19: Life Cycle NOX Emissions for Natural Gas Power Using Domestic Natural Gas Mix . 54 Figure 4-20: Upstream Water Use and Flowback Water Production .................................................. 55 Figure 4-21: Net Upstream Water Consumption ................................................................................. 56 Figure 4-22: Life Cycle Water Withdrawal and Discharge for Seven Natural Gas Sources through
NGCC Power ............................................................................................................................... 58 Figure 4-23: Life Cycle Water Withdrawal and Discharge for the Domestic Natural Gas Mix through
Different Power Plants ................................................................................................................. 59 Figure 4-24: Waterborne Total Dissolved Solid from Upstream Natural Gas..................................... 61 Figure 4-25: Waterborne Organics from Upstream Natural Gas ......................................................... 61 Figure 5-1: Direct Transformed Land Area for Upstream Natural Gas ............................................... 67 Figure 5-2: Direct Transformed Land Area for Natural Gas Power Using the 2010 Domestic Mix of
Natural Gas .................................................................................................................................. 67 Figure 5-3: Direct and Indirect Land Use GHG Emissions for Delivered Natural Gas ...................... 68 Figure 5-4: Direct and Indirect Land Use GHG Emissions for NGCC Power Using the 2010
Domestic Natural Gas Mix .......................................................................................................... 69 Figure 6-1: Comparison of Natural Gas Upstream GHGs from Other Studies ................................... 71
iii

Life Cycle Analysis of Natural Gas Extraction and Power Generation
Tables Table ES-1: Average and Marginal Upstream Greenhouse Gas Emissions (g CO2e/MJ Delivered) .... 3 Table 2-1: IPCC Global Warming Potentials (Forster, et al., 2007) ...................................................... 6 Table 3-1: Mix of U.S. Natural Gas Sources in 2010 (EIA, 2011a) .................................................... 11 Table 3-2: Natural Gas Composition on a Mass Basis (EPA, 2011a) ................................................. 13 Table 3-3: Other Point Source and Fugitive Emissions from Onshore Natural Gas Extraction .......... 16 Table 3-4: Other Point Source and Fugitive Emissions from Offshore Natural Gas Extraction ......... 17 Table 3-5: Other Point Source and Fugitive Emissions from Natural Gas Processing ........................ 21 Table 3-6: Natural Gas Composition and Associated Flaring Emissions ............................................ 23 Table 3-7: Coal Properties ................................................................................................................... 26 Table 3-8: Power Plant Performance Characteristics .......................................................................... 32 Table 3-9: Key Parameters for Seven Natural Gas Sources ................................................................ 33 Table 4-1: Production Rate Assumptions for Average and Marginal Cases ....................................... 42 Table 4-2: Average and Marginal Upstream Greenhouse Gas Emissions ........................................... 42 Table 4-3: Upstream Non-GHG Emissions ......................................................................................... 50 Table 4-4: Life Cycle Non-GHG Emissions for Natural Gas Power Using Domestic Natural Gas Mix
..................................................................................................................................................... 53 Table 5-1: Land Use Area for Natural Gas Life Cycle ........................................................................ 64 Table 5-2: State Land Use Profile for Natural Gas Life Cycle ............................................................ 65
iv

Life Cycle Analysis of Natural Gas Extraction and Power Generation
Acronyms and Abbreviations
AGR Acid gas removal ANFO Ammonium nitrate and fuel oil ANL Argonne National Laboratory API American Petroleum Institute bbl Barrel Bcf Billion cubic feet BTS Bureau of Transportation Statistics Btu British thermal unit CAA Clean Air Act CBM Coal bed methane CCS Carbon capture and sequestration CH4 Methane CHP Combined heat and power CO Carbon monoxide CO2 Carbon dioxide CO2e Carbon dioxide equivalent DOE Department of Energy eGRID Emissions & Generation Resource
Integrated Database ECF Energy conversion facility EIA Energy Information Administration EPA Environmental Protection Agency EUR Estimated ultimate recovery EXPC Existing pulverized coal FERC Federal Energy Regulatory
Commission g Gram gal Gallon GHG Greenhouse gas GTSC Gas turbine simple cycle GWP Global warming potential H2S Hydrogen sulfide Hg Mercury hp-hr Horsepower-hour IGCC Integrated gasification combined
cycle INGAA Interstate Natural Gas Association of
America IPCC Intergovernmental Panel on Climate
Change kg Kilogram km Kilometer kWh Kilowatt-hour lb, lbs Pound, pounds lb/ft Pounds per foot
LC Life cycle LCA Life cycle assessment/analysis LNG Liquefied natural gas LP Low pressure m Meter m3 Meters cubed Mcf Thousand cubic feet MCL Maximum contaminant level MJ Megajoule MMBtu Million British thermal units MMcf Million cubic feet MW Megawatt MWh Megawatt-hour N2O Nitrous oxide NARM North Antelope Rochelle Mine NETL National Energy Technology
Laboratory NG Natural gas NGCC Natural gas combined cycle NGL Natural gas liquids NH3 Ammonia NMVOC Non-methane volatile organic
compound NOX Nitrogen oxides NREL National Renewable Energy
Laboratory NSPS New Source Performance Standards OEL Open ended line Pb Lead PM Particulate matter PRB Powder River Basin psig Pounds per square inch gauge PT Product transport RFS Renewable Fuel Standards RMA Raw material acquisition RMT Raw material transport scf Standard cubic feet SCPC Super critical pulverized coal SF6 Sulfur hexafluoride SI International system of units SM Service mark SNG Synthetic natural gas SO2 Sulfur dioxide T&D Transmission and distribution TDS Total dissolved solids
v

Life Cycle Analysis of Natural Gas Extraction and Power Generation
Tcf Trillion cubic feet ton Short ton (2,000 lb) tonne Metric ton (1,000 kg) UP Unit process USGS United States Geological Survey
VEN Variable exhaust nozzle VOC Volatile organic compound WRI World Resources Institute WWTP Wastewater treatment plant µm Micrometer
vi

Life Cycle Analysis of Natural Gas Extraction and Power Generation
Executive Summary When accounting for a wide range of performance variability across different assumptions of climate impact timing, natural gas-fired baseload power production has life cycle greenhouse gas (GHG) emissions 35 to 66 percent lower than those for coal-fired baseload electricity. The lower emissions for natural gas (NG) are primarily due to the differences in average power plant efficiencies (46 percent efficiency for the natural gas power fleet versus 33 percent for the coal power fleet) and a higher carbon content per unit of energy for coal in comparison to natural gas. Natural gas-fired electricity has 57 percent lower GHG emissions than coal per delivered megawatt-hour (MWh) using current technology when compared with a 100-year global warming potential (GWP) using unconventional natural gas from tight gas, shale, and coal beds.
In a life cycle analysis (LCA), comparisons must be based on an equivalent service or function, which in this study is the delivery of 1 MWh of electricity to an end user. The life cycle (LC) GHG inventory used in this analysis also developed upstream (from extraction to delivery to a power plant) emissions for delivered energy feedstocks, including seven different domestic sources of natural gas, of which four are unconventional gas, and two types of coal, and then combined them both into domestic mixes. Details on different natural gas and coal feedstocks are important characterizations for the LCA community and can be used as inputs into a variety of processes. However, these upstream, or cradle-to-gate, results are not appropriate to compare when making energy policy decisions, since the two uncombusted fuels do not provide an equivalent function. The ways in which GHG conclusions can change when switching from an upstream basis to a life cycle basis of electricity production are shown in Figure ES-1. These results highlight the importance of specifying an end-use basis – not necessarily power production – when comparing different fuels.
Figure ES-1: Natural Gas and Coal GHG Emissions Comparison (Using 2007 IPCC GWPs)
488
1,124
573
1,203
8.4
4.9
18.7
11.7
0
5
10
15
20
25
0
300
600
900
1,200
1,500
100-yr 20-yr 100-yr 20-yr 100-yr 20-yr 100-yr 20-yr
Natural Gas Coal Natural Gas Coal
Fleet Baseload Power Extraction & Delivery
g CO
₂e/M
J
kg C
O₂e
/MW
h
1

Life Cycle Analysis of Natural Gas Extraction and Power Generation
Despite the conclusion that natural gas has lower GHG emissions than coal on a delivered power basis, the extraction and delivery of natural gas has a meaningful contribution to U.S.GHG emissions —25 percent of United States (U.S.) methane emissions and 2.2 percent of U.S. GHG emissions (EPA, 2013a). Figure ES-2 shows that, for natural gas that is consumed by power plants (or other large scale users), 92 percent of the natural gas extracted at the well is delivered to a power plant. The 8 percent share that is not delivered to a power plant is vented (either intentionally or unintentionally) as methane emissions, flared in environmental control equipment, or used as fuel in process heaters, compressors, and other equipment. For the delivery of 1,000 kg of natural gas to a power plant, 12.5 kg of methane is released to the atmosphere, 30.3 kg is flared to carbon dioxide (CO2) via environmental control equipment, and 45.6 kg is combusted in process equipment. When these mass flows are converted to a percent basis, methane emissions to air represent a 1.1 percent loss of natural gas extracted1, methane flaring represents a 2.8 percent loss of natural gas extracted, and methane combustion in equipment represents a 4.2 percent loss of natural gas extracted. These percentages are on the basis of extracted natural gas. Converting to a denominator of delivered natural gas gives a methane leakage rate of 1.2 percent.
Figure ES-2: Cradle-to-Gate Reduction in Delivered Natural Gas for 2010
The conclusions drawn from this analysis are robust to a wide array of assumptions. However, as with any inventory, they are dependent on the underlying data, and there are many opportunities to enhance the information currently being collected. This analysis shows that the results are both sensitive to and impacted by the uncertainty of a few key parameters: the use and emission of natural gas along the pipeline transmission network; the rate of natural gas emitted during unconventional gas extraction processes, such as well completion and workovers; and the lifetime production rates of wells, which determine the denominator over which lifetime emissions are calculated.
1 Converting to a denominator of delivered natural gas translates the methane leakage rate from 1.1 percent to 1.2 percent.
2

Life Cycle Analysis of Natural Gas Extraction and Power Generation
Table ES-1: Average and Marginal Upstream Greenhouse Gas Emissions (g CO2e/MJ Delivered)
Source Average Marginal Percent Change
Conventional Onshore 8.75 7.69 -12.2% Offshore 6.05 6.04 -0.3% Associated 7.64 7.58 -0.8%
Unconventional
Tight Gas 8.98 8.98 0.0% Barnett Shale 9.00 9.00 0.0% Marcellus Shale 9.11 9.11 0.0% Coal Bed Methane 7.84 7.84 0.0%
Liquefied Natural Gas 18.32 18.30 0.1%
This analysis inventoried both average and marginal production rates for each natural gas type, with results shown in Table ES-1. The average represents natural gas produced from all wells, including older and low productivity stripper wells. The marginal production rate represents natural gas from newer, higher productivity wells. The largest difference was for onshore conventional natural gas, which had a 12 percent reduction in upstream GHG emissions from 8.75 to 7.69 g CO2e/MJ when going from average to marginal production rates. This change has little impact on the life cycle GHG emissions from power production.
There are many opportunities for decreasing the GHG emissions from natural gas and coal extraction, delivery, and power production, including reducing fugitive methane emissions at wells and mines, and implementing advanced combustion technologies and carbon capture and storage. Since GHGs are not the only factor that should be considered when comparing energy options, this analysis also includes a full inventory of air emissions, water use and quality, and land use. Further, while this analysis is restricted to environmental metrics, energy options should be compared using a sustainability basis, which includes economic and social considerations (such as the ability to maintain energy reliability and security) in addition to environmental performance.
3

This page intentionally left blank.

Life Cycle Analysis of Natural Gas Extraction and Power Generation
1 Introduction Natural gas (NG) is considered a cleaner burning and more flexible alternative to other fossil fuels today. It is used in residential, commercial, industrial, and transportation applications in addition to having an expanding role in power production. However, the primary component of natural gas is methane, which is also a powerful greenhouse gas (GHG)—8 to 72 times as potent as carbon dioxide (CO2) (Forster et al., 2007). Losses of this methane to the atmosphere during the extraction, transmission, and delivery of natural gas to end users made up 25 percent of U.S. 2011 total methane emissions and 2.2 percent of all GHGs when comparing GHGs on a 100-year time frame(EPA, 2013a). The rate of loss and the associated emissions varies with the source of natural gas, both the geographic location of the formation, as well as the technology used to extract the gas.
This analysis expands upon previous life cycle analyses (LCA) of natural gas power generation technologies performed by the National Energy Technology Laboratory (NETL). It describes in detail the GHG emissions due to extracting, processing, and transporting various sources of natural gas to large end users, and the combustion of that natural gas to produce electricity. Emission inventories are created for the 2010 average natural gas production mix and also for natural gas produced from the next highly productive well for each source of natural gas. This context allows an analysis of what the emissions are currently and what they could be in the future.
This analysis also includes an expanded system that compares the life cycle (LC) GHGs from baseload natural gas-fired power plants with the GHGs generated by coal-fired plants, including extraction and transportation of the respective fuels. This comparison provides perspective on the scale of fuel extraction and delivery emissions relative to subsequent emissions from power generation and electricity transmission.
Beyond presenting the inventory, the goal of this analysis is to provide a clear presentation of NETL’s natural gas model, including documentation of key assumptions, data sources, and model sensitivities. Further, areas of large uncertainty in the inventory are highlighted, along with areas for potential improvement in both data collection and GHG reductions.
There are many opportunities for decreasing the GHG emissions from natural gas and coal extraction, delivery and power production, including reducing fugitive methane emissions at wells and mines, and implementing advanced combustion technologies and carbon capture and storage. GHGs are not the only factor that should be considered when comparing energy options, so this analysis also includes a full inventory of air emissions, water use and quality, and land use.
2 Inventory Method and Assumptions LCA is a systematic approach that calculates the environmental burdens of a product or system. The development of an LCA requires a boundary definition and a basis for comparison. The structure of a life cycle model and the data used by the model are also important aspects of performing an LCA.
2.1 Boundaries The first piece of this analysis is a cradle-to-gate GHG inventory that focuses on raw material acquisition (RMA) and raw material transport (RMT); as such, it is also referred to as an “upstream” inventory, in which “upstream” activities are the fuel acquisition and fuel transport activities that occur before fuel is combusted at a power plant. As shown in Figure 2-1, and in more detail in Figure 2-2, the boundary of RMA begins with all construction and operation activities necessary to extract fuel from the earth, and ends when fuel is extracted, prepared, and ready for final transport to the power plant. RMT begins with all construction and operation activities necessary to move fuel
5

Life Cycle Analysis of Natural Gas Extraction and Power Generation
from the extraction and processing point to the power plant, and ends at the power plant gate. The boundary of the upstream inventory of natural gas does not include the distribution system of natural gas to small end users, but rather is representative of delivery to a large end user such as a power plant or even a city gate.
The first portion of this analysis develops a detailed GHG profile of upstream natural gas. The second portion of this analysis applies a cradle-to-grave boundary that compares the GHG emissions from natural gas extraction and transport to those from electricity production and transmission. Coal-fired power systems are used as a further point of comparison.
Figure 2-1: Life Cycle Stages and Boundary Definitions
2.2 Basis of Comparison (Functional Unit) To establish a basis for comparison, the LCA method requires specification of a functional unit, the goal of which is to define an equivalent service provided by the systems of interest. Within the cradle-to-gate boundary of this analysis, the functional unit is 1 MJ of fuel delivered to the gate of an energy conversion facility or other large end user. When the boundaries of the analysis are expanded to include power production, the functional unit is the delivery of 1 MWh of electricity to the consumer. In both contexts, the period over which the service is provided is 30 years.
2.2.1 Global Warming Potential GHGs in this analysis are reported on a common mass basis of carbon dioxide equivalents (CO2e) using the global warming potentials (GWP) of each gas from the 2007 Intergovernmental Panel on Climate Change (IPCC) Fourth Assessment Report (Forster, et al., 2007). The default GWP used is the 100-year time frame, but in some cases, results for the 20-year time frame are presented as well. All GHG results in this report are expressed as 100-year GWPs unless specified otherwise. Selected results comparing all three time frames are included in Appendix D. Table 2-1 shows the GWPs used for the GHGs that were inventoried in this analysis.
Table 2-1: IPCC Global Warming Potentials (Forster, et al., 2007)
GHG 20-year 100-year (Default) 500-year
CO2 1 1 1 CH4 72 25 7.6 N2O 289 298 153 SF6 16,300 22,800 32,600
Stage #1 Raw Material
Acquisition (RMA)
Stage #2 Raw Material
Transport (RMT)
Stage #3 Energy
Conversion Facility (ECF)
Stage #4 Product
Transport (PT)
Cradle-to-gate (Upstream)
Cradle-to-grave
6

Life Cycle Analysis of Natural Gas Extraction and Power Generation
GWPs will change as our scientific understanding of climate change progresses. The IPCC recently finalized its fifth assessment report on climate change, which includes GWPs that will supplant the GWPs from the fourth assessment report (released in 2007). The fifth assessment report increases the 100-year GWP of methane from 25 to 28. Further, if the global warming caused by the decay of methane to CO2 is to be included within the boundaries of an analysis, the fifth assessment report recommends a 100-year GWP of 30 for methane. The GWP of methane is a function of the radiative forcing directly caused by methane in the atmosphere, as well as the radiative forcing from products of methane decay. IPCC increased the GWP of methane based on new data that shows that the lifetime of methane in the atmosphere is 12.4 years (a 12-year lifetime was used in the previous version). IPCC also increased the GWP of methane based on revised assumptions about relationships among methane, ozone, and water vapor in the atmosphere. (Stocker, Qin, & Platner, 2013)
IPCC’s fifth assessment report was finalized during the writing of this report. If the GHG results in this report were changed to the latest IPCC GWPs, the 100-year GWP for all methane results would increase by 20 percent, and the 20-year GWP for all methane results would increase by 18 percent. This would increase the values for total GHG results, but would not change any of the conclusions in this analysis.
2.3 Representativeness of Inventory Results This inventory uses data gathered from a variety of sources, each of which represents a particular temporal period, geographic location, and state of technology. Since the results of this study are the combination of each of those sources, this section discusses what the results of this study represent in each of those categories.
2.3.1 Temporal The natural gas upstream inventory results best represent the year 2010, because of the use of the 2010 Energy Information Administration (EIA) natural gas production data to create the mix of natural gas sources in the domestic average result. The inventory results for energy conversion facilities are based on advanced power plants modeled by NETL in 2010 (NETL, 2010a), and 2009 operating data for U.S. power plants as reported in the latest version of EPA’s Emissions & Generation Resource Integrated Database (eGRID) (EPA, 2012a). There would be little year-over-year change to the information, and so this LCA could represent a longer time period, from 2004 to 2015.
Some information included in this inventory pre-dates the temporal period stated above, but was determined to be the latest or highest quality available data.
The time frame of this study is 30 years, but that does not accurately represent a well drilled 30 years from now or a well operating 60 years into the future. Assumptions are made about resource availability based on both current estimated ultimate recovery (EUR) values, and also forecasts from the EIA.
2.3.2 Geographic The results of this inventory are representative of the lower 48 states in the U.S. Natural gas from Alaska and natural gas imports from and exports to Canada are not explicitly included in this analysis. However, some data sources do not provide detailed geographic information, so it is possible that data for natural gas produced outside of the lower 48 states is included in some modeling parameters. The error associated with such geographic boundary inconsistencies was determined to be insignificant.
7

Life Cycle Analysis of Natural Gas Extraction and Power Generation
2.3.3 Technological The natural gas upstream inventory results include two distinct technological representations. The first is a baseline result that represents average 2010 natural gas production, including production from older, less productive wells. Production data from that year is used to create an average domestic mix of natural gas sources, and the production rate of each source well is generally based on 2009 well count and production data. The second set of results is representative of a new marginal unit of natural gas produced in 2009; these results use a variety of methods to create production rates for wells, which would create the next unit of natural gas.
The power plant results are a mix of current and advanced technologies. This analysis includes fleet power plants that are representative of installed technology as of 2011. This analysis also includes advanced power plants – with and without CO2 capture – that are representative of the latest technology but have not achieved broad commercialization.
2.4 Model Structure All results for this inventory were calculated by NETL’s LCA model for natural gas power systems. This model is an interconnected network of operation and construction blocks covering fuel extraction through electricity transmission. Each block in the model, referred to as a unit process, accounts for the key inputs and outputs of an activity. The inputs of a unit process include the purchased fuels, resources from nature (fossil feedstocks, biomass, or water), and man-made raw materials. The outputs of a unit process include air emissions, water effluents, solid waste, and product(s). The role of an LCA model is to calculate the values for all intermediate flows within the interconnected network of unit processes, and then scale the flows of all unit processes to a common basis, or functional unit.
The network of unit processes used for the modeling of natural gas power is shown in Figure 2-2. Note that only the RMA and RMT portions of the model are necessary to determine the upstream environmental burdens of natural gas; a broader scope – from RMA through delivery of electricity – is necessary to determine the cradle-to-grave environmental burdens of natural gas power. For simplicity, the following figure shows the extraction and delivery for a generic natural gas scenario; NETL’s actual model uses seven parallel modules to arrive at the life cycle results for a mix of seven types of natural gas. This figure also shows a breakdown of the RMA stage into extraction and processing sub-stages.
8

Life Cycle Analysis of Natural Gas Extraction and Power Generation
Figure 2-2: Natural Gas LCA Modeling Structure
Raw Material Acquisition
ProcessingExtraction
Gas Centrifugal Compressor
Valve Fugitive Emissions
Dehydration
Acid Gas Removal
Reciprocating Compressor
Electrical Centrifugal Compressor
Liquids Unloading
Workovers
Other Point Source Emissions
Venting and Flaring
Other Fugitive Emissions
Venting and Flaring
Venting and Flaring
Well Construction
Well CompletionVenting/Flaring
Other Point Source Emissions
Other Fugitive Emissions
Valve Fugitive Emissions
Venting and Flaring
Venting and Flaring
Diesel
Steel
Concrete
Surface Water for
Hydrofracking (Marcellus Only)
Transport of Water by Truck
(Marcellus Only)
Flowback Water Treated at a
WWTP (Marcellus Only)
Diethanolamine
Electricity
Flowback Water Treated by
Crystallization (Marcellus Only)
Diesel
Electricity
Water Withdrawal &
Discharge During Well Operation
Raw Material Transport
Pipeline Operation (Energy &
Combustion Emissions)
Pipeline Construction
SteelElectricity
Pipeline Operation (Fugitive Methane)
Concrete
Venting/Flaring
Venting/Flaring
Venting/Flaring
Energy Conversion Facility
Plant OperationPlant Construction
Trunkline Operation
Switchyard and Trunkline Construction
CCUS OperationCCUS Construction
Cast Iron
Steel
Concrete
Aluminum
Diesel
Saline Aquifer Operation
Saline Aquifer Site Preparation and
Construction
Product Transport
Transmission & Distribution
EndUse
End Use(Assume 100%
Efficient)
9

Life Cycle Analysis of Natural Gas Extraction and Power Generation
3 Upstream Data Upstream data include the supply shares of natural gas and coal, as well as the energy requirements and material flows for the key activities for extraction, processing, and transport. These data are used to model the RMA and RMT stages in NETL’s natural gas and coal models.
3.1 Natural Gas The primary unit processes of this model are based on data compiled by NETL. Secondary unit processes, such as production of construction materials besides steel, are based on third party data. Appendix A includes details on how these data are assembled in a model and references the detailed documentation in NETL’s unit process library.
Where data for the inventory are available, high and low values are collected, along with an expected value. When results are presented, three cases are shown: an expected case, a high case, and a low case. The high and low results (error bars on the results) are a deterministic representation of the variability on the data and not indicative of an underlying distribution or likelihood.
3.1.1 Sources of Natural Gas This inventory and analysis includes results for natural gas domestically extracted from seven sources in the lower 48 states:
1. Conventional onshore 2. Associated 3. Conventional offshore 4. Tight gas 5. Barnett Shale 6. Marcellus Shale 7. Coal bed methane
This is not a comprehensive list of natural gas extracted or consumed in the U.S. Natural gas extracted in Alaska, which accounts for 1 percent of domestically extracted natural gas, is included as conventional onshore production. The Haynesville shale play makes up a large portion of unconventional shale production, but it is assumed in this analysis that the Barnett and Marcellus play is representative of all shale gas production. Imported natural gas (12 percent of 2009 total consumption, 95 percent of which is imported via pipeline from Canada) is not included. About 5 percent of imports in 2010 were brought in as liquefied natural gas (LNG) from a variety of countries of origin. While this inventory includes a profile for LNG from offshore extraction in Trinidad and Tobago, imported LNG is not included in the domestic production mix.
Table 3-1 shows the makeup of the domestic production mix in the U.S. in 2010 and the mix of conventional and unconventional extraction. Note that in 2010, unconventional natural gas sources accounted for 59 percent of production and the majority of consumption in the U.S. (EIA, 2013).
10

Life Cycle Analysis of Natural Gas Extraction and Power Generation
Table 3-1: Mix of U.S. Natural Gas Sources in 2010 (EIA, 2011a)
Source Conventional Unconventional
Onshore Offshore Associated Tight Barnett Shale
Marcellus Shale CBM
Domestic Mix 22% 12% 7% 27% 21% 2% 9%
Type Mix 41% 59%
54% 30% 16% 45% 35% 4% 16%
The characteristics of these seven sources of natural gas are summarized below, including a description of the extraction technologies.
3.1.1.1 Onshore Conventional onshore natural gas is recovered by vertical drilling techniques. Once a conventional onshore natural gas well has been discovered, the natural gas reservoir does not require significant preparation or stimulation for natural gas recovery. Approximately 22 percent of U.S. natural gas production was from conventional onshore gas wells in 2010 (EIA, 2013).
An intermittent procedure called “liquids unloading” is performed at mature onshore conventional natural gas wells to remove water and other liquids from the wellbore; if these liquids are not removed, the flow of natural gas is impeded. Another intermittent activity is a well workover, which is necessary to repair damage to the wellbore and replace downhole equipment, if necessary.
Natural gas is lost through intentional venting, which may be necessary for safety reasons, during well completion when natural gas recovery equipment or gathering lines have not yet been installed, or when key process equipment is offline for maintenance. When feasible, vented natural gas can be recovered and flared, which reduces the GWP of the vented natural gas by converting CH4 to CO2. Losses of natural gas also result from fugitive emissions due to the opening and closing of valves, and processes where it is not economically or technically feasible to use vapor recovery equipment.
3.1.1.2 Offshore Conventional offshore natural gas is recovered by vertical drilling techniques, similar to onshore. Once a conventional offshore natural gas well has been discovered, the natural gas reservoir does not require significant preparation or stimulation for natural gas recovery. A natural gas reservoir must be large in order to justify the capital outlay for the completion of a well and the construction of an offshore drilling platform, so production rates for offshore wells tend to be high. Approximately 12 percent of U.S. natural gas production was from offshore wells in 2010 (EIA, 2013).
3.1.1.3 Associated Associated natural gas is co-extracted with crude oil. The extraction of onshore associated natural gas is similar to the extraction methods for conventional onshore natural gas (discussed above). Similar to conventional onshore and offshore natural gas wells, associated natural gas extraction includes losses due to well completion, workovers, and fugitive emissions. Since the natural gas is co-produced with petroleum, the use of oil/gas separators is necessary to recover natural gas from the mixed product stream. Another difference between associated natural gas and other conventional natural gas sources is that liquid unloading is not necessary for associated natural gas wells, because the flow of petroleum prevents the accumulation of liquids in the well. Approximately 7 percent of U.S. natural gas production was from conventional onshore oil wells in 2010 (EIA, 2013).
The product profiles of associated wells are variable, with some associated wells producing more natural gas than oil and other associated wells producing more oil than gas. Since the objective of
11

Life Cycle Analysis of Natural Gas Extraction and Power Generation
this analysis is to account for the majority of natural gas production sources, so the associated wells in this analysis are representative of gas wells that produce a small fraction of petroleum, not petroleum wells that produce a small fraction of natural gas.
3.1.1.4 Tight Gas Tight gas is the largest single source of domestically produced natural gas and is also the largest share of unconventional natural gas. Tight gas is dispersed through impermeable rock or non-porous sand formations. There are several technologies for extracting tight gas, including hydraulic fracturing and acidizing. Hydraulic fracturing stimulates tight gas production by breaking apart the impermeable substances that impede gas flow, while acidification pumps acid and other agents that dissolve limestone and other minerals that impede gas flow. (NGSA, 2010) This analysis assumes tight gas wells are vertically drilled and hydraulically fractured. Approximately 27 percent of U.S. natural gas production was from tight gas deposits in 2010 (EIA, 2013).
3.1.1.5 Shale Natural gas is also dispersed throughout shale formations, such as the Barnett Shale region in northern Texas and the Marcellus Shale region in Pennsylvania, West Virginia, and Ohio. Shale gas cannot be recovered using conventional extraction technologies, but can be recovered through the use of horizontal drilling and hydraulic fracturing (hydrofracking). Horizontal drilling creates a wellbore that runs the length of a shale formation, and hydrofracking uses high pressure fluid (a mixture of water, surfactants, and proppants) for breaking apart the shale formation and facilitating the flow of natural gas. Hydrofracking is performed during the original completion of a shale gas well, but due to the steeply declining production curves of shale gas wells, hydrofracking is also performed during the workover of shale gas wells. Unlike conventional natural gas wells, shale gas wells do not require liquid unloading, because wellbore liquids are reduced during workover operations. Natural gas from shale formations accounted for approximately 23 percent of U.S. natural gas production in 2010 (EIA, 2013).
3.1.1.6 Coal Bed Methane Natural gas can be recovered from coal seams through the use of shallow horizontal drilling. The development of a well for coal bed methane (CBM) requires horizontal drilling followed by a depressurization period during which naturally occurring water is discharged from the coal seam. CBM wells do not require liquid unloading, and the emissions from CBM workovers are similar to those for shale gas wells. The production of natural gas from CBM wells accounted for approximately 9 percent of U.S. natural gas production in 2010 (EIA, 2013).
According to EPA’s Underground Injection Control program, CBM wells often require hydraulic fracturing (EPA, 2004a). When drilling horizontally, hydraulic fracturing is not necessary for CBM wells because horizontal wellbores align with naturally occurring vertical fractures in coal beds (EPA, 2009). Industry practices for CBM well development may vary, but there is consensus that CBM wells have low pressures. Well pressure is the key determinant of GHG emissions from well development and is the basis for calculating CBM well completion emissions (as described in Section 3.1.3.2).
3.1.1.7 Imported Liquefied Natural Gas (LNG) This analysis includes a scenario for imported LNG. The LNG scenario is for imported natural gas, so it is not included in any results for the domestic production mix. The imported LNG scenario is representative of natural gas that is extracted offshore from Trinidad and Tobago, liquefied at an
12

Life Cycle Analysis of Natural Gas Extraction and Power Generation
onshore liquefaction facility in Trinidad and Tobago, loaded onto a LNG ocean carrier that travels to the Gulf Coast of the U.S., and regasified at an LNG terminal in Lake Charles, Louisiana. The regasified natural gas is then sent to the U.S. natural gas transmission pipeline system. The extraction of natural gas offshore from Trinidad and Tobago is modeled using the same data that was developed for U.S. offshore extraction (as described in Section 3.1.1.2). Details on the liquefaction, ocean transport, and regasification processes in the LNG supply chain are included in Appendix A.
3.1.2 Natural Gas Composition The composition of natural gas varies considerably depending on source. For simplicity, a single assumption regarding natural gas composition is used, although that composition is modified as the natural gas is prepared for the pipeline (EPA, 2011a). Table 3-2 shows the composition on a mass basis of production and pipeline quality natural gas.
Table 3-2: Natural Gas Composition on a Mass Basis (EPA, 2011a)
Component Production Pipeline Quality CH₄ (Methane) 78.3% 92.8% NMVOC (Non-methane VOCs) 17.8% 5.54% N₂ (Nitrogen) 1.77% 0.55% CO₂ (Carbon Dioxide) 1.51% 0.47% H₂S (Hydrogen Sulfide) 0.50% 0.01% H₂O (Water) 0.12% 0.01%
3.1.3 Natural Gas Extraction Natural gas extraction includes the construction and development of wells, steady-state operations, and intermittent maintenance activities.
3.1.3.1 Well Construction and Installation The construction of natural gas wells requires a well casing that provides strength to the well bore and prevents contamination of the geological formations that surround the gas reservoir. In the case of offshore extraction, a large platform is also required. A well is lined with a carbon steel casing that is held in place with concrete. A typical casing has an inner diameter of 8.6 inches, is 0.75 inches thick, and weighs 24 pounds per foot (lb/ft) (NaturalGas.org, 2004). The total length of a natural gas well is variable, based on the natural gas extraction profile under consideration. The total weight of materials for the construction of a well bore is estimated by factoring the total well length by the linear weight of carbon steel and concrete.
The installation of natural gas wells includes the drilling of the well, followed by the installation of the well casing. Horizontal drilling is used for unconventional natural gas reserves where hydrocarbons are dispersed throughout a matrix of shale or coal. An advanced drilling rig has a drilling speed of 17.8 meters per hour, which translates to the drilling of a 7,000 foot well in approximately 10 days (NaturalGas.org, 2004). A typical diesel engine used for oil and gas exploration has a power of 700 horsepower and a heat rate of 7,000 Btu/hp-hr (EPA, 1995). The methane emissions from well installation are the product of the following three variables: heat rate of the drilling engine (7,000 Btu/hp-hr), methane emission factor (EPA, 1995) for diesel combustion in stationary industrial engines (6.35E-05 lb/hp-hr), and total drilling time (in hours).
The construction and material requirements are apportioned to 1 kg of natural gas production, by dividing them by the lifetime production of the well. Thus, construction and material requirements,
13

Life Cycle Analysis of Natural Gas Extraction and Power Generation
and associated GHG emissions, are apportioned over the lifetime production rate specific to each type of natural gas well, based on average well production rates.
3.1.3.2 Well Completion The data for well completion describe the emission of natural gas that occurs during the development of a well, before natural gas recovery and other equipment have been installed at the wellhead. Well completion is an episodic emission; it is not a part of daily, steady-state well operations, but represents a significant emission from an event that occurs one time in the life of a well.
The methane emissions from the completion of conventional and unconventional wells are based on emission factors developed by the Environmental Protection Agency (EPA) (EPA, 2011a, 2012c)1. Conventional wells produce 37 Mcf/completion, tight gas wells produce 3,600 Mcf/completion, shale wells produce 9,000 Mcf/completion, and coal bed methane wells produce 50 Mcf/completion.
Within the unconventional well category, NETL adjusted EPA’s completion emission factors to account for the different reservoir pressures of unconventional wells. NETL used EPA’s emission factor of 9,000 Mcf of methane per completion for shale gas wells. NETL adjusted this emission factor downward for tight gas in order to account for the lower reservoir pressures of tight gas wells. The pressure of a well (and, in turn, the volume of natural gas released during completion) is associated with the production rate of a well and therefore was used to scale the methane emission factor. The production rate of tight gas wells is 40 percent of that for Barnett Shale wells (with EUR of 1.2 Bcf for tight gas vs. 3.0 Bcf for Barnett Shale), and thus NETL assumes that the completion emission factor for tight gas wells is 3,600 Mcf of methane per completion (40 percent × 9,000 = 3,600).
CBM wells also involve unconventional extraction technologies, but have lower reservoir pressures than shale gas or tight gas wells. The corresponding emission factor of CBM wells is 49.57 Mcf of methane per completion, which is the well completion factor that EPA reports for low pressure wells (EPA, 2011a).
The analysis tracks flows on a mass basis, so it is necessary to convert these emission factors from a volumetric to a mass basis. For instance, when factoring for the density of natural gas (0.042 lb/scf) (API, 2009), a conventional completion emission of 36.65 Mcf is equivalent to 1,540 lbs. (699 kg) of methane (CH4) per completion.
3.1.3.3 Liquid Unloading The data for liquid unloading describe the emission of natural gas that occurs when water and other condensates are removed from a well. These liquids impede the flow of natural gas from the well; thus, producers must occasionally remove the liquids from the wellbore. Liquid unloading is necessary for conventional gas wells—it is assumed that unconventional wells or associated gas wells do not require liquid unloading as a standard practice. Liquid unloading is an episodic
1 The Draft Inventory of Greenhouse Gas Emissions and Sinks: 1990-2012 was released for public comment by the EPA on February 21, 2014 (during the writing of this report). The draft inventory uses a new method for calculating the methane emissions from the completion of unconventional wells (EPA, 2014). The current inventory (EPA, 2013a), which is used by NETL’s natural gas LCA, uses potential emission factors that represent the amount of methane that would be emitted if no emission capture and flaring systems were available. NETL calculates the effect that environmental controls (i.e., 15 and 51 percent flaring for unconventional and conventional wells, respectively) have on potential emission factors to convert potential emissions to post-control emissions. The draft inventory (EPA, 2014) calculates net emission factors, which represent the emissions that occur after emission control technologies are employed, and therefore no longer reports potential emission factors. The net emission factors have scenarios for well completion and workover emissions for reduced emission completions (REC) as well as scenarios where vented gas is not captured or flared (EPA, 2013b).
14

Life Cycle Analysis of Natural Gas Extraction and Power Generation
emission; it is not a part of daily, steady-state well operations, but represents a significant emission from the occasional maintenance of a well. Liquid unloading releases 3.6 Mcf of natural gas per episode. The average conventional well has 31 liquid unloading episodes per year, which is equivalent to 930 unloadings over a 30-year period (EPA, 2011c).
3.1.3.4 Workovers Well workovers are necessary for cleaning wells. Hydraulic fracturing is used for shale and tight gas well workovers to re-stimulate natural gas formations. The workover of a well is an episodic emission; it is not a part of daily, steady-state well operations, but represents a significant emission from the occasional maintenance of a well. As stated in EPA’s technical support document of the petroleum and natural gas industry (EPA, 2011a), conventional wells produce 2.454 Mcf of methane per workover. EPA assumes that the emissions from unconventional well workovers are equal to the emission factors for unconventional well completion (EPA, 2011a). Thus, for unconventional wells, this analysis uses the same emission factors for well completion (discussed above) and well workovers. Unlike well completions, well workovers occur more than one time during the life of a well. For conventional wells, there were approximately 389,000 wells and 14,600 workovers in 2007 (EPA, 2011a), which translates to 0.037 workovers per well-year. Unconventional wells have 0.3 workovers during a 30-year period (i.e., 1 workover every 100 years) (Shires & Lev-On, 2012).
3.1.3.5 Other Point Source Emissions Routine emissions from natural gas extraction include gas that is released from wellhead and gathering equipment. These emissions are referred to as “other point source emissions.” This analysis assumes that a portion of these emissions are flared, while the balance is vented to the atmosphere. For conventional wells, 51 percent of other point source emissions are flared, while for unconventional wells, a 15 percent flaring rate is used (EPA, 2011a).
The data for other point source emissions from onshore extraction are based on EPA data representative of 2006 natural gas production (EPA, 2011b). The original data (EPA, 2011b) include emissions from construction, dehydration, compressors, well completion, and pneumatic devices; these processes are accounted for elsewhere in NETL’s model and thus are not included in the emission factors for other point source and fugitive emissions. Additionally, emissions from Kimray pumps (used to pump glycol for dehydrators), condensate tanks, and compressor blowdowns are re-categorized as natural gas processing emissions in NETL’s model, and are thus not included in the emission factors for natural gas extraction. Based on EPA’s data (EPA, 2011b) and NETL’s boundary assumptions, the emission factor for other point source emissions from onshore gas extraction are 7.49E-05 kg CH4/kg NG extracted. The data for these calculations are included in Table 3-3.
3.1.3.6 Other Fugitive Emissions Routine emissions from natural gas extraction include fugitive emissions from equipment not accounted for elsewhere in NETL’s model. These emissions are referred to as “other fugitive emissions,” and cannot be captured for flaring. Data for other fugitive emissions from natural gas extraction are based on EPA data for onshore and offshore natural gas wells (EPA, 2011a). EPA’s data is based on 2006 production (EPA, 2011a) and shows the annual methane emissions for specific extraction activities. This analysis translated EPA’s annual data to a unit production basis by dividing the methane emission rate by the natural gas production rate in 2006. Based on EPA’s data (EPA, 2011b) and NETL’s boundary assumptions, the emission factor for other point source emissions from onshore gas extraction are 1.02E-03 kg CH4/kg NG extracted. The emission factors for other fugitive emissions from onshore and offshore natural gas extraction are included in Table 3-3.
15

Life Cycle Analysis of Natural Gas Extraction and Power Generation
Table 3-3: Other Point Source and Fugitive Emissions from Onshore Natural Gas Extraction
Emission Source MMcf/year Included in other
NETL UP or within NG processing
Point Source Fugitive
Normal Fugitives Gas Wells 2,751 Construction
Heaters 1,463 1,463 Separators 4,718 4,718 Dehydrators 1,297 Dehydrator
Meters/Piping 4,556 4,556
Small Reciprocating Comp. 2,926 Reciprocating Compressor
Large Reciprocating Comp. 664 Reciprocating Compressor
Large Reciprocating Compressor Stations 45 Reciprocating Compressor
Pipeline Leaks 8,087 8,087 Vented and Combusted
Completion Flaring 0 Well Completion V&F Well Drilling 96 Well Completion Coal Bed Methane 3,467 Well Completion
Pneumatic Device Vents 52,421 Pneumatic Devices Chemical Injection Pumps 2,814 2,814 Kimray Pumps (Glycol Pumps for Dehydrators) 11,572 In NG processing
boundary
Dehydrator Vents 3,608 Dehydrator V&F
Condensate Tanks without Control Devices 1,225 In NG processing boundary
Condensate Tanks with Control Devices 245 In NG processing boundary
Gas Engines, Compressor Exhaust Vented 11,680 Gas Compressor
Well Workovers Well Workovers, Gas Wells 47 Well Workovers Well Workovers, Well Clean Ups (Low Pressure [LP] Gas Wells) 9,008 Well Workovers
Blowdowns Blowdowns, Vessel 31 31 Blowdowns, Pipeline 129 129
Blowdowns, Compressors 113 In NG processing boundary
Blowdowns, Compressor Starts 253 In NG processing boundary
Upsets Pressure Relief Valves 29 29
Mishaps 70 70 Total Emissions 123,315 1,494 20,403 Total NG Extracted 19,950,828
Emission Rate (lb. CH4/lb. NG extracted) 7.49E-05 1.02E-03
16

Life Cycle Analysis of Natural Gas Extraction and Power Generation
Table 3-4: Other Point Source and Fugitive Emissions from Offshore Natural Gas Extraction
Emission Source MMcf/year Included in other NETL UP Point Source Fugitive
Amine Gas Sweetening Unit 0.2 AGR and CO2 Removal
Boiler/Heater/Burner 0.8 0.80
Diesel or Gasoline Engine 0.01 0.01
Drilling Rig 3 Construction
Flare 24 Venting and Flaring
Centrifugal Seals 358 Centrifugal Compressor
Connectors 0.8 0.80
Flanges 2.4 2.38
Open Ended Line (OEL) 0.1 0.10
Other 44 44.0
Pump Fugitive 0.5 0.50
Valves 19 19.00
Glycol Dehydrator 25 Dehydrator
Loading Operation 0.1 0.10
Separator 796 796
Mud Degassing 8.0 8.00
Natural Gas Engines 191 Reciprocating Compressor
Natural Gas Turbines 3.0 Centrifugal Compressor
Pneumatic Pumps 7.0 Pneumatic Devices
Pressure Level Controls 2.0 2.00
Storage Tanks 7.0 7.00 Variable Exhaust Nozzle (VEN) Exhaust Gas 124 124
Total Emissions 1616 140 865
Total Processed NG 3,584,190 Emission Rate (lb. CH4/lb. NG extracted) 3.90E-05 2.41E-04
3.1.3.7 Valve Fugitive Emissions (Extraction) The extraction of natural gas uses pneumatic devices for the opening and closing of valves and other control systems. When a valve is opened or closed, a small amount of natural gas leaks through the valve stem and is released to the atmosphere. It is not feasible to install vapor recovery equipment on all valves and other control devices at a natural gas extraction site, and thus the pneumatic operation of valves results in the emission of fugitive gas. Valve fugitive emissions were calculated for onshore and offshore production using annual inventory and production data:
• The annual emissions from pneumatic devices used for onshore production are 52,421 MMcf of methane; annual onshore production is 19,950,828 MMcf (EPA, 2011a). Dividing emissions by production (followed by conversion to a mass basis) results in an emission factor of 2.63E-03 kg of CH4 per kg of natural gas produced.
17

Life Cycle Analysis of Natural Gas Extraction and Power Generation
• The annual emissions from pneumatic devices used for offshore production are 7 MMcf of methane; annual offshore production is 3,584,190 MMcf (EPA, 2011a). Dividing emissions by production (followed by conversion to a mass basis) results in an emission factor of 1.95E-06 kg of CH4 per kg of natural gas produced.
3.1.3.8 Production Rate The parameters for EUR account for the amount of natural gas produced by a well during a 30-year period. The average production rate for conventional onshore natural gas wells in is 66 Mcf per day. This production rate was calculated by dividing the amount of onshore conventional natural gas production (5.2 Tcf) by the total count of onshore conventional natural gas wells (216,000 wells) (EIA, 2011a, 2014). Projecting the average annual production rate of onshore conventional natural gas over a 30-year period gives an EUR of 0.72 Bcf/well. An uncertainty of +/- 30 percent is assigned to this EUR to account for the variability in the production rates from onshore conventional wells.
The EUR for Marcellus Shale natural gas wells is calculated by performing a decline curve analysis of new wells in the Marcellus Play. A decline curve represents the production rate of a well over time, with the area under the curve representing the EUR of the well. The initial decline rate and hyperbolic exponent describe the shape of the decline curve; these two variables also determine the rate of the production decline. For Marcellus Shale, the first-month decline rate and decline exponent estimated by EIA are 29 percent and 1.38, respectively (Long, 2011). The initial production rate has a great impact on the total EUR of a well since the initial production rate is the maximum production rate within the entire well life and is the starting point for the decline curve. Initial production rates for 766 wells in the Marcellus region are reported by New York, Pennsylvania, and West Virginia state environmental agencies (NYDEC, 2011; PADEP, 2011; WVGES, 2011). NETL split the initial production rates for these 766 wells into three performance categories: low, medium, and high production rates. The low performers include the lower third of the production rate distribution and were excluded from further analysis under the assumption that they are capped immediately after completion because they are not productive enough to justify production when natural gas prices are low. The medium performers are within the inner third of the production rate distribution and have an EUR of 2.2 Bcf/well. The high performers represent the top third of the production rate distribution and have an EUR of 4.9 Bcf/well. NETL uses an EUR of 3.3 Bcf, which falls between the average EURs of the medium and high production categories, for the expected EUR of Marcellus Shale natural gas. The EURs for medium performers (2.2 Bcf/well) and high performers (4.9 Bcf/well) are used to account for the low and high uncertainty bounds of Marcellus Shale EUR.
The production rates of offshore natural gas wells were calculated from 2009 production data reported by 2,600 gas wells and 3,000 oil wells in the Gulf of Mexico (EIA, 2010). In 2009, these wells produced 2,460 Bcf of natural gas and 570 million barrels of oil. Energy-based allocation was used to scale the gas production rate to make it equivalent to a well that produces only natural gas. This allocation required the conversion of natural gas and oil production from a volumetric to an energy basis (1,027 MMBtu/Mcf natural gas and 5.8 MMBtu/bbl oil). By factoring the production rates, shares of gas and oil production, and well counts, the expected production rate of 2,800 Mcf/well-day was calculated. Over a 30-year period, this is equivalent to an EUR of 30.7 Bcf. An uncertainty of +/- 30 percent is assigned to this EUR to account for the variability in the production rates from offshore wells.
The EURs for other well types were not calculated from large samples of well data, but are based on EURs reported in trade journals and other literature.
18

Life Cycle Analysis of Natural Gas Extraction and Power Generation
3.1.4 Natural Gas Processing This analysis models the processing of natural gas by developing an inventory of key gas processing operations, including acid gas removal, dehydration, and sweetening. Standard engineering calculations were applied to determine the energy and material balances for the operation of key natural gas equipment. The natural gas processing data is summarized below. Appendix A includes details on how these data are assembled in a model and refers to the detailed documentation in NETL’s unit process library.
3.1.4.1 Acid Gas Removal Raw natural gas contains varying levels of hydrogen sulfide (H2S), a toxic gas that reduces the heat content of natural gas and causes fouling when combusted in equipment. Amine-based processes are the predominant technologies for the removal of H2S from natural gas. The H2S content of raw natural gas is highly variable, with concentrations ranging from 5.7E-05 kg of H2S per kg of natural gas to 0.16 kg of H2S per kg of natural gas. This analysis assumes an H2S concentration of 0.025 moles of H2S/kg of natural gas (moles per kg may be an unusual ratio, but it is necessary for performing the mass flow math in the acid gas removal unit process). This H2S concentration is based on raw gas composition data compiled by the Gas Processors Association (Foss, 2004).
The energy consumed by the amine reboiler accounts for the majority of energy consumed by the sweetening process. Reboiler energy consumption is a function of the amine flow rate, which, in turn, is related to the amount of H2S removed from natural gas. Approximately 0.30 moles of H2S are removed per 1 mole of circulated amine solution (Polasek & Bullin, 2006), the reboiler duty is approximately 1,000 Btu per gallon of amine (Arnold, 1999), and the reboiler has a thermal efficiency of 92 percent. The molar mass of amine solution is 83 g/mole, which is estimated by averaging the molar mass of monoethanolamine (61 g/mole) and diethanolamine (105 g/mole). The density of the amine is 8 lb/gal (3.62 kg/gal) (Arnold, 1999). The chemistry, energy requirements, and efficiency of the amine reboiler are factors to calculate the energy requirements per unit of natural gas treated.
The amine reboiler combusts natural gas to generate heat for amine regeneration. This analysis applies an emission factor for industrial boilers (EPA, 1995) to the energy consumption rate (discussed in the above paragraph) to estimate the combustion emissions from amine reboilers.
Acid gas removal (AGR) is also a source of vented methane emissions. In addition to absorbing H2S, the amine solution absorbs a portion of methane from the natural gas. This methane is released to the atmosphere during amine solvent regeneration. The venting of methane from acid gas removal is based on emission factors developed by the Gas Research Institute; natural gas AGR releases 0.000971 kg of methane per kg per natural gas treated (API, 2009). Raw natural gas contains naturally occurring CO2 that contributes to the acidity of natural gas. Most of this CO2 is absorbed by the amine solution during the sweetening of natural gas and is ultimately released to the atmosphere when the amine is regenerated. This analysis calculates the mass of naturally occurring CO2 emissions from the AGR unit by balancing the composition of production gas (natural gas that has been extracted but has not undergone significant processing) and pipeline-quality gas. Production gas contains 1.52 mass percent CO2 and pipeline-quality natural gas contains 0.47 mass percent CO2. A mass balance around the AGR unit, which balances the mass of gas input with the mass of gas venting and gas product, shows that 0.013 kg of naturally occurring CO2 is vented per kg of processed natural gas.
19

Life Cycle Analysis of Natural Gas Extraction and Power Generation
The majority (84 percent by mass) of the AGR vent stream is NMVOC. At this concentration, NMVOCs are a marketable product that can be used as a material feedstock or an energy source. The relative masses of natural gas and natural gas liquids (NGL) after the acid gas removal unit (the point at which the co-products are separated) as a basis for splitting all emissions that occur from extraction through acid gas removal.
3.1.4.2 Dehydration Dehydration is necessary to remove water from raw natural gas, which makes it suitable for pipeline transport and increases its heating value. The configuration of a typical dehydration process includes an absorber vessel in which glycol-based solution comes into contact with a raw natural gas stream, followed by a stripping column in which the rich glycol solution is heated in order to drive off the water and regenerate the glycol solution. The regenerated glycol solution (the lean solvent) is recirculated to the absorber vessel. The methane emissions from dehydration operations include combustion and venting emissions. This analysis estimates the fuel requirements and venting losses of dehydration in order to determine total methane emissions from dehydration.
The fuel requirements of dehydration are a function of the reboiler duty. Due to the heat integration of the absorber and stripper streams, the reboiler, which is heated by natural gas combustion, is the only equipment in the dehydration system that consumes fuel. The reboiler duty (the heat requirements for the reboiler) is a function of the flow rate of glycol solution, which, in turn, is a function of the difference in water content between raw and dehydrated natural gas. The typical water content for untreated natural gas is 49 lbs/MMcf (22 kg/MMcf). To meet pipeline requirements, the water vapor must be reduced to 4 lbs/MMcf (1.8 kg/MMcf) of natural gas (EPA, 2006). The flow rate of glycol solution is 3 gallons per pound of water removed; the heat required to regenerate glycol is 1,124 Btu/gal (0.313 MJ/L) (EPA, 2006). By factoring the change in water content, the glycol flow rate, and boiler heat requirements, the energy requirements for dehydration are 152,000 Btu/MMcf (160 MJ/MMcf) of dehydrated natural gas. This translates to 1.48E-04 kg of natural gas combusted per kg of dehydrated natural gas (as shown by the equations below). The emission factor for the combustion of natural gas in boiler equipment produces 2.3 lb CH4/million scf natural gas (API, 2009). After converting to common units, the above fuel consumption rate and methane emission factor translate to 8.09E-09 kg CH4/kg NG treated.
In addition to absorbing water, the glycol solution also absorbs methane from the natural gas stream. This methane is lost to evaporation during the regeneration of glycol in the stripper column. Flash separators are used to capture most of methane emissions from glycol strippers; nonetheless, small amounts of methane are vented from dehydrators. The emission of methane from glycol dehydration is based on emission factors developed by the Gas Research Institute (API, 2009). Based on this emission factor, 3.4E-04 kg of methane is released for every kg of natural gas that is dehydrated.
3.1.4.3 Valve Fugitive Emissions The processing of natural gas uses pneumatic devices for the opening and closing of valves and other process control systems. When a valve is opened or closed, a small amount of natural gas leaks through the valve stem and is released to the atmosphere. It is not feasible to install vapor recovery equipment on all valves and other control devices at a natural gas processing plant, and thus the pneumatic operation of valves results in the emission of fugitive gas.
Data for the fugitive emissions from pneumatic devices used at processing facilities are based on EPA data for gas processing plants (EPA, 2011a). EPA’s data is based on 2006 production (EPA, 2011a) and shows the annual methane emissions for specific processing activities. This analysis translated EPA’s annual data to a unit production basis by dividing the methane emission rate by the
20

Life Cycle Analysis of Natural Gas Extraction and Power Generation
natural gas processing rate in 2006. The annual fugitive emissions from natural gas processing are 93 Mcf; the annual volume of processed natural gas is 14,680,000 Mcf. Dividing emissions by production gives an emission factor of 6.33E-06 kg CH4 per kg of natural gas.
3.1.4.4 Other Point Source Emissions Routine emissions from natural gas processing include gas that is released from processing equipment not accounted for elsewhere in NETL’s model. These emissions are referred to as “other point source emissions.” This analysis assumes that 100 percent of other point source emissions from natural gas processing are captured and flared.
Data for the other point source emissions from natural gas processing are based on EPA data that are based on 2006 production (EPA, 2011a) and show the annual methane emissions for specific gas processing activities. This analysis translated EPA’s data from an annual basis to a unit of production basis by dividing the methane emission rate by the natural gas processing rate in 2006. The emission factor for other point source emissions from natural gas processing is included in Table 3-5.
3.1.4.5 Other Fugitive Emissions Routine emissions from natural gas processing include fugitive emissions from processing equipment not accounted for elsewhere in NETL’s model. These emissions are referred to as “other fugitive emissions” and cannot be captured for flaring.
Data for the other fugitive emissions from natural gas processing are based on EPA data that are based on 2006 production (EPA, 2011a) and show the annual methane emissions for specific gas processing activities. This analysis translated EPA’s data from an annual basis to a unit of production basis by dividing the methane emission rate by the natural gas processing rate in 2006. The emission factor for other fugitive emissions from natural gas processing is included in Table 3-5.
Table 3-5: Other Point Source and Fugitive Emissions from Natural Gas Processing
Gas Plant MMcf/year Included in other NETL UP Point Source Fugitive
Normal Fugitives
Plants 1,634 3,104
Reciprocating Compressors 17,351 Reciprocating Compressor
Centrifugal Compressors 5,837 Centrifugal Compressor
Vented and Combusted (Normal Operations)
Compressor Exhaust, Gas Engines 6,913 Reciprocating Compressor
Compressor Exhaust, Gas Turbines 195 Centrifugal Compressor
AGR Vents 643 AGR and CO2 Removal
Kimray Pumps (Glycol Pump for Dehydrator) 177 11,749
Dehydrator Vents 1,088 Dehydrator Venting & Flaring
Pneumatic Devices 93 Pneumatic Device
Routine Maintenance
Blowdowns/Venting 2,299 2,299 366
Total Emissions 36,230 5,403 12,115
Total Production 14,682,188
Emissions Rate (lb. CH4/lb. NG processed) 3.68E-04 8.25E-04
21

Life Cycle Analysis of Natural Gas Extraction and Power Generation
3.1.4.6 Natural Gas Compression Compressors are used to increase the gas pressure for pipeline distribution. This analysis assumes that the inlet pressure to compressors at the natural gas extraction and processing site is 50 psig and the outlet pressure is 800 psig. The inlet pressure depends on the pressure of the natural gas reservoir and pressure drop during gas processing and thus introduces uncertainty to the model. The outlet pressure of 800 psig is a standard pressure for pipeline transport of natural gas.
The energy required for compressor operations is based on manufacturer data that compares power requirements to compression ratios (the ratio of outlet to inlet pressures). A two-stage compressor with an inlet pressure of 50 psig and an outlet pressure of 800 psig has a power requirement of 187 horsepower per MMcf of natural gas (GE, 2005). Using a natural gas density of 0.042 lb/scf (API, 2009) and converting to international system of units (SI) gives a compression energy intensity of 1.76E-04 MWh per kg of natural gas. This energy rate represents the required output of the compressor shaft; the input fuel requirements for compression vary according to compression technology. The two types of compressors used for natural gas operations are reciprocating compressors and centrifugal compressors. These two compressor types are discussed below.
Reciprocating compressors account for an estimated 75 percent of wellhead compression in the Barnett Shale gas play, and are estimated to account for all wellhead compression at conventional onshore, conventional onshore associated, and coal bed methane wells. Reciprocating compressors used for industrial applications are driven by a crankshaft that can be powered by two- or four-stroke diesel engines. Reciprocating compressors are not as efficient as centrifugal compressors and are typically used for small scale extraction operations that do not justify the increased capital requirements of centrifugal compressors. The natural gas fuel requirements for a gas-powered, reciprocating compressor used for natural gas extraction are based on a compressor survey conducted for natural gas production facilities in Texas (Burklin & Heaney, 2006). The average energy intensity of a gas-powered turbine is 8.74 Btu/hp-hr (Burklin & Heaney, 2006). Using a natural gas heating value of 1,027 Btu/scf (API, 2009), a natural gas density of 0.042 lb/scf (API, 2009), and converting to SI units translates to 217 kg of natural gas per MWh of centrifugal, gas-powered turbine output. This fuel factor represents the mass of natural gas that is combusted per compressor energy output. The CO2 emissions from a gas-powered, 4-stroke reciprocating compressor are 110 lb/MMBtu (47.2 g/MJ) of fuel input. Similarly, the methane emissions from the same type of reciprocating compressor are 1.25 lb/MMBtu of fuel input (EPA, 1995); these methane emissions result from leaks in compressor rod packing systems and are based on measurements conducted by the EPA on a sample of 22 compressors (EPA, 1995).
Gas-powered centrifugal compressors are commonly used at offshore natural gas extraction sites. The amount of natural gas required for gas-powered centrifugal compressor operations is based on manufacturer data that compares power requirements to compression ratios (the ratio of outlet to inlet pressures). A two-stage centrifugal compressor with an inlet pressure of 50 psig and an outlet pressure of 800 psig has a power requirement of 187 horsepower per MMcf of natural gas (GE, 2005). Using a natural gas density of 0.042 lb/scf and converting to SI units gives a compression energy intensity of 1.76E-04 MWh per kg of natural gas.
Electrically powered centrifugal compressors account for an estimated 25 percent of wellhead compression in the Barnett Shale gas play, but were not found to be utilized in substantial numbers outside of the Barnett Shale. If the natural gas extraction site is near a source of electricity, it is financially preferable to use electrically powered equipment instead of gas-powered equipment. This is the case for extraction sites for Barnett Shale located near Dallas-Fort Worth. The use of electric
22

Life Cycle Analysis of Natural Gas Extraction and Power Generation
equipment is also an effective way of reducing the noise of extraction operations, which is encouraged when an extraction site is near a city.
An electric centrifugal compressor uses the same compression principles as a gas-powered centrifugal compressor, but its shaft energy is provided by an electric motor instead of a gas-fired turbine. The average power range of electrically driven compressor in the U.S. natural gas transmission network is greater than 500 horsepower. This analysis assumes that compressors of this size have an efficiency of 95 percent (DOE, 1996). This efficiency is the ratio of mechanical power output to electrical power input. Approximately 1.05 MWh of electricity is required per MWh of compressor energy output. Electric compressors have negligible methane emissions because they do not require a fuel line for the combustion of product natural gas; incomplete combustion of natural gas is not an issue (EPA, 2011e). In fact, electric compressors are recommended by EPA’s Natural Gas STAR program (a voluntary partnership between EPA and industry) as a strategy for reducing system emissions of methane (EPA, 2011e).
3.1.5 Venting and Flaring Venting and flaring occur during both extraction and processing. Venting and flaring are necessary in situations where a natural gas stream cannot be safely or economically recovered. Venting and flaring may occur when a well is being prepared for operations and the wellhead has not yet been fitted with a valve manifold, when it is not financially preferable to recover the associated natural gas from an oil well or during emergency operations when the usual systems for gas recovery are not available.
The combustion products of flaring at natural gas extraction and processing sites include carbon dioxide, methane, and nitrous oxide. Processed natural gas has a higher share of CH4 than production gas because it has been treated to remove acid gas, water, and natural gas liquids (in the form of NMVOCs) (EPA, 2011a). The mass composition of natural gas is used to calculate the composition of vented and flared gas. Flaring has a 98 percent destruction efficiency (98 percent of carbon in the flared gas is converted to CO2), the methane emissions from flaring are equal to the two percent portion of gas that is not converted to CO2; nitrous oxide (N2O) emissions from flaring are based on EPA AP-42 emission factors for stationary combustion sources (API, 2009; EPA, 1998b). The composition of natural gas and its flaring emissions during extraction and processing are shown in Table 3-6.
Table 3-6: Natural Gas Composition and Associated Flaring Emissions
Emission Production NG (at extraction)
Processed NG (ready for pipeline
transmission) Units Reference
Natural Gas Composition CH₄ 78.8% 93.4% % Mass EPA, 2011a CO₂ 1.52% 0.47% % Mass EPA, 2011a Nitrogen 1.78% 0.55% % Mass EPA, 2011a NMVOC 17.9% 5.57% % Mass EPA, 2011a Flaring Emissions CO₂ 2.67 2.69 kg CO₂/kg Flared NG API, 2009 N₂O 8.95E-05 2.79E-05 kg N₂O/kg Flared NG API, 2009 CH₄ 1.53E-02 1.81E-02 kg CH₄/kg Flared NG API, 2009
23

Life Cycle Analysis of Natural Gas Extraction and Power Generation
3.1.6 Natural Gas Transport This analysis models the transport of natural gas by characterizing key construction and operation activities for pipeline transport. Natural gas transport data is summarized below. Appendix A includes details on how these data are assembled in a model and references the detailed documentation in NETL’s unit process library.
3.1.6.1 Natural Gas Transport Construction The construction of a natural gas pipeline is based on the linear density, material requirements, and length for pipeline construction. A typical natural gas transmission pipeline is 32 inches in diameter and is constructed of carbon steel. The mass of pipeline per unit length was determined using an online calculator (Tubes, 2009). The weight of valves and fittings were estimated at an additional 10 percent of the total pipeline weight. The pipeline was assumed to have a life of 30 years. The mass of pipeline construction per kg of natural gas was determined by dividing the total pipeline weight by the total natural gas flow through the pipeline for a 30-year period.
Construction is a one-time activity that is apportioned to each unit of natural gas transport by dividing all construction burdens by total production over the study period.
3.1.6.2 Natural Gas Transport Operations The U.S. has an extensive natural gas pipeline network that connects natural gas supplies and markets. Compressor stations are necessary every 50 to 100 miles along the natural gas transmission pipelines in order to boost the pressure of the natural gas. Compressor stations consist of centrifugal and reciprocating compressors. Most natural gas compressors are powered by natural gas, but, when electricity is available, electrically powered compressors are used.
A 2008 paper published by the Interstate Natural Gas Association of America (INGAA) provides data from the 2004 INGAA database, which shows that the U.S. pipeline transmission network has 5,400 reciprocating compressors and over 1,000 gas turbine compressors (Hedman, 2008). Further, based on written communication from El Paso Pipeline Group, approximately three percent of transmission compressors are electrically driven (EPPG, 2011). El Paso Pipeline Group has the highest transmission capacity of all natural gas pipeline companies in the U.S., and it is thus assumed that the share of electrically powered compressors in their fleet is representative of the entire natural gas transmission network. Based on written communication with El Paso Pipeline Group (EPPG, 2011), the division of compressors on the U.S. natural gas pipeline transmission network is approximately 78 percent reciprocating compressors, 19 percent turbine-powered centrifugal compressors, and 3 percent electrically powered compressors.
The use rate of natural gas for fuel in transmission compressors was calculated from the Federal Energy Regulatory Commission (FERC) Form 2 database, which is based on an annual survey of gas producers and pipeline companies (FERC, 2010). The 28 largest pipeline companies were pulled from the FERC Form 2 database. These 28 companies represent 81 percent of NG transmission in 2008, which is assumed to be a representative sample of the fuel use rate of the entire transmission network. This data shows that 0.96 percent of natural gas product is consumed as compressor fuel. This fuel use rate was converted to a basis of kg of natural gas consumed per kg of natural gas transported by multiplying it by the total natural gas delivered by the transmission network in 2008 (EIA, 2011b) and dividing it by the annual tonne-km of pipeline transmission in the U.S. (Dennis, 2005). The total delivery of natural gas in 2008 was 21 Tcf, which is approximately 400 billion kg of natural gas. The annual transport rate for natural gas transmission was steady from 1995 through 2003, at approximately 380 billion tonne-km per year. More recent transportation data are not
24
Life Cycle Analysis of Natural Gas Extraction and Power Generation
available, and thus this analysis assumes the same tonne-km rate for 2008 as shown from 1995 through 2003.
The air emissions from the combustion of natural gas by compressors are estimated by applying EPA emission factors to the natural gas consumption rate of the compressors (EPA, 1995). Specifically, the emission profile of gas-powered, centrifugal compressors is based on emission factors for gas turbines; the emission profile of gas-powered, reciprocating compressors is based on emission factors for 4-stroke, lean burn engines. For electrically powered compressors, this analysis assumes that the indirect emissions are representative of the U.S. average fuel mix for electricity generation.
The average power of electrically driven compressors for U.S. NG transmission is assumed to be the same as the average power of all compressors on the transmission network. An average compressor on the U.S. natural gas transmission network has a power rating of 14,055 horsepower (10.5 MW) and a throughput of 734 million cubic feet of natural gas per day (583,000 kg NG/hr) (EIA, 2007). Electrically driven compressors have efficiencies of 95 percent (DOE, 1996; Hedman, 2008). This efficiency is the ratio of mechanical power output to electrical power input. Thus, approximately 1.05 MWh of electricity is required per MWh of compressor energy output.
In addition to air emissions from combustion processes, fugitive venting from pipeline equipment results in the methane emissions to air. The fugitive emission rate for natural gas pipeline operations is based on data published by the Bureau of Transportation Statistics (BTS) and EPA. The transport data for natural gas transmission is based on ton-mileage estimates by BTS, which calculates 253 billion ton-miles of natural gas transmission in 2003 (Dennis, 2005). The 2003 data are the most recent data point in the BTS reference, and thus EPA's inventory data for the years 2000 and 2005 were interpolated to arrive at a year 2003 value of 1,985 million kg of fugitive methane emissions per year (EPA, 2011d). Dividing the EPA emission by the transport requirements and converting to metric units gives 5.37E-06 kg/kg-km.
3.2 Coal Acquisition and Transport Though the overall goal of this analysis is to understand the GHG burdens of natural gas extraction and transport, the modeling of the conversion of natural gas energy to electricity and electricity transmission is necessary in order to understand how significant extraction and transport are in the cradle-to-grave life cycle context. Additionally, understanding the upstream GHGs from coal acquisition, transport, and consumption allows comparison of the fuels on a common basis.
Because a mix of natural gas sources was developed to represent a domestic production average, a similar method was followed for developing an average domestic coal extraction and transport profile. Two sources of coal are used in the mix, and a wide range of uncertainty is applied to sensitive parameters to ensure the domestic average is captured. The two coal sources are:
• Illinois No. 6 Underground-mined Bituminous • Powder River Basin Surface-mined Sub-bituminous
Table 3-7 shows the properties used for each type of coal, as well as the proportion of U.S. supply used to create the average profile (EIA, 2009b; NETL, 2010d, 2010e). The methane content is indicative of what is emitted to the atmosphere during the mining process, not the methane contained in the coal in the formation, or after mining.
25

Life Cycle Analysis of Natural Gas Extraction and Power Generation
Table 3-7: Coal Properties
Coal Type U.S. Supply Share Energy Content Carbon Content Methane Emissions
% by mass (kJ/kg) (% by mass) (scf CH₄/ton) Sub-bituminous 58% 19,920 50.1% 4 – 40 (8) Bituminous 42% 27,135 63.8% 216 – 504 (360) Average 22,952 54.3%
3.2.1 Powder River Basin Coal Extraction The Powder River Basin (PRB) coal-producing region consists of counties in two states – Big Horn, Custer, Powder River, Rosebud, and Treasure in Montana, and Campbell, Converse, Crook, Johnson, Natrona, Niobrara, Sheridan, and Weston in Wyoming (EIA, 2009a). PRB coal is advantageous in comparison to bituminous coals in that it has lower ash and sulfur content. However, PRB coal also has a lower heating value than higher rank coals (CBPG, 2005). In 2007, there were 17 surface mines extracting PRB coal, which produced over 479 million short tons (EIA, 2009a).
PRB coal is modeled using modern mining methods in practice at the following mines: Peabody Energy's North Antelope-Rochelle mine (97.5 million short tons produced in 2008), Arch Coal, Inc.’s Black Thunder Mine (88.5 million short tons produced in 2008), Rio Tinto Energy America’s Jacobs Ranch (42.1 million short tons produced in 2008), and Cordero Rojo Operation (40.0 million short tons produced in 2008). These four mines were the largest surface mines in the United States in 2008 according to the National Mining Association’s 2008 Coal Producer Survey (National Mining Association, 2009).
The unit processes and modeling structure for PRB coal are provided in Appendix B. The key processes for PRB coal extraction and processing are discussed below.
3.2.1.1 Equipment and Mine Site Much of the equipment used for surface coal mining in the PRB is exceedingly large. GHG emissions that result from the production of construction materials required for coal extraction were quantified for the following equipment, within the model: track loader (10 pieces at 26,373 kg each); rotary drill (3 pieces at 113,400 kg each); walking dragline (3 pieces at 7,146,468 kg each); electric mining shovel (10 pieces at 1,256,728 kg each); mining truck (11 pieces at 278,690 kg each); coal crusher (1 piece at 115,212 kg); conveyor (1 piece at 1,064,000 kg); and loading silo (6 pcs at 10,909,569 kg each).
Large-scale surface mining is common in the PRB, because coal seams are located relatively close to the surface. The coal seam ranges in thickness from 42 to 184 feet thick. Before overburden drilling and cast blasting can be carried out, topsoil and unconsolidated overburden must be removed from the consolidated overburden that is to be blasted. These operations use both truck and shovel operations and bulldozing to move these materials to a nearby stockpile location so that they can be used in post-mining site reclamation. Estimates are made for topsoil/overburden operations based on requirements reported in the Energy and Environmental Profile of the U.S. Mining Industry (DOE, 2002) for a hypothetical western surface coal mine.
3.2.1.2 Overburden Blasting and Removal Blast holes are drilled into overburden for subsequent explosive packing and detonation using large rotary drills. Drills use electricity to drill 220-270 mm diameter holes through sandstone, siltstone, mudstone, and carbonaceous shale that make up the overburden. Typically this overburden contains water, which controls particulate emission associated with drilling activities. For the purposes of this assessment it is assumed that drilling operations produce no significant direct emissions. Electricity
26

Life Cycle Analysis of Natural Gas Extraction and Power Generation
requirements for drilling are taken from the U.S. Department of Energy (DOE) report Mining Industry for the Future: Energy and Environmental Profile of the U.S. Mining Industry (DOE, 2002).
Cast blasting is a blasting technique that was developed relatively recently, and has found broad application in large surface mines. Cast blasting comminutes (breaks into fragments/particles) overburden, and also moves an estimated 25-35 percent (modeled at 30 percent) of the blasted overburden to the target fill location (mining-technology.com, 2007). The model assumes that blasting uses ammonium nitrate and fuel oil (ANFO) explosives with a powder factor1 of 300 g ANFO mixture per meters cubed (m3) of overburden blasted (Kennedy, 1990), and GHG emissions associated with explosive production and the blasting process are included in the model, based on EPA’s AP-42 report (EPA, 1998a).
Overburden removal is achieved primarily through dragline operations, with the remainder moved using large electric shovels. Dragline excavation systems are among the largest on-land machines, and utilize a large bucket suspended from a boom, where the bucket is filled by scraping it along the ground. The bucket is then emptied at a nearby fill location. Electricity requirements for dragline operation combined with other on-site operations, were estimated based on electricity usage at the North Antelope Rochelle Mine (NARM), to be approximately 1,273 kWh per 1,000 tons of coal (PEC, 2005). During this time dragline operation accounted for approximately 50 percent of the overburden energy.
3.2.1.3 Coal Recovery Following overburden removal, coal is extracted using truck and shovel-type operations. Because of the large scale of operations, large electric mining shovels (Bucyrus 495 High Performance Series) are assumed to be employed, with a bucket capacity of 120 tons, alongside 320-400 ton capacity mining trucks (Bucyrus, 2008).
The amount of coal that could be moved by a single shovel per year was determined by using data for the Black Thunder and Cordero Rojo coal mines (mining-technology.com, 2007). A coal hauling distance of two miles is assumed, with a round-trip distance of four miles, based on evaluation of satellite imagery of mining operations. The extracted coal is ground and crushed to the necessary size for transportation. It is assumed that the coal does not require cleaning before leaving the mine site. The crushed coal is carried from the preparation facility to a loading silo by an overland conveyor belt. From the loading silo, the coal is loaded into railcars for transportation.
3.2.1.4 Coal Bed Methane Emissions During coal acquisition, methane is released during both the coal extraction and post-mining coal preparation activities. While PRB has relatively low specific methane content, the large thickness of the coal deposit (80 feet thick or more in many areas) results in large methane content per square foot of surface area. As a result, the PRB has recently begun to be exploited on a large scale. Extraction of coal bed methane, prior to mining of the coal seam, results in a net reduction of the total amount of coal bed methane that is emitted to the atmosphere, since extracted methane is typically sold into the natural gas market, and eventually combusted.
For the purposes of this assessment, it is assumed that the coal seam in the area of active mining was previously drilled to extract methane. Based on recent data available from the EPA, coal bed methane
1 Powder factor refers to the mass of explosive needed to blast a given mass of material.
27

Life Cycle Analysis of Natural Gas Extraction and Power Generation
emissions for surface mining, including the Powder River Basin, are expected to range from 4 to 40 standard cubic feet per ton (scf/ton) of produced coal, with a typical value of 8 scf/ton (NETL, 2010e).
3.2.2 Illinois No. 6 Coal Extraction Illinois No. 6 coal is part of the Herrin Coal, and is a bituminous coal that is found in seams that typically range from about 2 to 15 feet in thickness, and is found in the southern and eastern regions of Illinois and surrounding areas. Illinois No. 6 coal is commonly extracted via underground mining techniques, including continuous mining and longwall mining. Illinois No. 6 coal seams may contain relatively high levels of mineral sediments or other materials, and therefore require coal cleaning (beneficiation) at the mine site.
The unit processes and modeling structure for Illinois No. 6 coal are provided in Appendix C. The key processes for Illinois No. 6 coal extraction and processing are discussed below.
3.2.2.1 Equipment and Mine Site Extraction of Illinois No. 6 coal requires several types of major equipment and mining components, in order to operate the modeled coal mine. The following components were assumed to be constructed within the boundary of the model, for use during underground mining operations: site paving and concrete, conveyor belt, stacker/reclaimer, crusher, coal cleaning, silo, wastewater treatment, continuous miner, longwall mining systems (including shear head, roof supports, armored force conveyor, stage loader, and mobile belt tailpiece), and shuttle car systems with replacement.
3.2.2.2 Coal Mine Operations Operations of the coal mine were based on operation of the Galatia Mine, which is operated by the American Coal Company and located in Saline County, Illinois. Sources reviewed in support of coal mine operations include Galatia Mine production rates, electricity usage, particulate emissions, methane emissions, wastewater discharge permit monitoring reports, and communications with Galatia Mine staff. When data from the Galatia Mine were not available, surrogate data were taken from other underground mines, as relevant.
Electricity is the main source of energy for coal mine operations. Electricity use for this model was estimated based on previous estimates made by EPA for electricity use for underground mining and coal cleaning at the Galatia Mine. The life cycle profile for electricity use is based on EIA data for annual power generation (EIA, 2011a).
Although no Galatia Mine data were found that estimated the diesel fuel used during mining operations, it was assumed that some diesel would be used to operate trucks for moving materials, workers, and other secondary on-site operations. Therefore, diesel use was estimated for the Galatia Mine from 2002 U.S. Census data for bituminous coal underground mining operations and associated cleaning operations (USCB, 2004). Emissions of GHGs were based on emissions associated with the use of diesel. EPA Tier 4 diesel standards for non-road diesel engines were used, since these standards would go into effect within a couple years of commissioning of the mine for this study (EPA, 2004b).
3.2.2.3 Coal Bed Methane During the acquisition of Illinois No. 6 coal, methane is released during both the underground coal extraction and the post-mining coal preparation activities. Illinois No. 6 coal seams are not nearly as thick as PRB coals, and as a result are less commonly utilized as a resource for coal bed methane extraction. Instead, methane capture may be applied during the coal extraction process. Based on
28

Life Cycle Analysis of Natural Gas Extraction and Power Generation
recent data available from the EPA, coal bed methane emissions from underground mining, including mining within the Illinois No. 6 coal seam, are expected to range from 216 to 504 scf/ton of produced coal, with an expected value of 360 scf/ton (NETL, 2010d). It is assumed that no methane capture is applied for Illinois No. 6 coal.
3.2.3 Coal Transport Train transport was modeled for the transport of both PRB and Illinois No. 6 coal from mining sites to energy conversion facilities. Mined coal is presumed to be transported by rail from PRB and Illinois No. 6 coal mine sources, in support of electricity production. Coal is assumed to be transported via unit train, where a unit train is defined as one locomotive pulling 100 railcars loaded with coal. The locomotive is powered by a 4,400 horsepower diesel engine and each car has a 100-ton coal capacity. (GE, 2008)
GHG emissions for train transport are evaluated based on typical diesel combustion emissions for a locomotive engine. Loss of coal during transport is assumed to be equal to the fugitive dust emissions; loss during loading at the mine is assumed to be included in the coal reject rate and no loss is assumed during unloading. It is assumed that the majority of the railway connecting the coal mine and the energy conversion facility is existing infrastructure. A 25-mile rail spur is constructed between the energy conversion facility and the primary railway.
3.3 Data for Energy Conversion Facilities One of the primary uses of natural gas and coal in the U.S. is to produce electricity, although there are alternative uses for both feedstocks. To compare inputs of coal and natural gas on a common basis, production of baseload electricity was chosen. Ten different power plant options are used – four for natural gas and six for coal. Three of the options include carbon capture technology and sequestration infrastructure. Two of the options are U.S. fleet averages based on eGRID data, while the rest are based on NETL models of advanced technologies. Figure 3-1 shows the distribution of heat rates and associated efficiencies from eGRID for U.S. fleet power plants operating in the year 2009 (EPA, 2012a). Plants with a nameplate capacity less than 250 MW, combined heat and power (CHP), biogas/biomass, a capacity factor less than 0.4, and less than 95 percent annual power generation from coal were excluded from the heat rate calculation. Similarly, plants with a nameplate capacity less than 250MW, CHP, biogas/biomass, a capacity factor less than 0.3, less than 95 percent annual power generation from natural gas, and no boilers were excluded from the calculation. The boxes are the first and third quartiles and the whiskers are the 5th and 95th percentiles. The division in the boxes is the median value and the black diamond is the weighted mean. The expected heat rate for modeling power production is the weighted mean, and the minimum and maximum values for the uncertainty are modeled using the 5th and 95th percentile values.
29

Life Cycle Analysis of Natural Gas Extraction and Power Generation
Figure 3-1: Fleet Baseload Heat Rates for Coal and Natural Gas in 2009 (EPA, 2012a)
3.4 Natural Gas Combined Cycle (NGCC) The NGCC power plant is based a 555 MW thermoelectric generation facility with two parallel, advanced F-Class gas-fired combustion turbines. Each combustion turbine is followed by a heat recovery steam generator that produces steam that is fed to a single steam turbine. The NGCC plant consumes natural gas at a rate of 75,900 kg/hr and has an 85 percent capacity factor. Other details on the fuel consumption, water withdrawal and discharge, and emissions are provided in NETL’s bituminous baseline (NETL, 2010a). The carbon capture scenario for NGCC is configured with a Fluor Econamine FG PlusSM carbon dioxide capture system that recovers 90 percent of the CO2 in the flue gas.
Full description, input data and results for this power plant can be found in the report, Life Cycle Analysis: Natural Gas Combined Cycle (NGCC) Power Plant (NETL, 2012b).
3.5 Gas Turbine Simple Cycle (GTSC) The GTSC plant uses two parallel, advanced F-Class natural gas-fired combustion turbines/generators. The performance of the GTSC plant was adapted from NETL baseline of NGCC power by considering only the streams that enter and exit the combustion turbines/generators and not accounting for any process streams related to the heat recovery systems used by combined cycles. The net output of the GTSC plant is 360 MW and is operated as a load follower, which means it has a lower capacity factor than baseload power plants.
3.6 U.S. 2009 Average Baseload Natural Gas The average baseload natural gas plant was developed using data from eGRID on plant efficiency and is representative of 2009 electricity production (EPA, 2012a). The average heat rate was calculated for plants with a capacity factor over 30 percent and a capacity greater than 250MW to represent those plants performing a baseload role. The average efficiency (weighted by production,
10,346 33.0%
7,351 46.4%
4,000
6,000
8,000
10,000
12,000
14,000
16,000
Coal Natural Gas
Heat
Rat
e
(Btu
/kW
h)
Unc
erta
inty
Leg
end
Max
95th
75th
Wtd. Mean 50th
25th
5th
Min
30

Life Cycle Analysis of Natural Gas Extraction and Power Generation
so the efficiency of larger, more productive plants had more weight) was 46.4 percent. This heat rate is applied to the energy content of natural gas (which ranges from 990 and 1,030 Btu/scf) in order to determine the feed rate of natural gas per average U.S. natural gas power. Similarly, the carbon content of natural gas (which ranges from 72 percent to 80 percent) is factored by the feed rate of natural gas, 99 percent oxidation efficiency, and a molar ratio of 44/12 to determine the CO2 emissions per unit of electricity generation.
3.7 Integrated Gasification Combined Cycle (IGCC) The plant modeled is a 622 MW IGCC thermoelectric generation facility located in southwestern Mississippi utilizing an oxygen-blown gasifier equipped with a radiant cooler followed by a water quench. A slurry of Illinois No. 6 coal and water is fed to two parallel, pressurized, entrained flow gasifier trains. The cooled syngas from the gasifiers is cleaned before being fed to two advanced F-Class combustion turbine/generators. The exhaust gas from each combustion turbine is fed to an individual heat recovery steam generator where steam is generated. All of the net steam generated is fed to a single conventional steam turbine generator. A syngas expander generates additional power.
This facility has a capacity factor of 80 percent. For the carbon capture case, the plant is a 543 MW facility with a two-stage Selexol solvent process to capture both sulfur compounds and CO2 emissions. The captured CO2 is compressed and transported 100 miles to an undefined geographical storage formation for permanent sequestration, in a saline formation.
Full description, input data and results for this power plant can be found in the report, Life Cycle Analysis: Integrated Gasification Combined Cycle (IGCC) Power Plant (NETL, 2012a).
3.8 Supercritical Pulverized Coal (SCPC) This plant is a 550 MW facility located at a greenfield site in southeast Illinois utilizing a single-train supercritical steam generator. Illinois No. 6 pulverized coal is conveyed to the steam generator by air from the primary air fans. The steam generator supplies steam to a conventional steam turbine generator. Air emission control systems for the plant include a wet limestone scrubber that removes sulfur dioxide, a combination of low-nitrogen oxides burners and overfire air, and a selective catalytic reduction unit that removes nitrogen oxides, a pulse jet fabric filter that removes particulates, and mercury reductions via co-benefit capture.
The carbon capture case is a 550 MW plant configured with 90 percent carbon capture and sequestration (CCS) utilizing an additional sulfur polishing step to reduce sulfur content and a Fluor Econamine FG PlusSM process. The captured CO2 is compressed and transported 100 miles to an undefined geographical storage formation for permanent sequestration, in a saline formation.
Full description, input data and results for this power plant can be found in the report, Life Cycle Analysis: Supercritical Pulverized Coal (SCPC) Power Plant (NETL, 2010c).
3.9 Existing Pulverized Coal (EXPC) This case is an existing pulverized coal power plant that fires coal at full load without capturing carbon dioxide from the flue gas. This case is based on a 434 MW plant with a subcritical boiler that fires Illinois No. 6 coal, has been in commercial operation for more than 30 years, and is located in southern Illinois. The net efficiency of this power plant is 35 percent.
Full description, input data and results for this power plant can be found in the report, Life Cycle Analysis: Existing Pulverized Coal (EXPC) Power Plant (NETL, 2010b).
31

Life Cycle Analysis of Natural Gas Extraction and Power Generation
3.10 U.S. 2009 Average Baseload Coal Using a similar method to the fleet average natural gas baseload plant, a weighted average efficiency of 33.0 percent was pulled from eGRID. Using the coal characteristics detailed in Table 3-7, a feed rate and emissions rate were created.
For each option, the transmission and distribution (T&D) of electricity incurs a 7 percent loss, resulting in the production of additional electricity and extraction of necessary fuel to overcome this loss. All upstream life cycle stages scale according to this loss factor.
Construction is included in the four NETL developed models. It accounts for less than 1 percent of overall GHG impact, and so was excluded from the total for the fleet average plants.
The performance characteristics of the power plants modeled in this analysis are summarized in Table 3-8. Note that for the average natural gas and coal power plants, low (L), expected (E) and high (H) values are indicated.
Table 3-8: Power Plant Performance Characteristics
Property Natural Gas Coal
NGCC NGCC
GTSC Fleet
IGCC IGCC
SCPC SCPC
EXPC Fleet
(w/CCS) NG (w/ CCS) (w/ CCS) Coal Performance
Net Output MW 565 511 360 > 200 622 543 550 550 434 > 250
Heat Rate1 MJ/MWh
L 7,172 8,406 12,001
8,729 9,238 11,034 9,165 12,663 10,664
12,734 E 7,756 10,915 H 7,319 9,799
Efficiency % L
50.2% 42.8% 30.0% 41.2%
39.0% 32.6% 39.3% 28.4% 33.8% 28.3%
E 46.4% 33.0% H 49.2% 36.7%
Capacity Fac. % 85% 85% 85% > 30% 80% 80% 85% 85% 85% > 40%
Feedstocks Natural
Gas kg/MWh 137 160 211 126 - - - - - -
Ill. No. 6 Coal kg/MWh - - - - 340 406 338 467 393 200
PRB Coal kg/MWh - - - - - - - - - 276 Air Emissions
CO2 kg/MWh 339 40 560 358 782 93 802 111 941 915 CO₂
Capture % N/A 90% N/A N/A N/A 90% N/A 90% N/A N/A
3.10.1 Summary of Key Model Parameters Table 3-9 summarizes the key parameters that affect the life cycle results for the extraction of natural gas. This includes the amounts of methane emissions from routine activities, frequency and emission rates from non-routine operations, depths of different well types, flaring rates of vented gas, production rates, and domestic supply shares.
1 L, N, H indicated Low, Expected (default), and High values, respectively.
32

Life Cycle Analysis of Natural Gas Extraction and Power Generation
Table 3-9: Key Parameters for Seven Natural Gas Sources
Property (Units) Onshore Offshore Associated Tight Gas
Barnett Shale
Marcellus Shale CBM
Natural Gas Source Contribution to 2010 U.S. Domestic Supply 22% 12% 6.6% 27% 21% 2.5% 9.4%
Average Production Rate (Mcf/day)
L 46 1,960 85 77 192 201 73 E 66 2,800 121 110 274 297 105 H 86 3,641 157 143 356 450 136
Expected EUR (Bcf) 0.72 30.7 1.32 1.20 3.00 3.25 1.15 Natural Gas Extraction Well Flaring Rate (%) 51% (41 - 61%) 15% (12 - 18%) Well Completion (Mcf natural gas/episode) 37.0 3,600 9,000 49.6 Well Workover (Mcf natural gas/episode) 2.44 3,600 9,000 49.6 Lifetime Well Workovers (Episodes/well) 1.1 0.3 Liquids Unloading (Mcf/episode) 3.57 N/A N/A Lifetime Liquid Unloadings (Episodes/well) 930 N/A N/A Valve Emissions, Fugitive (lb. CH₄/Mcf) 0.11 0.0001 0.11 Other Sources, Point Source (lb. CH₄/Mcf) 0.003 0.002 0.003 Other Sources, Fugitive (lb. CH₄/Mcf) 0.043 0.1 0.043 AGR and CO2 Removal Unit Flaring Rate (%) 100% CH₄ Absorbed (lb. CH₄/Mcf) 0.04
CO₂ Absorbed (lb. CO₂/Mcf) 0.56
H₂S Absorbed (lb. H₂S/Mcf) 0.21 NMVOC Absorbed (lb. NMVOC/Mcf) 6.59 Glycol Dehydrator Unit Flaring Rate (%) 100% Water Removed (lb. H₂O/Mcf) 0.045 CH₄ Emission Rate (lb. CH₄/Mcf) 0.0003 Valves & Other Sources of Emissions Flaring Rate (%) 100% Valve Emissions, Fugitive (lb. CH₄/Mcf) 0.0003 Other Sources, Point Source (lb. CH₄/Mcf) 0.02 Other Sources, Fugitive (lb. CH₄/Mcf) 0.03 Natural Gas Compression at Gas Plant Compressor, Gas-powered Reciprocating (%) 100% 100% 100% 75% 100% 100% Compressor, Gas-powered Centrifugal (%) 100% Compressor, Electrical, Centrifugal (%) 25% Natural Gas Emissions on Transmission Infrastructure Pipeline Transport Distance (mi.) 604 (483 - 725) Pipeline Emissions, Fugitive (lb CH₄/Mcf-mi.) 0.0003 Natural Gas Compression on Transmission Infrastructure Distance Between Compressors (mi.) 75 Compressor, Gas-powered Reciprocating (%) 78% Compressor, Gas-powered Centrifugal (%) 19% Compressor, Electrical, Centrifugal (%) 3%
33

Life Cycle Analysis of Natural Gas Extraction and Power Generation
4 Inventory Results This section includes upstream results for the average production case, marginal upstream results, and results after conversion to electricity.
4.1 Upstream Inventory Results for Average Natural Gas Production Upstream activities include the RMA and transport activities that are necessary for the delivery of fuel to a power plant. For the natural gas supply chain, upstream includes well operations and natural gas processing activities, as well as the pipeline transport of natural gas from the extraction site to a power plant.
Figure 4-1: Upstream Cradle-to-gate Natural Gas GHG Emissions by Source
Figure 4-1 shows the comparative upstream GHGs of the seven sources of domestic gas, imported liquefied natural gas, and the 2010 mix of all domestic natural gas production (which does not include imported LNG), broken into life cycle stage. These results are based on 2007 IPCC 100-year GWP. The domestic average of 8.4 g CO2e/MJ and its associated uncertainty are shown overlaying the results for the other types of gas. This average is calculated using the percentages shown in Table 3-1. It is worth noting here that the RMT result is the same for all types of natural gas because natural gas is a commodity that is indistinguishable once put on the transport network. The distance parameter is adjustable, so if a natural gas type with a short distance to markets were evaluated, the RMT value would be smaller.
Offshore natural gas has the lowest GHGs of any source. This is due to the very high production rate of offshore wells and an increased emphasis on controlling methane emissions for safety and risk-mitigation reasons.
Uncertainty is higher for onshore conventional, shale, and tight gas than for other extraction technologies because onshore conventional, shale, and tight gas have high episodic emissions (well
8.8
6.1
7.6
9.0 9.0 9.1
7.8
18.3
0
2
4
6
8
10
12
14
16
18
20
Onshore Offshore Associated Tight BarnettShale
MarcellusShale
CBM LNG(Imported)
Conventional Unconventional
Gre
enho
use
Gas
Em
issi
ons
(g
CO
₂e/M
J)
Raw Material Extraction Raw Material Processing Raw Material Transportation
2010 Domestic Mix (8.4 g CO₂e/MJ)
34

Life Cycle Analysis of Natural Gas Extraction and Power Generation
completions, workovers, and liquid unloading). These episodic emissions are subject to the uncertainty in production rates; production rates are used to allocate episodic emissions per unit of natural gas produced.
Imported LNG has significantly higher GHGs than even domestic unconventional extraction. It is fundamentally an offshore extraction process, which has the lowest GHGs of all the sources. But the additional impact is due to the refrigeration, ocean transport, and liquefaction processes.
Figure 4-2: Upstream Cradle-to-gate Natural Gas GHG Emissions by Source and GWP
The results in Figure 4-2 compare the basic results from Figure 4-1 across two sets of global warming potentials (detailed in Table 2-1). Converting the inventory of GHGs to 20-year GWP, where the methane factor increases from 25 to 72, magnifies the difference between conventional and unconventional sources of natural gas, and the importance of methane losses to the cradle-to-gate GHG results.
8.4
18.7
8.8
19.6
6.1
12.0
7.6
16.9
9.0
20.5
9.0
20.4
9.1
20.5
7.8
17.1 18.3
27.9
0
5
10
15
20
25
30
100-
yr
20-y
r
100-
yr
20-y
r
100-
yr
20-y
r
100-
yr
20-y
r
100-
yr
20-y
r
100-
yr
20-y
r
100-
yr
20-y
r
100-
yr
20-y
r
100-
yr
20-y
r
Avg. Gas Onshore Offshore Associated Tight BarnettShale
MarcellusShale
CBM LNG
Conventional Unconventional
Gre
enho
use
Gas
Em
issi
ons
(g C
O₂e
/MJ)
35

Life Cycle Analysis of Natural Gas Extraction and Power Generation
Figure 4-3: Cradle-to-Gate Reduction in Extracted Natural Gas
Figure 4-3 shows that, for natural gas that is consumed by power plants (or other large scale users), 92 percent of the natural gas extracted at the well is delivered to the power plant. The 8 percent share that is not delivered to a power plant is vented (either intentionally or unintentionally) as methane emissions, flared in environmental control equipment, or used as fuel in process heaters, compressors and other equipment. For the delivery of 1,000 kg of natural gas to a power plant, 12.5 kg of methane is released to the atmosphere, 30.3 kg is flared to CO2 via environmental control equipment, and 45.6 kg is combusted in process equipment. When these mass flows are converted to a percent basis, methane emissions to air represent a 1.1 percent loss of natural gas extracted, methane flaring represents a 2.8 percent loss of natural gas extracted, and methane combustion in equipment represents a 4.2 percent loss of natural gas extracted. These percentages are on the basis of extracted natural gas. Converting to a denominator of delivered natural gas gives a methane leakage rate of 1.2 percent.
A better understanding of the key contributors to natural gas emissions can be achieved by expanding the underlying data in NETL’s model; Figure 4-4 shows the cradle-to-gate results for the natural gas extracted from conventional onshore wells. This figure further shows the contribution of CH4, N2O, CO2, and sulfur hexafluoride (SF6) to the total GHG emissions. Similar data exist for other sources of natural gas, as well as for the domestic average.
36

Life Cycle Analysis of Natural Gas Extraction and Power Generation
Figure 4-4: Expanded Greenhouse Gas Results for Onshore Conventional Natural Gas
The key contributors to the upstream GHG emissions from onshore natural gas are the fugitive emissions from transport, fuel combusted by processing compressors, and episodic emissions from liquid unloading. Pipeline fugitive emissions contribute 26 percent to the total emissions and a large portion of the uncertainty. Liquid unloading contributes 11percent to the total emissions and accounts for a large portion of the uncertainty. This uncertainty is due to a wide range in the production rate, not the emission factor for liquids unloading. As discussed in the modeling method, production rate is used to apportion episodic emissions.
Figure 4-5 shows the contributions of specific extraction, processing, and transport activities to upstream Marcellus Shale GHG emissions.
8.8 g CO₂e/MJ 26.2% 5.2%
1.3% 26.9%
0.03% 0.3%
3.4% 0.1%
7.0% 11.3%
0.2% 4.4%
0.01% 11.2%
0.1% 2.3%
0 2 4 6 8 10 12
Cradle-to-gatePipeline Fugitive Emissions
Pipeline CompressorsPipeline Construction
CompressorsValve Fugitive Emissions
Other Point Source EmissionsOther Fugitive Emissions
DehydrationAcid Gas Removal
Valve Fugitive EmissionsOther Point Source Emissions
Other Fugitive EmissionsWorkovers
Liquid UnloadingWell Completion
Well Construction
Proc
essin
gEx
trac
tion
RMT
RMA
GHG Emissions in 2007 IPCC 100-year GWPs (g CO₂e/MJ)
CO₂ CH₄ N₂O
37

Life Cycle Analysis of Natural Gas Extraction and Power Generation
Figure 4-5: Expanded Greenhouse Gas Results for Marcellus Shale Gas
The key contributors to the upstream GHG emissions from Marcellus Shale natural gas are processing compressors (27 percent), pipeline fugitive emissions (26 percent), valve fugitive emissions at extraction (11 percent), and well completion (10 percent). It should be noted that pipeline fugitive emissions include methane that is released through compressor seals as well as through the many connection points throughout a pipeline system. Previous data used by NETL’s model showed more workovers per well life, which resulted in an overestimate of the episodic emissions associated with workovers. This activity now contributes about 3 percent to the total.
In general, Figure 4-4 and Figure 4-5 show how important methane is to the upstream GHG emissions. In most energy systems carbon dioxide is the primary concern, but for natural gas extraction, processing and transport, methane drives the GHG results and most of the uncertainty. These figures also demonstrate how periodic activities such and liquid unloading or well completions and workovers can be significant contributors to total GHG emission. This is an unusual conclusion for energy systems; steady-state operating emissions are usually the only significant contributors to total GHG emissions.
4.1.1 Sensitivity Analysis This analysis uses a parameterized model that allows the alteration and analysis of key variables. Doing so allows the identification of variables that have the greatest effect on results. The sensitivity analysis was performed by increasing each parameter by 100 percent while holding all other parameters constant. The 100 percent increase is an arbitrary change – the sensitivity analysis is valid as long as all parameters are changed by the same scale. The percent change to upstream GHG emissions with respect to each parameter were graphed using the tornado graphs shown in Figure 4-6 and Figure 4-7.
Positive results in Figure 4-6 and Figure 4-7 indicate that an increase in a parameter leads to an increase in the result. Conversely, negative results indicate inverse relationships; an increase in the parameter leads to a decrease in the overall result. For example, a 100 percent increase in production
9.1 g CO₂e /MJ 25.2% 5.0%
1.2% 25.8%
<0.1% 0.3%
3.3% 0.1%
6.7% 1.6% 1.2%
10.8% 0.3%
4.4% 3.0%
9.9% 1.4%
0 2 4 6 8 10 12
Cradle-to-gatePipeline Fugitive Emissions
Pipeline CompressorsPipeline Construction
CompressorsValve Fugitive Emissions
Other Point Source EmissionsOther Fugitive Emissions
DehydrationAcid Gas RemovalWater Treatment
Water DeliveryValve Fugitive Emissions
Other Point Source EmissionsOther Fugitive Emissions
WorkoversWell Completion
Well Construction
Proc
essin
gEx
trac
tion
RMT
RMA
GHG Emissions in 2007 IPCC 100-year GWPs (g CO₂e/MJ)
CO₂ CH₄ N₂O
38

Life Cycle Analysis of Natural Gas Extraction and Power Generation
rate reduces the upstream GHG emissions from onshore natural gas by 10.7 percent and the upstream emissions from Marcellus Shale natural gas by 16.7 percent. Thus, the upstream GHG emissions from onshore conventional natural gas extraction are less sensitive to changes in production rate than Marcellus Shale natural gas.
Figure 4-6: Sensitivity of Onshore Natural Gas GHG Emissions to Changes in Parameters
Figure 4-7: Sensitivity of Marcellus Shale Natural Gas GHG Emissions to Changes in Parameters
2.7% 2.8% 2.8% 2.8% 2.9% 3.0% 3.1%
-4.5% 5.2%
-5.9% 6.3% 7.2%
-10.7% 14.0% 14.0% 14.1%
29.4% 36.4%
-40% -20% 0% 20% 40% 60%
Pipeline Electric Motor ShareWorkover Vent Rate
Well Workover FrequencyPneumatic Device Vent Rate, Processing
Completion Vent RateOther Venting Extraction PointOther Venting Processing Point
Processing Flare RateWell Depth
Extraction Flare RateOther Venting Processing FugitiveOther Venting Extraction Fugitive
Production RateLiquid Unloading Vent Rate
Liquid Unloading FrequencyPneumatic Device Vent Rate, Extraction
Pipeline Fugitive CH₄ Rate Pipeline Distance
< 0.01% 0.5% 0.8% 0.9%
-1.1% -2.2% -2.3% -2.5% -2.5% -2.6%
-4.5% 7.4% 8.3%
-16.7% 23.0%
29.8%
-40% -20% 0% 20% 40% 60%
Workover Vent RateWell Workover Frequency
Other Venting Processing FugitiveProcessing Flare Rate
Well DepthOther Venting Extraction PointOther Venting Processing Point
Pneumatic Device Vent Rate, ProcessingOther Venting Extraction Fugitive
Pipeline Electric Motor ShareExtraction Flare Rate
Completion Vent RatePneumatic Device Vent Rate, Extraction
Production RatePipeline Fugitive CH₄ Rate
Pipeline Distance
39

Life Cycle Analysis of Natural Gas Extraction and Power Generation
Onshore conventional and Marcellus Shale natural gas are both sensitive to changes in pipeline distance, which is currently set to 971 km (604 miles) for all natural gas sources. As more unconventional sources like Marcellus shale, which is close to major demand centers (New York, Boston, Toronto), enter the market, the average distance natural gas has to travel could decrease, decreasing overall GHG emissions from upstream natural gas.
The pipeline transport of natural gas is inherently energy intensive because compressors are required to continuously alter the physical state of the natural gas in order to maintain adequate pipeline pressure. Further, the majority of compressors on the U.S. pipeline transmission network are powered by natural gas that is withdrawn from the pipeline. Figure 4-8 shows the sensitivity of natural gas losses to pipeline distance.
Figure 4-8: Sensitivity of GHGs Results to Pipeline Distance
Other key sensitivities shown by Figure 4-6 and Figure 4-7 are parameters for valve fugitive emissions at extraction and emissions from completions, workovers, and liquid unloading episodes. These parameters are large sources of methane emissions, so they are key drivers of GHG sensitivity. Valve fugitive emissions at extraction are a key sensitivity because they represent a group of many scattered devices that cannot be fitted with capture and control equipment such as flares. GHG results are also sensitive to production rate because it is a parameter used as the denominator for apportioning the episodic emissions discussed above (completions, workovers, and liquid unloading) to a unit of natural gas produced.
The above sensitivity tornados (Figure 4-6 and Figure 4-7) are useful because they demonstrate how GHG results respond to changes in parameters. A limitation of the sensitivity tornados is that they do not vary parameters within likely ranges. Figure 4-9 and Figure 4-10 are uncertainty tornados that show how the upstream GHG emissions from natural gas change within likely boundaries for pipeline distance, production rate, and flaring rate.
971 km, 8.39 g CO₂e/MJ
(Study Default)
0
2
4
6
8
10
12
0 200 400 600 800 1,000 1,200 1,400 1,600
Gre
enho
use
Gas
Em
issi
ons
(g C
O₂e
/MJ)
Pipeline Transport Distance (km)
40

Life Cycle Analysis of Natural Gas Extraction and Power Generation
Figure 4-9: Uncertainty Contributions to Onshore Natural Gas GHGs
Figure 4-10: Uncertainty Contributions to Marcellus Shale GHGs
Pipeline distance, production rate, and flaring rate are the only parameters that have been assigned uncertainty, which is why the above uncertainty tornados (Figure 4-9 and Figure 4-10) have only three bars each. (No data are available at the time of publication to assign uncertainty around the other parameters in NETL’s model.) Among these three parameters, pipeline distance and production rate have similar contributions to the total uncertainty in GHG emissions. Extraction flaring rate has a lower contribution to total uncertainty, especially the extraction flaring rate for Marcellus Shale natural gas, which represents a lower range (12 to 18 percent flaring) than the extraction flaring rates for onshore conventional natural gas (41 to 61 percent flaring).
4.2 Upstream Inventory Results for Marginal Natural Gas Production Marginal production is defined here as the next unit of natural gas produced not included in the average, presumably from a new, highly productive well for each type of natural gas. Since older, less productive wells are ignored as part of these results, the production rate per well is much higher, episodic emissions are spread across more produced gas, and the corresponding GHG inventory is lower. Table 4-1 shows the production rate assumptions used for both the average and marginal cases.
8.60
8.47
8.16
8.90
9.26
9.34
7.5 8 8.5 9 9.5 10
Flaring Rate (% mass)low 61%; exp 51%; high 41%
Production Rate (Mcf/day) low 86; exp 66; high 46
Pipeline Distance (km)low 777; exp 971; high 1166
Greenhouse Gas Emissions (g CO₂e/MJ)
Expected8.75
9.08
8.67
8.52
9.15
9.74
9.70
7.5 8 8.5 9 9.5 10
Flaring Rate (% mass)low 18%; exp 15%; high 12%
Production Rate (Mcf/day)low 450; exp 297; high 201
Pipeline Distance (km)low 777; exp 971; high 1166
Greenhouse Gas Emissions (g CO₂e/MJ)
Expected9.11
41

Life Cycle Analysis of Natural Gas Extraction and Power Generation
Table 4-1: Production Rate Assumptions for Average and Marginal Cases
Source Well Count Dry
Production (Tcf)
Production Rate (Mcf/day) Average Marginal
Expected L (-30%) H (+30%) Expected L (-30%) H (+30%) Onshore 216,129 5.2 66 46 86 593 297 1,186 Offshore 2,641 2.7 2,801 1,961 3,641 6,179 3,090 12,358 Associated 31,712 1.4 121 85 157 399 200 798 Tight Gas 162,656 6.6 111 78 144 111 78 143 Barnett 32,797 3.3 274 192 356 274 192 356 Marcellus N/A N/A 479 335 623 479 335 623 CBM 47,165 1.8 105 73 136 105 73 136
Results are shown in Table 4-2. The marginal and average production rates for the unconventional sources (tight, shale, and CBM) were identical, so there is no change shown below. There was a significant change in the production rate for all the mature conventional sources. Large numbers of the wells from each of these sources are nearing the end of the useful life, and have dramatically lower production rates, bringing the average far below what would be expected of a new well of each type.
Table 4-2: Average and Marginal Upstream Greenhouse Gas Emissions
Source Average (g CO₂e/MJ)
Marginal (g CO₂e/MJ)
Percent Change1
Conventional Onshore 8.8 7.7 -12.2% Offshore 6.1 6.0 -0.3% Associated 7.6 7.6 -0.8%
Unconventional
Tight Gas 9.0 9.0 0.0% Barnett Shale 9.0 9.0 0.0% Marcellus Shale 9.1 9.1 0.0% Coal Bed Methane 7.8 7.8 0.0%
Liquefied Natural Gas 18.3 18.3 0.1%
Interestingly, although the production rates for both associated gas and offshore gas change significantly, there is little change to the upstream results: a drop of 0.8 percent and 0.3 percent respectively. This has to do with the characteristics of these types of wells; the flow of natural gas in offshore wells is so strong that there is no need to periodically perform liquids unloading; for associated wells, the petroleum co-product is constantly removing any liquid in the well. This means the only episodic emission (one which would need to be allocated by lifetime production of the well) is the construction or completion of the well, which is small as a percentage of overall emissions.
That leaves onshore conventional production as the only source which shows a significant difference (a drop of 12.2 percent) between the average and marginal production. There are over 200,000 active onshore conventional wells, over 80 percent of which have daily production rates below the average rate of 138 Mcf/day (EIA, 2010).
1 The results for average and marginal GHG emissions (g CO₂e/MJ) are rounded to one decimal place, which is why the percent changes in Table 4-2 do not exactly match the changes indicated by the values shown for GHG results.
42

Life Cycle Analysis of Natural Gas Extraction and Power Generation
4.3 GHG Mitigation Requirements
The detailed results of the model allow the comparison of specific sources of leakage and the role that improved practices can have in reducing GHG emissions. As discussed above, current natural gas extraction and processing activities have completion activities, pneumatic controllers, and compressors that are sources of CH4 leakage. The New Source Performance Standards (NSPS) focus on these sources of CH4 leakage. NSPS is part of the Clean Air Act (CAA); NSPS established new rules for the oil and gas sector in August 2012. The NSPS rules are applicable to new or modified wells and will be fully implemented by 2015. (EPA, 2012b)
To represent the emission reductions caused by NSPS, the following modifications were made to the natural gas parameters:
• The loss of natural gas in flowback water from hydraulic fracturing was reduced by 95 percent. For example, the completion of a shale gas well before NSPS implementation produces 9,000 Mcf of natural gas that is entrained in flowback water that must be vented or flared; after NSPS implementation, the same activity sends only 450 Mcf of natural gas to venting or flaring, and the remaining 8,550 Mcf is sent to the gas processing facility.
• The flaring rate at unconventional wells was increased from 15 percent to 51 percent, which makes the average flaring rates of unconventional wells equal to those of conventional wells.
• Pneumatic venting for onshore conventional and unconventional wells was reduced by a factor of 1,000, making the bleed rates from pneumatically controlled equipment used by onshore wells the same as those for offshore wells.
• Leakage through wet seals on centrifugal compressors was reduced by 95 percent. This change affects both conventional and unconventional natural gas extraction technologies.
• Leakage through rod packing on reciprocating compressors was reduced by 95 percent. This change affects both conventional and unconventional natural gas extraction technologies.
The potential GHG emission reductions that NSPS implementation could create for onshore conventional natural gas are shown in Figure 4-11. The left-hand side of this graph shows the results for current practices, which are identical to the results shown in Figure 4-4. The right-hand side of this graph shows the GHG emissions from an NSPS-implementation scenario. This graph represents only the emission reductions for new or modified wells, not the reduction in emissions for the entire population of existing onshore conventional wells.
43

Life Cycle Analysis of Natural Gas Extraction and Power Generation
Figure 4-11: Effect of NSPS on New or Modified Conventional Onshore Natural Gas Wells
The successful implementation of NSPS could reduce the upstream GHG emissions from onshore conventional natural gas by 17 percent, from 8.8 to 7.3g CO2e per MJ of delivered natural gas. CH4 is 66 percent of the upstream GHG emissions from onshore conventional natural gas using current practices. After implementation of NSPS rules, CH4 will account for 59 percent of the upstream GHG emissions for natural gas from new or modified onshore conventional wells.
The potential GHG emission reductions that NSPS implementation could create for Marcellus Shale natural gas are shown in Figure 4-12. The left-hand side of this graph shows the results for current practices, which are identical to the results shown in Figure 4-5. The right-hand side of this graph shows the GHG emissions from an NSPS-implementation scenario. This graph represents only the emission reductions for new or modified wells, not the reduction in emissions for the entire population of existing Marcellus Shale wells.
8.8 g CO₂e/MJ 26.2% 5.2%
1.3%
26.9% 0.03%
0.3% 3.4% 0.1%
7.0%
11.3% 0.2%
4.4% 0.01%
11.2% 0.1%
2.3%
CRADLE-TO-GATE Pipeline Fugitives
Pipeline Compressors Pipeline Construction
TRANSPORT Compressors
Valve Fugitives Other Point Sources
Other Fugitives Dehydration
Acid Gas Removal PROCESSING
Valve Fugitives Other Point Sources
Other Fugitives Workovers
Liquid Unloading Well Completion
Well Construction EXTRACTION
7.3 g CO₂e/MJ 31.5% 6.3%
1.5%
25.6% 0.03% 0.3% 4.1%
0.1% 8.4%
0.01% 0.3%
5.3% 0.01%
13.5% 0.1% 2.8%
12 10 8 6 4 2 0 0 2 4 6 8 10 12 GHG Emissions in 2007 IPCC 100-year GWPs (g CO₂e/MJ)
Current Current Current Current Practice
NSPS Scenario
44

Life Cycle Analysis of Natural Gas Extraction and Power Generation
Figure 4-12: Effect of NSPS on New or Modified Marcellus Shale Natural Gas Wells
The successful implementation of NSPS could reduce the upstream GHG emissions from Marcellus Shale natural gas by 29 percent, from 9.1 to 6.5 g CO2e per MJ of delivered natural gas. CH4 is 67 percent of the upstream GHG emissions from Marcellus Shale natural gas using current practices. After implementation of NSPS rules, CH4 will account for 53 percent of the upstream GHG emissions for natural gas from new or modified Marcellus Shale wells.
NSPS does not apply to liquid unloading (a key source of GHG emissions from onshore conventional natural gas), nor does it apply to transmission pipeline operations. These two emission sources represent GHG reduction opportunities that would require voluntary participation from natural gas producers and pipeline operators.
9.1 g CO₂e/MJ 25.2% 5.0%
1.2%
25.8% 0.03%
0.3% 3.3% 0.1%
6.7%
1.5% 1.1%
10.8% 0.3%
4.2% 3.0%
9.9% 1.4%
CRADLE-TO-GATE Pipeline Fugitives
Pipeline Compressors Pipeline Construction
TRANSPORT Compressors
Valve Fugitives Other Point Sources
Other Fugitives Dehydration
Acid Gas Removal PROCESSING
Water Treatment Water Delivery Valve Fugitives
Other Point Sources Other Fugitives
Workovers Well Completion
Well Construction EXTRACTION
6.5 g CO₂e/MJ 35.4% 7.1%
1.7%
28.7% 0.04% 0.4% 4.6%
0.1% 9.5%
2.0% 1.7% 0.01% 0.3%
5.9% 0.1% 0.5% 2.0%
12 10 8 6 4 2 0 0 2 4 6 8 10 12 GHG Emissions in 2007 IPCC 100-year GWPs (g CO₂e/MJ)
Current Current Current Current Practice
NSPS Scenario
45

Life Cycle Analysis of Natural Gas Extraction and Power Generation
4.4 Comparison to Other Fossil Energy Sources Additional insight can be gained by comparing the upstream GHG emissions from natural gas to the upstream GHG emissions from coal. The upstream GHG emissions for natural gas and coal are shown in Figure 4-13.
Figure 4-13: Comparison of Upstream GHG Emissions for Various Feedstocks
Compared on an upstream energy basis, natural gas has higher GHG emissions than the domestic mix of coal. The expected GHG emissions from natural gas are 1.8 times higher than those from the average coal mix. Gassier bituminous coals such as Illinois No. 6 are more comparable to the natural gas mix, but only make up 42 percent of domestic consumption on an energy basis. The limitation with upstream comparisons between natural gas and coal is that they do not consider the eventual service (e.g., power production) provided by each fuel.
4.5 Role of Energy Conversion The per unit energy upstream emissions comparisons shown above are somewhat misleading in that a unit of coal and unit of natural gas often provide different services. If they do provide the same service, they often do so with different efficiencies—it is more difficult to get useful energy out of coal than it is out of natural gas. To provide a common basis of comparison, different types of natural gas and coal are run through various power plants and converted to electricity. There are alternative uses of both fuels, and as such, different bases on which they could be compared. However, in the United States the vast majority of coal is used for power production, which provides the most relevant comparison. Figure 4-14 compares results for natural gas and coal power on the basis of 1 MWh of electricity delivered to the consumer. In addition to the NETL baseline fossil plants with and without carbon capture and sequestration, these results include GTSC and representations of fleet average baseload coal and natural gas plants, as described in Section 3.2.1.
8.4 7.8 8.8
6.1 7.6
8.8 9.0 9.0 9.1 7.8
18.3
4.8
8.4
1.3
02468
101214161820
Avg.
Mix
Conv
. Mix
Ons
hore
Offs
hore
Asso
ciat
ed
Unc
onv.
Mix
Tigh
t
Barn
ett S
hale
Mar
cellu
s Sha
le
CBM
LNG
Avg.
Mix
Illin
ois N
o. 6
PRB
Conventional Unconventional Coal
Natural Gas
Gre
enho
use
Gas
Em
issi
ons
(g C
O₂e
/MJ)
Raw Material Acquisition Raw Material Transport
46

Life Cycle Analysis of Natural Gas Extraction and Power Generation
Figure 4-14: Life Cycle GHG Emissions for Electricity Production
In contrast to the upstream results, which showed higher GHGs for natural gas than coal, the results in Figure 4-14 show that natural gas power, on a 100-year GWP basis, has a lower impact than coal power without capture, even when using unconventional natural gas. When using less efficient simple cycle turbines, which provide peaking power to the grid, there are also fewer GHGs emitted than for coal-fired power. Because of the different roles played by these plants, the fairest comparison is the domestic mix of coal run through an average baseload coal power plant with the domestic mix of natural gas run through the average baseload natural gas plant. In that case, the coal-fired plant has emissions of 1,124 kg CO2e/MWh, more than double the emissions of the natural–gas fired plant at 489 kg CO2e/MWh.
Figure 4-15 shows the same scenarios as shown in Figure 4-14, but compares 100- and 20-year IPCC GWPs to the inventoried GHGs.
1,124 1,112
928 948
483 491 488 466
715
222 260
141
0
500
1,000
1,500
Flee
t Bas
eloa
d
EXPC
IGCC
SCPC
Flee
t Bas
eloa
d
Flee
t Bas
eloa
d
Flee
t Bas
eloa
d
NG
CC
GTSC
IGCC
SCPC
NG
CC
Average Illinois No. 6 Conv. UnConv. Average With Carbon Capture
Coal Natural Gas
Gre
enho
use
Gas
Em
issi
ons
(kg
CO₂e
/MW
h)
RMA RMT ECF T&D
47

Life Cycle Analysis of Natural Gas Extraction and Power Generation
Figure 4-15: Comparison of Power Production GHG Emissions on 100- and 20-year GWPs
1,124 1,112
928 948
483 491 488 466
715
222 260
141
1,203 1,264
1,059 1,077
558 584 573 552
844
380 440
242
0
200
400
600
800
1,000
1,200
1,400
1,600
100-
yr
20-y
r
100-
yr
20-y
r
100-
yr
20-y
r
100-
yr
20-y
r
100-
yr
20-y
r
100-
yr
20-y
r
100-
yr
20-y
r
100-
yr
20-y
r
100-
yr
20-y
r
100-
yr
20-y
r
100-
yr
20-y
r
100-
yr
20-y
r
FleetBaseload
EXPC IGCC SCPC FleetBaseload
FleetBaseload
FleetBaseload
NGCC GTSC IGCC SCPC NGCC
Average Illinois No. 6 Conv. UnConv. Average With Carbon Capture
Gre
enho
use
Gas
Em
issi
ons
(kg
CO₂e
/MW
h)
48

Life Cycle Analysis of Natural Gas Extraction and Power Generation
Figure 4-15 shows that even when using a GWP of 72 for CH₄ to increase the relative impact of upstream methane from natural gas, gas-fired power still has lower GHGs than coal-fired power. This conclusion applies across a range of fuel sources (conventional vs. unconventional for natural gas, bituminous vs. average for coal) and a range of power plants (GTSC, NGCC, average for natural gas, and IGCC, SCPC, EXPC, and average for coal).
4.6 Non-GHG Emissions Non-GHG emissions include CO and NOX, which arise from the combustion of fuels (natural gas, diesel, and heavy fuel oil) by the primary activities through life cycle Stages #1, #2, and #3 as well as by secondary fuel and material production activities. SO2 emissions arise from the combustion of diesel and heavy fuel oil in life cycle Stages #1 and #2, as well as from the secondary production of electricity used by the pipeline operations of Stage #2. NH3 emissions result from liquefaction (Stage #1 for imported natural gas) and NGCC plant operations. Lead (Pb) and Hg emissions do not represent a significant contribution to the life cycle emissions of any of the scenarios of this analysis and are highly concentrated in construction activities.
Each source of natural gas has unique construction and extraction requirements, which results in different emission profiles for criteria air pollutants and other non-GHG emissions. The following table (Table 4-3) shows the upstream emissions, RMA and RMT for each type of natural gas. The RMT emission profile is identical for all types of natural gas because the same transport distance (971 km) is modeled for each type of natural gas.
49

Life Cycle Analysis of Natural Gas Extraction and Power Generation
Table 4-3: Upstream Non-GHG Emissions
LC Stage Emission (g/MJ) Onshore Offshore Associated Tight Gas Barnett
Shale Marcellus
Shale CBM Mix (2010)
RMA
Pb 3.32E-07 1.06E-08 1.36E-07 2.50E-07 1.68E-07 2.12E-07 4.17E-07 2.29E-07 Hg 9.09E-09 2.91E-10 3.74E-09 6.86E-09 1.45E-08 6.96E-09 1.14E-08 8.39E-09
NH₃ 1.76E-07 1.91E-08 7.28E-08 1.33E-07 2.04E-06 4.16E-07 2.20E-07 5.42E-07 CO 6.35E-03 5.32E-03 5.73E-03 6.09E-03 4.56E-03 6.03E-03 6.63E-03 5.18E-03
NOx 6.93E-02 2.06E-03 6.85E-02 6.90E-02 5.24E-02 6.91E-02 6.96E-02 5.75E-02 SO₂ 4.41E-04 6.87E-05 1.87E-04 3.35E-04 1.92E-03 5.12E-04 5.52E-04 6.76E-04 VOC 2.51E-02 3.91E-03 1.74E-02 2.86E-02 2.81E-02 2.79E-02 1.77E-02 2.30E-02 PM 3.68E-04 1.09E-04 2.49E-04 3.18E-04 2.36E-04 3.03E-04 4.18E-04 2.94E-04
RMT
Pb 2.98E-07 2.98E-07 2.98E-07 2.98E-07 2.98E-07 2.98E-07 2.98E-07 2.98E-07 Hg 7.97E-09 7.97E-09 1.29E-03 7.97E-09 7.97E-09 7.97E-09 7.97E-09 7.97E-09
NH₃ 2.51E-07 2.51E-07 2.51E-07 2.51E-07 2.51E-07 2.51E-07 2.51E-07 2.45E-07 CO 2.05E-03 2.05E-03 2.05E-03 2.05E-03 2.05E-03 2.05E-03 2.05E-03 2.05E-03
NOx 1.70E-02 1.70E-02 1.70E-02 1.70E-02 1.70E-02 1.70E-02 1.70E-02 1.70E-02 SO₂ 3.00E-04 3.00E-04 3.00E-04 3.00E-04 3.00E-04 3.00E-04 3.00E-04 3.00E-04 VOC 4.91E-04 4.91E-04 4.91E-04 4.91E-04 4.91E-04 4.91E-04 4.91E-04 4.91E-04 PM 1.56E-04 1.56E-04 1.56E-04 1.56E-04 1.56E-04 1.56E-04 1.56E-04 1.56E-04
Cradle to Gate (RMA
+ RMT)
Pb 6.30E-07 3.08E-07 4.34E-07 5.48E-07 4.66E-07 5.10E-07 7.15E-07 5.27E-07 Hg 1.71E-08 8.26E-09 1.29E-03 1.48E-08 2.25E-08 1.49E-08 1.94E-08 1.64E-08
NH₃ 4.26E-07 2.70E-07 3.23E-07 3.83E-07 2.29E-06 6.67E-07 4.71E-07 7.86E-07 CO 8.41E-03 7.38E-03 7.78E-03 8.15E-03 6.61E-03 8.09E-03 8.68E-03 7.23E-03
NOx 8.63E-02 1.91E-02 8.56E-02 8.60E-02 6.95E-02 8.61E-02 8.66E-02 7.45E-02 SO₂ 7.41E-04 3.69E-04 4.87E-04 6.36E-04 2.22E-03 8.12E-04 8.52E-04 9.76E-04 VOC 2.56E-02 4.40E-03 1.79E-02 2.91E-02 2.86E-02 2.84E-02 1.82E-02 2.35E-02 PM 5.24E-04 2.65E-04 4.05E-04 4.75E-04 3.92E-04 4.59E-04 5.74E-04 4.50E-04
50
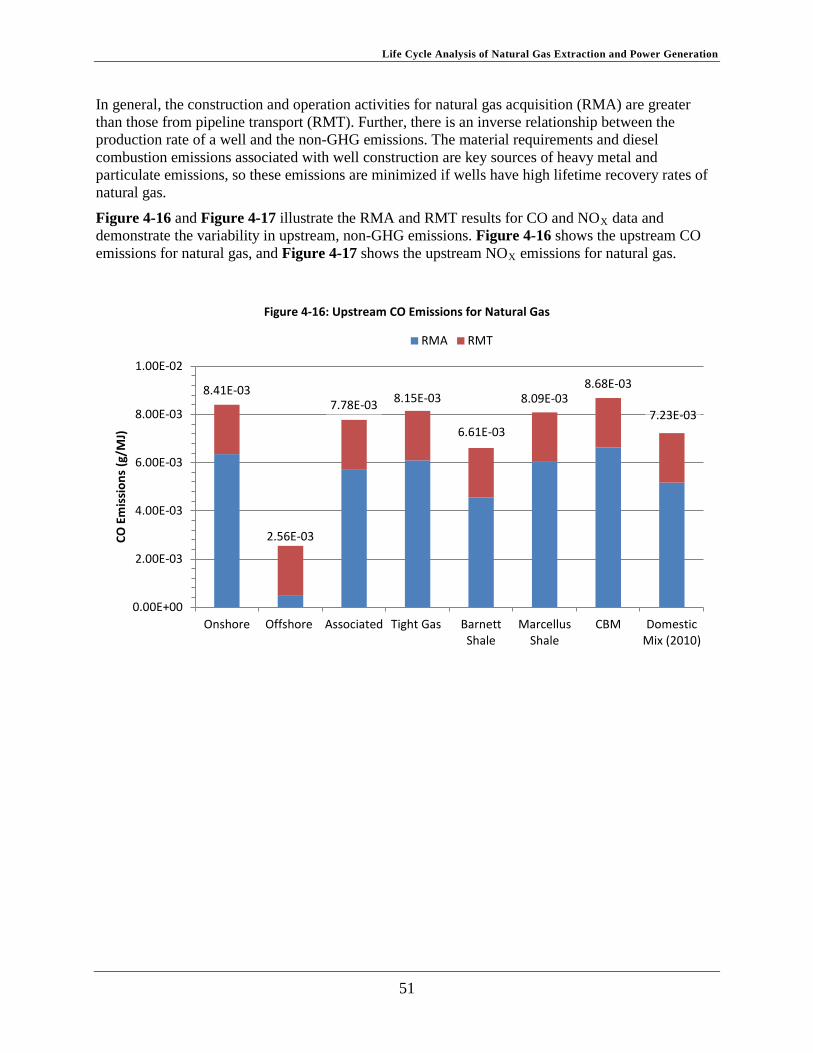
Life Cycle Analysis of Natural Gas Extraction and Power Generation
In general, the construction and operation activities for natural gas acquisition (RMA) are greater than those from pipeline transport (RMT). Further, there is an inverse relationship between the production rate of a well and the non-GHG emissions. The material requirements and diesel combustion emissions associated with well construction are key sources of heavy metal and particulate emissions, so these emissions are minimized if wells have high lifetime recovery rates of natural gas.
Figure 4-16 and Figure 4-17 illustrate the RMA and RMT results for CO and NOX data and demonstrate the variability in upstream, non-GHG emissions. Figure 4-16 shows the upstream CO emissions for natural gas, and Figure 4-17 shows the upstream NOX emissions for natural gas.
Figure 4-16: Upstream CO Emissions for Natural Gas
8.41E-03
2.56E-03
7.78E-03 8.15E-03
6.61E-03
8.09E-03 8.68E-03
7.23E-03
0.00E+00
2.00E-03
4.00E-03
6.00E-03
8.00E-03
1.00E-02
Onshore Offshore Associated Tight Gas BarnettShale
MarcellusShale
CBM DomesticMix (2010)
CO E
mis
sion
s (g
/MJ)
RMA RMT
51

Life Cycle Analysis of Natural Gas Extraction and Power Generation
Figure 4-17: Upstream NOX Emissions for Natural Gas
The above results focus on the upstream profile of natural gas types, but a life cycle perspective is necessary to evaluate upstream (RMA and RMT) emissions in comparison to emissions from the natural gas power plants (ECF). Using the 2010 domestic mix of natural gas, Table 4-4 shows the life cycle results for non-GHG emissions using the functional unit of 1 MWh of delivered electricity.
8.63E-02
1.91E-02
8.56E-02 8.60E-02
6.94E-02
8.61E-02 8.66E-02 7.45E-02
0.00E+00
2.00E-02
4.00E-02
6.00E-02
8.00E-02
1.00E-01
Onshore Offshore Associated Tight Gas BarnettShale
MarcellusShale
CBM DomesticMix (2010)
NO
x Em
issi
ons
(g/M
J)
RMA RMT
52

Life Cycle Analysis of Natural Gas Extraction and Power Generation
Table 4-4: Life Cycle Non-GHG Emissions for Natural Gas Power Using Domestic Natural Gas Mix
Technology Emission (kg/MWh) RMA RMT ECF Total
Fleet
Pb 1.91E-06 2.48E-06 4.37E-07 4.83E-06 Hg 6.99E-08 6.65E-08 2.46E-08 1.61E-07
NH₃ 4.52E-06 2.04E-06 1.92E-02 1.92E-02 CO 4.32E-02 1.71E-02 2.04E-03 6.23E-02
NOx 4.80E-01 1.42E-01 9.33E-02 7.15E-01 SO₂ 5.64E-03 2.50E-03 2.84E-03 1.10E-02 VOC 1.92E-01 4.09E-03 3.42E-05 1.96E-01 PM 2.45E-03 1.30E-03 5.03E-04 4.25E-03
NGCC
Pb 1.92E-06 2.49E-06 4.37E-07 4.85E-06 Hg 7.02E-08 6.68E-08 2.46E-08 1.62E-07
NH₃ 4.53E-06 2.05E-06 1.92E-02 1.92E-02 CO 4.33E-02 1.72E-02 2.04E-03 6.26E-02
NOx 4.82E-01 1.42E-01 3.09E-02 6.55E-01 SO₂ 5.66E-03 2.51E-03 7.74E-04 8.95E-03 VOC 1.93E-01 4.11E-03 3.42E-05 1.97E-01 PM 2.46E-03 1.31E-03 5.03E-04 4.27E-03
NGCC/ccs
Pb 2.25E-06 2.92E-06 5.94E-07 5.76E-06 Hg 8.23E-08 7.83E-08 7.75E-08 2.38E-07
NH₃ 5.31E-06 2.40E-06 2.28E-02 2.28E-02 CO 5.08E-02 2.01E-02 2.99E-03 7.39E-02
NOx 5.64E-01 1.67E-01 3.92E-02 7.71E-01 SO₂ 6.63E-03 2.94E-03 9.40E-03 1.90E-02 VOC 2.26E-01 4.82E-03 1.39E-03 2.32E-01 PM 2.88E-03 1.53E-03 1.01E-03 5.42E-03
GTSC
Pb 2.95E-06 3.84E-06 7.33E-06 1.41E-05 Hg 1.08E-07 1.03E-07 1.07E-08 2.22E-07
NH₃ 6.99E-06 3.15E-06 2.90E-02 2.90E-02 CO 6.68E-02 2.65E-02 5.00E-03 9.82E-02
NOx 7.42E-01 2.19E-01 4.93E-02 1.01E+00 SO₂ 8.72E-03 3.87E-03 1.35E-03 1.39E-02 VOC 2.97E-01 6.33E-03 4.49E-04 3.03E-01 PM 3.79E-03 2.01E-03 1.17E-03 6.97E-03
The following figures show the life cycle profiles for CO and NOX for each energy conversion technology. Figure 4-18 shows the life cycle emissions of CO, and Figure 4-19 shows the life cycle emissions of NOX.
53

Life Cycle Analysis of Natural Gas Extraction and Power Generation
Figure 4-18: Life Cycle CO Emissions for Natural Gas Power Using Domestic Natural Gas Mix
Figure 4-19: Life Cycle NOX Emissions for Natural Gas Power Using Domestic Natural Gas Mix
In general, life cycle emissions increase with decreasing power plant efficiency. The addition of CCS does not result in a significant change to non-GHG emissions. The slightly higher non-GHG emissions from the CCS cases are due to the normalization of the life cycle results to the functional unit of 1 MWh of delivered electricity (due to the decreased NGCC efficiency caused by the CCS system, more natural gas is combusted by the CCS cases than the cases that do not have CCS).
0.062 0.063
0.074
0.098
0.00
0.02
0.04
0.06
0.08
0.10
0.12
Fleet NGCC NGCC/ccs GTSC
CO E
mis
sion
s
(kg/
MW
h)
Raw Material Acquisition Raw Material Transport Energy Conversion Facility
0.715 0.655
0.771
1.011
0.00
0.20
0.40
0.60
0.80
1.00
1.20
Fleet NGCC NGCC/ccs GTSC
NO
x Em
issi
ons
(kg/
MW
h)
Raw Material Acquisition Raw Material Transport Energy Conversion Facility
54

Life Cycle Analysis of Natural Gas Extraction and Power Generation
4.7 Water Use This analysis accounts for the volume of water withdrawn for natural gas extraction and the volume of water discharged from natural gas wells. The net difference between these two flows (withdrawal minus discharge) is the water consumption rate.
This analysis also translates the water flows to the basis of natural gas produced, so that if a well has a high production rate, it is possible for that well to have relatively low water use results per unit of production even if the water use rate during completion was relatively high. In other words, a high production rate during the life of a well can offset its high burdens during well completion. Figure 4-20 provides a comparison of water withdrawal and discharge. In this case, the discharged water includes water that occurs naturally in the well formation (known as produced water) as well as flowback water that represents recovery of water used for hydrofracking. On the basis of natural gas produced, Marcellus Shale consumes less water than Barnett Shale and tight gas, but uses more water than conventional offshore, conventional onshore, conventional onshore associated gas, and coal bed methane, where water is either not required or is reused from other available produced water. Tight gas water use, produced water, and net water consumption were estimated based on an average of Barnett Shale water use and conventional onshore water use; this estimate was made due to lack of sufficient, readily available data and is noted as a data limitation.
Figure 4-20: Upstream Water Use and Flowback Water Production
Typical CBM wells are installed into relatively shallow coal formations, where a high water table is present. To enable natural gas extraction, the formation water is first pumped out of the coal seam. That formation water is typically discharged to the surface, and, in cases where water quality is sufficient, may be put to beneficial use, such as for stock watering or supplemental agricultural water. Natural gas production increases as the water is drawn down, and methane is released from the
1.5E-02
1.5E-03
1.4E-02
2.8E-02
5.2E-02
1.9E-02
4.1E-03
2.6E-02 2.3E-02
1.3E-02
2.2E-02
7.1E-03
2.6E-02
3.1E-03
1.1E-01
2.5E-02
0
0.02
0.04
0.06
0.08
0.1
0.12
Onshore Offshore Associated Tight Gas BarnettShale
MarcellusShale
CBM DomesticMix (2010)
Wat
er W
ithdr
awal
and
Dis
char
ge
(L/M
J)
Water Withdrawal (L/MJ) Water Discharge (L/MJ)
55

Life Cycle Analysis of Natural Gas Extraction and Power Generation
formation. Thus, CBM RMA results in a considerable rate of water production, shown as water discharge in Figure 4-20.
Figure 4-21 provides a comparison of upstream water consumption for various types of natural gas. In terms of net water consumed, Marcellus Shale ranks third highest (0.016 L/MJ), behind tight gas (0.021 L/MJ) and Barnett Shale (0.027 L/MJ). Net water consumption is low for conventional onshore and associated gas due to discharges of produced water to surface water. CBM has the lowest water consumption (-0.102 L/MJ) because it withdraws only 0.004 L/MJ and produces 0.106 L/MJ.
Figure 4-21: Net Upstream Water Consumption
Water is an input to hydrofracking, which is used for recovering natural gas from tight reservoirs such as Barnett Shale and Marcellus Shale. The water inputs for the completion of a horizontal, shale-gas well ranges from 2 to 4 million gallons. The variability in this value is due to basin and formation characteristics (GWPC & ALL, 2009). The completion of shale gas wells in the Barnett shale gas play uses 1.2 and 2.7 million gallons of water for vertical and horizontal wells, respectively. The data used in the LCA model of this analysis is based on the water use and natural gas production of the entire Barnett Shale region, so it is a composite of vertical and horizontal wells and has a per well average water use of 2.3 million gallons. The completion of a horizontal well in the Marcellus Shale gas play uses 3.88 million gallons of water (GWPC & ALL, 2009). Water used for hydrofracking accounts for 98 percent of this water use; the remaining 2 percent accounts for water used during well drilling. As stated above, this analysis translates water flows to the basis of natural gas produced, so that if a well has a high production rate, it is possible for that well to have relatively low water-use results per unit of production even if the water-use rate during completion was relatively high.
The results for water withdrawal and consumption should be viewed from a life cycle perspective, beginning with natural gas extraction and ending with electricity delivered to the consumer. The life cycle water withdrawal and discharge for natural gas power from seven sources of natural gas are
-0.008 -0.011 -0.008
0.021 0.027
0.016
-0.102
0.001
-0.12
-0.1
-0.08
-0.06
-0.04
-0.02
0
0.02
0.04
Onshore Offshore Associated Tight Gas BarnettShale
MarcellusShale
CBM DomesticMix (2010)
Wat
er C
onsu
mpt
ion
(L/M
J)
56

Life Cycle Analysis of Natural Gas Extraction and Power Generation
shown in Figure 4-22. This figure is based on a functional unit of 1 MWh of delivered electricity, is representative of an NGCC power plant (without CCS), and accounts for a 7 percent T&D loss between the power plant and consumer. Water withdrawals are shown as positive values, discharges are shown as negative values, and net consumption is shown by the black diamond on each data series.
As shown by Figure 4-22 on the basis of 1 MWh of delivered electricity from an NGCC power plant, the magnitude of water withdrawals and discharges is greatest for the energy conversion facility for all natural gas profiles considered except for CBM, where RMA discharge is greater than ECF discharge. Net water consumption varies considerably based on the natural gas source that is considered. Net water consumption rates for conventional onshore (745 L/MWh), conventional offshore (818 L/MWh), and onshore associated natural gas (738 L/MWh) are essentially similar in terms of net water consumption. However, due to elevated water requirements for hydrofracking, water consumption for the shale and tight gas is higher. For instance, in comparison to conventional onshore natural gas production (745 L/MWh), tight gas requires 32 percent more water (986 L/MWh), Marcellus Shale requires 26 percent more water (941 L/MWh), and Barnett Shale requires 38 percent more water (1,031 L/MWh).
The acquisition of CBM natural gas consumes a relatively small amount of water. As discussed above, CBM extraction involves the removal of naturally occurring water from the formation. As a result, the life cycle of an NGCC system using natural gas from CBM results in more water discharges than withdrawals.
57

Life Cycle Analysis of Natural Gas Extraction and Power Generation
Figure 4-22: Life Cycle Water Withdrawal and Discharge for Seven Natural Gas Sources through NGCC Power
As shown by Figure 4-22, different natural gas sources have significantly different life cycle water consumption when considered from a life cycle perspective with NGCC power. However, different power plant technologies also lead to different conclusions about life cycle water consumption. The life cycle water withdrawal and discharge volumes for three natural gas power technologies using the domestic mix of natural gas are shown in Figure 4-23.
745 818 738 986
1,031 941
-44
-1500
-1000
-500
0
500
1000
1500
2000
Onshore Offshore Associated Tight Gas Barnett Shale MarcellusShale
CBM
Wat
er W
ithdr
awal
and
Dis
char
ge
(L/M
Wh)
Withdrawal RMA Withdrawal RMT Withdrawal ECFDischarge RMA Discharge RMT Discharge ECF
58

Life Cycle Analysis of Natural Gas Extraction and Power Generation
Figure 4-23: Life Cycle Water Withdrawal and Discharge for the Domestic Natural Gas Mix through Different Power Plants
The life cycle water consumed by NGCC with CCS is approximately two times higher than that for NGCC without. This difference is due to the water requirements of the CCS system, associated with increased cooling requirements. The Econamine FG PlusSM process requires cooling water to reduce the flue gas temperature from 57°C to 32°C, cool the solvent (the reaction between CO2 and the amine solvent is exothermic), remove the heat input from the additional auxiliary loads, and remove the heat in the CO2 compressor intercoolers (NETL, 2007; Reddy, Johnson, & Gilmartin, 2008). GTSC power plants are air cooled and do not have steam cycles or other water requirements, so the life cycle water consumption for GTSC systems are solely a function of upstream water requirements. Directly comparable water data are not available for fleet natural gas power plants, so fleet power is not included in Figure 4-23. Fleet natural gas power plants use combined cycle technology, so it is likely that their water use profiles are similar to those for NGCC power plants.
4.8 Water Quality This analysis accounts for the water quality constituents associated with discharge water. These constituents have the potential to degrade surface or shallow groundwater quality. This analysis does not consider changes to water quality in deep aquifers, or the potential for migration of deep aquifer water to shallow aquifers used for potable water supply.
Water quality data for each of the natural gas types are not available from a single data source, but from a variety of sources. The water quality data available for Marcellus Shale were more detailed
809
1,559
1
-1.50E+03
-1.00E+03
-5.00E+02
0.00E+00
5.00E+02
1.00E+03
1.50E+03
2.00E+03
2.50E+03
3.00E+03
NGCC NGCC/ccs GTSC
Wat
er W
ithdr
awal
and
Dis
char
ge
(L/M
Wh)
Withdrawal RMA Withdrawal RMT Withdrawal ECFDischarge RMA Discharge RMT Discharge ECF
59

Life Cycle Analysis of Natural Gas Extraction and Power Generation
than any of the other natural gas profiles. As a result, only select water quality constituents can be meaningfully compared across all of the natural gas types. The water quality constituents considered here are described in terms of mass loadings: that is, the total mass of a water quality constituent, measured without the water in which it is contained, per unit of natural gas extracted. Figure 4-24 provides a comparison of total dissolved solids (TDS) loading for each natural gas profile. The TDS parameter is a measurement of the total inorganic and organic constituents that are not removed by a 2 micrometer (µm) filter. In produced water systems, TDS typically contains primarily ionic minerals (salts), but may also contain organic material and other constituents. TDS is analogous to salinity, although the term ‘salinity’ is typically restricted to the concentration of dissolved minerals contained in ocean water. TDS is a useful parameter for broadly comparing water quality since it integrates a wide array of minerals and other substances that may be contained in a water sample. Elevated TDS levels can also deleteriously affect the taste of potable water, reduce agricultural crop yields, and contribute to regional salt loadings, in some cases reducing the potential for beneficial use of affected waters. The U.S. EPA maintains a secondary maximum contaminant level (MCL) water quality standard for drinking water of 0.5 g/L. For comparison, seawater averages around 32 g/L, and some produced waters can reach 100 g/L or more.
TDS emissions associated with natural gas production are a result of the disposal or release of various produced water, including flowback water and wastewater that is treated on site or through wastewater treatment plants, including municipal wastewater treatment plants (WWTP). Ionic salts, the primary constituents of TDS, are extremely difficult and costly to remove during water treatment. For Marcellus Shale natural gas production, where flowback water can be routed through municipal wastewater systems, there may not be sufficient capacity to effectively remove TDS. Thus, essentially all of the TDS that is discharged from flowback water to a municipal WWTP is later released to surface waters.
CBM wells result in high TDS loading rates in part because suitable coal layers in the U.S. Rocky Mountain states (where most CBM is produced) contain water with high TDS levels. Additionally, the operation of CBM wells generates large volumes of produced water, which translates to high TDS loadings. High TDS is less problematic for water quality at offshore wells, where produced water having relatively high TDS loads is typically discharged to the ocean without treatment for TDS. As shown in Figure 4-24, other types of natural gas sources, which include Barnett Shale, Marcellus Shale, conventional onshore, onshore associated, and tight gas production result in less than 1.0E-04 kg of TDS per MJ of natural gas. Marcellus Shale is slightly higher, at approximately 1.4E-04 kg of TDS per MJ of natural gas.
Figure 4-25 shows composite values for organics, including oil and grease as well as total and dissolved organic carbon. Sufficient data were not available to calculate the organic effluents directly released by CBM or Barnett Shale extraction. Data quality is lower for organics than for TDS; however, some meaningful comparisons can still be made. For instance, Marcellus Shale production results in lower releases of waterborne organic constituents than conventional onshore and associated natural gas. Compared to other domestic natural gas extraction sources, offshore and tight gas extraction technologies release the lowest amounts of waterborne organic constituents.
60

Life Cycle Analysis of Natural Gas Extraction and Power Generation
Figure 4-24: Waterborne Total Dissolved Solid from Upstream Natural Gas
Figure 4-25: Waterborne Organics from Upstream Natural Gas
5 Land Use Calculation Method The land use metrics used for this analysis quantify the land area that is transformed from its original state due to production of electricity, including supporting facilities. The transformation of land causes the direct emission of GHG emissions due to changes in above-ground biomass and soil carbon. GHG emissions are also caused from the indirect consequences of land use change, specifically, the displacement of agriculture. Calculations are based on a 30-year study period, or as relevant for the natural gas life cycle as discussed in the following text.
7.1E-05
8.6E-04
7.1E-05 2.4E-06 7.0E-06 1.4E-04
5.1E-03
6.1E-04
0.0E+00
1.0E-03
2.0E-03
3.0E-03
4.0E-03
5.0E-03
6.0E-03
Onshore Offshore Associated Tight Gas BarnettShale
MarcellusShale
CBM DomesticMix (2010)
Tota
l Dis
solv
ed S
olid
s
(kg/
MJ)
4.9E-07
1.6E-09
4.9E-07
5.1E-09
1.5E-07
3.1E-08 7.5E-09
1.7E-07
0.0E+00
1.0E-07
2.0E-07
3.0E-07
4.0E-07
5.0E-07
6.0E-07
Onshore Offshore Associated Tight Gas BarnettShale
MarcellusShale
CBM DomesticMix (2010)
Org
anic
s (k
g/M
J)
61

Life Cycle Analysis of Natural Gas Extraction and Power Generation
5.1 Transformed Land Area The life cycle of natural gas incurs land use changes during RMA, RMT, and ECF stages. Land is transformed during the installation of an extraction site (RMA), the installation of a natural gas transmission pipeline (RMT), and the installation of a natural gas power plant (ECF). NETL’s land use model requires the input of land area (m2) and land type (grassland, forest, and cropland). The land areas and types for the natural gas supply chain are summarized in this section.
5.1.1 Extraction Natural gas extraction occurs within the RMA stage of NETL’s life cycle model. A natural gas extraction site has a well pad that holds permanent equipment and also provides room for development and maintenance activities.
The land area for natural gas wells range from 0.25 to 5.0 acres (1,000 to 20,200 m2) per well (Arthur & Cornum, 2010; Ebel, Borchers, & Carriazo, 2011; Smith, 2012). CBM wells are on the low end of this range and Barnett Shale and tight gas wells are on the high end of this range. To calculate life cycle results, the life cycle model apportions these land areas according to the total lifetime production of each well type.
The type of land (forest, grassland, or cropland) that is transformed depends on the location of the natural gas infrastructure. The location of land transformation varies across natural gas sources. Specific natural gas extraction sources include Marcellus Shale (Pennsylvania, West Virginia, and Ohio) and Barnett Shale (Texas). CBM is extracted in the Western U.S. (Colorado, Montana, New Mexico, Oklahoma, and Wyoming) and Illinois. Other natural gas extraction technologies (conventional onshore and tight gas) occur in many states. Offshore natural gas does not incur any land transformation at the point of extraction.
Natural gas extraction sites are permanently converted to an industrial land application. This permanent conversion is accounted for in NETL’s model, which includes long-term carbon balances for permanent and temporary conversion.
5.1.2 Transmission Pipeline Natural gas transmission occurs within the RMT stage of NETL’s life cycle model. Natural gas is transported via a natural gas transmission network, which has large diameter pipelines that move natural gas from processing sites to large markets. The U.S. has an extensive natural gas transmission network, which has a large transport capacity from the Southern U.S. (Texas and Louisiana) to the Northeast U.S. The pipeline transmission network also allows natural gas transport across the Rocky Mountains and from Texas to the West Coast. (EIA, n.d.)
Natural gas is a commodity. The quality of processed natural gas does not have significant geographical variability, and natural gas can be transported long distances via the U.S. natural gas transmission network. Since natural gas is a commodity, the same RMT characteristics are modeled for all sources of natural gas. The average distance for domestic natural gas transmission is 971 km (604 miles), and the width of a pipeline right-of-way is 15 meters (50 feet); factoring this distance and width equates to a total pipeline land area of 14.8 million m2. Offshore extraction (which includes offshore extraction for imported LNG) requires additional pipeline land use of 161 km (100 miles) with a 15 meter (50 feet) right-of-way.
The land types for transmission pipelines are the straight average of the land use profile of the lower 48 states. A more accurate land use profile could be developed by factoring the area of pipeline infrastructure for each state in the U.S. by the land profile of each state, but this would require a
62

Life Cycle Analysis of Natural Gas Extraction and Power Generation
time-consuming data collection effort that would yield limited returns with respect to the total GHG emissions from the natural gas life cycle.
The land used by pipelines reverts to its original land use type within five years. This reversion is accounted for in NETL’s model, which includes long-term carbon balances for permanent and temporary conversion.
5.1.3 Natural Gas Power Plant The combustion of natural gas at a power plant occurs within the ECF stage of NETL’s life cycle model. NGCC power plants are well suited for baseload power production. Since natural gas is a commodity, NETL models identical power plant characteristics for all sources of natural gas. The area of a typical NGCC facility is 40,500 m2 (10 acres). The land types for transmission pipelines are the straight average of the land use profile of the lower 48 states. A more accurate land use profile could be developed by factoring the capacity of NGCC power plants in each state by the land profile of each state, but this would require a time-consuming data collection effort that would yield limited returns with respect to the total GHG emissions from the natural gas life cycle.
No data are available for the land area required by CO2 capture equipment or GTSC power plants. This analysis increases the land area of an NGCC power plant without CO2 capture by 10 percent to account for the land used by an NGCC power plant with CO2 capture. The land area of a GTSC power plant is modeled as half of the land area of an NGCC power plant.
Natural gas power plant sites are permanently converted to an industrial land application. This permanent conversion is accounted for in NETL’s model, which includes long-term carbon balances for permanent and temporary conversion.
No land is transformed by fleet power plants. Fleet power plants are existing infrastructure and do not incur land use change within the boundaries of this analysis.
5.1.4 CO2 Pipeline A CO2 pipeline runs from the NGCC (with CO2 capture) power plant to a saline aquifer sequestration site. The pipeline is 161 km (100 miles) long and has a width (right-of-way) of 15.2 meters (50 feet). The land used by pipelines is not permanently converted, but reverts to its original land type within five years.
5.1.5 Saline Aquifer CO2 Sequestration Site There are a total of 47 wells required for the modeled saline aquifer. Each well has an approximate footprint of 0.25 acres (NETL, 2012c). The water treatment facility has a footprint of 6,400 m2, and the CO2 injection equipment was assumed to require 400 m2. In addition, land use used for road access to the wells. The required road area was estimated by assuming that the wells are laid out in a square grid with equal spacing. Based on the grid formation with four road connections at each well, the total land area for access roads was determined to be 443,500 m2. The total footprint for the saline aquifer sequestration site modeled in this analysis is 497,800 m2. (NETL, 2013)
Table 5-1 shows the land use area calculated for the stages in the natural gas life cycle. Table 5-2 shows the state land use profile for the natural gas life cycle.
63

Life Cycle Analysis of Natural Gas Extraction and Power Generation
Table 5-1: Land Use Area for Natural Gas Life Cycle
Process Property Units Conventional Onshore Offshore Associated Tight Barnett Marcellus CBM Imported
LNG
Extraction Well area acres/well 2.5
N/A 2.5 5.0 5.0 1.5 0.25
N/A m2/well 10,100 10,100 20,200 20,200 6,000 1,000
Pipeline, onshore
Pipeline length km 971
Right-of-way width m 15.2
Pipeline area m2/pipeline 14,800,000
Pipeline, offshore
Pipeline length km
N/A
161
N/A
161
Right-of-way width m 15.2 15.2
Pipeline area m2/pipeline 2,450,000 2,450,000
Power Plant
NGCC acres/facility 10
m2/facility 40,500
NGCC with CO2 capture
acres/facility 11 m2/facility 44,600
GTSC acres/facility 5
m2/facility 20,250
Fleet NGCC acres/facility N/A
m2/facility N/A
CO2 Pipeline Pipeline length km 161
Right-of-way width m 15.2 Pipeline area m2/pipeline 2,450,000
Saline Aquifer
Injection, monitoring, and
disposal wells
acres/well 0.25 m2/well 1,010
wells/facility 47
Water treatment acres/facility 1.6
m2/facility 6,400
Access roads acres/facility 110
m2/site 444,000 Storage capacity tonne CO2/facility-day 10,000
Operating life years 100
64

Life Cycle Analysis of Natural Gas Extraction and Power Generation
Table 5-2: State Land Use Profile for Natural Gas Life Cycle
State NG Source
NG Pipeline NGCC Facility Conventional
Onshore Offshore Associated Gas Tight Barnett Marcellus CBM
Colorado • •
Illinois •
Kansas •
Kentucky •
Louisiana •
Mississippi •
Montana • •
Nebraska •
New Mexico • •
New York •
North Dakota •
Ohio • •
Oklahoma • •
Pennsylvania • •
South Dakota •
Tennessee •
Texas • •
Utah •
West Virginia • •
Wyoming • •
National Average (lower 48 states) • • • •
65

Life Cycle Analysis of Natural Gas Extraction and Power Generation
5.2 Greenhouse Gas Emissions from Land Use GHG emissions due to land use change were evaluated based upon the U.S. EPA’s method for the quantification of GHG emissions, in support of the Renewable Fuel Standards (RFS) (EPA, 2010). EPA’s analysis quantifies GHG emissions that are expected to result from land use changes from forest, grassland, savanna, shrubland, wetland, perennial, or mixed land use types to agricultural cropland, grassland, savanna, or perennial land use types. Relying on an evaluation of historic land use change completed by Winrock, EPA calculated a series of GHG emission factors for the following criteria: change in biomass carbon stocks, lost forest sequestration, annual soil carbon flux, CH4 emissions, NOX emissions, annual peat emissions, and fire emissions, that would result from land conversion over a range of timeframes. EPA’s analysis also includes calculated reversion factors, for the reversion of land use from agricultural cropland, grassland, savanna, and perennial, to forest, grassland, savanna, shrub, wetland, perennial, or mixed land uses. Emission factors considered for reversion were change in biomass carbon stocks, change in soil carbon stocks, and annual soil carbon uptake over a variety of timeframes. Each of these emission factors, for land conversion and reversion, was included for a total of 756 global countries and regions within countries, including the 48 contiguous states. Based on the land use categories (forest, grassland, and agriculture/cropland) that were affected by study facilities, EPA’s emission factors were applied on a statewide or regional basis.
GHG emissions from indirect land use were quantified only for the displacement of agriculture, and not for the displacement of other land uses. Indirect land use GHG emissions were calculated based on estimated indirect land transformation values, as discussed previously. Then, EPA’s GHG emission factors for land use conversion were applied to the indirect land transformation values, according to transformed land type and region, and total indirect land use GHG emissions were calculated.
5.3 Land Use Results Figure 5-1 shows that the area of land transformation for upstream natural gas ranges from 5.7E-06 to 2.1E-05 m2 per MJ of delivered natural gas. Offshore natural gas, which does not have land transformation at the extraction site, transforms less land than other natural gas sources. CBM and Marcellus Shale also have low areas of land transformation (of the same order of magnitude as the land transformed by offshore natural gas). The low transformation area for CBM is due to its low extraction footprint (0.25 acre/well), and the low transformation for Marcellus Shale is due to multi-well drilling pads that minimize land transformation (1.5 acre/well) and the high EURs of Marcellus Shale wells. Life cycle land use results have an inverse relationship with EUR; EUR is used as the denominator for apportioning one-time or periodic burdens to a unit of production, so as the EUR of a well increases, the area of transformed land per unit of natural gas production decreases. Conventional onshore and tight gas have higher life cycle land transformation (approximately 2E-05 m2 per MJ of delivered NG) than other sources of natural gas due to their relatively high extraction areas per unit of gas produced. Since all domestically sourced natural gas is transported via the same pipeline network, all natural gas sources use the same land area for pipeline right-of-ways.
The type of land that is transformed, not just the total area of transformation, is also important. Marcellus Shale results in the highest proportional loss of forest land. Barnett shale has the highest proportional loss of grassland with relatively low losses of forests. Tight gas has the highest proportional loss of agriculture.
66

Life Cycle Analysis of Natural Gas Extraction and Power Generation
Figure 5-1: Direct Transformed Land Area for Upstream Natural Gas
Figure 5-2 shows the area of land use change on the basis of delivered power, which includes land transformed by upstream natural gas as well as land transformed by natural gas power plants. Four power plant technologies are shown, all of which are modeled using the 2010 domestic mix of natural gas for fuel. These results range from 0.12 to 0.46 m2 per MWh of delivered electricity. Power plant efficiency is the only variable that drives the differences among the fleet, NGCC, and GTSC scenarios.
Compared to NGCC, the scenario for NGCC with CCS has a lower power plant efficiency because it expends energy for carbon capture. Thus, compared to NGCC, NGCC with CCS incurs more natural gas acquisition and transport burdens per MWh of delivered electricity. Additionally, NGCC with CCS has land use burdens associated with CO2 pipelines and sequestration sites.
Figure 5-2: Direct Transformed Land Area for Natural Gas Power Using the 2010 Domestic Mix of Natural Gas
1.88E-05
5.65E-06
1.25E-05
2.14E-05
1.15E-05
6.69E-06 5.71E-06
1.44E-05
0.00E+00
5.00E-06
1.00E-05
1.50E-05
2.00E-05
2.50E-05
3.00E-05
Onshore Offshore Associated Tight BarnettShale
MarcellusShale
CBM
Conventional Unconventional DomesticMix 2010
Area
of L
and
Use
Cha
nge
(m
2 /M
J del
iver
ed N
G)
Grassland Forest Agriculture
0.12 0.12
0.46
0.19
0.00
0.10
0.20
0.30
0.40
0.50
Fleet NGCC NGCC/ccs GTSC
Area
of L
and
Use
Cha
nge
(m
2 /M
Wh
deliv
ered
)
Grassland Forest Agriculture
67

Life Cycle Analysis of Natural Gas Extraction and Power Generation
Figure 5-3 shows the land use GHG emissions from upstream natural gas. Extraction and processing emissions (RMA) are shown in blue and pipeline emissions (RMT) are shown in red. Further, direct land use emissions are shown in darker shades than indirect land use emissions. For example, the direct land use GHG emissions from extraction and processing are in dark blue, while the indirect land use GHG emissions from extraction and processing are shown in light blue.
Figure 5-3: Direct and Indirect Land Use GHG Emissions for Delivered Natural Gas
Both extraction and pipeline land use are key contributors to the upstream land use GHG profile. Exceptions include CBM and offshore natural gas, which have low or zero land use requirements at extraction, making the land used by pipelines the key contributor to their upstream land use GHG profiles.
Another interesting exception is the relatively high proportion of indirect land use GHG emissions from Barnett Shale extraction. This is due to Barnett Shale’s relatively high share of agriculture displacement (24 percent) and relatively high share of forest transformation (22 percent). Displaced agricultural land drives indirect land use change, while above-ground forest biomass (which stores high levels of carbon) drives direct land use change. Tight gas also displaces a significant share of agriculture, but, unlike Barnett Shale, has more direct land use GHG emissions from forest transformation. And Marcellus Shale, which uses the same extraction technology as Barnett Shale, displaces a lower share of agriculture (resulting in lower indirect land use GHG emissions than Barnett Shale) and a higher share of forest (resulting in higher direct land use GHG emissions than Barnett Shale).
There are trade-offs in land use GHG emissions among different natural gas sources, but land use GHG emissions are a small portion of the total GHG emissions from natural gas systems. Other GHG emissions from the natural gas life cycle include GHG emissions from fuel combustion and fugitive CH4. Figure 5-4 shows the land use GHG emissions for the 2010 domestic natural gas mix through four natural gas power technologies.
0.46
0.14
0.30
0.48
0.18 0.19 0.13
0.32
0.0
0.1
0.2
0.3
0.4
0.5
0.6
0.7
0.8
Onshore Offshore Associated Tight BarnettShale
MarcellusShale
CBM
Conventional Unconventional DomesticMix 2010
GHG
Em
issi
ons
in 2
007
IPCC
100
-yr G
WP
(g C
O₂e
/MJ d
eliv
ered
NG
)
Extraction/Processing Direct Extraction/Processing Indirect Pipeline Direct Pipeline Indirect
68

Life Cycle Analysis of Natural Gas Extraction and Power Generation
Figure 5-4: Direct and Indirect Land Use GHG Emissions for NGCC Power Using the 2010 Domestic Natural Gas Mix
The life cycle land use emissions for NGCC are 2.69 kg CO2e per MWh delivered electricity. This is only 0.6 percent of total NGCC life cycle emissions (466 kg CO2e/MWh). Land use GHG emissions are also an insignificant share of the life cycle GHG emissions from fleet and GTSC power plants.
Land use GHG emissions are a higher share of the life cycle GHG emissions from NGCC systems with CO2 capture. Due to the reduction in net power plant efficiency caused by CO2 capture systems, an NGCC power with CO2 capture must consume more natural gas per MWh of production than an NGCC power plant without CO2 capture. From a life cycle perspective, this higher natural gas consumption per MWh translates to more land use per MWh. Further, since carbon capture systems significantly reduce power plant GHG emissions, the percent contribution of land use GHG emissions increases between system without CO2 capture and systems with CO2 capture. Due to the relationships between CO2 capture and upstream requirements, the GHG emissions from land use account for two percent of the life cycle GHG emissions from NGCC power with CO2 capture.
2.67 2.69
3.15
4.14
0.0
1.0
2.0
3.0
4.0
5.0
Fleet NGCC NGCC/ccs GTSC
GHG
Em
issi
ons
in 2
007
IPCC
100
-yr G
WP
(kg
CO₂e
/del
iver
ed M
Wh)
Extraction/Processing Direct Extraction/Processing Indirect Pipeline Direct
Pipeline Indirect Power Plant Direct Power Plant Indirect
69

Life Cycle Analysis of Natural Gas Extraction and Power Generation
6 Status of Current Natural Gas Research NETL’s LCA of natural gas is detailed and leads to robust conclusions about the role of unconventional natural gas sources and how the environmental profile of natural gas compares to other energy sources. An understanding of natural gas analyses conducted by other authors corroborates NETL’s conclusions and points to further goals for data collection and analysis.
6.1 Other Natural Gas LCAs Authors at several universities and other government labs have conducted research on the natural gas life cycle. The methods and conclusions of three such papers are summarized below.
Life Cycle Assessment of a Natural Gas Combined Cycle Power Generation System (Spath & Mann, 2000) This National Renewable Energy Laboratory (NREL) study is somewhat dated, having been published in 2000, but using data from the 1990s. It is a high quality study, which makes solid assumptions and tests those assumptions with documented sensitivity analysis. It uses national, annual, top-down information to develop the upstream emissions for natural gas extraction and transportation. Because of this, there are no data specific to unconventional extraction. This study includes not only GHGs but select criteria air emissions and an energy balance. A qualitative impact assessment is performed as well.
Comparative Life-Cycle Air Emissions of Coal, Domestic Natural Gas, LNG, and SNG for Electricity Generation (Jaramillo, Griffin, & Matthews, 2007) This widely cited paper is the most recent publicly available, peer-reviewed study that directly compares life cycle GHGs of power generated from natural gas and coal. Due to concerns regarding gas price volatility at the time the paper was being written, it also includes a comparison of LNG and synthetic natural gas (SNG) from coal. Rather than attempting to represent the next megawatt-hour generated by using best available technology, it looks at average current megawatt-hours generated, so plant efficiencies tend to be lower and emission factors higher. It mixes technologies (NGCC vs. GTSC) and roles (baseload vs. peaking). Like the NREL study, the upstream emissions for both natural gas and coal are top-down numbers. These values are somewhat dated, and represent a homogeneous gas supply rather than breaking out unconventional extraction.
Life-cycle Greenhouse Gas Emissions of Shale gas, Natural Gas, Coal, and Petroleum (Burnham et al., 2011)
Researchers at Argonne National Laboratory (ANL) estimated the GHG emissions from shale gas and compared it to conventional natural gas and other fossil energy sources. (Burnham et al., 2011; Clark et al., 2011) Their results show that shale gas emissions are 6 percent lower than conventional natural gas, but the overlapping uncertainty of the results prevents definitive conclusions about whether shale gas has lower GHG emissions than conventional gas.
Life Cycle Greenhouse Gas Emissions of Marcellus Shale Gas (Jiang et al., 2011)
Researchers at Carnegie Mellon University (Jiang et al., 2011) estimated the GHG emissions from Marcellus Shale natural gas and compared it to U.S. domestic average natural gas. They concluded that development and completion of a Marcellus Shale natural gas well has GHG emissions that are 11 percent higher than the development and completion of an average conventional natural gas well. This 11 percent difference is based on a narrow boundary, representing only the differences in well development and completion for Marcellus Shale and conventional natural gas. When other phases of
70

Life Cycle Analysis of Natural Gas Extraction and Power Generation
the life cycle are included, the percent difference between Marcellus Shale and conventional natural gas are reduced. In other words, as the boundaries of the systems are expanded, the differences between conventional and unconventional wells are overshadowed by other processes in the natural gas supply chain. (Jiang et al., 2011)
Figure 6-1 compares the GHG emissions from the four studies reviewed above, alongside NETL’s upstream GHG results. Results from each study were converted to a common basis of 100-year GWP in g CO2e per MJ gas delivered. While these results are expressed on the same basis, full boundary reconciliation was not performed across studies. The NREL study (Spath & Mann, 2000) does not have an explicit range of values, so the central estimate is shown. For Jaramillo et al., the central estimate is the average of the high and low values. ANL’s paper (Burnham, et al., 2011) does not explicitly report expected values and uncertainty ranges, but a recent analysis by the World Resources Institute (WRI) reconciled the results to arrive at the values shown in Figure 6-1 (Bradbury, Obeiter, Draucker, Wang, & Stevens, 2013). Finally, Jiang et al. calculate uncertainty for key extraction, processing, and transport activities, but the uncertainty shown around the results shown here represent only the uncertainty around unconventional well development (Jiang, et al., 2011).
Figure 6-1: Comparison of Natural Gas Upstream GHGs from Other Studies
7.7 7.6
17.0 14.2
15.4 17.2
7.8 8.8
0
5
10
15
20
25
Conv. Conv. Conv. Unconv. Conv. Unconv. Conv. Unconv.
Spath &Mann(2000)
Jaramillo etal. (2007)
Burnham et al. (2011) Jiang et al. (2011) NETL
GHG
Em
issi
ons
(g
CO
2₂e/
MJ d
eliv
ered
NG
)
71

Life Cycle Analysis of Natural Gas Extraction and Power Generation
6.2 Natural Gas Research on Key Modeling Data Current research on the natural gas supply chain has focused on the extent of CH4 leakage from the natural gas supply chain and the EUR of unconventional wells.
6.2.1 Methane Leakage NETL’s modeling parameters translate to the direct emission of 12.5 kg of CH4 from the extraction, processing, and transmission of 1,000 kg domestic natural gas – a 1.2 percent loss rate (as illustrated by Figure 4-3). On a 100-year GWP timeframe, these losses account for nearly two-thirds of the upstream GHG emissions from natural gas (as illustrated by Figure 4-4 and Figure 4-5). The importance of CH4 leakage with respect to the total GHG emissions from upstream natural gas has been the impetus for recent data collection and analysis.
Hydrocarbon emissions characterization in the Colorado Front Range: A pilot study (Pétron et al., 2012)
Pétron measured atmospheric volatile organic compound (VOC) concentrations in northeast Colorado, and concluded that four percent of extracted natural gas (a combination of CH4 and VOCs) is vented (Pétron, et al., 2012). Pétron’s data are representative of tight gas extraction, the predominant natural gas extraction technology in northeast Colorado, as well as other oil and natural gas sector activities that occur in northeast Colorado. Pétron correlated the hydrocarbon ratios in measured VOCs with the hydrocarbon ratios of natural gas extraction wells in the same region, to calculate CH4 leakage.
Measurements of methane emissions at natural gas production sites in the United States (Allen et al., 2013)
Allen et al. measured emissions from conventional and unconventional natural gas wells across the U.S. and concluded that the total CH4 emissions from natural gas extraction represent a 0.42 percent loss of CH4 at the extraction site (Allen, et al., 2013). Allen’s data were collected at the device level at hundreds of natural gas extraction sites, and thus are representative of natural gas extraction only.
Greater focus needed on methane leakage from natural gas infrastructure (Alvarez, Pacala, Winebrake, Chameides, & Hamburg, 2012)
Alvarez et al. used technology warming potential (TWP), a novel method that compares the cumulative radiative forcing of two or more systems at each year in a time period. TWP is different than GWP because it does not rely on choosing a particular time frame (i.e., 20 or 100 years) for comparing GHG emissions. Using TWP, Alvarez concluded that the leakage rate from upstream natural gas would need to be less than 3 percent for there to be an immediate climate benefit from deploying a natural gas power plant instead of a coal-fired power plant (Alvarez, et al., 2012)
Methane leaks from North American natural gas systems (Brandt et al., 2014)
Brandt et al. reviewed 20 years of technical literature on natural gas emissions in North America and demonstrated that the methane emission factors used by different authors are highly variable. One source of variability is the way in which methane emissions data are collected; some emissions are measured at a device level (e.g., the flowback stream from a hydraulic fracturing job), while other emissions are measured at regional boundaries (e.g., atmospheric sampling in a region that has natural gas production). Theoretically, if these two types of measurements are scaled correctly, they should result in similar methane emission factors; however, the two methods lead to GHG results that differ by a factor of ten. Brandt et al. (2014) conclude that improved science for determining methane leakage will lead to cost-effective policy decisions. (Brandt, et al., 2014)
72

Life Cycle Analysis of Natural Gas Extraction and Power Generation
6.2.2 Estimated Ultimate Recovery EUR is an important variable because it is used as the denominator for apportioning one-time or periodic emissions, such as well completion or workover emissions, per unit of natural gas produced. Improved EUR data will improve the accuracy apportioning these one-time or periodic emissions.
Life cycle greenhouse gas emissions and freshwater consumption of Marcellus shale gas (Laurenzi & Jersey, 2013)
Analysis by Exxon, which has natural gas wells in the Marcellus Shale through its XTO Energy subsidiary, calculated a Marcellus Shale EUR of 1.8 Bcf/well (Laurenzi & Jersey, 2013).
Review of emerging resources: U.S. Shale gas and shale oil plays (EIA, 2011c)
EIA performed a geographically broader assessment of EUR and calculated that the average shale gas EUR in the lower 48 states, not including the Marcellus Play, is 1 Bcf/well (EIA, 2011c).
Variability of Distributions of Well-Scale Estimated Ultimate Recovery for Continuous (Unconventional) Oil and Gas Resources in the United States (USGS, 2012)
The variability in EUR, not only its average values, is another aspect of EUR research. The U.S. Geological Survey (USGS) performed a resource assessment of 132 regions and found that the EURs for unconventional gas wells can vary by two orders of magnitude within a given region (USGS, 2012).
6.3 Data Limitations A key objective of an LCA is to normalize all data to a common basis (the functional unit). Like all LCAs, this analysis is limited by data uncertainty and data limitations. Key instances of data uncertainty and limitation are summarized in the following section.
6.3.1 Data Uncertainty Episodic emissions, natural gas production rates, flaring rates, and pipeline distance are four areas of data uncertainty in this analysis and represented within the study results.
Episodic emission factors include the non-routine release of natural gas during well completion, workovers, and liquid unloading. The results of this analysis are sensitive to these episodic emissions. The data for episodic emissions from natural gas wells is limited to a relatively small sample of wells and includes data going back as far as 1996 (EPA, 2011a). These emission factors are not necessarily applicable to all natural gas wells. For instance, it is likely that some unconventional wells have been completed using best practices and thus have low completion emissions, while some conventional wells have been completed with poor practices and thus have high completion emissions. However, there is no basis for claiming that a more recent, larger sampling of natural gas wells would increase or decrease these emission factors.
This analysis uses the production rate for each type of natural gas well for apportioning episodic emissions to a unit of natural gas production. The production rates of unconventional natural gas wells (Barnett and Marcellus shale, tight gas, and CBM wells) are based on EUR data that are specific to each formation and have specific geographical constraints (Lyle, 2011). Representativeness of unconventional production rate data provides a reasonable confidence range of +/-30 percent. Production data for conventional wells is more variable, exhibiting a 200 percent increase from the low to high production rates. This variability is due to the broad range in age,
73

Life Cycle Analysis of Natural Gas Extraction and Power Generation
reservoir, and technology characteristics for conventional wells, making it difficult to define a typical conventional natural gas well.
Flaring rate is the portion of vented natural gas that is combusted; the unflared portion is released directly to the atmosphere. Conventional wells flare 51 percent of vented gas, while unconventional wells flare 15 percent of vented natural gas (EPA, 2011a). The natural gas processing plant is modeled at a 100 percent flaring rate. While technology is available to capture and flare virtually all of the vented natural gas from extraction and processing, economics and other practical concerns often prevent the implementation of such technologies. To account for uncertainty, this analysis varied the default values for flaring rates by +/-20 percent. It is likely that there are natural gas wells that fall outside of this range; however, based on professional judgment, we expect this range to account for average natural gas production.
The transmission of natural gas by pipeline involves the combustion of a portion of the natural gas in compressors as well as fugitive losses of natural gas. The total natural gas combustion and fugitive emissions is a function of pipeline distance, which was estimated at an average distance of 971 km. This distance is based on the characteristics of the entire transmission network and delivery rate for natural gas in the U.S. It is possible that some natural gas sources are located significantly closer to their final markets than other sources of natural gas. To account for this uncertainty, this analysis varies the average pipeline distance by +/- 20 percent, which is an uncertainty range based on professional judgment.
6.3.2 Data Availability Most data required for this analysis were readily available. However, there are several instances for which more detailed data would enhance the functionality of the LCA model and allow further discernment among natural gas types.
• Formation-specific gas compositions (CH4, H2S, NMVOC, and water) for each natural gas type would allow the assignment of specific venting emissions for natural gas extraction and processing. It would also allow the calculation of the specific heat load required for natural gas processing equipment (acid gas removal and dehydration).
• The effectiveness of green completions and workovers would allow further scrutiny of the episodic emissions at wells and, possibly, further data granularity among the three unconventional well types (Barnett Shale, tight gas, and CBM wells).
• No data are available for the fugitive emissions from around wellheads (between the well casing and the ground). This is a possible emission source that could present a significant opportunity for reductions in natural gas losses at a specific wellhead or site, but is not expected to be a significant contribution from an average natural gas perspective.
• Data for the energy requirements of natural gas exploration would allow further comparisons between conventional and unconventional natural gas. Historically, conventional natural gas fields have been difficult to find, but relatively easy to develop once they are located (NGSA, 2010). In contrast, unconventional gas fields are easy to find, but require significant preparation before natural gas is recovered.
• The current EPA GHG inventory data for natural gas pipeline emissions includes methane emissions in one category. A split between venting and fugitive emissions from pipeline transport would facilitate recommendations for reducing pipeline losses. Vented emissions may present opportunities for recovery, while fugitive emissions may not represent feasible opportunities for recovery.
74

Life Cycle Analysis of Natural Gas Extraction and Power Generation
6.4 Recommendations for Improvement Creating a GHG inventory from a life cycle perspective gives not only a more complete picture of the impact of the process in question, but also allows for identification for the areas of largest impact, and those with the greatest opportunity for improvement. Since this inventory is presented on two different bases, opportunities were identified in the extraction and delivery of natural gas as well as the production of electricity from natural gas and coal.
6.4.1 Reducing the GHG Emissions of Natural Gas Extraction and Delivery Unconventional gas sources (shale, tight gas, coal bed methane, etc.) now make up the majority of natural gas extraction. As such, the emissions released during well completion and periodic well workovers are a major contributor to the overall GHG footprint, and a large opportunity for reduction. However, due to the relatively recent development of unconventional resources, better data is needed to characterize this opportunity based on basin type, drilling method, and production in order to better identify the potential for reductions.
Transportation of processed natural gas to the point at which it is consumed – in this inventory, large end users such as power plants – makes up a large portion of the overall upstream impact. There are two components to this impact: the first is the use of energy to compress the natural gas – the initial compression to put the natural gas on the pipeline, and then periodic compression as the motive force to push the natural gas along the transmission system. The second component is fugitive emissions from joints in the pipeline and other equipment. Improving compressor efficiency not only increases the amount of sellable product, but reduces the GHGs emitted delivering that product. Pipeline fugitive emissions could be reduced with both technology and best management practices.
6.4.2 Reducing the GHG Emissions of Natural Gas and Coal-fired Electricity Although efforts to reduce methane emissions from natural gas and coal extraction and transportation are important and should be continued, most GHG emissions from their extraction, transportation and use comes in the form of post-combustion carbon dioxide. Three high-level opportunities for reducing these emissions include:
• Capture the CO2 at the power plant and sequester it in a saline aquifer or oil bearing reservoir
• Improve existing power plant efficiency
• Invest in advanced power research, development, and demonstration
Further, all opportunities need to be evaluated on a sustainable energy basis, considering full environmental performance, as well as economic and social performance, such as the ability to maintain energy reliability and security.
7 Conclusions This analysis inventories seven different sources of domestic natural gas, including four types of unconventional gas, combines them into a domestic mix, and then compares the inventory on both a delivered feedstock and delivered electricity basis to a similar domestic mix of coal. The results show that average coal has lower GHG emissions than domestically produced natural gas when comparisons are made on an upstream basis. The upstream GHG profile of imported LNG is also included in this report.
However, the conclusion that coal has lower GHG emissions than natural gas flips once the fuels are converted to electricity in power plants with different efficiencies. Natural gas power plants have an
75

Life Cycle Analysis of Natural Gas Extraction and Power Generation
average efficiency of 46 percent and coal power plants have an average efficiency of 33 percent. Natural gas-fired electricity has a 44 percent to 66 percent lower climate impact than coal-fired electricity. Even when fired on 100 percent unconventional natural gas, from tight gas, shale and coal beds, and compared on a 20-year GWP, natural gas-fired electricity has 51 percent lower GHGs than coal. This shifting conclusion based on a change in the basis of comparison highlights the importance of specifying an end-use basis—not necessarily power production—when comparing different fuels.
Despite the conclusion that natural gas has lower GHG emissions than coal on a delivered power basis, the extraction and delivery of natural gas has a meaningful contribution to U.S. GHG emissions —25 percent of U.S. methane emissions and 2.2 percent of U.S. GHG emissions (EPA, 2013a). For large-scale consumers, such as power plants, ninety-two percent of natural gas that is extracted at the well is delivered to a power plant or other large-scale consumer. The 8 percent share that is not delivered is vented (either intentionally or unintentionally) as methane emissions, flared in environmental control equipment, or used as fuel in process heaters, compressors and other equipment. Methane emissions to air represent a 1.1 percent loss of natural gas extracted1, methane flaring represents a 2.8 percent loss of natural gas extracted, and methane combustion in equipment represents a 4.2 percent loss of natural gas extracted. All three of these natural gas loss categories present opportunities for GHG emission reduction.
This analysis also includes non-GHG emissions, water quality, and water use metrics, as well as an analysis of the GHG emissions from land use change. This broad scope of metrics demonstrates the importance of evaluating trade-offs between different environmental burdens.
The conclusions drawn from this analysis are robust to a wide array of assumptions. However, as with any inventory, they are dependent on the underlying data, and there are many opportunities to enhance the information currently being collected. This analysis shows that the results are both sensitive to and impacted by the uncertainty of a few parameters: use and emission of natural gas along the pipeline transmission network; the rate of natural gas emitted during unconventional gas extraction processes such as well completion and workovers; and the lifetime production of wells, which determine the denominator over which lifetime emissions are placed.
1 Converting to a denominator of delivered natural gas translates the methane leakage rate from 1.1 percent to 1.2 percent.
76

Life Cycle Analysis of Natural Gas Extraction and Power Generation
8 References Allen, D. T., Torres, V. M., Thomas, J., Sullivan, D. W., Harrison, M., Hendler, A., Herndon,
S.C., Kolb, C.E., Fraser, M.P., Hill, A.D., Lamb, B.K., Miskimins, J., Sawyer, R.F., Seinfeld, J. H. (2013). Measurements of methane emissions at natural gas production sites in the United States. Proceedings of the National Academy of Sciences.
Alvarez, R. A., Pacala, S. W., Winebrake, J. J., Chameides, W. L., & Hamburg, S. P. (2012). Greater focus needed on methane leakage from natural gas infrastructure. Proceedings of the National Academy of Sciences.
API. (2009). Compendium of Greenhouse Gas Emissions for the Oil and Natural Gas Industry. American Petroleum Institute. Retrieved May 18, 2010, from http://www.api.org/ehs/climate/new/upload/2009_GHG_COMPENDIUM.pdf
Arnold. (1999). Surface Production Operations: Design of gas-handling systems and facilities. Houston, Texas: Gulf Professional Publishing.
Arthur, D., & Cornum, D. (2010). Technologies Reduce Pad Size, Waste. The American Oil & Gas Reporter.
Bradbury, J., Obeiter, M., Draucker, L., Wang, W., & Stevens, A. (2013). Clearing the Air: Reducing Upstream Greenhouse Gas Emissions from U.S. Natural Gas Systems. Retrieved March 31, 2014, from http://www.wri.org/publication/clearing-air
Brandt, A. R., G. A. Heath, E. A. Kort, F. O’Sullivan, G. Pétron, S. M. Jordaan, P. Tans, J. Wilcox, A.M. Gopstein, D. Arent, S. Wofsy, N.J.Brown, R. Bradley, G.D. Stucky, D. Eardley, and R. Harriss. (2014) Methane Leaks from North American Natural Gas Systems. Science 343(6172), pp. 733-735.
Burklin, C. E., & Heaney, M. (2006). Natural Gas Compressor Engine Survey for Gas Production and Processing Facilities, H68 Final Report. Retrieved May 18, 2010, from http://www.utexas.edu/research/ceer/GHG/files/ConfCallSupp/H068FinalReport.pdf
Burnham, A., Han, J., Clark, C. E., Wang, M., Dunn, J. B., & Palou-Rivera, I. (2011). Life-cycle greenhouse gas emissions of shale gas, natural gas, coal, and petroleum. Environmental Science & Technology, 46(2), 619-627.
CBPG. (2005). PRB Coal Properties. Clyde Bergemann Power Group. Retrieved June 8, 2009, from http://www.cba-ssd.com/Applications/knowledgeBase/PRBcoal/PRBcoalProperty.htm
Dennis, S. M. (2005). Improved Estimates of Ton-Miles. Journal of Transportation and Statistics, 8(1).
DOE. (1996). Buying an Energy-Efficient Electric Motor. (DOE/GO-10096-314). U.S. Department of Energy. Retrieved May 18, 2010, from http://www1.eere.energy.gov/industry/bestpractices/pdfs/mc-0382.pdf
77

Life Cycle Analysis of Natural Gas Extraction and Power Generation
DOE. (2002). Mining Industry of the Future - Energy and Environmental Profile of the U.S. Mining Industry, Chapter 2: Coal. Washington, D.C.: U.S. Department of Energy. Retrieved June 4, 2009, from http://www.netl.doe.gov/KeyIssues/mining/coal.pdf
Ebel, R., Borchers, A., & Carriazo, F. (2011). Major uses of land in the United States. U.S. Department of Agriculture. Retrieved March 31, 2014, from http://www.ers.usda.gov/ersDownloadHandler.ashx?file=/media/188404/eib89_2_.pdf
EIA. (2007). Natural Gas Compressor Stations on the Interstate Pipeline Network: Developments Since 1996. Washington, DC: U.S. Department of Energy, Energy Information Administration. Retrieved May 18, 2010, from http://www.eia.gov/FTPROOT/features/ngcompressor.pdf
EIA. (2009a). Annual Coal Report, 2007. U.S. Department of Energy, Energy Information Administration. Retrieved June 8, 2009, from http://www.eia.doe.gov/cneaf/coal/page/acr/acr.pdf
EIA. (2009b). Historic Coal Production Data: 2009. Retrieved July 2013, from U.S. Department of Energy, Energy Information Administration http://www.eia.gov/coal/data.cfm#production
EIA. (2010). United States Total 2009: Distribution of Wells by Production Rate Bracket. Washington, DC: U.S. Department of Energy, Energy Information Administration. Retrieved April 5, 2011, from http://www.eia.doe.gov/pub/oil_gas/petrosystem/us_table.html
EIA. (2011a). Annual Energy Outlook 2011. (DOE/EIA-0383(2011)). Washington, DC: U.S. Department of Energy, Energy Information Administration. Retrieved March 31, 2014, from http://www.eia.gov/forecasts/aeo/
EIA. (2011b). Natural Gas Gross Withdrawals and Production. U.S. Department of Energy, Energy Information Administration. Retrieved March 31, 2014, from http://www.eia.doe.gov/dnav/ng/ng_prod_sum_a_EPG0_VRN_mmcf_a.htm
EIA. (2011c). Review of emerging resources: U.S. Shale gas and shale oil plays. U.S. Department of Energy, Energy Information Administration. Retrieved March 31, 2014, from http://www.eia.gov/analysis/studies/usshalegas/pdf/usshaleplays.pdf
EIA. (2013). AEO2014 Early Release Overview. (DOE/EIA-0383ER(2014)). U.S. Department of Energy, Energy Information Administration. Retrieved January 6, 2014, from http://www.eia.gov/forecasts/aeo/er/index.cfm
EIA. (2014). Annual Quantity and Value of Natural Gas Production Report: Number of Producing Gas Wells. Washington, D.C.: U.S. Department of Energy, Energy Information Administration. Retrieved February 3, 2014, from http://www.eia.gov/dnav/ng/ng_prod_wells_s1_a.htm.
78

Life Cycle Analysis of Natural Gas Extraction and Power Generation
EIA. (n.d.). About U.S. Natural Gas Pipelines - Transporting Natural Gas. U.S. Department of Energy, Energy Information Administration. Retrieved February 26, 2013, from http://www.aiche.org/sites/default/files/cep/20120853.pdf
EPA. (1995). Compilation of Air Pollutant Emission Factors, Volume I: Stationary Point and Area Sources. Research Triangle Park, North Carolina: U.S. Environmental Protection Agency. Retrieved March 31, 2014, from http://www.epa.gov/ttnchie1/ap42
EPA. (1998a). Emissions Factors & AP 42, Compilation of Air Pollutant Emission Factors. Washington, D.C.: U.S. Environmental Protection Agency. Retrieved May 5, 2011, from http://www.epa.gov/ttnchie1/ap42/
EPA. (1998b). Emissions Factors and AP 42, Compilation of Air Pollutant Emission Factors; Natural Gas Combustion. Research Triangle Park, North Carolina: U.S. Environmental Protection Agency. Retrieved March 31, 2014, from http://www.epa.gov/ttnchie1/ap42/ch01/final/c01s04.pdf
EPA. (2004a). Evaluation of Impacts to Underground Sources of Drinking Water by Hydraulic Fracturing of Coalbed Methane Reservoirs U.S. Environmental Protection Agency. Retrieved April 2, 2014, from http://www.epa.gov/ogwdw/uic/pdfs/cbmstudy_attach_uic_ch03_cbm_practices.pdf
EPA. (2004b). Final Regulatory Analysis: Control of Emissions from Nonroad Diesel Engines. (EPA 420-R-04-007). Washington, D.C.: U.S. Environmental Protection Agency. Retrieved March 31, 2014, from http://www.epa.gov/otaq/documents/nonroad-diesel/420r04007.pdf
EPA. (2006). Replacing Glycol Dehydrators with Desiccant Dehydrators. U.S. Environmental Protection Agency. Retrieved June 1, 2010, from http://www.epa.gov/gasstar/documents/ll_desde.pdf
EPA. (2009). Coal Mine Methane Recovery: A Primer. U.S. Environmental Protection Agency. Retrieved April 2, 2014, from http://www.epa.gov/cmop/docs/cmm_primer.pdf
EPA. (2010). EPA Lifecycle Analysis of Greenhouse Gas Emissions from Renewable Fuels Ann Arbor, MI: U.S. Environmental Protection Agency. Retrieved April 1, 2014, from http://www.epa.gov/otaq/renewablefuels/420f10006.pdf
EPA. (2011a). Background Technical Support Document - Petroleum and Natural Gas Industry. Washington, D.C.: U.S. Environmental Protection Agency, Climate Change Division Retrieved March 31, 2014, from http://www.epa.gov/ghgreporting/documents/pdf/2010/Subpart-W_TSD.pdf
EPA. (2011b). Greenhouse Gas Emissions Reporting from the Petroleum and Natural Gas Industry Background Technical Support Document. Washington, D.C.: U.S. Environmental Protection Agency. Retrieved August 23, 2011, from http://www.epa.gov/climatechange/emissions/downloads10/Subpart-W_TSD.pdf
79

Life Cycle Analysis of Natural Gas Extraction and Power Generation
EPA. (2011c). Greenhouse Gas Emissions Reporting from the Petroleum and Natural Gas Industry: Background Technical Support Document. Washington, D.C.: Retrieved March 31, 2014, from http://www.epa.gov/climatechange/emissions/subpart/w.html
EPA. (2011d). Inventory of U.S. Greenhouse Gas Emissions and Sinks: 1990-2009. (EPA 430-R-11-005). Washington, D.C.: U.S. Environmental Protection Agency. Retrieved August 23, 2011, from http://epa.gov/climatechange/emissions/usinventoryreport.html
EPA. (2011e). Natural Gas STAR Recommended Technologies and Practices - Gathering and Processing Sector. U.S. Environmental Protection Agency. Retrieved March 2, 2011, from http://www.epa.gov/gasstar/documents/gathering_and_processing_fs.pdf
EPA. (2012a). The Emissions and Generation Resource Integrated Database (eGRID). Washington, DC: U.S. Environmental Protection Agency Retrieved April 1, 2014, from http://www.epa.gov/cleanenergy/energy-resources/egrid/index.html
EPA. (2012b). Oil and Natural Gas Sector: New Source Performance Standards for Hazardous Air Pollutants Reviews. U.S. Environmental Protection Agency. Retrieved March 12, 2014, from http://www.epa.gov/airquality/oilandgas/pdfs/20120417finalrule.pdf
EPA. (2012c). Oil and Natural Gas Sector: Standards of Performance for Crude Oil and Natural Gas Production, Transmission, and Distribution: Background Supplemental Technical Support Document for the Final New Source Performance Standards. U.S. Environmental Protection Agency. Retrieved January 21, 2014, from http://www.epa.gov/airquality/oilandgas/pdfs/20120418tsd.pdf
EPA. (2013a). Inventory of U.S. Greenhouse Gas Emissions and Sinks: 1990-2011. (EPA 420-R-13-001). U.S. Environmental Protection Agency. Retrieved March 17, 2014, from http://www.epa.gov/climatechange/ghgemissions/usinventoryreport/archive.html
EPA. (2013b). Inventory of U.S. Greenhouse Gas Emissions and Sinks: Updating Emissions Estimate for Hydraulically Fractured Gas Well Completions and Workovers U.S. Environmental Protection Agency. Retrieved March 31, 2014, from http://www.epa.gov/climatechange/Downloads/ghgemissions/memo-update-emissions-for-hydraulically-workovers.pdf
EPA. (2014). Draft Inventory of U.S. Greenhouse Gas Emissions and Sinks: 1990-2012. Washington, D.C.: U.S. Environmental Protection Agency. Retrieved March 31, 2014, from http://www.epa.gov/climatechange/Downloads/ghgemissions/US-GHG-Inventory-2014-Chapter-Upfront.pdf
EPPG (2011). [Personal communication with El Paso Pipeline Group (EPPG)].
FERC. (2010). Federal Energy Regulatory Commission: Form 2/2A - Major and Non-major Natural Gas Pipeline Annual Report: Data (Current and Historical). Federal Energy Regulatory Commission. Retrieved August 23, 2011, from http://www.ferc.gov/docs-filing/forms/form-2/data.asp
80

Life Cycle Analysis of Natural Gas Extraction and Power Generation
Forster, P., Ramaswamy, V., Artaxo, P., Berntsen, T., Betts, R., Fahey, D. W., . . . Dorland, R. V. (2007). Changes in Atmospheric Constituents and in Radiative Forcing. Cambridge, United Kingdom and New York, NY, USA: Intergovernmental Panel on Climate Change Retrieved March 31, 2014, from http://www.ipcc.ch/pdf/assessment-report/ar4/wg1/ar4-wg1-chapter2.pdf
Foss, M. M. (2004). Interstate Natural Gas - Quality Specifications & Interchangeability. Sugar Land, TX: The University of Texas at Austin. Retrieved August 23, 2011, from http://www.beg.utexas.edu/energyecon/lng/documents/CEE_Interstate_Natural_Gas_Quality_Specifications_and_Interchangeability.pdf
GE. (2005). Reciprocating Compressors. Florence, Italy: General Electric Company. Retrieved August 23, 2011, from http://www.ge-energy.com/content/multimedia/_files/downloads/Reciprocating%20Compressors.pdf
GE. (2008). The Evolution Series Locomotives. Retrieved August 14, 2008, from http://www.getransportation.com/na/en/docs/806527_20020%20-%20B%20Evo[1][1].Series.lores.pdf
GWPC, & ALL. (2009). Modern Shale Gas Development in the United States: A Primer. National Energy Technology Laboratory. Retrieved February 1, 2012, from http://www.netl.doe.gov/technologies/oil-gas/publications/epreports/shale_gas_primer_2009.pdf
Hedman, B. (2008). Waste Energy Recovery Opportunities for Interstate Natural Gas Pipelines. Interstate Natural Gas Association of America. Retrieved July 25, 2011, from http://www.ingaa.org/File.aspx?id=6210
Jaramillo, P., Griffin, W. M., & Matthews, H. S. (2007). Comparative Life-Cycle Air Emissions of Coal, Domestic Natural Gas, LNG, and SNG for Electricity Generation. Environmental Science & Technology, 41(17), 6290-6296. doi: 10.1021/es063031o
Jiang, M., Griffin, W. M., Hendrickson, C., Jaramillo, P., VanBriesen, J., & Venkatesh, A. (2011). Life cycle greenhouse gas emissions of Marcellus shale gas. Environmental Research Letters, 6(3), 034014.
Kennedy, B. A. (1990). Surface Mining, Second Edition: Society for Mining, Metallurgy, and Exploration, Inc.
Laurenzi, I. J., & Jersey, G. R. (2013). Life cycle greenhouse gas emissions and freshwater consumption of Marcellus shale gas. Environmental Science & Technology, 47(9), 4896-4903.
Long, G. (2011). EIA Exploration and Production Team: Basic Economics. In BasicEconomics.xls (Ed.). Washington, DC: (Unpublished).
Lyle, D. (2011, November 10). Shales Revive Oilpatch, Gas Patch. 2011 North American Unconventional Yearbook, 2010.
81

Life Cycle Analysis of Natural Gas Extraction and Power Generation
mining-technology.com. (2007). Cordero Rojo Coal Mine, WY, USA.: SPG Media Limited Retrieved June 5, 2009, from http://www.mining-technology.com/projects/cordero/
NaturalGas.org. (2004). Well Completion Retrieved July 1, 2010, from http://naturalgas.org/naturalgas/well_completion.asp#liftingwell
NETL. (2007). Cost and Performance Baseline for Fossil Energy Plants: Volume 1. (DOE/NETL-2007/1281). Pittsburgh, PA: National Energy Technology Laboratory. Retrieved March 31, 2014, from http://www.netl.doe.gov/KMD/cds/Disk50/Bituminous%20Baseline_Post%20Final%20Report_Rev%205.pdf
NETL. (2010a). Cost and Performance Baseline for Fossil Energy Plants: Volume 1. Pittsburgh, PA: Retrieved March 31, 2014, from http://www.netl.doe.gov/File%20Library/Research/Energy%20Analysis/Life%20Cycle%20Analysis/EXPC-LCA-Final-Report---Report---9-30-10---Final---Rev-1.pdf
NETL. (2010b). Life Cycle Analysis: Existing Pulverized Coal (EXPC) Power Plant. (DOE/NETL-403-110809). Pittsburgh, PA: Retrieved March 31, 2014, from http://www.netl.doe.gov/File%20Library/Research/Energy%20Analysis/Life%20Cycle%20Analysis/EXPC-LCA-Final-Report---Report---9-30-10---Final---Rev-1.pdf
NETL. (2010c). Life Cycle Analysis: Supercritical Pulverized Coal (SCPC) Power Plant. (DOE/NETL-403/110609). Pittsburgh, PA: National Energy Technology Laboratory. Retrieved June 5, 2012, from http://www.netl.doe.gov/energy-analyses/refshelf/PubDetails.aspx?Action=View&PubId=354
NETL. (2010d). Methane Emissions from Mining Illinois Basin Coals. (DOE/NETL-2010/1445). Pittsburgh, PA: National Energy Technology Laboratory. Retrieved March 31, 2014, from http://www.netl.doe.gov/File%20Library/Research/Energy%20Analysis/Publications/DOE-NETL-2010-1445-QGESSMethaneEmissionsIllns.pdf
NETL. (2010e). Methane Emissions from Mining Powder River Basin Coals. (DOE/NETL-2010/1446). Pittsburgh, PA: National Energy Technology Laboratory. Retrieved March 31, 2014, from http://www.netl.doe.gov/File%20Library/Research/Energy%20Analysis/Publications/DOE-NETL-2010-1446-QGESSMethaneEmissionsPRB.pdf
NETL. (2012a). Life Cycle Analysis: Integrated Gasification Combined Cycle (IGCC) Power Plant. (DOE/NETL-2012-1551). Pittsburgh, PA: National Energy Technology Laboratory. Retrieved March 31, 2014, from http://www.netl.doe.gov/File%20Library/Research/Energy%20Analysis/Life%20Cycle%20Analysis/IGCC-LCA-Final-Report---9-30-10---Final---Rev-2-1.pdf
NETL. (2012b). Life Cycle Analysis: Natural Gas Combined Cycle (NGCC) Power Plant. (DOE/NETL-403-110509). Pittsburgh, PA: National Energy Technology Laboratory. Retrieved March 31, 2014, from
82

Life Cycle Analysis of Natural Gas Extraction and Power Generation
http://www.netl.doe.gov/File%20Library/Research/Energy%20Analysis/Life%20Cycle%20Analysis/NGCC-LCA---Final-Report---Report---9-10-12---Final---Version.pdf
NETL. (2012c). Role of Alternative Energy Source: Natural Gas Technology Assessment (NETL/DOE-2012/1539). Pittsburgh, PA: National Energy Technology Laboratory. Retrieved May 23, 2013, from http://www.netl.doe.gov/energy-analyses/refshelf/PubDetails.aspx?Action=View&PubId=435
NETL. (2013). Gate-to-Grave Life Cycle Analysis Model of Saline Aquifer Sequestration of Carbon Dioxide. (DOE/NETL-2013/1600). Pittsburgh, PA: National Energy Technology Laboratory. Retrieved September 26, 2013, from http://www.netl.doe.gov/energy-analyses/pubs/GtG%20LCA%20of%20Saline%20Aquifer%20Sequestration.pdf
NGSA. (2010). Unconventional Natural Gas Resources. Natural Gas Supply Association. Retrieved June 6, 2011, from http://www.naturalgas.org/overview/unconvent_ng_resource.asp
NYDEC. (2011). Annual Well Production Data. New York: New York State Department of Environmental Conservation. Retrieved April 1, 2014, from http://www.dec.ny.gov/cfmx/extapps/GasOil/search/production/index.cfm
PADEP. (2011). OGRE Reports. Pennsylvania: Pennsylvania Department of Environmental Protection. Retrieved April 1, 2014, from https://www.paoilandgasreporting.state.pa.us/publicreports/Modules/Welcome/Welcome.aspx
PEC. (2005). Mine Energy Assessment, Supplemental Report. Gillette, WY: Peabody Energy Company. Retrieved March 31, 2014, from http://www.osti.gov/scitech/servlets/purl/881764
Pétron, G., Frost, G., Miller, B. R., Hirsch, A. I., Montzka, S. A., Karion, A., Trainer, M., Sweeney, C., Andrews, A.E., Miller, L., Kofler, J., Bar-Ilan, A., Dlugokencky, E.J., Patrick, L., Moore, C.T., Ryerson, T.B., Siso, C., Kolodzey, W., Lang, P.M., Conway, T., Novelli, P., Masarie, K., Hall, B., Guenther, D., Kitzis, D., Miller, J., Welsh, D., Wolfe, D., Neff, W., Tans, P. (2012). Hydrocarbon emissions characterization in the Colorado Front Range: A pilot study. Journal of Geophysical Research: Atmospheres, 117(D4), D04304. doi: 10.1029/2011JD016360
Polasek, J., & Bullin, J. A. (2006). Selecting Amines for Sweetening Units. Bryan Research and Engineering. Retrieved August 23, 2011, from http://www.bre.com/portals/0/technicalarticles/Selecting%20Amines%20for%20Sweetening%20Units.pdf
Reddy, S., Johnson, D., & Gilmartin, J. (2008). Fluor's Econamine FG PlusSM Technology for CO2 Capture at Coal-fired Power Plants.
Shires, T., & Lev-On, M. (2012). Characterizing Pivotal Sources of Methane Emissions from Unconventional Natural Gas Production: Summary and Analysis of API and ANGA
83

Life Cycle Analysis of Natural Gas Extraction and Power Generation
Survey Responses. Retrieved January 17, 2014, from http://www.api.org/~/media/Files/News/2012/12-October/API-ANGA-Survey-Report.pdf
Smith, T. (2012). Environmental Considerations of Shale Gas Development. Chemical Engineering Progress, 108(8), 53-59.
Spath, P. L., & Mann, M. K. (2000). Life Cycle Assessment of a Natural Gas Combined Cycle Power Generation System. (NREL/TP-570-27715). Golden, CO: National Renewable Energy Laboratory. Retrieved March 31, 2014, from http://www.nrel.gov/docs/fy00osti/27715.pdf
Stocker, T. F., Qin, D., & Platner, G. K. (2013). Climate Change 2013: The Physical Science Basis: Working Group I Contribution to the Fifth Assessment Report of the Intergovernmental Panel on Climate Change. Intergovernmental Panel on Climate Change. Retrieved December 10, 2013, from http://www.climatechange2013.org/images/uploads/WGIAR5_WGI-12Doc2b_FinalDraft_All.pdf
Tubes, S. P. (2009). Steel Pipe Weight Calculator. Retrieved May 1, 2009, from http://www.steel-pipes-tubes.com/steel-pipe-weight-calculator.html
USCB. (2004). Bituminous Coal Underground Mining: 2002. U.S. Census Bureau, Economics and Statistics Administration. Retrieved March 31, 2014, from http://www.census.gov/prod/ec02/ec0221i212112.pdf
USGS. (2012). Variability of Distributions of Well-Scale Estimated Ultimate Recovery for Continuous (Unconventional) Oil and Gas Resources in the United States. U.S. Geological Survey. Retrieved February 26, 2014, from http://pubs.usgs.gov/of/2012/1118/OF12-1118.pdf
WVGES. (2011). Oil & Gas Well Header Data. West Virginia: West Virginia Geological & Economic Survey. Retrieved April 1, 2014, from http://www.wvgs.wvnet.edu/pipe2/OGDataSearch.aspx
84

Life Cycle Analysis of Natural Gas Extraction and Power Generation
Appendix A: Unit Process Maps for Upstream Natural Gas
Table of Contents A.1 Model Overview ................................................................................................................... A-3 A.2 Model Connectivity and Unit Process Links ..................................................................... A-3
Tables Table A-1: Parent/Child Plan Connections for Natural Gas Extraction, Delivery and Electricity
Production .................................................................................................................................... A-4 Table A-2: Natural Gas with Destination Options ............................................................................. A-7 Table A-3: Unit Processes in LC1 CBM Extraction .......................................................................... A-7 Table A-4: Associated Gas Extraction ............................................................................................... A-8 Table A-5: Barnett Shale Extraction .................................................................................................. A-9 Table A-6: Conventional Onshore Extraction ................................................................................... A-9 Table A-7: Conventional Offshore Extraction ................................................................................. A-10 Table A-8: Marcellus Shale Extraction ............................................................................................ A-11 Table A-9: Tight Sands Extraction .................................................................................................. A-12 Table A-10: Natural Gas Extraction Processes ................................................................................ A-14 Table A-11: Natural Gas Processing ................................................................................................ A-18 Table A-12: Onshore Pipeline Deinstallation .................................................................................. A-21 Table A-13: Gas Pipeline Operation ................................................................................................ A-22 Table A-14: Onshore Pipeline Construction and Installation .......................................................... A-23 Table A-15: Liquefaction, Storage and Unloading .......................................................................... A-25 Table A-16: LNG Tanker Transport ................................................................................................ A-26 Table A-17: LNG Regasification ..................................................................................................... A-27 Table A-18: Tanker Berthing/Deberthing ........................................................................................ A-28 Table A-19: Liquefaction Construction ........................................................................................... A-29 Table A-20: Liquefaction Installation .............................................................................................. A-30 Table A-21: LNG Tanker Operation ................................................................................................ A-31 Table A-22: LNG Tanker Construction ........................................................................................... A-32 Table A-23: Regasification Construction ........................................................................................ A-33 Table A-24: Regasification Installation ........................................................................................... A-34 Table A-25: Regasification Operation ............................................................................................. A-35 Table A-26: Generic U.S. and N.A. Power Grid Mix for 2007 and 2010 ....................................... A-35
Preliminary – Pre-decisional Deliberative Draft A-1

Life Cycle Analysis of Natural Gas Extraction and Power Generation
Figures Figure A-1: Tiered Modeling Approach ............................................................................................ A-3 Figure A-2: Natural Gas with Destination Options – Top-Level Plan .............................................. A-6 Figure A-3: CBM Extraction – Second-Level Plan ........................................................................... A-7 Figure A-4: Associated Gas Extraction – Second-Level Plan ........................................................... A-8 Figure A-5: Barnett Shale Extraction – Second-Level Plan .............................................................. A-8 Figure A-6: Conventional Onshore Extraction – Second-Level Plan ................................................ A-9 Figure A-7: Conventional Offshore Extraction – Second-Level Plan ............................................... A-9 Figure A-8: Marcellus Shale Extraction – Second-Level Plan ........................................................ A-10 Figure A-9: Tight Sands Extraction – Second-Level Plan ............................................................... A-12 Figure A-10: Natural Gas Extraction Processes – Third-level Plan ................................................ A-13 Figure A-11: Natural Gas Processing – Third-level Plan ................................................................ A-17 Figure A-12: Domestic Pipeline Transport – Second-Level Plan .................................................... A-20 Figure A-13: Onshore Pipeline Deinstallation – Third-Level Plan ................................................. A-21 Figure A-14: Gas Pipeline Operation – Third-Level Plan ............................................................... A-22 Figure A-15: Onshore Pipeline Construction and Installation – Third-Level Plan ......................... A-22 Figure A-16: LNG Extraction and Processing – Second-Level Plan ............................................... A-24 Figure A-17: Liquefaction, Storage and Unloading – Third-Level Plan ......................................... A-25 Figure A-18: LNG Tanker Transport – Third-Level Plan ............................................................... A-26 Figure A-19: LNG Regasification – Third-Level Plan .................................................................... A-26 Figure A-20: Tanker Berthing/Deberthing – Third-Level Plan ....................................................... A-27 Figure A-21: Liquefaction Construction – Fourth-Level Plan ......................................................... A-28 Figure A-22: Liquefaction Installation – Fourth-Level Plan ........................................................... A-30 Figure A-23: LNG Tanker Operation – Fourth-Level Plan ............................................................. A-31 Figure A-24: LNG Tanker Construction – Fourth-Level Plan ........................................................ A-32 Figure A-25: Regasification Construction – Fourth-Level Plan ...................................................... A-33 Figure A-26: Regasification Installation – Fourth-Level Plan ......................................................... A-34 Figure A-27: Regasification Operation – Fourth-Level Plan ........................................................... A-35
Preliminary – Pre-decisional Deliberative Draft A-2

Life Cycle Analysis of Natural Gas Extraction and Power Generation
A.1 Model Overview This model was created using unit processes developed by NETL and modeled in the GaBi 6.0 LCA modeling software package. All of the unit processes utilized to create this model are publicly available on the NETL website, with the exception of those noted explicitly below, which are available from PE International. The model can be re-created utilizing the GaBi 6.0 software or by utilizing a spreadsheet to perform the scaling calculations between the individual unit processes.
A.2 Model Connectivity and Unit Process Links The structure of LCA models in GaBi uses a tiered approach, which means that there are different groups of processes, known as plans, which are combined to create the model. To aid in the connectivity of various plans used in this model, the following naming convention will be utilized in the figure headings throughout the remainder of this section. The main plan will be referred to as the top-level plan, and all subsequent plans will be referred to as second-, third-, etc. level plans. An example of this tiered-nature of the model structure is shown in Figure A-1.
Figure A-1: Tiered Modeling Approach
Table A-1 demonstrates the relationships between the tiers of plans used in the construction of the model. The figures in this section illustrate the connectivity of the various processes and plans.
Plan 1
Plan 2a
Process 3a Process 3b Plan 3a
Process 4a Process 4b
Plan 2b
Process 3c Process 3d
Process 2a
Preliminary – Pre-decisional Deliberative Draft A-3

Life Cycle Analysis of Natural Gas Extraction and Power Generation
Table A-1: Parent/Child Plan Connections for Natural Gas Extraction, Delivery and Electricity Production
Figure Plan Name Parent Plans Child Plans
A-2 Natural Gas with Destination Options None
1 – CBM Extraction 2 – Associated Gas Extraction 3 – Barnett Shale Extraction 4 – Conventional Onshore Extraction 5 – Conventional Offshore Extraction 6 – LNG Extraction and Processing 7 – Marcellus Shale Extraction 8 – Tight Sands Extraction 9 –Domestic Pipeline Transport 10 – US: NG Mixture NETL
A-3 CBM Extraction Natural Gas with Destination Options
1 – Natural Gas Extraction Processes 2 – Natural Gas Processing
A-4 Associated Gas Extraction Natural Gas with Destination Options
1 – Natural Gas Extraction Processes 2 – Natural Gas Processing
A-5 Barnett Shale Extraction Natural Gas with Destination Options
1 – Natural Gas Extraction Processes 2 – Natural Gas Processing
A-6 Conventional Onshore Extraction Natural Gas with Destination Options
1 – Natural Gas Extraction Processes 2 – Natural Gas Processing
A-7 Conventional Offshore Extraction
1 – LNG Extraction and Processing
2 – Natural Gas with Destination Options
1 – Natural Gas Extraction Processes 2 – Natural Gas Processing
A-8 Marcellus Shale Extraction Natural Gas with Destination Options
1 – Natural Gas Extraction Processes 2 – Natural Gas Processing
A-9 Tight Sands Extraction Natural Gas with Destination Options
1 – Natural Gas Extraction Processes 2 – Natural Gas Processing
A-10 Natural Gas Extraction Processes
1 – CBM Extraction 2 – Associated Gas Extraction 3 – Barnett Shale Extraction 4 – Conventional Onshore
Extraction 5 – Conventional Offshore
Extraction 6 – Marcellus Shale Extraction
7 – Tight Sands Extraction
None
Preliminary – Pre-decisional Deliberative Draft A-4

Life Cycle Analysis of Natural Gas Extraction and Power Generation
Figure Plan Name Parent Plans Child Plans
A-11 Natural Gas Processing
1 – CBM Extraction 2 – Associated Gas Extraction 3 – Barnett Shale Extraction 4 – Conventional Onshore
Extraction 5 – Conventional Offshore
Extraction 6 – Marcellus Shale
7 – Tight Sands Extraction
None
A-12 Domestic Pipeline Transport
1 – Natural Gas with Destination Options
2 – LNG Extraction and Processing
1 – Onshore Pipeline Deinstallation 2 – Gas Pipeline Operation 3 – Onshore Pipeline Construction and Installation
A-13 Onshore Pipeline Deinstallation Domestic Pipeline Transport None A-14 Gas Pipeline Operation Domestic Pipeline Transport None
A-15 Onshore Pipeline Construction and Installation Domestic Pipeline Transport None
A-16 LNG Extraction and Processing Natural Gas With Destination Options
1 – Conventional Offshore Extraction 2 – Domestic Pipeline Transport, Liquefaction 3 – Storage and Unloading 4 – LNG Tanker Transport 5 – LNG Regasification, Tanker Berthing/Deberthing
A-17 Liquefaction, Storage and Unloading LNG Extraction and Processing 1 – Liquefaction Construction
2 – Liquefaction Installation A-18 LNG Tanker Transport LNG Extraction and Processing None A-19 LNG Regasification LNG Extraction and Processing None A-20 Tanker Berthing/Deberthing LNG Extraction and Processing None
A-21 Liquefaction Construction Liquefaction, Storage and Unloading None
A-22 Liquefaction Installation Liquefaction, Storage and Unloading None
A-23 LNG Tanker Operation LNG Tanker Transport None A-24 LNG Tanker Construction LNG Tanker Transport None A-25 Regasification Construction LNG Regasification None A-26 Regasification Installation LNG Regasification None A-27 Regasification Operation LNG Regasification None
Preliminary – Pre-decisional Deliberative Draft A-5

Life Cycle Analysis of Natural Gas Extraction and Power Generation
Figure A-2: Natural Gas with Destination Options – Top-Level Plan
Preliminary – Pre-decisional Deliberative Draft A-6

Life Cycle Analysis of Natural Gas Extraction and Power Generation
Table A-2: Natural Gas with Destination Options
Unit Process Notes Version Creation Date
U.S. Natural Gas Mixture
This process includes all inputs for the raw material acquisition and raw material transportation for 1 kg of delivered natural gas proportionally from all extraction methods.
1 9/2011
Figure A-3: CBM Extraction – Second-Level Plan
Table A-3: Unit Processes in LC1 CBM Extraction
Unit Process Notes Version Creation Date
Water Use and Quality for CBM NG
This unit process covers produced water and water quality emissions associated with produced water in support of natural gas produced from coal bed methane (CBM) extraction. It considers only water and water quality related flows.
2 4/2013
Preliminary – Pre-decisional Deliberative Draft A-7

Life Cycle Analysis of Natural Gas Extraction and Power Generation
Figure A-4: Associated Gas Extraction – Second-Level Plan
Table A-4: Associated Gas Extraction
Unit Process Notes Version Creation Date
Water Use and Quality for Onshore Associated NG
This unit process covers water use, produced water, and water quality emissions associated with produced water in support of onshore associated extraction activities. This unit process considers only water and water quality related flows.
1 4/2011
Figure A-5: Barnett Shale Extraction – Second-Level Plan
Preliminary – Pre-decisional Deliberative Draft A-8

Life Cycle Analysis of Natural Gas Extraction and Power Generation
Table A-5: Barnett Shale Extraction
Unit Process Notes Version Creation Date
Water Use and Quality for Barnett Shale NG
This unit process covers water use, produced water, and water quality emissions associated with produced water in support of Barnett Shale extraction activities. This unit process considers only water and water quality related flows.
1 4/2011
Figure A-6: Conventional Onshore Extraction – Second-Level Plan
Table A-6: Conventional Onshore Extraction
Unit Process Notes Version Creation Date
Water Use and Quality for Conventional Onshore NG
This unit process covers water use, produced water, and water quality emissions associated with produced water in support of conventional onshore natural gas extraction activities. It considers only water and water quality related flows.
1 4/2011
Figure A-7: Conventional Offshore Extraction – Second-Level Plan
Preliminary – Pre-decisional Deliberative Draft A-9

Life Cycle Analysis of Natural Gas Extraction and Power Generation
Table A-7: Conventional Offshore Extraction
Unit Process Notes Version Creation Date
Gasoline, National Average (2005)
This unit process provides a summary of relevant input and output flows associated with production of gasoline including the production of crude oil, crude oil transportation, and gasoline fuel refining/energy conversion. Available adjustable parameters and their default values are provided in Section II. For additional information on the inputs, please refer to the associated documentation for the parameter or input flow in question.
1 5/2012
Offshore Crew Transport
This unit process accounts for the mass of aviation gas fuel and associated greenhouse gas emissions, including carbon dioxide, methane, and nitrous oxide, that result from the transport of employees and crew members to and from an offshore natural gas platform.
1 3/2011
Water Use and Quality for Conventional Offshore NG
This unit process covers produced water and water quality emissions associated with produced water in support of conventional offshore natural gas extraction activities. It considers only water and water quality related fields.
1 4/2011
Figure A-8: Marcellus Shale Extraction – Second-Level Plan
Preliminary – Pre-decisional Deliberative Draft A-10

Life Cycle Analysis of Natural Gas Extraction and Power Generation
Table A-8: Marcellus Shale Extraction
Unit Process Notes Version Creation Date
Hydraulic Fracturing Water Delivery
This unit process accounts for the transport of water from a surface or ground source to a Marcellus Shale gas well to be used for hydraulic fracturing (hydrofracking). The only tracked input is diesel fuel, and the key outputs are diesel combustion emissions.
1 10/2011
U.S. Diesel, National Average (2005)
This unit process provides a summary of relevant input and output flows associated with production of diesel including the production of crude oil, crude oil transportation, and diesel fuel refining/energy conversion. Available adjustable parameters and their default values are provided in Section II. For additional information on the inputs, please refer to the associated documentation for the parameter or input flow in question.
2 5/2012
Generic Power Grid Mixer U.S. and N.A.
This unit process provides a summary of relevant input and output flows associated with the average U.S. electricity grid in 2010 accounting for imports from Canada. The inputs include the various generation types in the U.S. A summary of the change in the grid mix for 2010 from 2007 is provided in Table A-26.
1 6/2012
Water Use for Marcellus Shale Gas
This unit process provides a summary of relevant inputs and outputs associated with the water withdrawal and discharge for the extraction of natural gas from a Marcellus Shale formation. It accounts for the amount of water from ground, surface, and recycled sources and the amount of water discharged to a water treatment plant.
1 10/2011
Marcellus Shale Water Treatment (WWTP)
This unit process provides a summary of relevant input and output flows associated with transport and treatment of flowback water from a natural gas well in the Marcellus Shale. It includes flowback water, electricity, and diesel.
1 10/2011
Marcellus Shale Water Treatment, Crystallization
This unit process provides a summary of relevant input and output flows associated with transport and treatment of flowback water from a natural gas well in the Marcellus Shale. It includes flowback water, electricity, and diesel. In this case, the wastewater treatment process uses crystallization.
1 10/2011
Preliminary – Pre-decisional Deliberative Draft A-11

Life Cycle Analysis of Natural Gas Extraction and Power Generation
Figure A-9: Tight Sands Extraction – Second-Level Plan
Table A-9: Tight Sands Extraction
Unit Process Notes Version Creation Date
Water Use and Quality for Barnett Shale NG
This unit process covers produced water and water quality emissions associated with produced water in support of antural gas produced from Barnett Shale extraction activities. It considers only water and water quality related flows.
1 4/2011
Preliminary – Pre-decisional Deliberative Draft A-12

Life Cycle Analysis of Natural Gas Extraction and Power Generation
Figure A-10: Natural Gas Extraction Processes – Third-level Plan
Preliminary – Pre-decisional Deliberative Draft A-13

Life Cycle Analysis of Natural Gas Extraction and Power Generation
Table A-10: Natural Gas Extraction Processes
Unit Process Notes Version Creation Date
U.S. Diesel, National Average (2005)
This unit process provides a summary of relevant input and output flows associated with
production of diesel including the production of crude oil, crude oil transportation, and diesel fuel refining/energy conversion. Available adjustable parameters and their default values are provided
in Section II. For additional information on the inputs, please refer to the associated
documentation for the parameter or input flow in question.
2 5/2012
Steel Pipe, Welded
This unit process provides a summary of relevant input and output flows associated with the
manufacturing of steel BF welded pipe. The data represents a world-wide, cradle-to-gate average of type BF steel welded pipe production with an
85 percent recovery rate. The key inputs are raw materials and water. Key outputs are air and
water emissions from the manufacturing of steel BF welded pipe such as carbon dioxide, nickel, and
ammonia.
1 6/2013
Generic Power Grid Mixer U.S. and N.A.
This unit process provides a summary of relevant input and output flows associated with the
average U.S. electricity grid in 2010 accounting for imports from Canada. The inputs include the
various generation types in the U.S. A summary of the change in the grid mix for 2010 from 2007 is
provided in Table A-26.
1 6/2012
U.S. Concrete, ready mixed, R-5-0 (100% Portland Cement)
This unit process provides a summary of relevant input and output flows associated with the
production of ready-mix concrete. 1 6/2013
Preliminary – Pre-decisional Deliberative Draft A-14

Life Cycle Analysis of Natural Gas Extraction and Power Generation
Unit Process Notes Version Creation Date
Natural Gas Well Construction and
Installation
This unit process provides a summary of relevant input and output flows associated with the
construction and installation of a generic natural gas well, applicable to all natural gas well types. Steel and concrete are used for the construction
of the well casing; these materials enter the boundaries of this unit process in the form of
prefabricated steel pipe and ready-mix concrete. Diesel is used for firing of internal combustion engines used for powering the rotary drilling
equipment. Air emissions from diesel combustion include greenhouse gases and criteria air
pollutants. The energy and material flows of well construction and installation are apportioned per
kg of natural gas production, based on the well production rate and life of the well, as relevant to the type of well in use. Venting of NG during well
completion is included. Water use and water quality associated with well construction are
included in a separate unit process, as relevant
1 2/2013
Natural Gas Well Completion
This unit process accounts for natural gas venting during well completion. 1 4/2011
Natural Gas Liquid Unloading
This unit process accounts for natural gas that is vented during liquid unloading at a natural gas
extraction site. This unit process is considered to be applicable to all natural gas well installations,
onshore and offshore, as relevant.
1 4/2011
Unconventional Natural Gas Well Workovers
This unit process accounts for the fraction of gas that is vented during the workover of a natural gas well. This unit process is considered to be
applicable to workovers for all completed natural gas wells, both conventional and unconventional.
1 4/2011
Natural Gas Extraction, Other Venting Point
Sources
This unit process accounts for natural gas that is vented by unidentified processes at a natural gas well. Unidentified processes include those that
are not modeled in other unit processes. This unit process is applicable to all natural gas well
installation as relevant.
1 5/2011
Natural Gas Extraction, Pneumatic Venting
This unit process accounts for the gas that is vented by pneumatic devices and valves at a
natural gas extraction site. This unit process is applicable to all natural gas types.
1 3/2011
Preliminary – Pre-decisional Deliberative Draft A-15

Life Cycle Analysis of Natural Gas Extraction and Power Generation
Unit Process Notes Version Creation Date
Natural Gas Well Flaring and Venting
This unit process provides a summary of relevant input and output flows associated with the flaring and venting of natural gas at a generic natural gas well. This unit process is considered applicable to all natural gas well types, as relevant. The mass of vented gas, in comparison to total natural gas, is
quantified in a separate unit process.
1 4/2011
Natural Gas Extraction Assembly
This process includes all inputs for the raw material acquisition for 1 kg of natural gas
proportionally from all extraction methods. No calculations were made in this process.
N/A N/A
Preliminary – Pre-decisional Deliberative Draft A-16

Life Cycle Analysis of Natural Gas Extraction and Power Generation
Figure A-11: Natural Gas Processing – Third-level Plan
Preliminary – Pre-decisional Deliberative Draft A-17

Life Cycle Analysis of Natural Gas Extraction and Power Generation
Table A-11: Natural Gas Processing
Unit Process Notes Version Creation Date
Diethanolamine Third-party data available from PE International. N/A N/A
Natural Gas Sweetening
This unit process provides a summary of relevant input and output flows associated with the acid gas removal (AGR) of natural gas, specifically the
removal of H2S. The scope of the unit process accounts for energy consumption, solvent use,
greenhouse gas emissions, criteria air pollutants and other air emissions of concern. Water use is
also quantified, however, water quality emissions are assumed to be insignificant for this unit
process. The boundaries begin with the receipt of "sour" natural gas and end with "sweetened" natural gas ready for pipeline transmission.
1 4/2011
Natural Gas Well Flaring and Venting
This unit process provides a summary of relevant input and output flows associated with the flaring and venting of natural gas at a generic natural gas well. This unit process is considered applicable to all natural gas well types, as relevant. The mass of vented gas, in comparison to total natural gas, is
quantified in a separate unit process.
1 4/2011
Natural Gas Dehydration
This unit process provides a summary of relevant input and output flows associated with the
dehydration of natural gas (NG) from a generic formation. The scope of the unit process accounts
for energy consumption and greenhouse gas emissions, as well as vented methane gas.
1 4/2011
Natural Gas Processing, Pneumatic Venting
This unit process accounts for the gas that is vented by pneumatic devices and valves at a
natural gas extraction site. This unit process is applicable to all natural gas types.
1 4/2011
Natural Gas Processing, Other Venting Point
Sources
This unit process accounts for natural gas that is vented by unidentified activities at a natural gas
processing plan. Unidentified activities are processes that are not identified elsewhere in
NETL's natural gas model.
1 5/2011
Natural Gas Processing, Other Venting Fugitives
This unit process accounts for natural gas that is vented as fugitive emissions by unidentified
processes at a natural gas extraction site. Unidentified processes include those that are not
modeled explicitly in other unit processes in NETL’s LCA model of natural gas.
1 1/2013
Preliminary – Pre-decisional Deliberative Draft A-18

Life Cycle Analysis of Natural Gas Extraction and Power Generation
Unit Process Notes Version Creation Date
Generic Power Grid Mixer U.S. and N.A.
This unit process provides a summary of relevant input and output flows associated with the
average U.S. electricity grid in 2010 accounting for imports from Canada. The inputs include the
various generation types in the U.S. A summary of the change in the grid mix for 2010 from 2007 is
provided in Table A-26.
1 6/2012
Wellhead Electricity-Powered Centrifugal
Compressor
This unit process provides a summary of relevant input and output flows associated with the
operation of 500 horsepower (HP), electrically-powered centrifugal compressors at a natural gas
wellhead. This unit process is applicable to all natural gas well types considered, and the
proportion of this versus other compressor types are identified in a separate assembly unit process.
1 4/2011
Wellhead Reciprocating Compressor
This unit process provides a summary of relevant input and output flows associated with the
operation of 200 horsepower (HP), gas-powered reciprocating compressors at a natural gas
wellhead. This unit process is applicable to all natural gas well types considered, and the
proportion of this versus other compressor types are identified in a separate assembly unit process.
1 4/2011
Wellhead Gas-Powered Centrifugal Compressor
This unit process provides a summary of relevant input and output flows associated with the
operation of 187 horsepower (HP), gas-powered centrifugal compressors at a natural gas wellhead.
This unit process is applicable to all natural gas well types considered, and the proportion of this versus other compressor types are identified in a
separate assembly unit process.
1 4/2011
Assembly of Natural Gas Compression
This unit process assembles the 3 wellhead natural gas compressor types, including
reciprocating, gas-powered centrifugal, and electrically-powered centrifugal. The proportions
for each compressor type vary based on the natural gas extraction source. Additional data for
each of the compressor/compression types is modeled in separate unit processes.
1 4/2011
Preliminary – Pre-decisional Deliberative Draft A-19

Life Cycle Analysis of Natural Gas Extraction and Power Generation
Figure A-12: Domestic Pipeline Transport – Second-Level Plan
Figure A-13: Onshore Pipeline Deinstallation – Third-Level Plan
Preliminary – Pre-decisional Deliberative Draft A-20

Life Cycle Analysis of Natural Gas Extraction and Power Generation
Table A-12: Onshore Pipeline Deinstallation
Unit Process Notes Version Creation Date
U.S. Diesel, National Average (2005)
This unit process provides a summary of relevant input and output flows associated with production of diesel including the production of crude oil, crude oil transportation, and diesel fuel refining/energy conversion. Available adjustable parameters and their default values are provided in Section II. For additional information on the inputs, please refer to the associated documentation for the parameter or input flow in question.
2 5/2012
Onshore Pipeliness Deinstallation
Underground onshore pipeline deinstallation is covered in this unit process. Deinstallation includes heavy construction equipment exhaust emissions, emissions from transport of pipes and associated materials (200 miles round-trip), and fugitive dust from deinstallation activities.
1 2/2010
Figure A-14: Gas Pipeline Operation – Third-Level Plan
Preliminary – Pre-decisional Deliberative Draft A-21

Life Cycle Analysis of Natural Gas Extraction and Power Generation
Table A-13: Gas Pipeline Operation
Unit Process Notes Version Creation Date
Generic Power Grid Mixer U.S. and N.A.
This unit process provides a summary of relevant input and output flows associated with the
average U.S. electricity grid in 2010 accounting for imports from Canada. The inputs include the
various generation types in the U.S. A summary of the change in the grid mix for 2010 from 2007 is
provided in Table A-26.
1 6/2012
Pipeline Natural Gas Operation
This unit process provides a summary of relevant input and output flows associated with the operation of a natural gas pipeline, including the use of electricity and combustion of natural gas used for powering compressor stations. The generation of electricity used by this unit process occurs upstream, and thus the emissions from electricity generation are not included in the boundaries of this unit process. Fugitive emissions of methane are also included.
2 7/2011
Figure A-15: Onshore Pipeline Construction and Installation – Third-Level Plan
Preliminary – Pre-decisional Deliberative Draft A-22

Life Cycle Analysis of Natural Gas Extraction and Power Generation
Table A-14: Onshore Pipeline Construction and Installation
Unit Process Notes Version Creation Date
U.S. Diesel, National Average (2005)
This unit process provides a summary of relevant input and output flows associated with production of diesel including the production of crude oil, crude oil transportation, and diesel fuel refining/energy conversion. Available adjustable parameters and their default values are provided in Section II. For additional information on the inputs, please refer to the associated documentation for the parameter or input flow in question.
2 5/2012
Onshore Pipeline, Construction and
Installation
Underground onshore (rather than offshore) pipeline installation and deinstallation are covered in this unit process. Installation and deinstallation includes heavy construction equipment exhaust emissions, emissions from transport of pipes and associated materials (200 miles round-trip), and fugitive dust from installation and deinstallation activities.
1 2/2010
Steel Pipe, Welded
This unit process provides a summary of relevant input and output flows associated with the manufacturing of steel BF welded pipe. The data represents a world-wide, cradle-to-gate average of type BF steel welded pipe production with an 85 percent recovery rate. The key inputs are raw materials and water. Key outputs are air and water emissions from the manufacturing of steel BF welded pipe such as carbon dioxide, nickel, and ammonia.
1 6/2013
Preliminary – Pre-decisional Deliberative Draft A-23

Life Cycle Analysis of Natural Gas Extraction and Power Generation
Figure A-16: LNG Extraction and Processing – Second-Level Plan
Preliminary – Pre-decisional Deliberative Draft A-24

Life Cycle Analysis of Natural Gas Extraction and Power Generation
Figure A-17: Liquefaction, Storage and Unloading – Third-Level Plan
Table A-15: Liquefaction, Storage and Unloading
Unit Process Notes Version Creation Date
Natural Gas Liquefaction, Storage, and Ship Loading
This process includes all inputs for the liquefaction, storage, ship loading, construction, and installation for 1 kg of liquefied natural gas (LNG). No calculations were made in this process.
1 N/A
U.S. NG Liquefaction, Storage, & Loading
This unit process encompasses the energy inputs and material outputs for the liquefaction of natural gas. The unit process is based on the reference flow of 1 kg of liquefied natural gas (LNG). The inputs to this unit process are natural gas (received from an offshore well) and municipal water; the energy and material flows of these two inputs are not included in this unit process but are accounted for by other unit process. The output of this unit process is liquefied natural gas that is suitable for cross-ocean transport in a tanker. This unit process also accounts for environmental emissions that are directly released by the liquefaction operations.
1 10/2010
Preliminary – Pre-decisional Deliberative Draft A-25

Life Cycle Analysis of Natural Gas Extraction and Power Generation
Figure A-13: LNG Tanker Transport – Third-Level Plan
Table A-16: LNG Tanker Transport
Unit Process Notes Version Creation Date
Assembly of NG – LNG Tanker
This process includes all inputs for the operation and construction of the transport of 1 kg of liquefied natural gas (LNG). No calculations were made in this process.
N/A N/A
Figure A-14: LNG Regasification – Third-Level Plan
Preliminary – Pre-decisional Deliberative Draft A-26

Life Cycle Analysis of Natural Gas Extraction and Power Generation
Table A-17: LNG Regasification
Unit Process Notes Version Creation Date
Assembly of NG – LNG Regasifier
This process includes all inputs for the construction, installation, and operation of the regasification of 1 kg of liquefied natural gas (LNG). No calculations were made in this process.
N/A N/A
Figure A-20: Tanker Berthing/Deberthing – Third-Level Plan
Preliminary – Pre-decisional Deliberative Draft A-27

Life Cycle Analysis of Natural Gas Extraction and Power Generation
Table A-18: Tanker Berthing/Deberthing
Unit Process Notes Version Creation Date
LNG Tanker Escort, Docking, and
Berthing/Deberthing
This unit process accounts for the relevant input and output flows associated with the docking, berthing, and de-berthing of an ocean tanker that is transporting LNG. All inputs and outputs are normalized to the reference flow (1 kg of LNG). The inputs to this unit process are liquefied natural gas (LNG), diesel, and residual fuel oil; the upstream energy and material flows of LNG, diesel, and residual fuel oil are not included in this unit process but are accounted for by other unit processes. This unit process also accounts for environmental emissions that are directly released by the combustion of fuel by the LNG tanker. The regasification of natural gas is the unit process that is immediately downstream of this unit process.
1 10/2010
U.S. Diesel, National Average (2005)
This unit process includes all inputs for the raw material acquisition, raw material transportation, and energy conversion for 1 kg of refined diesel.
2 5/2012
U.S. Heavy Fuel Oil at Refinery Third-party data available from PE International. N/A N/A
Figure A-21: Liquefaction Construction – Fourth-Level Plan
Preliminary – Pre-decisional Deliberative Draft A-28

Life Cycle Analysis of Natural Gas Extraction and Power Generation
Table A-19: Liquefaction Construction
Unit Process Notes Version Creation Date
Steel Pipe, Welded
This unit process provides a summary of relevant input and output flows associated with the manufacturing of steel BF welded pipe. The data represents a world-wide, cradle-to-gate average of type BF steel welded pipe production with an 85 percent recovery rate. The key inputs are raw materials and water. Key outputs are air and water emissions from the manufacturing of steel BF welded pipe such as carbon dioxide, nickel, and ammonia.
1 6/2013
Steel Plate, Manufacture
This unit process provides a summary of relevant input and output flows associated with the manufacturing of steel BF plate. The data represents a world-wide, cradle-to-gate average of type BF plate steel production with 85-percent recovery rate. The unit process is based on the reference flow of 1 kg of steel BF plate.
1 6/2013
Generic Power Grid Mixer U.S. and N.A.
This unit process provides a summary of relevant input and output flows associated with the average U.S. electricity grid in 2010 accounting for imports from Canada. The inputs include the various generation types in the U.S. A summary of the change in the grid mix for 2010 from 2007 is provided in Table A-26.
1 6/2012
U.S. Concrete, ready mixed, R-5-0 (100% Portland Cement)
This unit process provides a summary of relevant input and output flows associated with the production of ready-mix concrete.
1 6/2013
NG Liquefaction Facility, Construction
This process includes all inputs for the construction of a liquefaction facility. The unit process is based on the reference flow of 1pcs/kg construction. No calculations were made in this process.
N/A N/A
Preliminary – Pre-decisional Deliberative Draft A-29

Life Cycle Analysis of Natural Gas Extraction and Power Generation
Figure A-15: Liquefaction Installation – Fourth-Level Plan
Table A-20: Liquefaction Installation
Unit Process Notes Version Creation Date
U.S. Diesel, National Average (2005)
This unit process provides a summary of relevant input and output flows associated with production of diesel including the production of crude oil, crude oil transportation, and diesel fuel refining/energy conversion. Available adjustable parameters and their default values are provided in Section II. For additional information on the inputs, please refer to the associated documentation for the parameter or input flow in question.
2 5/2012
U.S. Antlantic LNG Installation/Deinstallation
This process includes inputs for the installation and deinstallation of liquefied natural gas (LNG) liquefaction. The unit process is based on the reference flow of 1 pcs/kg installation and deinstallation. No calculations were made in this process.
N/A N/A
Preliminary – Pre-decisional Deliberative Draft A-30

Life Cycle Analysis of Natural Gas Extraction and Power Generation
Figure A-23: LNG Tanker Operation – Fourth-Level Plan
Table A-21: LNG Tanker Operation
Unit Process Notes Version Creation Date
Petroleum Baseline, Diesel
This unit process includes all inputs for the raw material acquisition, raw material transportation, and energy conversion for 1 kg of refined diesel.
1 9/2011
LNG Tanker Transport Operation
This process includes inputs for the operation of a liquefied natural gas (LNG) tanker. The unit process is based on the reference flow of 1 kg LNG. No calculations were made in this process.
N/A N/A
Preliminary – Pre-decisional Deliberative Draft A-31

Life Cycle Analysis of Natural Gas Extraction and Power Generation
Figure A-16: LNG Tanker Construction – Fourth-Level Plan
Table A-22: LNG Tanker Construction
Unit Process Notes Version Creation Date
Aluminum Sheet Mix Third-party data available from PE International. N/A N/A
Steel Plate, Manufacture
This unit process provides a summary of relevant input and output flows associated with the manufacturing of steel BF plate. The data represents a world-wide, cradle-to-gate average of type BF plate steel production with 85-percent recovery rate. The unit process is based on the reference flow of 1 kg of steel BF plate.
1 6/2013
Stainless Steel, 316 2B, 80% Recycled
This unit process provides a summary of relevant input and output flows associated with the manufacturing of stainless steel 316 2B. The data represents a world-wide, cradle-to-gate average of type 316 stainless steel.
1 6/2013
LNG Tanker Construction
This process includes inputs for the construction of a liquefied natural gas (LNG) tanker. The unit process is based on the reference flow of 1pcs/kg construction. No calculations were made in this process.
N/A N/A
Preliminary – Pre-decisional Deliberative Draft A-32

Life Cycle Analysis of Natural Gas Extraction and Power Generation
Figure A-25: Regasification Construction – Fourth-Level Plan
Table A-23: Regasification Construction
Unit Process Notes Version Creation Date
U.S. Concrete, ready mixed, R-5-0 (100% Portland Cement)
This unit process provides a summary of relevant input and output flows associated with the production of ready-mix concrete.
1 6/2013
Generic Power Grid Mixer U.S. and N.A.
This unit process provides a summary of relevant input and output flows associated with the average U.S. electricity grid in 2010 accounting for imports from Canada. The inputs include the various generation types in the U.S. A summary of the change in the grid mix for 2010 from 2007 is provided in Table A-26.
1 6/2012
Steel Plate, Manufacture
This unit process provides a summary of relevant input and output flows associated with the manufacturing of steel BF plate. The data represents a world-wide, cradle-to-gate average of type BF plate steel production with 85-percent recovery rate. The unit process is based on the reference flow of 1 kg of steel BF plate.
1 6/2013
LNG Regasification Construction
This process includes inputs for the construction of a liquefied natural gas (LNG) regasification facility. The unit process is based on the reference flow of 1pcs/kg construction. No calculations were made in this process.
N/A N/A
Preliminary – Pre-decisional Deliberative Draft A-33

Life Cycle Analysis of Natural Gas Extraction and Power Generation
Figure A-26: Regasification Installation – Fourth-Level Plan
Table A-24: Regasification Installation
Unit Process Notes Version Creation Date
U.S. Diesel, National Average (2005)
This unit process provides a summary of relevant input and output flows associated with production of diesel including the production of crude oil, crude oil transportation, and diesel fuel refining/energy conversion. Available adjustable parameters and their default values are provided in Section II. For additional information on the inputs, please refer to the associated documentation for the parameter or input flow in question.
2 5/2012
LNG Regasification Installation and Deinstallation
This process includes inputs for the installation and deinstallation of liquefied natural gas (LNG) regasification. The unit process is based on the reference flow of 1pcs/kg installation and deinstallation. No calculations were made in this process.
1 N/A
Preliminary – Pre-decisional Deliberative Draft A-34

Life Cycle Analysis of Natural Gas Extraction and Power Generation
Figure A-17: Regasification Operation – Fourth-Level Plan
Table A-25: Regasification Operation
Unit Process Notes Version Creation Date
Petroleum Baseline, Diesel
This unit process includes all inputs for the raw material acquisition, raw material transportation, and energy conversion for 1 kg of refined diesel.
1 9/2011
Trunkline LNG Operation
This process includes inputs for the operation of a liquefied natural gas (LNG) trunkline. The unit process is based on the reference flow of 1 kg LNG. No calculations were made in this process.
1 N/A
Table A-26: Generic U.S. and N.A. Power Grid Mix for 2007 and 20101
Energy Source 2007 2010
Coal 49.8% 45.9%
Petroleum 1.6% 1.0%
Natural Gas 20.3% 22.7%
Nuclear 20.2% 20.4%
Hydro 6.9% 7.3%
Solar 0.02% 0.03%
Geothermal 0.4% 0.4%
Wind 0.9% 2.4% 1 Percentages in table do not add to exactly 100% due to rounding errors.
Preliminary – Pre-decisional Deliberative Draft A-35

This page intentionally left blank.

Life Cycle Analysis of Natural Gas Extraction and Power Generation
Appendix B: Unit Process Maps for PRB Coal Extraction through Power
Generation
Table of Contents B.1 Model Overview ................................................................................................................... B-3 B.2 Model Connectivity and Unit Process Links ..................................................................... B-3
Tables Table B-1: Parent/Child Plan Connections for PRB Coal Extraction, Delivery and Electricity
Production .................................................................................................................................... B-4 Table B-2: PPFM CTG Model ........................................................................................................... B-7 Table B-3: Stage #1: PRB Hard Coal RMA ...................................................................................... B-9 Table B-4: Surface Mine Commissioning, Decommissioning .......................................................... B-9 Table B-5: Assembly: Surface Coal Mine, Construction ................................................................ B-10 Table B-6: Blasthole Drill, Construction ......................................................................................... B-11 Table B-7: Coal Loading Silo, Construction ................................................................................... B-12 Table B-8: Conveyor System, Construction .................................................................................... B-13 Table B-9: Coal Loader, Construction ............................................................................................. B-14 Table B-10: Dragline, Construction ................................................................................................. B-15 Table B-11: Mining Truck, Construction ........................................................................................ B-16 Table B-12: Electric Shovel, Construction ...................................................................................... B-17 Table B-13: Coal Crusher, Construction.......................................................................................... B-18 Table B-14: PRB Coal Mine, Operation .......................................................................................... B-19 Table B-15: Stage #2: Coal Transport, General ............................................................................... B-20 Table B-16: Material Transport Construction .................................................................................. B-21 Table B-17: Transport of Coal via Train, Operation ....................................................................... B-23 Table B-18: SCPC Power Plant Construction.................................................................................. B-25 Table B-19: Ammonia Production, No CO2 Capture ...................................................................... B-26 Table B-20: Generic U.S. and N.A. Power Grid Mix for 2007 and 2010........................................ B-27
Preliminary – Predecisional Deliberative Draft B-1

Life Cycle Analysis of Natural Gas Extraction and Power Generation
Figures Figure B-1: Tiered Modeling Approach ............................................................................................ B-3 Figure B-2: PPFM CTG Model – Top-Level Plan ............................................................................ B-6 Figure B-3: PRB CTG – Second-Level Plan ..................................................................................... B-8 Figure B-4: Stage #1: PRB Hard Coal RMA – Third-Level Plan ..................................................... B-8 Figure B-5: Surface Mine Commissioning, Decommissioning – Fourth-Level Plan ........................ B-9 Figure B-6: Assembly: Surface Coal Mine, Construction – Fourth-Level Plan .............................. B-10 Figure B-7: Blasthole Drill, Construction – Fifth-level Plan ........................................................... B-11 Figure B-8: Coal Loading Silo, Construction – Fifth-level Plan ..................................................... B-12 Figure B-9: Conveyor System, Construction – Fifth-level Plan ...................................................... B-13 Figure B-10: Coal Loader, Construction – Fifth-level Plan ............................................................. B-14 Figure B-11: Dragline, Construction – Fifth-level Plan .................................................................. B-15 Figure B-12: Mining Truck, Construction – Fifth-level Plan .......................................................... B-16 Figure B-13: Electric Shovel, Construction – Fifth-level Plan ........................................................ B-17 Figure B-14: Coal Crusher, Construction – Fifth-level Plan ........................................................... B-18 Figure B-15: PRB Coal Mine, Operation – Fourth-level Plan ......................................................... B-19 Figure B-16: Stage #2: Coal Transport, General – Third-Level Plan .............................................. B-20 Figure B-17: Material Transport Construction – Fourth-Level Plan ............................................... B-21 Figure B-18: Transport of Coal via Train, Operation – Fourth-Level Plan ..................................... B-23 Figure B-19: SCPC Power Plant Construction – Second-level Plan ............................................... B-24 Figure B-20: Ammonia Production, No CO2 Capture – Second-level Plan .................................... B-26
Preliminary – Predecisional Deliberative Draft B-2

Life Cycle Analysis of Natural Gas Extraction and Power Generation
B.1 Model Overview This model was created using unit processes developed by NETL and modeled in the GaBi 6.0 LCA modeling software package. All of the unit processes utilized to create this model are publicly available on the NETL website, with the exception of those noted explicitly below, which are available from PE International. The model can be re-created utilizing the GaBi 6.0 software or by utilizing a spreadsheet to perform the scaling calculations between the individual unit processes.
B.2 Model Connectivity and Unit Process Links The structure of LCA models in GaBi uses a tiered approach, which means that there are different groups of processes, known as plans, which are combined to create the model. To aid in the connectivity of various plans used in this model, the following naming convention will be utilized in the figure headings throughout the remainder of this section. The main plan will be referred to as the top-level plan, and all subsequent plans will be referred to as second-, third-, etc. level plans. An example of this tiered-nature of the model structure is shown in Figure B-1.
Figure B-1: Tiered Modeling Approach
Table B-20 demonstrates the relationships between the tiers of plans used in the construction of the model. The figures in this section illustrate the connectivity of the various processes and plans.
Plan 1
Plan 2a
Process 3a Process 3b Plan 3a
Process 4a Process 4b
Plan 2b
Process 3c Process 3d
Process 2a
Preliminary – Predecisional Deliberative Draft B-3

Life Cycle Analysis of Natural Gas Extraction and Power Generation
Table B-1: Parent/Child Plan Connections for PRB Coal Extraction, Delivery and Electricity Production
Figure Plan Name Parent Plans Child Plans
B-2 PPFM CTG Model None
1 – PRB CTG 2 – SCPC Power Plant Construction 3 – Ammonia Production, No CO2 Capture
B-3 PRB CTG PPFM CTG Model 1 – Stage #1: PRB Hard Coal RMA 2 – Stage #2: Coal Transport, General
B-4 Stage #1: PRB Hard Coal RMA PRB CTG
1 – Surface Mine Commissioning, Decommissioning 2 – Assembly: Surface Coal Mine, Construction 3 – PRB Coal Mine, Operation
B-5 Surface Mine Commissioning,
Decommissioning
Stage #1: PRB Hard Coal RMA None
B-6 Assembly: Surface Coal Mine, Construction Stage #1: PRB Hard Coal RMA
1 – Blasthole Drill, Construction 2 – Coal Loading Silo, Construction 3 – Conveyer System, Construction 4 – Coal Loader, Construction 5 – Dragline, Construction 6 – Mining Truck, Construction 7 – Electric Shovel, Construction 8 – Coal Crusher, Construction
B-7 Blasthole Drill, Construction
Assembly: Surface Coal Mine, Construction None
B-8 Coal Loading Silo, Construction
Assembly: Surface Coal Mine, Construction None
B-9 Conveyer System, Construction
Assembly: Surface Coal Mine, Construction None
B-10 Coal Loader, Construction
Assembly: Surface Coal Mine, Construction None
B-11 Dragline, Construction
Assembly: Surface Coal Mine, Construction None
B-12 Mining Truck, Construction
Assembly: Surface Coal Mine, Construction None
B-13 Electric Shovel, Construction
Assembly: Surface Coal Mine, Construction None
B-14 Coal Crusher, Construction Assembly: Surface Coal Mine, Construction None
B-15 PRB Coal Mine, Operation Stage #1: PRB Hard Coal RMA None
B-16 Stage #2: Coal Transport, General PRB CTG
1 – Material Transport, Construction 2 – Transport of Coal via Train, Operation
B-17 Material Transport, Construction Stage #2: Coal Transport, General None
B-18 Transport of Coal via Train, Operation
Stage #2: Coal Transport, General None
Preliminary – Predecisional Deliberative Draft B-4

Life Cycle Analysis of Natural Gas Extraction and Power Generation
Figure Plan Name Parent Plans Child Plans B-19 SCPC Power Plant, Construction PPFM CTG Model None
B-20 Ammonia Production, No CO2 Capture PPFM CTG Model None
Preliminary – Predecisional Deliberative Draft B-5

Life Cycle Analysis of Natural Gas Extraction and Power Generation
Figure B-2: PPFM CTG Model – Top-Level Plan
Preliminary – Predecisional Deliberative Draft B-6

Life Cycle Analysis of Natural Gas Extraction and Power Generation
Table B-2: PPFM CTG Model
Unit Process Notes Version Creation Date
Natural Gas RMA/RMT 2010 Mix
This unit process provides a summary of relevant input and output flows associated with the
extraction and processing of natural gas and its transportation to an energy conversion facility. It includes all inputs for the raw material acquisition
and raw material transportation for 1 kg of delivered natural gas proportionally from all
extraction methods.
2 5/2012
U.S. Sulphuric acid aq. (96%) Third-party data available from PE International. N/A N/A
U.S. Sodium Hydroxide (from chloride alkali
electrolysis) Third-party data available from PE International. N/A N/A
U.S. Diethanolamine Third-party data available from PE International. N/A N/A
U.S. Limestone (CaCO3; washed) Third-party data available from PE International. N/A N/A
RER: Process Water Third-party data available from PE International. N/A N/A
U.S. PPFM Import
The Power Plant Flexible Model (PPFM) is an Excel-based tool that simulates coal combustion-based power plant electrical output, emissions, materials usage, and costs for a fully-configurable mix of boiler and steam plant types, feedstocks, and emissions control equipment. The technical documentation and user's guide for the model are included in the download package. PPFM is not engineered to be a consumer-level product and requires knowledge of coal combustion power plants and processes to yield reasonable results This UP uses scenario S12A to produce 1 MWh bus bar power.
1 11/2013
U.S. Transmission and Distribution
This unit process provides a summary of relevant input and output flows associated distribution of electricity to commercial or residential consumers. All inputs and outputs are normalized 1 MWh of electricity delivered.
1 4/2013
RER: Landfill for inert matter (unspecific
construction waste) Third-party data available from PE International. N/A N/A
Preliminary – Predecisional Deliberative Draft B-7

Life Cycle Analysis of Natural Gas Extraction and Power Generation
Unit Process Notes Version Creation Date
U.S. End User
This process includes all inputs for the extraction, delivery, electricity production, and transmission for 1 kg of liquefied natural gas (LNG). No assumptions or calculations were made in this process regarding end use efficiency.
N/A N/A
Figure B-3: PRB CTG – Second-Level Plan
Figure B-4: Stage #1: PRB Hard Coal RMA – Third-Level Plan
Preliminary – Predecisional Deliberative Draft B-8

Life Cycle Analysis of Natural Gas Extraction and Power Generation
Table B-3: Stage #1: PRB Hard Coal RMA
Unit Process Notes Version Creation Date
U.S. Stage #1: Coal Mine, Construction and Operation
This unit process provides a summary of relevant input and output flows associated with the aboveground extraction of Powder River Basin coal. All inputs and outputs are normalized per kg of Powder River Basin Coal
1 9/2011
Figure B-5: Surface Mine Commissioning, Decommissioning – Fourth-Level Plan
Table B-4: Surface Mine Commissioning, Decommissioning
Unit Process Notes Version Creation Date
U.S. Commissioning and Decommissioning of
Powder River Basin Coal Mine
This unit process provides a summary of relevant input and output flows associated with the commissioning (installation and opening) and decommissioning (closing and removal) of a surface mine for Powder River Basin subbituminous coal. Relevant input and output flows include diesel requirements for machinery and associated combustion emissions. The input and output flows associated with the operation of the Powder River Basin subbituminous coal mine mining the coal are provided in a separate unit process. All inputs and outputs are normalized per kg of Powder River Basin sub-bituminous coal.
1 2/2010
U.S. Diesel, Crude Mix (2005)
This unit process provides a summary of relevant input and output flows associated with production of diesel including the production of crude oil, crude oil transportation, and diesel fuel refining/energy conversion. All inputs and outputs are normalized per kg of diesel.
2 5/2012
Preliminary – Predecisional Deliberative Draft B-9

Life Cycle Analysis of Natural Gas Extraction and Power Generation
Figure B-6: – Assembly: Surface Coal Mine, Construction – Fourth-Level Plan
Table B-5: Assembly: Surface Coal Mine, Construction
Unit Process Notes Version Creation Date
U.S. PRB Coal Surface Mine Assembly,
Construction
This unit process provides a summary of the quantities of each piece of equipment required to extract and produce coal at a large surface mine in the Powder River Basin region. The mine produces PRB sub-bituminous coal under LC Stage #1, and prepares it to be transported by rail (LC Stage #2) to the energy conversion facility (LC Stage #3), over the 30 year study period. The number of each piece of equipment is based on equipment life expectancy, length of the study period, and amount of coal produced. The construction data for individual pieces of equipment is evaluated in separate unit processes. All inputs and outputs are normalized per 1 pcs of PRB coal surface mine per kg of coal produced.
1 2/2010
Preliminary – Predecisional Deliberative Draft B-10

Life Cycle Analysis of Natural Gas Extraction and Power Generation
Figure B-7: Blasthole Drill, Construction – Fifth-level Plan
Table B-6: Blasthole Drill, Construction
Unit Process Notes Version Creation Date
Steel Plate, Manufacture
This unit process provides a summary of relevant input and output flows associated with the manufacturing of steel BF plate. The data represents a world-wide, cradle-to-gate average of type BF plate steel production with 85-percent recovery rate. The unit process is based on the reference flow of 1 kg of steel BF plate.
1 6/2013
U.S. Blasthole Drill, Construction
This unit process provides a summary of the amount of steel plate required for the construction of a blasthole drill (e.g., 1 piece [pcs] of blasthole drill, 250,000 lbs). For the purposes of this analysis, the blasthole drill is assumed to be comprised entirely of steel plate, with other materials being negligible. The number of drills required to produce coal on a large surface mine with a dragline is evaluated in a separate assembly sheet. All inputs and outputs are normalized per pcs of blasthole drill.
1 2/2010
Preliminary – Predecisional Deliberative Draft B-11

Life Cycle Analysis of Natural Gas Extraction and Power Generation
Figure B-8: Coal Loading Silo, Construction – Fifth-level Plan
Table B-7: Coal Loading Silo, Construction
Unit Process Notes Version Creation Date
Steel Cold Rolled Coil Third-party data available from PE International. N/A N/A
Coal Loading Silos, Construction
This unit process provides a summary of the amount of steel plate and concrete required for the construction of a loading silo, which holds PRB sub-bituminous coal, releasing it during train loading. The number of silos required for train loading of PRB sub-bituminous coal is evaluated in a separate assembly sheet. All inputs and outputs are normalized per pcs of coal loading silo, 12,000 tons, PRB.
1 2/2010
U.S. Concrete, ready mixed, R-5-0 (100% Portland Cement)
This unit process provides a summary of relevant input and output flows associated with the production of ready-mix concrete.
1 6/2013
Preliminary – Predecisional Deliberative Draft B-12

Life Cycle Analysis of Natural Gas Extraction and Power Generation
Figure B-9: Conveyor System, Construction – Fifth-level Plan
Table B-8: Conveyor System, Construction
Unit Process Notes Version Creation Date
Hot-dip Galvanized Third-party data available from PE International. N/A N/A
Styrene-Butadiene Rubber (SBR) Mix Third-party data available from PE International. N/A N/A
Steel Cold Rolled Coil Third-party data available from PE International. N/A N/A
Steel-Cord Conveyer System, 72”, Construction
This unit process provides a summary of the amount of materials required for the construction of a single steel-cord conveyor system, 72" wide, used for the carrying of coal at a Powder River Basin sub-bituminous coal mine. The number of conveyor systems required to transport coal is evaluated in a separate assembly sheet. All inputs and outputs are normalized per pcs of steel-cord conveyor system, 72".
1 2/2010
Preliminary – Predecisional Deliberative Draft B-13

Life Cycle Analysis of Natural Gas Extraction and Power Generation
Figure B-10: Coal Loader, Construction – Fifth-level Plan
Table B-9: Coal Loader, Construction
Unit Process Notes Version Creation Date
Steel Plate, Manufacture
This unit process provides a summary of relevant input and output flows associated with the manufacturing of steel BF plate. The data represents a world-wide, cradle-to-gate average of type BF plate steel production with 85-percent recovery rate. The unit process is based on the reference flow of 1 kg of steel BF plate.
1 6/2013
U.S. Track Loader, 239 Horsepower, Construction
This unit process provides a summary of the amount of steel required for the construction of a track loader used to scrape and push unconsolidated overburden at a large surface mine. As shown, the loader is assumed to consist entirely of steel plate. The number of loaders required to scrape and move overburden is evaluated in a separate assembly unit process. This unit process provides construction data only for a single loader. All inputs and outputs are normalized per pcs of track loader, 239 HP.
1 2/2010
Preliminary – Predecisional Deliberative Draft B-14

Life Cycle Analysis of Natural Gas Extraction and Power Generation
Figure B-11: Dragline, Construction – Fifth-level Plan
Table B-10: Dragline, Construction
Unit Process Notes Version Creation Date
Steel Plate, Manufacture
This unit process provides a summary of relevant input and output flows associated with the manufacturing of steel BF plate. The data represents a world-wide, cradle-to-gate average of type BF plate steel production with 85-percent recovery rate. The unit process is based on the reference flow of 1 kg of steel BF plate.
1 6/2013
Dragline, 8200 ton, Construction
This unit process provides a summary of the amount of steel plate required for the construction of a dragline (e.g., 1 piece [pcs] of dragline, 8,200 tons). The dragline is assumed to be comprised entirely of steel plate, with other materials being negligible. The number of draglines required to produce coal at a surface mine is evaluated in a separate assembly sheet. All inputs and outputs are normalized per pcs of dragline.
1 2/2010
Preliminary – Predecisional Deliberative Draft B-15

Life Cycle Analysis of Natural Gas Extraction and Power Generation
Figure B-12: Mining Truck, Construction – Fifth-level Plan
Table B-11: Mining Truck, Construction
Unit Process Notes Version Creation Date
Styrene-butadiene Rubber (SBR) Mix Third-party data available from PE International. N/A N/A
Steel Plate, Manufacture
This unit process provides a summary of relevant input and output flows associated with the manufacturing of steel BF plate. The data represents a world-wide, cradle-to-gate average of type BF plate steel production with 85-percent recovery rate. The unit process is based on the reference flow of 1 kg of steel BF plate.
1 6/2013
Mining Truck for Surface Mine, 623690 kg,
Construction
This unit process provides a summary of the amount of steel plate and styrene-butadiene-rubber required for the construction of a mining truck (e.g., 1 piece [pcs] of mining truck, 623,690 kg). For the purposes of this analysis, the mining truck is assumed to be comprised of steel plate and styrene-butadiene-rubber, with other materials being negligible. The number of mining trucks required to produce coal is evaluated in a separate assembly sheet. All inputs and outputs are normalized per pcs of mining truck.
1 2/2010
Preliminary – Predecisional Deliberative Draft B-16

Life Cycle Analysis of Natural Gas Extraction and Power Generation
Figure B-13: Electric Shovel, Construction – Fifth-level Plan
Table B-12: Electric Shovel, Construction
Unit Process Notes Version Creation Date
Steel Plate, Manufacture
This unit process provides a summary of relevant input and output flows associated with the manufacturing of steel BF plate. The data represents a world-wide, cradle-to-gate average of type BF plate steel production with 85-percent recovery rate. The unit process is based on the reference flow of 1 kg of steel BF plate.
1 6/2013
Electric Shovel, 120 tons payload, Construction
This unit process provides a summary of the amount of steel required for the construction of an electric shovel (e.g., 1 piece [pcs] of shovel) needed to move overburden and extract coal at a large surface mine, and to load the coal into a truck for transport at the mine site. The electric shovel is assumed to consist entirely of steel plate. The number of shovels required to move overburden and extract coal is evaluated in a separate assembly sheet. All inputs and outputs are normalized per pcs of electric shovel, 120 tons payload.
1 2/2010
Preliminary – Predecisional Deliberative Draft B-17

Life Cycle Analysis of Natural Gas Extraction and Power Generation
Figure B-14: Coal Crusher, Construction – Fifth-level Plan
Table B-13: Coal Crusher, Construction
Unit Process Notes Version Creation Date
Steel Cold Rolled Coil Third-party data available from PE International. N/A N/A
Coal Crusher, Construction
This unit process provides a summary of the amount of steel required for the construction of a coal crusher (e.g., 1 piece [pcs] of coal crusher, 254,000 lbs). The coal crusher is assumed to be comprised entirely of cold rolled steel, with other materials being negligible. The number of crushers required to produce coal at a surface mine is evaluated in a separate assembly sheet. All inputs and outputs are normalized per pcs of coal crusher.
1 2/2010
Preliminary – Predecisional Deliberative Draft B-18

Life Cycle Analysis of Natural Gas Extraction and Power Generation
Figure B-15: PRB Coal Mine, Operation – Fourth-level Plan
Table B-14: PRB Coal Mine, Operation
Unit Process Notes Version Creation Date
Powder River Basin Surface Subbituminous Coal Mine, Operations
This unit process provides a summary of relevant input and output flows associated with surface mining of Powder River Basin subbituminous coal. These include: electricity use, diesel fuel use, water use, water discharge, air quality emissions including particulate matter and coal bed methane, and water quality emissions. For additional documentation, please see the associated DF sheet for this unit process. All inputs and outputs are normalized per kg of Powder River Basin subbituminous coal.
2 4/2013
Generic Power Grid Mixer U.S. and N.A.
This unit process provides a summary of relevant input and output flows associated with the average U.S. electricity grid in 2010 accounting for imports from Canada. The inputs include the various generation types in the U.S. A summary of the change in the grid mix for 2010 from 2007 is provided in Table B-20.
1 6/2012
Ammonium Nitrate Third-party data available from PE International. N/A N/A
Light Fuel Oil at Refinery Third-party data available from PE International. N/A N/A
Preliminary – Predecisional Deliberative Draft B-19

Life Cycle Analysis of Natural Gas Extraction and Power Generation
Unit Process Notes Version Creation Date
U.S. Diesel, Crude Mix (2005)
This unit process provides a summary of relevant input and output flows associated with production of diesel including the production of crude oil, crude oil transportation, and diesel fuel refining/energy conversion. All inputs and outputs are normalized per kg of diesel.
2 5/2012
Figure B-16: Stage #2: Coal Transport, General – Third-Level Plan
Table B-15: Stage #2: Coal Transport, General
Unit Process Notes Version Creation Date
U.S. Coal Rail Transport, Construction and
Operation
This unit process provides a summary of relevant input and output flows associated with the transportation of generic coal to an energy conversion facility. All inputs and outputs are normalized per the reference flow per kg of coal.
1 9/2011
Preliminary – Predecisional Deliberative Draft B-20

Life Cycle Analysis of Natural Gas Extraction and Power Generation
Figure B-17: Material Transport Construction – Fourth-Level Plan
Table B-16: Material Transport Construction
Unit Process Notes Version Creation Date
Aluminum sheet mix Third-party data available from PE International. N/A N/A
Steel Plate, Manufacture
This unit process provides a summary of relevant input and output flows associated with the manufacturing of steel BF plate. The data represents a world-wide, cradle-to-gate average of type BF plate steel production with 85-percent recovery rate. The unit process is based on the reference flow of 1 kg of steel BF plate.
1 6/2013
Stainless Steel, 316 2B, 80% Recycled
This unit process provides a summary of relevant input and output flows associated with the manufacturing of stainless steel 316 2B. The data represents a world-wide, cradle-to-gate average of type 316 stainless steel.
1 6/2013
Preliminary – Predecisional Deliberative Draft B-21

Life Cycle Analysis of Natural Gas Extraction and Power Generation
Unit Process Notes Version Creation Date
Diesel Locomotive, 4400 Horsepower, Construction
This unit process provides a summary of the amount of steel plate and stainless steel required for the construction of a locomotive (e.g., 1 piece [pcs] of locomotive) used to haul a generic type of coal from the coal mine to the energy conversion facility. The locomotive is assumed to consist entirely of carbon steel (90% by default) and stainless steel (10% by default). The number of locomotives required to transport coal is evaluated in a separate assembly sheet. All inputs and outputs are normalized per pcs of locomotive.
1 12/2009
Coal Railcar, 244000 lb Net Capacity, Construction
This unit process provides a summary of the amount of aluminum and steel required for the construction of a railcar (e.g., 1 piece [pcs] of railcar) needed to haul coal from the coal mine to the power plant. The railcar is assumed to consist entirely of aluminum and steel plate. The number of railcars required to transport coal is evaluated in a separate assembly sheet. All inputs and outputs are normalized per pcs of railcar.
1 12/2009
Coal Unit Train Assembly, 100 Railcars, Construction
This unit process provides a summary of the number of coal unit trains (locomotives and railcars) needed to haul coal from the coal mine (LC Stage #1) to the energy conversion facility (LC Stage #3), over the 30-year study period. This assembly process applies to a generic type of coal, and can be used for any type of coal.The number of trains is based on vehicle life expectancy, study period, weight of the coal to be shipped, and other travel variables. The construction data for individual locomotives and railcars is evaluated in separate unit processes. All inputs and outputs are normalized per 1 pcs of unit train per kg coal transported.
2 1/2012
Preliminary – Predecisional Deliberative Draft B-22

Life Cycle Analysis of Natural Gas Extraction and Power Generation
Figure B-18: Transport of Coal via Train, Operation – Fourth-Level Plan
Table B-17: Transport of Coal via Train, Operation
Unit Process Notes Version Creation Date
U.S. Coal, Train Transport
This unit process provides a summary of relevant input and output flows associated with the transport of an unspecified type of prepared coal by train. Flows include diesel input for combustion, amount of coal transported, and airborne emissions. This process can be used regardless of the type of coal being transported or the location in the US where the transport is taking place. For additional documentation, please see the associated DF for this unit process. All inputs and outputs are normalized per kg of cargo.
1 10/2010
U.S. Diesel, Crude Mix (2005)
This unit process provides a summary of relevant input and output flows associated with production of diesel including the production of crude oil, crude oil transportation, and diesel fuel refining/energy conversion. All inputs and outputs are normalized per kg of diesel.
2 5/2012
Preliminary – Predecisional Deliberative Draft B-23

Life Cycle Analysis of Natural Gas Extraction and Power Generation
Figure B-19: SCPC Power Plant Construction – Second-level Plan
Preliminary – Predecisional Deliberative Draft B-24

Life Cycle Analysis of Natural Gas Extraction and Power Generation
Table B-18: SCPC Power Plant Construction
Unit Process Notes Version Creation Date
Generic Power Grid Mixer U.S. and N.A.
This unit process provides a summary of relevant input and output flows associated with the average U.S. electricity grid in 2010 accounting for imports from Canada. The inputs include the various generation types in the U.S. A summary of the change in the grid mix for 2010 from 2007 is provided in Table B-20.
1 6/2012
U.S. Concrete, ready mixed, R-5-0 (100% Portland Cement)
This unit process provides a summary of relevant input and output flows associated with the production of ready-mix concrete.
1 6/2013
Steel Pipe, Welded
This unit process provides a summary of relevant input and output flows associated with the manufacturing of steel BF welded pipe. The data represents a world-wide, cradle-to-gate average of type BF steel welded pipe production with an 85 percent recovery rate. The key inputs are raw materials and water. Key outputs are air and water emissions from the manufacturing of steel BF welded pipe such as carbon dioxide, nickel, and ammonia.
1 6/2013
Iron, Sand Casted Third-party data available from PE International. N/A N/A
Aluminum Sheet Mix Third-party data available from PE International. N/A N/A
Steel Cold Rolled Coil Third-party data available from PE International. N/A N/A
Stainless Steel, 316 2B, 80% Recycled
This unit process provides a summary of relevant input and output flows associated with the manufacturing of stainless steel 316 2B. The data represents a world-wide, cradle-to-gate average of type 316 stainless steel
1 6/2013
SCPC Power Plant, Construction
This unit process provides a summary of relevant input and output flows associated with the construction of a supercritical pulverized coal (SCPC) power plant. This process can be used for scenarios with and without carbon capture and sequestration (CCS). Key inputs include concrete, steel, steel pipe, stainless steel, aluminum, and cast iron. The key output is one SCPC power plant.
1 9/2011
Preliminary – Predecisional Deliberative Draft B-25

Life Cycle Analysis of Natural Gas Extraction and Power Generation
Figure B-20: Ammonia Production, No CO2 Capture – Second-level Plan
Table B-19: Ammonia Production, No CO2 Capture
Unit Process Notes Version Creation Date
Natural Gas RMA/RMT 2010 Average U.S. Mix
This unit process provides a summary of relevant input and output flows associated with the extraction and processing of natural gas and its transportation to an energy conversion facility. All inputs and outputs are normalized per kg of natural gas delivered for the purpose of providing raw material as a feedstock for ammonia production.
2 5/2012
Natural Gas RMA/RMT 2010 Mix
This unit process provides a summary of relevant input and output flows associated with the extraction and processing of natural gas and its transportation to an energy conversion facility. All inputs and outputs are normalized per kg of natural gas delivered for the purpose of providing the energy required for steam production.
2 5/2012
Preliminary – Predecisional Deliberative Draft B-26

Life Cycle Analysis of Natural Gas Extraction and Power Generation
Unit Process Notes Version Creation Date
Natural Gas Combustion
This unit process provides a summary of relevant input and output flows associated with the combustion of natural gas in a boiler. The only input to this unit process is natural gas. Air emissions include greenhouse gas emission and criteria air pollutants. All inputs and outputs are normalized per kg of natural gas combustion.
1 9/2010
Ammonia Production, No CO2 Capture
This unit process provides a summary of relevant input and output flows associated with ammonia (NH3) production. This process is modified to render captured CO2 an emission, rather than an intermediate flow.
1 12/2012
Table B-20: Generic U.S. and N.A. Power Grid Mix for 2007 and 20101
Energy Source 2007 2010
Coal 49.8% 45.9%
Petroleum 1.6% 1.0%
Natural Gas 20.3% 22.7%
Nuclear 20.2% 20.4%
Hydro 6.9% 7.3%
Solar 0.02% 0.03%
Geothermal 0.4% 0.4%
Wind 0.9% 2.4% 1 Percentages in table do not add to exactly 100% due to rounding errors.
Preliminary – Predecisional Deliberative Draft B-27

This page intentionally left blank.

Life Cycle Analysis of Natural Gas Extraction and Power Generation
Appendix C: Unit Process Maps for I6 Coal Extraction through Power Generation
Table of Contents C.1 Model Overview ................................................................................................................... C-1 C.2 Model Connectivity and Unit Process Links ..................................................................... C-3
Tables Table C-1: Parent/Child Plan Connections for I6 Coal Gas Extraction, Delivery and Electricity
Production .................................................................................................................................... C-4 Table C-2: Unit Processes PPFM CTG Model .................................................................................. C-7 Table C-3: Unit Processes in Stage #1: Hard Coal Material (Illinois #6) .......................................... C-9 Table C-4: Unit Processes in Coal Mine Commissioning, Decommissioning .................................. C-9 Table C-5: Unit Processes in Assembly: Coal Preparation Facility, Construction .......................... C-11 Table C-6: Unit Processes in Coal Loading Silo, Construction ....................................................... C-11 Table C-7: Unit Processes in Stacker Reclaimer ............................................................................. C-12 Table C-8: Unit Processes in Coal Mine Wastewater Treatment Plant, Construction ..................... C-13 Table C-9: Unit Processes in Coal Cleaning Facility, Construction ................................................ C-14 Table C-10: Unit Processes in Coal Crusher Facility, Construction ................................................ C-16 Table C-11: Unit Processes in Underground Coal Mine, Construction ........................................... C-17 Table C-12: Unit Processes in Site Paving, Construction ................................................................ C-18 Table C-13: Unit Processes in Shuttle Car, Construction ................................................................ C-19 Table C-14: Unit Processes in Conveyer System, Construction ...................................................... C-20 Table C-15: Unit Processes in Continuous Miner, Construction ..................................................... C-20 Table C-16: Unit Processes in Longwall Miner System, Construction ........................................... C-21 Table C-17: Unit Processes in I6 Coal Mine, Operation ................................................................. C-22 Table C-18: Unit Processes in Stage #2: Coal Transport, General .................................................. C-23 Table C-19: Unit Processes in Material Transport Construction ..................................................... C-24 Table C-20: Unit Processes in Transport of Coal via Train, Operation ........................................... C-26 Table C-21: Unit Processes in SCPC Power Plant Construction ..................................................... C-28 Table C-22: Unit Processes in Ammonia Production, No CO2 Capture ......................................... C-29 Table C-23: Generic U.S. and N.A. Power Grid Mix for 2007 and 2010........................................ C-30
Preliminary – Pre-decisional Deliberative Draft C-1

Life Cycle Analysis of Natural Gas Extraction and Power Generation
Figures Figure C-1: Tiered Modeling Approach ............................................................................................ C-3 Figure C-2: PPFM CTG Model – Top-Level Plan ............................................................................ C-6 Figure C-3: I6 CTG – Second-Level Plan ......................................................................................... C-8 Figure C-4: Stage #1: Hard Coal Material (Illinois #6) – Third-Level Plan ...................................... C-8 Figure C-5: Coal Mine Commissioning, Decommissioning – Fourth-Level Plan............................. C-9 Figure C-6: Assembly: Coal Preparation Facility, Construction – Fourth-Level Plan .................... C-10 Figure C-7: Coal Loading Silo, Construction – Fifth-Level Plan .................................................... C-11 Figure C-8: Stacker Reclaimer, Construction – Fifth-Level Plan .................................................... C-12 Figure C-9: Coal Mine Wastewater Treatment Plant, Construction – Fifth-Level Plan .................. C-13 Figure C-10: Coal Cleaning Facility, Construction – Fifth-Level Plan ........................................... C-14 Figure C-11: Coal Crusher Facility, Construction – Fifth-Level Plan ............................................. C-15 Figure C-12: Underground Coal Mine, Construction – Fourth-Level Plan ..................................... C-17 Figure C-13: Site Paving, Construction – Fifth-Level Plan ............................................................. C-18 Figure C-14: Shuttle Car, Construction – Fifth-Level Plan ............................................................. C-19 Figure C-15: Conveyer System, Construction – Fifth-Level Plan ................................................... C-19 Figure C-16: Continuous Miner, Construction – Fifth-Level Plan .................................................. C-20 Figure C-17: Longwall Miner System, Construction – Ffifth-Level Plan ....................................... C-21 Figure C-18: I6 Coal Mine, Operation – Fourth-Level Plan ............................................................ C-22 Figure C-19: Stage #2: Coal Transport, General – Third-Level Plan .............................................. C-23 Figure C-20: Material Transport Construction – Fourth-Level Plan ............................................... C-24 Figure C-21: Transport of Coal via Train, Operation – Fourth-Level Plan ..................................... C-25 Figure C-22: SCPC Power Plant Construction – Second-Level Plan .............................................. C-27 Figure C-23: Ammonia Production, No CO2 Capture – Second-Level Plan .................................. C-29
Preliminary – Pre-decisional Deliberative Draft C-2

Life Cycle Analysis of Natural Gas Extraction and Power Generation
C.1 Model Overview This model was created using unit processes developed by NETL and modeled in the GaBi 6.0 LCA modeling software package. All of the unit processes utilized to create this model are publicly available on the NETL website, with the exception of those noted explicitly below, which are available from PE International. The model can be re-created utilizing the GaBi 6.0 software or by utilizing a spreadsheet to perform the scaling calculations between the individual unit processes.
C.2 Model Connectivity and Unit Process Links The structure of LCA models in GaBi uses a tiered approach, which means that there are different groups of processes, known as plans, which are combined to create the model. To aid in the connectivity of various plans used in this model, the following naming convention will be utilized in the figure headings throughout the remainder of this section. The main plan will be referred to as the top-level plan, and all subsequent plans will be referred to as second-, third-, etc. level plans. An example of this tiered-nature of the model structure is shown in Figure C-1.
Figure C-1: Tiered Modeling Approach
Table C-1 demonstrates the relationships between the tiers of plans used in the construction of the model. The figures in this section illustrate the connectivity of the various processes and plans.
Plan 1
Plan 2a
Process 3a Process 3b Plan 3a
Process 4a Process 4b
Plan 2b
Process 3c Process 3d
Process 2a
Preliminary – Pre-decisional Deliberative Draft C-3

Life Cycle Analysis of Natural Gas Extraction and Power Generation
Table C-1: Parent/Child Plan Connections for I6 Coal Extraction, Delivery and Electricity Production
Figure Plan Name Parent Plans Child Plans
C-2 PPFM CTG Model None
1 – I6 CTG 2 – SCPC Power Plant Construction 3 – Ammonia Production, No CO2 Capture
C-3 I6 CTG PPFM CTG Model
1 – Stage #1: PRB Hard Coal Material (Illinois #6) 2 – Stage #2: Coal Transport, General
C-4 Stage #1: PRB Hard Coal Material (Illinois #6) I6 CTG
1 – Coal Mine Commissioning, Decommissioning 2 – Assembly: Coal Preparation Facility, Construction 3 – Underground Coal Mine, Construction 4 –I6 Coal Mine, Operation
C-5 Coal Mine Commissioning,
Decommissioning Stage #1: PRB Hard Coal Material (Illinois #6) None
C-6 Assembly: Coal Preparation Facility, Construction Stage #1: PRB Hard Coal RMA
1 – Coal Loading Silo, Construction 2 – Stacker Reclaimer, Construction 3 – Coal Mine Wastewater Treatment Plant, Construction 4 – Coal Cleaning Facility, Construction 5 – Coal Crusher Facility, Construction
C-7 Coal Loading Silo, Construction Assembly: Coal Preparation Facility, Construction None
C-8 Stacker Reclaimer, Construction Assembly: Coal Preparation Facility, Construction None
C-9 Coal Mine Wastewater Treatment Plant, Construction
Assembly: Coal Preparation Facility, Construction None
C-10 Coal Cleaning Facility, Construction
Assembly: Coal Preparation Facility, Construction None
C-11 Coal Crusher Facility, Construction Assembly: Coal Preparation Facility, Construction None
C-12 Underground Coal Mine, Construction Stage #1: PRB Hard Coal RMA
1 – Site Paving, Construction 2 – Shuttle Car, Construction 3 – Conveyer System, Construction 4 – Continuous Miner, Construction 5 – Longwall Miner System
C-13 Site Paving, Construction Underground Coal Mine, Construction None
C-14 Shuttle Car, Construction Underground Coal Mine, Construction None
C-15 Conveyer System, Construction Underground Coal Mine, Construction None
Preliminary – Pre-decisional Deliberative Draft C-4

Life Cycle Analysis of Natural Gas Extraction and Power Generation
Figure Plan Name Parent Plans Child Plans
C-16 Continuous Miner, Construction Underground Coal Mine, Construction None
C-17 Longwall Miner System Underground Coal Mine, Construction None
C-18 I6 Coal Mine, Operation Stage #1: PRB Hard Coal Material (Illinois #6) None
C-19 Stage #2: Coal Transport, General I6 CTG
1 – Material Transport Construction 2 – Transport of Coal via Train, Operation
C-20 Material Transport Construction Stage #2: Coal Transport, General None
C-21 Transport of Coal via Train, Operation
Stage #2: Coal Transport, General None
C-22 SCPC Power Plant Construction PPFM CTG Model None
C-23 Ammonia Production, No CO2 Capture PPFM CTG Model None
Preliminary – Pre-decisional Deliberative Draft C-5

Life Cycle Analysis of Natural Gas Extraction and Power Generation
Figure C-2: PPFM CTG Model – Top-Level Plan
Preliminary – Pre-decisional Deliberative Draft C-6

Life Cycle Analysis of Natural Gas Extraction and Power Generation
Table C-3: PPFM CTG Model
Unit Process Notes Version Creation Date
Natural Gas RMA/RMT 2010 Mix
This unit process provides a summary of relevant input and output flows associated with the
extraction and processing of natural gas and its transportation to an energy conversion facility. It includes all inputs for the raw material acquisition
and raw material transportation for 1 kg of delivered natural gas proportionally from all
extraction methods.
2 5/2012
U.S. Sulphuric acid aq. (96%) Third-party data available from PE International. N/A N/A
U.S. Sodium Hydroxide (from chloride alkali
electrolysis) Third-party data available from PE International. N/A N/A
U.S. Diethanolamine Third-party data available from PE International. N/A N/A
U.S. Limestone (CaCO3; washed) Third-party data available from PE International. N/A N/A
RER: Process Water Third-party data available from PE International. N/A N/A
U.S. PPFM Import
The Power Plant Flexible Model (PPFM) is an Excel-based tool that simulates coal combustion-based power plant electrical output, emissions, materials usage, and costs for a fully-configurable mix of boiler and steam plant types, feedstocks, and emissions control equipment. The technical documentation and user's guide for the model are included in the download package. PPFM is not engineered to be a consumer-level product and requires knowledge of coal combustion power plants and processes to yield reasonable results This UP uses scenario case11 to produce 1 MWh bus bar power.
1 11/2013
U.S. Transmission and Distribution
This unit process provides a summary of relevant input and output flows associated distribution of electricity to commercial or residential consumers. All inputs and outputs are normalized 1 MWh of electricity delivered.
1 4/2013
RER: Landfill for inert matter (unspecific
construction waste) Third-party data available from PE International. N/A N/A
Preliminary – Pre-decisional Deliberative Draft C-7

Life Cycle Analysis of Natural Gas Extraction and Power Generation
Unit Process Notes Version Creation Date
U.S. End User
This process includes all inputs for the extraction, delivery, electricity production, and transmission for 1 kg of liquefied natural gas (LNG). No assumptions or calculations were made in this process regarding end use efficiency.
N/A N/A
Figure C-4: I6 CTG – Second-Level Plan
Figure C-4: Stage #1: Hard Coal Material (Illinois #6) – Third-Level Plan
Preliminary – Pre-decisional Deliberative Draft C-8

Life Cycle Analysis of Natural Gas Extraction and Power Generation
Table C-3: Stage #1: Hard Coal Material (Illinois #6)
Unit Process Notes Version Creation Date
U.S. Stage #1: Coal Mine Construction and Operation
This unit process provides a summary of relevant input and output flows associated with the underground extraction of Illinois #6 coal. All inputs and outputs are normalized per kg of Illinois #6 coal.
1 9/2011
Figure C-5: Coal Mine Commissioning, Decommissioning – Fourth-Level Plan
Table C-4: Coal Mine Commissioning, Decommissioning
Unit Process Notes Version Creation Date
U.S. Commissioning and Decommissioning of
Illinois No. 6 Coal Mine
This unit process provides a summary of relevant input and output flows associated with the commissioning (installation and opening) and decommissioning (closing and removal) of an underground mine for Illinois No. 6 bituminous coal. Relevant input and output flows include diesel and gasoline requirements for machinery and associated combustion emissions. The input and output flows associated with the operation of the Illinois No. 6 bituminous coal mine mining the coal are provided in a separate unit process. All inputs and outputs are normalized per kg of Illinois No. 6 coal.
1 1/2010
Preliminary – Pre-decisional Deliberative Draft C-9

Life Cycle Analysis of Natural Gas Extraction and Power Generation
Unit Process Notes Version Creation Date
U.S. Diesel, Crude Mix (2005)
This unit process provides a summary of relevant input and output flows associated with production of diesel including the production of crude oil, crude oil transportation, and diesel fuel refining/energy conversion. All inputs and outputs are normalized per kg of diesel.
2 5/2012
U.S. Gasoline (2005)
This unit process provides a summary of relevant input and output flows associated with production of gasoline including the production of crude oil, crude oil transportation, and gasoline fuel refining/energy conversion. All inputs and outputs are normalized per kg of gasoline.
2 5/2012
Figure C-6: – Assembly: Coal Preparation Facility, Construction – Fourth-Level Plan
Preliminary – Pre-decisional Deliberative Draft C-10

Life Cycle Analysis of Natural Gas Extraction and Power Generation
Table C-5: Assembly: Coal Preparation Facility, Construction
Unit Process Notes Version Creation Date
U.S. Illinois #6 Coal Preparation Facility
Assembly, Construction
This unit process provides a summary of equipment included in the coal preparation facility that is needed to prepare Illinois No. 6 bituminous coal for transport from the underground coal mine to an energy conversion facility. The number of each type of equipment is based on study period, life expectancy estimates, and analyst assumptions. The construction data for individual pieces of equipment, including the loading silo, stockpile stacker, crusher facility, cleaning facility, and wastewater treatment plant, are evaluated in separate unit processes. All inputs and outputs are normalized per 1 kg of Illinois No. 6 bituminous coal.
1 2/2010
Figure C-7: Coal Loading Silo, Construction – Fifth-level Plan
Table C-6: Coal Loading Silo, Construction
Unit Process Notes Version Creation Date
Steel Cold Rolled Coil Third-party data available from PE International. N/A N/A
U.S. Steel Coal-Loading Solo, 325 Tons, Construction
This unit process provides a summary of the amount of steel plate required for the construction of a loading silo, which holds the Illinois No. 6 bituminous coal, releasing it during train loading. The number of silos required for train loading of Illinois No. 6 bituminous coal is evaluated in a separate assembly sheet. All inputs and outputs are normalized pcs of coal-loading silo.
1 1/2010
Preliminary – Pre-decisional Deliberative Draft C-11

Life Cycle Analysis of Natural Gas Extraction and Power Generation
Figure C-8: Stacker Reclaimer, Construction – Fifth-level Plan
Table C-7: Stacker Reclaimer, Construction
Unit Process Notes Version Creation Date
Steel Plate, Manufacture
This unit process provides a summary of relevant input and output flows associated with the manufacturing of steel BF plate. The data represents a world-wide, cradle-to-gate average of type BF plate steel production with 85-percent recovery rate. The unit process is based on the reference flow of 1 kg of steel BF plate.
1 6/2013
U.S. Coal Stockpile Stacker, 450 Tonnes,
Construction
This unit process provides a summary of the amount of steel plate required for the construction of a single coal stockpile stacker, used for the stockpiling of coal at an Illinois No. 6 bituminous coal mine. The number of stockpile stackers required to produce coal is evaluated in a separate assembly sheet. All inputs and outputs are normalized per pcs of coal stockpile stacker.
1 2/2010
Preliminary – Pre-decisional Deliberative Draft C-12

Life Cycle Analysis of Natural Gas Extraction and Power Generation
Figure C-9: Coal Mine Wastewater Treatment Plant, Construction – Fifth-level Plan
Table C-8: Coal Mine Wastewater Treatment Plant, Construction
Unit Process Notes Version Creation Date
Hot-dip Galvanized Third-party data available from PE International. N/A N/A
Copper mix from electrolysis Third-party data available from PE International. N/A N/A
Polyvinylchloride pipe Third-party data available from PE International. N/A N/A
Thermal energy from heavy fuel oil Third-party data available from PE International. N/A N/A
Cast iron part Third-party data available from PE International. N/A N/A
Preliminary – Pre-decisional Deliberative Draft C-13

Life Cycle Analysis of Natural Gas Extraction and Power Generation
Unit Process Notes Version Creation Date
Generic Power Grid Mixer U.S. and N.A.
This unit process provides a summary of relevant input and output flows associated with the average U.S. electricity grid in 2010 accounting for imports from Canada. The inputs include the various generation types in the U.S. A summary of the change in the grid mix for 2010 from 2007 is provided in Table C-23.
1 6/2012
U.S. Concrete, ready mixed, R-5-0 (100% Portland Cement)
This unit process provides a summary of relevant input and output flows associated with the production of ready-mix concrete.
1 6/2013
Wastewater Treatment Plant, Underground Coal
Mine, Construction
This unit process provides a summary of the amount of PVC pipe, stainless steel, galvanized steel, cast iron, copper sheet, and concrete required for the construction of a wastewater treatment plant used at an underground Illinois No. 6 bituminous coal mine. The wastewater treatment plant removes sediment and other pollutants from stormwater generated on site, prior to release to a nearby stream. No wastewater requiring treatment is generated inside the mine. All inputs and outputs are normalized per pcs of wastewater treatment plant, underground coal mine.
1 1/2010
Figure C-10: Coal Cleaning Facility, Construction – Fifth-level Plan
Preliminary – Pre-decisional Deliberative Draft C-14

Life Cycle Analysis of Natural Gas Extraction and Power Generation
Table C-9: Coal Cleaning Facility, Construction
Steel Cold Rolled Coil Third-party data available from PE International. N/A N/A
Stainless Steel Cold Rolled Coil Third-party data available from PE International. N/A N/A
Zinc redistilled mix Third-party data available from PE International. N/A N/A
Rebar wire road, Manufacture
This unit process provides a summary of relevant input and output flows associated with the manufacturing of steel BF rebar wire rod. The data represents a world-wide, cradle-to-gate average of type BF steel rebar production at an 85-percent recovery rate. All inputs and outputs are normalized per kg of steel.
1 6/2013
Generic Power Grid Mixer U.S. and N.A.
This unit process provides a summary of relevant input and output flows associated with the average U.S. electricity grid in 2010 accounting for imports from Canada. The inputs include the various generation types in the U.S. A summary of the change in the grid mix for 2010 from 2007 is provided in Table C-23.
1 6/2012
U.S. Concrete, ready mixed, R-5-0 (100% Portland Cement)
This unit process provides a summary of relevant input and output flows associated with the production of ready-mix concrete.
1 6/2013
Coal Cleaning Facility, Construction
This unit process provides a summary of relevant input flows associated with the construction of a coal cleaning facility. No calculations are made in the development and use of this process. All inputs are normalized per 1 pcs of construction.
N/A N/A
Preliminary – Pre-decisional Deliberative Draft C-15

Life Cycle Analysis of Natural Gas Extraction and Power Generation
Figure C-11: Coal Crusher Facility, Construction – Fifth-level Plan
Table C-10: Coal Crusher Facility, Construction
Unit Process Notes Version Creation Date
Rebar wire road, Manufacture
This unit process provides a summary of relevant input and output flows associated with the manufacturing of steel BF rebar wire rod. The data represents a world-wide, cradle-to-gate average of type BF steel rebar production at an 85-percent recovery rate. All inputs and outputs are normalized per kg of steel.
1 6/2013
U.S. Concrete, ready mixed, R-5-0 (100% Portland Cement)
This unit process provides a summary of relevant input and output flows associated with the production of ready-mix concrete.
1 6/2013
Generic Power Grid Mixer U.S. and N.A.
This unit process provides a summary of relevant input and output flows associated with the average U.S. electricity grid in 2010 accounting for imports from Canada. The inputs include the various generation types in the U.S. A summary of the change in the grid mix for 2010 from 2007 is provided in Table C-23.
1 6/2012
Steel Plate, Manufacture
This unit process provides a summary of relevant input and output flows associated with the manufacturing of steel BF plate. The data represents a world-wide, cradle-to-gate average of type BF plate steel production with 85-percent recovery rate. The unit process is based on the reference flow of 1 kg of steel BF plate.
1 6/2013
Preliminary – Pre-decisional Deliberative Draft C-16

Life Cycle Analysis of Natural Gas Extraction and Power Generation
Unit Process Notes Version Creation Date
Coal Crusher Facility, Construction
This unit process provides a summary of the amount of steel required for the construction of a coal crusher (e.g., 1 piece [pcs] of coal crusher, 254,000 lbs). For the purposes of this analysis, the coal crusher is assumed to be comprised entirely of cold rolled steel, with other materials being negligible. The number of crushers required to produce coal at a surface mine is evaluated in a separate assembly sheet. All inputs and outputs are normalized per pcs of coal crusher.
1 2/2010
Figure C-12: Underground Coal Mine, Construction – Fourth-level Plan
Table C-11: Underground Coal Mine, Construction
Unit Process Notes Version Creation Date
Underground Coal Mine, Construction
This unit process provides a summary of the fraction of each piece of equipment that is needed to mine Illinois No. 6 bituminous coal at an underground longwall mine. The number of each piece of equipment is based on life expectancy, study period, and amount of coal produced. The construction data for individual pieces of equipment, including an individual longwall mining system, continuous miner, conveyor system, and shuttle car, are evaluated in separate unit processes. All inputs and outputs are normalized per 1 kg of Illinois No. 6 bituminous coal).
1 1/2010
Preliminary – Pre-decisional Deliberative Draft C-17

Life Cycle Analysis of Natural Gas Extraction and Power Generation
Figure C-13: Site Paving, Construction – Fifth-level Plan
Table C-12: Site Paving, Construction
Unit Process Notes Version Creation Date
Generic Power Grid Mixer U.S. and N.A.
This unit process provides a summary of relevant input and output flows associated with the average U.S. electricity grid in 2010 accounting for imports from Canada. The inputs include the various generation types in the U.S. A summary of the change in the grid mix for 2010 from 2007 is provided in Table C-23.
1 6/2012
U.S. Concrete, ready mixed, R-5-0 (100% Portland Cement)
This unit process provides a summary of relevant input and output flows associated with the production of ready-mix concrete.
1 6/2013
Asphalt (medium water content) Third-party data available from PE International. N/A N/A
Preliminary – Pre-decisional Deliberative Draft C-18

Life Cycle Analysis of Natural Gas Extraction and Power Generation
Figure C-14: Shuttle Car, Construction – Fifth-level Plan
Table C-13: Shuttle Car, Construction
Unit Process Notes Version Creation Date
Steel Cold Rolled Coil Third-party data available from PE International. N/A N/A
Shuttle Car, Construction
This unit process provides a summary of the amount of steel required for the construction of a shuttle car. The shuttle car is assumed to be comprised entirely of cold rolled steel, with other materials being negligible. All inputs and outputs are normalized per pcs of shuttle car.
N/A N/A
Figure C-15: Conveyer System, Construction – Fifth-level Plan
Preliminary – Pre-decisional Deliberative Draft C-19

Life Cycle Analysis of Natural Gas Extraction and Power Generation
Table C-14: Conveyer System, Construction
Unit Process Notes Version Creation Date
Steel Cold Rolled Coil Third-party data available from PE International. N/A N/A
Hot-dip Galvanized Third-party data available from PE International. N/A N/A
Styrene-Butadiene Rubber Mix Third-party data available from PE International. N/A N/A
Conveyor System, 48 inches, Construction
This unit process provides a summary of the amount of materials (cold-rolled steel, hot-dip galvanized steel, and rubber) required for the construction of a 1.21-m (48 inches) wide conveyor system used to haul coal from an underground longwall mine to a coal stockpile on the surface during the extraction of coal from mines. This unit process encompasses only the materials used in construction of a single conveyor system, including a 48-inch-wide belt, pulleys, and idlers. All inputs and outputs flows are normalized per pcs of conveyor system, 48 inches.
1 1/2010
Figure C-16: Continuous Miner, Construction – Fifth-Level Plan
Table C-15: Continuous Miner, Construction
Unit Process Notes Version Creation Date
Steel Plate, Manufacture
This unit process provides a summary of relevant input and output flows associated with the manufacturing of steel BF plate. The data represents a world-wide, cradle-to-gate average of type BF plate steel production with 85-percent recovery rate. The unit process is based on the reference flow of 1 kg of steel BF plate.
1 6/2013
Preliminary – Pre-decisional Deliberative Draft C-20

Life Cycle Analysis of Natural Gas Extraction and Power Generation
Unit Process Notes Version Creation Date
Continuous Miner, 755 Horsepower, Construction
This unit process provides a summary of the amount of material (steel plate) required for the construction of a 25M Series, 755-HP, underground continuous miner manufactured by Bucyrus International, Inc., used during underground mining of Illinois No. 6 bituminous coal. The continuous miner is used to remove coal from the mine face. This unit process provides construction data only for a single continuous miner manufactured by Bucyrus, Inc. The number of continuous miners required for the mining process is beyond the scope of the unit process and evaluated in a separate assembly unit process. All inputs and outputs are normalized per the reference flow (e.g., per pcs of continuous miner).
1 1/2010
Figure C-17: Longwall Miner System, Construction – Fifth-Level Plan
Table C-16: Longwall Miner System, Construction
Unit Process Notes Version Creation Date
Steel Plate, Manufacture
This unit process provides a summary of relevant input and output flows associated with the manufacturing of steel BF plate. The data represents a world-wide, cradle-to-gate average of type BF plate steel production with 85-percent recovery rate. The unit process is based on the reference flow of 1 kg of steel BF plate.
1 6/2013
Preliminary – Pre-decisional Deliberative Draft C-21

Life Cycle Analysis of Natural Gas Extraction and Power Generation
Unit Process Notes Version Creation Date
Longwall Miner System, Construction
This unit process provides a summary of the fraction of each piece of equipment included in the longwall mining system that is needed to mine coal at an underground mine. The number of each piece of equipment is based on data from representative mines, estimates, and analyst assumptions. The construction data for an individual shearer, shield, head drive, tail drive, stage loader, and line pan are evaluated in separate unit processes. All inputs and outputs are normalized per 1 pcs of Longwall Mining System.
1 1/2010
Figure C-18: I6 Coal Mine, Operation – Fourth-Level Plan
Table C-17: I6 Coal Mine, Operation
Unit Process Notes Version Creation Date
Generic Power Grid Mixer U.S. and N.A.
This unit process provides a summary of relevant input and output flows associated with the average U.S. electricity grid in 2010 accounting for imports from Canada. The inputs include the various generation types in the U.S. A summary of the change in the grid mix for 2010 from 2007 is provided in Table C-23.
1 6/2012
Preliminary – Pre-decisional Deliberative Draft C-22

Life Cycle Analysis of Natural Gas Extraction and Power Generation
Unit Process Notes Version Creation Date
U.S. Diesel, Crude Mix (2005)
This unit process provides a summary of relevant input and output flows associated with production of diesel including the production of crude oil, crude oil transportation, and diesel fuel refining/energy conversion. All inputs and outputs are normalized per kg of diesel.
2 5/2012
Underground Mine, Illinois #6, Bituminous
Coal, Operation
This unit process provides a summary of relevant input and output flows associated with underground mining of Illinois No. 6 bituminous coal. These include: electricity use, diesel fuel use, water use, water discharge, air quality emissions including particulate matter and coal bed methane, and water quality emissions. All inputs and outputs are normalized per the reference flow (e.g., per kg of Illinois No. 6 bituminous coal)
2 4/2013
Figure C-19: Stage #2: Coal Transport, General – Third-Level Plan
Table C-18: Stage #2: Coal Transport, General
Unit Process Notes Version Creation Date
U.S. Coal Rail Transport, Construction and
Operation
This unit process provides a summary of relevant input and output flows associated with the transportation of generic coal to an energy conversion facility. All inputs and outputs are normalized per the reference flow per kg of coal.
1 9/2011
Preliminary – Pre-decisional Deliberative Draft C-23

Life Cycle Analysis of Natural Gas Extraction and Power Generation
Figure C-20: Material Transport Construction – Fourth-Level Plan
Table C-19: Material Transport Construction
Unit Process Notes Version Creation Date
Aluminum sheet mix Third-party data available from PE International. N/A N/A
Steel Plate, Manufacture
This unit process provides a summary of relevant input and output flows associated with the manufacturing of steel BF plate. The data represents a world-wide, cradle-to-gate average of type BF plate steel production with 85-percent recovery rate. The unit process is based on the reference flow of 1 kg of steel BF plate.
1 6/2013
Stainless Steel, 316 2B, 80% Recycled
This unit process provides a summary of relevant input and output flows associated with the manufacturing of stainless steel 316 2B. The data represents a world-wide, cradle-to-gate average of type 316 stainless steel.
1 6/2013
Preliminary – Pre-decisional Deliberative Draft C-24

Life Cycle Analysis of Natural Gas Extraction and Power Generation
Unit Process Notes Version Creation Date
Diesel Locomotive, 4400 Horsepower, Construction
This unit process provides a summary of the amount of steel plate and stainless steel required for the construction of a locomotive (e.g., 1 piece [pcs] of locomotive) used to haul a generic type of coal from the coal mine to the energy conversion facility. The locomotive is assumed to consist entirely of carbon steel (90% by default) and stainless steel (10% by default). The number of locomotives required to transport coal is evaluated in a separate assembly sheet. All inputs and outputs are normalized per pcs of locomotive.
1 12/2009
Coal Railcar, 244000 lb Net Capacity, Construction
This unit process provides a summary of the amount of aluminum and steel required for the construction of a railcar (e.g., 1 piece [pcs] of railcar) needed to haul coal from the coal mine to the power plant. The railcar is assumed to consist entirely of aluminum and steel plate. The number of railcars required to transport coal is evaluated in a separate assembly sheet. All inputs and outputs are normalized per pcs of railcar.
1 12/2009
Coal Unit Train Assembly, 100 Railcars, Construction
This unit process provides a summary of the number of coal unit trains (locomotives and railcars) needed to haul coal from the coal mine (LC Stage #1) to the energy conversion facility (LC Stage #3), over the 30-year study period. This assembly process applies to a generic type of coal, and can be used for any type of coal. The number of trains is based on vehicle life expectancy, study period, weight of the coal to be shipped, and other travel variables. The construction data for individual locomotives and railcars is evaluated in separate unit processes. All inputs and outputs are normalized per 1 pcs of unit train per kg coal transported.
2 1/2012
Figure C-21: Transport of Coal via Train, Operation – Fourth-Level Plan
Preliminary – Pre-decisional Deliberative Draft C-25

Life Cycle Analysis of Natural Gas Extraction and Power Generation
Table C-20: Transport of Coal via Train, Operation
Unit Process Notes Version Creation Date
U.S. Coal, Train Transport
This unit process provides a summary of relevant input and output flows associated with the transport of an unspecified type of prepared coal by train. Flows include diesel input for combustion, amount of coal transported, and airborne emissions. This process can be used regardless of the type of coal being transported or the location in the US where the transport is taking place. For additional documentation, please see the associated DF for this unit process. All inputs and outputs are normalized per kg of cargo.
1 10/2010
U.S. Diesel, Crude Mix (2005)
This unit process provides a summary of relevant input and output flows associated with production of diesel including the production of crude oil, crude oil transportation, and diesel fuel refining/energy conversion. All inputs and outputs are normalized per kg of diesel.
2 5/2012
Preliminary – Pre-decisional Deliberative Draft C-26

Life Cycle Analysis of Natural Gas Extraction and Power Generation
Figure C-22: SCPC Power Plant Construction – Second-level Plan
Table C-21: SCPC Power Plant Construction
Unit Process Notes Version Creation Date
Generic Power Grid Mixer U.S. and N.A.
This unit process provides a summary of relevant input and output flows associated with the average U.S. electricity grid in 2010 accounting for imports from Canada. The inputs include the various generation types in the U.S. A summary of the change in the grid mix for 2010 from 2007 is provided in Table C-23.
1 6/2012
U.S. Concrete, ready mixed, R-5-0 (100% Portland Cement)
This unit process provides a summary of relevant input and output flows associated with the production of ready-mix concrete.
1 6/2013
Steel Pipe, Welded
This unit process provides a summary of relevant input and output flows associated with the manufacturing of steel BF welded pipe. The data represents a world-wide, cradle-to-gate average of type BF steel welded pipe production with an
1 6/2013
Preliminary – Pre-decisional Deliberative Draft C-27

Life Cycle Analysis of Natural Gas Extraction and Power Generation
85 percent recovery rate. The key inputs are raw materials and water. Key outputs are air and water emissions from the manufacturing of steel BF welded pipe such as carbon dioxide, nickel, and ammonia.
Iron, Sand Casted Third-party data available from PE International. N/A N/A
Aluminum Sheet Mix Third-party data available from PE International. N/A N/A
Steel Cold Rolled Coil Third-party data available from PE International. N/A N/A
Stainless Steel, 316 2B, 80% Recycled
This unit process provides a summary of relevant input and output flows associated with the manufacturing of stainless steel 316 2B. The data represents a world-wide, cradle-to-gate average of type 316 stainless steel
1 6/2013
SCPC Power Plant, Construction
This unit process provides a summary of relevant input and output flows associated with the construction of a supercritical pulverized coal (SCPC) power plant. This process can be used for scenarios with and without carbon capture and sequestration (CCS). Key inputs include concrete, steel, steel pipe, stainless steel, aluminum, and cast iron. The key output is one SCPC power plant.
1 9/2011
Figure C-23: Ammonia Production, No CO2 Capture – Second-level Plan
Preliminary – Pre-decisional Deliberative Draft C-28

Life Cycle Analysis of Natural Gas Extraction and Power Generation
Table C-22: Ammonia Production, No CO2 Capture
Unit Process Notes Version Creation Date
Natural Gas RMA/RMT 2010 Average U.S. Mix
This unit process provides a summary of relevant input and output flows associated with the extraction and processing of natural gas and its transportation to an energy conversion facility. All inputs and outputs are normalized per kg of natural gas delivered for the purpose of providing raw material as a feedstock for ammonia production.
2 5/2012
Natural Gas RMA/RMT 2010 Mix
This unit process provides a summary of relevant input and output flows associated with the extraction and processing of natural gas and its transportation to an energy conversion facility. All inputs and outputs are normalized per kg of natural gas delivered for the purpose of providing the energy required for steam production.
2 5/2012
Natural Gas Combustion
This unit process provides a summary of relevant input and output flows associated with the combustion of natural gas in a boiler. The only input to this unit process is natural gas. Air emissions include greenhouse gas emission and criteria air pollutants. All inputs and outputs are normalized per kg of natural gas combustion.
1 9/2010
Ammonia Production, No CO2 Capture
This unit process provides a summary of relevant input and output flows associated with ammonia (NH3) production. This process is modified to render captured CO2 an emission, rather than an intermediate flow.
1 12/2012
Table C-23: Generic U.S. and N.A. Power Grid Mix for 2007 and 20101
Energy Source 2007 2010 Coal 49.8% 45.9%
Petroleum 1.6% 1.0%
Natural Gas 20.3% 22.7%
Nuclear 20.2% 20.4%
Hydro 6.9% 7.3%
Solar 0.02% 0.03%
Geothermal 0.4% 0.4%
Wind 0.9% 2.4% 1 Percentages in table do not add to exactly 100% due to rounding errors.
Preliminary – Pre-decisional Deliberative Draft C-29

This page intentionally left blank.

Life Cycle Analysis of Natural Gas Extraction and Power Generation
Appendix D: Inventory Results in Alternate Units and
Comprehensive LCA Metrics
Tables Table D-1: Upstream Greenhouse Gas Inventory Results for Natural Gas ................................ D-2 Table D-2:Upstream Greenhouse Gas Inventory Results for Marginal Natural Gas ................. D-5 Table D-3: Upstream Greenhouse Gas Inventory Results for Coal ............................................ D-6 Table D-4: Greenhouse Gas Inventory Results for Power Generation ....................................... D-7 Table D-5: Comprehensive LCA Metrics for Natural Gas Power Using the 2010 Domestic
Mix ...................................................................................................................................... D-10
Preliminary – Pre-decisional Deliberative Draft D-1

Life Cycle Analysis of Natural Gas Extraction and Power Generation
Table D-1: Upstream Greenhouse Gas Inventory Results for Natural Gas
Category (Units)
g/MJ lb/MMBtu kg/kg or lb/lb lb/scf
RMA RMT Total RMA RMT Total RMA RMT Total RMA RMT Total
Avg. Gas
CO₂ 2.32E+00 5.63E-01 2.88E+00 5.40E+00 1.31E+00 6.71E+00 1.32E-01 3.20E-02 1.64E-01 5.54E-03 1.34E-03 6.89E-03 N₂O 7.39E-05 5.69E-06 7.96E-05 1.72E-04 1.32E-05 1.85E-04 4.20E-06 3.24E-07 4.53E-06 1.77E-07 1.36E-08 1.90E-07 CH₄ 1.27E-01 9.18E-02 2.19E-01 2.96E-01 2.14E-01 5.10E-01 7.25E-03 5.22E-03 1.25E-02 3.04E-04 2.19E-04 5.24E-04 SF₆ 2.79E-08 1.08E-09 2.90E-08 6.49E-08 2.51E-09 6.74E-08 1.59E-09 6.13E-11 1.65E-09 6.66E-11 2.58E-12 6.92E-11 20 yr CO₂e 1.15E+01 7.18E+00 1.87E+01 2.68E+01 1.67E+01 4.35E+01 6.55E-01 4.08E-01 1.06E+00 2.75E-02 1.71E-02 4.47E-02 100 yr CO₂e 5.53E+00 2.86E+00 8.39E+00 1.29E+01 6.65E+00 1.95E+01 3.14E-01 1.63E-01 4.77E-01 1.32E-02 6.83E-03 2.00E-02 500 yr CO₂e 3.30E+00 1.26E+00 4.56E+00 7.68E+00 2.93E+00 1.06E+01 1.88E-01 7.18E-02 2.60E-01 7.89E-03 3.01E-03 1.09E-02
Conv. Gas
CO₂ 2.33E+00 5.63E-01 2.89E+00 5.42E+00 1.31E+00 6.72E+00 1.32E-01 3.20E-02 1.64E-01 5.56E-03 1.34E-03 6.91E-03 N₂O 7.84E-05 5.69E-06 8.41E-05 1.82E-04 1.32E-05 1.96E-04 4.46E-06 3.24E-07 4.78E-06 1.87E-07 1.36E-08 2.01E-07 CH₄ 1.02E-01 9.18E-02 1.94E-01 2.37E-01 2.14E-01 4.51E-01 5.80E-03 5.22E-03 1.10E-02 2.44E-04 2.19E-04 4.63E-04 SF₆ 2.22E-09 1.08E-09 3.30E-09 5.16E-09 2.51E-09 7.67E-09 1.26E-10 6.13E-11 1.87E-10 5.30E-12 2.58E-12 7.87E-12 20 yr CO₂e 9.70E+00 7.18E+00 1.69E+01 2.26E+01 1.67E+01 3.92E+01 5.51E-01 4.08E-01 9.60E-01 2.32E-02 1.71E-02 4.03E-02 100 yr CO₂e 4.90E+00 2.86E+00 7.76E+00 1.14E+01 6.65E+00 1.81E+01 2.79E-01 1.63E-01 4.41E-01 1.17E-02 6.83E-03 1.85E-02 500 yr CO₂e 3.12E+00 1.26E+00 4.38E+00 7.25E+00 2.93E+00 1.02E+01 1.77E-01 7.18E-02 2.49E-01 7.44E-03 3.01E-03 1.05E-02
UnConv. Gas
CO₂ 2.32E+00 5.63E-01 2.88E+00 5.39E+00 1.31E+00 6.70E+00 1.32E-01 3.20E-02 1.64E-01 5.53E-03 1.34E-03 6.88E-03 N₂O 7.09E-05 5.69E-06 7.66E-05 1.65E-04 1.32E-05 1.78E-04 4.03E-06 3.24E-07 4.36E-06 1.69E-07 1.36E-08 1.83E-07 CH₄ 1.45E-01 9.18E-02 2.36E-01 3.36E-01 2.14E-01 5.50E-01 8.22E-03 5.22E-03 1.34E-02 3.45E-04 2.19E-04 5.65E-04 SF₆ 4.52E-08 1.08E-09 4.63E-08 1.05E-07 2.51E-09 1.08E-07 2.57E-09 6.13E-11 2.63E-09 1.08E-10 2.58E-12 1.11E-10 20 yr CO₂e 1.27E+01 7.18E+00 1.99E+01 2.97E+01 1.67E+01 4.63E+01 7.25E-01 4.08E-01 1.13E+00 3.05E-02 1.71E-02 4.76E-02 100 yr CO₂e 5.95E+00 2.86E+00 8.81E+00 1.38E+01 6.65E+00 2.05E+01 3.39E-01 1.63E-01 5.01E-01 1.42E-02 6.83E-03 2.11E-02 500 yr CO₂e 3.43E+00 1.26E+00 4.69E+00 7.97E+00 2.93E+00 1.09E+01 1.95E-01 7.18E-02 2.67E-01 8.19E-03 3.01E-03 1.12E-02
Onshore Gas
CO₂ 2.40E+00 5.63E-01 2.96E+00 5.58E+00 1.31E+00 6.89E+00 1.36E-01 3.20E-02 1.68E-01 5.73E-03 1.34E-03 7.08E-03 N₂O 6.76E-05 5.69E-06 7.33E-05 1.57E-04 1.32E-05 1.71E-04 3.85E-06 3.24E-07 4.17E-06 1.62E-07 1.36E-08 1.75E-07 CH₄ 1.39E-01 9.18E-02 2.31E-01 3.23E-01 2.14E-01 5.36E-01 7.90E-03 5.22E-03 1.31E-02 3.32E-04 2.19E-04 5.51E-04 SF₆ 3.61E-09 1.08E-09 4.69E-09 8.40E-09 2.51E-09 1.09E-08 2.05E-10 6.13E-11 2.67E-10 8.63E-12 2.58E-12 1.12E-11 20 yr CO₂e 1.24E+01 7.18E+00 1.96E+01 2.89E+01 1.67E+01 4.56E+01 7.06E-01 4.08E-01 1.11E+00 2.97E-02 1.71E-02 4.68E-02 100 yr CO₂e 5.89E+00 2.86E+00 8.75E+00 1.37E+01 6.65E+00 2.04E+01 3.35E-01 1.63E-01 4.98E-01 1.41E-02 6.83E-03 2.09E-02 500 yr CO₂e 3.46E+00 1.26E+00 4.73E+00 8.06E+00 2.93E+00 1.10E+01 1.97E-01 7.18E-02 2.69E-01 8.28E-03 3.01E-03 1.13E-02
Offshore Gas
CO₂ 2.29E+00 5.63E-01 2.85E+00 5.33E+00 1.31E+00 6.64E+00 1.30E-01 3.20E-02 1.62E-01 5.47E-03 1.34E-03 6.82E-03 N₂O 1.08E-04 5.69E-06 1.14E-04 2.51E-04 1.32E-05 2.64E-04 6.13E-06 3.24E-07 6.46E-06 2.58E-07 1.36E-08 2.71E-07 CH₄ 3.49E-02 9.18E-02 1.27E-01 8.11E-02 2.14E-01 2.95E-01 1.98E-03 5.22E-03 7.21E-03 8.33E-05 2.19E-04 3.03E-04 SF₆ 1.14E-10 1.08E-09 1.19E-09 2.66E-10 2.51E-09 2.77E-09 6.50E-12 6.13E-11 6.79E-11 2.73E-13 2.58E-12 2.85E-12 20 yr CO₂e 4.83E+00 7.18E+00 1.20E+01 1.12E+01 1.67E+01 2.79E+01 2.75E-01 4.08E-01 6.83E-01 1.15E-02 1.71E-02 2.87E-02 100 yr CO₂e 3.19E+00 2.86E+00 6.05E+00 7.43E+00 6.65E+00 1.41E+01 1.82E-01 1.63E-01 3.44E-01 7.63E-03 6.83E-03 1.45E-02 500 yr CO₂e 2.57E+00 1.26E+00 3.83E+00 5.98E+00 2.93E+00 8.92E+00 1.46E-01 7.18E-02 2.18E-01 6.14E-03 3.01E-03 9.16E-03
Preliminary – Pre-decisional Deliberative Draft D-2

Life Cycle Analysis of Natural Gas Extraction and Power Generation
Category (Units)
g/MJ lb/MMBtu kg/kg or lb/lb lb/scf
RMA RMT Total RMA RMT Total RMA RMT Total RMA RMT Total
Assoc. Gas
CO₂ 2.16E+00 5.63E-01 2.73E+00 5.03E+00 1.31E+00 6.34E+00 1.23E-01 3.20E-02 1.55E-01 5.17E-03 1.34E-03 6.51E-03 N₂O 5.98E-05 5.69E-06 6.55E-05 1.39E-04 1.32E-05 1.52E-04 3.40E-06 3.24E-07 3.72E-06 1.43E-07 1.36E-08 1.56E-07 CH₄ 1.04E-01 9.18E-02 1.96E-01 2.42E-01 2.14E-01 4.56E-01 5.92E-03 5.22E-03 1.11E-02 2.49E-04 2.19E-04 4.68E-04 SF₆ 1.49E-09 1.08E-09 2.56E-09 3.46E-09 2.51E-09 5.96E-09 8.45E-11 6.13E-11 1.46E-10 3.55E-12 2.58E-12 6.12E-12 20 yr CO₂e 9.67E+00 7.18E+00 1.69E+01 2.25E+01 1.67E+01 3.92E+01 5.50E-01 4.08E-01 9.58E-01 2.31E-02 1.71E-02 4.03E-02 100 yr CO₂e 4.78E+00 2.86E+00 7.64E+00 1.11E+01 6.65E+00 1.78E+01 2.72E-01 1.63E-01 4.35E-01 1.14E-02 6.83E-03 1.83E-02 500 yr CO₂e 2.96E+00 1.26E+00 4.22E+00 6.89E+00 2.93E+00 9.83E+00 1.69E-01 7.18E-02 2.40E-01 7.08E-03 3.01E-03 1.01E-02
Tight Gas
CO₂ 2.26E+00 5.63E-01 2.82E+00 5.25E+00 1.31E+00 6.56E+00 1.28E-01 3.20E-02 1.60E-01 5.40E-03 1.34E-03 6.74E-03 N₂O 6.29E-05 5.69E-06 6.86E-05 1.46E-04 1.32E-05 1.60E-04 3.58E-06 3.24E-07 3.90E-06 1.50E-07 1.36E-08 1.64E-07 CH₄ 1.54E-01 9.18E-02 2.45E-01 3.57E-01 2.14E-01 5.71E-01 8.74E-03 5.22E-03 1.40E-02 3.67E-04 2.19E-04 5.86E-04 SF₆ 2.73E-09 1.08E-09 3.80E-09 6.34E-09 2.51E-09 8.85E-09 1.55E-10 6.13E-11 2.16E-10 6.51E-12 2.58E-12 9.09E-12 20 yr CO₂e 1.33E+01 7.18E+00 2.05E+01 3.10E+01 1.67E+01 4.77E+01 7.59E-01 4.08E-01 1.17E+00 3.19E-02 1.71E-02 4.90E-02 100 yr CO₂e 6.12E+00 2.86E+00 8.98E+00 1.42E+01 6.65E+00 2.09E+01 3.48E-01 1.63E-01 5.11E-01 1.46E-02 6.83E-03 2.14E-02 500 yr CO₂e 3.44E+00 1.26E+00 4.70E+00 7.99E+00 2.93E+00 1.09E+01 1.95E-01 7.18E-02 2.67E-01 8.21E-03 3.01E-03 1.12E-02
Barnett Gas
CO₂ 2.37E+00 5.63E-01 2.93E+00 5.51E+00 1.31E+00 6.82E+00 1.35E-01 3.20E-02 1.67E-01 5.66E-03 1.34E-03 7.01E-03 N₂O 6.99E-05 5.69E-06 7.56E-05 1.63E-04 1.32E-05 1.76E-04 3.98E-06 3.24E-07 4.30E-06 1.67E-07 1.36E-08 1.81E-07 CH₄ 1.50E-01 9.18E-02 2.42E-01 3.49E-01 2.14E-01 5.62E-01 8.53E-03 5.22E-03 1.38E-02 3.58E-04 2.19E-04 5.78E-04 SF₆ 1.21E-07 1.08E-09 1.22E-07 2.81E-07 2.51E-09 2.83E-07 6.87E-09 6.13E-11 6.93E-09 2.88E-10 2.58E-12 2.91E-10 20 yr CO₂e 1.32E+01 7.18E+00 2.04E+01 3.07E+01 1.67E+01 4.74E+01 7.50E-01 4.08E-01 1.16E+00 3.15E-02 1.71E-02 4.86E-02 100 yr CO₂e 6.14E+00 2.86E+00 9.00E+00 1.43E+01 6.65E+00 2.09E+01 3.49E-01 1.63E-01 5.12E-01 1.47E-02 6.83E-03 2.15E-02 500 yr CO₂e 3.52E+00 1.26E+00 4.79E+00 8.20E+00 2.93E+00 1.11E+01 2.00E-01 7.18E-02 2.72E-01 8.42E-03 3.01E-03 1.14E-02
Marcellus Shale
CO₂ 2.43E+00 5.63E-01 2.99E+00 5.65E+00 1.31E+00 6.96E+00 1.38E-01 3.20E-02 1.70E-01 5.81E-03 1.34E-03 7.15E-03 N₂O 1.88E-04 5.69E-06 1.94E-04 4.38E-04 1.32E-05 4.51E-04 1.07E-05 3.24E-07 1.10E-05 4.50E-07 1.36E-08 4.63E-07 CH₄ 1.51E-01 9.18E-02 2.42E-01 3.50E-01 2.14E-01 5.64E-01 8.57E-03 5.22E-03 1.38E-02 3.60E-04 2.19E-04 5.79E-04 SF₆ 1.62E-08 1.08E-09 1.72E-08 3.76E-08 2.51E-09 4.01E-08 9.19E-10 6.13E-11 9.81E-10 3.86E-11 2.58E-12 4.12E-11 20 yr CO₂e 1.33E+01 7.18E+00 2.05E+01 3.10E+01 1.67E+01 4.77E+01 7.58E-01 4.08E-01 1.17E+00 3.18E-02 1.71E-02 4.90E-02 100 yr CO₂e 6.25E+00 2.86E+00 9.11E+00 1.45E+01 6.65E+00 2.12E+01 3.56E-01 1.63E-01 5.18E-01 1.49E-02 6.83E-03 2.18E-02 500 yr CO₂e 3.60E+00 1.26E+00 4.87E+00 8.38E+00 2.93E+00 1.13E+01 2.05E-01 7.18E-02 2.77E-01 8.61E-03 3.01E-03 1.16E-02
Preliminary – Pre-decisional Deliberative Draft D-3

Life Cycle Analysis of Natural Gas Extraction and Power Generation
Category (Units)
g/MJ lb/MMBtu kg/kg or lb/lb lb/scf
RMA RMT Total RMA RMT Total RMA RMT Total RMA RMT Total
Coal bed
CO₂ 2.33E+00 5.63E-01 2.89E+00 5.42E+00 1.31E+00 6.72E+00 1.32E-01 3.20E-02 1.64E-01 5.56E-03 1.34E-03 6.91E-03 N₂O 6.52E-05 5.69E-06 7.09E-05 1.52E-04 1.32E-05 1.65E-04 3.71E-06 3.24E-07 4.03E-06 1.56E-07 1.36E-08 1.69E-07 CH₄ 1.05E-01 9.18E-02 1.97E-01 2.45E-01 2.14E-01 4.58E-01 5.99E-03 5.22E-03 1.12E-02 2.51E-04 2.19E-04 4.71E-04 SF₆ 4.54E-09 1.08E-09 5.62E-09 1.06E-08 2.51E-09 1.31E-08 2.58E-10 6.13E-11 3.20E-10 1.08E-11 2.58E-12 1.34E-11 20 yr CO₂e 9.93E+00 7.18E+00 1.71E+01 2.31E+01 1.67E+01 3.98E+01 5.65E-01 4.08E-01 9.73E-01 2.37E-02 1.71E-02 4.09E-02 100 yr CO₂e 4.98E+00 2.86E+00 7.84E+00 1.16E+01 6.65E+00 1.82E+01 2.83E-01 1.63E-01 4.46E-01 1.19E-02 6.83E-03 1.87E-02 500 yr CO₂e 3.14E+00 1.26E+00 4.40E+00 7.30E+00 2.93E+00 1.02E+01 1.78E-01 7.18E-02 2.50E-01 7.50E-03 3.01E-03 1.05E-02
LNG
CO₂ 1.26E+01 5.63E-01 1.32E+01 2.94E+01 1.31E+00 3.07E+01 7.19E-01 3.20E-02 7.51E-01 3.02E-02 1.34E-03 3.15E-02 N₂O 1.46E-04 5.69E-06 1.51E-04 3.39E-04 1.32E-05 3.52E-04 8.29E-06 3.24E-07 8.61E-06 3.48E-07 1.36E-08 3.62E-07 CH₄ 1.11E-01 9.18E-02 2.03E-01 2.59E-01 2.14E-01 4.72E-01 6.33E-03 5.22E-03 1.16E-02 2.66E-04 2.19E-04 4.85E-04 SF₆ 1.75E-08 1.08E-09 1.85E-08 4.06E-08 2.51E-09 4.31E-08 9.93E-10 6.13E-11 1.05E-09 4.17E-11 2.58E-12 4.43E-11 20 yr CO₂e 2.07E+01 7.18E+00 2.79E+01 4.81E+01 1.67E+01 6.48E+01 1.18E+00 4.08E-01 1.58E+00 4.94E-02 1.71E-02 6.66E-02 100 yr CO₂e 1.55E+01 2.86E+00 1.83E+01 3.60E+01 6.65E+00 4.26E+01 8.79E-01 1.63E-01 1.04E+00 3.69E-02 6.83E-03 4.38E-02 500 yr CO₂e 1.35E+01 1.26E+00 1.48E+01 3.14E+01 2.93E+00 3.43E+01 7.68E-01 7.18E-02 8.40E-01 3.23E-02 3.01E-03 3.53E-02
Preliminary – Pre-decisional Deliberative Draft D-4

Life Cycle Analysis of Natural Gas Extraction and Power Generation
Table D-2:Upstream Greenhouse Gas Inventory Results for Marginal Natural Gas
Category (Units)
g/MJ lb/MMBtu kg/kg or lb/lb lb/scf
RMA RMT Total RMA RMT Total RMA RMT Total RMA RMT Total
Marginal Onshore
CO₂ 2.12E+00 5.63E-01 2.68E+00 4.92E+00 1.31E+00 6.23E+00 1.20E-01 3.20E-02 1.52E-01 5.06E-03 1.34E-03 6.40E-03 N₂O 5.82E-05 5.69E-06 6.39E-05 1.35E-04 1.32E-05 1.49E-04 3.31E-06 3.24E-07 3.64E-06 1.39E-07 1.36E-08 1.53E-07 CH₄ 1.08E-01 9.18E-02 2.00E-01 2.50E-01 2.14E-01 4.64E-01 6.12E-03 5.22E-03 1.13E-02 2.57E-04 2.19E-04 4.77E-04 SF₆ 4.02E-10 1.08E-09 1.48E-09 9.35E-10 2.51E-09 3.44E-09 2.29E-11 6.13E-11 8.42E-11 9.61E-13 2.58E-12 3.54E-12 20 yr CO₂e 9.89E+00 7.18E+00 1.71E+01 2.30E+01 1.67E+01 3.97E+01 5.62E-01 4.08E-01 9.70E-01 2.36E-02 1.71E-02 4.08E-02 100 yr CO₂e 4.83E+00 2.86E+00 7.69E+00 1.12E+01 6.65E+00 1.79E+01 2.74E-01 1.63E-01 4.37E-01 1.15E-02 6.83E-03 1.84E-02 500 yr CO₂e 2.94E+00 1.26E+00 4.20E+00 6.85E+00 2.93E+00 9.78E+00 1.67E-01 7.18E-02 2.39E-01 7.03E-03 3.01E-03 1.00E-02
Marginal Offshore
CO₂ 2.29E+00 5.63E-01 2.85E+00 5.32E+00 1.31E+00 6.63E+00 1.30E-01 3.20E-02 1.62E-01 5.46E-03 1.34E-03 6.80E-03 N₂O 1.08E-04 5.69E-06 1.13E-04 2.50E-04 1.32E-05 2.64E-04 6.12E-06 3.24E-07 6.45E-06 2.57E-07 1.36E-08 2.71E-07 CH₄ 3.44E-02 9.18E-02 1.26E-01 8.01E-02 2.14E-01 2.94E-01 1.96E-03 5.22E-03 7.18E-03 8.22E-05 2.19E-04 3.02E-04 SF₆ 5.19E-11 1.08E-12 5.30E-11 1.21E-10 2.51E-12 1.23E-10 2.95E-12 6.13E-14 3.01E-12 1.24E-13 2.58E-15 1.27E-13 20 yr CO₂e 4.79E+00 7.18E+00 1.20E+01 1.12E+01 1.67E+01 2.78E+01 2.73E-01 4.08E-01 6.81E-01 1.15E-02 1.71E-02 2.86E-02 100 yr CO₂e 3.18E+00 2.86E+00 6.04E+00 7.39E+00 6.65E+00 1.40E+01 1.81E-01 1.63E-01 3.43E-01 7.59E-03 6.83E-03 1.44E-02 500 yr CO₂e 2.56E+00 1.26E+00 3.83E+00 5.96E+00 2.93E+00 8.90E+00 1.46E-01 7.18E-02 2.18E-01 6.12E-03 3.01E-03 9.14E-03
Marginal Associated
CO₂ 2.11E+00 5.63E-01 2.67E+00 4.90E+00 1.31E+00 6.21E+00 1.20E-01 3.20E-02 1.52E-01 5.03E-03 1.34E-03 6.37E-03 N₂O 5.79E-05 5.69E-06 6.36E-05 1.35E-04 1.32E-05 1.48E-04 3.29E-06 3.24E-07 3.62E-06 1.38E-07 1.36E-08 1.52E-07 CH₄ 1.04E-01 9.18E-02 1.96E-01 2.42E-01 2.14E-01 4.55E-01 5.91E-03 5.22E-03 1.11E-02 2.48E-04 2.19E-04 4.67E-04 SF₆ 4.50E-10 1.08E-09 1.53E-09 1.05E-09 2.51E-09 3.56E-09 2.56E-11 6.13E-11 8.70E-11 1.08E-12 2.58E-12 3.65E-12 20 yr CO₂e 9.60E+00 7.18E+00 1.68E+01 2.23E+01 1.67E+01 3.90E+01 5.46E-01 4.08E-01 9.54E-01 2.29E-02 1.71E-02 4.01E-02 100 yr CO₂e 4.72E+00 2.86E+00 7.58E+00 1.10E+01 6.65E+00 1.76E+01 2.68E-01 1.63E-01 4.31E-01 1.13E-02 6.83E-03 1.81E-02 500 yr CO₂e 2.90E+00 1.26E+00 4.17E+00 6.75E+00 2.93E+00 9.69E+00 1.65E-01 7.18E-02 2.37E-01 6.94E-03 3.01E-03 9.95E-03
Preliminary – Pre-decisional Deliberative Draft D-5

Life Cycle Analysis of Natural Gas Extraction and Power Generation
Table D-3: Upstream Greenhouse Gas Inventory Results for Coal
Category (Units)
g/MJ lb/MMBtu kg/kg or lb/lb RMA RMT Total RMA RMT Total RMA RMT Total
Avg. Coal
CO₂ 6.03E-01 5.67E-01 1.17E+00 1.40E+00 1.32E+00 2.72E+00 1.38E-02 1.30E-02 2.69E-02 N₂O 1.78E-04 1.39E-05 1.92E-04 4.14E-04 3.23E-05 4.46E-04 4.09E-06 3.19E-07 4.40E-06 CH₄ 1.44E-01 6.75E-04 1.45E-01 3.35E-01 1.57E-03 3.37E-01 3.31E-03 1.55E-05 3.32E-03 SF₆ 9.23E-08 3.77E-14 9.23E-08 2.15E-07 8.78E-14 2.15E-07 2.12E-09 8.66E-16 2.12E-09 20 yr CO₂e 1.10E+01 6.20E-01 1.17E+01 2.57E+01 1.44E+00 2.71E+01 2.53E-01 1.42E-02 2.67E-01 100 yr CO₂e 4.26E+00 5.88E-01 4.85E+00 9.91E+00 1.37E+00 1.13E+01 9.78E-02 1.35E-02 1.11E-01 500 yr CO₂e 1.73E+00 5.75E-01 2.30E+00 4.02E+00 1.34E+00 5.36E+00 3.97E-02 1.32E-02 5.29E-02
Illinois No. 6 Coal
CO₂ 9.02E-01 4.80E-01 1.38E+00 2.10E+00 1.12E+00 3.21E+00 2.45E-02 1.30E-02 3.75E-02 N₂O 1.66E-05 1.17E-05 2.84E-05 3.87E-05 2.73E-05 6.60E-05 4.51E-07 3.19E-07 7.70E-07 CH₄ 2.81E-01 5.71E-04 2.82E-01 6.54E-01 1.33E-03 6.55E-01 7.62E-03 1.55E-05 7.64E-03 SF₆ 1.75E-07 3.19E-14 1.75E-07 4.08E-07 7.43E-14 4.08E-07 4.76E-09 8.66E-16 4.76E-09 20 yr CO₂e 2.11E+01 5.24E-01 2.17E+01 4.92E+01 1.22E+00 5.04E+01 5.74E-01 1.42E-02 5.88E-01 100 yr CO₂e 7.93E+00 4.98E-01 8.43E+00 1.85E+01 1.16E+00 1.96E+01 2.15E-01 1.35E-02 2.29E-01 500 yr CO₂e 3.05E+00 4.86E-01 3.53E+00 7.08E+00 1.13E+00 8.21E+00 8.26E-02 1.32E-02 9.58E-02
PRB Coal
CO₂ 3.08E-01 6.54E-01 9.62E-01 7.16E-01 1.52E+00 2.24E+00 1.80E-02 9.56E-03 2.75E-02 N₂O 3.37E-04 1.60E-05 3.53E-04 7.85E-04 3.72E-05 8.22E-04 3.31E-07 2.34E-07 5.65E-07 CH₄ 8.98E-03 7.77E-04 9.75E-03 2.09E-02 1.81E-03 2.27E-02 5.60E-03 1.14E-05 5.61E-03 SF₆ 1.03E-08 4.35E-14 1.03E-08 2.39E-08 1.01E-13 2.39E-08 3.49E-09 6.36E-16 3.49E-09 20 yr CO₂e 1.05E+00 7.14E-01 1.77E+00 2.45E+00 1.66E+00 4.11E+00 4.21E-01 1.04E-02 4.32E-01 100 yr CO₂e 6.33E-01 6.78E-01 1.31E+00 1.47E+00 1.58E+00 3.05E+00 1.58E-01 9.91E-03 1.68E-01 500 yr CO₂e 4.28E-01 6.62E-01 1.09E+00 9.95E-01 1.54E+00 2.54E+00 6.07E-02 9.68E-03 7.03E-02
Preliminary – Pre-decisional Deliberative Draft D-6

Life Cycle Analysis of Natural Gas Extraction and Power Generation
Table D-4: Greenhouse Gas Inventory Results for Power Generation
Category (Units)
kg/MWh lb/MWh
RMA RMT ECF T&D Total RMA RMT ECF T&D Total
Coal Illinois No. 6
EXPC
CO₂ 1.03E+01 5.51E+00 1.01E+03 0.00E+00 1.03E+03 2.28E+01 1.21E+01 2.23E+03 0.00E+00 2.27E+03 N₂O 1.91E-04 1.35E-04 0.00E+00 0.00E+00 3.25E-04 4.20E-04 2.97E-04 0.00E+00 0.00E+00 7.17E-04 CH₄ 3.22E+00 6.55E-03 1.14E-02 0.00E+00 3.24E+00 7.10E+00 1.44E-02 2.52E-02 0.00E+00 7.14E+00 SF₆ 2.01E-06 3.66E-13 0.00E+00 1.43E-04 1.45E-04 4.43E-06 8.07E-13 0.00E+00 3.16E-04 3.20E-04 20 yr CO₂e 2.42E+02 6.02E+00 1.01E+03 2.34E+00 1.26E+03 5.35E+02 1.33E+01 2.23E+03 5.15E+00 2.79E+03 100 yr CO₂e 9.10E+01 5.71E+00 1.01E+03 3.27E+00 1.11E+03 2.01E+02 1.26E+01 2.23E+03 7.20E+00 2.45E+03 500 yr CO₂e 3.49E+01 5.58E+00 1.01E+03 4.67E+00 1.06E+03 7.70E+01 1.23E+01 2.23E+03 1.03E+01 2.33E+03
IGCC
CO₂ 8.96E+00 4.77E+00 8.41E+02 0.00E+00 8.55E+02 1.98E+01 1.05E+01 1.85E+03 0.00E+00 1.88E+03 N₂O 1.65E-04 1.17E-04 4.40E-06 0.00E+00 2.86E-04 3.64E-04 2.57E-04 9.69E-06 0.00E+00 6.31E-04 CH₄ 2.79E+00 5.67E-03 2.82E-03 0.00E+00 2.80E+00 6.15E+00 1.25E-02 6.21E-03 0.00E+00 6.17E+00 SF₆ 1.74E-06 3.17E-13 5.17E-10 1.43E-04 1.45E-04 3.84E-06 6.99E-13 1.14E-09 3.16E-04 3.20E-04 20 yr CO₂e 2.10E+02 5.21E+00 8.41E+02 2.34E+00 1.06E+03 4.63E+02 1.15E+01 1.85E+03 5.15E+00 2.33E+03 100 yr CO₂e 7.88E+01 4.95E+00 8.41E+02 3.27E+00 9.28E+02 1.74E+02 1.09E+01 1.85E+03 7.20E+00 2.05E+03 500 yr CO₂e 3.03E+01 4.83E+00 8.41E+02 4.67E+00 8.81E+02 6.67E+01 1.06E+01 1.85E+03 1.03E+01 1.94E+03
SCPC
CO₂ 7.38E+00 3.93E+00 8.64E+02 0.00E+00 8.75E+02 1.63E+01 8.66E+00 1.90E+03 0.00E+00 1.93E+03 N₂O 1.30E-04 9.21E-05 3.15E-05 0.00E+00 2.54E-04 2.88E-04 2.03E-04 6.95E-05 0.00E+00 5.60E-04 CH₄ 2.77E+00 5.62E-03 3.15E-03 0.00E+00 2.77E+00 6.10E+00 1.24E-02 6.95E-03 0.00E+00 6.12E+00 SF₆ 1.73E-06 3.15E-13 4.06E-08 1.43E-04 1.45E-04 3.81E-06 6.94E-13 8.94E-08 3.16E-04 3.20E-04 20 yr CO₂e 2.07E+02 4.36E+00 8.64E+02 2.34E+00 1.08E+03 4.55E+02 9.61E+00 1.90E+03 5.15E+00 2.37E+03 100 yr CO₂e 7.66E+01 4.09E+00 8.64E+02 3.27E+00 9.48E+02 1.69E+02 9.03E+00 1.90E+03 7.20E+00 2.09E+03 500 yr CO₂e 2.85E+01 3.98E+00 8.64E+02 4.67E+00 9.01E+02 6.28E+01 8.78E+00 1.90E+03 1.03E+01 1.99E+03
IGCC w/CCS
CO₂ 1.07E+01 5.70E+00 1.18E+02 0.00E+00 1.34E+02 2.36E+01 1.26E+01 2.60E+02 0.00E+00 2.96E+02 N₂O 1.97E-04 1.39E-04 1.66E-04 0.00E+00 5.02E-04 4.35E-04 3.07E-04 3.66E-04 0.00E+00 1.11E-03 CH₄ 3.33E+00 6.77E-03 3.27E-02 0.00E+00 3.37E+00 7.35E+00 1.49E-02 7.20E-02 0.00E+00 7.44E+00 SF₆ 2.08E-06 3.79E-13 1.73E-06 1.43E-04 1.47E-04 4.59E-06 8.35E-13 3.81E-06 3.16E-04 3.24E-04 20 yr CO₂e 2.51E+02 6.22E+00 1.20E+02 2.34E+00 3.80E+02 5.53E+02 1.37E+01 2.65E+02 5.15E+00 8.37E+02 100 yr CO₂e 9.41E+01 5.91E+00 1.19E+02 3.27E+00 2.22E+02 2.08E+02 1.30E+01 2.62E+02 7.20E+00 4.90E+02 500 yr CO₂e 3.61E+01 5.77E+00 1.18E+02 4.67E+00 1.65E+02 7.97E+01 1.27E+01 2.61E+02 1.03E+01 3.63E+02
SCPC w/CCS
CO₂ 1.02E+01 5.43E+00 1.44E+02 0.00E+00 1.60E+02 2.25E+01 1.20E+01 3.17E+02 0.00E+00 3.52E+02 N₂O 1.80E-04 1.27E-04 3.85E-04 0.00E+00 6.93E-04 3.97E-04 2.81E-04 8.50E-04 0.00E+00 1.53E-03 CH₄ 3.82E+00 7.76E-03 3.20E-02 0.00E+00 3.86E+00 8.43E+00 1.71E-02 7.06E-02 0.00E+00 8.51E+00 SF₆ 2.39E-06 4.35E-13 2.11E-06 1.43E-04 1.48E-04 5.26E-06 9.58E-13 4.65E-06 3.16E-04 3.26E-04 20 yr CO₂e 2.85E+02 6.02E+00 1.46E+02 2.34E+00 4.40E+02 6.29E+02 1.33E+01 3.23E+02 5.15E+00 9.71E+02 100 yr CO₂e 1.06E+02 5.66E+00 1.45E+02 3.27E+00 2.60E+02 2.33E+02 1.25E+01 3.20E+02 7.20E+00 5.73E+02 500 yr CO₂e 3.93E+01 5.50E+00 1.44E+02 4.67E+00 1.94E+02 8.67E+01 1.21E+01 3.18E+02 1.03E+01 4.27E+02
Preliminary – Pre-decisional Deliberative Draft D-7

Life Cycle Analysis of Natural Gas Extraction and Power Generation
Category (Units)
kg/MWh lb/MWh
RMA RMT ECF T&D Total RMA RMT ECF T&D Total
Coal Average Mix
Fleet Baseload
CO₂ 7.09E+00 6.66E+00 1.06E+03 0.00E+00 1.07E+03 1.56E+01 1.47E+01 2.33E+03 0.00E+00 2.36E+03 N₂O 2.09E-03 1.63E-04 1.81E-02 0.00E+00 2.04E-02 4.61E-03 3.59E-04 3.99E-02 0.00E+00 4.49E-02 CH₄ 1.69E+00 7.92E-03 1.21E-02 0.00E+00 1.71E+00 3.73E+00 1.75E-02 2.67E-02 0.00E+00 3.77E+00 SF₆ 1.08E-06 4.43E-13 0.00E+00 1.43E-04 1.44E-04 2.39E-06 9.77E-13 0.00E+00 3.16E-04 3.18E-04 20 yr CO₂e 1.29E+02 7.28E+00 1.06E+03 2.34E+00 1.20E+03 2.85E+02 1.60E+01 2.35E+03 5.15E+00 2.65E+03 100 yr CO₂e 5.00E+01 6.91E+00 1.06E+03 3.27E+00 1.12E+03 1.10E+02 1.52E+01 2.34E+03 7.20E+00 2.48E+03 500 yr CO₂e 2.03E+01 6.75E+00 1.06E+03 4.67E+00 1.09E+03 4.47E+01 1.49E+01 2.34E+03 1.03E+01 2.41E+03
Natural Gas
Average Mix
Fleet Baseload
CO₂ 1.94E+01 4.69E+00 4.14E+02 0.00E+00 4.38E+02 4.27E+01 1.03E+01 9.13E+02 0.00E+00 9.66E+02 N₂O 6.17E-04 4.75E-05 1.11E-03 0.00E+00 1.77E-03 1.36E-03 1.05E-04 2.45E-03 0.00E+00 3.91E-03 CH₄ 1.06E+00 7.66E-01 1.11E-02 0.00E+00 1.84E+00 2.34E+00 1.69E+00 2.44E-02 0.00E+00 4.06E+00 SF₆ 2.33E-07 9.00E-09 0.00E+00 1.43E-04 1.44E-04 5.13E-07 1.98E-08 0.00E+00 3.16E-04 3.17E-04 20 yr CO₂e 9.61E+01 5.98E+01 4.15E+02 2.34E+00 5.73E+02 2.12E+02 1.32E+02 9.15E+02 5.15E+00 1.26E+03 100 yr CO₂e 4.61E+01 2.39E+01 4.15E+02 3.27E+00 4.88E+02 1.02E+02 5.26E+01 9.14E+02 7.20E+00 1.08E+03 500 yr CO₂e 2.75E+01 1.05E+01 4.14E+02 4.67E+00 4.57E+02 6.07E+01 2.32E+01 9.13E+02 1.03E+01 1.01E+03
NGCC
CO₂ 1.94E+01 4.71E+00 3.93E+02 0.00E+00 4.17E+02 4.28E+01 1.04E+01 8.66E+02 0.00E+00 9.19E+02 N₂O 6.19E-04 4.76E-05 1.40E-05 0.00E+00 6.81E-04 1.36E-03 1.05E-04 3.08E-05 0.00E+00 1.50E-03 CH₄ 1.07E+00 7.69E-01 3.23E-04 0.00E+00 1.84E+00 2.35E+00 1.70E+00 7.12E-04 0.00E+00 4.05E+00 SF₆ 2.33E-07 9.03E-09 1.11E-08 1.43E-04 1.44E-04 5.15E-07 1.99E-08 2.45E-08 3.16E-04 3.17E-04 20 yr CO₂e 9.64E+01 6.01E+01 3.93E+02 2.34E+00 5.52E+02 2.13E+02 1.32E+02 8.66E+02 5.15E+00 1.22E+03 100 yr CO₂e 4.63E+01 2.39E+01 3.93E+02 3.27E+00 4.66E+02 1.02E+02 5.28E+01 8.66E+02 7.20E+00 1.03E+03 500 yr CO₂e 2.76E+01 1.06E+01 3.93E+02 4.67E+00 4.36E+02 6.09E+01 2.33E+01 8.66E+02 1.03E+01 9.61E+02
GTSC
CO₂ 3.00E+01 7.27E+00 6.03E+02 0.00E+00 6.41E+02 6.61E+01 1.60E+01 1.33E+03 0.00E+00 1.41E+03 N₂O 9.55E-04 7.35E-05 1.26E-05 0.00E+00 1.04E-03 2.10E-03 1.62E-04 2.79E-05 0.00E+00 2.29E-03 CH₄ 1.65E+00 1.19E+00 6.83E-04 0.00E+00 2.83E+00 3.63E+00 2.61E+00 1.51E-03 0.00E+00 6.24E+00 SF₆ 3.60E-07 1.39E-08 1.82E-08 1.43E-04 1.44E-04 7.94E-07 3.07E-08 4.01E-08 3.16E-04 3.17E-04 20 yr CO₂e 1.49E+02 9.27E+01 6.03E+02 2.34E+00 8.47E+02 3.28E+02 2.04E+02 1.33E+03 5.15E+00 1.87E+03 100 yr CO₂e 7.14E+01 3.69E+01 6.03E+02 3.27E+00 7.15E+02 1.57E+02 8.14E+01 1.33E+03 7.20E+00 1.58E+03 500 yr CO₂e 4.26E+01 1.63E+01 6.03E+02 4.67E+00 6.67E+02 9.40E+01 3.59E+01 1.33E+03 1.03E+01 1.47E+03
NGCC w/CCS
CO₂ 2.28E+01 5.52E+00 5.50E+01 0.00E+00 8.33E+01 5.02E+01 1.22E+01 1.21E+02 0.00E+00 1.84E+02 N₂O 7.25E-04 5.58E-05 9.60E-05 0.00E+00 8.77E-04 1.60E-03 1.23E-04 2.12E-04 0.00E+00 1.93E-03 CH₄ 1.25E+00 9.01E-01 1.39E-02 0.00E+00 2.17E+00 2.76E+00 1.99E+00 3.07E-02 0.00E+00 4.77E+00 SF₆ 2.74E-07 1.06E-08 8.01E-07 1.43E-04 1.44E-04 6.03E-07 2.33E-08 1.77E-06 3.16E-04 3.18E-04 20 yr CO₂e 1.13E+02 7.04E+01 5.60E+01 2.34E+00 2.42E+02 2.49E+02 1.55E+02 1.23E+02 5.15E+00 5.33E+02 100 yr CO₂e 5.43E+01 2.81E+01 5.54E+01 3.27E+00 1.41E+02 1.20E+02 6.19E+01 1.22E+02 7.20E+00 3.11E+02 500 yr CO₂e 3.24E+01 1.24E+01 5.51E+01 4.67E+00 1.05E+02 7.14E+01 2.73E+01 1.21E+02 1.03E+01 2.31E+02
Preliminary – Pre-decisional Deliberative Draft D-8

Life Cycle Analysis of Natural Gas Extraction and Power Generation
Category (Units)
kg/MWh lb/MWh
RMA RMT ECF T&D Total RMA RMT ECF T&D Total
Natural Gas
Conv. Mix
Fleet Baseload
CO₂ 1.94E+01 4.69E+00 4.14E+02 0.00E+00 4.38E+02 4.28E+01 1.03E+01 9.13E+02 0.00E+00 9.66E+02 N₂O 6.54E-04 4.75E-05 1.11E-03 0.00E+00 1.81E-03 1.44E-03 1.05E-04 2.45E-03 0.00E+00 3.99E-03 CH₄ 8.51E-01 7.66E-01 1.11E-02 0.00E+00 1.63E+00 1.88E+00 1.69E+00 2.44E-02 0.00E+00 3.59E+00 SF₆ 1.85E-08 9.00E-09 0.00E+00 1.43E-04 1.43E-04 4.08E-08 1.98E-08 0.00E+00 3.16E-04 3.16E-04 20 yr CO₂e 8.09E+01 5.98E+01 4.15E+02 2.34E+00 5.58E+02 1.78E+02 1.32E+02 9.15E+02 5.15E+00 1.23E+03 100 yr CO₂e 4.09E+01 2.39E+01 4.15E+02 3.27E+00 4.83E+02 9.01E+01 5.26E+01 9.14E+02 7.20E+00 1.06E+03 500 yr CO₂e 2.60E+01 1.05E+01 4.14E+02 4.67E+00 4.55E+02 5.73E+01 2.32E+01 9.13E+02 1.03E+01 1.00E+03
UnConv. Mix
Fleet Baseload
CO₂ 1.93E+01 4.69E+00 4.14E+02 0.00E+00 4.38E+02 4.26E+01 1.03E+01 9.13E+02 0.00E+00 9.66E+02 N₂O 5.91E-04 4.75E-05 1.11E-03 0.00E+00 1.75E-03 1.30E-03 1.05E-04 2.45E-03 0.00E+00 3.85E-03 CH₄ 1.21E+00 7.66E-01 1.11E-02 0.00E+00 1.98E+00 2.66E+00 1.69E+00 2.44E-02 0.00E+00 4.37E+00 SF₆ 0.00E+00 0.00E+00 0.00E+00 1.43E-04 1.43E-04 0.00E+00 0.00E+00 0.00E+00 3.16E-04 3.16E-04 20 yr CO₂e 1.06E+02 5.98E+01 4.15E+02 2.34E+00 5.84E+02 2.34E+02 1.32E+02 9.15E+02 5.15E+00 1.29E+03 100 yr CO₂e 4.96E+01 2.39E+01 4.15E+02 3.27E+00 4.91E+02 1.09E+02 5.26E+01 9.14E+02 7.20E+00 1.08E+03 500 yr CO₂e 2.86E+01 1.05E+01 4.14E+02 4.67E+00 4.58E+02 6.30E+01 2.32E+01 9.13E+02 1.03E+01 1.01E+03
Preliminary – Pre-decisional Deliberative Draft D-9

Life Cycle Analysis of Natural Gas Extraction and Power Generation
Table D-5: Comprehensive LCA Metrics for Natural Gas Power Using the 2010 Domestic Mix Category
(Units) Material or Energy Flow NGCC with 2010 Domestic Average NG NGCC with CCS and 2010 Domestic Average NG
RMA RMT ECF PT Total RMA RMT ECF PT Total
GHG (kg/MWh)
CO₂ 1.94E+01 4.71E+00 3.93E+02 0.00E+00 4.17E+02 2.28E+01 5.52E+00 5.50E+01 0.00E+00 8.33E+01 N₂O 6.19E-04 4.76E-05 1.40E-05 0.00E+00 6.81E-04 7.25E-04 5.58E-05 9.60E-05 0.00E+00 8.77E-04 CH₄ 1.07E+00 7.69E-01 3.23E-04 0.00E+00 1.84E+00 1.25E+00 9.01E-01 1.39E-02 0.00E+00 2.17E+00 SF₆ 2.33E-07 9.03E-09 1.11E-08 1.43E-04 1.44E-04 2.74E-07 1.06E-08 8.01E-07 1.43E-04 1.44E-04 CO₂e (IPCC 2007 100-yr GWP) 4.63E+01 2.39E+01 3.93E+02 3.27E+00 4.66E+02 5.43E+01 2.81E+01 5.54E+01 3.27E+00 1.41E+02
Other Air (kg/MWh)
Pb 1.92E-06 2.49E-06 4.37E-07 0.00E+00 4.85E-06 2.25E-06 2.92E-06 5.94E-07 0.00E+00 5.76E-06 Hg 7.02E-08 6.68E-08 2.46E-08 0.00E+00 1.62E-07 8.23E-08 7.83E-08 7.75E-08 0.00E+00 2.38E-07 NH₃ 4.53E-06 2.05E-06 1.92E-02 0.00E+00 1.92E-02 5.31E-06 2.40E-06 2.28E-02 0.00E+00 2.28E-02 CO 4.33E-02 1.72E-02 2.04E-03 0.00E+00 6.26E-02 5.08E-02 2.01E-02 2.99E-03 0.00E+00 7.39E-02 NOₓ 4.82E-01 1.42E-01 3.09E-02 0.00E+00 6.55E-01 5.64E-01 1.67E-01 3.92E-02 0.00E+00 7.71E-01 SO₂ 5.66E-03 2.51E-03 7.74E-04 0.00E+00 8.95E-03 6.63E-03 2.94E-03 9.40E-03 0.00E+00 1.90E-02 VOC 1.93E-01 4.11E-03 3.42E-05 0.00E+00 1.97E-01 2.26E-01 4.82E-03 1.39E-03 0.00E+00 2.32E-01 PM 2.46E-03 1.31E-03 5.03E-04 0.00E+00 4.27E-03 2.88E-03 1.53E-03 1.01E-03 0.00E+00 5.42E-03
Solid Waste (kg/MWh)
Heavy metals to industrial soil 6.90E-02 1.47E-03 7.43E-04 0.00E+00 7.12E-02 8.09E-02 1.72E-03 8.71E-04 0.00E+00 8.35E-02 Heavy metals to agricultural soil 1.82E-08 6.24E-10 4.23E-09 0.00E+00 2.30E-08 2.13E-08 7.32E-10 4.95E-09 0.00E+00 2.70E-08
Water Use (L/MWh)
Withdrawal 1.89E+02 1.05E+01 1.13E+03 0.00E+00 1.33E+03 2.22E+02 1.23E+01 2.17E+03 0.00E+00 2.40E+03 Discharge 1.98E+02 8.23E-01 3.18E+02 0.00E+00 5.17E+02 2.32E+02 9.65E-01 6.12E+02 0.00E+00 8.45E+02 Consumption -8.71E+00 9.67E+00 8.08E+02 0.00E+00 8.09E+02 -1.02E+01 1.13E+01 1.56E+03 0.00E+00 1.56E+03
Water Quality (kg/MWh)
Aluminum 2.71E-06 7.38E-08 1.09E-07 0.00E+00 2.89E-06 3.18E-06 8.65E-08 1.27E-07 0.00E+00 3.39E-06 Arsenic (+V) 7.82E-06 1.68E-07 8.60E-08 0.00E+00 8.07E-06 9.17E-06 1.97E-07 1.01E-07 0.00E+00 9.46E-06 Copper (+II) 9.39E-06 2.06E-07 1.03E-07 0.00E+00 9.70E-06 1.10E-05 2.42E-07 1.21E-07 0.00E+00 1.14E-05 Iron 1.65E-04 7.10E-05 1.01E-05 0.00E+00 2.46E-04 1.93E-04 8.33E-05 1.19E-05 0.00E+00 2.88E-04 Lead (+II) 2.58E-07 4.33E-07 8.51E-08 0.00E+00 7.76E-07 3.02E-07 5.07E-07 9.98E-08 0.00E+00 9.09E-07 Manganese (+II) 4.61E-02 7.63E-07 1.51E-07 0.00E+00 4.61E-02 5.41E-02 8.94E-07 1.77E-07 0.00E+00 5.41E-02 Nickel (+II) 7.31E-04 1.57E-05 7.92E-06 0.00E+00 7.55E-04 8.57E-04 1.84E-05 9.28E-06 0.00E+00 8.85E-04 Strontium 3.64E-06 8.33E-08 6.86E-09 0.00E+00 3.73E-06 4.27E-06 9.76E-08 8.04E-09 0.00E+00 4.38E-06 Zinc (+II) 9.72E-05 2.22E-06 1.14E-06 0.00E+00 1.01E-04 1.14E-04 2.60E-06 1.34E-06 0.00E+00 1.18E-04 Ammonium/ammonia 1.71E-03 4.42E-05 2.42E-05 0.00E+00 1.77E-03 2.00E-03 5.18E-05 2.83E-05 0.00E+00 2.08E-03 Hydrogen chloride 3.13E-11 2.76E-12 4.24E-12 0.00E+00 3.83E-11 3.67E-11 3.23E-12 4.97E-12 0.00E+00 4.49E-11 Nitrogen (as total N) 3.01E-03 4.11E-07 9.93E-07 0.00E+00 3.01E-03 3.52E-03 4.82E-07 1.16E-06 0.00E+00 3.53E-03 Phosphate 1.69E-03 3.60E-05 1.83E-05 0.00E+00 1.74E-03 1.98E-03 4.22E-05 2.15E-05 0.00E+00 2.04E-03 Phosphorus 3.13E-11 2.76E-12 4.24E-12 0.00E+00 3.83E-11 3.67E-11 3.23E-12 4.97E-12 0.00E+00 4.49E-11
Resource Energy
(MJ/MWh)
Crude oil 5.52E+00 6.34E+00 8.16E+00 0.00E+00 2.00E+01 6.47E+00 7.43E+00 1.18E+01 0.00E+00 2.57E+01 Hard coal 1.38E+01 6.34E+00 2.22E+01 0.00E+00 4.23E+01 1.62E+01 7.43E+00 5.30E+01 0.00E+00 7.66E+01 Lignite 3.05E-03 4.61E+01 1.08E-02 0.00E+00 4.61E+01 3.58E-03 5.40E+01 2.07E-02 0.00E+00 5.40E+01 Natural gas 4.61E+01 3.52E-02 6.36E+03 0.00E+00 6.40E+03 5.40E+01 4.13E-02 7.45E+03 0.00E+00 7.51E+03 Uranium 3.52E-02 0.00E+00 6.40E-02 0.00E+00 9.92E-02 4.13E-02 0.00E+00 8.85E-02 0.00E+00 1.30E-01 Total resource energy 6.54E+01 5.88E+01 6.39E+03 0.00E+00 6.51E+03 7.67E+01 6.89E+01 7.52E+03 0.00E+00 7.66E+03
Energy Return on Investment N/A N/A N/A N/A 0.55 N/A N/A N/A N/A 0.47
Preliminary – Pre-decisional Deliberative Draft D-10

Life Cycle Analysis of Natural Gas Extraction and Power Generation
Category (Units)
Material or Energy Flow GTSC with 2010 Domestic Average NG Fleet Baseload Power 2010 Domestic Average NG RMA RMT ECF PT Total RMA RMT ECF PT Total
GHG (kg/MWh)
CO₂ 3.00E+01 7.27E+00 6.03E+02 0.00E+00 6.41E+02 1.94E+01 4.69E+00 4.14E+02 0.00E+00 4.38E+02 N₂O 9.55E-04 7.35E-05 1.26E-05 0.00E+00 1.04E-03 6.17E-04 4.75E-05 1.11E-03 0.00E+00 1.77E-03 CH₄ 1.65E+00 1.19E+00 6.83E-04 0.00E+00 2.83E+00 1.06E+00 7.66E-01 1.11E-02 0.00E+00 1.84E+00 SF₆ 3.60E-07 1.39E-08 1.82E-08 1.43E-04 1.44E-04 2.33E-07 9.00E-09 0.00E+00 1.43E-04 1.44E-04 CO₂e (IPCC 2007 100-yr GWP) 7.14E+01 3.69E+01 6.03E+02 3.27E+00 7.15E+02 4.61E+01 2.39E+01 4.15E+02 3.27E+00 4.88E+02
Other Air (kg/MWh)
Pb 2.95E-06 3.84E-06 7.33E-06 0.00E+00 1.41E-05 1.91E-06 2.48E-06 4.37E-07 0.00E+00 4.83E-06 Hg 1.08E-07 1.03E-07 1.07E-08 0.00E+00 2.22E-07 6.99E-08 6.65E-08 2.46E-08 0.00E+00 1.61E-07 NH₃ 6.99E-06 3.15E-06 2.90E-02 0.00E+00 2.90E-02 4.52E-06 2.04E-06 1.92E-02 0.00E+00 1.92E-02 CO 6.68E-02 2.65E-02 5.00E-03 0.00E+00 8.14E-02 4.32E-02 1.71E-02 2.04E-03 0.00E+00 5.15E-02 NOₓ 7.42E-01 2.19E-01 4.93E-02 0.00E+00 7.94E-01 4.80E-01 1.42E-01 9.33E-02 0.00E+00 5.75E-01 SO₂ 8.72E-03 3.87E-03 1.35E-03 0.00E+00 1.39E-02 5.64E-03 2.50E-03 2.84E-03 0.00E+00 1.10E-02 VOC 2.97E-01 6.33E-03 4.49E-04 0.00E+00 2.97E-01 1.92E-01 4.09E-03 3.42E-05 0.00E+00 1.92E-01 PM 3.79E-03 2.01E-03 1.17E-03 0.00E+00 6.62E-03 2.45E-03 1.30E-03 5.03E-04 0.00E+00 4.03E-03
Solid Waste (kg/MWh)
Heavy metals to industrial soil 1.06E-01 2.26E-03 2.75E-02 0.00E+00 1.36E-01 6.87E-02 1.46E-03 0.00E+00 0.00E+00 7.02E-02 Heavy metals to agricultural soil 2.80E-08 9.62E-10 1.33E-07 0.00E+00 1.62E-07 1.81E-08 6.22E-10 0.00E+00 0.00E+00 1.87E-08
Water Use (L/MWh)
Withdrawal 2.92E+02 1.62E+01 0.00E+00 0.00E+00 3.08E+02 1.89E+02 1.04E+01 6.62E+02 0.00E+00 8.61E+02 Discharge 3.05E+02 1.27E+00 0.00E+00 0.00E+00 3.06E+02 1.97E+02 8.20E-01 1.59E+02 0.00E+00 3.57E+02 Consumption -1.34E+01 1.49E+01 0.00E+00 0.00E+00 1.48E+00 -8.67E+00 9.63E+00 5.03E+02 0.00E+00 5.04E+02
Water Quality (kg/MWh)
Aluminum 4.18E-06 1.14E-07 2.05E-06 0.00E+00 6.34E-06 2.70E-06 7.35E-08 0.00E+00 0.00E+00 2.77E-06 Arsenic (+V) 1.20E-05 2.59E-07 3.15E-06 0.00E+00 1.55E-05 7.79E-06 1.68E-07 0.00E+00 0.00E+00 7.96E-06 Copper (+II) 1.45E-05 3.18E-07 3.83E-06 0.00E+00 1.86E-05 9.35E-06 2.05E-07 0.00E+00 0.00E+00 9.56E-06 Iron 2.54E-04 1.09E-04 2.49E-04 0.00E+00 6.13E-04 1.64E-04 7.08E-05 0.00E+00 0.00E+00 2.35E-04 Lead (+II) 3.97E-07 6.67E-07 8.98E-07 0.00E+00 1.96E-06 2.57E-07 4.31E-07 0.00E+00 0.00E+00 6.88E-07 Manganese (+II) 7.11E-02 1.18E-06 2.24E-02 0.00E+00 9.34E-02 4.60E-02 7.60E-07 0.00E+00 0.00E+00 4.60E-02 Nickel (+II) 1.13E-03 2.42E-05 2.92E-04 0.00E+00 1.44E-03 7.28E-04 1.56E-05 0.00E+00 0.00E+00 7.44E-04 Strontium 5.61E-06 1.28E-07 2.41E-06 0.00E+00 8.15E-06 3.63E-06 8.30E-08 0.00E+00 0.00E+00 3.71E-06 Zinc (+II) 1.50E-04 3.42E-06 3.93E-05 0.00E+00 1.92E-04 9.68E-05 2.21E-06 0.00E+00 0.00E+00 9.91E-05 Ammonium/ammonia 2.63E-03 6.81E-05 7.54E-04 0.00E+00 3.45E-03 1.70E-03 4.40E-05 0.00E+00 0.00E+00 1.74E-03 Hydrogen chloride 4.82E-11 4.24E-12 6.91E-11 0.00E+00 1.22E-10 3.12E-11 2.74E-12 0.00E+00 0.00E+00 3.39E-11 Nitrogen (as total N) 4.63E-03 6.33E-07 1.33E-03 0.00E+00 5.97E-03 2.99E-03 4.09E-07 0.00E+00 0.00E+00 3.00E-03 Phosphate 2.60E-03 5.54E-05 6.76E-04 0.00E+00 3.33E-03 1.68E-03 3.58E-05 0.00E+00 0.00E+00 1.72E-03 Phosphorus 4.82E-11 4.24E-12 6.91E-11 0.00E+00 1.22E-10 3.12E-11 2.74E-12 0.00E+00 0.00E+00 3.39E-11
Resource Energy
(MJ/MWh)
Crude oil 5.52E+00 6.34E+00 1.27E+01 0.00E+00 2.45E+01 6.47E+00 7.43E+00 7.63E+00 0.00E+00 2.15E+01 Hard coal 1.38E+01 6.34E+00 3.46E+01 0.00E+00 5.47E+01 1.62E+01 7.43E+00 2.00E+01 0.00E+00 4.36E+01 Lignite 3.05E-03 4.61E+01 9.80E-02 0.00E+00 4.62E+01 3.58E-03 5.40E+01 3.39E-03 0.00E+00 5.40E+01 Natural gas 4.61E+01 3.52E-02 1.11E+04 0.00E+00 1.11E+04 5.40E+01 4.13E-02 7.17E+03 0.00E+00 7.22E+03 Uranium 3.52E-02 0.00E+00 2.54E-01 0.00E+00 2.90E-01 4.13E-02 0.00E+00 4.00E-02 0.00E+00 8.13E-02 Total resource energy 6.54E+01 5.88E+01 1.11E+04 0.00E+00 1.13E+04 7.67E+01 6.89E+01 7.19E+03 0.00E+00 7.34E+03
Energy Return on Investment N/A N/A N/A N/A 0.32 N/A N/A N/A N/A 0.49
Preliminary – Pre-decisional Deliberative Draft D-11

www.netl.doe.gov
Pittsburgh, PA • Morgantown, WV • Albany, OR • Sugar Land, TX • Anchorage, AK
(800) 553-7681
Timothy J. Skone, P.E. [email protected]
Joe Marriott, Ph.D. [email protected]
Related Documents