4 GEOLOGICAL, GEOPHYSICAL, AND THERMAL CHARACTERISTICS OF THE SALTON SEA GEOTHERMAL FIELD, CALIFORNIA L. W. Younker P. W. Kasameyer J. D. Tewhey This paper was prepared for submittal to tne Journal of Volcanology and Geothermal Research. June 18, 1981 This is a preprint of I paper intended for publication in a Journal or proceedlnEs. Since channes mav be made before Dubliatbn. thb DreDrint is made avrilable with the un- - .. dentmndhg that it will not be cited or reproduced without the prmisaion of the author. 1 1 c

Welcome message from author
This document is posted to help you gain knowledge. Please leave a comment to let me know what you think about it! Share it to your friends and learn new things together.
Transcript
4
GEOLOGICAL, GEOPHYSICAL, AND THERMAL CHARACTERISTICS OF THE SALTON SEA
GEOTHERMAL FIELD, CALIFORNIA
L. W . Younker P. W . Kasameyer
J. D. Tewhey
Th is paper was prepared f o r submi t ta l t o t n e Journal of Volcanology and Geothermal Research.
June 18, 1981
This is a preprint of I paper intended for publication in a Journal or proceedlnEs. Since channes mav be made before Dubliatbn. thb DreDrint is made avrilable with the un- - . . dentmndhg that it will not be cited or reproduced without the prmisaion of the author.
1
1
c

DISCLAIMER
This document was prepared as an account of work sponsored by an agency of the United States Government. Neither the United States Government nor the University of California nor any of their employees, makes any warranty, express or implied, or assumes any legal liability or responsibility for the accuracy, completeness, or usefulness of any information, apparatus, product, or process disclosed, or represents that its use would not infringe privately owned rights. Reference herein to any specific commercial products, process, or service by trade name, trademark, manufacturer, or otherwise, does not necessarily constitute or imply its endorsement recommendation, or favoring of the United States Government or the University of California. The views and opinions of authors expressed herein do not necessarily state or reflect those of the United States Government or the University of California, and shall not be used for advertising or product endorsement purposes.
I
1
8
GEOLOGICAL, GEOPHYSICAL , AND THERMAL CHARACTERISTICS OF THE SALTON SEA GEOTHERMAL FIELD, CALIFOKNIA
LELAND W. YOUNKER, PAUL W. KASAMEYER and JOHN D. TEWHEY
Earth Sciences Division, University of California, Lawrence Livermore National
Laboratory, Livermore, CA 94550 (U.S.A.)
ABSTRACT
Younker, L.W., Kasameyer, P.W. and Tewhey, J.D., 1981. Geological,
geophysical, and thermal characteristics o f the Salton Sea Geothermal Field,
California. J. Volcanol. Geotherm. Res.,
.
I
The Salton Sea Geothermal Field is the largest water-dominated geothermal
field in the Salton Trough in Southern California. Within the trough, local
zones of extension among active right-stepping right-lateral strike-slip
faults allow mantle-derived magmas to intrude the sedimentary sequence. The
intrusions serves as heat sources to drive hydrothermal systems.
We can characterize the field in detail because we have an extensive
geological and geophysical data base. The sediments are relatively undeformed
and can be divided into three categories as a function o f depth: (1)
low-permeabi lity cap rock, ( 2 ) upper reservoir rocks consisting o f sandstones,
siltstones, and shales that were subject to minor alterations, and ( 3 ) lower
reservoir rocks that were extensively altered. Because of the alteration,
E, 2
intergranular porosity and permeability are reduced with depth.
permeability is enhanced by renewable fractures, i.e., fractures that can be
reactivated by faulting or natural hydraulic fracturing subsequent to being
sealed by mineral deposition.
Field
In the central portion of the field, temperature gradients are high near
the surface and lower below 700 m. Surface gradients in this elliptically
shaped region are fairly constant and define a thermal cap, which does not
neccessarily correspond to the lithologic cap.
narrow transition region, with a low near-surface gradient and an increasing
gradient at greater depths, separates the high temperature resource from areas
of normal regional gradient.
that vertical convective motion in the reservoir beneath the thermal cap is
confined to small units, and small-scale convection is superimposed on
large-scale lateral flow o f pore fluid.
At the margin of the field, a
Geophysical and geochemical evidence suggest
Interpretation of magnetic, resistivity, and gravity anomalies help to
establish the relationship between the inferred heat source, the hydrothermal
system, and the observed alteration patterns. A simple hydrothermal model is
supported by interpreting the combined geological, geophysical, and thermal
data.
spreading of hot water in a reservoir beneath an impermeable cap rock.
In the model, heat is transfered from an area of intrusion by lateral
INTRODUCTION
The Salton Sea Geothermal Field is one of several water-dominated
geothermal fields in the Salton Trough, a sediment-filled rift valley that
represents the landward extension of the Gulf of California into North
America. The area has been the subject of intensive geologic investigation
3
.
for several reasons.
in the transition from the divergent plate boundary of the East Pacific Rise
to the transform boundary of the San Andreas fault system (Elders et al.,
1972; Lomnitz et al., 1970; Elders and Biehler, 1975). Hot brines are present
at depth in the field making the area ideally suited for the study of active
hydrothermal alteration and ore deposition (Helgeson, 1968; Muffler and White,
It is a seismically active region and a significant link
1969; Skinner et al., 1967). Fina
of the largest and most accessible
(Towse, 1975; Renner et al., 1975;
Lee, 1977; Younker and Kasameyer,
ly from a more applied viewpoint, it is one
geothermal resource areas in North America
Nathenson and Muffler, 1975; Biehler and
978). With detailed understanding, this
region can be exploited efficiently.
Our purpose is to characterize the thermal anomaly and show its
relationship to the geological and geophysical features of the field.
first section we review the geological characteristics of the field.
description is based largely on information from logs of 16 geothermal wells
and from drill cuttings and core samples from 3 wells (Tewhey, 1977).
information is broadly consistent with other recent descriptions of the field
(McDowell and Elders, 1979). In the second section we briefly review the
geophysical characteristics o f the field, with emphasis on aspects relating to
the nature of the heat source. In the final section we analyze in detail the
subsurface temperatures and the surface gradient data to infer the mechanisms
of heat transfer throughout the system.
from these three sets of observations and arrive at an overview of the
geothermal system.
neat-transfer model consistent with these characteristics and the overall
tectonic setting.
In the
This
The
We then symmarize the information
In a future paper we will present a quantitative
4
THE GEOLOGIC CHARACTERISTICS OF THE SALTON SEA GEOTHERMAL FIELD
Geoloaic settina
The Salton Trough is the northern portion of a structural and topographic
basin extending from southern California to the southern end of the Gulf of
California. From its origin in the Miocene (Dibblee, 1954; Hamilton, 1961)
unti 1 mid-Pleistocene (Downs and Woodward, 1961), the trough received
sediments from the Colorado River.
period when the sea level was low, the Colorado River delta was built westward
across the trough from Yuma, Arizona.
this time and the northern portion of the basin, i.e., the Salton Trough, was
topographically separated from the Gulf of California. The Salton Sea
represents the latest in a long sequence of inland seas that have occupied the
trough since the Pleistocene (Van De Kamp, 1973).
In mid-Pleistocene, possibly during a
Deltaic sediments accumulated during
Geological (Dibblee, 1954) and geophysical evidence (Biehler et al., 1964)
shows that the sequence of sedimentary rocks in the Salton Trough is
approximately 6000 m thick.
sedimentary rocks along the margins of the trough and examination of cuttings
from the 4097-m Wilson No. 1 well near Brawley, the 6000-m sequence is
composed largely of detritus from the Colorado River.
contributions appear to have come from the Chocolate Mountains and Peninsular
ranges bordering the trough on the east and west (Muffler and White, 1969).
The unaltered deltaic sediments in the Salton Trough have a rather uniform
composition consisting predominantly of quartz and calcite and subordinately
of dolomite, feldspar, clay minerals, mica, and accessory minerals.
Based on results of field work in the folded
Only minor
5
The present description of reservoir geology is based on information in
logs from 16 geothermal wells and drill cutting and core samples from 3 wells
(Tewhey, 1977). The wells from which samples were obtained are located in the
west-central portion of the Salton Sea Geothermal Field, i.e., Magmarnax Nos. 2
and 3 and Woolsey No. 1 (Fig. 1). The three wells are 1331, 1219, and 1064 m
deep, respectively. The cutting samples were examined microscopically and
specific samples were selected for petrographic, x-ray diffraction, and
microprobe analyses. The petrographic analyses and porosity measurements were
done on core samples.
sedimentary sequence in the study area from the surface to below 1300 m that
can be divided into three categories: (1) cap rock, (2) upper, slightly
altered, reservoir rocks, and ( 3 ) lower, extensively altered, reservoir
rocks. This is shown in Fig. 2.
The drill cutting samples yielded evidence o f a
Sedimentarv seauence
The cap rock
The cap rock of a geothermal system is the thick layer of low permeability
It can serve both as a rock that overlies the more permeable reservoir rocks.
barrier for circulating convection currents and as a thermal insulator,
thereby contributing to the increase in temperature in the geothermal system.
In the Salton Sea Geothermal Field, the cap rock thickness is variable
and, generally,is thickest ($700 m) in the northern portion o f the field and
thinnest ($250 m) in the southern portion (Randall, 1974).
analysis of geophysical data from logs and observation of cutting samples near
Based on

6
the blagmamax wells, the cap rock is 340 to 370 m thick (Fig. 2 ) .
layers are present in the cap. The material in the upper 200 m consists of
unconsolidated clay, silt, sand, and gravel. The material from 200 m to the
bottom of the cap rock sequence consists primarily of anhydrite-rich evaporite
layers, often in a carbonate matrix. The evaporite layers are consolidated
and not friable, and the interlocking textures of anhydrite and carbonate
grains indicate low permeability. Gypsum commonly precipitates from sea
water. However, its stability field is limited to environments near the
surface, because during burial and diagenesis, gypsum is dehydrated and
converted to anhydrite (Berner, 1971). The relatively thick sequence of
evaporite-rich deposits that make up the cap rock are indicative of the long
sequence of intermittent Salton Seas that existed in the basin since its
isolation from the Gulf of California.
Two distinct
Facca and Tonani (1967) have shown empirically that hot water circulating
in a hydrothermal system can produce alteration and deposition along flow
paths in the cap rock and, thereby, reduce permeability. In this manner, a
geothermal system can be self-sealing by producing or restoring its own cap
rock.
and Simmons (1976), who examined samples of cap rock from the Dunes area of
the Salton Trough using tne scanning electron microscope. They interpreted
minute veinlets and fluid inclusion trains as microcracks that were healed by
minerals precipitating from circulating fluids. There is evidence to suggest
that crack production and subsequent sealing are not limited to the cap rock
but occur in reservoir rocks at the Salton Sea field as well. This will be
discussed in a later section.
Direct evidence of the self-sealing phenomenon was provided by Batzle
8
7
b
. 0
Umer reservoir rock
Technically, there are no unaltered sediments in the cuttings examined for
this study. Thermal springs at the surface indicate that hot brines
penetrated and permeated the entire sedimentary section.
brine-induced alterations in the uppermost reservoir rocks are principally
silicification and clay mineral reactions. An example of the latter is that
kaolinite and montmorillonite are transformed to chlorite or illite (Muffler
and White, 1969).
The effects of
With the exception of pyrite mineralization, the rock alteration above
800 m in the Magmamax wells and above 1000 m in the Woolsey well is detectable
only by means of careful x-ray diffraction analysis or detailed petrographic
studies. These secondary alterations did not result in marked changes in the
(e.g., porosity and permeability) of the reservoir petrophysical properties
rocks.
The sharp transition
interpreted as represent
between reservoir rocks and
ng the boundary between mar
the overlying cap rock is
ne sediments (reservoir
rock) deposited in the Gulf of California and lacustrine sediments (cap rock)
deposited in the Salton Trough after it was isolated from the southern portion
of the basin in the mid-Pleistocene. Dibblee (1954) and Dutcher et al. (1972)
consider the entire Miocene-Pleistocene section in the Salton Trough as a
conformable sequence.
In the Maymamax Nos. 2 and 3 wells, the zone of slightly altered reservoir
rocks is approximately 480 m thick, extending from a depth of 340 m to nearly
820 m. In Woolsey No. 1 , the zone is 660 m thick, from 340 to 1000 m. The
thickness of this zone increases to the east and, to a lesser extent, to the

8
north and is related to the heat distribution in the geothermal field.
slightly altered sequence in the Magmamax and Woolsey wells consists of
indurated sandstones, siltstones, shales, and a few thin coal seams.
sandstone contains subangular clastic grains of quartz with minor feldspar,
mica, chlorite, and lithic fragments. The rocks exhibit varying degrees of
calcite cementation and intergranular porosity ranging from 10 to 30%.
The
The
The first appearance o f epidote in reservoir rocks is used to mark the
transition to high-rank alteration.
temperature dependent and corresponds approximately to the present-day 28OOC
i so therm.
The epidote producing reaction is
Hvdrothermallv altered reservoir rocks
The mineralogical and textural changes in deep-seated rocks in the Salton
Sea Geothermal Field can be attributed to hydrothermal alteration in an open
system with a large mass-transfer of chemical constituents. The important
variables seem to have been permeability, temperature, brine composition, and
original rock composition.
wells ( e - 3OO0C), sandstones, and siltstones were appreciably altered, but
At the temperatures characteristic o f the Magmamax
the less permeable shales were relatively little affected. Heat-induced
metamorphism occurs in shales in the deeper portions o f the reservoir.
The hydrothermally altered deltaic sediments that constitute the
reservoir rocks can be described chemically by the complex system
K20-Na20-Ca0-Mg0-Fe0-Fe203-A1203-Si02-C02-H20-S. To interpret the
observed mineral assemblages, as well as those that might be encountered at
depth, it is necessary to reduce the complex system to the simple well-studied
9
Subsystem of Ca0-M 0 -Si0 -CO -H 0. The isobaric phase relations at
2 kb in the subsystem as a function of temperature and mole fraction C02 are
depicted in Fig. 3.
2 3 2 2 2
Calcite is a principal component of upper, slightly altered, reservoir
rocks and epidote is common in the lower rocks. The gradual disappearance of
calcite with depth coincides with the development of epidote as an alteration
product. The mineralogical observations and the presence of abundant CO at .. 2 shallow depths in the geothermal field can be accounted for by the evolution
of C02 through the reaction,
calcite + 3 anorthite (plagioclase feldspar) + water e 2 zoisite (Fe-free epidote) + carbon dioxide.
The slope o f the univariant line representing this reaction (Fig. 3 ) is near
infinity, thus, the sign of dT/dX is difficult to determine
experimentally. If dT/dX is positive, the transition from calcite to
zoisite (epidote) will occur as the temperature increases.
c02
c02 , If the sign of
dT/dX
pressure dependent. Therefore, if the sign of dT/dX is either positive
or negative, a mechanism exists for the transition of epidote to calcite as
the depth increases.
is negative, the calcite to zoisite transition will be largely c02
Grossularite-andradite garnet has been found in cuttings from the deepest
wells in the Salton Sea field (Kendall, 1976; McDowell and McCurry, 1977);
garnet therefore, the reaction path shown in Fig. 3 can be extended into the
field by the reaction
4 zoisite (Fe-free epidote) + quartz e grossularite (garnet)
+ 5 anorthite + 2 water.
The nature of the transition from slightly altered to more extens
altered rocks in the Salton Sea field was determined by petrographic, vely
x-ray

10
diffraction, and election microprobe analyses. Both the chemical
(mineralogical) and physical changes that result from alteration were
studied. Epidote is first seen at 811 m in Magmamax 2, at 826 m in Magmamax 3
and at 1006 m in Woolsey 1.
epidote at 1052 m in IID No. 1 well and 1167 m in Sportsman No. 1 well.
Although the data base is scanty, the contours of the epidote isograd, i.e.,
the first appearance of epidote, are concentric with the heat axis as defined
by Randall (1974) and the pattern of subsurface isotherms as determined by
Palmer (1975).
Muffler and White (1969) report first seeing
High-rank hydrothermal alteration of the reservoir rocks in the Salton Sea
Geothermal Field has reduced porosity and permeability. Epidote and silica
are the principal pore filling minerals produced during high temperature
alteration. They replace calcite and anhydrite, the cementing agents produced
during diagenesis.
and Tonani, 1967), discussed earlier, is beneficial when it creates an
impermeable cap rock over a shallow geothermal reservoir, but it can be
detrimental when it reduces porosity and permeability in reservoir rocks.
The process of the self-sealing geothermal field (Facca
Porosity was determined on core samples from geothermal wells at the
Salton Sea (see Fig. 4), and a reduction of porosity was noted with depth.
This is common in sedimentary basins and is enhanced in the Salton Sea
Geothermal Field by hydrothermal alteration.
In the area studied, data from geophysical logs and drill cores indicate
that the reservoir strata dip westward toward the center of the geothermal
resource at approximately 10 degrees.
porosity gradient, the dipping strata become less porous and less permeable
from the periphery of the field toward the center of the heat axis (Fig. 2).
In the presence of the vertical

11
Significance of fracture porosity and permeability
Fractures provide a substantial portion of the permeability and reservoir
capacity in a number of geothermal fields, e.g., Geysers, Otake, Larderel lo,
Wairakai, and i3roadlands (Facca, 1973). The primary intergranular porosity in
a reservoir is subject to irreversible self-sealing; however, fractures can be
considered to have renewable porosity, or permeability, or both, because they
can be reactivated after being filled or sealed.
mechanism may be either faulting (many major geothermal fields are located in
areas with active tensional tectonics) or natural hydraulic fracturing
resulting from high fluid pressures in the reservoir (Grindley and Browne,
1976).
The fracture producing
The hydrothermally altered reservoir rocks in the Salton Sea Geothermal
Field are extensively fractured, especially the shales.
from a few micrometres to 1 mm. The location of the Salton Sea field on an
active spreading zone (Elders et al., 1972) ostensibly can account for the
many fractures in the reservoir.
Fracture widths range
Evidence for the renewability of fracture porosity and permeability after
sealing is found in the form of (1) calcite filled veins in which the calcite
was mechanically twinned and deformed after deposition, indicating there was
renewed stress on an old fracture; (2) calcite filled veins reactivated
(refractured) and then refilled with epidote; and ( 3 ) anhydrite veins that
reveal two or more episodes of fracturing and deposition when viewed with
cathodoluminescence (see Fig. 5). These observations suggest that the seismic
activity in the Salton Trough may maintain fracture permeability in the
reservoir.
12
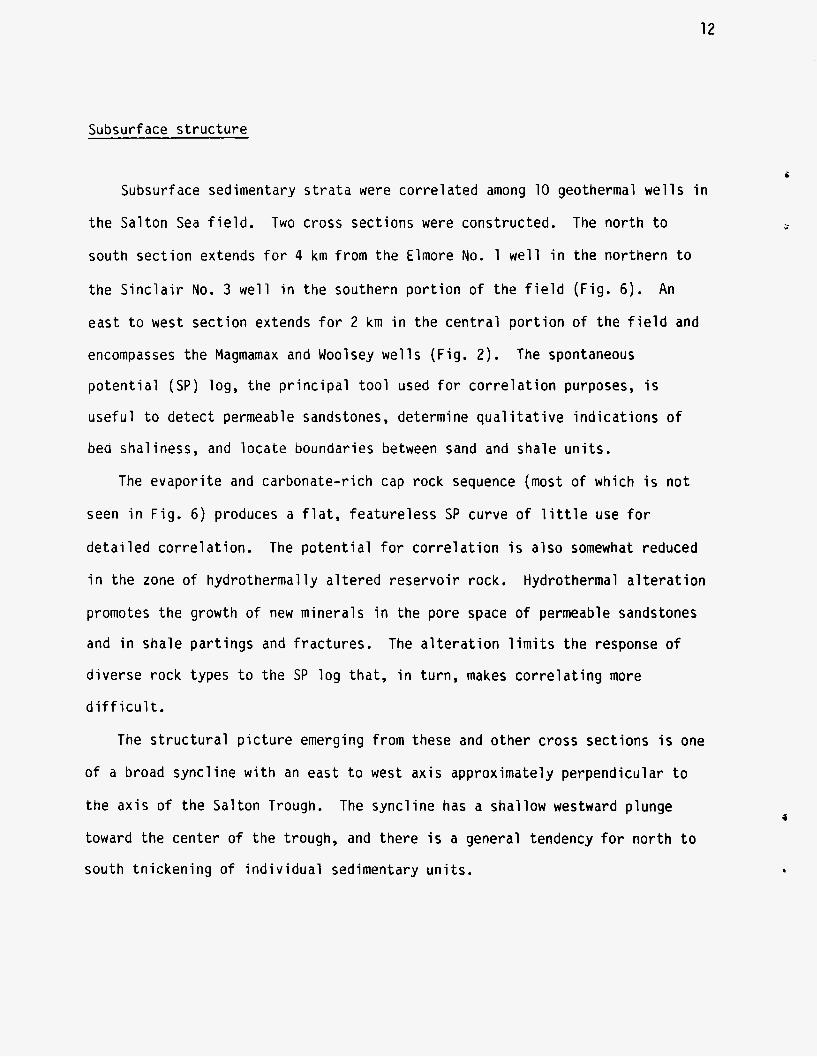
Subsurface structure
i
Subsurface sedimentary strata were correlated among 10 geothermal wells in
the Salton Sea field. Two cross sections were constructed. The north to
south section extends for 4 km from the Elmore No. 1 well in the northern to
the Sinclair No. 3 well in the southern portion of the field (Fig. 6 ) .
east to west section extends for 2 km in the central portion of the field and
encompasses the Magmamax and Woolsey wells (Fig. 2 ) .
potential (SP) log, the principal tool used for correlation purposes, is
useful to detect permeable sandstones, determine qualitative indications of
bed shaliness, and locate boundaries between sand and shale units.
An
The spontaneous
The evaporite and carbonate-rich cap rock sequence (most of which is not
seen in Fig. 6) produces a flat, featureless SP curve of little use for
detailed correlation. The potential for correlation is also somewhat reduced
in the zone of hydrothermally altered reservoir rock. Hydrothermal alteration
promotes the growth o f new minerals in the pore space of permeable sandstones and in shale partings and fractures. The alteration limits the response of
diverse rock types to the SP log that, in turn, makes correlating more
difficult.
The structural picture emerging from these and other cross sections is one
of a broad syncline with an east to west axis approximately perpendicular to
the axis of the Salton Trough. The syncline has a shallow westward plunge
toward the center of the trough, and there is a general tendency for north to
south thickening o f individual sedimentary units.
5

13
Igneous Activity
The Salton Sea Geothermal Field has five rhyolite buttes arranged along a
northeast trend at the southern end of the sea. These buttes are spaced 3 to
4 km apart, and were extruded over Quaternary alluvium.
(1976) noted that these rhyolites were similar in composition to those on
islands of the East Pacific Rise and that basaltic inclusions within the
rhyolites from the Salton Sea buttes are similar to the low-potassium
tholeiitic basalts from the rise.
association is a common feature of regions Characterized by tensional
tectonics.
includes the gravity and magnetic anomalies discussed below and the presence
of altered basaltic and silicic dikes and sills in several of the geothermal
wells at a depth of 1 to 2 km (Robinson et al., 1976).
Robinson et al.
This bimodal rhyolite plus basalt
Evidence suggesting subsurface igneous activity in the region
GEOPHYSICAL CHARACTERISTICS OF THE SALTON SEA GEOTHERMAL FIELD
Tectonic setting
The Salton Sea Geothermal Field is a significant link in the transition
from the divergent plate boundary of the East Pacific Rise to the transform
boundary of the San Andreas fault system. North of the Salton Sea, and within
the Salton Trough, the right lateral San Andreas fault system consists o f
three subparallel strands, i.e., the Banning-Mission Creek, the San Jacinto,
and the Elsinore. South of the Salton Sea, these strands lose their character

14
and merge into a series of smaller, less distinct, subparallel faults.
on recent seismicity within the Imperial Valley, the most important faults are
the side-stepping Imperial, Brawley, and Calipatria (Fig. 1).
Based
Lomitz et al. (1970) noted that the spreading centers in the Gulf of
California are offset by right-stepping en echelon faults, in a manner similar
to that displayed in the Imperial Valley on a smaller scale. They suggested
that the tectonic framework in the northern portion o f the Gulf of California
and the Salton Trough could be understood by considering these strike-slip
faults as transform faults connected by short spreading centers.
Salton Trough, they postulated, active ridge segments account for the
geothermal anomalies near Cerro Prieto and the Salton Buttes.
( 1972) expanded and refined the model using geophysical, petrological, and
geodetic data from the trough.
in tensional gaps between en echelon strike-slip faults.
(1975) and Hill et al. (1975) label these areas leaky transform faults; the
Within the
Elders et al.
They suggested active speading centers occur
Elders and Biehler
dominant movement in the region is strike slip, with
a rather diffuse zone of offset strike-slip faults.
of extensional and strike-sl ip movement is responsib
structure of the trough.
spreading taking place in
The complex interaction
e for the overall
The general model of crustal rift formation by leaky transform faulting is
supported by gravity, seismic, and leveling data. A gravity maximum in the
center of the trough can be explained by 8 km of crustal thinning (Biehler,
1971). Fuis et al. (1980) used over 3000 seismograms from 1300 stations and
found a high velocity crust at depths of 10 to 16 km under two thirds of the
Imperial Valley. They interpret this region as having an oceanic-type crust
i
1

15
that formed from the intrusion of mantle-derived materials into areas of
extension. Vertical leveling data collected since 1900 indicate ongoing
deepening of the Salton Trough consistent with the general model of rifting
(Lof gren, 1978).
Seismicity in the Salton Trough is characterized by both large earthquakes
and swarms of small-magnitude earthquakes (Hill et al., 1975; Sylvester, 1979;
Johnson, 1979). The large earthquakes obviously result from the relative
motion between the North American and Pacific plates; however, the swarm
activity has been related to hydraulic fracturing (Johnson, 1979) or magmatic
processes (Hill, 1977). The relationship between the swarm events and the
major events has not been established, but the general pattern of seismicity,
as revealed in epicenter locations and first motion studies, is consistent
with the combination of regional shearing and local extension required by the
leaky transform model (Weaver and Hi 11, 1978).
The Salton Sea Geothermal Field is one of the thermal anomalies within the
Salton Trough, where the active processes associated with crustal thinning and
rifting can be directly observed. A wide range of geophysical surveys near
the Salton Sea helped to detail critical aspects of the hydrothermal system.
Geophysical anomalies associated with the field
Gravity, magnetic and resistivity surveys show many features of the Salton
Sea Geothermal Field (Figs. 7-9).
geothermal area is approximately centered on Red Island Rhyolite butte
(Fig. 7). Elders et al. (1972) attributed the local anomaly to either an
A local gravity maximum within the

16
increase in density of the sediments resulting from hydrothermal alteration,
or the intrusion of dikes and sills into the sedimentary section, or both.
The magnetic surveys o f Griscom and Muffler (1971) and Kelley and Soske
(1936) reveal the presence o f material with a relatively high susceptibility
and remanent magnetization near the surface (Fig. 8).
separated the major anomaly into three superimposed ones, with the dominant
feature a magnetic ridge trending northwest from Calipatria to the middle of
the Salton Sea. Two elliptical northeast-trending anomalies are superimposed
upon the ridge; and small intense anomalies clearly associated with the
volcanic domes are, in turn, superimposed on the elliptical anomalies. They
interpreted the magnetic ridge to be caused by intrusive rocks at depths
greater than 2 km and the elliptical anomalies to be a result of dike and sill
clusters at depths o f approximately 1 km beneath the surface.
Griscom and Muffler
Meidav et al. (1976) made a recent resistivity survey in the vicinity of
the geothermal field. Electrical currents as high as 200 A were used to
detect resistivities of less than 0.5 $l to depths of several kilometres.
The survey consisted of 60 soundings with maximum separation of over 5 km and
approximately 60 km o f dipole survey lines.
layer they could detect was almost always resistive.
conductance o f the overlying layers was calculated from each sounding curve
using the method described by Kell and Frischknecht (1966). The conductance
value, essentially the sum o f the products of conductivity thickness for all
the overlying layers, is the most accurately determined quantity for
resistivity soundings. A contour map of the conductance determined from the
data o f Meidav et al. (1976) is seen in Fig. 9.
In these soundings, the deepest
The total transverse
A large volume of the

17
sedimentary rock, located between the surface and 2 km, is seen as highly
conductive. The conductivity and thickness product (conductance) of this
sedimentary sequence is greatest in the area of the drilled field, but a broad
area of high conductance extends along the axis of the valley (Kasameyer,
1976).
Low resistivity zones result when porous rocks are saturated with fluid
that is hot or saline, or both. Thus the physical boundaries of a porous
geothermal reservoir of saline fluid may be determined from resistivity data.
In the center of the Salton Sea Geothermal Field, the low resistivity results
presumably from both increased temperature and salinity. The resistivity
increases rapidly to the northeast and southwest of the known field,
indicating a loss of porosity or lower temperature and salinity of the fluid.
An area of low resistivity extends southeast from the known geothermal area,
and extremely low resistivities (0.5 Q-m) were detected in the vicinity of a
relatively cool well located 6 km from the Salton Sea Geothermal Field. The
low resistivity here is inferred to be the result of saline fluid in high
porosity rock.
Seismic refraction survey
A large-scale survey of the field involving seven seismic refraction
profiles and four long-distance refraction shots was recently completed (Frith
1978).
Salton Sea Geothermal Field is shown in Fig. 10. The location of the profile
is seen on the gravity anomaly map (Fig. 7).
One interpretation of data from a seismic profile that crosses the

18
If th s profile is compared with others in the Imperial Valley, an
anomalous y high velocity at shallow depths within the Salton Sea Geothermal
Field can be seen. Combs and Hadley (1977) reported a velocity of 2.60 km/s
at a depth of 0.9 km for an area near the East Mesa geothermal anomaly, and
Biehler et al. (1964) a velocity of 2.71 km/s at a similar depth near
Westmorland.
comparable depths probably results from intrusion of basaltic material near
the surface or the reduction of sediment porosity with hydrothermal alteration.
The higher velocity of 4.06 km/s in the Salton Sea field at
Seismicity and inferred faults
The Salton Sea field is located in the offset region between the San
Andreas fault and the Brawley fault. As a result, the region is subject to
intensive seismic activity (Fig. 11) (Schnapp and Fuis, 1977). Faults were
identified by geophysical and geological techniques, and their locations in
the geothermal field are shown in Fig. 1. The Brawley fault zone was
identified by a portable seismic survey (Gilpin and Lee, 1978) and a
resistivity survey (Ivleidav and Furgerson, 1972). The Calipatria fault was
identified using infrared detection (Babcock, 1971) and the alignment of
thermal hot springs (Muffler and White, 1968). The Red Hill fault, located
between the Brawley and the Calipatria faults, was traced with correlations
derived from electric logs (Towse, 1975), interpreted from the ground magnetic
survey (Meidav and Furgerson 1972), and subsequently located with a seismic
refraction survey (Frith 1978). i

19
THERMAL CHARACTERISTICS OF THE SALTON SEA GEOTHERMAL FIELD
Subsurface temperature data
Temperature data from the deep wells in the Salton Sea Geothermal Field
(Helgeson, 1968; Randall, 1974; Palmer, 1975; Magma Power Co., 1979) were
critically analyzed to determine in which surveys the measurements represent
equilibrium temperatures that existed prior to drilling.
surveys were used to gain insight into both the heat source distribution, and
the mechanisms of heat transfer within the geothermal field.
The data in those
The equilibrium profiles for 13 wells within the field are shown in
Fig. 12, and two prominent features are evident.
temperatures are high in the lower portions of the profiles.
typically over 320°C, i.e., 2OOOC higher than at a similar depth in the
Wilson No. 1 well, which is 15 km to the south of the field and in a
nongeothermal area. Also, temperatures are 14OOC higher than those reported
in other geothermal fields within the valley. Second, the thermal gradient in
the upper part of most of the wells does not change with depth. We can infer
from this the general character of the temperature versus depth curve at any
location and understand the control of heat transfer within the geothermal
sys tern.
First, the field
At 2 km they are
Surface aradient analysis for deeD wells
The equilibrium temperature profiles discussed above were used to estimate
the average gradient in the near-surface conductive zone and the depth to

20
which the gradient is nearly constant. For wells with enough data, the
near-surface temperature measurements were fitted with a straight line.
Additional data points from greater depths were added until the fit failed a
chi-square test (see Table 1).
points were estimated by eye. In all cases the average annual surface
temperature was assumed to be 23 - + l.O°C.
temperature measurement is assumed to be - + 5OC (one standard deviation, a)
unless stated otherwise.
Surface gradients for wells with few data
The uncertainty for a single
Nine wells have thermal gradients with similar characteristics and
configurations.
(0.38OC/m, la = 0.05OC/m) and are low and nearly constant at greater
depths. The transition in the character of the gradient occurs in reservoir
rocks beneath the impermeable cap.
The gradients are high in the upper portions of the wells
Four wells have thermal profiles significantly different from the profiles
described above. In Magmamax No. 4, the high gradient at the surface
increases slightly (but significantly) with depth in the impermeable cap.
River Ranch No. 1, three measurements in the impermeable cap provide data to
suggest a gradual decrease in gradient with depth.
temperature holes (Lee and Cohen, 1977) indicate a very high local gradient.
The proximity of this well to active mud volcanoes and the shallow C02 field
suggests that the geotherm here is strongly distorted by shallow fluid flow.
In the two Sinclair wells, the near surface gradient is low and constant and
increases with depth below the impermeable cap.
In
However, nearby shallow
The general mechanism of heat transport within the lithologic cap can be
If we assume that thermal conductivity in inferred from these observations.
the cap is uniform in the area determined by the nine wells with similar
21
.
profiles, the vertically-conducted heat flow within the lithologic cap is
nearly uniform and the horizontally-conducted heat flow negligible.
no evidence of convective heat flow in the lithologic cap (except near River
Ranch No. 1).
conditions on the lithologic cap must have been constant for a sufficiently
long time to enable the conductive heat-flow to equilibrate to steady state
over a large area and to a great depth.
There is
Furthermore, near these nine wells the thermal boundary
Because steady state conduction i s the dominating heat transfer mechanism
in the lithologic cap, we can use shallow thermal holes to determine the
gradient of the thermal profile throughout the lithologic cap where deep wells
do not exist.
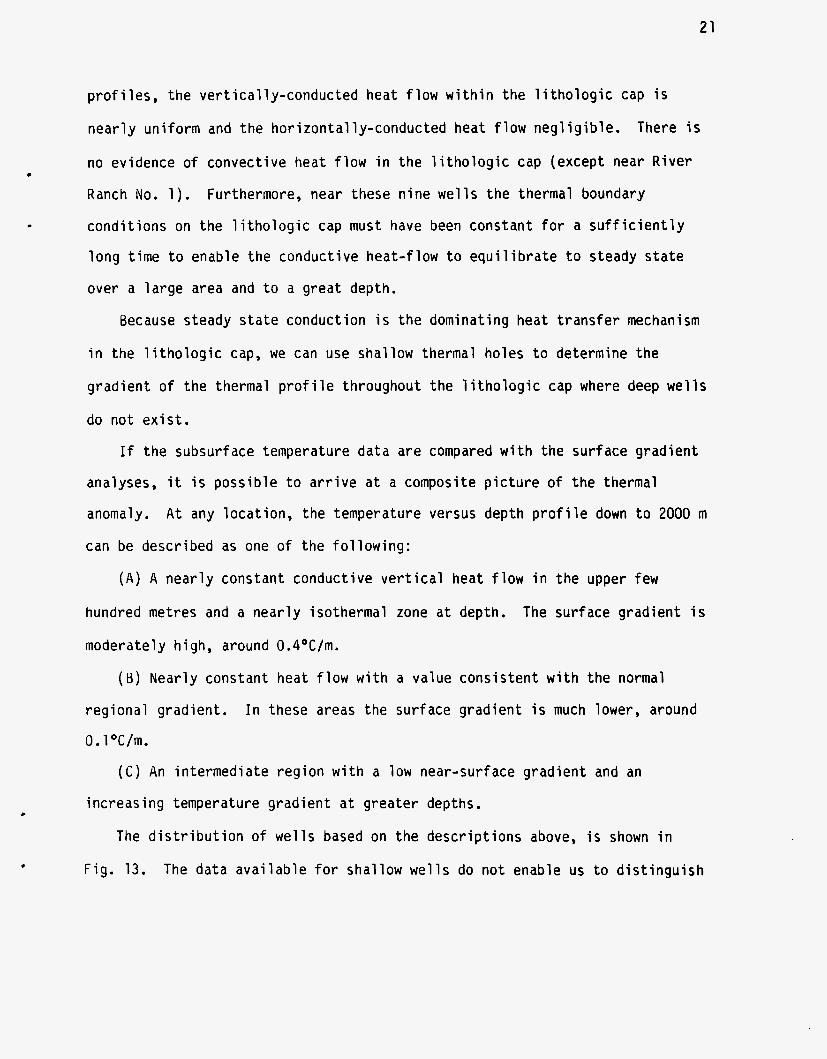
If the subsurface temperature data are compared with the surface gradient
analyses, it is possible to arrive at a composite picture of the thermal
anomaly. At any location, the temperature versus depth profile down to 2000 m
can be described as one of the following:
( A ) A nearly constant conductive vertical heat flow in the upper few
hundred metres and a nearly isothermal zone at depth.
moderately high, around 0.4'C/m.
The surface gradient is
(€3) Nearly constant heat flow with a value consistent with the normal
regional gradient. In these areas the surface gradient is much lower, around
0.1 "C/m.
(C) An intermediate region with a low near-surface gradient and an
increasing temperature gradient at greater depths.
The distribution of wells based on the descriptions above, is shown in
Fig. 13. The data available for shallow wells do not enable us to distinguish
22
descriptions B and C.
b.
those less than 0.16OC/m, b.
Therefore, all shallow wells are labeled either a or
Those with observed gradients greater than 0.35OC/m are labeled a and
Interpreted boundaries define regions containing wells with temperature
profiles of similar character. The region with wells labeled A (uniform,
moderately high gradient) is elliptical and covers most of the Salton Sea
Geothermal Field.
and is 8 to 12 km in length.
there are no measurements in the Salton Sea.
labeled C (transition) includes only the two deep Sinclair wells but is
assumed to surround the first region, A.
outside the others.
Its major axis strikes across the axis of the Salton Trough
The length of the minor axis is unknown because
The region containing wells
The region with wells labeled B lies
The near surface gradient can be used to infer the boundaries of the area
of high heat flow. However, the gradient cannot be used successfully to
predict temperature differences at depth within the field (see Fig. 14).
predict the temperature at depth, we must determine variations in thickness of
the steady-state conduction zone.
also analyzed to determine what geologic factors control this thickness and to
predict the temperature at depth in areas where there are no deep wells.
To
The thermal profiles from deep wells were
Vertical heat transDort
3
The temperature gradient in wells within the central portion of the
anomaly is dramatically reduced at a depth of approximately 500 m, and this is
presumed to mark a 'change in the major mode of heat transport.
region is characterized by steep gradients and heat flow by conduction and the
The upper
i

23
lower by low gradients that, however, must have been supplying heat to the cap
long enough for steady state conduction to develop. The dominant heat
transfer mechanism in the lower region must be convective flow of pore
fluids. We refer to this region as the convective zone.
Previous authors (Dutcher et al., 1972; White, 1968) suggested that
vertical heat transport in the Salton Sea field is by large-scale convection
cells encompassing the entire section of permeable reservoir rocks. We
propose a method to determine the thickness of the zone where conductive heat
flow dominates and use it to show that the zone includes a portion of the
uppermost section of reservoir rocks immediately beneath the cap rock. Our
results suggest the existence of a thermal cap in the Salton Sea field that i s
tnicker in some places than the impermeable lithologic cap described earlier.
In addition, we find evidence indicating that thin shale beds impede vertical
fluid flow and the amount of convective heat transport in a section is
controlled primarily by the thickness of sand beds. Consequently, large-scale
vertical convection of fluid cannot take place within that part of the
reservoir penetrated by we1 1 s .
If most of the heat in the thermal cap is transported by steady state
conduction, the heat flow, Qcond, is constant, and the temperature gradient
(AT~AZ) should vary in the cap inversely with the thermal conductivity of
the material, K , i.e.,
.
. - constant . AT
Qcond AZ = K - -
24
f 01
hor
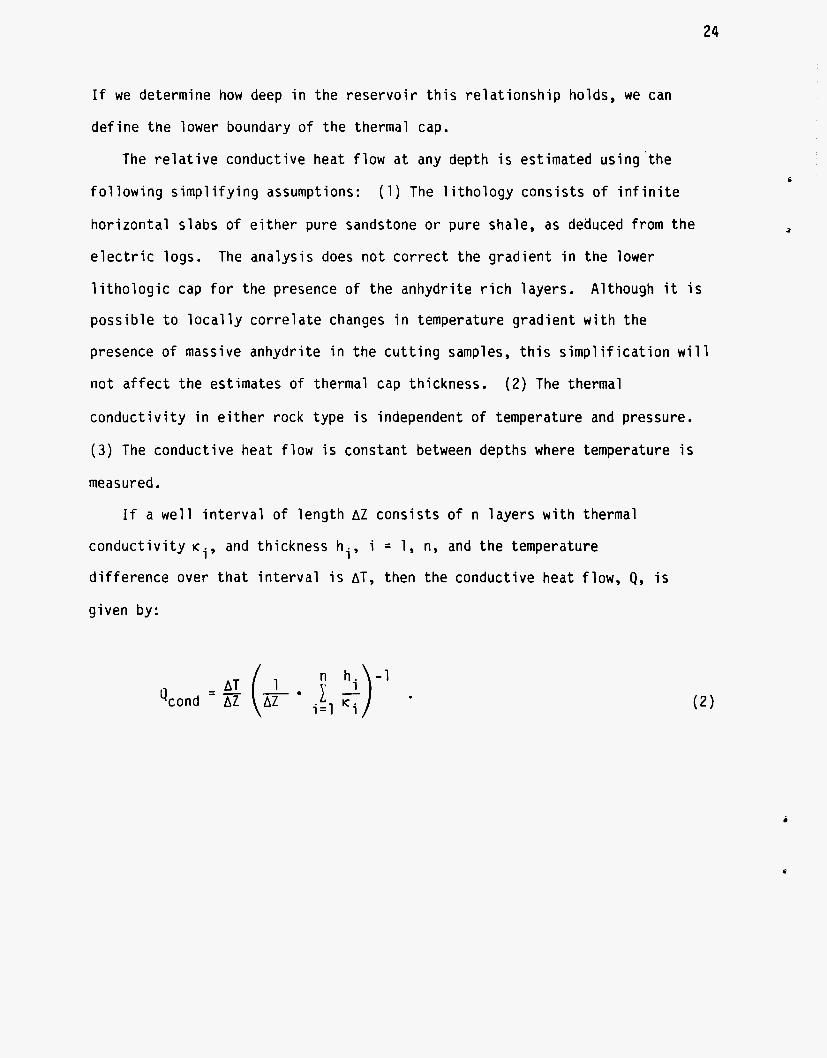
The relative conductive heat flow at any
If we determine how deep in the reservoir this relationship holds, we can
define the lower boundary of the thermal cap.
depth is estimated using 'the
owing simplifying assumptions: (1) The ithology consists of infinite
zontal slabs of either pure sandstone or pure shale, as deduced from the
electric logs. The analysis does not correct the gradient in the lower
lithologic cap for the presence of the anhydrite rich layevs.
possible to locally correlate changes in temperature gradient with the
presence of massive anhydrite in the cutting samples, this simplification will
not affect the estimates of thermal cap thickness.
conductivity in either rock type is independent of temperature and pressure.
( 3 ) The conductive heat flow is constant between depths where temperature is
measured.
Although it is
(2) The thermal
If a well interval of length AZ consists o f n layers with thermal
conductivity K ~ , and thickness hi, i = 1, n, and the temperature
difference over that interval is AT, then the conductive heat flow, Q, is
given by:
I - I \

25
sh If each layer is either sand or shale, with conductivity K~ or K
respectively, and AZs is the sum of the thicknesses of the sand layers,
then
- - E [ & D ( I - + h i 1 sand K~ shale Ksh Qcond AZ
and
-1 - - - AT
+ (1 - 2) $1 Qcond AZ dZKs sh
= relative conductive heat flow, 'cond - AT 1 - - - e
AZ sh K
K where a = sh and R = sand percentage.
S
( 3 )
(4)
(5)
The relative conductive heat flow for 12 wells changes as a function of
depth (Fig. 15). The conductive heat flow is nearly constant in the upper
section of most wells and then decreases rapidly with increasing depth.
Convection is inferred to be the important mechanism of heat flow below
the level where the conductive heat flow decreases. An estimate o f the
thickness of the thermal cap is provided in Fig. 15. The depth differs
considerably at adjacent wells but becomes increasingly shallow away from the
Salton Sea, consistent with the westward dip of the reservoir strata. The
Sinclair, Magmamax 3 , and River Ranch wells appear to be anomalous. If we
26
see that the
cap, and the
heat largely
permeability
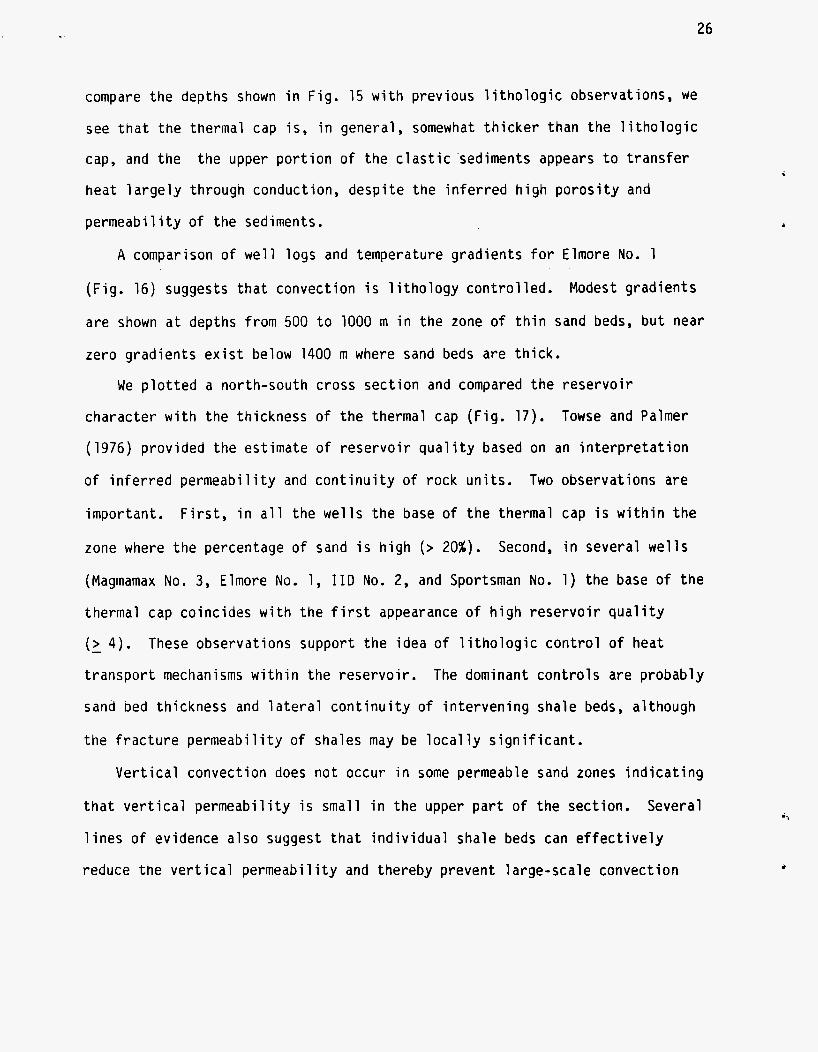
compare the depths shown in Fig. 15 with previous lithologic observations, we
thermal cap is, in general, somewhat thicker than the lithologic
the upper portion of the clastic'sediments appears to transfer
A compar
through conduction, despite the inferred h
of the sediments.
gh porosity and
son of well logs and temperature gradients for Elmore No. 1
(Fig. 16) suggests that convect
are shown at depths from 500 to
zero gradients exist below 1400
on is lithology controlled. Modest gradients
1000 m in the zone of thin sand beds, but near
rn where sand beds are thick.
We plotted a north-south cross section and compared the reservoir
character with the thickness of the thermal cap (Fig. 17). Towse and Palmer
(1976) provided the estimate of reservoir quality based on an interpretation
of inferred permeability and continuity of rock units. Two observations are
important. First, in all the wells the base of the thermal cap is within the
zone where the percentage of sand is high (> 20%).
(Magmamax No, 3 , Elmore No. 1, IID No. 2, and Sportsman No. 1) the base of the
thermal cap coincides with the first appearance of high reservoir quality
( 2 4). These observations support the idea of lithologic control of heat
transport mechanisms within the reservoir.
sand Ded thickness and lateral continuity of intervening shale beds, although
Second, in several wells
The dominant controls are probably
the fracture permeability of shales may be locally significant.
Vertical convection does not occur in some permeable sand zones indicating
that vertical permeability is small in the upper part of the section. Several
lines o f evidence also suggest that individual shale beds can effectively
reduce the vertical permeability and thereby prevent large-scale convection

27
cells within the zone of convective flow. Towse and Palmer (1976) and Tewhey
(1977) identified several major shale beds over 14 m thick in the reservoir
sands which would surely provide impermeable barriers to convective flow if
they are not extensively fractured.
Kendall (1976) provides support for the concept of a reservoir split into
several hydrologic systems. She found that extensive oxygen and carbon
isotope exchange occurred between geothermal brines and reservoir rock and
that several isotope inversions can be correlated with stratigraphic horizons.
This correlation suggests that water transport in the interval between 300 and
900 m is largely lateral and stratigraphical ly controlled.
composition below 900 m indicates that the water there is more thoroughly
mixed, perhaps as a result of the extensive fractures. In addition, minerals
in the larger fractures have approximately the same chemical and isotopic
compositions as minerals in the wall rocks, indicating that the large
fractures were not major avenues of water transport.
Consistent
More evidence for a lack of large-scale vertical transport of fluids and,
therefore, no large-scale convection cells comes from pressure measurements
within the wells, and well interference tests. The hydrostatic
pressure-versus-depth profile in the field is consistent with a constant fluid
density of 1 g/cm . but, as was pointed out by Helgeson (1968), smaller convection geometries
cannot be tested because of the uncertainty in the pressure measurements.
Morse and Thorsen (1978) analyzed well interference data and noted that wells
7 m apart did not communicate across a major shale break. They concluded
that the vertical permeability in the region is very low.
3 This observation precludes large convective movements,
An analysis of the conditions required for convection in a porous medium

28
supports the hypothesis that the vertical heat transport could result from
convection in individual sand layers (at least in the upper reservoir).
(1967) did numerical and experimental studies of convection in a porous
medium.
by a modified Rayleigh number, n, and convection only occurs if 11 is
greater than 40.
Elder
He found that the heat transport within a single layer is controlled
KOL AT gH
m K V r l = 9
where K = Permeability of the layer
a = Coefficient of volume expansion of the fluid
g = Absolute value of acceleration due to gravity
K = Thermal diffusivity of the saturated medium m v = Kinematic viscosity of the convecting fluid
H = Thickness of the layer
AT = Temperature contrast across the layer
To determine accurately whether convection will develop in a sand of a
given thickness, permeability, and depth, the variation of physical properties
of the convecting fluid as a function of temperature and pressure must be
investigated.
kinematic viscosity, and the thermal diffusivity of the saturated medium, each
highly dependent on temperature. The (conjugate) variation o f these three
parameters changes rl and makes convection much stronger when the temperature
increases.
given thickness and permeability are more likely to support convection if
Convection depends strongly on the coefficient of expansion,
By considering this variation, we can show that sand units of a
29
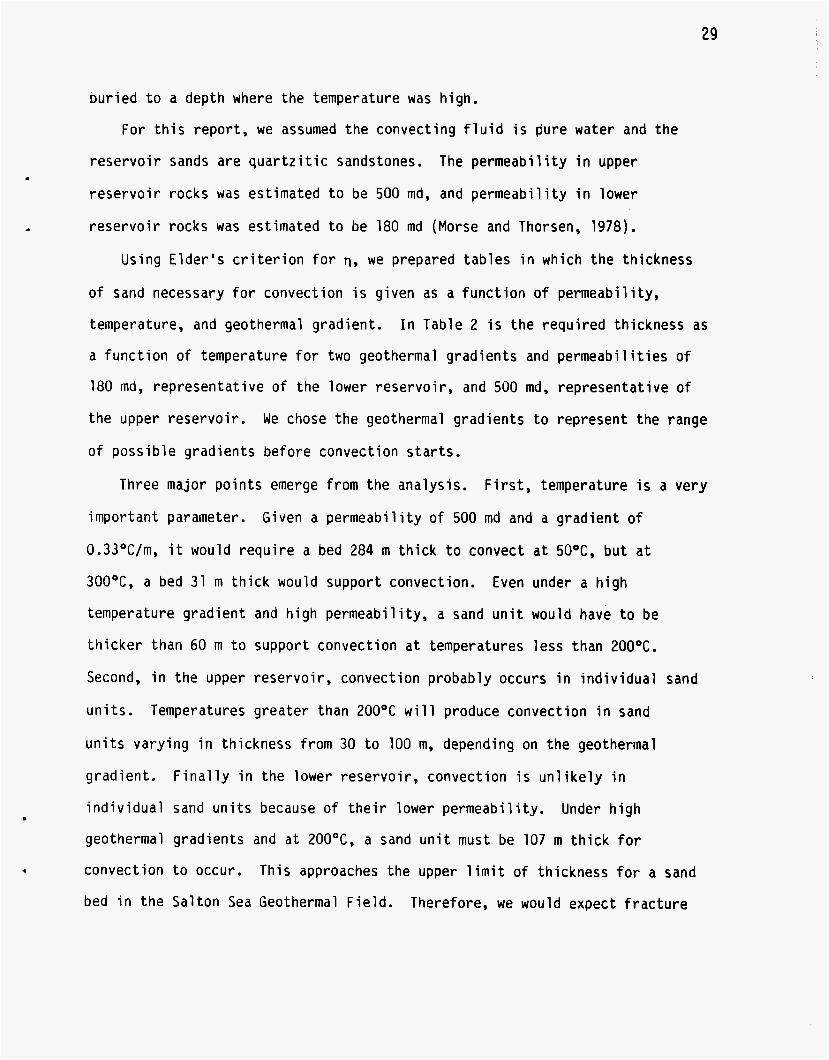
buried to a depth where the temperature was high.
For this report, we assumed the convecting fluid is pure water and the
reservoir sands are quartzitic sandstones. The permeability in upper
reservoir rocks was estimated to be 500 md, and permeability in lower
reservoir rocks was estimated to be 180 md (Morse and Thorsen, 1978).
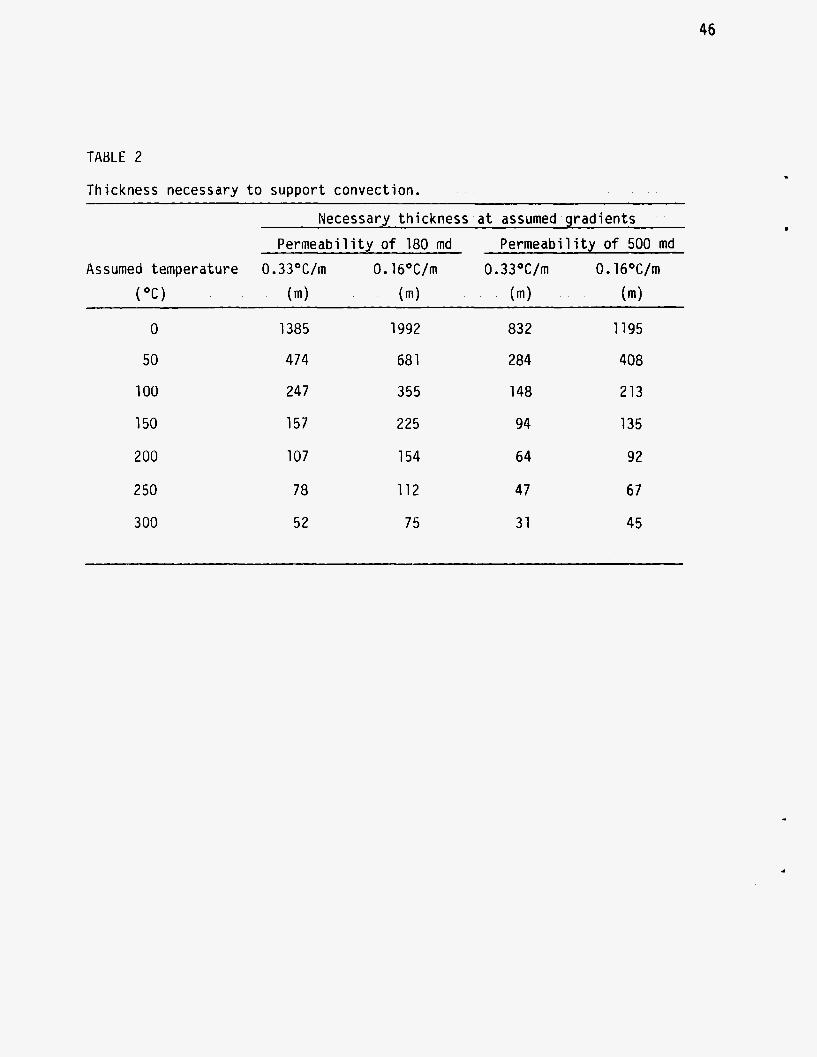
Using Elder's criterion for r(, we prepared tables in which the thickness
of sand necessary for convection is given as a function o f permeability,
temperature, and geothermal gradient. In Table 2 is the required thickness as
a function of temperature for two geothermal gradients and permeabilities of
180 md, representative of the lower reservoir, and 500 md, representative of
the upper reservoir.
of possible gradients before convection starts.
We chose the geothermal gradients to represent the range
Three major points emerge from the analysis. First, temperature is a very
important parameter.
0.33OC/m, it would require a bed 284 m thick to convect at 5OoC, but at
3OO0C, a bed 31 m thick would support convection.
temperature gradient and high permeability, a sand unit would have to be
thicker than 60 m to support convection at temperatures less than 200OC.
Second, in the upper reservoir, convection probably occurs in individual sand
units. Temperatures greater than 200°C will produce convection in sand
units varying in thickness from 30 to 100 m, depending on the geothermal
gradient. Finally in the lower reservoir, convection i s unlikely in
individual sand units because of their lower permeability. Under high
geothermal gradients and at 200°C, a sand unit must be 107 m thick for
convection to occur.
bed in the Salton Sea Geothermal Field. Therefore, we would expect fracture
Given a permeability of 500 md and a gradient of
Even under a high
This approaches the upper limit of thickness for a sand

30
permeability to be the dominant factor facilitating convection in deep
reservoir rocks.
Horizontal heat transport within the reservoir
It is possible that a much larger scale of horizonal convection is
superimposed on the small-scale convection, which controls the vertical heat
transport in the reservoir. High lateral permeability occurs even where the
reservoir is segmented vertically by shale beds.
intervals from nine geothermal wells placed in juxtaposition to emphasize
similiarities (Fig. 18) support the idea of widespread continuity of
individual sand beds throughout the area.
within the reservoir is much greater than the vertical, and the possibility o f
large-scale lateral flow exists.
SP logs of 350-ft (100-m)
Thus, the lateral permeability
If the temperature at the base of the thermal cap in several wells is
plotted as a function of the value of the magnetic anomaly at each well head,
the result is a nearly straight line (Fig. 19).
lends further support to a horizontal flow model.
Salton Sea Geothermal Field is caused by intrusions, which are probably the
source of heat for the field. Therefore, the value of the magnetic anomaly
can be used as a rough index of the distance from the source of heat. The
temperature at the base of the cap apparently decreases monotonically with
distance from the source of the heat (Fig. 19), and this is surprising if we
consider tnat the depth to the base of the cap i s quite irregular. However,
it is consistent with a model of large-scale horizontal flow beneath the
lithologic cap.
This unlikely correlation
The magnetic anomaly at the
Fluid rises above a localized heat source and spreads

31
laterally away from the source losing heat to the impermeable cap rock.
this model of predominantly horizontal flow is correct, then the high salinity
brine inferred from the resistivity data could be the total mass of water that
has flowed through the system.
transport associated with this lateral flow, and compare it with more detailed
observations on the temperature distribution within the field.
If
In our next paper we will model the heat
SUMMARY OF CHARACTERISTICS
Geo 1 ogy
1. Sediments within the field can be characterized as a three layer sequence
of cap rock, slightly altered reservoir rock and more extensively altered
reservoir rock.
underlying reservoir rock is interpreted to represent the boundary between
lacustrine sediments deposited in the isolated Salton Trough, and earlier
marine sediments deposited in the Gulf of California.
The cap rock is a variably thick, low permeability rock overlying the
reservoir rock.
silt, sand, and gravel. Below 200 m, it consists primarily o f
anhydri te-rich evaporite 1 ayers.
The slightly altered reservoir rocks were subject to silicification and
clay mineral reactions; however, these alterations did not change the
petrophysical properties.
Epidote and silica are the principal pore filling minerals produced during
high temperature alteration. They replace calcite and anhydrite and a
The sharp transition between the cap rock and the
2 .
In the upper 200 m, it consists of unconsolidated clay,
3 .
4.
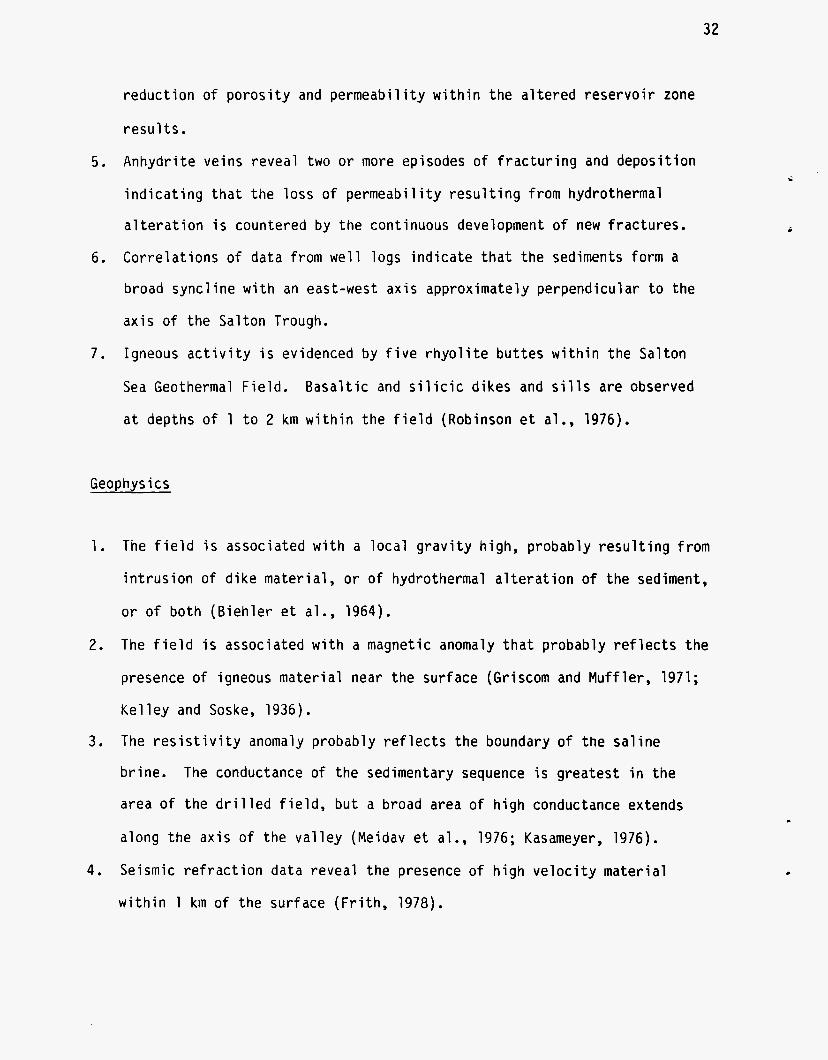
32
reduction of porosity
results.
5. Anhydrite veins revea
and permeabi ity with
two or more episodes
n the altered reservoir zone
of fracturing and deposition
indicating that the loss of permeability resulting from hydrothermal
alteration is countered by the continuous development of new fractures.
6. Correlations of data from well logs indicate that the sediments form a
broad syncline with an east-west axis approximately perpendicular to the
axis of the Salton Trough.
Igneous activity is evidenced by five rhyolite buttes within the Salton
Sea Geothermal Field. Basaltic and silicic dikes and sills are observed
at depths of 1 to 2 km within the field (Robinson et al., 1976).
7.
Geophysics
1. The field is associated with a local gravity high, probably resulting from
intrusion of dike material, or of hydrothermal alteration of the sediment,
or of both (Biehler et al., 1964).
The field is associated with a magnetic anomaly that probably reflects the
presence of igneous material near the surface (Griscom and Muffler, 1971;
Kelley and Soske, 1936).
The resistivity anomaly probably reflects the boundary of the saline
brine.
area of the drilled field, but a broad area of high conductance extends
along the axis of the valley (Meidav et al., 1976; Kasameyer, 1976).
Seismic refraction data reveal the presence of high velocity material
within 1 kin of the surface (Frith, 1978).
2.
3 .
The conductance of the sedimentary sequence is greatest in the
4. .

.
5. Numerous earthquakes indicate that the area is tectonically active
(Schnapp and Fuis, 1977).
6. Interpretations of resistivity surveys, seismic refraction data,
earthquake locations, and ground magnetic surveys are suggestive of the
existence of several steeply dipping faults within the field (Muffler and
White, 1968; Babcock, 1971; Meidav and Furgerson, 1972; Towse, 1975;
Gilpin and Lee, 1978; Frith, 1978).
Geothermal
1. Equilibrium temperature analysis indicates that the field is characterized
by extremely high temperatures at depth. Temperatures at a depth of 2 km
are 2 0 0 O C higher than temperatures at similar depths in nongeothermal
areas within the valley.
Within the field, temperature profiles are characterized by high
temperature gradients near the surface.
gradient at a depth of approximately 700 m.
At the margin of the field, temperature profiles are characterized by low
gradients at the surface and an increase in temperature gradient with
depth.
Surface gradients within the field are fairly constant, averaging
0.36OC/m.
the margin of the field i s approached.
The thermal cap does not necessarily conform in thickness to the
lithologic cap; it varies irregularly. However, the temperature at the
base of the cap varies smoothly with distance from the volcanic buttes.
2.
There is a dramatic reduction in
3 .
4.
Surface gradients drop off rapidly to the regional value as
5.

34
6 . Heat transfer mechanisms can be modeled as a three layer system. Layer
one, the upper thermal cap, is impermeable to fluid flow and has a high
temperature gradient consistent with conduction. Layer two, still within
the thermal cap but below the lithologic cap rock, has an increase in
high-conductivity sand units that produce a lower temperature gradient.
Layer three, below the thermal cap, is characterized by low thermal
gradients consistent with convective flow of pore fluid.
A variety of evidence suggests that vertical convective motion within the
reservoir is confined to small units. Vertical permeability is too low t o
allow for large-scale convection cells.
the reservoir is limited to individual sand bodies. Minor fractures in
the lower reservoir allow for more extensive convective patterns. Major
faults have not served as avenues of fluid and heat transport (Kendall,
1976).
Superimposed on the small-scale convection could be a large-scale
horizontal flow that transfers heat from the area of the buttes to the
margins of the field.
A schematic section of the field, which relates the geological
7.
Convection in the upper part of
8.
characteristics and the heat transfer characteristics, is seen in Fig. 20.
Geologically, the section can be broken down into four layers (cap rock,
slightly altered reservoir rock, highly altered reservoir rock, and zone of
intrusion). The impermeable cap rock is underlain by the dominantly sand
reservoir. The lower portion of the reservoir has undergone hydrothermal
alteration, which changed the petrophysical properties.
dikes penetrate to within 1 km of the surface. On the basis of thermal
properties, the field can be broken down into three layers. The thermal cap
Basaltic and silicic
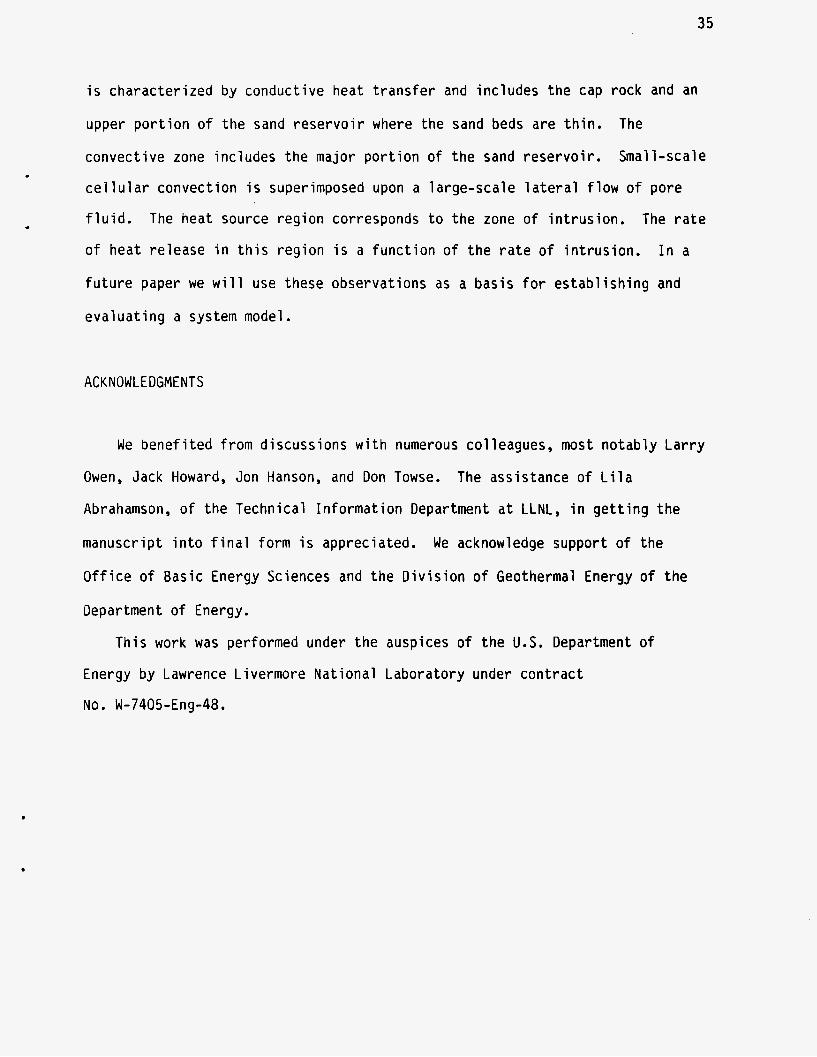
35
is characterized by conductive heat transfer and includes the cap rock and an
upper portion of the sand reservoir where the sand beds are thin.
convective zone includes the major portion of the sand reservoir.
cellular convection is superimposed upon a large-scale lateral flow of pore
fluid. The heat source region corresponds to the zone of intrusion. The rate
of heat release in this region is a function of the rate of intrusion.
future paper we will use these observations as a basis for establishing and
evaluating a system model.
The
Small-scale
In a
ACKNOWLEDGMENTS
We benefited from discussions with numerous colleagues, most notably Larry
Owen, Jack Howard, Jon Hanson, and Don Towse. The assistance of Lila
Abrahamson, of the Technical Information Department at LLNL, in getting the
manuscript into final form is appreciated.
Office of Basic Energy Sciences and the Division of Geothermal Energy of the
Department of Energy.
We acknowledge support of the
This work was performed under the auspices of the U.S. Department of
Energy by Lawrence Livermore National Laboratory under contract
No. W-7405-Eng-48.
.
.

36
REFERENCES
Sabcock, E. A., 1971. Detection of active faulting using oblique infrared
aerial photography in the Imperial Valley of California, Geol. SOC. Am.
Bull., 82: 3189-3196.
Batzle, M. L. and Simmons, G, 1976. Microfractures in rocks from two geothermal
areas, Earth Plant. Sci. Lett., 30: 71-93.
Berner, R. A . , 1971. Principles of Chemical Sedimentology. McGraw-Hill, New
York, N.Y.
Biehler, S., 1971. Gravity studies in the Imperial Valley. In: Cooperative
Geological-Geophysical Investigations of Geothermal Resources in the
Imperial Valley Area of California. University of California, Riverside,
Calif.
Biehler, S., Kovach, R. L. and Allen, C. R., 1964. Geophysical framework of
northern end of Gulf of California Structural Province, Am. Assoc. Petrol.
Geol., Memo No. 3 : 126-143.
Biehler, S . and Lee, T., 1977. Final report on a resource assessment of the
Imperial Valley, DLRI Report No. 10. University of California, Riverside,
Calif. .

37
Chan, M. A. and Tewhey, J. D., 1977. Subsurface structure o f the southern
portion of the Sal ton Sea Geothermal Field, UCRL-523554. Lawrence Livermore
National National Laboratory, Livermore, Calif.
Combs, J. and Hadley, D., 1977. Microearthquake investigation of the Mesa
Geothermal Anomaly, Imperial Valley, California, Geophysics, 42: 17-33.
Dibblee, T. W . , Jr., 1954. Geology of the Imperial Valley Region, California,
Pt. 2.
Div. Mines Bull. No. 170, pp. 21-28.
In: R. H. Jahns (Editor), Geology of Southern California, Calif.
Downs, T. and Noodward G. D., 1961. Middle Pleistocene extension o f the Gulf
of California into the Imperial Valley, Geol. SOC. Am. Abst. Spec. Paper
No. 68, p. 21.
Dutcher, L. C., Hardt, W . F. and Moyle, W . R . , Jr., 1972. Preliminary
appraisal of ground water in storage with reference to geothermal resources
in the Imperial Valley Area, California, U.S. Geolog. Surv. Circ. 649.
Elder, J. W . , 1967. Steady free convection in a porous medium heated from
below, J. Fluid Mech., 27: 29.
Elders, W. A., Rex, R. W . , Meidav, T., Robinson, P. T. and Biehler, S., 1972.
Crustal spreading in Southern California, Science, 178: 15-24.

38
Elders, W. A. and Biehler, S . , 1975. Gulf of California rift system and its
implication for the tectonics of Western North America, Geology, 3(2): 85.
Facca, G., 1973. The structure and behavior of geothermal fields. In:
H. C. H. Armstead (Editor), Geothermal Energy, Review of Research and
Development. United Nations Educational, Scientific and Cultural
Organization, Paris, pp. 61-69.
Facca, G. and Tonani, F., 1967. The self-sealing geothermal field, Bull.
Volcanol., 30: 271-273.
Frith, K. B., 1978. A seismic refraction investigation of the Salton Sea
Geothermal area, Imperial Valley California. M.S. Thesis, University of
California, Riverside, Calif., 94 pp. (unpublished).
Gilpin, B. and Lee, Tien-Chang, 1978. A microearthquake study in the Salton
Sea Geothermal area, California, Bull. Seism. SOC. Am., 68: 441-450.
Grindley, G. W. and Browne, P. R. L., 1976. Structural and hydrological
factors controlling the permeabilities of some hot-water geothermal wells.
In: Proc. Second United Nations Symp. on Development and Use o f Geothermal
Resources, vol. 1. Lawrence Berkeley Laboratory, Berkeley, Calif.,
pp. 379-386.
39
Griscom, A. and Muffler, L. J. P., 1971. Aeromagnetic map and interpretation
of the Salton Sea geothermal area, California, U.S. Geol. Survey, Geophys.
Invest. Map GP 754.
. Hamilton, W., 1961. Origin of the Gulf of California, Geol. SOC. Am. Bull.,
72: 1307-1318.
Helgeson, H. C., 1968. Geologic and thermodynamic characteristics o f the
Salton Sea geothermal system, Am. J. Sci., 266(3): 129-166.
Hill, D. P., 1977. A model for earthquake swarms, J. Geophys. Res.,
82: 1347-1352.
Hill, D. P., Mowinckel, P. and Peake, L. G., 1975. Earthquake active faults
and geothermal areas in the Imperial Valley, California, Science 188:
1306-1308.
Johnson, C. E., 1979. 1. CEDAR--An approach to the computer automation of
short-period local seismic networks; 11. Seismotectonics o f the Imperial
Valley of Southern California, Ph.D. dissertation, California Institute of
Technology, Pasadena, Calif.
Kasameyer, P. W., 1976. Preliminary interpretation of resistivity and seismic
. refraction data from the Salton Sea Geothermal Field, UCRL-52115. Lawrence
Livermore National Laboratory, Livermore, Calif.
40
Keller, G. V. and Frischknecht, F. C., 1966. Electrical Methods in
Geophysical Prospecting. Pergamon Press, New York, N.Y.
Kelley, V. C. and Soske, J. L., 1936. Origin of the Salton volcanic domes,
Salton Sea, California, J. Geol., 44: 496-509.
Kendell, C., 1976. Petrology and stable isotope geochemistry of three wells
in the Buttes area of the Salton Sea Geothermal Field, Imperial Valley
California, U.S.A. M.S. Thesis, University of California, Riverside, Calif.
(unpublished).
Lee, T. and Cohen, L., 1977. Onshore and offshore measurements of temperature
gradients in the Salton Sea geothermal area California, UCR/I6PP-77/22.
University of California, Riverside, Calif.
Lofgren, B. E., 1978. Salton Trough continues to deepen in Imperial Valley,
California, Trans. Am. Geophys. Union, 59: 1051.
Lomnitz, C., Mooser, F., Allen, C., Brune, J. N. and Thatcher, W . , 1970.
Seismicity of the Gulf of California region, Mexico--preliminary results,
Geofis. Int. 10: 37.
Magma Power Company, 1979. Personal communication.
41
McDowell, S . D. and McCurry, M., 1977. Active metamorphism in the Salton Sea
Geothermal Field, California: mineralogical and mineral chemistry changes
with depth and temperature in sandstone, Geol. SOC. Am. Abstr. Prog.,
9(7): 1088.
. McDowell, S. D. and Elders, W . A. , 1979. Geothermal metamorphism of sandstone
in the Salton Sea Geothermal System, UCR/I6PP-79-25. Inst. Geophys. Planet.
Phys., University of California, Riverside, Calif.
Meidav, T. and Fergerson, R., 1972. Resistivity studies of the Imperial
Valley geothermal area, California, Geothermics, 1: 47-62.
Meidav, T., West, R., Katzenstein, A . and Rostein, Y . , 1976. An electrical
resistivity survey of the Salton Sea Geothermal Field, Imperial Valley
California, UCRL-13690. Lawrence Livermore National Laboratory, Livermore,
Cal if.
Morse, J . G. and Thorson, L. D., 1978. Reservoir engineering study of a
portion of the Salton Sea Geothermal Field, Geotherm. Resources Council
Trans., 2: 471-474.
Muffler, L. J. P. and White, 0. E., 1968. Origin of C02 in the Salton Sea
geothermal system, Southeastern California, U.S.A.. In: Proc. 23rd Int.
Geol. Cong., Prague, 97(Symp. 2): 185-194.
42
Muffler, L. J. P. and White, D. E., 1969. Active metamorphism of upper
Cenozoic sediments in the Salton Sea Geothermal Field and the Salton Trough,
Southeastern California, Geol. SOC. Am. Bull., 80: 157-182.
Nathenson, M. and Muffler, L. J. P., 1975. Geothermal Resources in
Hydrothermal convection systems and conduction dominated areas. In:
Assessment of Geothermal Resources of the United States, U.S. Geological
Survey, Washington D.C., Circ. 726.
Palmer, T. D, 1975. Characteristics of geothermal wells located in the Salton
Sea Geothermal Field, Imperial County, California, UCRL-51976. Lawrence
Livermore National Laboratory, Livermore, Calif.
Randall, W., 1974. An analysis of the subsurface structure and stratigraphy
of the Salton Sea geothermal anomaly, Imperial Valley, California. Ph.D.
Thesis, University of California, Riverside, Calif. (unpublished).
Renner, J. L., White, D. E. and Williams, D. L., 1975. Hydrothermal
convection systems. In: Assessment of Geothermal Resources of the United
States, U.S. Geological Survey, Washington D.C., Circ. 726.
Robinson, P. T., Elders, W. A. and Muffler, L. J. P., 1976. Quaternary
Volcanism in the Salton Sea Geothermal Field, Imperial Valley California,
Geol. SOC. Am. Bull., 87: 347-360.

Schnapp, M and Fuis, G., 1977. Preliminary catalog o f earthquakes in the
Northern Imperial Valley, October 1, 1976 to December 31, 1976. U.S. Geol.
Surv. Seism. Lab., Pasadena, Calif.
Skinner, B. J . , White, D. E., Rose, H. J. and Mays, R. E., 1967. Sulfides . associated with the Salton Sea Geothermal brine, Econ. Geol., 62(3): 316-330.
Storre, B. and Nitsch, K . H., 1972. Die reaktion 2 zoisite + 1 C02
3 anorthite + 1 calcite + 1 H20, Contr. Mineral. Petrol., 35: 1-10.
Sylvester, A. G., 1979. Earthquake damage in Imperial Valley, California
May 18, 1940, as reported by T. A. Clark, Bull. Am. Seis. SOC. , 69: 547-568.
Tewhey, J. D . , 1977. Geologic characteristics of a portion o f the Salton Sea
Geothermal Field, UCRL-52267. Lawrence Livermore National Laboratory,
Livermore, Calif.
Towse, D., 1975. An estimate of the geothermal energy resource in the Salton
Trough California, UCRL-51851.
Livermore, Calif.
Lawrence Livermore National Laboratory,
Towse, D. F. and Palmer, T. D., 1975. Summary of geology at the
ERDA-Magma-SDG&E geothermal test site, UCID-17008. Lawrence Livermore
National Laboratory, Livermore, Calif.
44
Van de Kamp, P. C., 1973. Holocene continental sedimentation in the Salton
Basin, California: a reconnaissance, Geol. SOC. Am. Bull., 84: 827-848.
ldeaver, C. S. and Hill, D. P., 1978. Earthquake swarms and local crustal
spreading along major strike-slip faults in California, Pure Appl. Geophys.,
177: 51-64.
White, D. E., 1968. Environments of generation of some base metal ore
deposits, Econ. Geol., 63(4): 301-335.
.
Younker, L. and Kasameyer, P. W . , 1978. A revised estimate of recoverable
thermal energy in the Salton Sea Geothermal resource area, UCRL-52450.
Lawrence Livermore National Laboratory, Livermore, Calif.
45
TABLE 1
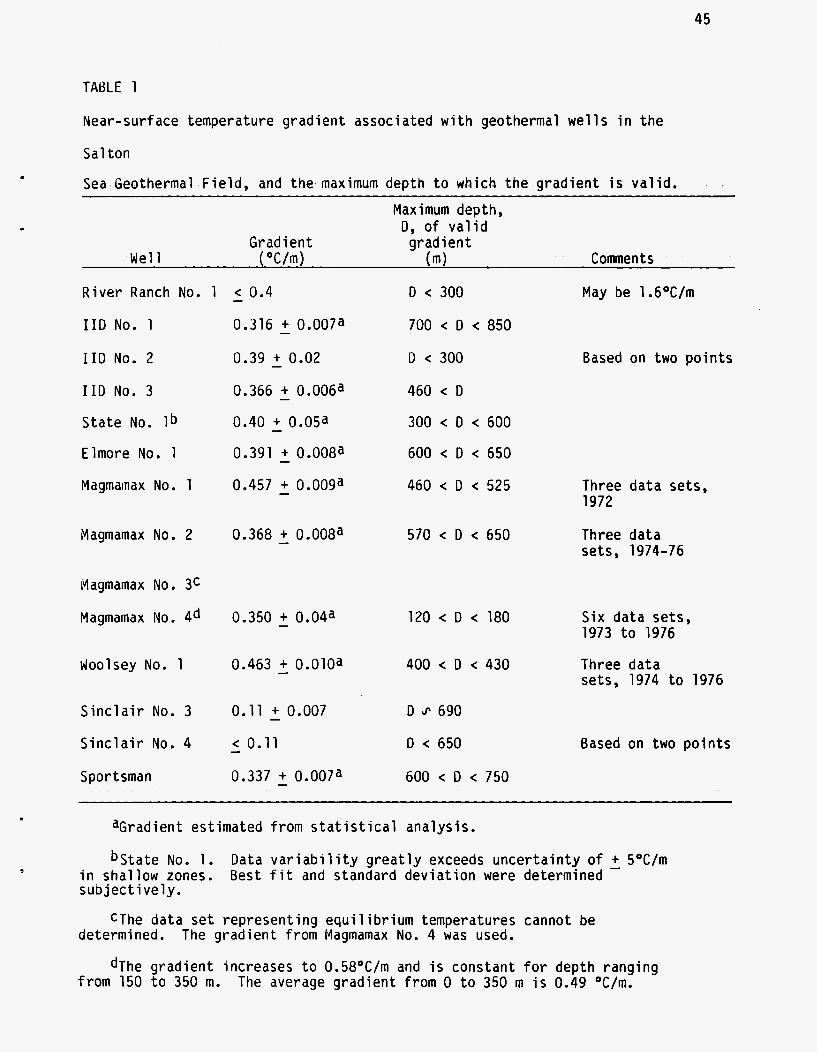
Near-surface temperature gradient associated with geothermal wells in the
Sal ton
Sea Geothermal Field, and the maximum depth to which the gradient is valid. Maximum depth, 0, of valid
Gradient gradient We1 1 ( O C / m ) (m) Comments
River Ranch No. 1 - < 0.4 D < 300 May be 1.6OC/m
IID No. 1 0.316 - + 0.007a 700 < D < 850
Based on two points IID No. 2 0.39 + 0.02
0.366 - + 0.006a
0.40 - + 0.05a
-
0.391 - + 0.008a
0.457 - + 0.009a
D < 300
IID No. 3
State NO. 1b
Elmore No. 1
Magmainax No. 1
460 < D
300 < D < 600
600 < D < 650
460 < D < 525 Three data sets, 1972
Magmamax No. 2 0.368 + 0.008a 570 < D < 650 Three data sets, 1974-76
Iqagmamax No. 3c
Magmamax No. qd 0.350 - + 0.04a 120 < D < 180 Six data sets, 1973 to 1976
Woolsey No. 1 0.463 - + 0.010a 400 < D < 430 Three data sets, 1974 to 1976
Sinclair No. 3
Sinclair No. 4
Sportsman
D s 690
D < 650
600 < D < 750
0.11 - + 0.007
< 0.11
0.337 - + 0.007a
- Based on two points
aGradient estimated from statistical analysis.
bState No. 1. Data variability greatly exceeds uncertainty of - + 5OC/m in shallow zones. Best fit and standard deviation were determined subjectively.
CThe data set representing equilibrium temperatures cannot be
dThe gradient increases to 0.58OC/m and is constant for depth ranging
determined. The gradient from Magmamax No. 4 was used.
from 150 to 350 m. The average gradient from 0 to 350 m is 0.49 OC/m.
46
TABLE 2
Thickness necessary to support convection.
Necessary thickness at assumed gradients Permeability o f 180 md Permeability o f 500 md
Assumed temperature 0.33'C/m 0.16OC/m 0.33OC/m O.l6OC/m C ° C ) (m) (m) (m) (m)
~~ ~ ~~ ~~ ~~ ~ ~
0 1385 1992 832 1195
50 474 68 1 284 408
100 24 7 355 148 213
150 157 225 94 135
2 00 107 154 64 92
2 50 78 112 47 67
3 00 52 75 31 45
47
Figure Captions
.
.
Fig. 1. Location of the Salton Sea Geothermal Field and nearby faults in the
Imperial Valley (after Elders et al., 1972). Basement rocks are indicated by
stippling. The inset shows locations of wells in the field.
Fig. 2. East-west cross section through the Magmamax and Woolsey wells in the
Salton Sea Geothermal Field. The three rock types, i.e., cap rock, slightly
altered reservoir rock, and hydrothermally altered rock, are classifications
based on petrographic analysis.
determined in this report. The orientation of strata in the reservoir rock is
shown by dashed lines.
Boundaries between rock types are those
Fig. 3a. Temperature versus C02 content plotted at Pfluid = 2kb for the
Ca0-Al2O3-SiO2-CO2-H20 system modified from Storre and Nitsch
(1972).
the Salton Sea Geothermal Field that is consistent with petrologic
The shaded arrow represents a possible reaction path, with depth, for
observations.
phase relations. 3b. Detail of CAQ triangle.
The calci te-anorthite-quartz (CAQ) triangle is used to depict
Fig. 4.
in the Salton Sea Geothermal Field.
Measured porosity versus depth for cores from five geothermal wells
48
Fig. 5. Calcite and epidote veins in shale from > 900-m depths in the
Salton Sea Geothermal Field. Ion microprobe-traverses were made across zoned
anhydrite grains to determine the geochemical basis for differences in
luminescent intensity. The position of data points in the graph are seen on
the ion microprobe-transverse. Positive concentration-anomal ies o f Y , Ce, and
La correspond to zones of yellow luminescence.
Fig. 6. Spontaneous potential (SP) log correlations o f five wells extending
north to south from Elmore No. 1 to Sinclair No. 3 in the Salton Sea
Geothermal Field.
Fig. 7.
Geothermal Field (after Biehler, 1971).
of a seismic refraction profile (refer to Fig. 10). The contour intervals is
2.5 milligals.
Bouguer gravity anomaly map of the area near the Salton Sea
Heavy solid line shows the position
Fig. 8.
(after Griscom and Muffler, 1971). The contour interval is 25 gammas.
Aeromagnetic map of the area near the Salton Sea Geothermal Field
Fig. 9.
Kasameyer, 1976). Open circles indicate the location of the soundings.
Conductance is in siemens.
Conductance map for area near the Salton Sea Geothermal Field (after
Fig. 10.
to the Alamo River on the west (after Frith, 1978). The position of the
profile is indicated on the gravity anomaly map (Fig. 7).
km/s .
Seismic refraction profile running from Obsidian Butte on the east
Velocities are in
i
49
.
.
.
Fig. 11. Location of earthquake epicenters in the Imperial Valley for the
period October 1, 1976 through December 31, 1976 (after Schnapp and Fuis,
1977).
network installed in 1973. Solid circles are the seismograph stations
installed in November 1976. Open circles and dots are the observed
epicenters.
The solid triangles are seismograph stations in the Imperial Valley
Tentative fault locations are shown in broken lines.
Fig. 12. Equilibrium temperature profiles for 13 wells in the Salton Sea
Geothermal Field. a. and b. Wells from the northern part of the field.
c. and d. Wells from the southern part of the field. The data for these
profiles are from Helgeson, 1968; Randall, 1974; Palmer, 1975; and Magma Power
Company, 1979.
Fig. 13. A map of the spatial character of the geothermal anomaly. Each
measurement point is represented by three symbols: a dot showing the location,
a number indicating the near surface gradient, and a letter representing the
character of the temperature versus depth curve.
deep wells.
upper few hundred metres, and a nearly isothermal zone at depth.
6 have a nearly constant low heat flow throughout their depth.
have low heat flow near the surface, but their gradient increases with depth.
Lower case letters represent shallow hole data (Lee and Cohen, 1977) with
corresponding characteristics.
gradients, respectively. The shallow wells are not deep enough to distinguish
between 6 and C behavior. The solid lines represent the approximate
boundaries of regions with similar characteristics, indicated by A, 6 , or C.
Upper case letters indicate
Wells marked A have a moderately high uniform heat flow in the
Wells marked
Wells marked C
Holes marked a or b have high or low

50
Fig. 14.
in the Salton Sea Geothermal Field.
would be at 1000 m if the gradient were constant.
Surface gradient versus temperature at a depth of 1000 m for 9 wells
The line represents the temperature that
Fig. 15. Thermal gradients versus depth for 12 wells in the Salton Sea
Geothermal Field. The interval gradient is indicated by a dashed line. The
gradient corrected for the sand conductivity is indicated by a solid line.
The depths at which the conductive heat flow has decreased by 30 to 40% are
indicated by arrows.
heat transfer below these points.
occurs between widely-spaced temperature measurements, the arrow is placed at
a change of lithology between the observation depths. The depth uncertainty
i s greater than 30 m in all cases. The data for State of California No. 1 are
(left) from the State of California Division of Oil and Gas and (right) from
He 1 geson ( 1968).
Convection is interpreted as a mechanism for significant
If the decrease in conductive heat flow
Fig. 16.
No. 1 well in the Salton Sea Geothermal Field.
The percentage o f sand and the interval gradients for the Elmore
Fig 17. A north-south section across the Salton Sea Geothermal Field showing
that the thermal cap does not coincide with the lithologic cap.
percentage, a subjective measure of reservoir quality (Towse, 1976), and the
thickness of the base of the thermal cap are shown for six wells. From south
to north, the wells are Sinclair No. 4, Woolsey No. 1, Magmamax No. 3 , Elmore
No. 1, IID No. 2 , and Sportsman No. 1.
Sandstone

51
Fig. 18. Data from SP logs of nine geothermal wells with markers set at 100-m
intervals (after Chan and Tewhey, 1977). The marker bed occurs at a different
depth in each well, and the logs were displaced vertically so that
similarities among wells can be seen.
. Fig. 19.
amplitude of the magnetic anomaly at the surface for 13 wells. The systematic
variation suggests that there is a physical relationship between the source of
the magnetic anomaly and the source of the heat.
A cross plot of temperature at the base of the thermal cap versus
Fig. 20.
characteristics at different zones from cap rock down to intrusion.
The relationship between the lithology and the heat transfer

.
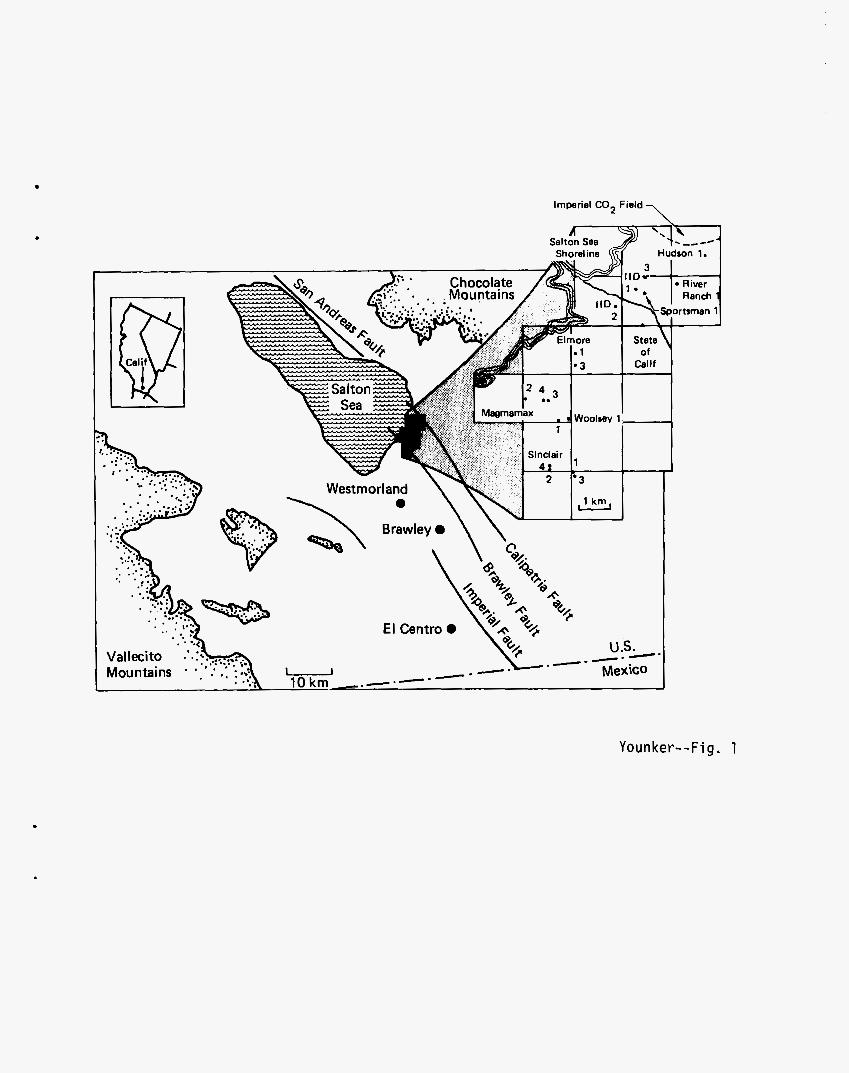
7 Imperial C 0 2 Field
.
Younker--Fig. 1

. C
250
500
Woolsey 1 Magmamax 2 Magmamax 3 Magmamax 1
--- - E
5 750 a
- E
1000
1250
[E] Cap rock
Unaltered resewoir rock
Hydrothermally altered reservoir rock - - Sedimentary stratification
4-
. .
Younker--Fig. 2
i

300
b.
phyllite
Grossularite Calcite Quartz
CaO Wollastonite SiO,
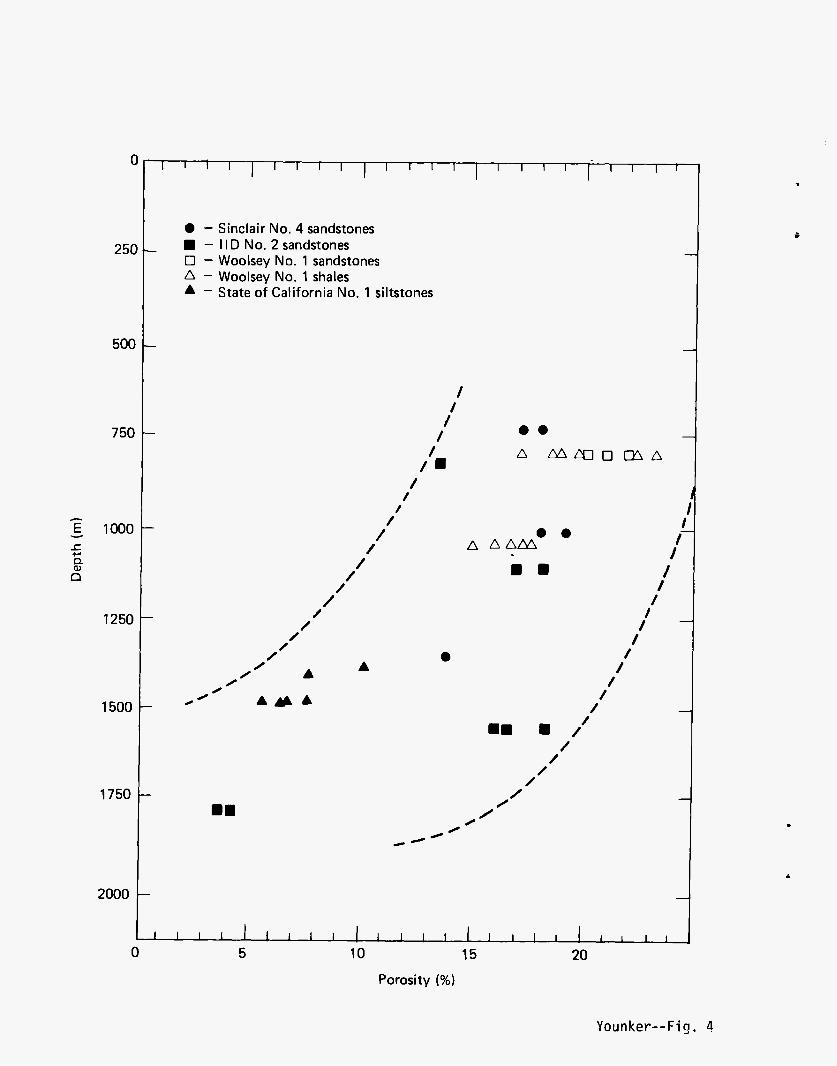
C
25C
500
750
1 - E 1000
5 % n
1250
1500
1750
2000
0 - Sinclair No. 4 sandstones - I I D No. 2 sandstones
0 - Woolsey No. 1 sandstones - Woolsey No. 1 shales
A - State of California No. 1 siltstones
I /
1 /
/ /. 0 .
I .. /
A A A M
/ /
/ /
1 /
/ /
/ / .. . /'
/ /
/ /
0 0
/ 0
0
* - /
0 5 10 15 20
Porosity (%)
Younker--Fig. 4
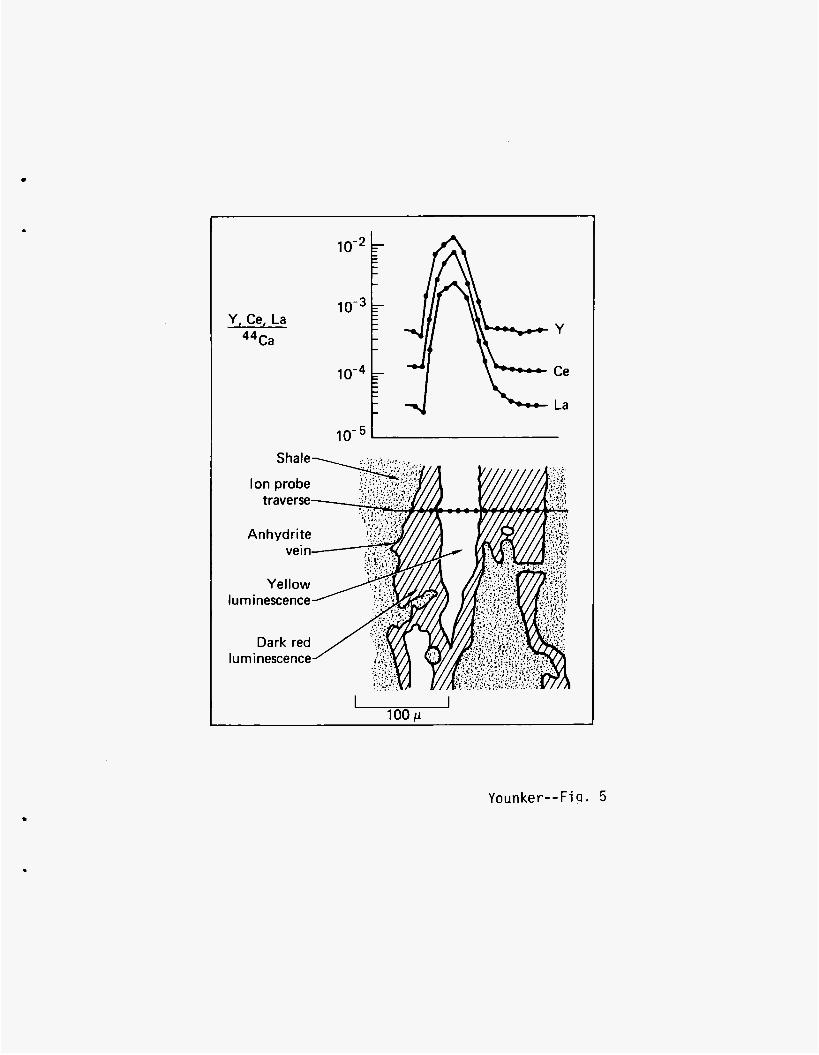
Y , Ce, La 4 4 ~ a
’ 100 p
Younker--Fig. 5

200
300
400
500
600
700 1
E Y
900
1000
1100
1200
1300
1400
0 1 2 3 Horizontal distance (km)
D
E
4
Younker--Fig. G

a
. 5 k m
Younker--Fig. 7
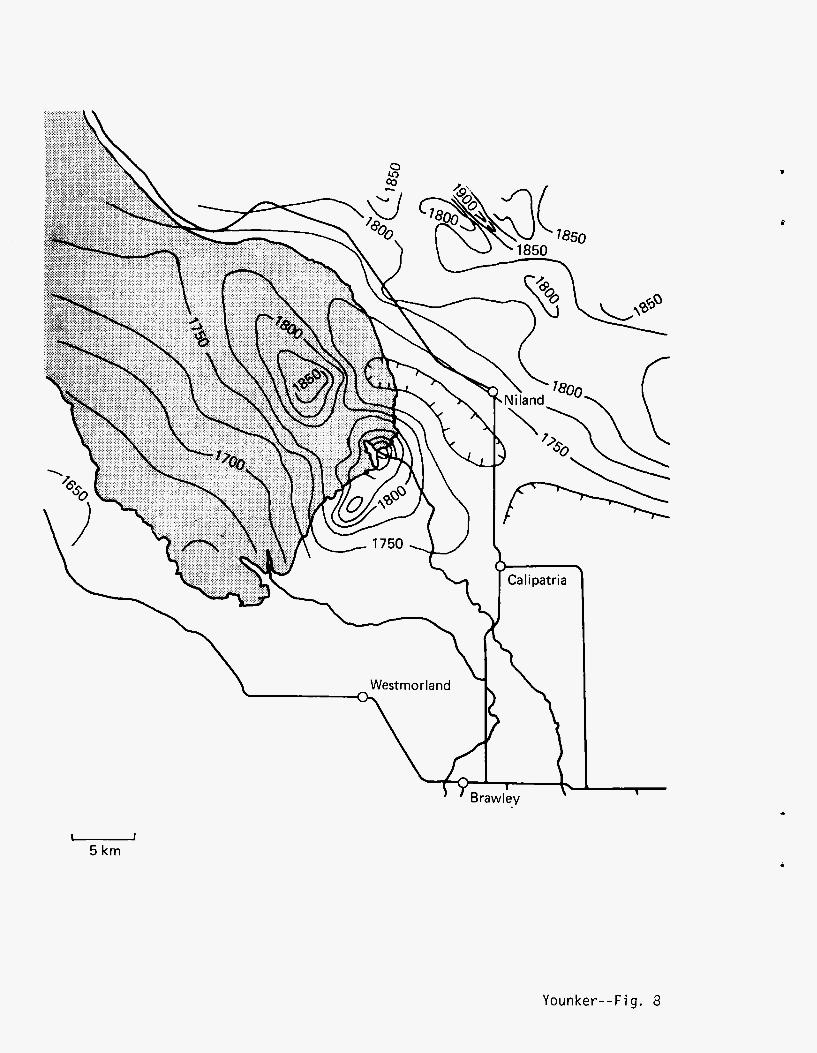
Younker--Fig. 8
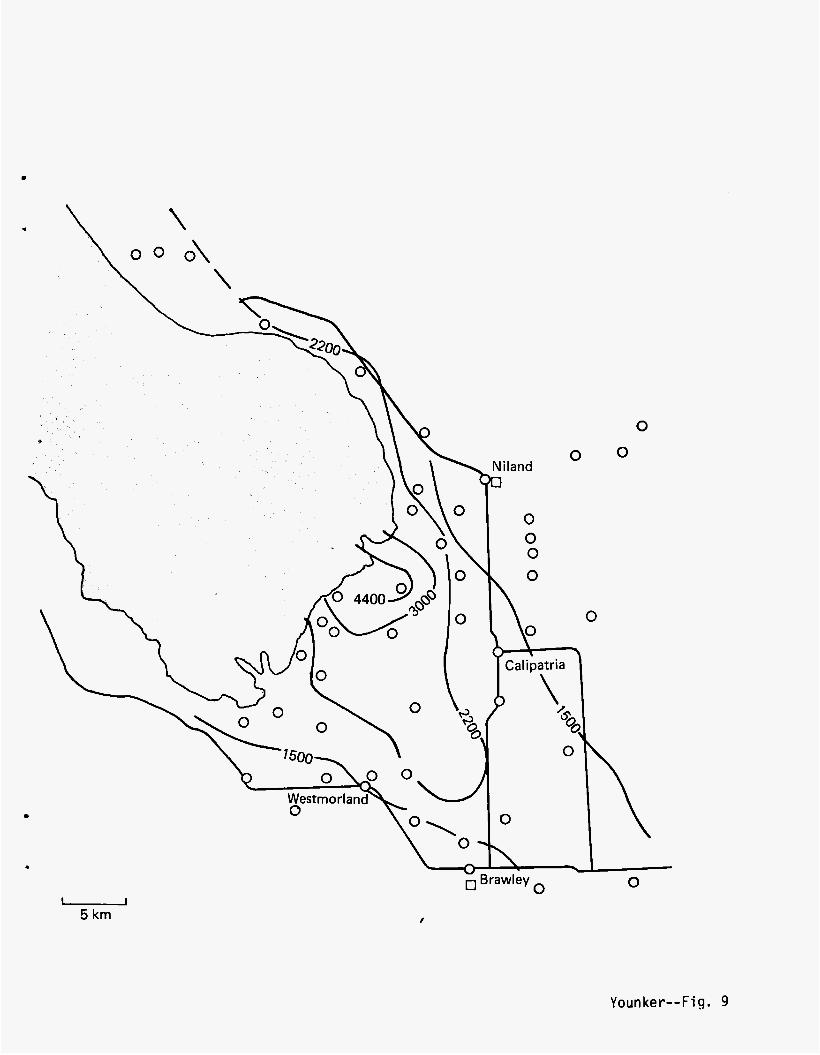
e
5 km
Younker--Fig. 9

E Y
Alamo Obsidian Butte
1.98
4.05
I 1 1 0 1 2 3 4 5
Distance (km)
River
.
Younker--Fin. 10
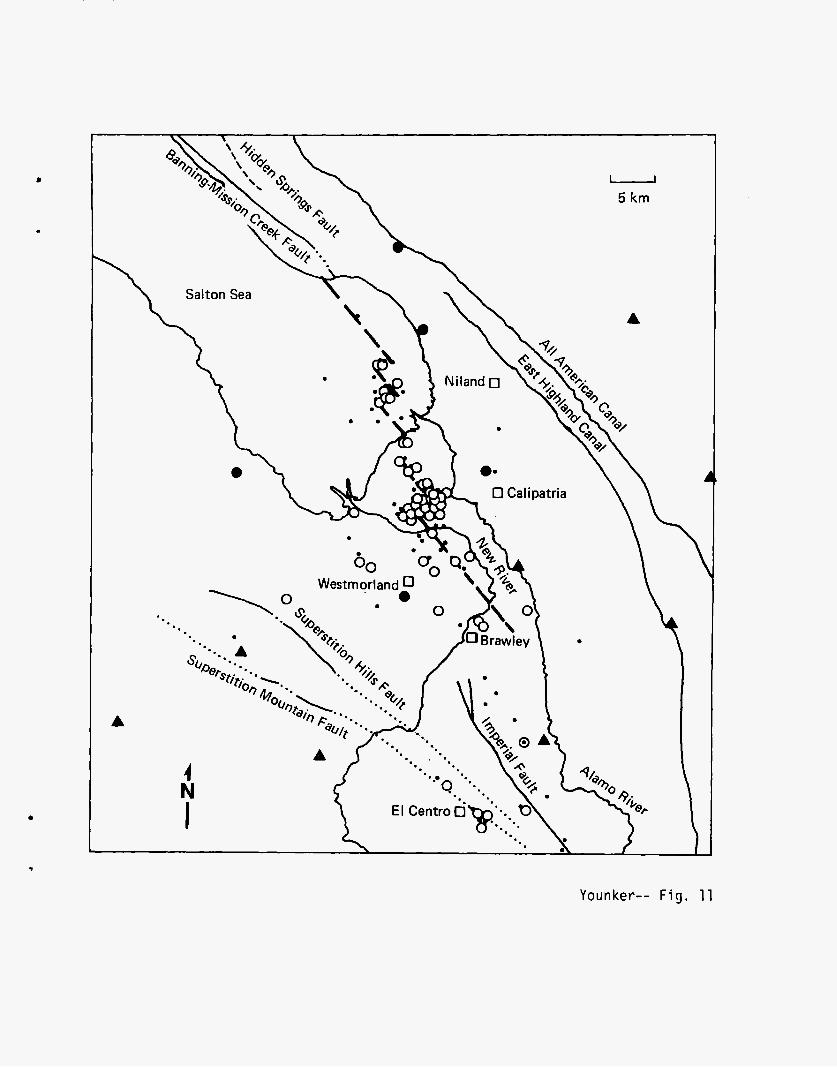
Younker-- F i g . 11
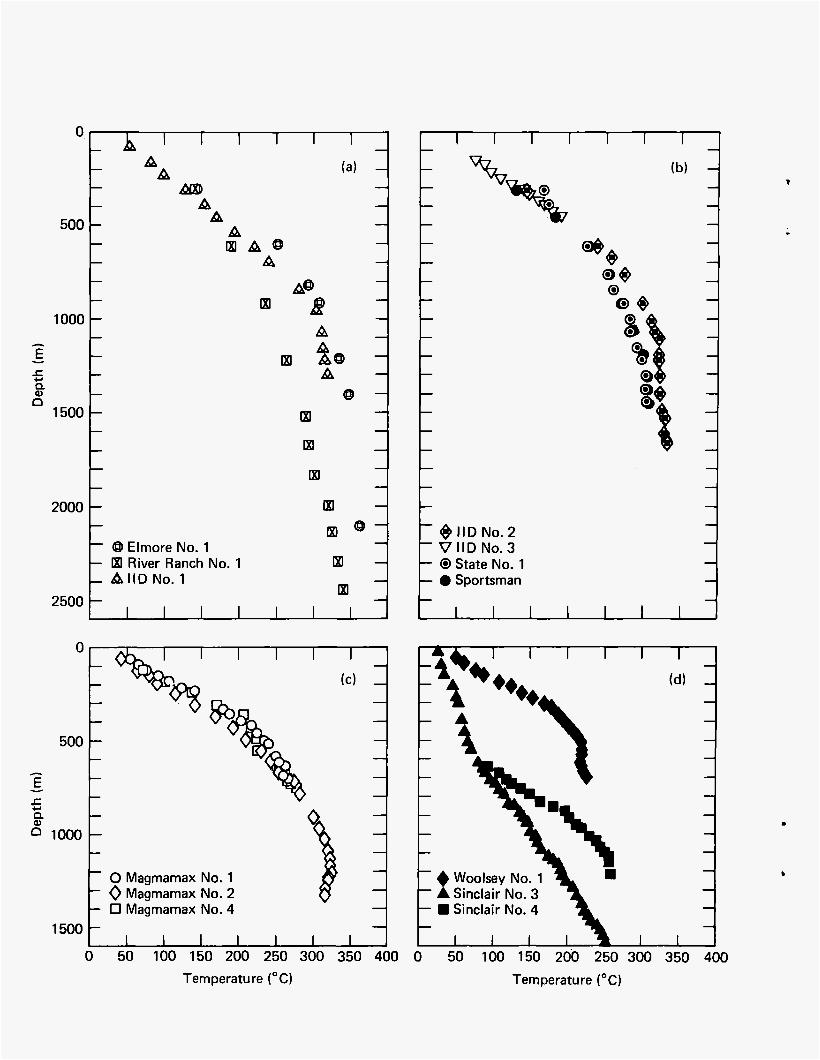
Elmore No. 1
A R I A 0
A
Ix)
a Ixl
m Q
El River Ranch No. 1 0 State No. 1 0 Sportsman
2500
0
500
1% ' @8
1
E
5 Q
E 1000 -
- 0 Magmamax No. 1 - 0 Magmamax No. 2 - 0 Magmamax No. 4
'8, 1 5 0 0 r , I , I , , I 1
0 50 100 150 200 250 300 350 400 0 50 100 150 200 250 300 350 400
Tern peratu re (" C) Temperature ("C)

\ \ \ \ I I a-b
4 N
\ I
Salton Sea
/- /'
. a 1.10
0
b 0.10
mb 0.12
@ b 0.15 ' b
ob 0.16
ob 0.08
' b 0.02
0.06
mb 0.08
2 k m
Younker--Fig. 13
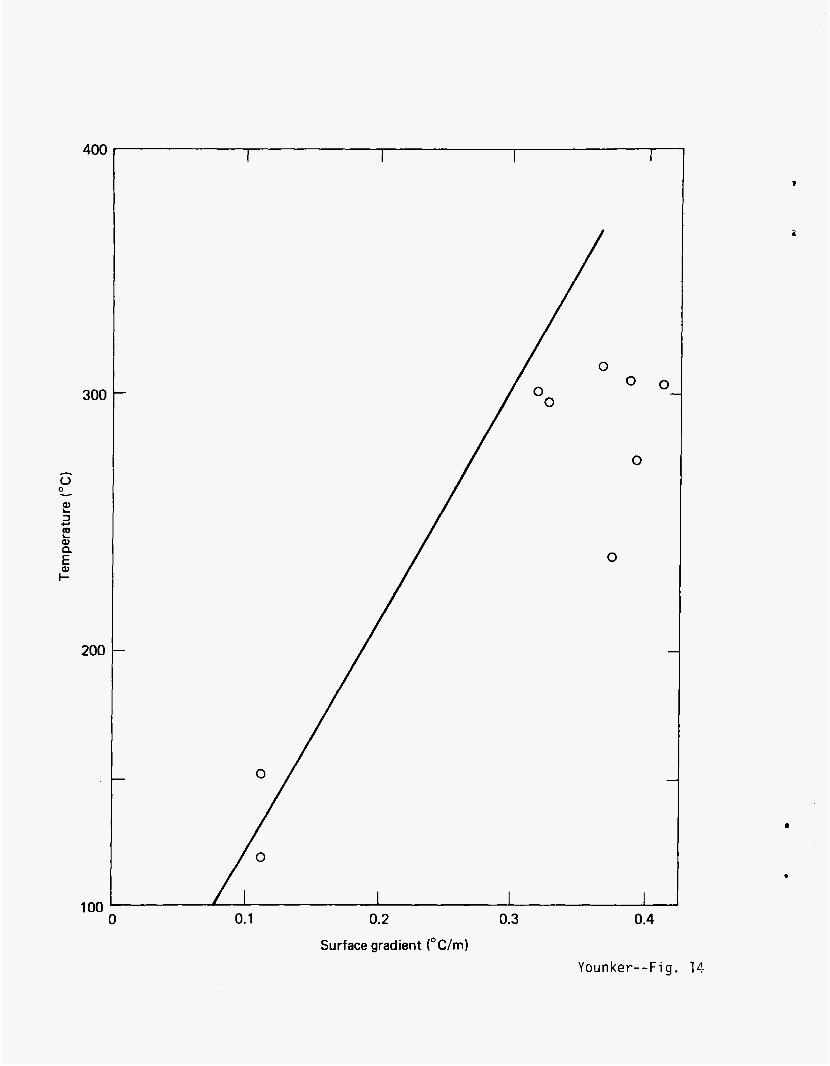
400
300
0 e aJ
200
1 00 0
0
0.1 0.2 0.3
Surface gradient ("C/m)
0
0.4
Younker--Fi g. 1 L!.

Sinclair No. 4 Magmamax No. 2 Woolsey No. 1 llD NO. 1 Sportsman No. 1 State of Calif. No. 1 Sinclair No. 3 Magmamax No. 1 Magmamax No. 3 Elmore No. 1 I ID No. 2 River Ranch No. 1 State of Calif. NO. 1
0
500
- 1000 E
5 n ' 1500 -
2000
2500
0 5 1015 0 5 1015
- :' Interval gradient Interval gradient corrected for sand conductivity
0 5 1015 510 0 51015 5 10 0 5 1015 0 510 -
0
500
1000 1
5 % 0
1500
2000
2500
Younker--Fig. 15
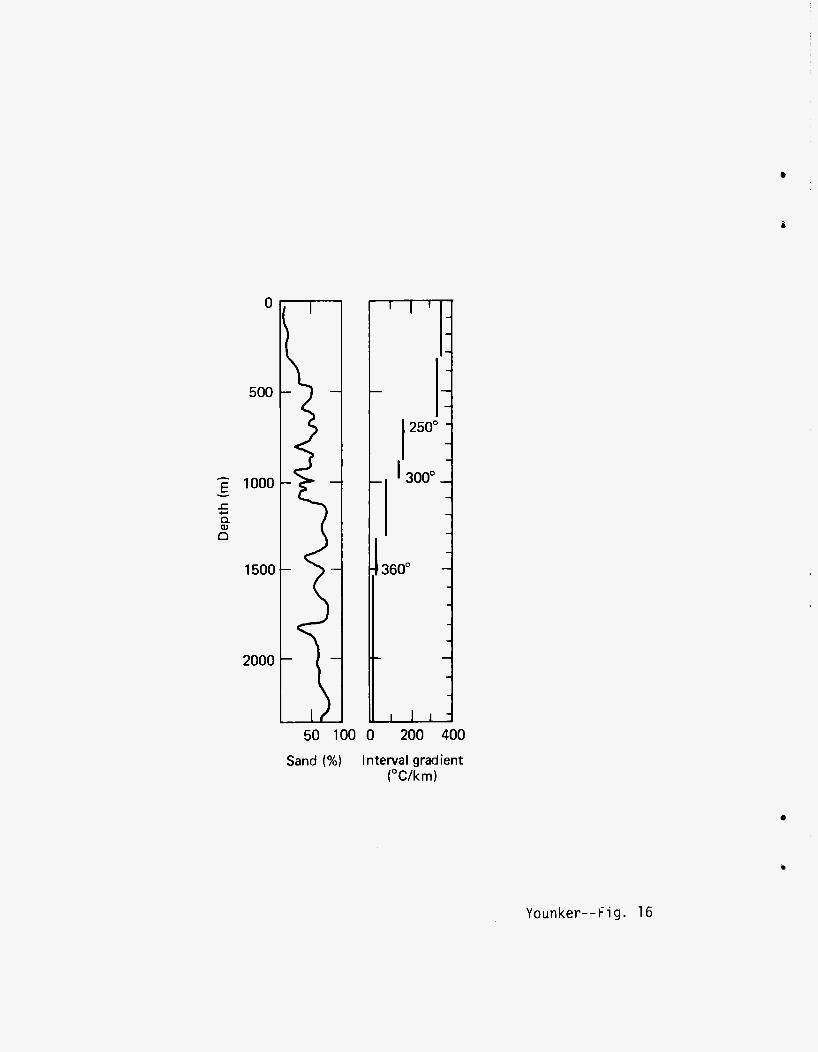
50 100 0 200 400
Sand (%) Interval gradient ('C/km)
Younker--Fig. 16

Base of lithologic cap f Sea level
500 - E
5 n
- !? 1000
1500
Younker--Fig. 17
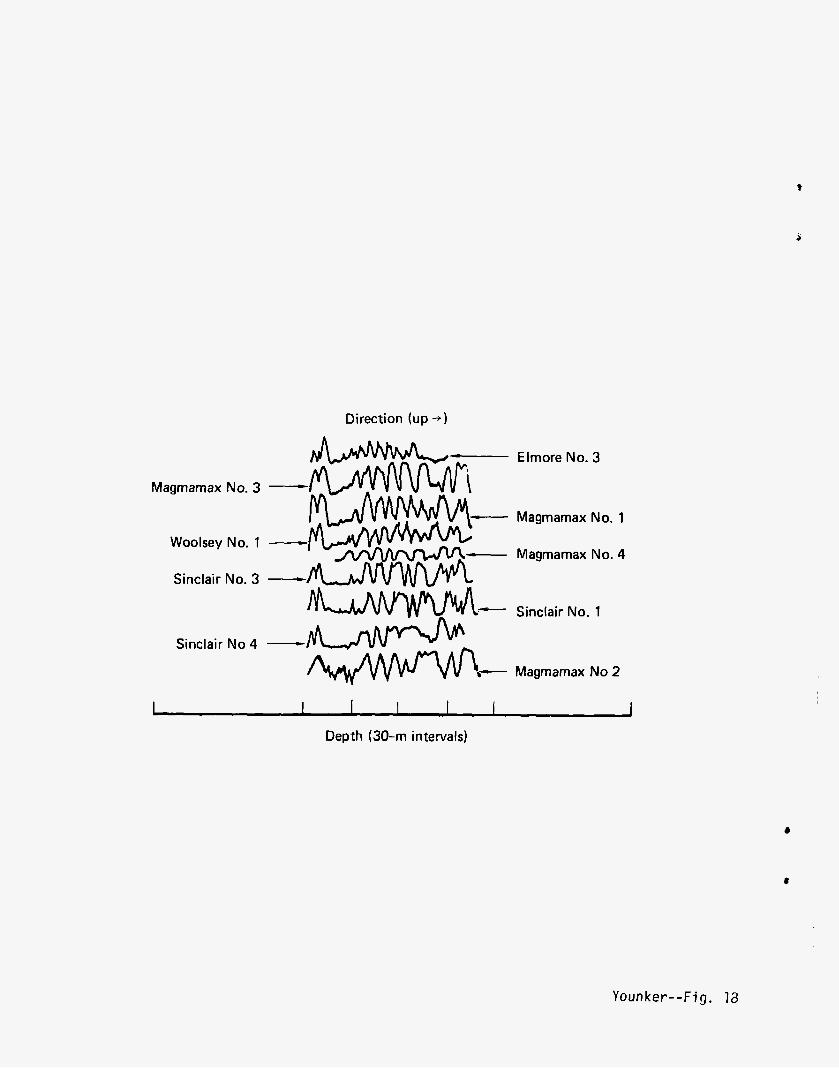
Direction (up -+)
M sagrnamax No. 3
Woo I sey
Sinclair
No. 1
No. 3
Sinclair No 4 -
Elrnore No. 3
Magmamax No. 1
Magmamax No. 4
Sinclair No. 1
Magmarnax No 2
Younker--Fig. 12
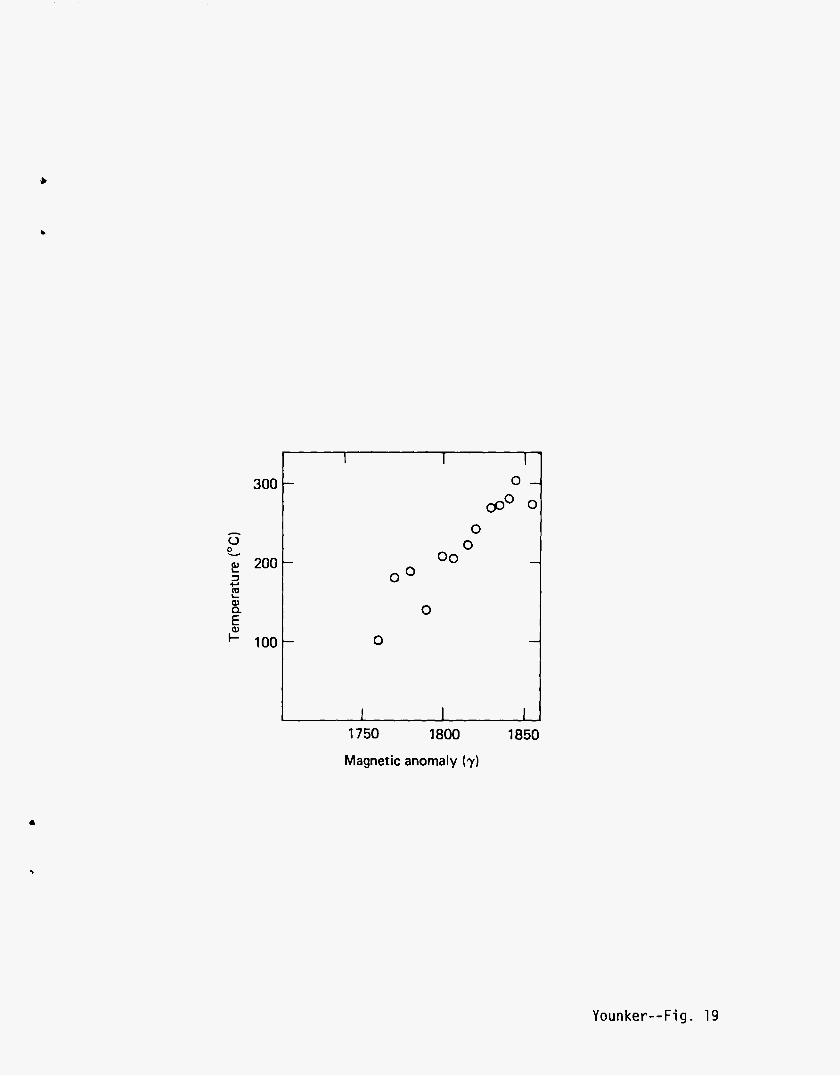
1750 1800 1850
Magnetic anomaly (7)
Younker--Fig. 19
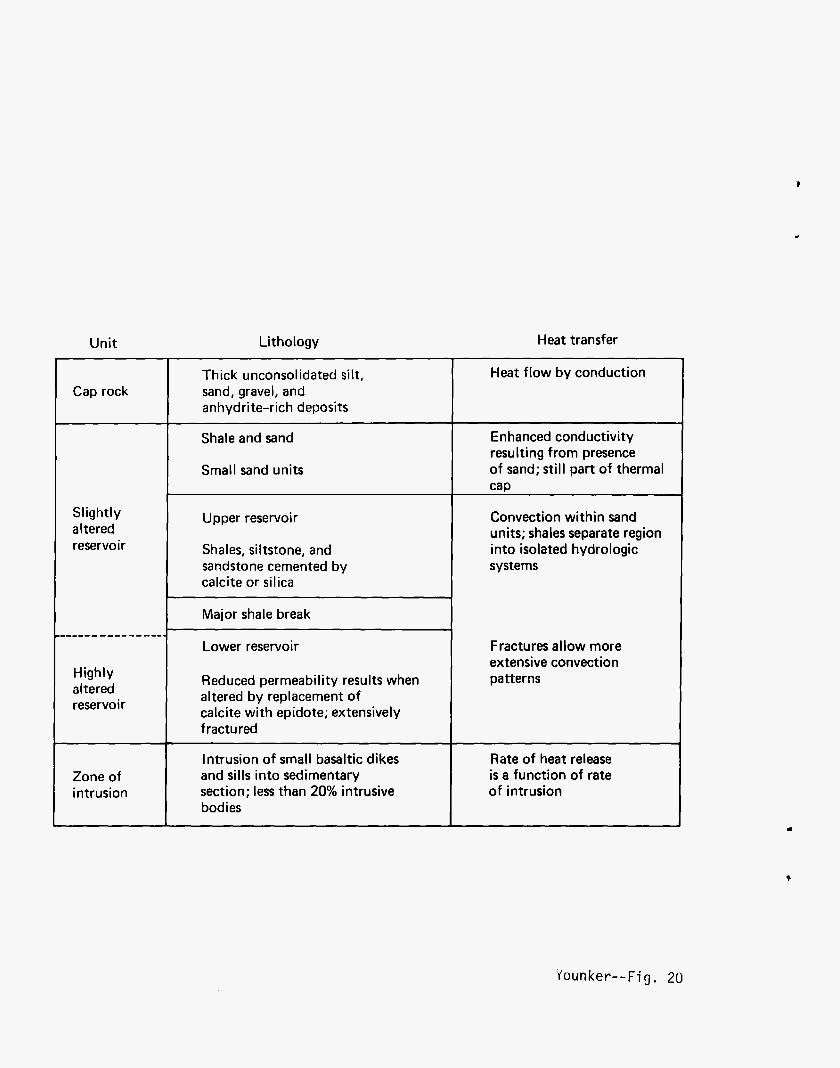
Unit
Cap rock
Highly altered reservoir
Zone of intrusion
I
Lithology Heat transfer ~ ~ ~~~~~~~~~~~
Thick unconsolidated si l t , sand, gravel, and anhydrite-rich deposits
Shale and sand
Small sand units
Upper reservoir
Shales, siltstone, and sandstone cemented by calcite or silica
Major shale break
Lower reservoir
Reduced permeability results when altered by replacement of calcite with epidote; extensively fractured
Intrusion of small basaltic dikes and sills into sedimentary section; less than 20% intrusive bodies
Heat flow by conduction
Enhanced conductivity resulting from presence of sand; st i l l part of thermal cap
Convection within sand units; shales separate region into isolated hydrologic systems
Fractures allow more extensive convection patterns
Rate of heat release is a function of rate of intrusion
You n k e r - - F i g . 2 0
Related Documents