Pro-poor Analysis Of The Dairy Value Chain Pro-poor Analysis Of The Dairy Value Chain Strengthening The Dairy Value Chain Project CARE Bangladesh

Welcome message from author
This document is posted to help you gain knowledge. Please leave a comment to let me know what you think about it! Share it to your friends and learn new things together.
Transcript
Pro-poor Analysis Of The Dairy Value Chain 1
Pro-poor Analysis Of
The Dairy Value Chain
Pro-poor Analysis Of
The Dairy Value Chain
Strengthening The Dairy Value Chain ProjectCARE Bangladesh
Pro-poor Analysis Of The Dairy Value Chain2
Pro-poor Analysis of The Dairy Value Chain of Bangladesh
Published byCARE BangladeshPragati RPR Center (9 th -13th Floor)20-21 Kawran Bazar, Dhaka-1215P.O. Box-226, Dhaka-1000, BangladeshPhone: 88-02-9113215, 88-02-8114207Fax: 88-02-8114183Email: [email protected]: www.carebd.org
Printed byEvergreen Printing and Packaging9, Segun Bagicha, Dhaka-1000
September, 2008
CopyrightCARE Bangladesh

Pro-poor Analysis Of The Dairy Value Chain 3
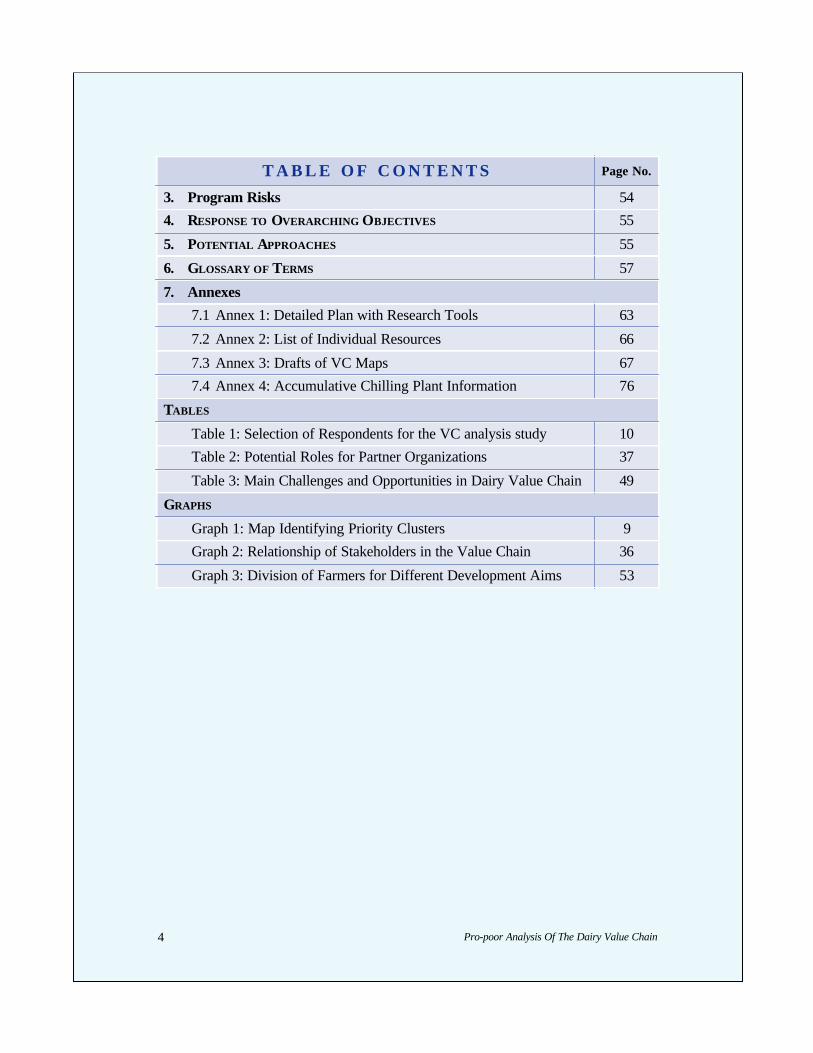
T A B L E O F C O N T E N T S Page No.
Acronyms 5
1. INTRODUCTION TO THE VALUE CHAIN ANALYSIS STUDY 7
1.1 BACKGROUND TO THE STUDY 7
1.2 OBJECTIVES OF THE STUDY 7
1.3 METHODOLOGY OF THE STUDY 8
2. ANALYSIS OF DATA BY OBJECTIVE 12
2.1 NATURE OF PRODUCTION AND CONDITION OF EMPLOYMENT 12
A. NATURE OF PRODUCTION ALONG THE DAIRY VALUE CHAIN 12
Summary of Findings 12
Research Questions 14
B. TERMS AND CONDITIONS OF EMPLOYMENT ALONG THE VALUE CHAIN 22
Summary of Findings 22
Research Questions 22
2.2 GENDER ANALYSIS OF THE DAIRY VALUE CHAIN 27
Summary of Findings 27
Research Questions 27
2.3 MARKET OPPORTUNITIES FOR SMALL SCALE PRODUCERS IN DAIRY SECTOR 31
Summary of Findings 31
Research Questions 32
A Technical Note on Cooperation of Value Chain Actors 36
2.4 INSTITUTIONAL ARRANGEMENTS FOR PROJECT IMPLEMENTATION 38
Summary of Findings 38
Research Questions 38
A Technical Note on the Basics of Institutional Arrangements 42
2.5 BOTTLENECKS LIMITING GROWTH POTENTIAL 43
Summary of Findings 43
Research Questions 43
2.6 POTENTIAL SOCIO-ECONOMIC AND ENVIRONMENTAL IMPACT 52
Summary of Findings 52
Research Questions 52
A Technical Note on Economic Targeting of Clients 53
Pro-poor Analysis Of The Dairy Value Chain4
T A B L E O F C O N T E N T S Page No.
3. Program Risks 54
4. RESPONSE TO OVERARCHING OBJECTIVES 55
5. POTENTIAL APPROACHES 55
6. GLOSSARY OF TERMS 57
7. Annexes
7.1 Annex 1: Detailed Plan with Research Tools 63
7.2 Annex 2: List of Individual Resources 66
7.3 Annex 3: Drafts of VC Maps 67
7.4 Annex 4: Accumulative Chilling Plant Information 76
TABLES
Table 1: Selection of Respondents for the VC analysis study 10
Table 2: Potential Roles for Partner Organizations 37
Table 3: Main Challenges and Opportunities in Dairy Value Chain 49
GRAPHS
Graph 1: Map Identifying Priority Clusters 9
Graph 2: Relationship of Stakeholders in the Value Chain 36
Graph 3: Division of Farmers for Different Development Aims 53

Pro-poor Analysis Of The Dairy Value Chain 5
A C R O N Y M S
A/I Artificial Insemination
BDS Business Development Services
BLRI Bangladesh Livestock Research Institute
BSP Big-Scale Producer
DFP Donor-Funded Project
DLS Department of Livestock
FF Field Facilitator
FGD Focus Group Discussion
FHH Female Headed Household
HH Household
IDI In-Depth Interview
KII Key Informant Interview
MSP Medium-Scale Producer
NGO Non Governmental Organization
PNGO Partner NGO
SP Service Provider (private, government or non-commercial, e.g. NGO)
SSP Small-Scale Producer
VC Value Chain
VCA Value Chain Actors

Pro-poor Analysis Of The Dairy Value Chain6
Pro-poor Analysis Of The Dairy Value Chain 7
1.1 Background to the Study
The Bill & Melinda Gates Foundation has awarded a $5.2 million grant to CAREBangladesh for the “Strengthening the Dairy Value Chain in Bangladesh” project,which will be implemented in 9 districts of North and Northwest of Bangladesh for aperiod of 4 years (2007-2011). The project aims to increase the income of 35,000targeted smallholding and landless milk producer households by at least $20 per monthfrom a current $18-$30. The project will also create employment opportunities forextremely poor households especially women through various activities along the valuechain. The project design is based on investment from the private sector anddevelopment of profit-driven infrastructure, making it sustainable.
The vision of success is that targeted landless and smallholding households in Northand Northwest Bangladesh have more sustainable livelihoods through incorporationinto a strengthened milk value chain. The specific objectives of the project are to:improve milk production and collection systems in rural and remote areas; improveaccess to inputs, markets, and services by mobilizing groups of poor farmers,producers, and char dwellers; improve the milk transport network; ensure access toquality services at the producer level; and improve the policy environment.
1.2 Objectives of the Study
As part of the Strengthening the Dairy Value Chain Project, Care Bangladeshcommissioned a value chain analysis study to identify the root causes of constraintson the chain’s development in Northern and Northeast Bangladesh and also assesspotential environmental impacts of the project. The key objectives of the study are to:
1. Explore the nature of production and the terms and conditions of employmentalong the dairy value chain in Bangladesh
2. Conduct a gender analysis of the value chain while highlighting (the differentpositions) of men and women across the chain and addressing issues of powerreflected in the production and exchange relationships
3. Identify opportunities to improve market outcomes, raise productivity andwages, and foster pro-poor growth in the dairy sector of Bangladesh
4. Focus on institutional arrangements that link producers, processors,marketers and distributors while recognizing that power differentials amongactors may influence outcomes along the chain
5. Identify particular bottlenecks/hindrances that limit the growth potential ofthe sector and address power and inequalities along the value chain
6. Assess potential socio-economic and environmental impact of a dairy valuechain development project in the area
1. Introduction to the Value Chain Analysis Study
Pro-poor Analysis Of The Dairy Value Chain8
1.3 Methodology of the Study
CARE contracted an international lead consultant and a research team leader for atotal of 23 days (12 days for the lead consultant and 11 days for the research teamleader) who together oversaw and conducted the value chain analysis study. Thefollowing paragraph provides an overview of the consultancy and the roles of thelead consultant, Linda Jones and research team leader, Eugene Ryazanov. The fieldstudy in Bangladesh was conducted from 23 December, 2007 till 4 January, 2008 bythe research team leader and followed up from 5 January till 12 January by the leadconsultant.
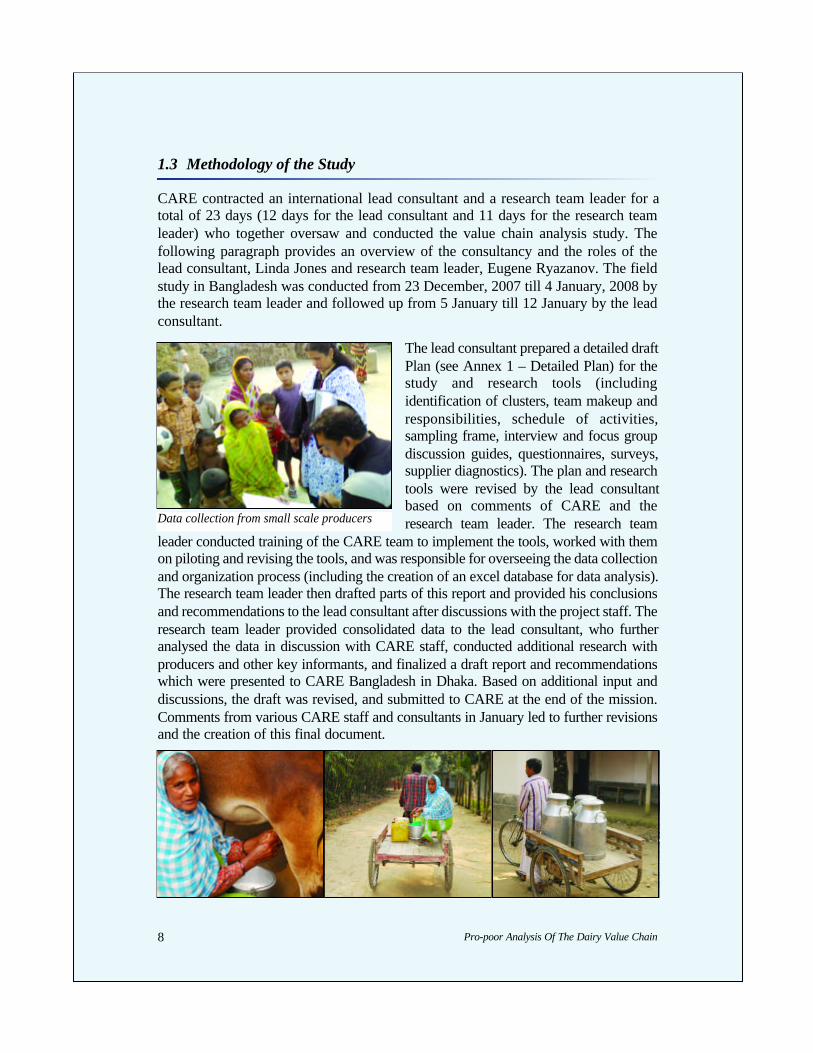
The lead consultant prepared a detailed draftPlan (see Annex 1 – Detailed Plan) for thestudy and research tools (includingidentification of clusters, team makeup andresponsibilities, schedule of activities,sampling frame, interview and focus groupdiscussion guides, questionnaires, surveys,supplier diagnostics). The plan and researchtools were revised by the lead consultantbased on comments of CARE and theresearch team leader. The research team
leader conducted training of the CARE team to implement the tools, worked with themon piloting and revising the tools, and was responsible for overseeing the data collectionand organization process (including the creation of an excel database for data analysis).The research team leader then drafted parts of this report and provided his conclusionsand recommendations to the lead consultant after discussions with the project staff. Theresearch team leader provided consolidated data to the lead consultant, who furtheranalysed the data in discussion with CARE staff, conducted additional research withproducers and other key informants, and finalized a draft report and recommendationswhich were presented to CARE Bangladesh in Dhaka. Based on additional input anddiscussions, the draft was revised, and submitted to CARE at the end of the mission.Comments from various CARE staff and consultants in January led to further revisionsand the creation of this final document.
Data collection from small scale producers
Pro-poor Analysis Of The Dairy Value Chain 9
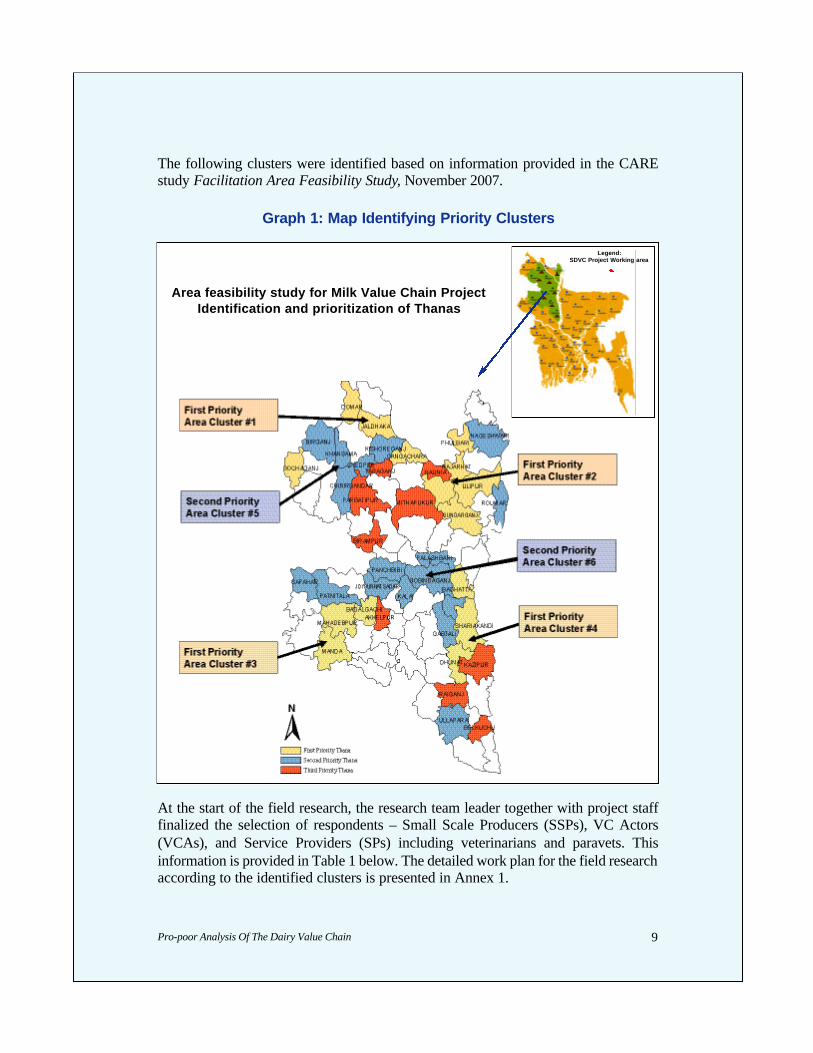
The following clusters were identified based on information provided in the CAREstudy Facilitation Area Feasibility Study, November 2007.
Graph 1: Map Identifying Priority Clusters
At the start of the field research, the research team leader together with project stafffinalized the selection of respondents – Small Scale Producers (SSPs), VC Actors(VCAs), and Service Providers (SPs) including veterinarians and paravets. Thisinformation is provided in Table 1 below. The detailed work plan for the field researchaccording to the identified clusters is presented in Annex 1.
Legend:SDVC Project Working area
Area feasibility study for Milk Value Chain ProjectIdentification and prioritization of Thanas
Pro-poor Analysis Of The Dairy Value Chain10
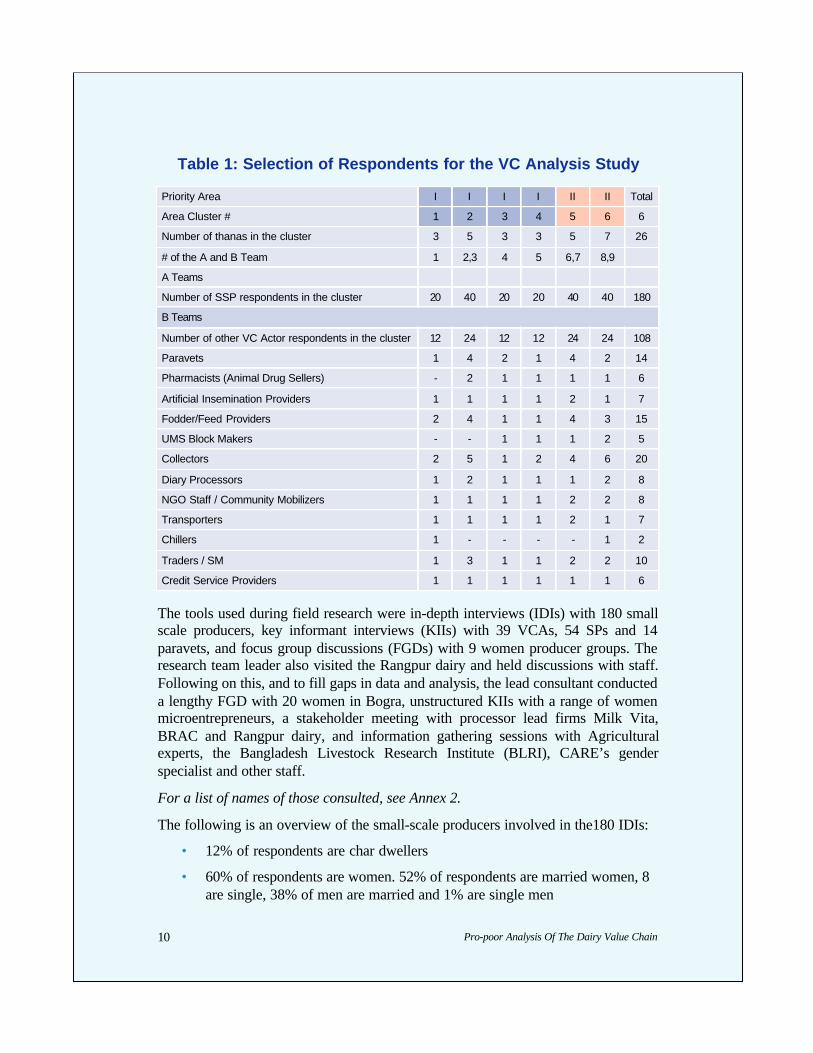
Table 1: Selection of Respondents for the VC Analysis Study
The tools used during field research were in-depth interviews (IDIs) with 180 smallscale producers, key informant interviews (KIIs) with 39 VCAs, 54 SPs and 14paravets, and focus group discussions (FGDs) with 9 women producer groups. Theresearch team leader also visited the Rangpur dairy and held discussions with staff.Following on this, and to fill gaps in data and analysis, the lead consultant conducteda lengthy FGD with 20 women in Bogra, unstructured KIIs with a range of womenmicroentrepreneurs, a stakeholder meeting with processor lead firms Milk Vita,BRAC and Rangpur dairy, and information gathering sessions with Agriculturalexperts, the Bangladesh Livestock Research Institute (BLRI), CARE’s genderspecialist and other staff.
For a list of names of those consulted, see Annex 2.
The following is an overview of the small-scale producers involved in the180 IDIs:
• 12% of respondents are char dwellers
• 60% of respondents are women. 52% of respondents are married women, 8are single, 38% of men are married and 1% are single men
Priority Area I I I I II II Total
Area Cluster # 1 2 3 4 5 6 6
Number of thanas in the cluster 3 5 3 3 5 7 26
# of the A and B Team 1 2,3 4 5 6,7 8,9
A Teams
Number of SSP respondents in the cluster 20 40 20 20 40 40 180
B Teams
Number of other VC Actor respondents in the cluster 12 24 12 12 24 24 108
Paravets 1 4 2 1 4 2 14
Pharmacists (Animal Drug Sellers) - 2 1 1 1 1 6
Artificial Insemination Providers 1 1 1 1 2 1 7
Fodder/Feed Providers 2 4 1 1 4 3 15
UMS Block Makers - - 1 1 1 2 5
Collectors 2 5 1 2 4 6 20
Diary Processors 1 2 1 1 1 2 8
NGO Staff / Community Mobilizers 1 1 1 1 2 2 8
Transporters 1 1 1 1 2 1 7
Chillers 1 - - - - 1 2
Traders / SM 1 3 1 1 2 2 10
Credit Service Providers 1 1 1 1 1 1 6

Pro-poor Analysis Of The Dairy Value Chain 11
• Average age of SSP is 36 years
• 42% have salary as a main source of income; 29% from other agriculturalactivities, 14% from selling of milk and 15% from small business (9%) andother sources of income (6%)
• 42% of SSP have land of average size 0,48 acres; 80% of land owners arehusbands (men) and 18% are women (10% female-headed HH and 8% arewife). Other members of the HH are owners of the land in 3% of cases
Pro-poor Analysis Of The Dairy Value Chain12
Section 2 responds to the six objectives outlined in the TOR in subsections 2.1through 2.6. A Summary of Findings is presented at the start of each subsection,followed by detailed supporting data analyzed from the field research.
2.1 Nature of Production and Condition of Employment
A. Nature of Production along the Dairy Value Chain
Summary of findings
2. Analysis of Data by Objectives
Main Production Challenges Recommended Solutions
The lack of appropriate andaffordable feeds is one of the biggestchallenges to producers in allcategories.
SSPs trained on and use of fodder with high nutritioncontent1 or urea blocks by lead farmers or PNGOswho are trained by CARE. Simple training materialsprepared.
Information transfer supported by radioprogramming, billboards etc. as analyzed andappropriate to the context. Paravets also reinforceinformation with embedded advisory services. Othercombinations of feeds investigated and promoted –acquire info from BLRI.
Knowledge of animal managementincluding hygiene is limited amongstmany SSPs. Even the poorestfarmers, with little or no cost, canbenefit from this information.
SSPs trained on animal management by leadfarmers and PNGOs who are trained by CARE.
Simple training materials prepared.
Information transfer supported by radioprogramming, billboards etc. as analyzed andappropriate to the context.
Paravets also reinforce information with embeddedadvisory services.
1 The project will explore other fodder and supplements as alternatives
Pro-poor Analysis Of The Dairy Value Chain 13
Main Production Challenges Recommended Solutions
Knowledge of and access toaffordable and appropriate animalhealthcare – vaccines, deworming,calf diarrhoea – is a challenge formany SSPs.
Fee-for-service Paravet system established byCARE – review CARE models and select the bestone for project replication.
Prepare modules for dairy.
Recruit paravets from women, men and youth.
Work with consultants2 to advocate government toreduce tariffs on imported medicines, and toincrease production of local vaccines.
Improved crossbreeds for increasedproduction – there is considerableconfusion about appropriatecrossbreeding and their adaptabilityto the local context.
Appropriate crossbreeds identified. CARE workswith BLRI, Milk Vita and others to select and pilotcrossbreeds. Crossbreeds to be initially piloted withclusters of larger SSPs who have superior animalmanagement – farmers with longevity of experienceand 4-5+ cows.
Access to effective artificialinsemination is limited – even whenA/I is available, it is often not wellmanaged and ineffective.
A/I services to be available through private sectorproviders (paravets and other commercialproviders). CARE may support development ofgovernment A/I services through advocating andfacilitation activities. Semen of selected crossbreedsto be made available to A/I providers.
Lack of overall knowledge andaccess to production information iswidespread, and not in formatsaccessible by SSPs.
SSPs to be exposed to information via a range ofmedia – billboards, radio programs, leaflets asanalyzed and appropriate. CARE facilitates thedevelopment of such materials with selectedstakeholders.
SSPs are not organized into groupsto take advantage of potentialtraining and other services.
CARE works with SSPs via its Field Facilitators(FFs) and possibly selected PNGOs to form groupsto access training and other services.
2 CARE has identified a professional consulting team who has experience advocating the government and would bemore effective than CARE staff acting on their own. The structure and the responsibilities of this relationship wouldneed to be defined.
Pro-poor Analysis Of The Dairy Value Chain14
The Plan (Annex 1) proposed the following method and key research questionsfor Objective 1 A. of the VC study. Answers to the questions are provided in thissection.
• Method
Assess current situation of milk production by target group usingqualitative tools aimed at collecting information from a representativesampling in each district of 1) smallholder and landless owners of dairycows and 2) support service providers and others in value chain (vets orparavets, input suppliers, traders/collectors/ buyers, transporters, financialservices providers, business advisors, quality controller).
Key Research Questions
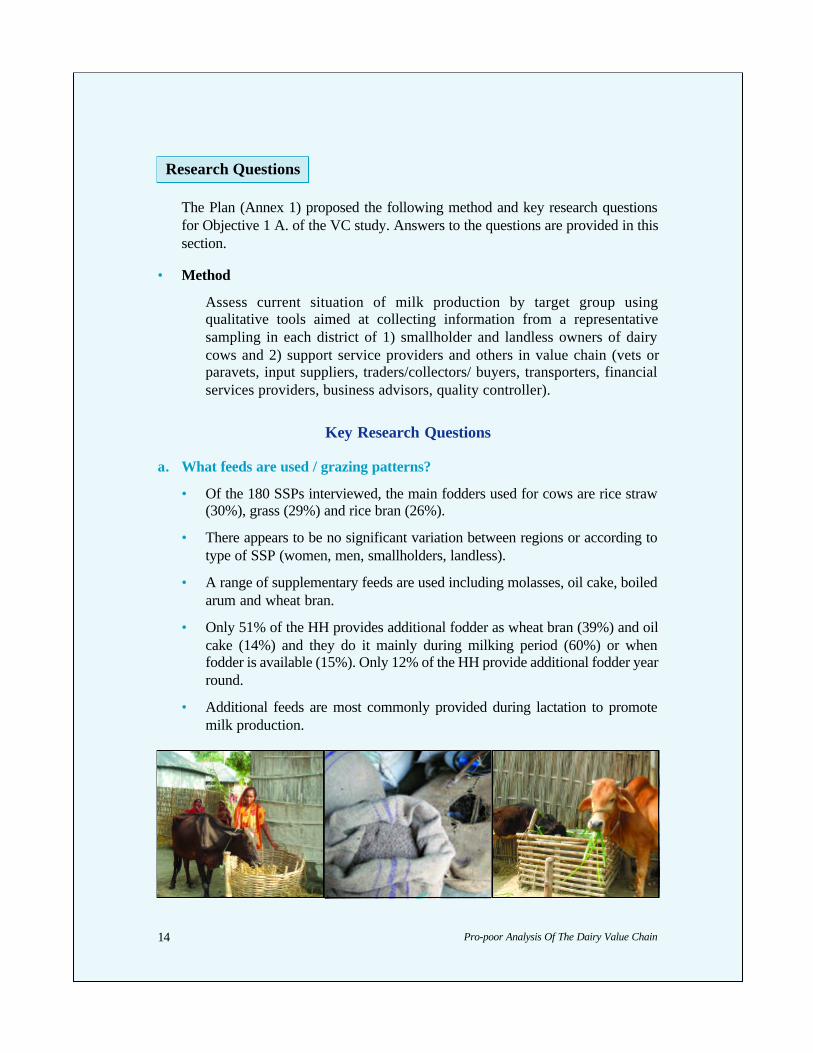
a. What feeds are used / grazing patterns?
• Of the 180 SSPs interviewed, the main fodders used for cows are rice straw(30%), grass (29%) and rice bran (26%).
• There appears to be no significant variation between regions or according totype of SSP (women, men, smallholders, landless).
• A range of supplementary feeds are used including molasses, oil cake, boiledarum and wheat bran.
• Only 51% of the HH provides additional fodder as wheat bran (39%) and oilcake (14%) and they do it mainly during milking period (60%) or whenfodder is available (15%). Only 12% of the HH provide additional fodder yearround.
• Additional feeds are most commonly provided during lactation to promotemilk production.
Research Questions
Pro-poor Analysis Of The Dairy Value Chain 15
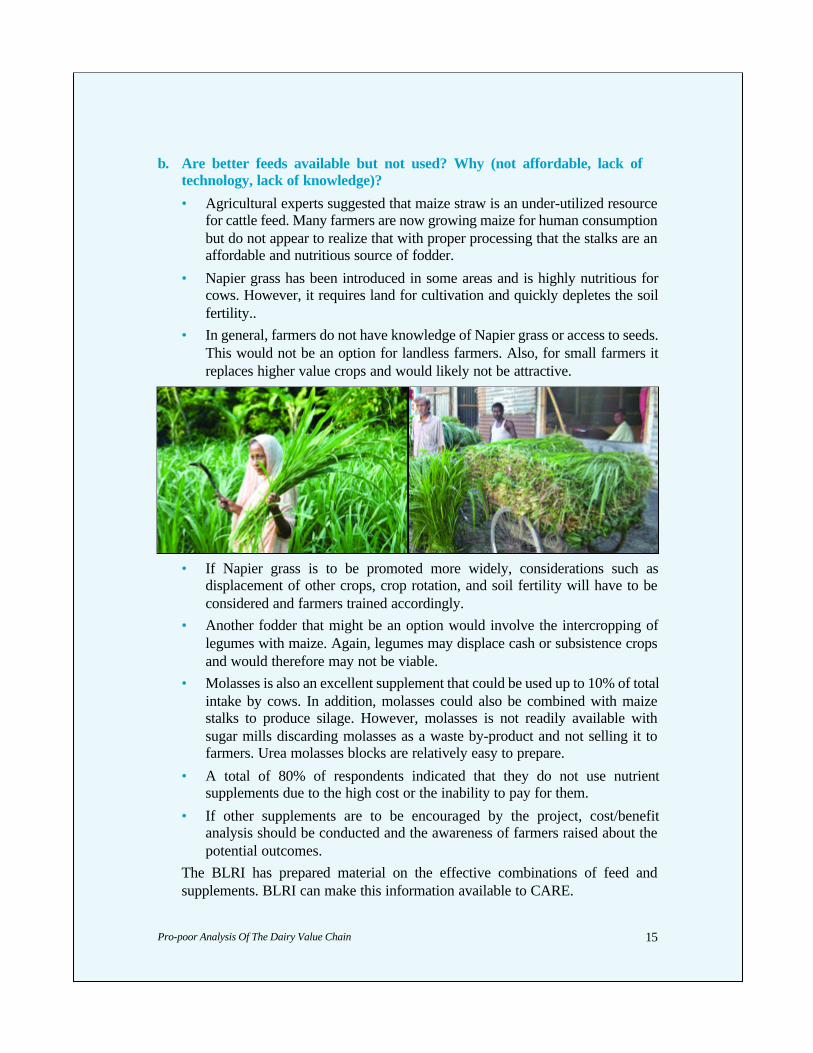
b. Are better feeds available but not used? Why (not affordable, lack oftechnology, lack of knowledge)?
• Agricultural experts suggested that maize straw is an under-utilized resourcefor cattle feed. Many farmers are now growing maize for human consumptionbut do not appear to realize that with proper processing that the stalks are anaffordable and nutritious source of fodder.
• Napier grass has been introduced in some areas and is highly nutritious forcows. However, it requires land for cultivation and quickly depletes the soilfertility..
• In general, farmers do not have knowledge of Napier grass or access to seeds.This would not be an option for landless farmers. Also, for small farmers itreplaces higher value crops and would likely not be attractive.
• If Napier grass is to be promoted more widely, considerations such asdisplacement of other crops, crop rotation, and soil fertility will have to beconsidered and farmers trained accordingly.
• Another fodder that might be an option would involve the intercropping oflegumes with maize. Again, legumes may displace cash or subsistence cropsand would therefore may not be viable.
• Molasses is also an excellent supplement that could be used up to 10% of totalintake by cows. In addition, molasses could also be combined with maizestalks to produce silage. However, molasses is not readily available withsugar mills discarding molasses as a waste by-product and not selling it tofarmers. Urea molasses blocks are relatively easy to prepare.
• A total of 80% of respondents indicated that they do not use nutrientsupplements due to the high cost or the inability to pay for them.
• If other supplements are to be encouraged by the project, cost/benefitanalysis should be conducted and the awareness of farmers raised about thepotential outcomes.
The BLRI has prepared material on the effective combinations of feed andsupplements. BLRI can make this information available to CARE.

Pro-poor Analysis Of The Dairy Value Chain16
c. Are vet or paravet services available and affordable (what is the cost)? Whichservices are used by small-scale producers and with what frequency: A/I,technical advice, treatment of sick animals? (Link to poverty profile, gender, age)
• Paravet services are sometimes available – although the data is contradictoryon this score (71% of respondents reported availability, but later 57% reportedthey don’t use services due to lack of availability).
• SSPs stated that the best way to get information about animal care is fromfriends/ neighbours (48%), paravets (33%) and NGOs (11%).
• No HHs reported receiving information from mass media;
• 91% of respondents reported having used paravet services at some time
• HH access services from local paravets (52%) or a nearby town (25%), while16% (or 1 in 6 HH) uses the services of a traditional healer.
• The average payment for one visit of a paravet is 70 TK, and this covers arange of services.
• Only 67% of surveyed HH are satisfied with paravet services. The mainreasons for their frustrations are unavailability of services (47%), high price(43%), low quality (19%) and long distance (12%).
• Producers who work with processors are more likely to have access toparavets, as are those who are involved in the current CARE paravet program.
• Of the 180 SSPs surveyed, the services most commonly accessed are:sometimes for sickness (31%), vaccinations (26%), de-worming (19%),artificial insemination (A/I) (11%) and all sicknesses (11%).
• In FGDs, women reported that they would utilize more healthcare services iffemale paravets were available. In particular, women do not feel comfortableseeking A/I services.
• Both smallholder and landless farmers, as well as farmers with variablenumbers of cows reported accessing paravet services.

Pro-poor Analysis Of The Dairy Value Chain 17
• A/I is used more in some regions than others – it is unknown if this is basedon practice or availability of services.
• HHs mainly breed cows locally (92%) and only 8% in A/I Centers.
• 90% of the HHs report burying dead cows – there is some scepticism about thisresponse among project staff who have witnessed them throwing cows in theriver.
• Agriculture experts reported that improper disposal of dead animals – withskinning prior to burial – contributes to the spread of anthrax.
• The average size of a cow-shed is 14 x 8 x 8 ft which typically houses 2 to 3cows. Proper ventilation is essential to cows, and higher sheds with good flowof air would be beneficial particularly to less hardy cross-breeds.
d. What are the roles of men, women, boys and girls in production? (Feeding,healthcare, breeding, milking, marketing etc.) Are there variations in theroles according to poverty profile, season, time of day, household dynamics,and individual preference?
• There is some overlap of work between men and women but there are definitedistinct patterns.
• Decisions about farm management are taken by the husband (44%) wife(35%) and female head of HH (16%).
• Women tend to have more responsibility for feeding, milking, healthcare andselling to neighbors.
• Men play a greater role in buying animals, breeding and selling to markets.
• There do not appear to be significant differences according to other variables.
• The exception is when husbands are absent or in FHHs, women have to takegreater responsibility.
• In some households, women receive more help. The CARE gender advisorindicated that gender sensitization has been proven effective in elicitingsupport for women from other household members.

Pro-poor Analysis Of The Dairy Value Chain18
e. What are the main problems faced by households with their cows?
• The main challenges that HHs face in this work are: unavailability of feed(32%), health care and diseases (27%) and high price of feed (11%).
• It is interesting to note that only 3% of SSPs3 consider distance to market anissue.
• A key consideration regarding fodder is the cost, particularly since it has risendramatically over the past year.
• Ag experts stated that critical healthcare issues need to be addressed. There isa prevalence of parasites and calf diarrhea, and the need for vaccinationagainst common diseases (anthrax, foot and mouth disease, rabies, blackwater etc.)
• See b. and c. above for information on fodder and paravets respectively.
• Secondary problems (after fodder and healthcare) are lack of time (especiallynoted by women in FGDs), less grazing land, shortage of milk, and financialcrises.
• Respondents did not emphasize the need for A/I although cross-breeding orimproved breeds were identified as issues by all the Ag experts consulted.
• Local breeds are very hardy and can withstand heat, humidity, parasites andpoor nutrition – however, their production of milk is consistently low underthese conditions.
• Under improved conditions, local breeds may produce up to 2.5 L (somereports stated 5 L but this seems doubtful).
• Crossbreeds may produce 5++ L but are more susceptible to heat, humidityand disease. Without proper care, they will produce less than local breeds orsuccumb to illness and death.
• There are some local breeds that might be better producers: Pavna,Chittagong red, Shahjadpur.
• A type of Pavna is available through the BLRI, and they indicated that theywould consider a research partnership with CARE whereby germ plasmacould be used on a pilot basis. This breed produces 3 L and is a hardy variety.
• In Bogra, we witnessed crossbreeds of local cows with Frisians. These cowsare producing 4-5 L per day and seemed healthy. The producers indicatedthat they had to be careful about hygiene and shade to keep the animals cooland dry.
3 It should be noted that on the next page the HH will mention the distance to the market as an issue again but it willbe related to sale of milk and in this case they gave answer on general question about HH problems.
Pro-poor Analysis Of The Dairy Value Chain 19
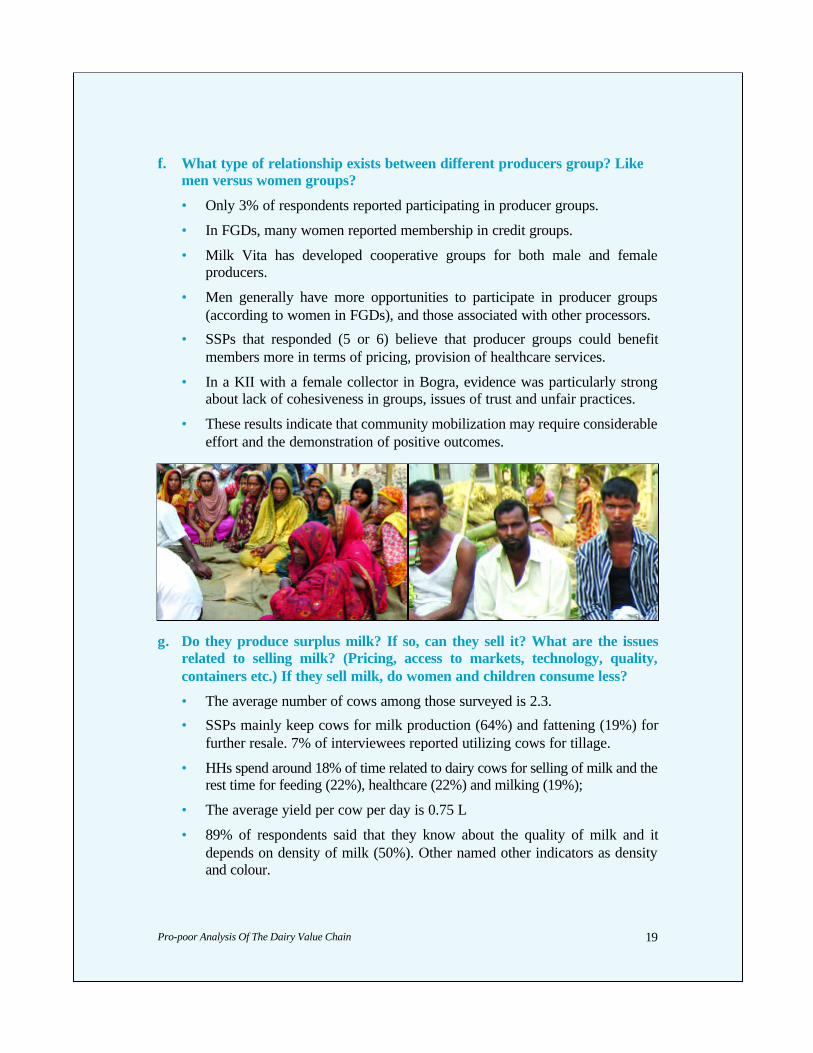
f. What type of relationship exists between different producers group? Likemen versus women groups?
• Only 3% of respondents reported participating in producer groups.
• In FGDs, many women reported membership in credit groups.
• Milk Vita has developed cooperative groups for both male and femaleproducers.
• Men generally have more opportunities to participate in producer groups(according to women in FGDs), and those associated with other processors.
• SSPs that responded (5 or 6) believe that producer groups could benefitmembers more in terms of pricing, provision of healthcare services.
• In a KII with a female collector in Bogra, evidence was particularly strongabout lack of cohesiveness in groups, issues of trust and unfair practices.
• These results indicate that community mobilization may require considerableeffort and the demonstration of positive outcomes.
g. Do they produce surplus milk? If so, can they sell it? What are the issuesrelated to selling milk? (Pricing, access to markets, technology, quality,containers etc.) If they sell milk, do women and children consume less?
• The average number of cows among those surveyed is 2.3.
• SSPs mainly keep cows for milk production (64%) and fattening (19%) forfurther resale. 7% of interviewees reported utilizing cows for tillage.
• HHs spend around 18% of time related to dairy cows for selling of milk and therest time for feeding (22%), healthcare (22%) and milking (19%);
• The average yield per cow per day is 0.75 L
• 89% of respondents said that they know about the quality of milk and itdepends on density of milk (50%). Other named other indicators as densityand colour.

Pro-poor Analysis Of The Dairy Value Chain20
• Processors stated that lacto-scanners are provided to producer groups so thatthey can test milk density prior to consolidation for fair pricing to each farmer.
• 64% of SSPs surveyed report raising cows primarily for milk production.
• 94% reported some income from dairy, earning an average of 31 Tk per daytotal for a price of 18 Tk per L.
• Main marketing channels are selling to other HHs (40%), collectors (31%),who sell milk themselves at the markets and to sweet-makers (9%) and toprocessing factories. Currently only 2% of HHs sell milk to processingfactories, and the marketing channel to the formal market is undeveloped.
• The key challenges in selling of milk are low price (42%), distance to market(22%), lack of transport (14%) and lack of buyers (7%);
• 85% of the respondents who sell milk think that they are in a fair relationshipbecause payment is on time and they have market access, however all areeager to earn more and increase yields.
• 56% of the SSPs stated that there are other market opportunities but they donot use them because of distance (26%)4, insufficient manpower (19%) andunstable price (17%).
• 38% of HHs considers the milk price as fair and only 13% of the HHs sellsmilk the year around.
• 14% indicated that it is a main source of income for the household.
• In 34% of HHs, the husband is responsible for selling milk, in 31% the wife,followed by female heads of HH (13%) and in some cases a son (8%).
• 64% reported selling all the milk that they produce, with approximately 30%not selling all due to household consumption.
• HHs would prefer to sell milk (85%) rather than consume it (15%), with afocus on the management of household expenses.
• When there are less consumption of milk in the HH, the first priority goes tothe husband (26%), then boys (23%), followed by the wife (17%) and lastlygirls (16%).
• The gender specialist at CARE informed us that there is a widespread beliefamongst rural women that it is better to consume less during pregnancy sothe baby will be small and the delivery therefore easier.5
4 SSPs mentioned the reason as "long distance" for different questions during the interviews - CARE may chose toinvestigate this further if it seems relevant to improving project functioning.
5 The TOR did not request information about HH consumption patterns for purchasers of milk. It would beworthwhile for CARE to conduct this study as it moves forward.

Pro-poor Analysis Of The Dairy Value Chain 21
h. Who are the other business services providers in the value chain6? What ismissing? What are the main constraints for small-holders producers toaccess their services?7
• There are limited services for SSPs (see information above and later sectionon VC bottlenecks for more details).
• SSPs do not access services due to availability, cost of services, awarenessand benefit of services.
6 The research team leader trained the project staff in making drafts of maps of VC in each Upazila. They are availablein Annex 4. The drafts will be regularly updated by the project staff in the future.
7 Additional information is available on leading processors in the section on institutional arrangements.
Pro-poor Analysis Of The Dairy Value Chain22
B. Terms and Conditions of Employment along the Value Chain
Summary of Findings
The Plan (Annex 1) proposed the following method and key research questionsfor Objective 1. B of the VC study. Answers to the questions are provided in thissection.
• Method:
Assess current employment opportunities for women and men along the dairyvalue chain using qualitative and quantitative tools aimed at value chainstakeholders and official agencies.
Main Employment Challenges Potential Solutions
Suitable employment needs to bedeveloped throughout value chain asthe formal sector grows.
SSPs are made aware of employment opportunitiesand employers are willing to employ both men andwomen. CARE FFs to create linkages betweenpotential employees (groups) and employers (VCactors) and promote awareness.
Skills of small scale producers aregenerally not adequate foremployment in the formal sector.
SSPs to train as needed by PNGOs or otherpartners to be employable.
CARE to train partners and provide simple trainingmaterials on employment.
Equal opportunities for womenemployees are often not available,although some areas are moresuitable and open to employingwomen.
Employers are sensitized to employment of womenand the value of their contribution.
CARE provides awareness rising.
CARE promotes women in areas where they havestronger employment opportunities – as loanofficers, extension workers and collectors.
Equal opportunities for independentwomen entrepreneurs need to bedeveloped.
Women to be trained in entrepreneurial andtechnical skills for selected businesses:sweetmaking, dairy collection and sales, paravets.
There is a lack of overall knowledgeand access to employmentinformation.
SSPs to be exposed to information via a range ofmedia – billboards, radio programs, leaflets asanalyzed and appropriate to the context. CAREfacilitates the development of such materials withselected stakeholders.
SSPs are not organized into groups totake advantage of potentialemployment training.
CARE works with SSPs via FFs and possiblePNGOs/mobilizers to form groups to access trainingopportunities.
Research Questions

Pro-poor Analysis Of The Dairy Value Chain 23
Key Research Questions
a. At each level of the value chain, what are the employment opportunities forwomen and men?
• HH data indicates that an average of 14% HH income is from selling milk.Wage labour is the highest source at 42%; other agricultural activity accountsfor 29%.
• To understand dairy value chain employment, 39 VCAs, 54 SPs and 14paravets were interviewed. The breakdown of respondents by category isoutlined in Table 1 above.
• In interviews with key informants, there was a much greater willingness tohire men than women.
• 59% of VCAs and 46% of SPs indicated that they employ men, and 41% and36% respectively said they would hire more men if the value chain activityincreases.
• 13% of VCAs and 17% of SPs indicated that they employ women, and 8%and 11% respectively said they would hire more women if the value chainactivity increases.
• Of 39 VCAs and 54 SPs interviewed (total 93), only 17 indicated that theywould hire a woman to carry out work currently done by a man if she werequalified for the work.
• In follow-up KIIs in Bogra, women revealed that they have opportunities ascollectors, milk sellers, sweetmakers, and would be interested in training asparavets and extortionists.
Pro-poor Analysis Of The Dairy Value Chain24
Detailed Employment Analysis by Category
• 38 men are employed by 11 of the 23 input suppliers mainly for selling; somemen perform unskilled labour and financial services. The few womenemployed carry out cleaning tasks. 13 input suppliers stated that they wouldprovide jobs to more men if business expands.
• 5 of the 7 extension service providers employ 24 men, and 4 have hired 11women. Women and men work as trainers, community mobilizers, and creditagents. The extension services did not feel they would require many additionalemployees if value chain activities increase.
• Credit providers employ men (42 total amongst seven organizations) and oneinstitute employs four women. Two of the credit agencies would hire morewomen and only one plans to hire additional men if the value chain grows.
• Six A/I providers were interviewed and they hire a few men, but no women.Two indicated they would be interested in employing more men if theirenterprise expands.
• Transport services and equipment suppliers appeared to have few or no male orfemale employees. Equipment suppliers showed some interest in hiring men ifactivities increase.
• One of the four pharmacies (animal drug sellers) interviewed stated that itemploys four men, while none hire women. One of the remaining pharmaciesstated it would employ more men if needed.8
• 16 of the 10 traders interviewed hire men with an average of four employeeseach across a range of activities. One woman has a job as a cleaner. Nine tradersindicated they will hire more men if business grows.
• Five out of 14 collection centres provides work to one man, and none employwomen. Seven collections centres said that if value chain activity increases,they will hire more men.
• 121 men are employed by five of the six processors / lead firms interviewed;three indicated they would hire more men if business grows. 19 women workfor 4 processors / lead firms, but only 1 is interested in hiring more women.
• 2 of the 3 sweetmakers surveyed indicated that they each hire one man toprepare sweets, and 1 would take on additional staff if demand increases.
• Only 1 of the 3 collectors employs a man, and none are currently willing to hirewomen.
8 Further research on formal and informal animal drug sellers is recommended.
Pro-poor Analysis Of The Dairy Value Chain 25
• Opportunities for women as the subsector expands appear to be in extension,credit, collection and paravet services.
• Opportunities for men are more wide-ranging with significant potential to workfor input suppliers, traders, collection centres and processors.
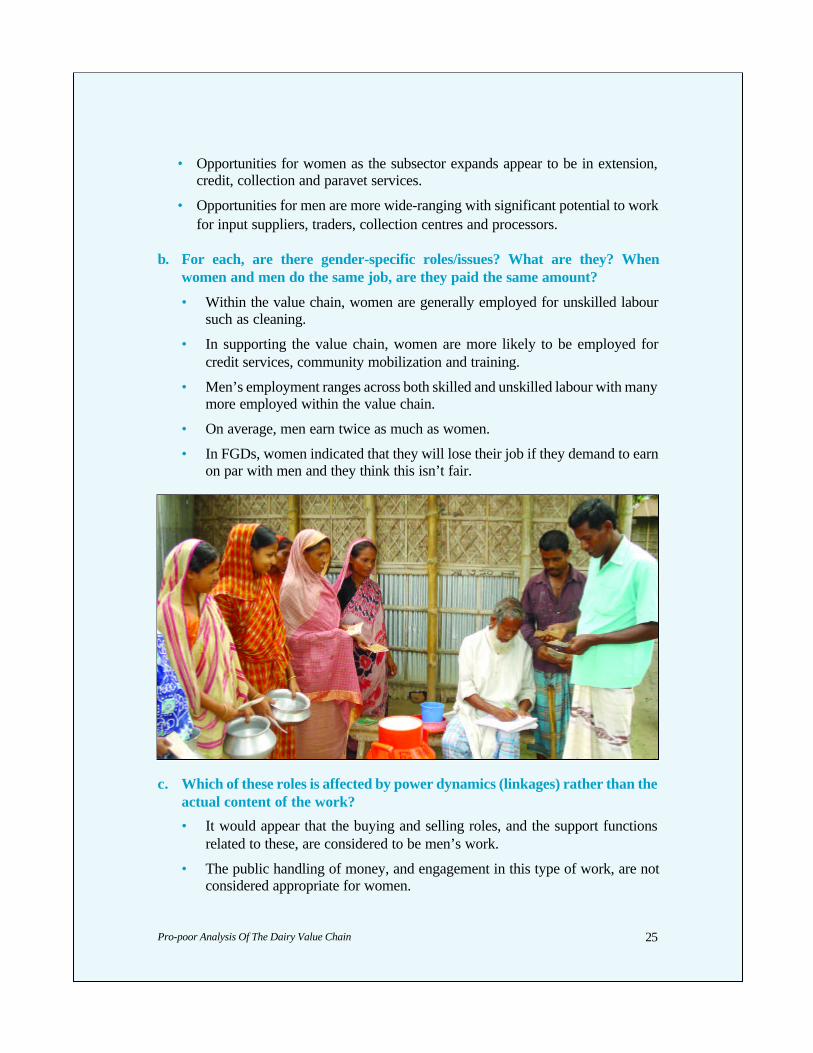
b. For each, are there gender-specific roles/issues? What are they? Whenwomen and men do the same job, are they paid the same amount?
• Within the value chain, women are generally employed for unskilled laboursuch as cleaning.
• In supporting the value chain, women are more likely to be employed forcredit services, community mobilization and training.
• Men’s employment ranges across both skilled and unskilled labour with manymore employed within the value chain.
• On average, men earn twice as much as women.
• In FGDs, women indicated that they will lose their job if they demand to earnon par with men and they think this isn’t fair.
c. Which of these roles is affected by power dynamics (linkages) rather than theactual content of the work?
• It would appear that the buying and selling roles, and the support functionsrelated to these, are considered to be men’s work.
• The public handling of money, and engagement in this type of work, are notconsidered appropriate for women.
Pro-poor Analysis Of The Dairy Value Chain26
d. What is the potential number of jobs for women and men at each level ineach value chain / district?
• A baseline survey will be required to calculate this accurately. Main areas ofjob growth for women will be in extension, credit and paravet services.Growth for men’s employment will be more generalized with strong potential
e. As the market grows, what is the projected percentage expansion rate forjobs; for women and men?
• A baseline survey will be required to calculate this accurately. Some, but notall of the employers suggested that number of staff would keep pace withgrowth in the value chain. 37% of SPs and 41% of VCAs reported that ifactivity doubles, staff requirements will double.
f. What issues are there with employment (low pay, safety hazards,child/indentured labour, unreliable, seasonal etc.)?
• Supporting the value chain only 24% of the jobs for men are year-round and38% are occasional. Within the value chain, 33% of the work is year-round. Asregards women, jobs provided by SPs are 11% all year, and by VCAs, 17%.
• There were no reports of child labour or bonded labour.
• SPs reported paying men an average of 108 Tk per day for a 12.7 hour day.VCAs provided similar data – averaging somewhat higher at 111 Tk per dayfor 10 hours.
• In general, women are paid much lower – VCAs offer 50 Tk per day for 10hours labour.
• Women who are entrepreneurs in the value chain (collectors, sweetmakers,and sellers) are able to earn more money. Key informant meetings (follow upresearch to the fieldwork) found women earning 80-200+Tk per day, and ableto save for expenses such as weddings and the purchase of land.

Pro-poor Analysis Of The Dairy Value Chain 27
2.2 Gender Analysis of the Dairy Value Chain
Summary of Findings
The Plan (Annex 1) proposed the following method and key research questionsfor Objective 2 of the VC study. Answers to the questions are provided in thissection.
• Method: Assess current employment opportunities for women and men along the dairyvalue chain using qualitative and quantitative tools aimed at value chainstakeholders and official agencies. Combine with research conducted in 1.Babove; add in gender experts as needed/available.
Main Gender Challenges Potential Solutions
Women are overburdened ashousekeepers, SSPs and daylabourers.
Families may need to be sensitized to women’sworkload and solutions sought within HH. CARE tolink to local PNGOs and other projects to providetraining and support to women as appropriate andavailable.
Women do not have decision makingauthority or respect in the HH.
Through economic empowerment, women’s statuswill improve and they will gain greater control.
Equal opportunities for womenemployees are limited, and employersare often not open to hiring women.
Employers to be sensitized to employment ofwomen and the value of their contribution.
CARE provides awareness raising.
CARE promotes women in areas where they havestronger employment opportunities – as loanofficers, extension workers and collectors.
Equal opportunities for independentwomen entrepreneurs cannot befound and leveraged.
Women to be trained in entrepreneurial andtechnical skills for selected businesses:sweetmaking, dairy collection and sales, paravets.
Women and girls consume less milkas more is sold to the market.
CARE to connect to PNGOs and other projects thatpromote women’s health, as appropriate anddesirable. Various media may also be vehicles forawareness raising.
Gender roles and tradition limitwomen’s opportunities.
CARE to connect to PNGOs and other projects thatpromote the role of women, as appropriate anddesirable. Various media may also be vehicles forawareness raising.
Women and their HHs are notorganized into groups to take advantageof training and other information.
CARE to work with women and their HHs via FFsand PNGOs/mobilizers that will form groups toaccess training and other information.
Research Questions
Pro-poor Analysis Of The Dairy Value Chain28
Key Research Questions
a. See 1.A for information on gender variations in production, 1.B for detailedinformation on women’s and men’s employment opportunities, and othersections for variations due to gender roles as it relates to specific issues.
b. What is the income distribution in a family? Who earns money? Whocontrols money? Who makes decisions about family spending? Are differentdecisions controlled by different members of the household?
• Men earn more income than women as day labourers.
• Men also generate more income based on agricultural output of owned land.Although women often provide labour for this land, the income is consideredto be the man’s right.
• In-depth interviews revealed that 52% of the time HH income is controlled bymen, and 27% by women. In addition, FHHs account for another 18% ofdecisions being made by women.
• FGDs with women presented a variable picture: joint decision making,women controlling their own income, and households where men hadcomplete authority over spending.
• Follow-up meetings with women in Bogra also revealed that women oftenhave control or share decision making. Women heading households have themost autonomy in decision making.
• There are some variations with regard to decision making.
c. Who owns and who controls the assets of production, including the cows,land, tools? Is there gender disparity and does this varies across groups?
• Husbands own the cows in 52% of responding HHs and wives 17%. Therewere also 17% women-headed HH who own cows.
• Husbands control the income from milk sales in 52% cases, wife in 27% ofcases women-headed HH in 18% of cases.
• Husbands decide about credit use in 55% of cases and wife in 34% of cases.
Pro-poor Analysis Of The Dairy Value Chain 29
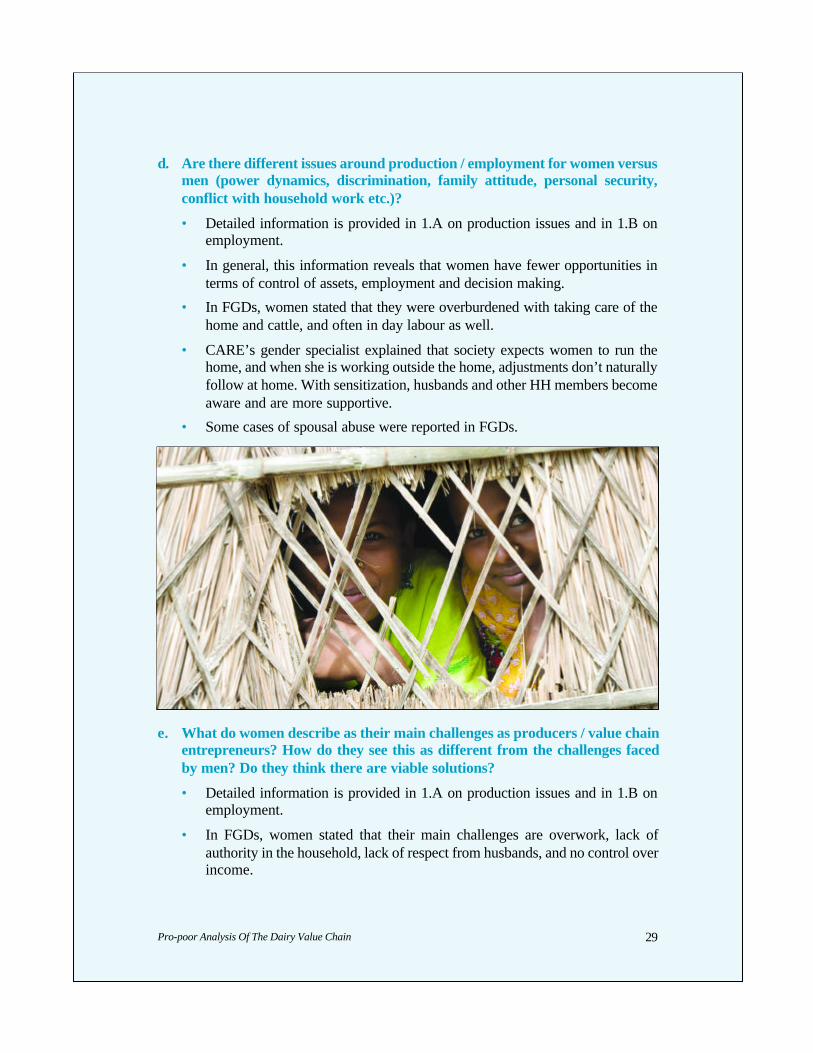
d. Are there different issues around production / employment for women versusmen (power dynamics, discrimination, family attitude, personal security,conflict with household work etc.)?
• Detailed information is provided in 1.A on production issues and in 1.B onemployment.
• In general, this information reveals that women have fewer opportunities interms of control of assets, employment and decision making.
• In FGDs, women stated that they were overburdened with taking care of thehome and cattle, and often in day labour as well.
• CARE’s gender specialist explained that society expects women to run thehome, and when she is working outside the home, adjustments don’t naturallyfollow at home. With sensitization, husbands and other HH members becomeaware and are more supportive.
• Some cases of spousal abuse were reported in FGDs.
e. What do women describe as their main challenges as producers / value chainentrepreneurs? How do they see this as different from the challenges facedby men? Do they think there are viable solutions?
• Detailed information is provided in 1.A on production issues and in 1.B onemployment.
• In FGDs, women stated that their main challenges are overwork, lack ofauthority in the household, lack of respect from husbands, and no control overincome.

Pro-poor Analysis Of The Dairy Value Chain30
• In terms of production issues, they feel that their issues are largely similar tomen’s (feed, paravet services).
• With regard to sales, women indicated they are at a disadvantage because theydo not have access to markets.
f. What new opportunities would women like to have as producers / value chainentrepreneurs? Why these opportunities? How do they think theseopportunities would be developed?
• Women would like to have greater market access.
• They believe that greater market access would ensure fairer prices for milk.Door to door traders generally pay the lowest prices to producers andhomebound women have limited sales choices.
• Control over income earned from dairy is considered to be desirable.
• Women did not show strong initiative and interest in new roles. But thiselement could be further explored and expanded upon as projectimplementation unfolds.

Pro-poor Analysis Of The Dairy Value Chain 31
2.3 Market Opportunities for Small Scale Producers in Dairy Sector
Summary of Findings
The following market information will be further elaborated by market assessmentonce the project is launched. This section focuses mainly on the formal sector, whichoffers greater income gains to SSPs. However, some informal channels may alsoprove promising and should be considered if resources allow, and if formal marketchannels are not developing as planned.
Main Market Challenges Potential Solutions
SSPs do not produce milk in quantitiessuitable for strong formal marketdevelopment.
Improve milk yields as identified under objective1.A.
SSPs do not produce the quality ofmilk that will fetch higher prices and bedesirable to the formal market.
Improve milk quality as identified under objective1.A.
SSPs are not organized into groupsand cannot take advantage ofconsolidation of milk that wouldpromote attraction of processors andestablishment of chilling plants.
SSPs to be organized into groups to consolidatemilk. CARE works through its FFS, lead farmers andlocal PNGOs/mobilizers to form producer groups.Producer groups are also developed by processors,collectors and other actors in the value chain.
SSPs do not have good knowledge oraffordable technology for testing ofmilk quality and cannot negotiate fairpricing from collectors.
Producer groups may be provided withlactoscanners for basic testing. CARE to work withprocessors to ensure that SSPs havelactoscanners, test milk, and receive fair price fromcollectors. Lead farmers may be trained to uselactoscanner.
Appropriate distance for chilling andprocessing factories is around 30 kmin radius and many SSPs are locatedfar from them and urban markets.
Additional chilling plants to be established inconjunction with processors. Alternativetransportation such as barges and rickshaws arepiloted by CARE.
Potential for informal marketsincluding formalization ofsweetmaking not well understood.
Action research to continue as program getsunderway regarding alternative markets. Inparticular, roles of women and youth to beassessed. As production increases, local marketswill also likely continue to grow as milk in general isin short supply.
Lack of overall knowledge and accessto market information includingpricing.
SSPs to be exposed to information via a range ofmedia – billboards, radio programs, leaflets asanalyzed and appropriate to the context. CAREfacilitate the development of such materials withselected stakeholders.

Pro-poor Analysis Of The Dairy Value Chain32
The Plan (Annex 1) proposed the following method and key research questionsfor Objective 3 of the VC study. Answers to the questions are provided in thissection.
• Method:
Assess market opportunities that have growth potential, allow for the integrationof small-scale producers, provide a fair return on labour and investment ofresources, and include sustainable supports for producers such as embeddedservices.
Key Research Questions
a. What are the growing market opportunities for dairy products inBangladesh (liquid milk, dried milk, sweetmeats, yoghurt, cheese, otherprocessed products)?
• All markets appear to be growing quickly – particularly fresh milk as there isa severe shortage.
• Dry milk is imported in large quantities (10 B Tk annually approx $140 m)but this is not due to preference for dry milk, but a lack of fresh milk.9
b. Compare informal and formal market opportunities.
• Both markets are large and unmet, but the formal market offers farmershigher profits particularly since the processors cover much of the cost oftransportation.
• Currently, Milk Vita pays producers 25 Tk per L10 whereas traders will pay aslow as 14 Tk per L. (See below for information regarding other processors.)
• Formal processors are operating at 10% capacity, and are interested inopening chilling plants throughout the regions where CARE is working.
• Informal markets will continue to grow and absorb excess production as thereis a general shortage. In addition, the informal sector will benefit if milkquality is upgraded and health/hygiene standards improved.
Research Questions
9 CARE plans to conduct a more detailed market assessment on the informal sector as the project is developed.However, the project will at least initially focus on the formal sector and lead firm processors.
10 Including transportation costs.
Pro-poor Analysis Of The Dairy Value Chain 33
c. What are the competitive pressures from imports?
• Imports are not competitive, but are a kind of last resort for consumers.
• Poorer consumers will buy cheaper fresh milk and cannot afford dry milk.
• From team observations and opinions of project staff more affluentconsumers buy dry milk only because pasteurized liquid milk is in shortsupply.
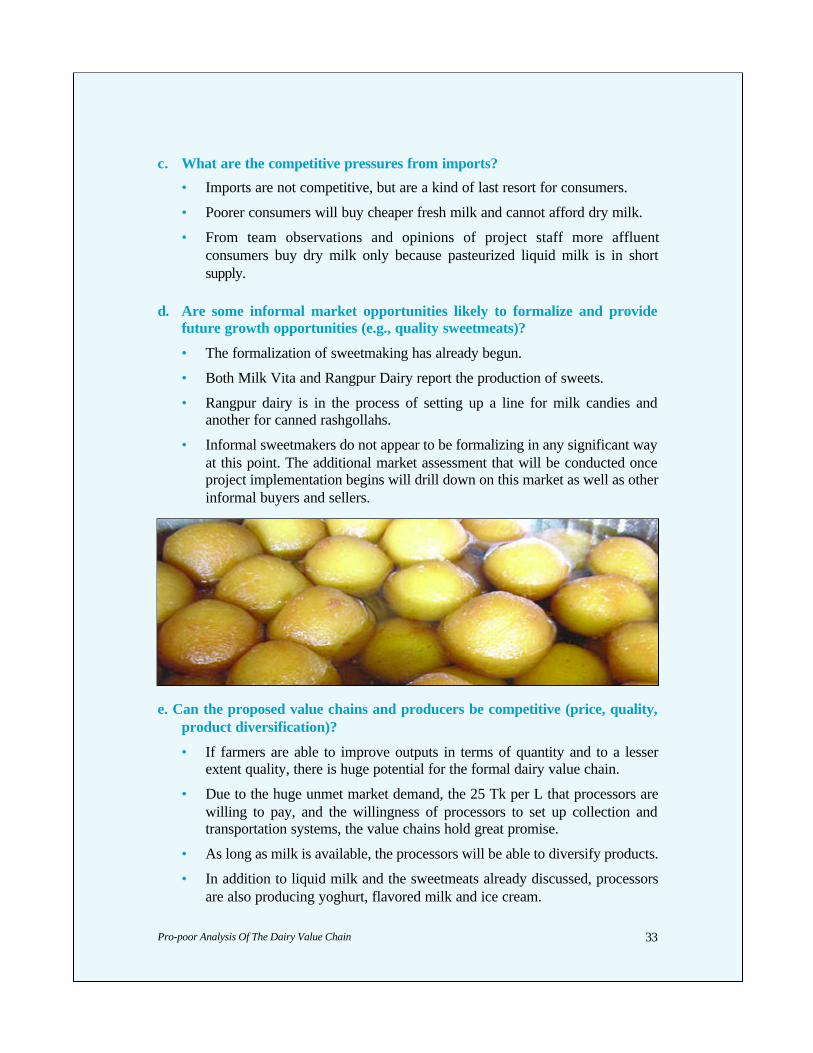
d. Are some informal market opportunities likely to formalize and providefuture growth opportunities (e.g., quality sweetmeats)?
• The formalization of sweetmaking has already begun.
• Both Milk Vita and Rangpur Dairy report the production of sweets.
• Rangpur dairy is in the process of setting up a line for milk candies andanother for canned rashgollahs.
• Informal sweetmakers do not appear to be formalizing in any significant wayat this point. The additional market assessment that will be conducted onceproject implementation begins will drill down on this market as well as otherinformal buyers and sellers.
e. Can the proposed value chains and producers be competitive (price, quality,product diversification)?
• If farmers are able to improve outputs in terms of quantity and to a lesserextent quality, there is huge potential for the formal dairy value chain.
• Due to the huge unmet market demand, the 25 Tk per L that processors arewilling to pay, and the willingness of processors to set up collection andtransportation systems, the value chains hold great promise.
• As long as milk is available, the processors will be able to diversify products.
• In addition to liquid milk and the sweetmeats already discussed, processorsare also producing yoghurt, flavored milk and ice cream.
Pro-poor Analysis Of The Dairy Value Chain34
f. What changes will need to be made to meet market demand?
• Interviews with lead firms and assessment of farmer capacity indicate thatchanges are required in terms of production, enabling farmers to produceenough output to warrant the installation of a chilling plant in their proximityand a collection system.
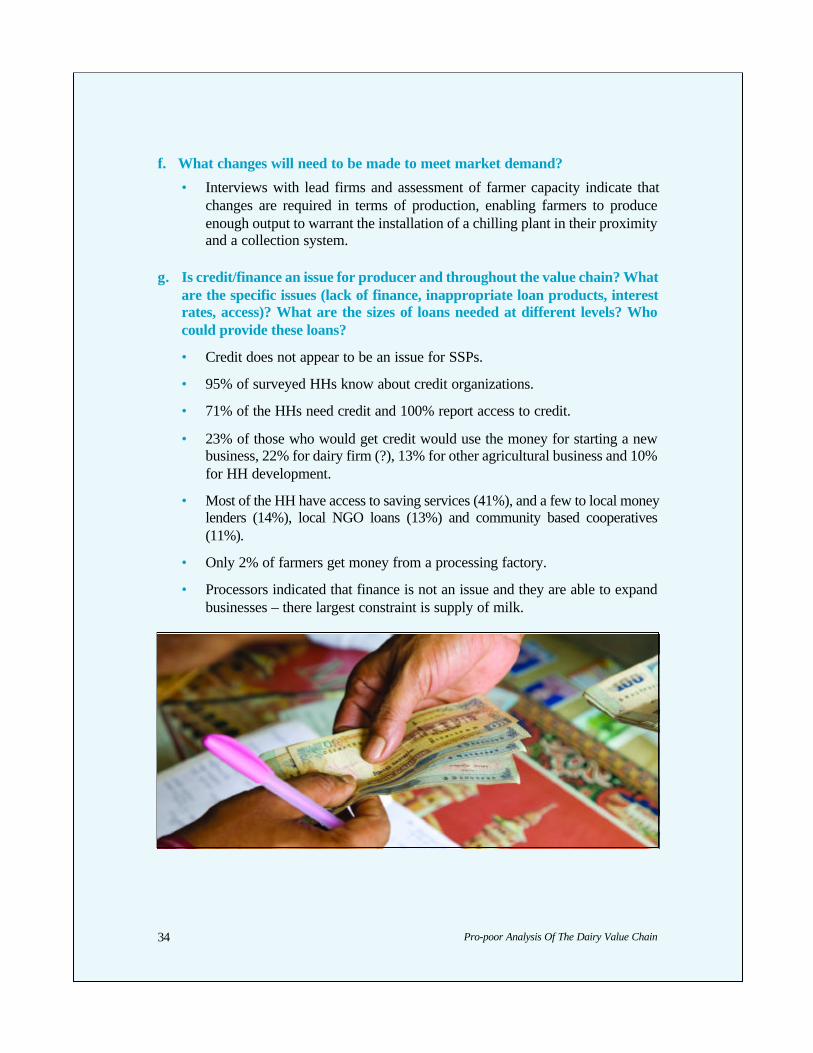
g. Is credit/finance an issue for producer and throughout the value chain? Whatare the specific issues (lack of finance, inappropriate loan products, interestrates, access)? What are the sizes of loans needed at different levels? Whocould provide these loans?
• Credit does not appear to be an issue for SSPs.
• 95% of surveyed HHs know about credit organizations.
• 71% of the HHs need credit and 100% report access to credit.
• 23% of those who would get credit would use the money for starting a newbusiness, 22% for dairy firm (?), 13% for other agricultural business and 10%for HH development.
• Most of the HH have access to saving services (41%), and a few to local moneylenders (14%), local NGO loans (13%) and community based cooperatives(11%).
• Only 2% of farmers get money from a processing factory.
• Processors indicated that finance is not an issue and they are able to expandbusinesses – there largest constraint is supply of milk.

Pro-poor Analysis Of The Dairy Value Chain 35
h. What are the future trends in market demand that will require furtherchange from the value chain?
• As the demand for milk in Bangladesh continues to grow (and there is alreadyhuge unmet demand) there will be further pressure to move to less populatedand more marginalized areas for milk collection.
• If CARE can pilot and develop suitable transport from Char areas (such as theproposed barges), there will be market opportunities for marginalized HHs.
i. Can a dynamic value chain be created that will respond to ongoing change inthe market place?
• Creating a dynamic value chain depends upon the flow of product up thevalue chain and the flow of information down.
• Farmers need to be aware of the market demands so that they can respond tochanges.
• If processors remain committed to acquiring milk from SSPs, then it will bein their interest to continue supporting and training milk producing HHs.
• With lead firms committed to growing the market, this dynamism should bepossible.
• In a meeting with BRAC, Milk Vita and Rangpur Dairy, they all indicated adouble bottom line where they are interested in both profitability and thewelfare of the poor producer – this is likely to be the best recipe for continuedsuccess if collection and transportation can be streamlined.
Pro-poor Analysis Of The Dairy Value Chain36
A Technical Note on Cooperation of Value Chain Actors:
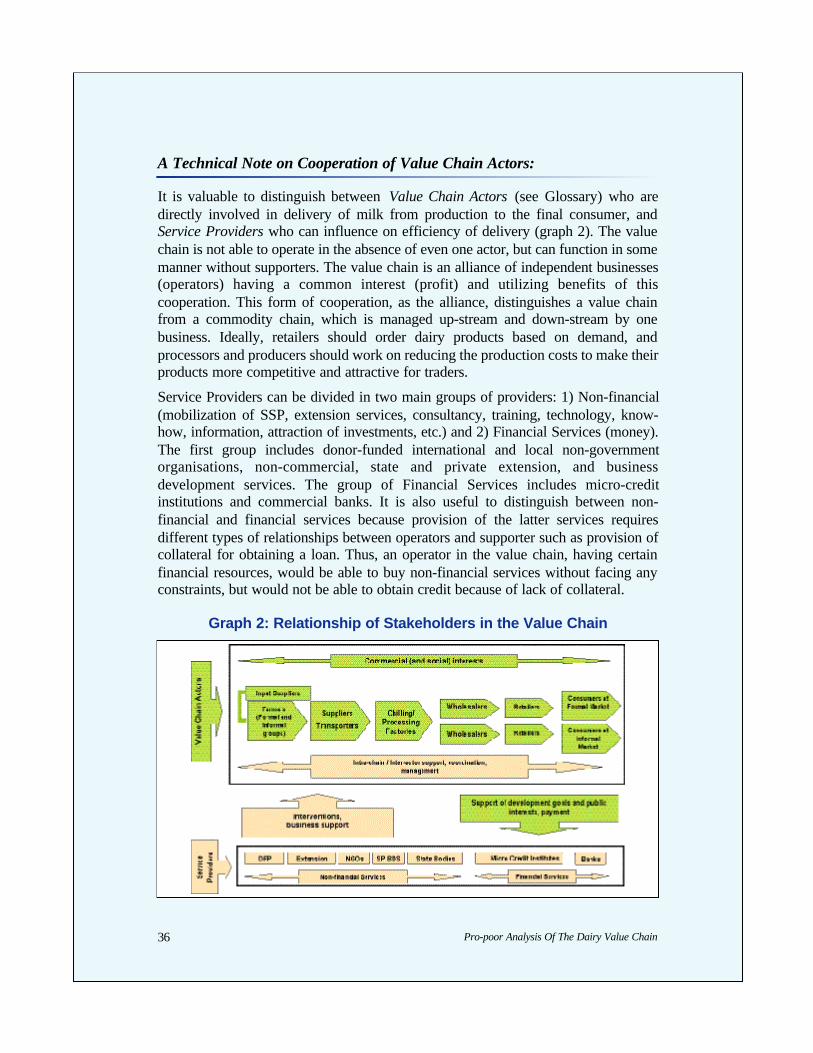
It is valuable to distinguish between Value Chain Actors (see Glossary) who aredirectly involved in delivery of milk from production to the final consumer, andService Providers who can influence on efficiency of delivery (graph 2). The valuechain is not able to operate in the absence of even one actor, but can function in somemanner without supporters. The value chain is an alliance of independent businesses(operators) having a common interest (profit) and utilizing benefits of thiscooperation. This form of cooperation, as the alliance, distinguishes a value chainfrom a commodity chain, which is managed up-stream and down-stream by onebusiness. Ideally, retailers should order dairy products based on demand, andprocessors and producers should work on reducing the production costs to make theirproducts more competitive and attractive for traders.
Service Providers can be divided in two main groups of providers: 1) Non-financial(mobilization of SSP, extension services, consultancy, training, technology, know-how, information, attraction of investments, etc.) and 2) Financial Services (money).The first group includes donor-funded international and local non-governmentorganisations, non-commercial, state and private extension, and businessdevelopment services. The group of Financial Services includes micro-creditinstitutions and commercial banks. It is also useful to distinguish between non-financial and financial services because provision of the latter services requiresdifferent types of relationships between operators and supporter such as provision ofcollateral for obtaining a loan. Thus, an operator in the value chain, having certainfinancial resources, would be able to buy non-financial services without facing anyconstraints, but would not be able to obtain credit because of lack of collateral.
Graph 2: Relationship of Stakeholders in the Value Chain
Pro-poor Analysis Of The Dairy Value Chain 37
Linking Value Chain Actors
Project partners are all operators directly integrated into the value chain such as SSP,collectors, chilling and dairy processing factories, and traders, as well as supportingorganizations such as extension services, input suppliers, local NGOs and serviceproviders.
Involvement of Service Providers and their Roles
Local PNGOs, government extension services, commercial input suppliers, andproviders of BDS are potential partners for project facilitation. The project maychoose to support them in pursuing the following objectives:
• Support SSPs in becoming effective contributors to value chains through theirmobilization in informal groups; facilitate SSPs linkages to potential buyers(collectors, chilling and processing factories); employ local consultants andmarketing experts where entrepreneurship and commercial knowledge is needed.
• Improve market access for SSP informal groups and develop their capacitiesthrough the preparation and delivery of training.
• Support sector, sub-sector and value chain analysis as well as research anddevelopment efforts.
• Facilitate fair relationships between SSP groups and other VCAs.• Facilitate Public-Private Partnership with the aim of using public money for
public interest.
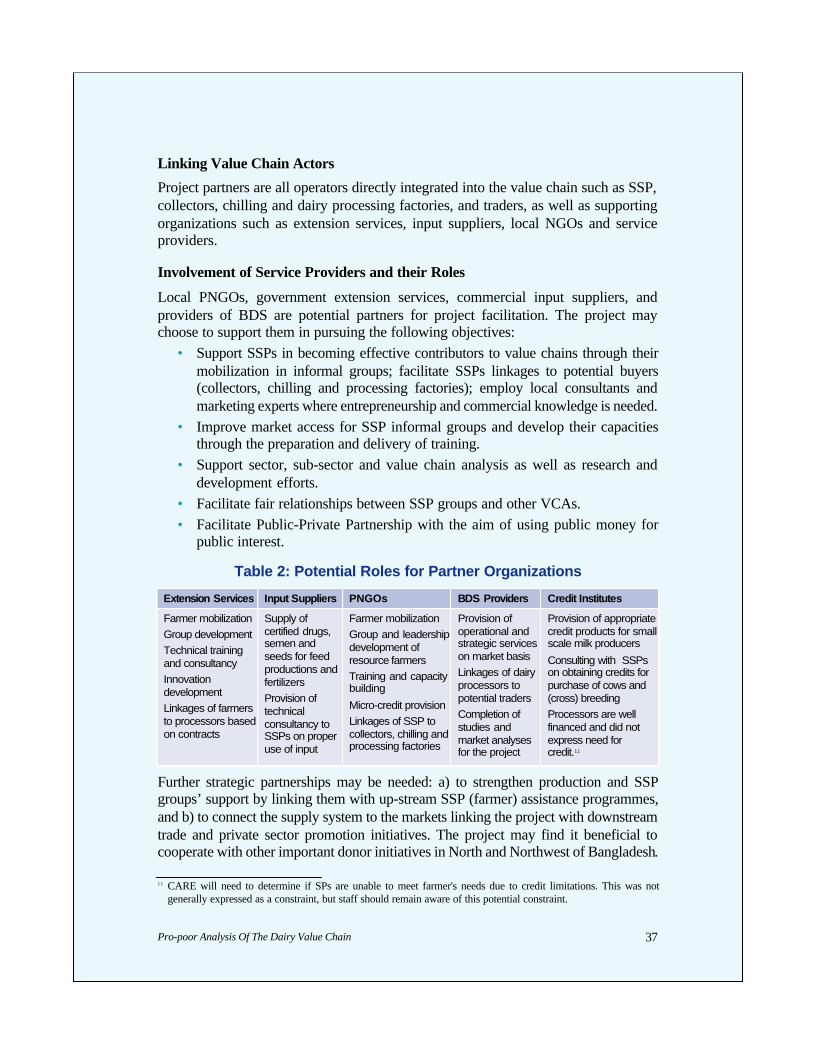
Table 2: Potential Roles for Partner Organizations
Further strategic partnerships may be needed: a) to strengthen production and SSPgroups’ support by linking them with up-stream SSP (farmer) assistance programmes,and b) to connect the supply system to the markets linking the project with downstreamtrade and private sector promotion initiatives. The project may find it beneficial tocooperate with other important donor initiatives in North and Northwest of Bangladesh.
Extension Services Input Suppliers PNGOs BDS Providers Credit Institutes
Farmer mobilizationGroup developmentTechnical trainingand consultancyInnovationdevelopmentLinkages of farmersto processors basedon contracts
Supply ofcertified drugs,semen andseeds for feedproductions andfertilizersProvision oftechnicalconsultancy toSSPs on properuse of input
Farmer mobilizationGroup and leadershipdevelopment ofresource farmers Training and capacitybuilding
Micro-credit provisionLinkages of SSP tocollectors, chilling andprocessing factories
Provision ofoperational andstrategic serviceson market basisLinkages of dairyprocessors topotential tradersCompletion ofstudies andmarket analysesfor the project
Provision of appropriatecredit products for smallscale milk producers
Consulting with SSPson obtaining credits forpurchase of cows and(cross) breedingProcessors are wellfinanced and did notexpress need forcredit.11
11 CARE will need to determine if SPs are unable to meet farmer's needs due to credit limitations. This was notgenerally expressed as a constraint, but staff should remain aware of this potential constraint.
Pro-poor Analysis Of The Dairy Value Chain38
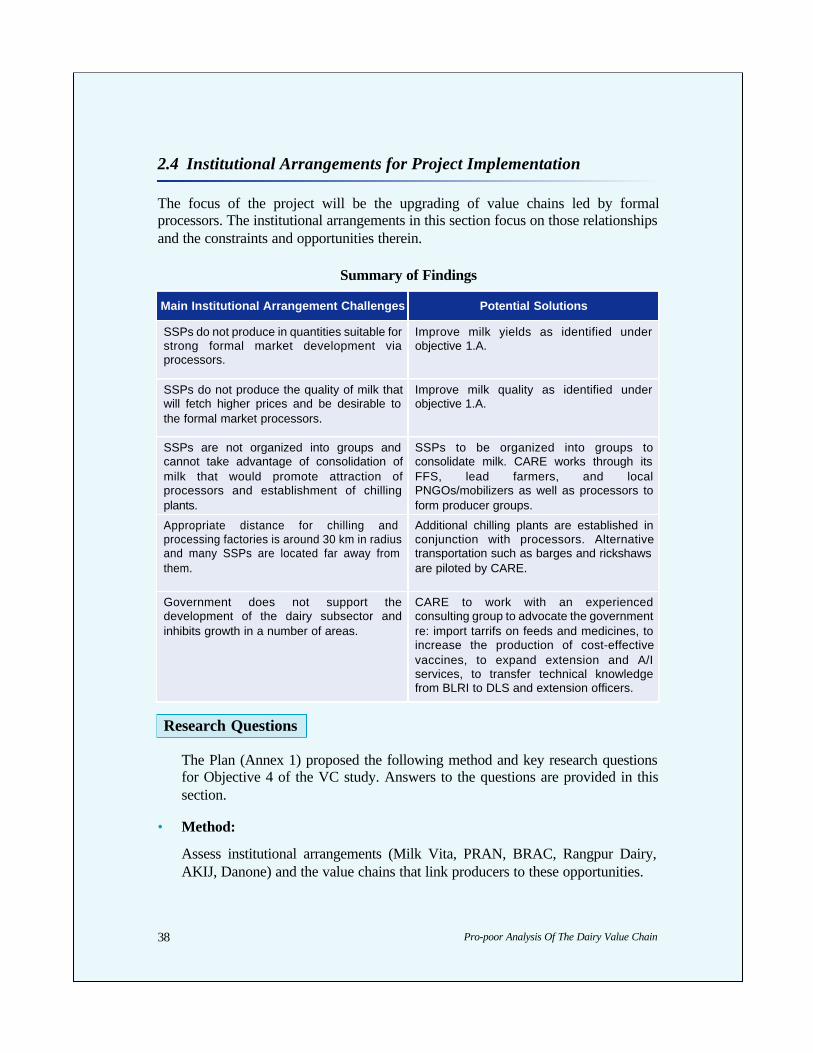
2.4 Institutional Arrangements for Project Implementation
The focus of the project will be the upgrading of value chains led by formalprocessors. The institutional arrangements in this section focus on those relationshipsand the constraints and opportunities therein.
Summary of Findings
The Plan (Annex 1) proposed the following method and key research questionsfor Objective 4 of the VC study. Answers to the questions are provided in thissection.
• Method:
Assess institutional arrangements (Milk Vita, PRAN, BRAC, Rangpur Dairy,AKIJ, Danone) and the value chains that link producers to these opportunities.
Main Institutional Arrangement Challenges Potential Solutions
SSPs do not produce in quantities suitable forstrong formal market development viaprocessors.
Improve milk yields as identified underobjective 1.A.
SSPs do not produce the quality of milk thatwill fetch higher prices and be desirable tothe formal market processors.
Improve milk quality as identified underobjective 1.A.
SSPs are not organized into groups andcannot take advantage of consolidation ofmilk that would promote attraction ofprocessors and establishment of chillingplants.
SSPs to be organized into groups toconsolidate milk. CARE works through itsFFS, lead farmers, and localPNGOs/mobilizers as well as processors toform producer groups.
Appropriate distance for chilling andprocessing factories is around 30 km in radiusand many SSPs are located far away fromthem.
Additional chilling plants are established inconjunction with processors. Alternativetransportation such as barges and rickshawsare piloted by CARE.
Government does not support thedevelopment of the dairy subsector andinhibits growth in a number of areas.
CARE to work with an experiencedconsulting group to advocate the governmentre: import tarrifs on feeds and medicines, toincrease the production of cost-effectivevaccines, to expand extension and A/Iservices, to transfer technical knowledgefrom BLRI to DLS and extension officers.
Research Questions
Pro-poor Analysis Of The Dairy Value Chain 39
Key Research Questions
a. What are the specific market opportunities – products, size of market, futuregrowth, roles of small producers – with each of the lead firms?
• The Bangladesh dairy market has huge unmet demand with over 90% beingserved by powdered milk imports, totaling 9,800 m Tk annually (approx $140 m).
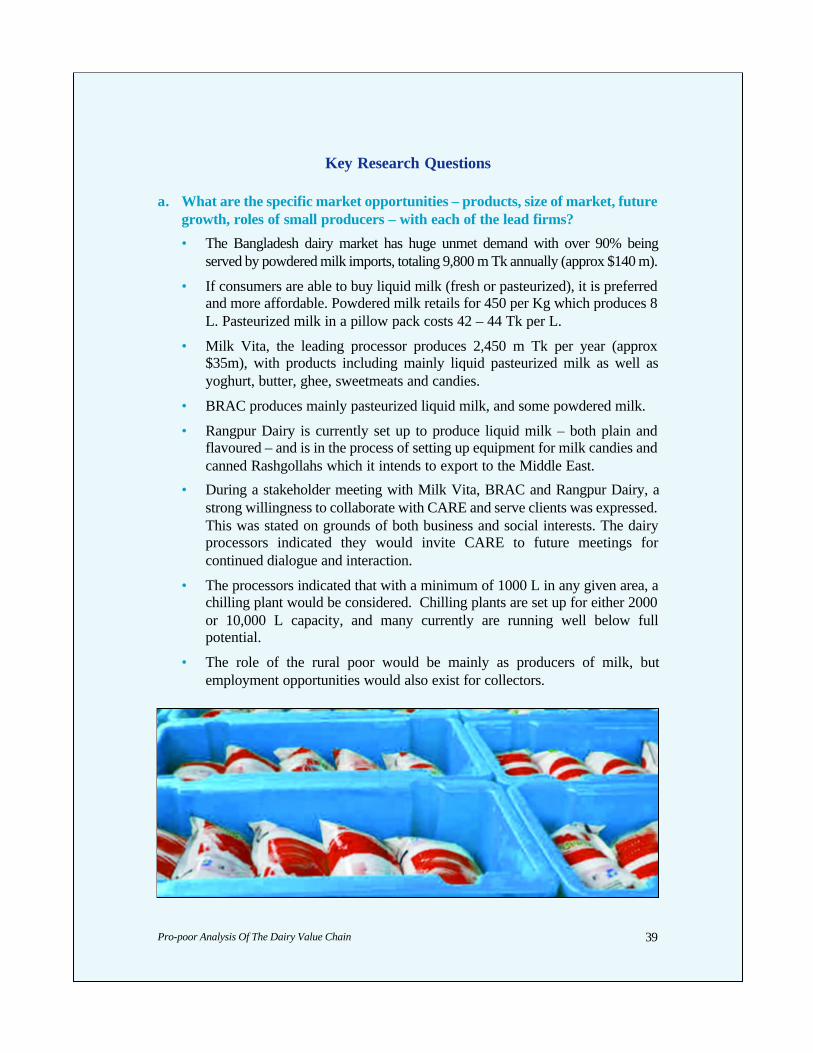
• If consumers are able to buy liquid milk (fresh or pasteurized), it is preferredand more affordable. Powdered milk retails for 450 per Kg which produces 8L. Pasteurized milk in a pillow pack costs 42 – 44 Tk per L.
• Milk Vita, the leading processor produces 2,450 m Tk per year (approx$35m), with products including mainly liquid pasteurized milk as well asyoghurt, butter, ghee, sweetmeats and candies.
• BRAC produces mainly pasteurized liquid milk, and some powdered milk.
• Rangpur Dairy is currently set up to produce liquid milk – both plain andflavoured – and is in the process of setting up equipment for milk candies andcanned Rashgollahs which it intends to export to the Middle East.
• During a stakeholder meeting with Milk Vita, BRAC and Rangpur Dairy, astrong willingness to collaborate with CARE and serve clients was expressed.This was stated on grounds of both business and social interests. The dairyprocessors indicated they would invite CARE to future meetings forcontinued dialogue and interaction.
• The processors indicated that with a minimum of 1000 L in any given area, achilling plant would be considered. Chilling plants are set up for either 2000or 10,000 L capacity, and many currently are running well below fullpotential.
• The role of the rural poor would be mainly as producers of milk, butemployment opportunities would also exist for collectors.
Pro-poor Analysis Of The Dairy Value Chain40
b. How are producers connected to each of the lead firms? Are there anyspecific barriers due to the gender? Poverty profile of the producers?
• Each of the three lead firms has a slightly different model of group formationand embedded service delivery. Milk Vita forms cooperatives and states thatit is owned by the farmers who ultimately benefit from all profits. Thecooperatives are represented by a collector, and receive free technical adviceand healthcare including vaccinations, deworming and A/I. Milk Vitaprovides each group with a lactoscanner to measure density beforeconsolidating so that farmers can be remunerated according to quality.
• BRAC works with farmers’ associations and also provides technical services.
• Rangpur is a startup and plans to have a more commercial model, subsidizingservices by paying for staff provision of services, and only recovering cost formedications etc. Rangpur Dairy has set up 250 societies with 150 active. Eachsociety has 100 – 300 producers, and sends a collection van around to eachsociety within a 40 km radius of its chilling centers that is producing morethan 40 L. Rangpur Dairy plans to have 12 chilling centres operational byJune. The chilling centres will also be served up to a 15 km radius byrickshaw vans.
• The processors work with women and men alike, and do not discriminateagainst the very poor. However, remote producers are not served, and thesecommunities tend to be the poorest.
c. Who dominates the market most among the lead firms? Why?12
• Milk Vita dominates the market among the lead firms selling 2,450 m Tkannually. The reason for this is that they have been in the market for 20 yearsand have worked to establish chilling plants and processing facilities.
• BRAC is the second largest with 700 m Tk per year (approx. $10 m).
• Pran, which did not attend the stakeholder meeting, is third, processing25,000 to 30,000.
• Rangpur Dairy processes 15,000 L per day, and is rapidly expanding.Rangpur Dairy is owned by PowerTrade Group who has invested in dairy tomake profit while having social impact. They are very eager to work withCARE and to establish viable producer groups (societies).
12 CARE staffs are currently mapping the location of processor chilling plants, and their reach. Discussions are alsounderway to determine which processors are willing to expand this reach and increase the number of chilling plantsin designated districts.
Pro-poor Analysis Of The Dairy Value Chain 41
d. What are the constraints and opportunities with each lead firm and its valuechain in terms of power, costing/pricing, embedded services, equitable returnto producers, involvement of the very poor and women?
• Each of the lead firm processors is struggling with underutilized chilling andprocessing plants. This is not cost-effective, but they are all invested in thelong term.
• Their main concern is low production by farmers in close proximity, and lowproduction compounded by distance for remote areas that are harder to collectfrom. It is not clear that with current levels of production (0.75 L per cow onaverage) that either the producers or processors can be profitable.
• Production near existing chilling plants will need to be increased to meetprocessor demand, and further increases in areas not near existing chillingplants to encourage processors to establish new ones.
• The processors are also covering the cost of many embedded services that areaffecting their profitability – some services that might be provided bygovernment, and others for which producers would pay if they were moreaffluent. This is currently a benefit to producers associated with processors asthey have access to subsidized vaccines, healthcare, A/I, transportation.
• The processors pay more to producers than other collectors and localconsumers so they are beneficial to producers – they pay 25 Tk per L onaverage. Producers reported an average of 18 Tk per L in the field research.13
• The processors are somewhat unaware of the complications with producergroups – or at least dismiss the complexity of group dynamics, milkadulteration, collector abuse etc. Given Milk Vita’s success in Shahjadpur, itmay be that many of these difficulties can be overcome.
e. What are the issues relating to the Business Enabling Environment (BEE) –trade barriers, official and unofficial taxation, business formalization,incentives for private sector, role of importers of dry milk, corruption in thevalue chain?
• The government is not involved in the dairy sector in any significant way.There is no national body such as a dairy development board.
• The processors felt that lack of involvement by the government has somebenefits, and they are beginning to cooperate to bring about change.
• An import duty has been imposed on powdered milk which makes local milkmore competitively priced.
13 More detailed costing and pricing will determine if farmers make money on the informal sector if the project decidesto develop this market. However, it is clear that farmers stand to have much greater income returns by working withthe formal processors.
Pro-poor Analysis Of The Dairy Value Chain42
• Import duties are also charged on animal feed (25%) and medicines whichraise the cost.
• Some issues around A/I have been reported – although there is only one dairyextension officer per upazila who can provide this service, it appears thatthere are constraints for private firms to be licensed (note – reported byJaheed from Ezab – needs further clarification to understand issues).
• The government reduced the production of vaccines in recent years whichmake the dairy industry more dependent on imports that are more expensive.
• Corruption in the value chain appears to be informal – adulteration of milkwith water, collectors who pay producers lower rates, suppliers not providingquality inputs.
A Technical Note on the Basics of Institutional Arrangements
In addition to working with processors, CARE has the potential to form institutionalarrangements with a number of implementing partners. The project intends to buildon existing community based groups, such as self help or informal groups, which havegone through some stages of empowerment regarding political awareness, communitybased action, dairy production, and saving and credit activities. Many members inthese groups focus on milk production and animal husbandry as a main source ofincome and are interested and ready to link to markets. At the same time, the projectwill build on the social capital established in these groups to reduce poverty, and reachmarginal and disadvantaged groups in society, like resource poor farmers, singlewomen and Char dwellers.
One of the key elements to meet this challenge is to work with a range of actors,including NGOs with primarily a social mandate, business actors like chilling anddairy processing companies, and BDS service providers. A feature of value chaindevelopment harnesses backward linkages, and supports the downstream actors in achain through, for example, marketing promotion and stimulating systems to makemarket information available.
Another element is a strong facilitation of the market broker role between actors in thechain. Trust is often a constraint, and the facilitation role assists in bringing actorstogether while providing concrete expertise in developing relations between actors.This also relates to Service Providers such as local development NGOs, extension andadvisory services, and micro finance institutions. The development of new serviceswhich are suitable for the value chain actors, primarily producer and producer groups,and of Service Providers promotes the building of an enabling environment. Last butnot least, there is the potential for increased support from collectors, chilling plantsand processing factories as an employer of rural poor and as a promoter of socialenterprise development.

Pro-poor Analysis Of The Dairy Value Chain 43
2.5 Bottlenecks Limiting Growth Potential
Summary of Findings
The Plan (Annex 1) proposed the following method and key research questionsfor Objective 5 of the VC study. Answers to the questions are provided in thissection.
• Method:
Assess bottlenecks that limit growth in value chains including power andinequalities through qualitative research.
Main VC Bottleneck Challenges Potential Solutions
Production: SSPs do not produce inquantities and of a quality suitable for strongformal market development.
Improve milk yields and quality as identifiedunder objective 1.A.
Support Services: SSPs do not have accessto suitable and affordable services includingparavets, A/I and feeds/breeds.
Service delivery and availability improved asper objective 1.A.
Market Access: SSPs are not organized intogroups and cannot take advantage ofconsolidation of milk that would promoteattraction of processors establishment ofchilling plants and other economies of scale.
SSPs are organized into groups toconsolidate milk. CARE works through itsFFs, lead farmers, and localPNGOs/mobilizers to form producer groups.
See objectives 3 and 4.
Value Chain Relationships: There is limitedtrust in the value chain both across producersand between producers and buyers.
Trust to be promoted through theestablishment of win-win relationships.CARE staff work to improve linkagesbetween producer groups andcollectors/processors as well as amongstproducers. Lead farmers to be trained innegotiation and mediation as appropriate.
Enabling Environment: The government isnot supportive of a competitive dairysubsector.
Government support is improved in keyareas as per objective 4.
Gender: Women face challenges with regardto position in the income, employmentopportunities, and over burden of work.
Address issues of gender as in objective 3.
Research Questions
Pro-poor Analysis Of The Dairy Value Chain44
Key Research Questions
a. What are the key bottlenecks that limit growth in each of the identified valuechains (e.g., product quality, lack of producer groups, collectors, cold chain,transportation, mistrust, lack of motivation/incentives, finance)?
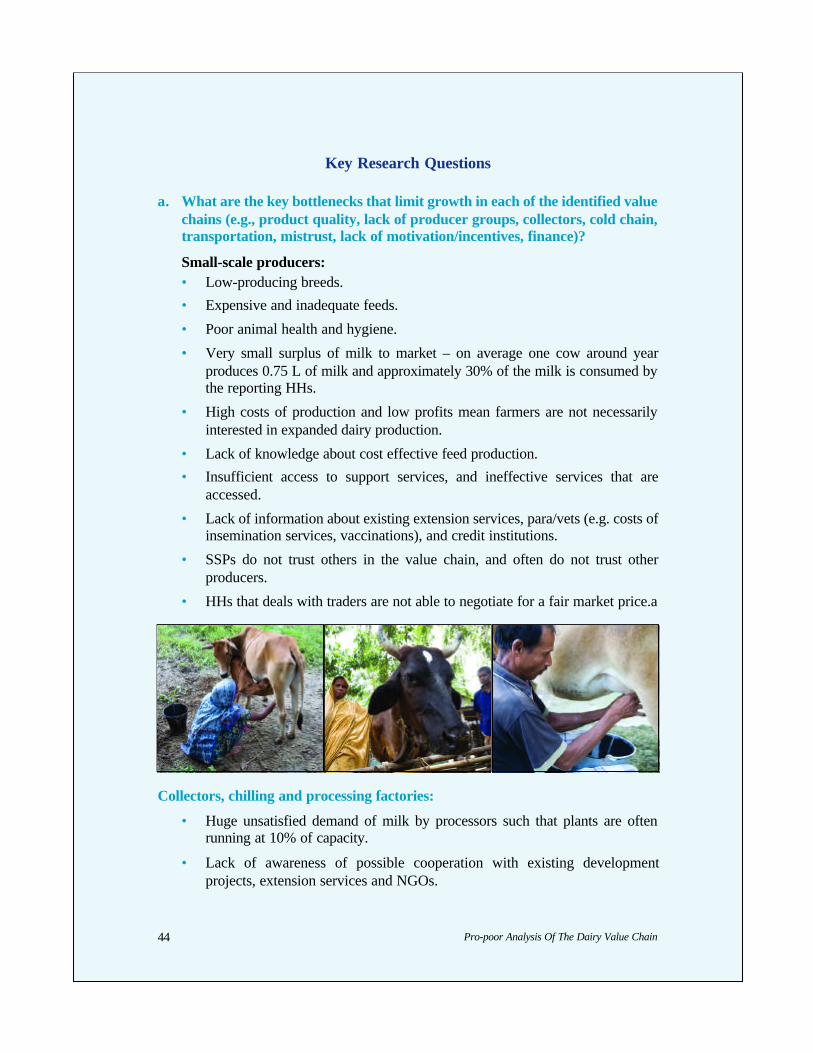
Small-scale producers:• Low-producing breeds.
• Expensive and inadequate feeds.
• Poor animal health and hygiene.
• Very small surplus of milk to market – on average one cow around yearproduces 0.75 L of milk and approximately 30% of the milk is consumed bythe reporting HHs.
• High costs of production and low profits mean farmers are not necessarilyinterested in expanded dairy production.
• Lack of knowledge about cost effective feed production.
• Insufficient access to support services, and ineffective services that areaccessed.
• Lack of information about existing extension services, para/vets (e.g. costs ofinsemination services, vaccinations), and credit institutions.
• SSPs do not trust others in the value chain, and often do not trust otherproducers.
• HHs that deals with traders are not able to negotiate for a fair market price.a
Collectors, chilling and processing factories:
• Huge unsatisfied demand of milk by processors such that plants are oftenrunning at 10% of capacity.
• Lack of awareness of possible cooperation with existing developmentprojects, extension services and NGOs.
Pro-poor Analysis Of The Dairy Value Chain 45
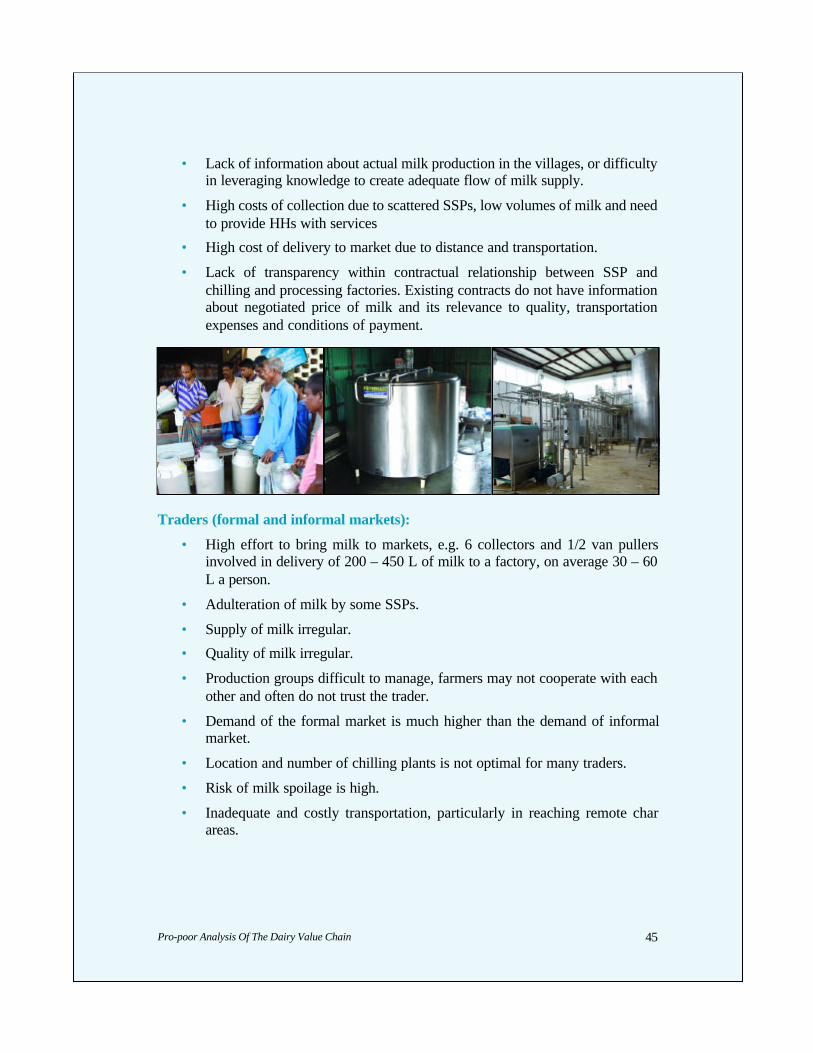
• Lack of information about actual milk production in the villages, or difficultyin leveraging knowledge to create adequate flow of milk supply.
• High costs of collection due to scattered SSPs, low volumes of milk and needto provide HHs with services
• High cost of delivery to market due to distance and transportation.
• Lack of transparency within contractual relationship between SSP andchilling and processing factories. Existing contracts do not have informationabout negotiated price of milk and its relevance to quality, transportationexpenses and conditions of payment.
Traders (formal and informal markets):
• High effort to bring milk to markets, e.g. 6 collectors and 1/2 van pullersinvolved in delivery of 200 – 450 L of milk to a factory, on average 30 – 60L a person.
• Adulteration of milk by some SSPs.
• Supply of milk irregular.
• Quality of milk irregular.
• Production groups difficult to manage, farmers may not cooperate with eachother and often do not trust the trader.
• Demand of the formal market is much higher than the demand of informalmarket.
• Location and number of chilling plants is not optimal for many traders.
• Risk of milk spoilage is high.
• Inadequate and costly transportation, particularly in reaching remote charareas.

Pro-poor Analysis Of The Dairy Value Chain46
14 This paragraph refers to services provided by government and NGOs.
Extension services, vets and paravets14:
• Low availability of existing human resources in extension and paravetservices compared to the number of SSPs in these areas.
• Limited knowledge of extension services regarding certain aspects of farmmanagement such as farm profitability: e.g., calculation of milk productioncosts or production of feed, purchase of feed at minimum price.
• Training and knowledge transfer skills need upgrading – particularly as itapplies to conveying technical knowledge to SSPs.
• CARE has a number of paravet programs with mixed success; these are to beanalyzed and the best model adapted to the project funded by the Bill &Melinda Gates Foundation.
• Lack of information about cost effective feed composition.
• Confusing information about appropriate breeds, feeds and care techniques.
• Ineffective cold chain for vaccines.
• Farmers often not able or willing to pay for necessary services.
Suppliers of animal healthcare drugs and A/I services:
• Limited number of services providers.
• Quality of services is low and therefore results not be forthcoming (e.g.,repeated efforts for A/I).
• Location and availability to SSPs.
• Input supplies such as appropriate medicines are not always available.
• Ineffective cold chain for A/I
Pro-poor Analysis Of The Dairy Value Chain 47
Suppliers of feed and fodder:
• Lack of information about existing producers and their needs.
• Inadequate technical knowledge regarding fodder and supplementcombinations.
• Tendency to promote business may impair transfer of useful information tofarmers re low-cost fodder production techniques.
Mobilizers of farmers into farmer groups (NGOs):
• A challenge to mobilize large numbers of farmers into farmer groups.
• Need for monitoring of benefit to SSPs of participaton in groups: access totraining, credit, collection, services.
• NGOs require capacity building to participate more fully in mobilization andknowledge transfer.
Regulatory activities/ government bodies:
• No dairy development board, milk marketing board, or governmentregulations or support of the dairy industry.
• Highly inadequate supply of government extension services (as compared topoultry for example).
• Variability in delivery and quality of services – for example, some SSPs inBogra appear to have reasonable success with government A/I services (closeto centre).
• Reduction in production of vaccines in recent years, and duties on importedvaccines.
• Tarrifs up to 25% on imported feeds.
• Regulation or licensing of private A/I providers appears to inhibitparticipation by a more effective private sector (further investigation neededinto Ezab).
• Lack of dissemination of information about available extension services anddrug provision to SSPs.
• Useful information from the BLRI on feeds, breeds and animal care does notappear to be transferred to DLS (Department of Livestock) or to governmentextension services.
Pro-poor Analysis Of The Dairy Value Chain48
b. What strategies could be devised to overcome each of the bottlenecks?
• CARE’s role as facilitator should focus on knowledge transfer, horizontal andvertical linkages strengthening, group mobilization and empowerment,enabling environment, and special activities related to women and remoteproducers.
• In order to overcome value chain bottlenecks, CARE will need to partner withvarious value chain stakeholders and facilitate change. This will be subject tofurther elaboration as the project unfolds.
c. Which constraints if overcome will have the greatest benefit for small-scaleproducers? Listed as solutions here:
• Knowledge of and access to suitable and affordable feeds.
• Knowledge of and access to appropriate and affordable animal healthcare.
• Knowledge of and access to improved breeds.
• Knowledge of and motivation to practice proper animal care and hygiene.
• Access to profitable and effective markets through a range of marketchannels.
d. Which constraints are lead firms willing to invest in overcoming?
• Lead firms are willing to invest in market access – the development of
collection centres15, training of collectors, and establishment oftransportation systems.
• Lead firms currently also provide technical assistance and subsidized animalhealthcare but it is unlikely that this will be sustainable over the longer.
e. Which constraints can be overcome by program activities?
• The program activities will facilitate change in the areas of feeding,healthcare, breeds, group formation and empowerment, and enablingenvironment.
f. Are there any constraints that cannot be overcome and still benefit small-scale producers?
• It is unknown if remote HHs can be reached in a way that is economicallyviable. CARE will have to pilot various approaches and develop cost-effective commercial strategies.
15 The research team leader and lead consultant both were told by officials of Rangpur Dairy that if SSPs canconsolidate more than 500 L of milk daily, the factory will collect from them and install a chilling plant. Sucharrangements need further negotiation, exploration and even formal agreements as appropriate.
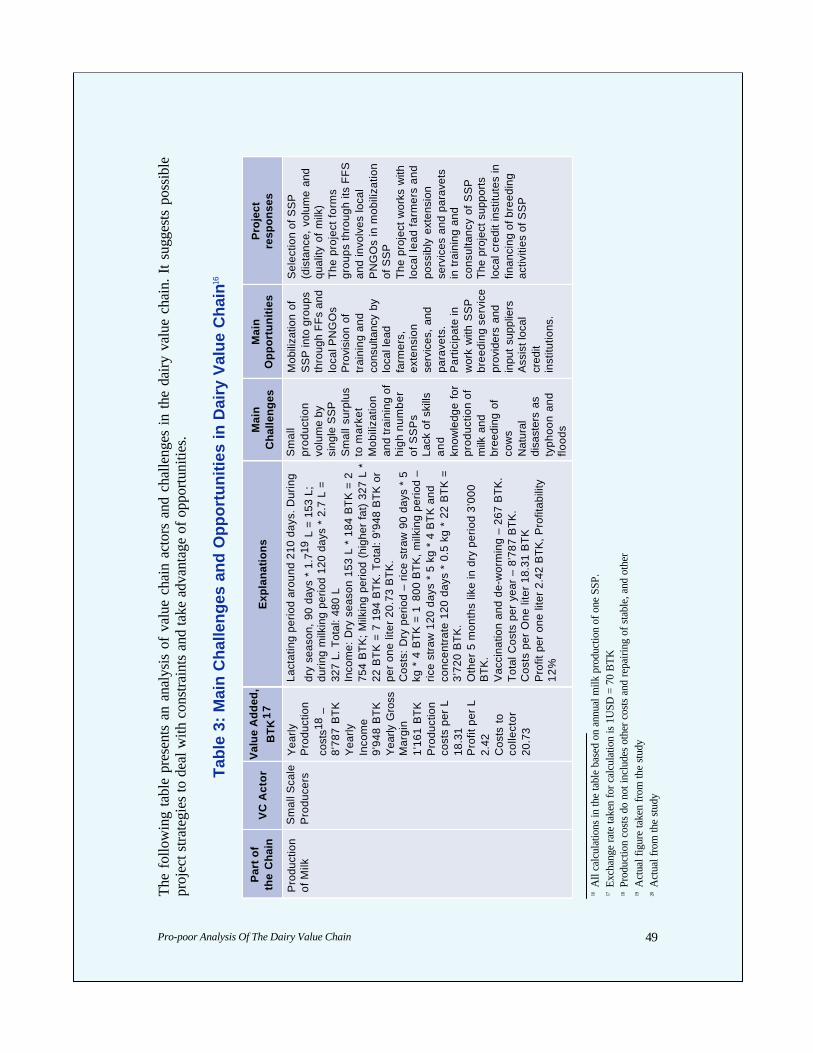
Pro-poor Analysis Of The Dairy Value Chain 49
The
follo
win
g ta
ble
pres
ents
an
anal
ysis
of
valu
e ch
ain
acto
rs a
nd c
halle
nges
in
the
dairy
val
ue c
hain
. It
sugg
ests
pos
sibl
epr
ojec
t stra
tegi
es to
dea
l with
con
stra
ints
and
take
adv
anta
ge o
f opp
ortu
nitie
s.
Tab
le 3
: M
ain
Ch
alle
ng
es a
nd
Op
po
rtu
nit
ies
in D
airy
Val
ue
Ch
ain16
Par
t o
fth
e C
hai
nV
C A
cto
rV
alu
e A
dd
ed,
BT
K1
7E
xpla
nat
ion
sM
ain
Ch
alle
ng
esM
ain
Op
po
rtu
nit
ies
Pro
ject
resp
on
ses
Pro
duct
ion
of M
ilkS
mal
l Sca
leP
rodu
cers
Y
early
Pro
duct
ion
cost
s18
–8’
787
BT
KY
early
Inco
me
9’94
8 B
TK
Yea
rly G
ross
Mar
gin
1’16
1 B
TK
P
rodu
ctio
nco
sts
per
L 18
.31
Pro
fit p
er L
2.42
Cos
ts t
oco
llect
or20
.73
Lact
atin
g pe
riod
arou
nd 2
10 d
ays.
Dur
ing
dry
seas
on,
90 d
ays
* 1.
719
L =
153
L;du
ring
milk
ing
perio
d 12
0 da
ys *
2.7
L =
327
L. T
otal
: 480
LIn
com
e: D
ry s
easo
n 15
3 L
* 18
4 B
TK
= 2
754
BT
K;
Milk
ing
perio
d (h
ighe
r fa
t) 3
27 L
*22
BT
K =
7 1
94 B
TK
. T
otal
: 9’
948
BT
K o
rpe
r on
e lit
er 2
0.73
BT
K.
Cos
ts:
Dry
per
iod
– ric
e st
raw
90
days
* 5
kg *
4 B
TK
= 1
800
BT
K, m
ilkin
g pe
riod
–ric
e st
raw
120
day
s *
5 kg
* 4
BT
K a
ndco
ncen
trat
e 12
0 da
ys *
0.5
kg
* 22
BT
K =
3’72
0 B
TK
. O
ther
5 m
onth
s lik
e in
dry
per
iod
3’00
0B
TK
. V
acci
natio
n an
d de
-wor
min
g –
267
BT
K.
Tot
al C
osts
per
yea
r –
8’78
7 B
TK
.C
osts
per
One
lite
r 18
.31
BT
KP
rofit
per
one
lite
r 2.
42 B
TK
, Pro
fitab
ility
12
%
Sm
all
prod
uctio
nvo
lum
e by
sing
le S
SP
Sm
all s
urpl
usto
mar
ket
Mob
iliza
tion
and
trai
ning
of
high
num
ber
of S
SP
sLa
ck o
f ski
llsa
nd
know
ledg
e fo
rpr
oduc
tion
ofm
ilk a
ndbr
eedi
ng o
fco
ws
Nat
ural
disa
ster
s as
typh
oon
and
flood
s
Mob
iliza
tion
ofS
SP
into
gro
ups
thro
ugh
FF
s an
dlo
cal P
NG
Os
Pro
visi
on o
ftr
aini
ng a
ndco
nsul
tanc
y by
loca
l lea
dfa
rmer
s,ex
tens
ion
serv
ices
, an
dpa
rave
ts.
Par
ticip
ate
inw
ork
with
SS
Pbr
eedi
ng s
ervi
cepr
ovid
ers
and
inpu
t su
pplie
rsA
ssis
t loc
alcr
edit
inst
itutio
ns.
Sel
ectio
n of
SS
P(d
ista
nce,
vol
ume
and
qual
ity o
f m
ilk)
The
pro
ject
for
ms
grou
ps th
roug
h its
FF
San
d in
volv
es lo
cal
PN
GO
s in
mob
iliza
tion
of S
SP
The
pro
ject
wor
ks w
ithlo
cal l
ead
farm
ers
and
poss
ibly
ext
ensi
onse
rvic
es a
nd p
arav
ets
in t
rain
ing
and
cons
ulta
ncy
of S
SP
The
pro
ject
sup
port
slo
cal c
redi
t ins
titut
es in
finan
cing
of b
reed
ing
activ
ities
of S
SP
16A
ll ca
lcul
atio
ns in
the
tabl
e ba
sed
on a
nnua
l milk
pro
duct
ion
of o
ne S
SP.
17Ex
chan
ge ra
te ta
ken
for c
alcu
latio
n is
1U
SD =
70
BTK
18Pr
oduc
tion
cost
s do
not
incl
udes
oth
er c
osts
and
repa
iring
of s
tabl
e, a
nd o
ther
19A
ctua
l fig
ure
take
n fr
om th
e st
udy
20A
ctua
l fro
m th
e st
udy

Pro-poor Analysis Of The Dairy Value Chain50
Par
t o
fth
e C
hai
nV
C A
cto
rV
alu
e A
dd
ed,
BT
K18
Exp
lan
atio
ns
Mai
nC
hal
len
ges
Mai
nO
pp
ort
un
itie
sP
roje
ctre
spo
nse
s
Col
lect
ors
Priv
ate
serv
ice
prov
ider
s
Tra
nspo
rtat
ion
Cos
ts 2
88B
TK
Gro
ssM
argi
n is
equa
l to
com
mis
sion
sfo
r co
llect
ion
and
it is
31
2B
TK
Cos
ts t
och
iller
21.
98
Tra
nspo
rtat
ion
cost
s de
pend
s on
adi
stan
ce a
nd v
arie
s fr
om 0
.35
to 0
.80
BT
Kpe
r lit
er p
er k
m. T
he c
osts
for
20 k
mdi
stan
ce a
re a
roun
d 0.
60 B
TK
. T
he t
otal
tran
spor
tatio
n co
sts
for
480
L =
288
BT
K
Col
lect
ing
expe
nses
are
bas
ed o
nco
mm
issi
ons
0.65
BT
K p
er o
ne li
ter.
For
480
L th
e co
mm
issi
ons
are
312
BT
KT
otal
col
lect
ing
cost
s ar
e 60
0 B
TK
.T
otal
cos
ts p
er o
ne li
ter
of m
ilk 1
.25
BT
K.
Pro
fit p
er o
ne li
ter
0.65
BT
K, P
rofit
abili
ty3%
(co
mm
issi
ons
312
/ tot
al p
urch
ase
ofm
ilk fr
om th
e S
SP
9'9
48)
Sm
all v
olum
eof
col
lect
edm
ilkN
onho
mog
eneo
usqu
ality
Dea
ling
with
high
num
bers
of S
SP
Sho
rt t
ime
for
deliv
ery
milk
to
chill
ing
and
proc
essi
ngfa
ctor
ies
(bec
ause
of
peris
habi
lity
ofm
ilk)
Con
trac
tsbe
twee
n gr
oups
of S
SP
s an
dco
llect
ors
Bui
ldin
g of
chill
ing
faci
litie
sin
pla
ces
with
high
vol
ume
ofm
ilk p
rodu
ctio
nD
evel
opm
ent o
fro
utes
for
milk
colle
ctio
nIn
trod
uctio
n of
prop
er c
are
ofco
ws
and
milk
ing
resu
lting
inho
mog
eneo
uspr
oduc
t
The
pro
ject
faci
litat
eses
tabl
ishm
ent
ofre
latio
nshi
ps b
etw
een
SS
P g
roup
s an
dco
llect
ors
(who
can
be
mem
bers
of t
hose
grou
ps)
Invo
lvem
ent o
f chi
lling
and
proc
essi
ngfa
ctor
ies
in p
aym
ent
toco
llect
ors
for
thei
r w
ork
Fac
ilita
tion
ofes
tabl
ishm
ent
ofco
ntra
ctua
lre
latio
nshi
ps b
etw
een
SS
P g
roup
s, c
olle
ctor
san
d ch
illin
g/pr
oces
sing
fact
ory
Chi
lling
fact
ory
Priv
ate
com
pany
Chi
lling
and
tran
spor
tco
sts
are
528
BT
KC
osts
topr
oces
sor
23.0
8
Chi
lling
cos
ts a
re 0
.60
BT
K p
er o
ne li
ter.
Tot
al c
osts
are
288
BT
K.
The
se c
osts
incl
ude
all p
roce
ssin
g an
d la
bor
cost
s.D
eliv
ery
to p
roce
ssin
g fa
ctor
y by
lorr
ies.
Tra
nspo
rt e
xpen
ses
varie
s fr
om 0
.5 to
1.0
BT
K p
er li
ter
and
depe
nd o
n di
stan
ce. H
ere
for
the
calc
ulat
ion
take
n 0.
5 B
TK
/L.
Tra
nspo
rt c
osts
240
BT
K.
Tot
al c
osts
at t
his
proc
essi
ng s
tage
are
528
BT
K.
Cos
ts p
er o
ne li
ter
of m
ilk is
1.1
0 B
TK
Uns
atis
fied
dem
and
for
milk
Inef
ficie
nttra
nspo
rtex
pens
es(t
ruck
s de
liver
milk
topr
oces
sing
fact
ory
and
com
e ba
ckem
pty)
Unp
redi
ctab
leel
ectr
icity
cut
s
Incr
ease
of
volu
me
supp
lied
to c
hilli
ng fa
ctor
y
The
pro
ject
sup
port
ses
tabl
ishm
ent o
ftr
ansp
aren
t and
trus
tful
rela
tions
hip
betw
een
chill
ing
fact
ory
and
othe
r V
CA
The
pro
ject
faci
litat
es o
fes
tabl
ishm
ent n
ewch
illin
g fa
cilit
ies
in o
ther
plac
es w
ith h
igh
num
bers
of
SS
Ps
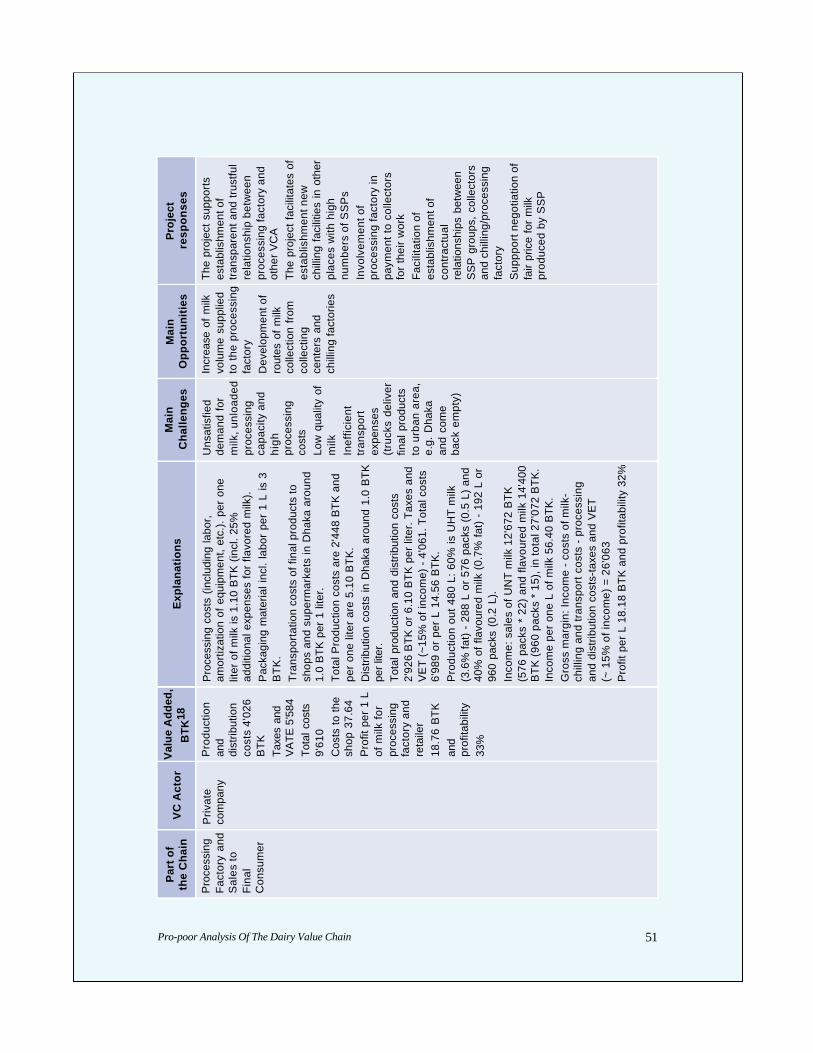
Pro-poor Analysis Of The Dairy Value Chain 51
Par
t o
fth
e C
hai
nV
C A
cto
rV
alu
e A
dd
ed,
BT
K18
Exp
lan
atio
ns
Mai
nC
hal
len
ges
Mai
nO
pp
ort
un
itie
sP
roje
ctre
spo
nse
s
Pro
cess
ing
Fac
tory
and
Sal
es to
Fin
alC
onsu
mer
Priv
ate
com
pany
Pro
duct
ion
and
dist
ribut
ion
cost
s 4'
026
BT
KTa
xes
and
VA
TE
5'5
84To
tal c
osts
9'61
0C
osts
to th
esh
op 3
7.64
Pro
fit p
er 1
Lof
milk
for
proc
essi
ngfa
ctor
y an
dre
taile
r 18
.76
BT
K
and
prof
itabi
lity
33%
Pro
cess
ing
cost
s (in
clud
ing
labo
r,am
ortiz
atio
n of
equ
ipm
ent,
etc.
). p
er o
nelit
er o
f milk
is 1
.10
BT
K (
incl
. 25%
addi
tiona
l exp
ense
s fo
r fla
vore
d m
ilk).
Pac
kagi
ng m
ater
ial i
ncl.
labo
r pe
r 1
L is
3B
TK
.T
rans
port
atio
n co
sts
of fi
nal p
rodu
cts
tosh
ops
and
supe
rmar
kets
in D
haka
aro
und
1.0
BT
K p
er 1
lite
r.
Tot
al P
rodu
ctio
n co
sts
are
2'44
8 B
TK
and
per
one
liter
are
5.1
0 B
TK
.D
istr
ibut
ion
cost
s in
Dha
ka a
roun
d 1.
0 B
TK
per l
iter.
Tot
al p
rodu
ctio
n an
d di
strib
utio
n co
sts
2'92
6 B
TK
or
6.10
BT
K p
er li
ter.
Tax
es a
ndV
ET
(~1
5% o
f inc
ome)
- 4
'061
. Tot
al c
osts
6'98
9 or
per
L 1
4.56
BT
K.
Pro
duct
ion
out
480
L: 6
0% is
UH
T m
ilk(3
.6%
fat)
- 2
88 L
or
576
pack
s (0
.5 L
) an
d40
% o
f fla
vour
ed m
ilk (
0.7%
fat)
- 1
92 L
or
960
pack
s (0
.2 L
).In
com
e: s
ales
of U
NT
milk
12'
672
BT
K(5
76 p
acks
* 2
2) a
nd f
lavo
ured
milk
14'
400
BT
K (
960
pack
s *
15),
in to
tal 2
7'07
2 B
TK
.In
com
e pe
r on
e L
of m
ilk 5
6.40
BT
K.
Gro
ss m
argi
n: In
com
e -
cost
s of
milk
-ch
illin
g an
d tr
ansp
ort c
osts
- p
roce
ssin
gan
d di
strib
utio
n co
sts-
taxe
s an
d V
ET
(~ 1
5% o
f inc
ome)
= 2
6'06
3P
rofit
per
L 1
8.18
BT
K a
nd p
rofit
abili
ty 3
2%
Uns
atis
fied
dem
and
for
milk
, unl
oade
dpr
oces
sing
capa
city
and
hig
hpr
oces
sing
cost
sLo
w q
ualit
y of
milk
Inef
ficie
nttr
ansp
ort
expe
nses
(tru
cks
deliv
erfin
al p
rodu
cts
to u
rban
are
a,e.
g. D
haka
and
com
eba
ck e
mpt
y)
Incr
ease
of
milk
volu
me
supp
lied
to t
he p
roce
ssin
gfa
ctor
yD
evel
opm
ent o
fro
utes
of
milk
colle
ctio
n fr
omco
llect
ing
cent
ers
and
chill
ing
fact
orie
s
The
pro
ject
sup
port
ses
tabl
ishm
ent o
ftr
ansp
aren
t and
trus
tful
rela
tions
hip
betw
een
proc
essi
ng fa
ctor
y an
dot
her
VC
AT
he p
roje
ct f
acili
tate
s of
esta
blis
hmen
t new
chill
ing
faci
litie
s in
oth
erpl
aces
with
hig
hnu
mbe
rs o
f SS
Ps
Invo
lvem
ent o
fpr
oces
sing
fact
ory
inpa
ymen
t to
col
lect
ors
for
thei
r w
ork
Fac
ilita
tion
ofes
tabl
ishm
ent o
fco
ntra
ctua
lre
latio
nshi
ps b
etw
een
SS
P g
roup
s, c
olle
ctor
san
d ch
illin
g/pr
oces
sing
fact
ory
Sup
ppor
t neg
otia
tion
offa
ir pr
ice
for
milk
prod
uced
by
SS
P
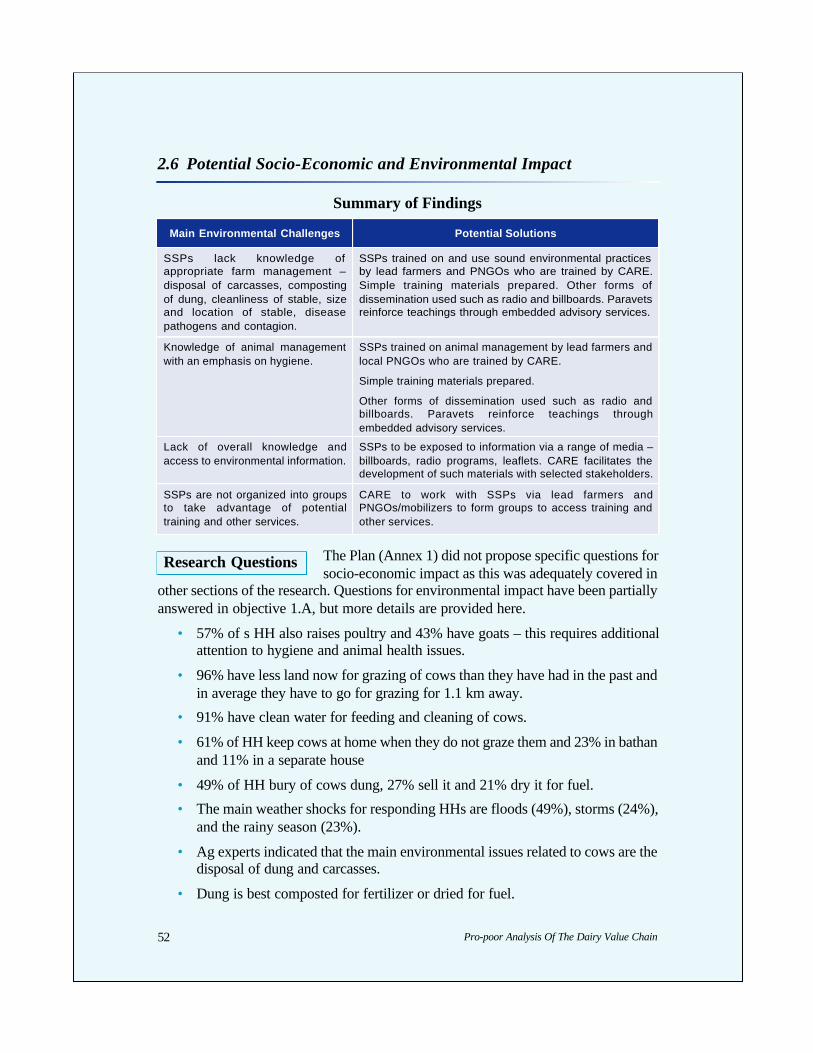
Pro-poor Analysis Of The Dairy Value Chain52
2.6 Potential Socio-Economic and Environmental Impact
Summary of Findings
The Plan (Annex 1) did not propose specific questions forsocio-economic impact as this was adequately covered in
other sections of the research. Questions for environmental impact have been partiallyanswered in objective 1.A, but more details are provided here.
• 57% of s HH also raises poultry and 43% have goats – this requires additionalattention to hygiene and animal health issues.
• 96% have less land now for grazing of cows than they have had in the past andin average they have to go for grazing for 1.1 km away.
• 91% have clean water for feeding and cleaning of cows.
• 61% of HH keep cows at home when they do not graze them and 23% in bathanand 11% in a separate house
• 49% of HH bury of cows dung, 27% sell it and 21% dry it for fuel.
• The main weather shocks for responding HHs are floods (49%), storms (24%),and the rainy season (23%).
• Ag experts indicated that the main environmental issues related to cows are thedisposal of dung and carcasses.
• Dung is best composted for fertilizer or dried for fuel.
Main Environmental Challenges Potential Solutions
SSPs lack knowledge ofappropriate farm management –disposal of carcasses, compostingof dung, cleanliness of stable, sizeand location of stable, diseasepathogens and contagion.
SSPs trained on and use sound environmental practicesby lead farmers and PNGOs who are trained by CARE.Simple training materials prepared. Other forms ofdissemination used such as radio and billboards. Paravetsreinforce teachings through embedded advisory services.
Knowledge of animal managementwith an emphasis on hygiene.
SSPs trained on animal management by lead farmers andlocal PNGOs who are trained by CARE.
Simple training materials prepared.
Other forms of dissemination used such as radio andbillboards. Paravets reinforce teachings throughembedded advisory services.
Lack of overall knowledge andaccess to environmental information.
SSPs to be exposed to information via a range of media –billboards, radio programs, leaflets. CARE facilitates thedevelopment of such materials with selected stakeholders.
SSPs are not organized into groupsto take advantage of potentialtraining and other services.
CARE to work with SSPs via lead farmers andPNGOs/mobilizers to form groups to access training andother services.
Research Questions

Pro-poor Analysis Of The Dairy Value Chain 53
• Carcasses can carry disease, and if buried untreated, cause threat to the groundwater.• Project staffs have observed the practice of HHs to skin cattle and throw them
in the river.
A Technical Note on Economic Targeting of Clients:
In the light of Strengthening the Dairy Value Chain in Bangladesh Project, the targetgroup can be further divided into the survival poor21, the entrepreneurial poor22 and theemployers of the poor2 3. It can be assumed that the second and third category of therural poor will profit from the project activities first of all. However, the project triesto give chances to farmers with small production resources and who live relatively faraway from the potential markets.
Graph 3: Division of Farmers for Different Development Aims
Program (Project) Interventions
In the first stage of the project, there will be a greater focus on clients living closer tochilling centres and who have 2-3 cows. Piloting of more complex project componentssuch as crossbreeds will begin with more experienced farmers who own 4-5+ cows.Farmers in more remote areas will be brought into the project as it progresses and asinnovative transportation systems have been trialed and proven cost-effective.
21 Survival poor: those poor whose first priority is to improve their insecure livelihood, both through subsistence andmarket oriented production
22 Entrepreneurial poor: those poor who have secured their basic livelihood and engage in market oriented productionto further improve it
23 This can be micro, small and medium-sized dairy farms: those who have entrepreneurial spirit and managementexperience and oriented at market production

Pro-poor Analysis Of The Dairy Value Chain54
A clear understanding of risks and a defined risk mitigation strategy are criticalelements of any value chain development program. The following table examines keyrisks that will exist in working towards overcoming value chain bottlenecks.Suggestions for risk mitigation are included.
3. Program Risks
Key Program Risks Potential Solutions
Production: SSPs are unable to upgrade qualityand quantity of milk production.
Pilot alternate approaches for feeds, breeds,and healthcare in case one or more approachesis not successful.
Support Services: Commercial serviceproviders do not adjust services to meet needsof SSPs
Service delivery and availability improved asper objective 1.A.
Market Access: SSPs are not motivated due tolow profitability of milk. Processors do not followthrough on commitments to establish chillingplants.
SSPs are organized into groups to consolidatemilk. CARE works with its FFs, lead farmers,and local PNGOs/mobilizers to form producergroups.
See objectives 3 an 4.
Value Chain Relationships: Distrust amongstVC actors results in intransigent bottlenecks.
Trust is promoted through the establishment ofwin-win relationships. Lead farmers are trainedin negotiation and mediation as appropriate.
Enabling Environment: The government doesnot improve support of the dairy sector, andother NGOs distort the market.
Government support is improved key areas asper objective 4.
Liaise with other NGOs working in the dairysector and discuss market distortion andsustainable development.
Gender: HHs are not receptive to women’sneeds and concerns.
Address issues as in objective 3.
Natural Disasters: Program success iscompromised by natural disasters, particularlyflooding in Char areas.
CARE to conduct a focused study of Char areasto understand the nature of risk and potentialrisk mitigation strategies.
Displacement: Players in informal marketchannels are displaced by the development offormal markets.
Baseline survey to include information oninformal market actors; M&E to follow up ontheir situation.
HH Well-being: The price of milk is driven up byformal market demand and HHs cannot affordfresh milk; consumption of producing HHs isreduced in preference to sales.
Collaboration with other projects and PNGOsthat are focused on HH health, and particularlymaternal well-being as well as that of children,especially girls.
Awareness raising as appropriate through avariety of media.

Pro-poor Analysis Of The Dairy Value Chain 55
The specific objectives of the project are to: • Improve milk collection systems in rural and remote areas
• Improve access to inputs, markets, and services by mobilizing groups of poorfarmers, producers, and char dweller
• Improve the milk transport network• Ensure access to quality services at the producer level• Improve the policy environment
The findings in each of the above sections provide detailed information on constraints,opportunities and potential solutions that will enable CARE to meet all projectobjectives.
Key overarching approaches of the first project phase leading to the successfulachievement of project objectives can be summarized as follows:
1. Work with a variety of SSPs united into informal groups which havesufficient production resources and decision making authority. In order todevelop strong farm management, those with more cows (sign ofprosperity) and closer proximity to chilling centres should be targeted at theoutset.
2. Utilize lead farmer models to build capacity at the grassroots level intechnical areas as well as marketing/sales, and negotiation and mediation ofrelationships. Lead farmers – both women and men – will be moresophisticated, capable of learning technical information and transferring toproducer groups, and able to act on behalf of the group in dealing withmarket channels.
3. Develop sustainable commercial services as much as possible to ensureongoing availability beyond the life of the project – paravets, inputsuppliers, A/I services, collectors.
4. Empower women and women’s groups to be active participants in the dairyvalue chain. At the same time, develop youth as future leaders and serviceproviders (e.g. paravets).
5. Support FFs, lead farmers and PNGO´s in working with SSPs to mobilizegroup formation, develop leadership skills, monitor knowledge acquisitionand skills transfer, and provide training modules as assigned by the project.
4. Response to Overarching Objectives
5. Potential Approaches
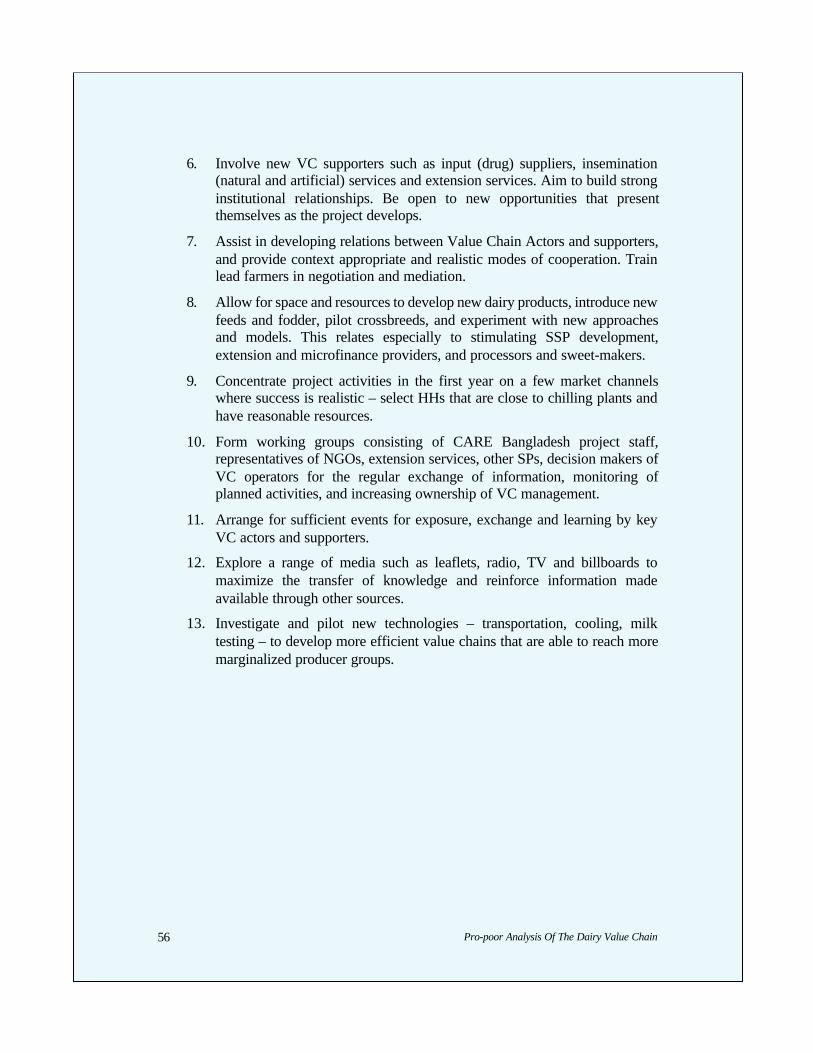
Pro-poor Analysis Of The Dairy Value Chain56
6. Involve new VC supporters such as input (drug) suppliers, insemination(natural and artificial) services and extension services. Aim to build stronginstitutional relationships. Be open to new opportunities that presentthemselves as the project develops.
7. Assist in developing relations between Value Chain Actors and supporters,and provide context appropriate and realistic modes of cooperation. Trainlead farmers in negotiation and mediation.
8. Allow for space and resources to develop new dairy products, introduce newfeeds and fodder, pilot crossbreeds, and experiment with new approachesand models. This relates especially to stimulating SSP development,extension and microfinance providers, and processors and sweet-makers.
9. Concentrate project activities in the first year on a few market channelswhere success is realistic – select HHs that are close to chilling plants andhave reasonable resources.
10. Form working groups consisting of CARE Bangladesh project staff,representatives of NGOs, extension services, other SPs, decision makers ofVC operators for the regular exchange of information, monitoring ofplanned activities, and increasing ownership of VC management.
11. Arrange for sufficient events for exposure, exchange and learning by keyVC actors and supporters.
12. Explore a range of media such as leaflets, radio, TV and billboards tomaximize the transfer of knowledge and reinforce information madeavailable through other sources.
13. Investigate and pilot new technologies – transportation, cooling, milktesting – to develop more efficient value chains that are able to reach moremarginalized producer groups.
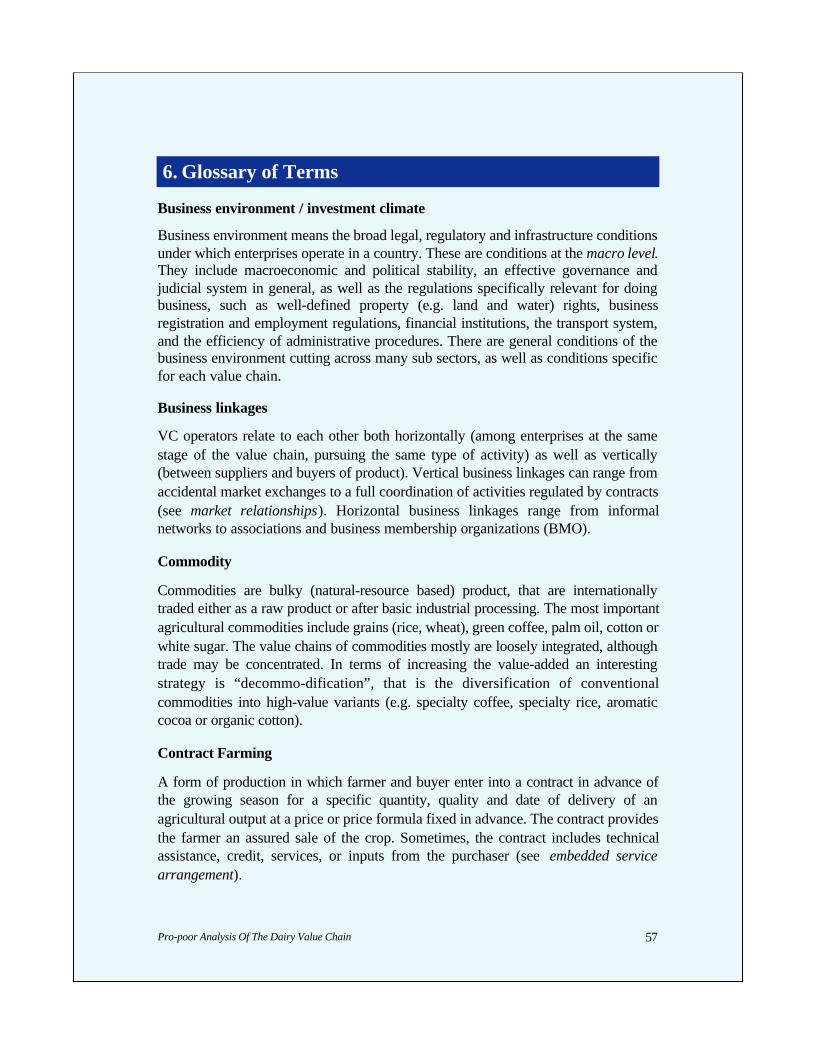
Pro-poor Analysis Of The Dairy Value Chain 57
Business environment / investment climate
Business environment means the broad legal, regulatory and infrastructure conditionsunder which enterprises operate in a country. These are conditions at the macro level.They include macroeconomic and political stability, an effective governance andjudicial system in general, as well as the regulations specifically relevant for doingbusiness, such as well-defined property (e.g. land and water) rights, businessregistration and employment regulations, financial institutions, the transport system,and the efficiency of administrative procedures. There are general conditions of thebusiness environment cutting across many sub sectors, as well as conditions specificfor each value chain.
Business linkages
VC operators relate to each other both horizontally (among enterprises at the samestage of the value chain, pursuing the same type of activity) as well as vertically(between suppliers and buyers of product). Vertical business linkages can range fromaccidental market exchanges to a full coordination of activities regulated by contracts(see market relationships). Horizontal business linkages range from informalnetworks to associations and business membership organizations (BMO).
Commodity
Commodities are bulky (natural-resource based) product, that are internationallytraded either as a raw product or after basic industrial processing. The most importantagricultural commodities include grains (rice, wheat), green coffee, palm oil, cotton orwhite sugar. The value chains of commodities mostly are loosely integrated, althoughtrade may be concentrated. In terms of increasing the value-added an interestingstrategy is “decommo-dification”, that is the diversification of conventionalcommodities into high-value variants (e.g. specialty coffee, specialty rice, aromaticcocoa or organic cotton).
Contract Farming
A form of production in which farmer and buyer enter into a contract in advance ofthe growing season for a specific quantity, quality and date of delivery of anagricultural output at a price or price formula fixed in advance. The contract providesthe farmer an assured sale of the crop. Sometimes, the contract includes technicalassistance, credit, services, or inputs from the purchaser (see embedded servicearrangement).
6. Glossary of Terms

Pro-poor Analysis Of The Dairy Value Chain58
Embedded service arrangement
In an embedded service arrangement operational services are delivered incombination with a basic business transaction (sale of products or loans). The basicidea is to finance the service as part of the business transaction, e.g. linking technicaladvice to the sale of inputs. Embedded arrangement may include other businesspartners as the service providers, such as input dealers or processing companies, orprofessional service providers as third parties.
Facilitator / facilitation
Facilitators are initiators pursuing a public interest in economic development (such asthe pro-poor growth goal). This includes government programmes for private sectordevelopment as well as development projects funded by international donors.Contrary to the VC actors, such programmes and projects are funded publicly (by taxmoney). They remain outsiders to the regular business process and restrict themselvesto temporarily facilitating a chain upgrading strategy. Typical facilitation tasksinclude creating awareness, facilitating joint strategy building and action and thecoordination of support activities.
Interventions (to promote value chains)
Interventions are temporary actions of external facilitators aimed at mobilising and/orjoining value chain actors and building their capacity thus promoting change in thevalue chain. The idea is that an external intervention triggers an internal change of thesystem, in this case the behaviour of VC actors.
Leverage point
An element in a system, where a small intervention or change can yield large effectsin the overall system.
Macro level
The macro level refers to the public agencies and institutions constituting the businessenabling environment. Typically, the macro level of a value chain is made up of national,regional and local government, the judicial system and major providers of public utilities(especially roads and water supply). The macro level determines the general cost ofdoing business cutting across different value chains and sectors of the economy.
Markets / market relationships
A market is the interaction of demand and supply (buyers and sellers) of particulartypes of goods or services. The exchange rules differ depending on the character ofthe good traded (e.g. commodities, perishable products, investment goods or services).There are different forms of market relationships: The basic market transaction is a
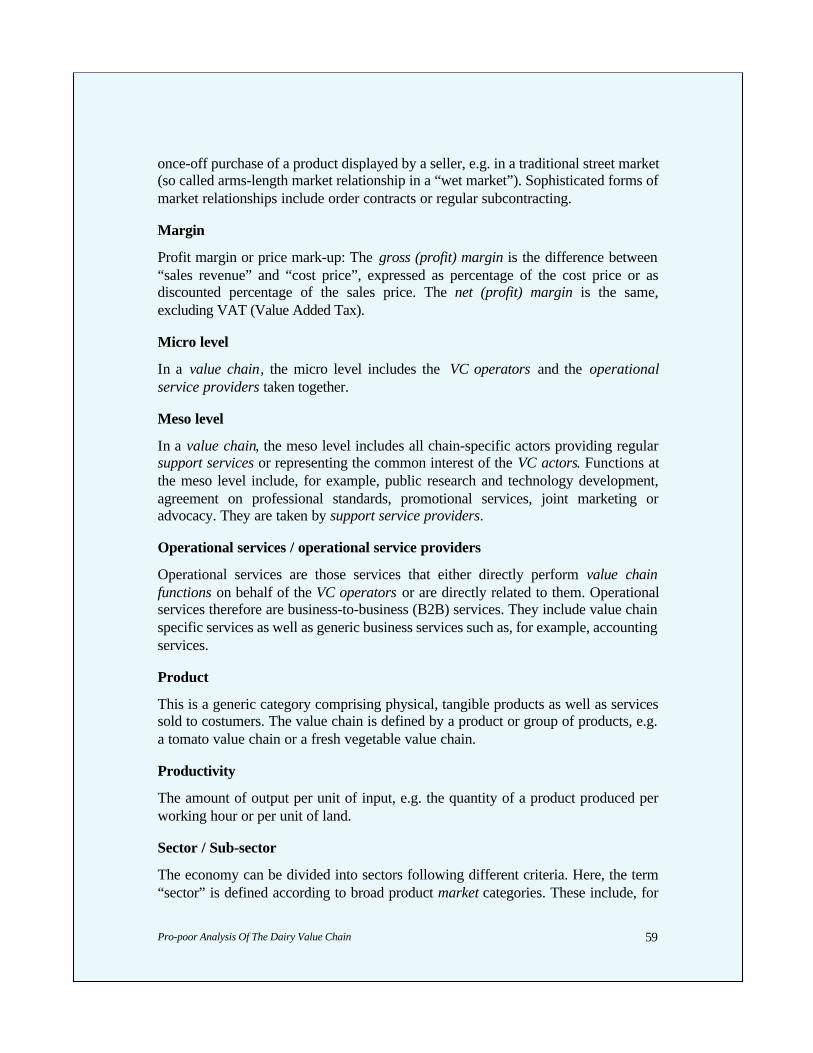
Pro-poor Analysis Of The Dairy Value Chain 59
once-off purchase of a product displayed by a seller, e.g. in a traditional street market(so called arms-length market relationship in a “wet market”). Sophisticated forms ofmarket relationships include order contracts or regular subcontracting.
Margin
Profit margin or price mark-up: The gross (profit) margin is the difference between“sales revenue” and “cost price”, expressed as percentage of the cost price or asdiscounted percentage of the sales price. The net (profit) margin is the same,excluding VAT (Value Added Tax).
Micro level
In a value chain, the micro level includes the VC operators and the operationalservice providers taken together.
Meso level
In a value chain, the meso level includes all chain-specific actors providing regularsupport services or representing the common interest of the VC actors. Functions atthe meso level include, for example, public research and technology development,agreement on professional standards, promotional services, joint marketing oradvocacy. They are taken by support service providers.
Operational services / operational service providers
Operational services are those services that either directly perform value chainfunctions on behalf of the VC operators or are directly related to them. Operationalservices therefore are business-to-business (B2B) services. They include value chainspecific services as well as generic business services such as, for example, accountingservices.
Product
This is a generic category comprising physical, tangible products as well as servicessold to costumers. The value chain is defined by a product or group of products, e.g.a tomato value chain or a fresh vegetable value chain.
Productivity
The amount of output per unit of input, e.g. the quantity of a product produced perworking hour or per unit of land.
Sector / Sub-sector
The economy can be divided into sectors following different criteria. Here, the term“sector” is defined according to broad product market categories. These include, for
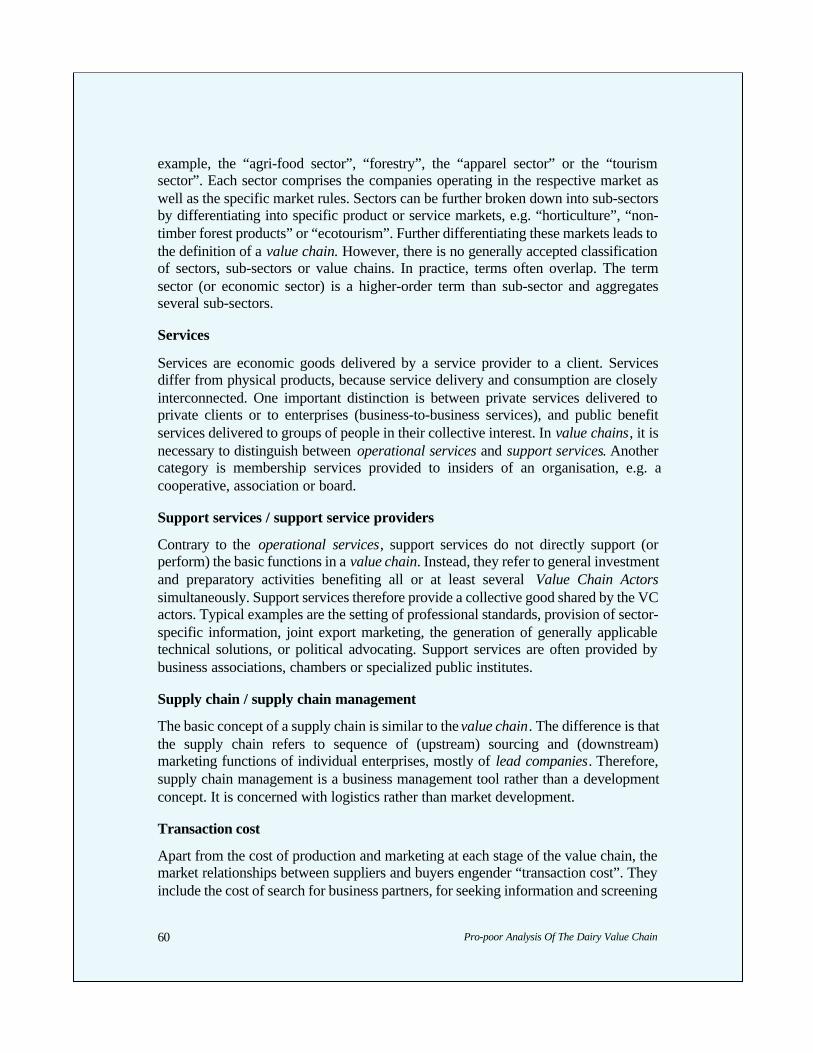
Pro-poor Analysis Of The Dairy Value Chain60
example, the “agri-food sector”, “forestry”, the “apparel sector” or the “tourismsector”. Each sector comprises the companies operating in the respective market aswell as the specific market rules. Sectors can be further broken down into sub-sectorsby differentiating into specific product or service markets, e.g. “horticulture”, “non-timber forest products” or “ecotourism”. Further differentiating these markets leads tothe definition of a value chain. However, there is no generally accepted classificationof sectors, sub-sectors or value chains. In practice, terms often overlap. The termsector (or economic sector) is a higher-order term than sub-sector and aggregatesseveral sub-sectors.
Services
Services are economic goods delivered by a service provider to a client. Servicesdiffer from physical products, because service delivery and consumption are closelyinterconnected. One important distinction is between private services delivered toprivate clients or to enterprises (business-to-business services), and public benefitservices delivered to groups of people in their collective interest. In value chains, it isnecessary to distinguish between operational services and support services. Anothercategory is membership services provided to insiders of an organisation, e.g. acooperative, association or board.
Support services / support service providers
Contrary to the operational services, support services do not directly support (orperform) the basic functions in a value chain. Instead, they refer to general investmentand preparatory activities benefiting all or at least several Value Chain Actorssimultaneously. Support services therefore provide a collective good shared by the VCactors. Typical examples are the setting of professional standards, provision of sector-specific information, joint export marketing, the generation of generally applicabletechnical solutions, or political advocating. Support services are often provided bybusiness associations, chambers or specialized public institutes.
Supply chain / supply chain management
The basic concept of a supply chain is similar to the value chain. The difference is thatthe supply chain refers to sequence of (upstream) sourcing and (downstream)marketing functions of individual enterprises, mostly of lead companies. Therefore,supply chain management is a business management tool rather than a developmentconcept. It is concerned with logistics rather than market development.
Transaction cost
Apart from the cost of production and marketing at each stage of the value chain, themarket relationships between suppliers and buyers engender “transaction cost”. Theyinclude the cost of search for business partners, for seeking information and screening

Pro-poor Analysis Of The Dairy Value Chain 61
the market, and for negotiating, monitoring and enforcing contracts. High transactioncosts often are the result of market inefficiencies, such as low market transparency,lacking grades and standards or deficiencies in the business environment. They can bebrought down by organizing markets and by improving value chain coordination.
Value added
Value added is a measure for the value created in the economy. It is equivalent to thetotal value generated by the operators in the chain (chain revenue = final sales price* volume sold). The value added per unit of product is the difference between theprice obtained by a VC operator and the price that the operator has paid for the inputsdelivered by operators of the preceding stage of the value chain and the intermediategoods bought in from suppliers of inputs and services who are not regarded as part ofthe value chain. In short: “The worth that is added to a good or service at each stageof its production or distribution” (McCormick/ Schmitz). Part of the additional valuecreated remains in the chain (= value captured), another part is captured by suppliersexternal to the chain
Value chain (VC)
A value chain is
- a sequence of related business activities (functions) from the provision of specificinputs for a particular product to primary production, transformation, marketing, andup to the final sale of the particular product to consumers (the functional view on avalue chain).
- the set of enterprises (operators) performing these functions i.e. producers,processors, traders and distributors of a particular product. Enterprises are linked bya series of business transactions in which the product is passed on from primaryproducers to end consumers.
According to the sequence of functions and operators, value chains consist of a seriesof chain links (or stages).
Value chain map / value chain mapping
The value chain map is a visual representation (chart) of the micro and meso levels ofthe value chain. According to the definition of the value chain it consists of afunctional map combined with a map of VC actors. Mapping can but does notnecessarily include the macro level of a value chain.
Value chain promotion
Promoting a value chains means supporting its development by externally facilitatinga value chain upgrading strategy.

Pro-poor Analysis Of The Dairy Value Chain62
Value creation / value created
The additional value added as a consequence of value chain upgrading.
VC actor
This term summarizes all individuals, enterprises and public agencies related to avalue chain, in particular the VC operators, providers of operational services and theproviders of support services. In a wider sense, certain government agencies at themacro level can also be seen as VC actors if they perform crucial functions in thebusiness environment of the value chain in question.
VC operator
The enterprises performing the basic functions of a value chain are VC operators.Typical operators include farmers, small and medium enterprises, industrialcompanies, exporters, wholesalers and retailers. They have in common that theybecome owners of the (raw, semi processed or finished) product at one stage in theVC. Thus, there is a difference between operators and “operational serviceproviders”, the latter being subcontracted by the VC operators.
VC supporter / support service provider
Service Providers provide VC support services and represent the common interests ofthe VC actors. They belong to the meso level of the value chain.
Vertical coordination / vertical integration
As value chains upgrade the vertical coordination between the different stages of thevalue chain increases. This means that relationships are being regulated throughagreements and written contracts. This coordination function is often taken by a leadcompany. At the extreme, the relationship between suppliers and buyers is“integrated” to the extent that the production and marketing functions of a supplier areentirely controlled by the buying company (also see value chain governance)
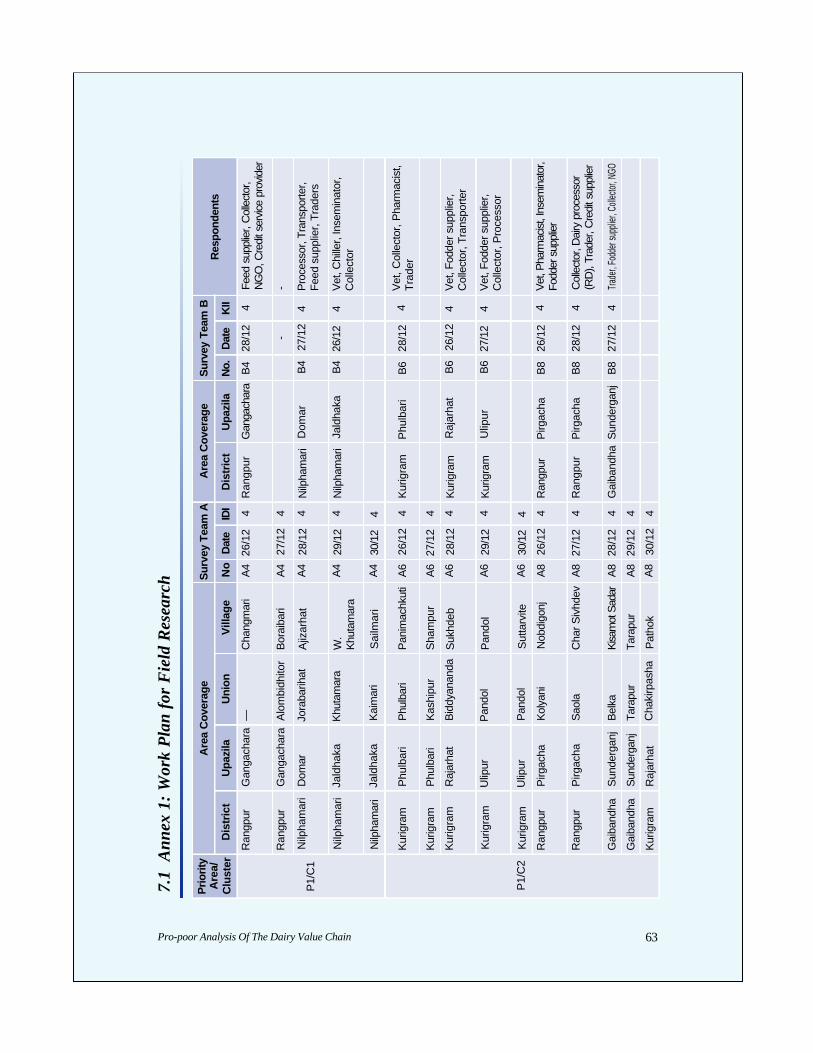
Pro-poor Analysis Of The Dairy Value Chain 63
7.1
Ann
ex 1
: W
ork
Pla
n fo
r F
ield
Res
earc
h
Pri
ority
Are
a/C
lust
er
Are
a C
over
age
Sur
vey
Team
AA
rea
Cov
erag
eS
urve
y Te
am B
Res
pond
ents
Dis
tric
tU
pazi
laU
nion
Vill
age
No
Dat
eID
ID
istr
ict
Upa
zila
No.
Dat
eK
II
P1/
C1
Ran
gpur
Gan
gach
ara
—C
hang
mar
iA
426
/12
4R
angp
urG
anga
char
a B
428
/12
4Fe
ed s
uppl
ier,
Col
lect
or,
NG
O, C
redi
t ser
vice
pro
vide
r
Ran
gpur
Gan
gach
ara
Alo
mbi
dhito
rB
orai
bari
A4
27/1
24
--
Nilp
ham
ari
Dom
arJo
raba
rihat
Ajiz
arha
tA
428
/12
4N
ilpha
mar
iD
omar
B4
27/1
24
Pro
cess
or, T
rans
porte
r,Fe
ed s
uppl
ier,
Trad
ers
Nilp
ham
ari
Jald
haka
Khu
tam
ara
W.
Khu
tam
ara
A4
29/1
24
Nilp
ham
ari
Jald
haka
B4
26/1
24
Vet
, Chi
ller,
Inse
min
ator
,C
olle
ctor
Nilp
ham
ari
Jald
haka
Kai
mar
iS
ailm
ari
A4
30/1
24
P1/
C2
Kur
igra
mP
hulb
ari
Phu
lbar
iP
anim
achk
uti
A6
26/1
24
Kur
igra
mP
hulb
ari
B6
28/1
24
Vet
, Col
lect
or, P
harm
acis
t,Tr
ader
Kur
igra
mP
hulb
ari
Kas
hipu
rS
ham
pur
A6
27/1
24
Kur
igra
mR
ajar
hat
Bid
dyan
anda
Suk
hdeb
A6
28/1
24
Kur
igra
mR
ajar
hat
B6
26/1
24
Vet
, Fod
der s
uppl
ier,
Col
lect
or, T
rans
porte
r
Kur
igra
mU
lipur
Pan
dol
Pan
dol
A6
29/1
24
Kur
igra
mU
lipur
B6
27/1
24
Vet
, Fod
der s
uppl
ier,
Col
lect
or, P
roce
ssor
Kur
igra
mU
lipur
Pan
dol
Sut
tarv
iteA
630
/12
4
Ran
gpur
Pirg
acha
Kol
yani
Nob
digo
njA
826
/12
4R
angp
urP
irgac
haB
826
/12
4V
et, P
harm
acis
t, In
sem
inat
or,
Fodd
er s
uppl
ier
Ran
gpur
Pirg
acha
Sao
laC
har S
ivhd
evA
827
/12
4R
angp
urP
irgac
haB
828
/12
4C
olle
ctor
, Dai
ry p
roce
ssor
(RD
), Tr
ader
, Cre
dit s
uppl
ier
Gai
band
haS
unde
rgan
jB
elka
Kisa
mot
Sad
arA
828
/12
4G
aiba
ndha
Sun
derg
anj
B8
27/1
24
Trad
er, Fo
dder
supp
lier, C
ollec
tor, N
GO
Gai
band
haS
unde
rgan
jTa
rapu
rTa
rapu
rA
829
/12
4
Kur
igra
mR
ajar
hat
Cha
kirp
asha
Pat
hok
A8
30/1
24
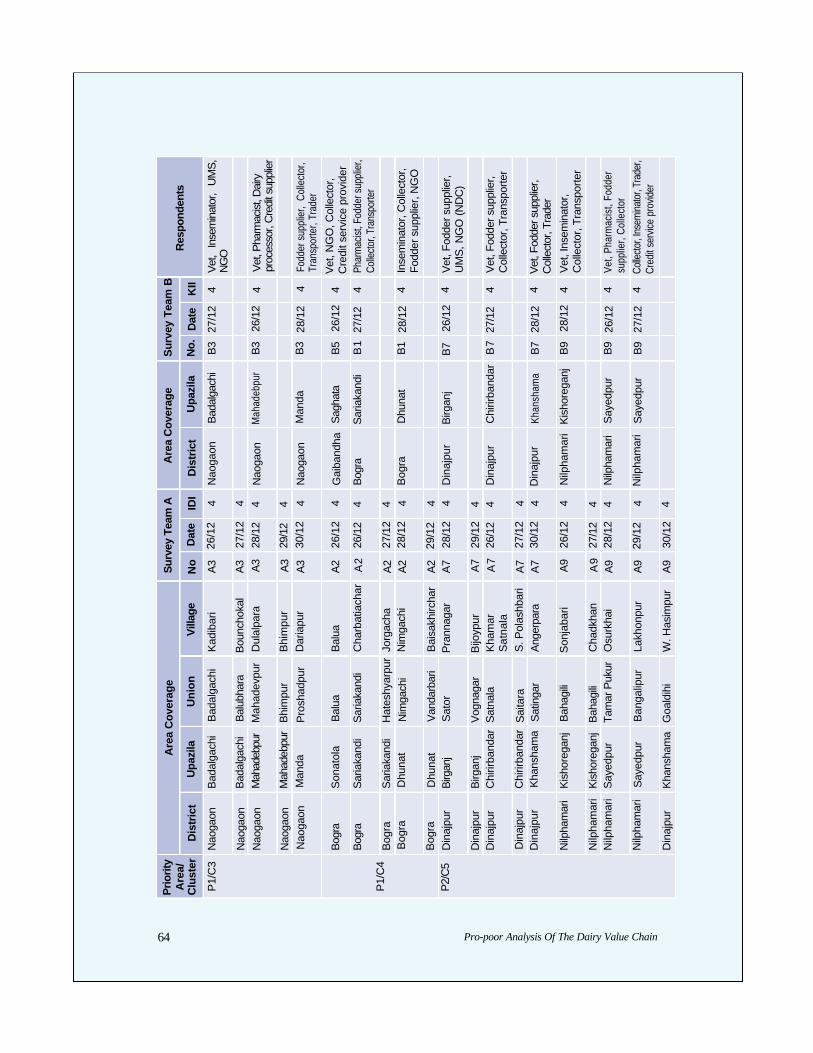
Pro-poor Analysis Of The Dairy Value Chain64
Pri
ority
Are
a/C
lust
er
Are
a C
over
age
Sur
vey
Team
AA
rea
Cov
erag
eS
urve
y Te
am B
Res
pond
ents
Dis
tric
tU
pazi
laU
nio
nV
illag
eN
oD
ate
IDI
Dis
tric
tU
pazi
laN
o.D
ate
KII
P1/
C3
Nao
gaon
Bad
alga
chi
Bad
alga
chi
Kad
ibar
iA
326
/12
4N
aoga
onB
adal
gach
iB
327
/12
4V
et,
Inse
min
ator
, U
MS
,N
GO
Nao
gaon
Bad
alga
chi
Bal
ubha
raB
ounc
hoka
lA
327
/12
4
Nao
gaon
Mah
adeb
pur
Mah
adev
pur
Dul
alpa
raA
328
/12
4N
aoga
onM
ahad
ebpu
rB
326
/12
4V
et, P
harm
acis
t, D
airy
proc
esso
r, C
redi
t sup
plie
rN
aoga
onM
ahad
ebpu
rB
him
pur
Bhi
mpu
rA
329
/12
4
Nao
gaon
Man
daP
rosh
adpu
rD
aria
pur
A3
30/1
24
Nao
gaon
Man
daB
328
/12
4Fo
dder
sup
plie
r, C
olle
ctor
,Tr
ansp
orte
r, Tr
ader
P1/
C4
Bog
raS
onat
ola
Bal
uaB
alua
A2
26/1
24
Gai
band
haS
agha
taB
526
/12
4V
et, N
GO
, Col
lect
or,
Cre
dit s
ervi
ce p
rovi
der
Bog
raS
aria
kand
iS
aria
kand
iC
harb
atia
char
A2
26/1
24
Bog
raS
aria
kand
iB
127
/12
4Ph
arm
acist
, Fod
der s
uppl
ier,
Colle
ctor
, Tra
nspo
rter
Bog
raS
aria
kand
iH
ates
hyar
pur
Jorg
acha
A2
27/1
24
Bog
raD
huna
tN
imga
chi
Nim
gach
iA
228
/12
4B
ogra
Dhu
nat
B1
28/1
24
Inse
min
ator
, Col
lect
or,
Fodd
er s
uppl
ier,
NG
OB
ogra
Dhu
nat
Van
darb
ari
Bai
sakh
ircha
rA
229
/12
4P
2/C
5D
inaj
pur
Birg
anj
Sat
orP
rann
agar
A7
28/1
24
Din
ajpu
rB
irgan
jB
726
/12
4V
et, F
odde
r sup
plie
r,U
MS
, NG
O (
ND
C)
Din
ajpu
rB
irgan
jV
ogna
gar
Bijo
ypur
A7
29/1
24
Din
ajpu
rC
hirir
band
arS
atna
laK
ham
arS
atna
laA
726
/12
4D
inaj
pur
Chi
rirba
ndar
B7
27/1
24
Vet
, Fod
der s
uppl
ier,
Col
lect
or, T
rans
porte
rD
inaj
pur
Chi
rirba
ndar
Sai
tara
S. P
olas
hbar
iA
727
/12
4D
inaj
pur
Kha
nsha
ma
Sat
inga
rA
nger
para
A7
30/1
24
Din
ajpu
rKh
ansh
ama
B7
28/1
24
Vet
, Fod
der s
uppl
ier,
Col
lect
or, T
rade
r
Nilp
ham
ari
Kis
hore
ganj
Bah
agili
Son
jaba
riA
926
/12
4N
ilpha
mar
iK
isho
rega
njB
928
/12
4V
et, I
nsem
inat
or,
Col
lect
or, T
rans
porte
rN
ilpha
mar
iK
isho
rega
njB
ahag
iliC
hadk
han
A9
27/1
24
Nilp
ham
ari
Say
edpu
rTa
mar
Puk
urO
surk
hai
A9
28/1
24
Nilp
ham
ari
Say
edpu
rB
926
/12
4Ve
t, Ph
arm
acis
t, Fo
dder
supp
lier,
Col
lect
orN
ilpha
mar
iS
ayed
pur
Ban
galip
urLa
khon
pur
A9
29/1
24
Nilp
ham
ari
Say
edpu
rB
927
/12
4Co
llecto
r, In
sem
inato
r, Tr
ader
,Cr
edit
serv
ice p
rovid
er
Din
ajpu
rK
hans
ham
aG
oald
ihi
W. H
asim
pur
A9
30/1
24

Pro-poor Analysis Of The Dairy Value Chain 65
Pri
ority
Are
a/C
lust
er
Are
a C
over
age
Sur
vey
Team
AA
rea
Cov
erag
eS
urve
y Te
am B
Res
pond
ents
Dis
tric
tU
pazi
laU
nio
nV
illag
eN
oD
ate
IDI
Dis
tric
tU
pazi
laN
o.D
ate
KII
P2/
C6
Gai
band
haP
alas
hbar
iM
ohod
ipur
Dur
gapu
rA
526
/12
4G
aiba
ndha
Pal
ashb
ari
B5
26/1
24
Vet
, Col
lect
or, D
airy
proc
esso
r, N
GO
Gai
band
haP
alas
hbar
iP
olas
hbar
iW
. Goa
lpar
aA
527
/12
4
Gai
band
haG
abin
daga
njS
apm
ara
Sap
mar
aA
528
/12
4G
aiba
ndha
Gab
inda
ganj
B5
27/1
23
Pha
rmac
ist,
Col
lect
or,
Trad
er
Gai
band
haS
haga
taS
haga
taS
atha
liaA
529
/12
4
Joyp
urha
tP
anch
bibi
Sul
tanp
urS
ulta
npur
A1
27/1
24
Joyp
urha
tP
anch
bibi
B2
26/1
24
Inse
min
ator
, U
MS
,C
olle
ctor
, Tra
der
Joyp
urha
tP
anch
bibi
Bal
igha
taP
atab
huga
A1
28/1
24
Joyp
urha
tJo
ypur
hat
Sad
arD
halo
hara
Bis
hnup
urA
126
/12
4Jo
ypur
hat
Joyp
urha
tS
adar
B2
27/1
24
Fodd
er s
uppl
ier,
Colle
ctor
,NG
O, C
redi
t ser
vice
prov
ider
Joyp
urha
tK
alai
Kal
aiM
ulgr
amA
129
/12
4Jo
ypur
hat
Kal
aiB
228
/12
3C
hille
r, V
et, C
olle
ctor
Joyp
urha
tK
alai
Am
dai
Rur
aiA
130
/12
4B
ogra
Son
atol
aB
128
/12
2Fo
dder
sup
plie
r, Tr
ansp
orte
r
Bog
raG
abta
liN
arua
mal
aB
ahad
urpu
rS
P26
/12
4B
ogra
Gab
tali
SP
26/1
24
Fodd
er s
uppl
ier,
UM
S,
Col
lect
or, D
airy
pro
cess
or
Tota
l:18
010
8
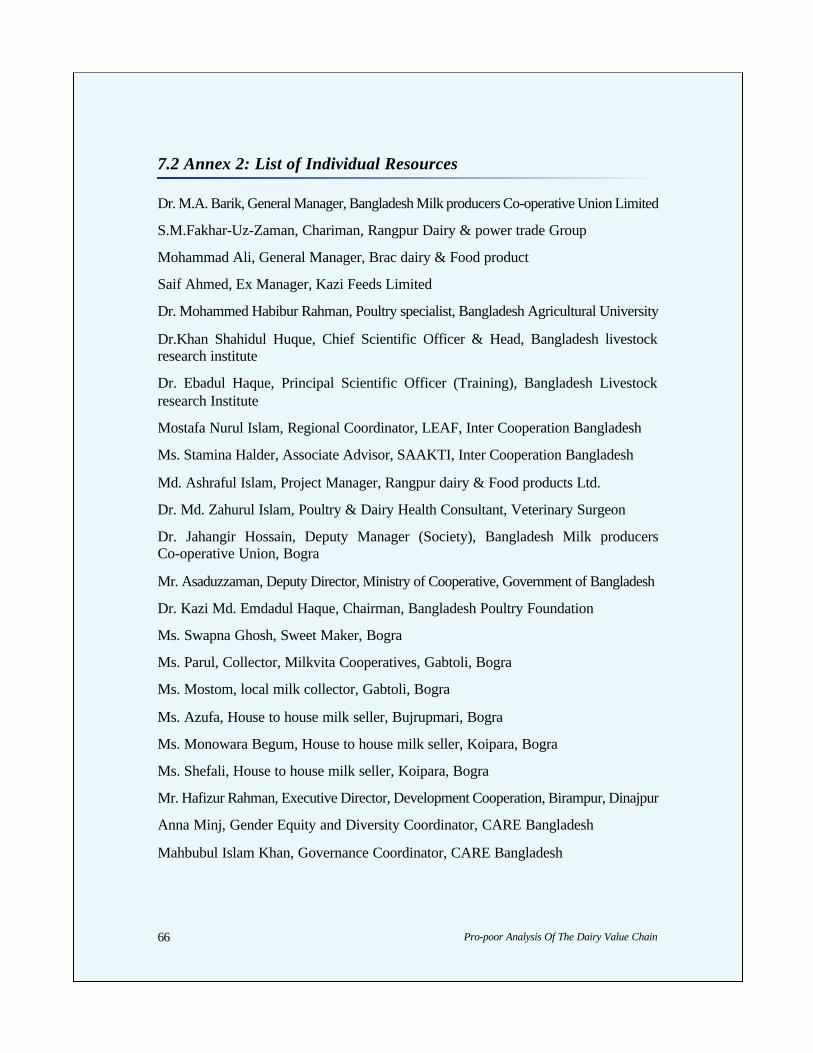
Pro-poor Analysis Of The Dairy Value Chain66
7.2 Annex 2: List of Individual Resources
Dr. M.A. Barik, General Manager, Bangladesh Milk producers Co-operative Union Limited
S.M.Fakhar-Uz-Zaman, Chariman, Rangpur Dairy & power trade Group
Mohammad Ali, General Manager, Brac dairy & Food product
Saif Ahmed, Ex Manager, Kazi Feeds Limited
Dr. Mohammed Habibur Rahman, Poultry specialist, Bangladesh Agricultural University
Dr.Khan Shahidul Huque, Chief Scientific Officer & Head, Bangladesh livestockresearch institute
Dr. Ebadul Haque, Principal Scientific Officer (Training), Bangladesh Livestockresearch Institute
Mostafa Nurul Islam, Regional Coordinator, LEAF, Inter Cooperation Bangladesh
Ms. Stamina Halder, Associate Advisor, SAAKTI, Inter Cooperation Bangladesh
Md. Ashraful Islam, Project Manager, Rangpur dairy & Food products Ltd.
Dr. Md. Zahurul Islam, Poultry & Dairy Health Consultant, Veterinary Surgeon
Dr. Jahangir Hossain, Deputy Manager (Society), Bangladesh Milk producersCo-operative Union, Bogra
Mr. Asaduzzaman, Deputy Director, Ministry of Cooperative, Government of Bangladesh
Dr. Kazi Md. Emdadul Haque, Chairman, Bangladesh Poultry Foundation
Ms. Swapna Ghosh, Sweet Maker, Bogra
Ms. Parul, Collector, Milkvita Cooperatives, Gabtoli, Bogra
Ms. Mostom, local milk collector, Gabtoli, Bogra
Ms. Azufa, House to house milk seller, Bujrupmari, Bogra
Ms. Monowara Begum, House to house milk seller, Koipara, Bogra
Ms. Shefali, House to house milk seller, Koipara, Bogra
Mr. Hafizur Rahman, Executive Director, Development Cooperation, Birampur, Dinajpur
Anna Minj, Gender Equity and Diversity Coordinator, CARE Bangladesh
Mahbubul Islam Khan, Governance Coordinator, CARE Bangladesh
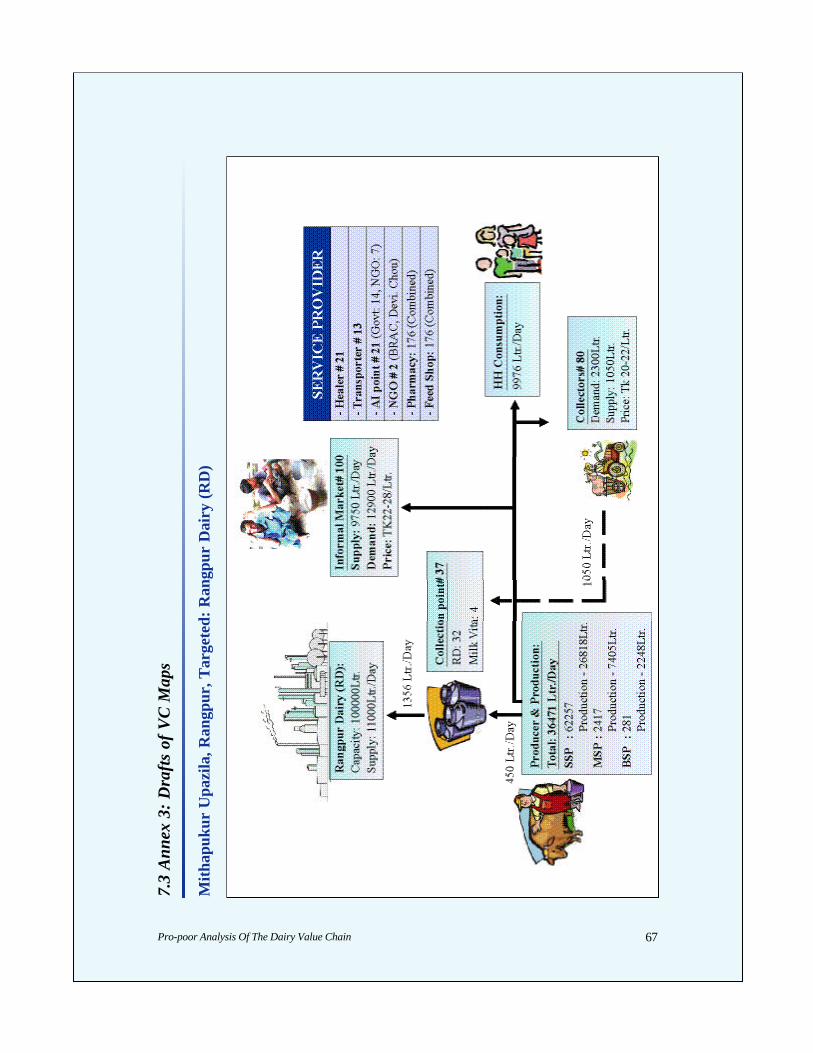
Pro-poor Analysis Of The Dairy Value Chain 67
7.3
Ann
ex 3
: D
raft
s of
VC
Map
s
Mith
apuk
ur U
pazi
la, R
angp
ur, T
arge
ted:
Ran
gpur
Dai
ry (
RD
)

Pro-poor Analysis Of The Dairy Value Chain68
Ulip
ur U
pazi
la, K
urig
ram
, Tar
gete
d: B
RA
C C
hilli
ng C
ente
r

Pro-poor Analysis Of The Dairy Value Chain 69
Par
batip
ur U
pazi
la, D
inaj
pur,
Tar
gete
d: B
RA
C C
hilli
ng C
ente
r
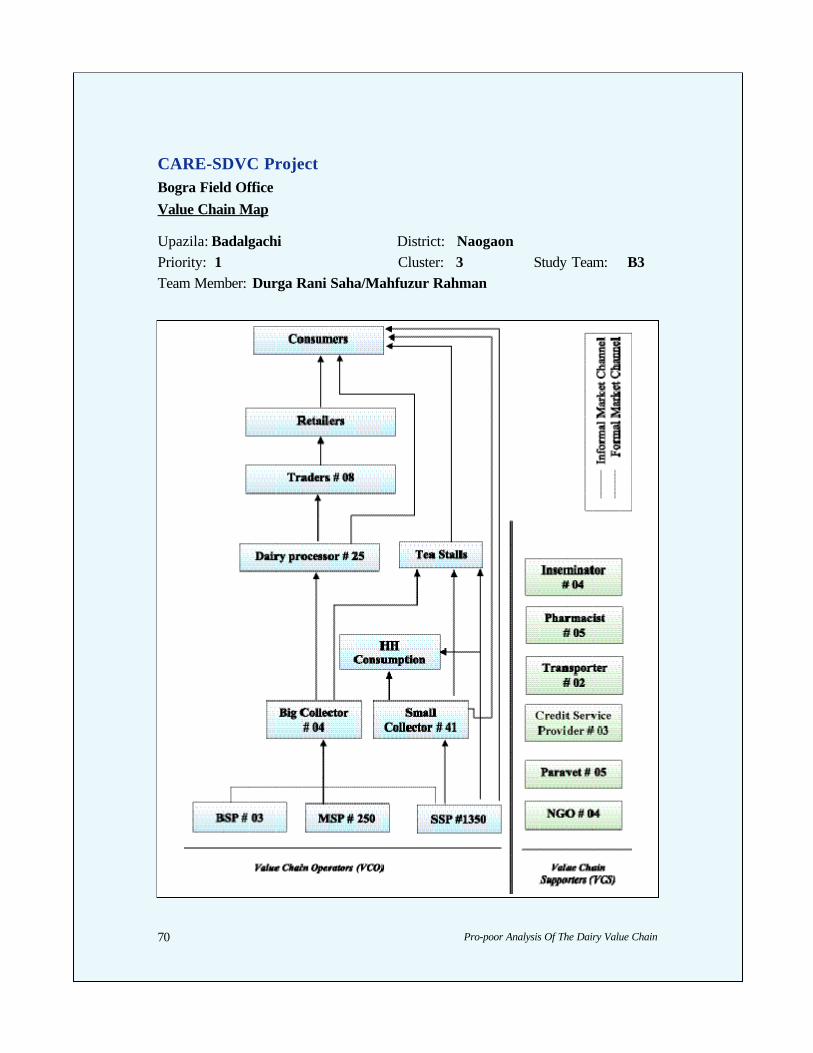
Pro-poor Analysis Of The Dairy Value Chain70
CARE-SDVC ProjectBogra Field OfficeValue Chain Map
Upazila: Badalgachi District: NaogaonPriority: 1 Cluster: 3 Study Team: B3Team Member: Durga Rani Saha/Mahfuzur Rahman
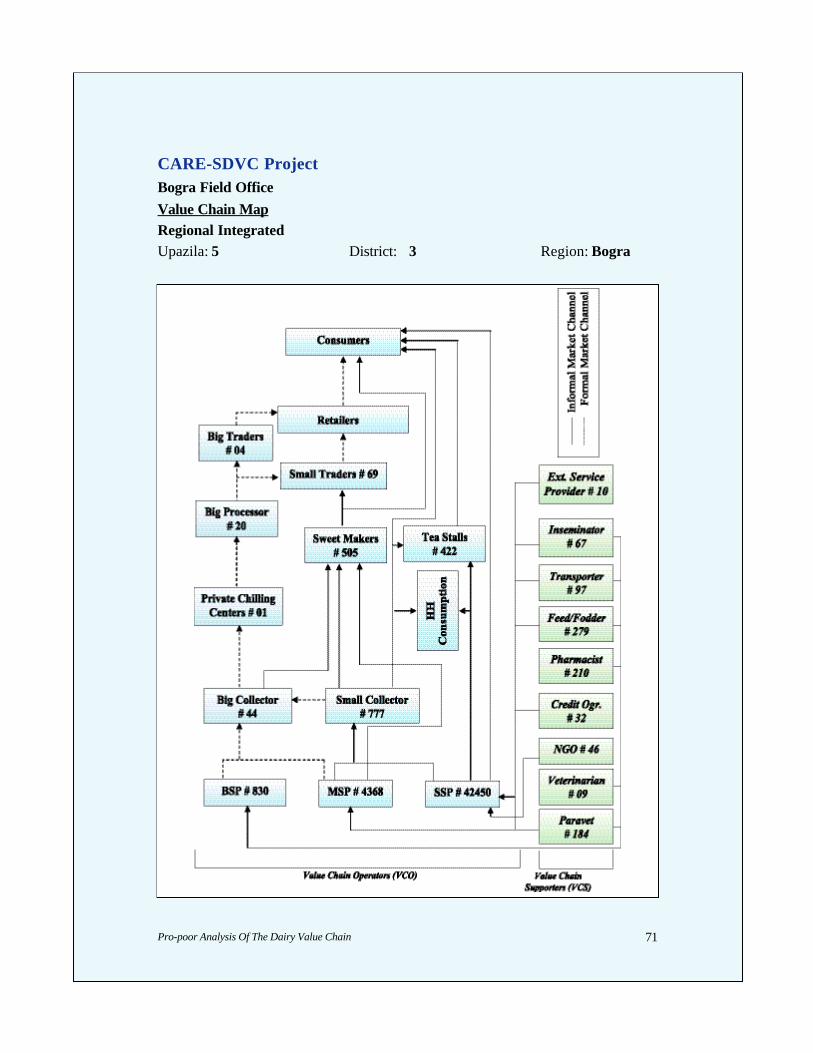
Pro-poor Analysis Of The Dairy Value Chain 71
CARE-SDVC ProjectBogra Field OfficeValue Chain MapRegional IntegratedUpazila: 5 District: 3 Region: Bogra
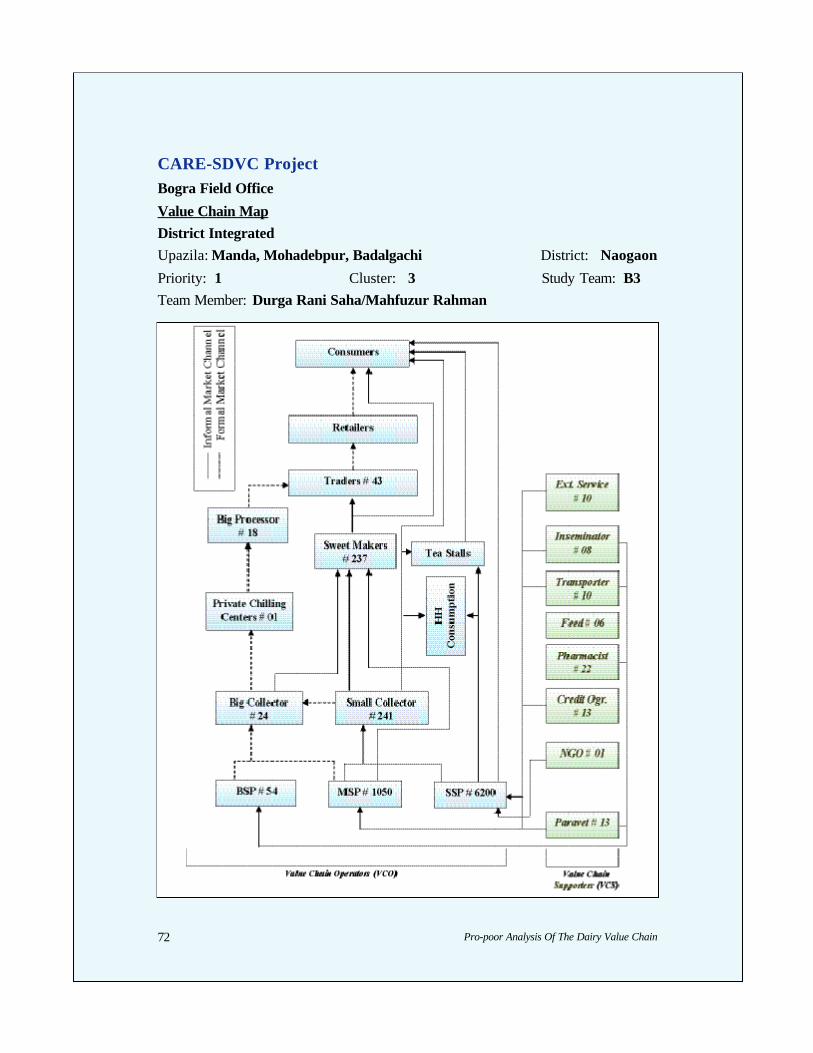
Pro-poor Analysis Of The Dairy Value Chain72
CARE-SDVC ProjectBogra Field Office
Value Chain MapDistrict IntegratedUpazila: Manda, Mohadebpur, Badalgachi District: Naogaon
Priority: 1 Cluster: 3 Study Team: B3Team Member: Durga Rani Saha/Mahfuzur Rahman
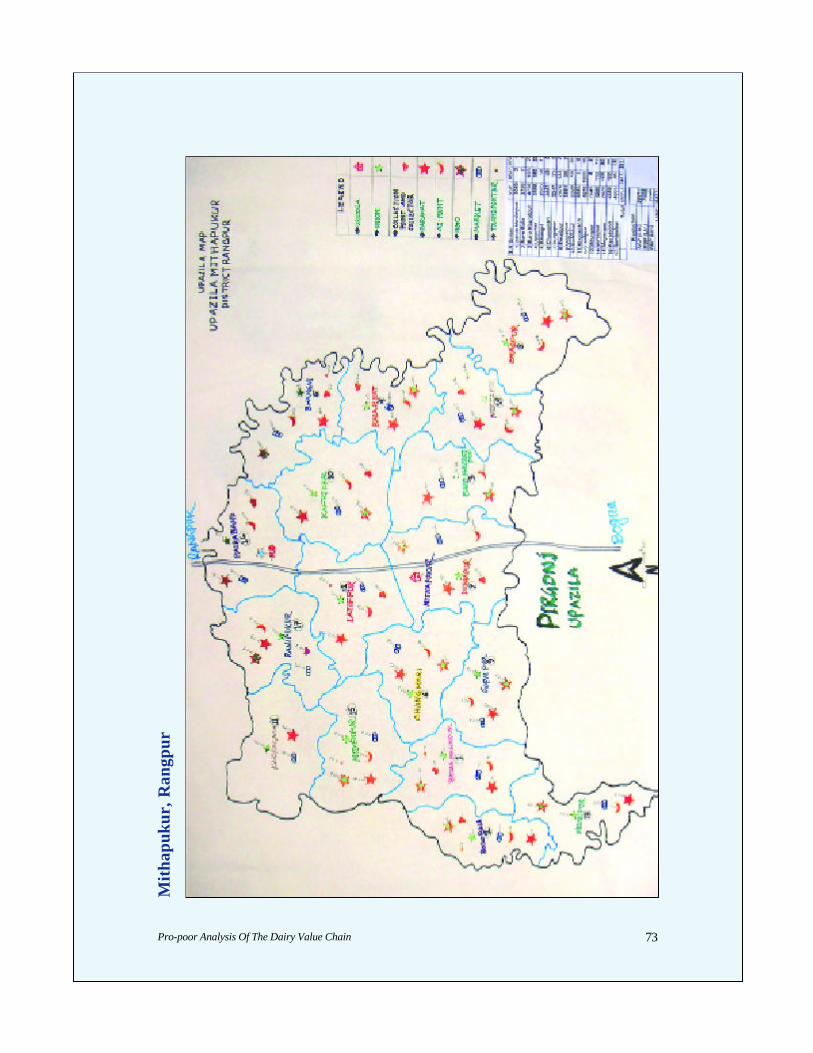
Pro-poor Analysis Of The Dairy Value Chain 73
Mit
hapu
kur,
Ran
gpur
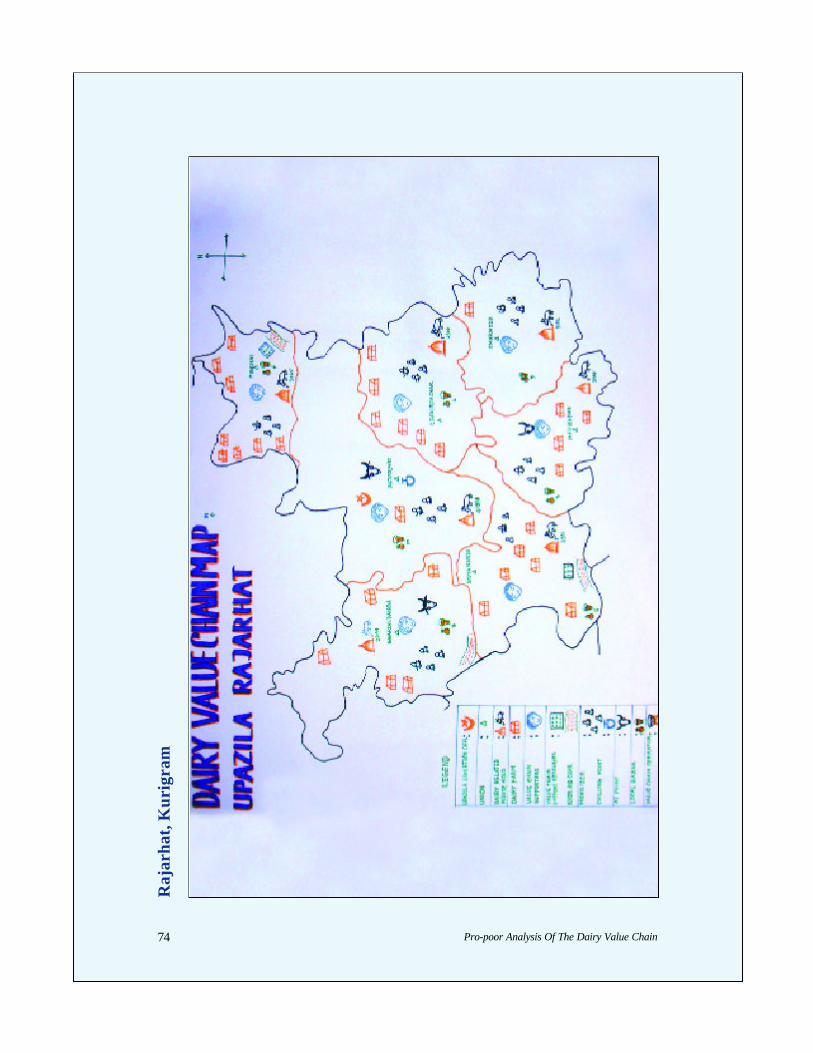
Pro-poor Analysis Of The Dairy Value Chain74
Raj
arha
t, K
urig
ram

Pro-poor Analysis Of The Dairy Value Chain 75
Syed
pur,
Nilp
ham
ari
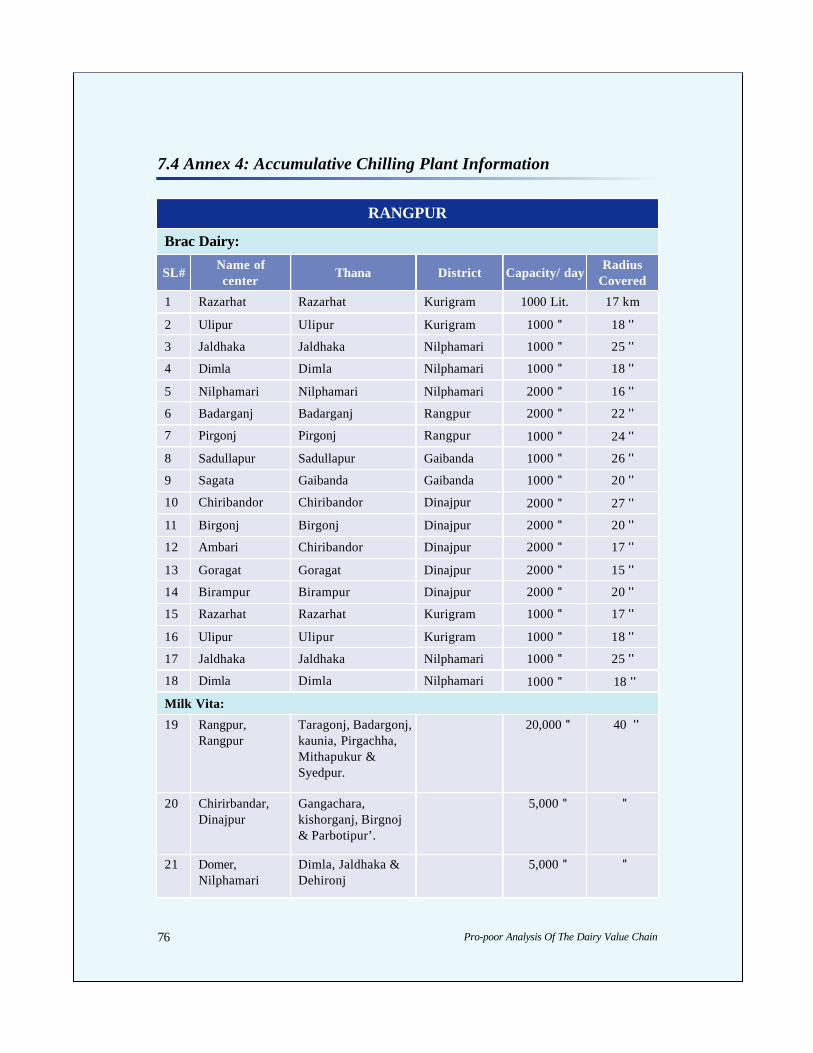
Pro-poor Analysis Of The Dairy Value Chain76
7.4 Annex 4: Accumulative Chilling Plant Information
RANGPUR
Brac Dairy:
SL#Name ofcenter
Thana District Capacity/ dayRadius
Covered
1 Razarhat Razarhat Kurigram 1000 Lit. 17 km
2 Ulipur Ulipur Kurigram 1000 '' 18 ''
3 Jaldhaka Jaldhaka Nilphamari 1000 '' 25 ''
4 Dimla Dimla Nilphamari 1000 '' 18 ''
5 Nilphamari Nilphamari Nilphamari 2000 '' 16 ''
6 Badarganj Badarganj Rangpur 2000 '' 22 ''
7 Pirgonj Pirgonj Rangpur 1000 '' 24 ''
8 Sadullapur Sadullapur Gaibanda 1000 '' 26 ''
9 Sagata Gaibanda Gaibanda 1000 '' 20 ''
10 Chiribandor Chiribandor Dinajpur 2000 '' 27 ''
11 Birgonj Birgonj Dinajpur 2000 '' 20 ''
12 Ambari Chiribandor Dinajpur 2000 '' 17 ''
13 Goragat Goragat Dinajpur 2000 '' 15 ''
14 Birampur Birampur Dinajpur 2000 '' 20 ''
15 Razarhat Razarhat Kurigram 1000 '' 17 ''
16 Ulipur Ulipur Kurigram 1000 '' 18 ''
17 Jaldhaka Jaldhaka Nilphamari 1000 '' 25 ''
18 Dimla Dimla Nilphamari 1000 '' 18 ''
Milk Vita:
19 Rangpur,Rangpur
Taragonj, Badargonj,kaunia, Pirgachha,Mithapukur &Syedpur.
20,000 '' 40 ''
20 Chirirbandar,Dinajpur
Gangachara,kishorganj, Birgnoj& Parbotipur’.
5,000 '' ''
21 Domer,Nilphamari
Dimla, Jaldhaka &Dehironj
5,000 '' ''
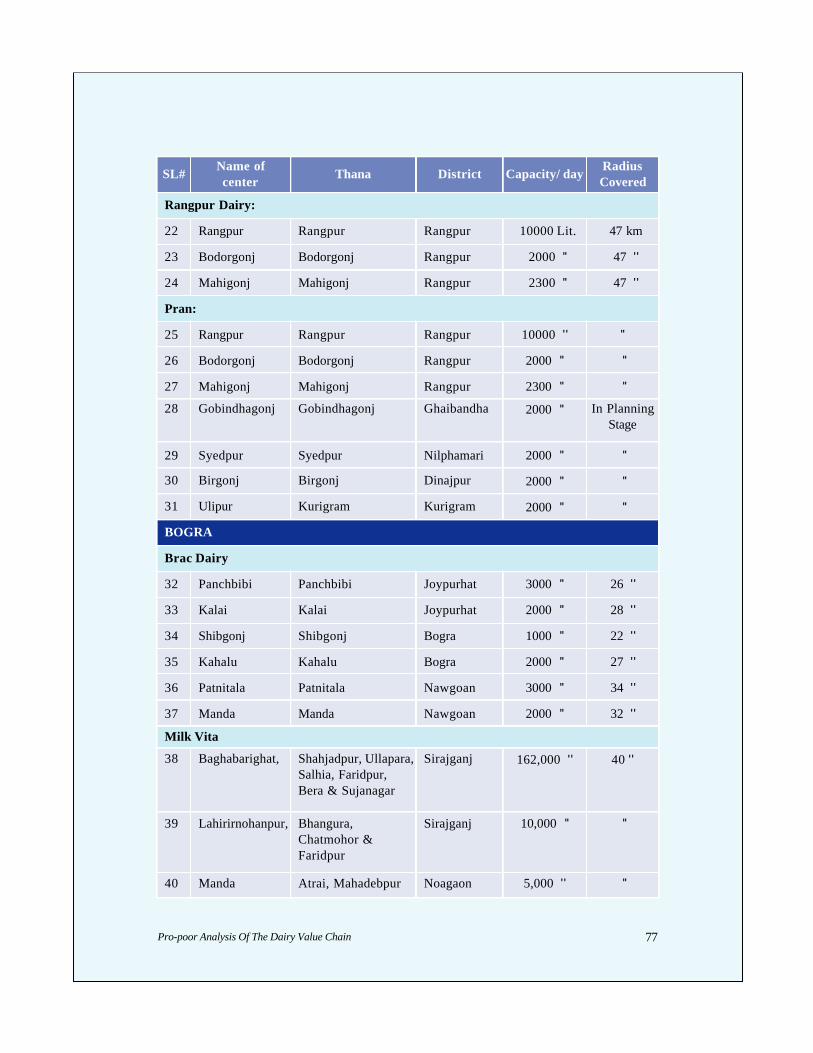
Pro-poor Analysis Of The Dairy Value Chain 77
SL#Name ofcenter
Thana District Capacity/ dayRadiusCovered
Rangpur Dairy:
22 Rangpur Rangpur Rangpur 10000 Lit. 47 km
23 Bodorgonj Bodorgonj Rangpur 2000 '' 47 ''
24 Mahigonj Mahigonj Rangpur 2300 '' 47 ''
Pran:
25 Rangpur Rangpur Rangpur 10000 '' ''
26 Bodorgonj Bodorgonj Rangpur 2000 '' ''
27 Mahigonj Mahigonj Rangpur 2300 '' ''
28 Gobindhagonj Gobindhagonj Ghaibandha 2000 '' In PlanningStage
29 Syedpur Syedpur Nilphamari 2000 '' ''
30 Birgonj Birgonj Dinajpur 2000 '' ''
31 Ulipur Kurigram Kurigram 2000 '' ''
BOGRA
Brac Dairy
32 Panchbibi Panchbibi Joypurhat 3000 '' 26 ''
33 Kalai Kalai Joypurhat 2000 '' 28 ''
34 Shibgonj Shibgonj Bogra 1000 '' 22 ''
35 Kahalu Kahalu Bogra 2000 '' 27 ''
36 Patnitala Patnitala Nawgoan 3000 '' 34 ''
37 Manda Manda Nawgoan 2000 '' 32 ''
Milk Vita
38 Baghabarighat, Shahjadpur, Ullapara,Salhia, Faridpur,Bera & Sujanagar
Sirajganj 162,000 '' 40 ''
39 Lahirirnohanpur, Bhangura,Chatmohor &Faridpur
Sirajganj 10,000 '' ''
40 Manda Atrai, Mahadebpur Noagaon 5,000 '' ''

Pro-poor Analysis Of The Dairy Value Chain78
SL#Name ofcenter
Thana District Capacity/ dayRadius
Covered
Rangpur Dairy:
41 Baghabari Shahjadpur Sirajgong 7000 Lit. 47 km
42 Laharimohonpur Ullapara Sirajgong 2300 '' ''
43 Protap Bazar Ullapara Sirajgong 3000 '' ''
Pran:
44 Baghabari Shahjadpur Sirajgong 7000 '' ''
45 Laharimohonpur Ullapara Sirajgong 2300 '' ''
46 Shapaher Shapaher Naogaon 1000 '' ''
47 Sharishakul Shahjadpur Sirajgong 2000 '' In planningStage
48 Atgharia Atgharia Pabna 2000 '' ''
49 Joypurhat Joypurhat Joypurhat 2000 '' ''
50 Shariakandhi Shariakandhi Bogra 2000 '' ''

Pro-poor Analysis Of The Dairy Value Chain 79

Pro-poor Analysis Of The Dairy Value Chain80
Related Documents