MOLECULAR BASIS OF ANTHOCYANIN PRODUCTION IN CALLUS AND CELL CULTURES OF OXAl/S REel/NATA BY NOKWANDA P. MAKUNGA Submitted in fulfilment of the requirements for the degree of MASTER OF SCIENCE in the Department of Botany, Faculty of Science, University of Natal, Pietermaritzburg December 1 996

Welcome message from author
This document is posted to help you gain knowledge. Please leave a comment to let me know what you think about it! Share it to your friends and learn new things together.
Transcript

MOLECULAR BASIS OF ANTHOCYANIN
PRODUCTION IN CALLUS AND CELL CULTURES
OF OXAl/S REel/NATA
BY
NOKWANDA P. MAKUNGA
Submitted in fulfilment of the requirements for the degree of MASTER OF
SCIENCE in the Department of Botany, Faculty of Science, University of
Natal, Pietermaritzburg
December 1 996

DECLARATION
The experimental work described in this thesis was conducted in
the Department of Botany, University of Natal, Pietermaritzburg,
under the supervision of Professor J. v,an Staden and co
supervision of Doctor W. A. Cress.
These studies were the result of my own investigations, except
where the work of others is acknowledged.
Nokwanda Pearl Makunga
December 1996

ACKNOWLEDGEMENTS
I am grateful to my supervisor, Professor J. van Staden for providing me with
the opportunity and facilities in which to conduct my studies. I wish to thank
him and Doctor W. A. Cress, my co-supervisor, for their guidance and
encouragement throughout this project.
I am sincerely thankful to Professor F. C. Botha, who served as a member of
my research committee. I take this opportunity to thank him for his insight,
invaluable input and time taken to attend the meetings.
I would also like to thank Carol Roskruge for her friendship, interest and
support in my studies. To my laboratory colleagues, especially Sandra du
Plessis and Peter Hare, I appreciate your help and encouragement throughout
this project. To Peter Hare, your diligent efforts in proof-reading this thesis are
greatly appreciated.
To the academic staff, research staff and postgraduate students of the Botany
Department, your interest in my work is appreciated. I also owe thanks to the
technical staff of the Botany Department, for their efficient assistance when
needed.
Many thanks to my sister, Bongie ledwaba and brother, Vuyo Makunga for
their invaluable support. Their successes at obtaining university degrees were
an encouragement and incentive to study further.
Finally, I am forever indebted and truly grateful to my parents, Daluxolo and
Nosisa Makunga, for the countless sacrifices made throughout my schooling.
I appreciate their insight in predicting the fall of the black education system in
South Africa long before it happened. I am grateful for the decisions they made
to ensure that I had the privi leged opportunity to obtain a decent and superior
education .
(ii)
ABSTRACT
Oxalis reclinata Jacq., is a dicotyledonous plant. O. reclinata belongs to the
family Oxalidaceae. This plant produced callus which accumulated red coloured
anthocyanin pigments when cultured in vitro. The levels of anthocyanin
accumulated by O. reclinata callus were higher than in the intact plant. The
major pigment was isolated and identified as cyanjdin-3-glucoside (CROUCH,
VAN STADEN, VAN STADEN, DREWES & MEYER, 1993). In nature,
anthocyanins are responsible for orange, red, purple and blue colouration of
certain tissues of higher plants. Due to the toxicity of many synthetic red
colouring agents, anthocyanins are regarded as potential substitutes for
synthetic food colourants. This research was aimed at investigating
mechanisms which induce pigment production as well as to optimize
anthocyanin yield from callus cultures of O. reclinata, -once anthocyanin
production was stimulated.
Pigmented and non-pigmented callus lines were generated from O. reclinata
(CROUCH & VAN STADEN, 1994) and maintained on MURASHIGE & SKOOG
(1962) agar medium (O.8% [w/v], pH 5.7) supplemented with 0.5 mgt-' BA,
5 mgt-' NAA, 30 gt ·' sucrose and 0.1 gt·' myo-inositol. Plant tissue culture
studies were conducted on red and white lines of O. reclinata to optimize callus
yield and anthocyanin production in vitro. This involved manipulating
contributory factors of the culture environment (carbohydrates, nitrates,
phosphates, phytohormones, light and temperature).
In vitro studies showed that, light played an inductive role in anthocyanin
production in callus cultures of O. reclinata. The auxin, 2,4-
dichlorophenoxyacetic acid (2,4-D) reduced pigment production but increased
callus biomass. This hormone probably exerted its effect by reducing the pool
of anthocyanin precursors, such as phenylalanine, resu lting in increased primary
metabolic activity. Suspension cultures were shown to be a viable means of
propagating pigmented callus cells of O. reclinata. The growth curves for red
and white callus cells were determined using the settled cell volume (SCV)
method. Pigmented cell cultures grew for longer periods compared to non
pigmented cells of O. reclinata. White callus cells reached the stationary phase
after 18 days. Red callus cells continued growing exponentially for an extra
three days compared to white callus cells. The vacuole was identified as the
organelle where anthocyanins a~cumulate using the light microscope.
The molecular techniques of two-dimensional electrophoresis and in vitro
translation were utilized to analyze differences in gene expression between
white and red callus cultures of O. reclinata. Thus far, two-dimensional
electrophoresis has shown that the red callus of O. reclinata had more
polypeptides compared to the white callus. The level of gene expression was
higher in the red callus compared to white callus, as revealed by non
radioactive in vitro translation. With optimization of radioactive in vitro
translation, identification of specific structural anthocyanin genes which are
under regulatory control should be possible.
Future research should aim at acquiring a better understanding about the
genetic control of anthocyanin biosynthesis in order to manipulate this pathway
effectively.
TABLE OF CONTENTS PAGE
DECLARATION ....................................... .
ACKNOWLEDGEMENTS .................................. ii
ABSTRACT ........................................... iii
LIST OF TABLES ..................... .................. ix
LIST OF FIGURES . . . . . . . . . . . . . . . . . . . . . . . . . . . . . . . . . . . . .. x
ABBREVIATIONS ...................................... xv
CHAPTER 1: GENERAL INTRODUCTION 1
CHAPTER 2: LITERATURE REVIEW . . . . . . . . . . . . . . . . . . . . .. 5
2.1 CHEMICAL STRUCTURE OF ANTHOCYANINS ............ 5
2.2 HISTORICAL BACKGROUND ........................ 8
2.3 ANTHOCYANIN BIOSYNTHESIS . . . . . . . . . . . . . . . . . . . .. 10
2.3.1 Structural genes involved in anthocyanin biosynthesis ...... 14
2.4 EVOLUTION AND FUNCTIONS OF ANTHOCYANINS AND OTHER FLAVONOIDS ............................ 19
2.4.1 Evolution of flavonoids ........................... 19
2.4.2 Functions of anthocyanins and other flavonoids in nature. . .. 21
2.5 MANIPULATION OF CULTURED CELLS TO SYNTHESIZE ANTHOCYANINS IN VITRO ........................ 24
2.5.1 Importance of accumulation of anthocyanins in cultured cells-possible role as food colourants . . . . . . . . . . . . . . . . . . . .. 24
2.5.2 Effects of carbohydrate manipulation. . . . . . . . . . . . . . . . .. 25
(v)

PAGE
2.5.3 Effects of manipulating inorganic salts on anthocyanin biosynthesis . . . . . . . . . . . . . . . . . . . . . . . . . . . . . . . . . .. 28
2.5.4
2.6
Effects of manipulating anthocyanin biosynthesis
AIMS AND OBJECTIVES
plant growth regulators on 29
34
CHAPTER 3: IN VITRO CULTURE STUDY .... . ..... . ..... 37
3.1 INTRODUCTION. . . . . . . . . . . . . . . . . . . . . . . . . . . . . . .. 37
3.1.1 Effects of physiological factors on anthocyanin production . .. 37
3.2 MATERIALS AND METHODS .............. -......... 39
3.2.2 Manipulation of chemical components of culture medium . . .. 40
3.2.2 .1 Carbohydrate manipulations . . . . . . . . . . . . . . . . . . . . . . .. 40
3.2.2.2 Nitrate and phosphate manipulations . . . . . . . . . . . . . . . . .. 40
3.2.2.3 Phytohormone manipulations ....................... 40
3.2.3 Manipulation of physical factors of the culture environment .. 41
3.2.3.1 Temperature effects ... . ......................... 41
3.2.3.2 Light effects. . . . . . . . . . . . . . . . . . . . . . . . . . . . . . . . . .. 41
3.2.4 Measurement of callus growth and determination of anthocyanin content .. . .... . . . . . . . . . . . . . . . . . . . . .. 41
3.2.5 Analysis of data ... . .... . ................. . .. . .. 41
3.3 RESULTS . .................................... 42
3.4. DISCUSSION .............................. . ....... 54
(vi)

PAGE
CHAPTER 4: SUSPENSION CULTURE ......... . . . . . . . . .. 59
4.1 INTRODUCTION. . . . • . . . . . . . . . . . . . . . . . . . . . . . . . .. 59
4.2 MATERIALS AND METHODS ........ '. . . . . . . . . . . . . .. 60
4.2.1 Plant material, initiation media and culture conditions. . . . . . . 60
4.2.2 Data collection for cell growth studies . . . . . . . . . . . . . . . .. 60
4.2.3 Analysis of data . . . . .... . ....................... 61
4.3 RESULTS . . . . . . . . . . . . . . . . . . . . . . . . . . . . . . . . . . . .. 61
4.4 DISCUSSION 66
CHAPTER 5: PROTEIN STUDIES ON ANTHOCYANIN PRODUCTION .... . . . . . . . . . . . . . . . . . . . . .. 68
5.1 INTRODUCTION. . . . . . . . . . . . . . . . . . . . . . . . . . . . . . .. 68
5.2 MATERIALS AND METHODS ......... . ............. 72
5.2.1 Reagents............ . . . ...................... 72
5.2.2 Plant material . . . . . . . . . . . . . . . . . . . . . . . . . . . . . . . . .. 72
5.2.3 Protein isolation ..... ... ........................ 72
5.2.4 The effect of anthocyanins on proteins ................ 74
5.2.5 Polyacrylamide gel electrophoresis of proteins. . . . . . . . . . .. 75
5.2.6 Two-dimensional electrophoresis. . . . . . . . . . . . . . . . . . . .. 76
5.2.7 Detection of electrophoresed proteins ................. 77
5.3 RESULTS .......... . .. . . . .................... 78
5.4 DISCUSSION. . . . . . . . . . . . . . . . . . . . . . . . . . . . . . . . .. 88
(vii)
PAGE
CHAPTER 6: IN VITRO TRANSLATION .................. 94
6.1 INTRODUCTION. . . . . . . . . . . . . . . . . . . . . . . . . . . . . . . . 94
6.2 MATERIALS AND METHODS .. ...... "............... 96
6 .2.1 RNA isolation. . . . . . . . . . . . . . . . . . . . . . . . . . . . . . . . .. 96
6.2.2 RNA analysis ..... . ............................ 98
6 .2.3 Non-radioactive in vitro translation ................... 99
6.2 .4 Radio-active in vitro translation ...................... 101
6.2.4.1 Trichloroacetic acid (TCA) precipitation ................ 102
6.2.4.2 Quantification of translation products ................. 102
6.2.5 Electrophoresis of translation products ................. 103
6.3 RESULTS ............ . .. . ..................... 103
6.5 DISCUSSION ......... . ........................ 112
CHAPTER 7: CONCLUSIONS AND FUTURE PROSPECTS . . . . .. 115
7.1 CONCLUSIONS. . . . . . . . . . . . . . . . . . . . . . . . . . . . . . .. 115
7.2 FUTURE PROSPECTS ............................ 118
LITERATURE CITED ... . .............................. 1 20
(viii)

LIST OF TABLES
PAGE
Table 2.1: Cloned structural genes of the anthocyanin biosynthetic pathway ........... .- ...................... 15
Table 2.2: Cloned regulatory genes of flavonoid metabolism ...
Table 5.1: The effect of extraction buffer components on protein yields (JIg g-1 fresh weight) isolated from O. reclinata callus ....... . ............................ 79
Table 6.1: Components added to reaction vessels for nonradioactive in vitro translation according to the Boehringer Mannheim protocol . . . . . . . . . . . . . . . . . . . . . . . . . . . 100
Table 6.2: Components added to reaction vessels for radioactive in vitro translation according to the Boehringer Mannhein protocol .................................. 101
Table 6.3: Modifications made to the phenol-LiCI method described by WANG & VODKIN (1994) for RNA extraction from pigmented plant tissues . . . . . . . . . . . . . . . . . . . . . . . . 105
(ix)

LIST OF FIGURES
Figure 2.1: The flavylium cation. R1 and R2 are H, OH, OCH 3 ; R3
is a glycosyl or H; and ,R4 is a glycosyl or OH
PAGE
(MAZZA & MANIATI, 1993) ..................... 6
Figure 2.2: Most frequently found anthocyanidins in plants (BROUillARD, 1982) .......................... 7
Figure 2.3: The general phenylpropanoid pathway (DIXON & BOlWEll, 1986) ............................ 10
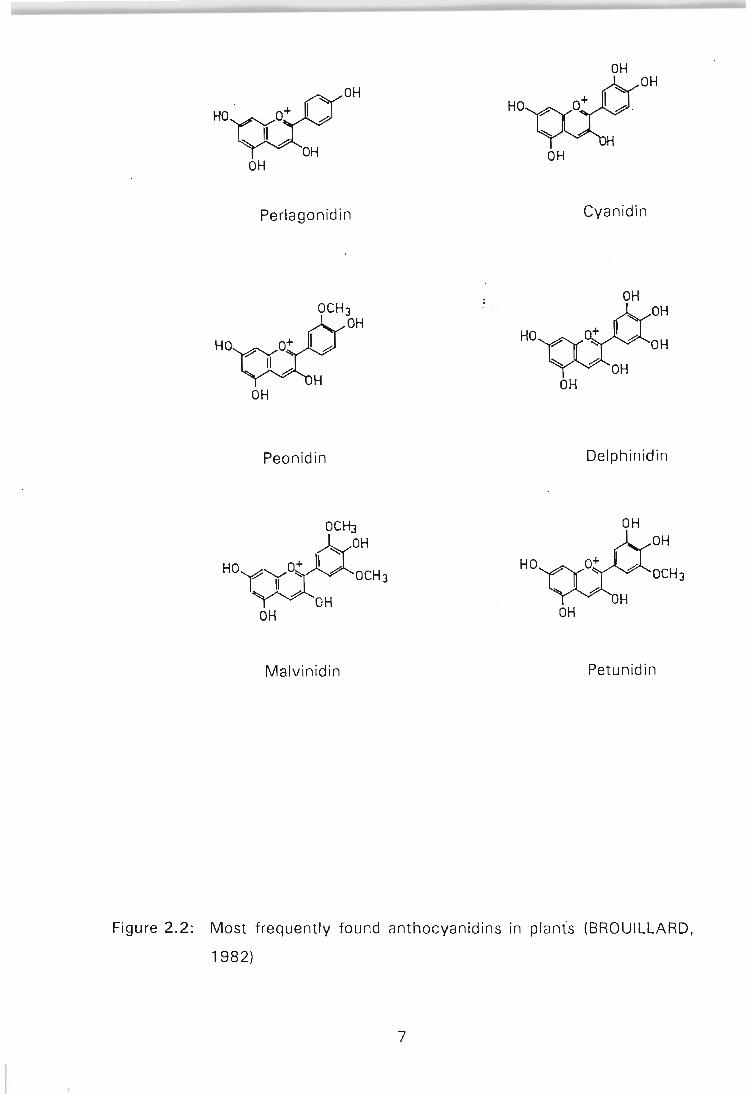
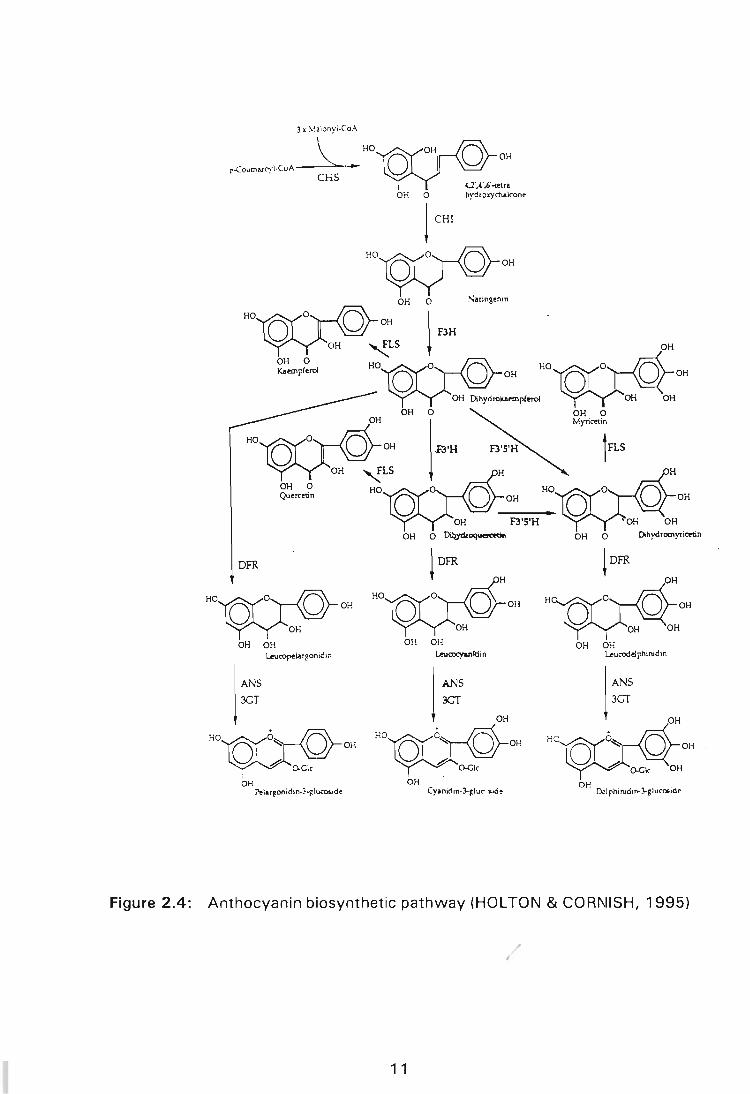
Figure 2.4: Anthocyanin biosynthetic pathway (HOLTON & CORNISH, 1995) .. . ........... . ............. 11
Figure 3.1: Effect of sucrose on callus growth (A) and anthocyanin production (B) in white and red callus cultures of O. reclinata. Cultures were maintained in MS basal medium with 5 mg £-1 NAA and 0.5 mg £-1 BA. Treatments with the same letter were not significantly different, P < 0.05 . . . . . . . . . . . . . . . . .. 43
Figure 3.2: Effect of carbohydrate source on callus growth (A) and anthocyanin production (B) in white and red callus cultures of O. reclinata. Cultures were maintained in MS basal medium with 5 mg £-1 NAA and 0.5 mg £-1 BA. Treatments denoted by the same letters were not significantly different, P < 0.05 ...... 44
Figure 3.3: Effect of nitrates ( ) and phosphates ( ) on callus growth (A) and anthocyanin production (B) in white cultures of O. reclinata. Cultures were maintained in MS basal medium with 5 mg £-1 NAA and 0.5 mg £-1 BA. Treatments denoted by the same letters were not significantly different, P < 0.05 ............... 46
Figure 3.4: Effect of nitrates ( ) and phosphates ( ) on callus growth (A) and anthocyanin production (B) of red callus cultures of O. reclinata. Cultures were maintained in MS basal medium with 5 mg £-1 NAA and 0.5 mg £-1 BA. Treatments denoted by the same letters were not significantly different, P < 0.05 ...... 47
(x)
Figure 3.5: Effect of different plant hormones on callus growth (A) and anthocyanin production (B) in white and red callus cultures of O. reclinata. Treatments denoted by the same letters were not significantly different,
PAGE
P < 0.05 .................. :............... 48
Figure 3.6: Effect of light on Oxalis callus grown in vitro. Four different callus types were generated. (A) Red callus grown in the light. (B) White callus grown in the light. (C) A heterogenous red-white line grown in the light and a red callus line which was paling due to absence of light (D) . . . . . . . . . . . . . . . . . . . . . . . . . .. 49
Figure 3.7: (A) Four callus types were generated (i) white callus grown in the light (ii) red callus grown in the dark (iii) white callus grown in the dark (iv) red callus grown in the light. (B) Dark grown callus shows induction of anthocyanin biosynthesis after transfer to the light ..................................... 50
Figure 3.8: Effect of light on callus growth (A) and anthocyanin production (B) in white and red callus cultures of O. reclinata. Cultures were maintained in MS basal medium with 5 mg £-1 NAA and 0.5 mg £-1 BA. Treatments denoted by the same letters were not significantly different, P < 0.05 . . . . . . . . . . . . . . . . .. 52
Figure 3.9: Effect of temperature on callus growth (A) and anthocyanin production (B) in white and red callus cultures of O. reclinata. Cultures were maintained in MS basal medium with 5 mg £-1 NAA and 0.5 mg £-1 SA. Treatments denoted by the same letters were not significantly different, P < 0.05 ............... 53
Figure 4.1: Liquid suspension cultures were established for the homogenous red and white callus lines of O. reclinata in sterile flasks. (A) Suspension culture of cells containing red anthocyanin pigment. (B) Suspension culture of non-pigmented cells . . . . . . . . . .. 63
(xi)

Figure 4.2: Cells isolated from suspension cultures of O. reclinata as viewed from a light microscope. (A) Cells from white callus were circular and had small vacuoles. (B) Elongated red cells had large vacuoles. (C) White cells accumulated red pigment towards the stationary phase of the growth cycle. A more heterogenous culture was formed at this time. (0) Browning of individual cells associated with the end
PAGE
of the growth cycle .......................... 64
Figure 4.3: The growth curves white ( ) and red ( ) cells of O. reclinata showing typical sigmoidal growth of liquid suspension cultures .......................... 65
Figure 5.1: Two-dimensional gels of O. reclinata callus proteins stained by silver staining. (A) Polypeptide pattern of electrophoresed proteins isolated from white callus. (B) Proteins were not successfully isolated from the red callus. Black arrows indicate the direction of SOS-PAGE . . . . . . . . . . . . . . . . . . . . . . . . . . . . . . . .. 81
Figure 5.2: One-dimensional gel of O. reclinata proteins stained by silver staining. Proteins were recovered as described in Section 5.2.4. Key to Figure, LR, proteins extracted from light-grown red callus; LW, proteins extracted from light-grown white callus; DR, proteins extracted from dark-grown red callus; OW, proteins extracted from dark-grown white callus; LR(P), proteins extracted from light-grown white callus; OW(P), proteins extracted from dark-grown red callus; R:W, proteins extracted from a mixture of light-grown red callus and dark-grown white callus (1:1, w/w); LR(B), proteins extracted from lightgrown red callus in the presence of 1 % BSA and LW(B), proteins extracted from light-grown white callus in the presence of 1 % BSA. Black arrows indicate the direction of SOS-PAGE . . . . . . . . . . . . . . .. 82
Figure 5.3: Two-dimensional gels of O. reclinata proteins stained by silver staining. (A) White callus proteins were isolated with extraction buffer containing protease inhibitors and the phenolic adsorbent, PVPP. (B) A basic polypeptide isolated from red callus. Black arrows indicate the direction of IEF and SOS-PAGE
(xii)
84

Figure 5.4: Two-dimensional gels of O. reclinata red callus proteins stained by silver staining. (A) The effect of OTT on isolation of proteins. (B) The effect of 2-mer<;aptoethanol as a reducing agent. Black arrows
PAGE
indicate the direction of SOS-PAGE . . . . . . . . . . . . . . .. 85
Figure 5.5: Two-dimensional gels of O. reclinata .callus proteins visualised by silver staining. (A) Polypeptide patterns of proteins isolated from dark-grown white callus. (B) Polypeptide patterns of proteins isolated from light-grown red callus. Black arrows indicate the direction of SOS-PAGE .................. .
Figure 5.6: Two-dimensional gels of O. reclinata callus proteins stained by silver staining. (A) Polypeptide patterns of proteins isolated from light-grown white callus. (B) Polypeptide patterns of proteins isolated from darkgrown red callus. Black arrows indicate the direction
87
of IEF and SOS-PAGE ......................... 89
Figure 6.1: Flow chart of basic steps involved in in vitro translation assays . . . . . . . . . . . . . . . . . . . . . . . . . . .. 95
Figure 6.2: Comparison of RNA quality extracted from white and red callus lines of O. reclinata fractionated on a 1.5% non-denaturing agarose gels. (A) Conventional methods yielded poor quality RNA which was degraded. (B) Good quality RNA was extracted according to the modified WANG & VOOKIN (1994) method .............. .... ................. 106
Figure 6.3: One-dimensional gel of non-radioactively synthesized in vitro translation products visualized by silver staining. Lane A, shows proteins associated with the wheat germ extract when the amino acid translation mixture was excluded from the translation assay. Lane B represents a control reaction, where no RNA was included in the translation reaction. Lane C represents bands visualized after non-radioactive translation of p-globin. Lanes O-E show proteins obtained from translation of red callus RNA and wheat germ extract proteins. Lanes F and G represent translation products of white callus RNA and wheat germ extract proteins. No bands were visualized when the wheat germ extracted was omitted from the translation assay (Lane H) . . . . . . . . .. 107
(xiii)

Figure 6.4: Comparison of silver-stained polypeptide patterns obtained from non-radioactive in vitro translation total RNA isolated from callus types of O. reclinata (A) A mixture of polypeptides synthesized from nonradioactive cell-free translation of white callus total RNA and wheat germ extract polypeptides. (B) A mixture of polypeptides synthesized from nonradioactive cell-free translation of red callus total RNA and wheat germ extract polypeptides. (C) Polypeptide pattern obtained from two-dimensional
PAGE
electrophoresis of wheat germ extract proteins ....... , 108
Figure 6.5: Autoradiogram of SDS-PAGE of translation products of control RNA provided with the wheat germ kit. Lane A represents TMV RNA translation products. Lane B represents the translation products of pglobin RNA. Lane C represents a faint smear of translation products of white callus RNA. White arrows point to unincorporated amino acids and an insoluble 40S-[35S]Met-tRNA complex. Black arrows indicate the direction of electrophoresis . . . . . . . . . . . .. 110
Figure 6.6: Autoradiogram of SDS-PAGE of translation products of total RNA isolated from callus types of O. reclinata. Lanes A and B represent faint bands of white callus translation products. Lanes C and D represent smears of translation products of red callus. Black and white arrows point to unincorporated amino acids and an insoluble 40S[35S]Met-tRNA complex. Black arrows indicate the
direction of SDS-PAGE ............. . .......... 111
(xiv)
APS
AS
ANOVA
ATP
P BA
bis
Bq
°C
cDNA
CHI
C4H
CHS
Ci
4CL
CoA
cpm
20
2D-PAGE
2,4-0
DFR
dH20
DNA
DR
DW
OTT
EDTA
EtBr
FAB-MS
F3H
ABBREVIATIONS
Ammonia persulfate
Anthocyanin synthase
Analysis of variance
Adenosine triphosphate
Beta
Benzyladenine
N'N'methylene bisacryalamide
Becquerel
Degrees celsius
Copy deoxyribonucleic acid
Chalcone isomerase
Cinnamate 4-hydroxylase
Chalcone synthase
Curie
4-Coumaryl CoA ligase
Co-enzyme A
Counts per minute
Two-dimensional
Two-dimensional polyacrylamide electrophoresis
2,4-Dichlorophenoxyacetic acid
Dihydroflavonol-4 reductase
Distilled water
Deoxyribonucleic acid
Dark-grown red callus
Dark-grown white callus
Dithiothreitol
Ethylene diamine tetra-acetic acid
Ethidium bromide
Fast atom bombardment mass spectrophotometry
Flavonone hydroxylase
(xv)
FW
g
9
pg
GA
g £-1
GTP
h
HPLC
IAA
ISA
IEF
KOa
KIN
£
£-1
LS
LOR
LOW
LLR
LLW
LR
LW
M
pM
mA
mM
mg
mg £-1
Mg2+
MgS04
pmol photons m-2 S-1
Fresh weight
Gram(s)
Standard acceleration of gravity
Microgram
Gibberellin
Grams per litre
Guanosine triphosphate ~ ..
Hour(s)
High-performance liquid chromatography
Indole acetic acid
Indole butyric acid
Isoelectric focusing
Kilodalton
Kinetin
Litre
Per litre
Leucoanthocyanidin synthase
Red callus exposed to a light-dark cycle
White callus exposed to a light dark cycle
Red callus grown at low-light intensity
White callus grown at low-light intensity
Red callus grown at high light intensity
White callus grown at high light intensity
Molar
Micromolar
Milliampere
Millimolar
Mi ll igrams
Mi ll igrams per litre
Magnesium ion
Magnesium sulfate
Micromole photons per square meter per second
(xvi)
mRNA
MEC
MS
Met
N
nm
NAA
NAO
NMR
NP-40
P
pi
pKa
PMSF
PAL
PCR
PVP
PVPP
pp.
R
RNA
RNase
rpm
rRNA
SCV
[35S] Methionine
SOS
SOS-PAGE
TCA
Temed
TLC
Messenger ribonucleic acid
Molecular exclusion chromatography
Murashige and Skoog medium
Methionine
Nitrate
Nanometer{s)
Naphthalene acetic acid
Nicotinamide adenine dinucleotide
Nuclear magnetic resonance
Nonidet P-40
Phosphate
Iso-electric point
Acid dissociation constant
Phenylmethylsulfonyl fluoride
Phenylalanine ammonia lyase
Polymerase chain reaction
Po lyvinylpyrollidone
Polyvinylpolypyrollidone
Page{s)
Red callus
Ribonucleic acid
Ribonuclease
Revolutions per minute
Ribosomal ribonucleic acid
Settled cell volume
Radioactive methionine
Sodium dodecyl sulfate
Sodium dodecyl sulfate polyacrylamide gel electrophoresis
Trichloroacetic acid
NNN'N'tetramethylethylene diamine
Thin layer chromatography
(xvii)

TM Reg istered trademark
tRNA Transfer ribonucleic acid
Tris Tris(hydroxymethyl) amino methane
UF3GT UDP glucose: flavonoid 3-0-
Glucosyl transferase
UV Ultraviolet
UV/VIS Ultraviolet/visible spectrophotometry
v Volume
V Volts
Vh Volt hours
w Weight
W White callus
X Times
(xviii)

CHAPTER 1
GENERAL INTRODUCTION
Oxalis reclinata Jacq., is a dicotyledonous plant. It belongs to the family
Oxalidaceae. This family consists of approximat~ly 800 species worldwide
(HEYWOOD, 1978). This family has major diversity centres in South America
and South Africa . There are about 150 temperate species native to South
Africa and these bear a wide range of inflorescence structures and herbaceous
forms (SALTER, 1944). These geophytic South African species have a wide
variety of perennating organs, such as tubers, stolons, bulbili, aerial bulbili and
bulbs. Formation of trifoliar leaves and flowers occurs during the winter months
when climatic conditions are wet and cold. Flowers of Oxalis open under well
lit conditions and the petals may exhibit a wide range of hues across the genus,
ranging from white, yellow, orange to scarlet . Oxalis reclinata Jacq. has lightly
coloured pink corollas and green vegetative organs (HEYWOOD, 1978). The
South African genera of Oxalidaceae were taxonomically described last by
SALTER in 1944, and no taxonomical reviews have been published since.
In vitro, propagation of Oxalis species was reported by CROUCH & VAN
STADEN (1994). Generation of plantlets was achieved on modified
MURASHIGE & SKOOG (1962) (MS) medium supplemented with either 5 mg
£-1 naphthalene acetic acid (NAA) and 0 .5 mg £-1 benzyladenine (SA) or 2 mg
£-1 NAA and 0.1 mg £-1 kinet in. Production of heterogenous mixtures of white,
yellow, green and red callus was initially noted for O. reclinata. Transfer of
routinely subcultured callus types from a 25°C growth room to a 10 to 12°C
cold room resulted in extensive organogenesis on both media types (CROUCH
& VAN STADEN, 1994). This lower culture temperature closely parallels the
natural conditions where Oxalis species are found. Maintenance of white and
red callus lines at 25°C promoted dedifferentiation and resulted in proliferation
of callus which requires a three to four week growth period before
1

subculturing. The red pigmented callus generated accumulated anthocyanins.
The major pigment was identified as cyanidin-3-glucoside (CROUCH, VAN
STADEN, VAN STADEN, DREWES & MEYER, 1993).
(J r " I:. I 1 . Studies on the biosynthesis and accumulation of anthocyanins are relevant as
anthocyanins are the main pigments of higher plants (CONE, COCCIOLONE,
BURR & BURR, 1993). These pigments have been :consumed by man without
apparent ill effects for years as they are the main pigments of fruits and
flowers. Anthocyanins are presently being studied with a renewed interest as
they are highly desirable substitutes for synthetic food colourants
(BROUILLARD, 1982; BROUILLARD, 1988; CROUCH, VAN STADEN, VAN
STADEN, DREWES & MEYER, 1993; MEYER & VAN STADEN, 1995).ln recent
years banning of especially red colourants for use in food products has :,
occurred. This is due to the toxicity of many synthetic food colouring 'agents f1i'l t '
(MORI, SAKURAI, SHIGETA, YOSHIDA & KONDO, 1993). Alternative natural
sources of these pigments are currently being investigated by research
companies. The small biomass produced by members of the Oxalidaceae does
not make it economically feasible to produce pigments on a large scale from
these plants. CROUCH, VAN STADEN, VAN STADEN, DREWES & MEYER
(1993) showed that callus and suspension cultures of O. reclinata may produce
pigments, characteristic of anthocyanins, to levels that exceed those in the
intact plant. Optimisation of anthocyanin accumulation in O. reclinata using in
vitro culture techniques was seen as one option or direction for studying
secondary metabolism involved in anthocyanin production.
Many studies involving the use of plant biotechnology have aimed at
manipulating plant cells in culture to increase metabolic flux into specific
pathways to increase secondary metabolite product formation (DIXON &
BOLWELL, 1986). This involves alteration of biotic components (carbohydrates,
nitrates, phosphates and plant growth regulators) and abiotic factors (light and
temperature) which contribute to the culture environment. Molecular analyses
resulting from such changes have generally been limited to measurements of ,
2
_';.:.1
~ .) .. , 'I
end-product accumulation only. This approach has undoubted value for
preliminary optimisation of culture conditions for production of secondary
metabolites such as anthocyanins. However, it has disadvantages as it may fail
to identify positive or negative endogenous biochemical regulatory
mechanisms which may act to control the flux through pathways under study,
and which, if able to be triggered or circumvented, may result in increased
metabolite yield. Therefore, studies based on end ~product accumulation only,
may not necessarily indicate the total attainable capacity for production of the
anthocyanin by that particular species . Assessment of the operation of
endogenous regulatory mechanisms controlling secondary product
accumulation requires knowledge of the enzymology of the biosynthetic
pathways under consideration and of the factors which might control enzymic
capacity both in vitro and in vivo. Positive and negative effectors may be
investigated to assess the in vitro situation, whereas the effects of
transcription, translation and post-translation modification, including enzyme
inactivation and/or degradation, are areas which require investigation to assess
in vivo control (DIXON & BOLWELL, 1986).
Most studies conducted on anthocyanins have dealt with the chemistry of
anthocyanins. This involves the elucidation of chemical structures of the
pigments and quantification of anthocyan ins in accumulating tissues.
Anthocyanins and other flavonoids have also formed a basis of
chemotaxonomical studies in plants (SPARVOLl, MARTIN, SCIENZA, GAVAZZI
& TONELLI, 1994). To date, biosynthesis of flavonoids at a molecular level has
been extensively studied in only three plant species, namely, Petunia hybrida
(VAN TUNEN & MOL, 1991); Zea mays (PAZ-ARES, WIENAND, PETERSON &
SAEDLER, 1987) and Antirrhinum majus (SPARVOLl, MARTIN, SCIENZA,
GAVAZZI & TONELLI, 1994). These molecular studies have disclosed the
existence of both structural and regulatory classes of genes involved in
anthocyanin biosynthesis. While structural genes encode enzymes involved in
the biosynthetic pathway, the regulatory genes are involved in control of the
activity of the biosynthetic genes, thereby conditioning temporal and spatial
3

accumulation of the pigments in higher plants (KOES, QUA TTROCHIO & MOL,
1994). Synthesis of enzymes encoded by the structural genes is highly
regulated in the intact plant. It is usually flower specific and under
developmental control. Synthesis in otherwise non-expressing tissues can be
induced by environmental stress factors, such as, ultraviolet (UV) light,
deficiency of nutrients, high-light intensity, lo~ temperatures, drought,
hormonal changes and phytopathogens (OZEKI & KOMAMINE, 1983;
SPARVOLl, MARTIN, SCIENZA, GAVAZZI & TONELLI, 1994).
This study was undertaken with the objective of identifying the environmental
control of anthocyanin production in cell and callus cultures of O. reclinata. It
deals with the physiological effects of exogenous plant growth regulators and
nutrients on callus growth and anthocyanin yield. It reports on the effect of
light and temperature on O. reclinata callus cultures. At a molecular level,
differences between anthocyanin-rich and anthocyanin-poor callus lines were
investigated using the techniques of two-dimensional electrophoresis and in
vitro translation.
The use of two-dimensional polyacrylamide gel electrophoresis (2D-PAGE) in
studying proteins allows for the identification of proteins whose expression is
changed by an external stimulus or stimuli; or which are developmentally
regulated. The use of two-dimensional electrophoresis coupled with the
technique of in vitro translation provides information about mechanisms
involved in protein synthesis. These molecular techniques allow for the
identification of specific messenger ribonucleic acid (mRNA) molecules and the
study of properties for which they code (BROWN, 1990). These two
techniques were chosen in order to identify the factor(s) that induces
anthocyanin biosynthesis and to make comparative analysis of the enzyme
composition between the red and white callus of O. reclinata.
4

CHAPTER 2
LITERATURE REVIEW
The anthocyanins (Greek anthos, flower, and kyanos, blue) belong to a
subclass of secondary metabolites collectively known as the flavonoids.
Flavonoids represent a class of plant constituents that are synthesized in
almost every vascular plant examined. Therefore, the distribution of
anthocyanins within the Plant Kingdom is widespread. In fact, anthocyanins are
responsible for blue, purple and red pigments of higher plants. In flowers and
fruits, anthocyanins are thought to be essential for fertilisation and seed
dispersal (MAZZA & MANIATI, 1993).
2.1 CHEMICAL STRUCTURE OF ANTHOCYANINS
The basic chemical structure of flavonoids is relatively simple and it is
composed of two aromatic Ca rings heJd together by a C3 unit. The degree of
oxidation of the carbon (C) ring, other additions and rearrangements determines
the subclass formed, such as chalcones, flavonones, flavonols, isoflavonoids,
flavones, and anthocyanins (VAN TUNEN & MOL, 1991; VAN DER MEER,
STUIT JIE & MOL, 1993). Anthocyanins are glycosides of polyhydroxy and
polymethoxy derivatives of two phenylbenopyrilium of flavylium salts (Figure
2.1). Differences between ind ividual anthocyanins are the number of hydroxyl
groups in the molecule, the degree of methylation of these hydroxyl groups, the
nature and the number of sugars attached to the molecule, the position of
attachment, and the number of aliphatic or aromatic acids attached to the
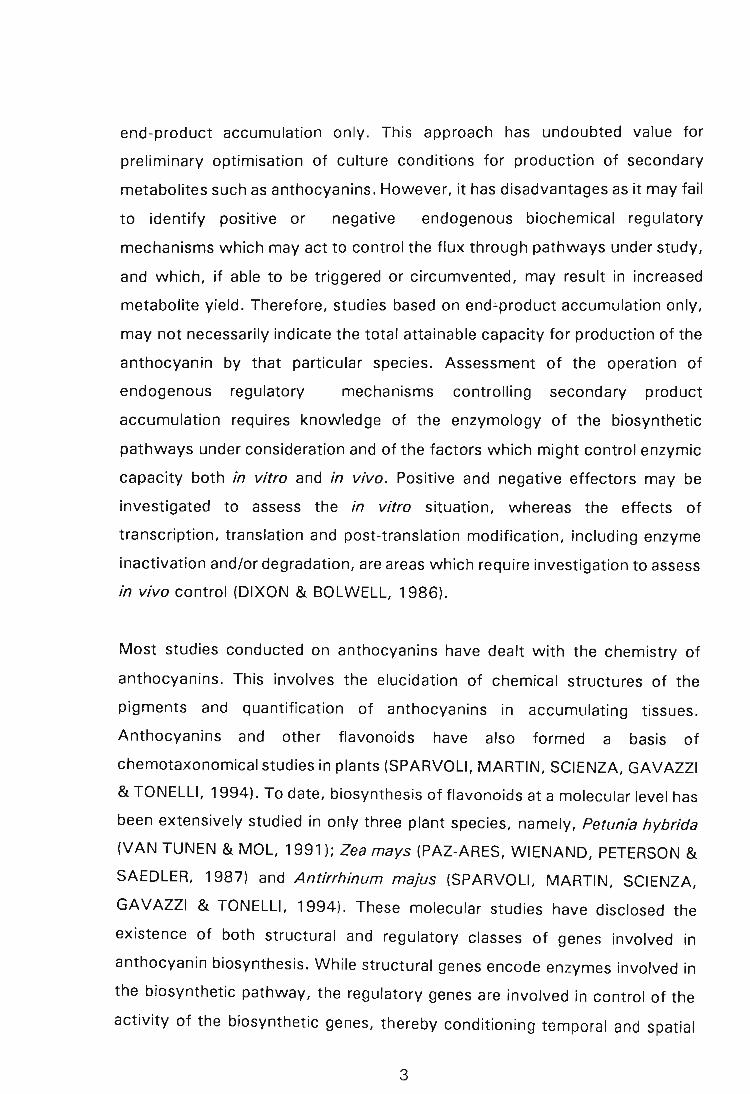
sugars in the molecule. The types of naturally occurring anthocyanidins which
are frequently found in plants are pelargonidin, cyanidin, peonidin, delphinidin,
petunidin, and malvinidin (Figure 2.2). Since each anthocyanidin may be
glycosylated and acylated by different sugars and acids, at different positions,
the number of anthocyanins is approximately 15 to 20 times greater than the
5

number of anthocyanidins . The sugars commonly associated with
anthocyanidins are glucose, galactose, rhamnose, and arabinose (MAZZA &
MANIATI, 1993).
Figure 2.1: The f lavylium cation . R, and R2 are H, OH, OCH 3 ; R3 is a glycosyl
or H; and R4 is a glycosyl or OH (MAZZA & MANIATI, 1993) .
6
OH OH OH
HO HO
OH OH
Perlagonidin Cyanidin
OH OH
HO HO OH
OH OH
Peonidin Delphinidin
~OC~H
HOy-..........O+ I: OCH I. U 3 Y ~ OH
OH
HO
OH OH
Malvinidin Petunidin
Figure 2.2: Most frequently found anthocyanidins in plants (BROUILLARD,
1982)
7

2.2 HISTORICAL BACKGROUND
The biosynthetic pathway of flavonoids has been subject to extensive study for
more than a century. The pathway has been looked at using various techniques
at multiple levels. By the seventeenth century, extraction of flavonoids from
flowers, and knowledge about how to change extract colour by addition of
salts and acids was known. The nineteenth century brought studies that were
involved in the biochemistry of flavonoids. A breakthrough was accomplished
in the 1960's with the development of techniques involving chromatography
and nuclear magnetic resonance (NMR) spectroscopy (VAN TUNEN & MOL,
1991). The analysis of anthocyanins is said to be complicated as they undergo
structural transformations and complexation reactions. Identification of
anthocyanins was initially carried out using paper and/or thin layer
chromatography (TLC)' UV/VIS spectroscopy, and controlled hydrolysis and
oxidation tests. High-performance liquid chromatography (HPLC) is a technique
which is frequently used for both preparative and quantitative work of
flavonoids. This is a powerful tool for separating anthocyanin mixtures.
Structural elucidation of anthocyanins involves NMR and fast-atom
bombardment-mass spectrometry (FAB-MS) (MAZZA & MANIATI, 1993).lnthe
late 1980's more than 3 500 different flavonoids from all kinds of plant species
had been identified and characterised (HARBORNE, 1988) and at present new
structures are still being reported (KOES, QUATTROCHIO & MOL, 1994).
The physiology and biochemistry, and especially the enzymology of
anthocyanin biosynthesis (Figure 2.3 and Figure 2.4) have been studied
extensively (VAN DER MEER, STUIT JIE & MOL, 1993). However, the last steps
of the pathway are unclear (JENDE-STRID, 1993). Genetic studies of flavonoid
metabolism were initiated around 1900, when pigments of flowers were used
to study Mendelian inheritance. The formation of end products of the flavonoid
biosynthetic pathway involves a number of different steps and sequential
action of many enzymes. Mutations that are visible but not lethal to the plant
have provided a genetic model system. The use of mutants has led to the
8

elucidation of the biochemistry of flavonoid biosynthesis (DOONER, ROBBINS
& JORGENSEN, 1991). Flavonoid biosynthesis is regarded as being one of the
best systems available for the study of regulation of plant gene expression. At
the genetic level, three plant species have been mainly utilized to study
flavonoid biosynthesis; namely,. Petunia hybrida (petunia), Antirrhinum majus
(snapdragon) and Zea mays (maize) (VAN TUNEN & MOL, 1991; VAN DER
MEER, STUIT JIE & MOL, 1993). Approximately 35 genes are involved in
flavonoid synthesis in Petunia (VAN DER MEER, STU IT JIE & MOL, 1993).
Twelve genes influence the pathway in Antirrhinum (DOONER, ROBBINS &
JORGENSEN, 1991). In Z. mays, at least 18 loci are implicated (DOONER,
ROBBINS & JORGENSEN, 1991). Many of the loci contain structural genes
coding for biosynthetic genes, but genes coding for regulatory mechanisms that
control several steps have also been identified. Synthesis of the enzymes of the
flavonoid pathway is co-ordinately and developmentally regulated in a tissue
specific manner. Several genes encoding enzymes and regulatory proteins
involved in flavonoid biosynthesis have been cloned from a number of plant
species (VAN TUNEN & MOL, 1991; VAN DER MEER, STUITJIE & MOL,
1993).
Molecular isolation of structural genes has been established by means of
biochemical, genetic and molecular strategies. These strategies may often be
used in combination. Biochemical strategies involve the use of antibodies
prepared against purified gene products, and are most useful for structural
genes that encode enzymes that can be assayed in vitro and that are
sufficiently stable during purification. Genetic strategies involve the use of
transposable elements in the induction of a mutation in an anthocyanin gene,
which can be subsequently isolated by the use of a physical probe for the
transposon. Molecular means utilize the differential regulation of transcripts of
anthocyanin genes by different alleles of regulatory genes. Screening of copy
deoxyribonucleic acid (cDNA) libraries prepared from tissues expressing
anthocyanin genes by ribonucleic acid (RNA) probes from the same genotypic
tissues that do not express these genes may be performed. Use of
9

heterologous hybridisation to isolate a homologous gene from another species
may be used depending on t he evolutionary distance between species. The
polymerase chain reaction (PCR) may be used to isolate genes that are from
distantly related species (DOONER, ROBBINS & JORGENSEN, 1991).
2.3 ANTHOCYANIN BIOSYNTHESIS
Anthocyanins are synthesized through the flavonoid biosynthetic pathway
which is one of the side branches of the more general phenylpropanoid
pathway (Figure 2.3) which branches off primary metabolism (OZEKI &
KOMAMINE, 1985a; KOES, SPELT & MOL, 1989). The general
phenylpropanoid pathway refers to a three step mechanism which involves
phenylpropane based structures. L-phenylalanine is channelled into the
formation of hydroxy-cinnamoyl co-enzyme-A (CoA) thiol esters. These esters
and other intermediates of this pathway lead to the formation of a number of
compounds, such as lignins, coumarins, stilbenes and flavonoids (HARBORNE,
1988).
I FLAVONOIDS ) !ISOFLAVANOIDS }! COUMARINS } [ SOLUBLE ESTERS)
/ i
GENERAL PHENYLPROPANOID METABOUSM
6~~L . I (coo~ . iCO_~:....=.:=--__ . I o l(1 R' R
COSCoA
Phenylalanine
....
Cinnamic Acid
OH OH
4-coumaric Acid
4-coumaroylCoA(R-R'-H) '
~ ....... /; , [ LIGNIN ) [r--S-UB--EJ.R-IN---") [ OTHER WALL-BOUND PHENOLICS ) [ STILBENES )
Figure 2.3: The general phenylpropanoiq pathway (DIXON & BOLWELL,
1986)
10
3 x M.lon~· I -CoA
r.coumiU~'I'COA--~-H":::'S--' HO~:.: OH 0 hydroxychalcon.
H°JA(°r-<O>-O ~ ~ OH
HO~lr--fi-OH OH 01
F3H Slring.nin
. 1:'Y'0H'-=-J "W:2:FLS
Kaemplerol HO 0 0 0 OH HO
HO
OFR
OH 0 Quercttin
HoW9-o OH
OH
OH OH ~copelar8onid,"
IANS 3GT
HomY 0 1 ~ OH
.# o.CIc , OH
Pelar1onidon."-!: Iuco..d.
OH DihydfOU<mplero!
OH 0
1~'H OH
OH
HO OH
• OH f)'S'H
OH 0 D)bydloq--.
lOFR
HO~OH H
OH OH Lruaxyanld in
j~ OH
HO~~OH OH
CyanK1ln.J..f;luC". ~ld!
OH
OH
OH 0 Myri~in
tFLS
OH
OH 0 OihydromyriC'etin
~ OFR OH
OH
I OH OH
uucodephinidon
j ANS 3GT
OH
OH o.lphirud,,,,?-glucooid.
Figure 2.4: Anthocyanin biosynthetic pathway (HOLTON & CORNISH, 1995)
/ J
1 1

Production of the hydroxylcinnamoyl CoA thiol esters occurs via activation of
transcinnamic acids produced from phenylalanine (OZEKI & KOMAMINE,
1985a). The first key step of this pathway is catalysed by phenylalanine
ammonia lyase (PAL) which converts the aromatic amino acid L-phenylalanine
into cinnamic acid. Cinnamate 4-hydroxylase (C4L) is involved in producing 4-
coumaric acid and 4-coumaroyl-CoA ligase (4CL) is responsible for production
of 4-coumaroyl CoA. The activity of PAL is said to control the entry of L
phenylalanine pools into the phenylpropanoid pathway and 4CL activity is
responsible for the removal of CoA esters into end product specific metabolic
branches. These two enzymes have been shown to be co-ordinately induced
in UV-irradiated parsley cell cultures (VAN TUNEN & MOL, 1991).
Malonyl-CoA, which is the other precursor for flavonoid biosynthesis, is
synthesized from the glycolysis intermediate acetyl-CoA and CO 2 , This
carboxylation reaction is catalysed by the enzyme Acetyl-CoA carboxylase.
Acetyl-CoA is a central intermediate in the Krebs cycle of primary metabolism
while production of 4-coumaroyl-CoA via PAL links the phenylpropanoid
pathway to primary metabolism as phenylalanine is produced from the
shikimate/arogenate pathway (HARBONE, 1988). Production of flavonoids is
initiated with the stepwise condensation of three malonyl-CoA molecules and
a molecule of coumaroyl-CoA (or related cinnamic esters) by chalcone synthase
(CHS) yielding a C'5 chalcone intermediate, 42'1'4'1'6'1-tetrahydroxy
chalcone. This is said to be the first committed step in flavonoid metabolism
and CHS is regarded as the key enzyme of flavonoid biosynthesis, as the C'5
chalcone intermediate forms the basic or fundamental structure from which all
flavonoids originate. Derivation of aurones and other diphenylpropanoids is also
dependent on this intermediate. Transformation of the yellow-coloured
tetrahydroxy chalcone by stereospecific action of chalcone flavonone
isomerase (CHI), where intramolecular closure of the carbon ring occurs,
produces a naringenin. This compound is a colourless flavonone. This
isomerisation proceeds spontaneously at a low rate, but the activity of CHI
increases the rate of reaction. Virtually all flavonoid classes are derived from
12

a flavonone. The enzyme 2-oxoglutarate-dependentdioxygenase: flavonone 3/3-
hydroxylase (F3H) is responsible for the production of dihydrokaempferol. This
reaction involves the /3-hydroxylation of flavonones at the 3-position of the C
ring. The enzyme requires Fe2 + and ascorbate as co-factors.
Dihydrokaempferol may be co~verted to dihydroflavonols which are direct
precursors for anthocyanin biosynthesis.
According to OZEKI & KOMAMINE, 1983; DOONER, ROBBINS & JORGENSEN,
1991; VAN DER MEER, STUITJIE & MOL, 1993; KOES, QUATTROCHIO &
MOL, 1994; HOLTON & CORNISH, 1995, the type of anthocyanin ultimately
produced is determined by the type of dihydroflavonol precursor synthesized.
Dihydrokaempferol can be hydroxylated by F3H to produce dihydroquercetin
or by flavonone 3',5'-hydroxylase (F35H) to produce dihydromyricetin. The -
activity of F3H results in hydroxylation of the B-ring taking place at the 3'
position only and the resultant production of dihydroquercetin may lead to red
coloured cyanidins being produced. Dihydromyricetin production involves the
hydroxylation of the B-ring to completion. Dihydromyricetin is a direct precursor
of blue or purple coloured delphnidins. In the absence of both 3' and 3'5'
hydroxylases, dihydrokaempferol acts as a precursor of the orange-coloured
pelargonidins. The conversion of colourless dihydroflavonols into anthocyanins
is highly complex and requires the action of a different number of enzymes,
some of which have been identified . The dihydroflavonols (dihydromyricetin,
dihydroquercetin and dihydrokaempferol) are reduced to flavan-3,4-cis-diols
(unstable proanthocyanidins) by dihydroflavonol-4-reductase (DFR). The next
two steps in the pathway are not clearly understood and defined, but it is
thought that leucoanthocyanidin dioxygenase and a dehydratase enzyme may
be responsible for converting proanthocyanidins into anthocyanidins. Further
oxidation, dehydration, and glycosylation of the different proanthocyanidins
produce corresponding brick-red perlargonidin, red cyanidin and blue delphinidin
pigments. Production of the first stable anthocyanin is due to the activity of
UDP glucose: flavonoid 3-0-glucosyl transferase (UFGT). The step, catalysed
by this enzyme, is an obligatory glycosylation reaction, usually a glycosylation
13
in the 3' position of the anthocyanidin or a suitable intermediate.
Anthocyanidin-3-glucosides may be further modified in many species by
glycosylation, methylation and acylation.
2.3.1 Structural genes involved in anthocyanin biosynthesis
Studies using mutants with a block in anthocyanin pigmentation have disclosed
the existence of two classes of genes which affect anthocyanin biosynthesis.
One class composed of the structural or effector genes of the pathway (Figure
2.3 and 2.4.) common to different species (FOSKET, 1994; SPARVOLl,
MARTIN, SCIENZA, GAVAZZI & TONELLI, 1994).
Genes involved in the biosynthetic pathway of flavonoids have been
characterized and cloned by differential and antibody screening of cDNA
libraries or by using transposable elements. Table 2.1, summarizes the
structural genes isolated from each of the species listed.
The second class consists of regulatory genes that control the activity of the
biosynthetic genes. These genes regulate the spatial and temporal accumulation
of anthocyanin pigments. The intensity of the pigment is also influenced by
these genes. Evidence for the regulatory control of anthocyanin biosynthesis
was obtained by enzyme assays or mRNA assays of structural gene activity
(HOLTON & CORNISH, 1995). The regulatory genes described in the best
studied plant systems, namely, maize, snapdragon and petunia are summarized
in Table 2.2.
14

Table 2.1: Cloned structural genes of the anthocyanin biosynthetic pathway -
Gene product Source Gene Comments References number
PAL Arabidopsis thaliana 3-4 Differential expression of PAL Wanner st a/. (1995) genes in plant tissues
Cucumis melD Wound-induced synthesis of PAL genes in melon fruit Diallinis and Kanellis (1994)
Ipomsa batatas Tanaka sta/. (1989)
Grzya sativa 3-4 Genes are regulated by light Minami et al. (1989)
Phaseolus vulgaris 3-4 Differential expression of genes Cramer st al. (1989)
Pstroselinum crispum 4-5 Lois et a/. (1989)
Solanum tubsrosum Genes isolated from elicitor-induced cell suspension cultures Fritzemeier st a/. (1987) CJ1
Vitis vinifsra 15-20 Snapdragon and maize heterologous probes were used to Sparvoli st a/. (1994) screen a cDNA library obtained from light grown seedlings
4CL P. crispum 2 Both genes induced by UV light and phytopathogens Douglas stal. (1987)
S. tuberosum 2 cDNA library constructed form mRNA isolated from elicitor- Fritzemeier st a/. (1987)
treated cell suspension cultures
CHS Antirrhinum majus 1 Multiple alleles as a result of transposon insertions Sommer and Saedler (1986)
A . thaliana 1 Gene induced by high-light intensity Fainbaum and Ausebel (1988)
Glycine max 6 Only CHS1 gene is induced by UV light and phytopathogens Wingender st a/. (1989)
Hordsum vulgars Phylogenetic study Niesbach-Klogen st a/. (1987)
Magnofolia liliflora Phylogenetic study Niesbach-Klogen st a/. (1987
Matthiola incana Sequencing of cDNA Epping st a/. (1990)

Table 2.1. continued
Gene product Source Gene Comments References
number
P. vulgaris 6-8 Genes differentially expressed Ryder et al. (1987)
Ranonculus acer Phylogenetic study Niesbach-Klogen et al. (1987)
CHI Petunia hybrida 2 Differential expression of van Tunen et a/. (1988)
genes
P. vUlgaris 1 Inducible by wounding and fungal infection Mehdy and Lamb (1987)
A. majus Multiple alleles as a result of transposon insertions Martin et al. (1985)
Z. mays Multiple alleles as a result of transposon insertions O'Reilly et a/. (1985)
(j) F3H A . majus Differential screening and genetic mapping was used to Martin et al. (1991)
isolate the eDNA corresponding to the incolorata locus which is known to encode F3H
P. hybrida High sequence homology exists between the snapdragon Britsch etal. (1993)
and petunia genes
DFR A. majus Transposon tagging was used to isolate the gene O'Reilly et al. (1985)
P. hybrida A snapdragon clone was used to isolate a homologous gene Beld et a/. (1989)
from petunia
V. vinifera 1 Expression induced by light Sparvoli et a/. (1994)
UFGT A . majus A putative UFGT clone was isolated from snapdragon using Martin et 8/. (1991) the maize gene as a probe
V. vinifera 1 A snapdragon clone was used to isolate a partial clone from Sparvoli et 81. (1994) grepe
Z. mays maize BzT gene encoding UFGT was isolated by transposon Dooner et s/. (1985) tagging
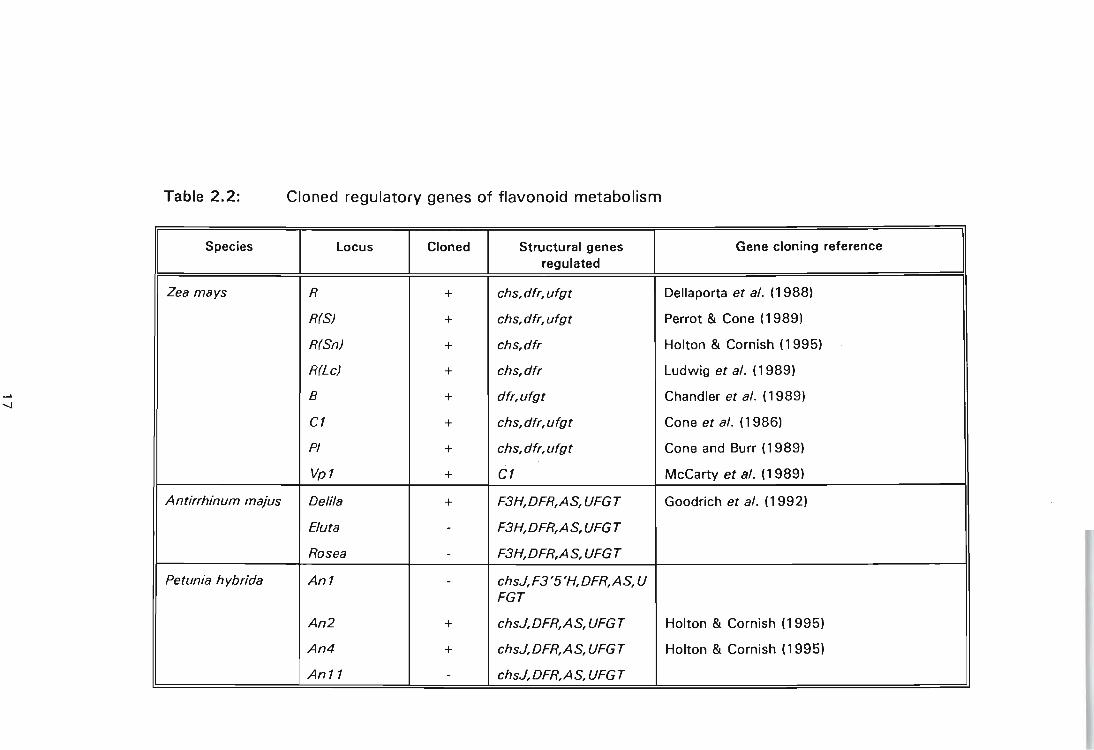
Table 2.2: Cloned regulatory genes of flavonoid metabolism
--
Species locus Cloned Structural genes Gene cloning reference regulated
Zea mays R + chs, dfr, ufgt Dellaporta et al. (1988)
R(S) + chs, dfr, ufgt Perrot & Cone (1989)
R(Sn) + chs,dfr Holton & Cornish (1995) -
R(Lc) + chs,dfr Ludwig et al. (1989) i
-...J B + dfr,ufgt Chandler et al. (1989)
C1 + chs, dfr, ufgt Cone et al. (1986)
PI + chs, dfr, ufgt Cone and Burr (1989)
Vp1 + C1 McCarty et al. (1989)
Antirrhinum majus Delila + F3H,DFR,AS,UFGT Goodrich et al. (1992)
Buta - F3H,DFR,AS, UFGT
Rosea - F3H,DFR,AS, UFGT
Petunia hybrida An1 - chsJ,F3'5'H,DFR,AS, U FGT
An2 + chsJ,DFR,AS,UFGT Holton & Cornish (1995) I
An4 + chsJ,DFR,AS, UFGT Holton & Cornish (1995) ,
An11 - chsJ,DFR,AS,UFGT

Anthocyanin biosynthesis is regulated primarily at the transcriptional level.
Regulatory genes involved in controlling anthocyanin biosynthesis in Z. mays
appear to control the whole pathway as a single unit as pigmentation of the
aleurone cell layer involves the simultaneous induction of the structural genes.
This multiple transcriptional activation is due to the Rand C 1 transcription
factors which act to induce all the committed steps of the pathway (DOONER,
ROBBINS & JORGENSEN, 1991; MARTIN & GERATS, 1993). The R family is
encoded by functionally duplicate, unlinked R (which includes S, Lc and Lw)
and 8 loci. The R proteins belong the class of helix-loop-helix type transcription
factors (BODEAU & WAlBOT, 1995). The R family comprises of a set of
regulatory genes consisting of the R locus (which includes S, Lc and L w), and
the 8 locus. The C1 proteins are encoded by C1 and PI loci.
This family resembles the Myb proto-oncogene type transcriptional activators.
The properties of individual alleles is responsible for the tissue specificity of
anthocyanin synthesis as each gene determines pigmentation of different parts
of the maize plant (DOONER, ROBBINS & JORGENSEN, 1991; BODEAU &
WAlBOT, 1995; HOLTON & CORNISH, 1995). BODEAU & WAlBOT (1995)
showed that the same biosynthetic pathway and regulatory mechanisms were
operative in maize callus as in the intact plant. At least one R gene-family
member is required for production of anthocyanin and the PI locus acts with the
R(S) locus to control pigmentation in the dark. Genotypes expressing PI gene
showed increased anthocyanin production in the presence of light.
In dicotyledonous plants, anthocyanin biosynthesis does not depend on a single
induction mechanism for all the biosynthetic genes as in the maize system. It
seems that different biosynthetic genes are regulated separately. In
snapdragon, three regulatory genes have been identified: delila, eluta and rosea
(HOLTON & CORNISH, 1995). Cloning and sequencing of delila have shown
that this gene is highly homologous to the maize R family. The first two steps
of the pathway, CHS and CHI, show minimal regulation, but subsequent steps
(F3H, DFR, AS, UF3GT) have an absolute requirement for the delila (Del) gene
18

product (KOES, QUATTROCHIO & MOL, 1994; MARTIN & GERATS, 1993;
HOLTON & CORNISH, 1995). Petunia has been shown to have the largest
collection of loci that influence anthocyanin production. The genes that control
anthocyanin production have been divided into two groups. One set of loci
controls the activity of a single enzyme from the biosynthetic pathway and
they appear to contain the structural gene encoding the enzyme. The second
class of loci controls the activity of multiple enzyme steps. These loci are said
to encode regulatory factors. The first and second parts of anthocyanin
biosynthesis are under different transcriptional control. The late steps of the
anthocyanin biosynthetic pathway are controlled by An 1, An2, An 10 and
An 11. These loci control the activity of DFR, UF3GT and AS. Mutations at
these loci result in unpigmented tissues but accumulation of dihydroflavonols
is maintained, indicating the activity of early biosynthetic enzymes encoded by
CHS, CHI and F3H genes (VAN TUNEN & MOL, 1991; KROON, SOUER, DE
GRAAFF, XUE, MOL & KOES, 1994; HOLTON & CORNISH, 1995).
2.4 EVOLUTION AND FUNCTIONS OF ANTHOCYANINS AND OTHER
FLAVONOIDS
2.4.1 Evolution of flavonoids
Different classes of flavonoids are distributed in a manner which suggests that
their appearance occurred sequentially during evolution. The chalcones,
flavonones and flavonols appeared with the ancestors of a class of Bryophytes
(muscO. Proanthocyanidins appeared with the first vascular plants
(Pteridophyta), and anthocyanins only appeared with the emergence of
flowering plants (Angiospermae). The genes encoding these compounds are
thought to have also evolved sequentially. Many of the structural genes which
have been sequenced, as well as their gene products, have shown homology
with enzymes from primary metabolism (KOES, QUATTROCHIO & MOL, 1994).
The initial reaction leading to the first C'5 compound is catalysed by chalcone
synthase. This condensation reaction utilises phenylpropanoid and malonyl-CoA
19
pathway products. This reaction shows high homology to reaction mechanisms
found in primary metabolism. It is thought that enzymes of fatty acid
metabolism, such as .B-ketoacyl carrier protein of fatty acid synthases may be
'parent' enzymes of chalcone synthase (STAFFORD, 1991).
The function of flavonoids is thought to have appeared at different points
during evolution in correspondence with the appearance of different flavonoids.
KOES, QUATTROCHIO & MOL (1994), consider their function as UV protectors
to have been the first to be established . STAFFORD (1991) argued that a
function as internal physiological regulators or signal molecules was the first
to have been established, as the first enzymes capable of synthesising
flavonoids were not as plentiful, nor as efficient, as modern day forms.
Therefore large amounts of flavonoids did not accumulate initially, and a
relatively large concentration would have been required for their function as UV
filters. Anthocyanins which appeared relatively late, are thought to have
evolved with the appearance of flowers, and the function of flavonoids in the
attraction of pollinators would have been acquired at this stage (KOES,
QUATTROCHIO & MOL, 1994). According to SWAIN (1986) anthocyanins do
occur sporadically in lower plants, but their role is unclear. The full range of
their orange to blue colours is not expressed until flowering plants coupled with
the advent of specialized animal pollinators and animal fruit dispersal agents.
SWAIN (1986) presumes that the biosynthetic steps involved in anthocyanin
production may have arisen early in the evolution of plants, but were not
utilized until required. The yellow chalcones are the first products of
anthocyanin biosynthesis and they occur on the outside of fern fronds, yet this
situation does not exploit their colour; instead they function to d ter a host of
potential pathogens. KOES, QUATTROCHIO &
acquisition of function by the flavonoids in the interaction with microbes
(rhizobia or pathogens) to be more recent, as this function is found mainly in
a single family of plants, namely Leguminoseae.
20
KOES, QUA TTROCHIO & MOL (1994) presented a model which attempted to
describe the evolution of mechanisms involved in the regulation of flavonoid
biosynthesis. Structural genes for proanthocyanidin and anthocyanidin
synthesis (the late acting genes of the pathway) are thought to be under a
linked or related set of regulatory genes, i.e. ancestors of Lc and C 1. This set
of genes ensures co-ordinated expression in the flower. It is thought that the
expression of early genes of the pathway were linked to the same ancestral C 1
and R regulatory genes as that of late genes. This would have allowed
flavonones, flavonol, proanthocyanidin and anthocyanidin synthesis to occur
independently. Co-ordination between late and early genes is thought to have
been achieved in two ways during evolution. Firstly, addition of new
appropriate modules in promoters of ancient genes would have occurred,
thereby giving them broad specificity. Alternatively duplication of some
structural genes, followed by coupling of one set of genes to newly acquired
regulators occurred. The specific cis-elements are presumed to have been lost
during later stages of evolution from mUlti-purpose genes, or specialised gene
copies may have been lost or inactivated (KOES, QUA TTROCHIO & MOL,
1994). The regulation of chs, chi and f3h genes in primitive ferns and mosses
has not yet been elucidated. KOES, QUA TTROCHIO & MOL (1994) suggested
that if the model presented holds true, then no activation of chs, chi and f3h
genes in primitive ferns and mosses would occur by present day Rand C 1
regulatory gene families.
2.4.2 Functions of anthocyanins and other flavonoids in nature
Plants that are insect-pollinated have a tendency to have large, often brightly
coloured petals; whereas wind-pollinated plants generally have small, dull
coloured petals, or no petals. This is clearly demonstrated by petunia and maize
(KOES, QUA TTROCHIO & MOL, 1994). Red or purple coloured anthocyanins
or aurones and chalcones (yellow coloured flavonoids) are mostly responsible
for flower pigmentation (MARTIN & GERATS, 1993) . Besides anthocyanins,
accumulation of flavonols or flavonones in petals of many plant species has
21
also been observed. These colourless compounds alter flower colour through
co-pigmentation by forming complexes with anthocyanins and metal ions.
Strong blue colours of flowers are a result of co-pigmentation and metal
chelation (JACKMAN, YADA, TUNG & SPEERS, 1987; MAZZA & MANIATI,
1993). Intermolecular co-pigmentation involves the association of anthocyan ins
with other flavonoids to form weak complexes through presumably hydrogen
bonding. Intramolecular co-pigmentation has been regarded as a more efficient
mechanism in the stabilisation of anthocyanins as opposed to intermolecular
co-pigmentation. It may occur in conjunction with metal complexing
(JACKMAN, YADA, TUNG & SPEERS, 1987).
Flower pigments act as visual signals to attract pollinators (insects or birds).
Anthocyanin biosynthesis is usually under spatial and temporal control, and this
is consistent with a role as a visual signal. Anthocyanins accumulate mainly in
the inner epidermis of petals. Transcriptional activity of structural genes and
the rate of anthocyanin biosynthesis reach a maximum prior to opening of the
flower bud (VAN TUNEN, KOES, SPEL T, VAN DER KROL, STUIT JIE & MOL,
1988; BELD, MARTIN, HUlTS, STUIT JIE & GERATS, 1989; KOES, VAN
BLOKLAND, QUATTROCHIO, VAN TUNEN & MOL, 1990; VAN TUNEN, MUIR,
BROUNS, RIENSTRA, KOES & MOL, 1990; MARTIN & GERATS, 1993). It has
been demonstrated that removal of petals from flowers results in a decrease
in the number of insects that visit flowers. Removal of petals does not
completely eliminate visitation of pollinators, as other factors, such as
fragrance, are involved in the attraction of pollinators (KOES, QUA TTROCHIO
& MOL, 1994). Wind-pollinated and self-fertile plant species, such as maize,
accumulate anthocyanins in several plant parts (e.g . anthers, leaves and
stems). The function of this pigmentation is unclear. In some cases,
accumulation of anthocyanins might be to attract fruit-eating animals and as
a result contributes in dispersal of seeds.
22
Accumulation of anthocyan ins and other flavonoids in the anthers and the pistil
of many plant species has been reported. Anthocyanins, as well as flavonols
and chalcones, are the most commonly found flavonoids in anthers. The
structural genes responsible for their biosynthesis, and the enzymes encoded
by those genes, are active in the tapetum and the connectivum. These are
tissues which are important for the nourishment of developing pollen grains
(KOES, VAN BLOKLAND, QUATTROCHIO, VANTUNEN & MOL, 1990). The use
of spontaneous and engineered mutants in flavonoid research has shown that
flavonoids play an essential role in pollen development. Maize plants with
mutations in chs genes produce unpigmented white pollen that is sterile (COE,
McCORMICK & MODENA, 1981). In petunia plants, blockage of chs gene
expression through antisense RNA or sense RNA (TAYLOR & JORGENSEN,
1992) resulted in white pollen that failed to produce a functional pollen tube.
In the pistil of petunia flowers , flavonoid biosynthetic genes like chs and chi are
highly active in the ovary and they result in flavonol accumulation (KOES, VAN
BLOKLAND, QUATTROCHIO, VAN TUNEN & MOL, 1990; VAN TUNEN, MUIR,
BROUNS, RIENSTRA, KOES & MOL, 1990). It has been suggested that
flavonols form a gradient along which growing pollen tubes are guided to the
ovule, as ovules are the primary sites for chs and chi expression (KOES,
QUATTROCHIO & MOL, 1994).
Sunlight is required by plants for photosynthesis, and the UV component of
light is a potential hazard as it can damage DNA and impair certain
physiological processes. Flavonoids are thought to act as ultra-violet
protectants as they strongly absorb UV light. They also accumulate mainly in
epidermal cells after express ion of structural biosynthetic genes of flavonoid
metabolism due to UV-induction. Therefore, they have been regarded as a
protective shield against UV light. With the accumulation of flavonoids, most
cells become shielded and biosynthesis then ceases. This is thought to be the
reason for transient expression of flavonoid genes under continuous UV light
23
conditions. Flavonoids have been reported to prevent UV-induced damage and
plants with decreased levels of flavonoids show increased sensitivity to
damage by UV irradiation (LI, OU-LEE, RABA, AMUNDSON & LAST, 1993;
KOOSTRA, 1994). Ultra-violet irradiation or white light containing UV leads to
a massive increase in transcriptional activity of CHS in Petroselinum crispum
cell suspension cultures (CHAPPELL & HAHLBROCK, 1984). Recently, the
analysis of UV light on Arabidopsis flavonoid mutants for the tt4 and tt5 genes
(encoding CHS and CHI, respectively) demonstrated the role of flavonoids in
the protection against UV light. These mutants lacked flavonols in all tissues
due to the synthesis of flavonol derivatives being blocked. When placed under
short wavelength UV light, growth of the mutants became strongly retarded
(LI, OU-LEE, RASA, AMUNDSON & LAST, 1993).
2 .5 MANIPULATION OF CULTURED CELLS TO SYNTHESIZE
ANTHOCYANINS IN VITRO
2.5.1 \ Importance of accumulation of anthocyanins in cultured cells -
~ssible role as food colourants
Researchers have long recognized the importance of cell cultures in the
production of secondary metabolites, even though many advances have been
made in organic chemistry to synthesize these metabolites that are of industrial
and medicinal importance. Many secondary metabolites have industrial
applications as pharmaceuticals and as agents in food flavouring and perfumery
(DODDS & ROBERTS, 1985). Initial proposals for using plant tissue culture
techniques in synthesising secondary metabolites were made by KLEIN (1960).
The basic technology involved in suspension cell cultures on a large scale was
described by NICKELL (1962). Plant tissue culture systems have allowed the
identification of previously undescribed secondary compounds. Cultures of
higher plants are seen as an important source of new and economically
important compounds (DODDS & ROBERTS, 1985). With the recent
advancement in plant biotechnology, many reports have been made regarding
the accumulation of anthocyanins in plant cell and callus cultures from a wide
24

variety of plant species (MORI, SAKURAI, SHIGETA, YOSHIDA & KONDO,
1993). The production of naturally occurring anthocyanin pigments in cell
cultures is a potential alternative to synthetic food colourants that have been
banned due to their toxicity (TIMBERLAKE & HENRY, 1986; MaRl, SAKURAI,
SHIGETA, YOSHIDA & KONDO, 1993). Due to the low toxicity of anthocyanins
which have been consumed by man - without any apparent ill-effects for
thousands of years, anthocyanins are now seen as a new source of food
colourants. Intensive research is being conducted by many research institutes
and food manufacturing companies into producing anthocyanin pigments in
cultured cells.
2.5.2 Effects of carbohydrate manipulation
In the intact plant, carbon dioxide is assimilated into sucrose which is the main
translocatable carbon source (CRESSWELL, FOWLER, STAFFORD & STEPAN
SARKISSIAN, 1989). In vitro cell cultures require carbon and an energy source
as well, and it has been suggested that sucrose-fed cell cultures are probably
similar in terms of primary metabolic pathways. Feeding of nutrients should be
at concentrations similar to that of the whole plant. Sucrose and D-glucose are
generally added to culture media in concentrations of 20 g £-1 to 30 g £-1
(DODDS & ROBERTS, 1985) and these sugars may be found present in phloem
and cell sap of cultured cells at levels of around 10% to 25%, considerably
higher than conventional concentrations (CRESSWELL, FOWLER, STAFFORD
& STEPAN-SARKISSIAN, 1989). In plant tissue culture systems, the favoured
source of carbon appears to be sucrose, as nearly all cultures appear to
respond optimally to its presence (DODDS & ROBERTS, 1985). It has been
demonstrated that sucrose added in vitro to cell suspensions is rapidly
hydrolysed to glucose and fructose, which are then taken up either passively
or actively, depending on the plant species. It is thought that invertases, which
are responsible for sucrose hydrolysis, may reside in the external medium, the
cell wall or the plasmalemma. Uptake of glucose is more rapid than that of
fructose from culture medium. Sucrose may therefore be viewed as an
25
alternative means of supplying glucose (CRESSWELL, FOWLER, STAFFORD &
STEPAN-SARKISSIAN, 1989). Reports on the effects of sucrose and glucose
upon culture growth and secondary metabolism have indicated that their mode
of uptake and utilization is regulated in a rather different manner. Other
glucose-containing disaccharides, such as maltose and lactose, may be used
as energy sources by certain cell lines, but they are generally less effective
than sucrose. According to CRESSWELL, FOWLER, STAFFORD & STEPAN
SARKISSIAN (1989) the effect of these alternative carbon sources on
secondary metabolism requires further investigation as they may have
detrimental effects on secondary metabolite production.
Carbohydrates are known to function in the regulation of external osmotic
potential, which governs the uptake of water by plant cells between vacuolar
sap and the external medium. Water availability to cultured cells is influenced
by the concentration of agar and other non-metabolites, as well as the
carbohydrate source (DODDS & ROBERTS, 1985). It is important to consider
the effect of various carbohydrates on cell growth and productivity of
secondary metabolites such as, anthocyanins.
SAKAMOTO, IIDA, SAWAMURA, HAJIRO, ASADA, YOSHIKAWA & FURUYA
(1993) reported the isolation of an anthocyanin producing cell strain of Aralia
cordata, which had a high and stable production capacity in conditions of
darkness or light. The cell line was produced from both A. cordata leaves and
stems, and was obtained by continuous cell-aggregate cloning. Investigations
dealing with the effects of several sucrose concentrations on cell growth and
anthocyanin yield suggested that sucrose concentrations higher than 5%
reduced cell growth and anthocyanin accumulation by affecting the osmotic
strength. High concentrations of sucrose results in higher osmotic strength of
the media and the higher osmotic strength negatively affects the water content
of the vacuole. Anthocyanins have been shown to accumulate in the vacuole
in A . cordata cells. Aralia reptans callus also tended to show reduced growth
and production at higher sucrose concentrations. The best conditions for
26

anthocyanin production in dark or light conditions were observed on
LlNSMAIER & SKOOG (1965) basal medium, supplemented with 2% sucrose
(anthocyanin yield: 9.0%; growth index: 7.5%) and 4% sucrose (anthocyanin
yield: 7.5%; growth index: 8.0%) respectively (SAKAMOTO, IIDA,
SAWAMURA, HAJIRO, ASADA, YOSHIKAWA & FURUYA, 1993).
The effects of different carbon sources other than sucrose have been
investigated on A. cordata cells. Under a light-dark cycle, glucose, sucrose and
fructose yielded the best results with respect to callus growth as compared to
xylose, cellobiose and maltose. The best anthocyanin yields were observed
with glucose and fructose at 5.9% and 7.9% in the light and dark,
respectively. In callus cultures of Hibiscus sabdariffa L., fructose was also
shown to be most effective toward anthocyanin production in the dark but the
growth rate was low in comparison with sucrose. Xylose was shown to be
inhibitory to growth and production of anthocyanin, whereas galactose,
cellobiose and maltose did not support growth. Sucrose, therefore, appears to
yield the best levels of anthocyanin, and it is capable of maintaining callus
growth (SAKAMOTO, IIDA, SAWAMURA, HAJIRO, ASADA, YOSHIKAWA &
FURUYA, 1993).
The effect of sucrose on cell growth and production of callus that does not
necessarily accumulate anthocyanins, was similar in species that do
accumulate anthocyanins . YAMAMOTO, YAN, IEDA, TANAKA, IINUMA &
MIZUNO (1993) showed that cell growth in Vancouveria hexandra cells
accumulation of flavonol glycoside paralleled an increase of sucrose up to 7%
on LlNSMAIER & SKOOG (LS) (1965) gellan gum medium, and then became
independent of the sucrose increase. These authors observed that the most
suitable sucrose concentration for flavonol glycoside production was 7%.
In in vivo propagated plant cells, application of sugars affected anthocyanin
production at the gene level as the expression of a particular CHS gene (CHS
A) from petunia in transgenic leaves of Arabidopsis was induced. Organ-
27
specific and sugar-responsive expression of CHS cDNA have been isolated from
Camellia sinensis, which accumulates the flavonoid, catechin. Leaves of C.
sinensis were treated with different carbohydrates. Fructose, sucrose or
maltose resulted in increased levels of CHS-transcripts. The other sugars, i.e.
glucose, galactose, sorbitol and mannitol had no effect on chalcone synthase
transcript levels. Transcript levels were observed to be lower in the darkness
than in continuous light. These researchers suggest that sugar effects are
mediated through balances of sugars and/or changes in energy metabolism.
They suggest that levels of sugars increase due to photosynthetic activity of
cells under continuous light, and balances and energy metabolism is changed
under conditions of light, causing differences with respect to sugar
responsiveness of CHS transcripts under different light conditions. Sugars are
suggested to act as inducers of CHS transcripts in vivo and the induction of
CHS gene expression by sucrose is thought to reflect the requirement for a
large amount of a carbon source for catechin accumulation (TAKEUCHI,
MATSUMOTO & HAYATSU, 1994).
2.5.3 Effects of manipulating inorganic salts on anthocyanin
biosynthesis
A continuous supply of macronutrient elements, such as nitrogen,
phosphorous, potassium, calcium, magnesium, and sulphur, is required by
cultured plant tissues. Nitrogen may be added in the largest amount as either
a nitrate or ammonium ion, or a combination of these ions. Magnesium sulfate
(MgS04 • 7H20) generally satisfies the magnesium and sulphur requirements and
phosphorus can be provided by NaH2P04 .H20 or KH2P04 . Potassium, the cation
found in the largest amount, is given as either KCI, KH2P04 or KN03 • The
calcium requirement may be provided by CaCI2.2H20, Ca(N0 3 )2.4H20, or an
anhydrous form of either salt may be added (DODDS & ROBERTS, 1985).
A high energy demand on nitrogen assimilation is imposed on cultured plant
cells when nitrogen is supplied as nitrate. The supply of nitrogen as ammonia
28
is energetically more efficient than supplying the more oxidised nitrate form .
Removal of NH3 from culture medium results in a pH decrease, especially with
the weak buffering capacity usually present in tissue culture media. It appears
that NH3 present in a culture medium, with other more oxidised forms (N03-)
is generally preferentially remov,ed and utilized.
Nitrogen effects on cultured A. cordata cells were investigated by varying the
nitrogen concentration in different types of basal media (LS and MS medium
with 3% (w/w) sucrose, 1 mg 1-1 2,4-0 and 1 mg 1-1 kinetin). One of the cell
lines was grown in the dark for 21 days at 25°C, whilst the other line was
exposed to a light-dark regime. Cell growth in the dark was better promoted by
1/5 total nitrogen of the standard MS medium, and the highest anthocyanin
yield under light conditions was obtained by 1/5 total nitrogen of the standard
MS medium. Increasing the nitrogen concentration resulted in decreasing
anthocyanin yield. In the dark, the N03- ion was speculated to be solely
responsible for activation of anthocyanin biosynthesis. Higher ratios of N03-/
NH4 + have been demonstrated to be more effective for anthocyanin production.
In the presence of light, 15 mM and 30 mM total nitrogen were preferable for
callus growth (SAKAMOTO, IIDA, SAWAMURA, HAJIRO, ASADA,
YOSHIKAWA & FURUYA, 1993).
2.5.4 Effects of manipulating plant growth regulators on anthocyanin
biosynthesis
For most callus cultures, the growth regulator requirements are generally auxin
and cytokinin. Auxins are compounds that stimulate shoot cell elongation. They
resemble indole acetic acid (lAA) in their spectrum of activity. Cytokinins are
known to promote cell division in plant tissues, and regulate cellular growth
and development. Auxin-cytokinin supplements are instrumental in the
regulation of cell-division, cell elongation, cell differentiation and organogenesis
(DODDS & ROBERTS, 1985).
29

The effects of 2,4-0 on secondary metabolic processes have been examined
by several researchers (OUELHAZI, FILALI, CRECHE, CHENIEUX & RIOEAU,
1993: Catharanthus roseus cell cultures; OZEKI, DAVIES & TAKEOA, 1993:
Daucus carota suspension cu ltl:lres; OZEKI, KOMAMINE & TANAKA, 1990:
Daucus carota suspension cultures; MEYER & VAN ST AOEN, 1995: Oxalis
reclinata cultured cells). Increasing concentrations of 2,4-0 resulted in
increased callus production in O. reclinata callus (MEYER & VAN STAOEN,
1995). The repression of anthocyanin production in Oxalis cultures by auxins
was said to be in agreement with reports made on Haplopappus gracilis
(CONSTABLE, SHYLUK & GAMBORG, 1971); Helianthus tuberosus (IBRAHIM,
THAKUR & PERMANANO, 1971) and Daucus carota L. cv Korudagosun (OZEKI
& KOMAMINE, 1986).
OZEKI & KOMAMINE (1985a) found that transfer of D. carota cells from a
medium containing 2,4-0 to a 2,4-0 lacking medium, cell division continued for
four days after the transfer. This was suggested to be due to 2,4-0 carry-over,
as cell division ceases after four or five days and accumulation of anthocyanin
occurs in the vacuole after five days. Addition of 2,4-0 to anthocyanin
synthesising cells six days after the transfer resulted in a gradual disappearance
of anthocyanin and an initiation of cell division in the same cells when
anthocyanin had almost vanished. This observation confirmed that a cell in
which cell division had stopped and anthocyanin synthesis was taking place in
a medium lacking 2,4-0, had the ability to regain cell division activity when it
was transferred again to a 2,4-0 containing medium. Anthocyanin biosynthesis
induction and cell division appeared to be a reciprocal phenomena. The use of
ONA synthesis inhibitors indicated that anthocyanin synthesis is regulated by
2,4-0, irrespective of cell div ision, and that anthocyanin synthesis and cell
division may be regulated by different mechanisms.
30

Investigations conducted to elucidate regulatory mechanisms involved in the
expression and suppression of secondary metabolism by auxins at the
enzymatic level have revealed that enzymes involved in the more general
phenylpropanoid pathway, mainly PAL and 4-CL have increased catalytic
activity during the first two day~ of transfer from media lacking or containing
2,4-0. This effect was assigned to a transfer response. Maintenance of
cultured cells on 2,4-0 containing medium resulted in a decrease of enzymatic
activities of these enzymes. Low levels of the enzymes were maintained on
2,4-0 containing medium. Chalcone synthase and chalcone isomerase were
detected at low levels at all times in the presence of 2,4-0. In particular,
chalcone synthase activity was below detectable levels throughout the culture
period. Transfer of cells to 2,4-0 lacking medium resulted in the induction of
anthocyanin, which was reflected by increased levels of all enzymes. Chalcone
synthase induction was particularly noted (OZEKI & KOMAMINE, 1985a).
Ultraviolet irradiation or elicit or treatment of cultured cells resulted in rapid
induction of flavonoid enzymes. Induction of PAL and CHS in 2,4-0 lacking
medium is said to be slow, as three or four days are taken for enzyme
induction. The rapid induction of flavonoid metabolism by UV light and elicitors
relates to the fact that defense responses need to be rapid in order to protect
plant cells against environmental changes. In general, the induction of enzymes
related to flavonoid metabolism is regulated at the transcriptional level and the
induction of mRNA synthesis occurs prior to the induction of the synthesis of
enzyme proteins (LAWTON, DIXON, HAHLBROCK & LAMB, 1983a and b;
EDWARDS, CRAMER, BOLWELL, DIXON, SCHUCH & LAMB, 1985).
Cytokinins are important regulators of many aspects of plant development,
including cell division, nutrient mobilisation, senescence, chloroplast
development and apical dominance (DEIKMANN & HAMMER, 1995). For in
vitro culture purposes, the most widely used cytokinins in growth media are
kinetin, benzyladenine (BA) and zeatin. Kinetin is typically added to media at
a concentration of 0.1 mg £-1 for the induction of callus (DODDS & ROBERTS,
1985).
31

Cytokinins affect the expression of specific genes by both increasing and
decreasing particular protein or mRNA abundance. Cytokinins have also been
shown to affect accumulation of anthocyanins in plants. Increases in
anthocyanin accumulation have been noted for tissues in culture as well as in
parts of intact plants. Anthocyanin accumulation in response to cytokinins has
been shown in D. carota suspension culture cells (OZEKI & KOMAMINE, 1981).
Recently induction of accumulation of anthocyanins by cytokinins has been
shown in Arabidopsis thaliana seedlings (DEIKMANN & HAMMER, 1995).
Induction of anthocyanin accumulation by cytokinins is said to be reminiscent
of the classical cytokinin bioassay of betacyanin induction in Amaranthus
seedlings. Even though betacyanins are chemically unrelated to anthocyanins,
and they accumulate in plants that do not produce anthocyanins, they playa
similar physiological role to anthocyanins. Betacyanins have the same set of
signals as anthocyanins, main ly light, wounding and development (DEIKMANN
& HAMMER, 1995).
In Arabidopsis, a large increase in anthocyanin accumulation is thought to
result from increased accumulation of mRNA's encoded by four genes in the
anthocyanin biosynthetic pathway. Two of the genes, namely, CHI and DFR,
are regulated at the transcriptional level and the other two genes, PAL 1 and
CHS, are post-transcriptionally regulated (DEIKMANN & HAMMER, 1995).
In cultured cell systems, there is controversy about the effects of cytokinins on
anthocyanin production. Some reports on inhibitory effects of cytokinins have
been made. KINNERSLEY & DOUGALL (1980) showed that kinetin decreased
the yield of anthocyanin in a suspension culture of D. carota. In the system of
OZEKI & KOMAMINE (1985b) where anthocyanin synthesis was induced in
relation to embryogenesis in suspension cultures of D. carota, cytokinins were
reported to have promoted synthesis of anthocyanins. In this system,
anthocyanin biosynthesis was viewed as 'metabolic differentiation', as
anthocyanin biosynthesis is an expression of secondary metabolism. In all the
32
systems, where cytokinins have a positive effect on anthocyanin production,
these promotions are closely associated with illumination (OZEKI &
KOMAMINE, 1981; TAKEDA, 1988; DEIKMANN & HAMMER, 1995).
OZEKI & KOMAMINE (1981) suggested that disagreement arising from the
controversial effects of growth regulators on anthocyanin biosynthesis may be
due to physiological developmental differences of the cells used for
experiments, as well as the different levels of endogenous growth regulators
used.
Controversy surrounds the effect of gibberellins on anthocyanin production.
Gibberellins increased anthocyanin accumulation in the corolla of petunia
flowers by increasing flavonoid gene transcription (WEISS, VAN DER LUIT,
KNEGT, VERMEER, MOL & KOOTER, 1992). In other systems, they have been
found to have inhibitory effects on anthocyanin production. Gibberellins were
shown to decrease anthocyanin accumulation in carrot cell suspension cultures
(HINDERER, PETERSEN & SEITZ, 1994; OZEKI & KOMAMINE, 1986). The
mechanism(s) of gibberellin inhibition have not yet been identified (ILAN,
ZANEWICH, ROOD & DOUGALL, 1994).
In intact plants, gibberellins are known to have profound and diverse effects on
growth and development. In petunia flowers, stamens contain high levels of
gibberellins and the gibberell ins promote pigmentation by playing a key role in
the regulation of anthocyanin synthesis in corolla tissues of Petunia hybrida
(WEISS & HALEVY, 1989). Removal of the stamens or anthers at an early
stage of corolla development, before the onset of anthocyanin synthesis,
inhibits growth and anthocyanin accumulation in the attached corollas. The
effect of gibberellins on corolla growth is independent of its effect on
anthocyanin biosynthesis (WEISS, VAN TUNEN, HALEVY, MOL & GERATS,
1990).
33
The expression of anthocyanin genes has been shown to be induced by
exogenous application of gibberellins. Immunoblotting using specific antibodies
showed that significantly higher levels of the flavonoid enzymes, CHS and CHI,
were detected in gibberellin in vitro cultured corollas of P. hybrida in the
presence of sucrose. Examinati~n of the steady-state levels of mRNA for CHS
and CHI revealed that gibberellins enhanced CHS and CHI steady-state mRNA
levels (WEISS, VAN TUNEN, HALEVY, MOL & GERATS, 1990). Gibberellin has
also been shown to increase the production of anthocyanin through increased
PAL activity. It is thought that gibberellin may operate at the transcriptional
level, or may aid in stabilisation of specific flavonoid mRNAs (WEISS, VAN
TUNEN, HALEVY, MOL & GERATS, 1990; HOOLEY, 1994). Gibberellin has
also been thought to act on regulatory genes encoding transcription factors of
the basic helix-loop-helix and c-myb classes, which, in part, appear to control
expression of anthocyanin biosynthetic genes. This particular concept requires
testing (HOOLEY, 1994).
2.6 AIMS AND OBJECTIVES
The economic importance of red coloured anthocyanins in the food industry
was the main motivation behind this study as cyanidin-3-glucoside which
accumulates as the major pigment in O. reclinata could potentially be used
industrially as an alternative source to synthetic red food colourants. This
research was aimed at investigating mechanisms which could be employed to
induce pigment production as well as optimising anthocyanin yield from callus
cultures of O. reclinata. Accumulation of red pigments in callus tissues was
hypothesized to be due to external factors as anthocyanins have been shown
to accumulate in response to environmental stimuli in usually non-expressing
tissues.
The major objectives were to determine the 'switch' for anthocyanin production
in O. reclinata callus cultures. With the establishment of the inducing factor(s),
optimisation of red colourant production from O. reclinata was to be achieved.
This involved determining the optimal conditions necessary for anthocyanin
34

yield as well as the maintenance of callus growth. The major objective of
increased pigment production would be achieved through tissue culture based
studies. The approach involved determination of physical and physiological
factors which could switch on the expression of the genes coding for
anthocyanin production during culturing of red and white callus lines. The
following factors were investigated:
i)
i i)
iii)
iv)
different carbohydrate sources;
the effect of inorganic salts (nitrogen and phosphate);
the influence of plant growth regulators; and
the effect of light and temperature on production of anthocyanin
and generation of callus biomass.
Tissue culture studies based on the measurement of secondary end product
accumulation only were foreseen as limiting as they may not truly reflect the
total attainable capacity for accumulation of the secondary metabolite. In order
to recognize and ascertain biochemically important mechanisms which affect
end product accumulation at the protein and gene level, molecular techniques
were employed. Two-dimensional electrophoresis and in vitro translation were
chosen in order to complement findings from plant tissue culture studies. These
molecular techniques were uti lized to acquire knowledge about the differences
between pigment producing callus and non-pigmented callus of O. reclinata.
Differences with respect to proteins, especially enzymes associated with the
anthocyanin biosynthetic pathway were investigated.
Although, these techniques have been reported to be simple, rapid and possess
a high resolution capacity, the establishment and optimisation of these
techniques had to be achieved before they could be used successfully. Plant
pigments and other secondary products tend to interfere with the isolation of
proteins and nucleic acids (WANG & VODKIN, 1994), as well as polyacrylamide
gel electrophoresis. Elimination of this problem had to be achieved prior to the
35
molecular analysis of the differences between the red and white callus types
of O. reclinata.
36
CHAPTER 3
IN VITRO CULTURE STUDY
3.1 INTRODUCTION
The use of plant tissue culture systems has allowed for elucidation · of
protective responses of plant cells to environmental stress. In cultured plant
cells, responses to stress occur even in the dedifferentiated state (DIXON &
BOLWELL, 1986) . Plant tissue culture systems are theoretically ideal for
metabolic studies involving synthesis of secondary metabolites. Production of
pigment-containing cells in anthocyanin synthesizing cultures is usually small.
The cells may be diffusely distributed, or may be localised, thus giving a patchy
appearance to the cultures (OlEKI, KOMAMINE & TANAKA, 1990). These
heterogenous cultures may be manipulated in vitro to produce optimal levels
of the desired secondary metabolite. Alteration of physical and chemical factors
contributing to the culture environment may result in an increase in the
metabolic flux towards secondary metabolite formation (DIXON & BOLWELL,
1986). This would result in reduced callus growth, even though the desired
product is synthesized.
3.1.1 Effects of physiological factors on anthocyanin production
Accumulation of anthocyanins in cultured cells may often be restricted to
certain cells or to a small region of cells. This results in a heterogenous type of
callus being produced. Most plant cell cultures are heterogenous, with some
more so than others. The component cells may differ in size, structure,
deoxyribonucleic acid (DNA) content and in many other ways, including
metabolism. The properties of cell types varies within and between cultures,
and changes with time. One may often observe a decline in the ability of a cell
37

population to accumulate a designated secondary metabolite, but there are
times when variation may give rise to cultures with an increased level of
biosynthetic activity. Therefore, factors affecting such changes, namely, the
heritable variation present in the explant, and the influence of culture conditions
must be considered with seriousness in terms of manipulating cultured cells for
increased metabolite production (HOLDEN, HOLDEN & YEOMAN, 1988).
Factors affecting increases or decreases in biosynthetic activity of cell cultures
are important to researchers that are looking for high yields of secondary
metabolites. Exposure of cells to appropriate cultural stimuli may lead to
cultures producing a significant and stable yield of product. Such stimuli may
be in two forms, that is, coming from a physical environment such as light or
temperature, or in a physiological form, from the components of the medium.
HOLDEN, HOLDEN & YEOMAN (1988) suggested that the ·components of the
culture medium have the greatest effect on product yield. The concentrations
and sources of carbon in the medium have been known to affect secondary
metabolism. The levels of inorganic salts are known to affect both primary and
secondary metabolic processes. In some cases, cultured cells may produce
greater levels of the desired secondary product in medium devoid of these
nutrients. Reduced nitrate levels also appear to stimulate biosynthetic activity
(HOLDEN, HOLDEN & YEOMAN, 1988).
Plant growth regulators are used primarily to induce or establish callus from an
explant and to maintain proliferation (DODDS & ROBERTS, 1985). They can
also be effective in stimulating or inhibiting secondary products in cultured
cells. Auxins appear to have the greatest influence on biosynthetic activity. The
synthetic auxin 2,4-0 has been shown to affect inductive activities of
anthocyanin biosynthetic enzymes, PAL and CHS (OZEKI & KOMAMINE,
1986). Application of this plant growth regulator appears to inhibit production
of the key regulatory enzymes of the anthocyanin biosynthetic pathway.
Removal of 2,4-D activates expression of PAL and CHS mRNA's. Other auxins,
38

such as IAA, have promotory characteristics in production of secondary
metabolites (HOLDEN, HOLDEN & YEOMAN, 1988; SATO, NAKAYAMA &
SHIGETA, 1996).
The main motivation behind plant tissue culture studies in O. reclinata was to
establish the factor(s) which induce or repress anthocyanin biosynthesis. The
second objective was to manipulate anthocyanin production and to increase
callus and anthocyanin yield.
3.2 MATERIALS AND METHODS
3.2.1 Plant material and callus generation
Pigmented and non-pigmented callus of Oxalis reclinata wa.s generated by the
method described by CROUCH, VAN STADEN, VAN STADEN, DREWES &
MEYER (1993). Callus was initiated by surface-sterilization of stem-internodal
explants in 1.75% NaOCI for four minutes prior to rinsing. A modified
MURASHIGE & SKOOG (1962) medium (without glycine) was supplemented
with 30 g£-' sucrose. SA (0.5 mg £-') and NAA (5 mg £-') were added to the
medium prior to adjusting the pH to 5.7. The medium was solidified with agar
(8 g £-') and sterilized by autoclaving. Explants (3 mm) were transferred to the
solid medium and placed with their long axes in contact with the agar. Culture
vessels were placed under white cool fluorescent light (44.5 pmol photons m-2
SO') in a growth room with a 16 hour (h) light regime at 25°C. Production of
callus occurred and heterogenous mixtures of white, yellow, green and red
callus were observed. Red callus formation occurred with the induction of
organogenesis. In order to create a homogenous red cell line, red cell
aggregates were clustered together and subcultured. A white callus line was
generated in a similar manner. The callus lines isolated were maintained on
MURASHIGE & SKOOG (1962) medium (0.8% agar [w/v]; pH 5.7)
supplemented with 5 mg £-, NAA, 0.5 mg £-, SA, 30 g £-, sucrose and 0.1 g
£ ,- myo-inositol. Stock cultures were sub-cultured at four weekly intervals.
39

3.2.2 Manipulation of chemical components of culture medium
Unless otherwise stated, all experiments were conducted at constant light (48
pmol photons m-2 S-1) at 22°C for 28 days.
3.2.2.1 Carbohydrate manipulatio':1s
The effect of varying concentrations of sucrose (10 g 1-1 to 60 g 1-1) were
investigated using both white and red callus lines. Alternative carbon sources
were examined on MS basal medium (0.8% agar [w/v]; pH 5.8). The
alternative sources of carbohydrate investigated were glucose, galactose,
fructose, xylose, lactose and maltose at 30 g 1-1•
3.2.2.2 Nitrate and phosphate manipulations
To investigate the effect of inorganic ions on anthocyanin yield, the target
compound concentration was changed and the other nutrient concentrations
maintained in the original MS medium (MURASHIGE & SKOOG, 1962)
previously described for maintaining O. reclinata callus (Section 3.2.1) This
medium contains 1.8 mM KN03 and 2 mM NH4N0 3 as the sources of nitrogen;
and 1.24 mM KH 2P0 4 as the main phosphate source. The above mentioned
concentrations of nitrogen and phosphate sources were quartered, halved or
doubled to test the effect of varying nitrogen and phosphate levels.
3.2.2.3 Phytohormone manipulations
The effect of growth regulators on callus growth and anthocyanin production
was determined by subjecting dark grown white callus and light grown red
callus to basal MS medium (MURASHIGE & SKOOG, 1962) containing different
types of plant growth regulators (BA, KIN, NAA, IAA, IBA (indole butyric acid),
2,4-0, GA3) at 0.1 mg 1-1•
40
3.2.3 Manipulation of physical factors of the culture environment
3.2.3.1 Temperature effects
Cultures were placed at 10°C, 22°C and 35°C. The influence of these
temperatures on white and red callus were recorded by weighing them after 28
days and thereafter extracting for anthocyanins (Section 3.2.4).
3.2.3.2 light effects
The absence of light on anthocyanin accumulation was observed by placing
callus lines in the dark for 28 days. Different light regimes were also
investigated. Control cultures of both red and white callus were placed in
continuous light under white fluorescent tubes (44 pmol photons m-2s-') at
22°C. Experimental cultures were incubated under a light-dark cycle (16 h light,
21.1 pmol photons m-2s-') at 22°C, alternatively placed in a growth room that
was dimly illuminated continuously (2 pmol photons m-2 s-') at 22°C.
3.2.4 Measurement of callus growth and determination of anthocyanin
content
In all experiments, final growth was measured by weighing callus after 28 days
of growth at the various treatments. The anthocyanin content was determined
by extracting weighed callus in 0.1 % HCI-methanol at 4°C overnight. The
absorbance of the clear methanolic supernatant, after centrifugation for five
minutes at 10 OOOg, was measured at 535 nm with a spectrophotometer
(Beckman DU-65 Spectrophotometer). A standard, cyanidin-3-glucoside
(ROTH), was used as a reference solution for quantification. Anthocyanin
content (mg g-' FW) was calculated.
3.2.5 Analysis of data
All experiments were done using five replicates for statistical purposes. Every
experiment was repeated five times. Data were subjected to a one-way
41

Analysis of variance (ANOVA) using the Statgraphics statistical programme.
When the ANOVA indicated statistical significance, a Tukey's multiple
comparison test was used to distinguish differences between treatments.
3.3 RESULTS
Production of anthocyanin containing O. reclinata callus was initially achieved
on MS medium (MURASHIGE & SKOOG, 1962) supplemented with 30 g 1.1
sucrose. Application of sucrose at this concentration to basal MS medium
resulted in the highest callus growth and anthocyanin yield for red and white
callus (Figure 3.1). Concentrations of 40 g 1.1 or more resulted in decreased
accumulation of callus biomass. Therefore, a concentration of 30 g 1.1 was
chosen to test the effect of different carbohydrate sources on anthocyanin
accumulating callus cultures of O. reclinata. Sucrose .was used as the
carbohydrate source in subsequent experiments, because it was found to have
the greatest effect on callus growth and anthocyanin production. However,
both sucrose and glucose had a positive effect on the growth of red callus.
Anthocyanin production was positively influenced by sucrose and maltose.
Fructose inhibited callus growth of both red and white cultures (Figure 3.2)
The effect of nitrates and phosphates on O. reclinata callus cultures are given
in Figures 3.3 and 3.4. Cell growth was best promoted by 1.8 mM KN03 and
2 mM NH4N03 for the white callus (Figure 3.3A). The other concentrations
resulted in far lower generation of callus biomass. Optimal white callus growth
was obtained once the phosphate level was halved from 1.24 mM KH 2P04 to
0.62 mM KH 2P0 4 • For the red callus, increasing the concentration of nitrates
had no significant effect on callus growth. Reducing the phosphate
concentration to 0.31 mM KH 2P04 in the growth medium induced greater
accumulation of anthocyanin. However, increasing the total nitrate source
promoted anthocyanin biosynthesis for the red callus but resulted in a reduction
in growth (Figure 3.4).
42
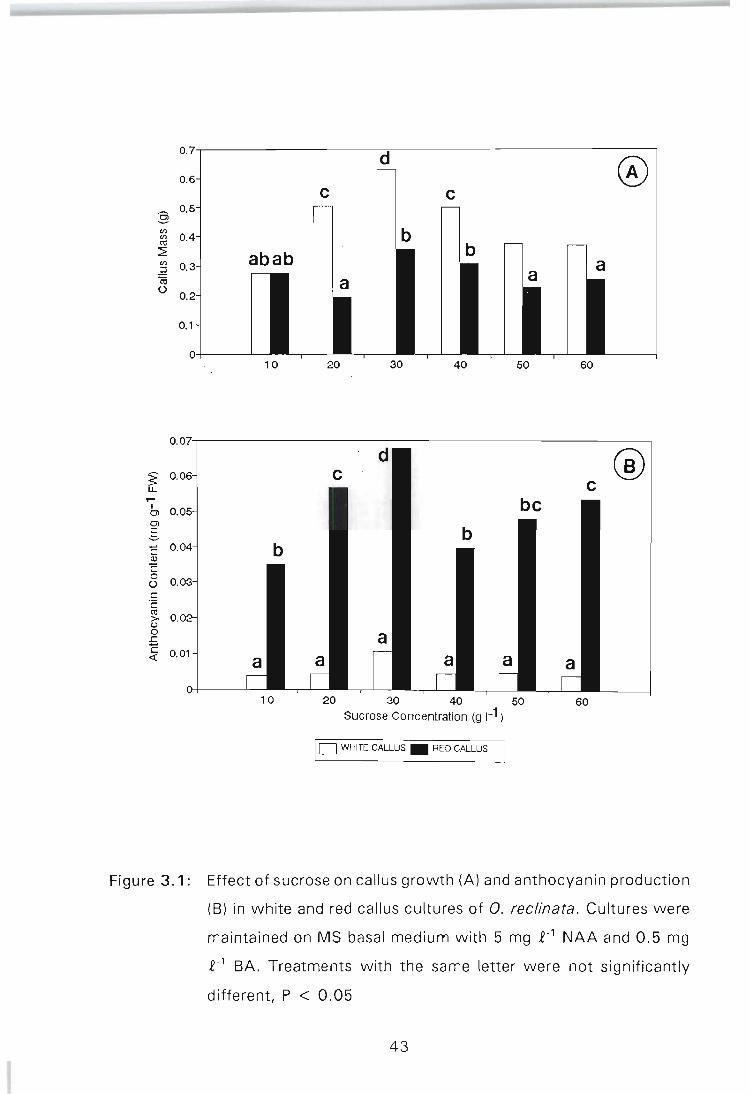
@
Ol .s. c Q)
c 0 ()
C ·C
CO >-<..l 0 .c C 0.01 «
10 20 30 40 50 60 Sucrose Concentration (g 1-1 )
I D WHITE CALLUS _ RED CALLUS
Figure 3.1: Effect of sucrose on callus growth (A) and anthocyanin production
(B) in white and red callus cultures of O. rec/inata. Cultures were
maintained on MS basal medium with 5 mg p., NAA and 0.5 mg
p., BA. Treatments with the same letter were not significantly
different, P < 0.05
43
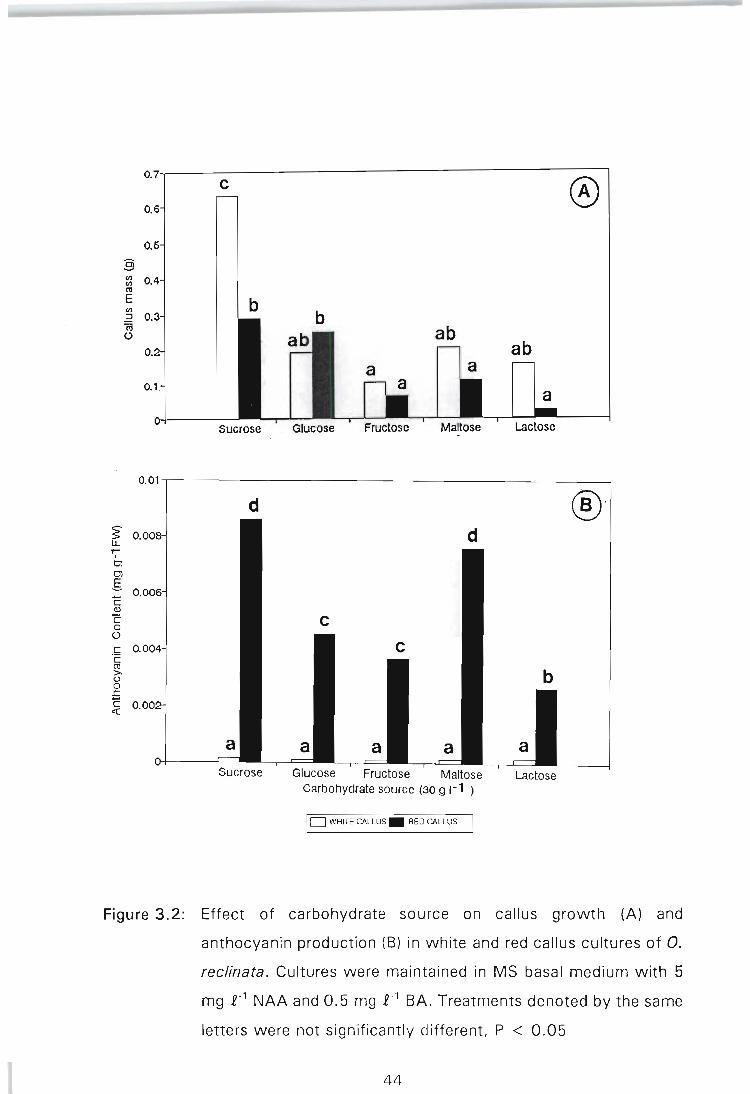
~ u. ....
I
Ol Ol .§. c Q.)
C o o
(I) (I)
<0 E (I)
:J ~ o
O.7-r----C-----------------®-A-----,
b
Sucrose Glucose Fructose Lactose
0.01~------------------------_,
d ®.
Glucose Fructose Maltose Lactose Carbohydrate source (30 g 1-1 )
I D WHITE CALLUS . RED CALLUS
Figure 3.2: Effect of carbohydrate source on callus growth (A) and
anthocyanin production (B) in white and red callus cultures of O.
reclinata. Cultures were maintained in MS basal medium with 5
mg £-1 NAA and 0.5 mg £.1 BA. Treatments denoted by the same
letters were not significantly different, P < 0.05
44

The most effective hormone on cell growth for both red and white callus with
an average of 1.4 9 and 1.9 g of callus biomass generated, respectively, was
2,4-0 (Figure 3.5). The highest anthocyanin yield (O.OOS mg g-' FW) was
obtained with medium supplemented with 1.0 mg 1-' NAA. Kinetin and IBA did
not support red callus growth. I~stead necrosis of the callus was observed and
eventually the cells died.
The requirement of Oxalis callus for light in order to produce anthocyanin is
shown in Figure 3.6. Dark-grown cultures of the white type did not produce red
pigment (Figure 3.6B). To induce anthocyanin production in white cultures, it
was necessary to illuminate these cultures with high-light (23,S pmol photons
m-2 s-') for 24 hours daily (Figure 3.60) . This resulted in production of a
heterogenous callus which was composed of anthocyanin-accumulating cells
and pigment-free cells. Red callus grown in a 24 hour high-light intensity (23,S
pmol photons m-2 s-') growth room was always richly pigmented (Figure 3.6A).
Transfer of this callus to the dark resulted in paling of the callus to a pink
colour (Figure 3.6C) and eventually complete loss of pigment. This indicated
the probable cessation of anthocyanin biosynthesis (Figure 3.7 A ii). Shifting
this dark grown red callus to the light activated anthocyanin biosynthesis as
accumulation the red pigment could be visualized (Figure 3. 7B).
Callus exposed to high-light continuously accumulated anthocyanin to the
highest quantities (O.OOS - 0.01 mg g-1 FW) (Figure 3.S). A slight reduction in
anthocyanin production was noted for red callus placed under a light-dark
illumination cycle (16-S hours respectively). Cultures placed in the dark showed
a significant reduction in anthocyanin synthesis. Red cultures placed under low
light conditions (2 pmol photons m-2 S-1) showed moderately lowered
anthocyanin levels. On the ot her hand, white cultures, grown at low-light,
hardly accumulated anthocyanins. These cultures accumulated anthocyanin to
similar levels as those cultures grown in the dark (Figure 3.SB).
45

.... I o O. 01 g C QJ
C o
C,)
0.1
c C co 0.0001 >-'-' o .r: C ~
c
b
c ® c
ab
Figure 3.3: Effect of nitrates (0) and phosphates (.) qt;1 callus growth (A)
and anthocyanin production (B) in white callus cultures of O.
reclinata. Cultures were maintained in MS basal medium with 5
mg t ·' NAA and 0.5 mg t ·' BA. Treatments denoted by the same
letters were not significantly different, P < 0.05
Key to figure: 1 /4N, 0.45 mM KN0 3 and 0.6 mM NH 4N03 ; 1 /2N, 0.9 mM KN0
3 and 1.2 mM NH4N03 ; 1 N, 1.8 mM KN0 3 and 2.4 mM NH4N03 ; 2N,
3.6 mM KN03
and 4.8 mM NH4N03 ; 1/4P, 0.312 mM KH 2P04 ; 1/2P, 0.624 mM KH 2P0 4 ; 1 P, 1.24 mM KH 2P0 4 and 2P, 1.24 mM KH 2P04.
46

o.
0.7 ® O.
§ O. '" '" C1l E o.
b '" .;2 co O. u
O.
0.1
0.01
® 0.01
~ lL. ... 0.01 b I
b 01 01 .s c O. <l)
c 0 u O. c C C1l >-
O. <..)
0 r::. C «
o.
Figure 3.4: Effect of nitrates (0) and phosphates (.) on callus growth (A)
and anthocyanin prod uction (S) of red callus cultures of O.
reclinata. Cultures were ma intained in MS basal medium with 5
mg £.1 NAA and 0.5 mg £.1 SA. Treatments denoted by the same
letters were not sign if icantly different , P < 0.05
Key to figure: 1 14N, 0.45 mM KN0 3 and 0 .6 mM NH4N0
3; 1 12N, 0.9 mM
KN0 3 and 1.2 mM NH 4N03 ; 1 N, 1.8 mM KN0 3 and 2.4 mM NH4N0
3; 2N,
3.6 mM KN0 3 and 4 .8 mM NH4N03 ; 1/4P, 0.312 mM KH2P0
4; 1/2P,
0.624 mM KH 2P04 ; 1 P, 1.24 mM KH 2P0 4 and 2P, 1.24 mM KH2P04.
4 7
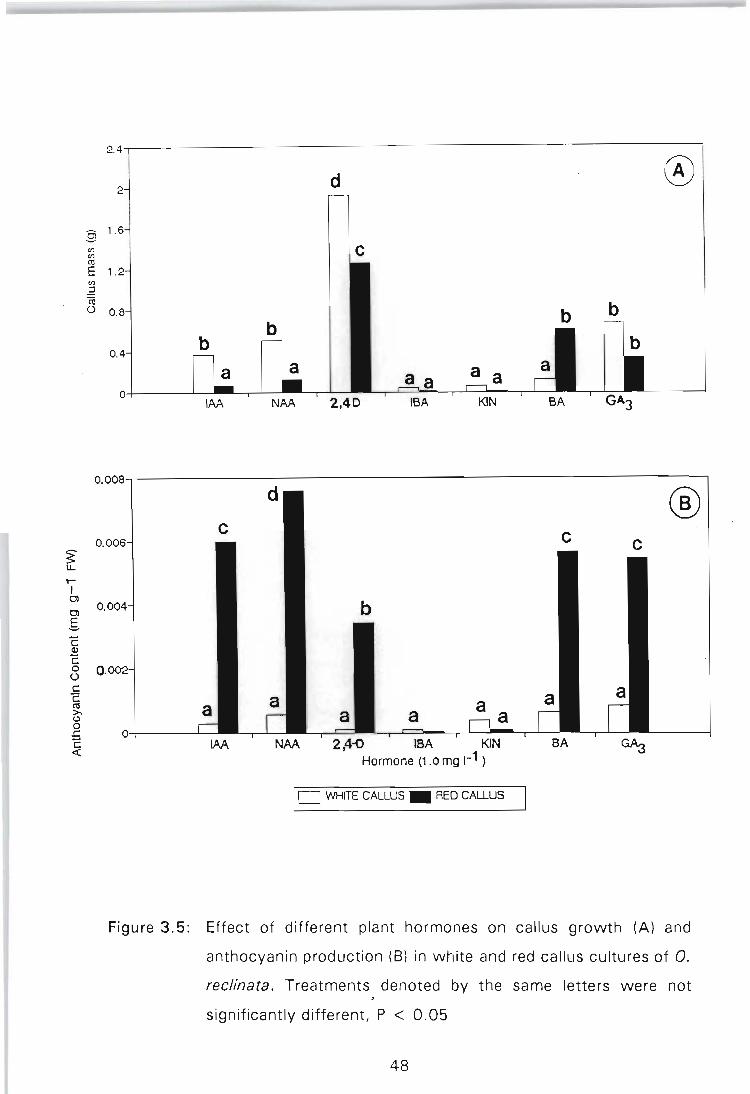
,... I 0)
0)
g c C1)
c o ()
c: C ~ (.)
o fi c: <{
2 . .1.-----------------------------1
d
~1 .9 <Il <Il co E 1. <Il
.2 ~ () O.
a a 1M NM IBA
o.ooal~----------------------------------------------------
® c
a lAA NAA 2,4-D IBA KIN
Hormone (1 .0 mg ,-1 )
I 0 'Nl-irTE CALLUS _ RED CAlLUS
Figure 3.5: Effect of different plant hormones on callus growth (A) and
anthocyanin production (B) in white and red callus cultures of O.
rec/inata. Treatments denoted by the same letters were not
significantly different, P < 0 .05
48
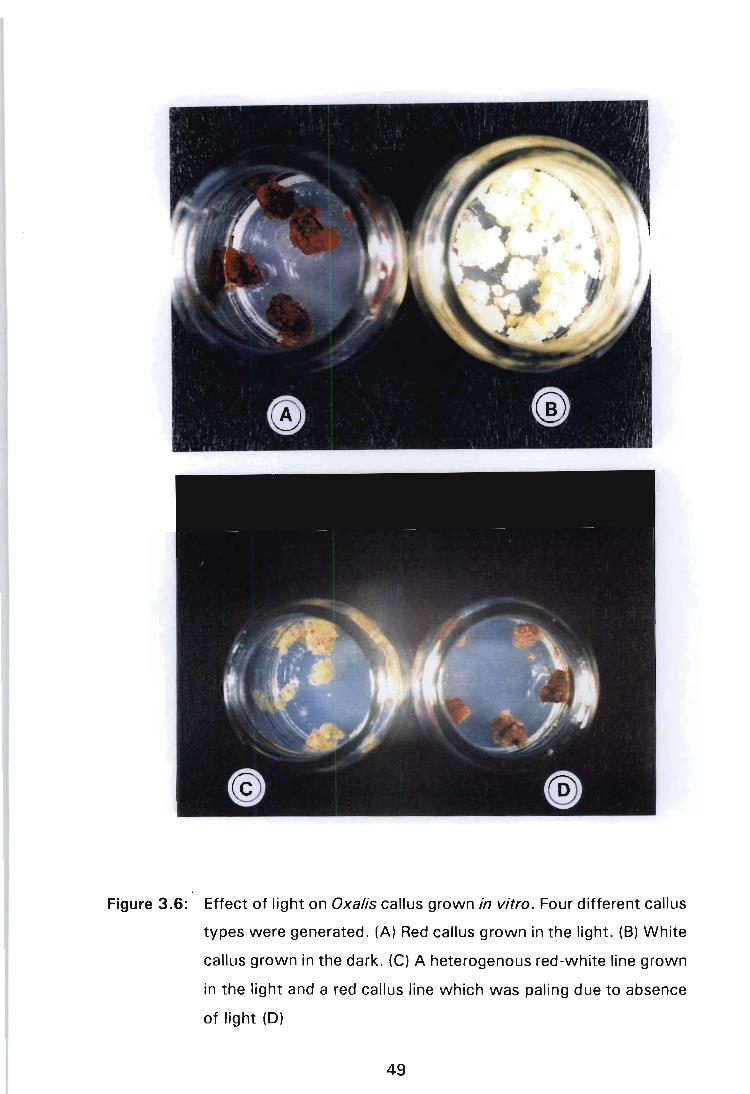
Figure 3.6: Effect of light on Oxalis callus grown in vitro. Four different callus
types were generated. (A) Red callus grown in the light. (8) White
callus grown in the dark. (C) A heterogenous red-white line grown
in the light and a red callus line which was paling due to absence
of light (0)
49
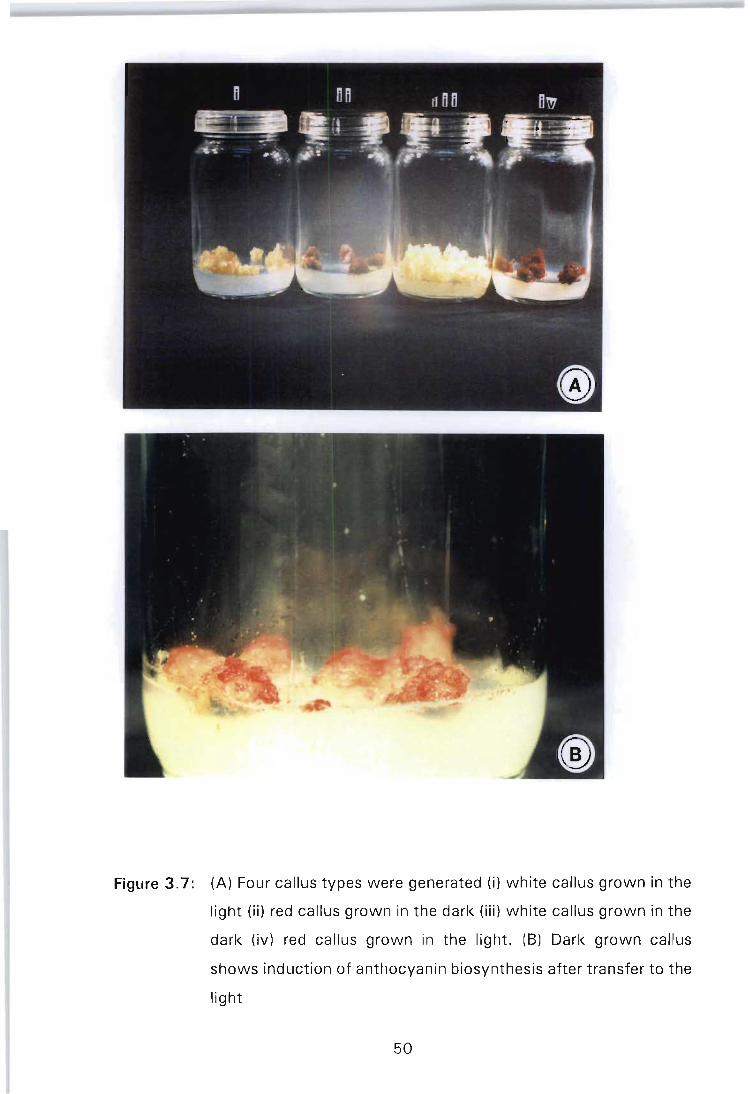
Figure 3.7: (A) Four callus types were generated (i) white callus grown in the
light (ii) red callus grown in the dark (iii) white callus grown in the
dark (iv) red cal lus grown in the light. (B) Dark grown callus
shows induction of anthocyanin biosynthesis after transfer to the
light
50
Even though light was essential for anthocyanin production, generation of
callus biomass appeared to be independent of light. Cultures of the white type
grown at high-light intensity and in the dark grew similarly. Continuously
illuminated red cultures grew slower than white Oxalis cultures exposed to the
same light conditions. Placement of red cultures in the absence of light
inhibited callus growth (Figure 3.8A). -
Production of anthocyanin was independent of temperature treatment as there
were no significant differences observed when callus was exposed to
temperatures of 10°C and to a 25°C. Red and white callus lines did not survive
at 35°C. This temperature was lethal to the callus as it became brown and
eventually died. The best temperature was apparently 25°C. At this
temperature, callus biomass generated was 0.75 g for the red callus (Figure
3.9).
51
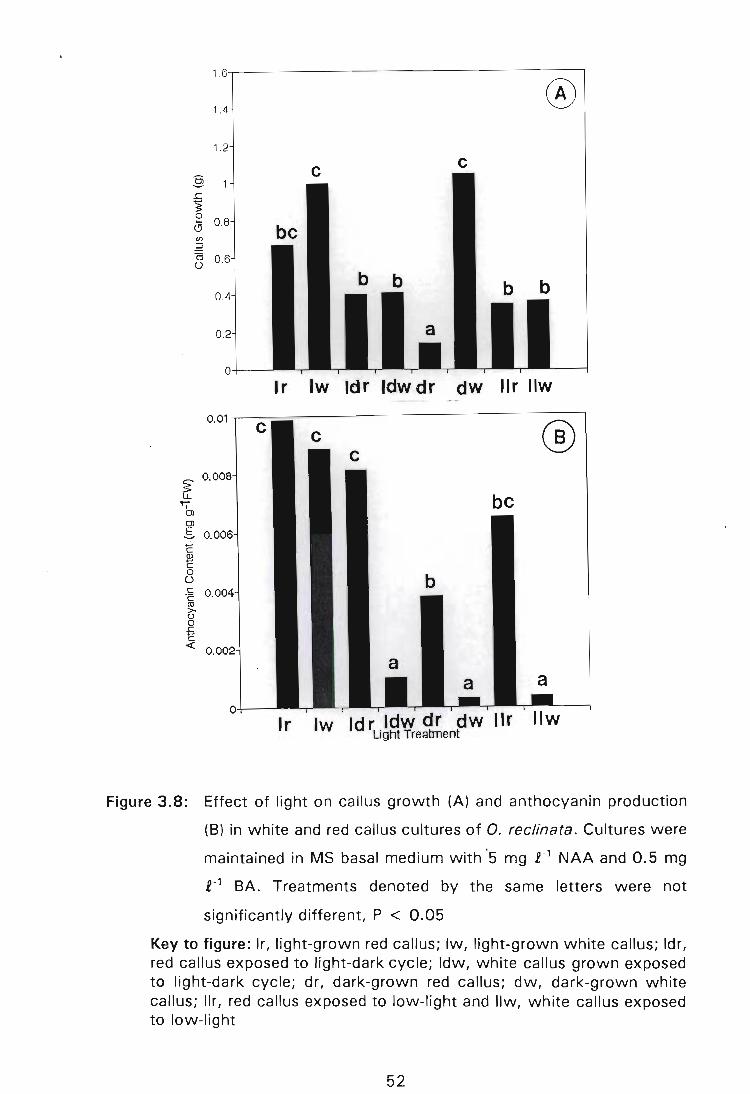
§' LL
"'i Ol
1:: Q)
c o o c
.~
>u o .c
~
1 .R.-------------------~
1.4
1.
§
~ o G O. /I)
~
8 o.
O.
O+---
Ir Iw Idr Idw dr dw IIr IIw O.01~-------------_=_1
®
Ir Iw Idr Idw dr dw Ilr Light Treatment
Figure 3.8: Effect of light on callus growth (A) and anthocyanin production
(B) in white and red callus cultures of O. reclinata. Cultures were
maintained in MS basal medium with '5 mg 1-1 NAA and 0.5 mg
1-1 BA. Treatments denoted by the same letters were not
significantly different, P < 0.05
Key to figure: Ir, light-grown red callus; Iw, light-grown white callus; Idr, red callus exposed to light-dark cycle; Idw, white callus grown exposed to light-dark cycle; dr, dark-grown red callus; dw, dark-grown white callus; IIr, red callus exposed to low-light and IIw, white callus exposed to low-light
52

1.6~----------------------------------~--,
®
3 LL
,.. I Ol Ol
:§ CIl CIl CIl
1 .
1 .
E o. CIl
~
8 o.
.s c Q)
C a 0 c 'c co >-u a -5 c -< 0.001
b
a a RED WHITE
b ®
RED WHITE Temperature (. C)
ID10.25~351
Figure 3.9:' Effect of temperature on callus growth (A) and anthocyanin
production (S) in white and red callus cultures of O. rec/inata.
Cultures were maintained in MS basal medium with 5 mg 2-1 NAA
and 0.5 mg 2-1 SA . Treatments denoted by the same letters were
not significantly different, P < 0.05
53

3.4 DISCUSSION
The anthocyanin yield is affected by cell growth and anthocyanin content. The
anthocyanin content is varied by both the amount of pigmentation in pigmented
cells and the number of pigmented callus cells in a culture (SA TO , NAKAYAMA
& SHIGETA, 1996).
Sucrose concentrations of higher than 50 g 1-' reduced cell growth and
anthocyanin production of cultured O. reclinata (Figure 3.1). It was speculated
that this effect is brought about by the higher osmotic strength affecting the
water content of the vacuole, negatively and thus, resulting in sucrose limiting
anthocyanin accumulation. For O. reclinata, the highest growth was obtained
with 20 to 40% sucrose for the white callus. This is in accordance with
previous findings as Aralia cordata cells were found to grow best on medium
supplemented with 20 to 40% sucrose. Sucrose acts as an osmotic agent
when used at high concentrations. This osmotic effect inhibited cell growth and
increased anthocyanin content in Fragaria ananassa by increasing the
percentage of pigmented cells (SATO, NAKAYAMA & SHIGETA, 1996).
Carbohydrates have been found to have a profound influence on anthocyanin
biosynthesis. Different carbohydrates were analyzed for their effect on callus
and anthocyanin accumulation in O. reclinata cultures. The best carbohydrate
source for Oxalis callus was found to be sucrose at 30 g £-'. The other
carbohydrates tested did not affect anthocyanin production and callus growth
significantly. Carbohydrates such as fructose could not support growth of
Oxalis reclinata callus.
A two-fold increase in the nitrogen source resulted in a decline in anthocyanin
production. Reducing the phosphate concentration to a quarter in comparison
to the basal medium significantly elevated levels of anthocyanin accumulated
by red callus cells (Figures 3.3 and 3.4). Depletion of nutrients is one of the
environmental factors which can induce anthocyanin synthesis in vivo in
54

tissues that generally do not accumulate these pigments. In O. reclinata callus,
decreasing the total phosphate concentration resulted in increased pigment
production for the pigmented callus. Increasing the concentration of nitrates for
the red callus had no significant effect on growth. In Oxalis, nitrates and
phosphates appear not to play a~ inductive role in anthocyanin biosynthesis as
no basic trend for accumulation of anthocyanin was identified. Accumulation
of anthocyanin due to limiting nutrients, may be due to the cessation of cell
division. Through cessation of division, the rate of protein synthesis declines
and endogenous accumulation of phenylalanine occurs. Enlargement of this
amino acid pool triggers t ranscription of mRNAs of key anthocyanin
biosynthetic enzymes, PAL and CHS. Anthocyanins are then synthesized from
phenylalanine (KAKEGAWA, SUOA, SUGIYAMA & KOMAMINE, 1995).
Controversy surrounds the effects of hormones on anthocyanin biosynthesis.
KINNERSLEY & DOUGALL (1980) reported that anthocyanin accumulation
occurred continuously in culture medium containing the auxin, 2,4-0 in carrot
cells. In most cases, 2,4-0 has been found to have an inhibitory effect on
anthocyanin production. OZEKI & KOMAMINE (1981) showed that transfer of
anthocyanin-accumulating carrot cells to medium lacking 2,4-0 resulted in
induction of anthocyanin biosynthesis which was coupled with induction of
embryogenesis. Reports on Daucus carota L. cv Korudagosun ( OZEKI &
KOMAMINE, 1986) and Oxalis reclinata (MEYER & VAN STAOEN, 1995) are
consistent with an inhibitory effect this auxin has on anthocyanin production.
This investigation showed that 2,4-0 inhibited pigment accumulation but it has
a promotive effect on callus growth for red and white callus of Oxalis. This
auxin probably increases primary metabolism in O. rec/inata cells and less
energy is then spent on secondary metabolic production of anthocyanin
pigments.
OZEKI & KOMAMINE (1986) suggested that addition of 2,4-0 resulted in
greater cell division and removal of this auxin from medium resulted in cell
55
division ceasing and the ability for cells to accumulate anthocyanin is gained.
Enzymatically, continued growth of cells in 2,4-0 containing medium results in
decreased levels of phenylpropanoid biosynthetic enzymes, PAL and 4CL.
Therefore, 2,4-0 probably acts by regulating the suppression of genes involved
in flavonoid metabolism in most,Plant species. The other auxins, IAA and NAA
had the opposite effect on anthocyanin biosynthesis as they promoted growth
in red cultures of O. reclinata at 1.0 mg £-1.
The cytokinin, BA, promoted anthocyanin production. It is well-documented
that in the intact plant, cytokinins promote secondary processes associated
with anthocyanin production (Arabidopsis thaliana: OEIKMANN & HAMMER,
1995). In cultured cells, the effect of cytokinins is not clearly defined and
presented in the literature. However, in cases where promotions occur with the
application of cytokinins, production is closely associated with the inductive
effect of light illumination and low temperatures.
Light was found to induce anthocyanin biosynthesis in O. reclinata callus cells.
Dark grown cultures of the white callus type remained pigment free. Transfer
of these cultures resulted in accumulation of pigments (Figure 3.6). High-light
intensity induces de novo synthesis of enzymes involved in the flavonoid
pathway and the spectral sensitivity for anthocyanin induction differs in
different plant systems (KOES, SPELT & MOL, 1989). Oxalis callus cultures
when grown under conditions of high-light intensity accumulated anthocyanins
to similar levels. Growth of these cultures under low-light conditions or in the
dark did not stimulate anthocyanin biosynthesis. The role played by light with
respect to anthocyanin biosynthesis in cultured plant cell systems may be
similar to the role played by these compounds in nature. Anthocyanins are
known to act as screening pigments in nature and they often accumulate in
response to UV-light. Flavonoid pigments strongly absorb UV-light and they are
thought to act as a protective shield as the UV-component of sunlight has the
potential to damage DNA and impair other physiological processes. Under
continuous UV-light transient expression of flavonoid genes occurs (KOES,
56
SPEL T & MOL, 1989). It is thought that, once sufficient flavonoids accumulate
most cells will be protected and flavonoid biosynthesis will cease (KOES,
QUATTROCCHIO & MOL, 1994).
Regarding callus growth, light does not playa significant role in O. reclinata.
Light and dark grown cultures of the white type grew to similar levels (Figure
3.8A). However, the red callus maintained under constant high-light grew
significantly slower compared to the white callus under the same conditions.
This was assigned to secondary metabolic processes which were occurring in
red callus cells. Greater energy was being spent on secondary metabolism.
Meanwhile, the white callus grew more actively as most energy was utilized
for primary metabolic processes. This, resulted in greater biomass generation.
Oxalis reclinata flowers during wet and cold winter months. Organogenesis was
achieved by incubation at 10°C using heterogenous callus composed of red,
white, yellow and green cells by CROUCH, VAN STADEN, VAN STADEN,
DREWES & MEYER (1993). This lowered temperature closely parallels the
natural growing conditions of this species. Using the relatively pure red and
white lines generated for manipulation studies in this particular investigation,
regeneration of plantlets did not occur at lower temperature. Instead, a
significant reduction in anthocyanin production was noted for the red callus.
This observation was in contrast with other reported data. In most cases, lower
temperatures have resulted in accumulation of anthocyanin and steady-state
levels of PAL and CHS have been shown to increase in response to lower
temperatures. In Oxalis, lower in vitro temperatures may have reduced primary
metabolism but did not necessarily result in increased secondary metabolic
activity.
OZEKI & KOMAMINE (1985b) and OZEKI, KOMAMINE & TANAKA (1990)
regarded anthocyanin product ion as a form of 'metabolic differentiation' and
they perceived the expression of secondary metabolism to be closely paralleled
with morphological differentiation since secondary metabolism is expressed in
57
differentiated organs and tissues during specific developmental stages in vivo.
In vitro, production of anthocyanin was achieved by these researchers with the
induction of embryogenesis in carrot suspension cells. In Oxalis reclinata, no
morphological differentiation was achieved at either growth temperatures with
the pure red and white lines, even though the red callus may be regarded as
being differentiated metabolically. To .be able to produce organs from this
callus, it appears necessary to generate green callus. CROUCH & VAN STADEN
(1994) found that incubation of a mixture of red, yellow and green callus of
Oxalis resulted in organogenesis at 10°C. White or yellow callus has the
potential to become red. The yellow callus most probably contains chalcones
which are precursors for synthesis of anthocyanins.
58
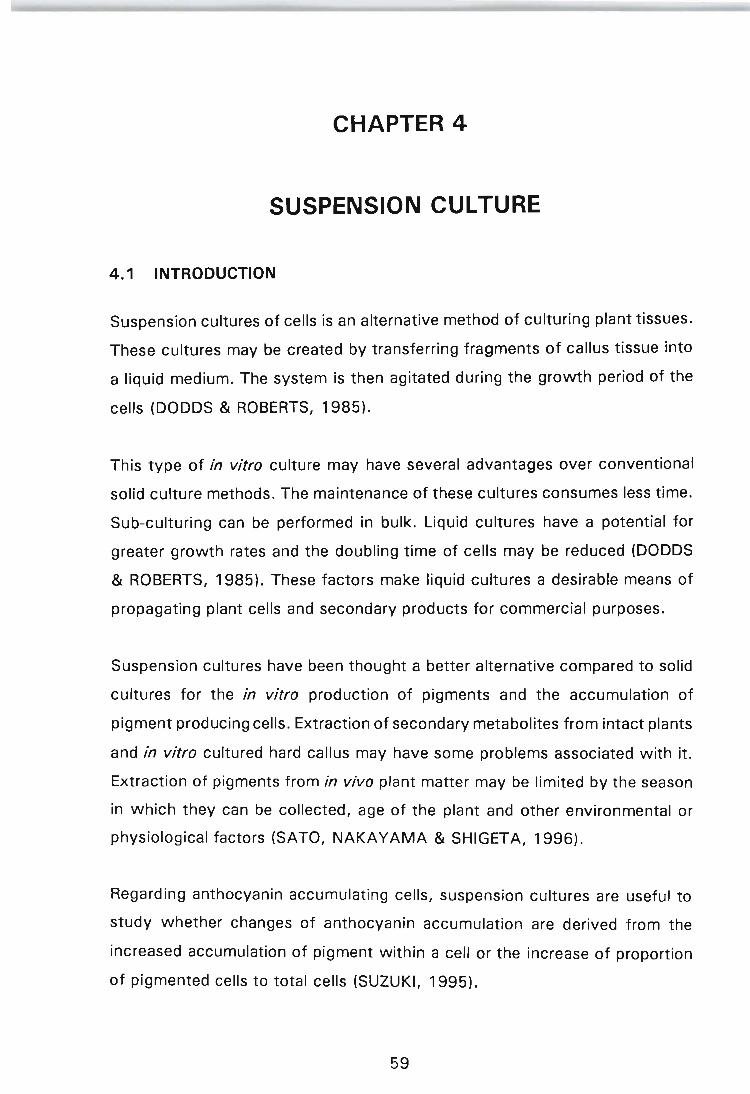
CHAPTER 4
SUSPENSION CULTURE
4.1 INTRODUCTION
Suspension cultures of cells is an alternative method of culturing plant tissues.
These cultures may be created by transferring fragments of callus tissue into
a liquid medium. The system is then agitated during the growth period of the
cells (DODDS & ROBERTS, 1985).
This type of in vitro culture may have several advantages over conventional
solid culture methods. The maintenance of these cultures consumes less time.
Sub-culturing can be performed in bulk. Liquid cultures have a potential for
greater growth rates and the doubling time of cells may be reduced (DODDS
& ROBERTS, 1985). These factors make liquid cultures a desirable means of
propagating plant cells and secondary products for commercial purposes.
Suspension cultures have been thought a better alternative compared to solid
cultures for the in vitro production of pigments and the accumulation of
pigment producing cells. Extraction of secondary metabolites from intact plants
and in vitro cultured hard callus may have some problems associated with it.
Extraction of pigments from in vivo plant matter may be limited by the season
in which they can be collected, age of the plant and other environmental or
physiological factors (SATO, NAKAYAMA & SHIGETA, 1996).
Regarding anthocyanin accumulating cells, suspension cultures are useful to
study whether changes of anthocyanin accumulation are derived from the
increased accumulation of pigment within a cell or the increase of proportion
of pigmented cells to total cells (SUZUKI, 1995).
59

In this study, it was seen necessary to elucidate whether the establishment of
suspension cultures for Oxalis callus can be achieved and whether the
maintenance of pigment production by the red cells of O. reclinata can be
carried out once the liquid suspension culture had been established. Cells which
have the ability to produce anthocyanin may often lose this quality due to a
change in environmental and growth conditions. For commercial purposes, it
is more economically viable to produce anthocyanin using liquid cultures.
4.2 MATERIALS AND METHODS
4.2.1 Plant material, initiation media and culture conditions
Suspension cultures were initiated from red and white callus stocks of O.
reclinata. Diced callus (3 g) was used to inoculate MS medium (MURASHIGE
& SKOOG, 1962) supplemented with 0.5 mg 1-' SA, 5 -mg 1-' NAA, 30 g
sucrose and 0.1 g 1-' myo-inositol without the addition of agar at pH 5.7. This
medium was similar to that" used for solid culture, except that the agar
component was omitted. The suspension cultures were initiated in 500 ml
sterile flasks containing 100 ml of autoclaved liquid medium, which were
sealed with a cotton wool bung and covered with a tinfoil cap. They were
placed on a rotary shaker and shaken at 120 revolutions per minute (rpm).
Cultures were grown at 22°C in continuous cool white fluorescent light (24.5
pmol photons m-2 so,). Once the cultures were established, subculturing was
performed as required by the white lines (3 - 4 weeks) and red lines (1 - 2
weeks).
4.2.2 Data collection for cell growth studies
Cell growth curves were determined for both types of callus lines. The settled
cell volume (SCV) was used to measure growth. This value represents the
proportion of cell aggregates settled out after 10 minutes in the side-arm of
culture vessels. Side-arm flasks (500 ml) were suspended so that the angle of
the flask arm was perpendicu lar for a period of five minutes in order to settle
60
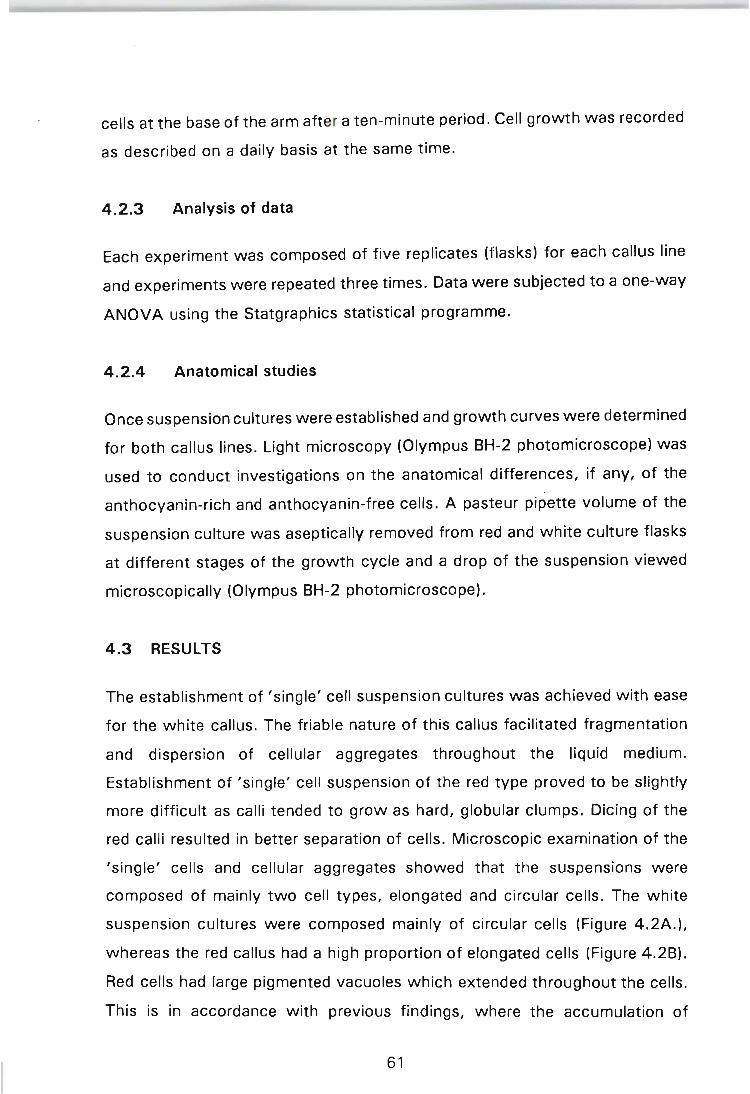
cells at the base of the arm after a ten-minute period. Cell growth was recorded
as described on a daily basis at the same time.
4.2.3 Analysis of data
Each experiment was composed of five replicates (flasks) for each callus line
and experiments were repeated three times. Data were subjected to a one-way
ANOVA using the Statgraphics statistical programme.
4.2.4 Anatomical studies
Once suspension cultures were established and growth curves were determined
for both callus lines. Light microscopy (Olympus BH-2 photomicroscope) was
used to conduct investigations on the anatomical differences, if any, of the
anthocyanin-rich and anthocyanin-free cells. A pasteur pipette volume of the
suspension culture was aseptically removed from red and white culture flasks
at different stages of the growth cycle and a drop of the suspension viewed
microscopically (Olympus BH-2 photomicroscope).
4.3 RESULTS
The establishment of 'single' cell suspension cultures was achieved with ease
for the white callus. The friab le nature of this callus facilitated fragmentation
and dispersion of cellular aggregates throughout the liquid medium.
Establishment of 'single' cell suspension of the red type proved to be slightly
more difficult as calli tended to grow as hard, globular clumps. Dicing of the
red calli resulted in better separation of cells. Microscopic examination of the
'single' cells and cellular aggregates showed that the suspensions were
composed of mainly two cell types, elongated and circular cells. The white
suspension cultures were composed mainly of circular cells (Figure 4.2A.),
whereas the red callus had a high proportion of elongated cells (Figure 4.28).
Red cells had large pigmented vacuoles which extended throughout the cells.
This is in accordance with previous findings, where the accumulation of
61
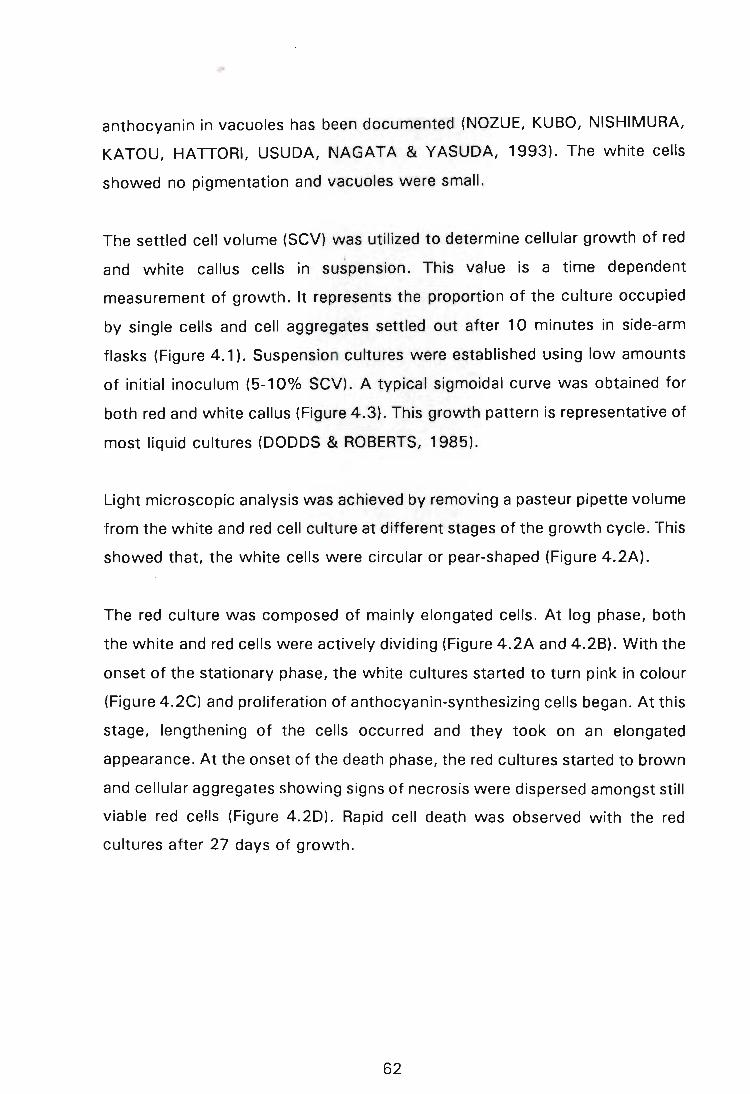
anthocyanin in vacuoles has been documented (NOlUE, KUBO, NISHIMURA,
KATOU, HATTORI, USUDA, NAGATA & YASUDA, 1993). The white cells
showed no pigmentation and vacuoles were small.
The settled cell volume (SCV) was utilized to determine cellular growth of red
and white callus cells in suspension. This value is a time dependent
measurement of growth. It represents the proportion of the culture occupied
by single cells and cell aggregates settled out after 10 minutes in side-arm
flasks (Figure 4.1). Suspension cultures were established using low amounts
of initial inoculum (5-10% SCV). A typical sigmoidal curve was obtained for
both red and white callus (Figure 4.3). This growth pattern is representative of
most liquid cultures (DODDS & ROBERTS, 1985).
light microscopic analysis was achieved by removing a pasteur pipette volume
from the white and red cell culture at different stages of the growth cycle. This
showed that, the white cells were circular or pear-shaped (Figure 4.2A).
The red culture was composed of mainly elongated cells. At log phase, both
the white and red cells were actively dividing (Figure 4.2A and 4.2B). With the
onset of the stationary phase, the white cultures started to turn pink in colour
(Figure 4.2C) and proliferation of anthocyanin-synthesizing cells began. At this
stage, lengthening of the cells occurred and they took on an elongated
appearance. At the onset of the death phase, the red cultures started to brown
and cellular aggregates showing signs of necrosis were dispersed amongst still
viable red cells (Figure 4.20). Rapid cell death was observed with the red
cultures after 27 days of growth.
62
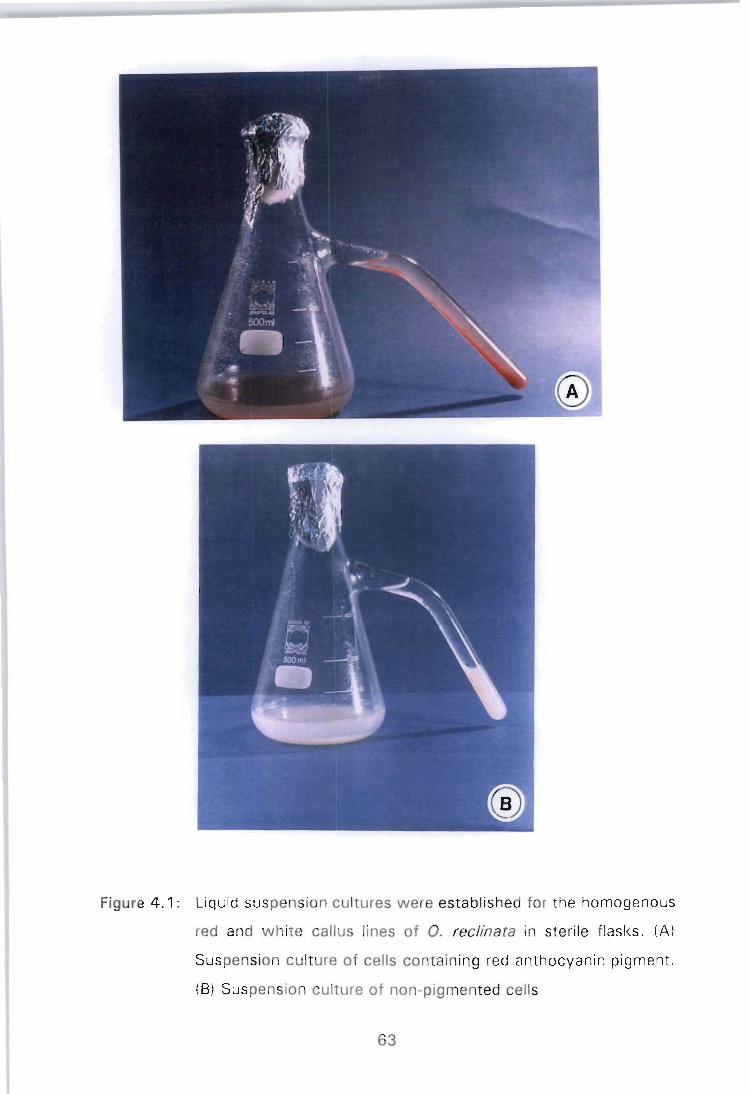
Figure 4.1: 'Liquid suspension cultures were established for the homogenous
red and white callus lines of O. reclinata in sterile flasks. (A)
Suspension culture of cells containing red anthocyanin pigment.
(8) Suspension culture of non-pigmented cells
63
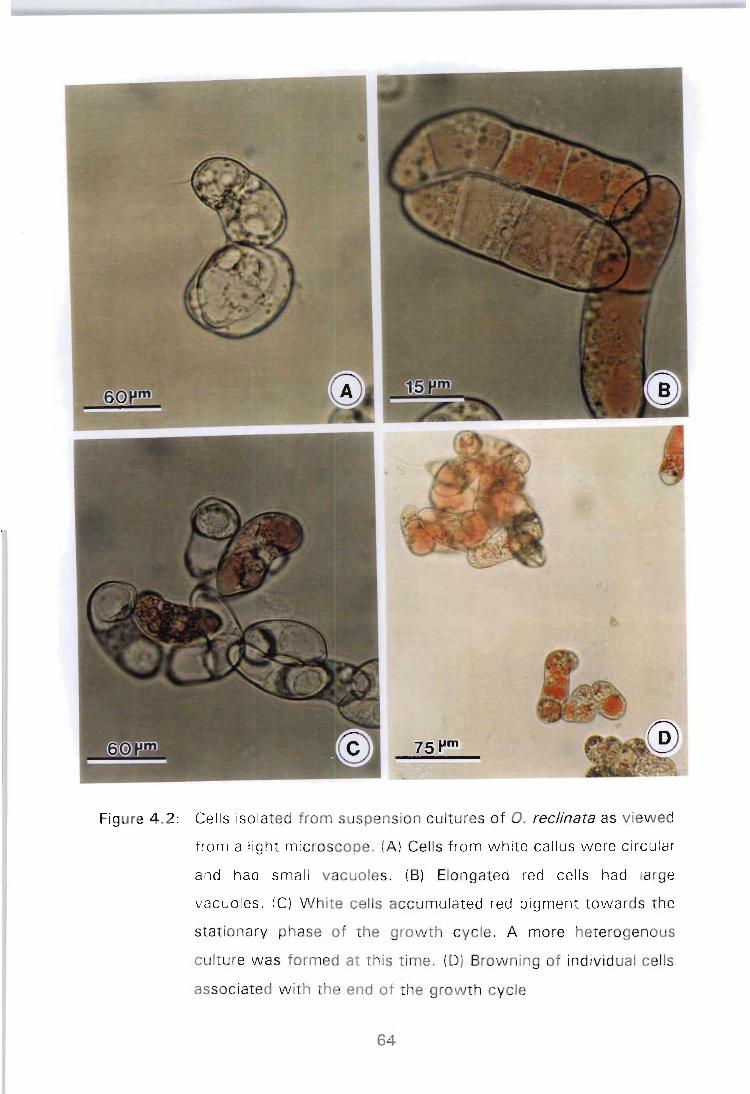
75t'm
Figure 4.2: Cells isolated from suspension cultu res of O. reclinata as viewed
from a light microscope. (A) Cells from white callus were circular
and had small vacuoles . (B) Elongated red cells had large
vacuoles. (C) Wh ite cells accumulated red pigment towards the
stationary phase of the growth cycle . A more heterogenous
culture was formed at this time. (0) Browning of individual cells
associated with the end of the growth cycle
64
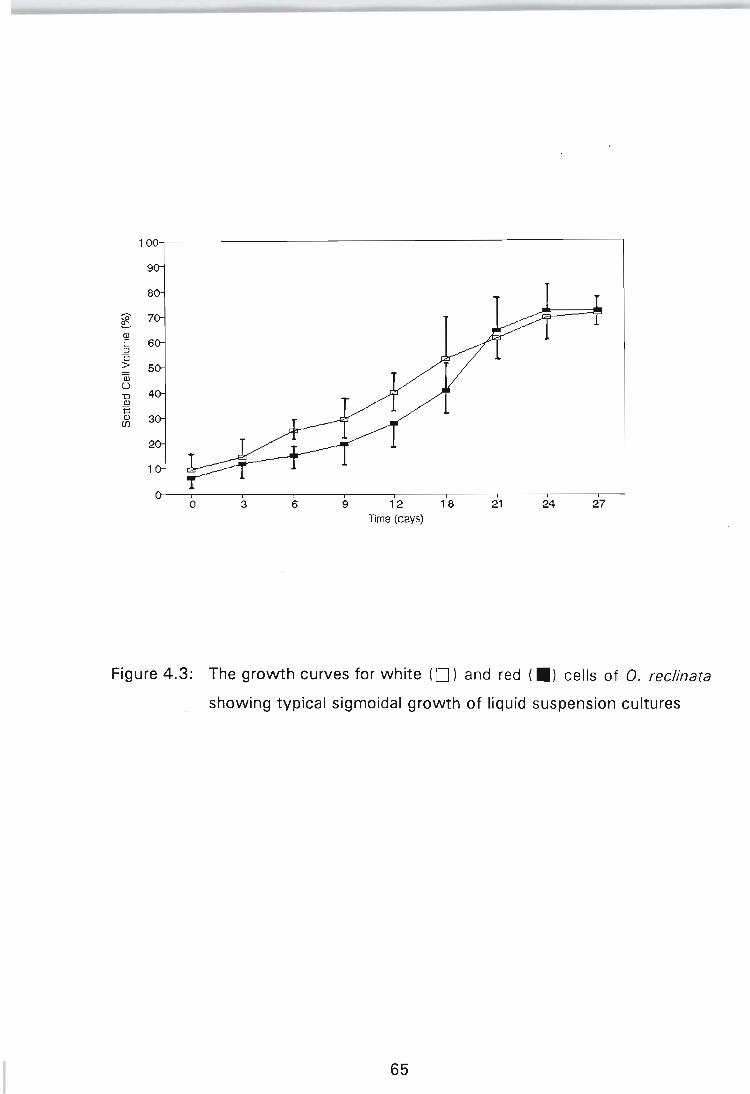
l Q)
E :J (5 > Qj o "0 Q)
B Q)
(JJ
1001~----------------------------------------------~
o 3 6 9 12 Time (days)
18 21 24 27
Figure 4.3: The growth curves for white (D) and red (.) cells of O. reclinata
showing typical sigmoidal growth of liquid suspension cultures
65

4.4 DISCUSSION
Oxalis reclinata white and red callus responded favourably to the transfer from
solid medium to liquid medium. Establishment of 'good' or 'ideal' suspension
cultures was achieved for both red and white callus. According to DODDS &
ROBERTS (1985) 'good' suspension cultures are those that contain a high
number of single cells and small cell clusters. Both red and white cell
suspension cultures had a high number of single cells. However, the red
cultures had a higher percentage of clustered cells when compared with the
white callus (Figure 4.3).
Initiation of suspension cultures requires a large amount of inoculum (DODDS
& ROBERTS, 1985). The initial inoculum to establish cell suspension cultures
for Oxalis was 30% (v/v). The growth cycle of these cult\)res was short and
they required constant subculturing. Using pre-conditioned cultures, lower
levels of inoculum were required to determine the growth response of red and
white cells of Oxalis in suspension media. Sigmoidal growth curves constructed
from the SCV for both red and white cell types (Figure 4.2) showed that, the
white callus had a shorter lag phase compared to the red cells. The lag phase
was a three day period for the white cells, whereas exponential growth for the
red callus began after six days. The lag phase represents the stage where no
apparent cell division occurs. Cell growth is characterized by a growth in size
rather than in cell number through division. An exponential rise in cell number
occurs after a lag period . Linear growth, representing an increase in the cell
population for both red and white cell types was evident from day nine to 18
after subculturing. Levelling off of the growth curve (indicative of the stationary
phase) was noted after 18 days for the white suspension cultures. The red
cells grew for a longer period as they only reached the stationary phase after
21 days. The red and white cells had reached the same cell density
(approximately 55% SCV) before the white cells went into the stationary
phase. The red cells in suspension proceeded to accumulate in number and the
cell density increased to 65% SCV. On solidified medium, the white callus
66
generated greater amounts of biomass compared the red callus. This may be
due to red callus being inhibited by contaminants which are released by the
agar into the culture environment as well as phenolic compounds which are
secreted from the callus towards the end of the growth phase. Accumulation
of such contaminants has been reported in agar-solidified media. In a liquid
medium such problems are not encountered (DODDS & ROBERTS, 1985).
Light microscopic analysis of t he red and white cells showed that anthocyanin
accumulation occurs within the vacuole. The vacuole has previously been
shown to be the main organelle for accumulation of many flavonoid
compounds . Intensely pigmented vacuolar structures termed' anthocyanoplasts'
have been · observed using light and electron microscopy. Their function and
their mechanism of formation are not yet known (NOZUE, KUBO, NISHIMURA,
KATOU, HATTORI, USUDA, NAGATA & YASUDA, 1993).
Expression of secondary metabolism is closely related with cell growth and
differentiation. In cultured cells, maximal accumulation of secondary
metabolites is observed during stationary phase. Therefore, accumulation of
anthocyanin coincides with cessation of cell growth (KAKEGAWA, SUDA,
SUGIYAMA & KOMAMINE (1995). White cells of O. reclinata were circular and
accumulated little or no pigment (Figure 4.2B) during the lag or log phases.
Coloured cells were observed at the stationary phase when cell division was
reduced. KAKEGAWA, SUDA, SUGIYAMA & KOMAMINE (1995) suggested
that high levels of phenylalanine accumulated as cell division declined in grape
suspension cultures. Phenylalanine may act as a signal promoting transcription
of anthocyanin biosynthetic genes.
Establishment of suspension cultures was achieved with ease for O. reclinata.
Therefore, liquid cultures are a viable means of propagating red pigmented cells
of O. reclinata for use in the food industry.
67
CHAPTER 5
PROTEIN STUDIES ON ANTHOCYANIN
PRODUCTION
5.1 INTRODUCTION
In the past, analysis of molecular events resulting from changes made to
increase secondary product formation, was often limited to measurements of
end product accumulation. End product based studies do not reveal the total
attainable capacity for secondary metabolite production. This approach is
undoubtably valuable for preliminary optimisation of plant tissue culture
conditions, but it overlooks endogenous regulatory controlling mechanisms of
secondary metabolism. Therefore, it is necessary to ascertain the factors that
control enzymic activity both in vitro and in vivo. It is important to elucidate the
effect of positive and negative effectors on transcription, translation and post
translational modification (DIXON & BOLWELL, 1986).
The two molecular techniques employed to analyze results obtained during the
tissue culture of O. reclinata were:
1) Two-dimensional polyacrylamide gel electrophoresis (2D-PAGE) of
proteins, and
2) In vitro translation.
The use of two-dimensional polyacrylamide gel electrophoresis (2D-PAGE) is
unmatched in its ability to resolve proteins and polypeptides in complex protein
mixtures (O'FARRELL, 1975). The method based on that of O'FARRELL (1975)
using denaturing conditions increases protein resolution capacity. Its
68

adaptability to a wide variety of samples with differing solubility properties is
commendable when compared to previously attempted separations under non
denaturing conditions. Two-dimensional electrophoresis under non-denaturing
conditions is limited to the analysis of soluble proteins (DUNN & PATEL, 1987).
Two-dimensional electrophoresis has become one of the most powerful tools
for the separation and quantification of proteins from complex mixtures. It
employs separation of proteins according to two different parameters:
isoelectric point and molecular weight (POLLARD, 1984). The method first
involves the separation of proteins according to their isoelectric points, by
isoelectric focusing in a first dimensional tube gel. This is followed by a
separation according to protein molecular weight in a second dimensional gel
using a sodium dodecyl sulphate (SDS) slab gel. The power of the method
arises from the combination of high resolution (first gel) with a high separation
capacity (second gel). The method is relatively fast and easy to carry out once
the technique is optimised (BAUW, VAN MONTAGU & INZE, 1992). It has
been used extensively to study proteins whose expression is changed by
external stimuli or which are developmentally regulated. The technique allows
for several gene products to be shown simultaneously. For this reason, the
technique is effective in studying changes in genome expression (BAUW, VAN
MONTAGU & INZE, 1992).
This method has been widely used in the analysis of proteins from bacteria,
several animal systems, insects, nematodes and fungi. The use of 2D-PAGE,
in the past, has often been restricted to non-pigmented plant tissues such as
seeds and hypocotyls. Pigmented tissue extracts pose several problems
because they contain phenolic compounds which can interact with proteins and
nucleic acids and change their characterist ics. Electrophoresis of proteins from
extracts that are not treated to remove the pigments and other phenolic
compounds give unreliable results (HARI, 1981).
Phenolic compounds interact with proteins to form insoluble complexes which
interfere with conventional assays for proteins. Proanthocyanidin-protein
69

interactions result in insoluble complexes being formed. These interactions
result in a irreversible precipitation step of the insoluble complex during protein
extraction procedures (HAGERMAN & BUTLER, 1981). According to LOOMIS
(1974) the reaction of phenolics with proteins falls into four main classes:
1) Hydrogen bonding: isolated phenolic hydroxyl groups form very strong
hydrogen bonds with the oxygen atoms of peptide bonds. This is one of
the strongest hydrogen bonds known, and cannot be broken by
conventional techniques, namely, dialysis or gel filtration;
2) Browning (oxidation) reactions in plant tissues and extracts is principally
caused by quinone oxidation which is then followed by covalent
coupling reactions or protein functional groups being oxidised by the
quinone. Quinones are known to be powerful oxidising agents. They
have a tendency to polymerise and condense readily with reactive
groups of proteins through -SH and -NH2 groups;
3) Ionic interactions: phenolic hydroxyl groups in general have pKa values
of 8.45 or higher. At higher pH's they may form salt linkages with the
basic amino acid residues of proteins. Plant phenolic compounds of the
phenylpropanoid group contain carboxyl groups as well, and may be
negatively charged even at a neutral pH or below; and
4) Hydrophobic interactions: phenolic compounds possess hydrophobic
aromatic ring structures which have an affinity for other hydrophobic
compounds. Phenolic compounds may interact with hydrophobic regions
of proteins.
When isolating proteins from plant tissues that are rich in phenolic compounds
and other secondary products, removal of these compounds before formation
of covalent complexes is necessary. This is best accomplished by the addition
70
of adsorbents or protective agents that compete with reactive phenolics.
Prevention of phenolic oxidation must be maintained simultaneously.
Polyphenols may be removed from crude plant extracts by complexing with
polyvinylpyrrolidone (PVP) or at times by gel filtration. The insoluble form of
PVP, termed polyvinlypoly pyrrolidone (PVPP) may be added to the extraction
buffer and hydrated. The phenolic adsorbent, PVPP, (1.5% [w/v]) is usually
used to inactivate polyphenols (GEGENHEIMER, 1990). Polyvinylpyrrolidone
bears some structural resemblance to proline. Proline has a pyrrolidine ring
which resembles the heterocyclic vinyl pyrrolidine subunits of PVP. Proteins
with high proline contents have been shown to have a higher affinity for
flavonoid compounds (HAGERMAN & BUTLER, 1981). Polyvinlypoly
pyrrolidone has strong binding ability to polyphenolics through its CO-N =
group. The phenolic adsorbent (PVPP) has been shown to bind compounds with
free aromatic hydroxyl groups and as the number of aromatic groups increases,
PVPP binding capacity increases (WANG & VODKIN, 1994). For plant tissue
extracts with high levels of procyanidins and other phenolic substances,
addition of other polyphenol-binding agents (0.2 M sodium tetra borate) or
antioxidants to inhibit phenol oxidase activity, such as 0.25 M sodium
carbamate, 0.02 M sodium meta bisulfite, may prevent formation of insoluble
protein-phenolic complexes (GEGENHEIMER, 1990).
Secondary phenolic compounds can interact with RNA and DNA. Therefore, it
is necessary to inactivate polyphenolics or to prevent interactions of phenolics
with nucleic acids. TODD & VODKIN (1993) showed the ability of a
dihydroxylated proanthocyanidin to bind to both proteins and RNA. Association
of phenolics with nucleic acids and proteins results in changed electrophoretic
mobility and a changed absorption spectra in these compounds (WANG &
VODKIN, 1994).
Polypeptide differences between red and white tissue callus cultures of O.
reclinata were investigated using two-dimensional electrophoresis. This study
71
was undertaken with the hope of acquiring greater insight into the molecular
mechanisms involved in the control of anthocyanin biosynthesis.
5.2 MATERIALS AND METHODS
5.2.1 Reagents
All chemicals used were purchased from BDH Chemicals Ltd, Poole England;
Oxoid Unipath Ltd, England; Unilab, Saarchem, Ltd, South Africa; Boehringer
Mannheim, Johannesburg, South Africa; Merck Darmdstadt, Germany; Sigma
Chemical Co., U.S.A. and Kleber Chemicals Ltd, South Africa. Ampholytes
were purchased from Pharmacia for iso-electric focusing.
5.2.2 Plant material
Oxalis reclinata anthocyanin-containing callus and non-pigmented callus were
generated using the methods described by CROUCH, VAN ST ADEN, VAN
STADEN, DREWES & MEYER (1993). The two main callus lines (light-grown
red and dark-grown white callus, simply referred to as red and white) were
maintained on MURASHIGE & SKOOG (1962) medium (MS) (0.8% agar [w/v];
pH 5.8) supplemented with 5 mg i -1 NAA, 0.5 mg i -1 BA, 30 g 1-1 sucrose and
0.1 g i-1 myo-inositol. Stocks were subcultured at four-weekly intervals.
5.2.3 Protein isolation
Four methods were used in an attempt to isolate intact proteins from
pigmented Oxalis tissues. Protein was isolated from the four callus types
generated (Section 3.2.1). One gram of callus was ground to a fine powder
with liquid N2 in a pre-cooled mortar and pestle. Proteins were extracted with
4 m1 of 200 mM potassium phosphate buffer (KPi, pH 6.8) containing 2 mM
2-men;aptoethanol and 40 mM ascorbic acid. The protease inhibitors included
in the extraction buffer were 1 mM ethylene diamine tetra-acetic acid (EDTA)
and 1 mM phenylmethylsulfonyl fluoride (PMSF). The samples were centrifuged
72
at 10 000 rpm (SS-34 rotor head, Sorvall RC-5 Superspeed Centrifuge) for 20
minutes. The supernatant was collected and proteins were precipitated
overnight at _20DC with an excess amount of pre-chilled acetone. The proteins
were recovered by centrifugation at 12 000 rpm for 10 minutes in a microfuge
(Sigma-113). The Biorad Protein Assay modified from the original BRADFORD
(1976) assay was used to quantify total protein.
No measurable amounts of protein were recovered with this method from the
red callus. A second method was attempted and proteins were extracted from
O. reclinata callus with a buffer containing 200 mM potassium phosphate (pH
6.8), 50 mM NaCI, 1 mM PMSF, 1 mM EDTA, and 14 mM 2-men;aptoethanol.
The buffer to sample ratio was 1 : 1 (v/w). The extracts were incubated with
2 mg mi-' protamine sulfate for 10 minutes at room temperature on an orbital
gyratory shaker and were shaken gently at 80 rpm at room temperature.
Samples were then centrifuged for 20 minutes at 10 000 rpm (SS-34 rotor
head, RC-5 Sorvall Centrifuge) to remove cell debris. The pellets were
discarded and the supernatants were chromatographed through a Sephadex G-
25 column to monitor colour and protein separation (GLEITZ & SEITZ, 1989).
Fractions of 500 pi were collected and spectrophotometrical readings then
taken at 260 and 280 nm. The fractions were collectively assayed using the
Biorad Protein Assay modified from BRADFORD (1976). Extracted proteins
were electrophoresed on polyacrylamide gels (Section 5.2.5).
A third method was also used for protein extraction. Callus (1 g) was ground
in 0.1 g PVPP in the presence of liquid N2 to a fine powder and homogenised
in 4 mi extraction buffer (0.1 M potassium phosphate, pH 6.8), 1.4 mM 2-
mer<;aptoethanol, 40 mM ascorbic acid, 3 mM EDTA, 0.2 M PMSF and 10%
glycerol (v/v). Protamine sulfate (2 mg mi-') was added and the samples were
shaken gently for 10 minutes at room temperature followed by 20 minutes
centrifugation at 14 000 rpm (SS-34 rotor head, RC-5 Sorvall Centrifuge).
Proteins were measured using the Biorad Protein Assay with modifications to
the BRADFORD (1976) method.
73
Proteins were successfully isolated from red and white calls of O. reclinata
when the effect of proanthocyanidins on proteins was minimized The phenolic
adsorbent, PVPP (1.5% [w/v]) was incubated overnight in extraction buffer at
4°C. The extraction buffer (0.1 M potassium phosphate [pH 6.8]), 1.4 mM 2-
mer<;aptoethanol, 40 mM ascorbic acid, 3 mM EOTA, 0.2 M PMSF and 10%
glycerol lv/v]) was modified to include sodium salts, namely, 20 mM sodium
diethyl-dithiocarbamate, 20 mM sodium metabisulphite, and 200 mM sodium
tetraborate. These sodium salts were included to adsorb phenolic compounds
and to inhibit phenol oxidase activity. Callus (1 g) from light-grown red callus
and dark-grown white callus was extracted by grinding to a fine powder in
liquid N2 in a pre-cooled mortar and pestle. Five millimolar dithiothreitol (OTT)
and 1.4 mM mer<;aptoethanol were compared as reductants. Oue to OTT
proving to be a better reducing agent, all subsequent protein isolations were
performed using 5 mM OTT.
5.2.4 The effect of anthocyanins on proteins
An experiment was conducted to determine the effect of anthocyan ins on the
isolation of total protein. At first, proteins were extracted from dark-grown
white callus, dark-grown red callus, light-grown white callus and light-grown
red callus using 4 mi extraction buffer (0.1 M potassium phosphate [pH 6.8],
1.4 mM 2-mer<;aptoethanol, 40 mM ascorbic acid, 3 mM EOTA, 0.2 M PMSF
and 10% glycerol [v/v]). Secondly, proteins were extracted from a mixture of
light-grown red callus and dark-grown white callus (1: 1; w/w). Bovine serum
albumin (10 mg) and 1 g of light-grown red callus were placed in a mortar and
pestle, and proteins isolated from this mixture. Protein extractions in the
presence of 1.5% PVPP were also performed from dark-grown white and light
grown red callus types. Extracted proteins were quantified and electrophoresed
using a one-dimensional polyacrylamide gel.
74
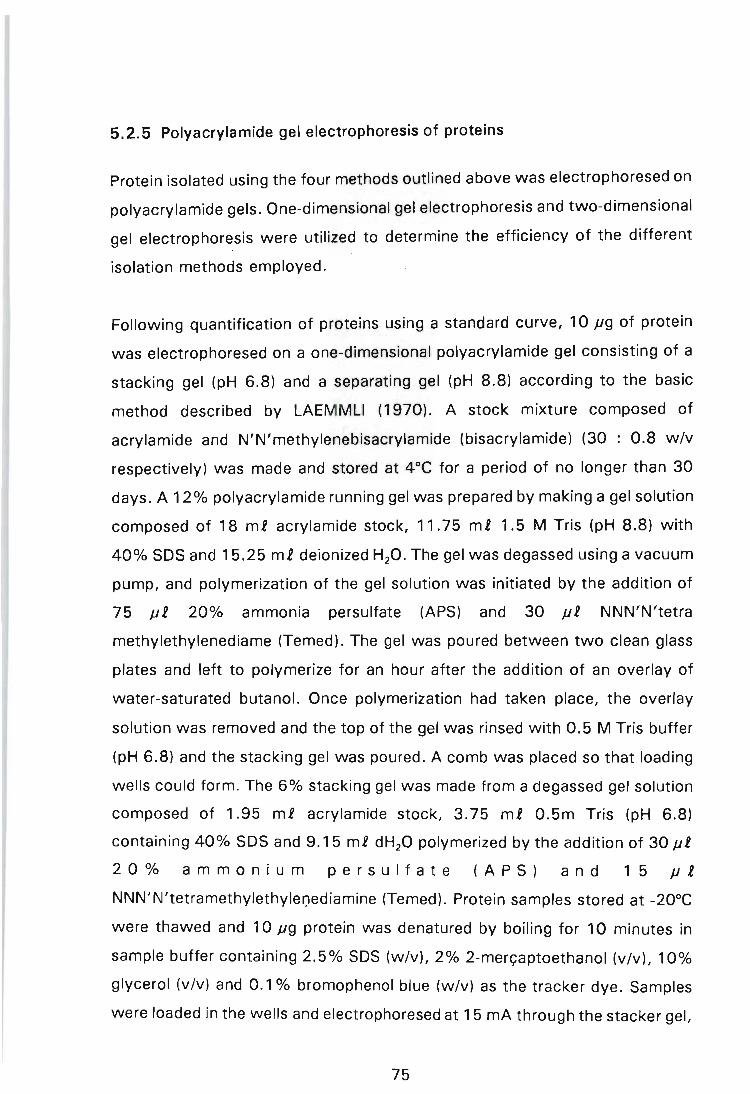
5.2.5 Polyacrylamide gel electrophoresis of proteins
Protein isolated using the four methods outlined above was electrophoresed on
polyacrylamide gels. One-dimensional gel electrophoresis and two-dimensional
gel electrophoresis were utilized to determine the efficiency of the different . .
isolation methods employed.
Following quantification of proteins using a standard curve, 10 pg of protein
was electrophoresed on a one-dimensional polyacrylamide gel consisting of a
stacking gel (pH 6.8) and a separating gel (pH 8.8) according to the basic
method described by LAEMMLI (1970). A stock mixture composed of
acrylamide and N'N'methylenebisacrylamide (bisacrylamide) (30 : 0.8 w/v
respectively) was made and stored at 4DC for a period of no longer than 30
days. A 12% polyacrylamide running gel was prepared by making a gel solution
composed of 18 mi acrylamide stock, 11.75 mi 1.5 M Tris (pH 8.8) with
40% SOS and 15.25 mi deionized H20. The gel was degassed using a vacuum
pump, and polymerization of the gel solution was initiated by the addition of
75 pi 20% ammonia persulfate (APS) and 30 pi NNN'N'tetra
methylethylenediame (Temed). The gel was poured between two clean glass
plates and left to polymerize for an hour after the addition of an overlay of
water-saturated butanol. Once polymerization had taken place, the overlay
solution was removed and the top of the gel was rinsed with 0.5 M Tris buffer
(pH 6.8) and the stacking gel was poured. A comb was placed so that loading
wells could form. The 6% stacking gel was made from a degassed gel solution
composed of 1.95 mi acrylamide stock, 3.75 mi 0.5m Tris (pH 6.8)
containing 40% SOS and 9.15 mi dH20 polymerized by the addition of 30 pi
20% ammonium persulfate (APS) and 15 pi
NNN'N'tetramethylethylet:lediamine (Temed). Protein samples stored at _20DC
were thawed and 10 pg protein was denatured by boiling for 10 minutes in
sample buffer containing 2.5% SOS (w/v), 2% 2-merc;aptoethanol (v/v), 10%
glycerol (v/v) and 0.1 % bromophenol blue (w/v) as the tracker dye. Samples
were loaded in the wells and electrophoresed at 15 mA through the stacker gel,
75

and at 30 mA through the sepa rating gel until the bromophenol blue marker dye
had reached the end of the gel. A running buffer (5x normal strength)
consisting of 7.2 g glycine, 1.5 g Tris and 0.5 g SOS dissolved in 100 ml was
diluted to a 1 x solution prior to electrophoresis.
5.2.6 Two-dimensional electrophoresis
Two-dimensional electrophoresis was carried out according to O'FARRELL
(1975) using the modifications made to the basic O'FARRELL method by
MAYER, HAHNE, PALME & SCHELL (1987).
Glass tubes were cleaned by soaking in chromic acid for three hours, rinsed
with 2 g KOH made up in 95% ethanol, followed by several rinses in distilled
water (dH 20). The glass tubes were then dried thoroughly in a drying oven prior
pouring of polyacrylamide gels.
Iso-electric focusing (lEF) gels (4.2%) were prepared with acrylamide /
N'N'methylenebisacrylamide stock (29.16 : 1.33 [w/v]), 5% ampholytes
(Pharmacia, 3-10), 4% nonidet P-40 (NP-40) and 9.0 M urea. The gel solution
was filtered through a 0.22 pm millipore filter and polymerization was initiated
vyith the addition of 2 pI. 20% APS ml.-'. The gel solution was poured into the
IEF glass tubes and overlaid with water. Temed was not essential for the
polymerization reaction but 1 pI. Temed was utilized on occasion to increase
the polymerization rate of the gel. Degassing of the gel prior addition of APS
was not necessary after filtering. All solutions for IEF reagents were made with
redistilled deionized H20.
To prepare extracted proteins for IEF, urea was added to a concentration of 9.0
M, and 4% NP-40 (v/v) was added to the extracts. Alternatively, precipitated
proteins were solubilized in IEF sample buffer of 9.0 M urea and 4% NP-40.
Protein (10 to 25 pg) was routinely applied to the basic end of the IEF gels.
Once the gels were loaded, IEF was initiated. Focusing of proteins was
76
performed overnight. The voltage was increased in steps from 200 V (20
minutes), 300 V (20 minutes) and 400 V until a total of 20 000 V h was
achieved. The cathode and anode electrolytes were 0.1 M NaOH and 0.11 M
H3P04 respectively. The focused gels were equilibrated for three minutes in
equilibration buffer (0.5 M Tris-C1 [pH6.S] 2.5% SOS [w/v], 0.1 % OTT [w/v]
and 10% glycerol [v/v)) prior storage at -70ce or subjection to the second
dimension. The basic end of the gel was marked by injection of equilibration
buffer containing 0.025% bromophenol blue in the glass rods containing the
gel before extrusion of the IEF gel by gentle pressure.
Two-dimensional polyacrylamide gel electrophoresis was conducted using
basically the same method as described for one dimensional gel electrophoresis
with modifications. If IEF gels were frozen, they were subsequently thawed at
room temperature in equilibration buffer and then subjected to electrophoresis.
The acrylamide gel solutions and conditions for gel polymerization were
maintained as previously described for one-dimensional electrophoresis. The
electrophoretic conditions were 25 mA until the marker dye (bromophenol blue)
reached the end of the stacking gel, whereafter it was increased to 45 mA in
the running gel. The gels were run at room temperature until the tracker dye
had reached the end of the running gel. Following electrophoresis, the gels
were subjected to silver staining (MORRISSEY, 1981). Once the extraction
method for anthocyanin-rich callus was established, protein molecular weight
markers (Amersham) were run next to the IEF gels.
5.2.7 Detection of electrophoresed proteins
To detect electrophoresed proteins, one-dimensional and two-dimensional
polyacrylamide gels were subjected to silver staining (MORRISSEY, 1981).
Firstly, the gels were prefixed for 30 minutes in an acidic-alcoholic solution of
50% methanol- 10% acetic acid, followed by a second pre-fixation step in 5%
methanol - 7% acetic acid for 30 minutes. The proteins were then fixed to the
77

gels by washing in 10% glutaraladehyde for 30 minutes. The gels were then
washed in several changes of deionised dH20 for three hours or left to wash
overnight with gentle shaking in deionised dH20. Following the water wash,
gels were subjected to 25 mg .e-1 OTT for 30 minutes and silver stained for 30
minutes with 0.1 % AgN0 3 • After silver staining, gels were rinsed for 30
seconds in deionised water. The silver staining was developed by soaking gels
in 3% sodium carbonate containing 5 pi 37% formaldehyde solution. Citric
acid (2.3 M) was used to stop the developing reaction after 10 minutes.
Polypeptide patterns on gels were photographed using 100 ASA Pan F black
and white film.
5.3 RESULTS
The amount of total protein isolated from the different callus types using the
four attempted methods (Section 5.2.3) were compared (Table 5.1). The best
method to isolate proteins from anthocyanin containing tissue was the fourth
method attempted.
Comparing the amount of protein isolated from light-grown red callus and dark
grown white callus, lower protein yields were observed with the pigmented red
callus (Table 5.1). It was thought that one of the enzymatic differences
between the red and white callus might be the presence of a larger pool of
proteases in the pigmented callus. An experiment to test the effect of protease
inhibitors was conducted. For all the callus types, less protein was isolated in
the absence of inhibitors. In the presence of one inhibitor (EOTA), isolated
protein for the red callus increased approximately four-fold. An increase in the
amount of protease inhibitors in the extraction buffer, increased the amount of
protein isolated. Three protease inhibitors were included in the extraction buffer
for subsequent experiments, namely, EDTA and PMSF. Total protein isolated
from the red and white callus using method number one (Section 5.2.3), were
visualized by silver staining after electrophoresis. No proteins were seen on
silver stained gels for the red callus (Figure 5.1 B).
78
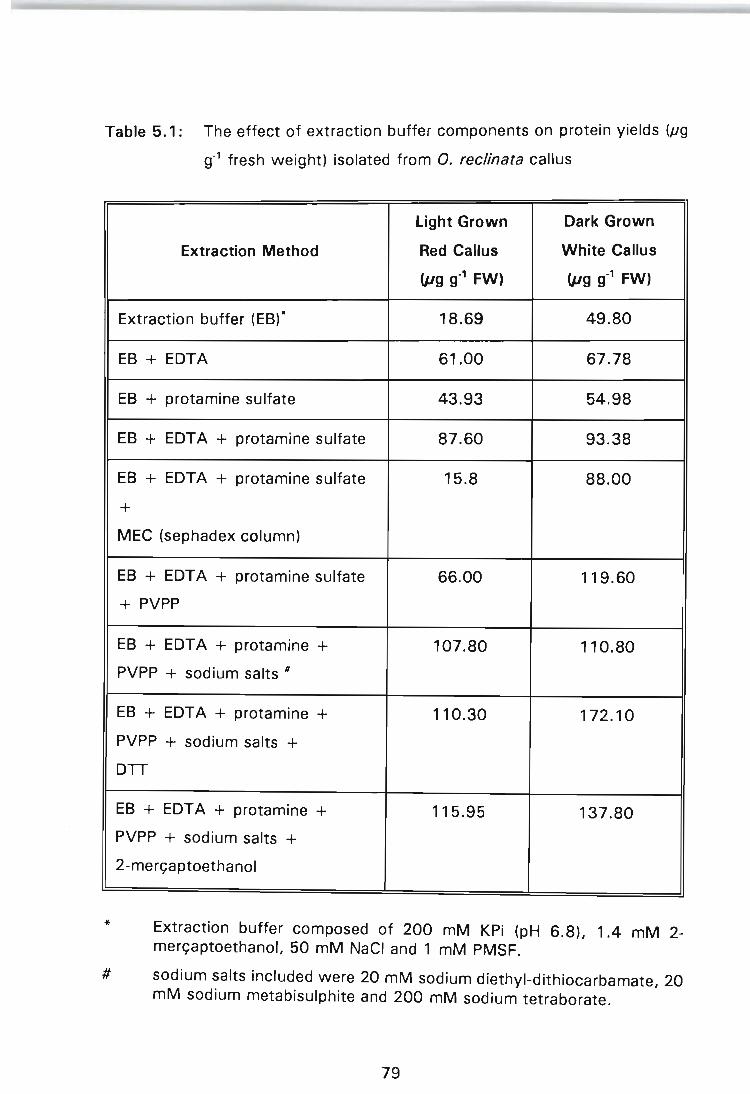
Table 5.1: The effect of extraction buffer components on protein yields (JIg
g-1 fresh weight) isolated from O. reclinata callus
*
#
Light Grown Dark Grown
Extraction Method Red Callus White Callus
(pg g01 FW) (pg g01 FW)
Extraction buffer (EB)· 18.69 49.80
EB + EDTA 61.00 67.78
EB + protamine sulfate 43.93 54.98
EB + EDT A + protamine su lfate 87.60 93.38
EB + EDT A + protamine sulfate 15.8 88.00 -
+ MEC (sephadex column)
EB + EDT A + protamine sulfate 66.00 119.60
+ pvpp
EB + EDT A + protamine + 107.80 110.80
PVPP + sodium salts #
EB + EDT A + protamine + 110.30 172.10
PVPP + sodium salts + DTT
EB + EDTA + protamine + 115.95 137.80
PVPP + sodium salts + 2-merc;aptoethanol
Extraction buffer composed of 200 mM KPi (pH 6.8), 1.4 mM 2-merc;aptoethanol, 50 mM NaCI and 1 mM PMSF.
sodium salts included were 20 mM sodium diethyl-dithiocarbamate, 20 mM sodium metabisulphite and 200 mM sodium tetraborate.
79

Proteins were successfully isolated from the white callus (Figure 5.1 A).
GLEITZ & SEITZ, 1989, monitored the separation of colour and protein using
Sephadex G25 columns before crude protein extracts, obtained from
anthocyanin accumulating D. carota callus lines, were separated on IEF gels.
This procedure was attempted with red and white cultures of O. reclinata. As
previously noted, proteins were isolated successfully from the dark-grown
white callus only (Figure 5.1 A). For this callus line, better protein quantities
were obtained when extracts were not passed through a column (Table 5.1).
Equal amounts of protein were loaded and electrophoresed on a one
dimensional SOS-PAGE gel (Figure 5.2). Clearly, anthocyanins interfered with
the isolation of proteins from red callus lines (Figure 5.2, lanes LR and OR
respectively). No distinct banding pattern was visualised after silver staining.
By contrast, proteins were successfully isolated from white callus kept in the
dark as intense bands were observed (Figure 5.2, lane labelled OW). This callus
remains anthocyanin-free at all stages of the growth cycle. Light-grown white
callus (Figure 5.2, lane labelled LW), on the other hand accumulated
anthocyanins in small quantities and the presence of phenolics resulted in
proteins being lost during the extraction procedure as only five bands were
detected.
80
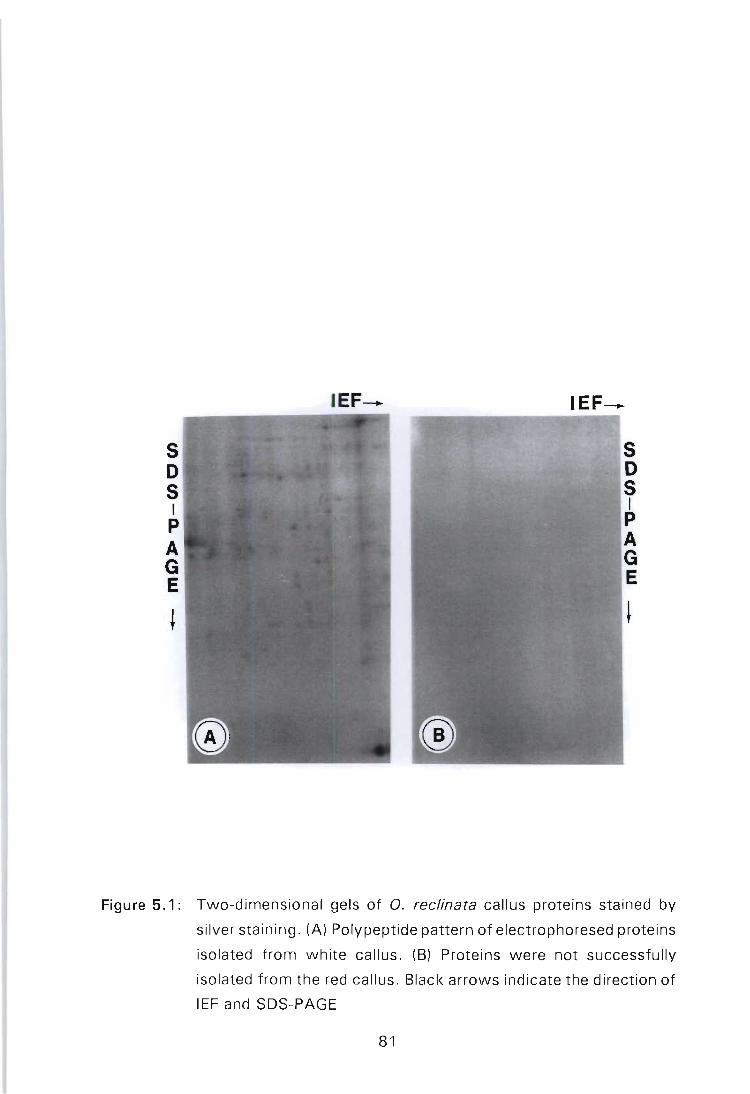
5 D 5 I P A G E
+
IEF- IEF-
Figure 5.1: Two-dimensional gels of O. reclinata callus proteins stained by
silver staining. (A) Polypeptide pattern of electrophoresed proteins
isolated from white callus . (B) Proteins were not successfully
isolated from the red callus. Black arrows indicate the direction of
IEF and SDS-PAGE
81
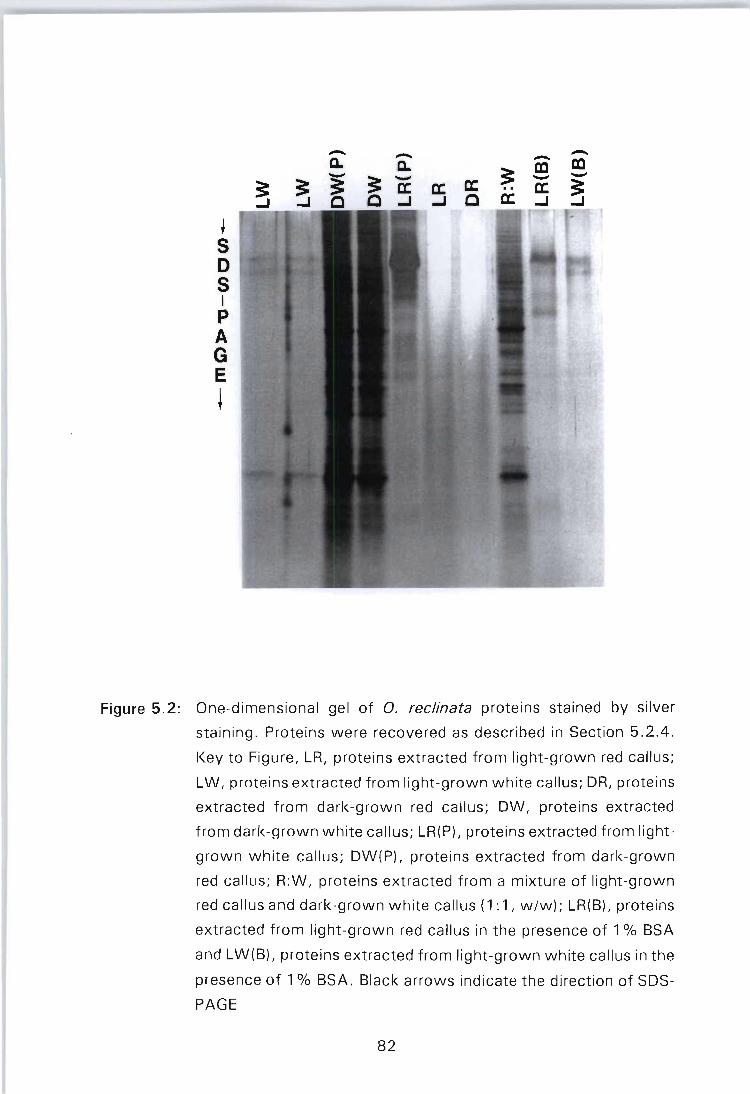
t 5 o 5 I P A G E
~
-a. 3: ..J
-a. 3: 1E .a: a: C ..J ...J C
-3: S a: 5
-ca -~
Figure 5.2: One-dimensional gel of O. reclinata proteins stained by silver
staining. Proteins were recovered as described in Section 5.2.4.
Key to Figure, LR, proteins extracted from light-grown red callus;
LW, proteins extracted from light-grown white callus; DR, proteins
extracted from dark-grown red callus; DW, proteins extracted
from dark-grown white callus; LR(P), proteins extracted from light
grown white callus; DW(P), proteins extracted from dark-grown
red callus; R:W, proteins extracted from a mixture of light-grown
red callus and dark-grown white callus (1: 1, w/w); LR(B), proteins
extracted from light-grown red callus in the presence of 1 % BSA
and LW(B), proteins extracted from light-grown white callus in the
presence of 1 % BSA. Black arrows indicate the direction of SDS
PAGE
82
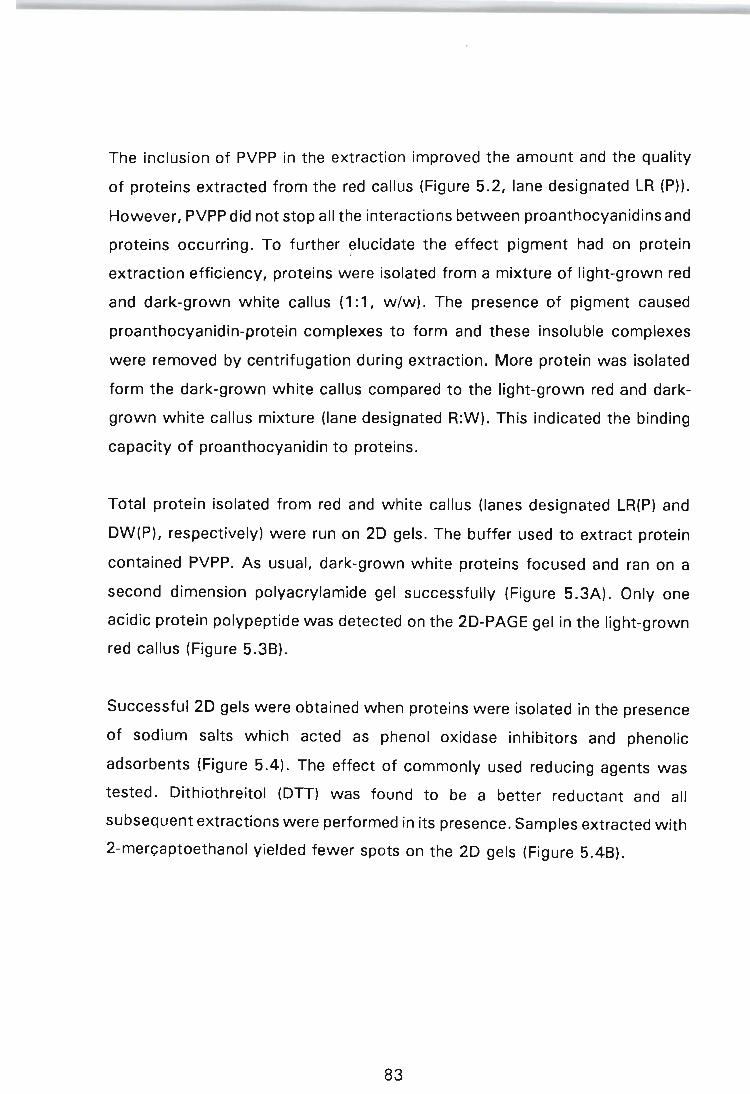
The inclusion of PVPP in the extraction improved the amount and the quality
of proteins extracted from the red callus (Figure 5.2, lane designated LR (P)).
However, PVPP did not stop all the interactions between proanthocyanidins and
proteins occurring. To further ~Iucidate the effect pigment had on protein
extraction efficiency, proteins were isolated from a mixture of light-grown red
and dark-grown white callus (1: 1, w/w). The presence of pigment caused
proanthocyanidin-protein complexes to form and these insoluble complexes
were removed by centrifugation during extraction. More protein was isolated
form the dark-grown white callus compared to the light-grown red and dark
grown white callus mixture (lane designated R:W). This indicated the binding
capacity of proanthocyanidin to proteins.
Total protein isolated from red and white callus (lanes designated LR(P) and
DW(P), respectively) were run on 20 gels. The buffer used to extract protein
contained PVPP. As usual, dark-grown white proteins focused and ran on a
second dimension polyacrylamide gel successfully (Figure 5.3A). Only one
acidic protein polypeptide was detected on the 20-PAGE gel in the light-grown
red callus (Figure 5.38).
Successful 20 gels were obta ined when proteins were isolated in the presence
of sodium salts which acted as phenol oxidase inhibitors and phenolic
adsorbents (Figure 5.4). The effect of commonly used reducing agents was
tested. Oithiothreitol (OTT) was found to be a better reductant and all
subsequent extractions were performed in its presence. Samples extracted with
2-merc;:aptoethanol yielded fewer spots on the 20 gels (Figure 5.48).
83
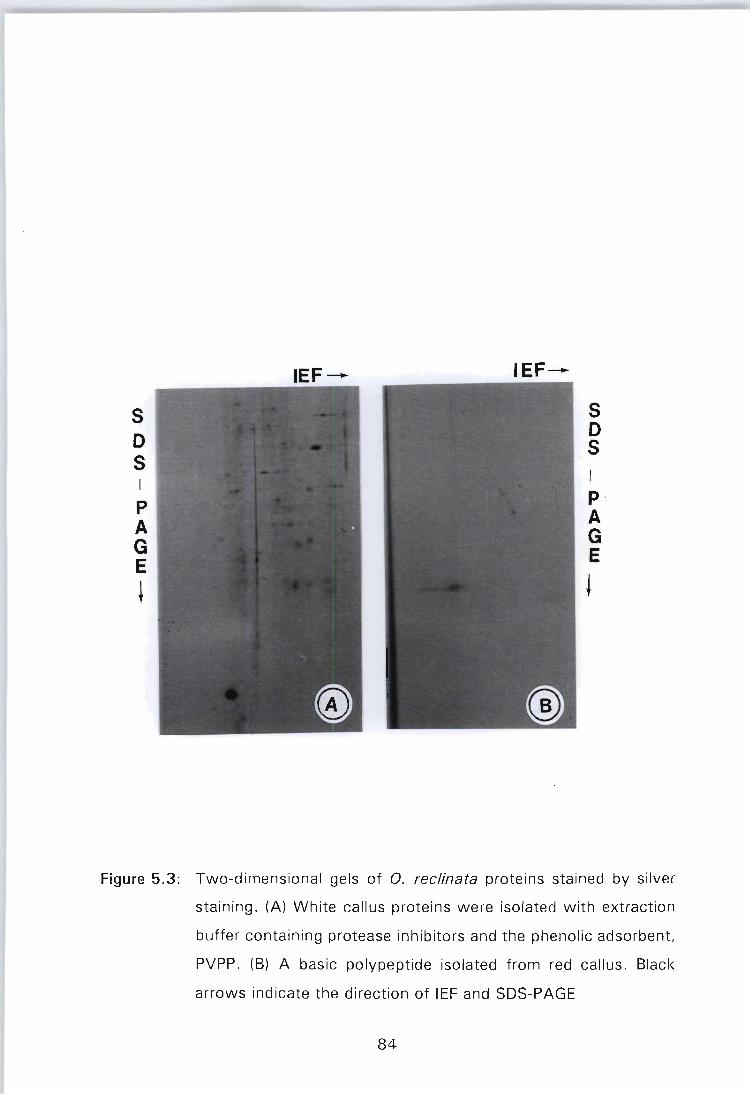
IEF- IEF-
S S
0 0 S
S I I
P p . A A G G E E
+ ~
Figure 5.3: Two-dimensional gels of O. reclinata proteins stained by silver
staining. (A) White callus proteins were isolated with extraction
buffer containing protease inhibitors and the phenolic adsorbent,
PVPP. (B) A basic polypeptide isolated from red callus . Black
arrows indicate the direction of IEF and SDS-PAGE
84
s o S I P A G E
t
-IEF - IEF
s o S I P A G E
t
Figure 5.4: Two-dimensional gels of O. rec/inata red callus proteins stained by
silver staining . (A) The effect of DTT on isolation of proteins. (B)
The effect of 2-mer<;:aptoethanol as a reducing agent . Black
arrows indicate the direction of IEF and SDS-PAGE
85
The differences in polypeptide composition between the white callus (OW) and
the red callus (LR) are shown in Figure 5.5 . There was an overall increase in
polypeptide number of the red callus. More neutral to acidic proteins had
accumulated in the red callus grown in the light (Figure 5.58) as compared to
the dark-grown white callus (Figure 5.5A). Synthesis of these more acidic
proteins appeared to be associated with anthocyanin synthesis. The light
grown white callus showed an overall increase in neutral and acidic proteins
(Figure 5.6A). This callus line was made of red and non-pigmented cells. It
accumulated anthocyanin pigments (Section 3.3, Figure 3.6C)
A reduction in basic proteins was noted for the light-grown white callus. In
Figure 5.5A, polypeptides 1-3 were recognized as being unique to the dark
grown white callus. Some polypeptides of the dark-grown white callus were
markedly reduced in intensity when compared to light-grown red callus
polypeptides (Figure 5.5, shown by black and white arrows). The dark-grown
red callus was morphologically different from the other callus types. It had a
tendency to be softer, mucilaginous and grey in colour. The protein
composition of this callus appears to be dramatically different as compared to
the other types (Figure 5.68). A general loss in polypeptide number was noted.
The complete disappearance of the intense « 20 kilodalton [KOa]) polypeptide
present in the other callus types was observed (Figure 5.5).
86

KOa
20 14
IEF - IEF-
s o S I
P A G E
~
Figure 5.5: Two-dimensional gels of O. reclinata callus proteins visualised by
silver staining. (A) Polypeptide patterns of proteins isolated from
dark-grown white callus. (8) Polypeptide patterns of proteins
isolated from light-grown red callus. Black arrows indicate the
direction of IEF and SDS-PAGE
87
5.4 DISCUSSION
The use of two-dimensional electrophoresis to analyze polypeptide mixtures has
often been restricted to unpigmented tissues in plant species (HARI, 1981). It
was necessary to optimise the isolation methods for pigmented Oxalis tissues.
Isolation of proteins from the light-grown red and dark-grown white callus lines
of O. reclinata proved to be most successful when phenol oxidase inhibitors
and phenolic adsorbents were included in the extraction buffer (Figures 5.5 and
5.6). When preventative measures were not taken to reduce or inhibit
proanthocyanidins from coupling with proteins, little or no protein was isolated
from anthocyanin-rich O. reclinata callus.
Difficulties experienced with the extraction of proteins from the red callus may
be ascribed to the interference of proanthocyanidins present in the callus.
These compounds are polyphenolic compounds that bind proteins and form
insoluble complexes. During homogenization, they are released from cell
vacuoles where they are compartmentalized. Once released, they react with
proteins and nucleic acids (WANG & VODKIN, 1994). During extraction release
of phenolics from the red callus occurred and resulted in the formation of
insoluble phenolic-protein complexes were being formed.
These protein-phenolic complexes would be discarded with cellular debris
during the centrifugation steps of the extraction process. Phenolic-protein
interactions result in changed electrophoretic mobility and absorption spectra
of proteins and nucleic acids . In plant extracts, phenolics interfere seriously
with several protein determination methods which were originally described for
animal tissues. These popular methods often give plant protein values that are
in error by orders of magnitudes as plant phenolics absorb strongly at 260 nm
as was observed with spectrophotometrical analysis of isolated proteins from
red callus of Oxalis (Table 5.1 ).
88
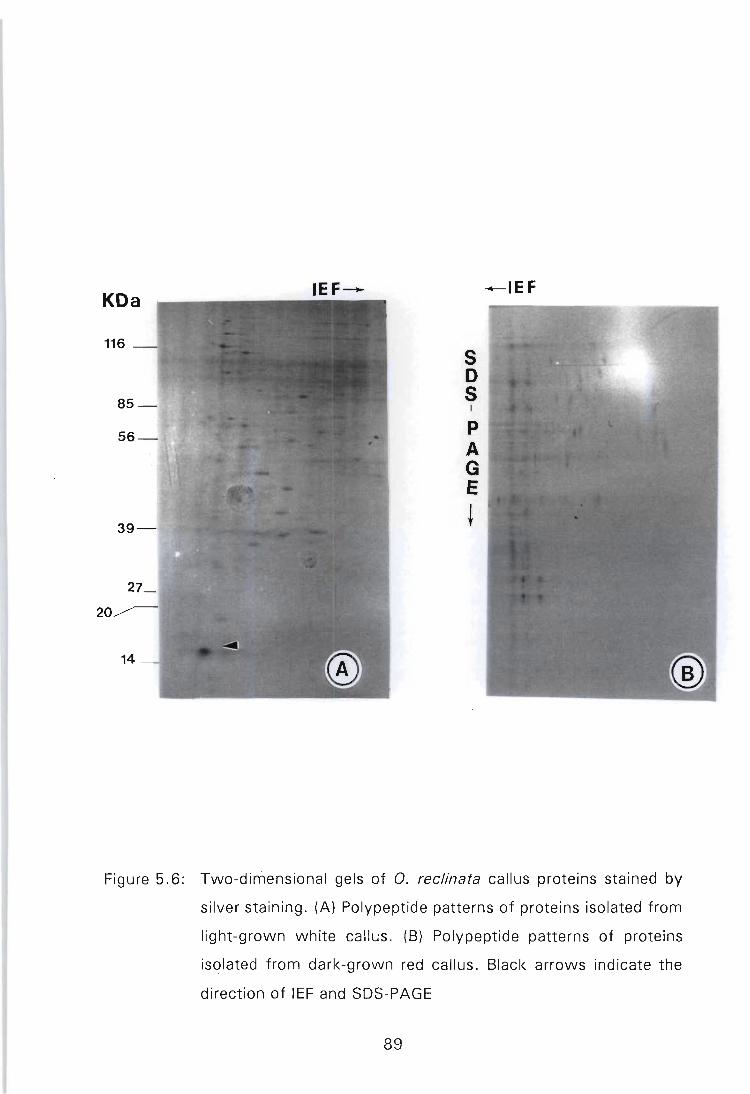
KDa IEF---
39-.
14
S D S
I
P A G E
~
-IEF
Figure 5.6: Two-dimensional gels of O. reclinata callus proteins stained by
silver staining. (A) Polypeptide patterns of proteins isolated from
light-grown white callus. (B) Polypeptide patterns of proteins
isolated from dark-grown red callus. Black arrows indicate the
direction of IEF and SDS-PAGE
89
Therefore, absorption at 260 nm is mainly due to phenolic compounds rather
than nucleic acids or proteins (lOOMIS, 1974).
Inhibitory compounds can often be removed, by passage over a column of
BioGel P-6DG or Sephadex G-50, from plant extracts high in phenolics
(lOOMIS, 1974) Molecular exclusion chromatography was not able to reduce
binding of phenolics to proteins in this study. Gel filtration was not sufficient
in preventing proanthocyanidin-protein complexing from occurring as only one
polypeptide was noted after two-dimensional electrophoresis for the red callus
line (Figure 5.2A). However, two-dimensional analysis of dark-grown white
callus proteins gave a typical pattern of polypeptides (Figure 5.2B). The
inclusion of the phenolic adsorbent, PVPP, gave similar results for both callus
lines.
Rapid procedures when dealing with plant material high in polyphenolics is
recommended. Rapid measures reduce the time period for which secondary
products are in contact with proteins and nucleic acids. Procedures used to
prepare samples for gel filtration were rapid. Precautions were taken during this
study, such as, grinding the callus in liquid N2 and mixing the powder with the
extracting medium rapidly. However, the time period taken for the samples to
pass through Sephadex columns could have allowed for phenolic-protein bonds
to form resulting in only one polypeptide being visible after silver-staining.
One-dimensional gels were run to confirm the effect of pigment production on
the methods used to extract proteins (Figure 5.3). Some insight into secondary
metabolism was gained. With the presence of pigment, which indicates
biosynthesis of anthocyanins, little or no proteins were obtained using
conventional methods to isolate proteins. This was due to formation of
phenolic-protein complexes, as previously mentioned. The white callus grown
in the dark accumulates a negligible amount of anthocyanin (less than 0.002
mg g'1 FW, Section 3.3). This callus grows significantly faster than the red
callus in the light. Primary metabolic activity is greater than secondary
90
metabolic activity in the white callus. Therefore, it is not necessary to take
precautions against phenolic interference when isolating total protein from this
type of callus. Darkly stained bands were present when total protein (10 Jig)
isolated from this callus were run on a one-dimensional gel (Figure 5.3).
Inclusion of PVPP, a phenolic adsorbent, in the extraction buffer increased the
intensity of the bands slightly. Therefore, production of secondary products
was minimal as basically no difference was observed with the addition of
PVPP. On the other hand, when secondary metabolic activity is taking place,
no proteins were isolated in the absence of PVPP (Figure 5.3., lane LR). The
inclusion of this phenolic adsorbent improved protein recovery to a great extent
(Figure 5.3., lane labelled LR(P)).
Light was demonstrated to playa r'hajor role in the induction of anthocyanin
biosynthesis as the light grown white callus was induced to accumulate
pigment. With the initiation of anthocyanin biosynthesis, callus growth slowed
and energy was shunted towards pigment production. The initiation of
anthocyanin production is reflected by the inability to isolate proteins from this
heterogenous callus line. Placing the red callus in the dark is paralleled by a
decline in anthocyanin biosynthesis. Dark-grown red callus accumulated
significantly lower levels of anthocyanin (0.003 mg go, FW). Thus, showing a
reduction in the activity ,of flavonoid biosynthetic enzymes. Although
anthocyanin production was reduced, binding of the already stored phenolic
compounds to proteins was observed and isolating proteins from this callus
using the conventional methods was impossible. No proteins were successfully
isolated from this callus in the absence of phenolic adsorbents and inhibitors
of phenolic oxidases .
Total protein isolated from a 1: 1 mixture (v/v) of light grown red and dark
grown white callus mixture gave a less intense banding pattern as compared
to the dark grown white callus (Figure 5.3., lane R:W). This confirmed the
interference of phenolics with protein isolation procedures. From
spectrophotometric quantification of protein, equal amounts of protein were
91
supposed to have been loaded. However, the resultant banding patterns were
not of the same intensity.
Prevention of phenolic-protein interactions was achieved by the inclusion of
phenolic adsorbents and phenol.oxidase inhibitors. Phenolic adsorbent, PVPP,
(1-2%) has been utilized by many researchers to control polyphenolic-protein
binding (LOOMIS, 1974). The inclusion of this phenolic adsorbent in the
extraction buffer (Section 5.2.3.) slightly improved the amount of protein
isolated. Bands were observed after silver staining of one-dimensional gels
(Figure 5.3., lanes labelled R(P)). The phenolic adsorbent, PVPP, acts by
forming strong H-bonded complexes with phenolic complexes. One of the ways
in which phenolic compounds interact with proteins is through H-bonding
(LOOMIS, 1974; GEGENHEIMER, 1990). Therefore, PVPP acts by competitively
binding to phenolics. However, on two-dimensional gels one polypeptide « 20
KDa) was noted, indicating that irreversible interactions between proteins and
procyanidins were still taking place (Figure 5.2B).
Bovine serum albumin is a protein that can be included in extraction buffers to
act as a phenolic adsorbent. It acts by binding to phenols through H-bonds to
the peptide-bond oxygens. Bovine serum albumin was observed to have a very
small effect on protein isolation from red calli, only a few bands were observed
when comparing its effect to that of PVPP (Figure 5.3., lane designated LR(B)).
Phenol oxidase activity may be inhibited by anti-oxidants such as
mercaptobenzothiazol and metabisulfites. These antioxidants provide a strong
reducing environment to counteract the effect of phenol oxidases. Phenol
oxidases allow for interactions to occur between proteins and phenolic
compounds. Proteins isolated in the presence of these sodium salts (e.g.
sodium metabisulfite and sodium tetra borate) from the red callus were
successfully run on two dimensional gels and patterns of polypeptides were
observed (Figure 5.4).
92
Metabisulfites are thought to protect plant enzymes through complex reactions.
They are known to react with a wide variety of plant secondary products such
as phenolics, coumarins and quinones. Borate acts by complexing with
compounds such as o-diphenols and it inhibits diphenol oxidase activity. In the
presence of PVP, borate has been shown to give higher yield of soluble protein.
This effect may be assigned to phenolic compounds that have highly
interacting hydroxyl and carbonyl groups forming stable compounds with
borate and which are less active in forming hydrogen bonds with proteins
(LOOMIS, 1974).
Several proteins were unique to the red callus grown in the light (Figure 5.6B).
These proteins were thought to be involved with the synthesis of anthocyanins.
The white callus which is grown in the light has a patchy appearance showing
initiation of anthocyanin synthesis, as a result there are polypeptides which are
shared between the red callus and this white callus line (Figure 5.7 A). The
polypeptide which is less than 20 KDa is common to three callus lines of O.
reclinata, namely, light-grown red callus, dark-grown white callus and light
grown white callus. It may be assumed to be associated with primary metabolic
events.
Two-dimensional studies were not conclusive and further molecular analysis
was required to elucidate mechanisms involved in anthocyanin production.
93
CHAPTER 6
IN VITRO TRANSLATION
6.1 INTRODUCTION
The technique of in vitro translation provides information about protein
synthesis mechanisms. It allows for the identification of mRNA molecules and
the study of the properties for which they code (BROWN, 1990). Cell-free
protein-synthesising systems are now available commercially and have been
extensively used for the translation of eukaryotic mRNA's. The two most
commonly utilized in vitro translation systems are the rabbit reticulocyte lysate
and the wheat germ extract (CLEMENS, 1984). Attention will be paid to the
wheat germ extract as it was utilized in this study. The manufacturer,
BOEHRINGER MANNHEIM (1994) claims that the wheat germ translation kit is
an ideal source of ribosomes because of the low levels of endogenous mRNA
activity. The cell-free translation system allows for the performance of the
three basic steps involved in translations, namely, initiation, elongation and
termination. The kit is intended for protein synthesis in the presence of [35S]_
methionine or [3Hl-leucine. The labelled protein product may be examined by
trichloro-acetate (TCA) precipitation and gel electrophoresis, followed by
autoradiography (Figure 6.1) .
The wheat germ extract has several advantages. In comparison to the
reticulocyte system, its preparation, and therefore cost, are easier and lower
respectively. Wheat germ extracts are sensitive to stimulation of overall protein
synthesis by exogenous mRNAs without micrococcal nuclease treatment.
Under optimal conditions, mRNA may stimulate amino acid incorporation during
in vitro translation as much as 400-fold. The wheat germ system is capable of
synthesizing high molecular weight polypeptides (ANDERSON, STRAUS, &
94
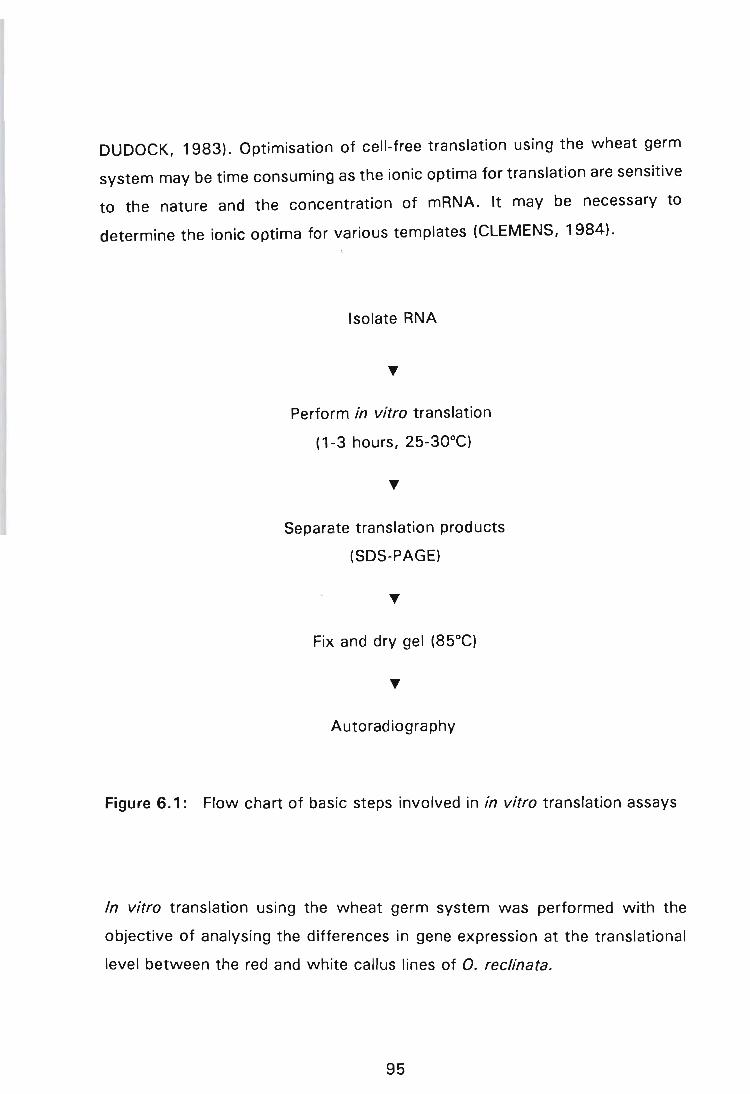
DUDOCK, 1983). Optimisation of cell-free translation using the wheat germ
system may be time consuming as the ionic optima for translation are sensitive
to the nature and the concentration of mRNA. It may be necessary to
determine the ionic optima for various templates (CLEMENS, 1984).
Isolate RNA
Perform in vitro translation
(1 -3 hours, 25-30°C)
Separate translation products
(SDS-PAGE)
Fix and dry gel (85°C)
Autoradiography
Figure 6.1: Flow chart of basic steps involved in in vitro translation assays
In vitro translation using the wheat germ system was performed with the
objective of analysing the differences in gene expression at the translational
level between the red and white callus lines of O. reclinata.
95
6.2 MATERIALS AND METHODS
6.2.1 RNA isolation
Two methods were attempted to isolate RNA from light-grown red callus and
dark-grown white callus types of O. reclinata. Prior to preparation of reagents,
a 1 % solution of diethylpyrocarbonate (DEPC) was prepared and stirred
overnight at room temperature in a glass Schott bottle. The DEPC solution was
then used to remove RNases from all glassware and plasticware. The DEPC
was inactivated by autoclaving for an hour. Initially, RNA was isolated from a
small amount of tissue (0.1 g) by grinding in liquid N2 in a pre-cooled mortar
and pestle to a fine powder. The powder was transferred to a centrifuge tube
with 1.5 ml Tris-saturated phenol (pH 5.0) and 1.5 ml extraction RNA buffer
(0.2 M Tris, pH 9.0; 0.4 M LiCI, 25 mM EDTA and 1 % SDS) and vortexed
well. The extract was centrifuged at 3 000 rpm (Sigma-113) for five minutes
and the aqueous phase transfe rred to another tube and precipitated with 1/10
volume 3 M sodium acetate (pH 5.2) and 2 volumes absolute ethanol by
placing at -20°C for two hours, followed by centrifugation at 8 000 rpm
(Sigma-113 microfuge) for 15 minutes. The recovered pellet was resuspended
in 0.3 ml sterile RNase-free dH20, vortexed well, and 30 pi 3 M sodium
acetate (pH 5.2) and 600 pi absolute ethanol and RNA was precipitated at -
70°C for 15 minutes. The pellet was washed with 80% ethanol twice and RNA
was dissolved in 50 pi of water. Quantification of RNA was performed using
5 pi of the extract. RNA was quantified in pg m-' i using a nucleic acid
calculator (Genequant, Pharmacia). To bind phenolics PVPP (2%) was added
to the extraction buffer.
The second method used was described by WANG & VODKIN (1994) for
anthocyanin-containing tissues. For this study, the method was modified as
large amounts of heparin are required and this makes the original method
expensive. Bovine serum albumin (5%), which acts as a phenolic adsorbent,
was incubated in Extraction Buffer A (100 mM Tris-CI, pH 9.0, 200 mM NaCI,
96
20 mM EDTA, 4% sarkosyl lv/v]) containing 16 mM 2-merc;aptobenzothiazol
(a RNase inhibitor) and 1.5% PVPP, for a period of two hours to overnight.
Callus material (0.2 - 0.5 g) was ground to a fine powder in a pestle and mortar
using liquid N2 • The fine powder was transferred to a centrifuge tube,
containing 2 mi of extraction buffer (EB) A, before it began to thaw. Extraction
buffer B (6.5 mil which had the same chemical composition as extraction
buffer A but excluding BSA and PVPP was added to the centrifuge tube and
200 pi Proteinase K (10 mg mi-', Boehringer Mannheim) added, and the
homogenate left on ice in the combined extraction buffers for one minute. The
extract was then incubated at 3rC in a waterbath, and gently shaken in rotary
motion at 80 rpm for 20 minutes. The protease enzyme was used to digest
BSA which competitively binds anthocyanins. The BSA and cell debris were
removed by centrifugation at 10 000 rpm (SS-34 rotor head, RC-5 Sorvall
Centrifuge) for 10 minutes at 4°C. The supernatant was transferred to a new
centrifuge tube and extracted in an equal volume of Tris-saturated phenol (pH
7.5) at 8 000 rpm for 10 minutes (SS-34 rotor head, RC-'5 Sorvall Centrifuge).
The supernatant was extracted twice with phenol at 20°C. Chloroform-isoamyl
alcohol extractions were performed following phenol extractions using Sevag
solution (Chloroform : isoamyl-alcohol, 24 : 1 lv/v]) by centrifugation of
supernatant at 8 000 rpm ( SS-34 rotor head, RC-5 Sorvall Centrifuge) for 10
minutes at 20°C. The supernatant was measured and 1/3 volume of LiCI (8 M)
was used to precipitate RNA overnight at 4°C. The RNA was recovered by
centrifugation at 8 000 rpm in a microfuge (Sigma-113) for 20 minutes. The
pellet was washed twice in 2 M LiCI and RNA was dissolved in deionized dH20
and 1/10 volume of 2.5 M sodium acetate (pH 5.2) and 2.5 volumes of ethanol
were used for the final RNA precipitation at 20°C overnight, or at -70°C for 15
minutes. The RNA samples were centrifuged at 8 000 rpm for 20 minutes, in
a microfuge (Sigma-113) and vacuum dried for three minutes. Pellets were
resuspended in distilled water, or TE (0.1 M Tris, 0 .01 M EDTA [pH 8.0]) and
stored as 10 Jl i aliquots at -70°C until needed. All glassware and plasticware
97
was treated with 0.1 % DEPC overnight (as previously described), to remove
RNases.
The method described by WANG & VODKIN (1994), proved to be the most ,
successful. Several other modifications were also attempted to the WANG &
VODKIN (1994) protocol. They were as follows:
i) Extraction was performed in the absence of 16 mM
merc;aptobenzothiazol (RNase inhibitor);
ii) BSA was excluded from Extraction Buffer A; and
iii) Addition of phenol oxidase inhibitors and a phenolic adsorbent to the
two extraction buffers were attempted. These were 0.2 M sodium
tetraborate, 0.02 M sodium metabisulfite, and 0.002 M sodium
d iethyld ithioca rba mate .
6.2.2 RNA analysis
The isolated RNA was quantified prior to storage using an automated nucleic
acids calculator (Genequant, Pharmacia). RNA (2 Jig) was electrophoresed in
1.5% agarose gel under non-denaturing conditions at 56 V (5 V cm-') for two
hours to establish its integrity. Electrophoresis was performed using 1 X TAE
(0.04 M Tris-Acetate, 0.002 M EDTA, pH 8.5). This running buffer was made
from a 50X TAE buffer stock solution (121 g Tris, 28 .55 ml glacial acetic acid,
50 ml 0.5 M EDTA and 421 ml H20). To monitor the electrophoretic process,
RNA samples were dissolved in a loading buffer containing bromophenol blue.
The loading buffer (10X stock solution) was made of 50 mM NaOH, 1 mM
EDTA, 2.5% glycerol and 0.025% bromophenol blue) and was stored at 4°C.
Once electrophoresis was complete, gels were stained by submersion in a 0.5
Jig ml-' solution of ethidium bromide (EtBr) for 10 minutes. When necessary
gels were destained using the previously described agarose electrophoresis
98
running buffer (TAE [pH 8 .5]) . The RNA was visualised using UV-illumination
(Spectroline UV-Transilluminator, TC-312A) after staining with EtBr.
6.2.3 Non-radioactive in vitro translation
Non-radioactive translation is not conventionally utilized. However, as part of
this study it was necessary to employ this method for the reasons listed below:
1) The wheat germ kit init ially used for translation was 'old'. It had been
stored at - 70°C for a year. Non-radioactive translation was used to test
the activity of the kit;
2) It was regarded as a cheaper means of optimizing cell-free translation as
radioactively labelled methionine is expensive and the wheat germ
system is sensitive to potassium and magnesium concentrations;
3) This system would be able to provide sufficient information with respect
to gene expression and translation mechanisms of pigment synthesizing
callus, provided that several controls were set up to eliminate
background proteins which form part of the wheat germ kit and;
4) The hazards encountered with radioactive experimental procedures
would be eliminated.
A stock solution of 125 mM methionine was made and stored at -70°C. Prior
to use, the stock solution was diluted 1 DO-fold in RNase-free water. Translation
reactions were set up as described in Table 6.1.
The reaction volume adjusted to 25 pi with RNase-free dH20. Cell-free
translation was initiated by incubating reaction tubes in a waterbath at 3DoC.
After three hours, the tubes were removed from the waterbath and placed on
ice prior to electrophoresis of t ranslation products using one-dimensional PAGE
99
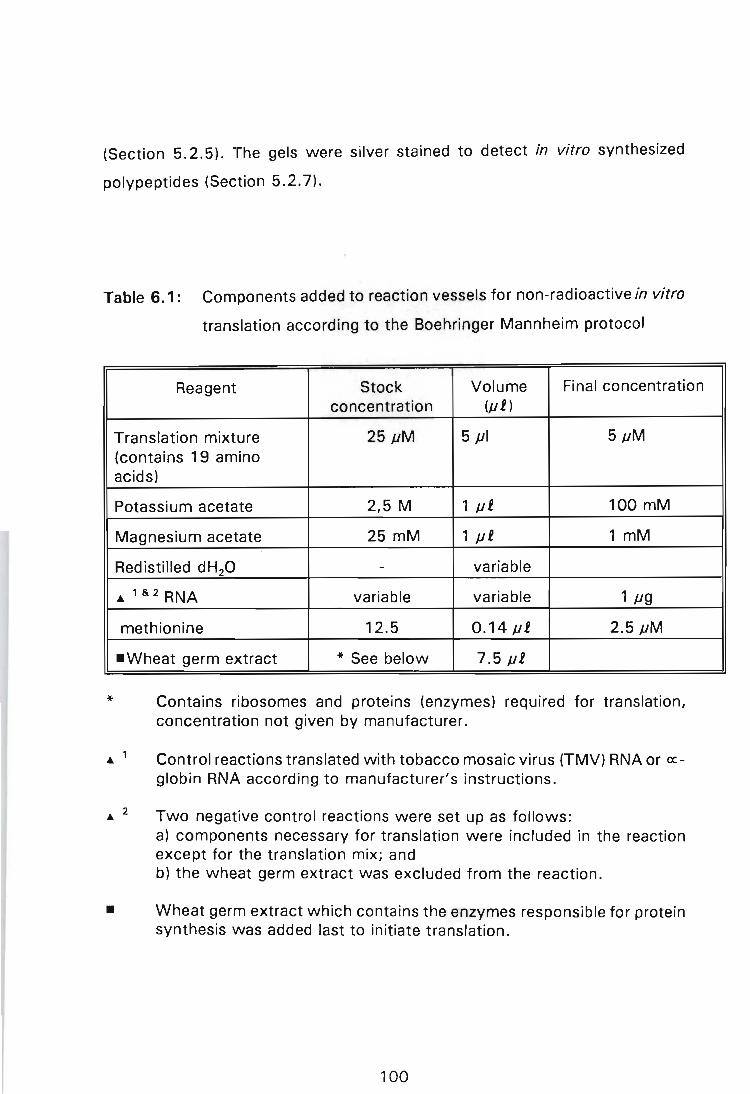
(Section 5.2.5). The gels were silver stained to detect in vitro synthesized
polypeptides (Section 5.2.7).
Table 6.1: Components added to reaction vessels for non-radioactive in vitro
translation according to the Boehringer Mannheim protocol
*
Reagent Stock Volume Final concentration concentration (p i)
Translation mixture 25 pM 5 pi 5pM (contains 19 amino acids)
Potassium acetate 2,5 M 1 pi 100 mM
Magnesium acetate 25 mM 1 pi 1 mM
Redistilled dH20 - variable
.1&2RNA variable variable 1 pg
methionine 12.5 0.14pi 2.5 pM
-Wheat germ extract * See below 7.5pi
Contains ribosomes and proteins (enzymes) required for translation, concentration not given by manufacturer.
• 1 Control reactions translated with tobacco mosaic virus (TMV) RNA or ex:globin RNA according to manufacturer's instructions.
• 2
-
Two negative control reactions were set up as follows: a) components necessary for translation were included in the reaction except for the translation mix; and b) the wheat germ extract was excluded from the reaction.
Wheat germ extract which contains the enzymes responsible for protein synthesis was added last to initiate translation.
100
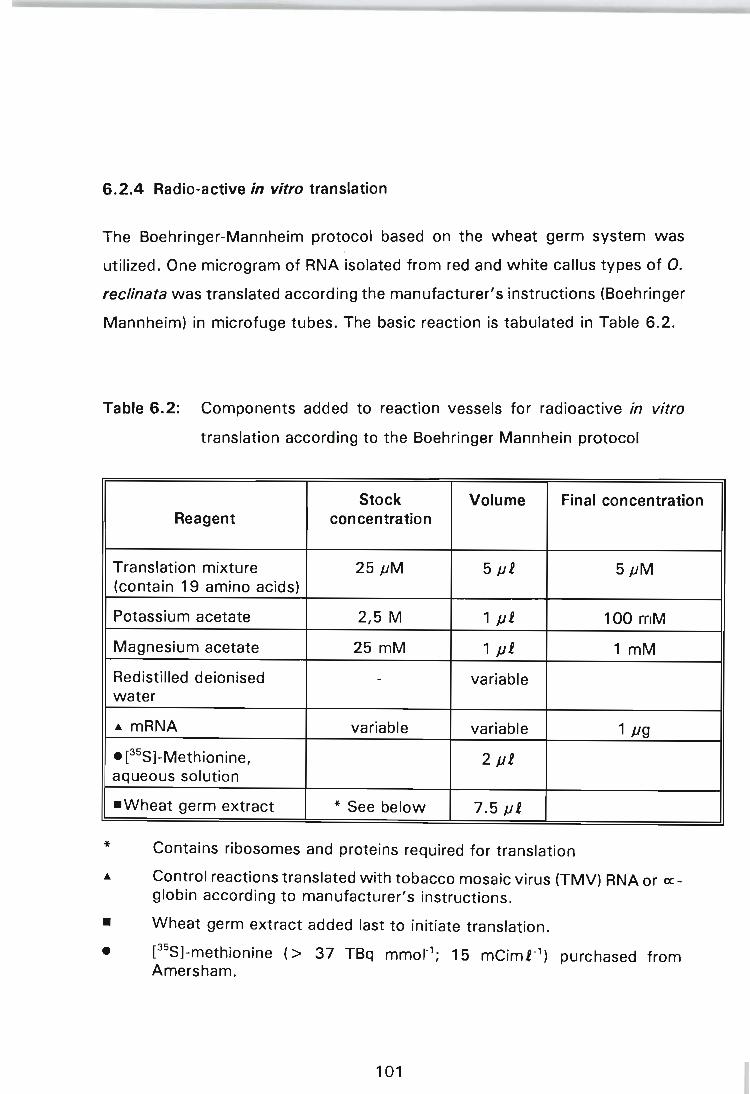
6.2.4 Radio-active in vitro translation
The Boehringer-Mannheim protocol based on the wheat germ system was ,
utilized. One microgram of RNA isolated from red and white callus types of O.
reclinata was translated according the manufacturer's instructions (Boehringer
Mannheim) in microfuge tubes. The basic reaction is tabulated in Table 6.2.
Table 6.2: Components added to reaction vessels for radioactive in vitro
translation according to the Boehringer Mannhein protocol
*
-•
Stock Volume Final concentration Reagent concentration
Translation mixture 25 JIM 5 pi 5pM (contain 19 amino acids)
Potassium acetate 2,5 M 1 pi 100 mM
Magnesium acetate 25 mM 1 pi 1 mM
Redistilled deionised - variable water
A mRNA variable variable 1 pg
• [35S]-Methionine, 2 pi
aqueous solution
-Wheat germ extract * See below 7.5pi
Contains ribosomes and proteins required for translation
Control reactions translated with tobacco mosaic virus (TMV) RNA or ex:globin according to manufacturer's instructions.
Wheat germ extract added last to initiate translation.
[35S]-methionine (> 37 TBq mmol-1
; 15 mCimi-1) purchased from Amersham.
101

The reaction volume was adjusted to 25 pi with redistilled water. The reaction
tubes were incubated for three hours at 30°C. Attempts to optimise cell-free
translation were made. These involved manipulating mRNA concentrations of
the basic standard assay and varying the concentration of magnesium and
potassium ions.
6.2.4.1 Trichloroacetic acid (TeA) precipitation
Assay mixture (3 pi) was mixed with 147 pi redistilled water and placed on
ice. From the diluted assay mixture 5 pi were pi petted onto a dry GFC-filter
(Whatman). The filters were left to dry for 10 minutes at 65°C and counted
with TCA precipitated radiolabelled proteins using a liquid scintillation counter
(Beckman LS 600LL). Precipitat ion with TCA of radioactive translation products
was performed by mixing the in vitro translation (50 pi) with 500 pi 0.1 M
NaOH and incubating for 10 minutes at 3rC. After incubating, 400 pi TCA
(50% [w/v)) containing casein hydrolysate (2% [w/v)), was added and the
reaction was placed on ice for 30 minutes. GFC-filters (Whatman) previously
soaked for 30 minutes in TCA solution (5% [w/v)), containing 0.01 M KH4P20 7 ,
were used to filter the mixture. The filters were washed three times in a
solution of 2.0 M TCA and. 2.0 M Na4P20 7 • The filters were dried for 10
minutes at 65°C after being washed.
6.2.4.2 Quantification of translation products
The dried filters were placed in scintillation counting vials with 5 mi of
scintillation cocktail (Beckman Ready Value™) and counted on a liquid
scintillation counter (Beckman LS 6000LL). The efficiency of translation was
represented as the percentage incorporation. This value was derived by
counting both precipitated and unprecipitated assay mixtures simultaneously.
The percentage incorporation of [35S)-methionine was calculated according to
the following formula:
% incorporation = TCA precipitated products (cpm vi') Unprecipitated products (cpm l1i-')
102

6.2.5 Electrophoresis of translation products
The assay mixture (10 pi) was run on a 6% stacking gel and 12 % ru~ning gel,
as described in Section 5.2.5. Once gel electrophoresis was complete, the gel
was rinsed in a solution of 10% acetic acid (to fix proteins) containing 1 %
glycerol for 30 minutes. The gel was placed onto filter paper (Whatman 1),
transferred to a gel drying system (Slab Gel Dryer SE1160, Hoefer Scientific)
and vacuum dried for two-and-a-half hours at 80°C. The dried gel was then
exposed to autoradiographic film (Hyperfilm 0.:: -max, Amersham) for a period
of 12 - 24 hours. The film was then developed.
6.3 RESULTS
The quality of RNA's isolated using the methods described in Section 6.2.1. are
compared in Figure 6.2. The type of degraded RNA recovered when
interference derived from phenolic compounds has not been minimized during
isolation is shown in Figure 6.2A. Therefore, standard phenol-liel methods
were not effective for extracting RNA from the pigmented callus. Mostly, no
RNA was recovered by these methods or RNA was degraded and appeared as
smears on 1.5% non-denaturing agarose gels. Several other problems were
encountered with conventional methods for isolating RNA. Gelatinous and
pigmented pellets were formed (Table 6.3). These pellets were difficult to
resuspend in water or TE buffer (pH 6.8). The texture of the pellets was
probably a reflection of large amounts of polysaccharides which were not
removed during the extraction. Bovine serum albumin was included in the
extraction buffer to competitively bind procyanidins. Heparin, in large amounts,
is required to act effectively as a RNase inhibitor because the BSA which is
required to competitively bind proanthocyanidins is not free of RNase activity
(WANG & VODKIN, 1994). This makes the WANG & VODKIN (1994) method
expensive. The method was modified by excluding heparin from the buffer. The
phenolic adsorbent, BSA, was then incubated in EB containing the RNase
inhibitor, 2-men;:aptobenzothiazol, for a longer time period (two hours to
103
overnight) at 4°C. This proved to be the most successful method to isolate
RNA from anthocyanin containing callus tissues.
Proteinase K (Boehringer Mannheim) was the preferred proteinaceous enzyme
as Pronase (Boehringer Mannheim) yielded intact white callus RNA but the red
callus RNA was degraded. When extracting RNA, it was necessary to incubate
the extracts with one of these enzymes to remove residual BSA unbound by
proanthocyanidins. Digestion with Proteinase K resulted in discolouration of red
extracts from red to cream and intact RNA was always recovered. By contrast,
Pronase did not cause a colour change during the digestion. Pink to purple
pellets were always recovered. This reflected the association of phenolic
compounds with RNA. Absorbance values obtained with treatments without
2-merc;:aptobenzothiazol (Treatments 1 - 3), were always low. Comparing
readings obtained with Pronase (treatment 4) and Proteinase K (Treatment 5),
the former resulted in RNA with lower A260 values (data not shown). In general,
RNA yields obtained with the red callus were far lower than those obtained
with the white callus . Intact RNA obtained with Proteinase K containing EB
(Treatment 4) was represented by the appearance of two bands, the major 28S
and 18S rRNAs after electrophoresis in a non-denaturing 1.5% agarose gel
(Figure 6.2B). The degradation of the two major ribosomal RNA bands was
always seen as smears on 1.5% agarose gels (Figure 6.2A).
Non-radioactive translation was successful as revealed by one-dimensional and
two-dimensional PAGE (Figures 6 .3 and 6.4). Comparing the banding pattern
observed for the wheat germ extract proteins (Lane labelled A) with the
banding pattern observed after non-radioactive translation of white and red
callus RNA (Lanes F-G and O-E, respectively), the in vitro translated samples
showed an increase in the number of bands.
104
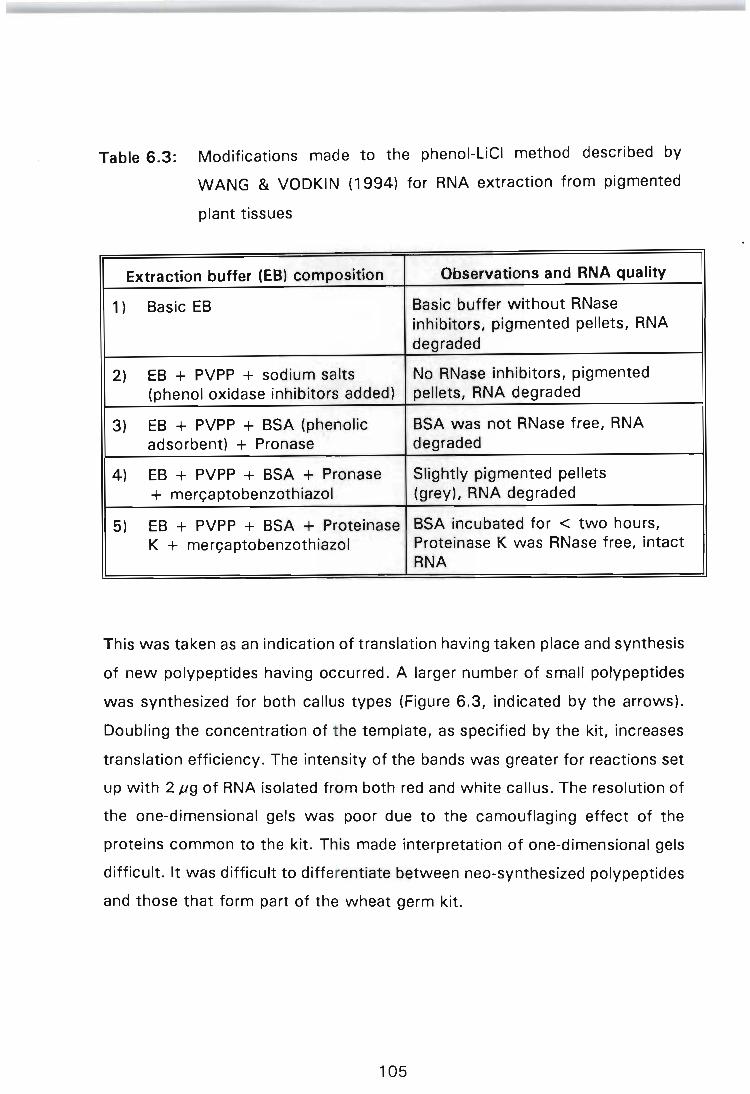
Table 6.3: Modifications made to the phenol-Liel method described by
WANG & VODKIN (1994) for RNA extraction from pigmented
plant tissues
Extraction buffer (EB) composition Observations and RNA quality
1 ) Basic EB Basic buffer without RNase inhibitors, pigmented pellets, RNA degraded
2) EB + PVPP + sodium salts No RNase inhibitors, pigmented (phenol oxidase inhibitors added) pellets, RNA degraded
3) EB + PVPP + BSA (phenolic BSA was not RNase free, RNA adsorbent) + Pronase degraded
4) EB + PVPP + BSA + Pronase Slightly pigmented pellets + merc;:aptobenzothiazol (grey), RNA degraded
5) EB + PVPP + BSA + Proteinase BSA incubated for < two hours, K + merc;:aptobenzothiazol Proteinase K was RNase free, intact
RNA
This was taken as an indication of translation having taken place and synthesis
of new polypeptides having occurred. A larger number of small polypeptides
was synthesized for both callus types (Figure 6.3, indicated by the arrows).
Doubling the concentration of t he template, as specified by the kit, increases
translation efficiency. The intensity of the bands was greater for reactions set
up with 2 pg of RNA isolated from both red and white callus. The resolution of
the one-dimensional gels was poor due to the camouflaging effect of the
proteins common to the kit . This made interpretation of one-dimensional gels
difficult. It was difficult to differentiate between neo-synthesized polypeptides
and those that form part of the wheat germ kit.
105

RWW
Figure 6 .2: Comparison of RNA quality extracted from white and red callus
lines of O. rec/inata fractionated on a 1 .5 % non-denaturing
agarose gels . (A) Conventional methods yielded poor quality RNA
which was degraded. (B) Good quality RNA was extracted
according to the modified WANG & VODKIN (1994) method .
Key to lane labels: R, RNA extracted from red callus; W, RNA extracted from white callus . Black arrows indicate the direction of electrophoresis
106

0 E F G H
~ S 0 S I P A G E
~
Figure 6.3: One-dimensional gel of non-radioactively synthesized in vitro
translation products vis ualized by silver staining. Lane A shows
proteins associated with the wheat germ extract when the amino
ac id translation mixtu re was excluded from the translation assay .
Lane B represents a control reaction, where no RNA was included
in the translation reaction. Lane C represents bands visualized
after non-radioact ive t ranslation of ,B-globin. Lanes O-E show
proteins obtained from translat ion of red callus RNA and wheat
germ extract prote ins . Lanes F and G represent translation
products of white ca ll us RNA and wheat germ extract protein!?
No bands were visualized when the wheat germ extract. was
omitted f rom the translat ion assay (Lane H)
107
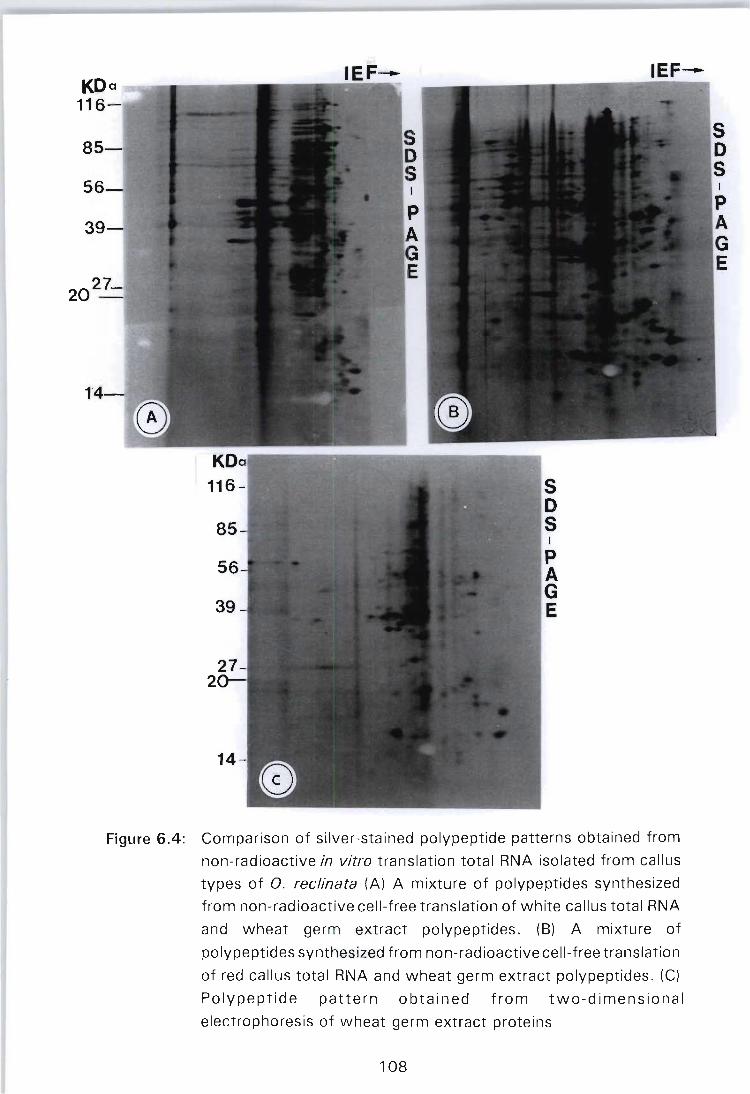
KDa 116-
2027
IEF-
Figure 6.4: Comparison of silver-stained polypeptide patterns obtained from
non-radioactive in vitro translation total RNA isolated from callus
types of O. reclinata (A) A mixture of polypeptides synthesized
from non-radioactive cell-free translation of white callus total RNA
and wheat germ extract polypeptides. (8) A mixture of
polypeptides synthesized from non-rad ioactive cell -free translation
of red callus total RNA and wheat germ extract polypeptides. (C)
Polypeptide pattern obtained from two -dimensional
electrophoresis of wheat germ extract proteins
108
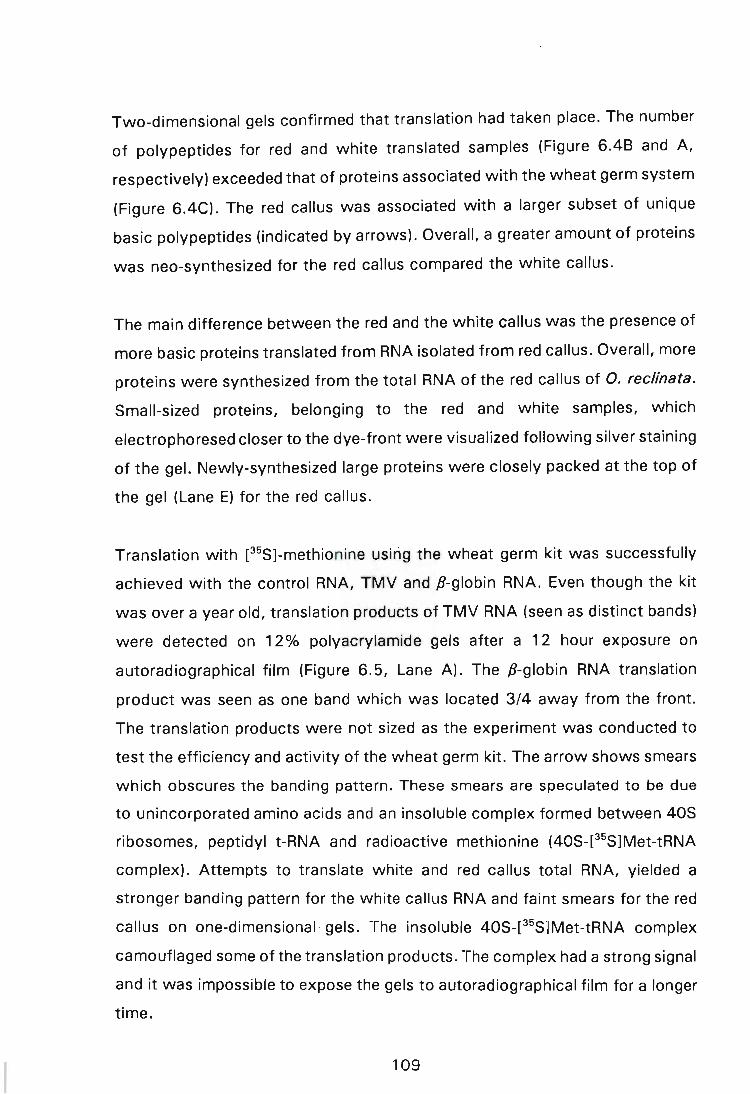
Two-dimensional gels confirmed that translation had taken place. The number
of polypeptides for red and white translated samples (Figure 6.48 and A,
respectively) exceeded that of proteins associated with the wheat germ system
(Figure 6.4C). The red callus was associated with a larger subset of unique
basic polypeptides (indicated by arrows). Overall, a greater amount of proteins
was neo-synthesized for the red callus compared the white callus.
The main difference between the red and the white callus was the presence of
more basic proteins translated from RNA isolated from red callus. Overall, more
proteins were synthesized from the total RNA of the red callus of O. reclinata.
Small-sized proteins, belonging to the red and white samples, which
electrophoresed closer to the dye-front were visualized following silver staining
of the gel. Newly-synthesized large proteins were closely packed at the top of
the gel (Lane E) for the red callus.
Translation with [35S]-methionine using the wheat germ kit was successfully
achieved with the control RNA, TMV and ,B-globin RNA. Even though the kit
was over a year old, translation products of TMV RNA (seen as distinct bands)
were detected on 12% polyacrylamide gels after a 12 hour exposure on
autoradiographical film (Figure 6.5, Lane A). The ,B-globin RNA translation
product was seen as one band which was located 3/4 away from the front.
The translation products were not sized as the experiment was conducted to
test the efficiency and activity of the wheat germ kit. The arrow shows smears
which obscures the banding pattern. These smears are speculated to be due
to unincorporated amino acids and an insoluble complex formed between 40S
ribosomes, peptidyl t-RNA and radioactive methionine (40S-[35S]Met-tRNA
complex). Attempts to translate white and red callus total RNA, yielded a
stronger banding pattern for the white callus RNA and faint smears for the red
callus on one-dimensional · gels. The insoluble 40S-[35S]Met-tRNA complex
camouflaged some of the translation products. The complex had a strong signal
and it was impossible to expose the gels to autoradiographical film for a longer
time.
109
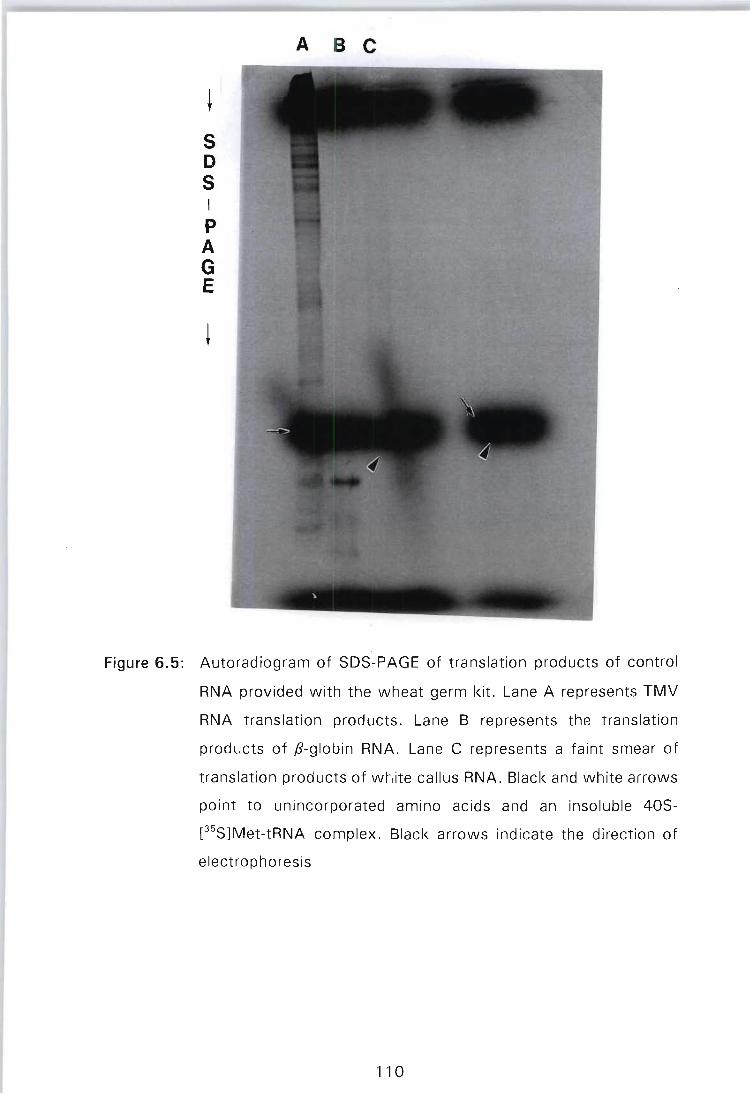
A B C
~
S D S I P A G E
Figure 6.5: Autoradiogram of SDS-PAGE of translation products of control
RNA provided with the wheat germ kit. Lane A represents TMV
RNA translation products . Lane B represents the translation
products of ,B-globin RNA. Lane C represents a faint smear of
translation products of white callus RNA. Black and white arrows
point to unincorporated amino acids and an insoluble 40S
[35S]Met-tRNA complex. Black arrows indicate the direction of
electrophoresis
11 0
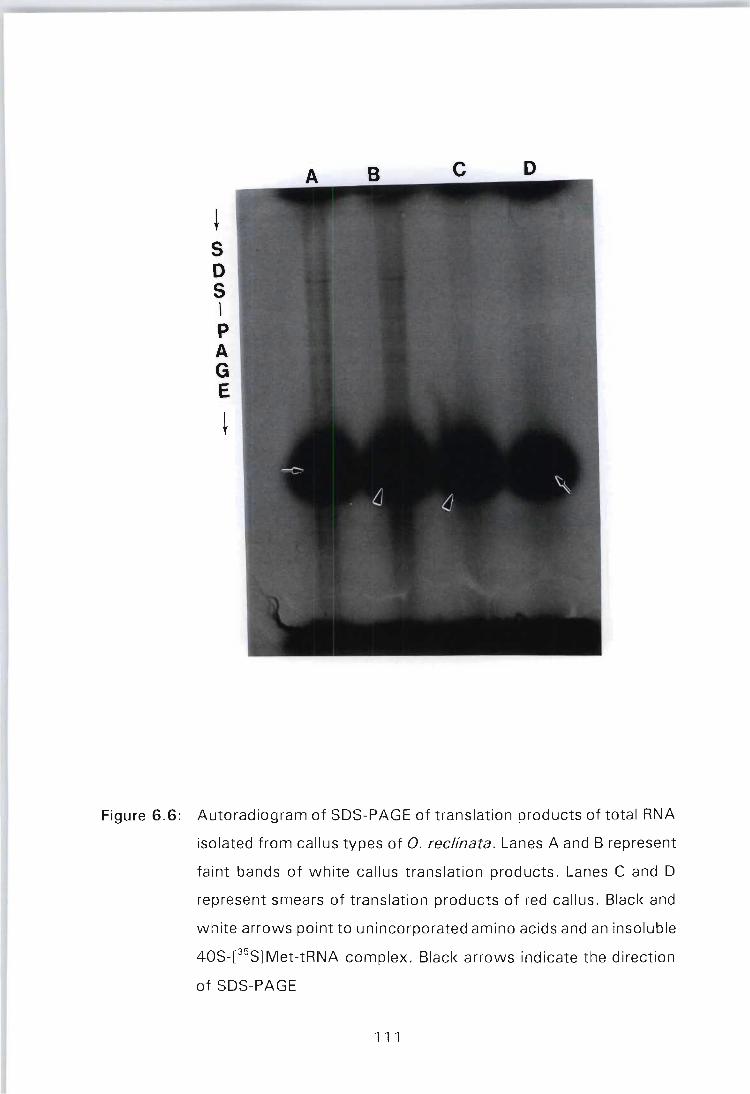
~ 5 o 5 \
P A G E
~
c 0
Figure 6.6: Autoradiogram of SOS-PAGE of translation products of total RNA
isolated from callus types of O. reclinata. Lanes A and B represent
faint bands of white callus translation products. Lanes C and 0
represent smears of translation products of red callus. Black and
white arrows point to unincorporated amino acids and an insoluble
40S-[35S]Met-tRNA complex. Black arrows indicate the direction
of SOS-PAGE
111

6.5 DISCUSSION
Phenolic compounds have been shown to form insoluble complexes with
nucleic acids and proteins. Common methods are not effective to isolate RNA
from tissues with high levels of proanthocyanidins (TODD & VODKIN, 1993;
WANG & VODKIN, 1994). Conventionally, RNA is usually extracted using
slightly alkaline buffers at pH 9. The use of high pH's which is necessary to
reduce RNase activity most probably contributes also to phenolics binding to
the RNA. At higher pH's activity of phenol oxidase activity is increased.
Although, alkalinity of the extraction buffer may reduce interactions via
hydrogen bonding as phenols are ionized considerably and do not form strong
interactions, the effectiveness of phenol adsorbents (such as PVPP) is also
reduced (LOOMIS, 1974).
The inclusion of BSA in the extraction protocol to bind phenolics required the
removal of excess protein using proteolytic enzymes. Pronase always resulted
in slightly pigmented pellets which were difficult to resuspend and RNA that
was degraded. By contrast, t he use of Proteinase K yielded intact RNA that
was pigment free for the both types of callus. Proteinase K is classified as a
subtilin-related protease. It is therefore not inactivated by metal ions, chelating
agents (EDT A), sulfhydryl reagents or trypsin and chymotrypsin inhibitors. It is
also stable over a wide pH range (4-12,5). Due to the enzyme being effective
against native proteins, it can inactivate endogenous nucleases such as RNases
and DNases. On the other hand, what is termed Pronase by the manufacturer
(Boehringer Mannheim) is a mixture of several unspecific endo- . and
exoproteases which digest proteins to single amino acids. These proteases are
not as effective as Proteinase. Some of these proteases are most probably
inactivated by chelators such as EDTA and mercaptobenzothiazol. They are not
as effective on RNases as Proteinase K which is active in the presence of these
compounds. Inclusion of phenolic adsorbents, BSA and PVPP, minimized
interference from proanthocyanidin. These compounds provide a large amount
of alternative substrate for which proanthocyanidins bind, thereby reducing the
112

their levels to bind RNA. This increases RNA yield and purity. Quality of RNA
is important, if the RNA is to be manipulated further. Intact RNA (Figure 6.28)
was seen as two bands, 28S and 18S rRNA molecules for both red and white
callus types (Lanes labelled Rand W, respectively). This RNA was shown to
translate effectively in a non-radioactive wheat germ system. More proteins
were synthesized from the red callus compared to the white callus. This
indicated that the red callus was more active at the gene level. Gene
expression was presumed to increase to accommodate production enzymes
involved in the secondary process of anthocyanin production. The vacuole has
been shown to be the organelle where anthocyanins accumulate in O. reclinata
callus cells (Section 4.2.2). Accumulation of anthocyanin in the vacuole is most
probably associated with production of proteins involved in transport
mechanisms. Proteins associated with anthocyanin biosynthesis and
accumulation appear to be basic in nature. The non-pigmented white callus
RNA did not translate into basic protein (Figure 6.4).
Radioactive translation studies would have been easier to interpret as the
background proteins of the wheat germ extract would be eliminated as they do
not become radioactively labelled during translation. Several attempts were
made with this technique. The results were masked by unincorporated amino
acids and formation of 40S[35S]Met-tRNA complexes. Formation of these
radioactive complexes occurs during translation and the compounds necessary
for their formation are provided by the extract. Preparation of the wheat germ
extract involves the release of polysomes, ribosomes, ribosomal units,
aminoacyl-tRNA synthases, tRNA and translational factors. The system
involves the incorporation of radioactive amino acid (such as leucine or
methionine) into protein when incubated with ATP, GTP and amino acids.
Ribonucleoprotein particles exist as 40S, 60S and 80S subunits after the
extract has been treated with microccocal nuclease (ANDERSON, STRAUS &
DUDOCK, 1983; CLEMENS, 1984). The wheat germ extract has several other ,
disadvantages. The wheat germ system is said to have low endogenous
translational activity as compared to the reticulocyte lysate system and that
113

translation in the wheat germ extract is far more dependent on the added
mRNA (CLEMENS, 1984). The wheat germ extract has been criticized for its
tendency to produce incomplete products due to premature termination and the
release of peptidyl-tRNA. This factor may be problematic with large mRNA
coding for polypeptides wh ich are larger than 60000 daltons. The polyamines,
spermine and spermidine may overcome this problem by lowering the Mg2+
optimum as there is endonucleolytic cleavage of large mRNAs and this increase
the probability of ribosomes completing the synthesis of full-length products
before the degradation of the template (CLEMENS, 1984). It remains necessary
to optimise translation conditions for RNA isolated from red and white callus
cultures of Oxalis and this would involve the manipulation of Mg2+ and K2+ ion
as the ionic optima for translation are sensitive to the nature and concentration
of the mRNA. Inclusion of RNase inhibitors, such as RNasin (Promega) might
prevent degradation of the template by RNases and thus, allow for completion
and full-length synthesis of translation polypeptides. Digestion of translated
samples with 200 jJg m 1-1 , in the presence of 200 mM EDT A or other protease
inhibitors (e.g. PMSF), prior to electrophoresis may remove unincorporated
amino acids. The translation products may be precipitated out with 90%
acetone. If the proteins under study are soluble in acetone it may be necessary
to precipitate the proteins using 10% TCA (ANDERSON, STRAUS & DUDOCK,
1983).
In vitro translation was initiated to study changes in genome expression which
are induced or influenced by environmental stimuli as several gene products are
shown at the same time . Using this technique, it was discovered that basic
difference between red and white cultures was the synthesis of non-radioactive
translation products which were basic in nature. Optimisation of radioactive
translation will shed further insight to the mechanisms controlling anthocyanin
biosynthesis at the enzymic level.
114
CHAPTER 7
CONCLUSIONS AND FUTURE PROSPECTS
7.1 CONCLUSIONS
The research conducted in this investigation has illustrated the benefits of using
plant tissue culture systems in studying the effects of environmental factors on
the production of economically important secondary metabolites, such as,
anthocyanins. To reiterate, the main objectives of the study were to determine
the inducer of anthocyanin biosynthesis in callus of O. reclinata, and to
optimize pigment production, once anthocyanin synthesis had been stimulated.
Accumulation of red pigment was hypothesized to be in response to external
stimuli. It is well documented that production of anthocyanins in non
expressing plant tissues is usually under environmental control (DOONER,
ROBBINS & JORGENSEN, 1991). Using in vitro culture techniques, light was
recognized as a major inducing factor of anthocyanin biosynthesis in callus
cultures of O. reclinata. Up-regulation of the genes encoding key enzymes
involved in the flavonoid pathway, namely, PAL and CHS, has been reported
to occur once plant tissues are illuminated. De novo synthesis of mRNAs
encoding PAL and CHS takes place in response to UV and high-light
(BATSCHAUER, ROCHOLL, KAISER, NAGATANI, FURUYA & SCHAFER, 1996).
The spectral sensitivity of anthocyanin production differs in different plant
species. However, UV and blue light have often been found to play the most
significant role in stimulating pigment production. It has been suggested that,
anthocyanin genes are expressed in response to light in culture as anthocyanins
act as screening pigments in nature (TAKEDA, 1988; BATSCHAUER,
ROCHOLL, KAISER, NAGATANI, FURUYA & SCHAFER, 1996).
The hormone, 2,4-0, had the most negative effect on production of
anthocyanins. It resulted in significantly lower anthocyanin yield but increased
115
callus growth. This auxin most probably exerts its effect by increasing primary
metabolic activity. It has been speculated that, this hormone acts on the
phenylpropanoid pathway. Substrates for phenylpropanoid metabolism are the
end products of primary metabolic activity. Precursors for anthocyanin
biosynthesis are indirectly provided by primary metabolism. Therefore, 2,4-0
has its influence on the pathwa'y that links primary metabolism to secondary
metabolism. Primary metabolic activity is most probably increased by 2,4-0 and
less energy is spent on secondary metabolic production. This hormone may
increase the incorporation rate of amino acids into proteins and as a result
decrease phenylalanine accumulation. The reduction of the phenylalanine pool
would cause a decrease in phenylpropanoid metabolism. This in turn would
reduce production of flavonoid pigments (SATO, NAKAYAMA & SHIGETA,
1996). Accumulation of phenylalanine due to cessation of cell division results
in elevated PAL and CHS mRNA, leading to the induction of anthocyanin
biosynthesis KAKEGAWA, SUOA, SUGIYAMA & KOMAMINE (1995).
Suspension cultures are a valuable means of propagating plant cells and are
potentially useful for generation of secondary products for industrial purposes
(SATO, NAKAYAMA & SHIGETA, 1996). This was the main motivation for
investigating whether establishment of suspension cultures was possible with
the red and white callus cultures of O. reclinata. Establishment of liquid
cultures was performed with ease. A change from solid medium to liquid
medium may result in the loss of secondary metabolite production by in vitro
propagated plant cells, in certain species (BECKER, 1987). This was not the
case with pigment producing cells of O. reclinata. Light microscopy showed
that, this species maintained anthocyanin biosynthesis and accumulation of
pigments took place in vacuoles. It may be concluded that suspension cultures
are a viable means of mass producing anthocyanin accumulating cells of O.
rec/inata. Therefore, this study has shown the potential use of this culture
method to propagate red cells for use in the food industry.
116
Plant tissue culture studies are invaluable for the optimisation of culture
conditions for anthocyanin biosynthesis. However, their greatest limitation is
that, they fail to recognize endogenous factors that control secondary
metabolism (DIXON & BOLWELL, 1986). Molecular studies were conducted to
gain insight into anthocyanin biosynthesis at the level of gene expression. The
results obtained from two-dimensional electrophoresis showed that polypeptide
differences exist between red and white callus of O. reclinata. Overall, the red
callus was more active genetically as a larger subset of proteins was produced.
Therefore, two-dimensional protein studies showed an increase in gene
expression by the red callus of O. reclinata. These findings were further
endorsed by results obtained with non-radioactive in vitro translation. These
two techniques showed resu lts which were similar in nature. Although, non
radioactive methods are not conventionally used for cell-free translation
purposes, information concerning the differences in gene expression between
red and white callus was extractable using this method. Translation was
confirmed to have taken place for the red and white callus RNA. Polypeptide
patterns showed a far greater number of total polypeptides and their intensity
was far stronger compared to the polypeptide pattern of wheat germ extract
proteins.
Attempts to optimise radio-active translation were in vain. Due to the
expensive nature of the technique of in vitro translation, establishment of non
radioactive cell-free protein synthesis was regarded as a more cost effective
method. Non-radioactive protein synthesis allowed for the study of proteins
whose expression is dependent on external stimulus. Differences in genome
expression between the white and red callus were observed. Some of the
genes whose expression was induced or increased may be associated directly
with the anthocyanin biosynthesis pathway or they may be involved in
accumulation of anthocyanin pigments in vacuoles. However, the observed
changes in polypeptide patterns do not reveal the effects of post-translational
processing of neosynthesized proteins through glycosylation and/or
phosphorylation.
117

7.2 FUTURE PROSPECTS
This study has shown that, in O. rec/inata callus cultures, production of
pigment is induced by high-light illumination. It would be of interest to
investigate which part of the light spectrum is involved in controlling expression
of anthocyanin genes. Many of the genes involved in the flavonoid pathway
have been cloned and characterized from a range of plant species. Due to the
availability of heterologous probes encoding anthocyanin genes, northern
hybridization studies could be conducted to gain further insight into the control
of anthocyanin gene expression.
Polypeptide differences between the red and white callus of O. reclinata were
noted using the techniques of two-dimensional 50S-PAGE and non-radioactive
in vitro translation. Optimisation of radioactive translation would yield more
conclusive results. The major problems experienced with this work was the
production of insoluble 40S[35S]Met-tRNA complexes and the termination of
translation before completion of synthesis of polypeptides. Removal of insoluble
complexes by dialysis or by digestion with protease-free RNase A could be
attempted. Inclusion of commercially available RNase inhibitors in translation
reaction vessels might prevent degradation of the RNA template before
translation is complete. With the optimisation of in vitro translation,
identification of specific genes which are under regulatory control with hybrid
arrested translation could be performed.
118

Long term objectives foreseen for this project would be to isolate and
characterize some of the genes which encode key enzymes of anthocyanin
biosynthesis. Structural comparisons could be made with genes isolated from
other plant species. It has been shown that the key enzymes are encoded by
multigene families in most plant species. It would be interesting to i,nvestigate
whether this holds true for O. reclinata.
Regulatory genes acting upon structural genes of the anthocyanin synthesis
pathway have been identified in all plants where anthocyanin genetics is
established. These regulatory genes encode nuclear proteins which interact
with DNA and act as transcriptional factors (BODEAU & WALBOT, 1993).
Future research should concentrate on the controlling mechanisms of
anthocyanin biosynthesis in O. reclinata. Manipulation of this pathway requires
a greater knowledge about the positive and negative effectors which regulate
anthocyanin production.
In conclusion, the molecular basis for co-ordinate induction of anthocyanin
biosynthesis in plants remains poorly understood. This area should be a subject
for further study.
119
LITERATURE CITED
ANDERSON, C.W., STRAUS, J.W. & B.S. DUDOCK (1983) Preparation of
cell-free protein synthesis system from wheat germ. Methods in
Enzymology 101: 635-639.
BATSCHAUER, A., ROCHOLL, M., KAISER, T., NAGATANI, A., FURUYA, M.
& E. SCHAFER (1996) Blue and UV-A light-regulated CHS expression in
Arabidopsis independent of phytochrome A and phytochrome B. Plant
Journal 9: 63-69.
BAUW, G., VAN MONTAGU, M. & D. INZE (1992) Microsequence analysis of
arabidopsis proteins separated by two-dimensional polyacrylamide gel
electrophoresis: A direct linkage of proteins and genes. In: Methods in
Arabidopsis research. Eds: Koncz, C., Chua, N-H. and J. Schell. World
Scientific Publishing Co., Singapore. ISBN 9810209045. pp.357-377.
BECKER, H. (1987) Regulation of secondary metabolism in plant cell cultures.
In: Plant tissue culture: Volume 3. Eds: Green, C.E., Somers, D.A.,
Hackett, W.P. and D.O. Biesboer. Alan R. Liss, New York. ISBN
0845118021. pp. 199-213.
BELD, M., MARTIN, C., HUlTS, H., STUIT JIE, A.R. & A.G.M. GERATS (1989)
Flavonoid synthesis in Petunia hybrida: partial characterization of
dihydroflavonol-4-reductase gene. Plant Molecular Biology 13: 491-502.
BODEAU, J.P. & V. WALBOT (1995) Genetic regulation of anthocyanin
biosynthesis in embryogenetic maize callus. Maydica 40: 77-83.
120

BRADFORD, M.M. (1976) A rapid and sensitive method for the
quantification of protein utilizing the principle of protein-dye binding.
Analytical Biochemistry 72: 248-254.
BRITSCH, l., DEDIO, J., SAEDLER, H. & G, FORKMANN (1993) Molecular
characterization of flavanone-3-hydroxylases. Consensus sequence,
comparison with related enzymes and the role of conserved histidine
residues. European Journal of Biochemistry 217: 745-754.
BROUILLARD, R. (1982) Chemical structure of anthocyanins. In: Anthocyanins
as flower colours: Ed: P. Markakis. Academic Press, New York.
01244725503. pp.1-3.
BROUILLARD, R. (1988) Flavonoids and flower colour. In: The flavonoids:
Advances in research since 1980. Ed: J.B. Harborne. Chapman and Hall,
London. ISBN 0412287706. pp.525-538.
BROWN, T.A. (1990) Gene cloning: An introduction. Chapman and Hall, New
York.
CHANDLER, V.l., RADICELLA, J.P., ROBBINS, T.P., CHEN, J. & D. TURKS
(1989) Two regulatory genes of the maize anthocyanin pathway are
homologous: isolation of b utilizing R genomic sequences. Plant Cell 1:
1175-1183.
CHAPPELL, J. & K. HAHLBROCK (1984) Transcription of plant defence genes
in response to UV light or fungal elicitor. Nature 311: 76-78.
121
CLEMENS, M.J. (1984) Trans lation of eukaryotic messenger RNA in cell-free
extracts. In: Translation and transcription: A practical approach. Eds:
Hames, B.D. & S.J. Higgins. IRL Press, Oxford. ISBN 09904147525.
pp.231-270.
COE, E.H. Jr., McCORMICK, S.M. & S. MODENA (1981) White Pollen in
Maize. Journal of Hereditary 72: 318-320.
CONE, K. C. & B. BURR (1989) Molecular and genetic analyses of light
requirement for anthocyanin synthesis in maize. In: The genetics of
flavonoids. Eds: Styles, D.E., Gavazzi, G.A. and M.L. Racchi. Edizioni
Unicopli, Milan. pp.143-146.
CONE, K.C., BURR, F.A. & B. BURR (1986) Molecular analysis of of the maize
anthocyanin regulatory locus C 1. Proceedings of the National Academy
of Sciences, USA 9631-9638.
CONE, K.C., COCCIOLONE, S.M., BURR, F.A. & B. BURR (1993) Maize
anthocyanin regulatory gene PI is a duplicate of C1 that functions in the
plant. Plant Cell 5: 1795-1805.
CONSTABEL, F., SHYLUK, J. P. & O. L. GAMBORG (1971) The effect of
hormones on anthocyanin accumulation in cell cultures of Hap/opappus
gracilis. Planta 96: 306-316.
CRAMER, C.L., EDWARDS, K., DRON, M., LIANG, X., DILDINE, S. L.,
BOLWELL, G.P., LAMB, C.J. & W. SCHUCH (1989a) Phenylalanine
ammonia-lyase gene organization and structure. Plant Molecular Biology
12: 367-383.
122
CRESSWELL, R. FOWLER, M.W. STAFFORD, A. & G. STEPAN-SARKISSIAN
(1989) Plant cell and tissue culture. Open University, Milton-Keynes. ISBN
0335151620.
CROUCH, N.R. & J. VAN STADEN (1994) In vitro propagation of a number of
South African Oxalis species . South African Journal of Botany 60:
134-135.
CROUCH, N.R., VAN STADEN, L.F., VAN STADEN, J. DREWES, S.E. & H.J.
MEYER (1993) Accumulation of cyanidin-3-glucoside in callus cultures of
Oxalis reclinata. Journal of Plant Physiology 142: 109-111.
DELLAPORTA, S.L., GREENBLATT, I.M., KERMICLE, J.L., HICKS, J.B. & S.R.
WESSLER (1988) Molecular cloning of the R-nj gene by transposon
tagging with Ac. In: Chromosome structure and function: Impact of new
concepts. Eds: Gustafon, J.P. and R. Appels. Plenum Press, New York.
0306429330. pp.263-282.
DEIKMAN, J. & P.E. HAMMER (1995) Induction of anthocyanin accumulation
by cytokinins in Arabidopsis thaliana. Plant Ph ysiology 1 08: 47-57.
DIALLINAS, G. & A.K. KANELLIS (1994) A phenylalanine ammonia-lyase gene
from melon fruit: DNA cloning, sequence and expression in response to
development and wounding. Plant Molecular Biology 26: 473-479.
DIXON, R.A. & G.P. BOLWELL (1986) Modulation of the phenylpropanoid
pathway in bean (Phaseolus vulgaris) cell suspension cultures. In:
Secondary metabolism in plant cell cultures. Eds: Morris, P., Scragg, A.H.,
Stafford, A. and M.W. Fowler. Cambridge University Press, Cambridge.
0521328896. pp.89-102.
123

DODDS, J. H. & L. W. ROBERTS (1985) Experiments in tissue culture: Second
Edition. Cambridge University Press, London. ISBN 0521304784.
DOONER, H.K., ROBBINS, T.P. & R.A. JORGENSEN (1991) Genetic and
developmental control of ~nthocyanin biosynthesis. Annual Review in
Genetics 25: 173-1 99.
DOONER H. K., WECK, E., ADAMS, S., RALSTON, E., FAVREAU, M. & J.
ENGLISH (1985) A molecular genetic analysis of insertion in the bronze
locus in maize. Molecular and General Genetics 200: 240-246.
DOUGLAS, C., HOFFMANN, H., SCHULZ, W. & K. HAHLBROCK (1987)
Structure and elicitor or UV-light stimulated expression of two
4-coumarate: CoA ligase genes in parsley. EMBO Journal 6: 1189-1192.
DUNN, M.J. & K. PATEL (1987) Two-dimensional electrophoresis using
immobilized (1987) pH gradients in the first dimension. In: Methods in
enzymology: New protein techniques. Ed: Walker, J.M. Humana Press,
New Jersey. pp.203-216.
EDWARDS, K., CRAMER, C.L., BOLWELL, G.P., DIXON, R.A., SCHUCH, W.
& C.J. LAMB (1985) Rapid transient induction of phenylalanine
ammonia-lyase mRNA in elicitor-treated bean cells. Proceedings of the
National Academy of Science, USA. 82: 6731-6735.
EPPING, B., KITTEL, M., RUHNAU, B. & V. HEMLEBEN (1990) Isolation and
sequence analysis of a chalcone synthase DNA of Mattholia incana R Sr.
(Srassicaceae). Plant Molecular Biology 14: 1061-1063.
FEINBAUM, R.L. & F.M. AUSEBEL (1988) Transcriptional regulation of the
Arabidopsis thaliana chalcone synthase gene. Molecular and Cell Biology
8: 1985-1992.
124
FLORES, S. & E.M. TOBIN (1986) 8enzyladenine modulation of the expression
two genes for nuclear-encoded chloroplast proteins in Lemma gibba:
Apparent post-transcriptional regulation. Planta 168: 340-349.
FOSKET, D.E. (1994) Plant growth and development: A molecular approach,
Academic Press, New York, 0122624300. pp.62-65.
FRITZEMEIER, K-H., CRETIN, C., KOMBRIMNK, E., ROHWER, F., TAYLOR, J.,
SCHEEL, D. & K. HAHLBROCK (1987) Transient induction of
phenylalanine ammonia-lyase and 4- coumarate: CoA ligase mRNA's in
potato leaves infected with virulent or avirulent races of Phytophthora
infestans. Plant Physiology 85: 6415-6419.
GEGENHEIMER, P. (1990) Preparation of extracts from plants. Methods in
Enzymology 182: 174-193.
GLEITZ, J. & H.U. SEITZ (1989) Induction of chalcone synthase in cell
suspension cultures of carrot (Daucus carota L. ssp. sativus) by ultraviolet
light: evidence for two different forms of chalcone synthase. Planta 179:
323 -330.
HAGERMAN, A.E. & loG. BUTLER (1981) The specificity of
proa nthocya n id in-p rotei n interactions. Journalo f Biological Chemistry 256:
4494-4497.
HARBORNE, J.B. (1988) The flavonoids. Chapman and Hall, London.
HARI, V.( 1981) A method for two-dimensional electrophoresis of leaf proteins.
Analytical Biochemistry 113: 332-335.
HEYWOOD, V. H. (1978) Flowering plants of the world. Oxford University
Press, Oxford.
125
HINDERER, W., PETERSEN, M. & H.U. SEITZ (1994) Inhibition of flavonoid
biosynthesis by gibberellic acid in cell suspension cultures of Daucus
carota L. Planta 160: 544 -549.
HOLDEN, P.R. HOLDEN, M.A. · & M.M. YEOMAN (1988) Variation in the
secondary metabolism of cultured plant cells. In: Manipulating secondary
metabolism in culture. Eds: Robins, R.J. & M.J.C. Rhodes. Cambridge
University Press, Cambridge. ISBN 0521362547. pp.15-30.
HOLTON, T.A. & E.C. CORNISH (1995) Genetics and biochemistry of
anthocyanin biosynthesis . Plant Cell 7: 1071-1083.
HOOLEY, R. (1994) Gibberellins: perception, transduction and responses. Plant
Molecular Biology 26: 1529-1555.
IBRAHIM, R.K., THAKUR, M.l. & B. PERMANAND (1971) Formation of
anthocyanin in callus cultures. L/yodia 34: 175-182.
ILAN, A., ZANEWICH, K.P., ROOD, S.B. & O.K. DOUGALL (1994) Gibberellic
acid decreases anthocyanin accumulation in wild carrot cell suspension
cultures but does not alter 3'-nucleotidase activity. Physiologia Plantarum
92: 47-52.
JACKMAN, R.l., YADA, R.Y., TUNG, M.A. & R.A. SPEERS (1987)
Anthocyanins as food colorants: A review. Journal of Food Biochemistry
11: 21 0-247.
JENDE-STRIO, B. (1993) Genetic control of flavonoid biosynthesis in barley.
Hereditas 119: 187-204.
KAKEGAWA, K., SUDA, J., SUGIYAMA, M & A. KOMAMINE (1995)
Regulation of anthocyanin biosynthesis in cell suspension cultures of Vitis
in relation to cell division . Physiologia Plantarum 94: 661-666.
126

KINNERSLEY, A.M. & O.K. DOUGALL (1980) Increase in anthocyanin yield
from wild-carrot cell cultures by a selection system based on
cell-aggregate size. Maydica 149: 200-204.
KLEIN, R.M. (1960) Plant tissue cultures, as a possible source of plant
constituents. Economical Botany. 14: 286-289.
KOES, R.E., SPEL T, C.E. & J.N.M. MOL (1989) The chalcone synthase
multigene family of Petunia hybrida (V30): differential, light-regulated
expression during flower development and UV induction. Plant Molecular
Biology 12: 213-225.
KOES, R.E., QUATTROCHIO, F. & J.N.M. MOL (1994) The flavonoid
biosynthetic pathway in plants: function and evolution. BioEssays 16:
123-132.
KOES, R.E., VAN BLOCKLAND, R., aUATTROCHIO, F., VAN TUNEN, A. J. &
J.N.M. MOL (1990) Chalcone synthase promoters in petunia are active in
pigmented and unpigmented cell types. Plant Cell 2: 379-384.
KOOSTRA, A. (1994) Protection from UV-B induced DNA damage by
flavonoids. Plant Molecular Biology 26: 771-774.
KROON, J., SOUER, E., DE GRAAFF, A., XUE, Y. MOL, J. & R. KOES (1994)
Cloning and structural analysis of the anthocyanin pigmentation locus Rt
of Petunia hybrida: Characterization of insertion sequences in two mutant
alleles. Plant Journal 5: 69-80.
LAEMMU, U.K. (1970) Cleavage of structural proteins during the assembly of
bacteriophage T4. Nature 227: 680-685.
LAWTON, M.A., DIXON, R.A., HAHLBROCK, K. & C.J. LAMB (1983) Rapid
induction of the synthesis of phenylalanine ammonia-lyase and chalcone
127

synthase in elicitor-treated plant cells. European Journal of Biochemistry
129: 593-601.
LAWTON, M.A., DIXON, R.A., HAHLBROCK, K. & C.J. LAMB (1983) Elicitor
induction of mRNA activity: rapid effects of elicitor on phenylalanine
ammonia-lyase and chalcone synthase mRNA activities in bean cells.
European Journal of Biochemistry 130: 131-139.
lINSMAEIR, E.M. & F. SKOOG (1965) Organic growth factor requirements of
tobacco tissue cultures. Physiologia Plantarum 18: 100-127.
lI, J., OU-LEE, T.M., RABA, R., AMUNDSON & R.l. LAST (1993) Arabidopsis
flavonoid mutants hypersensitive to UV-B radiation. Plant Cell 4:
1229-1236.
LOIS, R., DIETRICH, A. & HAHLBROCK (1989) A phenylalanine ammonia lyase
gene from parsley: structure, regulation and identification of elicitor and
light responsive cis-acting elements. EMBO Journal 8: 1641-1648.
LOOMIS, W. D. (1974) Overcoming problems of phenolics and quinones in the
isolation of plant enzymes and organelles. Methods in Enzymology 31:
528-544.
LUDWIG, S.R., HABERA, l.F., DELLAPORTA, S.l. & S.R. WESSLER (1989) Lc,
a member of the maize R gene family responsible for tissue-specific
anthocyanin production, encodes a protein similar to transcription
activators and contains the myc-homology region. Proceedings of the
National Academy of Sciences, USA 86: 7092-7096.
MARTIN, C., CARPENTER, R., SOMMER, H., SAEDLER, H. & E.S. COEN
(1985) Molecular analysis of instability in flower pigmentation of
Antirrhinum majus, following isolation of pallida locus by transposon
tagging. EMBO Journal 1625-1630.
128
MARTIN, C., PRESCOTT, A., MACKAY, S., BARTLETT, J. & E. VRIJLANDT
(1991) Control of anthocyanin biosynthesis in flowers of Antirrhinum
majus. Plant Journal 1 : 37-49.
MARTIN, C. & T. GERATS (1993) Control of pigment biosynthesis genes
during petal development. Plant Cell 5: 1253-1264.
MAYER, J.E., HAHNE, G., PALME, K. & J. SCHELL (1987) A simple procedure
and general plant tissue extraction for two-dimensional gel electrophoresis.
Plant Cell Reports 6: 77-81.
MAZZA, G. & E. MANIATI (1993) Anthocyanins in fruits, vegetables and
grains. CRC Press, Baco Raton . ISBN 08493017266.
McCARTY, D.R. CARSON, C.B., STINARD, P.S. & D.S. ROBERTSON (1989)
Molecular analysis of viviparous- 1: an absiscic acid insensitive mutant of
maize. Plant Cell 1 : 523-532.
MEHDY, M.C. & C.J. LAMB (1987) Chalcone isomerase DNA cloning and
mRNA induction by funga l elicitor, wounding and infection. EMBO Journal
6: 1572-1579.
MEYER, H.J. & J. VAN STADEN (1995) The in vitro production of anthocyanin
from callus cultures of Oxalis linearis . Plant, Cell, Tissue and Organ Culture
40: 55-58 .
MINAMI, E.I., OZEKI, Y., MATSUOKA, M., KOIZUKA, N. & Y. TANAKA (1989)
Structure and some characterization of the gene for phenylalanine
ammonia-lyase from rice plants. European Journal of Biochemistry 185:
19-25.
MORI, T., SAKURAI, M., SHIGETA, J-C., YOSHIDA, K. & T. KONDO (1993)
Formation of anthocyanin from cells cultured from different parts of
strawberry plants. Journal of Food Science 58: 788-792 .
129

MORRISSEY, J.H. (1981) Silver stain for protein in polyacrylamide gels: a
modified procedure with enhanced uniform sensitivity. Analytical
Biochemistry 117: 307-3 10.
MURASHIGE, T. & F. SKOOG (1962) A revised medium for rapid growth and
bioassays with tobacco tissue cultures. Physiologia Plantarum 15:
473-497.
NIESBACH-KLOGEN, U., BARZEN, E., BERNHARDT, J. ROHDE, W.,
SHWARZ-SOMMER, Z., REIF, H. J., WIENAND, U. & H. SAEDLER (1987)
Chalcone synthase genes in plants: a tool to study evolutionary
relationships. Journal of Molecular Evolution 26: 213-235.
NICKELL, L.G. (1962) Submerged growth of plant cells. Advances in Applied
Microbiology 4: 213-236.
NOZUE, M., KUBO, H., NISHIMURA, M., KATOU, A., HATTORI, C., USUDA,
N., NAGATA, T. & H. YASUDA (1993) Characterization of intravacuolar
pigmented structures in anthocyanin-containing cells of sweet potato
suspension cultures. Plant Cell Physiology 34: 803-808.
O'FARRELL, P.H. (1975) High resolution two-dimensional electrophoresis.
Journal of Biological Chemistry 250: 4007-4021.
O'REILLY, C., SHEPARD, N., PEREIRA, A., SHWARZ-SOMMER, Z, BERTRAM,
I., ROBERTSON, D.S., PETERSON, P.A. & H. SAEDLER (1985) Molecular
cloning of the a 1 locus of Zea mays using the transposable elements En
and Mu1. EMBO Journal 4: 877-812.
OUElHAZI, lo, FILAU, M., CRECHE, J., CHENIEUX & RIDEAU (1993) Effects
of 2,4-D removal on the synthesis of specific proteins by Catharanthus
roseus cell cultures. Plan t Growth Regulation 13: 287-295.
130
OZEKI, V., DAVIES, E. & E. TAKEDA (1993) Structure expression of chalcone
synthase gene in carrot suspension cultured cells regulated by 2,4-0. Plant
Cell Physiology 34: 1029-1037.
OZEKI, V. & A. KOMAMINE (1981) Induction of anthocyanin synthesis in
relation to embryogenesis in a carrot suspension culture: correlation of
metabolic differentiation with morphological differentiation. Plant
Physiology 53: 570-577.
OZEKI, V. & A. KOMAMINE (1983) Effects of inoculum density, zeatin and
sucrose on anthocyanin accumulation in a carrot suspension culture. Plant,
Cell, Tissue and Organ Culture 5: 45-53.
OZEKI, V. & A. KOMAMINE (1985a) Changes in activity of enzymes involved
in general phenylpropanoid metabolism during the induction and reduction
of anthocyanin synthesis in carrot suspension culture as regulated by
2,4-D. Plant Cell Physiology 26: 903-911.
OZEKI, V. & A. KOMAMINE (1985b) Induction of anthocyanin synthesis in
relation to embryogenesis in a carrot suspension culture: a model system
for the study of expression and repression of secondary metabolism. In:
Primary and secondary metabolism of plant cell cultures. Eds : Neumann,
K-H., Barz, W. and E. Reinhard. Springer-Verlag, Berlin. ISBN
0387157972. pp.99-116.
OZEKI, V. & A. KOMAMINE (1986) . Effects of growth regulators on the
induction of anthocyanin synthesis in a carrot suspension culture. Plant
Cell Physiology 27: 1361-1368.
OZEKI, V., KOMAMINE, A. & V. TANAKA (1990) Induction and repression of
phenylalanine ammonia-lyase and chalcone synthase enzyme proteins and
131
mRNAs in carrot cell suspension cultures regulated by 2,4-D. Physiologia
Plantarum 78: 400-408.
PAZ-ARES, J. WIENAND, U., PETERSON, P. A. & H. SAEDLER (1987) The
regulatory c 1 locus of Zea mays encodes a protein with homology to the
myb proto-oncogene products and with structural similarities to
transcriptional activators. EMBO Journal 5: 829-833.
PERROT, G.H. & K.C. CONE (1989) Nucleotide sequences of the maize R-S
gene. Nucleic Acids Research 17: 8003-8005.
POLLARD, J.W. (1984) Two-dimensional electrophoresis of proteins. In:
Methods in molecular biology, Volume 1. Ed: J.M. Walker. Humana Press,
New Jersey. ISBN 0896030628 .
RYDER, T.B., HEDRICK, S.A., BELL, J.N., LIANG, X., CLOUSE, S. D. & C.J.
LAMB (1987) Organization and differential activation of a gene family
encoding the plant defense enzyme chalcone synthase in Phaseolus
vulgaris. Molecular and General Genetics 210: 219-233.
SAKAMOTO, K., IIDA, K., SAWAMURA, K., ASADA, Y., YOSHIKAWA, T. &
T. FURUYA (1993) Effects of nutrients on anthocyanin production in
cultured cells of Aralia cordata . Phytochemistry 33: 357- 360.
SALTER, T. M. (1944) The genus Oxalis in South Africa. A taxonomic revision.
Journal of South African Botany, Supplement (1).
SANTONI, V., BELLINI, C. & M. CABOCHE (1994) Use of two-dimensional
protein-pattern analysis for the characterization of Arabidopsis thaliana
mutants. Planta 192: 557-566.
SATO, K., NAKAYAMA, M . & J-1. SHIGETA (1996) Culturing conditions
affecting the production of anthocyanin in suspended cell cultures of
strawberry. Plant Science 113: 91-98.
132
SOMMER, H. & H. SAEDlER (1986) Structure of the chalcone synthase gene
of Antirrhinum majus. Molecular and General Genetics 202: 429-433.
SPARVOll, F., MARTIN, C., SCIENZA, A., GAVAZZI, G. & C. TONELLI (1994)
Cloning and molecular analysis of structural genes involved in flavonoid
and stilbene biosynthesis in grape (Vitis vinifera l.) Plant Molecualr Biology
24: 743-755.
STAFFORD, A. (1991 a) Natural products and metabolites from plants and plant
tissue culture. In: Plant tissue cultures. Eds: Stafford, A. and G. Warren.
Open University Press, Great Britain. ISBN 0335151620. pp.124-161.
STAFFORD, H. (1991 b) Flavonoid evolution: an enzymic approach. Plant
Physiology 96: 680-685.
SUZUKI, M. (1995) Enhancement of anthocyanin accumulation by high osmotic ,
stress and low pH in grape cells (Vitis hybrids). Journal of Plant Physiology
147.150-155.
SWAIN, T. (1986) The evolution of flavonoids. In: Plant flavonoids in biology
and medicine. Biochemical, pharmacological, and structure-activity
relationships. Eds: Cody, V. Middleton, E. and J.B. Harborne. Alan R. liss,
New York. ISBN 0845150634. pp.1-14.
TAKEDA, J.T. (1988) light-induced synthesis of anthocyanin in carrot cells in
suspension: The factors affecting anthocyanin production. Journal of
Experimental Botany 39: 1065-1077.
TAKEUCHI, A., MATSUMOTO, S. & M. HAYATSU (1994) Chalcone synthase
from Camellia sinensis: Isolation of the cDNAs and the organ-specific and
sugar responsive expression of the genes. Plant Cell Physiology 35(7):
1011-1018.
133

TANAKA, Y., MATSUOKA, M., YAMAMOTO, N., OHASHI, Y.,
KANO-MURAKAMI, Y. & Y. OZEKI (1989) Structure and characterization
of a DNA clone for phenylalanine ammonia lyase from cut-injured roots of
sweet potato. Plant Physiology 90: 1403-1409.
TAYLOR, L.P. & R. JORGENSEN (1992) Conditional male sterility in chalcone
synthase-deficient petunia. Journal of Hereditas 83: 11-17.
TIMBERLAKE, C.F. & B.S. HENRY (1986) Plant pigments as natural food
colours. Endeavour (OXF) 10: 31-36.
TODD, J.J. & L. VODKIN (1993) Pigmented soybean (Glycine Max) seed coats
accumulate proanthocyanidins during development. Plant Physiology 102:
663-670.
VAN DER MEER, I.M., STUIT JIE, A.R. & J.N.M. MOL (1993) Regulation of
general phenylpropanoid and flavonoid gene expression. In: Control of
plant gene expression. Ed: Verma, D-P. S. CRC Press, Baco Rato. ISBN
84938866. pp.125 -155 .
VAN TUNEN, A.J., KOES, R.E., SPELT, C.E., VAN DER KROL, R. STUIT JIE,
A.R. & J.N.M. MOL (1988) Cloning of the two chalcone flavanone
isomerase genes from Petunia hybrida: co-ordinate, light-regulated and
differential expression of flavonoid genes. EMBO Journal 2: 1257-1263.
VAN TUNEN, A.J. & J .N.M. MOL (1991) Control of flavonoid synthesis and
manipulation of flower colour. In: Plant biotechnology, volume 2:
Developmental regulation of plant gene expression. Ed: Grierson, D.,
Chapman and Hall, New York. ISBN 0412025310. pp.95-129.
VAN TUNEN, A.J., MUIR, L., BROUNS, G.S., RIENSTRA, J-D., KOES R. E. &
J.N.M. MOL (1990) Chalcone synthase promoters in Petunia are active in
pigmented and unpigmented cell types. Plant Cell 2: 379-392.
134

WANG, C-H. & VODKIN, L. O. (1994) Extraction of RNA from tissues
containing high levels of procyanidin that bind RNA. Plant Molecular
Reports 12: 132-145.
WANNER, L.A., L1, G., WARE, D., SOMSSICH, I. & K. DAVIS (1995) The
phenylalanine ammonia-lyase gene family in Arabidopsis thaliana. Plant
Molecular Biology 27: 327-338.
WEISS, D. & A.H. HALEVY (1989) Stamens and gibberellin in the regulation of
corolla pigmentation and growth in Petunia hybrida. Planta 179: 89-96.
WEISS, D., VAN TUNEN, A.J., HALEVY, A.H., MOL, J.N. M.& A.G. M.
GERATS (1990) Stamens and gibberellic acid in the regulation of flavonoid
gene expression in the corolla of Petunia hybrida. Plant Physiology 94:
511-515.
WINGENDER, R., ROHRIG, H., HORICKE, C., WING, D. & J. SCHELL (1989)
Differential regulation of soybean chalcone synthase genes in plant
defence, symbiosis and upon environmental stimuli. Molecular and General
Genetics 218: 315-318.
YAMAMOTO, H., YAN, K., IEDA, K., TANAKA, T., IINUMA, M. AND M.
MIZUNO (1993) Flavonol glycosides production in cell suspension cultures
of Vancouveria hexandra. Phytochemistry 33 (4): 841-846.
135
Related Documents