Of Licensed Practical Nurses

Welcome message from author
This document is posted to help you gain knowledge. Please leave a comment to let me know what you think about it! Share it to your friends and learn new things together.
Transcript

Of Licensed Practical Nurses
Supply, Demand, and Use of Licensed Practical Nurses
November 2004
Prepared for the Department of Health and Human Services, Health Resources and Services Administration, Bureau of Health Professions, Office of Workforce Evaluation and Quality Assurance by the Center for Health Workforce Distribution Studies, University of California, San Francisco under Grant # 1-U79-HP-00032-01

Prepared by
Jean Ann Seago, PhD, RN Joanne Spetz, PhD
Susan Chapman, PhD, RN Wendy Dyer, MS
Kevin Grumbach, MD Center for California Health Workforce Studies
University of California, San Francisco

2
Table of Contents
Exe cut i ve Sum m ary 3
Cha pter 1: Int ro duction 7
Chapter 2: The LPN Workforce 13
Chapte r 3: Sc ope of Practic e and Practice Acts 31
Chapter 4: Education of LPNs 38
Chapter 5: Factors Affect ing the Supply and Demand for LPNs 44
Chapter 6: Perspecti ves of the Em ployers, Educators, St ate Boards, 73 and Nurses
Chapter 7: Summary, Conclusion s, and Recommendations 86
Appendice s 91

3
Executive Summary
Although licensed practical nurses (LPNs) organized into professional groups as early as 1941, there is little in the literature about the practice, work, demand for, or efficient utilization of the licensed practical nurse. There also is little guidance about how to make effective use of these practitioners' skills to enhance patient care and augment the nurse workforce. Recently there has been an increased interest in trying new care delivery models in acute care hospitals using LPNs (Kenney, 2001). In the 1990s, publications explored the creative use of LPNs in critical care, as advice nurses, and in intravenous therapy teams (Buccini, 1994;Ingersoll, 1995; Intravenous Nurses Society, 1997;Eriksen, 1992;Roth, 1993). However, little systematic study has occurred to explore these roles.
This study examines the demand, supply, utilization, and scope of practice of LPNs in the United States. Particular attention is paid to educational issues, career mobility, geographic distribution, and the ability of LPNs to substitute for registered nurses. The research team analyzed data from the Bureau of the Census, American Hospital Association, National Council of State Boards of Nursing, and Centers for Medicare and Medicaid Services to learn about LPN characteristics, education, and employment. Scope of practice information was obtained and characterized to learn how practice regulations vary nationally and how they affect the demand for LPNs. Key informant interviews and focus groups were conducted in four States: California, Iowa, Louisiana, and Massachusetts. The findings of the study are provided in this report.
Data from the Bureau of Labor Statistics’s Current Population Survey to describe the demographic characteristics of LPNs, was compared to registered nurses (RNs) from 1984 to 2001. The data indicate the following similarities and differences between LPNs and RNs.
Similarities:
• Both workforces are aging, with LPNs being slightly older than RNs on average; • Males represent a small percent of both workforces, but are slowly increasing; • The western region of the U.S. has the lowest numbers of LPNs and RNs relative to the
population; • On average, RNs and LPNs work between 36 and 38 hours per week; • The shares of RNs and LPNs working in offices and clinics of physicians doubled
between 1984 and 2001; and • The hourly pay rate of RNs and LPNs increased 19 percent between 1984 and 2001.
Differences:
• The RN workforce is larger than the LPN workforce, but the actual size of the LPN workforce is unclear because the available data are conflicting;
• Compared to RNs, more LPNs live in the South and fewer in the Northeast; • Fewer LPNs are foreign-born, whereas an increasing percent of RNs are immigrants; • RNs work in hospitals in greater proportions than LPNs, and the share of LPNs working
in hospitals declined more than RNs between 1984 and 2001; • The percent of LPNs working in nursing and personal care facilities increased between
1984 and 2001, but the percent of RNs did not; and

4
• By 2001, the percentage of LPNs working in the private sector was greater than the percent of RNs working in the private sector.
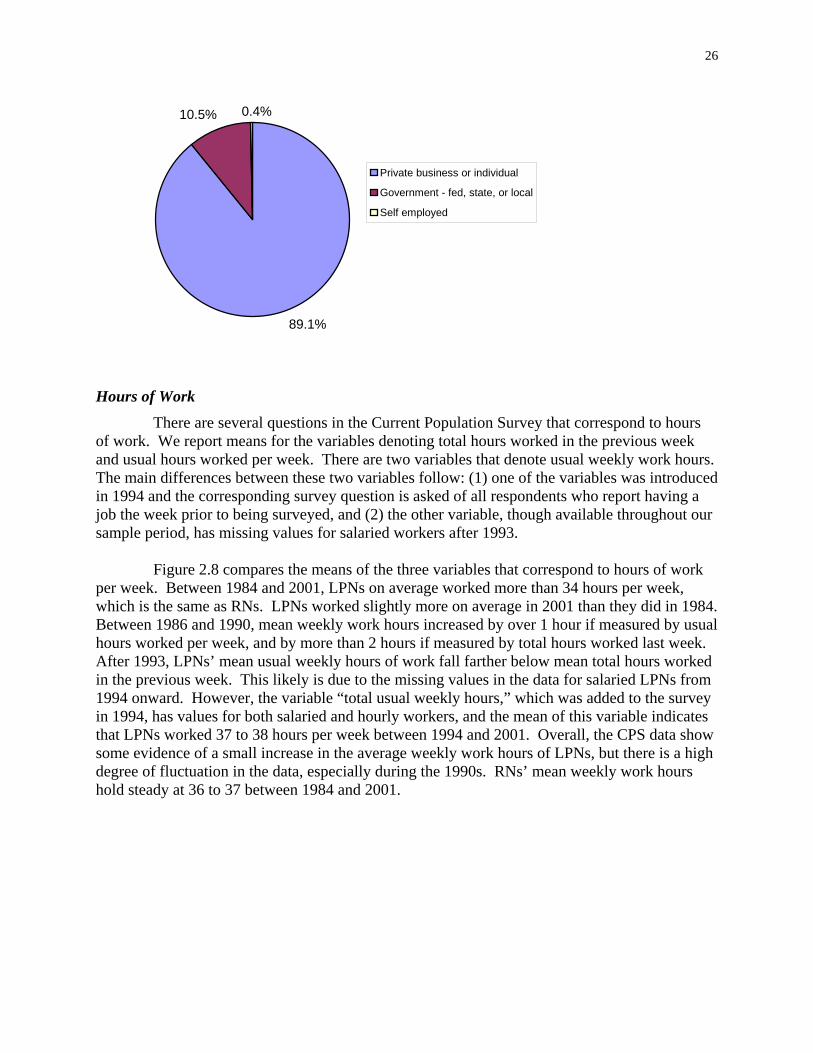
State boards of nursing regulate the practice of LPNs. Most States have a single board that oversees RNs and LPNs. Some States have separate boards for RNs and LPNs. The boards are responsible for developing scope of practice regulations and issuing licenses. They also have disciplinary responsibility and can revoke licenses. There are similarities in the nursing practice acts across States, but variation in how the States express the details of the work of practical nurses. Most States have relatively flexible practice requirements and not very specific about the tasks that are permitted. However, some States have very restrictive practice regulations and/or specific detailing of tasks that can and cannot be done by practical nurses. These data are used in Chapter 5 to examine whether the restrictiveness and specificity of the scope of practice affect demand for LPNs. These data suggest that it may be possible to identify States that could reasonably increase their utilization of practical nurses, particularly in hospitals, by reducing the restrictiveness of their practice.
Since the 1990s, the number of LPN education programs has remained relatively stable but there has been a decline in the number of enrolled students and graduates. Despite the drop in graduates, the total number of active licenses increased slightly through the 1990s. This suggests that LPNs are remaining in the workforce at higher rates than in previous years. The number of first time US-educated graduates who are taking the LPN licensing examination has dropped, but the percentage of those passing the examination has remained relatively constant.
LPN educational requirements vary among the States and territories. Most States specify the content and number of hours of training, and some are more detailed than others. Most curricula teach similar basic nursing skills, such as measuring vital signs, patient data collection, patient care and comfort measures, and oral medication administration. Most States have additional training requirements for more advanced skills, such as phlebotomy, IV infusion, and IV medication administration. Even though requirements vary across States, States generally license LPNs that have been licensed in other States without further requirement.
Key informant interviews with leaders of State boards of nursing, LPN education programs, hospitals, and nursing homes allowed us to compare the actual practice of LPNs with the written regulations. State nursing board leaders are aware of the differences in scope of practice regulations across States, and do not find these differences troublesome. They also recognize that employers establish their own internal practice guidelines, which may be more restrictive than the legal scope of practice. Some hospital and education leaders think their States’ scopes of practice are too restrictive. Nursing home leaders agreed that LPNs are essential to the provision of care in their facilities; the scope of practice of LPNs is perfectly suited to the needs of their patients. Hospital leaders varied in their willingness to employ LPNs. Most recognized that experienced, intelligent LPNs could be an asset to a nursing care team, but found that the scope of practice of LPNs was too limited to allow for significant employment of LPNs in acute care settings.
Participants in the focus groups discussed their perceptions of their scope of practice, which occasionally differed from State regulations. Most of the LPNs Stated an intention to

5
return to school to become RNs, but few were enrolled in RN programs. Barriers such as time, the need to keep working, challenges in getting into courses, and family issues were among those that kept LPNs from pursuing further education. Most LPNs and RNs felt they have good working relationships with each other. Some LPNs expressed resentment about the higher wages paid to RNs for what is seen by the LPNs as similar work. Other LPNs said they did not envy RNs, because RNs have a greater amount of paperwork to complete and thus have less time to be with patients. Some RNs expressed discontent about the need to supervise LPNs because supervision adds to their workload.
Based on findings in this report, we make the following recommendations:
1. The LPN could be used to augment the workforce during RN shortages. However, the role of LPNs is limited by their scope of practice. How much the LPN can be used depends on the ability of States to create a more flexible LPN scope of practice. States should assess whether there is evidence that lessening practice restrictions would negatively impact patient care before making changes to the scope of practice. Careful study of the use of the LPN in various settings is necessary to determine positive or negative impact on patient outcomes. Federal and State governments should support research on the effect of LPNs on quality of care.
2. Employers should work to create teams, of RNs and LPNs to share workload appropriately in both acute and long-term care.
3. Boards of Nursing must ensure that bedside RNs and LPNs, nurse managers, and hospital and long term care executives have a common and accurate understanding of the scopes of practice of RNs and LPNs. Employers should clarify for their employees the differences between State scopes of practice and individual institutional policy.
4. State Boards of Nursing should work toward standardization of LPN training, both at the basic education preparation level and beyond. One mechanism to achieve greater uniformity might involve the identification of national standards for entry level and advanced education of LPNs.
5. Nurse educators need to facilitate articulation between LPN and RN license requirements. More efficient “laddering” of workers from lower skill to higher skill healthcare jobs benefits both workers and employees, and will ultimately decrease the total cost to educate nurses.
6. Based on data related to gender, age, marital status, and ethnicity, it appears that LPNs and RNs come from essentially the same pool or potential workers. Therefore, the long-term RN shortage is unlikely be solved with an influx of LPNs, because increased recruitment of students into LPN programs will likely offset recruitment into RN programs.
7. Employers should examine how the work of licensed nurses could be allocated safely and reasonably, so that RNs are not overwhelmed and LPNs can practice to their full scope of practice. Although LPNs cannot directly substitute for RNs, many tasks traditionally completed by RNs can be accomplished by LPNs, with appropriate training.

6
8. Employers should consider providing additional compensation to LPNs who complete additional training and obtain certifications beyond the basic LPN license, to provide LPNs with incentives to continue their education.
9. The Bureau of Health Professions and State Board of Nursing should strive to educate the public about the LPN profession, both to give recognition to practicing LPNs and to encourage more people to pursue a career in practical nursing.
10. The Bureau of the Health Professions, National Council of State Boards of Nursing, or individual State Boards of Nursing should create a national database to track both LPNs and RNs to have accurate data for prediction of nurse and healthcare workforce needs.
References
Buccini, R., & Ridings, L. E. (1994). Using licensed vocational nurses to provide telephone patient instructions in a health maintenance organization. Journal of Nursing Administration, 24(1), 27-33.
Eriksen, L. R., Quandt, B., Teinert, D., Look, D. S., Loosle, R., Mackey, G., et al. (1992). A registered nurse-licensed vocational nurse partnership model for critical care nursing. Journal of Nursing Administration, 22(12), 28-38.
Ingersoll, G. L. (1995). Licensed practical nurses in critical care areas: intensive care unit nurses' perceptions about the role. Heart and Lung: Journal of Critical Care, 24(1), 83-88.
Intravenous Nurses Society. (1997). The role of the licensed practical nurse and the licensed vocational nurse in the clinical practice of intravenous nursing. J Intraven Nurs, 20(2), 75-76.
Kenney, P. A. (2001). Maintaining quality care during a nursing shortage using licensed practical nurses in acute care. Journal of Nursing Care Quality, 15(4), 60-68.
Roth, D. (1993). Integrating the licensed practical nurse and the licensed vocational nurse into the specialty of intravenous nursing. Journal of Intravenous Nursing, 16(3), 156-166.

7
Chapter 1: Introduction
Background and Significance
Licensed practical nurses (LPNs), called Licensed Vocational Nurses (LPNs) in Texas and California (Seago & Ash, 2002), have been working with physicians and registered nurses in many settings for years. Some women who cared for others but had no formal education frequently called themselves “practical nurses” (White & Duncan, 2001). However there were early schools of practical nursing including the Ballard School in New York City founded in 1892, the Thompson Practical Nursing School in Vermont in 1907, and the Household Nursing School in Boston in 1918 (White & Duncan, 2001). These schools followed the opening of three of the first schools of “trained” nursing in the United States. These “trained” nursing schools were Bellevue Hospital in New York City, Massachusetts General Hospital in Boston, and New Haven Hospital in Connecticut, and they opened around 1873. LPNs organized into professional groups as early as 1941 with the creation of the National Association for Practical Nurse Education & Service, Inc. (NAPNES) and the National Federation of Licensed Practical Nurses in 1949 (NFLPN) (National Association for Practical Nurses Education & Service, 2004).
In a conversation in March of 2004 with Helen Larsen, the Executive Director for the National Association for Practical Nurse Education and Service, Larsen spoke about the State-by--State evolution of giving waivers to and licensing practical nurses.
In 1946 NAPNES recommended that States become active in seeking licensure for "Practical Nurses" and State-by-State it happened. The "Practicals" were licensed through waivers and different States had different ways. Some required a letter of recommendation from a physician, a supervisor, etc., and the nurse had to have worked as a practical nurse for at least 5 years immediately prior to application. But State-by-State, they were waivered into nursing. Their licenses had a "W" on it and for many of them it was a stigma until they actually took the licensure exam.
It is difficult to categorize the work of LPNs in the U.S. because there is substantial variation in the practice acts and scopes of practice in the various States. Although the National Nursing Council recommended mandatory licensure for LPNs in 1948, not all States acted on the recommendation (Brown, 1948). For example, Ohio did not require mandatory licensure until 1965 (Licensed Practical nurse Association of Ohio, 2002). Some States had a “grandfather clause” to allow licensure of persons who were practicing as practical nurses at the time the licenses were mandated. This is commonly done when new regulations are implemented.
During cycles of nurse shortage in the U.S., there typically is a renewed interest in the licensed practical nurse as a potential worker to augment the nurse workforce and as a potential substitute for registered nurses. In response to a nursing shortage, California Senate Bill 1625 was introduced in 1951, leading to approval of California’s first LPN education program at Chaffey College. The notion of LPNs supplementing or substituting for RNs has been discussed in nursing literature during most of the shortage cycles (Bray, 1979; Kenney, 2001) In general, the scope of practice of LPNs is more limited than that of RNs. In some settings LPNs can serve as substitutes for registered nurses (RNs), but in other settings the scope of practice of LPNs is

8
more restricted. These restrictions may be because of State regulations, Federal regulations, or institutional policy. LPNs can perform many of the functions that RNs perform but at times are not allowed to practice to the full legal limit of practice acts.
One of the broadest descriptions of LPN scope of practice comes from the U.S. Department of Labor Occupational Outlook Handbook: “Licensed practical nurses… care for the sick, injured, convalescent, and disabled under the direction of physicians and registered nurses"(US Department of Labor, 2002). State regulations tend to be more specific about the role of LPNs; for example, the California Board of Vocational Nursing and Psychiatric Technicians (BVNPT) States that the duties “include, but are not limited to, provision of basic hygienic and nursing care; measurement of vital signs; basic client assessment; documentation; performance of prescribed medical treatments; administration of prescribed medications; and, performance of non-medicated intravenous therapy and blood withdrawal (requires separate Board certification.)” (California Board of Licensed Vocational Nursing and Psychiatric Technicians, 2004)
In 1998, LPNs accounted for 39 percent of licensed nurses in hospitals and 46 percent of licensed nurses in long-term care settings (Bureau of Labor Statistics, 2000). Through the 1990s growth in demand for licensed nurses was fairly consistent (Buerhaus, 1996;Spetz, 1996) with that demand being lower in areas heavily penetrated by health maintenance organizations. Additionally, during the 1990s employment of LPNs shifted away from the acute care setting toward long term care (Buerhaus, 1996). This shift was likely related to cost cutting measures in hospitals. The movement of LPNs out of hospitals created a gap in the acute care experience of LPNs, requiring substantial re-training and orientation of vocational/practical nurses who are brought back into the acute care setting (Barber, Bland, Langdon, & Michael, 2000).
Reported annual turnover rates for LPNs in nursing homes range from 32 percent to 61 percent and demand for LPNs is growing each year (Decker, Dollard, & Kraditor, 2001). Poor wages, mandatory overtime, and physically demanding work are thought to contribute to higher turnover rates (Decker et al., 2001). A number of bills have been introduced in State legislatures and Congress that seek to improve the work environment for LPNs and RNs. Eliminating mandatory overtime, providing more resources for nurse training, increasing payment rates, offering whistleblower protection, and developing needlestick prevention programs are among issues being considered through legislation (AFT Healthcare, 2002; Bellandi, 2001; Galloro, 2001). Some States and the Federal government are considering minimum licensed nurse-to-patient ratio regulations for acute-care hospitals, although California is the only State to have instituted such requirements. The only national staffing requirements for long term care settings are minimal standards set by the Centers for Medicare and Medicaid Services (CMS) (formerly Health Care Financing Agency (HCFA))(Center for Medicare and Medicaid Services, 2002).
A number of studies have demonstrated that increased nursing hours are related to better patient outcomes (Aiken, 2000;American Nurses Association, 2000;Needleman, 2002) and organizations have called for increasing nursing hours in hospitals and long-term care settings (Spetz, 1998;AFSCME, 2002). There also is some evidence to indicate that improved patient outcomes may be related to higher education levels of RNs (Aiken, 2003). The literature generally focuses on the importance of RN staffing in improving quality of care, and the

9
evidence is difficult to apply to the LPN workforce. The education and training of LPNs vary widely across States. LPNs can apply to take a licensing examination after completing a 1 or 2 year program at a community college, an adult educational program, or private vocational school. RNs typically are viewed as workers who have a great deal of skill flexibility, while LPNs have a more limited degree of flexibility. During periods of nursing shortage, there is interest in creating a more efficient educational path for LPNs to become RNs. Many schools and colleges across the U.S. provide career mobility mechanisms to allow LPNs to make this transition (Eastern Tennessee State University, 2002). However, these programs are specific to States, geographic regions, or even schools, and popularity of programs waxes and wanes depending on the nursing labor market and economic climate. A number of barriers, including access to courses, funding, and variation in requirements, prevent LPNs from progressing efficiently through the career ladder and little systematic study has been done to identify and reduce those barriers.
Although LPNs organized into professional groups in the early 1940s, there is little literature about the practice, work, demand or efficient utilization of the licensed practical nurse. Additionally, there is little guidance as to how to most effectively make use of this practitioners' skills to enhance patient care and augment the nurse workforce. In the 1990s, there were published works that explored the creative use of LPNs in critical care, as advice nurses, and in intravenous therapy teams, (Buccini,1994; Ingersoll,1995; Eriksen,1992; Roth,1993); interest in trying new care delivery models using LPNs in acute care hospitals has been renewed in the 2000s (Kenney, 2001). However, little systematic study has occurred that explore these staffing strategies. It is important to measure the effects of these roles and how they work with the scope of practice of the LPN. This study will fill some of the gaps in our understanding of the LPN workforce in the United States.
Purpose and Organization of This Report
The objective of this study is to inform nurse educators, employers, the health professions community, the public, and policy makers about the demand, supply, utilization, and scope of practice of LPNs in the 50 United States, the 4 U.S. territories, the District of Columbia, and the Commonwealth of the Northern Marianas Islands. Particular attention is paid to educational issues, career mobility, geographic distribution, and the ability of LPNs to substitute for registered nurses. Since most boards refer to this provider as a licensed practical nurse, we will use the title LPN and not LVN. The terms “licensed nurse” and “nurse” are used to refer to the combined group of RNs and LPNs
This research will seek to answer these questions:
1. What is it that LPNs do and in what settings are they employed? (Chapters 2 & 3)
2. What is the demographic profile of the LPN workforce? (Chapter 2)
3. What are national and State educational trends in applications, enrollments, and graduates? (Chapter 4)
4. What are the supply, demand, and adequacy of the LPN workforce? (Chapter 5)
5. To what degree can LPNs substitute for RNs? (Chapter 3)

10
6. Is there any evidence of increasing demand for LPNs as a result of the RN shortage? (Chapter 6)
7. What are the issues precluding greater utilization of LPNs as a way of mitigating the current RN shortage? (Chapter 3)
8. What are employer, educator, and practicing LPN perspectives on the current State of the LPN workforce and its ability to substitute for registered nurses? (Chapter 6)
This report is organized into seven chapters, each addressing specific research questions. Each chapter includes an overview of the questions addressed, the significance of the questions, the design and methods used, specific findings, and a discussion of the meaning of the findings. Chapter 2 provides a general description of the LPN workforce. Using secondary data, we describe the demographic and employment characteristics of the LPN workforce. Chapter 3 provides a discussion and analysis of data on LPN scope of practice and recent legislation related to the work of LPNs. Data on the scope of practice of LPNs were collected from all 50 States. Information was gathered from officials in State licensing boards and government Internet sites. Recent legislation regarding the practice of LPNs was identified with assistance from the National Conference of State Legislatures and other sources. The legislative activity is evaluated to assess how the use of LPNs has changed or might change in the near future.
Chapter 4 provides a description and analysis of LPN education using both primary data collection and secondary data analysis. Chapter 5 examines the supply and demand of LPNs. The supply of RNs is known to vary with personal characteristics and economic conditions (Link, 1985;Buerhaus, 1994;Brewer, 1994). We estimate a multivariate regression equation to identify the relative importance of factors that affect the supply of LPNs. How does the labor force participation of LPNs change as LPNs age? How responsive is the LPN workforce to changes in wages or economic conditions? Has the underlying supply of LPNs changed over time? Then, we estimate multivariate regression equations for the demand for LPNs by hospitals and nursing homes, using national data. These models enable us to determine the relative importance of quantity of care provided by facilities, wages of all personnel, scope of practice regulations, Medicare and Medicaid reimbursement rates, managed care penetration, and other factors on the demand for licensed vocational nurses. The analysis takes into account the fact that demand for LPNs may affect the wages of LPNs and other personnel, and that scope of practice may be affected by demand for LPNs using instrumental variables techniques (Newhouse & McClellan, 1998).
Chapter 6 considers the perspectives of employers, educators, and practicing LPNs regarding the practice and education of LPNs. We selected 4 States in which to conduct in-depth qualitative research, including focus groups and interviews with LPN employers, educators, and Boards. From this research, we gain more depth in our understanding of how LPNs practice in the United States, and what the future may hold for these professionals. Finally, Chapter 7 summarizes our findings, conclusions, and recommendations.

11
References
AFSCME. (2002). Legislative Fact Sheet, from http://www.afscme.org/action/legfs01.hrm AFT Healthcare. (2002). Legislative Update, from
http://www.aft.org/healthcare/legislative/index.html Aiken, L. H., & Patrician, P. A. (2000). Measuring organizational traits of hospitals: the Revised
Nursing Work Index. Nursing Research, 49(3), 146-153. Aiken, L. H., Clarke, S. P., Cheung, R. B., Sloane, D. M., & Silber, J. H. (2003). Educational
levels of hospital nurses and surgical patient mortality. Journal of the American Medical Association, 290(12), 1617-1623.
American Nurses Association. (2000). Nurse Staffing and Patient Outcomes in the Inpatient Hospital Setting. Washington, DC: American Nurses Publishing.
Barber, J. L., Bland, C., Langdon, M. B., & Michael, S. (2000). LPN role advancement: from blueprints to ribbon cutting. Journal of Nurses in Staff Development, 16(3), 112-117.
Bellandi, D. (2001). High court to hear labor case: Kentucky suit questions right of some nurses to be union members. Modern Healthcare, 31(8), 26-27.
Bray, P. (1979). The LP/VN supplements the hospital staff. The Journal of Nursing Care, 26-27. Brewer, C. S. (1994). The short-run labor supply of registered nurses: a comparison of male and
female registered nurses in 1984 and 1988 [abstract]. AHSR FHSR Annu Meet Abstr Book, 11, 127.
Brown, E. (1948). Nursing for the Future. New York: Russell Sage Foundation. Buccini, R., & Ridings, L. E. (1994). Using licensed vocational nurses to provide telephone
patient instructions in a health maintenance organization. Journal of Nursing Administration, 24(1), 27-33.
Buerhaus, P. I. (1994). Managed competition and critical issues facing nurses. Nurs Health Care, 15(1), 22-26.
Buerhaus, P. I., & Staiger, D. O. (1996). Managed care and the nurse workforce. Journal of the American Medical Association, 276(18), 1487-1493.
Bureau of Labor Statistics. (2000). Categories of Occupations Employed in Selected Long-Term Care Settings and in Hospitals, United States, 1998.
California Board of Licensed Vocational Nurses and Psychiatric Technicians. (2004, 1951). Licensed Vocational Nurses. Paper presented at the Sections 2512 (Vocational Nurses) of the California Code of Regulations.
Center for Medicare and Medicaid Services. (2002). Form CMS-671. Decker, F. H., Dollard, K. J., & Kraditor, K. R. (2001). Staffing of nursing services in nursing
homes: Present issues and prospects for the future. Seniors Housing & Care Journal, 9(1), 3-26.
Eastern Tennessee State University. (2002). N.U.R.S.E. Center LPN to BSN Career Mobility Project, from http://www.etsu.edu/etsucon/lpn-bsn_career_mobility_project.htm
Eriksen, L. R., Quandt, B., Teinert, D., Look, D. S., Loosle, R., Mackey, G., et al. (1992). A registered nurse-licensed vocational nurse partnership model for critical care nursing. Journal of Nursing Administration, 22(12), 28-38.
Galloro, V. (2001). Who's minding the store?; Survey finds need for more than 100,000 nursing home workers, from http://Web lexis-nexis.com/universe/printdoc
Ingersoll, G. L. (1995). Licensed practical nurses in critical care areas: intensive care unit nurses' perceptions about the role. Heart and Lung: Journal of Critical Care, 24(1), 83-88.

12
Kenney, P. A. (2001). Maintaining quality care during a nursing shortage using licensed practical nurses in acute care. Journal of Nursing Care Quality, 15(4), 60-68.
Licensed Practical nurse Association of Ohio, I. (2002). LPNAO Overview-History, from http://www.lpnao.org/history.html
Link, C. R. (1985). Labor supply responses of licensed practical nurses: A partial solution to a nurse shortage? Journal of Economic Business, 37(1), 49-57.
National Association for Practical Nurses Education & Service, I. (2004). Home page, 2004, from http://napnes.org/
Needleman, J., Buerhaus, P., Mattke, S., Stewart, M., & Zelevinsky, K. (2002). Nurse-staffing levels and the quality of care in hospitals. N Engl J Med, 346(22), 1715-1722.
Newhouse, J., & McClellan, M. (1998). Econometrics in outcomes research: The use of instrumental variables. Annual Review of Public Health, 19, 17-34.
Roth, D. (1993). Integrating the licensed practical nurse and the licensed vocational nurse into the specialty of intravenous nursing. Journal of Intravenous Nursing, 16(3), 156-166.
Seago, J. A., & Ash, M. (2002). Registered nurse unions and patient outcomes. Journal of Nursing Administration, 32(3), 143-151.
Spetz, J. (1996). Wages and employment of nurses: an analysis of demand and implications for policy.
Spetz, J. (1998). Hospital employment of nursing personnel. Has there really been a decline? Journal of Nursing Administration, 28(3), 20-27.
White, L. e., & Duncan, G. (2001). Basic Nursing: Foundations of Skills and Concepts: Delmar Learning.
U.S. Department of Labor. (2002). Licensed Practical and Licensed Vocational Nurses, from http://www.bls.gov/oco/ocos102.htm#nature

13
Chapter 2: The LPN workforce
Relatively little is known about the LPN workforce in the United States. As far as we have been able to determine, there has only been one national survey of LPNs, conducted in 1983 (U.S. Department of Health and Human Services, 1985). We have not been able to locate a single database providing information about the number of licensed practical nurses in the Nation. Information about the size, demographics, and employment characteristics of this workforce must be obtained from a variety of disparate sources. Since none of these sources of data can provide comprehensive information, some of the data are conflicting when compared across sources.
Workforce Size and Distribution
According to estimates from the Census 2000 Special Equal Employment Opportunity Tabulation (U.S. Bureau of the Census, 2000), there were 596,355 licensed practical nurses in 2000. This figure, however, is lower than the total number of active LPN licenses and number of jobs held by LPNs. The following table compares figures from various sources.
Table 2.1: Licensed Practical Nurses in the United States Source Measure
Labor j
)
Total Census 2000 Special EEO Tabulation Number of People in LPN Occupation in 2000 596,355
Bureau of Labor Statistics, U.S. Department of Number of obs held by LPNs in 2002 702,000
National Council of State Boards of Nursing (NCSBN
Total Number of Active LPN Licenses in 2000 889,027
In Table 2.2 we compare two different measures of LPN supply by State. In every State except Maryland, the number of active licenses is much larger than the LPN population estimate. In Maryland the estimated population exceeded the total number of active licenses by 909. The population estimates as a percent of the total number of active licenses range from 35 percent to 111 percent. Since a person can have an LPN license in more than one State, using the number of active licenses as a measure of supply most likely overstates the number of LPNs in each State.
Table 2.2: Total Active LPN Licenses and Estimated LPN population
State
Estimated Number
16,676 13,515
Total Active Licenses in 2000
of People in LPN Occupation in 2000
Alabama Alaska 827 565 Arizona 9,271 6,930 Arkansas 16,917 9,785 California 65,383 46,190 Colorado 10,206 5,140 Connecticut 11,135 6,380 Delaware 2,079 1,415

14
State
Estimated Number
Texas
Total Active Licenses in 2000
of People in LPN Occupation in 2000
District of Columbia 2,675 925 Florida 51,899 37,675 Georgia 30,042 18,385 Hawaii 2,699 1,570 Idaho 4,007 2,530 Illinois 28,742 20,745 Indiana 25,997 14,925 Iowa 9,429 6,170 Kansas 8,718 6,405 Kentucky 13,231 9,855 Louisiana 22,369 14,505 Maine 3,463 2,260 Maryland 8,426 9,335 Massachusetts 22,445 12,145 Michigan 28,047 18,160 Minnesota 22,342 15,875 Mississippi 11,315 8,750 Missouri 22,296 15,370 Montana 3,223 1,930 Nebraska 6,413 4,980 Nevada 2,945 2,065 New Hampshire 2,989 2,145 New Jersey 22,855 15,110 New Mexico 3,240 2,645 New York 69,820 40,545 North Carolina 21,578 15,560 North Dakota 3,031 2,025 Ohio 42,720 29,970 Oklahoma 16,732 11,510 Oregon 4,225 3,005 Pennsylvania 50,714 32,785 Rhode Island 3,057 1,835 South Carolina 11,559 9,840 South Dakota 2,176 1,600 Tennessee 26,421 17,025
77,044 48,760 Utah 3,470 2,695 Vermont 1,884 1,620 Virginia 26,694 17,185 Washington 13,869 9,410 West Virginia 6,091 5,470 Wisconsin 14,521 10,465 Wyoming 1,120 665 Total U.S. 889,027 596,355* *Estimates may not add to total due to rounding
Sources: (1) (Crawford, 2001) (2) (U.S. Bureau of the Census, 2000)

Alabama 303.6 7 852.1 24 Alaska 90.0 50 793.5 33 Arizona 134.2 45 664.2 45 Arkansas 365.3 1 772.3 35 California 135.9 43 596.8 49 Colorado 118.8 48 716.8 41 Connecticut 187.0 31 977.1 8 Delaware 179.9 33 964.5 9 District of Columbia 161.9 40 303.6 51 Florida 234.8 20 801.4 32 Georgia 223.4 22 717.1 40 Hawaii 129.5 46 709.8 42 Idaho 194.7 28 641.0 47 Illinois 166.8 39 861.1 22 Indiana 245.0 15 867.2 21 Iowa 210.7 26 998.6 3 Kansas 237.9 19 947.0 13 Kentucky 243.4 17 858.3 23 Louisiana 324.6 3 760.1 37 Maine 176.9 35 952.0 12 Maryland 175.7 36 935.7 15 Massachusetts 190.9 30 1099.0 1
15
Table 2.3 shows the estimated number of LPNs and RNs per 100,000 population, and ranks States based on these ratios. There are about four times as many RNs as there are LPNs per 100,000 people in the U.S. population. Massachusetts and New Hampshire stand out as having the greatest difference between the numbers of RNs and LPNs, having over 1000 RNs and under 200 LPNs per 100,000 population. Overall, there is more variation in the numbers of RNs per capita than of LPNs. Though the distribution of LPNs throughout the U.S. does not closely match the distribution of RNs, there are some similarities.
In 2000, the estimated number of LPNs per 100,000 population ranged from a low of 88 in Oregon to a high of 365 in Arkansas. Other States with low numbers of LPNs per 100,000 people include Alaska, Nevada, Colorado, Utah, and Hawaii. In fact, the Western part of the U.S. appears to have the lowest concentration of LPNs, while the South and Midwest (e.g., Arkansas, Oklahoma, Louisiana, Minnesota, and North Dakota) have the highest. This pattern is similar to that reflected in the data for RNs. States with the lowest numbers of RNs per 100,000 individuals in the population include Nevada, California, Utah, Idaho, and Texas – mostly western States. The highest numbers are in the Northeast and Midwest (e.g., Massachusetts, New Hampshire, Iowa, South Dakota, and Rhode Island).
Table 2.3: LPNs and RNs Per 100,000 Population
State
Estimated Number State Rank -
LPNs Per State Rank -of LPNs Per
100,000 Population 100,000
Population
Estimated Number of RNs
Per 100,000 Population
RNs Per 100,000 Population

16
State
Texas
Estimated Number State Rank -
LPNs Per
32 4 6
11 23 10 49 38 34 42 24 29 5
14 2
51 12 37 16 25 9
21 47 13 18 41 8
27 44
State Rank -
31 11 27 20 30 14 50 2 19 44 18 25 6
16 43 39 7 5
29 4 28 46 48 10 34 36 26 17 38
Michigan Minnesota Mississippi Missouri Montana Nebraska Nevada New Hampshire New Jersey New Mexico New York North Carolina North Dakota Ohio Oklahoma Oregon Pennsylvania Rhode Island South Carolina South Dakota Tennessee
Utah Vermont Virginia Washington West Virginia Wisconsin Wyoming Total U.S.
of LPNs Per 100,000 Population
182.4 321.8 307.2
274.2 213.6 290.7 102.3 172.9 179.2 145.2 213.4 192.6 315.9
263.7 333.2 87.6
266.9 174.7 244.6 211.7 298.5 232.8 120.1
265.6 241.9
159.2 302.7 194.7 134.6 211.3
100,000 Population
n/a
Estimated Number of RNs
Per 100,000 Population
803.8 954.7 824.0 878.3 805.9 943.0 568.9
1059.3 880.4 672.0 883.0 849.8 992.9 914.7 706.9 725.7 988.8 997.5 811.8 997.8 821.5 653.5 614.8 958.3 780.8 769.8 846.8 891.2 740.8 803.7
RNs Per 100,000 Population
n/a Sources: (1) (U.S. Bureau of the Census, 2000) (2) (U.S. Bureau of the Census, 2003)
Demographics of LPNs
Information about the demographic characteristics of LPNs can be obtained from the Current Population Survey (CPS). The CPS is a monthly survey of households conducted by the Bureau of the Census for the Bureau of Labor Statistics. It is the primary source of information on the labor force characteristics of the U.S. civilian non-institutional population (see http://www.bls.census.gov/cps/overmain.htm) (U.S. Bureau of the Census, 2004). The CPS contains individual and family demographic information. LPNs are self-identified in these data by reporting that their occupation is licensed practical nursing. We computed all data presented

17
here using weights provided by the Bureau of the Census to ensure that the data represent the U.S. population. With relatively few LPNs in some years of this survey, the data may not represent the LPN workforce accurately. Furthermore, the CPS was revised in 1994, resulting in the discontinuation of several variables in dataset. Several questionnaire items were changed, making comparisons across all years difficult or impossible depending on the variable. Thus, some of the demographic information we report is for recent survey years only.
Table 2.4 shows the number of LPNs in the CPS from 1984 to 2001. The number of LPNs identified in the CPS has declined from 1,002 in 1984 to 584 in 2001. This drop follows the decline in the total number of records in the CPS between 1984 and 2001. Thus, it does not reflect a trend in the supply of LPNs; rather, it reflects the drop in the number of households surveyed by the Census.
Table 2.4: Number of LPNs Identified in the Current Population Survey Outgoing Rotation Group Files, 1984-2001 (Unicon Research Corporation, 2002)
CPS Survey Year No. of LPNs 1984 1,002 1985 980 1986 948 1987 898 1988 843 1989 863 1990 925 1991 894 1992 885 1993 825 1994 701 1995 667 1996 583 1997 593 1998 561 1999 508 2000 539 2001 584 Total 13,799
The regional distribution of nurses in the 1984-2001 CPS data is shown in Figures 2.1 through 2.3. All three types of nursing personnel—LPNs, RNs, and nurse aides—have a similar regional distribution. The major difference is that more LPNs live in the South and fewer in the Northeast, as compared to RNs in the data. This is in agreement with the population estimates.

18
Figure 2.1: Regional Distribution of LPNs
Source: Current Population Survey Outgoing Rotation Group Files, 1984-2001
28%
South 34%
23% 15%
Midwest
Northeast West
Figure 2.2: Regional Distribution of Registered Nurses
Source: Current Population Survey Outgoing Rotation Group Files, 1984-2001
28%
South 27%
19% Northeast
Midwest
West
26%

19
Figure 2.3: Regional Distribution of Nurse Aides
Source: Current Population Survey Outgoing Rotation Group Files, 1984-2001
West
Mi
Northeast 27%
dwest
South 30%
16%
27%
Table 2.5 presents the gender and racial/ethnic characteristics of LPNs in the United States from 1984 through 2001. Men are a slowly growing share of the LPN workforce, comprising only 3 percent of LPNs in 1984 and 5 percent in 2001. The share of LPNs that is male is similar to that of the RN workforce (See Spratley et al. (2000) for information on RN gender distribution).
The LPN workforce is predominantly white, although the ethnic diversity of LPNs has grown over time. In 1984, 77 percent of the LPN workforce was white, but this share dropped to 67 percent by 2001. The largest minority group of LPNs is blacks, comprising 26 percent of the workforce in 2001. Blacks are overrepresented in the LPN workforce relative to the total U.S. population. Hispanics account for 3 percent and Asians account for 2 percent of the LPN workforce; these ethnic groups are significantly underrepresented in this workforce, and these shares have not changed substantially since the 1980s. About 1 percent of the LPN workforce is Native American; this is consistent with the general population (see Census 2000 population estimates at http://quickfacts.census.gov/qfd/States/00000.htm).
Table 2.5: Distribution of Licensed Practical Nurses by Gender and Race/Ethnicity

20
1984 1985 1986 1987 1988 1989 1990 1991 1992 1993 1994 1995 1996 1997 1998 1999 2000 2001 Male 3% 3% 3% 3% 4% 3% Female 97% 97% 97% 97% 96% 97% White 77% 74% 78% 77% 73% 73% Black 16% 19% 17% 18% 20% 21% Hispanic 4% 5% 3% 3% 4% 4% Native American 0% Asian or Pacific Islander 2% Other 2% 2% 2% 3% 4% 0%
4% 96% 74% 18% 4% 1% 2% 0%
5% 95% 76% 17% 4% 1% 1% 0%
6% 94% 76% 18%
3% 1% 2% 0%
5% 95% 77% 18%
3% 1% 1% 0%
5% 95% 74% 18% 5% 1% 2% 0%
5% 95% 75% 19% 3% 0% 1% 0%
5% 95% 77% 16% 4% 1% 2% 0%
7% 4% 5% 6% 5% 93% 96% 95% 94% 95% 75% 75% 74% 68% 67% 17% 18% 17% 21% 26%
5% 5% 6% 6% 3% 1% 1% 1% 1% 1% 2% 2% 2% 3% 2% 0% 0% 0% 0% 0%
Source: Current Population Survey Outgoing Rotation Group Files, 1984-2001
Most LPNs are married (Table 2.6). From 1984 to 2001, the share of LPNs that reported being married varies between 56 percent and 66 percent, with no clear pattern of change over time. During this same time period, between 23 percent and 32 percent were widowed, divorced, or separated, and 10 percent to 14 percent were never married.
Table 2.6: Marital Status of Licensed Practical Nurses
1984 1985 1986 1987 1988 1989 1990 1991 1992 1993 1994 1995 1996 1997 1998 1999 2000 2001 Married 65% 64% 66% 62% 63% 63% 65% 65% 61% 60% 59% 56% 62% 63% 60% 61% 64% 60% Widowed, Divorced, Separated 23% 23% 23% 26% 25% 26% 24% 23% 29% 28% 27% 32% 27% 25% 29% 25% 24% 26% Never Married 12% 13% 11% 11% 13% 11% 10% 12% 10% 12% 14% 12% 11% 12% 11% 14% 13% 14% Source: Current Population Survey Outgoing Rotation Group Files, 1984-2001
As with registered nurses, the mean age of LPNs has been increasing since the 1980s. In 1984, the mean age was 39. By 2001, the mean age was 43. As shown in Table 2.7, LPNs are slightly older than RNs on average. The age distribution of LPNs in the 1984-2001 CPS data is shown in Figure 2.4. The histogram shows the distribution of the ages of LPNs. The numbers on the left indicate the age range, while those on the right are the number of LPN observations. The box plot to the right of the histogram illustrates the 75th (age 49) and 25th (age 32) percentiles, denoted by the top and bottom of the box, respectively. The plus sign in the upper half of the box signifies the mean (age 41). Both plots indicate that the LPN workforce leans toward older ages, rather than being evenly spread out across all ages. Based on these data, we can expect large numbers of LPNs to retire within the next 25 years.

21
Figure 2.4: Histogram of LPN Age Histogram # Boxplot
87.5+* 6 0 .* 11 0 .* 37 0
72.5+*** 126 | .******* 307 | .*************** 655 |
57.5+******************** 908 |.**************************** 1246 |.************************************** 1718 +-----+
42.5+********************************************* 2062 *--+--* .************************************************ 2188 | |.********************************************** 2109 +-----+
27.5+************************************* 1658 | .***************** 743 | .* 24 |
12.5+* 1 | ----+----+----+----+----+----+----+----+----+--- * may represent up to 46 counts
Source: Current Population Survey Outgoing Rotation Group Files, 1984-2001
Table 2.7: Mean Age of Licensed Nurses
Nurse Type 1984 1985 1986 1987 1988 1989 1990 1991 1992 1993 1994 1995 1996 1997 1998 1999 2000 2001 Licensed Practical Nurses 39 40 40 40 41 41 41 41 42 42 41 42 42 42 42 42 43 43 Registered Nurses 38 39 39 39 39 40 40 41 41 41 41 41 41 41 42 42 43 42 Source: Current Population Survey Outgoing Rotation Group Files, 1984-2001
More LPNs are U.S.-born than RNs. In 2001, 94 percent of LPNs had been born in the U.S. This percent was the same in 1994, the earliest date for which the CPS has data on citizenship status. However, the data shows that an increasing percent of RNs are foreign-born: 11 percent in 2001 compared to 8 percent in 1994. The CPS also collects data on when survey respondents immigrated to the U.S. The data shows that foreign-born LPNs mostly immigrated to the U.S. in the 1970s, 1980s, and late 1990s.
Table 2.8 shows the educational attainment of LPNs in the CPS data. The CPS education data prior to 1992 indicate only the highest grade attended and completed. College is defined as ranging from 13 years of education to 18 or more years of education. Between 1984 and 1991, 47 percent to 59 percent of LPNs completed at least 1 year of college. Beginning in 1992, information on degrees attained is available.
Almost 66 percent of LPNs in 1992 completed some college or an AA degree. This percent increased to almost 80 percent by 2001. Between 1992 and 2001, there was a small increase in the percentage of LPNs with a bachelor’s degree. The bachelor’s degrees may have been in non-nursing fields of study. Since 1996, this figure has hovered near 5 percent. Less than 1 percent holds a master’s or doctorate degree in any field of study. Those who have only a

22
high school education (including those who did not graduate) represent a decreasing proportion of LPNs. In 1992, this figure was 30 percent; by 2001 it had decreased to 15 percent.
Table 2.8: Educational Attainment of LPNs
1992 1993 1994 1995 1996 1997 1998 1999 2000 2001 < 12th 1.8%
dHigh School 28.3% dSome College, No 37.0%
AA Degree, Occ or 23.8% AA Degree, Academic 4.7% Bachelor's 3.6% Master's 0.6% Doctorate 0.0% Professional School 0.3%
1.3% 22.1% 34.9% 30.6% 5.3% 4.9% 0.9% 0.0% 0.1%
0.9% 23.3% 31.3% 34.6% 5.5% 3.3% 0.5% 0.0% 0.6%
0.9% 19.5% 33.2% 37.5% 3.9% 3.8% 0.5% 0.1% 0.7%
1.1% 16.5% 35.6% 34.8% 5.1% 6.4% 0.1% 0.0% 0.3%
1.1% 18.6% 34.7% 32.5% 7.7% 5.3% 0.0% 0.0% 0.2%
0.8% 19.7% 35.1% 31.6% 5.8% 5.6% 0.0% 0.0% 1.5%
0.4% 20.3% 38.6% 29.6% 7.3% 3.4% 0.3% 0.0% 0.0%
0.6% 18.8% 29.3% 37.0% 7.7% 5.7% 0.4% 0.0% 0.6%
0.8% 14.2% 34.0% 35.9% 9.2% 4.7% 0.5% 0.0% 0.7%
Source: Current Population Survey Outgoing Rotation Group Files, 1992-2001
The Current Population Survey contains family income information by income categories. In any year, however, 4 percent to 13 percent of LPNs in the CPS data have no family income information. From 1984 to 2001, the majority of LPNs responded that their family income was less than $50,000 per year. Between 1984 and 1985, more than half reported family incomes less then $25,000. Since the 1980s, the proportion of LPNs with family incomes over $50,000 increased so that by 2001 one-third of LPNs were in this family income category.
Empl oyment status of LPNs
The Current Population Survey asks respondents whether they are employed. However, we should note that since 1994, the CPS variable for employment status has been derived from all labor force items in the survey; this was not the case previously. Thus, it is possible that estimates from the CPS understated the percent of working survey respondents prior to 1994. Also, it is important to keep in mind that LPNs are self-identified in the CPS data (by reporting that their occupation is licensed practical nursing). Thus, some people might have licenses as LPNs, but do not identify themselves as such because they are working in other fields (or not working at all).
In 1984, 80 percent of LPNs said they were employed; this share rose to 94 percent by 2001 (Figure 2.5). This is very similar to RN employment trends in the data. Relatively small shares of LPNs are unemployed at any time, with the rate always below 5 percent between 1984 and 2001. LPNs reporting that they were not part of the labor force decreased from 16 percent in 1984 to 5 percent in 2001. It is unclear whether this is due to changes in the CPS survey in 1994, or whether there is a higher share of LPNs in the labor force in recent years.

23
Figure 2.5: Employment Status of LPNs, Selected Years 100%
80%
60%
40%
20%
0% 1984 1990 1994 2001
Employed Unemployed Not in Labor Force
Source: Current Population Survey Outgoing Rotation Group Files
The CPS asks survey respondents why they are not in the labor force, but the precise questions have changed over time. Between 1984 and 1988, 52 percent to 69 percent of LPNs not in the labor force reported housekeeping responsibilities as the main reason for not working. Another 5 percent to 11 percent reported being in school, while 17 percent to 32 percent reported other reasons for not working, including retirement. Comparable data for RNs not in the labor force indicate the following: 66 percent to 72 percent reported housekeeping responsibilities, 4 percent to 6 percent indicated school, and 20 percent to 26 percent claimed other/retired as the main reason for not looking for work.
In 1989, a new variable was added to the CPS that provided more detail as to why survey respondents were not looking for work. (However, this variable was discontinued after 1993). Between 1989 and 1992, 4 percent to 10 percent of LPNs (and 4 percent to 7 percent of RNs) not looking for work reported they were in school; this is a similar share as between 1984 and 1988. Illness and disability were reported by 21 percent to 35 percent of LPNs, compared to 11 percent to 19 percent of RNs, not in the labor force. In 1989, 47 percent indicated that they were “keeping house,” with this share declining to 30 percent by 1992. Likewise, compared to previous survey years, a smaller and declining share of RNs reported housekeeping responsibilities as the main reason for not seeking employment. Retirement was reported as the reason for 8 percent to 14 percent of LPNs and 15 percent to 23 percent of RNs not looking for work.
Between 1994 and 2000, 22 percent to 50 percent of LPNs who were not in the labor force said they were retired. Not surprisingly, this share is higher than the estimated retired shares of the 1980s, since LPNs are now older on average. The retirement figures for RNs in the 1994-2000 CPS data range from 29 percent to 41 percent, with no clear trend. The proportion of LPNs who reported not being in the labor force due to disability varies from 9 percent to 39 percent between 1994 and 2000. This figure ranges from 5 percent to 19 percent for RNs. Again, there is no clear trend in the data for LPNs or RNs. In almost every survey year since 1994, most LPNs and RNs who reported not being in the labor force did not provide a detailed reason for their labor force status. By 2001 over 80 percent of LPNs not working and not seeking work provided an answer that fell into the “other” category.

24
Since 1994, the CPS has asked respondents if they hold more than one job. LPNs reported having more than one job at a rate of 6 percent to 9 percent between 1994 and 2001. A somewhat larger share of RNs reports having more than one job during this same time period. It is unclear from the data whether there is an upward trend in LPNs holding multiple jobs.
Work settings of LPNs LPNs work primarily in hospitals and nursing and personal care facilities (Table 2.9).
From 1984 to 2001, the proportion of LPNs working in hospitals declined from 54 percent to 32 percent. During this same time period, the percent of LPNs working in nursing and personal care facilities grew from 26 percent to 32 percent. The proportion of RNs working in hospitals also declined between 1984 and 2001, but by only by 10 percentage points. However, even at its lowest, 60 percent in 2001, the share of RNs working in hospitals is greater than that of LPNs in every year. Also, the data do not show an increase in the percent of RNs working in nursing and personal care facilities; this share stays near 7 percent in all years.
In 1984, 6 percent of LPNs worked in offices and clinics of physicians; by 2001, this had increased to 12 percent. The share of RNs in this work setting likewise doubled, from 5 percent to 10 percent. There is no obvious trend in the percent of LPNs working for personnel supply services (e.g. temporary agencies), although the percents are lower overall in the 1990s compared to the 1980s. The same is true for RNs in the data. Between 1984 and 2001, 2 percent to 9 percent of LPNs (compared to 1 percent to 5 percent of RNs) worked in this industry. Private households were the work setting of 4 percent of LPNs in 1984. By 1994, less than 1 percent worked in private households. Less than 1 percent of RNs worked in private households in any year.
The CPS industry classification system includes a category called “health services not elsewhere classified (n.e.c.).” In 1984, 3 percent of LPNs were employed in work settings within this broad industry class. The proportion of LPNs in these work settings increased to 11 percent by 2001. Similarly, RN employment in this industry category increased – from 5 percent in 1984 to 12 percent in 2001. Unfortunately, we do not know what precise industries are included in the “health services (n.e.c.)” category. LPNs also are increasingly working in industries other than those discussed above, such as elementary and secondary schools, colleges and universities, child day care services, public administration, and other industries not traditionally associated with the type of work done by LPNs (e.g., real eState).
Table 2.9: Distribution of LPNs by Work Setting
1984 1985 1986 1987 1988 1989 1990 1991 1992 1993 1994 1995 1996 1997 1998 1999 2000 2001
54.3 55.4 54.5 50.7 48.1 49.0 46.6 46.7 42.5 43.2 38.4 36.9 36.5 35.0 39.0 35.7 36.9 32.1 percen percen percen percen percen percen percen percen percen percen percen percen percen percen percen percen percen percen
Hospitals t t t t t t t t t t t t t t t t t t Nursing & 25.8 24.8 26.9 26.0 26.2 26.6 28.8 31.0 32.8 32.6 35.2 34.0 37.0 32.1 30.1 34.0 31.9 32.4 Personal Care percen percen percen percen percen percen percen percen percen percen percen percen percen percen percen percen percen percen Facilities t t t t t t t t t t t t t t t t t t
4.2 6.1 5.5 6.2 8.8 6.5 6.5 4.1 4.7 4.2 3.4 3.3 1.6 3.1 3.8 3.2 4.1 5.2 Personnel percen percen percen percen percen percen percen percen percen percen percen percen percen percen percen percen percen percen Supply Services t t t t t t t t t t t t t t t t t t Offices and 6.1 5.1 4.8 6.1 5.4 6.8 6.3 7.4 8.2 8.3 8.9 8.3 8.9 11.3 11.2 10.6 10.1 12.4 Clinics of percen percen percen percen percen percen percen percen percen percen percen percen percen percen percen percen percen percen Physicians t t t t t t t t t t t t t t t t t t

25
Private 4.0
percen t
2.8 percen
t
2.1 percen
t
2.1 percen
t
2.6 percen
t
1.8 percen
t
1.9 percen
t
1.2 percen
t
1.0 percen
t
1.0 percen
t
0.3 percen
t
0.5 percen
t
0.3 percen
t
0.9 percen
t
0.3 percen
t
0.0 percen
t
0.3 percen
t
0.2 percen
t
(n.e.c.)
3.3 percen
t
4.1 percen
t
4.1 percen
t
5.0 percen
t
6.1 percen
t
6.3 percen
t
6.4 percen
t
6.8 percen
t
6.4 percen
t
5.2 percen
t
9.2 percen
t
11.3 percen
t
10.8 percen
t
14.1 percen
t
10.5 percen
t
11.3 percen
t
12.4 percen
t
11.3 percen
t 2.4 1.6 2.0 4.0 2.9 3.0 3.5 2.9 4.3 5.6 4.6 5.7 4.9 3.6 5.1 5.3 4.4 6.4
t t t t t t t t t t t t t t t t t t
In 1984, 19 percent Stated that they
Between 1984 and 2001, around 80
1.4%
Households
Health Services
percen percen percen percen percen percen percen percen percen percen percen percen percen percen percen percen percen percen Other
n.e.c. = not elsewhere classified Source: Current Population Survey Outgoing Rotation Group Files, 1984-2001
The majority of LPNs work in private sector jobs, and the percent has increased from almost 80 percent to 89 percent between 1984 and 2001. were employed by government agencies; this share declined to 10 percent by 2001 (Figures 2.6 and 2.7). Only 0.4 to 2 percent of LPNs reported being self-employed in any year. The data do not show much change in the employment sectors of RNs. percent of RNs worked in the private sector, and 20 percent for government.
Figure 2.6: Employment Sector of LPNs, 1984
Source: Current Population Survey Outgoing Rotation Group Files
19.0%
79.6%
i i
l
l
Pr vate bus ness or individual
Government - fed, state, or loca
Se f employed
Figure 2.7: Employment Sector of LPNs, 2001
Source: Current Population Survey Outgoing Rotation Group Files
26
10.5% 0.4%
89.1%
i i
l
l
Pr vate bus ness or individual
Government - fed, state, or loca
Se f employed
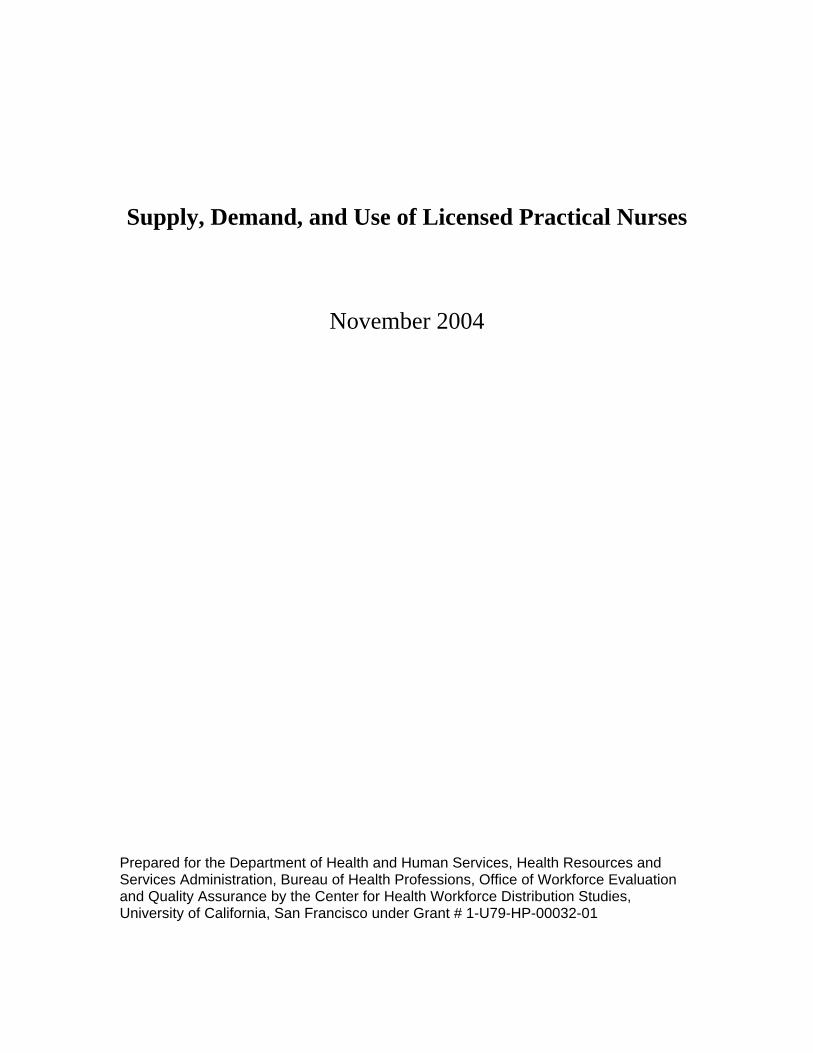
Hours of Work There are several questions in the Current Population Survey that correspond to hours
of work. We report means for the variables denoting total hours worked in the previous week and usual hours worked per week. There are two variables that denote usual weekly work hours. The main differences between these two variables follow: (1) one of the variables was introduced in 1994 and the corresponding survey question is asked of all respondents who report having a job the week prior to being surveyed, and (2) the other variable, though available throughout our sample period, has missing values for salaried workers after 1993.
Figure 2.8 compares the means of the three variables that correspond to hours of work per week. Between 1984 and 2001, LPNs on average worked more than 34 hours per week, which is the same as RNs. LPNs worked slightly more on average in 2001 than they did in 1984. Between 1986 and 1990, mean weekly work hours increased by over 1 hour if measured by usual hours worked per week, and by more than 2 hours if measured by total hours worked last week. After 1993, LPNs’ mean usual weekly hours of work fall farther below mean total hours worked in the previous week. This likely is due to the missing values in the data for salaried LPNs from 1994 onward. However, the variable “total usual weekly hours,” which was added to the survey in 1994, has values for both salaried and hourly workers, and the mean of this variable indicates that LPNs worked 37 to 38 hours per week between 1994 and 2001. Overall, the CPS data show some evidence of a small increase in the average weekly work hours of LPNs, but there is a high degree of fluctuation in the data, especially during the 1990s. RNs’ mean weekly work hours hold steady at 36 to 37 between 1984 and 2001.

27
Figure 2.8: Mean Hours of Work Per Week - Licensed Practical Nurses
20
22
24
26
28
30
32
34
36
38
40
1984 1985 1986 1987 1988 1989 1990 1991 1992 1993 1994 1995 1996 1997 1998 1999 2000 2001
Year
Total Hours Worked Last Week Usual Hours Worked Per Week Total Usual Weekly Hours
Source: Current Population Survey Outgoing Rotation Group Files, 1984-2001
The majority of LPNs work full-time, and the share working full-time increased between 1984 and 2001. The CPS asks respondents that work less than 35 hours per week what their main reason is for working part-time. The reasons reported by the CPS have changed over time. Between 1984 and 1993, the reasons identified in the CPS include slack work or business conditions; could only find part-time work; own illness, health, or medical limitations; too busy, didn’t want full-time work; reported less than 35 hours, but usually works full-time; and all other reasons. Since 1994, additional reasons are seasonal work, childcare problems, other family/personal obligations, school or training, and retired or social security limit earnings. Also, “too busy, didn’t want full-time” was dropped from the survey.
Between 1984 and 1993, most LPNs who reported working less then 35 hours per week responded that they were too busy and/or didn’t want full-time work. After the survey change in 1994, most responded that they usually do work full-time. Those reporting slack business or could not find full-time work ranged from less than 1 percent to almost 12 percent between 1984 and 2001. The highest percentages were during the 1990s. There is no obvious trend in the percent that work less then 35 hours per week because of childcare problems or own illness, health, or medical limitations. Furthermore, these percentages are small (almost always under 4 percent). From 1994 to 2001, 4 percent to 11 percent of LPNs reported school or training as their reason for working part-time. An increasing percent since 1994 have responded that they are retired or that social security limits earnings: 2 percent in 1994 and 4 percent by 2001.
Earnings

28
The Current Population Survey asks respondents who report they are paid by the hour for their hourly pay rate. As shown in Figure 2.9, the hourly earnings of LPNs increased 19 percent between 1984 and 2001, from $12.21 to $14.56 (all figures are adjusted for inflation). By 1994, LPNs earned over $14 per hour on average. However, LPNs experienced a slight decline in their hourly earnings between 1994 and 1998, which corresponds to the decline in real RN wages reported by others (Spetz, 1998). By 1999 LPNs’ mean hourly pay rate had bounced back to $14. The data for RNs shows a similar pattern—an overall increase of nearly 19 percent ($17.78 in 1984 and $21.15 in 2001) with a slight drop between 1993 and 1997.
The CPS also collects information on usual weekly earnings before deductions from both hourly and salaried workers. As shown in Figure 2.10, the weekly earnings of LPNs increased 23 percent between 1984 and 2001. In 1984, LPNs earned nearly $450 per week on average. By 1994, this figure had increased to $531. The data shows a decline in average weekly earnings after 1994. It wasn’t until 2001 that LPNs’ mean weekly earnings rose above the 1994 value to $555.
Figure 2.9: LPNs' Mean Hourly Pay Rate (in Year 2002 Dollars)
$0.00
$2.00
$4.00
$6.00
$8.00
$10.00
$12.00
$14.00
$16.00
1984
1985
1986
1987
1988
1989
1990
1991
1992
1993
1994
1995
1996
1997
1998
1999
2000
2001
Year
Source: Current Population Survey Outgoing Rotation Group Files, 1984-2001
Figure 2.10: LPNs' Average Weekly Earnings (in Year 2002 Dollars), 1984-2001

29
$600
$500
$400
$300
$200
$100
$0
1984
1985
196
197
1988
189
190
1991
1992
19Year
319
9419
951
9619
9719
9819
920
020
018 8 9 9 09 9 9
Source: Current Population Survey Outgoing Rotation Group Files
Summary
In this chapter, we used data from the Current Population Survey, U.S. Census Bureau, Bureau of Labor Statistics, and the National Council of State Boards of Nursing to describe the licensed practical nurse workforce. Most of the reported figures are weighted estimates.
We provided corresponding data on registered nurses for comparison, and found the following similarities:
• Both workforces are aging, with LPNs being slightly older on average; • Males represent a small percent of both workforces, but this percent is increasing; • The western region of the U.S. has the lowest numbers of LPNs and RNs relative to the
population; • RNs and LPNs share similar employment trends—greater percents were employed in
2001 than in 1984; • On average, RNs and LPNs work about the same number of hours per week—between 36
and 38 hours; • The share of RNs and LPNs working in physician offices/clinics doubled between 1984
and 2001, and the share working in health services “not elsewhere classified” increased; and
• The hourly pay rate of RNs and LPNs increased 19 percent between 1984 and 2001.
Differences we found between the two workforces include the following:
• The RN workforce is larger than the LPN workforce, but the actual size of the LPN workforce is unclear since the available data is conflicting;
• Compared to RNs, more LPNs live in the South and fewer in the Northeast; • Fewer LPNs are foreign-born, whereas an increasing percent of RNs are immigrants; • RNs work in hospitals in greater proportions than LPNs, and the share of LPNs working
in hospitals declined more than that of RNs between 1984 and 2001; • The percent of LPNs working in nursing and personal care facilities increased between
1984 and 2001, but not the percent of RNs; and

30
• By 2001, the percent of LPNs working in the private sector was greater than the percent of RNs.

31
References
Crawford, L. H., Marks, C., Gawel, S. H., White, E., & Obichere, L. (2001). 2000 Licensure and Examination Statistics. Chicago: National Council of State Boards of Nursing.
National Council of State Boards of Nursing. (2004). Home page, from http://www.ncsbn.org/about/index.asp
Spetz, J. (1998). Hospital employment of nursing personnel. Has there really been a decline? Journal of Nursing Administration, 28(3), 20-27.
Spratley, E., Johnson, A., Sochalski, J., Fritz, M., & Spencer, W. (2000). Findings from the National Sample Survey Of Registered Nurses. Retrieved March, from http://bhpr.hrsa.gov/healthworkforce/rnsurvey/rnss1.htm
Unicon Research Corporation. (2002). CPS Utilities, Earner Study, Outgoing Rotation 2001 Software & Documents (Version 5.1). College Station, TX: Unicon Research Corporation.
U.S. Bureau of the Census. (2000). Census 2000 Special Equal Employment Opportunity (EEO) Tabulation. Retrieved January 2004, from http://www.census.gov/hhes/www/eeoindex.html
Licensed Practical andU.S. Bureau of Labor Statistics. Occupational Outlook Handbook: Licensed Vocational Nurses, 2004, from http://www.bls.gov/oco/ocos102.htm
U.S. Bureau of the Census. (2003). Annual Estimates of the Population for the United States and States, and for Puerto Rico: April 1, 2000 to July 1, 2003, 2004, from http://eire.census.gov/popest/data/States/tables/NST-EST2003-01.php
U.S. Bureau of the Census. Current Population Survey, 2004, from http://www.bls.census.gov/cps/cpsmain.htm
U.S. Department of Health and Human Services, D. o. N. (1985). First National Sample Survey of Licensed Practical/Vocational Nurses, 1983. Springfield, VA: National Technical Information Service, Accession No. HRP 0906278.

32
Chapter 3: Scope of Practice and Practice Acts
Each of the 50 States, the District of Columbia, the U.S. territories (Guam, U.S. Virgin Islands, American Samoa, and Puerto Rico), and the Commonwealth of the Northern Mariana Islands, have Boards and legislation regulating the practice of registered and practical nursing, as well as advanced practice nurses and other workers1. These documents display both similarities and differences in legislation, language, and scope of practice. In order to provide an overview of the scope of practice of the practical nurse in the U.S., this chapter summarizes major similarities and differences in the practice of LPNs and provides a methodology for categorizing the practice acts. Additionally, based on scope of practice data, we discuss issues that limit the utilization of LPNs in various States and settings.
With the exception of four States, the 56 boards have a single governing board that oversees the practice of both RNs and LPNs. California, Georgia, Louisiana, and West Virginia have separate boards for RN and LPN practice. Texas changed to one board on February 1, 2004. The National Council of State Boards of Nursing (NSBCN) (National Council of State Boards of Nursing, 2004) is a not-for-profit organization whose membership is comprised of the boards of nursing of the 50 States, the District of Columbia, four United States territories--American Samoa, Guam, Puerto Rico, the Virgin Islands--and the Commonwealth of the Northern Mariana Islands. The purpose of NCSBN is to serve as an organization through which boards of nursing cooperate and work together on matters of common interest and concern affecting the public health, safety and welfare, including the development of licensing examinations in nursing. NCSBN's activities include developing the National Council Licensure Examination for Registered Nurses (NCLEX-RN®) and the National Council Licensure Examination for Practical Nurses (NCLEX-PN®), performing policy analysis and promoting uniformity in relationship to the regulation of nursing practice, disseminating data related to the licensure of nurses, conducting research pertinent to NCSBN's purpose, and serving as a forum for information exchange for members. NSBCN has developed a model nurse practice act that can be used by the members to guide legislation.
Typically the boards have basic practice acts and documents related to scope of practice, including the education and training that is required for the practice of practical nursing, and what work LPN basic education allows. Most boards then allow for expanded practice with additional education. The most common areas for expanded practice relate to intravenous infusions, intravenous medications, hemodialysis, and supervision of other staff. In order to engage in expanded practice, the practical nurse must obtain further training and/or certification. Generally, the practice acts declare that the practical nurse must work under the supervision of a registered nurse, a physician, and, in some States, pharmacists, podiatrists, or others.
The typical paths to licensure are examination, endorsement, and temporary licensing. For example, California allows application for the licensing examination in five ways: 1) after completion of an approved in-State program, 2) after completion of an approved out-of-State program, 3) with equivalent experience (such as having worked as a nurse aide and taking a pharmacy course), 4) with experience as a military corpsman, and 5) after the first year of an RN
1 We refer to these governmental authorities as “boards” in the remainder of this chapter.

33
program. In an interview that took place in February 2003, Suellen Clayworth of the California Department of Consumer Affairs, Board of Vocational Nursing and Psychiatric Technicians, Stated that “there was a period of time that California did not use the standardized examination and nurses who were licensed during that time may not get endorsement to other States.” Until 1974, California used the National League for Nursing examination. From May 1974 through March 1986 California used a State constructed licensure examination. People licensed during this time may not be able to get endorsed to other States. According to Ms. Clayworth, the State began using the NCSBN licensure examination in October of 1986. Because of examination standardization, most States now approve endorsement of currently licensed practical nurses from other States.
States have elected to explicate the work of practical nurses in a variety of ways. Some, such as Louisiana, Montana, Maine, and Nevada, have detailed lists of tasks that practical nurses can and cannot do. Other States, such as Georgia, Alaska, Kentucky, and Oklahoma, have decision trees that are to be used to decide on appropriate tasks that can be done. Connecticut has an extensive algorithm for decision-making that can be used regarding issues of practice. Washington has a decision tree that is used for making decisions and specifically States that there is no “laundry list” of approved and prohibited tasks. Some States such as Colorado and Nebraska use the sections of the nursing care plan to detail work that can be done by different nursing personnel (RNs, LPNs, and aides). South Carolina has developed extensive skills charts that are organized by body system, job categories, and experience level within job categories. Neither Michigan nor Texas has a scope of practice or practice act for practical nurses.
There are several points of contention that exist in the scopes of practice of registered nurses and practical nurses. These issues typically surround the words “assessment”, “delegation”, “supervision or charge nurse” and, more recently, “decision-making” and “critical thinking”. Since the American Nurses Association defined registered professional nursing as the diagnosis and treatment of human responses to actual or potential health problems, assessment has been a key to the boundary of practice between the registered nurse and other nurses and nurse assistants. Practical nurses and nurse assistants are permitted to “collect data” rather than assess patients; however, the boundary between data collection and assessment is difficult to define.
Delegation has traditionally been thought of as a management function reserved for the registered nurse. However, practical nurses delegate functions to other providers in many settings, and some practice acts acknowledge that fact. The positions of supervisor and charge nurse are similar, in that those roles traditionally involve management. In long-term care settings practical nurses function in those roles routinely. In 1994, the U.S. Supreme Court upheld a decision by the Sixth Circuit Court of Appeals that said in that case, the licensed nurses involved were supervisors, and therefore no longer covered by collective bargaining agreements (Supreme Court of the United States, 1994). The concepts of decision-making and critical thinking are now included in some scopes of practice, usually in order to define the practice boundary between the practical and registered nurse. However, as with the term “assessment”, it is difficult to argue that practical nurses do not engage in decision-making and critical thinking activities.

34
As in many fields, the professions of RN and LPN seek to protect and expand their jobs and opportunities. The scope of practice regulations delineate the roles of these licensed nurses and thus RN and LPN organizations lobby for scopes of practice that protect jobs. Additionally, in States with powerful RN unions, union contracts and proposed legislation have been explicit about what is and is not the practice of the RN, as compared to the LPN. For example, there has been a controversy in California over whether or not LPNs may administer intravenous medications to patients as part of hemodialysis and blood bank procedures.(Editor, 2003) The California Nurses Association (CNA), which represents RNs, bitterly opposed a change in regulations permitting these activities, while Service Employees International Union (SEIU), which represents LPNs and other hospital workers, supported it. On January 29, 2003, the California Office of Administrative Law approved the new regulation.(Editor, 2003)
When there are shortages of registered nurses, licensed practical nurses often are suggested as substitutes for RNs, or as members of multidisciplinary care provision teams. The ways in which patient care can be allocated across employees depends on the legal scopes of practice of LPNs. In order to better understand the scopes of practice of LPNs, we obtained documentation from virtually every board that regulates the practice of practical and vocational nurses. Our underlying hypothesis was that there is variation in the “restrictiveness” of the scopes of practice for LPNs, and that this restrictiveness influences the role and flexibility of LPNs in work settings. The data show substantial variation in the restrictiveness of scopes of practice, but there also are complexities that require additional explication. As we reviewed the practice acts and scopes of practice information, we determined that there was also variation in the specificity of scopes of practice. Some practice acts and supporting documents are highly specific and others are very vague in describing the roles LPNs can play and the tasks they can complete. Thus, we found that practice acts were variable both in the way the States restricted or enlarged the roles of LPNs and in the specific or nonspecific language they used to detail the roles. We determined that in order to discuss the practice acts and related documentation reasonably, we would categorize the States based on both restrictiveness and specificity of the scopes of practice. To determine our ratings, we relied upon supporting documentation, key informant interviews, focus group data, Web based information, and telephone interviews (Appendix C).
We defined the term restrictiveness as limiting the level of autonomy, flexibility, or independence in the practice of LPNs. The term specificity was defined as explicating or not the defined parameters of practice of LPNs. We created categorical scales for each of the terms and evaluated each State’s scope of practice documents (Appendix C). The scales included the following instructions and relative values.
Restrictiveness
As a relative value, on a scale of 1-4, with 1 being the least restrictive and 4 being the most restrictive, categorize each State’s LPN scope of practice. “Restrictive” is defined as not allowing a level of autonomy, flexibility, or independence in the practice of LPNs
4- Most Restrictive – allows limited practice under the direct supervision or delegation from an RN or physician, usually allows some IV infusion administration with additional training, but no administration of IV medications.

35
3- Fairly Restrictive – allows limited scope of practice with some direct supervision. IV medication administration of premixed solutions is allowed, as well as other functions that may include IV insertion and maintenance.
2- Somewhat Restrictive – IV medication administration of premixed solutions allowed, as well as the functions allowed under #3. An additional 2-3 functions are allowed, but not the advanced functions such as those listed in #1
1- Least Restrictive – allows the broadest scope of practice that may be delegated but not directly supervised. Allows broad range of practice including IV therapy, and in addition several additional advanced functions such as administration of cancer agents, hyperalimentation, arterial blood draws, or patient assessment.
Specificity
As a relative value, on a scale of 1-4, with 1 being the least specific and 4 being the most specific, categorize each State’s LPN scope of practice. Specificity is defined as explicating defined parameters of practice of LPNs.
4-Most specific – Documents are clear and there are detailed regulations with consistent telephone information. Regulations list specific permitted and prohibited activities.
3-Fairly specific – Documents have specific information about permitted activities, but the information is not detailed or complete. Information obtained by telephone also is not complete and allows some room for interpretation.
2-Somewhat specific –Little information is provided with the regulatory documents about specifically permitted and prohibited activities. The telephone information is answered with little detail.
1-Least specific – There is little information in regulatory documents, and no or limited telephone information.
Methodology for Assigning Categories
The three principal investigators for the study, two registered nurses and one economist, met to categorize the practice acts of the boards. We individually reviewed documentation for every board and each reviewer made a determination of specificity and restrictiveness based on individual experience and expert judgment. We read all available documentation, including Web based information, telephone interviews, focus group data, and key informant information, but did not discuss our decisions with each other. We individually categorized both restrictiveness and specificity for every board and completed the scale forms. A research assistant entered the results of the initial determinations into a database.
After the data were entered, one of the reviewers evaluated the results of the three scores. If all three reviewers agreed on a score, the score was accepted. If two reviewers agreed and the third score did not differ by more than 1 point, the majority score was accepted. If there
36
was no agreement among the three reviewers, or if there was a difference of more than 1 point in any of the three scores, the file was pulled for further review. In the initial review, we had
Num
ber
of S
tate
s insufficient data to review the three territories and the commonwealth. For the restrictiveness scale, there were 40 scores that met the criteria for agreement and 12 that were reviewed a second time by all reviewers. For the specificity scale, there were 32 scores that met the criteria for agreement and 20 that were reviewed a second time by all reviewers. During the second review, the reviewers discussed the issues until agreement was reached.
Resu lts
Figures 3.1 and 3.2 provide graphic representations of the final scale score results. Appendices C1 and C2 provide the actual results by State.
Figure 3.1: Restrictiveness Scale
30
25
20
15
10
5
0
15
24
11
2
1.00 2.00 3.00 4.00
As noted in Figure 3.1, most of the States are in the first or second categories of restrictiveness. There are 13 boards in the two most restrictive categories.
Figure 3.2: Specificity Scale

37
25
20
15
10
5
0
Num
ber
of S
tate
s
14
20
6
12
1.00 2.00 3.00 4.00
As noted in Figure 3.2, most States are in the first or second category of specificity, meaning that most States do not have very specific scopes of practice for LPNs. Eighteen States are in the more specific categories.
Based on the focus group data from four States (Louisiana, Massachusetts, California, Iowa), we have indications that individual employers restrict practice of practical nurses even more than regulations require. A number of the focus group members remarked that they were surprised when the facilitator read the actual scope of practice documents. Their responses varied from, “I am not going to mention this to my employer because I will have to do more for the same pay” to “I am going to go back and ask my employer why the practice is restricted more than the legislation allows.”
Conclusion
Our data indicate there are similarities in the practice acts across States but variation in how the States express the details of the work of practical nurses. The data also indicate that most States are flexible in the practice requirements and not overly specific in the tasks that are enumerated. However, there are a number of States with restrictive practice or very specific detailing of tasks that can and cannot be done by practical nurses. These data are used in Chapter 5 to examine whether the restrictiveness and specificity of the scope of practice affect demand for LPNs. The descriptive data presented above suggest that it may be possible to identify States that could reasonably increase their utilization of practical nurses by reducing the restrictiveness of their practice.

38
References
Editor. (2003). Vein of controversy: The dispute over LPN scope of practice goes to court. Nurses World Magazine, October 12-16.
National Council of State Boards of Nursing. (2004). Home page, from http://www.ncsbn.org/about/index.asp
Supreme Court of the United States. (1994). NATIONAL LABOR RELATIONS BOARD, PETITIONER v. HEALTH CARE & RETIREMENT CORPORATION OF AMERICA on writ of certiorari to the united States court of appeals for the sixth circuit; No. 921964; May 23, 1994, from http://supct.law.cornell.edu/supct/html/92-1964.ZO.html

39
Chapter 4: Education of LPNs
Background
The scope of practice and job roles of practical nurses depend, in large measure, on education and training programs. As with curricula for RNs, the approval of training curricula for LPNs rests with the governing board in each State or territory. The governing boards’ responsibilities include approving new training programs, reviewing existing training programs, issuing and re-issuing licenses, monitoring practice, administering disciplinary actions, and providing information regarding practice. Boards define curricular requirements in a variety of ways. As with practice acts and scopes of practice, substantial similarities and some variation in legislation, wording, and actual practice exist in curricular requirements, faculty requirements and other areas of the education process. This chapter will summarize major similarities and differences in the education of LPNs and provide data on national and State trends in LPN education.
Method
In order to examine the education of LPNs, we collected data from a number of sources. Data sources include: (1) U.S. Bureau of Health Professions’ Area Resource Training File (February 2003 Release), (2) National Center for Health Workforce Analysis, Bureau of Health Professions, Health Resources & Services Administration, Department of Health & Human Services, (3) National Council of State Boards of Nursing (NCSBN), and (4) primary data from individual Board Web sites and telephone interviews.
Findings
Curricula Many State and territory boards use the model developed by the National Council of
State Boards of Nursing to guide the language of their regulations related to education and curriculum for practical nursing programs. Most boards have similar ways of describing the administration of the program, the faculty requirements, how to open and close a program and the curricular content. However, curricular requirements vary in specificity, as do the scopes of practice. For example, Arkansas describes specific content to be taught in theory and clinical courses. California and Delaware have detailed faculty qualifications. Arizona and Missouri specify the NCLEX pass rate required in order for the program to remain in good standing with the Board. Some States, such as California, Alaska, Arkansas, Illinois, and the District of Columbia, have continuing education requirements and describe what can and cannot be approved. Arizona and Delaware’s documents discuss the requirements for refresher courses.
Each board tries to provide guidelines for the programs and schools to ensure adequate training of the student. The greatest degree of variation in LPN education is in the required length of the educational programs. Although most programs can be completed in a calendar year, there are exceptions. North Dakota has an associate of science degree for practical nursing that requires 2 or more years of study. California States that programs must be greater than or

40
equal to 1,530 hours or 50 semester units, with theory accounting for 576 hours and clinical training accounting for 954 hours. Connecticut requires that programs last for 230 days. Indiana specifies that programs must last two semesters and one summer, or four quarters. Louisiana sets a specific number of hours for given topics of study. Missouri requires no less than a 10month program. Oklahoma requires that programs last between 1300 and 1600 clock hours or 32-40 semester hours. Each board has mechanisms to evaluate LPN programs, for both the establishment of a new program and re-approval of an existing program.
Trends in LPN Education Figure 4.1 illustrates the number of graduates, enrollment, and admissions in U.S.
practical nursing schools from 1976 to 1998. Specific information by State and school are in the appendix. Over the 22 years shown, there have been cycles of growth and decline, but the decline has been persistent since 1994. After 1994, there was significant downsizing of U.S. hospitals, as a result of the growth of managed care health insurance plans and other cost-containment programs, which was accompanied by lower demand for nursing personnel. Appendix D1 presents the detailed information shown in the figure.
Figure 4.1: LPN Admissions, Enrollment, and Graduation Data for the U. S.
0
Num
ber
10,000
20,000
30,000
40,000
50,000
60,000
70,000
1976 1977 1981 1982 1983 1984 1985 1986 1987 1988 1989 1990 1991 1992 1993 1994 1995 1996 1997 1998
Year
i ions iGraduates Total Enrollment Fall Adm ss Adm ssions
Source: Area Resource Training File (February 2003 Release), National Center for Health Workforce Analysis, Bureau of Health Professions, Health Resources & Services Administration, Department of Health & Human Services
Figure 4.2 illustrates the number of programs and schools in the U.S. over the years 1976 to 1997. Since the 1990s, the number of LPN programs has remained relatively stable. Thus, since 1994, there has been a decline in the number of students each program has enrolled and graduated.

41
Figure 4.2: Practical Nurse Programs and Schools in the U.S.
500
600
700
800
900
Num
ber o
f Sch
ools
/Pro
gram
s
1,000
1,100
1,200
1,300
1,400
1,500
1976 1977 1981 1982 1983 1984 1985 1986 1987 1988 1989 1990 1991 1992 1993 1994 1995 1996 1997
Year
Programs Schools
Source: Area Resource Training File (February 2003 Release), National Center for Health Workforce Analysis, Bureau of Health Professions, Health Resources & Services Administration, Department of Health & Human Services
Table 4.1 presents information about active licenses of both registered and practical nurses in the U.S. between 1987 and 2000. There has been a gradual increase in the number of active licenses of both registered and practical nurses since the late 1980s. Even though the number of new graduates has been declining since the early 1990s, the size of the LPN workforce has been rising. This suggests that the flow of LPNs out of the workforce is smaller than the inflow of new graduates, even though the inflow is dropping. The age distribution of LPNs is skewed toward older ages, and as these older LPNs retire greater numbers of new graduates will be needed to maintain the LPN supply.
Table 4.1: Total Number of Active RN & LPN Licenses, 1987-2000
Year RN LPN 1987 2,345,996 829,990 1988 2,404,968 841,441 1989 2,465,779 887,802 1990 2,501,996 844,044 1991 2,595,110 885,063 1992 2,608,422 881,584 1993 2,701,125 886,597 1994 2,892,720 912,585 1995-1996 2,956,425 908,207 1997 2,992,342 883,102

42
Year RN LPN 1998 3,054,215 919,240 1999 3,097,902 911,332 2000 3,103,981 902,154
Table 4.2 provides the number of LPNs who have taken the NCLEX-PN, and the percent passing the exam. The data are available from 1997 through 2000. Based on these data, in 1997 43,352 U.S.-educated LPN candidates took the examination for the first-time. This number is much larger than the 24,522 graduates reported that year in the Area Resource File. According to the user documentation for the Area Resource File (February, 2003 release) (Bureau of the Health Professions, 2003) the Area Resource File is likely to underState the number of graduates because some schools withheld data. We anticipate that the number of U.S.-educated LPN candidates taking the exam for the first time most accurately represents the number of graduates from LPN programs.
Table 4.2: Number of Candidates Taking NCLEX-PN® and Percent Passing, by Type of Candidate
1999 2000Type of Candidate 1997 1998
# took percent # took percen # took percen # took percent exam t exam t exam passed passed exam
passed passed
First-Time, U.S.-Educated 43,351 88.6 40,195 87.2 37,372 86.4 35,572 85.1 Repeat, U.S.-Educated 6,082 43.5 6,947 43.5 7,378 42.4 7,712 41.6 First-Time, Foreign-Educated 1,572 49 1,406 47.9 1,357 47.2 1,306 44.2 Repeat, Foreign-Educated 1,657 24.9 1,688 22.9 1,779 19.7 1,687 20 Invalid Program Codes 93 61.3 95 66.3 TOTAL 52,662 80.2 50,236 77.9 47,979 75.9 46,351 74.3 Source: The NCLEX-RN® and NCLEX-PN® Examination Statistics Database, copyright 1996-2001 (http://www.ncsbn.org/)
Summary
Since the 1990s, the number of LPN programs has remained relatively stable but there has been a decline in number of graduates. Therefore, since 1994, there has been a decline in the number of students each program has enrolled and graduated. The total number of active licenses of LPNs increased slightly through the 1990s. This suggests that LPNs are remaining in the workforce or keeping their licenses active. The number of first time U.S. educated graduates who are taking the NCLEX-PN has dropped, but the percentage of those passing the examination has remained relatively consistent.
LPN educational curricular requirements vary among the States and territories. Most States specify the content and number of hours of training, some more detailed than others. However, most curricula teach similar basic nursing skills training, such as vital signs, patient data collection, patient care and comfort measures, and medication administration. Additionally,

43
most have added requirements for more advanced skills, such as IV infusion and IV medication administration. Even though requirements vary, endorsement of LPNs from one State to another is generally done smoothly. Therefore, the States recognize the similarities of the training programs, even though they have differences.

44
References
Bureau of the Health Professions. (2003). Area Resource File (February 2003 Release). Washington, D.C.: Department of Health and Human Services.
National Center for Health Workforce Analysis. (2004). 2004, from http://bhpr.hrsa.gov/healthworkforce/
National Council of State Boards of Nursing. (2004). Home page, from http://www.ncsbn.org/about/index.asp

45
Chapter 5: Factors Affecting the Supply of and Demand for LPNs
The labor market for licensed practical and vocational nurses consists of two components: the supply of LPNs and the demand for LPNs. Both supply and demand should be affected by the wage paid to LPNs. When wages rise, LPNs should find employment more attractive and increase their supply of labor. Conversely, higher wages increase the cost of hiring to employers and thus demand should decline. When there is a shortage or surplus of LPNs, wages should adjust to rectify the imbalance.
Numerous other factors can affect the supply of and demand for LPNs, however. The family circumstances of LPNs may prohibit them from working full-time, and regulatory requirements might lead to higher or lower demand for LPNs. This chapter examines the underlying supply of and demand for LPNs to identify the factors that affect LPNs’ decisions to work and employers’ demands for them.
The Supply of LPNs
A Conceptual Model of the LPN Supply Labor markets for licensed nurses generally are not national in scope. In some
geographic regions there are few employers and these employers may have a high degree of control over the local labor market. Other nursing labor markets are very competitive, with a plethora of employers. Because job opportunities for licensed nurses are plentiful at nearly all times, nurses usually do not need to relocate to find interesting and rewarding work.
The supply of nurses consists of nurses with active licenses. Some of these nurses are not working in nursing, but they are part of the current pool of nurses potentially available to work. The supply of nurses to a local labor market increases as nurses flow into the labor market by graduating from nursing programs, migrating from other regions, immigrating from other countries, or increasing hours worked. The supply of nurses declines with retirements, migration out of the region, decreasing hours worked, and career changes out of nursing. Figure 5.1 summarizes the labor flows in and out of the stock of licensed nurses.
The primary source of growth in the nursing workforce is graduations from nursing programs. These graduations generally stem from interest in the nursing profession. For the first part of the 20th century, licensed nursing was one of a few occupations widely open to women. Most women faced limited career choices, and nursing was an attractive option to women who were interested in science. As career opportunities expanded for women in the last quarter of the 20th century, however, nursing had to compete with numerous other attractive professions for new entrants. It has been suggested that women now are less likely to choose a traditionally female-dominated career such as nursing (Buerhaus, Staiger, & Auerbach, 2000). However, an annual survey of 350,000 first-year college students across the U.S. found that the percent of students planning on a career in nursing remained steady at five percent between 1966 and 1996 (Astin, 1998).
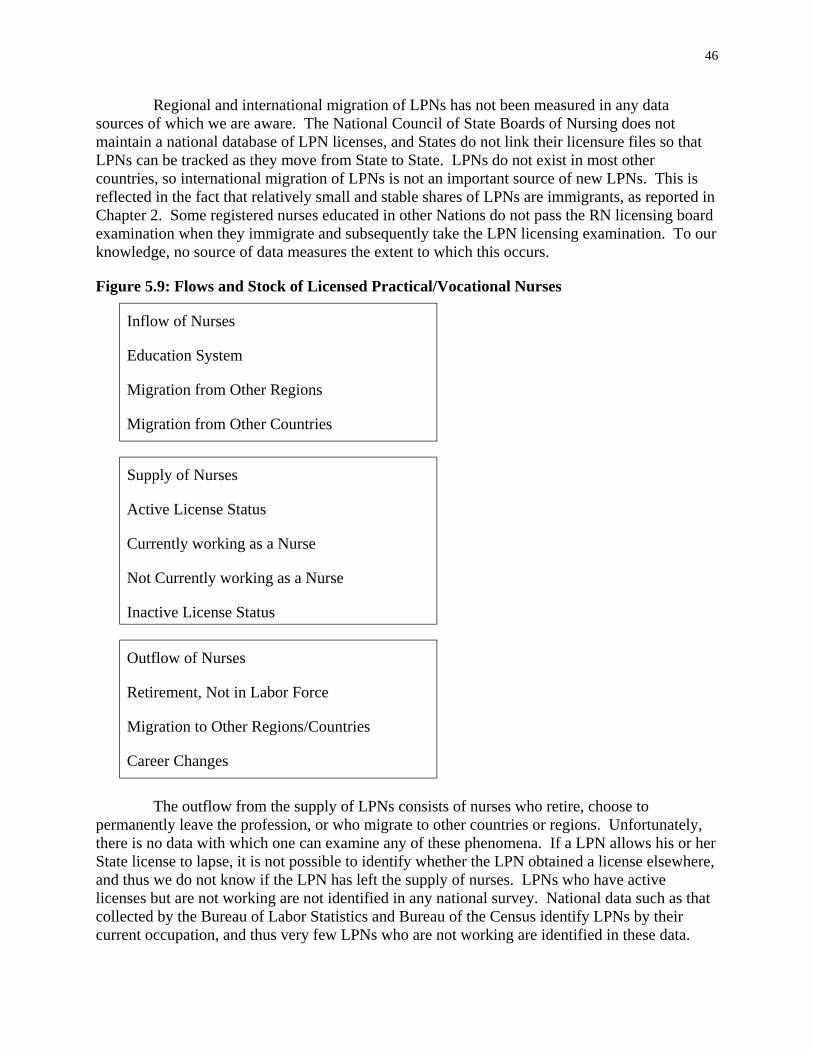
46
Regional and international migration of LPNs has not been measured in any data sources of which we are aware. The National Council of State Boards of Nursing does not maintain a national database of LPN licenses, and States do not link their licensure files so that LPNs can be tracked as they move from State to State. LPNs do not exist in most other countries, so international migration of LPNs is not an important source of new LPNs. This is reflected in the fact that relatively small and stable shares of LPNs are immigrants, as reported in Chapter 2. Some registered nurses educated in other Nations do not pass the RN licensing board examination when they immigrate and subsequently take the LPN licensing examination. To our knowledge, no source of data measures the extent to which this occurs.
Figure 5.9: Flows and Stock of Licensed Practical/Vocational Nurses
Inflow of Nurses
Supply of Nurses
Active License Status
Currently working as a Nurse
Inactive License Status
Outflow of Nurses
Education System
Migration from Other Regions
Migration from Other Countries
Not Currently working as a Nurse
Retirement, Not in Labor Force
Migration to Other Regions/Countries
Career Changes
The outflow from the supply of LPNs consists of nurses who retire, choose to permanently leave the profession, or who migrate to other countries or regions. Unfortunately, there is no data with which one can examine any of these phenomena. If a LPN allows his or her State license to lapse, it is not possible to identify whether the LPN obtained a license elsewhere, and thus we do not know if the LPN has left the supply of nurses. LPNs who have active licenses but are not working are not identified in any national survey. National data such as that collected by the Bureau of Labor Statistics and Bureau of the Census identify LPNs by their current occupation, and thus very few LPNs who are not working are identified in these data.

47
Thus, little can be said about important components of the inflow and outflow of LPNs. The behavior of LPNs who are actively licensed and consider their current occupation to be that of LPN can be examined using the annual Current Population Survey conducted by the Bureau of Labor Statistics and the Bureau of the Census. Many characteristics of these LPNs are available from these surveys, and the factors that affect labor supply can be considered in depth.
Data for Supply Analyses We use data from the 1994-2001 Current Population Survey (CPS) Outgoing Rotation
Group (ORG) (U.S. Bureau of the Census, 2004) to analyze factors that influence the supply of licensed practical nurses. In order to identify licensed practical/vocational nurses in the Current Population Survey, we utilize the occupation codes. With these codes, we identified 4,736 LPNs in the 1994-2001 CPS ORG files. The resulting dataset used to estimate the supply of licensed practical nurses in the U.S. has 4,616 observations. This number does not match the total number of LPNs in the 1994-2001 CPS ORG files since we delete LPN observations that have extreme values (defined as over the 99th percentile) for the earnings and work hours variables used in our analysis.
Methods of Analysis Economic theory suggests that an individual’s work decision is a function of individual
(demographic) characteristics, family characteristics, and labor market conditions. We use the Current Population Survey’s demographic and labor force information on LPNs to create variables for our models of the supply of LPNs. The demographic variables in our models include the following: gender, age, educational attainment, race/ethnicity, and citizenship status. Family characteristics included in our analysis are marital status, number of kids in household by age category (e.g. number of kids aged 0 to 5 in same household as LPN), and household earnings (defined as the sum of weekly earnings of all household members minus the LPN’s weekly earnings).
Labor market variables were generated using the geographic and earnings data in the CPS. We created dummy variables for each region in the United States (Northeast, Midwest, South, and West), and for the population size of the metropolitan statistical area in which LPNs in our sample reside. Also included is the percentage of licensed practical nurses unionized in the LPN’s State of residence. The market wage for LPNs is an important labor market condition. We generate State-level market wages using hourly earnings from our sample of LPNs. Because we had small numbers of observations for some States, we used a complex method to determine markets wages. Each wage is based on 3 years of data, so the wage of a single year is the median of the wages of that year and the years immediately preceding and following that year. For example, the market wage for 1990 is the median of the wages for 1989, 1990, and 1991.
We then group LPN observations in each State based on whether they resided in a metropolitan statistical area (MSA). Those residing in an MSA are considered to be living in an urban area, while those not residing in an MSA are considered to be in a rural area. Using this information, we calculate urban and rural LPN wages for each State. Since sample sizes were small for several States, we decided that the market wage associated with each LPN would have to be calculated from at least 15 observations. We used the following algorithm to assign market wages: if LPN lives in an urban area in a State and the median urban wage for that State is

48
calculated from at least 15 observations, then the market wage is the median urban wage; otherwise, the market wage is the State-level median wage. Substituting “rural” for “urban” in the above algorithm explains the logic for assigning a market wage to LPNs residing in rural areas of a State. Thus, we have three potential market wages for each State, but only one is matched to each LPN in our sample.
Even though we assume market wages are exogenous in our labor supply equations, we cannot rule out the possibility that they are determined simultaneously with supply, thus potentially biasing our estimates. To address this concern, we use two-stage least squares regression as a specification check. This technique produces predicted values for wages after estimating a wage equation.2 We then use these predicted wages in our labor supply regressions, and compare the results with those from the regressions in which market wages are used. As a third specification, we calculate wages for the LPNs in our sample who report being employed. The CPS has data on usual weekly earnings and usual weekly hours of work. We divide usual weekly earnings by usual weekly hours of work to obtain a measure of own wage for each LPN in our sample who reports being employed. We then estimate the supply equations using own wages for working LPNs and predicted wages for non-working LPNs. Thus, we run three regressions for each supply model, each with a different measure of wage.
We focused on three outcome measures in our analysis: (1) the probability of working (labor participation), (2) the probability of working full-time, defined as usually works 30 or more hours per week, and (3) usual hours of work per week. We model each of these to examine the factors that affect the supply of licensed practical nurses. Appendix E1 reports the means of the variables in the dataset used to estimate the supply of LPNs. We discuss trends in the variables here.
Several of the demographic variables show an upward trend in their mean values during our sample time period. These variables include age, and the proportion of LPNs who are black, Native American, have completed some college, and hold an AA degree. Those with a downward trend are the proportion of LPNs who are white and the percent that have no more than a high school education. These trends were discussed in detail in Chapter 2.
The data show an increase in the percent of LPNs holding more than one job, usual hours worked per week, and usual weekly earnings before deductions. Notably, the means of our wage variables follow a similar pattern over our sample time period. They decrease until 1997 and then climb to near their 1994 values by 2001. Most of the market characteristics in the dataset exhibit a trend in their mean values. Union representation/coverage of LPNs decreased, as did the share of LPNs residing in the Northeast and West, and the percent living in metropolitan areas with a population of 500,000 to 2.5 million. The percent of LPNs in our sample that live in the South increased between 1994 and 2001, as did the proportion residing in rural areas.
2 The explanatory variables in the wage equation are dummy variables for male, citizenship status, highest education attained, race, work setting, type of employer, region, city size, and year in sample, as well as age, age squared, and the percentage of licensed practical nurses unionized in state of residence. The average manufacturing wage and number of physicians per 100,000 people in the LPN’s state of residence serve as instrumental variables.

49
LPNs in our sample also increasingly worked for private employers, in personnel supply services, and the offices of physicians. The share working for government and the percent who are self-employed declined during our sample time period. The only family characteristic exhibiting a trend during our sample time period is household earnings, which increased between 1994 and 2001.
Factors That Affect the Employment of LPNs Table 5.1 presents the estimated coefficients and marginal effects from probit regression
equations of the likelihood of a LPN being employed using the Current Population Survey data for 1994 through 2001. The marginal effect measures the increase in probability resulting from increases in the explanatory variable in the regression equation. For example, the marginal effect of living in the Midwest is 0.016. The explanatory variable has a value of 1 if an LPN lives in the Midwest and 0 otherwise. Thus, living in the Midwest increases the probability of being employed 1.6 percentage points, which is the product of the marginal effect and the change in the explanatory variable. In the regression equation tables, the statistical significance of the coefficients is indicated. We focus our discussion on explanatory variables that are significant with a p-value of 0.05, meaning there is a 5 percent chance that the identified relationship is spurious.
The first three columns in Table 5.1 report the estimated coefficients, robust standard errors, and marginal effects for the regression in which market wages are included as an explanatory variable. The next three columns report estimates for the two-stage least squares model in which predicted wages are used, and the final three columns report results from the regression in which the wage is defined separately, as described above, for working and nonworking LPNs. From this point forward, we refer to this last measure of wage as “own wage.”
The results from the probit regression with market wages as an independent variable are quite similar to the results from the two-stage least squares regression in which predicted wages are used to estimate the supply model. The probit regression in which own wages are used produce surprising results, especially concerning the effect of wage.
Though not statistically significant, the estimated coefficients on market wage and predicted wage and their squared values have the expected sign. However, when estimating the model using own wages, we find a negative and statistically significant coefficient on wage. The marginal effect implies that a one-dollar increase in wage decreases the likelihood of a LPN being employed by 1.4 percentage points. Furthermore, the wage-squared coefficient is positive and statistically significant, implying that as the wage increases beyond a certain point, LPNs are more likely to work. This result is opposite the pattern found in many studies of labor supply. The likelihood of employment typically rises with wage at nearly all wage levels. It is important to note that the LPNs in our sample have very high labor participation rates, ranging from 92 percent to 96 percent during our sample time period of 1994-2001. Thus, there is little variation in our outcome variable, and this may affect our regression results. Nevertheless, several of the coefficients of the remaining explanatory variables across all three specifications of our model are in agreement with economic theory.
Demographic characteristics are important predictors of employment of LPNs. The likelihood of working initially increases with age, by 0.1 to 0.4 percentage points, and then
50
decreases as indicated by the coefficients on age squared. The inflection points calculated from the marginal effects indicate that LPNs are less likely to work after age 38 (first specification), 40 (second specification), or 50 (third specification). Native American LPNs are 2.5 to 7.6 percentage points less likely to be working than white LPNs. Black LPNs also are less likely to be employed, although the degree of statistical significance is lower in two of the specifications. In contrast, Asian LPNs are more likely to be working, although this result is only statistically significant at a higher p-value. LPNs who are US citizens by naturalization are 0.6 to 3.4 percentage points less likely to be employed than are US-born LPNs. In the regression with market wage as an independent variable, LPNs who are not U.S. citizens also are less likely to be employed.
Family characteristics do not appear to be strong predictors of labor force participation. In all three specifications of the model, only household earnings have a statistically significant relationship with the likelihood of working for LPNs. LPNs are less likely to work as the earnings of other household members (such as the LPN’s spouse/partner) increase. However, the marginal effects are practically zero.

51
Table 5.1: Probit Results for Probability of Working (1) (2) (3)
Variables Effect Effect Effect
Wage 0.267 (0.255) 0.014 0.303 0.015 -2.220** (0.341) -0.014 Wage Squared -0.010 (0.009) -0.0005 (0.016) -0.001 0.080** (0.013) 0.001
Demographic Variables Male -0.034 (0.177) -0.002 0.030 0.001 -0.040 (0.186) -0.0003 Age 0.069** (0.022) 0.003 0.079** 0.004 0.096** (0.025) 0.001 Age Squared -0.001** (0.000) -0.00004 (0.000) -0.00005 -0.001** (0.000) -0.00001 Some College 0.188* (0.111) 0.009 (0.112) 0.010 0.187 (0.121) 0.001 AA Degree 0.160 (0.108) 0.008 0.188* (0.110) 0.009 0.145 (0.117) 0.001
PhD, or Professional School Degree 0.131 (0.191) 0.006 0.198 0.008 0.090 (0.207) 0.001 Black -0.192* (0.111) -0.011 -0.189* -0.011 -0.244** (0.118) -0.002 Hispanic -0.160 (0.202) -0.009 -0.172 (0.201) -0.010 -0.209 (0.219) -0.002 Native American -0.690** (0.277) -0.068 (0.287) -0.076 -0.945** (0.305) -0.025 Asian 0.639* (0.361) 0.018 0.655* 0.018 0.677* (0.370) 0.002
-0.383** (0.238) -0.028 -0.436* (0.245) -0.033 -0.396 (0.261) -0.005
Naturalization -0.438** (0.208) -0.034 (0.209) -0.032 -0.476** (0.228) -0.006
of All Household
Nurse -0.0004** (0.000) -0.00002 -0.0004** -0.00002 -0.0005** (0.000) -0.000003 Married 0.005 (0.132) 0.0002 0.011 (0.131) 0.001 0.018 (0.140) 0.0001 Previously Married 0.104 (0.153) 0.005 0.106 (0.151) 0.005 0.093 (0.166) 0.001
0-5 in Household -0.051 (0.074) -0.003 (0.073) -0.003 -0.039 (0.082) -0.0003
6-12 in Household -0.055 (0.057) -0.003 -0.057 (0.056) -0.003 -0.075 (0.060) -0.0005
13-17 in Household 0.015 (0.069) 0.001 0.010 0.001 -0.017 (0.078) -0.0001
Northeast 0.217 (0.136) 0.010 0.240* (0.136) 0.011 0.243* (0.143) 0.001 Midwest 0.370** (0.139) 0.016 0.347** (0.145) 0.015 0.410** (0.146) 0.002 South 0.149 (0.127) 0.007 0.100 0.005 0.152 (0.125) 0.001 MSA Population
-0.038 (0.132) -0.002 0.009 0.0004 0.023 (0.138) 0.0001 MSA Population
0.093 (0.170) 0.004 0.150 0.007 0.225 (0.183) 0.001 MSA Population 1,000,000-2,499,999 -0.138 (0.137) -0.008 -0.061 -0.003 -0.029 (0.140) -0.0002 MSA Population 2,500,000+ -0.016 (0.140) -0.001 0.153 0.007 -0.015 (0.132) -0.0001
1995 0.172 (0.149) 0.008 0.176 0.008 0.198 (0.162) 0.001
Market Wages Predicted Wages Own Wages if Working, Else Predicted Wages
Independent Coefficient SE Marginal Coefficient SE Marginal Coefficient SE Marginal
(0.426) -0.014
(0.189) (0.028)
-0.001** 0.207*
Bachelor, Master,
(0.204) (0.111)
-0.738** (0.360)
Not a U.S. Citizen Citizen by
-0.422**
Family Characteristics Weekly Earnings
Members Except (0.000)
No. of Kids Aged -0.054
No. of Kids Aged
No. of Kids Aged
(0.069) Market Characteristics
(0.137)
100,000-499,999 (0.133)
500,000-999,999 (0.179)
(0.150)
(0.187)
Year Dummy Variables (0.150)

52
(1) (2) (3)
Variables Effect Effect Effect
1996 0.235 (0.167) 0.010 0.183 0.008 0.207 (0.181) 0.001 1997 -0.029 (0.148) -0.001 -0.100 -0.005 -0.110 (0.162) -0.001 1998 0.014 (0.151) 0.001 -0.019 (0.156) -0.001 -0.031 (0.167) -0.0002 1999 0.258 (0.175) 0.011 0.258 0.011 0.248 (0.190) 0.001 2000 0.103 (0.154) 0.005 0.076 0.004 0.125 (0.171) 0.001 2001 0.142 (0.157) 0.006 0.146 0.007 0.156 (0.167) 0.001
-529.04 -528.69 -472.19 N 4,478 4,478 4,478
Market Wages Predicted Wages Own Wages if Working, Else Predicted Wages
Independent Coefficient SE Marginal Coefficient SE Marginal Coefficient SE Marginal
(0.176) (0.163)
(0.174) (0.155) (0.156)
Log-likelihood
*p < 0.10 **p < 0.05 Notes: (1) dependent variable equals one if employed, and equals zero otherwise; (2) all regressions include a constant; and (3) standard errors are estimated using the "robust" option in Stata.
Source: Current Population Survey Outgoing Rotation Group Files, 1994-2001
The labor market in which the LPN resides affects employment opportunities, and cultural differences across regions also may affect the likelihood of working. As compared to LPNs living in the West, Midwest LPNs are 0.2 to 1.6 percentage points more likely to work.
It is important to note that LPNs are identified by their self-reported occupation, and thus LPNs who are not working in nursing may not identify themselves as LPNs. The CPS data thus likely overstate the probability of employment, and regression equations estimated for a broader sample of LPNs might produce different results
The Hours Worked by LPNs Once an individual decides to work, a decision must be made about the extent to which
to work. Employees can work part-time or full-time, and the number of hours per week they work can vary. Personal, family, and labor market characteristics affect the decision of how much to work. To explore these relationships, we estimate regression equations similar to those estimated for whether a LPN is working. Table 5.2 presents probit regression equations for the probability of a LPN working full time (i.e., 30 or more hours per week). Again we run three regressions, each with a different measure of wage. The first specification, using market wages as an explanatory variable, is restricted to LPNs who report working, and thus the regression results only apply to the population of working LPNs. The remaining specifications use the full sample of LPNs. Despite differences in how we define the wage variable (and, thus, the wage-squared variable) in each of the three specifications of the model, the regression results are similar.
In all three specifications, the estimated coefficient on wage is positive. It also is statistically significant except in the regression using predicted wages as an independent variable for all observations. For the sample of working LPNs (specification (1)), a one-dollar increase in the market wage increases the likelihood of working full-time 6.8 percentage points. In specification (3), a one-dollar increase in own wage increases the likelihood of full-time employment 2.6 percentage points.

53
Table 5.2: Probit Results for Probability of Working Full-Time (1) (2) (3)
Variables Effect Effect Effect
Wage 0.356** (0.162) 0.068 0.429 0.080 0.142** (0.024) 0.026 Wage Squared -0.013** (0.006) -0.003 (0.011) -0.003 -0.005** (0.001) -0.001
Demographic Variables Male 0.496** (0.160) 0.071 0.505** 0.070 0.538** (0.161) 0.072 Age 0.091** (0.015) 0.017 0.081** 0.015 0.082** (0.016) 0.015 Age Squared -0.001** (0.000) -0.0002 (0.000) -0.0002 -0.001** (0.000) -0.0002 Some College -0.192** (0.073) -0.038 (0.074) -0.041 -0.214** (0.073) -0.041 AA Degree -0.012 (0.072) -0.002 -0.033 (0.073) -0.006 -0.039 (0.072) -0.007
PhD, or Professional School Degree 0.018 (0.135) 0.003 (0.141) 0.003 0.018 (0.138) 0.003 Black 0.202** (0.087) 0.035 0.217** 0.037 0.217** (0.087) 0.036 Hispanic -0.097 (0.152) -0.020 -0.084 (0.151) -0.017 -0.047 (0.154) -0.009 Native American -0.249 (0.251) -0.055 (0.246) -0.039 -0.217 (0.238) -0.045 Asian -0.007 (0.251) -0.001 -0.068 -0.013 -0.029 (0.235) -0.005
0.308 (0.243) 0.049 0.326 0.050 0.305 (0.236) 0.047
Naturalization 0.680** (0.215) 0.085 (0.211) 0.086 0.690** (0.203) 0.083
of All Household
Nurse -0.0001* (0.000) -0.00002 -0.0001 -0.00001 -0.00004 (0.000) -0.00001 Married -0.424** (0.097) -0.076 -0.421** (0.096) -0.073 -0.444** (0.096) -0.076 Previously Married 0.019 (0.110) 0.004 0.020 (0.109) 0.004 0.006 (0.110) 0.001
0-5 in Household -0.128** (0.047) -0.024 -0.123** -0.023 -0.111** (0.046) -0.020
6-12 in Household -0.139** (0.034) -0.026 -0.133** (0.034) -0.025 -0.129** (0.034) -0.024
13-17 in Household -0.119** (0.040) -0.023 -0.119** (0.039) -0.022 -0.112** (0.039) -0.021 Market Characteristics Northeast -0.137 (0.086) -0.027 -0.146* (0.086) -0.029 -0.150* (0.086) -0.029 Midwest -0.004 (0.083) -0.001 (0.085) 0.001 0.001 (0.082) 0.000 South 0.271** (0.089) 0.049 0.290** 0.051 0.260** (0.085) 0.045 MSA Population
-0.236** (0.081) -0.050 -0.228** (0.082) -0.047 -0.210** (0.079) -0.042 MSA Population
-0.189* (0.099) -0.039 -0.189* (0.099) -0.039 -0.184* (0.096) -0.037 MSA Population 1,000,000-2,499,999 -0.142 (0.094) -0.029 -0.149 -0.030 -0.143 (0.089) -0.028 MSA Population 2,500,000+ -0.084 (0.087) -0.017 -0.071 (0.115) -0.014 -0.060 (0.082) -0.011
1995 -0.016 (0.093) -0.003 -0.010 -0.002 -0.002 (0.093) 0.000
Market Wages Predicted Wages Own Wages if Working, Else Predicted Wages
Independent Coefficient SE Marginal Coefficient SE Marginal Coefficient SE Marginal
(0.299) -0.016
(0.161) (0.018)
-0.001** -0.209**
Bachelor, Master,
0.016 (0.086)
-0.187 (0.247)
Not a U.S. Citizen (0.240) Citizen by
0.715** Family Characteristics Weekly Earnings
Members Except (0.000)
No. of Kids Aged (0.046)
No. of Kids Aged
No. of Kids Aged
0.004 (0.093)
100,000-499,999
500,000-999,999
(0.098)
Year Dummy Variables (0.092)

54
(1) (2) (3)
Variables Effect Effect Effect
1996 0.037 (0.101) 0.007 0.038 0.007 0.021 (0.100) 0.004 1997 0.059 (0.100) 0.011 0.076 0.014 0.052 (0.100) 0.009 1998 0.058 (0.101) 0.011 0.064 0.012 0.069 (0.100) 0.012 1999 0.195* (0.106) 0.034 0.187* 0.032 0.180 (0.106) 0.030 2000 0.118 (0.102) 0.021 0.120 0.021 0.106 (0.102) 0.019 2001 0.214** (0.104) 0.037 0.209** 0.035 0.189* (0.104) 0.032
-1558.87 -1581.61 -1554.77 N 4,351 4,478 4,478
Market Wages Predicted Wages Own Wages if Working, Else Predicted Wages
Independent Coefficient SE Marginal Coefficient SE Marginal Coefficient SE Marginal
(0.104) (0.109) (0.103) (0.105) (0.103) (0.103)
Log-likelihood
*p < 0.10 **p < 0.05
Source: Current Population Survey Outgoing Rotation Group Files, 1994-2001
Notes: (1) dependent variable equals one if usually works 30+ hours per week, and equals zero otherwise; (2) in column one, sample is restricted to licensed practical/vocational nurses who reported being employed; (3) all regressions include a constant; and (4) standard errors are estimated using the "robust" option in Stata.
To check for the possibility of backward-bending supply, we included wage-squared as an independent variable. The estimated coefficients are negative in all three specifications, and statistically significant in the regressions with market wages and own wages. The negative coefficients across the three specifications provide evidence that the labor supply of LPNs is backward bending, indicating that after a point, further wage increases reduce the likelihood of working full-time. A possible explanation is that LPNs want to earn a target income, and as wages rise they need to work fewer hours to reach this target.
Demographic characteristics are important predictors of whether LPNs work full-time. Notably, the same demographic variables have statistically significant coefficients regardless of how we define wages. Furthermore, there is very little difference in the marginal effects. For example, black LPNs are 3.5 to 3.7 percentage points more likely to work full-time than are white LPNs. Male LPNs are 7.0 to 7.2 percentage points more likely than females, and LPNs who are naturalized citizens are 8.3 to 8.6 percentage points more likely than U.S.-born LPNs. LPNs with some college education but no degree are less likely to work full-time than LPNs who have never attended college. Finally, LPNs are more likely to work full-time until their late thirties or early forties, after which time age has a negative association with the likelihood of working full-time.
Family characteristics also are important factors for LPNs in deciding whether to work full-time. As the earnings of other members of the household increase, the likelihood of a LPN working full-time decreases. However the estimated coefficients in all three specifications are small in magnitude and only the coefficient in the regression with market wages is statistically significant. All three specifications of the model indicate that married LPNs are less likely to work full-time than are LPNs who have never been married. As expected, the presence of children in the household is negatively associated with full-time work. The results are similar for each age category and suggest that each child under the age of 18 reduces the likelihood of a LPN working full-time by approximately two percentage points.

55
Several market characteristics affect the probability of a LPN working full-time. LPNs residing in the South are 4.5 to 5.1 percentage points more likely to work full-time than are LPNs in the Western region of the U.S. The results for all three specifications of the model also indicate that LPNs residing in urban areas with a population between 100,000 and 499,999 are less likely to work full-time than those residing in less populated areas. Finally, compared to the beginning of the sample time period, LPNs in 2001 were more likely to work full-time.
Table 5.3 presents regression equations for the usual number of hours worked per week in the past year. As before, we run three regressions, each with a different measure of wage. When market wages are used, the sample is restricted to LPNs who report being employed. Otherwise, the full sample of working and non-working LPNs is used.
The regression results are remarkably similar; however, there are key differences centered on the coefficients for wage. In the specifications (1) and (2), wage is positively associated with hours of work. However, this result is only statistically significant when we correct for the potential endogeneity of wages. In this case, the estimated coefficient implies that LPNs on average work an additional 3.2 hours per week for each dollar increase in wage. In specification (3), the coefficient on own wage is negative, but statistically insignificant. Again, we find evidence of a backward bending supply curve. In all three specifications, the estimated coefficient on wage squared is negative and statistically significant, albeit at a higher p-value.
Male LPNs work more hours per week than do women, and black LPNs work more hours than white LPNs. The number of hours worked increases with age until age 39 (37 in specification (3)) after which time age has a negative relationship with hours worked per week. LPNs who are citizens by naturalization work an average of 2.5 to 2.6 hours per week more than do US-born LPNs.
Family characteristics affect the number of hours worked per week in ways that are consistent with the regression equations that examine full-time versus part-time work. Married LPNs work approximately 2.2 fewer hours per week than do unmarried LPNs. Children also reduce hours worked per week, with the effect being largest for children younger than thirteen. The earnings of other members of a LPN’s household are negatively associated with hours worked per week, but in all specifications the size of the coefficient is so small as to be negligible.
The average number of hours worked per week varies across regions of the United States. Southern LPNs work 1.2 to 1.4 hours per week more than do LPNs in Western States, and LPNs living in the Northeast work fewer hours.
The Demand for LPNs
The demand for licensed nurses is derived from the demand for health care, and is affected by a variety of factors, including the general population’s demographics and health, new medical treatments, health care payment systems, and health care regulations. Health care providers rely on licensed nurses to provide the majority of direct patient care. Registered nurses assess patients, develop plans for their care, perform tests, provide medical treatments, plan for

56
patients’ discharges, teach patients and their families how to provide ongoing care, and keep detailed records of all these activities. Licensed practical and vocational nurses assist in patient assessments and the development of care plans, provide medications to patients, start intravenous fluids, obtain blood samples, and participate in numerous other components of patient care. Without licensed nurses, many health care providers could not care for patients.

57
(1) (2) (3)
Wage 1.379 (0.928) 3.198* (1.805) -0.003 (0.183) Wage Squared -0.057* (0.033) -0.127* (0.066) -0.010* (0.006) Demographic Variables Male 3.076** (0.615) 3.303** (0.641) 3.345** (0.599) Age 0.624** (0.102) 0.625** (0.116) 0.667** (0.104) Age Squared -0.008** (0.001) (0.001) -0.009** (0.001) Some College -0.495 (0.382) -0.490 (0.384) -0.504 (0.377) AA Degree 0.364 (0.359) 0.381 (0.365) 0.362 (0.355)
School Degree 0.872 (0.601) 1.135* (0.636) 1.096* (0.607) Black 1.212** (0.382) 1.208** (0.381) 1.220** (0.377) Hispanic -0.580 (0.616) -0.654 (0.615) -0.576 (0.606) Native American 0.091 (1.469) 0.036 (1.463) -0.210 (1.454) Asian 0.904 (1.154) 0.802 (1.149) 0.788 (1.085)
0.476 0.218 (0.944) 0.300 (0.893) 2.513** (0.816) 2.610** (0.807) 2.487** (0.782)
-0.0005* (0.000) -0.0005* (0.000) -0.0004 (0.000) Married -2.203** (0.420) (0.421) -2.170** (0.410)
0.381 0.389 (0.452) 0.392 (0.443) (0.282) -0.821** (0.282) -0.738** (0.276) (0.204) -0.886** (0.205) -0.845** (0.203) (0.230) -0.443* (0.231) -0.490** (0.228)
Market Characteristics -0.262 (1.054) -0.199 (1.051) -0.174 (1.047)
Northeast -0.909* (0.488) -0.828* (0.492) -0.877* (0.484) Midwest -0.594 (0.484) -0.466 (0.494) -0.542 (0.464) South 1.212** (0.480) 1.364** (0.501) 1.235** (0.454)
-0.497 -0.506 (0.462) -0.399 (0.437) -0.698 -0.691 (0.547) -0.598 (0.529) -0.206 (0.487) -0.224 (0.512) -0.144 (0.466) -0.061 0.269 (0.597) 0.175 (0.416)
1995 -0.166 (0.476) -0.116 (0.478) -0.097 (0.476) 1996 0.453 (0.527) 0.451 (0.553) 0.361 (0.522) 1997 0.637 (0.538) 0.599 (0.585) 0.452 (0.531) 1998 0.422 (0.539) 0.437 (0.549) 0.383 (0.532) 1999 0.578 (0.492) 0.613 (0.497) 0.564 (0.490) 2000 0.837 (0.524) 0.816 (0.533) 0.763 (0.522) 2001 0.916* (0.506) 0.987* (0.505) 0.894* (0.501)
R-squared 0.0843 0.0836 0.1026 N 4,002 4,002 4,002
) (2)( ) (3)
Table 5.3: Regression Results for Usual Hours Worked Per Week
Market Wages Predicted Wages Own Wages if Working, Else Predicted Wages
Independent Variables Coefficient SE Coefficient SE Coefficient SE
-0.008**
Bachelor, Master, PhD, or Professional
Not a U.S. Citizen (0.922) Citizen by Naturalization Family Characteristics Weekly Earnings of All Household Members Except Nurse
-2.179** Previously Married (0.452) No. of Kids Aged 0-5 in Household -0.824** No. of Kids Aged 6-12 in Household -0.877** No. of Kids Aged 13-17 in Household -0.453**
Percentage of LPNs Unionized in State
MSA Population 100,000-499,999 (0.452) MSA Population 500,000-999,999 (0.547) MSA Population 1,000,000-2,499,999 MSA Population 2,500,000+ (0.450) Year Dummy Variables
*p < 0.10 **p < 0.05
Source: Current Population Survey Outgoing Rotation Group Files, 1994-2001
Notes: (1 in the first column, the sample is restricted to nurses who reported being employed; standard errors in parentheses are estimated using the “robust” option in Stata; and all regressions include a constant.

58
The dominant employer of licensed nurses is the hospital industry, although RNs are more likely to work in hospitals than are LPNs. As the number of patients and patient days in hospitals rise, demand for RNs and LPNs rises (Spetz, 1999). The increasing acuity of illness of patients in the hospital makes RNs particularly important to hospital care, as does the diffusion of high-technology medical services in hospitals (Spetz, 1999). LPNs are generally restricted from giving patients medications through intravenous lines (IVs), administering blood products, and providing other types of care that are critical in the hospital setting. These restrictions reduce the usefulness of LPNs to hospitals.
A high share of LPNs work in nursing homes and long-term care facilities; relatively fewer RNs work in this setting. Patients in nursing homes generally do not receive complex treatments such as IV medication therapy, and thus much of the patient care in nursing homes can be provided by LPNs and unlicensed nursing personnel. LPNs assist in the ongoing assessment of nursing home patients and the administration of oral medications. In this section we use hospital and nursing home data to examine the demand for LPNs by these employers.
Data for the Analysis of Hospital Demand To analyze the demand for licensed practical/vocational nurses in general acute care
hospitals, we use 1990-2000 data from the American Hospital Association (AHA) Annual Survey of Hospitals. This database contains hospital-level information on organizational structure; facilities and services; community orientation; total beds, utilization, finances, and staffing; and location and other geographic codes. The AHA surveys all hospitals in the United States and the response rate averages 85 to 95 percent annually (American Hospital Association, 1999). Thus, in any year, the AHA Annual Survey Database has around 6,000 hospital observations.
The AHA Annual Survey asks hospitals to report full-time and part-time personnel for the total facility and for specific types of personnel, including registered nurses and licensed practical/vocational nurses. The survey specifically defines full-time as working 35 hours or more per week, and part-time as working less than 35 hours per week (American Hospital Association, 1999). The staffing figures reported by the hospitals are then converted by the AHA into full-time equivalent (FTE) measures. According to the AHA, full-time equivalent figures are calculated by adding the number of full-time personnel to half the number of part-time personnel (American Hospital Association, 1999). We use full-time equivalent LPN employment as our measure of LPN staffing for short-term, general acute care hospitals. However, we should note that this measure potentially overestimates or underestimates the use of LPNs by hospitals. For example, a nurse who works 20 hours per week and one who works 34 hours per week each would be counted as one-half of an FTE. Similarly, a nurse who works 35 hours per week and one who works 40 hours per week would each count as one FTE.
We model hospital demand for LPNs as a function of hospital, patient, and market characteristics. This model is similar to that used in previous studies of the demand for nurses (Spetz, 1999). We construct hospital characteristic variables using data from the AHA. We measure the quantity of care provided by each hospital in our sample as the number of patient days. Also included in our model are Medicare’s share of total patient days, and the hospital’s service mix. Our measure of service mix is the Saidin technology index (Spetz and Maiuro,

59
2004). The Saidin index provides a measure of the degree of technology available at hospitals by weighting each potential service and calculating the sum of weighted services available at each hospital. The more rare the technology used by a hospital, the higher the weight it receives (Spetz & Maiuro, 2004).
Patient characteristics in our demand model are the average length of stay (available from the AHA data) and the hospital’s case mix index from Medicare files (available from the Center for Medicare & Medicaid Services). Both measures control for changes in patient volume, but the case mix index also controls for variation in the complexity or severity of cases treated by hospitals.
We use data from the 1989-2001 Current Population Survey Outgoing Rotation files and the Bureau of Health Professions Area Resource File (ARF) (Bureau of the Health Professions, 2003) to create market-level variables. The CPS contains union status information and we use this to create variables denoting the percentage of LPNs, RNs, and all workers in a given State who are covered by or a member of a union. We calculate market wages for registered nurses, licensed practical nurses, and nurse aides using earnings data from the CPS ORG files. The market wages are median values calculated from 3 years of data. For example, 1990 LPN market wages are based on hourly earnings reported by LPNs in 1989, 1990, and 1991. Furthermore, we calculate these at both the State level and for urban and rural areas within a State. Thus, for each nurse type, we have with three potential market wages per State. We attach an LPN, RN, and nurse aide market wage to each hospital observation in our sample depending on the number of observations used in creating the respective market wage. If the rural or urban wage for a given State was calculated from less than 15 observations, then we assign the State-level wage to the hospital. Otherwise, we assign the rural wage if the hospital is in a rural area or the urban wage if the hospital is in an urban area. In the end, each hospital observation in our sample is matched to three market wages, one for each type of nurse.
We also include managed care variables in our demand model, which were generously provided by Douglas R. Wholey of the University of Minnesota. Managed care activity is measured with two variables: the number of HMOs operating in the county and HMO penetration. We also create a variable interacting these two measures of the managed care environment, and include this in our analysis (Wholey, Christianson, Engberg, & Bryce, 1997). County-level per capita income also is included in the model, and was obtained from the Area Resource File. Finally, we include the two State-level scope of practice variables described in Chapter 3 in some equations.
We estimated our demand equations including several other variables from the ARF, such as physicians per 1,000 population and the share of population estimated to be aged 65 and over; however, we do not report the results of these regressions because these variables had no statistically significant relationship with our dependent variable, nor did their inclusion affect any other coefficients. Our dataset for estimating hospital demand for licensed practical nurses contains 54,258 hospital observations over our sample time period from 1990 to 2000.
As shown in Appendix E2, the average number of full-time equivalent LPNs in our sample of hospitals declined between 1990 and 2000. In contrast, the mean number of full-time

60
equivalent RNs increased. As a result of these trends, the ratio of LPNs to all licensed nurses declined during our sample time period.
All of the variables denoting hospital and patient characteristics exhibit trends in their mean values. The average number of inpatient days and length of stay declined between 1990 and 2000. Medicaid’s share of inpatient days increased, however, as did the service mix and the severity of cases treated in our sample of hospitals.
Market wages for LPNs, RNs, and nurse aides were higher on average in 2000 compared to 1990. However, the data do not show a continuous upward trend during our sample time period. RN and LPN market wages increased between 1990 and 1994, and then declined during the mid-1990s. In contrast, market wages for nurse aides declined during the first half of our sample time period, and then increased between 1994 and 2000.
Other market characteristics in our dataset also exhibit trends. The degree of HMO penetration increased between 1990 and 2000, as did the average number of HMOs operating in a county. In addition, the average per capita income in the hospitals’ counties increased during our sample time period.
Methods for Analyzing Hospital Demand for LPNs In our hospital demand analysis, our dependent variable is the log of the number of full-
time equivalent LPNs. We also log several of our independent variables to normalize their distributions. Thus, our demand equation is log-linear in form. Each regression includes dummy variables for each year in our sample. We estimate robust standard errors using the “cluster” command in Stata because it is possible that observations within a State may not be independent (StataCorp, 2003).
We use several estimation methods in our demand analysis. This is motivated by two concerns. One is that there could be some unknown factor inherent to each hospital that affects its demand for licensed practical nurses. If this is the case, ordinary least squares (OLS) estimates will be inefficient. To address this possibility, we estimate fixed effects models to allow for individual hospital effects.
Another concern is the potential endogeniety of LPN wages1. If wages are endogenous in the demand equation, then OLS estimates will be inconsistent. Thus, we also estimate our demand equation using the instrumental variable procedure in Stata (StataCorp, 2003). To use this procedure, we have to find variables that are correlated with wages, but not correlated with the error term in our demand equation. County unemployment rates, obtained from the Area Resource File, have been used as an instrument for nurse wages in other studies (Spetz, 1999). As unemployment rates rise, spouses are more likely to be unemployed, and thus the nurse is more likely to work. We also try two other instruments: the average age of LPNs in the
1 We assume that the market wages for registered nurses and nurse aides are exogenous in our model of hospital demand for licensed practical nurses. While individual hospitals’ wages to nurses may indeed be simultaneously determined with demand, market wages should not be influenced significantly by any single hospital’s demand for LPNs.

61
hospital’s market area2, and the percent of all workers unionized within the State. We estimate first-stage regressions for LPN wages including these instruments as explanatory variables, and consistently find that the estimated coefficients on all but the county-level unemployment rates are highly significant. Thus, we determine that the average age of LPNs and the percent of workers unionized within a State are good instruments for LPN wage in our demand equation. We further check for the endogeneity of wages by conducting a Hausman test (Hausman, 1978; Kennedy, 1998; StataCorp, 2003). The test results provide no evidence that LPN market wages are endogenous in our model. Thus, we report regression results both with and without instrumental variables, because although theory suggests instrumental variables are needed, the Hausman test indicates they may not be appropriate.
Longitudinal Analysis of Hospital Demand for LPNs Table 5.4 presents regression equations estimating hospital demand for licensed
practical nurses as a function of hospital, patient, and market characteristics. The first two columns present the ordinary least squares equation coefficients and standard errors. The second two columns present the results of a fixed effects equation, which includes a dummy variable for each hospital to control for hospital characteristics that are unobserved and constant over time. The final two columns contain the results of the model estimated with fixed effects and instruments to control for the endogeneity of wages.
Conventional economic theory predicts that demand for employees will decline as their wages rise. At the same time, demand for a type of employee could rise or fall with the wages of other employees, depending on whether other employees are complements or substitutes. The results presented in Table 5.4 are consistent with this theory. Higher LPN wages have a negative effect on demand for LPNs when instrumental variables are used to control for the endogeneity of wages. The importance of addressing endogeneity is demonstrated by the positive, significant relationship between wages and demand in the uninstrumented fixed effects model. In all three models, higher RN wages are associated with higher demand for LPNs. This finding suggests that LPNs are used as substitutes for RNs, at least in part. The fixed effects and instrumental variables models indicate that a ten percent increase in the RN wage will raise LPN demand about two to three percent. Aide wages have a modest positive relationship to demand for LPNs in the fixed effects equations, with a ten percent increase in the aide wage having less than a one percent effect on demand. In the ordinary least squares equation, the aide wage has a very large, negative effect on LPN demand.
The volume of patients cared for at a hospital has an important effect on demand for LPNs. The fixed effects and instrumental variables models estimate that ten percent growth in the number of inpatient days increases the demand for LPNs by about four percent. Conversely, as the length of stay of these patients rises, the demand for LPNs falls. The coefficient measuring the relationship between case mix and demand for LPNs is negative as well. LPNs are less able to care for acutely ill patients, and thus as acuity rises, demand will fall. Hospitals with a higher level of technology demand fewer LPNs.
2 Average ages were computed in the same way as were market wages and merged to each observation in the same fashion.

62
The ability of hospitals to hire staff depends on the revenue received in exchange for patient care services. Several variables measure the potential revenues available to hospitals. As the share of patient days reimbursed by Medicaid rises, demand for LPNs also rises. Medicaid reimbursements to hospitals are known to be low, and hospitals that have high shares of Medicaid patients also typically have large shares of charity and non-paying patients. Thus, it is possible that this relationship results from hospitals with a high share of Medicaid patients having smaller personnel budgets. Another possibility is that Medicaid patients are somewhat less acutely ill than are other patients, and thus as the share of Medicaid patients rises, LPNs are better able to care for more patients.
The next three variables measure the relationship between the type of hospital owner and demand for LPNs. For-profit, district, and government hospitals have greater demand for LPNs than do not-for-profit hospitals, holding other factors constant. The potential reasons for these findings vary by type of owner. For-profit hospitals have a financial incentive to hire less-expensive LPNs to increase their profit margins. District and government hospitals may have smaller personnel budgets because they rely at least in part on tax revenues; thus, they may stretch their budgets with LPNs.

63
Acute Care Hospitals, 1990-2000 ) )
Instrumenting for
) ) ( ) ( ) )
) ( ) ( ) ( )
) ) ) ( ) ( )
) ( ) ( ) ) ( ) ( )
( ) ( ) ( ) )
) ) ) )
( ) ( ) ( )
) ( ) ( ) ( ) ( ) ( )
- (0.000) - (0.000) - (0.000)
in State
in State
( ) ( ) ( ) ( ) ( ) ( ) ( ) ( ) ( ) ( ) ( ) ( ) ( ) ( ) ( )
( ) ( ) ( )
N
) (2))
Table 5.4: Estimates of Demand for Licensed Practical/Vocational Nurses in U.S. General
OLS (s.e. Fixed Effects (s.e. Fixed Effects,
LPN Wages (s.e.) log (LPN Wage -0.154 (0.259 0.290** 0.044 -0.804** 0.390log (RN Wage 0.645** (0.235) 0.235** (0.047) 0.286** (0.051) log (Nurse Aide Wage -1.140** 0.324 0.009 0.046 0.095* 0.055
log (Inpatient Days 0.754** (0.027) 0.420** (0.013) 0.424** (0.014) log (Length of Stay -0.512** (0.028 -0.192** 0.015 -0.192** 0.015Case Mix 0.037 (0.087 -0.202** 0.034 -0.201** 0.035Technology (Saidin Index) -0.030** (0.012 -0.039** 0.002 -0.038** 0.002log (Medicaid Share of 0.036* 0.020 0.024** 0.004 0.023** 0.004Inpatient DaysFor Profit Hospital 0.190** (0.050) 0.142** (0.020) 0.154** (0.020) District Hospital 0.221** (0.058 0.090** (0.025 0.098** (0.025Government (State or local 0.161** (0.053) 0.117** (0.023) 0.117** (0.023) Hospital
Number of HMOs Operating in -0.022* 0.013 -0.006** 0.002 -0.004** 0.002County HMO Penetration -0.328 (0.223 -0.139** 0.046 -0.115** 0.047No. of HMOs X HMO 0.011 0.029 -0.004 0.004 -0.014** 0.005Penetration Per Capita Income in County
Percentage of LPNs Unionized 0.175 (0.154) 0.060** (0.024) 0.060** (0.025)
Percentage of RNs Unionized 0.007 (0.263) -0.013 (0.049) -0.063 (0.052)
1991 -0.006 0.022 -0.001 0.011 0.026* 0.0141992 -0.063** 0.027 -0.054** 0.011 -0.012 0.0191993 -0.115** 0.033 -0.093** 0.012 -0.047** 0.0201994 -0.031 0.037 -0.023** 0.012 0.022 0.0201995 0.039 0.041 -0.001 0.013 0.039** 0.0191996 0.072 (0.045) 0.009 (0.014) 0.046** (0.019) 1997 0.140** (0.052) 0.045** (0.015) 0.078** (0.019) 1998 0.163** (0.059) 0.040** (0.017) 0.100** (0.027) 1999 0.137** (0.058) 0.002 (0.018) 0.083** (0.034) 2000 0.121* 0.062 -0.029 0.019 0.061* 0.037
R-Squared 0.519 0.458 0.451 42,401 42,317 42,299
*p < 0.10 **p < 0.05
Sources: American Hospital Association Annual Survey of Hospitals, Current Population Survey Outgoing Rotation Group Files, and Area Resource File. Managed care data courtesy of Douglas R. Wholey
Notes: (1 the dependent variable is log (Number of Full-time Equivalent Licensed Practical Nurses) all regressions include a constant; and (3 OLS regression uses the cluster (on State) option in Stata.

64
As HMO penetration and the number of HMOs operating in a county rise, the demand for LPNs falls, and these effects are somewhat accelerated as the interaction between penetration and the number of HMOs rises. Greater HMO penetration in a market is thought to have a primary effect of reducing revenues available to hospitals. Such revenue reduction could reduce demand for LPNs because hospital budgets are tighter. However, HMOs also may value the quality of care offered by hospitals, and thus as HMO penetration increases, hospitals are pressured to favor the hiring of more-skilled RNs while reducing LPN staff.
County income affects demand for LPNs. As per capita income rises, the demand for LPNs falls. This relationship may arise if wealthier patients prefer hospitals with more highly skilled staff, and thus hospital demand for LPNs falls.
Statewide unionization of LPNs is associated with greater demand for LPNs in the instrumental variables equation. This relationship may indicate that unionized LPNs are better able to ensure that they are retained in hospital staffing models. Conversely, LPNs may be more likely to unionize when their numbers are higher in the hospital industry. RN unionization has no statistically significant relationship to LPN demand.
The coefficients of the yearly dummy variables indicate that there has been some change in hospital demand for LPNs over time. In 1993, demand for LPNs was lower than in 1990, while demand rose from 1995 through 1999. This period of increased demand coincides with reports that hospitals were redesigning their nursing services to emphasize team nursing and less-skilled nursing personnel. In these staffing strategies, LPNs would have had a more prominent role, and thus demand for LPNs would have risen.
Table 5.5 presents regression equations similar to Table 5.4, but the dependent variable is employment of LPNs as a share of all licensed nurses. In these equations, we can directly compare the effects of explanatory variables on demand for LPNs to demand for RNs. The results confirm those of the level of LPN employment equations. Relative demand for LPNs declines as the LPN wage rises, and it rises with growth in RN wages.
Increases in the number of inpatient days has no effect on relative demand for LPNs, suggesting that hospitals maintain a consistent skill mix even as patient volumes rise. Longer lengths of patient stays increase relative demand for LPNs, even though they decrease overall demand for LPNs. Together, these findings suggest that longer lengths of stay are associated with lower overall demand for nursing care, perhaps because the share of patients in intermediate and rehabilitation units increases.
A higher patient case mix reduces relative demand for LPNs, although this relationship is statistically significant only in the ordinary least squares equation. The coefficient on the technology index is consistent with expectations, in that higher technology reduces relative demand for LPNs. It is possible that case mix is collinear with both length of stay and the technology index, so the statistically insignificant coefficients for case mix result from multicollinearity rather than a lack of relationship.

65
) ) Instrumenting for LPN
) ) ( ) ( ) ( ) ( ) ( ) ( )
) ( ) ( ) ( )
( ( ) ( ) ( ) ( ( ) ( ) ( )
Case Mix ( ) ( ) ( ) ) ( ) ( )
( ( ) ( ) ( ) ( ) ( ) ( ) ( ) ( ) ( ) ( ) ( ) ( )
) ( ) ( ) ( ) ( ) ( ) ( ) ( ) ( )
- (0.000) ( ) ( )
( ) ( ) ( ) ) ) )
( ) ( ) ( ) ( ) ( ) ( ) ( ) ( ) ( ) ( ) ( ) ( ) ( ) ( ) ( ) ( ) ( ) ( ) ( ) ( ) ( ) ( ) ( ) ( ) ( ) ( ) ( ) ( ) ( ) ( )
N)
) (2) )
Per capita
Table 5.5: Estimates of Relative Demand for Licensed Practical/Vocational Nurses OLS (s.e. Fixed Effects (s.e. Fixed Effects,
Wages (s.e.) log (LPN Wage -0.055 (0.041 0.019** 0.006 -0.126** 0.055log RN Wage 0.098** 0.045 0.039** 0.007 0.046** 0.007log (Nurse Aide Wage -0.234** 0.056 -0.024** 0.006 -0.012 0.008
log Inpatient Days) -0.016** 0.005 -0.002 0.002 -0.002 0.002log Length of Stay) 0.027** 0.004 0.016** 0.002 0.016** 0.002
-0.070** 0.013 -0.006 0.005 -0.006 0.005Technology (Saidin Index) -0.004** (0.001 -0.001** 0.000 -0.001** 0.000
log Medicaid Share of 0.007** 0.003 0.005** 0.001 0.005** 0.001For Profit Hospital 0.027** 0.008 0.015** 0.003 0.017** 0.003District Hospital 0.040** 0.010 0.022** 0.004 0.023** 0.004Government (State or local) 0.020* 0.010 0.024** 0.003 0.024** 0.003
Number of HMOs Operating in -0.003** (0.001 -0.002** 0.000 -0.002** 0.000HMO Penetration -0.070** 0.027 -0.020** 0.007 -0.017** 0.007No. of HMOs X HMO 0.005* 0.003 0.004** 0.001 0.003** 0.001
Per Capita Income in County 0.000 -0.000001** 0.000
Percentage of LPNs Unionized 0.014 0.022 0.006* 0.003 0.006* 0.003Percentage of RNs Unionized 0.004 (0.044 0.001 (0.007 -0.005 (0.007
1991 -0.008** 0.004 -0.009** 0.002 -0.005** 0.0021992 -0.021** 0.005 -0.024** 0.002 -0.018** 0.0031993 -0.033** 0.006 -0.036** 0.002 -0.030** 0.0031994 -0.030** 0.007 -0.038** 0.002 -0.032** 0.0031995 -0.021** 0.007 -0.040** 0.002 -0.035** 0.0031996 -0.022** 0.007 -0.049** 0.002 -0.044** 0.0031997 -0.012 0.007 -0.049** 0.002 -0.044** 0.0031998 -0.009 0.009 -0.057** 0.002 -0.049** 0.0041999 -0.008 0.010 -0.063** 0.003 -0.052** 0.0052000 -0.010 0.010 -0.071** 0.003 -0.058** 0.005
R-Squared 0.378 0.098 0.181 43,289 43,204 43,186
*p < 0.10 **p < 0.05 Notes: (1 the dependent variable is log (LPNs as a Proportion of Total Licensed Nurse Staff all regressions include a constant; and (3 OLS regression uses the cluster (on State) option in Stata.
Sources: American Hospital Association Annual Survey of Hospitals, Current Population Survey Outgoing Rotation Group Files, and Area Resource File. Managed care data courtesy of Douglas R. Wholey.
The effects of payer mix and hospital ownership in the relative demand equations are similar to those in the level of demand equations. Hospitals with higher shares of Medicaid inpatient days have greater relative demand for LPNs, and the relative demand for LPNs falls as HMO penetration and the number of HMOs increases. For-profit, district, and government hospitals have greater demand for LPNs relative to RNs than not-for-profit hospitals. county income also has a negative effect on relative demand for LPNs. Hospitals in States with higher shares of LPNs in unions have greater relative demand for LPNs.

66
Relative demand for LPNs declined from 1991 through 2000 (relative to 1990). Combined with Table 5.4, these findings indicate that although absolute demand for LPNs stabilized in the late 1990s, hospitals have demanded relatively more RNs over time.
These findings demonstrate the importance of wages, hospital characteristics, and payer mix on hospital demand for LPNs. As hospitals face increased pressure to reduce costs, or face higher wages for RNs and LPNs, the demand for LPNs changes significantly. There have been periods of time during which LPNs have been considered attractive substitutes for RNs, and other times when demand for LPNs dropped because hospitals preferred RNs. These demand changes have large effects on the career opportunities of LPNs.
The Effect of Scope of Practice on Hospital Demand for LPNs The longitudinal models presented above omit one important factor that could affect
demand for LPNs: scope of practice regulations. Using the categorizations of LPN scope of practice created as part of this study, we examined the relationship between the scope of practice of LPNs and hospital demand for LPNs. This is a complex undertaking, because these things are determined jointly. For example, a liberal scope of practice may encourage employers to demand LPNs and reduce demand for other workers such as RNs. However, when there is a shortage of RNs, employers are likely to increase their demand for LPNs and also to lobby State legislatures for expanded scope of practice for LPNs. Because the relationship between demand and scope of practice is likely to be endogenous, we use instrumental variables to predict scope of practice regulations, in a fashion similar to that used to control for endogeneity of wages. Our instruments are a set of variables measuring the political characteristics of each State: whether there is Democratic control of both legislative houses and the governorship, whether there is divided control of the legislature and/or governorship, the ratio of per capita State debt to per capita income, whether the governor has a line item veto, the percent of the upper legislative house that is Democratic, and the percent of the lower legislative house that is Democratic. Mark W. Smith from the Veterans Health Administration Health Economics Resource Center in Menlo Park kindly provided these variables.
Because we have scope of practice data for only 1 year, we estimate the demand for LPNs using only a single year of data. Table 5.6 presents the results of regression equations for hospital demand for LPNs using data from 2000, and Table 5.7 presents analogous equations for relative demand for LPNs (as a share of total licensed nurse employment). The tables are organized in the same way as Tables 5.4 and 5.5. As seen in the first two rows of Table 5.6, hospitals in States with restrictive scopes of LPN practice tend to have lower employment of LPNs. However, once the potential endogeneity of wages and scope of practice are addressed using instrumental variables, the relationship is no longer statistically significant. A similar pattern holds for the specificity of scope of practice. However, Table 5.7 demonstrates that as the scope of practice of LPNs becomes more restrictive, the demand for LPNs falls relative to the demand for all licensed nurses, even when controlling for the endogeneity of scope of practice.
There are some differences in the effects of other explanatory variables between the cross-section and longitudinal results. LPN wages continue to have a negative effect on demand for LPNs, but this effect is not significant when instrumental variables are used to control for the endogeneity of LPN wages. RN and aide wages are not significantly associated with LPN

67
demand, except in the uninstrumented equations. In these equations, higher aide wages are associated with greater demand for LPNs. As seen in Table 5.7, wages have little to no effect on relative demand for LPNs.

68
Acute Care Hospitals, 2000 Instrumenting for
(s.e.) (s.e.) Specific ) ) )
) ( ) ( ) ( ( ) ( ) ( )
)
) ) ) ( ) ( )
) ) )
)
) ) ) )
( ) ) )
) ) )
) ( ) ( )
N )
) )
rises.
Table 5.6: Estimates of Demand for Licensed Practical/Vocational Nurses in U.S. General
OLS (s.e.) Instrumenting for Scope Scope of Practice of Practice & LPN Wages
-0.077* (0.040 -0.085** (0.041 0.221 (0.354Restrictive -0.137** (0.032 -0.136** 0.032 -0.060 0.056log LPN Wage) -0.857** 0.281 -0.838** 0.289 -4.929 3.977log (RN Wage -0.092 (0.350) -0.093 (0.348) 1.912 (1.373) log (Nurse Aide Wage) 0.667** (0.275) 0.725** (0.277) 0.183 (0.601) log (Inpatient Days 0.615** (0.024) 0.615** (0.024) 0.631** (0.030) log (Length of Stay -0.418** (0.030 -0.420** 0.031 -0.436** 0.033Case Mix 0.098 (0.080) 0.087 (0.081) 0.076 (0.091) Technology (Saidin Index) -0.022* (0.012 -0.021* (0.012 -0.022* (0.012log (Medicaid Share of 0.067** (0.023) 0.069** (0.024) 0.083** (0.032) Inpatient DaysFor Profit Hospital 0.035 (0.039) 0.039 (0.039) 0.044 (0.039) District Hospital 0.154** (0.050 0.159** (0.051 0.137** (0.055Government (State or local 0.127** (0.055) 0.134** (0.056) 0.132** (0.060) Hospital Number of HMOs Operating -0.049** 0.008 -0.049** (0.008 -0.026 (0.025in County HMO Penetration -0.138 (0.261 -0.120 (0.265 0.131 (0.332No. of HMOs X HMO 0.042 (0.032) 0.040 (0.032) -0.003 (0.058) Penetration Per Capita Income in County -0.00001** (0.000 -0.00001** 0.000 -0.000009** 0.000R-Squared 0.542 0.539 0.498
3,890 3,798 3,798 *p < 0.10 **p < 0.05 Notes: (1 dependent variable is log (No. of Full-time Equivalent Licensed Practical Nurses), (2 all regressions include State dummy variables and a constant; and (3 all regressions use the cluster (on State) option in Stata.
Sources: American Hospital Association Annual Survey of Hospitals, Current Population Survey Outgoing Rotation Group Files, and Area Resource File. Managed care data courtesy of Douglas R. Wholey Political variables courtesy of Mark W. Smith, Health Economics Resource Center, VA Palo Alto Health Care System.
Higher patient volumes increase the demand for LPNs, and this relationship is larger in magnitude in the cross-section than it was in the longitudinal data. However, higher volumes reduce the relative demand for LPNs in the cross section, suggesting that larger hospitals demand fewer LPNs, all other things held equal. LPN demand is negatively associated with length of stay, but relative demand for LPN rises with length of stay, again suggesting that the acuity of patients declines with length of stay. Thus, both overall demand for nursing staff and demand for RNs drops as length of stay rises. Relative demand for LPNs falls as the case mix of patients

69
Acute Care Hospitals, 2000 Instrumenting for
Specific ) ) ) ) ( ) ( )
) ) ) ) )
) ( ) ( ) ( ) ( ( ) ( ) ( ) ( ( ) ( ) ( )
Case Mix ( ) ( ) ( ) ) ) )
( ) ( ) ( ) )
-0.001 (0.007) ( ) ( ) ( ) ( ) ( )
) ( ) ( ) ( )
( ) ) )
( ) ( ) ( ) ( ) ( ) ( )
( ) ( ) ( )
N
) ) (3)
Table 5.7: Estimates of Demand for Licensed Practical/Vocational Nurses in U.S. General
OLS (s.e.) Instrumenting for Scope Scope of Practice (s.e.) of Practice & LPN
Wages (s.e.) -0.025** (0.006 -0.0001 (0.010 0.045 (0.056
Restrictive -0.004 (0.024 -0.038** 0.009 -0.027** 0.009log (LPN Wage -0.108 (0.084 -0.106 (0.083 -0.722 (0.621log (RN Wage -0.154* (0.090) -0.152* (0.089) 0.150 (0.244) log (Nurse Aide Wage 0.054 0.064 0.059 0.065 -0.022 0.116log Inpatient Days) -0.025** 0.002 -0.026** 0.002 -0.024** 0.003log Length of Stay) 0.034** 0.004 0.035** 0.004 0.033** 0.004
-0.057** 0.013 -0.057** 0.014 -0.059** 0.015Technology (Saidin Index) -0.001 (0.001 -0.001 (0.001 -0.001 (0.001log (Medicaid Share of 0.006** 0.003 0.006** 0.003 0.008** 0.004Inpatient DaysFor Profit Hospital -0.0002 0.007 0.0003 0.007District Hospital 0.022** 0.007 0.022** 0.007 0.019** 0.008Government (State or local 0.015* 0.008 0.016* 0.009 0.015* 0.009Hospital Number of HMOs -0.006** 0.002 -0.006** (0.002 -0.003 (0.003Operating in County HMO Penetration -0.046** 0.019 -0.045** 0.019 -0.008 0.039No. of HMOs X HMO 0.009** 0.004 0.009** 0.004 0.002 0.007Penetration Per Capita Income in County
-0.000001** 0.000 -0.000001** 0.000 -0.000001** 0.000
R-Squared 0.529 0.527 0.464 3,963 3,867 3,867
*p < 0.10 **p < 0.05
Sources: American Hospital Association Annual Survey of Hospitals, Current Population Survey Outgoing Rotation Group Files, and Area Resource File. Managed care data courtesy of Douglas R. Wholey Political variables courtesy of Mark W. Smith, Health Economics Resource Center, VA Palo Alto Health Care System.
Notes: (1 dependent variable is log (LPNs as a Proportion of Total Licensed Nurse Staff), (2 all regressions include State dummy variables and a constant; and all regressions use the cluster (on State) option in Stata.
As in the longitudinal models, hospitals with a higher share of Medicaid inpatient days have greater demand for LPNs. District and government hospitals demand more LPNs both in absolute and relative terms. The only cross-sectional effect of managed care is that as the number of HMOs operating in a county rises, demand for LPNs falls. Relative demand for LPNs also falls as the number of HMOs and HMO penetration rise. However, neither of these findings is observed when instrumental variables are used to account for the potential endogeneity of wages. County per capita income continues to be negatively associated with LPN demand and relative LPN demand.

70
The Demand for LPNs by Long-Term Care Facilities The above analysis demonstrates that restrictive scopes of LPN practice reduce hospital
demand for LPNs, both in absolute terms and relative to total licensed nurse demand. How does scope of practice affect demand for LPNs by nursing homes? To answer this question, we turned to Medicare’s Online Survey, Certification, and Reporting System (OSCAR). These data provide information about long-term care facilities, including staffing, limitations in the activities of daily living of residents (ADLs), the share of residents insured by Medicaid, and facility number of beds. To examine the factors that affect long-term care facility demand for LPNs, we estimate regression equations similar to those used to study hospital demand for LPNs.
The dependent variables in our analysis are LPN hours per facility resident day, and LPN hours as a share of licensed nurse hours per resident day. We anticipate that demand for LPNs will be a function of the scope of practice, measured as above; the number of beds in the facility; the resident case mix index; State Medicaid reimbursement rates; nurse wages; the share of residents on Medicaid; whether the State uses a case mix reimbursement method; the facility’s ownership, including profit status, and chain membership; whether the nursing facility is based in a hospital; whether is certified to accept patients insured by Medicaid, Medicare, or both; and the concentration of nursing homes in the market, measured as the Herfindahl index. All data are from 2002, except for RN and LPN wages, which are measured as in the hospital demand models.
Previous research has demonstrated that many of the variables that affect demand for LPNs are endogenous (Harrington & Swan, 2003; Zinn, 1993). Specifically, the case mix of residents is simultaneously determined with LPN demand, and State Medicaid rates are endogenous. In order to estimate the demand equations, we implemented instrumental variables techniques to address this endogeneity. The instrumental variables for case mix, which is measured as the dependency of residents in activities of daily life, are the proportion of the MSA population aged 65 and over, the percentage of females in the labor force, personal per capita income, and the percent excess beds in the county. The instrumental variables for State Medicaid rates are the proportion of the MSA population aged 65 and over, personal per capita income, whether the governor is Democratic, and whether the legislature and/or governorship are split between political parties. Wages also are endogenous, and we use RNs per 100,000 population, the share of the population over age 65, percentage of females in the labor force, and personal income per capita as instrumental variables. Finally, we assume that scope of practice regulations may be endogenous with demand for LPNs, and we use the same instrumental variables as in the hospital equations.
Tables 5.8 and 5.9 present LPN demand equations for long-term care facilities. In Table 5.8, the dependent variable is LPN hours per resident day, and in Table 5.9 it is LPN hours divided by total licensed nursing hours per resident day. The first two columns of both tables present an equation in which instrumental variables are used for Medicaid reimbursement rates, case mix, and scope of practice. The second two columns include instrumental variables for LPN wages as well.

71
Table 5.8: Estimates of Demand for Licensed Practical/Vocational Nurses in U.S. Long-Term Care Facilities, 2002
Not instrumenting for Instrumenting for wages wages
Restrictive scope of practice -0.028** (0.006) -0.022** (0.006) Specific scope of practice -0.030** (0.004) -0.033** (0.004)
LPN wage (or relative wage) -0.025** -0.004 -0.097** (0.006)
Number of beds -0.0004** (0.00006) -0.0005** (0.00006)
Case mix Index 0.390** (0.018) 0.344** (0.018) Rate of Medicaid residents -0.004** (0.0002) -0.004** (0.0002) Accepts Medicare and Medicaid -0.263** (0.012) -0.232** (0.012)
Medicaid reimbursement rate 0.0001 (0.0003) 0.003** (0.0003) Case mix reimbursement method 0.011 (0.009) -0.021** (0.009)
For-profit facility 0.002 (0.008) 0.003 (0.008) Chain facility 0.021** (0.008) 0.028** (0.008) Hospital-based facility 0.022* (0.012) 0.014 (0.012) Market concentration -0.062** (0.017) -0.163** (0.018)
Intercept -0.595** (0.108) 0.347** (0.121)
R-squared 0.138 0.154 N 14029 14029
*p < 0.10 **p < 0.05
Notes: (1) Dependent variable is LPN hours per resident day; (2) both equations instrument for Medicaid Reimbursement Rate, Case mix, and Scope of Practice
As seen in Table 5.8, long-term care facilities located in States with more restrictive and specific scopes of LPN practice demand fewer LPNs. This effect is statistically significant in both the level of demand and the relative demand equations. This result persists in the equations for relative LPN demand, although the relationship is not statistically significant when instrumental variables are used for relative wages. Thus, as with hospitals, it appears that the restrictiveness of the LPN scope of practice has an important effect on the demand for LPNs by long-term care facilities.
Other factors affect long-term care facility demand for LPNs. As the market wage rises, demand for LPNs falls, as expected. However, in the relative demand equation, the opposite relationship is found: higher LPN wages, relative to RN wages, are associated with increased demand for LPNs relative to RNs. We have not been able to explain this contrary finding. It may be that the higher wages for LPNs are related to having additional training and certification. That would also explain the increase in demand for LPNs. If the LPNs have acquired higher

72
skills, they are more attractive to hospitals than RNs, even though they have a higher wage. They can perform more complex activities and they cost less than RNs.
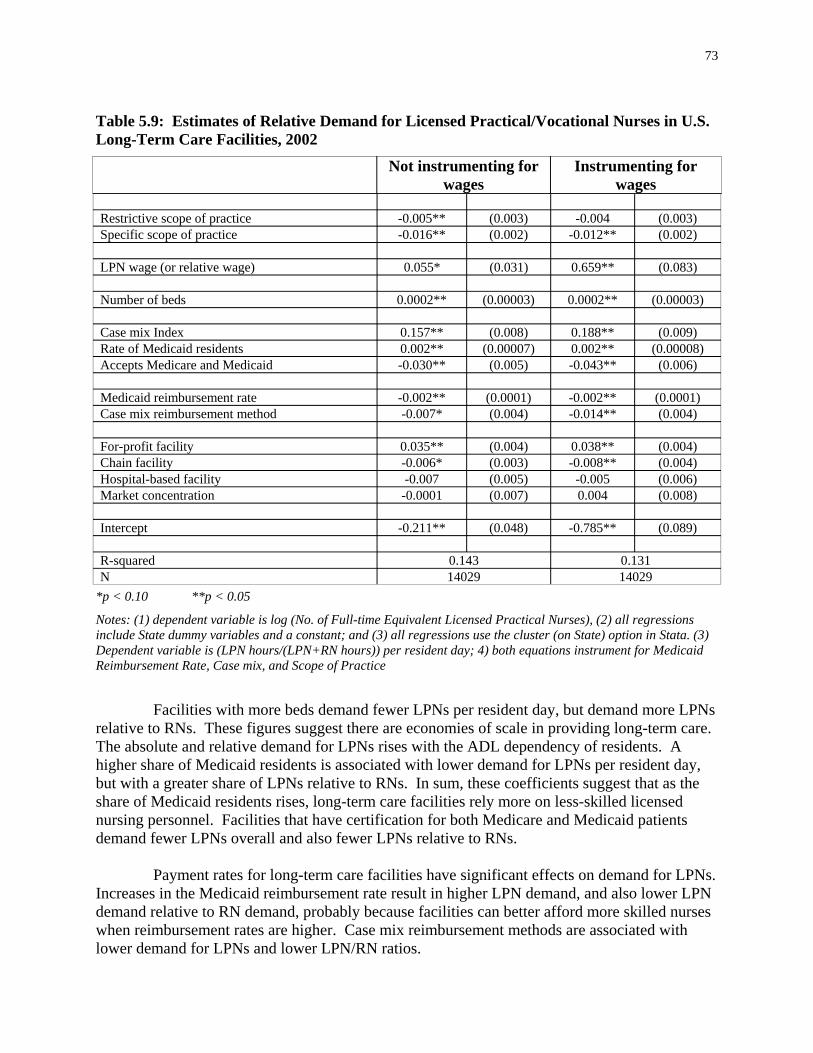
73
Table 5.9: Estimates of Relative Demand for Licensed Practical/Vocational Nurses in U.S. Long-Term Care Facilities, 2002
Instrumenting for
( ) ( ) ( ) ( )
) ) )
( ) ( )
) ) (0.005) (0.006)
( () )
(0.004) (0.004) (0.003) (0.004)
-0.007 (0.005) -0.005 (0.006) ) )
( ) ( )
N
Not instrumenting for wages wages
Restrictive scope of practice -0.005** 0.003 -0.004 0.003Specific scope of practice -0.016** 0.002 -0.012** 0.002
LPN wage (or relative wage 0.055* (0.031 0.659** (0.083
Number of beds 0.0002** 0.00003 0.0002** 0.00003
Case mix Index 0.157** (0.008) 0.188** (0.009) Rate of Medicaid residents 0.002** (0.00007 0.002** (0.00008Accepts Medicare and Medicaid -0.030** -0.043**
Medicaid reimbursement rate -0.002** 0.0001) -0.002** 0.0001) Case mix reimbursement method -0.007* (0.004 -0.014** (0.004
For-profit facility 0.035** 0.038** Chain facility -0.006* -0.008** Hospital-based facility Market concentration -0.0001 (0.007 0.004 (0.008
Intercept -0.211** 0.048 -0.785** 0.089
R-squared 0.143 0.131 14029 14029
*p < 0.10 **p < 0.05
Notes: (1) dependent variable is log (No. of Full-time Equivalent Licensed Practical Nurses), (2) all regressions include State dummy variables and a constant; and (3) all regressions use the cluster (on State) option in Stata. (3) Dependent variable is (LPN hours/(LPN+RN hours)) per resident day; 4) both equations instrument for Medicaid Reimbursement Rate, Case mix, and Scope of Practice
Facilities with more beds demand fewer LPNs per resident day, but demand more LPNs relative to RNs. These figures suggest there are economies of scale in providing long-term care. The absolute and relative demand for LPNs rises with the ADL dependency of residents. A higher share of Medicaid residents is associated with lower demand for LPNs per resident day, but with a greater share of LPNs relative to RNs. In sum, these coefficients suggest that as the share of Medicaid residents rises, long-term care facilities rely more on less-skilled licensed nursing personnel. Facilities that have certification for both Medicare and Medicaid patients demand fewer LPNs overall and also fewer LPNs relative to RNs.
Payment rates for long-term care facilities have significant effects on demand for LPNs. Increases in the Medicaid reimbursement rate result in higher LPN demand, and also lower LPN demand relative to RN demand, probably because facilities can better afford more skilled nurses when reimbursement rates are higher. Case mix reimbursement methods are associated with lower demand for LPNs and lower LPN/RN ratios.

74
The ownership of the long-term care facility affects demand for LPNs. For-profit facilities demand more LPNs relative to RNs, although the absolute level of demand for LPNs is not associated with profit status. This suggests that for-profit facilities employ fewer RNs than do other facilities. Chain-owned long-term care facilities demand more LPNs, and also demand fewer LPNs relative to RNs (indicating that they demand more RNs).
Finally, LPN demand is affected by market characteristics. Facilities in markets where there is less competition between facilities have lower demand for LPNs, and competition has no effect on the LPN to RN mix. This finding suggests that competition between long-term care facilities may increase quality of care, because the facilities compete for patients by hiring more licensed staff.
The earnings of LPNs
In general, the wages of LPNs result from the intersection of market supply and market demand. As demand rises relative to supply, wages will rise. This wage inflation will, in turn, increase the supply of LPNs and reduce demand for LPNs. These movements bring the labor market into balance. Thus, it is difficult to examine the earnings of LPNs separately from demand and supply. The above sections on demand and supply explore these relationships. In this section, we present the results from the first-stage regression used to obtain predicted values of wage. Recall that these predicted values were used in our supply regressions.
We use Current Population Survey data from 1994 through 2001 to estimate the wage of each LPN, controlling for demographic, market, and job characteristics. We omit family characteristics because in theory family characteristics should not affect the human capital of workers. The yearly dummy variables included in the equation control for secular changes in wages nationwide, such as those that result from economy-wide inflation. We also include the number of physicians per 100,000 people and the average manufacturing wage in the LPN’s State of residence as explanatory variables in the wage equation. These two variables serve as instruments in our two-stage least squares regressions of the supply of LPNs. The dependent variable is created for each LPN in our sample by dividing their usual weekly earnings (before deductions) by their usual hours of work per week, and is adjusted for inflation.
Table 5.10 presents ordinary least squares regression results for LPN wages. Notably, the estimated coefficients on the two variables serving as instruments are positive and statistically significant, and imply that LPN wages increase as the Statewide average manufacturing wage and the number of physicians relative to the population increase.
Demographic characteristics affect the wages received by LPNs. Male LPNs earn higher wages than do female LPNs, and LPNs with a college degree have higher wages than do those who do not have a college degree. Furthermore, the wage differential is greater for LPNs with at least a 4-year degree (i.e., bachelor’s degree or higher). LPNs who are not citizens earn lower wages than US-born LPNs, though this result is only statistically significant at a higher p-value. Age has a significant effect on LPN wages. Wages rise with age until age 52, after which time they decline. This finding suggests that, adjusted for inflation, LPN wages do not progress consistently with potential experience.

75
Table 5.10: Regression Results for Log of LPN/LPN Earnings Per Hour
SE
( ) ( )
Age ) (0.000)
)
( ) Black ( )
( ) -0.903 (0.604)
) ) )
) )
( ) ( ) (0.198) (0.227) ( ) (0.214)
) ( ) ( )
) )
)
( ) ( ) ( ) ( ) ( ) ( ) ( )
N
Coefficient Instruments Number of Physicians Per 100,000 People in State 0.004** 0.001Average Manufacturing Wage in State 0.270** 0.044Demographic Variables Male 0.782** (0.323)
0.207** (0.040Age Squared -0.002** Some College 0.274 (0.185AA Degree 0.445** (0.180) Bachelor, Master, PhD, or Professional School Degree 0.987** 0.357
-0.265 0.190Hispanic -0.053 0.391Native American Asian 0.357 (0.567) Not a U.S. Citizen -0.846* (0.491Citizen by Naturalization 0.026 (0.436Government Worker -0.262 (0.185Market Characteristics Percentage of LPNs Unionized in State -0.498 (0.550Northeast -0.235 (0.281Midwest -0.829** 0.220South -0.671** 0.229MSA Population 100,000-499,999 0.508** MSA Population 500,000-999,999 0.548** MSA Population 1,000,000-2,499,999 0.993** 0.211MSA Population 2,500,000+ 1.599** Type of Industry Personnel Supply Services 0.935 (0.601Offices and Clinics of Physicians -0.918** 0.203Private Households -2.455** 1.012Health Services (not else where classified 0.021 (0.227Hospitals 0.154 (0.147) Other Industries -0.459 (0.309Year Dummy Variables 1995 -0.092 0.2331996 -0.782** 0.2421997 -1.117** 0.2401998 -0.608** 0.2501999 -0.328 0.2522000 -0.495** 0.2502001 -0.047 0.238
R-squared 0.1057 3,994
*p < 0.10 **p < 0.05 Source: Current Population Survey Outgoing Rotation Group Files, 1994-2001 Notes: (1) the dependent variable is created by dividing usual weekly earning by usual hours of work per week; (2) standard errors (in parentheses) are estimated using the "robust" option in Stata; and (3) all regressions include a constant.

76
Market characteristics are important predictors of wages. Compared to those living in the Western region of the U.S., LPNs residing in the Midwest and South earn lower wages. Also, LPNs in rural areas earn lower wages than do their urban-dwelling counterparts. The more populated an urban area is, the higher the wage relative to wages in rural areas. This may reflect higher costs of living in cities, especially in cities of 2.5 million or more.
Employment setting has some effect on the wages of LPNs. LPNs working in physician offices and private households have lower wages than do LPNs working in long-term care settings. Finally, wages in 1996-1998 and in 2000 were lower compared to wages in 1994. Thus, there is some evidence that inflation adjusted wages for LPNs declined during our sample time period.
Conclusions about Supply and Demand of LPNs
The supply of LPNs is affected by characteristics common to other professions. Male LPNs are not more likely to be employed, but they tend to work more hours and are more likely to be employed full time than are females. LPNs reduce their participation in the labor force after some age, the probability of employment drops after age 40 or 50 (depending on how the model is specified) and the probability of full-time work declines after LPNs reach their early forties. Black LPNs are more likely to work full time and tend to work more hours than white LPNs. Likewise for LPNs living in the South, relative to those in the Western States. Furthermore, Midwestern LPNs are more likely to be employed than their counterparts in the West. LPNs who are foreign-born are less likely to be employed, but work more hours than do LPNs who are US-born. LPNs with children in their households tend to work fewer hours. Finally, as LPN wages rise, LPNs are more likely to work full-time. LPNs enjoy higher earnings with experience, until they are in their early 50s. They also have higher wages if they have a college degree, especially if they have a 4-year or graduate degree. LPN earnings vary by employment sector; the highest earnings are enjoyed by LPNs working in personnel supply services (such as temporary and home health agencies), hospitals, and long-term care facilities, and the lowest earnings are received by those working in private households and physician offices.
The demand for LPNs varies with LPN wages, wages of other nursing personnel, patient volumes, case mix of patients, and market characteristics. In general, demand for LPNs drops as LPN wages rise, and demand for LPNs rises as wages of RNs rise. Higher patient volumes are associated with higher demand for LPNs. In hospitals, rising patient acuity reduces demand for LPNs, while demand increases in long-term care facilities with higher ADL dependency of patients.
Hospital demand for LPN rises as the share of patients insured by Medicaid increases. Long-term care facility demand for LPNs declines as the share of residents insured by Medicaid rises, and demand for RNs also declines. Thus, both types of employers shift their labor demand to the least skilled nursing personnel possible when Medicaid is more prominent in the patient mix. Increases in the Medicaid reimbursement rate cause long-term care facilities to demand more skilled nurses.

77
Finally, the scope of practice of LPNs affects demand for them. Restrictive scopes of practice have a significant, negative effect on hospital and long-term care facility demand for LPNs. Demand for LPNs also is lower in States with more specific scopes of practice. If States want to encourage the employment of LPNs as substitutes for RNs, they can liberalize the scope of practice of LPNs to achieve this goal. However, because there is little research indicating whether these skill mix changes would have negative effects on quality of care, policymakers should tread carefully before moving in this direction.

78
References
American Hospital Association. (1999). The AHA Annual Survey Database Fiscal Year 1997 Documentation. Chicago, IL: Health Forum.
Astin, A. (1998). The changing American college student: Thirty-year trends, 1966 - 1996. The Review of Higher Education, 21(2), 115-135.
Buerhaus, P. I., Staiger, D. O., & Auerbach, D. I. (2000). Implications of an aging registered nurse workforce. Journal of the American Medical Association, 283(22), 2948--2987.
Harrington, C., & Swan, J. H. (2003). Nursing home staffing, turnover, and case mix. Med Care Res Rev, 60(3), 366-392; discussion 393-369.
Hausman, J. A. (1978). Specification tests in Econometrics. Econometrica, 46, 1251-1271. Kennedy, P. (1998). A guide to econometrics (4th ed.). Cambridge, Mass.: MIT Press. Spetz, J. (1999). The effects of managed care and prospective payment on the demand for
hospital nurses: evidence from California. Health Services Research, 34(5 Pt 1), 9931010.
Spetz, J. & Maiuro, L.S. (2004). Measuring levels of technology in hospitals. Quarterly Review of Economics and Finance, 44 (3), 430-447.
StataCorp. (2003). Stata Statistical Software (Version 8.0). College Station, TX: Stata Corporation.
U.S. Bureau of the Census. (2004). Current Population Survey, 2004, from http://www.bls.census.gov/cps/cpsmain.htm
Unicon Research Corporation. (2002). CPS Utilities, Earner Study, Outgoing Rotation 2001 Software & Documents (Version 5.1). College Station, TX: Unicon Research Corporation.
Wholey, D. R., Christianson, J. B., Engberg, J., & Bryce, C. (1997). HMO market structure and performance: 1985-1995. Health Affairs (Millwood), 16(6), 75-84.
Zinn, J. S. (1993). The Influence of Nurse Wage Differentials on Nursing Home Staffing and Resident Care Decisions'. The Gerontologist, 33(6), 721-729.
Zinn, J. S. (1993). Inter-SMSA Variation on Nursing Home Staffing and Management Practices. Journal of Applied Gerontology, 12(2), 206-224.
79
Chapter 6: Perspectives of the Employers, Educators, State Boards, and Nurses
The preceding chapters reported on the work of LPNs, their demographic characteristics, the process of education for LPNs, and their demand and supply. While the data presented in these chapters provide substantial information about the LPN workforce, it does not answer some key questions. How do LPNs and their employers view their role in the workforce? How do they interact with RNs? Are LPNs interested in pursuing additional education? To answer these questions, we turn to qualitative research methods, including focus groups and key informant interviews. This chapter reports on qualitative work conducted in four States to better understand the these issues related to the LPN workforce.
Methods
The qualitative approaches used in this study included key informant interviews and focus groups. Key informant interviews were conducted with officials from State nursing boards, nurse administrators in acute care hospitals and long-term care settings, and directors of LPN educational programs in community colleges and adult schools. Focus groups were conducted separately with practicing LPNs and RNs to learn the perspectives of staff nurses.
We selected four States in which to conduct qualitative research: Iowa, California, Massachusetts, and Louisiana. These States were selected to provide geographic variation and a range of restrictiveness of scopes of practice. California and Iowa have relatively restrictive scopes of practice, with scores of 4. Massachusetts and Louisiana’s scopes of practice are among the most liberal in the U.S., with scores of one. In California, Louisiana, and Iowa, we visited both a large city and a smaller city in order to determine whether population density was associated with differences in the utilization of LPNs. In California, these cities were Los Angeles (population 3,694,820) and Bakersfield (population 247,057); in Iowa we visited Des Moines (population 198,682) and Cedar Rapids (population 120,758); in Louisiana we visited New Orleans (population 484,674) and Baton Rouge (population 227,818). In Massachusetts, we conducted our interviews and focus groups in Framingham, a city halfway between the large city of Boston and the smaller metropolitan area of Worcester. Key informant interviewees and focus group participants were selected from these seven sites.
Key Informant Interviews
Potential hospital key informant interviewees were identified using data from the American Hospital Association (AHA) Annual Survey of Hospitals (American Hospital Association, 1999). With these data, we examined the number of beds at each hospital and the share of licensed nurses who were LPNs. We attempted to schedule key informant interviews with people from hospitals with at least 100 beds and with at least 10 percent of their licensed nursing staff was comprised of LPNs. In some cases we visited hospitals that were slightly smaller or had somewhat fewer LPNs in their nursing staff.
To identify potential interviewees in long-term care facilities in the target States, we utilized the Medicare Web site, Nursing Home Compare, which includes data on all Medicare certified nursing homes in the country (U.S. Department of Health and Human Services, 2004).

80
We targeted nursing homes with more than 75 beds in order to assure a staffing mix that would include both RNs and LPNs.
A research assistant contacted potential interviewees and read a telephone script that explained the purpose of the study, the purpose of the interview, and procedures for voluntary consent and confidentiality. Once interviewees agreed to participate, a follow-up letter and email were sent including the interview details, a written information sheet, and a copy of the consent form to be signed at the time of the interview.
In total, there were 24 key informant interviews conducted in the four States. Most of these were in-person interviews, scheduled to coincide with the focus groups in each State. When schedules did not permit in-person interviews, telephone interviews were held subsequent to the focus groups. There was no overlapping participation between the focus groups and key informant interviewees although several of the focus group participants were employees at facilities where the Director of Nursing was interviewed as a key informant.
The Employer Perspective
LPN practice in hospitals In general, LPNs tend to be a small component of the total nurse staffing in hospitals,
regardless of the State and scope of practice. LPNs generally are employed in medical-surgical units, rehabilitation units, hospital-based skilled nursing facilities, and outpatient clinic settings. However, the RN shortage seems to be increasing LPN employment in hospitals. In more than one State, nursing directors of hospitals Stated that LPN employment was increasing in all types of patient units. Some respondents Stated that they were considering increased LPN staffing or replacing some nursing assistant staff with LPNs.
Factors Favoring LPNs in Hospitals
Nursing directors in hospitals Stated that several factors made it attractive to hire LPNs. The major attraction of LPNs is that they cost less than RNs and can be used for nursing functions within their scope of practice. LPNs are attractive because they have more skills and training than nurse aides and are licensed to perform functions that nurse aides are not allowed to do, such as administer medications. In some locations, LPN wages are not much higher than those of nurse aides. Wages for RNs and LPNs varied widely across the four States we studied, but the difference between RN and LPN salaries averaged $5 per hour. Hospitals were particularly interested in hiring LPNs who are enrolled in RN programs and working their way through school. The students are attractive because they have a high level of skills and knowledge and can also be recruited for a future position as an RN. Another factor making LPNs more attractive in some States is that they are more plentiful than RNs and can perform many of the same functions. Regardless of the State or scope of practice, experienced long-tenured LPN employees were highly valued in the acute care units where they work. They were trusted by the RNs, highly skilled as a result of their education and experience, which was valued by the nurse managers and directors.
Factors Unfavorable for Hiring LPNs in Hospitals

81
Factors that made LPNs unattractive to hire primarily centered around their limited, or perceived limited, scope of practice. Because there are many nursing functions such as advanced IV therapy, patient assessment, and administration of blood that LPNs are not able to perform, they must be teamed with an RN who then shares the patient assignment. Some RNs consider this more burdensome than helpful. Even States with the most liberal scopes of practice have limitations in LPN scope of practice that reduce LPN utility in acute care settings. Other factors that limit the attractiveness of LPNs were limited training in critical thinking and the lack of clinical experience in specialized hospital units.
LPN and RN Working Relationships
In general, most nursing directors felt that RNs and LPNs worked well together in their hospitals. On the inpatient units, RNs are in charge (make the assignments and supervise all staff). LPNs usually have an independent assignment and may care for complex patients, but the RN on the team performs RN-required procedures for those patients. On hospital-based skilled nursing units, LPNs often have the role of charge nurse with a supervising RN overseeing the LPN. In the outpatient setting, LPNs may work alongside RNs in performing a variety of outpatient services including patient screening and education. In one interview site, a large integrated health system practice, LPNs function as health educators in the outpatient setting.
Substitution
All hospital nurse administrators interviewed Stated that LPNs could not substitute for RNs in any situation that required an RN skill level. LPNs can, and often do, substitute for nurse aides as well as other allied health staff such as EKG technologists if they are trained in that skill.
Adequacy of LPN Education
Most interviewees felt that LPN education was adequate. Nursing directors usually preferred particular LPN education programs in their region and tended to recruit primarily from the preferred schools. These hiring preferences provide feedback to the schools on the strength of the curriculum and teaching. Hospital nursing directors generally thought that the longer LPN programs (18 months or more) were better. Several interviewees mentioned that they do not support the challenge exam in which certain categories of LPN candidates, generally those with a military background, are allowed to take the LPN licensing exam without completing a training program.
Appropriateness of Scope of Practice
Most nursing administrators in hospitals agreed that the scope of LPN practice was appropriate even though it varied widely between the restrictive and liberal States. Some Stated that the challenge facing hospitals and the RNs who manage the patient care units is to assure that LPNs are allowed to perform up to the maximum of their legal scope of practice, yet not exceed that scope. Problems occur when there is a lack of knowledge of the LPN scope of practice, or when RNs are unwilling to let LPNs maximize their practice.
LPN practice in long-term care facilities
Long-term care facilities are a major employer of LPNs across the country and in the four States where we conducted interviews. LPNs are hired in LTC facilities for virtually all nursing functions except those that require an RN under Medicare requirements. LPN functions

82
include supervision of nurse aides, administration of medications, IV care, and other skilled care within the LPN scope of practice in that State.
Factors Favoring LPNs in Long-term Care Facilities
LPNs are attractive to long-term care facilities for several reasons. The primary reason is that LPNs are less costly than RNs for nursing functions that can be performed by either LPNs or RNs, such as basic bedside care, administration of oral medications, supervision of nurse aides, and interaction with patients and their families. In addition, LPNs as compared to RNs are more available for hire, often have more experience in geriatric settings, and have a more positive attitude about working in long-term care facilities.
Factors Unfavorable for Hiring LPNs in Long-term Care Facilities
LPNs may be unattractive to hire in long-term care facilities for reasons similar to those cited for acute care settings. Patients entering skilled nursing facilities can be acutely ill, requiring complex treatments, IV therapy, and wound care, some of which is outside the LPN scope of practice. Thus, an RN may be preferred over an LPN to fill a vacant position because of the broader scope of practice for RNs. In addition, skilled nursing homes must hire RNs to meet Medicare requirements for RN staffing, at least 8 hours per day, and to complete the Medicare Minimum Data Set (MDS). The MDS is the Medicare mandated report on patient level and facility level data that is required for all Medicare and Medicaid certified nursing home residents. Other interviewees mentioned that RNs are better able to perform patient assessments. While LPNs are more likely to note that a patient’s condition has changed, RNs are in a better position to assess and diagnose the problem.
An unexpected, but understandable, negative factor cited by employers was that LPNs who were studying to become RNs often do not stay in LPN roles long enough to obtain significant experience in nursing. In areas where many LPNs follow career ladders to RN licensure, LPNs tend to spend fewer years in LPN practice and the number of highly experienced LPNs in the community is diminished.
LPN and RN Working Relationships
All interviewees Stated that RNs and LPNs work well together in long-term care facilities, sometimes performing the same functions or with the RN performing RN-required functions only. Some long-term care facilities hire a greater proportion of RNs and others hire only the minimally required number of RNs. LPNs often act as charge nurses in long-term care facilities, while RNs function as the Director of Nursing.
Substitutability
There were mixed responses to questions about the substitutability of LPNs for other staff in long-term care facilities. A few said that LPNs substituted for RNs but most said that LPNs only substituted for aides. In fact, when facilities have a high rate of turnover of nurse aide staff, LPNs are more likely to substitute for nurse aides. Some of this substitution is intentional and pre-scheduled in order to give the LPNs an opportunity to get to know the patients better and to better understand, or recall, the role of nursing aides.
Adequacy of LPN Education
83
Most of the long-term care interviewees believed that LPN education in their State was adequate. Most agreed that not all programs are equal and that the longer courses are better than “fast track” courses. There was consensus that the curriculum could be stronger in two areas important to long-term care facilities: supervisory skills and geriatric care. Iowa addresses this concern by requiring a continuing education supervisory course that is mandatory for all LPNs within 6 months of employment in a long-term care facility. The Iowa State Board of Nursing developed the course and it is offered at community colleges throughout the State. Facilities in California offer in-service programs to strengthen LPN supervisory skills. Some interviewees recommended curriculum additions including psychosocial content focused on interacting with patient families, preventive care, and assessment.
Scope of Practice
Most interviewees agreed that the LPN scope of practice is adequate for their State. Some commented that requiring an RN to sign off on LPN patient assessments is an unnecessary practice since frequently the RN is merely providing the signature rather than oversight of practice. Others stated that LPNs are not able to practice to the full scope of practice because RNs would not or were not allowed to delegate certain functions. For example, in Louisiana, LPNs are not allowed to perform certain functions under their scope of practice because the RN scope of practice forbids RNs from delegating those functions.
The Educational Program Perspective
We interviewed directors and faculty of several types of LPN educational programs in the four focus States, including private adult schools, community college degree programs, and community college non-degree programs. Some of the programs are ladder programs in which students receive credits toward an RN program and can matriculate into an RN program after completing the LPN program and passing the LPN licensure exam. Other programs were built in as part of RN programs. For example, some of the community college programs in Iowa are ladder programs in which students, seeking RN or LPN training, enter a single nursing program. After the first year of study, students are prepared for and encouraged to take the LPN exam. Some students stop at this level and pursue a career and employment as an LPN. Students seeking an RN license, and who meet the minimum grade point average, continue in the program for another year to earn an associate degree in nursing. In one of these programs about 85 percent to 90 percent of students eventually pursue their RN license.
Another nuance found in some of the LPN programs was the requirement of certified nursing assistant (CNA) training as a prerequisite for entry into the LPN program. The purpose was to assure that students master basic skills of the CNA so the LPN curriculum can proceed at a faster pace.
Enrollment Trends In most of the programs, enrollment has increased over the past 2 years. Most of the
programs had no difficulty filling available slots and some have a waiting list of a year or more. Several program interviewees believed that the enrollment increase was greater in recent years due to the national nursing shortage and the downturn in the economy, which made competing occupations less attractive. Several interviewees noted an increase in the diversity of student enrollment over the past few years with greater enrollment of males and ethnic minorities.

84
Adequacy of Preparation prior to LPN Program Interviewees generally thought that many students were not adequately prepared for the
LPN program. They felt that students are less well prepared than in the past and believed poorer high school education, less rigorous admission criteria, and an increasing number of new immigrant applicants contributed to the lack of preparation. They also Stated that the skills most lacking were in math, reading, and writing. To address these deficiencies, many of the programs instituted prerequisite math courses or a math entrance exam as an admission requirement. Others offered English as a second language and math tutoring to help students through the program. These interventions help students who would otherwise likely fail to complete the program. However, remedial programs and tutoring are costly and the tuition fees are not adequate to cover these expenses.
Program Completion Rates Completion rates for the LPN programs ranged from 55 percent to over 95 percent.
Some programs tried to assure completion by allowing students multiple opportunities to retake courses until they passed. Other programs increased their completion rates by being more selective in the admission process. In States with open access admission, such as California, programs wee not allowed to be selective in admissions even if there are more applicants than student slots.
Pass Rates on State Board Exam Data on passing the LPN State board exams were not available from all the programs
interviewed. The programs that provided information reported that their pass rates ranged between 64 and 95 percent. One program director reported that the program’s low first-time pass rate had resulted in pressure from the State licensing board to improve. The director Stated that the program offered free tutoring for students to prepare for repeating the exam if they failed it the first time. The director felt that the State board should consider second and third-time pass rates when reviewing programs. Because we selected only a few programs in each State to interview, overall State board pass rates give a better indication of performance in that State.
Academic and Social Support Services The educational programs offered a variety of academic support services including
tuition assistance, loans, educational tutoring, and peer counseling as well payment for books and supplies for students who need assistance in getting through the LPN program. Interviewees Stated that a variety of services and support are needed to assist some students through the program. LPN programs located at the community colleges took full advantage of campus learning centers, academic advising, practice labs, tutoring services, and financial assistance. Some programs also took advantage of county workforce programs to offer students transportation and childcare services in order to help them complete the program.
Barriers to Completion
Respondents indicated that barriers to completing LPN programs were those targeted by the support services. Financial needs and lack of educational preparation were cited as the primary barriers to students completing LPN programs. Programs directors Stated that most LPN students found it necessary to work part or full time while in school. Many students are older than other college students and have families to support; many are single parents. Although most programs had the ability to offer some type of financial aid or loans, the amounts

85
were rarely enough to cover a student’s total financial needs. The other major barriers to completing the program were student lifestyle issues. Some students have difficulty focusing on school and the need to study, some have attendance problems, and others have unexpected family issues and health problems that impede their ability to focus on school. Most program directors Stated that these students are usually identified and leave the program early, although often not early enough for the slot to be filled by another student from the waiting list.
Curriculum and Employment Opportunities Not surprisingly, most LPN program directors felt that the curriculum at the institution
was adequate preparation for the students’ future work. The program directors based this perception on the positive feedback they get from employers directly or from employers recruiting and hiring the program graduates. Program directors Stated that the students had no difficulty getting jobs, although most Stated that hospital jobs were less available and jobs in long-term care facilities were abundant. This employment landscape for LPNs may be changing as a result of the RN shortage, and may be altered with staffing legislation such as that recently implemented in California.
One of the LPN programs is a bit unique in that it also prepares LPNs with skills in phlebotomy, EKG, coding, and medical office computer skills. Some of the graduates take nontraditional LPN jobs in clinical laboratories or medical offices. It was not clear how this extra course work fit into the curriculum or whether it was an add-on that could be selected by students.
Pursuing RN Education According to the program directors, many LPN students want to pursue RN education,
although the number of students who eventually complete RN education varied among the programs. The ladder program schools, such as those in Iowa, have a much higher rate of students who finish RN education because the program structure is one program with two possible exit points. Other programs that are well articulated with RN programs also have higher proportions of LPN graduates pursuing an RN license. In these programs, the length of the RN program is one to two semesters shorter when LPN program credits are accepted. The vocational and/or certificate LPN programs create a greater challenge and time commitment for LPNs who wish to pursue an RN license. In most cases, graduates of vocational LPNs programs must start at the beginning of an RN program, including taking the RN program prerequisites.
Scope of Practice The program directors generally thought that the LPN scope of practice in their State
was appropriate. They felt that they produce a much-needed bedside caregiver who is well prepared for his or her role and scope of practice. One interviewee noted that the RN board wields a great deal of power over the LPN scope of practice. She does not anticipate any changes in LPN scope of practice due to the RN board’s power to impede any movement toward expanding LPN practice. Another noted that if the LPN scope of practice does change, s/he will be ready to alter the LPN program curriculum, but that it would likely mean expanding the length of the program. A few program directors noted that they thought the intravenous administration of some medications and nutritional solutions should be permitted under the LPN scope of practice. One director argued that medications that are available over-the-counter should be permitted for IV administration by LPNs.

86
Boards of Nursing Perspective
In all four States, we interviewed officials at the State board overseeing LPNs. In Iowa and Massachusetts, a single board oversees RNs and LPNs. In Louisiana and California there are separate boards for RNs and LPNs. The predominant model in the United States is for the boards to be combined.
Board Composition Whether or not the LPN and RN board is combined may have implications for the scope
of practice for LPNs in that State. It is possible that LPNs have relatively less power when a combined board represents them, and thus their scope of practice may be limited. However, when boards are separated they may not consult with each other regarding the scope of practice. We do not have adequate data to assess whether it is beneficial for patient care and nursing practice in general and for LPN practice in particular to have separate or combined boards of nursing.
The directors of the State boards of nursing interviewed were RNs with varied backgrounds in nursing care, administration, nursing education, and State government. Most had served for a considerable time in their board position and were knowledgeable about trends and issues in nursing for their State.
Board Responsibility for LPN Practice The chief responsibility of the State boards of nursing is consumer protection and
assuring compliance with regulations governing the practice of nursing in that State. All the board directors felt strongly that the regulatory role was their major responsibility. Most quoted directly from State statutes regarding authority and responsibility of the board of nursing as a consumer protection agency. Those responsibilities include oversight of the licensing and license renewal process, collecting and summarizing data on licensees, investigation of complaints, administering the disciplinary process, and determining scope of practice based upon the laws and regulations in the State. Other board functions include setting policy, presiding over board meetings, reviewing nursing education programs in the State, and conducting research on nurses in the State. Boards track trends in NCLEX pass rates and demographic data of nurses. All four States have State health care workforce task forces or committees to study the nursing shortage and health workforce issues in the State. State board staff members were usually participants in those efforts.
LPN Data The nursing board directors provided detailed data on the number of LPNs in the State
the number of educational programs, graduates, exam pass rates, and other demographic data. Some of the boards have this information readily available on their Web sites, while others gave us copies of written reports and summary data. Financial resources and staff capacity limit the ability of each State to gather data on LPNs and analyze trends. Nevertheless, there was a great deal of detailed data available for each of the four focus States.
LPN Scope of Practice Changes In the four focus States, the LPN scope practice has had only minor or no changes over
the past 5 years. In Louisiana, the scope has not changed since 1948 although the board director

87
noted that the utilization of LPNs in clinical settings has changed. The scope of practice Statements in Louisiana and Massachusetts are very broad, leaving it open to interpretation. Iowa has a specific Statement of the scope of practice, and there have been minor changes. For example, a change in the scope of practice was required to allow limited performance of intravenous therapy by LPNs and to include the requirement of the supervisory course for LPNs working in long-term care facilities. Iowa is considering expanding the scope of LPN practice in managing end-stage renal disease and hemodialysis. Recently in California, there have been changes in the interpretation of the scope of practice to allow LPNs to perform hemodialysis and to administer IV medications during the dialysis procedure.
Substitution All nursing board directors Stated very specifically that LPNs could not substitute for
RNs in their State. Each saw the role of LPNs as very different from RNs and did not think that the roles overlapped. Interviewees stated that LPNs supplement RN care and perform routine care but the educational preparation of LPNs and RNs is very different and should remain so.
Enrollment Board directors generally agreed that enrollment in LPN programs had increased over
the past 2 years in each of the States we visited. One interviewee said that, over the long-term, LPN enrollment has been tied to the general economy and the availability of alternate careers. Over the past several years, nursing has been considered a secure career, and the increased awareness of registered nursing has created more interest in LPN programs as well. The RN shortage seemed to contribute to an increase in LPN enrollment in some States. During the nursing surplus of the 1990s, there was a decrease in LPN enrollment, presumably due to a diminished number of jobs available for LPNs. During that time, the State Board of Licensed Practical Nursing in Louisiana recommended a moratorium on new LPN programs. However, with the advent of another nursing shortage, Louisiana has seen a 12 percent increase in enrollment in LPN programs over the past year.
LPN Shortages All the State board directors are concerned about a shortage of RNs in the State. There
were mixed responses about whether there were an adequate number of LPNs. In Louisiana, board staff felt that there was an adequate supply of LPNs but that they were not all working in health care. Because of overwork due to the nursing shortage and higher salaries available in other occupations, some LPNs have stopped working in health care. LPNs work for local registries or traveling nurse agencies and some are practicing out of State. Even Iowa, which has one of the highest RN to population ratios in the Nation, loses nursing staff to neighboring States that pay higher salaries. In Iowa, nurses living near the border are able to work as traveling nurses in a neighboring State while still living at home. In California, more LPNs are needed to work in long-term care and home health settings. Massachusetts interviewees felt that the shortage in their State was not as severe as other States.
Board Suggestions There were various responses to the question of how States are addressing RN and LPN supply issues. Most respondents focused on the need for increased funding for nursing at both the Federal and State level. Funding is needed to build programs, hire faculty, increase the number of clinical sites, and provide tuition assistance for students. Iowa passed legislation 2 years ago

88
to increase the education of the nursing workforce but funding was not made available. California has devoted over $34 million via the Nursing Workforce Investment Act to fund nurse workforce development. In Louisiana, the State has few funds to allocate for addressing the nursing shortage.
Perspectives from Working RNs and LPNs
Focus Groups
Methods
Eleven focus groups were conducted, 7 with LPNs and 4 with RNs. A professional focus group organization recruited RNs and LPNs via telephone from lists provided by public and private sources. All of the groups were held between May 21 and June 9, 2003, in the following locations:
• Iowa: Des Moines: 1 group each of RNs and LPNs Cedar Rapids: 1 group of LPNs
• Louisiana: New Orleans: 1 group each of RNs and LPNs in New Orleans Baton Rouge: 1 group of LPNs in Baton Rouge
• California: Los Angeles: 1 group each of RNs and LPNs in Los Angeles Bakersfield: 1 group of LPNs in Bakersfield
• Massachusetts: Framingham: 1 group each of RNs and LPNs in Framingham
Jennifer Arthur, Principal of Arthur Associates, moderated the focus groups using discussion guides (Appendix F). Each focus group lasted one and one-half hours and participants were paid incentives ranging from $75–85 for LPNs and from $100–125 for RNs. The different amounts were determined based on customary incentives for this type of activity for each geographic area. The groups were held in focus group facilities or hotel conference rooms. Prior to each focus group, participants were asked to complete a two-page written survey (Appendix F).
Description of Participants
A total of 67 LPNs and 43 RNs participated in the 11 focus groups. The average age of LPNs and RNs in the focus groups was 46.1 and 45.2 years of age, respectively. LPNs had slightly more children under 18 living at home than did RNs (2.1 versus 1.8). The LPNs were somewhat less likely than RNs to be married (47 percent versus 62 percent), and more likely to be divorced (33 percent versus 21 percent). A higher percentage of RNs (75 percent) were Caucasian than LPNs (59 percent), while LPNs (13 percent) are more likely than RNs (5 percent) to be Asian.
According to written survey responses, 44 percent of LPNs attended community or junior colleges, versus 23 percent of RNs. Adult school education was obtained by 32 percent of LPNs and 2 percent of RNs. Similar percentages of LPNs and RNs attended a 4-year college (17 percent and 16 percent, respectively). Among the RNs, 33 percent earned an ADN, 23 percent a

89
diploma, and 21 percent had a BSN. Over one-fourth (29 percent) of the RNs obtained an LPN license before they pursued their RN license. LPNs in the groups had been licensed an average of 15.8 years, while RNs had been licensed an average of 17.1 years.
Key Findings From Focus Groups
Despite the differences in licensure and employer, both RNs and LPNs Stated that direct patient care is the main responsibility of both RNs and LPNs. The acute care setting was desired by most RNs and LPNs if pay was equal. LPNs, however, predominate in long-term care settings in a more hands-on, technical capacity. RNs are more prevalent in acute care, where they are more likely to supervise and perform highly skilled tasks. Though some LPNs who work in the acute care setting expressed resentment regarding their lower pay and perceived lower status, most LPNs and RNs in the focus groups reported that relationships between the two groups are generally positive.
Although some of the focus group LPNs were not interested in obtaining an RN license, one or more individuals in each LPN group are either currently studying for their RN license, or are very interested in doing so. The LPNs in the focus group cited few barriers to earning their LPN license, saying they found it fairly easy. However, there are significant barriers for LPNs to obtain RN education and licensure. The major obstacles to LPNs obtaining an RN license appear to be:
• The need to take prerequisite courses such as math and science • The difficulty of finding time off from work to take courses • The expense of financing additional education
The majority of focus group participants were generally familiar with the State’s scope of practice for LPNs. There were differences between what the regulations actually explicated and what members believed that LPNs were permitted to do. Those areas of discrepancy generally centered on patient assessment, IV therapy, and administration of blood products. Some LPNs reported that they are not permitted to perform all of the activities outlined in the scope of practice, while others felt that they have responsibilities that go beyond the State’s regulations. Several LPNs who had knowingly practiced outside their scope of practice by performing tasks in the RN scope of practice expressed discomfort. Reasons for the discomfort included concern about legal liability issues and the fact that they are paid less than RNs and should not be expected to perform “RN tasks”.
Focus group participants were generally satisfied with their choice of nursing as a career and certain aspects of their current jobs. In the written survey of the participants, over half the LPNs (56 percent) and three-fourths (74 percent) of RNs said that they strongly agree they are satisfied with nursing as a career (Appendix F1).
Summary of Workforce Perspectives
The key informant interviews yielded information from working RNs and LPNs about scope of practice issues, relationships between the two groups of nurses, and how each group perceived the practice of practical nursing, its limitations and opportunities. Both RNs and LPNs were generally aware of the legal scope of practice for LPNs in their State, yet there was wide variation in interpretation and implementation. There was uncertainty in some groups about the

90
difference between institutional policy and State law. Both RNs and LPNs often assumed that the “law” was what was practiced in their institution. Some individuals expressed surprise at the actual language of the State Practice Act and indicated that the scope was broader than their institutional policy allowed.
In the focus groups, we learned about perceptions of scope of practice, educational barriers, and the relationships between RNs and LPNs. Although most of the LPNs stated a desire or intention to return to school to get the RN license, few were actually enrolled in RN programs. Barriers such as time, a need to keep working, challenges in getting into courses, and family issues were among those that kept LPNs from pursuing further education. Relationships between LPNs and RNs in the workplace were reported to be cordial. There was some resentment by LPNs of the higher wages paid to RNs for what is seen by the LPNs as similar work. RNs, on the other hand, expressed some discontent over the need to supervise LPNs because it often added to their workload.

91
References
American Hospital Association. (1999). The AHA Annual Survey Database Fiscal Year 1997 Documentation. Chicago, IL: Health Forum.
U.S. Department of Health and Human Services. (2004). Nursing Home Compare, 2004, from www.medicare.gov/NHCompare/home.asp

92
Chapter 7: Summary, Conclusions, and Recommendations
Summary
Although LPNs organized into professional groups as early as 1941, there is little in the literature about the practice, work, demand or efficient utilization of the licensed practical nurse. Additionally, there is little guidance as to how to most effectively make use of this practitioners' skills to enhance patient care and augment the nurse workforce. Recently there has been an increased interest in trying new care delivery models in acute care hospitals using LPNs (Kenney, 2001). In the 1990s, there were published works that explored the creative use of LPNs in critical care, as advice nurses, and in intravenous therapy teams, (Buccini, 1994; Ingersoll, 1995; Eriksen, 1992; Roth, 1993). However, little systematic study has occurred that explore these roles.
Information about the LPN workforce is necessary before making predictions about how best to make use of that workforce. We found that LPNs were similar to RNs in the following ways:
• Both workforces are aging, with LPNs being slightly older on average; • Males represent a very small percent of both workforces, but this is slowly increasing; • The western region of the U.S. has the lowest numbers of LPNs and RNs relative to the
population; • RNs and LPNs share similar employment trends—more were employed in 2001 than in
1984; • On average, RNs and LPNs work about the same number of hours per week—between 36
and 38 hours; • The share of RNs and LPNs working in the offices and clinics of physicians doubled
between 1984 and 2001. Also the share working in health services “not else where classified” increased; and
• The hourly pay rate of RNs and LPNs increased 19 percent between 1984 and 2001.
Differences found between the two workforces include the following:
• The RN workforce is larger than the LPN workforce, but the actual size of the LPN workforce is unclear since the available data are conflicting;
• Compared to RNs, more LPNs live in the South and fewer in the Northeast; • Fewer LPNs are foreign-born, whereas an increasing percent of RNs are immigrants; • RNs work in hospitals in greater proportions than LPNs, and the share of LPNs working
in hospitals declined more than that of RNs between 1984 and 2001; • The percent of LPNs working in nursing and personal care facilities increased between
1984 and 2001, but the percent of RNs did not; and • By 2001, the percentage of LPNs working in the private sector was greater than the
percent of RNs working in the private sector.
Our data indicate there are similarities in the LPN nurse practice acts across States but variation in how the States express the details of the work of practical nurses. The data also indicate that most States are flexible in the practice requirements and not overly specific in the tasks that are enumerated. However, there are a number of States that have a restrictive scope of practice and/or very specific detailing of tasks that LPNs are permitted to perform. Because of

93 the restrictiveness/specificity in selected States, it would be possible to identify States that could reasonably increase their utilization of practical nurses by reducing the restrictiveness of their practice.
Since the 1990s, the number of LPN programs has remained relatively stable but there has been a decline in number of graduates. Therefore, since 1994, there has been a decline in the number of students each program has enrolled and graduated. The total number of active licenses of LPNs has increased slightly through the 1990s. This suggests that LPNs are remaining in the workforce or keeping their licenses active. The number of first time US educated graduates who are taking the NCLEX-PN has dropped, but the percentage of those passing the examination has remained relatively consistent.
LPN educational curricular requirements vary among the States and territories. Most States specify the content and number of hours of training, some more detailed than others. However, most curricula teach similar basic nursing skills training, such as vital signs, patient data collection, patient care and comfort measures, and medication administration. Additionally, most have added requirements for more advanced skills, such as IV infusion and IV medication administration. Even though requirements vary, endorsement of LPNs from one State to another is generally done smoothly. Therefore, the States recognize the similarities of the training programs, even though they have differences.
The supply of LPNs is affected by characteristics common to other professions. Male LPNs are not more likely to be employed, but they tend to work more hours and are more likely to be employed full time than are females. LPNs reduce their participation in the labor force after a given age; the probability of employment drops after age 40 or 50 and the probability of full-time work declines after LPNs reach their early forties. Black LPNs are more likely to work full time and tend to work more hours than white LPNs. LPNs with children in their households work fewer hours. As LPN wages rise, LPNs are more likely to work full-time.
LPNs generally enjoy higher earnings with experience, but their earnings level off. They also have higher wages if they have a college degree. LPN earnings vary by employment sector, with the highest earnings enjoyed by LPNs working in personnel supply services (such as temporary and home health agencies), hospitals, and long-term care facilities.
The demand for LPNs varies with LPN wages, wages of other nursing personnel, patient volumes, case mix of patients, and market characteristics. In general, demand for LPNs drops as LPN wages rise, and demand for LPNs rises as wages of RNs rise. Higher patient volumes are associated with higher demand for LPNs. In hospitals, rising patient acuity reduces demand for LPNs, while demand increases in long-term care facilities with higher ADL dependency of patients. Revenue constraints imposed by Medicaid lead to higher LPN demand in hospitals but lower LPN demand in long-term care facilities.
Finally, the scope of practice of LPNs affects demand for them. Restrictive scopes of practice have a significant, negative effect on hospital demand for LPNs. The restrictiveness of the scope of practice has a negative effect on demand by long-term care facilities. The weaker effect of scope of practice restrictions on long-term care facility demand for LPNs is not surprising. Long-term care facilities rarely require the skills that LPNs are prevented from practicing in the restrictive States.
The key informant interviews and focus groups yielded a great deal of information from working RNs and LPNs about scope of practice issues, relationships between the two groups of

94 nurses, and how each group perceived the practice of practical nursing, its limitations and opportunities. Both RNs and LPNs were fairly knowledgeable about the legal scope of practice for LPNs in their State, yet there was wide variation in its interpretation and implementation. There was also variation in understanding about the scopes of practice of the two practitioners.
Although most of the LPNs expressed a desire or an intention to return to school to get the RN license, few were actually enrolled in RN programs. Barriers such as time, a need to have a salary, challenges in getting into courses, and family issues were among those that kept LPNs from pursuing further education. In some locations, LPNs in long-term care facilities have salaries that are at or near hospital RN salaries. These LPNs tend to be less interested in pursuing an RN license. In locations with a substantial gap in salary between RNs and LPNs, there was more interest in moving from LPN to RN. In several focus group locations, long-term care facilities paid LPNs more money than acute care hospitals. There was also a perception that LPNs are treated with less respect in acute care hospitals and that the work is more technical and less interesting.
Workplace relationships between LPNs and RNs in the workplace are reported to be cordial. There is some resentment by LPNs of the higher wages paid to RNs for what is seen by the LPNs as similar work. RNs, on the other hand, expressed some discontent over the need to supervise LPNs, since this can adds to the RN workload.
Conclusions
LPNs are now and have historically been a necessary part of the healthcare workforce in U.S. hospitals, long-term care facilities, and other organizations that provide health care. As the technical complexity of patient care has increased, the demand for more extensive education for both LPNs and RNs has increased. Simultaneously, the demand for more LPNs, and RNs seems to require that the educational requirements be reduced. Nurse educators and executives have responded to these conflicting demands by adding additional training to both the basic LPN and RN education programs and generally increasing the time to complete both programs. Additionally, both practitioners can opt to expand their scopes of practice with additional training. It is not clear that this increase in scope of practice leads to an increase in salary for the LPN or RN. LPNs with additional training and responsibility for IV medications may see no salary increase. So, while the increased skill is good for organizations, it is not clear that it benefits the individual in a tangible way.
The LPN workforce displays the same demographic characteristic as the RN workforce, and thus has many of the same limitations, in regards to age, gender, and family obligations. To expect the LPN workforce to substantially augment the RN workforce is unrealistic, as it presently exists. There are selected States that have scopes of practice that limit the utility of the LPN. Less restrictive scopes of LPN practice would increase hospital demand for LPNs but leave long-term care demand unchanged. Further, selected organizations restrict the scope of practice of LPNs further than the State laws allow. Reasons for these restrictions may be the belief, supported by some studies, that fewer LPN hours have been found to be related to better patient outcomes in acute care facilities. In any case, less restrictive scopes of practice would influence demand for LPNs in acute care hospitals.
Although all key informants and focus group members stated flatly that LPNs could not directly substitute for RNs, most acknowledged that much of the work that RNs perform could be performed by LPNs. There are, of course, differences in the training, skill, and ability of the two different work groups, just as there are differences among individuals in both work groups.

95 It is very clear that long-term care institutions in the U.S. could not function without LPNs. It is also clear that LPNs could be used more fully in hospitals. However, even if direct substitution was possible, there is little hope that the current number of LPNs will be able to augment the RN workforce in adequate numbers to fill the need. More of both LPNs and RNs are needed.

96
Recommendations
Based on our findings, we recommend the following:
1. The LPN could be used to augment the workforce during RN shortages. However, the role of LPNs is limited by their scope of practice. How much the LPN can be used depends on the ability of States to create a more flexible LPN scope of practice. States should assess whether there is evidence that lessening practice restrictions would negatively impact patient care before making changes to the scope of practice. Careful study of the use of the LPN in various settings is necessary to determine positive or negative impact on patient outcomes. Federal and State governments should support research on the effect of LPNs on quality of care.
2. Employers should work to create teams, of RNs and LPNs to share workload appropriately in both acute and long-term care.
3. Boards of Nursing must ensure that bedside RNs and LPNs, nurse managers, and hospital and long term care executives have a common and accurate understanding of the scopes of practice of RNs and LPNs. Employers should clarify for their employees the differences between State scopes of practice and individual institutional policy.
4. State Boards of Nursing should work toward standardization of LPN training, both at the basic education preparation level and beyond. One mechanism to achieve greater uniformity might involve the identification of national standards for entry level and advanced education of LPNs.
5. Nurse educators need to facilitate articulation between LPN and RN license requirements. More efficient “laddering” of workers from lower skill to higher skill healthcare jobs benefits both workers and employees, and will ultimately decrease the total cost to educate nurses.
6. Based on data related to gender, age, marital status, and ethnicity, it appears that LPNs and RNs come from essentially the same pool or potential workers. Therefore, the long-term RN shortage is unlikely be solved with an influx of LPNs, because increased recruitment of students into LPN programs will likely offset recruitment into RN programs.
7. Employers should examine how the work of licensed nurses could be allocated safely and reasonably, so that RNs are not overwhelmed and LPNs can practice to their full scope of practice. Although LPNs cannot directly substitute for RNs, many tasks traditionally completed by RNs can be accomplished by LPNs, with appropriate training.
8. Employers should consider providing additional compensation to LPNs who complete additional training and obtain certifications beyond the basic LPN license, to provide LPNs with incentives to continue their education.
9. The Bureau of Health Professions and State Board of Nursing should strive to educate the public about the LPN profession, both to give recognition to practicing LPNs and to encourage more people to pursue a career in practical nursing.
10. The Bureau of the Health Professions, National Council of State Boards of Nursing, or individual State Boards of Nursing should create a national database to track both LPNs and RNs to have accurate data for prediction of nurse and healthcare workforce needs.

97
References
Buccini, R., & Ridings, L. E. (1994). Using licensed vocational nurses to provide telephone patient instructions in a health maintenance organization. Journal of Nursing Administration, 24(1), 27-33.
Eriksen, L. R., Quandt, B., Teinert, D., Look, D. S., Loosle, R., Mackey, G., et al. (1992). A registered nurse-licensed vocational nurse partnership model for critical care nursing. Journal of Nursing Administration, 22(12), 28-38.
Ingersoll, G. L. (1995). Licensed practical nurses in critical care areas: intensive care unit nurses' perceptions about the role. Heart and Lung: Journal of Critical Care, 24(1), 83-88.
Kenney, P. A. (2001). Maintaining quality care during a nursing shortage using licensed practical nurses in acute care. Journal of Nursing Care Quality, 15(4), 60-68.
Roth, D. (1993). Integrating the licensed practical nurse and the licensed vocational nurse into the specialty of intravenous nursing. Journal of Intravenous Nursing, 16(3), 156-166.

98
Appendices
Appendix A: A1. Nursing-Related Web sites
Appendix B: B1. Summary of Responses to IV Medication Survey Sent to all Boards of
Nursing except California Appendix C:
C1. Restrictiveness Scale Scores Sorted by Most Restrictive C2. Specificity Scale Scores Sorted by Most Specific C3. LPN Scope of Practice C4. Model for Categorizing Scopes of Practice C5. Telephone Interview Script for LPN Boards
Appendix D: D1. LPN Training Data Totals for U.S.: 1976-1998 D2. Graduates of LPN/LPN Schools by State: 1976-1997 D3. Total Enrollment in LPN/LPN Schools by State: 1977-1998 D4. Fall Admissions to LPN/LPN Schools by State: 1977-1998 D5. Admissions to LPN/LPN Schools by State: 1976-1997 D6. LPN/LPN Programs by State: 1976-1997 D7. LPN/LPN Schools by State: 1976-1997 D8. Total Number of Active Licenses by State: 1997-2000 D9. Summary of Licensing Activities D10. Number of Graduates of Foreign Nursing Programs Licensed by State D11. New in State Functions by Jurisdiction: 1997-2000 D12. Maintenance Functions by Jurisdiction: 1997-1998 D13. Total Licenses Processed by Jurisdiction: 1997-1998 D14. Number of Candidates Taking NCLEX-PN® Examination and Percent
Passing for First-Time Candidates Educated in Member Board Jurisdictions: 1997-2000 D15. Number of First-Time Candidates Not Educated in Member Board
Jurisdictions Taking NCLEX-PN® Examination and Percent Passing: 1997-2000 D16. Summary Statistics for First-Time, U.S.-Educated Candidates Taking
NCLEX-PN® Examination: 1997-2000 D17. National Passing Rate: Licensed Practical/Vocational Nurses: 1989-1994 D18. Number of Candidates Taking NCLEX-PN® Examination and Percent
Passing by Type of Candidate: 1994-2003 Appendix E:
E1. Means of Variables, 1994-2001 – Supply of Licensed Practical/Vocational Nurses
E2. Means of Variables, 1990-2000 – Hospital Demand for Licensed Practical Nurses
Appendix F: F1. Findings From Focus Groups F2. Key Informant Interview Questions F3. Focus Group Questions

99
Appendix A
A1. Nursing-Related Web sites
Advance for LPNs http://www.advanceforlpns.com/
Board of Vocational Nursing and Psychiatric Technicians (California) http://www.bvnpt.ca.gov/
Bureau of Labor Statistics, U.S. Department of Labor: Licensed Practical and Licensed Vocational Nurses http://www.bls.gov/oco/ocos102.htm/
National Association for Practical Nurse Education and Service, Inc http://www.napnes.org/
National Council of State Boards of Nursing http://www.ncsbn.org/
The National Federation of Licensed Practical Nurses, Inc http://www.nflpn.org/

100
Appendix B
B1. Summary of Responses to IV Medication Survey Sent to all Boards of Nursing except California State
• Nurses”
; ;
Alaska
scope of practice.
No
Statement Allowing LPNs/LPNs to Administer IV Medications
Statement Specific to Hemodialysis
Alabama General Statement section 610-X-6-.04 of regulations: “Provision of care using standardized procedures including administration of medications and treatments under the direction of licensed professional nurse…”
Statement: “Chronic Hemodialysis by Licensed Practical
“…it is within the scope of practice of licensed practical nurses to perform hemodialysis…” including, “initiation of dialysis treatment at peripheral sites; performance of intravenous therapy…, including connection of IV fluids/ “piggyback” solutions to existing central venous infusions; flushing of central venous ports and alteration of fluid rates by LPNs with two years experience in initiating peripheral IV therapy monitoring of dialysis treatment adjustment of dialysis treatment at the direction of physician or registered nurse; termination of dialysis treatment…” “Functions under the supervision of a registered nurse, i.e., RN physically present in the facility.”
Alaska advocates the use of the National Council’s Delegation process to determine what LPNs can do. Using the example of “hanging a premixed medicated intravenous solution”, they go on to State that, “Activities that fit the decision making model depicted in Figure 1 are appropriate areas for expanded practice by experienced LPNs.”
The Alaska Board uses “management of chronic dialysis care in the health care facility setting” as another example of a task that can be appropriately delegated to LPNs.
Arizona LPNs allowed to administer IV meds. Arkansas LPNs are not taught IV therapy in the Education Program.
The RN may delegate this task to an LPN provided the LPN has had postgraduate education and competency validation. They cannot perform any task that requires “specialized knowledge, skill or judgment of an RN, “e.g. cancer chemotherapy or any medication that requires assessment/monitoring, as assessment is not in the LPN

101
State
No
No
)
No
Statement Allowing LPNs/LPNs to Administer IV Medications
Statement Specific to Hemodialysis
Colorado “Intravenous therapy and venous blood withdrawal is a part of the expanded role of the LPN.” In addition to other activities, LPNs may administer, “pre-mixed antibiotic solutions via peripheral veins regulated by gravity flow or pump.”
Connecticut May initiate IV therapy, maintain continuous therapy and administer IV medications (except IV push medications) with special post-basic training, demonstrated competence and availability of ongoing supervision.
Delaware Board’s position paper recognizes initiation and maintenance of peripheral therapy (including IV medications, except by push They have limited central line activities (not delineated by Board in our response.)
Florida LPNs can administer IV medications. Georgia No restrictions on LPN's administering IV medications. Idaho “The licensed practical nurse implements aspects of the
strategy of care by:…Performing peripheral intravenous therapy functions as follows…Hanging containers of medicated or unmedicated intravenous solutions which are commercially prepared or pre-mixed by pharmacy, hanging blood or blood derivatives, inserting analgesic cartridges and programming and monitoring patient controlled analgesia pumps and performing autoinfusion”
“The licensed practical nurse implements aspects of the strategy of care by:…Performing a variety of procedures including but not limited to: application of monitoring equipment, recording of readings and hemodialysis or peritoneal dialysis.”
Illinois The letter of the Illinois Nurse Practice Act States that the LPN does not give IVP medications. However, it is standard practice in the Nephrology Community for LPN's with IV certification to give Dialysis specific IVP medications. They are not allowed to co-sign or administer blood or blood products
Indiana “Indiana does not have specific laws defining the scope of practice for Practical Nurses. The law just basically States that a nurse can perform functions that they are trained to do and those in which the facility allows them to do.” Kristen Kelley – Indiana Board of nursing.

102
State
)
No
• •
• •
•
Statement Allowing LPNs/LPNs to Administer IV Medications
Statement Specific to Hemodialysis
Iowa “Iowa Administrative Code 655.6.5(3 authorizes the licensed practical nurse to perform procedures related to the expanded scope of administration of intravenous therapy in a licensed hospital, a licensed skilled nursing facility and a certified end-stage renal dialysis unit” after taking a Board-approved post-graduate course. LPNs may initiate peripheral IV therapy, administer premixed electrolyte and vitamin solutions and premixed antibiotic solutions – all of these after the initial dose is administered by an RN.
See Statement re IV meds.
Kansas After post-graduate training the LPN may, administer “continuous intravenous drip analgesics and antibiotics…administer by direct intravenous push analgesics, antibiotics, antiemetics and diuretics.”
Kentucky “When delegated by a registered nurse, the licensed practical nurse may administer IV medications and fluids that are: (a) mixed and labeled by a registered nurse or pharmacist or are commercially prepared; and (b) given on a routine reoccurring basis to a patient with a stable condition.”
“LPNs who provide dialysis care may: Collect assessment data; Cannulate and perform dialysis treatment via an implanted subcutaneous vascular device, and/or peripheral access sites (AV fistulas and AV grafts). Administer heparin 1:1000 units or less concentration… Administer normal saline via the dialysis machine to correct dialysis induced hypotension based upon pre-approved medical protocol Administer intravenous therapy/ medications” as listed in “Statement Allowing LPNs/LPNs to Administer IV Medications” in this table.

103
State
Louisiana
(a) (b) PPN
; ; (3)
No
Statement Allowing LPNs/LPNs to Administer IV Medications
Statement Specific to Hemodialysis
“Scope of practice is a fluid concept. It changes as knowledge and technology expand. LPNs must possess the knowledge, skill, and ability to perform their duties, therefore, scope of practice comes down to the competency of the individual LPN….Some of the tasks an LPN may perform when the above conditions are met… Initiate and maintain IV therapy and administer IV medications by IVPB and/or IVP (including hyperalimentation, blood and blood products)…Perform heparinization during hemodialysis…Care for clients with external venous catheters and specifically: obtain blood specimens/connect and monitor IV fluids/connect IVPB, provide site care (including dressing changes)
See Statement re IV meds.
Maine Must have IV certification course [could not access more detailed information]
“…a licensed practical nurse may administer a heparin bolus as part of the procedure for initiating dialysis in a renal dialysis center.”
Maryland “The LPN may perform the following infusion therapy acts for peripheral and subcutaneous infusion when there is an RN on site or available by telephone…Administer a medication which is routine for the patient…Administer medication via a peripheral IV line (including midline) using: pharmacy-prepared medication; andsolutions; and Add medications to an intravenous solution.” “The LPN may perform the following additional acts under the direct supervision of the RN following a comprehensive patient assessment: (1) Administer medication and TPN via midclavicular or CVC by hanging pharmacy-prepared solutions (2) Add medication to a solution administered via a midclavicular or CVC Administer medication and subsequent replacement solutions including TPN via implanted ports.” “On completion of a second specialized educational program…and with documented evidence of clinical competency, the LPN may administer standardized doses of non-vesicant chemotherapeutic agents and antiviral agents.”

104
State
Massachusetts "The
No
Michigan
Mississippi Missouri
system.”
(b)
)
(1)
Statement Allowing LPNs/LPNs to Administer IV Medications
Statement Specific to Hemodialysis
LPNs may administer IV medications with the exception of IV medications used during conscious sedation. measurement of competency and whether the LPN is allowed this practice is given to the facility to determine. Our regs say that it is within the SOP.”
In Michigan, LPN's can give IV meds as long as they have the Medication class and certificate. They may not administer blood but can give all other drugs.
Minnesota LPNs are allowed to give IV medications.
LPNs are allowed to give IV medications LPNs are allowed to give IV medications.
Montana “Any of the following IV therapy tasks related to peripheral vessel IVs may be performed by the practical nurse:…mix medication solution from a unit dose vial and add to IV solution or volutrol; hang medication solutions that are pre-mixed and properly labeled by a registered nurse or pharmacist; administer metered dose of medication by way of a patient controlled analgesia pump…” “Any of the following tasks related to central venous lines may be performed by a practical nurse:…change standard solutions on continuous flow, pre-established central line
“Under the direct supervision of a dialysis RN, an LPN may perform hemodialysis procedures that include: (a) arterio-venous fistula/graft needle insertion; administration of prescribed local anesthesia as needed prior to dialysis needle insertion; (c)accessing, blood draws, flushes and dressing changes of hemodialysis central-venous catheters; (d administration of prescribed doses of routine dialysis heparin.”
Nebraska “A licensed practical nurse-certified may perform limited intravenous therapy interventions under the direction of a registered nurse or licensed practitioner… When under the direct supervision of an RN or licensed practitioner, an LPN-C may perform these activities for an adult client: Infuse intravenous fluids and administer approved medications into a continuous flow central line.. “Approved medications” Approval determined by RN or MD delegating the task.
“The Nebraska Board supports the ANNA Position Statement on Delegation of Nursing Tasks and the ANNA Position Statement on Use of Unlicensed in Dialysis.”
The Board supports administration of heparin but does not support administration of other IV medications in dialysis setting.

105
State
No
New No
No
MAY
access devices.”
No
No
Statement Allowing LPNs/LPNs to Administer IV Medications
Statement Specific to Hemodialysis
Nevada “A licensed practical nurse who has at least 1 year of experience in nursing after receiving his initial license, who has completed a course in intravenous therapy approved by the Board…, and who acts pursuant to a written order of a physician and under the immediate supervision of a physician or registered nurse may:… Administer antibiotics or histamine H2 receptor antagonists by adding a solution by piggyback…”
Hampshire LPNs may administer intravenous “medications and nutrients to intravenous fluids after the initial dose is administer by the registered nurse…Add medications and nutrients to fluids previously premixed by a registered pharmacist or the pharmaceutical manufacturer after the initial dose is administered by the registered nurse…”
New Jersey “LPNs need to be competent to perform the delegated task of initiating and administering IV therapy (excluding IV push medications).”
New Mexico LPNs are allowed to give IV medications. New York “…a licensed practical nurse, who has demonstrated
knowledge, skills and competency in intravenous therapy, , while practicing in an acute care setting under
appropriate supervision:… Add medications except chemotherapy to IV solutions for infusion through vascular
North Carolina “Administration of IV fluids and medications via the central vascular route is within the scope of nursing practice for the registered nurse and the licensed practical nurse.” “Administration of IV fluids and medications via the peripheral vascular route is within the scope of practice for the licensed practical nurse.”

106
State
(1)
(2) ; (3) ; (4)
physician for dialysis.” No
j
No
Statement Allowing LPNs/LPNs to Administer IV Medications
Statement Specific to Hemodialysis
North Dakota “The North Dakota Board of Nursing authorizes the provision of selected components of intravenous therapy by a Licensed Practical Nurse who has completed a board approved educational program that included intravenous therapy in the curriculum or has successfully completed a course in intravenous therapy…” “The role of the Licensed Practical Nurse in the nursing management of intravenous therapy of a stabilized client is to:… Add prescribed medications to intravenous fluids to administer through existing peripheral lines and central venous lines having external access.” “Administer selected medications by intravenous bolus according to specific institutional policies and after specific institutional inservice.”
“The Licensed Practical Nurse may perform the following nursing functions in a dialysis unit according to specific institutional policy and after completion of specific institutional inservice:… Administer IV medications and solutions during hemodialysis.”
Ohio After completing a course in intravenous therapy approved by the Board the LPN may “initiate or maintain an intravenous piggyback infusion containing an antibiotic additive.”
“…at the direction of a physician or a registered nurse, a licensed practical nurse authorized by the board to perform intravenous therapy may perform the following activities for the purpose of performing dialysis:
The routine administration and regulation of saline solution for the purpose of maintaining an established fluid plan; The administration of a heparin dose intravenouslyThe administration of a heparin dose peripherally via a fistula needleThe loading and activation of a constant infusion pump or the intermittent injection of a dose of medication prescribed by licensed
Oklahoma “IV therapy and medication administration may be within the scope of practice of the LPN who has appropriate educational training and under supervision.”
Oregon “The Board recognizes that the role of the licensed practical nurse and registered nurse will change over time. Basic education which leads to licensure as a licensed practical nurse of registered nurse establishes entry level competencies. The licensee may add technical skills to practice following initial licensure through such methods as inservice education, on the ob training or continuing education.” Oregon does not publish a laundry list of tasks that are within the LPN scope of practice.

107
State
No
The No
No
Texas No
Utah No
Statement Allowing LPNs/LPNs to Administer IV Medications
Statement Specific to Hemodialysis
Pennsylvania LPNs may administer IV medications except for antineoplastic agents, titrated medication and intravenous push medications other than heparin flush.
Rhode Island “There is nothing in statute or regulations to preclude an LPN from administering IV therapy or medication.employing agency decides which level of caregiver (RN or LPN) may perform this task and to assure the individual is competent to perform task.”
South Carolina South Carolina requires an IV certification course South Dakota LPNs may, “Administer, by peripheral route, standard
solutions at a defined flow rate, with or without admixtures, mixed and labeled by a pharmacist, registered nurse or physician…Administer vitamins, antibiotics, corticosteroids, and H2 antagonists by the intravenous piggyback route, that are mixed and labeled by a pharmacist, registered nurse, or physician, excluding the first dose which must be administered by a registered nurse.” Administer “via an externally accessed centrally place catheter…standard solutions at a defined flow rate, with or without admixtures, mixed and labeled…” “Administer vitamins, antibiotics, corticosteroids, and H2 antagonists by the intravenous piggyback route, that are mixed and labeled by a pharmacist, registered nurse, or physician, excluding the first dose which must be administered by a registered nurse.”
LPNs may administer intravenous medications both peripherally and via central lines after education that includes competencies specific to those functions. LPNs may administer IV medications after taking a postgraduate certification course.
Virginia LPN's can administer all med's utilized in dialysis, IV included. They cannot, however, administer blood without an RN second signature.

108
State
)
No
No
No
No
Statement Allowing LPNs/LPNs to Administer IV Medications
Statement Specific to Hemodialysis
Washington “Licensed Practical Nurses (PN) may, under the supervision of a registered nurse, administer intravenous medications and fluids provided the LPN has had the appropriate continuing education and practice to prepare to administer these procedures safely and competently.” “The LPN may perform administration of fluids, medication, Total Parenteral Nutrition (TPN , blood or blood products via central venous catheters and central lines, access these lines for blood draws and administration of emergency cardiac medications via IV push”…if there are strict guidelines and protocols in place.”
West Virginia “The registered nurse may delegate selected activities associated with the administration and management of intravenous therapy to a licensed practical nurse qualified by education and experience.” Based on this, LPNs do administer IV medications.
Wisconsin “We don’t do laundry lists of tasks-they may be delegated acts according to their education/training and experience.” Intravenous therapy, including administration of intravenous medications, “are considered either delegated medical acts or delegated nursing acts from an RN.”
Wyoming LPNs may administer IV medications after completing an IV Therapy Certification course.
Source: www.bvnpt.ca.gov/

109
Appendix C
Final Iowa 4 4 3 4
4 4 4 4 Alaska 3 3 2 3 Arizona 4 3 3 3 Arkansas 3 3 3 3 California 4 3 3 3 Colorado 2 3 3 3 Illinois 3 3 3 3 Kansas 4 3 3 3 Maine 4 3 3 3 Nebraska 3 3 3 3 Utah 3 3 3 3
3 3 3 2 2 2 2
Connecticut 2 2 3 2 Delaware 2 2 3 2 Georgia 1 2 2 2 Idaho 1 2 2 2 Kentucky 1 2 2 2 Maryland 1 2 2 2 Mississippi 1 2 2 2 Missouri 2 2 3 2 Montana 1 2 2 2 Nevada 2 2 2 2
1 2 2 2 1 2 2 2 1 2 2 2
Ohio 3 2 2 2 Oregon 2 2 2 2 Pennsylvania 2 2 2 2
3 2 2 2 2 2 3 2
Tennessee 2 2 2 2 Virginia 2 2 2 2
1 2 2 2 2 1 2 2 2 2 3 2
Florida 1 1 1 1 Hawaii 1 1 1 1 Indiana 1 1 1 1
C1. Restrictiveness Scale Scores Sorted by Most Restrictive
Review1 Review2 Review3 Restrictiveness
Virgin Islands
Washington, D.C. 4 Alabama
New Hampshire New York North Dakota
South Carolina South Dakota
West Virginia Wisconsin Wyoming

110
Final Louisiana 1 1 1 1 Massachusetts 2 1 1 1 Michigan 2 1 1 1 Minnesota 1 1 1 1
1 1 1 1 1 1 2 1 1 1 1 1 1 1 1 1 1 1 1 1
Texas 1 1 1 1 1 1 2 1
Washington 1 1 1 1
Specificity Final
California 4 4 4 4 Idaho 4 4 4 4 Iowa 4 4 4 4 Kansas 4 4 3 4 Maine 4 3 4 4 Montana 3 4 4 4 Nebraska 4 4 4 4
3 4 4 4 Ohio 4 4 4 4 Pennsylvania 3 4 4 4
4 4 3 4 3 4 4 4
Alaska 4 3 3 3 Illinois 4 3 3 3 Mississippi 2 3 3 3 Nevada 4 3 3 3
1 3 3 3 Oregon 3 3 2 3
3 2 2 2 Arkansas 2 2 2 2 Colorado 1 2 2 2 Delaware 3 2 2 2 Kentucky 1 2 2 2 Louisiana 1 2 2 2 Missouri 1 2 2 2
1 2 2 2 1 2 2 2
Review1 Review2 Review3 Restrictiveness
New Jersey New Mexico North Carolina Oklahoma Rhode Island
Vermont
C2. Specificity Scale Scores Sorted by Most Specific
Review1 Review2 Review3
New Jersey
South Carolina South Dakota
New Hampshire
Alabama
New Mexico New York

111
Specificity Final
1 2 2 2 1 2 2 2 1 2 2 2
Tennessee 1 2 2 2 Utah 2 2 2 2
1 2 2 2 Washington 1 2 2 2
2 2 2 2 2 2 2 1 2 2 2 1 2 2 2
Arizona 1 1 1 1 Connecticut 2 1 1 1 Florida 1 1 1 1 Georgia 1 1 2 1 Hawaii 1 1 1 1 Indiana 1 1 2 1 Maryland 1 1 1 1 Massachusetts 2 1 1 1 Michigan 1 1 1 1 Minnesota 1 1 1 1
1 1 1 1 Texas 1 1 1 1 Virginal 1 1 1 1
1 1 1 1
Review1 Review2 Review3 North Carolina North Dakota Rhode Island
Vermont
Washington, D.C. 1 Wisconsin Wyoming Virgin Islands
Oklahoma
West Virginia

112
C3. LPN Scopes of Practice Scope of Practice
State Tubes Dressings Nursing Care Planning
IV m
eds
Cen
tral l
ines
Blo
odH
yper
al
Rei
nfor
cem
ent
Dat
a co
llect
ion
Obs
erva
tion
Teac
hing
Sta
ndar
dize
d
iS
peci
fic
Alabama x x x x x no x x x x x x* no x* x x* x x x x 4 4 x* no x* no x x no x x x 3 3 x* x* x x* x x 1 x 1
Georgia x x x 1 ii x x 1
Idaho x x x x* x x x x x x x x 2 4 Illinois x x x x x x 3 3 Indiana 1 1
x* no x x* x x* x x x x 4 4 x* x* x* x* x RN 3 4
Kentucky x*
Supervisors C
ance
r age
nts
Ven
us b
lood
dra
w
Arte
rial b
lood
dra
ws
Inse
rt IV
In
serti
on
Mai
nten
ance
C
hang
es
Doc
umen
tatio
n As
sess
men
t
Ver
bal a
nd p
hone
o
rder
s
Doc
umen
tatio
n co
-si
gned
Pro
cedu
res/
E
xpan
ded
prac
tice
Res
trict
ve
Oth
er P
roce
dure
s
RN, MD Alaska RN, MD, Dentist Arizona Arkansas RN, MD, Dentist, APN California RN, MD Colorado RN,MD,APN,Dentist, Podiatrist Connecticut Delaware Florida RN,MD,DO, Podiatrist,dentist
Hawano x* RN,MD,Dentist
no x no x RN,MD,Dentist RN,MD,Dentist,Chiropractor, Optometrist,Podiatrist
Iowa Kansas no no no

113
x x x x x x x x x x Psy g
x 1 2
Maine x* no x x* x* x x no x x 3 3 l x
x x x x 2 x* no 1
Mi x 1 x* no x x x 3 3
IV Cen
tral l
ines
Blo
odH
yper
al
Rei
nfor
cem
ent
Dat
a co
llect
ion
Obs
erva
tion
Teac
hing
Sta
ndar
dize
di
Spe
cific
Mi i 2 Montana x x x x x x x 2 2
x* no x x x x RN x 4 3 x* no no x x x x x x x 3 3
H hi x* x x 2 x x x 2 x x x 2 x* no x* x x x 2
x* x x x 1 x x x x 1
Ohio x* x x x x 1
x x x x* no no x x x 3 3 x
x* x* x/* x* x* x x 4 5 x no x x x no x 3 3
x x 1
Louisiana RN,MD,Optometrist,Dentist, cholo ist
Mary and x* Massachusetts x Michigan
nnesota Mississippi no x* RN,MD,Dentist
Can
cer a
gent
s
Ven
us b
lood
A
rteria
l blo
od
Inse
rt IV
In
serti
on
Mai
nten
ance
C
hang
es
Doc
umen
tatio
n As
sess
men
t
Sup
ervi
sors
Ver
bal a
nd
phon
e or
ders
D
ocum
enta
tion
co-s
igne
d
Res
trict
ve
ssour x* RN,MD no no no no RN,MD,Dentist, OD,Podiatrist
Nebraska no no no no x* Nevada no x New RN,MD,ARNP,Dentist New Jersey New Mexico New York North Carolina x North Dakota
RN,MD,Dentist,Optometrist,Podiatrist Oklahoma Oregon Pennsylvania Rhode Island South Carolina x* South Dakota no x* RN,MD Tennessee

114
IV Cen
tral l
ines
Blo
odH
yper
al
Rei
nfor
cem
ent
Dat
a co
llect
ion
Obs
erva
tion
Teac
hing
Sta
ndar
dize
di
Spe
cific
Texas x* x* x* x* x x x 2 2 x* x x 2
Vermont x x 1 Virginia x* 1
x* x* x* x* x* x x x 3 3
D C x x* x x x 2 x* x x x x 1 x x x 1
Wyoming x* x x 1
Can
cer a
gent
s
Ven
us b
lood
A
rteria
l blo
od
Inse
rt IV
In
serti
on
Mai
nten
ance
C
hang
es
Doc
umen
tatio
n As
sess
men
t
Sup
ervi
sors
Ver
bal a
nd
phon
e or
ders
D
ocum
enta
tion
co-s
igne
d
Res
trict
ve
Utah RN,MD RN,MD,APRN,Dentist
Washington Washington, West Virginia Wisconsin RN,MD,Podiatrist,Dentist,Optometrist
RN,MD,Dentist
* with additional education x = written Y = verbal
non-specific-specific =1-5 unrestrictive-restrictive=1-5 (with 1 being the least and 5 being the most)

115
C4. Model for Categorizing Scopes of Practice
Restrictive and Specific Scale Scoring Instructions As demonstrated by the Web information, telephone interviews of the Boards, key
informant interviews, and focus groups, please make the following judgments:
As a relative value, on a scale of 1-4, with 1 being the least restrictive and 4 being the most restrictive, categorize (by circling) each State’s LPN/LPN scope of practice. Restrictive is defined as allowing or not allowing a level of autonomy/flexibility/independence in the practice of the LPN/LPN.
State Name Least Restrictive Most Restrictive 1 2 3 4
As a relative value, on a scale of 1-4, with 1 being the least specific and 4 being the most specific, categorize (by circling) each State’s LPN/LPN scope of practice. Specific is defined as explicating defined parameters of practice of the LPN/LPN.
State Name Least Specific Most Specific 1 2 3 4

116
C5. Telephone Interview Script for LPN Boards
Introduction:
I am------ and we were recently funded by HRSA to study LPN scope or practice in the 50 States. We have collected information from your Web site and have several questions for clarification. It will take about 20 minutes of your time. Would you answer the questions? Offer to read or fax the Information Letter.
1. Are there other written documents, not on the Web site, that further explains the scope of practice for your State?
2. How would you characterize the scope of practice in your State? From 1-5 with 1 being the most restrictive and 5 being the least restrictive?
3. We have developed a chart of LPN activities. As I go through the information, will you verify that it is correct?
4. Have you changed your scope of practice in the last 5 years? If yes, please describe.
5. How many disciplinary actions has your board taken in the past year against LPNs? • Can you characterize the reasons for these actions? • What share of actions result from patient care violations/drug violations/etc.?
6. What data does your State collect about LPNs? • What information is collected with licensure? Demographics, employment
status? • Have you done any special surveys of LPNs in your State? Do you do regular
surveys? • What information do you have about your State’s LPN education programs? • Can you share any or all of these data with us?
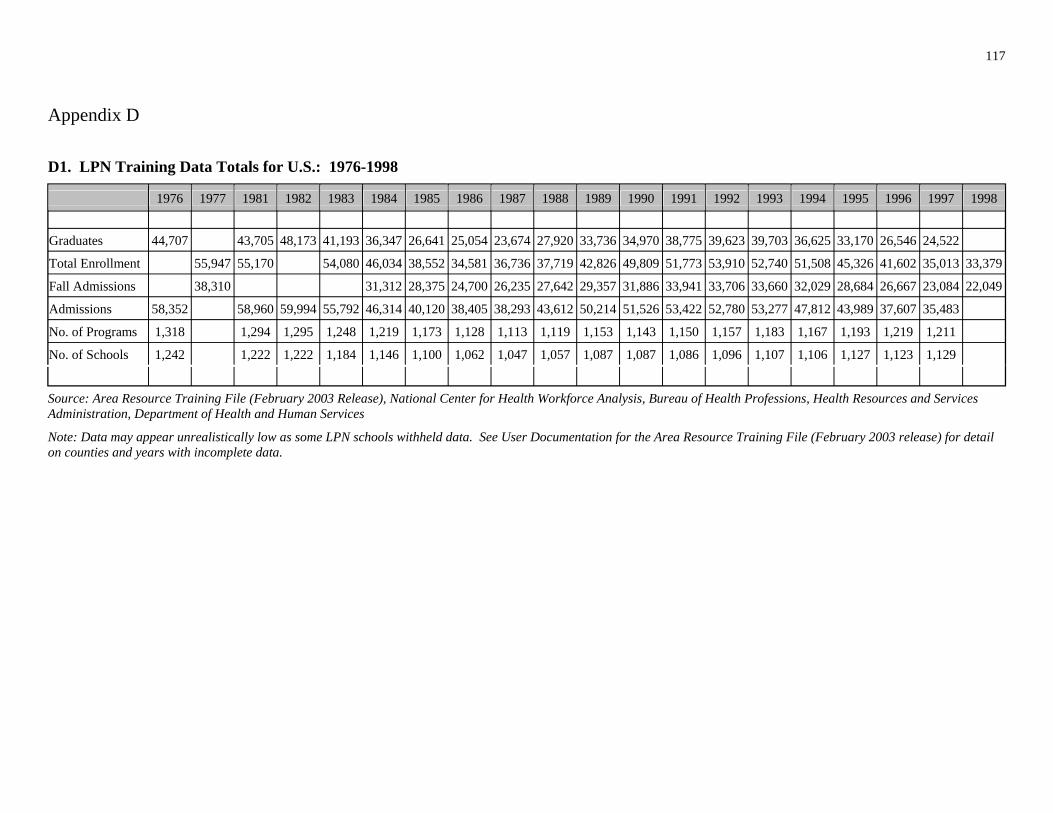
117
Appendix D
D1. LPN Training Data Totals for U.S.: 1976-1998
Graduates 44,707
1976 1977
43,705
1981
48,173
1982
41,193
1983
36,347
1984
26,641
1985
25,054
1986
23,674
1987
27,920
1988
33,736
1989
34,970
1990
38,775
1991
39,623
1992
39,703
1993
36,625
1994
33,170
1995
26,546
1996
24,522
1997 1998
Total Enrollment 55,947 55,170 54,080 46,034 38,552 34,581 36,736 37,719 42,826 49,809 51,773 53,910 52,740 51,508 45,326 41,602 35,013 33,379
Fall Admissions 38,310 31,312 28,375 24,700 26,235 27,642 29,357 31,886 33,941 33,706 33,660 32,029 28,684 26,667 23,084 22,049
Admissions 58,352 58,960 59,994 55,792 46,314 40,120 38,405 38,293 43,612 50,214 51,526 53,422 52,780 53,277 47,812 43,989 37,607 35,483
No. of Programs 1,318 1,294 1,295 1,248 1,219 1,173 1,128 1,113 1,119 1,153 1,143 1,150 1,157 1,183 1,167 1,193 1,219 1,211
No. of Schools 1,242 1,222 1,222 1,184 1,146 1,100 1,062 1,047 1,057 1,087 1,087 1,086 1,096 1,107 1,106 1,127 1,123 1,129
Source: Area Resource Training File (February 2003 Release), National Center for Health Workforce Analysis, Bureau of Health Professions, Health Resources and Services Administration, Department of Health and Human Services
Note: Data may appear unrealistically low as some LPN schools withheld data. See User Documentation for the Area Resource Training File (February 2003 release) for detail on counties and years with incomplete data.
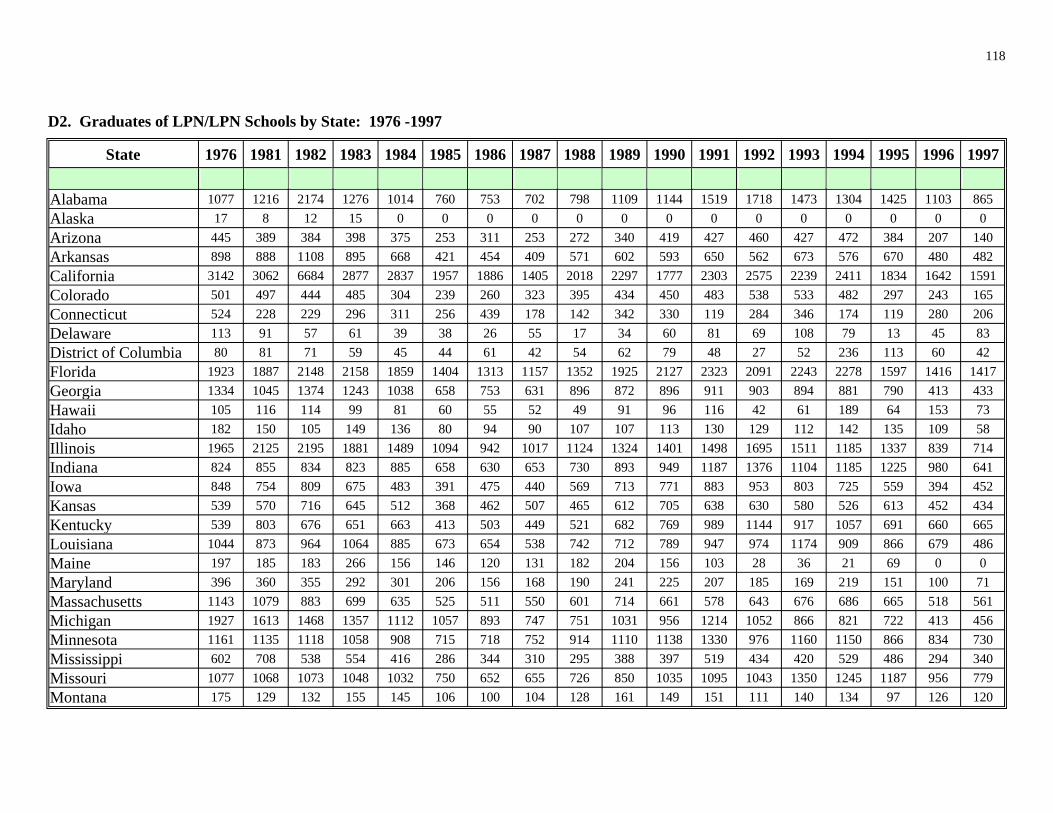
118
D2. Graduates of LPN/LPN Schools by State: 1976 -1997
State 1976 1981 1982 1983 1984 1985 1986 1987 1988 1989 1990 1991 1992 1993 1994 1995 1996 1997
Alaska 17 8 12 15 0 0 0 0 0 0 0 0 0 0 0 0 0 0 Arizona Arkansas California Colorado Connecticut Delaware 91 57 61 39 38 26 55 17 34 60 81 69 79 13 45 83
80 81 71 59 45 44 61 42 54 62 79 48 27 52 60 42 Florida Georgia Hawaii 99 81 60 55 52 49 91 96 42 61 64 73 Idaho 80 94 90 58 Illinois Indiana Iowa Kansas Kentucky Louisiana Maine 28 36 21 69 0 0 Maryland 71 Massachusetts Michigan Minnesota
Missouri Montana 97
Alabama 1077 1216 2174 1276 1014 760 753 702 798 1109 1144 1519 1718 1473 1304 1425 1103 865
445 389 384 398 375 253 311 253 272 340 419 427 460 427 472 384 207 140 898 888 1108 895 668 421 454 409 571 602 593 650 562 673 576 670 480 482
3142 3062 6684 2877 2837 1957 1886 1405 2018 2297 1777 2303 2575 2239 2411 1834 1642 1591 501 497 444 485 304 239 260 323 395 434 450 483 538 533 482 297 243 165 524 228 229 296 311 256 439 178 142 342 330 119 284 346 174 119 280 206 113 108
District of Columbia 236 113 1923 1887 2148 2158 1859 1404 1313 1157 1352 1925 2127 2323 2091 2243 2278 1597 1416 1417 1334 1045 1374 1243 1038 658 753 631 896 872 896 911 903 894 881 790 413 433 105 116 114 116 189 153 182 150 105 149 136 107 107 113 130 129 112 142 135 109
1965 2125 2195 1881 1489 1094 942 1017 1124 1324 1401 1498 1695 1511 1185 1337 839 714 824 855 834 823 885 658 630 653 730 893 949 1187 1376 1104 1185 1225 980 641 848 754 809 675 483 391 475 440 569 713 771 883 953 803 725 559 394 452 539 570 716 645 512 368 462 507 465 612 705 638 630 580 526 613 452 434 539 803 676 651 663 413 503 449 521 682 769 989 1144 917 1057 691 660 665
1044 873 964 1064 885 673 654 538 742 712 789 947 974 1174 909 866 679 486 197 185 183 266 156 146 120 131 182 204 156 103 396 360 355 292 301 206 156 168 190 241 225 207 185 169 219 151 100
1143 1079 883 699 635 525 511 550 601 714 661 578 643 676 686 665 518 561 1927 1613 1468 1357 1112 1057 893 747 751 1031 956 1214 1052 866 821 722 413 456 1161 1135 1118 1058 908 715 718 752 914 1110 1138 1330 976 1160 1150 866 834 730
Mississippi 602 708 538 554 416 286 344 310 295 388 397 519 434 420 529 486 294 340 1077 1068 1073 1048 1032 750 652 655 726 850 1035 1095 1043 1350 1245 1187 956 779 175 129 132 155 145 106 100 104 128 161 149 151 111 140 134 126 120

119
State 1976 1981 1982 1983 1984 1985 1986 1987 1988 1989 1990 1991 1992 1993 1994 1995 1996 1997 Nebraska Nevada 67 74 67 57 53 28 43 56 47 63 79 73 88 73 72 0 0 0
96 56 40 32 87 82 92 99 82 New Jersey New Mexico New York North Carolina North Dakota 55 27 33 38 80 55 83 89 Ohio
Oregon 0 20 Pennsylvania Rhode Island 99 99 87 78 79 45 48 0 59 52 51 0 63 0 0 0 0 South Carolina South Dakota 67 13 17 19 21 52 61 50 59 62 58 49 53 50 Tennessee Texas Utah 99
89 57 58 66 69 79 75 85 77 84 83 85 Virginia
gton g
Wy g 63 86 86 93 85 64 67 63 85 77 98 42 13 0 TOTAL
(
(
439 381 468 446 391 255 200 270 316 336 319 312 314 251 315 254 267 253
New Hampshire 130 143 200 209 122 104 108 104 102 1333 1050 1171 1069 1064 799 674 541 627 791 822 1139 834 1157 826 701 620 410 279 267 294 305 284 197 152 135 130 115 155 170 158 187 236 187 131 128
3632 2478 2910 2846 2719 1835 1844 1568 1731 2072 2479 2576 3343 3142 2288 2467 2232 2086 933 843 929 651 499 429 317 307 352 430 469 516 484 641 561 498 413 420 268 249 223 211 102 104 140 164 122 123
2156 2032 2274 2317 1701 1117 997 1088 1342 1594 1627 1641 1853 1873 1635 1572 1453 1310 Oklahoma 656 690 721 667 654 392 431 516 609 766 792 895 843 845 771 861 850 865
403 375 358 321 343 344 265 269 289 350 234 369 199 205 142 158 2449 2438 2705 2726 2227 1718 1329 1245 1492 1678 1940 2127 2263 2250 2264 2000 1532 1336
111 580 542 490 491 508 360 313 284 334 424 414 400 509 437 484 468 255 306 231 215 245 231
1023 1355 921 796 1003 708 573 687 781 964 1039 912 983 1060 949 911 627 662 3471 3184 3370 3414 3174 2510 2024 2156 2735 3166 3557 4028 3767 3991 3903 3550 2963 2616 197 267 339 311 248 237 233 255 328 341 272 338 353 386 217 259 185
Vermont 154 131 129 128 107 143 970 1076 1102 536 948 667 680 682 672 764 755 822 892 978 747 734 618 849
Washin 896 2426 764 953 857 576 702 602 685 946 796 884 822 863 606 648 270 256 West Vir inia 367 509 531 450 368 373 301 305 376 424 436 475 476 477 346 286 290 300 Wisconsin 1133 880 917 699 416 142 142 129 206 200 158 148 327 278 177 180 196 210
omin 102 115 113 129 44,707 43,705 48,173 41,193 36,347 26,641 25,054 23,674 27,920 33,736 34,970 38,775 39,623 39,703 36,625 33,170 26,546 24,522
Source: Area Resource Training File February 2003 Release), National Center for Health Workforce Analysis, Bureau of Health Professions, Health Resources and Services Administration, Department of Health and Human Services
Note: Data may appear unrealistically low as some LPN/LPN schools withheld data. See User Documentation for the Area Resource Training File February 2003 release) for detail on counties and years with incomplete data.

120
D3. Total Enrollment in LPN/LPN Schools by State: 1977-1998
State 1977 1981 1983 1984 1985 1986 1987 1988 1989 1990 1991 1992 1993 1994 1995 1996 1997 1998
Alabama 1371 1636 1641 1166 1031 940 1089 1182 1546 2174 2348 2490 2213 2321 2125 2160 1654 1408 Alaska 33 22 22 7 0 0 0 0 0 0 0 0 0 0 0 0 16 0 Arizona 421 319 255 291 239 286 343 225 272 408 395 283 444 243 333 200 320 191 Arkansas 895 1145 1070 717 542 520 587 546 746 782 694 740 678 746 817 843 578 565 California 4362 4602 4098 3798 3253 2744 2642 2427 3610 3694 3069 3656 3953 3168 3090 2855 2059 1991 Colorado 575 533 498 374 199 264 486 368 419 409 344 561 375 435 344 287 302 219 Connecticut 498 422 332 328 302 249 202 156 196 383 424 358 325 403 214 230 294 242 Delaware 186 272 236 180 28 28 52 86 21 80 114 130 128 251 135 25 53 128 District of Columbia 202 119 118 117 140 244 148 202 110 236 119 120 98 170 226 224 57 67 Florida 2130 2391 2465 2166 1821 1536 1870 1684 2040 2581 3003 2854 2614 2759 2925 2136 1782 1684 Georgia 1602 1539 1719 1375 1258 849 1076 1083 1244 1568 1674 1689 1676 1390 1495 1428 897 707 Hawaii 112 120 117 78 93 78 102 79 63 167 51 101 0 82 228 83 172 88 Idaho 179 164 119 128 120 117 103 116 117 131 139 142 155 149 148 136 143 72 Illinois 2554 2738 2471 2035 1541 1241 1379 1455 1607 1974 1840 1799 1852 1938 1590 1474 913 873 Indiana 975 1021 1044 867 946 784 883 1056 1233 1364 1886 1512 2079 1270 1588 1499 1276 991 Iowa 909 674 849 589 427 626 923 603 812 976 890 982 820 922 580 421 455 645 Kansas 532 528 467 395 347 559 543 550 573 626 741 659 622 519 523 579 501 519 Kentucky 609 1005 775 684 725 543 639 674 723 1052 1189 1303 1301 1280 1180 967 824 931 Louisiana 1451 1386 1249 1430 1323 881 972 937 1327 1243 1084 1844 1721 1638 1453 1073 964 606 Maine 214 222 178 192 151 181 128 213 254 235 124 48 0 45 0 0 0 0 Maryland 792 617 535 474 417 319 222 291 339 335 379 360 259 239 284 171 160 96 Massachusetts 1309 1141 1020 781 799 662 739 875 766 800 857 691 882 911 870 799 634 718 Michigan 2005 1651 1481 1563 1304 1283 1023 1220 994 1371 1149 1073 992 1084 916 727 643 677 Minnesota 1229 1361 1302 1108 927 1004 1145 1429 1768 2021 2389 2798 1826 2455 1922 1957 1846 1459 Mississippi 776 820 553 697 352 418 476 375 526 513 473 676 584 586 624 641 363 421 Missouri 1226 1254 1219 1101 998 780 879 962 1086 1097 1187 1312 1424 1620 1403 1119 995 933 Montana 223 199 196 178 171 166 161 194 229 257 255 255 194 254 258 208 225 209

121
State 1977 1981 1983 1984 1985 1986 1987 1988 1989 1990 1991 1992 1993 1994 1995 1996 1997 1998 Nebraska Nevada 68 49 62 44 42 52 42 73 86 83 72 47 75 70 0 0 0
51 New Jersey New Mexico New York North Carolina North Dakota 82 26 34 0 59 Ohio
Oregon 36 0 94 0 0 0 30 0 0 0 23 Pennsylvania Rhode Island 96 96 98 0 0 0 0 0 0 0 0 0 0 0 0 South Carolina South Dakota 50 20 24 26 66 73 60 64 67 63 63 61 65 60 Tennessee Texas Utah
93 81 82 82 96 95 95 94 93 71 Virginia
gton g
Wy g 69 63 88 95 72 48 17 0 24 39 18 0 19 TOTAL
(
(
489 545 533 415 303 388 437 436 421 330 414 406 424 244 314 339 325 294 115
New Hampshire 186 235 203 134 123 102 122 141 143 165 178 165 184 194 186 145 170 1789 1423 1586 1749 1176 888 1256 979 1305 1368 1575 1718 1534 1950 1198 778 699 519 322 180 275 294 139 248 260 228 137 188 152 165 127 193 165 109 156 146 6438 5026 5125 4321 3978 3006 3023 3232 3376 4242 5142 4986 5480 4202 3343 3626 3264 2959 1185 1088 1078 791 597 518 475 546 534 614 732 843 766 855 614 594 552 480 215 263 247 165 134 172 250 314 251 315 193 217 202 2501 2684 2718 2178 1500 1264 1479 1701 2134 2271 2255 2196 2415 2153 1791 2051 1860 1760
Oklahoma 785 985 994 756 666 535 634 798 820 1039 1083 1000 912 1014 985 1046 985 1066 244 183 206 180 129 240 256 2679 2951 3206 2833 2082 1924 1761 1866 2117 2438 2815 2849 2668 2661 2228 2105 1693 1573 117 125 304 986 964 961 611 617 541 538 546 688 735 862 758 798 789 664 625 427 498 243 281 282 196 1179 456 691 1084 1087 878 808 1031 1118 1200 1186 1172 1327 1192 1137 996 696 955 4010 4401 4697 3775 3327 3438 3191 3876 3806 4080 4565 4983 4358 4649 4157 3595 3425 3119 319 375 374 338 287 259 279 322 376 318 359 331 370 419 167 203 106 179
Vermont 180 170 174 162 100 108 101 175 2012 2441 2177 1092 1576 1402 1591 1552 1672 1833 1755 2035 1942 2065 1616 1538 1223 1635
Washin 825 714 775 856 542 817 961 515 534 795 665 581 850 657 604 616 388 458 West Vir inia 505 575 594 407 367 358 396 433 494 528 510 511 539 507 352 296 337 364 Wisconsin 1184 1034 888 620 192 139 198 199 221 195 179 199 390 294 201 210 231 389
omin 102 122 100 129 178 55,947 55,170 54,080 46,034 38,552 34,581 36,736 37,719 42,826 49,809 51,773 53,910 52,740 51,508 45,326 41,602 35,013 33,379
Source: Area Resource Training File February 2003 Release), National Center for Health Workforce Analysis, Bureau of Health Professions, Health Resources and Services Administration, Department of Health and Human Services
Note: Data may appear unrealistically low as some LPN/LPN schools withheld data. See User Documentation for the Area Resource Training File February 2003 release) for detail on counties and years with incomplete data.

122
D4. Fall Admissions to LPN/LPN Schools by State: 1977-1998
State 1977 1984 1985 1986 1987 1988 1989 1990 1991 1992 1993 1994 1995 1996 1997 1998
Alabama 896 837 708 606 640 743 859 1179 1162 1021 1653 1001 801 946 936 688 Alaska 33 9 0 0 0 0 0 0 0 0 0 0 0 0 16 0 Arizona 354 171 150 217 146 224 158 226 239 225 287 217 191 107 256 172 Arkansas 699 564 494 509 547 494 546 654 568 517 461 606 540 543 378 550 California 2178 1820 1831 1342 1501 1505 1886 1414 1494 1842 1431 1578 1332 1272 1044 902 Colorado 476 279 201 216 304 346 271 336 289 404 254 303 294 201 228 156 Connecticut 408 40 102 132 32 141 40 109 408 277 145 209 227 201 110 32 Delaware 148 64 39 34 41 98 25 43 105 79 78 100 112 25 53 73 District of Columbia 155 101 113 196 146 191 124 120 98 40 61 74 172 97 28 28 Florida 1077 1157 1038 1031 1169 1128 1050 1454 1528 1306 1373 1598 1636 1011 1015 894 Georgia 1106 943 917 665 627 580 660 627 819 619 922 510 698 675 337 451 Hawaii 120 84 95 59 73 74 54 40 52 109 0 83 231 83 97 24 Idaho 130 92 90 83 73 101 107 117 117 124 138 100 89 70 52 40 Illinois 1810 1457 1282 1036 1136 1049 1163 1293 1333 1330 1525 1255 965 1040 799 696 Indiana 660 654 698 577 587 783 948 1050 1202 959 1265 949 863 969 748 692 Iowa 673 441 384 444 476 429 542 669 713 696 571 458 422 410 286 281 Kansas 328 264 281 389 377 354 422 362 568 479 435 416 449 452 398 436 Kentucky 427 402 466 456 422 543 557 551 732 801 760 740 751 415 379 485 Louisiana 811 757 963 418 689 531 760 509 650 1301 914 632 777 576 402 348 Maine 156 173 132 198 124 202 210 200 131 51 0 45 0 0 0 0 Maryland 557 307 251 217 162 231 278 267 298 216 181 142 169 138 124 72 Massachusetts 1233 768 803 655 717 862 777 793 758 616 839 825 860 801 632 730 Michigan 1312 929 920 822 633 778 519 854 851 720 685 556 597 432 350 434 Minnesota 1094 894 916 804 1068 1160 1276 1212 1438 1147 908 1304 1278 1270 1136 705 Mississippi 466 475 257 265 241 462 367 485 416 611 501 510 597 567 316 406 Missouri 993 840 728 681 734 709 874 939 959 1047 1122 1220 996 765 742 752 Montana 188 149 127 106 167 120 153 139 137 142 116 138 131 91 100 107

123
State 1977 1984 1985 1986 1987 1988 1989 1990 1991 1992 1993 1994 1995 1996 1997 1998 Nebraska Nevada 62 44 42 46 31 21 86 86 72 48 40 40 0 0 0
99 22 56 89 94 59 55 89 New Jersey New Mexico New York North Carolina North Dakota 56 68 26 50 0 58 32 67 89 25 62 74 Ohio
Oregon 67 36 0 0 0 0 0 10 0 0 0 26 Pennsylvania Rhode Island 0 0 0 0 0 0 0 0 0 0 0 0 South Carolina South Dakota 49 20 24 23 67 80 64 66 63 31 66 66 74 Tennessee Texas Utah 75
92 66 78 51 80 64 90 84 81 Virginia
gton g
Wy g 75 91 64 72 72 69 59 78 26 0 0 0 40 0 0 0 TOTAL
(
(
319 234 206 240 236 339 321 266 280 261 362 161 212 223 226 215 115
New Hampshire 188 122 103 109 110 118 118 120 1270 1191 919 720 877 740 970 980 1197 1220 941 1015 768 571 392 446 334 229 103 134 145 197 150 126 159 165 129 194 172 113 136 135 4460 3548 3236 2426 2319 2768 2902 3241 3788 3884 3985 3298 2640 2801 2557 2077 1070 634 538 476 419 530 493 495 610 561 541 634 490 517 511 442 192 118 124 104 1754 1366 1064 938 1109 1333 1597 1662 1536 1479 1601 1500 1301 1326 1370 1320
Oklahoma 590 623 652 403 529 640 715 910 930 878 819 768 660 894 738 823 123 134 105 101 1615 1581 1395 1257 1027 1093 1178 1370 1634 1412 1438 1511 1194 1111 946 948 118 102 116 308 727 490 547 466 474 437 460 568 619 520 634 507 492 564 354 402 187 161 105 526 592 675 670 523 692 696 768 618 700 848 699 660 630 486 619 2828 2869 2239 2447 2660 2472 2546 2624 2610 2880 2723 3077 2483 2457 2270 2004 235 153 111 122 189 167 165 160 219 236 225 245 157 120 132
Vermont 104 106 100 101 102 185 121 1238 890 1240 958 1107 1154 1179 1252 1323 1454 1283 1361 1140 959 914 1173
Washin 613 730 510 408 834 323 431 480 367 346 530 433 442 442 311 273 West Vir inia 444 326 303 303 385 385 438 362 448 514 330 426 266 140 275 256 Wisconsin 709 352 117 132 165 172 145 177 165 157 194 200 155 174 166 225
omin38,310 31,312 28,375 24,700 26,235 27,642 29,357 31,886 33,941 33,706 33,660 32,029 28,684 26,667 23,084 22,049
Source: Area Resource Training File February 2003 Release), National Center for Health Workforce Analysis, Bureau of Health Professions, Health Resources and Services Administration, Department of Health and Human Services
Note: Data may appear unrealistically low as some LPN/LPN schools withheld data. See User Documentation for the Area Resource Training File February 2003 release) for detail on counties and years with incomplete data.

124
D5. Admissions to LPN/LPN Schools by State: 1976-1997
State 1976 1981 1982 1983 1984 1985 1986 1987 1988 1989 1990 1991 1992 1993 1994 1995 1996 1997
Alabama 1416 1784 2078 1769 1447 1228 1244 1429 1839 2103 2285 2699 2749 2922 2337 2494 1995 1641 Alaska 46 56 24 23 0 0 0 0 0 0 0 0 0 0 0 0 16 0 Arizona 476 302 424 363 378 357 380 353 273 468 434 332 345 326 337 203 378 184 Arkansas 1120 1273 1242 1135 705 586 664 580 824 766 806 832 712 784 896 983 614 701 California 4187 4549 4456 3986 3708 3033 2840 2559 3072 3555 3117 3510 3975 2688 3069 2529 2307 2087 Colorado 534 583 521 528 313 282 451 333 407 424 301 547 324 442 381 215 318 211 Connecticut 609 437 420 402 383 425 275 218 294 455 371 421 398 424 226 289 362 277 Delaware 179 254 155 142 70 47 59 116 25 70 109 108 80 124 165 29 56 95 District of Columbia 174 124 144 122 116 277 159 283 107 277 132 123 80 65 256 148 53 74 Florida 2347 2818 2713 2609 2308 2074 2164 1948 2363 2797 3333 3171 2734 3123 3301 2185 2014 1925 Georgia 2023 1819 2066 1852 1619 1226 1401 1249 1810 1732 1780 1629 1809 1492 1681 1603 788 830 Hawaii 153 118 122 72 107 93 99 88 54 173 37 112 0 73 178 84 154 65 Idaho 191 185 128 181 158 148 111 119 139 141 160 152 158 160 160 164 174 80 Illinois 2620 2979 2780 2437 2034 1428 1535 1422 1588 1873 1727 1912 1943 2081 1637 1693 1064 913 Indiana 1072 1131 1099 1104 1067 842 878 998 1170 1407 1493 1665 1769 1457 1484 1529 1205 989 Iowa 1030 788 882 741 552 607 978 596 883 1121 822 963 864 917 658 460 548 524 Kansas 582 548 562 451 451 492 614 584 633 595 875 722 649 573 568 651 575 566 Kentucky 588 1180 1048 1008 843 681 754 754 833 1206 1189 1454 1442 1424 1448 1062 974 1080 Louisiana 1565 1657 1773 1879 1695 1286 1115 1339 1576 1594 1366 2024 2155 2217 1914 1511 1323 934 Maine 227 234 200 222 206 190 139 185 270 250 154 76 0 53 0 0 0 0 Maryland 570 629 556 465 427 317 233 228 281 355 323 255 213 202 228 132 141 89 Massachusetts 1433 1083 1166 894 841 761 718 767 770 815 909 656 838 857 850 874 646 761 Michigan 2202 1698 1749 1767 1440 1463 1044 1212 992 1027 1216 992 908 938 758 739 610 588 Minnesota 1400 1614 1573 1556 1141 1185 1213 1354 1691 2021 2431 2092 1668 2369 1870 1829 1755 1242 Mississippi 923 964 688 776 488 410 572 501 515 588 568 731 653 551 689 767 417 547 Missouri 1312 1293 1312 1193 1202 809 1009 886 1092 1117 1237 1455 1359 1793 1495 1220 1113 965 Montana 310 262 240 246 233 205 180 168 241 246 220 227 161 240 234 167 213 212

125
State 1976 1981 1982 1983 1984 1985 1986 1987 1988 1989 1990 1991 1992 1993 1994 1995 1996 1997 Nebraska Nevada 71 59 75 57 42 56 87 69 48 90 66 72 88 72 0 0 0
42 62 89 45 New Jersey New Mexico New York North Carolina North Dakota 65 87 25 0 48 97 Ohio
Oregon 36 0 94 0 0 0 30 0 0 0 24 Pennsylvania Rhode Island 0 0 0 0 0 0 0 0 0 0 0 South Carolina South Dakota 68 14 20 26 24 68 77 59 70 67 63 63 66 66 Tennessee Texas Utah
51 80 88 90 80 99 84 98 Virginia
gton g
Wy g 86 77 98 63 54 24 0 24 40 20 0 23 Total
(
(
573 636 636 558 339 434 348 401 521 439 423 453 444 314 365 352 371 372 119
New Hampshire 145 239 208 148 126 124 118 125 126 137 140 146 110 109 1833 1472 1745 1737 1548 1190 1095 945 1078 1375 1525 1521 1170 1771 1049 924 746 471 376 199 258 306 218 234 182 209 136 173 161 189 133 179 226 156 211 199
5270 4341 4386 4352 4171 3054 2943 2842 3056 3731 3872 4230 5150 4209 3513 3472 3207 3036 1305 1068 1200 953 684 573 543 562 552 627 730 891 734 945 658 625 558 538 360 368 275 238 125 108 159 147 177 142 120 126
2761 2824 2973 2706 1840 1446 1351 1622 1989 2358 2517 2186 2433 2316 1981 2025 1924 1920 Oklahoma 857 958 1097 901 879 588 610 774 783 955 1036 1048 1007 1027 1027 1075 1007 1136
355 165 228 136 151 522 310 2835 3174 3561 3275 2471 2244 1947 1808 2101 2471 2779 2807 2720 2786 2355 2424 1769 1736 118 116 130 100 100 114 291 928 888 935 748 648 588 520 481 676 789 856 824 780 793 747 678 462 527 256 301 295 271
1214 1508 1111 2165 1254 1098 915 1162 1353 1410 1549 1243 1532 1473 1350 1222 891 1105 4773 5098 5670 4869 4325 4036 3257 4030 4103 4484 4827 5183 4609 5095 4610 4278 3963 3486 379 423 428 365 334 281 289 317 444 330 359 400 375 425 174 238 109 225
Vermont 207 177 206 163 104 114 105 104 189 101 1489 1769 1739 1144 1459 1163 1233 1154 1273 1358 1489 1585 1585 1561 1294 1302 1032 1517
Washin 1020 841 878 1071 604 1032 997 581 603 820 657 634 749 663 572 534 469 478 West Vir inia 513 627 675 570 467 390 451 461 555 550 558 616 570 584 412 338 393 398 Wisconsin 1291 1221 1059 892 417 222 197 218 279 232 205 227 278 254 212 271 288 310
omin 114 121 126 112 114 177 58,352 58,960 59,994 55,792 46,314 40,120 38,405 38,293 43,612 50,214 51,526 53,422 52,780 53,277 47,812 43,989 37,607 35,483
Source: Area Resource Training File February 2003 Release), National Center for Health Workforce Analysis, Bureau of Health Professions, Health Resources and Services Administration, Department of Health and Human Services
Note: Data may appear unrealistically low as some LPN/LPN schools withheld data. See User Documentation for the Area Resource Training File February 2003 release) for detail on counties and years with incomplete data.

126
D6. LPN/LPN Programs by State: 1976-1997
State 1976 1981 1982 1983 1984 1985 1986 1987 1988 1989 1990 1991 1992 1993 1994 1995 1996 1997
25 25 25 22 23 22 22 22 22 23 23 23 22 22 22 22 22 22 Alaska 1 1 1 1 0 0 0 0 0 0 0 0 0 0 0 0 1 0 Arizona 14 12 12 13 12 12 10 10 11 13 15 14 13 14 13 13 13 14 Arkansas 30 29 29 29 29 28 27 27 27 27 27 27 27 29 28 28 28 28 California 96 94 95 88 86 81 80 76 75 71 70 69 71 68 70 76 76 80 Colorado 17 18 18 17 14 14 14 14 14 15 15 15 15 17 17 17 16 15 Connecticut 10 10 10 10 10 11 11 11 11 11 11 12 13 13 12 12 12 12 Delaware 5 5 5 5 3 3 4 4 4 4 3 4 4 4 4 3 3 4
3 3 3 3 3 3 3 3 3 4 4 4 4 4 4 4 4 3 Florida 35 36 37 37 35 36 34 34 36 39 41 40 43 43 45 44 43 45 Georgia 53 49 48 48 44 47 46 42 44 42 39 40 40 41 39 40 39 37 Hawaii 4 4 4 4 4 4 4 4 4 4 4 4 4 4 4 4 4 4 Idaho 11 8 8 8 8 7 6 5 5 5 5 5 5 5 5 6 7 5 Illinois 42 44 42 41 41 39 37 37 38 39 38 39 39 40 40 37 37 39 Indiana 17 17 18 19 19 17 18 19 19 21 21 21 22 23 22 22 23 23 Iowa 25 30 30 28 27 25 25 25 25 26 26 26 26 26 26 26 26 28 Kansas 16 18 18 17 17 17 17 17 17 18 18 18 18 18 18 18 18 19 Kentucky 15 16 16 16 17 17 17 17 17 18 18 18 18 18 18 19 19 19 Louisiana 35 37 36 37 37 36 35 35 34 39 39 40 45 47 45 47 47 46 Maine 5 5 5 5 5 5 5 5 5 5 5 5 5 5 5 5 5 5 Maryland 22 20 20 18 18 17 15 17 15 16 16 13 13 15 13 14 15 16 Massachusetts 32 25 26 23 23 22 22 22 21 22 21 20 20 20 20 20 19 20 Michigan 37 37 36 36 33 32 31 29 29 31 31 29 30 29 27 25 28 27 Minnesota 27 27 26 26 27 27 27 26 26 27 28 29 28 25 27 29 31 32
13 13 12 12 12 12 12 13 14 14 14 14 15 15 15 15 15 15 Missouri 33 34 34 35 35 33 32 31 32 36 35 36 37 38 39 41 40 42 Montana 6 5 5 5 5 5 5 5 5 5 5 5 5 5 5 5 5 5 Nebraska 9 9 8 8 8 8 8 8 9 7 7 7 7 7 7 7 7 7
Alabama
District of Columbia
Mississippi

127
State 1976 1981 1982 1983 1984 1985 1986 1987 1988 1989 1990 1991 1992 1993 1994 1995 1996 1997 Nevada 7 5 4 4 4 4 3 3 3 3 2 2 2 2 2 1 1 1
4 5 5 5 5 5 4 3 3 2 2 2 2 2 2 2 2 2 New Jersey 37 31 32 33 31 30 29 27 28 27 26 29 28 25 24 24 23 22 New Mexico 10 9 10 10 9 8 7 7 7 7 8 8 8 8 8 8 9 9 New York 90 89 88 92 89 84 82 84 82 74 78 74 75 71 73 76 76 North Carolina 41 46 46 27 26 26 23 23 27 29 31 32 32 32 31 29 28 28 North Dakota 5 7 7 7 7 5 3 3 3 3 5 5 5 5 5 5 5 5 Ohio 42 46 47 44 43 41 44 46 43 44 42 44 44 46 45 45 46 46
27 33 35 33 27 25 25 27 27 29 29 29 29 28 31 32 32 32 Oregon 12 11 12 12 12 12 11 11 11 11 11 11 11 11 11 11 10 11 Pennsylvania 53 54 56 56 56 53 50 48 50 52 52 52 50 51 51 50 49 47 Rhode Island 1 1 1 1 1 1 1 1 1 1 1 1 1 1 2 1 1 1 South Carolina 34 31 30 29 34 31 24 24 24 24 25 25 27 27 26 28 28 28 South Dakota 6 6 6 6 3 1 1 1 2 2 2 2 2 2 2 2 2 2 Tennessee 7 12 12 24 25 23 22 23 22 23 25 27 27 28 26 26 25 24 Texas 99 Utah 5 6 6 6 6 6 6 6 6 6 7 6 6 6 6 7 7 8
3 3 3 3 3 3 3 3 3 3 3 3 3 3 3 4 4 4 Virginia 59 57 58 55 57 57 58 61 57 61 58 56 53 68 65 67 88 81
gton 28 28 29 29 25 24 23 22 23 24 22 22 23 24 23 27 23 23 g 18 20 20 19 19 19 19 19 19 20 20 20 21 21 21 21 21 19
14 14 14 12 11 9 9 9 9 11 11 11 11 11 11 11 12 12 Wy g 3 6 7 7 7 7 6 6 6 6 6 6 6 6 6 6 5 6 TOTAL
(
(
New Hampshire
106
Oklahoma
158 142 139 127 121 114 106 100 101 102 102 103 106 105 114 119 112
Vermont
WashinWest Vir inia Wisconsin
omin1,318 1,294 1,295 1,248 1,219 1,173 1,128 1,113 1,119 1,153 1,143 1,150 1,157 1,183 1,167 1,193 1,219 1,211
Source: Area Resource Training File February 2003 Release), National Center for Health Workforce Analysis, Bureau of Health Professions, Health Resources and Services Administration, Department of Health and Human Services
Note: Data may appear unrealistically low as some LPN/LPN schools withheld data. See User Documentation for the Area Resource Training File February 2003 release) for detail on counties and years with incomplete data.

128
D7. LPN/LPN Schools by State: 1976-1997
State 1976 1981 1982 1983 1984 1985 1986 1987 1988 1989 1990 1991 1992 1993 1994 1995 1996 1997
25 25 25 22 23 22 22 22 22 23 23 23 22 22 22 22 22 22 Alaska 1 1 1 1 0 0 0 0 0 0 0 0 0 0 0 0 1 0 Arizona 12 12 12 12 12 11 10 10 10 11 14 13 13 13 13 13 12 13 Arkansas 30 28 28 29 29 28 27 27 27 27 27 27 27 29 28 28 28 28 California 93 91 91 84 83 78 78 75 73 70 69 68 69 67 69 74 75 80 Colorado 17 18 18 17 14 14 14 14 14 15 15 15 15 17 17 17 15 15 Connecticut 10 10 10 10 10 11 11 11 11 11 11 12 12 13 12 12 12 12 Delaware 5 5 5 5 3 3 3 3 3 3 3 3 3 3 3 3 3 3
2 2 2 2 2 2 2 2 2 3 3 3 3 3 3 3 3 3 Florida 33 34 35 34 34 34 34 34 36 39 40 39 41 42 41 42 43 43 Georgia 53 49 46 45 43 43 42 40 41 40 37 37 38 38 38 39 38 37 Hawaii 4 4 4 4 4 4 4 4 4 4 4 4 4 4 4 4 4 4 Idaho 11 8 8 8 8 7 6 5 5 5 5 5 5 5 5 5 5 5 Illinois 35 38 36 35 35 34 32 32 33 33 34 35 35 36 36 37 37 37 Indiana 17 17 18 19 19 17 18 19 19 21 21 21 22 22 22 22 23 23 Iowa 25 19 19 27 26 25 25 25 25 26 26 26 26 26 26 26 26 26 Kansas 14 17 17 16 16 16 16 16 16 17 17 17 17 17 17 17 17 18 Kentucky 14 16 16 16 17 17 17 17 17 18 18 18 17 17 17 18 18 18 Louisiana 33 37 36 36 36 35 35 35 34 39 39 40 45 46 45 46 46 46 Maine 5 5 5 5 5 5 5 5 5 5 5 5 5 5 5 5 5 5 Maryland 22 20 20 18 18 17 14 14 15 15 14 12 11 13 11 12 11 13 Massachusetts 32 24 26 23 23 22 22 22 21 22 21 20 20 20 20 20 19 20 Michigan 34 34 33 32 29 28 27 26 26 28 28 27 27 27 27 25 27 27 Minnesota 27 27 26 26 26 26 26 26 26 26 27 25 25 24 24 26 26 26
13 13 12 12 12 12 12 13 14 14 13 14 15 15 15 15 15 15 Missouri 32 34 34 35 35 33 32 31 32 35 35 36 36 38 39 41 40 41 Montana 6 5 5 5 5 5 5 5 5 5 5 5 5 5 5 5 5 5
Alabama
District of Columbia
Mississippi

129
State 1976 1981 1982 1983 1984 1985 1986 1987 1988 1989 1990 1991 1992 1993 1994 1995 1996 1997 Nebraska 9 9 8 8 8 8 8 8 9 7 7 7 7 7 7 7 7 7 Nevada 7 5 4 4 4 4 3 3 3 3 2 2 2 2 2 1 1 1
4 5 5 5 5 5 4 3 3 2 2 2 2 2 2 2 2 2 New Jersey 36 31 32 30 30 30 27 26 26 26 26 26 25 24 23 23 23 22 New Mexico 10 9 10 10 9 8 7 7 7 7 8 8 8 8 8 8 8 8 New York 77 64 63 63 62 61 60 57 58 58 53 53 53 54 54 54 53 51 North Carolina 41 46 46 27 26 26 23 23 27 29 31 32 32 32 31 29 28 28 North Dakota 5 7 7 7 7 5 3 3 3 3 5 5 5 5 5 5 5 5 Ohio 39 46 46 44 41 40 41 41 41 40 40 40 40 41 41 41 41 43
23 28 30 32 27 25 25 27 27 29 29 29 29 28 30 31 31 31 Oregon 12 11 12 12 12 12 11 11 11 11 11 11 11 11 11 11 10 11 Pennsylvania 51 53 55 55 54 52 50 48 50 51 51 51 50 50 50 50 49 47 Rhode Island 1 1 1 1 1 1 1 1 1 1 1 1 1 1 1 1 1 1 South Carolina 31 29 29 27 26 24 20 21 21 22 21 21 23 23 23 23 23 23 South Dakota 6 6 6 6 3 1 1 1 2 2 2 2 2 2 2 2 2 2 Tennessee 7 12 12 24 25 23 22 23 22 23 25 27 27 28 26 26 25 24 Texas 98 97 Utah 5 6 6 6 6 6 6 6 6 6 6 6 6 6 6 7 7 8
3 3 3 3 3 3 3 3 3 3 3 3 3 3 3 4 4 4 Virginia 54 52 52 51 51 49 49 48 48 50 49 49 49 50 53 54 55 55
gton 26 27 28 28 24 23 22 22 22 22 22 22 22 22 22 22 23 23 g 18 20 20 19 19 19 19 19 19 20 20 20 21 21 21 21 21 19
14 14 14 12 11 9 9 9 9 11 11 11 11 11 11 11 12 12 Wy g 3 5 7 7 7 7 6 6 6 6 6 6 6 6 6 6 5 6 TOTAL
(
(
New Hampshire
Oklahoma
155 140 138 125 118 110 103 100 102 102 103 103 104 111 111 111
Vermont
WashinWest Vir inia Wisconsin
omin1,242 1,222 1,222 1,184 1,146 1,100 1,062 1,047 1,057 1,087 1,087 1,086 1,096 1,107 1,106 1,127 1,123 1,129
Source: Area Resource Training File February 2003 Release), National Center for Health Workforce Analysis, Bureau of Health Professions, Health Resources and Services Administration, Department of Health and Human Services
Note: Data may appear unrealistically low as some LPN/LPN schools withheld data. See User Documentation for the Area Resource Training File February 2003 release) for detail on counties and years with incomplete data

Juri 1997 1998 1999 2000 AKAL 17,161 ,906 ,086 ,676 AR 16,890 ,953 ,807 ,917 AS a a 96 72 AZ 9, 9, 8, 9,CA ,150 ,766 ,830 ,383 CO 9, 9, 9, 10,206 CT ,641 ,078 ,061 ,135 DC 3, 2, 2, 2,DE 1, 1, 1, 2,FL 55,162 ,904 ,312 ,899 GA 2, 28,321 ,042 ,042 GU a HI 3, 3, 2, 2,IA 9, 9, 9, 9,ID 3, 3, 3, 4,IL 27,422 ,526 ,864 ,742 IN 23,361 ,102 ,102 ,997 KS 8, 8, 8, 8,KY 14,083 ,285 ,393 ,231 LA 22,149 ,028 ,170 ,369 MA ,186 ,195 ,170 ,445 MD 8, 8, 9, 8,ME 3, 3, 3, 3,MI ,871 ,763 ,626 ,047 MN ,489 ,388 ,442 ,342 MO ,715 ,750 ,683 ,296
a 28 28 50 MS ,979 ,214 ,227 ,315 MT 3, 3, 3, 3,NC ,483 ,658 ,854 ,578 ND 3, 3, 3, 3,NE 6, 6, 6, 6,NH 3, 3, 3, 2,NJ 25,308 ,151 ,443 ,855 NM 3, 3, 3, 3,NV 2, 2, 2, 2,NY 76,919 ,730 ,877 ,820 OH 41,741 ,411 ,468 ,720 OK 14,515 ,942 ,018 ,732 OR 4, 4, 4, 4,PA 59,694 ,968 ,396 ,714 PR a 12,550 ,550 ,550 RI 3, 2, 2, 3,SC 11,331 ,252 ,007 ,559 SD 2, 2, 2, 2,TN 26,425 ,439 ,738 ,421 TX 73,648 ,496 ,648 ,044 UT 3, 3, 3, 3,VA 25,808 ,453 ,747 ,694 VI VT 2, 1, 2, 1,WA 14,184 ,761 ,984 ,869 WI 16,581 ,694 ,585 ,521 WV 7, 6, 6, 6,WY 1, 1, 1, 1,
, , , ,
130
D8. Total Number of Active Licenses by State: 1997-2000
sdiction 845 737 740 827
16 19 16 16 16 16
385 548 812 271 66 65 65 65
735 800 276 11 11 11 11
093 560 675 675 827 770 832 079
52 48 51611 30 30
140 277 277 225 598 357 699 772 573 506 429 658 512 616 007
29 26 28 25 25 25
921 519 039 718 13 14 13 22 21 22
23 18 22 22584 871 603 426 895 750 591 463
32 31 32 28 22 22 22 22 18 21 23 22
MP11 11 12 11
211 226 321 223 21 22 21 21
007 059 073 031 966 417 847 413 165 023 340 989
25 24 22482 437 268 240 408 263 523 945
71 73 69 44 40 42 16 17 16
766 377 299 225 57 56 50
12 12031 935 998 057
15 11 11250 241 211 176
26 25 26 74 74 77
816 394 727 470 26 26 26
182 195 129 178 146 946 136 884
15 13 13 15 14 14
132 592 789 091 093 045 093 120
Total 883 102 919 240 911 332 902 154 a = no information available

131
D9: Summary of Licensing Activities Year 2000
RN LPN/LPN 47,171 Total
RN 3,103,98 1
LPN/LPN Total 4,006,13
5
RN 2,512 LPN/LPN 23 Total * 2,535
New in State 151,982
199,153
Active Licenses
902,154
Graduates of Foreign Nursing Programs

AK AL 2 12 AR 0 1 0 AS AZ 3 CA
25 CT DC DE 0 FL 11 GA GU 9 15 HI IA ID IL IN KS 0 5 KY 1 0 1 LA 0 MA MD 2
0 0 0 MI MN 3 1 1
5 1 3 4 1 13
MS 4 MT NC 14 ND 0 0 NE 0 NH NJ NM 3 2 NV NY OH 3 6 2 OK 18 0 OR 13 PA 6 14 PR RI 2 SC SD 1 TN TX UT VA VI 1 0 VT WA WI 4 WV 3 0 WY
63 89 40 23
132
D10. Number of Graduates of Foreign Nursing Programs Licensed by State
Jurisdiction 1997 1998 1999 2000
CO
ME
MOMP
Total

133
D11. New in State Functions by Jurisdiction: 1997-2000 Examination Examination Examination Examination
1997 1997 1997 1998 1998 1998 1999 1999 1999 2000 2000 2000 JD n n n n n n n n n n n n
perce perce perce perce perce perce perce perce perce perce perce perce nt nt nt nt nt nt nt nt nt nt nt nt
AK 21 0.06 percent
59 0.36 percent
80 0.14 percent
9 percent
66 0.42 percent
75 0.13 percent
24 0.07 percent
69 0.43 percent
93 0.17 percent
17 0.06 59 0.46 76 0.16
AL 930 2.51 346 2.11 1276 2.16 1,029 2.37 306 1.96 1,335 2.26 824 2.39 242 1.50 1,066 1.90 739 2.51 240 1.87 979 2.08 percent percent percent percent percent percent percent percent percent
AR 717 1.94 322 1.96 1039 1.76 697 1.60 271 1.73 968 1.64 711 2.06 350 2.17 1,061 1.89 662 2.24 310 2.42 972 2.06 percent percent percent percent percent percent percent percent percent
AS a a a a a a a a a a a a 4 1 0.01 5 4 0 0 4 0.01 percent percent percent
AZ 570 1.54 516 3.14 1086 1.84 506 1.16 1,200 7.68 1,706 2.89 390 1.13 420 2.61 810 1.44 498 1.69 542 4.23 1,040 2.2 percent percent percent percent percent percent percent percent percent
CA 3489 9.42 469 2.86 3958 6.69 3,177 7.31 486 3.11 3,663 6.20 3,162 9.18 482 2.99 3,644 6.49 3,158 10.71 468 3.65 3,626 7.69 VN percent percent percent percent percent percent percent percent percent CO 804 2.17
percent 431 2.63
percent 1235 2.09
percent 675 1.55
percent 380 2.43
percent 1,055 1.79
percent 2,308 6.70
percent 1,558 9.66
percent 3,866 6.88
percent 477 1.62 357 2.79 834 1.77
CT 355 0.96 132 0.80 487 0.82 304 0.70 123 0.79 427 0.72 100 0.29 170 1.05 270 0.48 369 1.25 200 1.56 569 1.21 percent percent percent percent percent percent percent percent percent
DC 0 0.00 0 0.00 209 0.35 38 0.09 133 0.85 171 0.29 a a a a 122 0.22 a a a percent percent percent percent percent percent percent
DE 69 0.19 74 0.45 143 0.24 117 0.27 105 0.67 222 0.38 114 0.33 79 0.49 193 0.34 101 0.34 97 0.76 198 0.42 percent percent percent percent percent percent percent percent percent
FL 2257 6.10 1349 8.22 3606 6.10 2,107 4.85 1,305 8.35 3,412 5.78 2,249 6.53 1,299 8.06 3,548 6.32 1,562 5.3 993 7.75 2,555 5.42 percent percent percent percent percent percent percent percent percent
GA 1001 2.70 762 4.64 1763 2.98 1,040 2.39 808 5.17 1,848 3.13 824 2.39 825 5.12 1,649 2.94 a a a PN percent percent percent percent percent percent percent percent percent GU a a a a a a 9
percent 9
percent 18 0.03
percent 12 0.03
percent 8 0.05
percent 20 0.04
percent a a a
HI 115 0.31 212 1.29 327 0.55 200 0.46 133 0.85 333 0.56 188 0.55 87 0.54 275 0.49 131 0.44 159 1.24 290 0.61 percent percent percent percent percent percent percent percent percent
IA 843 2.28 187 1.14 1030 1.74 727 1.67 183 1.17 910 1.54 695 2.02 186 1.15 881 1.57 667 2.26 175 1.37 842 1.78 percent percent percent percent percent percent percent percent percent
ID 146 0.39 96 0.59 242 0.41 121 0.28 65 0.42 186 0.31 164 0.48 81 0.50 245 0.44 172 0.58 95 0.74 267 0.57 percent percent percent percent percent percent percent percent percent
IL 1102 2.98 199 1.21 1301 2.20 1,413 3.25 25 0.16 1,438 2.43 a a a a 2.60 a a 1,241 2.63 percent percent percent percent percent percent percent
IN 1195 3.23 362 2.21 1557 2.63 1,132 2.61 335 2.14 1,467 2.48 a a a a a a 963 3.27 342 2.67 1,305 2.77 percent percent percent percent percent percent
KS 574 1.55 360 2.19 934 1.58 587 1.35 324 2.07 911 1.54 545 1.58 295 1.83 840 1.50 546 1.85 273 2.13 819 1.74 percent percent percent percent percent percent percent percent percent
Endorsement New in State Endorsement New in State Endorsement New in State Endorsement New in State
0.02
0.01 0.01 0.01
0.02 0.06
1,458

134
Examination Examination Examination Examination 1997 1997 1997 1998 1998 1998 1999 1999 1999 2000 2000 2000
KY 633 1.71 percent
289 1.76 percent
922 1.56 percent
638 1.47 percent
326 2.09 percent
964 1.63 percent
696 2.02 percent
261 1.62 percent
957 1.70 percent
569 1.93 274 2.14 843 1.79
LA 1192 3.22 346 2.11 1538 2.60 1,006 2.32 267 1.71 1,273 2.16 858 2.49 266 1.65 1,124 2.00 1,005 3.41 189 1.47 1,194 2.53 PN percent percent percent percent percent percent percent percent percent MA 755 2.04
percent 184 1.12
percent 939 1.59
percent 782 1.80
percent 182 1.17
percent 964 1.63
percent 678 1.97
percent 191 1.18
percent 869 1.55
percent 646 2.19 170 1.33 816 1.73
MD 369 1.00 329 2.01 698 1.18 324 0.75 419 2.68 743 1.26 328 0.95 428 2.65 756 1.35 344 1.17 595 4.64 939 1.99 percent percent percent percent percent percent percent percent percent
ME 20 0.05 78 0.48 98 0.17 26 0.06 59 0.38 85 0.14 11 0.03 84 0.52 95 0.17 10 0.03 89 0.69 99 0.21 percent percent percent percent percent percent percent percent percent
MI 1220 3.29 273 1.66 1493 2.52 1,165 2.68 277 1.77 1,442 2.44 1,039 3.02 276 1.71 1,315 2.34 860 2.92 224 1.75 1,084 2.3 percent percent percent percent percent percent percent percent percent
MN 1053 2.84 179 1.09 1232 2.08 1,027 2.36 166 1.06 1,193 2.02 1,014 2.94 168 1.04 1,182 2.10 862 2.92 195 1.52 1,057 2.24 percent percent percent percent percent percent percent percent percent
MO 584 1.58 1226 7.47 1810 3.06 1,027 2.36 611 3.91 1,638 2.77 1,012 2.94 424 2.63 1,436 2.56 1,115 3.78 602 4.7 3.64 percent percent percent percent percent percent percent percent percent
MP a a a a a a 2 1 3 a a a a a a 12 0.04 2 percent percent percent
MS 730 1.97 252 1.54 982 1.66 695 1.60 210 1.34 905 1.53 582 1.69 191 1.18 773 1.38 535 1.81 173 1.35 708 1.5 percent percent percent percent percent percent percent percent percent
MT 119 0.32 59 0.36 178 0.30 140 0.32 51 0.33 191 0.32 126 0.37 92 0.57 218 0.39 66 0.22 94 0.73 160 0.34 percent percent percent percent percent percent percent percent percent
NC 1016 2.74 933 5.69 1949 3.30 957 2.20 833 5.33 1,790 3.03 874 2.54 718 4.45 1,592 2.83 875 2.97 727 5.67 1,602 3.4 percent percent percent percent percent percent percent percent percent
ND 53 0.14 17 0.10 70 0.12 142 0.33 67 0.43 209 0.35 114 0.33 63 0.39 177 0.32 121 0.41 63 0.49 184 0.39 percent percent percent percent percent percent percent percent percent
NE 292 0.79 120 0.73 412 0.70 230 0.53 104 0.67 334 0.57 236 0.69 132 0.82 368 0.66 262 0.89 120 0.94 382 0.81 percent percent percent percent percent percent percent percent percent
NH 177 0.48 112 0.68 289 0.49 180 0.41 125 0.80 305 0.52 195 0.57 125 0.78 320 0.57 162 0.55 147 1.15 309 0.66 percent percent percent percent percent percent percent percent percent
NJ 844 2.28 170 1.04 1014 1.71 700 1.61 182 1.17 882 1.49 561 1.63 224 1.39 785 1.40 542 1.84 83 0.65 625 1.32 percent percent percent percent percent percent percent percent percent
NM 193 0.52 206 1.26 399 0.67 180 0.41 167 1.07 347 0.59 173 0.50 170 1.05 343 0.61 159 0.54 139 1.08 298 0.63 percent percent percent percent percent percent percent percent percent
NV 110 0.30 254 1.55 364 0.62 24 0.06 231 1.48 255 0.43 24 0.07 265 1.64 289 0.51 28 0.09 229 1.79 257 0.54 percent percent percent percent percent percent percent percent percent
NY 0.00 0.00 5489 9.28 5,235 12.05 a a 5,235 8.86 a a a a 7.15 a a 3,210 6.81 percent percent percent percent percent percent
OH 1677 4.53 420 2.56 2097 3.55 1,656 3.81 507 3.25 2,163 3.66 1,470 4.27 442 2.74 1,912 3.40 1,391 4.72 425 3.32 1,816 3.85 percent percent percent percent percent percent percent percent percent
OK 1340 3.62 423 2.58 1763 2.98 1,300 2.99 354 2.27 1,654 2.80 1,495 4.34 292 1.81 1,787 3.18 1,158 3.93 220 1.72 1,378 2.92 percent percent percent percent percent percent percent percent percent
OR 138 0.37 106 0.65 244 0.41 259 0.60 75 0.48 334 0.57 245 0.71 226 1.40 471 0.84 234 0.79 130 1.01 364 0.77 percent percent percent percent percent percent percent percent percent
PA 1669 4.51 408 2.49 2077 3.51 1,584 3.65 345 2.21 1,929 3.27 1,249 3.63 440 2.73 1,689 3.01 1,155 3.92 396 3.09 1,551 3.29 percent percent percent percent percent percent percent percent percent
Endorsement New in State Endorsement New in State Endorsement New in State Endorsement New in State
1,717
0.00 0.01 0.01 0.02 14 0.03
4,015

Examination Examination Examination Examination 1997 1997 1997 1998 1998 1998 1999 1999 1999 2000 2000 2000
PR a a a a a a 1,653 3.81 percent
1 percent
1,654 2.80 percent
1,705 4.95 percent
0 0.00 percent
1,705 3.04 percent
a a a
RI 61 0.16 58 0.35 119 0.20 27 0.06 40 0.26 67 0.11 40 0.12 65 0.40 105 0.19 8 percent percent percent percent percent percent percent percent percent
SC 497 1.34 422 2.57 919 1.55 468 1.08 398 2.55 866 1.47 436 1.27 410 2.54 846 1.51 401 1.36 285 2.22 686 1.45 percent percent percent percent percent percent percent percent percent
SD 74 0.20 62 0.38 136 0.23 77 0.18 51 0.33 128 0.22 66 0.19 50 0.31 116 0.21 70 0.24 58 0.45 128 0.27 percent percent percent percent percent percent percent percent percent
TN 1017 2.75 582 3.55 1599 2.70 942 2.17 729 4.67 1,671 2.83 827 2.40 725 4.50 1,552 2.76 806 2.73 600 4.68 1,406 2.98 percent percent percent percent percent percent percent percent percent
TX 4055 10.95 1065 6.49 5120 8.66 3,722 8.57 1,073 6.87 4,795 8.12 3,385 9.83 999 6.20 4,384 7.81 3,321 11.26 883 6.89 4,204 8.91 VN percent percent percent percent percent percent percent percent percent UT 434 1.17
percent 200 1.22
percent 634 1.07
percent 641 1.48
percent 80 0.51
percent 721 1.22
percent 563 1.63
percent 99 0.61
percent 662 1.18
percent 645 2.19 62 0.48 707 1.5
VA 1152 3.11 645 3.93 1797 3.04 1,051 2.42 610 3.91 1,661 2.81 945 2.74 543 3.37 1,488 2.65 949 3.22 576 4.49 1,525 3.23 percent percent percent percent percent percent percent percent percent
VI 10 0.03 15 0.09 25 0.04 6 32 0.20 38 0.06 5 18 0.11 23 0.04 a a 24 0.05 percent percent percent percent percent percent percent percent percent
VT 59 0.16 70 0.43 129 0.22 81 0.19 69 0.44 150 0.25 81 0.24 343 2.13 424 0.76 41 0.14 81 0.63 122 0.26 percent percent percent percent percent percent percent percent percent
WA 510 1.38 622 3.79 1132 1.91 800 1.84 257 1.65 1,057 1.79 352 1.02 677 4.20 1,029 1.83 612 2.08 336 2.62 948 2.01 percent percent percent percent percent percent percent percent percent
WI 288 0.78 137 0.83 425 0.72 317 0.73 211 1.35 528 0.89 286 0.83 285 1.77 571 1.02 a a 388 0.82 percent percent percent percent percent percent percent percent percent
WV 446 1.20 212 1.29 658 1.11 429 0.99 210 1.34 639 1.08 417 1.21 203 1.26 620 1.10 420 1.42 181 1.41 601 1.27 PN percent percent percent percent percent percent percent percent percent
WY 55 0.15 percent
58 0.35 percent
113 0.19 percent
56 0.13 percent
43 0.28 percent
99 0.17 percent
38 0.11 percent
75 0.47 percent
113 0.20 percent
40 0.14 80 0.62 120 0.25
Tot 100.00 100.00 100.00 43,437 100.00 15,620 100.00 59,057 100.00 34,440 100.00 16,122 100.00 56,157 100.00 29,490 100 12,818 100 47,171 100 al percent percent percent percent percent percent percent percent percent
( / )
135
Endorsement New in State Endorsement New in State Endorsement New in State Endorsement New in State
0.01
0.03 80 0.62 88 0.19
0.01 0.01
37030 16408 59136
a = no information available Copyright 1996-2001, National Council of State Boards of Nursing, Inc. http:/ ncsbn.org
Note: New in State total for 2000 includes new in State processing of 4,863 licenses not available by specific function category.

136
D12. Maintenance Functions by Jurisdiction: 1997-1998 Renewal 1997 ReinStatement 1997 Total Maintenance 1997 Renewal 1998 ReinStatement 1998
JD n percent n percent AK 628 0.12 45 0.50 percent
percent AL 374 0.07 3 0.03 percent
percent AR 7816 1.48 2 0.02 percent
percent AS a a a a AZ 4080 0.77 4 0.04 percent
percent CAVN 29969 5.68 7 0.08 percent
percent CO 7500 1.42 300 3.32 percent
percent CT 11115 2.11 39 0.43 percent
percent DC 3080 0.58 13 0.14 percent
percent DE 1680 0.32 67 0.74 percent
percent FL a a 3 0.03 percent
GAPN 2471 0.47 140 1.55 percent percent
GU a a a a
HI 2898 0.55 0 0.00 percent percent
IA 2332 0.44 103 1.14 percent percent
ID 2556 0.48 24 0.27 percent percent
IL 26640 5.05 1629 18.03 percent percent
IN 21804 4.13 0 0.00 percent
Total Maintenance 1998 n percent n percent n percent n percent
673 0.13 percent 0 0.00 a a a a percent
377 0.07 percent 16,147 3.18 4 0.06 percent 16,151 3.14 percent percent
7818 1.46 percent 7,629 1.50 6 0.09 percent 7,635 1.48 percent percent
a a a a a a a a 4084 0.76 percent 4,800 0.94 a a 4,800 0.93 percent
percent 29976 5.59 percent 29,802 5.87 3 0.05 percent 29,805 5.79 percent
percent 7800 1.45 percent 7,600 1.50 200 3.06 percent 7,800 1.52 percent
percent 11154 2.08 percent 11,078 2.18 42 0.64 percent 11,120 2.16 percent
percent 3093 0.58 percent 3,423 0.67 a a 3,423 0.66 percent
percent 1747 0.33 percent 1,770 0.35 54 0.83 percent 1,824 0.35 percent
percent 3 0.00 percent 54,000 10.63 3 0.05 percent 54,003 10.49 percent
percent 2611 0.49 percent 0 0.00 211 3.22 percent 211 0.04 percent
percent a a 122 0.02 a a 122 0.02 percent
percent 2898 0.54 percent 3,298 0.65 a a 3,298 0.64 percent
percent 2435 0.45 percent 2,346 0.46 102 1.56 percent 2,448 0.48 percent
percent 2580 0.48 percent 3,236 0.64 32 0.49 percent 3,268 0.63 percent
percent 28269 5.27 percent 579 0.11 509 7.78 percent 1,088 0.21 percent
percent 21804 4.06 percent 0 0.00 a a a a

137
Renewal 1997 ReinStatement 1997 Total Maintenance 1997 Renewal 1998 ReinStatement 1998 Total Maintenance 1998 percent
KS 3180 0.60 404 4.47 percent percent
KY 0 0.00 148 1.64 percent percent
LAPN 19708 3.73 903 10.00 percent percent
MA 22200 4.21 47 0.52 percent percent
MD 7841 1.49 0.00 percent percent
ME 1635 0.31 111 1.23 percent percent
MI 18612 3.53 307 3.40 percent percent
MN a a a a
MO 21179 4.01 325 3.60 percent percent
MP a a a a
MS 0 0.00 218 2.41 percent percent
MT 3077 0.58 44 0.49 percent percent
NC 8426 1.60 530 5.87 percent percent
ND 1418 0.27 a a percent
NE 0 0.00 59 0.65 percent percent
NH 987 0.19 92 1.02 percent percent
NJ 391 0.07 148 1.64 percent percent
NM 1332 0.25 0.00 percent percent
NV 1104 0.21 0.00 percent
percent 3584 0.67 percent 2,988 0.59 395 6.04 percent 3,383 0.66 percent
percent 148 0.03 percent 13,344 2.63 243 3.71 percent 13,587 2.64 percent
percent 20611 3.84 percent 19,755 3.89 1,000 15.28 20,755 4.03 percent
percent percent 22247 4.15 percent 9,097 1.79 10 0.15 percent 9,107 1.77 percent
percent 7841 1.46 percent 8,128 1.60 0 0.00 percent 8,128 1.58 percent
percent 1746 0.33 percent 1,628 0.32 85 1.30 percent 1,713 0.33 percent
percent 18919 3.53 percent 14,616 2.88 0 0.00 percent 14,616 2.84 percent
percent a a 9,828 1.93 287 4.39 percent 10,115 1.96 percent
percent 21504 4.01 percent 21,297 4.19 126 1.93 percent 21,423 4.16 percent
percent a a 5 0.00 1 0.02 percent 6 0.00 percent
percent 218 0.04 percent 11,024 2.17 674 10.30 11,698 2.27 percent
percent percent 3121 0.58 percent 3,066 0.60 52 0.79 percent 3,118 0.61 percent
percent 8956 1.67 percent 10,010 1.97 524 8.01 percent 10,534 2.05 percent
percent 1418 0.26 percent 1,480 0.29 63 0.96 percent 1,543 0.30 percent
percent 59 0.01 percent 6,736 1.33 65 0.99 percent 6,801 1.32 percent
percent 1079 0.20 percent 985 0.19 90 1.38 percent 1,075 0.21 percent
percent 539 0.10 percent 127 0.02 32 0.49 percent 159 0.03 percent
percent 1332 0.25 percent 1,289 0.25 a a 1,289 0.25 percent
percent 1104 0.21 percent 1,085 0.21 a a 1,085 0.21 percent

138
VI
Renewal 1997 ReinStatement 1997 Total Maintenance 1997 Renewal 1998 ReinStatement 1998 Total Maintenance 1998 percent
NY 71430 13.54 0.00 percent percent
OH 38904 7.37 1628 18.02 percent percent
OK 14077 2.67 217 2.40 percent percent
OR 1865 0.35 8 0.09 percent percent
PA 55000 10.42 300 3.32 percent percent
PR a a a a
RI 1446 0.27 a a percent
SC 10198 1.93 214 2.37 percent percent
SD 1078 0.20 39 0.43 percent percent
TN 13200 2.50 527 5.83 percent percent
TXVN 36463 6.91 a a percent
UT a a 60 0.66 percent
VA 12000 2.27 a a percent
147 0.03 10 0.11 percent percent
VT 2017 0.38 a a percent
WA 10341 1.96 60 0.66 percent percent
WI 16156 3.06 208 2.30 percent percent
WVPN 6435 1.22 39 0.43 percent percent
WY 875 0.17 9 0.10 percent
percent 71430 13.31 percent 23,671 4.66 a a 23,671 4.60 percent
percent 40532 7.55 percent 0 0.00 507 7.75 percent 507 0.10 percent
percent 14294 2.66 percent 16,942 3.33 0 0.00 percent 16,942 3.29 percent
percent 1873 0.35 percent 2,188 0.43 0 0.00 percent 2,188 0.43 percent
percent 55300 10.30 percent 52,000 10.23 200 3.06 percent 52,200 10.14 percent
percent a a 10,896 2.14 a a 10,896 2.12 percent
percent 1446 0.27 percent 1,469 0.29 a a 1,469 0.29 percent
percent 10412 1.94 percent 14,331 2.82 55 0.84 percent 14,386 2.79 percent
percent 1117 0.21 percent 1,012 0.20 49 0.75 percent 1,061 0.21 percent
percent 13727 2.56 percent 12,000 2.36 570 8.71 percent 12,570 2.44 percent
percent 36463 6.79 percent 35,935 7.07 a a 35,935 6.98 percent
percent 60 0.01 percent 3,116 0.61 a a 3,116 0.61 percent
percent 12000 2.24 percent 13,226 2.60 a a 13,226 2.57 percent
percent 157 0.03 percent a a a a 157 0.03 percent
2017 0.38 percent 1,811 0.36 0 0.00 percent 1,811 0.35 percent percent
10401 1.94 percent 14,736 2.90 10 0.15 percent 14,746 2.86 percent percent
16364 3.05 percent 15,166 2.98 104 1.59 percent 15,270 2.97 percent percent
6474 1.21 percent 6,358 1.25 234 3.58 percent 6,592 1.28 percent percent
884 0.16 percent 943 0.19 3 0.05 percent 946 0.18 percent

139
ReinStatement 1997 ReinStatement 1998Renewal 1997 Total Maintenance 1997 Renewal 1998 Total Maintenance 1998 percent percent
Total 527665 100.00 percent
9034 100.00 percent
536699 100.00 percent
508,118 100.00 percent
6,545 100.00 percent
514,820 100.00 percent
a = no information available
Copyright 1996-2001, National Council of State Boards of Nursing, Inc. (http://ncsbn.org)

140
D13. Total Licenses Processed by Jurisdiction: 1997-1998 JD New in State 1997 Maintenance 1997 Total Processed 1997 New in State 1998 Maintenance 1998 Total Processed 1998
n percent n percent n percent n percent n percent n percent AK 80 0.14 percent 673 0.13 percent 753 0.13 percent 75 0.13 percent 0 0.00 75 0.01 percent
percent AL 1,276 2.16 percent 377 0.07 percent 1,653 0.28 percent 1,335 2.26 percent 16,151 3.14 17,486 3.05 percent
percent AR 1,039 1.76 percent 7,818 1.46 percent 8,857 1.49 percent 968 1.64 percent 7,635 1.48 8,603 1.50 percent
percent AS a a a a a a a a a a a a AZ 1,086 1.84 percent 4,084 0.76 percent 5,170 0.87 percent 1,706 2.89 percent 4,800 0.93 6,506 1.13 percent
percent CAVN 3,958 6.69 percent 29,976 5.59 percent 33,934 5.70 percent 3,663 6.20 percent 29,805 5.79 33,468 5.83 percent
percent CO 1,235 2.09 percent 7,800 1.45 percent 9,035 1.52 percent 1,055 1.79 percent 7,800 1.52 8,855 1.54 percent
percent CT 487 0.82 percent 11,154 2.08 percent 11,641 1.95 percent 427 0.72 percent 11,120 2.16 11,547 2.01 percent
percent DC 209 0.35 percent 3,093 0.58 percent 3,302 0.55 percent 171 0.29 percent 3,423 0.66 3,594 0.63 percent
percent DE 143 0.24 percent 1,747 0.33 percent 1,890 0.32 percent 222 0.38 percent 1,824 0.35 2,046 0.36 percent
percent FL 3,606 6.10 percent 3 0.00 percent 3,609 0.61 percent 3,412 5.78 percent 54,003 10.49 57,415 10.00 percent
percent GAPN 1,763 2.98 percent 2,611 0.49 percent 4,374 0.73 percent 1,848 3.13 percent 211 0.04 2,059 0.36 percent
percent GU a a a a a a 18 0.03 percent 122 0.02 140 0.02 percent
percent HI 327 0.55 percent 2,898 0.54 percent 3,225 0.54 percent 333 0.56 percent 3,298 0.64 3,631 0.63 percent
percent IA 1,030 1.74 percent 2,435 0.45 percent 3,465 0.58 percent 910 1.54 percent 2,448 0.48 3,358 0.59 percent
percent ID 242 0.41 percent 2,580 0.48 percent 2,822 0.47 percent 186 0.31 percent 3,268 0.63 3,454 0.60 percent
percent IL 1,301 2.20 percent 28,269 5.27 percent 29,570 4.96 percent 1,438 2.43 percent 1,088 0.21 2,526 0.44 percent
percent IN 1,557 2.63 percent 21,804 4.06 percent 23,361 3.92 percent 1,467 2.48 percent 0 0.00 1,467 0.26 percent

KS 934 3,584
KY 922 148
LAPN 1,538 20,611 22,149
MA 939 22,247 23,186
MD 698 7,841
ME 98 1,746
MI 1,493 18,919 20,412
MN 1,232 0
MO 1,810 21,504 23,314
a a a a a a 6 9
MS 982 218
MT 178 3,121
NC 1,949 8,956 10,905
ND 70 1,418
NE 412 59 471
NH 289 1,079
NJ 1,014 539
NM 399 1,332
NV 364 1,104
141
JD New in State 1997 Maintenance 1997 Total Processed 1997 New in State 1998 Maintenance 1998 Total Processed 1998 percent
1.58 percent 0.67 percent 4,518 0.76 percent 911 1.54 percent 3,383 0.66 percent
4,294 0.75 percent
1.56 percent 0.03 percent 1,070 0.18 percent 964 1.63 percent 13,587 2.64 percent
14,551 2.54 percent
2.60 percent 3.84 percent 3.72 percent 1,273 2.16 percent 20,755 4.03 percent
22,028 3.84 percent
1.59 percent 4.15 percent 3.89 percent 964 1.63 percent 9,107 1.77 percent
10,071 1.75 percent
1.18 percent 1.46 percent 8,539 1.43 percent 743 1.26 percent 8,128 1.58 percent
8,871 1.55 percent
0.17 percent 0.33 percent 1,844 0.31 percent 85 0.14 percent 1,713 0.33 percent
1,798 0.31 percent
2.52 percent 3.53 percent 3.43 percent 1,442 2.44 percent 14,616 2.84 percent
16,058 2.80 percent
2.08 percent 0.00 percent 1,232 0.21 percent 1,193 2.02 percent 10,115 1.96 percent
11,308 1.97 percent
3.06 percent 4.01 percent 3.91 percent 1,638 2.77 percent 21,423 4.16 percent
23,061 4.02 percent
MP 3 0.01 percent 0.00 percent
0.00 percent
1.66 percent 0.04 percent 1,200 0.20 percent 905 1.53 percent 11,698 2.27 percent
12,603 2.20 percent
0.30 percent 0.58 percent 3,299 0.55 percent 191 0.32 percent 3,118 0.61 percent
3,309 0.58 percent
3.30 percent 1.67 percent 1.83 percent 1,790 3.03 percent 10,534 2.05 percent
12,324 2.15 percent
0.12 percent 0.26 percent 1,488 0.25 percent 209 0.35 percent 1,543 0.30 percent
1,752 0.31 percent
0.70 percent 0.01 percent 0.08 percent 334 0.57 percent 6,801 1.32 percent
7,135 1.24 percent
0.49 percent 0.20 percent 1,368 0.23 percent 305 0.52 percent 1,075 0.21 percent
1,380 0.24 percent
1.71 percent 0.10 percent 1,553 0.26 percent 882 1.49 percent 159 0.03 percent
1,041 0.18 percent
0.67 percent 0.25 percent 1,731 0.29 percent 347 0.59 percent 1,289 0.25 percent
1,636 0.29 percent
0.62 percent 0.21 percent 1,468 0.25 percent 255 0.43 percent 1,085 0.21 1,340 0.23 percent

NY 5,489 76,919
OH 2,097 40,532 42,629
OK 1,763 14,294 16,057
OR 244 1,873
PA 2,077 57,377
a a a a a a
RI 119 1,446
SC 919 10,412 11,331
SD 136 1,117
TN 1,599 13,727 15,326
TXVN 5,120 36,463 41,583
UT 634 60 694
VA 1,797 12,000 13,797
VI 25 157 182
VT 129 2,017
WA 1,132 10,401 11,533
WI 425 16,364 16,789
WVPN 658 6,474
WY 113 884 997
142
JD New in State 1997 Maintenance 1997 Total Processed 1997 New in State 1998 Maintenance 1998 Total Processed 1998 percent
9.28 percent 71,430 13.31 percent 12.91 percent 5,235 8.86 percent 23,671 4.60 percent
28,906 5.04 percent
3.55 percent 7.55 percent 7.15 percent 2,163 3.66 percent 507 0.10 percent
2,670 0.47 percent
2.98 percent 2.66 percent 2.69 percent 1,654 2.80 percent 16,942 3.29 percent
18,596 3.24 percent
0.41 percent 0.35 percent 2,117 0.36 percent 334 0.57 percent 2,188 0.43 percent
2,522 0.44 percent
3.51 percent 55,300 10.30 percent 9.63 percent 1,929 3.27 percent 52,200 10.14 percent
54,129 9.43 percent
PR 1,654 2.80 percent 10,896 2.12 percent
12,550 2.19 percent
0.20 percent 0.27 percent 1,565 0.26 percent 67 0.11 percent 1,469 0.29 percent
1,536 0.27 percent
1.55 percent 1.94 percent 1.90 percent 866 1.47 percent 14,386 2.79 percent
15,252 2.66 percent
0.23 percent 0.21 percent 1,253 0.21 percent 128 0.22 percent 1,061 0.21 percent
1,189 0.21 percent
2.70 percent 2.56 percent 2.57 percent 1,671 2.83 percent 12,570 2.44 percent
14,241 2.48 percent
8.66 percent 6.79 percent 6.98 percent 4,795 8.12 percent 35,935 6.98 percent
40,730 7.10 percent
1.07 percent 0.01 percent 0.12 percent 721 1.22 percent 3,116 0.61 percent
3,837 0.67 percent
3.04 percent 2.24 percent 2.32 percent 1,661 2.81 percent 13,226 2.57 percent
14,887 2.59 percent
0.04 percent 0.03 percent 0.03 percent 38 0.06 percent 157 0.03 percent
195 0.03 percent
0.22 percent 0.38 percent 2,146 0.36 percent 150 0.25 percent 1,811 0.35 percent
1,961 0.34 percent
1.91 percent 1.94 percent 1.94 percent 1,057 1.79 percent 14,746 2.86 percent
15,803 2.75 percent
0.72 percent 3.05 percent 2.82 percent 528 0.89 percent 15,270 2.97 percent
15,798 2.75 percent
1.11 percent 1.21 percent 7,132 1.20 percent 639 1.08 percent 6,592 1.28 percent
7,231 1.26 percent
0.19 percent 0.16 percent 0.17 percent 99 0.17 percent 946 0.18 1,045 0.18 percent
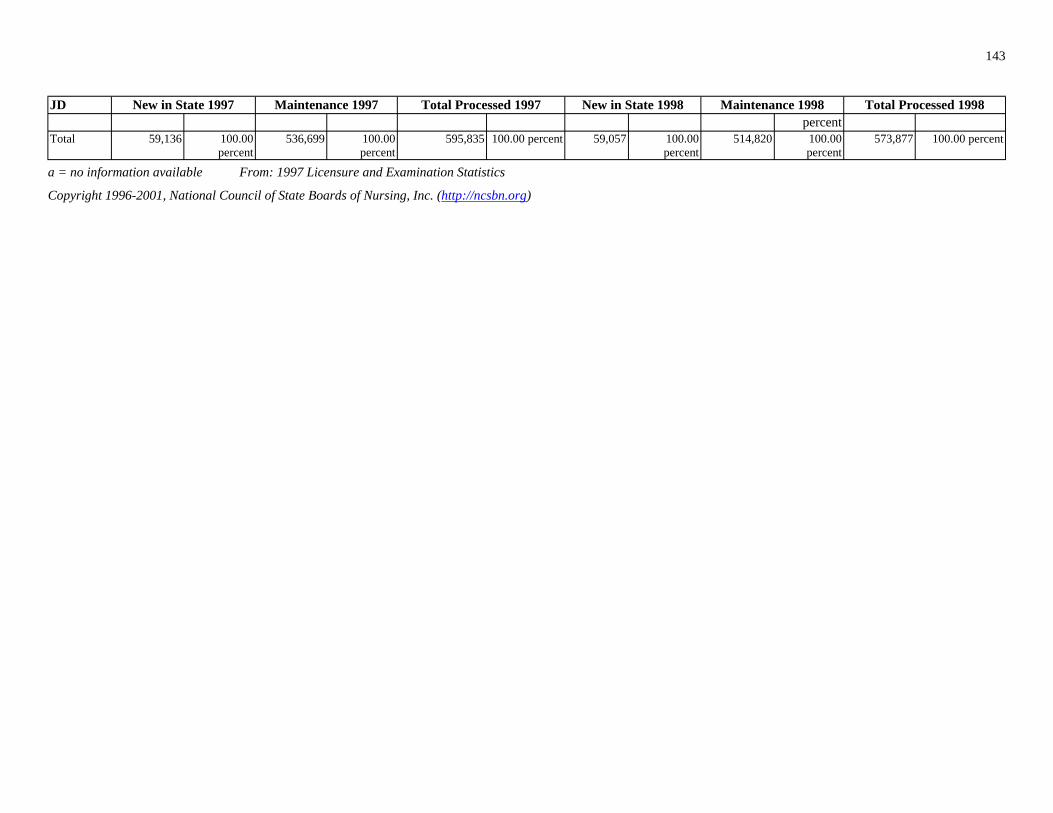
143
JD New in State 1997 Maintenance 1997 Total Processed 1997 New in State 1998 Maintenance 1998 Total Processed 1998
Total 59,136 100.00 536,699 100.00 percent percent
percent 595,835 100.00 percent 59,057 100.00 514,820 100.00 573,877 100.00 percent
percent percent
a = no information available From: 1997 Licensure and Examination Statistics
Copyright 1996-2001, National Council of State Boards of Nursing, Inc. (http://ncsbn.org)

144
1997-2000
1997 1997 1997 1998 1998 1998 1999 1999 1999 2000 2000 2000 Jurisdiction No. of
Candidates No.
Passing percent Passing
No. of Candidates
No. Passing
percent Passing
No. of Candidates
No. Passing
percent Passing
No. of Candidates
No. Passing
percent Passing
AL
AK 0 2 2 1 1 0
AS 4 2 2 0 8 4 3
AZ
AR
DE
DC
FL
GA
GU 0 0 0 1 1 7 3
HI
ID
IL
D14. Number of Candidates Taking NCLEX-PN® Examination and Percent Passing for First-Time Candidates Educated in Member Board Jurisdictions:
1,277 1,053 82.5 percent
1,113 899 80.8 percent
839 688 82.0 percent
883 695 78.7 percent
0 0.0 percent 100.0 percent
100.0 percent
0 0.0 percent
50.0 percent
0.0 percent 0 0.0 percent 75.0 percent
566 527 93.1 percent
458 433 94.5 percent
530 494 93.2 percent
513 463 90.3 percent
816 705 86.4 percent
708 611 86.3 percent
645 571 88.5 percent
708 618 87.3 percent
CA 3,349 2,657 79.3 percent
3,176 2,429 76.5 percent
2,898 2,098 72.4 percent
3,267 2,343 71.7 percent
CO 577 524 90.8 percent
554 507 91.5 percent
489 457 93.5 percent
555 513 92.4 percent
CT 319 310 97.2 percent
348 323 92.8 percent
357 334 93.6 percent
100 76 76.0 percent
164 143 87.2 percent
154 134 87.0 percent
140 117 83.6 percent
105 86 81.9 percent
165 101 61.2 percent
161 105 65.2 percent
260 164 63.1 percent
334 159 47.6 percent
2,266 2,032 89.7 percent
2,299 2,022 88.0 percent
2,211 1,888 85.4 percent
2,046 1,731 84.6 percent
1,120 980 87.5 percent
992 872 87.9 percent
957 825 86.2 percent
901 750 83.2 percent
0 0.0 percent 0.0 percent 100.0 percent
42.9 percent
227 200 88.1 percent
190 162 85.3 percent
182 157 86.3 percent
160 144 90.0 percent
125 123 98.4 percent
156 147 94.2 percent
160 151 94.4 percent
108 101 93.5 percent
1,335 1,154 86.4 1,215 1,043 85.8 1,121 939 83.8 1,042 876 84.1

1997 1997 1997 1998 1998 1998 1999 1999 1999 2000 2000 2000 Jurisdiction No. of
Candidates No.
Passing percent Passing
No. of Candidates
No. Passing
percent Passing
No. of Candidates
No. Passing
percent Passing
No. of Candidates
No. Passing
percent Passing
IN
IA
KS
KY
LA
23 22 9 6 13 13 17 16
0 1 1 0 0
99 94
NE
NV 59 57 18 18 15 15 19 18
NH 95 82
145
percent percent percent percent 1,112 1,030 92.6
percent 1,119 1,029 92.0
percent 990 894 90.3
percent 977 882 90.3
percent 842 775 92.0
percent 737 657 89.1
percent 762 690 90.6
percent 681 622 91.3
percent 605 573 94.7
percent 575 520 90.4
percent 557 500 89.8
percent 577 511 88.6
percent 691 633 91.6
percent 668 583 87.3
percent 690 598 86.7
percent 623 552 88.6
percent 1,064 1,002 94.2
percent 1,090 1,017 93.3
percent 1,080 968 89.6
percent 866 759 87.6
percent ME 95.7
percent 66.7
percent 100.0
percent 94.1
percent MD 229 213 93.0
percent 181 163 90.1
percent 182 166 91.2
percent 171 148 86.5
percent MA 708 645 91.1
percent 720 650 90.3
percent 649 567 87.4
percent 645 555 86.0
percent MI 1,006 962 95.6
percent 982 931 94.8
percent 918 873 95.1
percent 878 822 93.6
percent MN 1,084 996 91.9
percent 1,171 1,035 88.4
percent 930 814 87.5
percent 918 802 87.4
percent MS 747 611 81.8
percent 658 525 79.8
percent 620 482 77.7
percent 561 448 79.9
percent MO 1,235 1,064 86.2
percent 1,086 926 85.3
percent 1,075 907 84.4
percent 971 844 86.9
percent MP 0 0.0 percent 100.0
percent 0 0.0 percent 0 0.0 percent
MT 129 118 91.5 percent
146 133 91.1 percent
94.9 percent
102 95 93.1 percent
246 232 94.3 percent
239 227 95.0 percent
218 209 95.9 percent
245 237 96.7 percent
96.6 percent
100.0 percent
100.0 percent
94.7 percent
152 140 92.1 percent
149 136 91.3 percent
128 120 93.8 percent
86.3 percent

1997 1997 1997 1998 1998 1998 1999 1999 1999 2000 2000 2000 Jurisdiction No. of
Candidates No.
Passing percent Passing
No. of Candidates
No. Passing
percent Passing
No. of Candidates
No. Passing
percent Passing
No. of Candidates
No. Passing
percent Passing
NJ
NM
NY
NC
ND
OH
OK
OR
PA
PR 38 10 38 6 28 3 27
20 19 26 22 28 24 23 19
SC
SD 59 52 57 55 58 57 56 50
TN
TX
UT
VT 82 82 84 80 55 52 79 76
VI 12 4 8 4 8 5 27 10
146
878 743 84.6 percent
782 639 81.7 percent
645 523 81.1 percent
525 411 78.3 percent
179 169 94.4 percent
184 170 92.4 percent
138 126 91.3 percent
178 159 89.3 percent
4,444 3,754 84.5 percent
3,874 3,192 82.4 percent
3,206 2,593 80.9 percent
2,574 2,063 80.1 percent
874 831 95.1 percent
861 802 93.1 percent
858 814 94.9 percent
860 793 92.2 percent
134 124 92.5 percent
173 162 93.6 percent
117 109 93.2 percent
178 166 93.3 percent
1,688 1,568 92.9 percent
1,608 1,519 94.5 percent
1,535 1,405 91.5 percent
1,645 1,505 91.5 percent
1,289 1,163 90.3 percent
1,292 1,144 88.5 percent
1,219 1,065 87.4 percent
1,140 993 87.1 percent
225 219 97.3 percent
221 218 98.6 percent
236 233 98.7 percent
219 215 98.2 percent
1,756 1,525 86.8 percent
1,446 1,201 83.1 percent
1,320 1,112 84.2 percent
1,022 888 86.9 percent
26.3 percent
15.8 percent
10.7 percent
2 7.4 percent
RI 95.0 percent
84.6 percent
85.7 percent
82.6 percent
462 437 94.6 percent
427 405 94.8 percent
450 409 90.9 percent
418 396 94.7 percent
88.1 percent
96.5 percent
98.3 percent
89.3 percent
939 874 93.1 percent
855 794 92.9 percent
956 871 91.1 percent
932 834 89.5 percent
4,511 4,052 89.8 percent
3,867 3,464 89.6 percent
3,747 3,318 88.6 percent
3,684 3,140 85.2 percent
573 548 95.7 percent
586 564 96.2 percent
609 583 95.7 percent
577 550 95.3 percent
100.0 percent
95.2 percent
94.5 percent
96.2 percent
33.3 50.0 62.5 37.0

1997 1997 1997 1998 1998 1998 1999 1999 1999 2000 2000 2000 Jurisdiction No. of
Candidates No.
Passing percent Passing
No. of Candidates
No. Passing
percent Passing
No. of Candidates
No. Passing
percent Passing
No. of Candidates
No. Passing
percent Passing
VA
WA
WV
WI
WY 76 75 41 38 57 56 59 58
)
147
percent percent percent percent 1,086 952 87.7
percent 1,144 964 84.3
percent 992 840 84.7
percent 1,000 834 83.4
percent 736 710 96.4 738 697 94.4 687 642 93.4 648 594 91.7
percent percent percent percent 435 401 92.2 411 370 90.0 455 396 87.0 353 315 89.2
percent percent percent percent 257 237 92.2 277 238 85.9 243 229 94.2 268 242 90.3
percent percent percent percent 98.7 92.7 98.2 98.3
percent percent percent percent Invalid 356 295 82.9 program codes percent Total 43,351 38,426 88.6 40,077 34,994 87.3 37,372 32,260 86.3 35,571 30,267 85.1
percent percent percent percent
Copyright 1996-2001, National Council of State Boards of Nursing, Inc. (http://ncsbn.org
From: 1997 Licensure and Examination Statistics

148
1997-2000
1997 1997 1998 1998 1999 1999 2000 2000 Country of Education n percent n percent n percent n percent Afghanistan 1 0.0 1 100.0
Albania 1 0.0 1 100.0
Algeria 2 0.0
Andorra 2 50.0
Angola 1 0.0 1 0.0
Argentina 1 0.0 1 0.0 1 0.0 3 66.7
Australia 2 100.0 2 50.0
Austria Azerbaijan 1 100.0
Azores 1 100.0
2 50.0 1 100.0
Bahrain 3 66.7
Bangladesh 1 0.0 1 100.0
Barbados 1 100.0
Belgium 1 100.0
Belize (British Honduras) 3 33.3 2 50.0
Bolivia 1 0.0
Bosnia and Herzegovina 1 0.0 7 42.9
Botswana 1 100.0
Brazil 1 100.0 4 25.0 3 33.3
2 0.0
D15. Number of First-Time Candidates Not Educated in Member Board Jurisdictions Taking NCLEX-PN® Examination and Percent Passing:
percent percent
percent percent
percent
percent
percent percent
percent percent percent percent Armenia 3 0.0 percent
percent percent
percent
percent Bahamas 1 0.0 percent
percent percent
percent
percent percent
percent
percent
percent percent Bermuda 1 0.0 percent
percent
percent percent
percent
percent percent percent British West Indies
percent

1997 1997 1998 1998 1999 1999 2000 2000 Country of Education n percent n percent n percent n percent Bulgaria 2 50.0 1 0.0 1 0.0 2 50.0
2 0.0 1 100.0
1 0.0
2 100.0 2 50.0
Canada 75 65.3 42 69.0 50 58.0 33 48.5
3 66.7
Central African Republic 1 0.0
Chile 1 100.0
3 33.3 2 100.0
USSR 94 40.4 60 38.3
Costa Rica 2 50.0 1 100.0
Croatia 1 0.0
Cuba 7 0.0 3 0.0 2 50.0 8 50.0
1 100.0
1 100.0 1 100.0 1 100.0
3 33.3 4 50.0
Ecuador 1 0.0
Egypt, Arab Republic of 1 100.0 2 0.0 1 100.0 1 100.0
El Salvador 4 25.0 4 25.0
England 18 55.6 15 73.3 9 77.8 14 64.3
Eritrea 1 100.0
Estonia 1 100.0
Ethiopia 6 33.3 10 70.0 10 70.0 8 37.5
Falkland Islands 1 0.0
149
percent percent percent percent Burma
percent percent Cambodia
percent Cameroon, Free Republic of
percent percent
percent percent percent percent Cayman
percent
percent
percent Colombia 1 0.0 percent
percent percent Commonwealth of States-
percent percent 1 0.0 percent
percent percent
percent
percent percent percent percent Denmark 1 0.0 percent
percent Dominica
percent percent percent Dominican Republic 1 0.0 percent
percent percent
percent
percent percent percent percent
percent percent
percent percent percent percent
percent
percent
percent percent percent percent

1997 1997 1998 1998 1999 1999 2000 2000 Country of Education n percent n percent n percent n percent
2 0.0
France 4 75.0
Finland 1 100.0 1 100.0 1 100.0
French Polynesia 3 100.0 2 100.0
French Terr of Afars & 1 100.0
Gabon 3 66.7
5 60.0 7 14.3
Georgia 4 100.0 5 100.0 7 85.7 7 100.0
Ghana 15 66.7 20 60.0 17 52.9 22 50.0
Greece 1 0.0
Grenada and the Grenadines 7 71.4 1 100.0 1 100.0
Guadeloupe 1 0.0
1 100.0 3 66.7
Guinea, Republic of 1 100.0
Guyana 24 70.8 30 30.0 19 31.6 10 70.0
Haiti 76 23.7 91 37.4 45 4.4
Honduras 2 50.0 1 0.0
Hong Kong 5 60.0 3 100.0 2 50.0
Hungary 2 50.0 1 0.0
India 227 51.1 135 49.6 143 46.2 130 39.2
Indonesia 3 33.3 10 30.0 6 33.3
Iran 15 46.7 7 28.6 15 66.7 6 66.7
Iraq 1 0.0
150
percent Fiji Islands
percent 2 0.0 percent
percent
percent percent percent
percent percent
percent
percent Gambia
percent percent 1 0.0 percent
Germany United percent percent percent percent
percent percent percent percent
percent
percent percent percent
percent Guatemala
percent percent
percent
percent percent percent percent 67 9.0 percent
percent percent percent 1 0.0 percent
percent percent 2 0.0 percent
percent percent percent
percent percent
percent percent percent percent 4 0.0 percent
percent percent percent
percent percent percent percent

1997 1997 1998 1998 1999 1999 2000 2000 Country of Education n percent n percent n percent n percent
Ireland 3 100.0 1 100.0 3 100.0
Israel 2 50.0 3 33.3 5 40.0 4 50.0
Italy 4 25.0 1 0.0
Ivory Coast 1 0.0 1 100.0
10 40.0 5 60.0 6 83.3 3 33.3
Japan 6 83.3 6 50.0 6 83.3 2 50.0
Jordan 2 50.0 1 0.0
Kazakhstan 1 0.0
Kenya 8 50.0 12 75.0 9 66.7 10 70.0
Korea 13 69.2 5 20.0 12 66.7 8 37.5
Korea (North) 1 0.0 8 12.5 1 100.0
Lebanon 2 100.0 2 100.0
Liberia 2 100.0 1 100.0 1 0.0
Lithuania 1 0.0 3 33.3 1 0.0
Macao 2 50.0 2 100.0
2 50.0 Yugloslav Malagasy Madagascar Malawi Malaysia 1 0.0
Marshall Islands 1 100.0
Mexico 20 45.0 13 7.7 10 30.0 8 25.0
Moldova 1 100.0 2 100.0
Nepal 2 50.0 3 33.3
Netherlands 1 100.0
151
percent
percent percent percent
percent percent percent percent
percent percent
percent percent Jamaica
percent percent percent percent
percent percent percent percent
percent percent
percent
percent percent percent percent
percent percent percent percent
percent percent percent
percent percent 1 0.0 percent
percent percent percent
percent percent percent 1 0.0 percent
percent percent Macedonia, Former
percent 1 0.0 percent 3 0.0 percent
percent
percent
percent percent percent percent
percent percent
percent percent
percent

1997 1997 1998 1998 1999 1999 2000 2000 Country of Education n percent n percent n percent n percent New Zealand 1 100.0
Nicaragua 2 0.0 23 52.2 1 0.0
Niger 1 0.0 1 100.0
Nigeria 122 62.3 82 63.4 103 57.3 74 51.4
Northern Ireland 1 100.0
Norway 1 0.0
Pakistan 7 28.6 8 50.0 2 0.0 4 75.0
1 0.0 11 54.5 1 0.0
Peoples Republic of China 36 52.8 16 68.8 23 43.5 20 75.0
Peru 8 12.5 190 50.0 7 71.4
648 46.5 452 45.1 617 45.4 655 47.0
Poland 10 70.0 31 61.3 13 53.8 11 36.4
Portugal 1 0.0
Russia 3 0.0 72 40.3 41 46.3
4 25.0 2 50.0 8 50.0 3 33.3
Rwanda 1 0.0
Saudi Arabia 1 100.0
Scotland 1 100.0
5 20.0 5 40.0 8 37.5 9 11.1
Senegal Singapore 1 100.0
South Africa 1 0.0 2 100.0
Spain 2 50.0
St. Vincent 3 66.7 2 50.0 2 50.0
152
percent 1 0.0 percent
percent percent percent
percent percent
percent percent percent percent
percent
percent
percent percent percent percent Panama, Republic of
percent percent percent
percent percent percent percent 2 0.0 percent
percent percent percent Philippines
percent percent percent percent
percent percent percent percent
percent
percent percent percent Rumania Romania
percent percent percent percent
percent
percent
percent Sierra Leone
percent percent percent percent 1 0.0 percent
percent
percent percent
percent St Thomas & Principe 1 0.0 percent

1997 1997 1998 1998 1999 1999 2000 2000 Country of Education n percent n percent n percent n percent
Sweden 2 50.0 3 66.7 1 100.0
Taiwan (Republic of China) 13 38.5 11 54.5 11 54.5 7 28.6
Tajikistan 1 100.0 2 50.0
1 0.0 1 0.0
Thailand 3 33.3 6 66.7
Tonga 1 0.0
Tunisia 1 0.0
Trinidad & Tobago 3 66.7 3 66.7 2 100.0 6 66.7
Turkey 2 50.0 1 100.0
Uganda 2 100.0 1 0.0 1 100.0 1 100.0
Ukraine 10 40.0 8 25.0
1 100.0 2 50.0
Uruguay 1 100.0 1 100.0
Uzbekistan 1 0.0 18 33.3 15 20.0
Vatican City State 1 0.0
Venezuela 1 100.0
Vietnam 4 75.0 2 0.0
4 100.0
Yugoslavia 4 75.0 4 0.0 1 100.0
6 83.3
Zaire 1 0.0
2 100.0 1 100.0 1 100.0
2 100.0 1 100.0 2 100.0
153
percent percent percent
percent percent percent
percent percent percent percent
percent percent Tanzania, United Republic of
percent percent 1 0.0 percent
percent percent
percent
percent
percent percent percent percent
percent percent
percent percent percent percent
percent percent United Arab Emirates
percent percent
percent percent
percent percent percent
percent
percent 1 0.0 percent
percent percent Windward Islands
percent
percent percent percent Yugoslavia/Former
percent
percent Zambia 2 0.0 percent
percent percent percent Zimbabwe 1 0.0 percent
percent percent percent

154 1997 1997 1998 1998 1999 1999 2000 2000
Country of Education n percent n percent n percent n percent TOTAL 1570 49.2 1403 47.8 1357 47.2 1285 44.8
percent percent percent percent Copyright 1996-2001, National Council of State Boards of Nursing, Inc. (http://ncsbn.org)
From: 1997 Licensure and Examination Statistics

155
D16. Summary Statistics for First-Time, U.S.-Educated Candidates Taking NCLEXPN® Examination: 1997-2000
1997 1998 1999 2000 Passing Standard* -0.51 -0.51 -0.51 -0.47
-0.47 Estimated Decision 0.92 0.91 0.9 0.9 Consistency**
Average Number of 111 113 118 114.7 Test Items (questions) Taken Percent Taking 60 percent 58 percent 53 percent 56 percent Minimum Number of Items Percent Taking 14 percent 15 percent 18 percent 16 percent Maximum Number of Items Average Testing Time 1 hr 58 min 2 hr 0 min 2.24 2.11
Percent Taking 0.7 percent 0.6 percent 1.7 percent 1.2 percent Maximum Amount of Time
* These statistics are in units, called logits, on the Rasch measurement scale
** Estimated Decision Consistency calculations include only U.S.-Educated, First-Time Candidates Taking NCLEX-PN® Examination
Copyright 1996-2001, National Council of State Boards of Nursing, Inc. (http://ncsbn.org)

1989-1994
Administered
)
156
D17. National Passing Rate: Licensed Practical/Vocational Nurses: Month/Year 1st-time, U.S.-
educated All Examinees
Apr-89 0.87 0.70 Oct-89 0.90 0.79 Apr-90 0.90 0.74 Oct-90 0.87 0.76 Apr-91 0.86 0.68 Oct-91 0.89 0.78 Apr-92 0.89 0.69 Oct-92 0.91 0.78 Apr-93 0.91 0.76
Oct-93* 0.89 0.75 Apr-Jun94 0.91 0.83 Jul-Dec 94 0.90 0.82 Jan-Mar 95 0.89 0.77 Apr-Jun 95 0.91 0.80 Jul-Sep 95 0.92 0.87
Oct-Dec 95 0.90 0.82 Jan-Mar 96 0.91 0.82 Apr-Jun 96 0.90 0.80 Jul-Sep 96 0.92 0.87
Oct-Dec 96 0.88 0.80 Jan-Mar 97 0.90 0.80 Apr-Jun 97 0.88 0.77 Jul-Sep 97 0.90 0.84
Oct-Dec 97 0.86 0.77 Jan-Mar 98 0.86 0.75 Apr-Jun 98 0.87 0.75 Jul-Sep 98 0.89 0.82
Oct-Dec 98 0.85 0.76 Jan-Mar 99 0.87 0.76 Apr-Jun 99 0.85 0.72 Jul-Sep 99 0.88 0.81
Oct-Dec 99 0.84 0.73 *Last paper-and-pencil examination
Copyright 1996-2001, National Council of State Boards of Nursing, Inc. (http://ncsbn.org

157
D18. Number of Candidates Taking NCLEX-PN® Examination and Percent Passing by Type of Candidate: 1994-2003
# # # # # # # # # # percen percen percen percen percen percen percen percen percen percen
t t t t t t t t t t First Time, US Educated 46,823 90.30 47,684 90.80 44,942 90.60 43,351 88.60 40,195 87.20 37,465 86.30 35,666 85.00 34,649 86.40 37,917 86.50 34,160 88.70
s
US Educated 6,251 49.20 6,546 47.60 5,825 47.00 6,082 43.50 6,947 43.50 7,378 42.40 7,712 41.60 8,014 43.80 8,056 44.00 6,363 45.70
s First Time, Foreign Educated 1,694 54.30 1,998 54.10 1,615 54.80 1,572 49.00 1,406 47.90 1,357 47.20 1,286 44.90 1,363 49.30 1,805 53.50 1,636 53.20
s
Foreign Educated
s
1,943 37.30 2,455 27.10 1,863 24.70 1,657 24.90 1,688 22.90 1,779 19.70 1,687 20.00 1,799 23.60 1,781 26.20 1,404 30.10
Total 1994 Total 1995 Total 1996 Total 1997 Total 1998 Total 1999 Total 2000 Total 2001 Total 2002 Total 2003 Type of
Candidate
candidate percent percent percent percent percent percent percent percent percent percent
Repeat,
candidate percent percent percent percent percent percent percent percent percent percent
percent percent percent percent percent percent percent percent percent percent candidate
Repeat,
candidate percent percent percent percent percent percent percent percent percent percent
All candidate s
56,711 82.90 percent 58,683 82.10
percent 54,245 82.60 percent 52,662 80.20
percent 50,236 77.90 percent 47,979 75.90
percent 46,351 74.30 percent 45,825 75.40
percent 49,559 76.20 percent 43,563 79.20
percent
*2003 total incomplete -- missing data for Oct-Dec.
Source: The NCLEX-RN® and NCLEX-PN® Examination Statistics Database, copyright 1996-2001
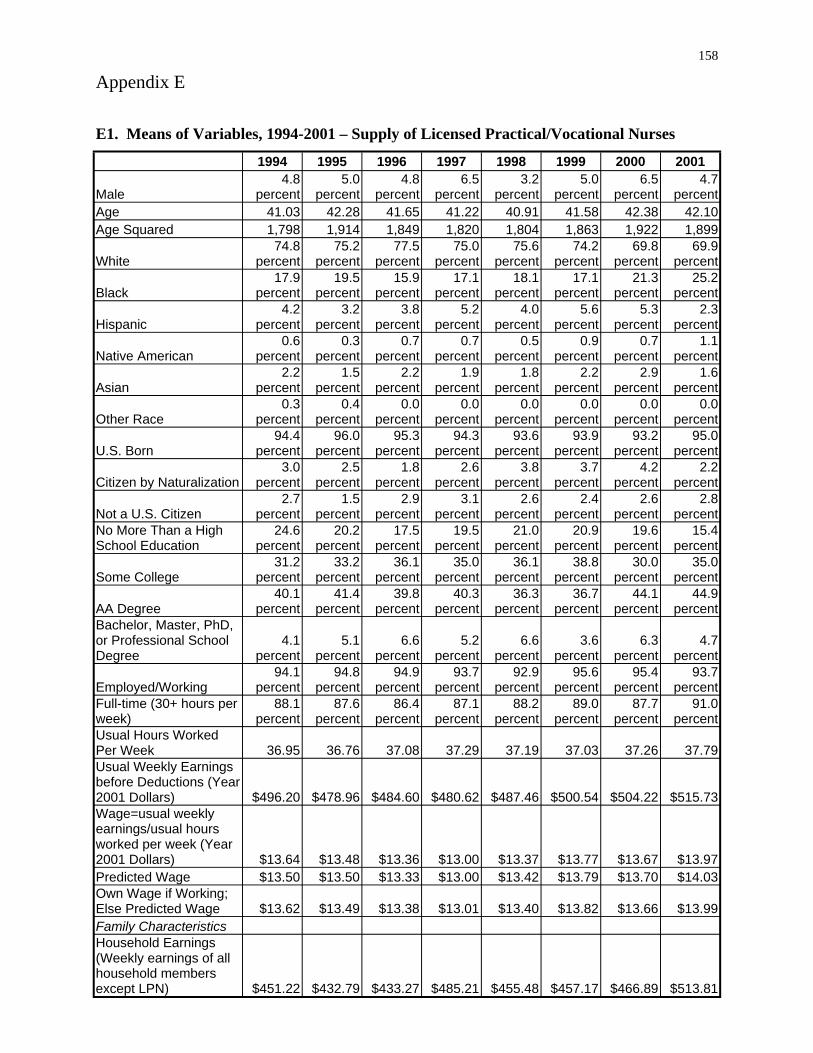
158
Appendix E
1994 1995 1996 1997 1998 1999 2000 2001
Male 4.8
percent 5.0
percent 4.8
percent 6.5
percent 3.2
percent 5.0
percent 6.5
percent 4.7
percent Age 41.03 42.28 41.65 40.91 41.58 42.38 42.10 Age Squared 1,798 1,914 1,820 1,804 1,863 1,922 1,899
White 74.8
percent 75.2
percent 77.5
percent 75.0
percent 75.6
percent 74.2
percent 69.8
percent 69.9
percent
Black 17.9
percent 19.5
percent 15.9
percent 17.1
percent 18.1
percent 17.1
percent 21.3
percent 25.2
percent 4.2 3.2 3.8 5.2 4.0 5.6 5.3 2.3
percent percent percent percent percent percent percent percent 0.6
percent 0.3
percent 0.7
percent 0.7
percent 0.5
percent 0.9
percent 0.7
percent 1.1
percent
Asian 2.2
percent 1.5
percent 2.2
percent 1.9
percent 1.8
percent 2.2
percent 2.9
percent 1.6
percent 0.3
percent 0.4
percent 0.0
percent 0.0
percent 0.0
percent 0.0
percent 0.0
percent 0.0
percent
U.S. Born 94.4
percent 96.0
percent 95.3
percent 94.3
percent 93.6
percent 93.9
percent 93.2
percent 95.0
percent 3.0 2.5 1.8 2.6 3.8 3.7 4.2 2.2
percent percent percent percent percent percent percent percent
Not a U.S. Citizen 2.7
percent 1.5
percent 2.9
percent 3.1
percent 2.6
percent 2.4
percent 2.6
percent 2.8
percent 24.6
percent 20.2
percent 17.5
percent 19.5
percent 21.0
percent 20.9
percent 19.6
percent 15.4
percent 31.2 33.2 36.1 35.0 36.1 38.8 30.0 35.0
percent percent percent percent percent percent percent percent 40.1 41.4 39.8 40.3 36.3 36.7 44.1 44.9
AA Degree percent percent percent percent percent percent percent percent
4.1 5.1 6.6 5.2 6.6 3.6 6.3 4.7 percent percent percent percent percent percent percent percent
94.1 94.8 94.9 93.7 92.9 95.6 95.4 93.7 percent percent percent percent percent percent percent percent
88.1 87.6 86.4 87.1 88.2 89.0 87.7 91.0 ) percent percent percent percent percent percent percent percent
36.95 36.76 37.08 37.29 37.19 37.03 37.26 37.79 Usual Weekly Earnings
l
$13.64 $13.48 $13.36 $13.00 $13.37 $13.77 $13.67 $13.97 $13.50 $13.50 $13.00 $13.42 $13.79 $13.70 $14.03
$13.62 $13.49 $13.38 $13.01 $13.40 $13.82 $13.66 $13.99
except LPN)
E1. Means of Variables, 1994-2001 – Supply of Licensed Practical/Vocational Nurses
41.22 1,849
Hispanic
Native American
Other Race
Citizen by Naturalization
No More Than a High School Education
Some College
Bachelor, Master, PhD, or Professional School Degree
Employed/Working Full-time (30+ hours per weekUsual Hours Worked Per Week
before Deductions (Year 2001 Dollars) $496.20 $478.96 $484.60 $480.62 $487.46 $500.54 $504.22 $515.73 Wage=usua weekly earnings/usual hours worked per week (Year 2001 Dollars) Predicted Wage $13.33 Own Wage if Working; Else Predicted Wage Family Characteristics Household Earnings (Weekly earnings of all household members
$451.22 $432.79 $433.27 $485.21 $455.48 $457.17 $466.89 $513.81

1994 1995 1996 1997 1998 1999 2000 2001
59.9 percent
55.9 percent
61.9 percent
62.9 percent
60.4 percent
61.3 percent
63.3 percent
60.7 percent
27.1 32.0 27.2 25.4 28.8 25.0 23.6 25.9 percent percent percent percent percent percent percent percent
12.9 12.1 10.9 11.7 10.7 13.7 13.1 13.4 percent percent percent percent percent percent percent percent
23.3 percent
20.7 percent
22.1 percent
22.7 percent
20.4 percent
22.1 percent
21.2 percent
22.2 percent
27.3 percent
27.7 percent
28.1 percent
30.3 percent
27.7 percent
30.7 percent
27.5 percent
31.2 percent
26.3 percent
24.9 percent
26.3 percent
21.6 percent
25.6 percent
23.0 percent
19.8 percent
24.0 percent
$13.43 $13.17 $13.10 $13.05 $13.22 $13.58 $13.72 $13.60 16.3
percent 16.3
percent 15.7
percent 13.1
percent 10.9
percent 13.6
percent 11.9
percent 12.2
percent 22.1
percent 23.1
percent 22.0
percent 23.3
percent 22.1
percent 21.1
percent 18.2
percent 18.0
percent
Midwest 25.2
percent 26.4
percent 28.5
percent 28.4
percent 23.2
percent 29.9
percent 28.2
percent 26.7
percent
South 37.8
percent 37.8
percent 36.1
percent 36.6
percent 44.5
percent 38.5
percent 41.5
percent 45.2
percent 15.0
percent 12.7
percent 13.4
percent 11.7
percent 10.1
percent 10.4
percent 12.0
percent 10.1
percent 73.9
percent 69.6
percent 0.0
percent 0.0
percent 0.0
percent 0.0
percent 0.0
percent 0.0
percent 8.7 10.1 30.2 31.2 34.8 37.4 33.7 35.4
Not an MSA/CMSA percent percent percent percent percent percent percent percent MSA Population 4.9 6.1 18.3 15.4 14.9 17.4 16.0 17.5
percent percent percent percent percent percent percent percent MSA Population 3.2 2.2 11.4 12.2 11.2 8.4 10.5 10.0
percent percent percent percent percent percent percent percent MSA Population 4.4 3.8 15.7 17.2 18.0 13.8 14.6 13.2
percent percent percent percent percent percent percent percent MSA Population 5.0 8.1 24.4 24.0 21.1 23.1 25.3 23.9
percent percent percent percent percent percent percent percent
Type 86.7 84.9 86.3 87.3 88.1 89.0 87.9 89.1
Private Employer percent percent percent percent percent percent percent percent 12.6 14.0 12.9 11.6 10.9 10.5 11.1 10.6
percent percent percent percent percent percent percent percent 0.7 1.1 0.8 1.1 1.0 0.5 0.9 0.4
Self Employed percent percent percent percent percent percent percent percent 3.1
percent 3.3
percent 1.7
percent 2.8
percent 3.5
percent 3.2
percent 4.0
percent 4.9
percent 0.3
percent 0.5
percent 0.3
percent 0.8
percent 0.3
percent 0.0
percent 0.3
percent 0.2
percent i 8.7 8.4 9.1 11.5 11.0 10.9 10.4 13.1
Physicians percent percent percent percent percent percent percent percent 39.2 36.9 36.5 35.3 38.9 36.3 36.6 31.6
percent percent percent percent percent percent percent percent
Care Facilities 35.3
percent 33.9
percent 37.0
percent 32.5
percent 30.6
percent 34.2
percent 31.6
percent 32.8
percent 8.9 11.2 10.5 13.5 10.6 10.6 12.5 11.2
percent percent percent percent percent percent percent percent
159
Married
Previously Married
Single, Never Married Presence of Kids Aged 0-5 in Household Presence of Kids Aged 6-12 in Household Presence of Kids Aged 13-17 in Household Market Characteristics LPN Market Wage (Yr 2001 Dollars) Percentage of LPNs Unionized in State
Northeast
West No Information on MSA Size
100,000-499,999
500,000-999,999
1,000,000-2,499,999
2,500,000+ Work Setting/Industry
Government Employer
Personnel Supply Services
Private Households Off ces and Clinics of
Hospitals Nursing and Personal
Health Services (not else where classified)

1994 1995 1996 1997 1998 1999 2000 2001 4.6 5.8 4.9 3.6 5.1 4.9 4.6 6.1
percent percent percent percent percent percent percent percent
State 226 238 236 243 249 250 241 244
$14.39 $14.29 $14.24 $14.40 $14.31 $14.67 $14.52 $14.47 683 659 570 579 543 498 524 560
160
Other Industry Instruments for Wage Number of Physicians Per 100,000 People in
Average Manufacturing Wage in State Sample Size Source: Current Population Survey Outgoing Rotation Group Files, 1994-2001; Area Resource File (February 2003 release); and Bureau of Labor Statistics.

Variable 1990 1991 1992 1993 1994 1995 1996 1997 1998 1999 2000 31.61 31.59 30.33 28.88 28.92 27.41 27.74 27.20 26.60 25.77
LPNs 149.87 157.12 162.77 166.71 171.56 176.13 180.39 187.47 191.79 197.28
Ratio of LPNs 24.6 percent
23.9 percent
22.6 percent
21.4 percent
21.2 percent
20.7 percent
19.7 percent
19.6 percent
18.8 percent
18.5 percent
18.0 percent
Scope of
Specific 2.34 1.95
Patient i
42,265 42,120 42,178 39,912 38,791 38,119 38,509 38,677 39,210 39,706
Share of 15.2
percent 16.3
percent 17.3
percent 18.1
percent 18.6
percent 18.7
percent 18.0
percent 18.1
percent 17.3
percent 17.6
percent 18.3
percent
10.00 10.32 10.44 10.73 10.48 10.18 10.13 9.85 9.78 9.71 9.92 1.20 1.22 1.23 1.23 1.24 1.25 1.26 1.28 1.28 1.25 1.79 1.85 1.97 2.06 2.12 2.16 2.21 2.18 2.34 2.47
58.6 percent
58.8 percent
59.4 percent
59.3 percent
59.3 percent
59.1 percent
58.9 percent
59.1 percent
60.0 percent
60.5 percent
61.1 percent
For-profit Owner 13.6 13.4 13.1 13.1 13.3 13.8 14.0 14.9 14.5 14.1 14.1
16.5 percent
16.6 percent
16.2 percent
16.0 percent
15.9 percent
15.4 percent
15.5 percent
14.7 percent
14.1 percent
14.0 percent
13.7 percent
11.3 11.3 11.3 11.6 11.5 11.7 11.6 11.4 11.4 11.4 11.1
Market i
LPN Market $12.23 $12.50 $12.71 $12.77 $12.81 $12.62 $12.57 $12.88 $13.12 $13.29
$18.85 $19.26 $19.56 $19.59 $19.58 $19.11 $18.83 $18.96 $19.24 $19.40
$7.51 $7.49 $7.48 $7.39 $7.36 $7.45 $7.51 $7.62 $7.78 $7.97
6.60 6.85 7.03 6.67 6.56 7.79 8.00 8.36 7.63 6.30
Operating in
HMO 12.9 percent
13.9 percent
14.4 percent
14.9 percent
15.6 percent
15.8 percent
18.3 percent
20.4 percent
22.1 percent
21.7 percent
21.0 percent
1.33 1.41 1.44 1.40 1.47 2.06 2.26 2.42 2.48 1.90
Per Capita
12.6 percent
12.5 percent
14.8 percent
14.6 percent
15.1 percent
14.7 percent
13.4 percent
11.1 percent
11.0 percent
12.9 percent
12.3 percent
161
E2. Means of Variables, 1990-2000 – Hospital Demand for Licensed Practical Nurses
Number of Full- 28.24 time Equivalent
Number of Full- 173.25 time Equivalent RNs
to All Licensed Nurses
Practice
Restrictive Hospital and
Character stics Inpatient Days 41,346 Medicaid's
Inpatient Days Length of Stay Case Mix 1.24 Technology (Saidin Index)
2.14
Non-profit Owner
percent percent percent percent percent percent percent percent percent percent percent Government Owner Hospital District/Authority percent percent percent percent percent percent percent percent percent percent percent Owner
Character stics
Wage $12.71
RN Market $19.25 Wage Nurse Aide $7.44 Market Wage Number of 6.95 HMOs
County
Penetration No. of HMOs In 1.65 County x HMO Penetration
$17,057 $17,375 $18,384 $18,957 $19,844 $20,908 $22,018 $22,718 $24,375 $25,506 $26,208 Income in County Percentage of LPNs Unionized

162 Variable 1990 1991 1992 1993 1994 1995 1996 1997 1998 1999 2000
in State
in State
17.3 percent
17.0 percent
16.7 percent
15.8 percent
17.1 percent
16.5 percent
16.3 percent
15.3 percent
14.5 percent
16.3 percent
16.9 percent
Scope of
Per Capital 6.27 State Debt/Per
State
Controlled by
9.5 percent
State 52.3 percent
Item Veto
9.6 percent
percent
Lower
53.7 percent
percent 51.1 percent
LPN Wage 42.32
Age percent of Total
State
13.9 percent
5,220 5,152 5,076 5,042 4,991 4,943 4,888 4,810 4,772 4,703 4,661
).
Percentage of RNs Unionized
Instruments for
Practice
Capita Income
Government
Democrats
Government Control Divided Governor Does Not Have Line
Democrats in
Legislative House
Democrats in Upper Legislative House Instruments for
LPN Average
Workforce Unionized in
Sample Size
Sources: American Hospital Association Annual Survey of Hospitals, Current Population Survey Outgoing Rotation Files, and Area Resource File (February 2003 release). Managed care data courtesy of Douglas R. Wholey (Wholey et al., 1997 Political variables courtesy of Mark W. Smith, Health Economics Resource Center, VA Palo Alto Health Care System.

163
Appendix F
F1. Findings From Focus Groups
Patient care is the major role for both RNs and LPNs Despite the differences in their licensure and employer, LPNs and RNs Stated that
direct patient care is their main responsibility. While LPN and RN licenses specify different scopes of practice, and LPNs predominate in the long-term care setting with RNs more prevalent in acute care facilities, the focus group respondents cited similar overall duties in their current jobs. Specifically, direct patient care is the most often-mentioned responsibility with most of the participating LPNs and RNs claiming this duty. In descending order of importance, both groups also Stated responsibility for: patient education, supervision of other nurses, education of other staff members, and supervision of non-nursing staff.
When LPNs and RNs work side-by-side in a particular facility or department, the actual patient-care duties performed by each differ, with LPNs serving in a more hands-on, technical capacity and RNs more likely to supervise and to perform specific highly skilled tasks. However, when RNs greatly outnumber the LPNs in a particular setting, their duties may be fairly similar, except for those activities the LPN is not licensed to perform. When LPNs greatly outnumber the RNs in a setting, usually in long-term care, the LPNs report to an RN, but may take on broader responsibilities.
Relationships between RNs and LPNs are positive The relationships between the LPNs and RNs in the focus groups and the other nursing
staff members with whom they work are generally positive. LPNs Stated that the RNs with whom they interact are, for the most part, supportive and respectful, while the RNs Stated that they appreciate the contributions of the LPNs and rely on them to get the job done. In the acute care setting, some LPNs resent their lower pay and perceived lower status, although not all hospital LPNs felt this way. The few specific instances of friction cited by focus group respondents were believed to be isolated examples of personality clashes or the occasional frustrated or overworked individual.
There are significant barriers for LPNs in obtaining RN education and licensure If it were easier for LPNs to get their RN license, more LPNs would be interested in
doing so. Although some of the focus groups’ LPNs are not interested in obtaining an RN license, many would like to obtain the more advanced license. In each of the LPN focus groups, at least one individual was currently enrolled in an RN program, and several others Stated an intention to enroll in the future. Still others in each group claimed to have been interested in an RN license in the past, but to have shelved their aspirations for a variety of reasons. The major obstacles to LPNs obtaining an RN license appear to be:
• The need to take prerequisite courses such as math and science • The difficulty of finding time off from work to take courses • The expense of financing additional education
Some LPNs who Stated that they are not interested in obtaining a RN license said that they would be paid less as a newly licensed RN than as an experienced LPN. Some LPNs said that they perceive RNs to have more non-patient-care responsibilities, such as paperwork, and that they personally did not want to leave bedside nursing.

164 The following ideas were proposed by the group to help LPNs address barriers in gaining RN licensure were suggested by focus group participants:
• Have RN programs that give substantial credit for the expertise and knowledge of an experienced LPN
• Offer employer-sponsored programs that provide financial assistance and scheduling flexibility to LPNs interested in pursuing the RN license
• Offer LPNs who meet certain criteria an opportunity to challenge the RN boards without further course work
• Offer more LPN–RN ladder programs such as those offered at most Iowa Community Colleges
Most participants agree with the LPN scope of practice in their State The four States visited varied in LPN scope of practice. The majority of focus group
participants were generally familiar with their State’s scope of practice for LPNs. In each group, several individuals were able to articulate the LPN scope of practice and could specify how it differed from the RN scope of practice. Even many respondents who did not feel comfortable articulating the guidelines appeared knowledgeable about what RNs and LPNs are and are not permitted to do in the workplace. In each focus group, a few individuals seemed unsure about what the regulations specify.
While focus group members generally understood the LPN scope of practice in each of the four States, there are a few differences between what the regulations State and what members believed that LPNs are permitted to do. Those areas of discrepancy mostly centered on patient assessment, IV therapy, and treatment with blood products.
Most focus group participants were in agreement with their State’s scope of practice, although a few respondents, particularly LPNs, felt that the scope is too restrictive. Those who support the current scope of practice believe that it appropriately captures the level of training and skills possessed by LPNs. Those who felt that the scope of practice is too limiting expressed the following perspectives:
• Some LPNs mentioned that they are not permitted to perform all the activities outlined in the scope of practice. LPNs Stated that they are guided more by employer-specific policies and procedures stating their specific job tasks and responsibilities than by everyday knowledge of the State’s scope of practice. Employers have the prerogative to establish internal practice guidelines that are more limited than the legal scope of practice.
• In reality LPNs often perform many RN tasks, with the RN signing off on their completion.
• Many LPNs with experience have greater technical abilities than junior RNs • LPNs are more practiced at the technical, hands-on aspects of nursing while RNs spend
more time doing administrative work. • Another limiting factor in LPN scope of practice is that of what RNs are allowed to
delegate to other health professionals, including LPNs. For example, in the State of Louisiana, the RN scope of practice limits the tasks that an RN may delegate to an LPN, thereby de facto reducing the LPN scope of practice.
Some LPNs felt that they have responsibilities that go beyond the State’s regulations.
According to the focus group participants, when the LPNs functioned outside the scope of practice, it was usually for one of the following reasons:

165 • In some units/department (e.g., ER, ICU, cardiac catheterization lab), the pace is so
hectic that everyone must pitch in and do what is required, regardless of regulatory boundaries.
• If an RN has confidence in a particular LPN’s knowledge and skills, that LPN may be permitted to bend the rules.
• In long-term care facilities and on night and weekend shifts, there may be few or no RNs available, so LPNs must perform tasks outside of the scope of practice.
• In emergency situations LPNs may perform tasks outside their scope of practice. • A relatively junior RN may have a lower skill level than a more senior LPN, who
therefore is asked to perform a task in his/her stead.
Several LPNs who had knowingly practiced outside their scope of practice expressed discomfort with this both because of legal liability and because they are paid less than RNs and should therefore not be expected to take on RN tasks.
Many LPNs are interested in earning an RN license In each LPN group, one or more individuals are either currently studying for their RN
license, or are very interested in doing so. Still others considered getting an RN license at some time in the past, but were unable to complete the process. Among the reasons LPNs cited for wishing to become an RN are:
• Higher pay • Greater respect from patients, physicians, other staff members • Ability to supervise other and less hands-on work • Already do everything RNs do, but not paid as much • RNs work at a slower pace with more paperwork to do • Greater opportunities for advancement • To gain more knowledge and skills • Priority in scheduling work-shifts (acute care)
Several LPNs also Stated that they were not interested in becoming RNs. Among the reasons they wished to remain an LPN were:
• Because of seniority, earn more than most RNs • Not a risk-taker • Not sure I have what it takes to get the RN license • LPNs today have more opportunities than they did in the past • Can’t afford to quit work to pursue the RN license • Would have to take the various prerequisite courses (math, science, history) • LPNs have less responsibility and lower legal liability • RNs don’t do as much direct patient care
Barriers to LPN education and licensure are fewer than for RN licensure
The LPNs in the focus groups cited few barriers to earning their LPN license, saying they found it fairly easy. The obstacles mentioned by individual respondents included difficulty in the following areas:
• Finding information about LPN programs in the area • Fulfilling prerequisites • Attending the program as a single mother or when raising a family • Lack of employer tuition reimbursement • Obtaining paid time off from work to attend school

166 • Competing with other students for prerequisite courses
Once initial barriers such as finding a program and completing prerequisites were completed, most of the LPNs Stated that they had few barriers to completing LPN educational programs. The major barrier cited was the need to work and attend school as well as juggle family responsibilities.
Most RNs and LPNs were satisfied with their career and job Focus group participants were generally satisfied with their choice of nursing as a
career and certain aspects of their current jobs. In the written survey of the participants, over half of LPNs (56 percent) and three-fourths (74 percent) of RNs say that they Strongly Agree that they are satisfied with nursing as a career, while over half of LPNs (56 percent) and two-thirds (67 percent) of RNs Strongly Agree that they are not considering leaving the field. Three-fourths of LPNs (73 percent) and half of RNs (50 percent) strongly agree that they like working with a mix of different types of nurses. However nearly half of each group believed that their supervisors value their opinions. The most negative scores were given to salary level. Just 2 percent of LPNs and 12 percent of RNs strongly agree that their pay is satisfactory for their work.
Most RNs and LPNs preferred to work in acute care settings if pay was equal The written survey results showed that LPNs are more than twice as likely as RNs to
work in the long-term care setting, while RNs are more than twice as likely as LPNs to work in acute care hospitals. Part of this is due to the fact that in the 1990s, many acute care hospitals reduced or eliminated LPN positions in an attempt to increase the percentage of RNs in their work forces. In addition, the typically lower skill set of the LPN is adequate to meet the needs of the less acutely ill long-term care patient population.
Nurses who work in the acute care setting Stated that they preferred that setting for several reasons:
• Acute care is a more exciting, fast-paced and challenging • Use more skills and uses a wider variety of skills • Greater variety of patient cases • Pay is generally higher • Employee benefits are better • Opportunities for travel and per diem positions
The participants who preferred the long-term care setting cited the following reasons for their views:
• Longer lengths of stay allow staff to get to know the patient and family • Work hours often shorter and usually more regular • Mandated overtime rarely exists in long-term care. • LPNs pay is usually higher in long-term care than in acute care hospitals. • Pace of work is generally slower

167
F2. Key Informant Interview Questions
Interview Questions for employers
Questions to be asked in the employer interviews include, but are not limited to:
• To what extent do you employ LPNs in your facility? • What factors make LPNs attractive to you? • What factors make LPNs unattractive to you? • How do LPNs work with other personnel in your facility? • To what extent do you substitute LPNs for other personnel in your facility? • Do you believe LPN education is adequate? • What changes to LPN education would you recommend? • Do you believe the scope of practice of LPNs in your State is appropriate? • What changes to the scope of practice would you recommend?
Interview Questions for educators
Questions to be asked in the educator interviews include, but are not limited to:
• What factors help students complete their LPN education? • What factors are barriers to the completion of LPN education? • What positions do your LPNs obtain after completion of your program? • Do you believe LPN educational requirements are adequate in your State? • What changes to LPN educational requirements would you recommend? • Do many of your students want to pursue RN education after completing LPN education? • How difficult is it to pursue RN education after LPN education? • Do you believe the scope of practice of LPNs in your State is appropriate? • What changes to the scope of practice would you recommend?
Interview Questions for Boards of LPN/LPN
Questions to be asked in the Boards of LPN/LPN interviews include, but are not limited to:
• What is the philosophy behind the scope of practice of LPNs in your State? • Do you believe the scope of practice regulations for LPNs in your State are effective? • What changes to the scope of practice are under consideration? • How do you accredit LPN educational programs in your State? • Is adequate LPN education available in your State? • How difficult is it to pursue RN education after LPN education? • Where do LPNs work when they complete their education in your State? • Does there appear to be a shortage of LPNs?

168
F3. Focus Group Questions
Focus Group Questions for RNs
Questions to be asked in the RN focus groups include, but are not limited to:
• How do LPNs work with other personnel in your facility? • Do you supervise LPNs? • What difficulties do you experience working with LPNs? • To what extent do LPNs substitute for other personnel in your facility? • Do you believe LPN education is adequate? • What changes to LPN education would you recommend? • Do you believe the scope of practice of LPNs in your State is appropriate? • What changes to the scope of practice would you recommend?
Focus Group Questions for LPN/LPNs
Questions to be asked in the practicing LPN focus groups include, but are not limited to:
• How do LPNs work with other personnel in your State? • To what extent do LPNs substitute for other personnel in your State? • What factors are barriers to the completion of LPN education? • Do you believe LPN education is adequate? • What changes to LPN education would you recommend? • How difficult is it to pursue RN education after LPN education? • Do you believe the scope of practice of LPNs in your State is appropriate? • What changes to the scope of practice would you recommend?
Related Documents