R E F E R E N C E D O C U M E N T 2005 AN ADVENTURE O F ENTERPRI SE

Welcome message from author
This document is posted to help you gain knowledge. Please leave a comment to let me know what you think about it! Share it to your friends and learn new things together.
Transcript

R E F E R E N C E
D O C U M E N T
2005
AN ADVENTUREO F E N T E R P R I S E


Above all, PPR is the incarnation
of a state of mind: the desire and
willingness to display entrepreneurship.
With boldness and a sense of risk,
PPR invests and commits itself to its
various businesses, always directed
at the same goal: to grow its activities
and become the leader. It imposes on
each of its brands and companies its
own demanding culture of growth and
performance. With revenues of nearly
18 billion euros in 2005, PPR is a
world leader in two different, but
complementary universes: Luxury
Goods and Retail. The diversity of
its brands and businesses drives
its success. Its specifi c balance in
terms of products, sales formats,
brands, and geographic locations has
generated a growth profi le surpassing
the average in its markets. Open to
the world and backed by the skills
and talents of its 84,000 employees,
PPR makes expertise the core of its
development and values and promotes
an entrepreneurial spirit. It is a group
with cutting-edge talents ahead of
its time. As a responsible corporate
citizen, it guarantees the conduct of
its brands and places human values
at the centre of its commitments.
AN ADVENTURE OF E N T E R P R I S E

PPR 02 03

Reference document 2005
05 PPR in 2005
68 Corporate Social Responsibility (CSR)
120 Financial information
316 Person responsible for the Reference Document and Statutory Auditors
268 Legal and stock market information
21 The Group’s activities: Luxury Goods and Retail
318 Reference Document cross-reference table
Table of contents
02 03

PPR 04 05

Reference document 2005
08
06
10
History
The PPR Group10 Group organisational chart
11 Positioning and strategy
12 Map of worldwide locations at 31/12/2005
14 2005 highlights and outlook
Key consolidated fi gures
PPR in 2005
04 05

HistoryEstablished in 1963 by François Pinault in the timber and building material businesses, the PPR group positioned itself
in the middle of the 1990s in the Retail sector, in which it soon became a major player. The purchase of a controlling
stake in Gucci Group in 1999 and the establishment of a multi-brand Luxury Goods group marked a new stage in
the development of the Group. PPR continues to expand its two activities in high-growth markets through powerful
and recognised brands.
PPR in 2005
1963 • François Pinault establishes the Pinault group, specialising in timber trading.
1988 • Flotation on the Paris Stock Market’s Second Marché of Pinault SA, a company specialising in timber trading, distribution and processing.
1990 • Acquisition of CFAO, specialising in electrical equipment distribution (through CDME, which became Rexel in 1993) and in trading with Africa.
1991 • With the acquisition of Conforama, the Group enters the Retail activity.
1992 • The Pinault-Printemps Group is born with the takeover of Au Printemps SA, which held 54% of La Redoute and Finaref.
1994 • Merger of La Redoute with the Group, which is renamed Pinault-Printemps-Redoute.• Takeover of Fnac.
1995 • Launch of the Group’s fi rst website, laredoute.fr.
1996 • Acquisition by CFAO of SCOA, the leading pharmaceutical distributor in West Africa through its sub sidiary Eurapharma.
• Creat ion of Orcanta, a women’s lingerie chain.• Launch of fnac.com, the Fnac website.
1997 • Takeover by Redcats (PPR home shopping activity) of Ellos, the leader in the Scandinavian mail-order market.• Creation of Fnac Junior, a store concept for children under 12.
1998 • Takeover of Guilbert, the European leader in offi ce supplies and furnishings.• Acquisition by Redcats of 49.9% of Brylane, the fourth largest home shopping company in the United States. • Creation of Made in Sport, a chain of stores dedicated to sports enthusiasts.
06PPR

1999 • Purchase of the remaining stake in Brylane.• The Group enters the luxury goods sector with the acquisition of 42% of Gucci Group NV.• First steps towards building up a multi-brand luxury goods group, with the acquisition
by Gucci Group of Yves Saint Laurent, YSL Beauté and Sergio Rossi.
2000 • Acquisition of Surcouf, a specialised PC distributor.• Acquisition by Gucci Group of Boucheron and BEDAT & Co.• Launch of Citadium, the new Printemps sports store.
2001 • Gucci Group acquires Bottega Venta and Balenciaga and signs partnership agreements with Stella McCartney and Alexander McQueen.
• Conforama enters the Italian market with the purchase of the Emmetza group, one of the leaders in the home furnishings market in Italy.
• Pinault-Printemps-Redoute raises its stake in Gucci Group to 53.2%.
2002 • The Group further increases its stake in Gucci Group to 54.4%.• Sale of Guilbert mail order activity to Staples Inc.• Sale of part of the Credit and Financial Services activity in France and Scandinavia
to Crédit Agricole SA (61% of Finaref) and to BNP Paribas (90% of Facet).
2003 • Pinault-Printemps-Redoute raises its stake in Gucci Group to 67.6%.• Sale of Pinault Bois & Matériaux to the Wolesley group in the UK.• Sale of the Guilbert “contract” activity to Offi ce Depot the American group.• Further sale of 14.5% of Finaref.
2004 • The Group raises its stake in Gucci Group to 99.4% following tender offer launched in April-May.• Sale of Rexel.• Divestment of the Group’s remaining 24.5% stake in Finaref.
2005 • Change in the corporate name: Pinault-Printemps-Redoute becomes PPR.• Sale of MobilePlanet.• Sale of the 10% residual stake in Facet.
07 Reference document 2005

PPR
Key consolidated figures
09
PPR in 2005
08
(1) 2004: adjusted for the impact of the transition to IFRS and change in the reporting period of Gucci Group (consolidation over the period from January-December).(2) Net cash from operating activities – net acquisitions of intangible assets and property, plant and equipment.(3) Submitted to the approval of the Shareholders’ Meeting of May 23, 2006.(4) Excluding holding company.
(in € million) 2004 (1) 2005 Change
Revenue 17,042 17,766 +4.2%
Revenue earned outside France (as % of revenue) 50.2% 51.3% +1.1 pt
Gross margin 7,388 7,734 +4.7%
Recurring operating income 986 1,084 +9.9%
Operating margin (as % of revenue) 5.8% 6.1% +0.3 pt
Income before taxes 795 762 -4.1%
Net income from continuing operations attributable to equity holders of the parent 464 535 +15.4%
Free cash fl ow from operations (2) 729 955 +31.0%
Debt-to-equity ratio at 31/12(net fi nancial debt as a percentage of shareholders’ equity for the consolidated entity)
58.9% 56.4% -2.5 pts
Per share data(in €)
2004 (1) 2005 Change
Net income per share from continuing operations attributable to equity holders of the parent 3.89 4.50 +15.7%
Net dividend per share 2.52 2.72 (3) +7.9%
Excluding non-recurring items, the change in net income from continuing operations attributable to equity holders of the parent was as follows:
2004 (1) 2005 Change
Net income from continuing operations attributable to equity holders of the parent 485 539 +11.2%
Net income from continuing operations attributable to equity holders of the parent (in €) 4.06 4.53 +11.6%

Reference document 200509
Breakdown of revenue by sector
RETAIL
LUXURY GOODS
17.1%
82.9%
15.9%
84.1%
2004 (1) 2005
Breakdown of revenue by geographic region
AMERICAS OCEANIA
FRANCE
EUROPE (EXCLUDING FRANCE)
AFRICA
ASIA
49.8%
23.9%
11.7%
8.3%
5.1% 1.2%
2004 (1) 2005
48.7%
23.8%
11.7%
9.0%
5.8% 1.0%
65.9%
34.1%27.5%
72.5%
Breakdown of recurring operating income by activity (4)
2004 (1) 2005
LUXURY GOODS
RETAIL
14.4%
85.4%
0.2%
15.2%
0.2%
84.6%
Breakdown of employees at December 31 by activity
2004 (1)
Total: 84,3512005
Total: 84,316
LUXURY GOODS
HOLDING COMPANY
RETAIL
08

PPR
The PPR Group
11
PPR in 2005 - The PPR Group
A leading player
PPR is driven by its goal of sustainable growth and continues to expand internationally in a spirit of achievement and creativity. PPR is a leading group in each of its activities, both through the power of its brands and the skills of its teams. The Group’s specifi c balance in terms of products, sales formats and geographic locations has been the engine for its above-market growth. The size of the Group, which recorded nearly €18 billion in revenues in 2005, is also a major competitive advantage.
Because of the size and diversity of its activities, there is no single competitor on the scale of PPR. Each brand is developing in its own competitive environment, as described in the section on the Group’s activities.
Group organisation chart at 31/12/2005
Percentage stake at December 31, 2005.
Other brands:
• Balenciaga (91%)
• Boucheron (100%)
• Sergio Rossi (100%)
• BEDAT & CO (100%)
• Alexander McQueen (51%)
• Stella McCartney (50%)
Gucci
Yves Saint Laurent
YSL Beauté
100%
86.28%
100%
100%
Bottega Veneta
Luxury Goods: Gucci Group
Printemps
Conforama
Other activities:
• Kadéos (99.99%)
• Orcanta (100%)
100%
99.96%
99.95%
99.93%
Redcats
CFAO
100%Fnac
Retail
99.48%
10
PPR

Reference document 2005
Positioning and strategy
PPR is a global leader in two universes: Luxury Goods and Retail. This unique positioning refl ects the Group’s strategic choices and its entrepreneurial spirit.
A strong entrepreneurial culture
Since its inception in 1963, the PPR Group has constantly been on the move, guided by a strong entrepreneurial culture. At each stage in its history, PPR has acted boldly and imposed its performance-driven culture, developing each of its businesses and offering them strong prospects for growth. The entrepreneurial spirit lies at the heart of the Group’s fundamental identity and has made PPR a global player in the Luxury Goods and Retail, with revenues of nearly €18 billion in 2005.
A unique combination of two businesses
Today, PPR is one of the rare groups of its size to combine Luxury Goods and Retail. These two different, but complementary, universes where success is closely tied to brand management, the quality of customer services, and control of distribution, are also among the most profi table sectors and give PPR a particularly attractive profi le. Gucci Group, with its prestigious brands, gives PPR a global presence in high-growth markets. The Retail companies are major players in stable and mature consumer markets. By combining both universes, PPR achieves a special balance in terms of products, sales formats, brands and geographic locations, driving higher-than-average growth in its markets.
A strategy of organic growth, focused on international activities
PPR is growing through a strategy of organic growth, generating strong cash fl ow, and emphasis on international activities. In the Luxury Goods activity, Gucci Group combines leading, clearly positioned brands, the complementary features of which form one of the greatest assets. These prestigious brands are expanding because of the growing success of their designers, the expertise of their craftsmen, the relevance of their positioning, and their development in markets offering the most promising momentum for growth. The Retail companies provide steady organic growth in promising markets because of their constant expansion and renewal of the product and service offering, the deployment of e-commerce, the launch of innovative store concepts, and the expansion of the retail network, particularly abroad, both in traditional countries and in high-potential new markets.
A decentralised operational management combined with pooled resources and skills
For a long time, the organisational style of PPR favoured operational decentralisation and proximity to the market and the customer, factors that guarantee responsiveness and speed of adaptation. Resources are pooled to improve performance. Knowledge-sharing among the various brands and companies is systematically encouraged to exploit the specifi c expertise of each company and brand in order to promote group-wide creativity and innovation. This organisation is a key factor in the performance of the Group’s activities.
1110

12PPR 13
Map of worldwide locations
More than 30 catalogues
France 14
United States 11
England 5
Belgium 5
Sweden 5
Norway 4
Finland 3
Germany 2
Austria 2
Switzerland 2
Portugal 2
Denmark 1
Spain 1
Japan 1
Japan 140
Americas 74
Italy 53
France (1) 31
South Korea 21
United Kingdom 19
Taiwan 17
Hong Kong 15
Germany 11
Switzerland 9
China 7
Spain 7
Singapore 5
Australia 4
Guam 4
Malaysia 4
Belgium 3
Austria 1
Netherlands 1
(1) Including Monaco.
426 directly-operated stores
PRINTEMPS
France 18
(1) Excluding Citadium, Made in Sport, Madelios and Printemps Design. Excluding 8 affi liate stores.
18 directly-operated department stores (1)
PPR generated €9,118 million in revenue overseas, representing 51.3% of the total of its activity.
PPR in 2005 - The PPR Group

13 Reference document 2005
109 directly-operated stores (1)
France 68
Spain 12
Portugal 8
Belgium 6
Brazil 6
Italy 5
Switzerland 4
(1) Excluding Fnac Éveil & Jeux, Fnac Service and Surcouf. Excluding 8 joint venture stores.
at 31/12/2005
France (1) 142
Italy 19
Spain 15
Switzerland 11
Portugal 5
Poland 3
Croatia 3
Luxembourg 1
(1) Excluding 47 affi liate stores.
199 directly-operated stores

14PPR 15
2005 highlights
PPR in 2005 - The PPR Group
PPR
Change of name and governance structure for Pinault-Printemps-Redoute
The Shareholders’ Meeting of May 19, 2005 approved the change of the Pinault-Printemps-Redoute corporate name, which offi cially became PPR, a simpler and more international name. The Meeting also approved amending the Group’s bylaws refl ecting the change from a structure with a Supervisory Board and Management Board to a Board of Directors.
At the end of the Meeting, the Board of Directors elected François-Henri Pinault as Chairman and Chief Executive Offi cer of PPR. Patricia Barbizet was elected Vice-Chairman of the Board and François Pinault as Honorary Chairman. Five of the nine Board members elected are independent according to the criteria defi ned in the “Bouton Report”.
In addition, one-third of the Board members are non-French. The three specialised Board Committees (Audit Committee, Remuneration Committee and Appointments Committee) are maintained within the Board of Directors, while a Strategy and Development Committee has been created to identify, study and recommend strategic development initiatives for PPR.
A strong fi nancial structure
In the fi rst half of 2005, PPR completed two disposals under excellent conditions. In April, MobilePlanet, a company specialising in Internet sale of mobile technology products, was sold to eXpansys Holdings Limited for €2.1 million. On June 30, PPR announced the completion of an agreement with Cetelem, a subsidiary of BNP Paribas, for the sale of its residual 10% stake in Facet (Conforama card activity) for €90 million of which 9.69% was sold in the fi rst half.
In an extremely favourable interest rate environment, PPR continued its policy to extend the maturity of its debt and diversify its fi nancing sources with the completion in June of a €300 million bond issue, with a 4% coupon and maturing in January 2013. In March, the Group cancelled 2 million treasury shares. During the year, PPR also sold a net 2,738,618 treasury shares for a total of €224.8 million. As of December 31, 2005, the Group held 149,514 treasury shares, including 25,000 shares under its liquidity contract.
Luxury Goods
With 426 directly-operated stores at the end of December, compared with 398 in 2004, the Luxury Goods activity performed extremely well in all its retail channels, refl ecting the warm welcome that greeted all the 2005 collections from the Group’s brands, particularly Gucci and Bottega Veneta.
These strong performances were driven by a number of initiatives during the year that confi rmed the potential for creativity and innova-tion of the Group’s brands. Leather goods, footwear, designer jewellery and cosmetics recorded very strong growth, and all geographic regions rose signifi cantly.

15 Reference document 2005
and outlook
Gucci
The Gucci brand appointed Frida Gianinni as Creative Director in men’s ready-to-wear (January 2006), in addition to her responsibilities in women’s ready-to-wear (March 2005) and all accessories (April 2004). The brand’s collections again refl ect creative talent, with models that unite youth and glamour, while maintaining the codes related to the history of the brand. As a result, the latest ready-to-wear collection presented by Frida Giannini in September was highly successful.
Every year, Gucci creates over 3,000 items, including several hundred for accessories alone. In 2005, growth was driven by leather goods, with the success of the Hasler, Pelham, Punch and Creole handbag lines and by the carry-over lines (permanent collections) like Abbey, Eclipse, Flora, or even the new La Pelle Guccissima collection launched in 2005. Available in all Gucci boutiques since August, La Pelle Guccissima uses the revolutionary technique of leather embossing, which gives an original and extremely contemporary 3D effect. At the end of 2005, Gucci had 207 directly-operated stores, up from 198 at the end of 2004.
Bottega Veneta
Bottega Veneta pursued the strong growth generated by its growing brand recognition among consumers and the expansion of its directly-operated stores. The brand is positioned in the exclusive fi ne leather goods market with highly sophisticated designs and all the 2005 collections were extremely well received. In leather goods, the leading revenue contributor, the Veneta, Baby bag and Campana bags confi rmed their best-sales positions, while the two new Ball bag and Cocker bag lines were successfully rolled out with the 2005 Fall-Winter collection.
During the year, Bottega Veneta expanded its network of directly-operated stores, raising the number of stores from 65 at year-end 2004 to 83 at the end of 2005, a net 18 openings. Most of the new stores were in Asia: fi ve in Japan, four in Taiwan, four in the South Korea, and four in the rest of Asia. In 2006, the brand will continue its store programme opening with two new fl agship stores on Avenue Montaigne in Paris (300 sq.m.) and in the Omotesando district of Tokyo (270 sq.m.), as well as a 256 sq.m. store in Kalakua in Honolulu.
Yves Saint Laurent
At Yves Saint Laurent, a new management team was established in 2005, with the appointment of Valérie Hermann as Chairman and CEO and Raphaëlle Hanley as Creative Director for the accessory lines, which now represent 35% of the brand’s sales.
The creative talent of Stefano Pilati, Creative Director of Yves Saint Laurent since April 2004, is widely recognised and he has given the brand an avant-garde edge, while maintaining a classic and elegant wardrobe. The Cruise collection which reached the stores in November has performed well. Stephano Pilati continues to expand the accessories offering and designed during the year a new bag named Muse. Created in workshops in Florence, Italy, Muse requires no fewer than 46 pieces of leather for manufacturing and is available in three colours (black, white and chocolate) and three sizes.

16PPR 17
PPR in 2005 - The PPR Group
YSL Beauté
In fragrances, YSL Beauté accelerated the number of new products launched during the year, including Z Zegna, the new perfume from Ermenegildo Zegna, the men’s brand created in 1903. Available in France since April 2005, this fresh, elegant fragrance with a Mediterra-nean fl avour is contained in a glass and metal bottle. The company also launched My Queen in September, the new women’s fragrance created by Alexander McQueen with a base of parma violet. His bottle draws its inspiration from the lines and curves of Art Nouveau, in the great tradition of elegant crystal.
In cosmetics, Rouge Pure Shine, the latest lipstick from Yves Saint Laurent has been one of the success stories of the year. During the summer, YSL Beauté continued to launch its “looks”, special encounters where cosmetics interpret fashion and suggest a trend for the season. Linda Cantello, Artistic Consultant for Yves Saint Laurent make-up, developed the Bayadère Style for 2005, a palette of brilliant colours inspired by the famous stripe pattern of Monsieur Saint Laurent.
Other brands
Balenciaga achieved spectacular growth in its activity over the year under its famous Creative Director Nicolas Ghesquière. His designs, are very close to haute couture, retain and modernise the integrity of the Cristobal Balenciaga, the Spanish founder of the brand, and were highly successful. To complete its fl agship boutiques in Paris and New York, the brand is now working to open stores in Los Ange-les, London and Italy. The brand also expanded its target customer base with the February launch of a line of women’s down jackets in conjunction with Moncler, the specialist in upscale quilted clothing.
At Boucheron, the year was highlighted by the success of the new high-end Trouble Désir jewellery collection, launched in July. In 2005, the brand also opened two new directly-operated stores in Monaco and at Harrod’s, as well as three franchise stores in Al-maty, Dubaï and Shanghai, its fi rst Chinese store. In Paris, the newly renovated historic boutique on Place Vendôme opened its doors at the end of the year. An art book of sumptuous photographs of Boucheron works, titled La Capture de l’Éclat, was also published by Editions Cercle d’Art.
The Italian Luxury Goods footwear designer Sergio Rossi opened a new store on Fifth Avenue in New York. This new fl agship store in North America presents the men’s and women’s shoe collections and the various accessory lines. Edmundo Castillo was appointed Creative Director for the brand; his imprint and Latin spirit will drive the growth of the brand.
Alexander McQueen continued to develop his handbag and footwear lines, designing the Novak bag, to achieve his goal of an identifi able and timeless “McQueen classic”. Prices for this bag range from USD 1,100 for a small model to USD 13,000 for a large bag made from crocodile skin. To heighten the visibility of the brand, the designer also launched a new collection of sports shoes with the German brand Puma and an all-denim ready-to-wear line under the name “McQ – Alexander McQueen” with SINV SpA.
In 2005, Stella McCartney implemented a strategy of selective partnerships designed to initiate younger customers and expand her media coverage. The designer partnered with Adidas to launch a collection of women’s sportswear, celebrating the merger of style and performance. She also created a women’s ready-to-wear line that is both modern and classic for the Swedish retailer H&M.
2005 highlights

17 Reference document 2005
and outlook
Retail
Printemps
In 2005, Printemps Haussmann in Paris opened the new accessories, men’s and women’s spaces at Printemps de la Mode and expanded the children’s and lingerie departments to 300 sq.m. and 2,700 sq.m. respectively. At the Beauty care department, the Beauty Room, a new space on the fi rst fl oor, offers an exclusive collection of about thirty bio and natural international brands.
The Paris stores in Nation and Place d’Italie as well as the Printemps stores in Nancy, Metz, Marseille, Rennes and Toulon continued to renovate and modernise. The Deauville store was completely renovated and offers new trendy brands along with an extensive watch and jewellery selection.
Reaffi rming its positioning as the fashion trendsetter, Printemps has increased traffi c in its stores with innovative events. The themes of Frénétique Brésil, Parenthèse Végétale and Numéro de Charme marked the seasons of the year, while the Christmas season was organised on the theme of Great Britain, suggesting fashion and new products, tradition and eccentricity.
Citadium renovated its selling areas for better visibility and dedicated a space to Adidas by Stella McCartney. The company also launched its website at citadium.com, the showcase for the megastore and current news. Made in Sport launched promotional campaigns tied to sports events like the next soccer World Cup. Two new stores were opened in Nancy and Nantes during the year.
Redcats
In France, the Redcats brands continued their quest for innovation. La Redoute is strengthening its positioning as a fashion player, offering a new line of La Redoute by Gaultier clothing with the signature stripes of the designer in his 2005 Spring-Summer catalogue. At the same time, as part of its strategy to expand internationally, La Redoute entered the Norwegian, Greek and Italian markets. Its presence in Italy is based on a partnership agreement with Postalmarket (Bernardi Group), which will begin with the 2006 Spring-Summer collection, distributed through a catalogue printed in 450,000 copies and on Internet (www.laredoute.it).
So’Home, the home furnishings catalogue of La Redoute, received double recognition during the year: the award for best catalogue design and the award for best consumer catalogue.
Somewhere expanded its distribution concepts with the launch of an entirely new trial boutique dedicated to men’s ready-to-wear in the retail centre Marché de Saint-Germain in Paris, and a new franchise experiment in Saint-Étienne. The brand also won the 2005 trophy for best merchant site at the direct retail trade show.
Daxon modernised its new 2005 Spring-Summer catalogue targeted at seniors with a new sports line featuring Florence Arthaud the navigator.
Finally, at the end of December, Vertbaudet launched VB2U (“VB to you”), a new catalogue designed exclusively for the 10 to 15 year- age group. The 2006 Spring-Summer collection, in which 70% of the products have been designed by the Vertbaudet stylists under its own brand name V.I.K., will also appear on Internet in 2006 on the website www.vertbaudet.fr.
In the United States, three new catalogues came out early in the year: two catalogues of overstocked items (“Brylane Catalog Outlet” and “Chadwick’s Catalog Outlet”) and a catalogue of outsize lingerie by Roaman’s (“Intimate Promise”). At the same time, in April Redcats launched Millena, a new Internet platform shared by the websites of the “Home & Lifestyles” brands in the United States and laredoute.fr. The teams are now able to set up in less than one day a short-term sales operation to react more quickly to the competition, economic conditions and customer expectations.

18PPR 19
2005 highlights
Fnac
In 2005, Fnac continued to expand its retail network, which consisted of 109 stores at year-end (excluding joint venture stores). In France, Fnac opened its 68th store in a 1950 sq.m. space in Limoges, the only French city with more than 100,000 inhabitants where the company was not present.
Internationally, Fnac accelerated its growth in Spain, with 12 Spanish stores at the end of 2005, after the May opening of the third Madrid store in the Parque Sur retail centre and a store in Saint-Sébastien in the Basque country in September.
In Portugal, Fnac opened its eighth store in Albufeira in southern Portugal in June.
In December, the company also opened its fi rst Greek store in Athens, in a 2100 sq.m. space in the largest retail centre in Greece, in partnership with the Marinopoulos group.
These new stores also included the introduction of a new architectural concept based on a more airy layout and a new signage, along with a customer walkway staked out by the latest new products.
Fnac Éveil & Jeux opened six new stores during the year, raising its sales points in France to 30. Since May, the new Fnac Éveil & Jeux space on the 7th fl oor of the department store has highlighted the exclusivity of the toy offering from Printemps Haussmann. Other new stores were opened in the centres of Nice, Marseille, Angers, Nîmes and Lyon.
Surcouf opened its fi rst store outside France in Barakaldo, Spain, offering 10,000 items in a 3,000 sq.m. space. At the same time, the company expanded its product offering with the creation of Surcouf Affaires, a Paris 100 sq.m. destocking outlet. Surcouf also launched a portal for downloading video games in partnership with Metaboli, the European leader in the sector.
Conforama
Early in 2005, Christophe Cuvillier was named Chairman and Chief Executive Offi cer of Conforama, after fi ve years with Fnac. In February, Conforama enhanced its discount image with a new advertising theme: “Confort at home at an affordable price” (Bien chez soi, bien moins cher), relayed both through advertising campaigns and in the stores.
In France, the company expanded the number of its stores with the opening of two new sites, raising the number of directly-operated stores to 142. In May, Conforama opened its nineteenth Ile-de-France store in Saint-Brice (Val-d’Oise), covering an area of 4,200 sq.m., and rebuilt its 3,000 sq.m. store in Morsbach (Moselle). In March, Conforama also expanded its store in Vitry-sur-Seine (Val-de-Marne), which occupies 7,100 sq.m., the company’s third largest store.
At the same time, Conforama strengthened its logistics capacities in France with the launch of the Le grand Lyon platform, reorganising the company’s historic sites at a 41,000 sq.m. site with 36 unloading docks. Conforama also opened a new platform in the north in Onnaing, covering 30,000 sq.m..
Conforama consolidated its international positions in its traditional markets. In Switzerland, the company opened two new stores in Emmen in March (4,800 sq.m.) and in Saint-Gall in August (4,000 sq.m.). With 11 stores in Switzerland, Conforama wanted to expand its logistics capacities and opened a new platform in Niederbipp (Bern canton). The platform covering 30,000 sq.m. with 37 unloading docks will enable the company to meet the challenges of long distance sourcing and signifi cantly improve the level of service to the stores.
In the high priority Spanish market, Conforama opened two stores during the year, increasing its Spanish store network to 15. The new store in Barakaldo near Bilbao has occupied 3,700 sq.m. since May in the country’s largest retail centre, while the Malaga store (Andalusia), opened in April, for the fi rst time offers a space dedicated to home decorating products, which covers more than 15% of the 4,000 sq.m. selling space.
PPR in 2005 - The PPR Group

19 Reference document 2005
and outlook
In Italy, in May, the company successfully converted for the fi rst time an Emmezeta store into a Conforama in Sassari in Sardinia. The product offering extends over 6,000 sq.m. and the bazaar, do-it-yourself and entertainment departments, specialities of the Emmezeta stores that are highly valued by Italian customers, complete the traditional Conforama offering. At the end of 2005, Conforama had a network of 57 international stores.
CFAOIn the automotive sector, CFAO continued to expand in Mediterranean Africa with the acquisition in Morocco of Daf Industrie Maroc (DIM), a company specialised in the distribution of trucks over 15 tons. This acquisition enables CFAO Motors Maroc to expand its product offering through a broad range of vehicles of all sizes. CFAO also signed an agreement with Libyan NA Energy Group to create a high-level auto service centre before it begins to import and sell new vehicles in Libya.
Eurapharma, the CFAO health activity, expanded its logistics capacities during the year with the opening of its fi rst automated pharmaceutical distribution company in Martinique, a novelty in the Caribbean region, and the launch of a new logistic platform near Rouen that covers an area of 12,500 sq.m.. This platform equipped with the latest in equipment is located near the Paris airports and the port of Rouen, enabling Eurapharma to offer optimised logistics solutions to its clients.
In February, CFAO Technologies purchased the Intelec Communications business, which distributes especially the Motorola and Sagem brands in Ivory Coast.
Kadéos
In 2005, Kadéos grew rapidly, recording a 23.2% revenue increase generated by growth in the product offering. In March, the company launched a gift card in the Group’s companies in the French market. Sold via self service and useable in stores, by phone or on Internet, the Kadéos gift card boosted the company’s sales potential by more than 10%. Since April, Kadéos has also offered works councils a new culture-voucher for cultural products and sites.
Post-closing events
In January 2006, Conforama strengthened its position as market leader in France when it acquired majority control of the Sodice Expansion group, its principal franchisee, in which it held 31.98%. Sodice operates 14 stores under the Conforama name in the Nord-Pas-de-Calais region, representing a sales area of 57,000 sq.m., which strengthens Conforama’s position in a key region.
On April 5, 2006, YSL Beauté presented a project plan to reorganise its services and industrial activities to the works councils of its industrial plant in Bernay and its headquarters in Neuilly-sur-Seine.The luxury perfumes and cosmetics market is currently characterised by very fl at growth, an increasingly competitive environment and a strong concentration of both cosmetics and distribution groups.In this context, YSL Beauté has to be more responsive to and more innovative in meeting market needs and create a stronger investment capacity to support its brands. It should also improve the competitiveness of its production.The reorganisation plan involves resizing the services of its Headquarters operation and consolidating the industrial activities in Lassigny (Oise).The optimisation of the headquarters’ structure would facilitate improvements in operations including decision-making and management processes and result in closer proximity to the markets. Regarding the Bernay plant, YSL Beauté has received an offer from a fragrance/cosmetic industrialist who is willing to acquire the plant and maintain 224 production employees representing two thirds of the current workforce. Taking into account all current vacant positions as well as new positions that should be created at Neuilly headquarters and in Lassigny, and subject to the necessary mobility, the reorganisation project could affect the employment of 118 people in Neuilly and 45 in Bernay.

20PPR 21

21 Reference document 2005
22 Luxury Goods22 Presentation of the Luxury Goods activity: Gucci Group
26 Gucci
28 Bottega Veneta
30 Yves Saint Laurent
32 YSL Beauté
34 Other brands: Balenciaga, Boucheron, Sergio Rossi,
BEDAT & CO, Alexander McQueen,
Stella McCartney
38 Retail38 Presentation of the Retail activity
42 Printemps
46 Redcats
52 Fnac
58 Conforama
62 CFAO
66 Other activities: Kadéos, Orcanta Lingerie
The Group’s activities

22PPR 23
Presentation of the Luxury
The Group’s activities – Luxury Goods
a3,036 M2005 revenue
a390 M2005 recurring operating income
12,843employees at end 2005
426directly-operated stores at end 2005
• A worldwide player in Luxury Goods • A portfolio of leading brands: Gucci, Bottega Veneta, Yves Saint Laurent, YSL Beauté,
Balenciaga, Boucheron, Sergio Rossi, BEDAT & CO, Alexander McQueen and Stella McCartney
• 17.1% of PPR’s total revenue• 34.1% of PPR’s recurring operating income (excl. holding company)
A leading player in the luxury goods industry
Gucci Group is one of the world’s leading multi-brand luxury goods companies with a portfolio of tier-one brands. The Gucci, Bottega Veneta and Yves Saint Laurent brands are the main drivers of profi table, organic growth. Boucheron, Gucci Group Watches, YSL Beauté and BEDAT & CO have opened up new market segments and complementary expertise in jewellery, watches, fragrances, cosmetics and beauty care products. Finally, Balenciaga, Sergio Rossi, Alexander McQueen and Stella McCartney show promising growth potential.
With its prestigious brands, extensive geographical presence and broad product range, Gucci Group is a major player in luxury goods worldwide. Its competitors are international groups, such as Armani, Bulgari, Cartier, Chanel, Christian Dior, Ferragamo, Hermès, Louis Vuitton and Prada; major international players in the fragrance, cosmetics and skincare industry, including Estée Lauder, L’Oréal and Shiseido; as well as local or international companies involved in some or all of the product categories marketed by Gucci Group.
Global presence
Gucci Group is present in all of the world’s major luxury goods markets. Its goal is to strengthen its positions in the highest growth potential markets. All of the Gucci Group brands are developing a signifi cant local client base, while continuing to exploit the opportunities offered by the global tourist market.
Breakdown of 2005 revenue by brand
59.5%
5.3%
GUCCI
BOTTEGA VENETA
YVES SAINT LAURENT
YSL BEAUTÉ
OTHER
9.7%
20.2%
5.3%
Breakdown of 2005 revenue by product category
6.2%
6.9%
LEATHER GOODS
FRAGRANCES
READY-TO-WEAR
SHOES
OTHER
WATCHES
COSMETICS
JEWELLERY
SKINCARE PRODUCTS
39.8%
4.1%
13.6%
5.2%1.3%
11.7%
11.2%

23 Reference document 2005
Goods activity: Gucci Group
In 2005, Gucci Group generated revenue of €3,036 million, up by 11.9%.
With revenue of €1,258 million, Europe is a key market for the Group, which recorded 10.3% revenue growth for the year thanks to product quality and a highly selective policy of opening directly operated stores.
In North America, Gucci Group recorded revenue of €595 million in 2005, an increase of 7.6% comparate to 2004. Given its importance in the global economy, North America remains a high-potential region for the luxury goods industry.
Gucci Group is committed to expanding its share in the fast-growing markets of Asia, where it recorded a 16.1% growth in 2005. At the end of the year 2005, 217 of its 426 directly-operated stores were located in this area. Over the next two years, 50% of the new Gucci Group store openings will take place in Asia.
A broad, diversifi ed product portfolio
Gucci Group designs, manufactures and markets high-end luxury goods items, including ready-to-wear, leather goods, shoes, watches, jewellery, ties and scarves, fragrances, cosmetics and skincare products. The extensive product range is one of the Group’s greatest strengths. It is a source of organic growth and one of the main criteria for the acquisition policy conducted between 1999 and 2001.
As a multi-brand group, Gucci Group has promoted the sharing of knowledge among its various brands, capitalizing on the specifi c expertise. The Gucci brand, which has a long-standing reputation in fashion, leather goods and accessories, has shared its in-depth knowledge with the other brands of the Group to successfully build the Group market share in the luxury goods industry. Gucci Group Watches manufactures its products in Switzerland and markets Gucci, BEDAT & CO and Boucheron timepieces worldwide. Lastly, YSL Beauté creates, manuf actures and distributes fragrances and cosmetics for Yves Saint Laurent, as well as fragrances for Boucheron, Alexander McQueen and Stella McCartney.
Breakdown of 2005 revenue by geographical area
EUROPE
NORTH AMERCIA
JAPAN
ASIA P ACIFIC EXCLUDING JAPAN
OTHER
41.4%
5.0%
15.7%
19.6%
18.3%
GUCCI
YVES SAINT LAURENT
OTHER
BOTTEGA VENETA
Number of directly-operated stores

24PPR 25
Presentation of the Luxury
A controlled distribution network
Management of brands and brand image is tightly controlled through the distribution network. The carefully controlled development of an integrated distribution network with a sound geographical basis has been a key strategic focus for Gucci Group. Fashion goods and accessories are mainly sold in directly-operated stores which are designed according to a specifi c concept for each brand, ensuring consistency in terms of product display and service quality around the world. The 426 directly-operated stores generated 54% of Gucci Group revenue in 2005.
Gucci Group’s products are also distributed through a selected number of exclusive franchise stores, duty-free boutiques, department and specialty stores. The Gucci Group Watches activity markets its products directly through jewellery stores on most major markets, or through third parties. YSL Beauté focuses on locations which correspond best to its product prestigious image, marketing its products through subsidiaries in upscale perfume shops, department stores and duty-free boutiques.
A rigorous communication policy
Creative design, product quality and brand image are closely linked in the luxury goods industry. Through rigorous management of brand image, tight communication policy, outstanding product quality and a carefully controlled distribution network, Gucci Group has succee-ded in strengthening and reinforcing its brands’ leading status over the past few years. The goal of the communication activities, which combine fashion shows, advertising campaigns, public relations, special events and store displays, is to maintain the brands’ exclusive image while ensuring high profi le and consistent visibility and reinforcing their market positioning at the international, national and local level.
The Group’s activities – Luxury Goods
Contribution of each brand to 2005 recurring operating incomeAs % of recurring operating income
124.6%
3.5%
-16.9%
4.0%
-15.2%
GUCCI
BOTTEGA VENETA
YVES SAINT LAURENT
YSL BEAUTÉ
OTHER

25 Reference document 2005
Goods activity: Gucci Group
Strategy
Gucci Group’s strategy is based on three main objectives: ensuring revenue growth and profi tability at Gucci Group, refocusing on the Gucci brand and assigning a specifi c task to each brand within the portfolio. The latter point strengthens the coherence of the multi-brand strategy.
In order to implement its strategy, Gucci Group has overhauled its organisational structure. The Group has granted substantial autonomy, within specifi c guidelines, to the CEOs of the various brands who are now in charge of design, merchandising and all aspects of the operating and fi nancial results of their respective brands.
Regarding the supply chain, Gucci Group takes care to guarantee exceptional product quality. To achieve this, it selects the very best materials and exercises very strict controls over production, whether in-house or by outside partners. Prototype development and the entire manufacturing process are monitored constantly for quality control. In addition, Gucci Group is making its supply chain more fl exible in order to rotate its collections and replenish stocks faster during the season. The group also keeps a watchful eye on practices by the main competitors in luxury goods and other industries in order to stay on top in terms of supply chain.
Outstanding fi nancial performance
In 2005, Gucci Group posted revenue of €3,036 million, an increase of 11.9%, representing 17.1% of the PPR Group’s revenue. It also gene-rated operating income of €390 million, an increase of 35.4%, representing 34.1% of PPR operating income (excluding holding company).
2,712
288
3,036
390
2004 (1) 2005
REVENUE (IN € MILLION)
RECURRING OPERATING INCOME (IN € MILLION)
Revenue and recurring operating income
(1) Adjusted for the impact of the transition to IFRS and change in the reporting period of Gucci Group.

26PPR 27
Brand established in
1921
a1,807 M2005 revenue
a485 M2005 recurring operating income
5,611employees at end 2005
207directly-operated stores at end 2005
Business concept
Founded in Florence in 1921, Gucci built its reputation by specialising in the creation of high-quality leather goods. As Gucci Group’s fl agship brand, it is now one of the most prominent and profi table brands in the luxury goods sector. Gucci manufactures and markets leather goods (handbags, small leather goods and luggage), shoes, ready-to-wear, silks and jewellery. The products are sold exclusively through directly-operated stores and through exclusive Gucci franchise stores, department stores and specialty stores around the world. In addition, Gucci manufactures and distributes watches through Group-owned Gucci Group Watches in Switzerland. Licensed distributors manufacture and distribute Gucci brand eyewear and fragrances.
Positioning
Gucci’s strong heritage is built on key critical foundations of uncompromising quality, superior crafts-manship and made in Italy.
The Creative Leadership strengthened the focus on iconic brand symbols (Horsebit, Bamboo, GG logo, Green/Red/Green web, Flora), re-inventing them in a modern and luxurious way. Their understanding and appreciation for the brand’s heritage, together with the extraordinary talent in providing a fresh and modern interpretation, drove Gucci to the excellent 2005 results.
Gucci has thus confi rmed its outstanding growth potential in its main product categories and regions worldwide, through the creative and innovative appeal of its offering, underscored by the increased emphasis on communication policy and the development of exclusive goods.
Strategy
Gucci’s growth strategy emphasises three main areas of action: capitalising on its state-of-the-art positioning in fashion, innovation and product quality; maintaining the strong momentum in leather goods and shoes; exploiting new opportunities in jewellery, ready-to-wear and watches, as these product categories have recorded improved results since the fourth quarter of 2005 and should continue to post strong growth in 2006.
Breakdown of 2005 revenue by geographical area
Breakdown of 2005 revenue by product category
EUROPE
JAPAN
ASIA PACIFIC EXCLUDING JAPAN
NORTH AMERICA
OTHER
LEATHER GOODS
SHOES
READY-TO-WEAR
WATCHES
JEWELLERY
OTHER
32.8%
3.3%
20.5%
22.7%
20.7%
6.8%
54.3%12.2%
5.1%
12.7%
8.9%
The Group’s activities – Luxury Goods

27 Reference document 2005
Gucci operates in 55 countries, and thanks to strong global brand recognition the brand is successfully developing its presence in the emerging markets. The global balance of the revenue breakdown by geographical area ensures that future results will come from a com-bination of continued growth in the major markets (Europe, Japan, and USA) and exploiting opportunities in fast growing new markets, such as China where Gucci owned seven stores as at the end of 2005.
Financial results
In 2005 Gucci revenue amounted to €1,807 million with an increase of 13.6%. Directly-operated stores represented 71% of 2005 revenue and recorded a 14.7% increase. Gucci posted double digit growth in each of the major geographical regions, i.e. Europe (which accounts for 32.8% of revenue), USA (20.5%), and Asia Pacifi c excluding Japan (20.7%). Leather goods, the cornerstone of the Gucci heritage, continue to be the core business, representing 54% of revenue. Gucci Group recorded a strong increase in recurring operating income, which rose by 14.7% to €485 million, with operating margin at 26.9%, compared to 26.6% in 2004.
2005 highlights and outlook
In July 2005, Mark Lee was appointed CEO of the Gucci brand. Mark Lee was formerly President and Managing Director of the Gucci brand from November 2004 and has worked with Gucci Group since 1996.
In terms of new products, 2005 was characterised by the launch of La Pelle Guccissima, the fi rst signature leather collection introduced in August. La Pelle Guccissima is a perfect expression of a modern classic, the Gucci tradition in a new, luxurious interpretation. The legen-dary Gucci symbols, GG logo and the horsebit, have been redefi ned by Frida Giannini, Creative Director of the brand, using precious and innovative materials. The extremely positive reaction of the market contributed to increased leather goods and footwear activity, making La Pelle Guccissima a new core business to be renewed each season.
In 2005, Gucci opened important stores in a number of key markets, including Canada (Vancouver), South Korea (Hyundai Ulsan), and the USA (Naples). At the end of 2005 Gucci has 207 directly-operated stores worldwide.
As the brand approaches its 85th anniversary (1921–2006), the goal for the coming year is to strengthen the presence both in consolidated markets and in emerging countries, leveraging the positive momentum for accessories and shoes.
1,590
423
1,807
485
2004 (1) 2005
REVENUE (IN € MILLION)
RECURRING OPERATING INCOME (IN € MILLION)
Revenue and recurring operating income
(1) Adjusted for the impact of the transition to IFRS and change in the reporting period of Gucci Group.

28PPR 29
The Group’s activities – Luxury Goods
Brand established in
1966
a160 M2005 revenue
a14 M2005 recurring operating income
741employees at end 2005
83directly-operated stores at end 2005
Business concept
Bottega Veneta – meaning “Venetian workshop” – creates luxury goods based on its core values of quality, craftsmanship, exclusivity and discreet luxury. The brand began as a leather goods house made famous through its signature intrecciato, a unique leather weaving technique created by the Bottega Veneta artisans, and it has now a full product range of leather goods (handbags, small leather goods and full collection of luggage), men and women’s ready-to-wear, shoes, and other accessories.
Positioning
From its beginning, Bottega Veneta has stood for the highest craftsmanship, the choice of fi nest materials product, design innovation and softness of its products. It was the fi rst brand to introduce the deconstructed bag as opposed to the usual rigid construction of handbags coming from the French school. However, at the time the brand was bought by Gucci Group in February 2001, the company was in a diffi cult position having gone through a number of failed re-positioning attempts following the departure of its founder and his creative vision in the early 1980s.
Under the creative leadership of Tomas Maier and a new management team, Bottega Veneta has re-established its high-end luxury positioning with products able to satisfy the most demanding clients. By combining traditional luxury goods values – exclusivity, craftsmanship and the highest quality – with inno-vation, its products are modern with timeless elegance. Bottega Veneta is synonymous with understated elegance and in keeping with the brand’s slogan, “When your own initials are enough”, the label is only present inside the products. Bottega Veneta owes its exceptional product quality to the work of its meticulous craftsmen based in its workshop in Vicenza.
Bottega Veneta products are sold exclusively through a tightly-controlled distribution network of directly-operated stores, exclusive franchise stores and carefully selected department and specialty stores around the world. At the end of 2005, Bottega Veneta had a network of 83 directly-operated stores, which generated 87% of the brand’s 2005 revenue.
Breakdown of 2005 revenue by product category
LEATHER GOODS
SHOES
READY-TO-WEAR
OTHER
Breakdown of 2005 revenue by geographical area
JAPAN
EUROPE
NORTH AMERICA
ASIA PACIFIC EXCLUDING JAPAN
OTHER25.1%
0.3%
22.5%
33.2%18.9%
5.2%
85.0%
2.8%
7.0%

29 Reference document 2005
Strategy
Bottega Veneta continued to strengthen its position as a brand dedicated to life-style through its jewellery collections, furnishings (decorative accessories, tableware and offi ce items, candles and interior fragrances) and gift items, whose launch was a great success.
Bottega Veneta is and will remain an exclusive and discreet niche market luxury brand.
Financial results
In 2005, revenue amounted to €160 million, a 60.2% increase year on year. Thanks to the consistent strengths of the collections, reve-nue for the period was driven by strong performance in both existing and in the newly opened directly-operated stores as well as in the wholesale distribution channel. In 2005, Bottega Veneta recorded a profi t and exceeded its initial target, with recurring operating income at €14 million.
2005 highlights and outlook
Bottega Veneta had many successes in 2005. The brand opened 18 new directly-owned stores, increasing its presence signifi cantly in the Asia Pacifi c excluding Japan, where the brand opened 10 new stores in the year.New handbag styles launched in 2005 were major successes and styles such as the Cocker and the Ball Bag are in the top 10 best sellers along with the long standing Veneta. The exclusive limited edition handbag the Cabat was described by the leading Italian newspaper, Il Corriere della Sera as “the desired object of excellence for any woman”. The Cabat continues to be produced in such limited quantities that many stores now carry waiting lists.In March 2005, Tomas Maier presented the brand’s fi rst women’s ready-to-wear runway show which received very positive reviews; the second runway show held in October 2005 received even stronger reviews, confi rming the success of the collections. The runway shows led to the strong development of the ready-to-wear, shoes, jewellery and belts activities, whilst highlighting the outstanding level of craftsmanship in handbags and leather goods. The feedback from the new 2006 Spring/Summer collections has been already very strong and gives a positive outlook for 2006.
The brand plans to open new stores in 2006. After opening a fl agship store on Avenue Montaigne in Paris (300 sq.m.), the company plans to open a new store in the Omotesando area in Tokyo (270 sq.m.), and another one in Kalakua, Honolulu (256 sq.m.).
REVENUE (IN € MILLION)
RECURRING OPERATING INCOME (IN € MILLION)
Revenue and recurring operating income
(1) Adjusted for the impact of the transition to IFRS and change in the reporting period of Gucci Group.

30PPR 31
The Group’s activities – Luxury Goods
Brand established in
1961
a162 M2005 revenue
-a66 M2005 recurring operating income
921employees at end 2005
62directly-operated stores at end 2005
Business concept
Yves Saint Laurent core product lines are men’s and women’s ready-to-wear, leather goods and shoes. The brand distributes its products and collections through directly-operated and franchise stores, as well as through department stores and specialty boutiques. Yves Saint Laurent grants licenses for the production and distribution of some products, including selected men’s ready-to-wear and eyewear.
Positioning
Since its foundation in 1961 Yves Saint Laurent has been a global success and had lasting impact on fashion. For nearly 40 years, founder Yves Saint Laurent built a reputation as one of the 20th century’s most innovative and provocative designers. He instigated the move toward ready-to-wear collections, which represented the fi rst step in making designer labels accessible to a wider public.
Since Gucci Group acquired Yves Saint Laurent in 1999, the management team has been focused on repositioning the brand at the top end of the luxury goods market. The number of licences has been cut from 167 to 11. Alongside the brand repositioning, signifi cant investments have been made in the network of directly-operated stores and manufacturing facilities. Today Yves Saint Laurent operates 62 directly-operated stores, including fl agship stores in Paris, New York, London and Hong Kong. The di-rectly-operated stores generated 67% of Yves Saint Laurent revenues in 2005. The brand is also present in more than 400 of the most prestigious boutiques and multi-brand department stores in the world. At the same time, Yves Saint Laurent has successfully expanded into accessories, complementing its core ready-to-wear business. Thanks to Gucci’s expertise in leather goods, Yves Saint Laurent has a thriving activity in leather goods and shoes, which now accounts for 45% of the brand’s revenue.
Breakdown of 2005 revenue by geographical area
10.5%
44.1%12.8%
EUROPE
NORTH AMERICA
JAPAN
ASIA PACIFIC EXCLUDING JAPAN
OTHER
6.5%
26.1%
Breakdown of 2005 revenue by product category
13.1%44.5%
9.4%1.1%
READY-TO-WEAR
LEATHER GOODS
SHOES
OTHER
BRISTLE31.9%

31 Reference document 2005
Strategy
Alongside the brand repositioning, Yves Saint Laurent current challenge is to improve fi nancial performance through increased revenue. Yves Saint Laurent prime objective is therefore to create highly desirable products which refl ect the very essence of the brand. This will involve broadening the product range while respecting the brand’s fundamental identity and its historical presence in ready-to-wear.
Financial results
Yves Saint Laurent’s annual revenue totalled €162 million, with a decline of 4.3% compared to 2004. The softness in the fi rst nine months of the year was partially offset by a better fourth quarter. The operating loss stood at €66 million, down by €5 million over one year.
2005 highlights and outlook
2005 was an important year for Yves Saint Laurent management with the appointment of Valérie Hermann as the new CEO.
After softer fi rst 9 months, the 2005 last quarter showed positive signs of recovery in most of the businesses, in particular shoes and lea-ther goods, with good momentum in December. Europe and Asia Pacifi c excluding Japan saw higher growth, thanks also to the success of the 2006 ready-to-wear Cruise collection as well as the newest leather goods products (i.e. Muse bag).Yves Saint Laurent has established excellent management and creative design teams which will ensure the brand’s success. In 2005, Stefano Pilati, the very talented Creative Director for the entire product range, received critical acclaim worldwide and was named “Designer of the Year” by the Spanish press.
169
-71
162
-66
2004 (1) 2005
REVENUE (IN € MILLION)
RECURRING OPERATING INCOME (IN € MILLION)
Revenue and recurring operating income
(1) Adjusted for the impact of the transition to IFRS and change in the reporting period of Gucci Group.

32PPR 33
The Group’s activities – Luxury Goods
a613 M2005 revenue
a15 M2005 recurring operating income
4,034employees at end 2005
Business concept
YSL Beauté creates, produces and distributes fragrances and cosmetics under the Yves Saint Laurent and Roger & Gallet brands, as well as fragrances for Gucci Group brands like Stella McCartney, Alexander McQueen and Boucheron. YSL Beauté sells its products through leading department stores, specialty stores and duty-free boutiques and uses distribution agents, overseen by its regional offi ces, to reach the markets not covered by its subsidiaries.
Strategy
YSL Beauté is a major player in the luxury fragances and cosmetics market. As a multi-brand company, it develops and expands each brand in its portfolio on the basis of the brand’s distinctive features. Its products represent the state of the art in terms of quality, creativity and technology. YSL Beauté’s reactivity and fl exibility enables it to promptly respond to changing market trends.
YSL Beauté contributes to global awareness of the Yves Saint Laurent brand as well as of Alexander McQueen, Boucheron, and Stella McCartney, and provides Gucci Group with privileged access to the luxury fragrances and cosmetics sector.
Breakdown of 2005 revenue by product category
25.9%
6.6%
FRAGRANCES
COSMETICS
SKINCARE PRODUCTS
OTHER
67.1%
Breakdown of 2005 revenue by geographical area
5.3%
68.5%
EUROPE
NORTH AMERICA
ASIA PACIFIC EXCLUDING JAPAN
JAPAN
OTHER
5.2%
14.8%
6.2%
0.4%

33 Reference document 2005
Financial results
During a challenging year for the sector, YSL Beauté’s revenue totalled €613 million, a decrease of 1.3%. Revenue was driven by make up and the new designers’ fragrances (such as Stella by Stella Mc Cartney, My Queen by Alexander Mc Queen and Z Zegna by Ermenegildo Zegna). Recurring operating income stood at 15 million euros.
2005 highlights and outlook
For the Yves Saint Laurent brand, 2005 was characterized by the consolidation of Cinéma, its latest women’s fragrance launched in October 2004. It has become the third pillar line of the brand alongside Opium and Paris. Make-up represented a key segment in terms of turnover and brand identity. Its growth was continuous and homogeneous worldwide, thanks to a high profi le image and technological novelties, and to star products such as Touche Eclat and Mascara Volume Effet Faux Cils. Skincare remained stable, in spite of the high potential of its market, due to the lack of novelties in the course of the year.Sales of the designers’ fragrances were very successful during the year, while the traditional brands (like Oscar de La Renta or Van Cleef & Arpels) suffered through a diffi cult distribution market.
621
23
613
15
2004 (1) 2005
Revenue and recurring operating income
(1) Adjusted for t he impact of the transition to IFRS and change in the reporting period of Gucci Group.
REVENUE (IN € MILLION)
RECURRING OPERATING INCOME (IN € MILLION)

34PPR 35
Other brands
The Group’s activities – Luxury Goods
The following section covers Balenciaga, Boucheron, Sergio Rossi, BEDAT & CO, Alexander McQueen and Stella McCartney. Since joining Gucci Group, all of these brands have seen their revenue increase signifi cantly, thanks to the individual creative vision of their designers and the Group’s fi nancial support.
Gucci Group’s support involved substantial investments to fund the development of their collections, the opening of exclusive stores in the fashion capitals considered strategic for each brand, the development of the wholesale network on a worldwide scale, and the implementation of the infrastructure needed to support the growth. The growth of these brands will require the business success of their collections, a carefully controlled development of wholesale network and directly-operated stores, and improved productivity.
Balenciaga
The House of Balenciaga is one of the most infl uential forces in fashion. Founded in 1919 by Cristóbal Balenciaga and established in Paris from 1936, the House’s haute couture defi ned many of the greatest moments and movements in fashion from the 1930’s to 1960’s. The provocation of its design and vision, the mastery of techniques and cut, and the constant innovation in fabrics marked out a special place for Balenciaga in the hearts and minds of its privileged clients and followers.
In 1995, Nicolas Ghesquière joined Balenciaga and presented his fi rst collection two years later, at the age of 26. The young Designer’s work has since captured the attention of both the media and the customers. Critical acclaim, including the VH1 Award for “Avant-Garde Designer of the Year” in 2000 and the “2001 International Designer Award” from the Council of Fashion Designers of America also recognized and contributed to the brand’s business success.
Gucci Group partnered with Nicolas Ghesquière in 2001 to accelerate the development of the activity internationally. Sales in the brand’s men’s and women’s ready-to-wear and accessories collections have since grown exponentially, enabling the brand to post a profi t in 2005.
While the brand’s identity is fi rmly anchored and refl ected in its iconic ready-to-wear collections, the bag and shoe ranges have also enjoyed phenomenal success worldwide. The women’s ready-to-wear collection covers a wide range of price positioning, from the iconic pieces, to the more continuative “capsule” products that provide broader customers access to Balenciaga’s style.
In the early years of its modern renaissance, Balenciaga has deliberately prioritized the exclusivity of its distribution. With its product platform now well established and demand for bags, clothes and shoes now high, Balenciaga is looking forward to selective growth in its international distribution network. The House unveiled the new store concept in its New York and Paris fl agships during 2003, and further retail stores are in planning. Franchise and similar exclusive distribution arrangements are in operation or under negotiation with fi rst class partners in key franchise markets such as Hong Kong, Taiwan, South of Korea, Singapore, Russia and Middle Eastern markets. Wholesale distribution presence is also targeted to increase, while carefully preserving the brand’s undeniable prestige and mystique. This spirit, both from its heritage and its more contemporary incarnation, will be show-cased in a major exhibition to be held from July 2006 at the Musée de la Mode et du Textile in Paris. A great and fi tting tribute for a House that enjoys again the provocative infl uence it wielded for decades.
a294 M2005 revenue
1,536employees at end 2005
74directly-operated stores at end 2005

35 Reference document 2005
Boucheron
Established in 1858, Boucheron was the fi rst jeweller to establish a store on the famous Place Vendôme in 1893. It was also the fi rst to use new materials in its jewellery and to launch innovative products, such as interchangeable watch straps. For nearly 150 years Boucheron has been a trend-setter in the exclusive jewellery segment, acquiring an international reputation.
A Gucci Group subsidiary since 2000, Boucheron manufactures and distributes jewellery, watches and luxury fragrances through directly-operated stores, including its fl agship store on Place Vendôme in Paris, franchise stores, department stores and exclusive multi-brand boutiques. Since 2003, YSL Beauté has managed all aspects of Boucheron’s fragrance activity, including marketing, distri-bution and coordination of the subsidiaries and international distributors.
The year 2005 marked the beginning of a new era for Boucheron in terms of image, communication, retail network and products.A new store concept was created exclusively for the fl agship boutique on Place Vendôme. A new advertising campaign with legendary characters was launch and a new web-site has been created. A fi ne art book entitled La Capture de l’Eclat (Capturing the Sparkle) with sumptuous photographs was published (Publisher Cercle d’Art). Boucheron opened two directly-operated stores in Monaco and at Har-rod’s and three franchise stores in Almaty, Dubai and Shanghai.The last high-jewellery collection, Trouble Désir, was an excellent success as well as four new jewellery lines and three new watch models were successfully launched in 2005.
Sergio Rossi
Sergio Rossi is a leading Italian luxury goods brand focusing on manufacturing and distributing glamorous shoes for women. The company also produces and distributes handbags and men’s shoes. Its products are distributed through directly-operated stores, leading depart-ment stores and upscale specialty boutiques. Sergio Rossi has built a notable reputation in Italian luxury goods through a combination of exceptional product quality and unique style, season after season. Gucci Group’s acquisition of Sergio Rossi in 1999 marked a new stage in the development of this brand, whose origins date back to the 1950s. The Italian shoe manufacturer has tripled its distribution network, which included 43 stores as at end 2005.
In 2005, Sergio Rossi revenues declined compared to the previous year. However, in the last quarter the activity showed signifi cant im-provements, thanks to the good performance of the Fall/Winter collection both at directly-operated stores and wholesale levels and the strong momentum of the Japanese market.
The Company appointed Edmundo Castillo as new designer for the brand. With his attitude and his Latin spirit, Edmundo will have an extremely important role in developping the image of the brand.
Sergio Rossi’s profi tability suffered from over-investment in production and distribution at a time when some collections underperformed. The new management team aims to have Sergio Rossi breakeven by 2007. To achieve this, they plan to better balance the collections, by broadening the range of leather goods and its stylish desirable footwear models for women, developing a complete range of shoes for men, streamlining the store network and keeping costs under tight control.

36PPR 37
Other brands
BEDAT & CO
Founded in 1996 by Simone and Christian Bédat, BEDAT & CO is a unique, contemporary and exclusive watch brand which combines quality with timeless value. Distributed primarily in the United States, Italy and Japan, BEDAT & CO offers a handful of exclusive models, for which the quality and origin are guaranteed by the Swiss A.O.S.C ® certifi cate. By working with Gucci Group Watches, BEDAT & CO plans to expand both its product offering and its distribution network into new markets in Europe and Asia.
Alexander McQueen
Alexander McQueen has an outstanding reputation in the world of fashion. Known for his audacity and creativity, the British designer won the U.K. “Designer of the Year Award” in 1996, 1997, 2001 and 2003. He received the “Best International Designer Award” from the Council of Fashion Designers of America in June 2003 and was named “Menswear Designer of the Year” at the British Fashion Awards in November 2004.
A 51% subsidiary of Gucci Group since 2001, Alexander McQueen primarily markets women’s accessories and ready-to-wear through its own retail network and upscale department and specialty stores. The brand has three directly-operated stores, in London, Milan and New York and in the last two years several shop-in shop concepts have been opened with leading wholesale clients in the UK (Harvey Nichols and Selfridges), France (Le Printemps) and Asia (Joyce in Hong Kong).
In 2005, the Company has continued to put in place the key strategic building blocks that position the brand for long term growth and to achieve profi tability by 2007, in line with its targets. New categories of men’s ready-to-wear, shoes and small leather goods have been added to the brand portfolio, enabling stronger and broader global representation. In March 2005, a new handbag line, part of the 2005 Fall Winter collection, met with particularly strong acclaim by press and buyers; this line has been developed further in the 2006 Spring-Summer season and provides a promising ground for future success in the Alexander McQueen accessories line-up.In September 2005, the company launched its second women’s fragrance, My Queen, as part of its licence arrangement with YSL Beauté.
In addition, the company has carefully entered into selected strategic brand licensing partnerships that are consistent with the brand’s core values and the Alexander McQueen collections, increase brand awareness and offer revenue streams to complement the existing core business. In this context, in June 2005, the company announced the signature of a three year licensing agreement with Puma AG for a co-branded line of sports leisure shoes for men and women, positioned at the upper end of the market. In November 2005, a fi ve year licensing agreement with SINV SpA was announced for the launch of a denim-based ready-to-wear line under a new label “McQ – Alexander McQueen”. Both of these important strategic partnerships will allow Alexander McQueen’s internationally acclaimed design ethos to reach a much wider audience, whilst complementing the brand’s existing highly successful main line collections of luxury ready-to-wear and accessories.
The Group’s activities – Luxury Goods

37 Reference document 2005
Stella McCartney
The Stella McCartney brand was established in partnership with Gucci Group in mid-2001, with its fi rst collection of ready-to-wear unveiled to the world’s media and leading wholesale clients in October that year. Since then, the Stella McCartney activity has developed at a strong pace, and collections of non-leather shoes, bags and other accessories have been added to complement the core ready-to-wear business.
The brand directly-operates three retail stores, in New York, London and Los Angeles. The brand is also available through a network of upscale wholesale clients around the world, many of which present the brand’s collections within in-store environments that feature iconic elements of the full store concepts of the brand’s own retail stores.
The strength and breadth of appeal of the Stella McCartney brand name has also been demonstrated by the success of a num-ber of carefully managed strategic licences granted to major international partners capable of respecting and promoting the brand’s identity and values. The brand’s fi rst fragrance line was launched under licence through YSL Beauté. The line has met with considerable success (including receiving major international awards) and has grown into a sizeable activity. The brand also offers eyewear through a license with Safi lo since 2003.
In 2005, a major licence partnership was established with Adidas for a women sportswear line. The fi rst “Adidas by Stella McCartney”products became available from early 2005 through a limited number of selected Adidas stores and leading Adidas wholesale clients, primarily in the USA, Japan and Europe. In similar vein, H&M approached Stella McCartney in early 2005 for a major one-season partnership. The one-off women’s ready-to-wear collection launched in November 2005 proved a tremendous success, further fuelling awareness of the brand worldwide.

Texte
PPR 39
Presentation of
18.9%26.0%
16.0%
14.1%
Breakdown of 2005 revenue by product category
38
a14,760 M2005 revenue
a754 Mrecurring operating income
71,328employees at the end of 2005
719stores (directly-operated storesand affi liates) at the end of 2005
• Leading companies in Europe• A strong trad position in high-growth sectors• 42.9% of revenue generated outside of France in 53 countries • 9.0% of revenue over Internet• 82.9% of PPR’s total revenue• 65.9% of PPR’s recurring operating income (excluding holding company)
A portfolio of leading brands
PPR is a European market leader in Retail segments that are experiencing strong growth – electronic goods and household appliances, fashion, beauty care, furniture and cultural products. The Group is made up of well known companies, all of which have great potential for expansion. They cover the entire gamut of sales formats: department stores, specialist stores in city centres or on the outskirts, and home shopping by catalogue and e-commerce, a segment in which PPR is now a leading player.
Company Ranking Position
Printemps No.1 department store in Paris and surrounding area
A fashion trendsetter at the heart of the contemporary scene
Redcats No.1 in B to C home shopping in France, Scandinavia and PortugalNo.3 Worldwide in home shoppingin fashion and home decoration
Leading fashion brands, multi-channel operator, specialist catalogue concepts
Fnac No.1 in cultural and technology products distribution in France, Belgium, Spain and Portugal
Track record as a pioneer of new technologies, with a range of books and publications second to none
Conforama No.1 in furniture in France No.2 worldwide in household equipments
Positionned as discounter, with a multi-style and multi-product offering and immediate product availability
CFAO No.1 in automotive and pharmaceutical distribution in Africa and the French overseas departments and territories
More than 100 years experience in Africa, dedicated professional teams, exclusive agreements with the leading global brands
The Group’s activities – Retail
13.8%
29.7%
29.6%
0.5%
Breakdown of 2005 revenue by company
FNAC
REDCATS
CONFORAMA
CFAO
PRINTEMPS
OTHER
21.3%
5.1%
CULTURAL PRODUCTS
FURNITURE
ELECTRICAL AND HOUSEHOLD APPLIANCES
OTHER25.0%
FASHION, ACCESSORIES, BEAUTY CARE

Reference document 2005
International presence, a driver for higher growth
PPR focuses particular attention on developing its companies abroad, which is an important driver for growth. Sales abroad accounted for 42.9% of total revenue in the Retail activity and 44.1% of recurring operating income, in 2005. Thanks to their relevant concepts and their team’s expertise, the Group’s companies have successfully gain a solid foothold abroad. They focus on two strategic growth objectives: consolidating their presence on traditional markets and setting up in new countries offering high potential. For instance, 2005 saw the ope-ning of the fi rst Fnac store in Greece and the launch of the catalogue La Redoute in Norway and Greece, while CFAO continued to expand in Mediterranean African countries, including Algeria and Morocco. At the same time, Conforama and Fnac boosted their retail networks in their top priority markets, including Spain, where both Conforama and Fnac opened two new stores during the year.
Company % of 2005 revenue generated abroad
Number of countries
(excl. France)
Number of stores abroad
Number of catalogues
abroad
Redcats 52.8% 24 17
Fnac (1) 23.6% 6 41
Conforama 32.3% 7 57
CFAO 96.4% 36 173 car sites (2) deliveries to 15,000 pharmacies every day
(1) Excluding joint venture stores.(2) Dealerships and after-sales service sites.
Increase in Internet sales
PPR has become one of the leading players in e-commerce thanks to its brands’ reputation and their expertise in logistics and customer relations. In 2005, the Group recorded revenue totalling €1,332 million, an increase of 34.2%.As a result of the increased use of Internet, PPR has boosted its revenue considerably and improved its sales performance. Internet is an additional sales channel that enables the Group companies to attract new customers, extend and diversify their offering – notably through online goods sales – and transform customer relations by offering a more personalised range. Internet was the sales channel that recorded the highest growth, with increases of up to 50% for some product categories such as white goods (home appliances), brown goods (retail electronics) and grey goods (computers and mobile phones). Fnac.com is the leading private-sector e-commerce site in terms of visits, with 5.2 million single hits each month (1). It looks set to become the leading Fnac store in France in terms of revenue in the near future.Increased use of Internet has also made it possible to generate new synergies thanks to the complementary nature of the various sales formats of the PPR companies. For instance, the fnac.com site boosts the stores’ commercial effi ciency. It receives frequent hits from the compa-ny’s customers attracted by the wealth and detail of its product information. These customers then visit stores to obtain advice from sales staff. At present, 60% of customers who buy in stores have previously visited the site. 43% of Internet users who buy on fnac.com have previously visited a store (2). In home shopping, Redcats generated 25.1% of its sales via Internet, compared to 18.3% in 2004. Laredoute.fr saw a 66% increase in the number of single hits between December 2004 and December 2005, while some of the catalogue brands, such as Josefssons, may generate up to 50% of their sales on line.
39
the Retail activity
9.7%
57.1%21.3%
10.8%
1.1%
Breakdown of 2005 revenue by geographical area
FRANCE
EUROPE EXCL. FRANCE
AFRICA
AMERICAS
ASIA AND OCEANIA
Breakdown of 2005 revenue by sales format
54.6%21.5%
STORES
CATALOGUES
INTERNET
OTHER
9.0%
14.9%
(1) Source: Panel Nielsen/NetRatings (December 2005).(2) Source: Fevad – French home shopping federation (December 2005). 38

PPR 41
Presentation of
Customer satisfaction: a top priority
The PPR Group companies are faced with constant challenges; these include optimising and personalising customer relations, the focal points being knowledge of customers and their satisfaction and loyalty.The companies in the Retail activity focus on in-store reception and service. Customer satisfaction, and consequently the performance of the sales outlets, depends on the quality and skill of the sales teams in their day-to-day work. In order to improve the availability of its sales staff, Fnac has, for instance, launched a long-term programme with three main objectives: reducing subsidiary tasks, increasing the number of staff on hand at peak times and developing skills. Providing staff training is also a key feature in making the shopping experience more pleasurable for customers. Fnac earmarks a signifi cant part of its payroll expenses for staff training. The company also arranges “sales forums” at which sales staff can meet and exchange views. In addition, Fnac has a unique policy for customer information, aimed at establishing long-term customer relations. The company offers customers a wealth of in-store information, along with free technical leafl ets on its various product ranges.Most of the Group companies have launched loyalty card schemes as a way of stimulating customer relations. Holders of these cards are entitled to savings and special services aimed at helping them in different ways. With this in mind, Printemps has, since October 2005, offered its best customers a new card called Carte Printemps Suprême; among other things, this offers them the option of express delivery service and special alteration offers. In addition, Fnac is continuing its policy of increasing customer loyalty with its card. At the end of 2005, there were 1.8 million holders. Loyalty-card holders tend to make purchases some three times as often as other customers, which is equivalent to purchases of an average of some €1,000 per holder per year.Finally, PPR also offers after-sales service as another means of optimising customer service. Since 2002, the Group has combined the expertise of its companies to offer an effective, permanent after-sales service. When Saveo was set up in 2002, Conforama was assigned responsibility for undertaking repairs to Fnac’s TV, hi-fi , video and camcorder products (excluding the Paris region) and the at-home after-sales service for white and brown goods purchased from La Redoute and La Maison de Valérie. The company has introduced a single number for France and the eleven regional platforms. This organisation has cut waiting times for customers (one week less for Fnac customers and three days less for Conforama customers), enhanced customer satisfaction and optimised repair costs (reduction of 3.3% in after-sales service costs in one year).
A strong stores network designed to make shopping a pleasure
There is a growing need among consumers for shopping to be a pleasant, novel and appealing experience. In response to this, the PPR companies are adapting their sales areas, encouraging customers to consider new products in an aesthetically pleasing, welcoming environment on a human scale. While ensuring that they maintain the basic aspects of their identity, the Group companies also focus on what makes them stand out. They have implemented new store layouts and modernised the commercial architecture of their stores and product displays. The sales areas bear the individual stamp of each company, recognisable internationally.For instance, Conforama is continuing to change its store concept to improve visibility, attract customers to their products and place more of a focus on decorative items. The offering has become cross-functional and has been broken down by universe so as to highlight the company’s profi le as a multi-specialist discounter. In addition, aisles have been widened to make the shopping experience as comfortable as possible. Fnac introduced a new concept in the stores opened in 2005 in Limoges, Madrid, Algarve (Portugal) and Athens. This includes using new store furnishings, which are lower and easier to move, along with wider aisles and improved product display. Customers have a better view of the entire store, which helps them obtain a better overall view of the range of products offered by Fnac. Printemps has opted for a festive, colourful atmosphere. It has undertaken numerous special campaigns, enabling customers to discover the major trends of the season in novel store displays. In 2005, the special campaigns included Frénétique Brésil, Parenthèse Végétale and Numéro de Charme.
Constant improvements of purchasing
PPR has set up many group-wide structures and tools to optimise its purchasing. This entails sharing expertise common to all its companies, combining resources, purchasing in bulk, rationalising purchases and implementing uniform methods throughout the Group.PPR Purchasing is the Group’s central buying unit for white goods (household appliances), brown goods (retail electronics), grey goods (computers and phones) and consumables (batteries, printer cartridges, photographic fi lms and CD-ROMs). Each company takes the role of specialist in steering sales, with its requirements determined on the basis of its sales policy and its customer profi le. PPR Purchasing is responsible for negotiating with suppliers. For brand products, PPR Purchasing negotiates annual framework contracts with all suppliers, both for one and same product distributed by several companies and for different products from a single supplier. As far as own-brand products such as Grandin and Höher are concerned, the involvement of PPR Purchasing makes it possible to set up a fl exible organisation based on the Group’s expertise. Quality tests are undertaken in La Redoute and Fnac laboratories. In 2005, PPR Purchasing negotiated more than €2 billion worth of direct purchases, generating savings of € 40 million.
The Group’s activities – Retail
40

Reference document 2005
Buyco is the Group’s shared platform which centralises purchases of non-commercial goods and services used by all the companies, including till bags, point-of-sale advertising support, photocopiers and advisory services. In 2005, Buyco negotiated more than €1 billion worth of indirect purchases, involving savings totalling €14 million.Two cross-functional purchasing tools – GlobalNetXchange (GNX), an on-line negotiating platform that the Group joined in 2000, and e-procurement (on-line procurement for indirect purchases) – have been added to boost these companies, the objective being to improve the Group’s purchasing terms and management. In 2005, PPR negotiated €442 million worth of purchases using GNX, with savings or more than 10% on the recommended price.
Logistics, the strong link in distribution
PPR aims to supply top quality products in due time, at the right place and at the lowest cost. The Group has given priority to adapting its logistics in line with market developments and use of more remote sourcing locations. Between 2004 and 2008, PPR aims to achieve three major objectives: optimising territorial coverage, increasing centralisation by boosting storage capacity and reducing transport and rental costs.Although PPR companies in the Retail activity have fairly similar logistical systems, with centralised management for all their stores, they are faced with different challenges.At Conforama, the globalisation of sourcing has reduced direct deliveries to stores and increased deliveries to distribution depots. With the number of parcels distributed increasing by 2.5 times between 2002 and 2005, Conforama Distribution has increased its storage capacity by 50,000 sq.m. in a year, bringing it to a total of 150,000 sq.m. at the end of 2005, and a projected 200,000 sq.m. in 2006. Through signifi cant restructuring of the regional distribution centres, Conforama is gradually switching from a national operating system, where the depots were dedicated to a particular type of product, to a more regional distribution system. In 2005, the company overhauled its historical 41,000 sq.m. Lyon site and opened a new platform at Onnaing in the north of France on 30,000 sq.m. with the capacity to ship 2.6 million packages a year. Conforama also inaugurated a new logistics platform in Switzerland during the year, with a surface area of 30,000 sq.m., able to meet the challenges posed by remote sourcing.Fnac has two central logistics platforms, one on a 56,000 sq.m. site at Massy and the other on a 20,000 sq.m. site at Wissous (Essonne), opened in August 2005 and handling technical products for the French stores and fnac.com. Fnac has therefore gone from 30 million centralised products in 2000-2001 to 110 million in 2005, which represents almost 85% of all products distributed by the company. The new Wissous platform should enable Fnac to centralise up to 130 million products by 2008.Printemps has two depots with a total surface area of 30,000 sq.m., located in Seine-et-Marne; 55% of their operations involve Printemps Haussmann. In 2005, these depots handled almost 14 million items, and stock an average of 100,000 standard items.CFAO has developed tailor-made logistics to provide distribution systems suited to each of its lines of activity. Products originating from virtually anywhere in the world are delivered in more than 35 countries. In the automotive segment, logistics are outsourced via one sub-contracted platform in France and two others in Belgium. In the pharmaceutical segment, because of the rigorous legislation on drugs, CFAO handles logistics in-house and, since 2005, has had depots with a surface area of 12,500 sq.m. located close to the port infrastructure at Rouen (France).
Financial result s
In 2005, sales by the Retail activity remained buoyant, increasing by 2.8% to €14,760 million, against a backdrop of slower economic growth. Recurring operating income stood at €754 million.
41
the Retail activity
Revenue and recurring operating income
REVENUE (€ MILLION)
RECURRING OPERATING INCOME (€ MILLION)
(1) Adjusted for the impact of transition to IFRS.
3.4%
30.7%
23.5%
0.2%
Breakdown of 2005 recurring operating income by company
22.1%
20.1%
FNAC
REDCATS
CONFORAMA
CFAO
PRINTEMPS
OTHER
40

42PPR 43
• No.1 department store in Paris and the Paris region• 42.4% of merchandise sales accounted for by the Printemps Haussmann store in Paris• 7.5 million visitors in 2005 (source SIMM)• 28 million products sold and more than 3,000 brands offered
(including 10% of exclusive brands)• Average price per item: €36.5 (up 9.8% from 2004)
Business concept
Printemps is the leading department store in France. Created in 1865, the company is specialised in fashion, beauty care and home decoration. Featuring major brands and offering a wide range of personalised customer services, Printemps is now a genuine fashion trendsetter, enjoying widespread recognition in France and abroad. The company also owes its reputation abroad to its fl agship store on the boulevard Haussmann, which is located in a strategic district near Saint-Lazare railway station and place de la Madeleine, thus attracting a large number of foreign customers. The 26 Printemps stores are located in the downtown areas of major cities in France; 18 of them are directly-operated on more than 150,000 sq.m. of selling space, six are affi liates in France and two abroad. The Printemps subsidiaries (Citadium, Made in Sport, Madelios and Printemps Design) operate a total of 27 stores representing more than 15,000 sq.m. of selling space.
a752 M 2005 revenue
a 26 M2005 recurring operating income
5,287Number of employees at year-end 2005
18directly-operated department stores at year-end 2005 (excluding Citadium, Made in Sport, Madelios and Printemps Design; excluding 8 affi liate stores)
Map of Printemps sites in France:directly-operated stores and subsidiaries
• 17 department storesincluding Paris • (Haussmann, Nation, Parly, Vélizy, Italie).
1 Printemps design■ 1 Carré des Affaires
Printemps 1 Madelios
Sports activity★ 1 Citadium▲ 24 Made In Sportincluding Paris: ▲ Aulnay, Créteil, Évry,Paris Les Halles, Rosny 2, Thiais, Parinor.
•▲ Lille
• Poitiers
Rennes•▲
• Toulon
• RouenLe Havre
• •
Deauville
Lyon•▲
Metz•
Nancy ▲ • Strasbourg
▲ Bordeaux
Dijon▲
▲ Grenoble
Montpellier ▲
Nîmes▲
St-Étienne ▲
Toulouse▲
▲Vitrolles
•▲ Marseille
▲ OM Cannebière▲ OM Vélodrome▲ OM Plan de Campage
■ St-Herblain
★
▲ Nice
▲• PARIS
▲ Nantes
The Group’s activities – Retail

43 Reference document 2005
Competitive environment
As the No.1 department store in Paris and the Paris region, Printemps operates in a highly competitive environment. It competes with the other department stores (Galeries Lafayette, Le Bon Marché, BHV) and the chains specialising in clothing and apparel (Gap, Zara, H&M). Printemps stands out because of its position in terms of contemporary appeal and fashion, and thus continues to grow in its main markets.
Strategy
Printemps again demonstrates its position as a “Fashion trendsetter at the heart of the contemporary scene”
For the past two years, Printemps has been carving out a position as a brand “at the heart of the contemporary scene.” The objective is to make Printemps a department store recognised as “a fashion trendsetter, the place to shop for fashion, beauty care or home de-coration – one that invents new shopping experiences for the customer”. In 2005, Printemps continued to apply its strategy aimed at “always being a step ahead”, to products and customer service as well as to its stores, concepts and events. The company offers more than 3,000 brands (including 10% of exclusive brands) attesting to its position as a company in sync with its times and its special focus on fashion.
Printemps continues its programme to reallocate and renovate selling space
For the past fi ve years, Printemps has pursued a vast capital expenditure programme consistent with its market position as a fashion trendsetter. Selling space is reallocated to support the highest-growth, high-margin sectors – accessories, fashion, lingerie and children’s wear. At the same time, the departments representing less buoyant sectors such as recreation, toys and stationery, are being scaled down. In all, between 2000 and 2005, nearly the entire Printemps Haussmann store and the stores in the provinces will have been renovated and updated, and more than 13,000 sq.m. of space will have been reallocated to the company’s most profi table markets.
Focus on the Customer
Customer satisfaction is one of the key components of Printemps’ sales growth. The company provides a variety of services to its customers (hands-free purchasing, free delivery and alterations, wedding lists, etc.) as well as an array of services simplifying the act of shopping. In this area, the Printemps card is a powerful customer loyalty tool, which has adopted the new Printemps colours, and has made transactions even more secure thanks to a confi dential code. The Suprême card was also introduced on a test basis at the Printemps Haussmann store, offering special products and services to high-end customers. In addition, the traditional gift check was replaced by the Kadeos card, which is available in different amounts and which can be activated by the bearer at the cash register. In 2005, in a further attempt to make its employees more customer-focused, Printemps reintroduced its “Client au Coeur” programme (Focus on the Customer), with a second version that now includes eight new projects aimed at increasing customer satisfaction. These projects will be implemented in concrete form in 2006 and will be aimed at in-house teams. They will deal with topics such as improved information on trends and fashion, providing customers with regular information on the intranet and training in customer service involving foreign customers.
Specialised subsidiaries
While expanding its department store activity, Printemps is also expanding its specialized subsidiaries.
The sports activityThe sports activity, comprised of Made in Sport and Citadium, is positioned at the intersection of sports, fashion and current sporting events. Made in Sport is the leading multi-channel distributor of news devoted to sports and sports champions. The brand has 24 stores, four of which are offi cial club shops, as well as a home shopping activity (web and catalogue), which accounts for 22.7% of sales. Cita-dium features sports fashion. Located in the Haussmann district in Paris, this store features 250 major street and urban sports brands on more than 6,000 sq.m. of selling space. In the years to come, the sports activity will continue to expand its store network.

44PPR 45
Madelios, specialising in traditional, elegant menswearLocated in the Madeleine district in Paris, Madelios is a 3,800 sq.m. store devoted exclusively to men over the age of 30. It offers more than 100 leading brands in mid-to high-end men’s fashions as well as numerous personalised services. In 2005, the casual and jeans displays were rearranged to give them a more contemporary look that appeals to customers as they enter the store.
Printemps DesignA store devoted to designer items is also located in the heart of the Georges Pompidou Centre in Paris.
Financial results
In 2005, Printemps revenue under IFRS standards (adjusted for concession sales, which are growing in the department stores) fell by 4.1% to €752 million, while sales of merchandise, including concession sales, remained virtually unchanged at €1,157 million (down 0.9%). These fi gures refl ect the company’s repositioning in high-contribution product categories, which are seeing their revenue rise, especially in fashion, luxury goods and accessories. Women’s wear rose 3.4%, accessories rose 3.7% and menswear rose 1.9%, with market share increases despite a tough economic environment. In general, the main events of the year included the decision to eliminate toys and to undertake construction work in eight of the Chain’s stores, including two major renovations in Metz and Marseille, which strongly impacted year-end sales.
Recurring operating income increased by 11.8% to €26 million despite a slight dip in sales, thus confi rming the emphasis by Printemps on margin and cost control.
Revenue and recurring operating income
Breakdown of 2005 revenue by product category
The Group’s activities – Retail
784 752
23 26
2004 (1) 2005
REVENUE (IN € MILLION)
RECURRING OPERATING INCOME (IN € MILLION)
10.2%
22.4%36.6%
30.8%
FASHION
ACCESSORIES
BEAUTY CARE
OTHER
(1) Adjusted for the impact of the transition to IFRS.

45 Reference document 2005
2005 highlights and outlook
In 2005, the Company continued its policy of reallocating selling space and renovating its stores, with major construction done at the Printemps stores in Metz and Marseille, which will now feature a 2,100 sq.m. Fnac store on the mezzanine. Renovation projects were carried out in Nancy, Deauville, Rennes, Toulon and Paris (the Place d’Italie and Nation stores). At the Printemps Haussmann store, accessories, lingerie, children’s wear and the ground fl oor of the Printemps de l’Homme store were completely renovated. Two Made in Sport stores were opened in Nancy and in Nantes, where a joint venture agreement was signed with the city’s soccer club (the fourth joint venture after the ones in Saint-Étienne, Marseille and Rennes). Of further note, the lease was signed for the future department store in Toulouse, which in 2010 will be the fi rst store opened by Printemps in more than a quarter century. Major sales events were held, featuring highly successful original store themes and activities like Frénétique Brésil, Parenthèse Végétale and Numéro de Charme.
In 2006, Printemps will continue to emphasise its position as a fashion trend-setter at the heart of the contemporary scene. The ma-jor Printemps projects in Metz, Marseille and Deauville will be completed and new investments will be made in Rouen and Nancy. At Printemps Haussmann, the largest footwear department in the world will be opened featuring a selling area of 3,000 sq.m. Women’s fashions will get a new look on all fl oors and the Printemps de l’Homme store and Home decoration departments will be rearranged. Lastly, formats and areas earmarked for renovation will be thoroughly rethought in conjonction with new partners in order to refl ect the Printemps image at the heart of the contemporary scene. In the sports activity, 2006 will be associated with the latest in sport news – the winter Olympic Games and the World Soccer Cup, and with new exclusive partnerships signature on the web.
Stores under the Printemps name Number of stores and selling space
TOTAL PRINTEMPS 2004: 27 (190,636 SQ.M.)
TOTAL PRINTEMPS 2005: 26 (194,018 SQ.M.)
Including the Printemps Haussmann store: 43,700 sq.m. in 200444,309 sq.m. in 2005
2004
2005
Printemps subsidiariesNumber of stores and selling space

46PPR 47
• No.1 in B to C home shopping in France, Scandinavia and Portugal• No.3 home shopping company worldwide in fashion and home decoration• Active in 25 countries through 17 brands• 3 distribution channels:
. More than 60 e-commerce sites
. More than 30 catalogues
. 111 stores in France and abroad• More than 100 billion pages printed every year• 22 million customers• 100 million parcels distributed per year
Business concept
Redcats represents a common business line, home shopping, drawing together established, easily identifi able brands that are leaders in their respective markets. Redcats covers product categories mainly in the areas of apparel and personal care, and home furnishings and appliances. The Company is active in twenty-fi ve countries, including 16 directly and nine through a partnership, and uses a multi-channel approach combining catalogues, Internet and specialty stores.
A Portfolio of leading brands
Redcats has a portfolio of prestigious brands. Whether specialists in a specifi c segment or multi-specialists serving a wider audience, they develop new products and services. The brands constantly seek to be at the cutting edge in terms of innovation and creativity in order to better anticipate customers’ expectations and meet their wishes.
The Group’s activities – Retail
a4,377 M2005 revenue
a231 MRecurring operating income in 2005
20,130employees at year-end 2005
More than 60e-commerce sites
Breakdown of 2005 revenue by sales format
71.3%
3.6%
CATALOGUES
INTERNET
STORES
25.1%

47 Reference document 2005
French brands
La Redoute, the leading home shopping and women’s ready-to-wear company in France, offers its French Touch in 19 countries. It deploys its apparel offering via its generalist catalogue and specialised catalogues such as Anne Weyburn (for older women) or Taillis-sime (for outsizes). The brand also includes home furnishings and decoration, with specialised catalogues like AM.PM., Solutions Maison and So’Home. On Internet, La Redoute is the top home shopping company for fashion and home decoration: with an average of 7.9 million hits per month in the second half of 2005, the laredoute.fr website now accounts for 30.6% of total revenue. During the year, La Redoute confi rmed its role as a “style trendsetter”, adding more and more designers and brands. Despite an unusually fi erce competitive environment in 2005, La Redoute continued to gain market share over its direct competitors. Furthermore, the brand turned in a good performance abroad with international sales accounting for 23.7% of its revenue in 2005, especially in Spain, Austria, and Sweden. It continued to grow, moving into Greece and Norway.
La Maison de Valérie specialises in household equipment (furniture, home decoration, TV, hi-fi , video, etc.). This brand is proving to be a winner in the “household linens” category, which was expanded in 2005.
The Redcats Children and Family activity consists of the Vertbaudet, Somewhere and Cyrillus brands.Specializing in children, Vertbaudet publishes the catalogues “Histoires d’Enfants” (“Children’s Stories”) for ready-to-wear and “Histoires de Chambres” (“Bedroom Stories”) devoted to furniture, decoration and bed linen. During 2005, the brand continued to grow at a steady pace, with a 7.9% increase in revenue, thanks to its outstanding creative performance and the success of its catalogues. While new designers were added to the “Histoire de Chambres” offering, “Histoires d’Enfants” was enhanced with two new in-house brands: “BV Sport” - transposing the Vertbaudet spirit to the world of sports - and “VB2U”, a new catalogue dedicated to the 0-15 year.In addition, Vertbaudet continues to demonstrate its mastery of Internet channel, recording an excellent performance during the year, with the addition of new headings to its website. Internationally, the brand is now active in Spain, Portugal and the United Kingdom.Specialising in casual wear, this year the Somewhere brand introduced a line of natural cotton products “b.i.o.” for “believe in origins”, in the homewear spirit, inviting shoppers to get back to basics.Lastly, Cyrillus made steady progress while at the same time demonstrating the success of its new “classic, contemporary and chic” market position, with a 7.6% increase in revenue during 2005. As a multi-channel brand, Cyrillus publishes nine catalogues in four languages – French, English, Japanese and German – in addition to a network of 43 stores and websites. The Redcats “Senior” activity includes Daxon for fashion, lifestyle, home furnishings and Edmée for outsizes. Celaia’s specialised product line is now included in the Daxon pages and is still devoted to active women over the age of 45. The “Alpen Nature” line of comfortable clothing is still highly popular among women customers. The senior brands are offered in France, Belgium, Great Britain and Germany.
Breakdown of 2005 revenue by product category
11.2%
67.2%14.1%
1.9%
5.6%
EDUCATIONAL PRODUCTS
OTHER
FASHION, ACCESSORIES, BEAUTY CARE
HOME FURNISHINGS
ELECTRONICS AND DOMESTIC APPLIANCES

48PPR 49
English brands
Empire Stores offers two general catalogues per year focused on fashion for the whole family and products for the household equipment. During the year, Empire Stores recorded an increase in the total number of its active customers. A home offering was added to the in-house brand “La Vie” (“Life”) for the home. In addition, for the fi rst time, the Empire Stores catalogue opened its pages to other Redcats brands, including Vertbaudet – with a selection of its best selling items for children – and Daxon. At year-end, the company unveiled to the press its new partnership with the famous English designer Tracey Boyd, who designed a collection in the women’s wear pages of the catalogue. This move was very well received by the press, which bodes well for future seasons. In 2005, Empire Stores earned 19% of its revenue on Internet.
Scandinavian brands
Ellos, the leading brand in Scandinavia, features affordable contemporary products for the entire family, including in-house brands such as “Sara Kelly”, for active women, “Casual Woman” for women seeking the authentic look, “Joelle”, trendy and original, and “Broadcast”, a men’s line of daywear. Its apparel and textile product lines also include Nuova, a specialised catalogue for senior people, and Jotex, which specialises in home textiles.
Josefssons is focused on the modern young woman, offering several styles and trends organised into “boutiques”. The general catalogue includes a children’s line, produced in conjunction with French brand Vertbaudet. In 2005, the “Pinky” and “Nevada” sportswear lines were added to the wide range of in-house brands. This year, Josefssons also focused on its website, adding new features in terms of communications and management of the “boutiques”. This brand performed well, ending the year up 7.3%.
In addition to their general catalogues, Ellos and Josefssons added mini-catalogues, offering customers a sampling of products throughout the year. The Scandinavian brands are active in Denmark, Estonia, Finland, Norway and Sweden. On Internet, their performance continues to improve sharply, with 32.4% of their revenue coming from that channel in 2005.
American brands
The “Misses” women’s ready-to-wear activity features two brands: Chadwick’s, contemporary casual fashion for active women and Lerner for low-priced urban fashion.
The large sizes segment remains the main driver of growth in the US activity. Thus, Jessica London, Lane Bryant and Roaman’s, brands devoted to women, performed extremely well in 2005, thanks to the effectiveness of the prospecting catalogues and a better targeting of Internet strategies. KingSize, a men’s brand, also saw an improvement in activity, mainly driven by Internet. The outsize brands ended the year up 9.0%, excluding Sears, a catalogue for men approved on May 31, 2005, pursuant to the licensing agreements signed with the owners of the brand.
In the “Home & Lifestyles” activity, devoted to home furnishings and decoration, the Brylane Home brand was down during the year, as a result of the decision to reduce by 11% the number of catalogues shipped to shift its focus to its best customers. The two specialised catalogues added to the activity’s offering, “Brylane Home Kitchen” and “Brylane Home Wishes” performed well in 2005 (up 13.1% and 22.2% respectively).
Overall, the US brands earned 32.5% of their revenue through Internet.
The Group’s activities – Retail

49 Reference document 2005
Competitive environment
Redcats is the third largest home shopping company in the world in the apparel and decoration sectors. Redcats also diversifi es outside the apparel market, particularly in furniture. The international home shopping market mainly comprises mail order companies, which in the past have focused on apparel, including Otto Versand and Quelle who are market leaders. The market has grown and competition has stiffened as a result of gradual diversifi cation into non-textile segments and the development of e-commerce, with new players such as department stores, specialist store chains and Internet companies. With its fast-selling specialised brands, the strength of its multi-specialist brands and its position on the web, Redcats is a major player in its markets. Thus Redcats is a leader in France, Scandinavia and Portugal in the B-to-C home shopping market and a leader in the United States in the home shopping apparel market for women’s outsizes. Redcats also ranks No. 3 in the United States in the catalogue market and No. 5 in the catalogue home shopping market in Great Britain.
Strategy
A multi-channel approach
Redcats operates via three sales channels, providing the customer with easy access and greater responsiveness. Its 17 brands produce over 30 catalogues, which are updated every season with new concepts added regularly. In addition to the catalogues, there is a network of some one hundred stores. Lastly, Internet is turning out to be a tremendous growth driver for all brands and all geographical areas. Backed by proven know-how in managing mail-order customer relations and a logistics infrastructure for parcel deliveries at competitive prices, Redcats has developed a vast Internet network of over 60 e-commerce sites in 16 countries. Through new offerings and services, relations developed with customers are now further enhanced. In 2005, revenue generated through Internet amounted to €1,099 million, up 36.5% from 2004. Internet channel accounted for 25.1% of home shopping revenue, compared with 18.3% in 2004.
Growth continues outside France
Redcats earns 52.8% of its revenue outside France. This strong international presence helps it to balance its growth drivers. It also illus-trates Redcats’ ability to regionalise the French brands in its portfolio. Thus the “Senior” brands, led by Daxon, earn 28% of their revenue abroad, while La Redoute earns 23% and Vertbaudet 19% – brands that attest to Redcats’ success outside France. This growth abroad is built on a pooling of resources implemented in the countries. In 2005, the United States contributed signifi cantly to supporting Red-cats’ international activity, with growth of 3.6%. In 2006, Redcats USA will migrate its Lerner brand activity to Metrostyle, a private label brand.The European countries excluding the United Kingdom and Scandinavia were also up, with growth of 3.9%. In 2005, in a highly competitive market that suffered from the weather conditions in the fourth quarter, the Redcats activity was down in the United Kingdom (down 5.6%) and Scandinavia (down 1.3%).
Breakdown of 2005 revenue by geographical area
8.2%
47.2%
25.8%
12.1%
FRANCE
UNITED STATES
UNITED KINGDOM
SCANDINAVIA
REST OF EUROPE
6.7%
(Belgium, Portugal, Switzerland, Spain, Austria, Germany, Greece)
(Sweden, Norway, Finland, Denmark, Estonia)

50PPR 51
More effi cient organization and better use of resources for greater customer satisfaction
Improving sourcing, especially in apparel, is one of Redcats’ major objectives. The company is backed by a network with seven purchasing offi ces located in Bangladesh, Brazil, China, India and Turkey in order to benefi t from the best procurement conditions.
Redcats has also developed a pooling of computer resources on some channels so as to cut costs. On Internet, the Millena platform, a joint effort by French and American employees, hosted the websites of the “home & lifestyles” activity in the United States, in 2005 as well as the website laredoute.fr. A major technological advance to benefi t customers, the Millena platform will continue to be de-ployed in 2006 to the other US brands activity and to La Redoute International websites. In France, for more than 10 years, La Redoute has been offering 24-hour delivery, with the addition of “48-hours delivery” and “Livraison bonheur” (“Convenience delivery”), allowing the customer to set the delivery date when the order is placed. This year, an interdepartmental service called “Livraison groupée” (“Bulk delivery”) was introduced to process more effi ciently home furnishing orders.
The Group’s activities – Retail
The Redcats presence worldwide
DIRECT PRESENCE, THROUGH A SUBSIDIARY
PRESENCE THROUGH A PARTNERSHIP
7 PURCHASING OFFICES

51 Reference document 2005
Innovation at the heart of the brands
Creativity is a major strategic focus for Redcats, which is increasing innovative initiatives to better meet the needs of its customers. In terms of products, new in-house brands were introduced: Vertbaudet with the “VB Sport” line dedicated to sports, Roaman’s, in the United States, with “Intimate Promise”, a catalogue devoted to outsize lingerie. Other brands continued to work with designers, thereby enhancing their image as “style trendsetter”. Thus Daxons is continuing its partnership with Ralph Kemp while La Redoute is featuring Jean-Paul Gaultier in its general catalogue for a unique and original reinterpretation of a few basics, and the top-actress Laetitia Casta, who posed for the fi rst time on the front page of its winter catalogue. In the home furnishing segment, specialised catalogues such as “AM.PM.”, “So’Home” and “Solutions Maison” continue to be highly popular. A great deal of work has been devoted to the websites, leading to improved showcasing of products – the customer consults most of the catalogues on-line, zooms in on the product, inspects it from different angles, tries it on virtually or goes to specifi c e-boutiques that follow the seasons.
Financial results
In 2005, Redcats posted revenue of €4,377 million. Excluding Sears activity, the licence for which was terminated this year, the company’s revenue rose 0.1% on last year. Recurring operating income remained stable for the year at €231 million: excluding Sears, it was up 2.9% from 2004. This growth was driven mainly by the portfolio’s specialised brands, the Redcats USA outsize activity and the brands in the Children and Family activity.
2005 highlights and outlook
In 2005, Redcats successfully continued the overhaul of its activities, with improvement in the market position and globalisation of its brands and the development of the web channel. In particular, 2005 saw strong growth in the Children and Family brands in Europe, and in the United States, in large size brands. Internationally, Redcats continued to grow steadily, bolstering its presence through new stores in Greece and Norway. Lastly, Internet sales grew steadily, accounting for 25.1% of Redcats revenue at year-end.
In 2006, Redcats will continue to shift its focus to its strong brands, single-segment or multi-segment specialists, and will continue to grow its activities outside France and on Internet. As part of its internalisation strategy, La Redoute will distribute its 2006 Spring-Summer collection in Italy, under a partnership agreement with Postelmarket (Bernardi Group).
4,403 4,377
231 231
2004 (1) 2005
REVENUE (IN € MILLION)
RECURRING OPERATING INCOME (IN € MILLION)
Revenue and recurring operating income
(1) Adjusted for the impact of the transition to IFRS.

52PPR 53
Map of Fnac sites in France
• No.1 retailer of cultural and technological products in France, Belgium, Spain and Portugal
• Active in 7 countries (1)
• Leading bookstore in France with 500,000 references• Leading music store in France with 200,000 CDs in stores • 30,000 references in personal computers, photography, hi-fi ,
TV/video, software/games, offi ce equipment/telephony• 150 million visitors to stores and 15 million customers a year in France
Business concept
Fnac is France’s favourite retailer (2). The company’s concept is based on a novel approach to business, based on differentiation. Fnac is the only retail company offering an unrivalled selection of books, CDs, DVDs, video games and technological products under one roof. This product range is supported by its independent, innovative positioning as an “opinion former” based on the independence of its sales force in relation to its suppliers and the work of its test laboratories. Its physical and on-line multi-specialist stores are not only used for purchases: they provide a cultural, social and exchange forum. They enable literary, musical, and audiovisual arts as well as technological innovations to reach a broader audience. Fnac has enhanced its status as a cultural player and a corporate citizen company through the various events it pro-duces, its publications, its support for freedom of expression and its commitments to preventing illiteracy.
Fnac is active in seven countries, with 109 stores, including 41 stores outside France (1), and selling space in excess of 268,000 sq.m.. Its 68 French stores have over 150 million visitors and 15 million customers each year.
(1) Excluding 8 stores on a joint-venture basis.(2) Source: IFOP/Expansion.
a4,382 M2005 revenue
a152 M2005 recurring operating income
20,077employees at end 2005
109directly-operated stores at end 2005 (excluding Fnac Service, Fnac Éveil & Jeux and Surcouf)(1)
The Group’s activities – Retail
• Lille
• Reims • Metz• Strasbourg
• Mulhouse• Belfort
• Colmar
• Annecy
• Grenoble• Valence
• Pau
Toulouse• •
Montpellier
• Bordeaux
• Poitiers
Rennes• •
Le Mans
Monaco•
•Cannes
Nîmes•
• Toulon
Marseille •
•Rouen
Le Havre•
• Caen
Nantes ••
Angers • Tours
• Orléans
Troyes•
• Nancy
Dijon••
Bourges
Lyon•
St-Étienne •
Clermont-Ferrand •
• PARIS
Brest•
• Lorient
Amiens•
• Chartres
• Perpignan
• Nice
• Limoges
Map of Fnac sites in the Paris region

53 Reference document 2005
New store concept
In 2005, Fnac launched its brand new store concept. The concept was fi rst introduced successfully in the existing Madrid ParqueSur store in Spain, and then in new stores opened in San Sebastian (Basque Country), Albufeira (Portugal), Limoges (France) and Athens. Fnac has always offered customers a broad product range in its stores and has managed to adapt its infrastructure in line with changes in both products and patterns of consumption. The new store concept goes hand in hand with this approach and is expected to be rolled out further when existing stores are refurbished or new stores opened in France and abroad. The concept is distinctive both for its airier, warmer and more colourful architecture and signage, but also for the furnishings used. It creates a more convivial atmosphere and a store layout lined with the latest new products. Customers also encounter a more user-friendly reception, following the birth of the Fnac mascot placed in stores to enable customers to identify the company’s different services.
Competitive environment
Fnac is the leading retailer of cultural and technological products in most of the countries in which it has a presence. In France in particular, Fnac is the leading bookstore with 500,000 references, and the largest music store with 200,000 CDs in stock and almost 1.5 million CDs available by order.
Fnac is present in high-growth markets marked by accelerating technological innovation and the growing appeal of cultural products. Its main competitors are hypermarkets, specialist retail chains and e-commerce specialists. Fnac’s success stems from its brand recognition, its unique concept, its diversity of choice and the breadth of its product offering. Fnac continues to win market share from its competitors in both cultural and technological products by offering value-added services and the high-quality advice for which it is renowned.
2005 market share in France and FNAC’s main countries of operation (1)
France Spain Belgium Portugal
Books 14.5% 8.0% 10.5% 17.0%
CDs 28.4% 19.5% 17.8% 44.4%
Video 20.1% 17.2% 8.6% 40.0%
December 2005 estimates (Source: Sofres, Ifop, GfK, Nielsen).(1) Other countries: market share not signifi cant.
Breakdown of 2005 revenue by geographical area (1)
Breakdown of 2005 revenue by product category
8.1%
76.4%
2.4%
3.8%
(1) Excluding Taiwan and Greece, which are owned on a joint-venture basis.
FRANCE
BELGIUM
SPAIN
PORTUGAL
SWITZERLAND
ITALY
BRAZIL
5.0%
2.4%1.9%
35.1%
21.3%
10.7%
3.0%
PERSONAL COMPUTERS
CDS
BOOKS
PHOTOGRAPHY
HI-FI
TV/VIDEO
GAMES
5.1%6.5%
18.3%

54PPR 55
Strategy
“Click and brick”: the true multi-channel strategy
In 2005, e-commerce generated revenue of €215 million for Fnac, a rise of 32.8%.
Its main website, fnac.com, is France’s leading private-sector retail website in terms of audience, with 5.2 million individual visitors (1) – an audience rate of 26% for 550,000 internet connections a day. With over a million product references, fnac.com is the only website offering a combination of tickets, cultural, technological and travel-related products. Customers benefi t from high-quality service, with 100,000 products available for delivery in under 24 hours, and delivery to a network of 3,500 Relais-Colis (parcel delivery outlets).
Fnac.com is France’s best example of the “click and brick” concept whereby Internet sales complement the Fnac stores. Today, 60% of customers purchasing in-store have carried out their research on the website beforehand. By the same token, 43% of those, purchasing on-line from fnac.com have also visited the store (2). In 2004, the company introduced a function enabling visitors to the website to check the availability of a particular technological product at their selected store. On-line purchasers are also able to benefi t from the after-sales service offered in the stores. For Fnac.com, it is a never-ending quest to update its services to better meet the needs of its customers.
Given this dynamic growth, in September 2005, Fnac transferred the website order preparation function for technological products (stock and packaging of articles) and its after-sales service to a new warehouse in Wissous (Essonne). This move is due to the sharp rise in sales of technological products which require a lot of space. Proximity to the Massy site, housing the logistics centre for the Fnac stores also facilitates synergies in terms of storage, transportation and after-sales service.
At the end of 2004, the company launched its music download site, fnacmusic. This service offers the benefi ts of proximity, discovery and advice, thanks to a catalogue of over 600,000 titles, an original theme-based classifi cation system and prices that are both attractive and easy to understand. To improve integration and synergies with the Fnac stores, last summer, fnacmusic launched pre-paid download cards. These cards are available in units of 10, 20, or 30 titles from all Fnac stores on a self-service basis. They have been a huge success, with over 9,000 cards activated on the website in just four months, accounting for over 15% of the site’s total revenue in December.
The Group’s activities – Retail
(1) Source: Panel Nielsen/NetRatings (December 2005).(2) Source: Fevad (December 2005).
TOTAL 2004: 105
TOTAL 2005: 109
Fnac stores excluding subsidiaries (1)
Number of stores
TOTAL 2004: 255,506 SQ.M.
TOTAL 2005: 268,693 SQ.M.
Fnac stores excluding subsidiaries (1)
Selling space (sq.m.)
(1) Excluding Fnac Service, Fnac Éveil & Jeux and Surcouf.Excluding 8 stores on a joint-venture basis.

55 Reference document 2005
A player in the transformation of consumers
Far beyond its role in retailing, Fnac has traditionally positioned itself as a pioneer of new technologies and enjoys undisputed leadership as regards innovation. Thanks to this positioning, Fnac is able to benefi t from buoyant growth in the markets for the most recent technological advances such as fl at screens, MP3 players and digital photography, which were the main growth drivers in 2005.
Fnac is an independent, innovative opinion former providing expertise and advice to consumers. This role is apparent in operations such as the multimedia house or the demonstration area dedicated to fi xed line digital television. Fnac also devises a broad range of services designed to make new technologies more accessible to customers, such as technological fi les, multimedia training, home installation, demonstrations/displays for technological products and a hotline.
In addition, Fnac strives to make whatever changes are required in stores and on shelves to favour the roll-out of new technologies. In 2005, Fnac also set up a new personal mobility department in 80% of stores in order to facilitate rapidly-developing convergence, particularly in so-called nomad products which benefi t from lower prices and a higher replacement rate than domestic equipment. In 2006, high-defi nition cable and satellite television will be launched in France. Flat screens, whether plasma or LCD, will be the favoured medium for this innovation.
An increasingly customer-focused company
Fnac’s goal is to become an increasingly customer-focused company. In order to improve the availability of its salespeople – one of the company’s major assets – Fnac has launched a long-term programme with three main pillars: reducing non-sales related tasks, in-creasing the number of staff on the shop fl oor at peak times and developing sales skills. 86% of Fnac’s customers said they are satisfi ed with the quality of service received at their last visit to a store (1). Fnac is also pursuing its customer loyalty policy with its membership card. At the end of 2005, the company had 1.8 million members who make store purchases about 3 times more often than other customers, and have an average annual spend of almost €1,000. Fnac also has a unique consumer information policy, the main vehicles of which are the technological fi les distributed in stores and its “Contact” magazine sent to members’ homes.
To improve control of its service quality, Fnac has also set up a telephone helpline to inform, advise and assist customers on the functioning and set-up of their equipment (Attitude), and its own PC repair centre (MSS) which benefi ts from the approval and training of leading manufacturers. At the end of 2005, Attitude and MSS had recorded a successful step-up in activity, with over 540,000 customer calls and almost 65,000 PC repairs (+100% in three years). Customer satisfaction levels have been rising steadily since 2003.
Lastly, in order to optimise product fl ow, Fnac decided to pursue the development of Fnac Logistique. Most notably, in the middle of last year the Rungis site was transferred to a new 20,000 sq.m. facility at Wissous to bolster the 56,000 sq.m. Massy site. Fnac Logistique accounted for 85% of 2005 store purchases in France, for instance 110 million products.
Step-up in international expansion
At the end of 2005, Fnac generated 23.6% of its total revenue outside France up 11.3%, through a network of 41 stores (excluding stores on a joint-venture basis). Of those countries in which the company is well established, the strongest performances were recorded in Spain (+14.9%), where a third Madrid store was opened in May and a new store opened in San Sebastian (Basque Country), and in Portugal (+10.2%), where the eighth Fnac store was opened in Albufeira in June. Countries in which the company has more recently commenced operations saw dynamic performance, with revenue rising by 52.1% in Brazil, 8.7% in Switzerland and 7.6% in Italy in a lacklustre market. In December, Fnac opened its fi rst store in Athens in a joint venture basis with one of Greece’s largest retailers, the Marinopoulos group.
In 2006, Fnac aims to strengthen its leadership position outside France by expanding its store network. It also plans to open three new stores in Spain (Bilbao, Seville and Palma), two in Portugal (Coimbra and Funchal) and one in Brazil (Morumbi).
International expansion is one of the key pillars of Fnac’s development strategy. The company’s goal is to double the number of its stores outside France within fi ve years.
(1) Source: Défi 2005.

56PPR 57
Continued expansion in France
Expansion within France remains at the heart of Fnac’s strategy. In October 2005, the company opened a store in Limoges – the only town with a population of over 100,000 in which it did not yet have a presence. Fnac will be opening more new stores in France in 2006, both in the centre of smaller cities and out-of-town, where the company will harness its taste for innovation with the introduction of a new type of store.
In town centres, Fnac is to open a new store in Valenciennes in the second quarter, whilst Marseille will welcome a second store a little later in the year. The Pau store will move to new, more spacious premises, and the Angers, Mulhouse, Orléans and Paris Montparnasse stores will benefi t from extensions and refurbishment.
Fnac is also working on extending its store network out of town to bring stores closer to its customers in response to new patterns of consumption. The opening of a fi rst out-of-town store is scheduled for the second half of 2006 in the south west of France.
Fnac’s specialist companies
Fnac has successfully created specialist companies in order to better meet the needs of its customers.
In addition to its historical offering in computers and software, Surcouf has successfully developed a wide range of digital products sold at competitive prices through its fi ve French stores. In 2005, the company opened its fi rst store outside France, in Barakaldo in Spain. The company’s website, surcouf.com, is among the top fi ve retail websites in France, with 1.2 million individual visitors in December 2005. The site offers 20,000 references, and availability and prices are updated three times a day. Surcouf posted 2005 revenue of €275 million, a 7.2% increase on 2004.
Fnac Éveil & Jeux offers a range of games and toys, books and multimedia products, nursery accessories and decoration for children up to the age of 12. The company uses three different distribution channels – catalogues, Internet and stores – enabling it to increase its recognition and offer each customer a tailor-made purchasing method. Fnac Éveil & Jeux is market leader in the on-line and home shopping sale of games and toys thanks to the originality and selective approach of its product offering. In 2005, the company recorded revenue of €132 million, up 9.9%, with 38.1% growth in on-line sales. At the end of 2005, Fnac Éveil & Jeux had 30 stores in France, and plans to open another fi ve stores a year taking the total to 45 by 2008.
The Group’s activities – Retail
131
24
92
30
5 6
Fnac Service Fnac Éveil & Jeux Surcouf
2004
2005
Fnac subsidiariesNumber of stores
Revenue and recurring operating income
REVENUE (IN € MILLION)
RECURRING OPERATING INCOME (IN € MILLION)
(1) Adjusted for the impact of the transition to IFRS.

57 Reference document 2005
Reasserting its role as a cultural, corporate citizen and responsible player
In addition to its retail activities, Fnac has always positioned itself as a cultural player and a corporate citizen company.
Cultural activitiesEighteen years ago Fnac launched the Goncourt Prize for Lycéens (secondary school pupils) in association with the Ministry of National Education and with the support of the Académie Goncourt. This prize is recognised in the French literary awards arena, and is designed to introduce secondary school pupils to the pleasures of reading through contemporary literature. In 2005, over 2,000 pupils in 58 classes participated in the competition and the prize was awarded to Sylvie Germain for Magnus.
For many years Fnac has also been actively involved in developing and promoting new talents.The “Attention Talent” award inaugurated in 1996 initially for records and subsequently extended to books, cartoons, short fi lms, photography and theatre, provides a platform for artists who do not enjoy the media coverage and promotion they deserve. The artists discovered benefi t from a specifi c commercial programme: one year of support, six months at a temporarily discounted price (Prix vert) in Fnac stores, three months availability in stores’ listening booths and a further promotion of the album at a Prix vert when artists are conducting a publicity campaign, in concert or on tour.Fnac has additionally been supporting artists from independent labels since 2002 via the “Indétendances” with the FnacIndétendances Festival launched at Paris Plage, in 2004. In 2005, independent artists accounted for over 26% of Fnac’s audio sales.
Fnac is also introducing the public to the breadth of the photographic image. Photography is another key plank of Fnac’s identity which the company has been pioneering since the 1960s. Fnac gives new talent and masterpieces exposure in its stores, whilst its photographic collection of several thousand images is regularly presented at exhibitions in France and abroad. Fnac is also regularly present at the Festival des Rencontres in Arles, where photography has been discovered and revered since its launch in 1969.
Social awareness activities To make culture accessible to all categories of the population, Fnac has, since 2003, been involved in a scheme to prevent illiteracy among school children in partnership with the association to promote an effective school (Association pour favoriser une école effi cace - APFEE), a French association combating illiteracy in primary schools and student city foundation association (Association de la fonda-tion étudiante pour la ville - AFEV), a student community service association. Fnac also actively supports the fabric of the community by making its forums and photo galleries available to associations and selling dozens of editorial products each year with the profi ts returned to the community (in 2005: the Guide Planète Urgence, Reporters sans Frontières, Objets chômage, etc.).In June, as part of its active policy of respect for the environment, Fnac set up a collection and recycling facility for ink cartridges for the benefi t of the Emmaüs/Atelier du bocage association. In conjunction with Emmaüs, the company has also initiated a service collecting old PCs from customers which are then repaired and put to use in underprivileged communities. During 2006, Fnac will also introduce fully biodegradable plastic bags which customers will be able to exchange free of charge once they have fi nished with them.
Financial results
In 2005, Fnac generated revenue of €4,382 million, up 6.1% compared to 2004. In France, revenue rose by 4.6%, fuelled by stronger growth in sales of technological products. Fnac increased its editorial products market share thanks to its broad offering and a strong performance in books. Abroad, Fnac confi rmed its growth: international revenue rose by 11.3%. Growth in recurring operating income outstripped that of revenue, rising by 9.7% to €152 million.
2005 highlights and outlook
In May 2005, Fnac was ranked in a TNS Sofres survey, third brands inspiring most confi dence in French consumers, conducted on behalf of the magazine Challenges.
In 2006, the Angers, Mulhouse, Orléans and Paris Montparnasse stores will be refurbished and extended, and the Pau store will move to its new location in August. In Belgium, the Anvers and Liège stores will be renovated. Four new stores will be opened in France and the pace of international expansion will accelerate with a total of 6 new store openings.

58PPR 59
• No.1 in household goods in France with over 9 million customers a year• No.2 worldwide retailer of home furnishings • A multi-product, multi-style discount offering• Selling space of 832,346 sq.m. in directly operated-stores • Active in 8 countries
Business concept
Conforama’s mission is to “allow as many people as possible to obtain well-being in the home, in line with their particular tastes and at the best price”. Conforama’s aim as a discounter is to offer its customers a broad range of home furnishing products and appliances (furniture, electrical appliances, consumer electronics and decorative items) in all styles, with immediate availability.
No.1 in France, with a 16% market share in furniture (1) and 9% in home appliances (2), Conforama is present in all regions of France, with 142 directly-operated stores and 47 affi liates at December 31, 2005. The company also operates 57 stores in seven countries outside France, in Spain, Switzerland, Portugal, Poland, Luxembourg, Italy and Croatia.
Its stores stock over 20,000 references, of which 80% are available immediately. Stores have average selling space of 3,500 sq.m., except in Italy and Croatia, where 20 stores under Emmezeta name with average selling space of 8,000 sq.m. offer textiles and general products in addition to Conforama’s usual range.
Conforama boosts its offering with regular promotions: 15-25 catalogues or leafl ets are distributed each year depending on the country concerned.
(1) Source: IPEA.(2) Source: GFK and Conforama
a 3,140 M2005 revenue
a177 M2005 recurring operating income
14,636employees at end 2005
199directly-operated stores at end 2005 (excluding 47 affi liate stores)
The Group’s activities – Retail
Map of Conforama sites in FranceNumber of directly-operated stores
MORE THAN 15 STORES
10 TO 15 STORES
5 TO 9 STORES
0 TO 4 STORES

59 Reference document 2005
Competitive environment
Conforama is the second largest player in the highly fragmented worldwide home furnishings and appliances market. Its main competitors depending on the country concerned are specialist retail chains ( Mediamark, Ikea, But, Darty, etc.), department stores and hypermarkets. Conforama differentiates itself through its multi-style offering, the launch of product ranges meeting local tastes and its ability to adapt its concept from one country to another. For a number of years the company has been France’s top “trusted brand” in the furniture category (1).
(1) Source: annual Reader’s Digest survey.
Strategy
Reaffi rming its discounter positioning
Since February 2005, Conforama has been returning to its roots, reinforcing its image as a discounter with a new advertising slogan “Confort at home at an affordable price” (“Bien chez soi, bien moins cher”). This slogan has been appearing in the media as well as in stores. At the same time, Conforama has been working on the structure of its product offering, strengthening the lowest priced goods in the most appro-priate segments, redefi ning the positioning of Top Confo (products offering the best value for money) and developing its own brands.
Modernising the brand and upgrading the store network
Conforama is stepping up its store refurbishment programme using a pragmatic and less costly approach based on three strands: a revised store layout, simplifi ed furniture and the optimisation of selling areas allocated to the various product categories. A total of 57 stores have been converted to the new concept, with a further 20 to follow in 2006, of which 17 in France. At the same time, the company has increased efforts to bring the product offering into line with current trends, and to strengthen the offering in high-growth market segments such as new technologies and kitchens. Conforama is also improving service on arrival, product availability, waiting times at parcel collection points and the launch of new paying services. In 2005, Conforama opened two new stores in France, one at Saint-Brice in May, and another at Morsbach in June, and continued its modernisation programme.
8.2%
52.8%
22.5%
FRANCE
7.4%
67.7%18.7%
6.2%
Breakdown of 2005 revenue by geographical area
Breakdown of 2005 revenue by product category
ITALY AND CROATIA
SWITZERLAND
OTHER COUNTRIES (1)
(1) Spain, Portugal, Luxembourg, Poland.
ELECTRONIC APPLIANCES
OTHER
DOMESTIC APPLIANCES
HOME FURNISHINGS (INCLUDING HOME APPLIANCES)
16.5%

60PPR 61
Consolidating its position abroad
Conforama is in the process of consolidating its presence abroad with the aim of becoming one of the top three retailers in each country in which it currently operates. There were major organisational changes in 2005: Switzerland, Portugal, Poland and Spain were grouped under a single unit to enable it to better identify and implement growth levers and share best practices in each country. Conforama ope-ned four stores outside France in 2005: two in Spain (Malaga in April and Barakaldo in May) and two in Switzerland (Emmen in March and Saint-Gall in August). In Italy, an Emmezeta store in Sassari, Sardinia was converted to a Conforama in the spring. Following this successful transformation, the format now combines a traditional Conforama product offering with a general goods section inspired by Emmezeta. The initial results have exceeded the company’s expectations. Conforama aims to carry on developing this concept in 2006, with a new store opening planned for Naples and the imminent conversion of the Emmezeta store in Affi (Verona).
Optimising sourcing, purchasing and the fl ow of goods
Conforama continued to develop its purchasing function in 2005. The company has been reorganising this function since 2003 in order to improve price competitiveness, boost profi tability and diversify the product range. Six offi ces are now operating in Paris, Milan, Warsaw, Bucharest, Ho Chi Minh City and Shenzen. Currently 11% of furniture purchases come from Asia and 7% from Eastern Europe. Conforama is developing international synergies – jointly developed low-price products – and is launching a project to turn purchasing gains into margin improvements and to manage selling prices more effectively.Simultaneously, Conforama is implementing a new guiding framework for logistics aimed at optimising supply times, logistics costs and product availability. The logistics installation in France was radically reorganised and modernised in 2005 with two new platforms in France at Onnaing and Satolas (71,000 sq.m.), and Niederbipp in Switzerland (30,000 sq.m.). In order to meet its ambitious objectives, Conforama is adapting its information systems and introducing the structures required to expand its businesses.
A responsible and socially aware company
Conforama is pursuing its sustainable development strategy, in particular with the launch of a programme for the design of eco-friendly white goods in partnership with the French energy management agency (Agence de l’environnement et de la maîtrise de l’énergie – ADEME), PPR Purchasing and Electrolux, and the development of river transport for its goods over the course of the year.
The Group’s activities – Retail
2004 TOTAL EXCL. AFFILIATES: 193
2005 TOTAL EXCL. AFFILIATES: 199
Number of stores
Affi liate stores at December 31, 2004 and 2005: 47
TOTAL 2004: 799 573 SQ.M.
TOTAL 2005: 832 346 SQ.M.
Selling space excl. affi liates (in sq.m.)

61 Reference document 2005
Financial results
Conforama posted 2005 revenue of €3,140 million, a 1.4 % increase on 2004, despite a fi ercer competitive environment and an unfavourable economic climate. In Conforama’s main market, France, revenue advanced by 2.7%, marked by a substantial rise in visitors to stores and an increase in the contribution of household appliance sales. Outside France, revenue declined by 1.2% refl ecting lower activity in Italy (which accounts for 51.2% of total international revenue) due to the depressed trading conditions. Outside Italy, international sales were up 2.8%. Recurring operating income came to €177 million (5.6% of revenue), weighed down by charges associated with the new operating methods introduced in several Italian stores, now let, and the sharp rise in logistical costs arising from the implementation of a new process designed to increase effi ciency and competitiveness.
2006 outlook
At the start of 2006, Conforama strengthened its leadership of the French market with the acquisition of Sodice Expansion, the company’s fi rst franchisee, which operates 14 stores in the north of the country and has a almost 1,000 employees. This acquisition will have a po-sitive impact on Conforama’s results as from this year. It consolidates Conforama’s store network by extending its coverage to the whole of the country. In France, the number of directly-operated stores now stands at 156, with selling space of 552,000 sq.m..The company plans to open three new stores in 2006: one in France (Nice), one in Switzerland (Villeneuve) and one in Italy (Naples) and store renovation will be pursued.In the autumn, Conforama plans to launch a new logistics platform in the Paris region (at Châtres-en-Brie in Seine-et-Marne) with an additional surface area of 65,000 sq.m.. At the same time, several new purchasing offi ces will be set up in Asia (Indonesia, Pakistan, etc.) in an attempt to continue diversifying the company’s suppliers.
3,097
207
3,140
177
2004 (1) 2005
Revenue and recurring operating income
REVENUE (IN € MILLION)
RECURRING OPERATING INCOME (IN € MILLION)
(1) Adjusted for the impact of the transition to IFRS.

62PPR 63
• No.1 in Africa and the French overseas departments and territories in automotive and pharmaceutical distribution
• A major player in the distribution of new technologies• Active in 30 African countries and 6 French overseas departments and territories• 128 subsidiaries and 273 sites• 42,500 new vehicles sold in 2005• 15,000 pharmacies delivered daily (45 boxes a second)
Business concept
CFAO distributes internationally recognised products in three core businesses: automotive (51% of 2005 revenue), healthcare (31%) and new technologies (6%). The company is also active in the production and distribution of consumer products. CFAO is backed by dedicated teams of professionals in each of its activities. Its 10,586 employees work in 128 subsidiaries at 273 sites. CFAO has been operating on the African continent for over a century, and is now active in 30 African countries (71% of revenue) and 6 French overseas departments and territories.
a2,034 M2005 revenue
a167 M2005 recurring operating income
10,586employees at end 2005
Map of CFAO operations in Africa
CFAO OPERATIONS
KEY AREAS FOR CFAO EXPANSION
AREAS FOR CFAO EXPANSION
The Group’s activities – Retail

63 Reference document 2005
Competitive environment
With 42,500 new vehicles sold and €1,039 million in revenue in 2005, CFAO is the leading automotive retailer in Africa (excluding southern Africa). CFAO is the distributor for major international carmakers such as Toyota, PSA Peugeot Citroën, Renault/Nissan, General Motors, Daimler Chrysler and Ford.The company is also the leading pharmaceutical distribution company on the African continent and in the French overseas departments and territories, with revenue of €638 million in 2005 and 38% of the pharmaceutical distribution market in Sub-Saharan Africa. Lastly, CFAO aims to become a major player in new technologies in Africa. Its dedicated activity CFAO Technologies is carving out a market as a “solutions integrator” in information technology, telecommunications, networks and offi ce automation. CFAO Technologies represents the world leaders in the sector: IBM, Lenovo, Cisco, Oracle, Siemens, Motorola, Sharp and Otis. In 2005, CFAO Technologies generated revenue of €115 million.With no real competitor of comparable stature on the African continent, CFAO offers each of its customers in each of its businesses its professionalism and its know-how combined with international quality standards.
Map of CFAO operations around the world
French Polynesia
Guyana
GuadeloupeMartinique
MauritiusReunion
Liverpool
SèvresRouenLe Havre
New Caledonia
Madagascar
See opposite page

64PPR 65
Strategy
Signifi cant growth
Between 2000 and 2005, CFAO pursued an ambitious growth strategy, establishing new companies as well as making acquisitions. Over this period, CFAO moved into 13 new countries and saw revenue rise by 63%. Over the past 10 years, CFAO has undergone a period of outstanding growth and profi tability: revenue and recurring operating income have more than tripled. This performance underscores the success of its investment strategy, including countries deemed high risk. This success is underpinned by strong control of the risk/profi tability matrix combined with diversifi cation from both a geographical and a business standpoint.
Expanding market share in Mediterranean Africa and East Africa
One of the top priorities of the CFAO growth strategy in the medium term is to focus on the markets of Mediterranean Africa, from Morocco to Egypt. In the automotive sector, CFAO has negotiated exclusive distribution agreements with General Motors and DAF in Morocco and Algeria for the Opel, Chevrolet, Isuzu and DAF brands. In these two countries, activity grew by 69.9% in 2005. CFAO’s healthcare subsidiary Eurapharma captured 12% of the Egyptian pharmaceuticals distribution market in three years. In 2005, Eurapharma’s activity in Egypt grew by 31.4%, and CFAO Technologies reported a 24.2% increase in revenue in Algeria. In the medium term, CFAO aims to increase revenue in Mediterranean African countries from the current 16.6% of the total to 25%. At the same time, it plans to bolster its market share in English-speaking African countries, particularly East Africa.
CFAO: a trusted, quality brand in its markets
As a distributor of major global brands, CFAO stands out from its competitors with its effi cient before and after sales services, its constant emphasis on operating investments (as illustrated by its showrooms, stores, warehouses, workshops, equipment, information systems, etc.), and a supply chain able to swiftly supply markets far from production centres.To project an image that sets it apart, CFAO launched a drive to improve the quality of its customer service, and gradually introduced new tools and working methods. Therefore, CFAO created an Automotive Quality Charter for use throughout its network of dealerships. Subsidiaries that have achieved the objectives set are “certifi ed” by CFAO.
A socially responsible company
CFAO cannot conceive of its role as a player in the economy without adding a strong commitment to corporate social responsibility. Thus, in October 2002, the company set up the organisation CFAO Solidarité to focus chiefl y on education and professional training, health and hygiene and in particular the fi ght against AIDS.
The Group’s activities – Retail
Breakdown of 2005 economic sales (1) revenue by geographical area
38%
(1) Including equity affi liates.
FRENCH SPEAKING SUB-SAHARAN AFRICA FRENCH OVERSEAS TERRITORIES AND INDIAN OCEAN
MEDITERRANEAN AFRICA
ENGLISH SPEAKING SUB-SAHARAN AFRICA
MAINLAND FRANCE
4%
17%
29%
Breakdown of 2005 revenue by activity
AUTOMOTIVE
EURAPHARMA (HEALTHCARE)
INDUSTRIES AND TRADING
TECHNOLOGY51.1%
5.6%
31.3%
12.0%12%

65 Reference document 2005
Financial results
In 2005, CFAO’s revenue rose by 9.4% to €2,034 million, despite political and economic problems, notably in Ivory Coast and Cameroon. Automotive sales increased by 9.3%, and pharmaceuticals by 9.8%, while CFAO Technologies continued to grow at a steady pace, posting a 20.8% increase in revenue. Industries and trading revenue was up 4.2%.Recurring operating income advanced by 5.2% to €167 million, driven by the company’s excellent performance in Mediterranean Africa.
2005 highlights and outlook
CFAO continued to pursue organic growth in 2005.The automotive activity grew by 69.9% in Mediterranean Africa. Revenue in French-speaking Sub-Saharan Africa was unchanged on 2004, with tough economic and political conditions in Cameroon and Ivory Coast leading to declines in these countries. Note a 36.4% jump in revenue in Gabon. In 2005, a number of dealerships, primarily in Mali and Morocco, designed in line with European standards and fully focused on customer satisfaction, were refurbished. An acquisition in Morocco added DAF trucks to CFAO’s brand portfolio. The healthcare activity launched a new logistics platform in Rouen and equipped its Martinique subsidiary with an automated pharmaceuticals distribution tool.Meanwhile, CFAO Technologies made organisational changes to bring its resources closer to the customer. Five regional skills centres bringing together the most advanced resources are now responsible for co-ordination of the 21 countries and 10 subsidiaries of the technology activity. During the year, CFAO also continued efforts to improve customer service quality in all its activities.
CFAO’s goal for 2006 is to generate healthy revenue growth by expanding existing activities and adding to its positions in high-growth markets.
Revenue and recurring operating income
REVENUE (IN € MILLION)
RECURRING OPERATING INCOME (IN € MILLION)
(1) Adjusted for the impact of the transition to IFRS.

66PPR 67
Other activities
The Group’s activities – Retail
Kadéos
• No.1 in gift vouchers and cards in France and Europe• 30% of the French gift voucher market (sales to individuals and corporations)• More than 70 retail partners• €335 million in gift vouchers and cards issued in 2005 • More than 13,000 corporate customers • 82 employees in France and abroad at December 31, 2005
Business concept
Kadéos was established in January 2000. The company develops and markets a wide range of gift vouchers and cards which can be used at more than 70 retail companies, of which 40 are exclusive partners. Kadéos fully exploits synergies with the PPR Group (Fnac, Printemps, Conforama, Redcats and their subsidiaries) whilst also developing partnerships with other companies in specifi c areas (Thomas Cook for travel, Go Sport for sports, Toys’R’Us for toys, Jean Louis David for lifestyle, etc.). Kadéos gift vouchers and cards thus have a multitude of uses in culture, fashion, home furnishings, computers, and leisure. They can be purchased and used at over 1,000 points-of-sale and 3,000 Relais-Colis in France and also on Internet and by mail-order. Kadéos is active in six European countries: France, Italy, Spain, Belgium, Luxembourg and Portugal.
Competitive environment
In less than three years, Kadéos has become the top gift voucher company in France and Europe. The company operates in two markets: the B-to-B market with corporate management and works councils, and the B-to-C market with individuals. Corporations have long used gift vouchers as a reward and incentive for their employees and partners. This gift gesture is also extremely popular with works councils for Christmas, weddings, mother’s day and father’s day, birthdays and retirements. Kadéos does 70% of its activity in the B-to-B market. In 2005, with €237 million in gift vouchers issued to companies, Kadéos controlled 25% of the French B-to-B market, which comprises over 200,000 companies and 30,000 works councils (1). The individual market (B-to-C) is booming and expected to grow substantially in the years to come. A study conducted by Deloitte in 2005 showed that more than one-third of French consumers wish to receive gift vouchers for Christmas. Furthermore, gift vouchers and cards are becoming the most appropriate gift for the growing number of French purchasers (53%), who leave their Christmas shopping until the last minute. In 2005, Kadéos issued €98 million in gift vouchers and cards to individuals in France and abroad, giving it over 55% of the French B-to-C market.
Strategy
A pioneering position in a booming sector
In April 2005, Kadéos launched on the French market a new multi-company gift card in Fnac, Printemps, La Redoute, Made in Sport, Citadium, Madélios, Conforama, Orcanta, Surcouf, fnac.com and redoute.fr. The card is designed to replace the gift voucher in the B-to-C market, and has numerous advantages, such as self-service sales, multi-channel use (internet, telephone and store), enhanced security and a more contemporary format. Underpinning Kadéos’ market position as a pioneer, the new card boosts the company’s sales potential by more than 10%. In the B-to-B market, 2005 saw the launch of the Kadéos culture voucher – the fi rst multi-company voucher dedicated to cultural products and venues and aimed at works councils.
(1) Source: 2005 Deloitte Study.

67 Reference document 2005
Continued expansion in Europe
The European gift voucher market is booming and far from mature. The United Kingdom is the most advanced country in this area but remains well behind the United States and Japan, which is the world leader with more than €10 billion in gift vouchers sold per year. Recent studies show a growing taste for gift vouches in countries such as Belgium, the Netherlands, Ireland, France, Germany, and the United Kingdom, which ranked the gift voucher among the top fi ve gifts featured on Christmas wish lists in 2005 (1).To consolidate its leadership position in Europe and exploit the strong growth to come, starting in 2003 Kadéos expanded the range of countries accepting its gift vouchers to include Spain, Italy, Portugal, Luxembourg and Belgium. Kadéos aims to generate 20% of its activity outside France within the next fi ve years.
Financial results
Kadéos is a cross-functional organization which manages the gift voucher activity of PPR’s retail companies. In 2005, revenue (namely commissions received on the issuance, distribution and conversion of vouchers) was up 23.2% to €19 million.
2005 highlights and outlook
In 2005, Kadéos launched an unprecedented promotional campaign aimed at bolstering its market leadership. For a 10-week period commencing in October (a period accounting for 30% of Kadéos’ annual revenue ), the company broadcast adverts on French TV channel M6 and carried out a press campaign to accompany the launch of the gift card on the B-to-C market. 2005 was also marked by a successful trial distribution of Kadeos gift vouchers through the Post Offi ce network. Following the successful test period, Kadeos and the Post Offi ce established a partnership in early 2006 in order to distribute Kadeos gift cards and vouchers, which the Post Offi ce will offer to its customers via its 3,500 offi ces throughout France. 2006 also will see the enhancement of the gift card’s functionality and its launch on the B-to-B market.
Orcanta Lingerie
Business concept
Established in 1996, the Orcanta lingerie chain operates 64 stores in France. Orcanta Lingerie invites its customers into a warm, contemporary world designed like a private apartment. The company offers three constantly-updated product ranges made up of the best styles selected from the major lingerie brands. The product offering centres on four product categories: corsetry, day and night time lingerie, bath and accessories.
Financial results and outlook
The lingerie market has been contracting since 2005, and is particularly competitive. Orcanta differentiates itself through its trendy, up-market, multi-brand product offering and renowned service quality. In 2005, Orcanta reported revenue of €49 million. Orcanta has continued to focus on boosting its earnings by improving the quality of its service and advice and carrying out an in-depth review of its selections and margins. The company has also reinforced its partnerships with the main lingerie brands through the launch of exclusive styles, and has also created a new accessories line. In 2006, Orcanta plans to open new stores and develop the on-line distribution channel.
(1) Source: 2005 Deloitte study.

68PPR 69
72
The CSR approach of the PPR Group70 Organisational structure dedicated to the CSR approach
70 The PPR Group’s Code of Business Practices
71 Reliable environmental and social reporting
Employees73 Employment
75 Working environment and personal development
78 Diversity and equal opportunities
82 Freedom of expression and employee relations
Management of risks, health and safety84 Obtaining international certifi cations
85 Bodies responsible for the management of risks, health and safety
85 Innovative prevention policies implemented by the Group’s companies
Environment 88 Developing reliable data for environmental reporting
89 Consumption of raw materials
92 Logistics and transport
70
Corporate Social
84
88
Les activités du Groupe
69 Reference document 2005
98 Waste production
100 Energy consumption
103 Water consumption
Business partners 104 Making corporate social and environmental responsibility
an integral part of the Group’s purchasing policy
107 Sensitising and training in corporate social and environmental responsibility
and sharing good practices
Customers and consumers 108 Guaranteeing safe and quality products
111 Sensitising the Group’s customers and offering products refl ecting
sustainable social and environmental development issues
Shareholders
Encourage corporate citizenship 114 SolidarCité’s areas of actions
115 Inter-company projects at Group level
117 Specifi c projects at company level
104
113
Responsibil ity (CSR)
108
114

70PPR 71
The fi rst structural element that formalised PPR’s CSR (1) policy has been the creation of SolidarCité in 2001, a non-profi t making organisation created in order to promote and pursue projects in this area. 2004 was devoted to identifythe challenges to be met by the Group’s CSR policy and harmonising the projects implemented by the companies (2). The PPR Group developed a reference framework for its CSR approach with the creation in 2004 of a Code of Business Practices organised by stakeholders: employees, customers and consumers, business partners, the environment, local communities, fi nancial markets and all of the Group’s managers in 2005. 2006 will be devoted to defi ning the CSR policies appropriate for each company that comply with the commitments of the PPR Group.
Organisational structure dedicated to the CSR approach PPR’s Corporate Social Responsibility Department, which was set up in 2003, reports to the Senior Vice-President for Human Resources, who is a member of the Executive Committee. Its mission is to defi ne the Group’s CSR policy, to guarantee implementation, ensure com-pliance with the Code of Business Practices, and to assist and coordinate the policies and action plans of the companies. Within the companies, the “Corporate Social Responsibility” Managers are responsible for deploying the PPR Group’s CSR approach and for executing the environmental and social projects specifi c to their businesses. Several corporate social responsibility networks have been created (the sustainable development network, the WEEE (3) network, the transport network, supplier relations, etc.) to ensure that projects and resources are shared.
The PPR Group’s Code of Business PracticesFaced with the emergence of new ethical challenges, such as respect for human rights among its suppliers, PPR wanted to update its Ethics Charter written in 1996 to give it a broader commitment and responsibility framework. The Code of Business Practices testifi es the group’s ethical convictions and its commitments to its stakeholders.
A Code structured by stakeholders
The PPR Group’s Code of Business Practices is organised on the basis of stakeholders, i.e. the internal and external stakeholders concerned by the Group’s activities. It provides a comprehensive and coherent view of PPR’s commitments to its employees, customers and consumers, business partners, environment, local communities and to the fi nancial markets.
A top-down deployment
The deployment process of the Code of Business Practices started in October 2004 when it was presented to the PPR senior executives’ meeting in Lisbon for the Group’s Convention. At the same time, 70 works councils in France or equivalent structures abroad were consulted between the fall of 2004 and the spring of 2005.The top-down deployment began in 2005 through 150 “Code Ambassadors”, operational managers or human resources staff appointed in each company, and specifi cally trained to be able to train Group managers, and then each manager had to involve his teams. Information and facilitation kits were developed in eight languages and a collaborative online working platform was installed to assist the managers in this deployment. At the end of 2005, the Code of Business Practices was deployed throughout the Group.
The CSR approach
Corporate Social Responsibility – The CSR approach of the PPR Group
(1) CSR: Social and environmental responsibility(2) First level of segment reporting described in note 2.20 to the consolidated fi nancial statements and representing a Group company or brand (Printemps, Redcats, Fnac, Conforama, CFAO
for Retail activity; Gucci, Bottega Veneta, Yves Saint Laurent and YSL Beauté for Luxury Goods activity).(3) Waste electrical and electronic equipment products.

71 Reference document 2005
of the PPR Group
The creation of an Ethics Committee for Social and Environmental Responsibility (ECSER)
The development of the Code of Business Practices was accompanied at Group-level by the establishment of an Ethics Committee for Social and Environmental Responsibility (ECSER), which is an advisory, monitoring and feedback structure that guarantees compliance with the Group’s commitments. With about ten members - one representative per company, four members from the PPR head offi ce, and one independent expert from outside the Group, the ECSER may be contacted by any employee or any person outside the Group. A specifi c and confi dential email address has been set up for this purpose. The ECSER meets every two months on the average, depending on the matters submitted to it for consideration.
The establishment of a local network with Business Ethics representatives
Chosen for their knowledge of the company and their reputation for integrity, the “Business Ethics Representatives” have been specially trained in the companies and at PPR’s head offi ce to report with complete confi dentiality on all matters relating to the Code of Business Practices submitted by employees and to fulfi l their duties to assist in ensuring compliance with the Code.
Reliable environmental and social reporting Indicators of environmental and social performance were defi ned in 2003 in application of the French decree on the New Economic Regulations (NER) concerning environmental and social data and in accordance with specifi c recommendations of the Global Reporting Initiative (GRI) (1). These indicators aim to qualify and monitor the progress of the Group’s CSR approach Two on-line platforms were crea-ted in 2004 to host the social and environmental reporting tool. 2005 was focused on optimising reporting, ensuring reliable data to calculate the performance indicators and also extending the reporting scope. In 2005, PPR was ranked as one of the leading companies in terms of the quality of information provided and compliance with the requi-rements of the NER law, even though the Group was in the “beginners” category in 2003 (2).
The environmental reporting
As environmental reporting is relatively recent within the Group, PPR focused its efforts in 2005 on improving the reliability of data feed-back with the extension of the scope of the data and the establishment of reporting sheets for qualitative data. The specifi c aspects of environmental reporting are specifi ed in the section on the environment.
The social reporting
A step in social reporting was taken in 2005 with the deployment of a new data collection and consolidation tool. This tool allows 141 representatives to enter the data from their scope directly to the same application, which ensures data consistency with immediate access to the common defi nitions of the various indicators to be provided. The data completion rate is monitored throughout the reporting campaign and intermediate validation levels are established.The data published in this document covers 99.7% of employees at December 31, 2005 within the Group’s scope of consolidation, with the exception of the indicators for full-time equivalent and data on hirings and promotions, which excludes Africa and, therefore, covers 88.1% of the scope. 2004 data were calculated over the same scope of consolidation.
The Group’s commitments
As the CSR approach of the PPR Group is organised by stakeholders, this reference document provides a similar breakdown to report on the strategic programmes and the most signifi cant company actions for 2005. Thus, the information provided is not an exhaustive presentation.
(1) International guide on social and environmental reporting.(2) Source: ALPHA Etudes Group.

72PPR 73
In 2005, PPR set a goal to be an employer of choice for its internal relations (employees, candidates for future employment…) and external relations (customers, suppliers, shareholders…)In each of the Group’s activities, Luxury Goods and Retail, the collective goals to be achieved require strong performance from all employees. In order to meet this challenge, PPR deploys a Human Resources policy that combines the development of internal skills, mobility and better visibility of its ambition in relation to its various stakeholders. In 2005, the Group and its companies continued their strategy to deploy their “Employer Brand” based on the opportunities offered by the Group.
Breakdown of permanent employees by region at December 31, 2005
51.2%
0.6%
7.0%
23.5%
11.6%
FRANCE
WESTERN EUROPE
AFRICA
NORTH AMERICA
ASIA
SOUTH AMERICA
AUSTRALASIA
EASTERN EUROPE
4.1% 0.9%1.1%
Total: 84,316
Breakdown of permanent employees (CDI) and fi xed-term employees (CDD) by region at December 31, 2005
51.8%
0.6%
8.0%
22.1%
11.4%
FRANCE
WESTERN EUROPE
AFRICA
NORTH AMERICA
ASIA
SOUTH AMERICA
AUSTRALASIA
EASTERN EUROPE
4.2%0.6%1.3%
47.3%
1.2%
32.6%
13.8%
2.2% 2.8%0.1%
Employees on permanent contracts
Total: 74,331
Employees on fi xed-term contracts
Total: 9,604
Out of a total workforce of 84,316 employees at the end of 2005, 12,732 were part-time, representing 17.1% of employees on permanent contracts. 82% were women and 95.8% were non-managers. The average monthly number of temporary staff equated to 3,753 full-time employees in 2005 (exclu-ding Africa).
Employees
84,316employees at December 31, 2005
54.1%women employeesat December 31, 2005
82.2%non-managersat December 31, 2005
37.3 yearsaverage age of employees on permanent contracts (CDI)
8.7 yearsaverage length of service of employees on permanent contracts (CDI)
36.6 hoursaverage work week
For all graphs, each geographic region includes the following countries: Western Europe: Germany, Austria, Belgium, Spain Finland, Great Britain, Greece, Italy, Luxembourg, Monaco, Norway, Netherlands, Portugal, Sweden and Switzerland; Eastern Europe: Croatia, Estonia, Poland and Romania; North America: Canada and the United States; South America: Aruba, Brazil, Guyana, Martinique, Guadeloupe and Saint-Martin; Africa: Algeria, Benin, Burkina Faso, Cameroon, Congo, Ivory Coast, Egypt, Gabon, Gambia, Ghana, Guinea, Equatorial Guinea, Kenya, Madagascar, Malawi, Mali, Morocco, Mauritius, Niger, Nigeria, Uganda, Centrafi can Republic, Democratic Republic of Congo, Réunion, Senegal, Tanzania, Chad, Togo and Zambia; Oceania: Australia, New Caledonia, New Zealand, and French Polynesia; Asia: China, South Korea, Dubai, Guam, Hong Kong, India, Bangladesh, Japan, Singapore, Malaysia, Taiwan, Turkey and Vietnam.
Corporate Social Responsibility – Employees

73 Reference document 2005
EmploymentAttracting and hiring
• 33,944 new hires in 2005 (excluding Africa), including 56.8% women • 2,146 fi xed-term contracts converted to permanent contracts • 84.0% of managers were hired under permanent contracts compared to 83.5% in 2004 • 36.6% of non-managers were recruited under permanent contracts compared to 35.0% in 2004 • 674 apprentice contracts
To attract and recruit the best candidates, PPR continue to communicate about its businesses and offers in France and abroad. In 2005, the Group recruited 13,413 employees under permanent contracts and 20,531 employees under fi xed-term contracts. The Group’s companies have few recruitment problems. The few diffi culties encountered are primarily related to linguistic constraints (particularly in Belgium, Asia, Eastern Europe or Switzerland), the search for technical expertise (particularly at Fnac) or experience in specifi c businesses (Luxury Goods or home shopping).
Globalisation and optimisation of the e-recruitment tool
PPR has developed an online recruitment tool, www.peopleatppr.com, available in France, Spain and the USA. This tool was deployed in Sweden, the United Kingdom and Portugal in 2005. Over the entire reporting scope for 1400 jobs, PPR received more than 105,000 applications.Thanks to the new version of the website, completed in April 2005, the number of visitors continued to rise over the year, reaching more than 20,000 hits in October.
Developing lasting relations with schools
In addition to general communications about its ambitions and employment opportunities, PPR pursued a dynamic school relations policy by strengthening links with the schools defi ned as partners for each of its companies. PPR participated in exchanges and meetings, and business forums and conferences. This enabled students to discover the Group’s needs and the diversity of professional careers with the participation of experts from the Group.
Employees on permanent contractsTotal: 13,413
Employees on fi xed-term contractsTotal: 20,531
Breakdown of employees on permanent and fi xed-term contracts by region in 2005 (excl. Africa)
42.9%
7.3%
31.9%
16.1%
FRANCE
WESTERN EUROPE
NORTH AMERICA
ASIA
SOUTH AMERICA
EASTERN EUROPE
AUSTRALASIA
1.0% 0.2%0.6%
74.7%
20.9%
0.7%2.3%
0.7% 0.1%
Employees on permanent contractsTotal: 13,413
Employees on fi xed-term contractsTotal: 20,731
Breakdown of managers and non-managers hired under permanent and fi xed-term contracts in 2005 (excl. Africa)
86.8%
MANAGERS
NON-MANAGERS98.4%
13.2%1.6%
0.7%

74PPR 75
Help with relocation
• Global turnover: 21.8% of the average monthly number of employees on permanent contracts and 14.7% excluding the United States, where the contractual situation is different
PPR applies a policy designed to retain candidates who fulfi l its business needs. The Group must also deal with changes inside and outside businesses linked to the economic climate in order to meet the expectations of its customers and the challenge from its competitors.Restructuring, site improvements, closures or non-suitability may lead the Group’s companies to relocate some of their employees.To assist with these changes, PPR naturally relied on its existing transfer policy together with a specifi c “Job Coordination” programme in France to accompany and facilitate the relocation of its employees impacted by these changes . In 2005, 73.6% of the employees affected by the Groups’ transfers found jobs within or outside PPR (versus 67.2% in 2004), 58.0% of the employees were relocated within the Group (versus 53.9% in 2004) with an average of one valid relocation offer per employee in the Group.
Job coordination
Created in 1999, the Job Coordination task force includes representatives of the companies responsible for recruitment in France, who meet in work groups once a month. It acts through the internal networks, circulates job vacancies, initiates personalised follow-up and organises reconnaissance trips, etc.In order to make this mechanism dynamic and encourage internal relocation of employees, the PPR Executive Committee decided in July 2005 to implement a “temporary, geographic freeze on outside hires” at the end of the year. This decision shows PPR’s efforts to make progress in inter-company mobility and implement job solidarity within the Group.
Breakdown of permanent employees departures by reasons in 2005 (excl. Africa)
9,635(66.8%)
799(5.6%)
RESIGNATIONS
OTHER DISMISSALS
OTHER REASONS
ECONOMICAL LAY-OFFS (1)
RETIREMENT
2,949(20.5%)
577(4.0%)
419(3.1%)
(1) In particular the restructuring plans in France (Boucheron, La Redoute, Fnac Services), the United States (Redcats) and Belgium (Fnac).
Total: 14,379
Exchanging information and increasing awareness during “Employment and Mobility Days”
In addition to the working groups, the Job Coordination unit has also organised “Employment and Mobility Days” since 2002 with the Human Resources Development Club. In 2005, an “Employment and Mobility Day” was organised in Nantes (France) and attended by 57 operational managers and human resources managers from the PPR companies operating in this region to promote inter-company transfers and to create greater awareness of equality of opportunity.
Corporate Social Responsibility – Employees

75 Reference document 2005
Working environment and personal developmentBeing a Group of choice also requires for PPR, a commitment to facilitate the integration of new arrivals, provide an ongoing training process, develop mobility, evaluate individual contributions to results and reward this contribution.
Integration and training
• 1,71% of payroll allocated to training in 2005• 885,008 hours of training in 2005 (excluding safety training)• 76.9% of the employees trained in 2005 were non-managers
Succeding employees integration
The Group’s companies have developed integration days for new employees. During these days, new French and international managers have been able to learn the scope of the Group, the range of its businesses and the diversity of career paths. 75% of PPR employees, up from 72% in 2003, feel that new arrivals rapidly feel integrated within their company (Source: PPR 2005 opinion survey).
Training employees and enhancing their skills
Within the framework of the internal training developed at the PPR UniverCité, the Group offers training programmes to its executives from the various companies which cover a wide variety of themes in French and English, particularly on management or designed to improve fi nancial knowledge. The companies are also developing their own training programmes. In 2005, Printemps established the “Ulysses” project, an internal trai-ning programme covering the “department manager” position. Over a period of 18 to 24 months, it offered about twenty salespersons the possibility of being promoted. The programme which began with a day of induction and a presentation of the tutors who will guide them during their entire training period, establish an intermediate phase to validate potential conducted by the Department of Human Resources in July 2006. To back up its business expertise, Redcats expanded its Speed training school (Specifi c education) and developed new programmes, par-ticularly on the contribution of knowledge from the Internet channel.Fnac has developed a genuine ongoing training process so that some employees could validate their professional experience, thus promoting recognition of a skill, and improve their employability. Fnac accompanies its employees throughout the preparatory phase, providing them help and advice them if necessary regarding the choice of further training. In 2005, the Professional Experience Valida-tion project was extended to all the French regions, in conjunction with the French National Education Ministry: 52 of the 61 candidates achieved successfully their diploma.
Developing internal networks
In addition to the theoretical contribution of knowledge during these training programmes, the PPR Group encourages and develops many opportunities for inter-company meetings among professionals. The creation and development of clubs by communities of businesses such as Finance and Human Resources enable good practices and successful experiences to be shared among the companies.
Breakdown of staff trained by geographic region in 2005
39.7%15.5%
5,7%FRANCE
WESTERN EUROPE
AFRICA
NORTH AMERICA
ASIA
SOUTH AMERICA
AUSTRALASIA
EASTERN EUROPE
3.9%
32.7%
1.5%0.5%
0.5%
Total: 40,018staff trained
Breakdown of men/women non-managers who became managers in 2005by geographic region (excl. Africa)
58.9%22.0%
11.2%
4.6%2.0%
0.3%1.0%
WomenTotal: 304
FRANCE
WESTERN EUROPE
NORTH AMERICA
SOUTH AMERICA
ASIA
EASTERN EUROPE
AUSTRALASIA
MenTotal: 247
54.3%
2.4%
8.5%
1.6%
28.8%
4.0% 0.4%

76PPR 77
Career mobility and development
Offering its employees new opportunities for development, expanding an employee’s portfolio of skills, enabling the employee to discover his or her business within the context of another culture or country represent the mobility commitments of the PPR Group.
Organising and encouraging the identifi cation of potential
Every year, an internal mechanism enables an exchange regarding potential mobility and the qualifi cations of in-house candidates, fi rst within each company and then Group-wide. To facilitate the identifi cation of potential internal candidates, Human Ressources Develop-ment Clubs are organised every month within the companies. During those sessions, each company representative provides information about its group of potential candidates in order to organise meetings that facilitate inter-company exchanges. Career Committees are also organised every year to identify the talents and expertise in each company with consolidation at Group level. Executive positions also benefi t from this process and potential succession plans are formalised every year. Thus, 62% of the members of the “Leadership Group”, representing the 150 top Group executives, come from this internal promotion process.
Performance reviews and career development
The transfer policy developed within each company, the deployment of the Moovenet Intranet dedicated to transfers and new international offers, in 2005 expanded the scope of opportunities for professional development to a growing number of employees. Employees can organise their choice of positions based on different criteria proposed by Moovenet with complete confi dentiality, and learn fi rst about job offers in France and abroad about 5 to 15 days before the position is open to outside candidates. The Printemps initiative should be noted here. The company decided to communicate through its business segments to heighten awareness of possible career paths and potential entry points for every employee. In 2005, 2,904 employees benefi ted from intra-company transfers and 92 from inter-company transfers, representing a 12% increase in the total number of transfers from 2004.
Evolution of intra-company and inter-company transfers
84 92
2,539
2,904
2004 2005
INTER-COMPANY TRANSFERS
INTRA-COMPANY TRANSFERS
Performance reviews and career development
The employee evaluation process is a key element in their professional development.
Annual appraisal interview
If the career committee process offers a variety of professional paths, it is because it is based on a consolidation of the annual appraisal interviews, which are a valuable source for a constructive exchange on the contribution of each person to the collective performance and to the action plans to be implemented in the coming year. The 2005 internal opinion survey provides an analysis that complements this managerial tool: 65% of the Group’s employees who responded to the poll had such an interview within the 12 months prior to the study, a fi gure comparable to 2003. Plans will have to be initiated within the companies to optimise the use of these interviews. In 2005, Printemps also added a mid-year interview for its entire managerial staff.
A skill centre for managers
50 young managers enrolled in 2005 in the Development Centre programme were better able to identify their professional strengths and build personalised career development plans with the Group.
Executive appraisal
Group executives benefi t from an additional appraisal tool, known as the 360° Feedback which gives them a feedback on the perception of their management (by their employees, their team, their supervisor and their peers) every two years and gives them the opportunity to defi ne their individual development projects.
Corporate Social Responsibility – Employees

77 Reference document 2005
Compensation and benefi ts
The compensation policies for employees are set at the company level, with the exception of the compensation for members of the Leadership Group, comprised of the 150 top executives, which is determined by general Group policy. Common, unifi ed tools are, however, developed in all the companies: the employee card, employee share ownership, stock option plans, and the compensation of the managers of the Leadership Group.
The employee card for the Retail activity
This card gives preferential purchase conditions in all the Group’s Retail companies for each PPR employee in the Retail activity. It is also valid for retired employees, the spouses of employees or a person of their choice. Since 2005, the employee card can be used in Switzerland, Belgium and Luxembourg.
The employee card for the Luxury Goods activity
This card gives preferential purchase conditions for all the products of the Group’s Luxury Goods brands for all PPR employees in the Luxury Goods activity.
Employee share ownership
PPR launched the Value in Action (VIA) employee share ownership plan in 15 countries in 2000. 37,337 employees subscribed to VIA in 2000, 31,949 in France and 5,388 outside France, within a capital increase of 800,000 shares. 2005 marked the end of the lock-in period for the assets for all VIA vehicles. As of December 30, 2005, 12,471 subscribers were directly or indirectly (depending on the country) PPR shareholders through these VIA investment vehicles.
Stock options
Stock options are granted very year with the approval of the PPR Board of Directors. In 2005, this policy was completed with the award of bonus shares to stock option benefi ciaries based in France. A total of 495 managers benefi ted from this long-term compensation policy. Three option plans covering 394,230 options at the prices of €78.01, €78.97 and €85.05, as well as a bonus share allotment plan for 23,133 shares were granted in 2005.
Compensation for the executives of the Leadership Group
The fi xed salary is coupled with a variable compensation representing 30% of the fi xed salary if targets are reached. A maximum of 60% of this variable compensation depends on fi nancial objectives and a minimum of 40% on non-fi nancial objectives like innovation, manage-ment or leadership. It is then modulated by plus or minus 20% based on the implementation by each manager of the 6 PPR attitudes (1).
Supplementary health, accident and pension coverage:
• Supplementary health and accident coverage in France: In order to deal with the structural trend toward higher health costs and to anticipate the implementation of the measures of the French Douste-Blazy law on sickness benefi ts, supplementary health and accident coverage in France was studies within the companies in 2005 and a call for tender was launched by PPR. This call for tender allowed the Group to use its size to negotiate insurance rates and fees to manage the vehicles, and to make decisions at the company-level based on the specifi c characteristics of the health and accident schemes for each company. The process resulted in revised coverage (improvement in the coverage for specifi c categories, increased responsibility for personal medical care, etc.) and improved terms for the schemes (renegotiation of the rates, expansion of profi t-sharing accounts) in order to offer competitive and long-term coverage to PPR employees.
• Supplementary pension schemes (under Article 83 of the French Tax Code) have been established since 2001 for the French managers of Printemps, Fnac, Conforama and PPR Holding.
Incentive agreements and profi t-sharing
Most of PPR’s French employees benefi t from the redistribution of company profi ts through profi t-sharing or participation schemes. These mechanisms are governed (under applicable regulations) by agreements within the companies of the Group, which specify the procedures for calculating the amounts paid to each employee. The criteria for distributing the amounts paid are usually the employee’s salary and seniority.
(1) PPR promotes and encourages six managerial attitudes in order to create a favourable context for successful teamwork : seeing clearly, mastering complexity, speaking honestly, having the sense of time, taking ambition to the highest level, succeding together.

78PPR 79
Profi t-sharing by employees in the context of a company’s growth is mandatory in France for any business with more than 50 employees. Rights are calculated using a formula that distributes a fraction of the profi ts earned, both legal and special, which is defi ned by an agreement if applicable. Incentives are optional in France, and established by agreement in some companies of the PPR Group in order to associate the employees in the results and/or the performance of their company.
Employee savings
Most of the Group’s companies in France have Employee Saving Plans (Plans d’epargne entreprise - PEE) which are designed to receive pro-fi t-sharing, incentives, voluntary contributions from employees and any employer’s matching contribution. Most of the PPR companies have chosen to offer to their employees either a company or multi-company collective employee shareholding plans (Fonds communs de place-ment d’entreprises - FCPE) in order to invest these sums and benefi t from tax exemptions provided they comply with the lock-in conditions.
Initiatives conducted by the companies
As a result of the action plans implemented by the Group companies to explain the compensation structure, such as the Orizon programme at Fnac, employee understanding of their compensation as measured by the PPR 2005 opinion survey improved by 4 points over one year.
“Orizon” at Fnac
Fnac wants to ensure greater visibility for all the components of employee compensation in France. Through a new vehicle, called Orizon, the individual components of the direct and supplementary compensation package for 2005 were detailed and explained. In 2006, Orizon will be sent to each employee and will now include a yearly review that will report on the past year and discuss changes for the following year.
Diversity and equal opportunitiesConvinced that diversity and equal opportunities are the drivers of social integration, innovation and performance, PPR has established an integration management policy that includes all the different strands of society, regardless of sex, age, diversity of origin and disability.
The basic guidelines for diversity and equal opportunities management
Diversity has become an established part of the PPR Group’s policy since 2004. The Group’s decentralized structure means that each company can take this subject and decide on the projects that are most appro-priate for it, with respect to all aspects of diversity. Therefore, Conforama used to work with training schools located in underprivileged neighbourhoods, Redcats used to host at the company high school students of nearly 30 different nationalities during their “One student, one day, one job” event, while Fnac used to host disabled students under a vocational training contract.To encourage this approach, commitments and initial steps were taken by the Group in France. The basic components of the diversity policy are listed below:
A Principle set forth in the PPR Group’s Code of Business Practices
The Code of Business Practices, in those principles relating to Group employees, states that PPR is owed “respect and fairness” (…) encouraging their development, providing a work environment where human rights and labour legislation are respected (…) and a work-place where neither discrimination nor intimidation nor harassment are tolerated.” Distributed to all the employees in the Retail activity and available on the CSR website, the PPR Code of Business Practices complies with the commitments taken when the Diversity Charter was signed. Furthermore, if any employees fall victim to the failure to comply with the diversity policy, they can refer the matter to the PPR Committee for Ethics and Corporate Social Responsibility (CECSR).
The Diversity Charter signature
In 2004, PPR was among the fi rst companies to sign the Diversity Charter. Initiated and introduced in France by the Institut Montaigne, a think tank founded by Claude Bébéar (AXA) and by AFEP (the French Private Enterprise Association, chaired by Bertrand Collomb (Lafarge), it was created following the publication of the report “Les oubliés de l’égalité des chances” (“The people left behind by equal opportunity”) written by Laurence Méhaignerie, a journalist, and Yazid Sabeg, a company chairman. In May 2005, François-Henri Pinault reconfi rmed himself and PPR commitment in favour of diversity by signing the Charter established by his predecessor. Thus PPR is committed to educating and training its senior executives and employees involved in human resources processes to respect and promote enforcement of the principle of non-discrimination, to refl ect the diversity of French society, to convey to our employees our commitment to non-discrimination and diversity, to make it a topic of discussion with union representatives and to include in the Annual Report a chapter describing its commitment.
Corporate Social Responsibility – Employees

79 Reference document 2005
SolidarCité as a driving force
Enlisting participation by employees and PPR companies in their solidarity and community development efforts since 2001, the SolidarCité Association has made equal opportunity its central unifying theme (see page 114). Financed by the Group and its companies, SolidarCité is backed by a permanent structure and 500 regular volunteers. It favours long-term partnerships with other associations, institutions and NGOs.
Mission Handicap creation and policy
As a multi-disciplinary inter-company working group, Mission Handicap meets with a dedicated project manager to exchange best practices, and to defi ne and decide on common guidelines and commitments concerning employment of the disabled. One of the objectives of Mission Handicap is to reach a 6% of disabled workers employment rate by end of 2008, compared with only 3.2% in 2004 when Mission Handicap was created (rates calculated based on the 1987 French law aimed at employing disabled persons).Based on the lessons learned from the assessment done in 2004 in the Retail division, the policy defi ned by Mission Handicap is fourfold: communication regarding the disability to get rid of preconceived notions; job placement projects; job retention measures; and raising awareness among the Group’s internal and external stakeholders.
Partnerships with specialised agencies well-known for their actions
To promote and establish a diversity and equal opportunity policy, PPR chose to team up on a voluntary basis with partners recognised in France for their actions in these areas of expertise.PPR entered into two successive partnerships with Agefi ph (1), a French association promoting job placement and vocational training of the disabled through an Action Agreement in 2004 and a Policy Agreement on March 1, 2005 for a period of two years.In June 2005, a one-year partnership agreement was signed between PPR and the French association to facilitate job placement for young graduates (Association pour faciliter l’insertion professionnelle des jeunes diplômés - AFIJ). It is aimed at facilitating and improving job placement for students and young college graduates, who are from an immigrant background, from underprivileged urban areas or disabled. Under this agreement, PPR agrees to send to AFIJ descriptions of jobs available within the Group, to review the applications sent by the said agency and to call in for interviews the applicants whose backgrounds correspond to the job to be fi lled, as well as some of the young graduates whose backgrounds are not suitable in order to help them improve their interviewing techniques.Beyong it’s membership in IMS- Entreprendre pour la Cité since 2000, PPR conducted in 2005 an assessment on cultural diversity and equal opportunities for men and women. The assessment was developed and conducted at Printemps, La Redoute, Fnac, Conforama and CFAO by experts from IMS- Entreprendre pour la Cité. It provided up-to-date information on company practices and gave the Group the possibility to make progress in terms of non-discrimination and diversity management, and to educate PPR employees on the subject.
Enlistment in supporting diversity shared by managers
In 2005, PPR designed educational projects on the topic of diversity. Nearly 360 new managers participating in PPR induction days (on April 14, June 23 and September 16, 2005) received information on the Group’s equal opportunity commitments. A total of 57 managers from the Nantais employment region, during “Employment and Mobility” Day, also received information and awareness training from customised playlets produced by Théâtre à la Carte on June 8, 2005.
The numerous facets of diversity at PPR
Equal opportunities for men and women
• 75% of PPR employees in France feel that individuals are treated fairly regardless of their gender (PPR 2005 opinion survey)
Percentage of women at the level of the Group and as members of senior management or managerial bodies
In 2005, women accounted for 54.1% of the Group’s total workforce compared to 54.2% in 2004. Given PPR’s broad geographical presence and the diversity of its activities, the percentage of women varies according to country: to 77.9 % in Asia, 68.3% in North America, 62.7% in Eastern Europe, 61.7% in Western Europe, 56.5% in France, 45.6% in Oceania, 41.7% in South America and 12.5 % in Africa. Regarding the managerial sphere, 48.1% of PPR managers were women in 2005 (47.6% in 2004). Seven women hold Chairman or Senior management positions in the group: Patricia Barbizet, Vice-Chairman of the PPR Board of Directors; Valérie Hermann, CEO of Yves Saint Laurent Couture, Chantal Roos, Chairman of YSL Beauté; Isabelle Guichot, Chief Executive of Sergio Rossi; Laurence Danon, Chairman of Printemps; Carole Balas, CEO of Orcanta and Sylvie Robin-Romet, CEO of Kadéos.14 women are members of the seven Executive Committees of the companies and the PPR Group. The percentage of women in the Lea-dership Group is 17%.
(1)Agefi ph: Association for management of the fund for job placement of the disabled.

80PPR 81
Women development and advencement
The percentage of women among newly hired employees in 2005 was 56.8%, compared with 59.8% in 2004. In terms of career development, 52.2% of the employees promoted in 2005 were women, a fi gure comparable to 54.5% in 2004, with 55.2% of women in non-managerial positions promoted managers. With regard to skills development, 42% of the participants in the “Unext” (University for the next generation) curriculum reserved for leadership development of high potential employees and 48% of the participants in the Ugrow personalised development curriculum designed for managers were women in 2005.To take into account the differences in perceptions between men and women, PPR decided to conduct its 2005 in–house opinion survey to refl ect these gender differences. Introducing this new codifi cation will enable the individual companies to defi ne suitable measures and action plans.
Breakdown of men/women in the employees registered in as of December 31, 2005
WOMEN
MEN54.1%45.9%
Total employees: 84,316
Breakdown of men/women transferred in 2005
WOMEN
MEN50.3%49.7%
Total movements: 2,996
Disabled employees
• 963 disabled employees in the Group in 2005• 3.6% disabled workers in the Group in France in 2005 compared with 3.3% in 2004• 63% of PPR employees in France feel that individuals are treated fairly regardless of their state of health or their disability
(PPR 2005 opinion survey)
In 2005, the Mission Handicap policy was instituted and a dedicated framework was defi ned with the signing of a new two-year partnership agreement with Agefi ph (March 1, 2005 – February 28, 2007) encompassing Printemps, Redcats, Fnac and Conforama. This agreement calls for the hiring of 160 people by the Group during the relevant period, and the execution of different action plans meeting the commitments made by Mission Handicap.
Assessment of hiring and job extension
In France, as of September 30, 2005, the fi rst assessment of employees hiring shows 90 job placements, 49 of which as defi ned in Article 1 of the Agefi ph agreement (permanent and fi xed-term contracts, temporary and vocational contracts of six months and over). A total of 55% of employees with a skills defi ciency were relocated and Occupational Therapy partnerships were revived. Innovative projects were also conducted in 2005. For example, Fnac hired 12 employees under professionalisation contracts, Conforama signed a partnership agreement with Handicap zero (a French non-profi t making organisation helping the blind and partially sighted) to translate into Braille product information brochures for company brands; a pilot project was initiated in the Lille area with the La Redoute occupational therapists and the inter-company occupational therapists in the Senior division and the Children and Family division. The Group also signed a rider to the AFIJ agreement concerning the “young disabled workers” category, resulting in participation in job fairs and in the posting of internship offers or entry-level jobs offers. Lastly, if a worker proves unsuitable, the freeze on external hiring managed by job coordination applies.
Corporate Social Responsibility – Employees

81 Reference document 2005
Information on disability and awareness training
In 2005, Mission Handicap designed information tools and held briefi ngs and awareness sessions as part of a nationwide communication campaign. The brochure “Partageons l’expérience, Multiplions les chances” (“Sharing experiences, increasing chances”) was circulated to nearly 12,000 employees, a Mission Handicap CD-Rom designed for concrete use by staff members on a regular basis, equipped with a tool box (recruitment, retention, communication, etc.) was circulated to 750 managers, and posters setting forth the Group’s commit-ment and providing a completely confi dential hot line were circulated in the Group’s facilities. PPR also participated in job fairs for young disabled students in Paris on October 6, 2005 and in Aix en Provence on November 14, 2005. With the communications campaign, managers, employees and union representatives were trained, using existing information and communications media, such as internal newspapers, intranets, welcome booklet, induction days, all of which were used to convey the Group’s policy regarding disability.
Age diversity
• 67% of the PPR employees in France feel that individuals are treated fairly regardless of their age (PPR 2005 opinion survey)
The need to understand the work issues related to “Senior” employees
In order to understand the issue faced by the Group’s companies in France regarding the need to extend one’s working life with the ageing of the population and pension reform (the Fillon reform), an inter-company, inter-function and inter-age working group was established to analyse the demand for work by employees in their fi fties and sixties and to consider suitable human resources policies. Input was pro-vided to the group by independent experts: Serge Volkoff, Director of CREAPT (Centre for research and studies on age and the working population) and Eléonore Marbot, an Associate Profession at CNAM (Centre National des Arts et Métiers), the author of a thesis on the feeling of the end of professional life.Since 2003, the results of the in-house opinion survey can be analysed by age group.
A summary showing the points different companies have in common
In 2005, PPR retained Eléonore Marbot to conduct qualitative assessments on the Group’s companies (Printemps, Redcats, Fnac, Confo-rama and CFAO) through more than 120 interviews. The analysis of the assessments based on fi ve major themes – the current involvement of experienced employees, the perception of their work, the perception of their manager and of management in general, the perception of HR policies, the vision for the future – was submitted to the companies in 2005. On the basis of this analysis, a status report was prepared and recommendations for action were formulated. The synthesis of the assessments shows similarities between the various companies. Among senior employees, sources of commitment and motivation – autonomy, work variety, improved status, recognition of experience and the absence of discrimination – are essential to a positive perception of their work. In addition, the key role of management in main-taining motivation and the error of confusing the effective retirement age with actual physical diffi culty in performing some tasks can also be noted.
2005 population pyramid
0.1% 0.8%
0.8% 3.1%
1.7% 6.2%
5.4% 18.5%
8.2% 24.8%
3.1% 17.7%
0.3% 9.3%
Age 56-60
Age > 60
Age 51-55
Age 41-50
Age 31-40
Age 25-30
Age < 25 MANAGERS
NON-MANAGERS

82PPR 83
Diversity in terms of ethnic background
• 76% of PPR employees in France feel that individuals are treated fairly regardless of their ethnic background.(PPR 2005 opinion survey)
In 2004, the fi ght against discrimination on the basis of origin resulted in a commitment by the Group at the highest level (Diversity Char-ter, diversity principles and rejection of all forms of discrimination set forth in the Code of business practices, contribution to the fi lm Les défricheurs (The Pioneers).
In 2005, the analysis and feedback from the Diversity assessments conducted by IMS – Entreprendre pour la Cité at PPR, Printemps, Redcats, Fnac, Conforama and CFAO were used as a basis to draft a general status report and to conduct a full review of the human resources processes in terms of diversity. Some major trends were revealed; high points and points to watch for were identifi ed, particularly in hiring and induction, as well as in career development. The assessment also consisted of a detailed report for each Company: which represented the inventory of fi xture on diversity in the company, the review of practices, the strong points, the good practices, the areas of improvement, the points to watch for or to be curbed.
With the aim of showing examples of people who have succeeded in becoming part of the Group, the fi lm Les défricheurs by Yamina Benguigui was shown in 2005 in all Group companies. It produced discussions on a few key themes: the value of work, accepting differences as a source of wealth, integration within the company, discrimination, equal opportunities and the like. As part of its diversity promotion programme, Conforama sent 9,317 DVDs of the fi lm Les défricheurs to all the employees of the subsi-diaries when Christophe Cuvillier, Chairman and CEO of Conforama, sent out his holiday greetings in January 2006. Before the fi lm came out in theatres, three premieres were held featuring a showing of the fi lm followed by a discussion at the company’s head offi ce. Numerous actions were also carried out by the Group’s companies in connection with the activities of SolidarCité (see page 117).
Freedom of expression and employee relations• 72% of PPR employees versus 66% in 2003, feel that they are suffi ciently informed about their company’s
performances (PPR 2005 opinion survey)• 60% of PPR employees versus 56% in 2003 feel that they are suffi ciently informed about their company’s
plans (PPR 2005 opinion survey)
The PPR Group has put in place information and interactive tools that lend themselves to free speech and dialogue.
Providing and sharing information
Many channels of information and units for dialogue and interaction at the Group level and in the companies have been created to encourage “top-down” and “bottom-up” information fl ows
News and information media in the Group and the companies
Le Mag is a bi-lingual, French-English quarterly in-house magazine circulated to nearly 20,000 employees. La Lettre des Managers is a monthly publication distributed through an electronic platform, reporting on the group’s policies and actions and those of its companies in a newspaper style The PPR website Easydoor provides information on the group in real time and offers access to collaborative platforms organised by business line or project. More specifi c in-house newsletters according to business line are also published and shared, such as La lettre des Achats (The Purchasing Letter) or La Veille stratégique et concurrentielle (Strategic research).The website www.ppr.com, which is accessible both internally and externally, promotes the sharing of information. In 2005, a CSR tab representing the Group’s corporate social and environmental responsibility policy and the projects implemented by the companies was added. This part of the site was designed to encourage reading by the partially sighted.Furthermore, most of the Groups’ companies have their own in-house corporate magazine: YSL Beauté Le Magazine, Printemps Info, e-letter for Redcats, Culture Fnac, Confo Mag, and Contact for CFAO, etc.). Conforama has also designed its own intranet, Planet Confo, which is a true interactive platform for employees.
Corporate Social Responsibility – Employees

83 Reference document 2005
In-house opinion survey: “What’s the weather like?”
With the dual objective of providing a picture of the social climate within the Group and of prioritising improvements to be introduced in the companies, the PPR employee opinion survey is a genuine management tool, assisting in the analysis of managerial performance and in monitoring Human Resources policies. It also provides an opportunity for interaction between employees and management. Conducted every two years on an anonymous basis in the languages of the countries concerned and processed by an external company, this survey was sent to more than 60,000 employees in the Retail activity in 2005. This year, it drew a 74% response rate, compared with 70% in 2003 (at comparable structure). Some new countries were consulted in 2005: Algeria, China, Croatia, Estonia, India and Vietnam. The change from 2003 shows that 72% of the questions refl ect improvement, 14% remain unchanged and 14% are down. 2006 will be devoted to communicating the results to the employees of the companies and defi ning action plans identifi ed as areas of improvement, and working to improve employee satisfaction and to foster progress by management. The group has committed to a new survey in 2007 in order to continue evaluating employee satisfaction over time.
The 2005 HR agreement
Nearly 170 of the Group’s human resources managers met for two days in 2005 to exchange views and share best practices. One of the themes discussed was innovation in human resources by holding creative workshops.
Developing relations and dialogue
• 318 collective company agreements signed in 2005
In addition to the Works Councils or company level union organisations, employee relations at the Group level in France and Europe are shaped in the Group Works Council and the European Works Council.
The Works Councils or collective bargaining units in the individual companies
At end December 2005, the Group structure in France included 276 Works Councils or company-level union organisations representing 1,885 elected members. Collective bargaining in Group companies has resulted in the signing of collective bargaining agreements dealing mainly with the duration and organisation of work time, compensation (wages, incentive schemes, savings plan, insurance, etc.), col-lective status and training. In 2005, the number of hours of strikes amounted to 51,289. These strikes mainly refl ected participation in national movements in France, Italy and Belgium, with no direct link with the company. The other reasons for strikes were the mandatory annual wage negotiations in France and restructuring in France and Belgium.
The PPR Works Council
The PPR Group’s French Works Council is informed about the Groups’ strategy in France and abroad, the economic and fi nancial challenges it faces and its policies and actions relating to human resources. Established in 1993, the scope of the Council has evolved and since March 2005, it has included the companies of the Retail and Luxury Goods divisions, since Gucci Group joined the Council.It includes thirty members, drawn from the different electoral colleges and the union organisations in the case of the fi rst electoral college. The PPR Group Works Council meets twice a year. The following issues were on the agenda in 2005: the Group’s strategy presented by François-Henri Pinault, the presentation of the companies’ strategy with the Human Ressources Directors of Printemps and Conforama, an update on SolidarCité, employee relocation and a presentation of the subjects relating to the employee map, the Kadéos marketing policy and the improvement of the employee protection schemes.
The PPR European Works Council (EWC)
An interactive body created in 2000, the European Works Council acts within the Group at European level to supplement existing national bodies. The EWC is informed or consulted on any cross-border issue (at least two countries involved) affecting the employees of the Group. Its scope includes the companies of the PPR Group established in 17 European countries, from the Retail and Luxury Goods divisions, including Gucci Group since September 2005. Under a rule of one seat per country at least, the European Works Council is made up of 21 members and one observer. The countries represented are: Germany, Austria, Belgium, Spain, Estonia, Finland, France, United Kingdom, Italy, Luxembourg, the Netherlands, Portugal, Norway, Sweden, Poland, Greece and Switzerland. The EWC meets twice a year and in 2005 discussed issues related to the employee opinion survey, a briefi ng on corporate social and environmental responsibility, a review and analysis of the accounts, a presentation on the activities and policy of the Group by François-Henri Pinault and a presentation on Gucci Group by its Chairman.The EWC has a committee of four members, elected by the members of the Council, which meets six times a year to prepare for and analyse the two annual plenary meetings.

84PPR 85
• 76% of PPR employees feel that their place of work is a place where they can work in complete safety (PPR 2005 opinion survey) – a one percentage point increase on 2003
The activities of PPR companies do not entail any major corporate social responsibility (CSR) risk of a direct nature. The Groups’ CSR policy is designed to identify the main impacts PPR has, and to respond to the legitimate expectations of the Group as regards prevention. Since 2003, we have been setting up specifi c bodies within the Group and its companies, and health and safety training is offered to all PPR employees.
PPR and its companies view guaranteeing the health and safety of their employees as one of its funda-mental duties. It aims to use procedures and action plans within its companies to limit the predominant risks, which will vary depending on the company concerned. Each Group company pursues its own risk, health and safety management policy, which is geared to the scale of the potential risks involved. This policy may entail obtaining international certifi cation, setting up specifi c bodies and/or drawing up a prevention policy, and follows a process of identifying and qualifying the risks involved combined with implementation of action plans designed to protect people and property. In 2005, 2,781 work-related accidents resulting in sick leave occurred either in the work place or whilst on business (one being a fatal accident due to a heart attack), compared to 3,016 in 2004.
In 2003, the PPR Group also identifi ed the primary CSR impacts of its activities. With a view to limiting these impacts, the Group has in particular taken action relating to the management of raw materials and natural resources (including energy); the optimisation of logistics and transportation, and the management of waste and the product offering. These actions are described in the sections on the environment, on business partners and on customers and consumers.
Obtaining international certifi cationsTriple certifi cation in quality, safety and environment for YSL Beauté
Continuing the company’s structured risk management process, YSL Beauté’s two fragrance and cos-metics production sites located at Bernay (Normandy) and Lassigny (Oise) are aiming to secure triple certifi cation in quality, safety and the environment. The company is on track to meet this goal in 2006. The Bernay site renewed its OHSAS 18001 safety certifi cation, ISO 9001 quality and hygiene certifi cation and ISO 14001 environmental management certifi cation in June 2005. The Lassigny site, meanwhile, has already been awarded its ISO 9001 certifi cation and should have obtained all three by 2006.Each year, strategies are reviewed and quantifi ed, shared targets are set and then broken down into action plans for each particular site. The main areas requiring progress on hygiene and safety issues are as follows: optimisation of infrastructures and fl ows, continuous awareness-raising among staff regarding best practices in industrial hygiene, reduction of risks associated with dangerous products, industrial installations, business trips and vehicles, and improvement in the ergonomics of work stations.
Management of risks,
5.3%overall absenteeism rate in 2005, compared to 2004
3.6%sickness absenteeism rate in 2005, compared to 2004
7.8%fewer work-related accidents resulting in sick leave in 2005
70,504hours of health and safety trainingprovided in Group companies
14,686employees received safety trainingin 2005
Corporate Social Responsibility – Management of risks, health and safety

85 Reference document 2005
Gucci
Gucci has set a target of obtaining both social (SA 8000) and environmental (ISO 14001) certifi cation by 2006, in partnership with the region of Tuscany and the BVQI certifi cation body. Gucci is PPR fi rst luxury goods brand to have obtained SA 8000 certifi cation on social responsibility under a protocol agreement signed with the region of Tuscany in 2004 for purposes of securing double certifi cation SA 8000 and ISO 14001. A formal hygiene, safety and environment (HSE) procedure has been in place since 2001. Risks to employees are assessed by a dedicated team each year.
Bodies responsible for the management of risks, health and safetyThe Hygiene, Safety and Working Conditions Committee (CHSCT) in France
In accordance with legislation, all PPR Group companies in France with more than 50 employees must have a CHSCT. The members of this committee are appointed by elected representatives (employee representatives and members of the Works Council) and meet every quarter. The aim of the committee is to ensure protection of health and safety of employees. It also seeks to improve working conditions and ensure compliance with legal provisions in respect of hygiene, safety and working conditions.
Gucci’s collective CSR Committee
Continuing the formal health and safety procedure commenced in 2001,Gucci set up in September 2004 a collective CSR Committee comprising an equal number of representatives from the main trade unions and the managers of the company. The committee is respon-sible for Gucci’s double certifi cation in social (SA 8000) and environmental management (ISO 14001).
Innovative prevention policies implemented by the Group’s companiesThe actions of YSL Beauté contribute to its overall policy on health, safety and environment
At the Bernay site, the aim of obtaining triple certifi cation has resulted in the implementation of several employee-safety related actions. In 2005, a cross-functional managers’ working group was established with the CHSCT to introduce new box tables to reduce the risk of RSI (Repetitive Strain Injury). Concentrations of toxic particles in the air at the company’s laboratories were measured by a monitoring body in order to assess the chemical CMR (carcinogenic, mutagenic and reprotoxic) risk associated with the use of reagents in laboratory tests. In 2005, there was a particular focus on employee safety at the Lassigny site. Additional fi re detectors have been installed, and nitrate fi lters for water fountains and additional disconnectors have been put in place so as to better protect the supply of drinking water. Tanks for storing oils and treatment products have been also installed in an attempt to reduce waste.The company also organised information and awareness days on health-related subjects during the year. Thus, on World Smoke-free Day, all employees were offered individual consultations with health professionals. Likewise, on World Water Day the company issued a reminder of the various control tests carried out by the site’s laboratory on the pollutants contained in waste water.
health and safety

86PPR 87
Redcats rolls out its Prevention Management System policy
The Prevention Management System was fi rst set up in 2003 in the shipping department of “La Martinoire” La Redoute site in northern France which prepares all parcels for dispatch to customers. The system was extended to all divisions, notably inventory and returns, in April 2005. It is structured in two phases: the fi rst phase involves alerting employees to the risks of work-related accidents, occupational diseases and absenteeism. The second stage focuses on encouraging employees to take a more proactive role in accident prevention by helping to identify and risks in advance. In 2005, 2,000 employees helped to protect their own and their colleagues’ safety. Briefi ng sessions and prevention visits were also extended to all departments. Early results show a reduction in absenteeism and an increase in the number of suggestions for improvement put forward by employees (over 1,000 in 2005). In addition review designed to prevent incapacity and occupational diseases has been launched. Work station ergonomics are in the process of being mapped, whilst career paths that limit future risks by managing adapted mobility are being defi ned.
Fnac develops a hygiene, safety and working conditions policy
For Fnac, 2005 was a year for refl ection on a hygiene, safety and working conditions policy aimed at coordinating the various actions already underway in each of its subsidiaries, back day and internal training for occupational health and safety, movement and posture trainers. At the same time, the eight Fnac outlets affected by the new regulation on facilities classifi ed for the protection of the environment are now meeting their new obligations. The eight air coolers are undergoing more frequent water analyses and stricter maintenance planning involving notably use of a monitoring book and regular technician training.
Conforama continues to pursue its investment plan and introduces a safety guide
At the end of 2002, Conforama launched a fi ve-year investment plan aimed at improving safety and working conditions on its premises, particularly in its warehouses. An initial investment outlay of €2.5 million in 2003, primarily to prevent falls and back problems and to provide training in connection with electrical and fi re risks, helped reduce work-related accidents by more than 20% in France. Further investment of €4.3 million in 2004 focused on improving working conditions and renovating company premises and has reduced work-related accidents by 4.8% in France. Conforama continued to pursue this investment plan in 2005, focusing on the implementation of action plans drawn up by individual sites, which has enabled the creation of a safety policy at the Satolas warehouse. These actions have succeeded in reducing absenteeism from work-related accidents by 10%. An educational and entertaining note-book, setting out the key risks existing in stores and warehouses and the safety actions to be taken, was drawn up in 2005. It was subsequently distributed to company managers and displayed on Conforama’s website.
Corporate Social Responsibility – Management of risks, health and safety

87 Reference document 2005
CFAO consolidates the Hygiene, Safety and Environment (HSE) policy initiated in the group companies in 2002
The aim of CFAO’s Hygiene, Safety and Environment (HSE) policy is to identify work-related accidents, categorise them according to their seriousness and set targets to monitor progress. Severity (the most serious being a fatal accident) is assessed primarily by the number of days absence from work and the scale of the damages awarded. Using this method, CFAO has calculated an average of 1,000 work-related accidents a year, enabling the company to set annual targets. These targets have mostly focused on reducing the number of work-related and car accidents (which are particularly serious and frequent in Africa) and on preventing such accidents via an assessment of the health and safety training provided (fi rst aid, fi re, awareness and audit). To enable it to continuously track the process internally and analyse the results, CFAO has introduced a risk prevention and reduction tool in the shape of the Risk Identifi cation Report (RIR). Data obtained in the form of indicators will be used to generate a monthly report, and form the basis of action plans designed to reduce accident rates in the context of specifi ed targets. In this regard, CFAO’s plastics transformation subsidiary in Cameroon (Icrafon) has improved its night-time emergency procedures and established an action plan for 2006 based chiefl y on the provision of driving, fi rst aid and fi re training and on the control and strict main-tenance of safety and manufacturing equipment. On a more general note, CFAO has also run a road safety campaign in conjunction with Bridgestone (see page 119).
Geographical breakdown of employees who received health and safety training in 2005
8,002
1,473FRANCE
WESTERN EUROPE
AFRICA
NORTH AMERICA
ASIA
SOUTH AMERICA
AUSTRALASIA
EASTERN EUROPE
338
4,366
20040
128
Total: 14,686
139

88PPR 89
• 57% of PPR employees feel that their company is mindful of its impact on the environment (PPR 2005 opinion survey)
The vectors for improvement identifi ed were the optimisation of raw materials consumption, logistics and transport, energy consumption, and management of waste. In 2004, PPR developed a reporting structure to identify the impacts, and describe the Group’s environmental challenges and to prioritise the areas in which the companies had to improve. In 2005, the Group focused its approach on developing reliable environmental reporting and the implementation of actions designed to reduce its environmental impact.
Developing reliable data for environmental reporting In 2005, a new campaign to collect environmental data was conducted in the Group’s companies. The consolidation of this data allows PPR to provide indicators that refl ect its CSR policy. The main goal for 2005 was to optimise the tool and the process. Efforts were made to ensure that data and data feedback were reliable, to extend the reporting scope, and to improve certain indicators. PPR is making progress in developing representative indicators. Since the 2005 scope changed from that in 2004, the comparison between the two years is not considered to be relevant for certain groups of indicators. Over time, the reporting scope should be stabilised and allow an accurate comparison of data from year to year.
A growing scope
All the environmental data presented in this document refl ect the scopes described in the table below, expressed as a percentage of revenues by company:
Consumption Production 2004
Paper Packaging Industrial materials
Water Energy Waste All indicators
YSL Beauté 100% 100% 100% 100% 100% 100% 100%
Printemps 98% 98% (1) 98% 98% 100% 98% (2) 95%
Redcats 100% 100% 100% 100% 100% 100% 100%
Fnac 78% 87% (3) 96% 70% 97% Hazardous: 83%Non-hazardous: 98%
Other: 68%
Fnac Europe
Conforama 100% 100% 100% 100% 100% 100% 62%
CFAO 77% 100% 100% 100% 58% 82% 51%
(1) Excluding cardboard: 100%.(2) Excluding ink cartridges: 100%.(3) Excluding cardboard: 36%.
The scopes for the environmental data on transport vary depending on the indicators and the companies and are described in the trans-port section.
Indicators representing PPR’s challenges
The indicators were defi ned in 2004 by a work group composed of the members of the environmental network within the companies. The same indicators were used for the 2005 reporting so that changes could be assessed. However, a few improvements were also made by the work group. Seven themes were identifi ed to report on PPR’s overall environmental performances:• quantitative measurements: consumption of raw materials, transport, waste production, energy consumption, water consumption;• qualitative measurements: product policies and environmental management.The data provided by the companies is consolidated into indicators at the level of the PPR Group as formalised in the reporting protocol common to each company. The reporting tool used in 2005 was the same as in 2004: an electronic platform on which the company managers and their networks of agents enter data online.
Environment
Corporate Social Responsibility – Environment

89 Reference document 2005
Consumption of raw materials
Optimisation paper consumption
Within the relevant scope, PPR consumed approximately 274,000 tonnes of paper in 2005, which break down as follows: • 81% in direct purchases for sale operations, primarily for the printing of catalogues, magazines and sales material (compared to 77%
in 2004);• 17% in indirect purchases (ordered by the printers) to print various communication materials (compared to 21% in 2004);• 2% in offi ce papers (compared to 2004).
Catalogue printing generates substantial paper consumption at Group level and is, therefore, a real environmental issue. In order to optimise the paper consumption process, PPR has established centralised management of paper purchases at Redcats, the largest consumer in the Group because of its direct sales activity.
Emphasis on use of paper from certifi ed forests and recycled paper
PPR’s goal is to use paper from sustainable managed forest. To achieve it, the Group ensures traceability of the wood used and selects fi rstly papers that have been certifi ed by organisms such as the Forest Stewardship Council (FSC), the Pan European Forest Certifi cation (PEFC) or other offi cial certifi cation agencies.
To ensure responsible consumption, Redcats has defi ned for the Group in Europe a three-year action plan with the Group’s paper sup-pliers for catalogues and direct marketing printed material (brochures, prospectuses, etc.). The goal for the end of 2007 is for 70% of the paper used by the Group to contain fi bres from certifi ed forests. In 2005, the goal was 60% certifi ed paper for Europe and 53% for the United States coming from certifi ed forests. This goal was broadly exceeded, since the consumption of paper from certifi ed forests amounted to 64.8% for Europe and 62.6% for the United States, representing on average 64% consumption of certifi ed paper from sustainable managed forests in 2005.This improvement was generally driven by the environmental performance of one of PPR’s Italian suppliers with plants in Germany. Signi-fi cant improvements were also made in the United States in the manufacture of paper pulp from Wisconsin.
Moreover, recycled paper is increasingly being used by the Group’s companies. In 2005, two of them intensifi ed this approach: while Le Prin-temps printed and distributed more than fi ve million fl yers made from recycled paper to tourists in hotels, Fnac decided to use recycled paper to print all its technical document audits “Contact” magazine for members, which represents more than 10 million copies annually.
Paper consumption in the companies: Redcats, Fnac and Conforama, the Group’s largest paper consumers
PPR is aware of the signifi cant environmental challenge represented by paper consumption and, in 2005, initiated efforts to reduce the paper consumption upstream along with its efforts to ensure traceability. Thus, Redcats and Fnac Surcouf initiated actions to reduce paper weight, and to optimise paper and catalogue sizes.
Redcats
In 2005, Redcats used 228,812 tonnes of paper, 78% in direct purchases and 20% in indirect purchases, and the remainder for offi ce paper. As in 2004, Redcats was the Group’s largest paper consumer and represented approximately 84% of PPR total con-sumption. More than half of Redcats’ paper consumption is in foreign subsidiaries: Redcats USA, Redcats Nordic, and Redcats UK. In 2005, Redcats reduced its paper consumption for indirect purchases by approximately 2,400 tonnes compared to 2004 at comparable structure, primarily because of the termination of the publication of a catalogue by the Redcats United Kingdom subsidiary. On the other hand, the volume for indirect paper purchases was higher in 2005 because of the expansion of the reporting scope.
Fnac
Over the scope used, Fnac consumed just over 7,300 tonnes of paper in 2005. Fnac France used 3,027 tonnes of paper in 2005, com-pared to 3,069 tonnes in 2004.86% of the paper used by Fnac France are in direct purchases to be used to print the magazines “Contact” and “Epok” (42% of Fnac’s direct paper purchases in France), technical guides, product brochures and other guides.

90PPR 91
Conforama
Conforama represented 13% of PPR’s total paper consumption: it purchased 35,399 tonnes of paper, less than 1% of which was offi ce paper with the rest in direct paper purchases for the catalogues.
Actions to protect the environment
Redcats uses plantation pines from Brazil and contributes in this way to local reforestation. In addition, on January 31, 2006, La Redoute renewed an agreement for 3 years (2006- 2008) with the non-governmental organisation ESSOR, which contributes to the development of poor regions in Brazil. This partnership includes a project to reforest and replant fruit trees in the States of Céara and Para in northern Brazil. Between 2003 and 2005, the initial goal of planting 50,000 trees per year was surpassed: 184,000 trees were planted, giving 1,900 families the resources to support themselves. The agreement stipulates that La Redoute repays through this project a portion of the value of furniture purchases to Brazil and that its Brazilian suppliers also make a contribution to the project based on their sales to the company. In 2005, La Maison de Valérie and Vertbaudet also joined this project.
Paper consumption in 2005 (in tonnes)
YSL Beauté Printemps Redcats Fnac Conforama CFAO PPR Group
Direct purchases n/a (1) 1,310 179,499 6,282 35,173 n/a (1) 222,263
Indirect purchases n/a (1) 306 45,855 730 n/a (1) 350 47,241
Offi ces 61 88 3,458 290 226 123 4,246
Total(excluding packaging) 61 1,704 228,812 7,302 35,399 473 273,750
(1) Non-applicable.
Breakdown of paper consumption by company in 2005
Total: 273,750 tonnes
83.6%
0.6%
12.9%
FNAC
REDCATS
CONFORAMA
CFAO
PRINTEMPS2.7%
0.2%
Packaging consumption
The Group’s companies use signifi cant volumes of cardboard and plastics to protect and transport the products sold in their stores or mail-ordered.
Equal volumes of cardboard and plastic consumption
In 2005, PPR consumed approximately 10,218 of plastic packaging and 10,572 tonnes of cardboard. 56% of the plastic packaging was consumed by Redcats and 42% by Conforama. 65% of the cardboard was used by Redcats and 20% by YSL Beauté. Moreover, over the reporting scope in 2005, PPR consumed 1,721 tonnes of shopping bags: 78% in plastic and 22% in paper. Redcats is the Group’s largest cardboard and plastic consumer because of its home shopping business. In 2005, the company used 6,873 tonnes of cardboard and 5,386 tonnes of plastics. Conforama consumed over 4,000 tonnes of plastic. In addition, the YSL Beauté consumed 238 tonnes of plastic in 2005. On the other hand, despite its recycling efforts, its cardboard consumption stood at 2,120 tonnes in 2005.
Corporate Social Responsibility – Environment

91 Reference document 2005
Companies initiatives to optimise packaging consumption: YSL Beauté and Le Printemps re-used their suppliers packaging
In 2005, YSL Beauté implemented a packaging recycling policy. The manufacturing site in Bernay will reuse the cardboard packaging of its suppliers for its boxes in 2006. Le Printemps cuts its consumption of cardboard by 35% between 2004 and 2005, partially by recycling cartons after use.
Working programmes to fi nd an alternative to plastic bags
PPR Retail activity generates plastic bags consumption which are used by its customers to carry the products they have purchased. In 2005, the Group consumed 1,721 tonnes of plastic bags.Over the reporting scope, Fnac recorded 48% of the plastic bag consumption of the PPR Group with 830 tonnes.In 2005, Fnac initiated a pilot programme in its Limoges store to test its new reusable and biodegradable bags. Available in medium or large sizes, the bags are manufactured from corn starch (GMO-free) and printed with solvent-free inks. They are returnable for a deposit, which is paid the fi rst time by the consumer. The company is also providing a paper bag made of recycled kraft paper, printed with non-leaded water-based inks. In 2006, this operation will also be tested in Belgium.Printemps accounted for 31% of plastic shopping bags consumption, and 93% of PPR’s paper bag consumption with 350 tonnes. Printemps successfully offered its customers a reusable bag in place of the traditional shopping bags under a special marketing effort.Redcats used 167 tonnes of bags, 83% of which were plastic; Conforama used 189 tonnes of plastic bags.
Breakdown per company of the shopping bags consumption in 2005
Total: 1,721 tonnes
31.1%
11.0%
9.7%
FNAC
REDCATS
CONFORAMA
PRINTEMPS
48.2%
Breakdown per type of shopping bags consumption by PPR in 2005
PLASTIC SHOPPING BAGSCONSUMPTION
PAPER SHOPPING BAGSCONSUMPTION
78.0%
22.0%
Total: 1,721 tonnes
Packaging consumption in 2005 (in tonnes)
YSLBeauté
Printemps Redcats Fnac Conforama CFAO PPRGroup
Plastic bags consumption n/a (1) 185 139 830 189 n/a (1) 1,343
Paper bags consumption n/a (1) 350 28 n/a (1) n/a (1) n/a (1) 378
Plastic packaging consumption (polyethylene, polypropylene, etc.)
238 29 5,386 n/a (1) 4,036 529 10,218
Total bags and plastics 238 564 5,553 830 4,225 529 11,939
Cardboard consumption 2,120 162 6,873 1,367 ND (2) 50 10,572
Totale packaging consumption 2,358 726 12,426 2,197 4,225 579 22,511
(1) Non-applicable.(2) Non-available.

92PPR 93
Industrial raw materials consumption
Industrial raw materials are consumed by YSL-Beauté and CFAO which have industrial production sites. YSL-Beauté uses glass and plastic bottles for its cosmetics and perfume products. CFAO uses raw materials to produce ballpoint pens, plastic packaging, crates for citrus fruits, beer and carbonated drinks.
Metals, plastic, glass and wood consumption
PPR’s metals consumption primarily refl ects purchases of aluminium for the aerosols used by YSL-Beauté or capsules for CFAO and the steel used in the manufacture of crates produced by CFAO. Metal consumption for the reporting scope in 2005 was 1,794 tonnes, 79% of which was used by CFAO and 21% by YSL-Beauté.YSL-Beauté and CFAO are also the only plastic consumers (excluding plastic bags and fi lms) in the Group. In 2005, they used 2,427 tonnes (comparable to 2004), which included 62% for CFAO. In 2005, the glass consumption of YSL-Beauté and CFAO amounted to 3,654 tonnes, 75% of which was used for YSL-Beauté bottles. Finally, PPR’s wood consumption is used entirely by CFAO to manufacture crates at the company’s plant in Morocco. Wood consumption was 38,800 tonnes in 2004 and was reduced by more than one-fourth to 30,028 tonnes in 2005
Industrial raw materials consumption in 2005 (in tonnes)
YSL Beauté CFAO PPR Group
Metal consumption (steel, aluminium, etc.) 372 1,422 1,794
Plastic consumption (excluding packaging) 927 1,500 2,427
Glass consumption (bottles) 2,754 900 3,654
Wood consumption (total) n/a (1) 30,028 30,028
(1) Non-applicable.
Logistics and transport Logistics and transport are a real environmental challenge for PPR for two reasons: fi rst, the energy consumed and, second, the production of the greenhouse gases that are responsible for global warming.
Reporting scope reassessed in 2005
As transport fl ows are complex and vary substantially depending on the company, transport reporting was redefi ned in 2005. First, the scope was modifi ed to take into account the individual transport scenarios for each company. Second, only transport under the control of PPR was included. As a result, the transport fl ow data provided in this document refl ect the transport paid for by the PPR Group, i.e. all the routes of group fl eets among the various plants, the store supply fl ow from the warehouses and delivery to customers. For some companies, the shipments made by suppliers directly and the transport of employees and customers were excluded because of the diffi culty in collecting outside data on transport for which PRR’s ability to act is reduced. These fl ows are in principle already reported by the carriers. To provide greater reporting clarity, transport was divided into two categories when the data was collected:• transport fl ows of merchandise performed between the various business units of the companies, known as “B to B” transport (all fl ows
paid for outside the company);• transport fl ows to the fi nal consumer, known as “B to C” (all fl ows paid for within the company).
To represent the rail, maritime and air transport fl ows more accurately, fl ows are shown as an equivalent number of 24-tonne trucks.
Corporate Social Responsibility – Environment

93 Reference document 2005
Company logistics scenarios
YSL Beauté
Transport reporting takes into account fl ows between the two YSL-Beauté warehouses and two plants which supply the subsidiaries and the different retail agents.
Transport fl ows included in YSL Beauté 2005 environmental reporting
“B to C”
“B to B”
Warehouse 2
Lassigny Plant Bernay Plant
Distribution agentsand subsidiaries
Warehouse 1
For “B to B” exports, YSL Beauté primarily uses air freight and shipping. For “B to C” transport, the company uses trucks. In 2005, it con-sumed 163,698 litres of fuel to travel 779,517 km (representing estimated consumption of 35 litres per 100 km).
YSL Beauté “B to B” transport
Rail freight Shipping Air freights Total
Scope 100% 100% 100% 100%
Shipping in number of 20-ft containers 94 628 722
Freight in tonnes 1,182
Equivalent in number of 24-tonne trucks 47 (1) 314 (1) 49 410
(1) One 20-ft container is equivalent to 0.5 24-tonne truck.
Printemps
Because of Printemps’ retail activity, the company’s transport fl ows fi rst supply the company’s warehouses and stores via its suppliers. The stores then supply the delivery and storage service providers and the customers. The reporting includes transport from the warehou-ses to the stores and customer deliveries by courier.
Transport fl ows inclued in Printemps 2005 environmental reporting
“B to C”
“B to B”
Storage/deliveryservice provider
Customers
Stores
Warehouses

94PPR 95
For its “B to B” transport fl ows, Le Printemps consumed 1,678,941 litres of fuel over a 100% scope in 2005, which corresponds to 4,796,974 km travelled (for average estimated consumption of 35 litres per 100 km). For “B to C” transport fl ows over a 98% scope, the company consumed 48,510 litres of fuel, which corresponds to 138,600 km travelled (for average consumption of 35 litres per 100 km).
In order to reduce shipments, the Printemps Nancy store has pooled its deliveries with those of Fnac to limit the mileage travelled.
Redcats
Redcats represents a large number of complex transport fl ows. The suppliers supply the warehouses and end customer directly. In addition, the warehouses supply customers via the 27 SOGEP agencies (the Redcats logistics structure), and the company’s stores
Transport included in Redcats France 2005 environmental reporting
“B to C”
“B to B” Customers
Suppliers
Mail order Stores
Warehouses
SOGEP
Redcats primarily uses trucking for its “B to B” transport. Shipment volume stood at 129,198 cubic metre (cu.m.)Redcats uses highway transport for its “B to C” shipments. Over 89% of its scope, the company consumed 5,412,666 litres of fuel in 2005, which corresponds to 29,477,099 km travelled (for average estimated consumption of 18 litres per 100 km).
Redcats “B to B” transport Highway transport
Rail freight
Shipping Rail freight
Air freights
Total
Scope 89% 89% 100% 85% 100%
Shipping in number of 20-ft containers 4,243 21,756 32
Freight in tonnes 11,439
Highway volumes carried in cu.m. 129,198
Equivalent in number of 24-tonne trucks 2,122 (1) 10,878 (1) 16 (1) 477 13,493
(1) One 20-ft container is equivalent to 0.5 24-tonne truck.
Measures are also taken by the stores to reduce shipments: the Redcats subsidiary SOGEP uses rail-highway when scheduling permits.
Fnac
Fnac France has a number of different shipping fl ows. The suppliers supply the company’s subsidiaries and the logistics centre in Massy-Wissous. This centre is the departure point for Fnac’s largest transport fl ows since it supplies the regional warehouses, the stores, cus-tomers, subsidiaries, and after-sales centre. Over a 94% scope, Fnac consumed 2,795,398 litres of fuel for its road transport in 2005, which corresponds to 12,108,091 km travelled.In addition, Fnac signed a contract with the Lungta company, the leading “all electric” messenger company in Paris. Its fl eet of electric scooters limits atmospheric and sound pollution.
Corporate Social Responsibility – Environment

95 Reference document 2005
Transport fl ows included in Fnac France 2005 environmental reporting
“B to C”
“B to B”
SubsidiariesStores
Customers
Massy-Wissous logistics centre
Regionalwarehouses
Suppliers
After-sales service centre
Conforama
Conforma’s shipments are linear, from suppliers to customers, and are routed through the company’s two logistics centres and its various stores:
Transport fl ows included in Conforama France 2005 environmental reporting
“B to C”
“B to B”Customers
Suppliers
Cogedem Bretignylogistics centre
Cogedem Vénissieuxlogistics centre
Stores
Conforama uses ship transport and trucks for its “B to B” shipments:
Redcats “B to B” transport
Highway transport Shipping Total
Scope 100% 100% 100%
Freight in tonnes 1,721,242
Highway volumes carried in cu.m. 1,593
Equivalent in number of 24-tonne trucks 71,718 (1) 71,718
(1) One 20-ft container is equivalent to 0.5 24-tonne truck.

96PPR 97
Corporate Social Responsibility – Environment
For “B to C” shipping, Conforama consumed 6,129,750 litres of fuel in 2005, which corresponds to 17,716,040 km covered (for average estimated consumption of 35 litres per 100 km).
Optimisation of logistics has focused on 3 areas since 2003:• Reorganisation of logistics over four years aimed at increasing warehouse space and improving the regional breakdown. This will in-
clude a reduction in mileage travelled and emphasis on rail transport (rail deliveries to be a mandatory criterion in choosing the location of new warehouses). For example, the Grand Lyon (Satolas-et-Bonce) warehouse, with storage space of over 43,500 sq.m. and rail tracks, was opened in 2005.
• Inclusion of sustainable development criteria in the specifi cations for transport companies.• A move towards greater emphasis on multi-modal transport. Conforama’s goal is that 100% of warehouses should have railway
platforms by 2007. In 2005, parcels for the stores in Corsica were shipped in trucks by rail and road from Brétigny to Marseille, while Conforama has become the largest charterer at the Edouard Herriot Port in Lyon. In 2007, Conforama plans to use the Bonneuil river port in order to supply the Châtres-en-Brie warehouse in the Paris region. The developer of the Châtre logistics centre won the special prize for logistical innovation under sustainable development criteria at the international transport and logistics week.
CFAO
CFAO’s transport fl ows are clearly divided into two stages. The fi rst stage is the “B to B” fl ows from the company’s suppliers to the logistical platforms, subsidiaries and plants. In the second stage, the “B to C” fl ows supply the customers from the subsidiaries, agencies and plants.
Transport fl ows included in CFAO 2005 environmental reporting
“B to C”
“B to B” Customers + after-sales service
Suppliers
SubsidiariesLogistical platforms Plants
Branches Plants
CFAO represents a signifi cant portion of the “B to B” shipments of the PPR Group. The company primarily uses maritime shipping with over 334 billion tonnes.km carried (for average estimated consumption of 35 litres per 100 km). CFAO’s measurement unit for transport is based on the number of tonnes carried per km travelled).
CFAO “B to B” transport Highway transport
Rail freight
Shipping Air freights
Total
Scope 41% 99% 69% 94%
Shipping in number of 20-ft containers 349,896
Freight in tonnes.km 334,808,043,472 1,126,923,432 335,934,966,904
Freight volume carried in cu.m. 39,259
CO2 emissions in kg 5,695,084,820 698,692,528 6,393,777,348

97 Reference document 2005
CFAO also uses ships for its “B to C” transport, with over 31 billion tonnes.kilometres carried by ship, compared with 178 million by air. Regarding road transport, the company consumed 906,765 litres of fuel on 84% of its scope, representing 5,711,980 km covered (for average consumption estimated at 35 litres per 100 km).
CFAO “B to B” transport Highway transport
Rail freight
Shipping Air freight
Total
Scope 84% 97% 85% 85%
Shipping in number of 20-ft containers 31,540,000
Freight in tonnes.km 31,133,536,980 178,380,287 31,311,917,267
Fuel consumption in litres 906,765
Equivalent km travelled for consumption 5,711,980
CO2 emissions in kg 529,581,464 110,595,778 640,177,242
Finally, over the scopes considered, the air and sea shipments of CFAO (“B to B” and “B to C”) emit over 7 million tonnes of CO2 (1).
Note that CFAO’s use of nearly 32 million 20-ft containers for its rail shipments (“B to B” and “B to C” shipments) avoids the use of 15.9 million 24-tonne trucks
Highway transport
In 2005, emissions (2) into the air in CO2 equivalent, calculated on the basis of the scopes previously considered, totalled more than 45,281 tonnes CO2 equivalent for the PPR Group’s “B to C” road shipments:
YSL Beauté
Printemps Redcats Fnac Conforama CFAO PPRGroup
Fuel consumption (in litres) 163,698 1,678,941 5,412,666 2,795,398 6,129,750 906,765 17,087,218
km travelled 779,517 4,796,974 29,477,099 12,108,091 17,716,040 5,711,980 70,589,701
Greenhouse gas emissions (in tonnes CO2 equivalent)
434 4,449 14,344 7,408 16,244 2,403 45,282
(1) Air transport (long-haul): emissions factor: 620 g CO2 / 1000 kg.km.Source: International Civil Aviation Organisation (Boeing 747 with 4 CF680C2 engines– Fuel consumption calculated on the basis of a 10,250 km fl ight: 60 cu.m. in loan, consumption of 0.18 kg per cu.m..km).Shipping: emissions factor: 17.01 g CO2 / 1000 kg.km.Source: Swiss Federal Offi ce of Environment, Forests and Landscape ((FOEFL or BUWAL) Environmental Series No. 32, Bern, February 1991.(2) Transport-related emissions are calculated on the basis of the standard emissions factor of 2,650 grammes equivalent CO2 emitted for the combustion of one litre of fuel.

98PPR 99
Waste productionThe waste products produced by the companies of the PPR Group consist primarily of packaging waste and very small quantities of hazardous waste. In order to optimise its waste management, the Group has developed reporting on the various types of waste produced. In 2005, the Group produced 83,262 tonnes of waste. As required by legislation, special attention was paid in 2005 to waste electrical and electronic equipment (WEEE). As of this date, all the companies have established general waste management procedures regarding collec-tion, transport, treatment and recycling.
Waste production in 2005 (in tonnes)
YSL Beauté Printemps Redcats Fnac Conforama CFAO PPRGroup
Non-hazardous industrial waste
1,690 4,389 27,717 6,891 20,520 19,192 80,399
Hazardous waste 686 5 8 274 n/a (1) 1,890 2,863Total waste 2,376 4,394 27,725 7,164 20,520 21,083 83,262
(1) Non-available.
Non-hazardous industrial waste
2005 results: a high proportion of cardboard waste
Within the reporting scope, PPR generated 80,399 tonnes of various waste products in 2005. Redcats is the largest producer of non-hazardous industrial waste in the Group, which accounted for more than one-third of the waste produced. CFAO and Conforama each contributed one quarter of the total non-hazardous waste.
Breakdown of non-hazardous waste production by company in 2005
34.5%
25.5%
5.4%2.1%
FNAC
REDCATS
CONFORAMA
CFAO
PRINTEMPS
YSL BEAUTÉ
8.6%
23.9%
Total: 80,399 tonnes
Recycling of non-hazardous waste
Nearly 40% of the non-hazardous waste produced by PPR is cardboard, which is then recycled. More than 60% of the non-hazardous waste from Redcats, 48% of YSL-Beauté waste and 35% of Fnac waste consist of cardboard that is recycled. In total almost 34,000 tonnes of non-hazardous waste were recycled in 2005. In line with its goal to earn ISO 14001 certifi cation, YSL Beauté reduced its production of non-hazardous waste which fell from 1,812 tonnes in 2004 to 1,690 tonnes in 2005.All the Redcats waste products are absorbed by recovery and recycling. The cardboard used by its suppliers to ship products to the Redcats sites is 100% recycled. Conforama has been sorting and recycling its cardboard waste for more than fi ve years. In 2005, the company focused its efforts on optimising its bins, reducing the rotation of the collection trucks, and training warehouse managers in sorting procedures. Despite a signifi cant increase in the cost of skip processing and turnover, the cost per recycled tonne remained relatively stable at approximately €138/tonne in 2005 versus approximately €132/tonne in 2004. Cost stabilisation was achieved through the implementation of a centralised management and selective sorting process. The gain per unit of 60 sorted tonnes is estimated at €1,850. Finally, CFAO recovers for use as animal feed 100% of the 7 million tonnes of spent grains (consisting of the husks of malt grain) produced by the two breweries operated in Congo by Brasco, a joint venture between CFAO Congo Industries Trading and Heineken under CFAO operational management. These grains are by-products, which have not been included in the waste category.
Corporate Social Responsibility – Environment

99 Reference document 2005
Recovery of non-hazardous industrial waste in 2005 (in tonnes)
YSL Beauté Printemps Redcats Fnac Conforama CFAO PPRGroup
Cardboard sent to recovery plants
815 660 16,856 1,864 4,486 7,527 32,208
Pallets sent to recovery plants
141 112 604 640 12 34 1,543
Total 956 772 17,460 2,504 4,498 7,561 33,751
Hazardous waste 2005 results: a small amount of hazardous waste
Less than 4% of the waste generated by PPR is hazardous waste (2,862 tonnes). 66% of the hazardous waste comes from the ope-rations of CFAO, particularly the company’s Moroccan subsidiary. Slightly less than one-quarter of the hazardous waste (686 tonnes) is produced by the YSL-Beauté plants, which generate laboratory solvents, aerosols and neons along with production scrap, obsolete products or defective products.
Breakdown of hazardous waste production by company in 2005
0.2%
23.9%
FNAC
REDCATS
CONFORAMA
CFAO
PRINTEMPS
YSL BEAUTÉ
9.6%66.0%
Total: 2,862 tonnes
0.3%
Recovery of hazardous waste
Over half of the PPR Group’s hazardous waste materials consist of non-industrial waste (electrical and electronic equipment, batteries, ink cartridges, etc.) which are sent to recycling plants. In 2005, CFAO recycled used oils produced by its Brasco subsidiary in Congo, reusing them in the plant boiler to produce steam. Furthermore, all the Group companies collect batteries. As part of its environmental strategy, Fnac enhanced its programme to collect large and small batteries to be sent for recycling. Each store is equipped with a small battery collector, which collected 28 tonnes of batteries in 2005, an increase of 19% in real volume from 2003. Since June 2005, Fnac has also collected printer ink cartridges in all its stores in France and set up collection terminals for its customers.
Recovery of hazardous industrial waste in 2005 (in tonnes)
YSL Beauté Printemps Redcats Fnac Conforama CFAO PPRGroup
Batteries collected and sent to recycling plants
6.2 n/a (1) 8.6 28 0.1 6.0 48.9
Ink cartridges sent to recycling and reconditioning plants
0.5 1.9 1.5 2.1 n/a (1) n/a (1) 6.0
(1) Non-available.

100PPR 101
Waste electrical and electronic equipment (WEEE)
Pursuant to European Directive 2002/96/EC and French Decree 2005-829 of 20 July 2005 respecting the end of life of WEEE, the Group has participated since 2004 in the pre-mapping mission of Eco-Systèmes, a French eco-organisation representing a large number of pro-ducers and distributors. PPR became a shareholder of Eco-Systèmes in 2005 and contributes, with its companies, to the work groups developed to pool the collection and treatment of this type of waste. At the same time, Fnac set up a system to recover its customers’ old computers. The goal is to give them a second life with economi-cally disadvantaged groups. An initial test was conducted in the Nantes and Dijon stores starting in mid-June 2005, then in Limoges in November 2005. Fnac relies locally on the Emmaüs association for the collection, rehabilitation and reinitialization of the computers. Internethon, a national association, is responsible for coordination between the Emmaüs networks and the organisations or associations needing repaired computers.In 2005, PPR companies collected nearly 1,500 tonnes of WEEE, 84% of which was collected by Conforama.
Waste electrical and electronic equipment (WEEE) recycling in 2005 (in tonnes)
YSL Beauté Printemps Redcats Fnac Conforama CFAO PPRGroup
(WEEE) used for recycling purposes
2 1 50 187 1,303 0 1,543
Energy consumptionEnergy represents a substantial portion of the structural expenditures of the stores because it is a crucial factor in creating product value. It has also an impact on the group’s environmental policy that is closely tracked for consumption and greenhouse gas emissions.
Energy consumption in 2005 (in MWh)
YSL Beauté Printemps Redcats Fnac Conforama CFAO PPRGroup
Electricity consumption 12,195 75,163 117,498 142,675 165,273 23,666 536 470
Fuel oil consumption 100 3,318 2,730 NC (1) 9,278 52,770 68,196
Natural gas consumption 14,379 5,037 51,278 7,399 47,589 2,510 128,192
Steam consumption (heating network)
n/a (1) 7,996 17,777 7,407 n/a (1) n/a (1) 33,180
Total energy consumption 26,674 91,514 189,283 157,481 222,140 78,946 766,038
(1) Non-applicable.
Breakdown of PPR energy consumption in 2005
CONSUMPTION OF ELECTRICITY
CONSUMPTION OF FUEL OIL
CONSUMPTION OF STEAM(HEATING NETWORK)
CONSUMPTION OF NATURAL GAS 70.0%
4.3%
8.9%
16.8%
Total: 766,039 MWh
Corporate Social Responsibility – Environment

101 Reference document 2005
Electricity is the largest energy fl ow
Within the reporting scope, the PPR Group’s total energy consumption in 2005 was 766 GWh, which included 536 GWh of electricity, 128 GWh of natural gas, 68 GWh of fuel oil and 33 GWh of steam. The Group’s companies mainly use electricity to light their selling areas. The largest electricity consumer in the Group was Conforama with 165 GWh, representing 31% of PPR’s power usage over the reporting scope. Redcats ranks second and used 22% of the Group’s electricity with 117 GWh. Consumption of electricity and urban heating steam in 2005 was the same as in 2004. On the other hand, PPR consumer more natural gas and less fuel oil in 2005 than in 2004, thus reducing polluting emissions. The leading natural gas consumers in the Group were Redcats and Conforama with 51 GWh (40%) and 48 GWh (37%) of PPR’s consumption within the reporting scope. The largest fuel oil consumer was CFAO with 53 GWh in 2005, representing more than three quarters of the Group’s consumption, primarily related to the company’s industrial activities.
Breakdown of electricity consumption by company in 2005
FNAC
REDCATS
CONFORAMA
CFAO
PRINTEMPS
YSL BEAUTÉ
14.0%
26.6%
30.8%
4.4%2.3%
21.9%
Total: 536,470 MWh
Within the relevant scope, the average consumption for selling space for Printemps, Redcats, Fnac, and Conforama was 578 KWh per sq.m. of selling area. This indicator is not relevant for the operations of YSL Beauté and CFAO. The differences in energy consumption per sq.m. of area by company are the result of the need for different lighting depending on the products offered and the consumption of the electrical and electronic equipment offered.
Energy consumption by selling area in 2005 (in kWh/sq.m.)
Printemps Redcats Fnac Conforama PPR Group average
Electricity 429 684 525 206 405
Fuel oil 19 16 n/a (1) 12 51
Natural gas 29 299 29 59 97
Steam 46 104 29 n/a (1) 25
Total 523 1,103 615 278 578
(1) Non-applicable.
Fuel oil and natural gas are the primary sources of greenhouse gases
The Group’s fuel oil and natural gas consumption produces the direct emission of 44,733 tonnes of CO2, including 15,278 tonnes for CFAO, 12,116 tonnes from Conforama and 11,020 Redcats.

102PPR 103
Emissions of CO2 (in tonnes)
YSL Beauté Printemps Redcats Fnac Conforama CFAO PPR Group
Greenhouse gas emission related to energy consumption (fuel oil and natural gas)
2,904 1,936 11,020 1,480 12,116 15,278 44,734
The emission factors used to calculate direct emissions of CO2 are as follows:• fuel oil: 280 grams CO2 equivalent emitted per KWh ;• natural gas: 200 grams CO2 equivalent emitted per KWh.
Breakdown of CO2 emissions by company in 2005
FNAC
REDCATS
CONFORAMA
CFAO
PRINTEMPS
YSL BEAUTÉ
27.1%
34.2%
4.3%6.5%
24.6%
Total: 44,734 tonnes of CO2
3.3%
Companies’ actions to reduce their energy consumption
In 2005, YSL-Beauté equipped its Bernay site with sensors that electronically measure every 10 minutes the specifi c electrical consump-tion of the various activities (process, offi ces, air conditioning, etc.) In November 2005, the remote water meter reading system installed in 2004 was extended to the gas and steam meters. This system indicates the gas consumers entering the site as well as the fraction used to produce steam. By also measuring its steam production, the site can track performance and optimises its natural gas consumption. Finally, under new regulations that require the destruction and elimination of pyralene (an oil that facilitates the evacuation of the heat emitted during current transformation), YSL-Beauté replaced its three pyralene transformers with dry transformers (no oil).
In order to save electricity in 2005, Printemps Haussmann replaced 58W fl uorescent tubes with 35 W tubes and the halogen lights with high-performance lights. In addition, a study is in progress to produce hot water using solar energy. The store is working to optimise machine operation and consumption (refrigeration units, escalator motors, etc.) by 2010.
As part of a plan to reduce energy consumption, Redcats Nordic is participating in a programme to reduce electricity consumption in partnership with the University of Linkopings in Sweden.
The Fnac stores use large numbers of low-energy bulbs and have installed centralised technical management of lighting and heating which improves adjustments and allows lighting and air conditioning to be programmed in order to limit consumption during non-busi-ness hours. In 2005, 43 Fnac stores installed this type of management. The Fnac Italy stores in Milan, Turin, and Genoa replaced their air conditioning equipment in order to reduce consumption, thereby cutting electricity consumption by 12% in 2005.
Furthermore, the PPR companies optimised their electricity consumption by tracking it and selecting contracts suited to their usage. In 2005, the “green” contracts that PPR signed in 2004 with EDF took effect. As a result, 10% of the electricity consumed by the Group’s companies come from renewable energies.
Corporate Social Responsibility – Environment

103 Reference document 2005
Water consumptionWater consumption has not been considered to be a major impact in the Retail activities of the PPR companies. Most of the Group’s consumption is from sanitary uses. Conversely, the cosmetics manufacturing operations at YSL Beauté and the industrial brewing operations at CFAO require higher water con-sumption.
Relatively stable water consumption
Over the reporting scope, the water consumption of the PPR Group in 2005 was just over 1.8 million cu.m..The water consumption ratios per useful area occupied by the Group’s companies were similar in 2004 and 2005: 0.56 cu.m./sq.m. in 2004 and 0.58 cu.m./sq.m. in 2005. Water consumption at YSL-Beauté declined from 136,557 cu.m. in 2004 to 54,596 cu.m. in 2005. This strong decline is the result of the changeover to a closed circuit at the Lassigny plant completed in 2004. In 2005, YSL-Beauté participated in the world water day. The company displayed twenty panels on the themes of water in daily life, drinking water, water and industry, and water in the natural environ-ment. A “Voyage to the heart of water” quiz was also offered to the participants in order to test their knowledge in this area.
Consumption for Redcats rose by about 7% to just over 266,000 cu.m. in 2005. As the useful area of the stores also declined slightly, the ratio of water consumption per useful area rose in 2005 from 0.21 cu.m./sq.m. to 0.25 cu.m./sq.m..
Finally, Fnac consumed over 222,000 cu.m. of water, which includes 57,000 cu.m. for France.
Conforama used 250,761 cu.m. and, within a scope different from the reporting scope in 2005, the ratio of water consumption per useful area remained stable at around 0.25 cu.m./sq.m..
CFAO accounts for nearly half the Group’s total water consumption of the Group. This high consumption is mainly due to the brewery operated by the company in partnership with Heineken in Congo, and used approximately 750,000 cu.m. in 2005, compared with 683,000 cu.m. in 2004.
Water consumption in 2005
YSL Beauté Printemps Redcats Fnac Conforama CFAO PPR Group
Water consumption (in cu.m.)
54,596 162,991 266,455 222,850 250,761 892,821 1,850,474
Ratio of water consumption/useful area (cu.m./sq.m.)
0.75 0.46 0.25 0.56 0.25 3.10 0.58
Note: a portion of the water consumption has been estimated, particularly for 12 Conforama France stores and 7 Conforama Switzerland stores, using the average weighted by revenues.
Breakdown of water consumption by company in 2005
FNAC
REDCATS
CONFORAMA
CFAO
PRINTEMPS
YSL BEAUTÉ
13.6%
48.2%
8.8%3.0%
12.0%
Total: 1,850,474 in cu.m.
14.4%

104PPR 105
• 14 international purchasing offi ces• 69% of PPR employees feel that their company acts honestly in its external relations, compared to 62% in 2003
(PPR 2005 opinion survey)
The Group has defi ned its policy around commitments of fairness and respect based on quality procedures and compliance with environ-mental and social criteria, which it applies to its business partners. Thus, PPR is able to offer outstanding quality products and services to its customers at all times.
A partnership structure cited in the PPR Code of Business Practices
The PPR Code of Business Practices describes the Group’s commitments to its business partners. In the fi rst part of the Code, the Group agrees to observe impartiality and equal treatment when engaging in competition, objectivity in the terms for awarding contracts and compliance with the rules governing industrial ownership or when terminating a business relationship. In the second part, PPR clearly explains the commitments and behaviours to be engaged in by its business partners if lasting partnership relations are to be maintained. These involve, on the one hand, the willingness to eliminate any risk of confl icts of personal interest, either direct or indirect, with the employees of the Group, and, on the other hand, the compliance with the Group’s purchasing policy, which takes environmental and corporate social criteria into account.
Making corporate social and environmental responsibilityan integral part of the Group’s purchasing policySince 2002, the PPR Group has been implementing a genuinely voluntary purchasing policy clearly aimed at complying and ensuring that its suppliers comply with human, social and environmental rights. This policy applies both to the Group’s cross company, direct (PPR Purchasing) and indirect (PPR Buyco) purchasing offi ces and the purchasing units of the individual companies. This policy focuses on basic principles, which refl ect PPR’s commitment:
PPR’s Code of Business Practices introduced in 2005
Designed by PPR and shared by the Group companies, the Code of Business Practices is derived from basic international laws:• the United Nations Universal Declaration of Human Rights and the European Convention on Human Rights,• the “OECD guidelines for Multinational Enterprises”,• the United Nations Convention on Children’s Rights.
PPR’s commitments to our business partners stipulate that: “We are against child labour and forced labour and we monitor our suppliers to ensure that they comply with the principles to which we are attached (…) we do not form partnerships with suppliers if we know or learn that they do not comply with health and safety regulations or if they do not carry out their business in compliance with environmental laws and regulations”.The PPR Code of Business Practices is available on the website www.ppr.com, (CSR tab and heading relating to the Code of Business Practices).
PPR Supplier Charter introduced in 2002
The PPR Supplier Charter outlines all the rules with which the Group’s suppliers must comply. It is based on the main conventions of the International Labour Organisation (ILO) and on compliance with labour and environmental laws and regulations. They include:• prohibition on labour by children under the age of 15 and on forced labour (Conventions 29, 105, 138 and 182),• compliance with health and safety regulations (Convention 155),• guarantee of decent working conditions (Convention 100),• the right to organize and engage in collective bargaining (Conventions 87 and 98),• prohibition on any form of discrimination (Convention 111),• compliance with social and environmental laws and regulations.
Whether or not a supplier adheres to and signs this charter is a major criterion for inclusion in or removal from the list of accredited suppliers. With regard to the Charter, the Group’s direct suppliers also agree to see to it that their own suppliers comply with the principles set forth in the Charter.
Corporate Social Responsibility – Business partners
Business partners

105 Reference document 2005
Sector-based commitments
In 2004, in addition to the Supplier Charter, the PPR indirect purchasing offi ce, PPR Buyco, produced an Ethics Charter specifi c to logistics and transport. Sent to all carriers under contract with PPR in 2005, it notably specifi es commitments in terms of environmental criteria as well as limits on drivers’ working hours that must be met by the contracting companies and their sub-contractors. In addition, calls for tender by PPR Buyco include requirements in terms of social and environmental responsibility.In 2005, an ethics code specifi c to on-line auctions was completed and sent to the auction managers in the French and foreign subsidiaries, to be passed on to the suppliers participating in them. This document is available on the group intranet (heading: e-sourcing).
The Group’s self-assessment questionnaire
Sent automatically to every supplier, the self-assessment questionnaire is part of the internal auditing system enabling the Group’s purchasing teams to perform an initial analysis on respect for human, social and environmental rights. This way, any future audits to be performed at the production sites of direct suppliers can be oriented by specialised independent fi rms and by PPR in-house staff. The questionnaire must be returned to the companies fi lled out and signed by the suppliers, committing them to be familiar with and to comply with the principles of the Supplier Charter.
Local purchasing and supply offi ces
The strong presence of the companies’ buyers and of PPR Purchasing, in the international production sites provides another internal system helping to ensure compliance with human and social rights. At year-end 2005, the PPR companies had 14 international purchasing offi ces, mainly in Asia (China, India, Bangladesh, Vietnam, etc.), in Eastern Europe (France, Italy, Romania, Poland, etc.) as well as in Turkey and Brazil. This permanent presence of the Group’s buyers, who are nearly all natives of the countries where these purchasing offi ces are located, is a key factor in terms of compliance with the quality of the products supplied, and with the quality of the Group’s suppliers regarding social awareness.Upstream, including these social criteria set forth in the Charter affects the approval of all PPR companies’ suppliers. Once a business relationship is entered into, the managers in charge of quality control monitor the supplier by means of follow-up audits, especially when a corrective action plan has been approved after an initial audit.
PPR membership of the Social Clause Initiative (ICS) since 2002
The Social Clause Initiative (ICS) is an organisation comprising 15 of the largest retailers in France, engaged in a pragmatic and gradual move designed to encourage their suppliers to comply with the main conventions and recommendations of the ILO as well as local labour regulations in the emerging countries. The desire to improve the control of the process undertaken led the companies to place more emphasis on helping their suppliers to meet social and economic goals by going out to verify actual working conditions on-site. This task is turned over to specialised independent outside auditing fi rms accredited by the ICS and appointed by PPR (CSCC, Interteck, SGS).The Group’s companies developed a pool of common reference tools that could be used by the companies and the auditors: “the ICS Code of Ethics”, “the Manual audit”, “the Factory profi le”, “the Reference audit questionnaire”, “Execution guidelines”, “the Corrective action plan”, and “the Notifi cation alert”. Based on feedback, these tools were revised in conjunction with the auditing fi rms and were imple-mented in early 2005. The auditing questionnaire which is used as a common reference by the companies that are members of the ICS to conduct corporate social audits, takes into account the main ILO conventions and recommendations and the local regulations of each country. This common reference is organised into eight sections: child labour, forced labour, discrimination, disciplinary practices, harassment or poor treatment, freedom of association, working hours, salaries and benefi ts.This platform is also available to external auditors in the context of their auditing duties.This approach has enabled stringent requirements to be established regarding social audits. As the ICS is based on interaction, a com-mon electronic database platform containing more than 1,500 audits that can be shared by the companies was developed in 2005. It enables the companies to refer where necessary to pre-existing audits that meet ICS standards, while complying with data confi dentiality when necessary. External auditors also have access to the database in the context of their auditing duties.

106PPR 107
External audits of the Group’s suppliers
The PPR companies conduct external, independent audits of their various suppliers.
Breakdown of audits by geographical area
The breakdown of audits refl ects geographical areas where the Group’s companies do their buying and receive their supplies, and the desire to conduct audits in those countries where there is a higher probability of detecting cases of non-compliance with the Supplier Charter. The 2005 audits were conducted in 31 countries, including 75% in Asia (152 audits in China, 39 audits in India, 26 in Pakistan, 17 in Bangladesh, etc.), nearly 14% in Europe (Eastern and Western), with the remainder in Africa (7%) and America/Australasia (4%).
Evaluation of our suppliers
As part of the policy aimed at constant improvement, the valuation criteria were modifi ed in May 2005, with a signifi cant increase in the level of requirements from the Group’s suppliers. Compared to 2004, no supplier was considered to be excellent after this date. In 2005, 50% of the audits were considered to be acceptable, 21% needed improvement and approximately 25% were considered unacceptable. In the last case, major corrective action plans were implemented immediately. Lastly, 14% of audits could not be concluded successfully owing to the refusal of some suppliers to allow visits to their plants. These audits were all rescheduled.
Strict procedures in major cases of non-compliance
In 2005, a new warning system was implemented. It is known as the Alert notifi cation and guarantees that in the event of major non-compliance, the manager in charge of corporate social audits is warned in a timely manner after the non-compliance is discovered.Major non-compliance includes in particular child labour or forced labour. In 2005 no known case of child labour has been reported. However, eight audits demonstrated how hard it is to determine the age of the youngest employees (between the ages of 15 and 18) in the absence of identifi cation papers (birth, medical or dental certifi cates).32 cases of alleged forced labour (employees’ documents confi scated, salary deposit or uniform expenses withheld at hiring) were cited. If doubt cannot be raised quickly or if the supplier fails to agree to change his practices within a reasonable timeframe, in major case of non-compliance he is removed from the Group’s roster of suppliers. Three suppliers in China, India and Malaysia were removed from the list of accredited suppliers in 2005 after refusing or failing to imple-ment the required corrective measures. The Chinese supplier removed by PPR Purchasing was, however, put back on the roster two months later after showing legal documents to prove the age of all its employees and after putting in place all the corrective actions.
Improvements to be made concerning mainly issues of health, safety and compensation
• 54% of the cases of non-compliance reported in the analysis of the audits involve health and safety. Reports of failure to comply with safety standards include emergency exits that are obstructed or insuffi cient in number, lack of or insuffi cient protection from machines or lack of fi re drills. Reports of failure to comply with health standards include an insuffi cient number of bathrooms, snack rooms or dormitories compared with the number of employees.
• 19% of cases reported include working hour violations (no day off during the week, excessive overtime, etc.), • 16% of cases of non-compliance related to wages and benefi ts (failure to pay the minimum wage, unpaid overtime or overtime paid
below the legal rate, lack of the legally required insurance and retirement contributions, etc.)
Corporate Social Responsibility – Business partners
Geographical breakdown of audits in 2005
275
27EUROPE
AFRICA
AMERICA/AUSTRALASIA
ASIA
53
14
Total: 369 social audits
Ranking of audits in 2005
186
ACCEPTABLE
UNACCEPTABLE UNKNOWN(FACTORY COULD NOT BE VISITED)
NEEDS IMPROVEMENT
91
15
Total: 369 social audits
77
Breakdown of non-compliance by category in 2005
19158
15
Total: 369 non-compliance
66
WORKING HOURS HEALTH AND SAFETY
UNKNOWN (FACTORY COULD NOT BE VISITED)
OTHER: WORKING CONDITIONS, FORCED LABOUR, DISCRIMINATION, FREEDOM OF ASSOCIATION, ETC.
ABSENCE OF INFORMATION ON THE AGE OF EMPLOYEES
WAGES AND SOCIAL PROTECTION
2217

107 Reference document 2005
Sensitising and training in corporate social and environmental responsibility and sharing good practicesPPR and its companies held training and awareness session in corporate social and environmental responsibility with the employees and partners concerned. In order to share good practices in terms of CSR, the Group also encourages the sharing of information and interaction in internal and external networks promoting these topics.
Sensitising and training in CSR
The implementation of the PPR Code of Business Practices
Much of 2005 was spent on training in the Code of Business Practices and on circulating versions translated into eight languages. More than 150 ambassadors were trained using information and presentation kits created for that purpose, to train in turn at least 2,000 Group managers in a top-down process, with each manager then required to train its staff. By year-end 2005, most PPR employees had been trained and had received the Group’s Code of Business Practices.
Special training programmes for each category concerned
At the Group level, the buyers and product managers participating in the Purchasing seminar at the PPR “UniverCité” are trained sys-tematically. In 2005, specialized managers (buyers, product managers, etc.) were trained in taking CSR into account in the purchasing policy. CSR is also dealt with systematically during induction days for new employees.
Every year, PPR Purchasing holds an education and awareness seminar for its suppliers. In 2005, the seminar was held in Chinese in Hong Kong and focused specifi cally on appliances and electronics and on limited hazardous substances as described in EU Directive 2002/95/CE of January 27, 2003. The PPR Purchasing staff and the Conforama staff in charge of appliances and electronics were also trained in eco-design by a specialised fi rm, in partnership with the Agency for the Environment and Energy Management (Agence de l’environnement et de la maîtrise de l’énergie – ADEME).
Exchanging and sharing good practices in terms of CSR actions
PPR and its group of companies are actively sharing experiences in networks and entities recognised as promoting social and environmental responsibility. PPR is a member and participates in the task forces of the Observatory on Corporate Social Responsibility (ORSE), a French umbrella group of companies and agencies organised around the theme of corporate social responsibility. The Group is a member of the association IMS-Entreprendre pour la Cité, which includes over 120 companies acting in partnerships with the other players of the inner city, working towards sustainable development.PPR contributed along with Conforama to a task force on High Quality Environment (HQE) approaches to construction held by Utopies, a French consulting fi rm dedicated to the promotion of sustainable development through data collection and consultancy work for com-panies. This cooperation led to the release of a report, Sustainable construction: a Corporate Strategy produced in connection with this initiative.In the companies, interaction regarding good practices is also encouraged. The CEO of CFAO established the Corporations against AIDS Association (“Sida entreprise”), which includes 25 major international corporations active in Africa, for the purpose of combating AIDS. For its part, Conforama, a member of Orée, whose membership includes companies and local authorities and which produces joint analysis on the emphasis on environmental criteria, participated in that capacity in the task forces relating to transport and to sustainable purchasing.The proceedings resulted in the publication of Guide de la relation clients fournisseurs [Guide to Customer Supplier Relations].Finally, the PPR Group and its companies participate and speak at numerous symposia to learn more about good practices and to provide feedback based on their experience, especially at the European Symposium FEDERE 2005, held by Les Echos (a French news-paper) for sustainable development players and decision-makers. Lastly, to encourage interaction, in 2005, PPR created a social and environmental responsibility heading on its website.

108PPR 109
“Satisfi ed customers are loyal customers”. Convinced of the truth of this adage, PPR has placed the customer at the heart of its strategy. Viewed from the standpoint of social and environmental responsibility, customer satisfaction means offering a reliable quality product and an exchange of information and advice on the products delivered. Determined to go further, the Group’s companies have developed product and services offerings that refl ect sustainable development criteria, and have decided to make their customers aware of social and environmental issues.
Guaranteeing safe and quality productsProduct quality and safety are guaranteed by the Group through PPR Purchasing regarding appliances and electronics and by the companies regarding other products. Products are at the core of PPR’s businesses, so quality and safety are fundamental factors for the Group, as witnessed by the organisations and procedures put in place by PPR and its companies.
PPR Purchasing, a directly operated purchasing structure guaranteeing the quality of the Group’s private label brands
Entity established by the Group in 2001, PPR Purchasing (PPRP) pools the Group’s appliance and electronics labels sold by Printemps, Redcats, Fnac and Conforama. The PPRP Quality Control Department was introduced in 2003, with the goal of establishing a demanding quality process applicable to all references.
A Quality process throughout the supply chain
Specifi cations
The primary tool used by the Quality Department is the specifi cations, applicable to the products which lay out all the requirements in terms of conformity, regulations and quality. For example, the marking relating to appliances and electronics was applied to all products within the deadline established by EU Directive 2002/96/DE.
Laboratory tests
When new models are selected that conform to the specifi cations, two prototypes are automatically sent to the Group’s directly operated laboratories. The Redoute laboratory tests the sample product for safety, functionality, ease of use, European documentation and assem-bly qualities instruction for use. In 2005, nearly 1,400 sample products were tested at the La Redoute laboratory. The Fnac laboratory tests the technical performance of the product. Out of around 700 models tested in 2005, only 250 products were found to be suffi ciently qualifi ed to be listed and then sold within the Group. When the product has passed the fi rst selection test, a second similar test is done before sending the full batch is sent to the company.
Inspection assignments
Before products are shipped, a quality inspection is done automatically by certifi ed sub-contractors.
Sharing results
An intranet site devoted to quality was put in place in 2004 to make available to every company in the Group a database on all the standards and quality references of its products.
A 100% quality compliance rate
This system as a whole resulted in a compliance rate equal to 100%, all the quality deliveries were accepted by the Group’s companies as being in compliance with specifi cations. The quality satisfaction rate was 99.5%. The company satisfaction rate (including delivery delays) was 90% versus an objective of 95% in 2005.
Corporate Social Responsibility – Customers and consumers
Customers

109 Reference document 2005
Research and development
Some products were wholly developed in conjunction with the Group’s suppliers (mini-dishwasher, LCD TV, oven, etc.). PPR Purchasing also contributed to the eco-design project in partnership with Conforama, Electrolux and ADEME, with the threefold objective of selecting eco-design products, educating customers and training its staff in eco-design concepts. (see page 112).
A closer look at some of the PPR companies quality and compliance systems
Highly qualifi ed integrated laboratories guaranteeing the quality of YSL Beauté products
With the establishment of a measuring and control unit, YSL Beauté can guarantee a level of excellence in its beauty products regarding the harmlessness and effi ciency of a beauty care cream or the fragrance quality and content of a perfume. The laboratories employ 25 people (scientists, lab technicians and quality offi cers) and are responsible for quality control at the two YSL Beauté production plants, in Bernay and Lassigny (France).They are divided by speciality: the fi rst laboratory guarantees the absence of bacteria or germs in all beauty care products; the second one checks the compatibility of the extracts used in making perfumes and cosmetics formulas, particularly in terms of allergens; the third one does olfactory studies and the fourth one works on monitoring the raw materials used and the bulk containers.
The YSL Beauté laboratories have cutting edge technological equipment (chromographs to trace and identify molecules, an image-analyzer detecting any tiny leaks in defective packaging, etc.), guaranteeing product quality beyond reproach, and making it possible to stop all animal testing in 1993, as tests are now conducted in vitro before being conducted on human subjects with volunteer employees of the brand and a selected panel of consumers. In 2005, more than 20,000 analysis and control tests were done on the extracts, formulas and raw materials of semi-fi nished and fi nished products. This chain of control also applies to YSL Beauté suppliers, where the controls done in 2005 made it possible to guarantee the conformity of the data with the products provided.
An organisation that lends itself to product quality at Printemps
In 2005, Printemps purchasing offi ce was comprised up of around 250 persons, organised by business unit, on the basis of a breakdown per market: women’s fashion, accessories/luxury goods, menswear/children’s wear, beauty care/ linen, household goods. Each business unit defi nes its sales strategy based on the company’s positioning (Printemps as a fashion trend-setter, at the heart of the contemporary scene). The aim is to defi ne the brand portfolio and negotiate business terms. Printemps purchasing offi ce also has a procurement and management development department, whose duties include supplying the 17 Printemps stores and exercising control over all fi nancial issues.
The existence and conformity of all the legal documents relating to the products such as the customs certifi cate and the instructions for use and the validity of the product tests are then verifi ed by the Import department. If a check proves is necessary, it conducts the tests itself in a specialised laboratory. With this structured organisation, Printemps can offer a wide range of products with a high turnover rate, driven by the demand for a trendy and fashionable product offering.
In addition, a systematic training policy was established in 2002 for the employees of the purchasing centre. After initial training in the different standards and regulations, follow-up and update sessions are offered every year. Every new arrival is required to take this training. All the documents relating to the organisation of procedures and checks and the sheets on various themes (clothing, precious metals, cosmetics, etc.) published and updated by the Printemps Import department are available on the company intranet since February 2005, along with a dedicated hotline.
and consumers

110PPR 111
A strict product quality and safety requirement at Fnac Éveil et Jeux
Fnac Éveil et Jeux is extremely demanding when it comes to the quality of its products. It has them checked in accordance with safety requirements in effect. In addition, Fnac Éveil et Jeux has most of its products tested by “Pilot Parents”, a panel of 1,500 families, day-care centres and play centres… which evaluates the products in real life situations and validate their merits, their quality and their robustness. Therefore, only after a long series of safety and environmental tests and generally with the approval of “Pilot Parents” can a product be selected in Fnac Éveil et Jeux catalogues and stores.
Products from Asia representing 40% of Fnac Éveil & Jeux products, are subject to systematic quality control before being imported: a sample product is sent to France for approval before leaving.In 2005, quality inspections were completed on 435 references, and around a hundred products were taken out of production (for laboratory trials) on sensitive products. A systematic check is also done when products are delivered to the warehouse: for the warehouses of the North in 2005, more than 18,300 checks were made on around 7,470 products received.
Aiming to take Quality and Safety checks further, in 2005, Fnac Éveil & Jeux added a Quality and Safety engineer to its Products team, which is in charge of managing problems relating to product safety, monitoring products for compliance with regulations and standards, and advising and training staff in the requirements applicable.
The threefold quality, savety and environmental (QSE) policy developed by Conforama
Conforama has defi ned mandatory minimum standards to be applied from 2005, relating to quality, safety and also to the environment (Quality Safety Environment). Applicable to all the company’s product categories, this policy, called the “Minimas qualité “ (minimum quality requirement) policy, is based on EU directives, on the regulations of the countries concerned, if they are stricter, or on industry standards if there are no regulations. These “Minima qualité” requirements concern the packaging/product combination and describe all aspects of this combination: functionality, raw materials, logistics and transport, etc. Under these standards, some substances are prohibited (PVC packaging, copper or zinc in contact with food, asbestos, CFC [chlorofl uorocarbon gas], halon and types of wood prohibited by the Convention on International Trade in Endangered Species of Wild Flora and Fauna (CITES) signed in 1973, etc.), and thresholds are set for the use of some limited substances (tefl on, cadmium, lead, chrome, formaldehyde, etc.).
The QSE policy is disseminated to the relevant stakeholders (quality and sales departments, purchasing and supply offi ces, suppliers, etc), both internally and externally during training programmes and interaction. A website with access limited to the internal and external stakeholders concerned was established in 2004; it gives a thorough, detailed explanation of the Conforama QSE policy.
The interaction with customers on product quality
PPR believes that the trust established between the Group and its customers fuels lasting relationships. For that reason, the Group has added to its product quality control systems a structure providing information and advice to its customers.
CLIO, a programme of the PPR Group dedicated to customer service
Aimed at satisfying the Group’s customers, the CLIO (“Customer Obsession”) programme was introduced by PPR in 2002. The pro-gramme entered its second phase in 2004. ClIO 2 demonstrates the Group’s desire to pursue this commitment in 2005. The CLIO programme is being used by the companies in connection with specifi c projects such as “Client au coeur” (“Focus on Customers”) at Printemps, “Service plus” at Redcats, “Engagements” at Fnac and “Avantage service” at Conforama. The Printemps “Client au cœur” programme is based on three themes: making the act of purchasing easier, listening to customers’ requirements and motivating the teams dealing with customers. It has helped the company attain an overall satisfaction rating on the quarterly customer survey in line with the goal set for 2005.
Corporate Social Responsibility – Customers and consumers
111 Reference document 2005
Encouraged by the good results of its quality policy that started in its automobile network in 2003, CFAO’s “CLIO” programme goes now will now go further with the introduction of the second edition of the Standards Guide in December 2005. This edition now meets the quality plan requirements of each of the three car-makers (Toyota, Peugeot and Nissan), and thus combines CFAO’s best practices. The CLIO programme now includes 263 criteria (compared with 238 previously), 173 of which are defi ned as “MR” (minimum required), and 90 “NA” (for “Advanced Level” – meaning that implementation is more complex). Some criteria have moved from the status of “MI” to “NA” and others are new, such as preparing new vehicles before delivery, processing customer claims, and improving knowledge of fi nancing methods. As an operational and practical extension of the hard copy guide, the CD-Rom enables the user to fi ll in automati-cally all the car-makers’ action plans and to view the results in real time, which represents an undeniable time-saver improving effi ciency. With 10 new sites included in 2005, this tool is used by all the plants in the automotive business. Armed with this new system and buoyed by the enthusiasm of its staff, CFAO is moving even further along the path to customer satisfaction.
Strict confi dentiality regarding customer data
The confi dentiality of the data submitted when they purchase is a key factor in clients’ trust in the Group . In general, all the PPR companies have agreed to respect the confi dentiality of their customers’ data, particularly when it comes to the store cards they offer. In particular, these guarantees are based on the respect of CNIC procedures (French national commission for information technology and freedom – CNIL) and on interprofessional charters such as the one for the French association of home shopping businesses, (Association française des entreprises de vente à distance – FEVAD). These guarantees were further strengthened within the PPR Group following amendments to the Information Technology and Freedom Law of January 6, 1978 through the law of August 6, 2004 (new disclosure requirements to be fulfi lled by persons processing personal data). The Group has also complied with new rules on e-mail “spamming” established by the Law on Confi dence in the Digital Economy of June 21, 2004.
Sensitising the Group’s customers and offering products refl ecting sustainable social and environmental development issuesAs part of their approach to Corporate Social Responsibility, the Group’s companies, decided to take a new approach by offering products and services refl ecting environmental and social criteria and educating their customers as to the challenges of sustainable development.
Environmental issues
YSL Beauté is certifi ed to develop organic cosmetics
As part of its development policy, in 2005, YSL Beauté received a licence issued by Ecocert, an independent French agency, certifying it to develop environmentally friendly and organic cosmetics. To obtain this license, the company had to establish a specifi c organisation and quality process.
The Redcats Somewhere brand offers organically grown cotton
The Somewhere brand’s Spring-Summer catalogue for 2005 offers a range of 15 products called BIO for Believe In Origins, made from organic cotton. These products bear this Swiss label certifi ed by the institute of marketecology - IMO guaranteeing that no pesticides or chemicals were used in the cotton manufacturing process, and that dyes were without heavy metals.
Fnac proposes shopping bags that are more environmentally friendly
Organic store bags made from corn starch, which are more environmentally friendly, have been developed by Fnac and are currently being tested in Limoges in France. The impact on the environment is limited throughout their useful life and during manufacturing through the use of renewable raw material made from plants. The impact on the environment is further reduced during transport because the manufacturing plants are in Europe and can be recycled after use as they are biodegradable. Thanks to an initial deposit, these bags can also be traded in free of charge when they are no longer useable. If the test proves conclusive, in 2006, Fnac plans to introduce these more environmentally friendly store bags to its entire network.

112PPR 113
Conforama launches an “Eco-design” policy
As a continuation of its product offering based on low energy consumption and of its policy to educate customers using the manual entitled Pour une consommation plus durable (For more sustainable consumption). Conforama introduced an eco-design policy in partnership with PPR Purchasing, Electrolux and ADEME in 2005 . Eco-design involves minimizing the impact on the environment during the entire life cycle of a product and its components, from the design phase to the end of life of the product. To illustrate this policy, Conforama and its partners have selected eight energy-saving and water-saving appliances (washing machine, dryer, dishwasher, simple refrigerator, simple freezer and combination refrigerator-freezer) available in the company’s stores in 2005.In order to educate its customers, Conforama published more than 64,000 copies of an educational guide distributed in its stores, explaining the benefi ts of an eco-design policy and helping customers to recognise the products resulting from it. The company’s catalogues also emphasized this initiative by pointing out the products made under the eco-design policy. In line with this policy, special training in eco-design was developed for Conforama product managers and PPR Purchasing. At the same time, an eco-design exhibit was shown at Conforama head offi ce to educate employees regarding this new policy.
Social issues
Printemps encourages ethical fashion
The 2005 Ethical Fashion show was held on October 7, 8 and 9 in Paris during Paris fashion week, with PPR and Printemps as sponsors. Respect for the environment was the theme of this second show. Fashion industry professionals had an opportunity to view show-rooms presenting some fi fty designers from around the world. The programme also featured round table discussions on ethical fashion, and fashion shows presenting the designs. As a member of the jury, PPR again confi rmed its desire to promote products refl ecting environ-mental and social criteria.Furthermore, Citadium, a Printemps sport company, entered into a partnership with the VEJA company to sell in 2005 baskets produced in Brazil from rubber and natural materials, made in accordance with fair trade rules. This partnership entered into by Citadium helps to add value to production from the forest through the purchase of rubber from small producers at prices guaranteeing decent living condi-tions. It is also sponsoring health education programmes in Brazil.
Redcats is involved in introducing a fair trade cotton segment under the Max Havelaar label
In a partnership with the Max Havelaar association in France, Redcats helped to develop a new business segment in Africa of fair trade cotton for clothing and textiles. A range of 12 labelled T-shirt products was offered in the La Redoute Fall-Winter catalogue for 2005-2006 from Mali, Senegal, Burkina-Faso and Cameroon. The company sold almost 112,000 tee-shirts in 2005. This label guarantees to the 3,000 small producers involved a guaranteed minimum price that is 20 to 30% higher than international market rates, with a development premium paid to producers’ groups to assist with projects of general interest such as drilling wells, building roads, etc.
Fnac offers its non-retail and and cultural spaces to discuss global issues
In addition to its commitments as a company (combating illiteracy and desending freedom of speech), Fnac is playing its role as a “media” store and has decided to make available its forum its non-commercial spaces to hold lectures and discussions on subjects such as fair trade and ethical marketing. During fair trade week from May 2 and May 13, in France, 17 Fnac stores hosted meetings on fair trade with the theme “Why just consume when you can consume fairly?” in partnership with the Max Havelaar NGO.
Corporate Social Responsibility – Customers and consumers – Shareholders

113 Reference document 2005
Listed on the premier marché of Euronext Paris, PPR has adopted corporate governance principles guaranteeing compliance with accounting, fi nancial and stock market regulations (see Corporate governance principles, page 284).
Promoting transparency in fi nancial and other data
PPR aims to provide its shareholders and the fi nancial sector with fair, complete and accurate information. PPR has fi nancial communication tools allowing it to produce a variety of communications: letters to shareholder, dedicated website, site visits, CSR report, and presentations to fi nancial analysts (for further details, see page 278).
Included in triple performance market indices
The PPR Group is rated by the main non-fi nancial rating agencies. These agencies grade and rank companies according to economic, social and environmental criteria in order to build socially responsible market indices and investment portfolios. In 2005, the PPR Group was listed in the Footsie4Good index designed by English company Eiris and in the Aspi index of French rating agency Vigeo.
Shareholders

114PPR 115
SolidarCité’s areas of actions• 67% of PPR employees feel that their company has a responsible attitude towards
the community compared to 64% in 2003 (PPR 2005 opinion survey)
Convinced that its sphere of responsibilities does not stop at the doors to its stores or warehouses, the PPR Group aims to involve itself and to participate in designing solidarity projects fi rmly rooted in the domestic or international regions where its companies are present. In order to unify and coordinate solidarity projects, in 2001, PPR established a SolidarCité, an association dedicated to community work. In order to avoid a company on the move becoming a company that excludes, the aim of SolidarCité is to develop citizenship projects that create synergies to build together the Community, Business and the Individual.
PPR provides SolidarCité with the infrastructure of a large corporation run by committed individuals, which allows initiatives to emerge. The association’s priorities include working together to improve the standard of living in cities, promoting diversity, equal opportunities and job placement for the underprivileged, and helping the poor and deprived to retrieve their dignity.SolidarCité’s model is based on an innovative principle that mobilises the PPR Group’s resources, links institutional partners with individuals, enables employees to join forces and to provide support commensurate with their desire to become involved, and communicates the pleasure of committing oneself along with others to solidarity projects of which they can be proud. SolidarCité’s approach is illustrated by two approaches: cross-company projects at PPR Group level and specifi c projects within the companies.
SolidarCité’s originality lies in the fact that it encourages and supports the initiatives proposed by the Group’s employees, with an independent budget of one million euros. At the same time, the companies are developing programmes specifi c to their scope of social responsibility whereby SolidarCité acts as a centre of expertise to advise the brands and develop partnerships.
PPR network- Companies -
SolidarCité
Human network- Individuals -
Citizen network- Partners -
Cre
ate
bond
s
Create initiatives
Create relays
Corporate Social Responsibility – Encourage corporate citizenship
Encourage corporate
SolidarCité is present in
7 countries
a1,000,000 budget in 2005
57projects supported
9,895volunteers (all projects combined)

115 Reference document 2005
Inter-company projects at Group levelSupport for partnership projects
SolidarCité aims to encourage the commitment of all PPR employees. As part of a general interest initiative, every Group’s employee can qualify for material, human or fi nancial assistance from SolidarCité. All they need to do is to submit their project to the SolidarCité Selection Committee, composed of one employee from each of the Group’s companies, who meet every quarter. The selection is made using a scale of 10 weighted criteria, which allows for an impartial and objective assessment of the projects presented. In 2005, 27 projects were supported in this manner, representing a total budget of €302,471.
Actions promoting equal opportunities
For the sake of consistency and in order to enlist more support for social cohesion, the decision was made in December 2003 at a SolidarCité seminar that the association’s theme in terms of assistance would focus on equal opportunities, respect for individual diversity and living together.
A Strong commitment to diversity
Les Défricheurs [The Pioneers]
In October 2004, PPR and the Group’s company chairmen signed the French diversity Charter to attest to the Group’s commitment to cultural, ethnic and social diversity, to encourage pluralism and to seek diversity through recruitment and career management.
To bring recognition to those who have achieved outstanding success, SolidarCité decided to call on Yamina Benguigui to produce a fi lm aimed at showing the invisible and pernicious aspects of the discrimination suffered by those with immigrant backgrounds. She indepen-dently produced Les Défricheurs. The purpose of this documentary is to show that the company is successfully bringing together all the components of society and giving the feeling of belonging to a nation. This approach, sends a strong signal, while making concrete and believable the idea that it is possible to achieve social and professional recognition.Each portrait is a human adventure, viewed through the career paths of PPR employees, with the common thread on origin, socio-cultural context, family life, problems getting started, and hard work in the face of obstacles to succeed in a career.
Broad support
In October 2005, SolidarCité held a conference for PPR employees with the theme “Diversity challenges in Europe, in French society and in business: economic and social outlook and human resources prospects.” Among the speakers were Claude Bébéar, CEO of Axa, who outlined the issues facing the republican social model as relates to diversity, and Yasid Sabeg, co-founder of the diversity charter, who showed that the republican, economic, sociological and political outlook are related to business. The Vice presidents for Human Re-sources of the SNCF and British Telecom also shared their experiences through case studies.
In 2005, SolidarCité also supported Maison de la Mixité, the layman’s Tour de France and the fi rst event of the Festival du Film de Paris, including a selection of fi lms dealing with equal opportunities, non-discrimination, tolerance and diversity. Discussions were also held in suburban cities with Respect, the association’s partner magazine.
citizenship

116PPR 117
Education
Since it was created, SolidarCité has been involved in the area of education with the aim of offering new ways to climb the social ladder. Hosting young people in the company, assistance with training and exposure to the business world are effective ways to bring the busi-ness world closer to the academic sphere.
Replying to the collapse of the social and professional ladder with the Télémaque Foundation
Created in June 2005, the Télémaque Foundation provides educational sponsorship by its member companies for children aged 10 to 16 selected for their academic aptitude and social criteria. Télémaque is in fact a project based on the fi nding that a talented, motivated child growing up in a disadvantaged environment has little chance of getting suffi cient schooling to aspire to a fulfi lling professional life
Télémaque is the fruit of several years of programmes and projects. In 2001, SolidarCité signed a two-year agreement with the Ministry of National Education in partnership with two selected schools – Douai and Moret-sur-Loing. In 2003, this agreement was renewed and expanded to include two other boarding schools of the Fondation d’Auteuil – Chartres and Thiais. In 2004, a new agreement was signed with the Ministry of National Education in order to support and help integrate boarding school students from high priority underprivileged areas.Chaired by Bernard Stasi, the Télémaque Foundation includes in 2005, four partner schools, some twenty young people on scholarship and fi ve companies that are either members or in the process of becoming members.
Offering personalised [career] development with “Why Not Me?”
SolidarCité is a partner in the “Why Not Me?” programme implemented by the elite business school ESSEC, which aims to provide support for fourth-year secondary school pupils from underprivileged backgrounds, enrolled in schools in poor neighbourhoods, in order to help them enter preparatory classes for admission to a major business and management school. The programme reinstils the value of hard work by offering each student participating in the programme a chance to investigate their own future careers. In 2005, 27 young people spent a full day at the Massy Fnac store. Aside from the site visit and the testimonials, they were introduced to different business lines. In addition, 40 school students had a day of shadowing (learning about the company with an employee).
Recognising deserving students with the Edouard Vaillant school in Gennevilliers
On May 13, 2005, a partnership agreement was signed between SolidarCité and the Edouard Vaillant School in Genevilliers. The purpose of the agreement established by this college is to support the programme recognising good students, which is considered a high priority education area. The high point of the programme was an annual awards ceremony held on June 24, 2005. Prizes were awarded in the form of books and diplomas granted to the most deserving students. The ceremony was attended by the students, their parents, the staff of the school and the partners (around 300 people).In late 2005, SolidarCité and the Édouard Vaillant secondary school, working with the Printemps Haussmann store (two internship sessions, participation in juries, etc.), introduced a work-study programme at the third year level.
Citizenship development
For SolidarCité, citizenship is a way of interacting daily with others to accept differences and learn to live together. Every day, the employees of the PPR Group demonstrate their citizenship commitment and their involvement in the life of the community.
Projects abroad
Since 2004, SolidarCité has gone global. It now has employees in Italy, Spain, Switzerland, Sweden, Portugal, the United States and Great Britain.
Corporate Social Responsibility – Encourage corporate citizenship

117 Reference document 2005
SolidarCité provided assistance in New Orleans to help the victims of Hurricane Katrina. All the Redcats USA sites participated in this vast outpouring of solidarity and appealed for voluntary donations from employees, who contributed $29,283. This sum was matched by the company. At the same time, Redcats USA chose to aid the victims with in-kind donations. The company delivered 20,000 units of goods and merchandise (T-shirts, etc.) to Bâton Rouge in Louisiana. SolidarCité joined the Redcats USA solidarity project and sent as quickly as possible a €70,000 donation to the American Red Cross.
As part of the solidarity contest launched by Fnac Switzerland in the fourth quarter of 2005, Solidarcité supported the fi rst project called “Révélation Prod”, intended to encourage, develop, promote and introduce to the public artists and cultural projects in Switzerland and abroad by creating exchanges – particularly with Africa.
Solidarity leave
On April 18, 2005, SolidarCité signed an agreement with the Planète Urgence association to institute solidarity leave as a way of promoting and encouraging volunteer activities by the Group’s employees. Planète Urgence offers to participate in humanitarian or environmental projects in third world countries working with employees on paid leave, thus supporting technical, training or material projects. Financial support from SolidarCité is provided for employees leaving on a humanitarian mission. In 2005, 10 employees signed up for solidarity leave.
The Clichy-Montfermeil ”Mémoires Plurielles” project
The Bosquets district in Clichy-Montfermeil in the Paris region is part of the French government’s redevelopment plan (the Borloo plan for social cohesion) aimed at demolishing some neighbourhoods of that city to make way for new housing projects. A second year class from the Jean Jaurès secondary school in the Paris area worked on a book of testimonies on the history of the Bosquets district. The meetings between old and young led to a dialogue and interaction that proved to be preventive as well as educational. In addition to fi nancial support, SolidarCité provided full support to this project, more specifi cally in the design, drafting and illustration of a book on the subject.
Specifi c projects at company levelNot only is SolidarCité a central location where employees demonstrate their citizenship by working together as volunteers; it also acts as a rallying point within each of the PPR Group’s companies. Although individuals may feel a strong desire to act, this desire is rooted in a mutual wish to assist and to implement projects. The Association encourages solidarity projects in keeping with the history and culture of each company.
Gucci committed to the fi ght against AIDS
From November 22 to December 31, 2005 Gucci teamed up with Unicef to kick off an international solidarity campaign for children orphaned by AIDS. For this operation, Gucci produced a special collection of accessories consisting of 15 products, including sandals, a wallet, handbags and gold Christmas tree ornaments. All these products are recognisable by the famous Gucci red and green stripe; 20% of the sales from this collection, which are available in nearly 200 Gucci boutiques around the world, go to Unicef.
Children sponsored by Boucheron
In 2005, Boucheron sponsored Signature International, a group of leading photographers and artists sponsored by Dennis Hopper. Previously unknown photography work by Dennis Hopper, Penelope Cruz, Enki Bilal, Philippe Quaisse and André Rau, including photo-graphs taken at the Oscars or the Cannes Film Festival in 2005 was displayed at several exhibitions and will be auctioned in 2006. Profi ts will be donated to the International Committee of the Red Cross, Handicap International and the Starlight Starbright Children Foundation.

118PPR 119
Printemps and Solidarity Food Stores
In 2005, Printemps renewed its commitment to Solidarity Food Stores for underprivileged consumers. Arranged like small convenience stores and staffed by volunteers, these stores enable users to buy popular items at low prices, based on their resources and the number of people in their household. This is based on the notion of consumption as a driver of rehabilitation and on close cooperation with the social service agencies monitoring these families. Printemps’ contribution was to supply a non-food department in the Food Stores in the form of donations and to provide know-how in terms of display, arrangements, and merchandising thanks to volunteer employees, and to confi rm its role as a corporate citizen with associations working for rehabilitation. In 2005, the brand collected 3,500 beauty care, skincare and shaving products, which were sold in partner Solidarity Food Stores.
Redcats and its active social cohesion policy
Redcats, which is well established in the North of France, created an entity devoted to that geographical area by forming SolidarCité Nord. Drawing a crowd of 2,000 including 158 volunteers in 2005, the traditional fair held by SolidarCité raised €45,000 after matching contri-butions by SolidarCité, raised for six associations: Aide Écoute Familles Professionnelles (the Dr TITRAN Association), ABC D’ailleurs (an educational project in Mali), Éspoir (Hope) (a rehabilitation association in Roubaix – ironing/sewing), Les enfants de Ambotolampy (Children of Madagascar), Les Clowns de l’Éspoir (the Clowns of Hope) and Les Amis des Enfants du Monde (the Friends of the Children of the Earth).
Other projects are implemented every year. The “un jour, un collégien, un métier“ (“One day, one student, one job”) project enabled in 2005 136 high school students from a school in an underprivileged area to spend a day learning about a job previously chosen by them with assistance from a Redcats employee, and to have a mentor for a day. The Christmas dinner included some fi fty volunteers who hosted poor families on this symbolic day.Moreover special partnerships have also been developed, including Daxon with Handisport; La Redoute with SOS Children’s Villages for l’Ourson Baptiste (Baptiste the Bear), a catalogue item shared with the Ela Association; Vertbaudet with Necker Hospital and Redcats UK with a school in Wakefi eld located in an underprivileged neighbourhood.
Fnac’s commitment to make the arts more accessible to all segments of the population
Since December 2003, Fnac has teamed up with two associations – Association to promote an effective school (Association pour favo-riser une école effi cace – APFEE), and Student city foundation association (Association de la fondation étudiante pour la ville – AFEV) – in a literacy project for school children. The brand donates profi ts from two yearly events under the “on aime, on aide” (“We love,we care”), project by selling a 3-track CD (Sanseverino in 2005) and Christmas fi gurines. In 2005, Fnac donated €100,000. In close conjunction with several educational associations, the Forum des Halles Fnac store in Paris is involved in the fi ght against this “reading defi ciency” by focusing on grassroots projects. In 2005, the Forum Fnac store designed and fi nanced an unusual experimental project: allowing four young Parisians age 16, with no particular knowledge of fi lms, to write and produce a 3-minute fi ction fi lm on illiteracy. The fi lm was shown in 35 mm format at the UGC Les Halles cinema in Paris during the summer of 2005.
Moreover, Fnac actively supports non-profi t making organisations, by allowing access to its forums and photo galleries and selling tens of published items, the profi ts of which are donated to voluntary organisations (in 2005: the Planète Urgence Guide, Reporters sans Frontières, Objets chômage, etc.)
At the same time, the Fnac stores often take the initiative to implement solidarity projects. For example, the Paris stores offered unem-ployed young people 3-week internships in various departments, supervised by voluntary mentors. Likewise, the Prior and Rosy 2 Fnac teamed up with the “CAF du 93” (Family allowance department of Seine-Saint-Denis), the organiser of a reading contest called “Lire, écrire et grandir en Seine-Saint-Denis” (“Reading, writing and growing up in Seine-Saint-Denis”).
Corporate Social Responsibility – Encourage corporate citizenship

119 Reference document 2005
Access to reading for underprivileged children thanks to the Éveil et Jeux Foundation
In 2005, the Fnac Éveil et Jeux Foundation supported the “Ensemble pour la lecture” (“Together for reading”) project conducted by the French association AFEV (Student city foundation Association) aimed at helping children successfully enter primary school through lear-ning how to read. Fnac Éveil et Jeux created exclusive greeting cards with images illustrating childhood from a multi-cultural perspective along with the joy of reading. For each package of 10 cards and envelopes sold, €1.5 is sent by the Fnac Éveil et Jeux Foundation to AFEV. More than 23,300 packages have been sold, representing a total of €35,000 raised for the AFEV in 2005.
Conforama and its commitment to genetic research
Conforama made a commitment in 2004 for the fi rst time to the French Muscular Dystrophy Association (Association française contre les myopathes – AFM), and made the Téléthon a top priority in terms of solidarity. In 2005, the Company decided to take on this major challenge again, repeating the idea of a bicycle trip between Saint Priest and Paris. Thanks to the 7,786 km covered in all by 46 cyclists, a total amount of €84,000 was raised after a matching contribution by SolidarCité.
Education and fi ght against AIDS promoted by CFAO
Education
For the past fi ve years, academic scholarships have been awarded to the children of non-managerial African workers to fi nance their secondary studies and help the poorest and most deserving students gain access to schooling. As of 2006, the brand had 273 English-speaking and French-speaking scholars in 23 African countries. In addition to these scholarships, CFAO Solidarité donated to the French-speaking children a year’s subscription to the “Planète Jeunes” magazine, the primary purpose of which is to develop reading through the press.
CFAO also led a road safety programme in partnership with Bridgestone. Aware of the fact that in terms of road safety, tyre quality and condition are essential, CFAO teamed up with Bridgestone to hold training sessions for 15 African countries. These sessions were designed for the CFAO sales network and for the staff of client companies and offi cial bodies. Their purpose was to educate using simple and effective safety gestures related to tyres, such as adding tyre pressure, mounting tyres, balancing wheels and the like. CFAO and Bridgestone also fi nanced a 24-page supplement inserted into Planète Jeunes magazine with the goal of having children provide the latest safety tips to their parents.
The fi ght against AIDS
Introduced in April 2003 in subsidiaries in Sub-Saharan Africa, CFAO’s campaign against AIDS consists of informing and educating employees about the illness, holding voluntary diagnostic sessions for the workforce and paying for the care of anyone testing positive.In 2005, around 70% of the workers had participated in the education and awareness sessions, 427 sets of instructors were trained and 35,000 free condoms were distributed monthly.
At the same time, CFAO is contributing to the development of “Sida Entreprise” (Corporation against AIDS), created in May 2003. Chaired by Alain Viry, the Chairman and CEO of CFAO, this association brings together major European companies involved in the fi ght against AIDS, mainly in Africa. The objectives of “Sida Entreprise” are primarily educating the management of the large fi rms operating in Africa, organising exchanges of experience and helping the companies with their programmes to combat AIDS.

Financial information
120PPR 121
122 2005 Activity report 122 Foreword
123 Highlights
123 Comments on 2005 activity
129 Ananlysis of operating performances by division
135 Financial structure and cash fl ow
138 Other information
139 Subsequent events
139 Outlook
Investment policy and outlook140 Financial investments
141 Operating investments
142 Other investments
142 Outlook
Risk management143 Financial risks
144 Legal risks
145 Insurance risks
147 Employee-related and environmental risks
140
143

Les activités du Groupe
121 Reference document 2005
Consolidated fi nancial statements 148 Consolidated income statement
149 Consolidated balance sheet
150 Consolidated cash fl ow statement
151 Consolidated statement of change in shareholders’ equity
152 Notes to the consolidated fi nancial statements
243 Statutory Auditors’ report on the consolidated fi nancial statements
Parent company financial statements244 Parent company balance sheet
as of December 31, 2005, 2004 and 2003
245 Parent company income statement and statement of cash fl ow
for the years ended December 31, 2005, 2004 and 2003
246 Statement of charges in shareholders' equity of the parent company
246 Notes to the fi nancial statements
256 Subsidiaries and associates
258 Securities portfolio as of December 31, 2005
259 Parent company management report
263 Parent company fi nancial results for the last fi ve years
264 Statutory Auditors’ reports
148
244

122
Financial Information – 2005 Activity report
PPR 123
ForewordTransition to IFRS
Pursuant to European regulation no.1606/2002 of July 19, 2002, the PPR consolidated fi nancial statements for the year ended December 31, 2005 were prepared in accordance with the applicable international accounting standards adopted by the European Union as of that date. The international standards comprise the International Financial Reporting Standards (IFRS), the International Accounting Standards (IAS), and the interpretations of the Standing Interpretations Committee (SIC) and the International Financial Reporting Interpretations Committee (IFRIC).
The 2004 comparative fi nancial information has been prepared in accordance with the IFRS applicable on the date the 2005 annual statements were drawn up and in compliance with IFRS 1 on fi rst–time adoption of IFRS, excluding IAS 32 – Financial Instruments: Disclosure and Presentation, and IAS 39 – Financial Instruments: Recognitionand and Measurement which have been applied by the Group prospectively as of January 1, 2005.
Pro forma accounting fi gures – Change in Gucci Group closing dates (Luxury Goods division)
As of December 31, 2004, the Group aligned the fi scal period-ends of all its subsidiaries. Hence, the Group’s consolidated fi nancial statements include, for the Luxury Goods division, different consolidation periods for fi scal year 2005 (period of 12 months from January 1 to December 31) and fi scal year 2004 (period of 14 months from November 1 to December 31), making it diffi cult to analyse operating and fi nancial performance.For a better comparison of the fi scal years ended December 31, 2005 and December 31, 2004, the pro forma accounting fi gures comprising an income statement, consolidated balance sheet and statement of cash fl ows were prepared by consolidating the Luxury Goods division over 12 months in 2004 from January 1 to December 31. These pro forma accounting fi gures are shown in note 4.2 to the consolidated income statements.
Defi nition of “actual” and “comparable” revenue
The Group’s actual revenue corresponds to reported revenue.
The Group also uses the “comparable” notion in order to assess the organic growth of its activities. The notion of “comparable” revenue involves restating 2004 revenue for:• impacts of changes in Group structure in 2004 or 2005;• translation differences relating to revenue reported by foreign subsidiaries in 2004;• calendar effects between 2004 and 2005.
Considering the alignment of fi scal period-ends for the Luxury Goods division as of December 31, 2004, comparable revenue for 2004 corresponds to revenue for the 12-month period from January 1 to December 31.
Business segmentation (Segment reporting – IAS 14)
The level of segmentation at which the Group analyses its operating performance is identical to the fi rst level of segment reporting defi ned by IAS 14 – Segment reporting and described in notes 2.18 and 5 to the consolidated fi nancial statements.
Defi nition of Group consolidated net indebtedness
The concept of net indebtedness used by the Group is based on gross net indebtedness less net cash, as defi ned by recommendation no. 2004-R.02 of the Conseil National de la Comptabilité (French National Accounting Council) of October 27, 2004. The fi nancing of customer loans is presented under borrowings for fully consolidated consumer credit companies. The Group’s net indebtedness excludes the fi nancing of customer loans in the consumer credit business.
2005 Activity report

123 Reference document 2005
Defi nition of EBITDA
The Group uses EBITDA, the management line item, to monitor its operating performance. This fi nancial indicator corresponds to recurring operating income and depreciation, amortisation and provisions for non-current operating assets recognised in recurring operating income.
HighlightsTreasury share transactions
On March 30, 2005, in accordance with the authorisations granted by the Annual General Meeting, the Group’s Management Board decided to cancel 2 million treasury shares, thus bringing PPR share capital to 120,438,230 shares with a par value of €4 each.
During 2005, the Group also performed net disposals of 2,738,618 shares as follows:• 1,108,132 shares were sold by blocks between May 18, and June 10, 2005 through market brokers acting independently, at an average
price of €81.058 per share;• 1,560,000 shares were sold on June 27, 2005 via an over-the-counter transaction at a price of €83.7 per share;• 195,000 shares were sold under the liquidity contract;• 124,514 shares were purchased by the Group following the automatic exercise of PPR call options considering share performance.
Finally, the Group purchased 3,394,062 PPR call options in order to hedge the following transactions:• 3 million PPR call options maturing in 2008 to partially hedge the 2008 OCEANE bonds;• 394,062 PPR call options to hedge the share option plans issued in 2005, including 124,514 options exercised during the year.
Sale of the Group’s remaining interest in Facet
During the fi rst six months, the Group sold its remaining 9.69% interest in Facet to BNP Paribas for a sale price of €87.2 million. At the same time, both groups (PPR and BNP Paribas) announced a strengthening of their sales agreements to ensure the continuity of relations between Facet and Conforama.
Comments on 2005 activityRevenue
Consolidated revenue from continuing operations in 2005 totalled €17,765.7 million, up 4.2% compared to 2004, and breaks down by division as follows:
(in € million) 2005 2004 % change
Luxury Goods (1) 3,036.2 2,712.4 11.9%
Retail 14,760.0 14,357.9 2.8%
Eliminations (30.5) (28.6) NM
PPR – Continuing operations 17,765.7 17,041.7 4.2%
(1) Luxury Goods division consolidated over 12 months from January 1, 2004 to December 31, 2004.

124
Financial Information – 2005 Activity report
PPR 125
The increase in revenue includes the positive impact of changes in scope of consolidation in the amount of €8.3 million, mainly relating to the acquisition of Jotex by Redcats in the second half of 2004 and the sale of Mobile Planet in the fi rst half of 2005. The rise in revenue also includes a net negative impact of exchange rate fl uctuations in the amount of €93.0 million, including €68.6 million relating to the depreciation of the US dollar against the euro and €27.9 million relating to the depreciation of the yen against the euro. The remaining negative foreign exchange impacts mainly stem from the depreciation of the pound sterling against the euro.
The calendar effect, adjusted for calculation of comparable revenue growth and amounting to €2.9 million in 2005, refl ects a lower number of trading days in 2005 than in the previous year.
On a comparable basis, in terms of Group structure, exchange rates and number of trading days, the increase in revenue breaks down by division as follows:
(in € million) Comparable2004 (1)
Change 2005 % change
Luxury Goods (2) 2,620.3 415.9 3,036.2 15,9%
Retail 14,362.4 397.6 14,760.0 2,8%
Eliminations (28.6) (1.9) (30.5) NM
PPR – Continuing operations 16,954.1 811.6 17,765.7 4,8%
(1) 2005 Group structure, exchange rates and number of trading days.(2) Luxury Goods division consolidated over 12 months from January 1, 2004 to December 31, 2004.
On a comparable basis in terms of exchange rates and number of days, Group revenue from continuing operations rose from 4.8% with an exceptional growth dynamic in the Luxury Goods division and a satisfactory performance from the Retail division in the face of sluggish household consumption, particularly in France, and in markets characterised by the acceleration of new products and stiff competition.
Revenue by geographical area
(in € million) 2005 2004 (1) % change
France 8,647.6 8,479.6 2.0%
Europe excluding France 4,232.9 4,080.4 3.7%
Americas 2,084.5 1,995.5 4.5%
Africa 1,595.4 1,418.1 12.5%
Oceania 182.5 195.3 -6.6%
Asia 1,022.8 872.8 17.2%
PPR – Continuing operations 17,765.7 17,041.7 4.2%
(1) Luxury Goods division consolidated over 12 months from January 1, 2004 to December 31, 2004.
The Group’s international revenue totalled €9,118.1 million in 2005, up 6.5% in actual terms and 7.9% on a comparable basis in terms of exchange rates and number of trading days. The Group’s international activity continued to predominate, representing 51.3% of total revenue in 2005, compared to 50.2% in 2004.
The Group was able to withstand the economic fl uctuations that took place in 2005, particularly in France and Europe, through the balance in the geographical locations for its selling formats. The Group’s revenue outside Europe represented 27.5% of total revenue, compared to 26.3% in 2004.
Revenue increased in all major geographical areas in 2005, with growth of 3.8% in Europe excluding France, 8.5% in the Americas, 12.3% in Africa and 21.3% in Asia on a comparable basis in terms of Group structure, exchange rates and number of trading days.

125 Reference document 2005
Internet revenue
Group internet revenue from continuing operations totalled €1,332.4 million in 2005, up 34.2% compared to the previous year, and was mainly achieved by the Redcats and Fnac Retail companies. E-commerce represented 9.0% of total Retail division revenue, compared to 6.9% in 2004.
Gross profi t
The Group’s gross profi t amounted to €7,733.6 million in 2005, up 4.7% compared to a 2004 pro forma gross profi t of €7,387.9 million.
The actual and pro forma gross profi t percentages for the various divisions are as follows:
(as % of revenue) Actual Pro forma (1)
2005 2004 2005 2004
Luxury Goods 66.5% 66.6% 66.5% 66.3%
Retail 38.9% 39.1% 38.9% 39.1%
PPR – Continuing operations 43.5% 44.0% 43.5% 43.4%
(1) Luxury Goods division consolidated over 12 months in 2005 and 2004 from January 1 to December 31.
The Group’s pro forma gross profi t percentage increased by 0.1 points to 43.5%. This was mainly attributable to the following factors:• an increase in the Luxury Goods division’s contribution to total gross profi t, refl ecting the division’s stronger-paced growth within the Group;• the increase in the gross profi t percentage of the Luxury Goods division by 0.2 points to 66.5%, refl ecting the division’s ability, faced with
unfavourable exchange parities, to adjust its pricing policy and limit mark-down effects particularly due to the success of its collections;• the slight decline in the gross profi t percentage of the Retail division by 0.2 points to 38.9% due to the fall in the gross profi t percentage
of Fnac by 0.7 points to 30.2%, refl ecting, in particular, the heightened international presence and the greater predominance of technical products, and despite the improvements in the gross profi t percentages of Redcats, by 1.2 points to 57.3%, and Conforama, by 0.3 points to 33.4%, due to the favourable effects of the international sourcing policy.
Payroll expenses and other recurring operating income and expenses
The Group’s payroll expenses totalled €2,661.9 million in 2005, up 4.1% compared to €2,556.3 million on a pro forma basis in 2004, yet lower than the 4.7% rise in gross profi t in the same period.
Productivity, which measures payroll expenses compared to gross profi t, improved by 0.2 points to 34.4% compared to 2004. This productivity gain refl ects, in particular, the stability of the Retail division’s operating expenses in a contrasting economic environment.
The average number of employees totalled 76,669, up 1.4% compared to 2004, while the average number of employees increased by 1.2% in the Retail division and by 3.8% in the Luxury Goods division. The average number of employees in the holding companies fell however by 4.6% during the year.
Other recurring operating income and expenses, which include marketing and advertising investments and miscellaneous operating expenses (transport, real estate, IT, etc.), rose by 3.7% on a pro forma basis and represent 22.4% of revenue, compared to 22.6% in 2004.
This 3.7% increase in comparison to a 4.7% growth in gross profi t was mainly attributable to increased costs for premises in connection with the expansion and refurbishment of selling space at most Retail companies, and the controlled rise in store network expansion and communication costs in the Luxury Goods division.
Depreciation, amortisation and provisions for non-current operating assets totalled €393.5 million in 2005, up slightly compared to 2004 pro forma fi gures.

126
Financial Information – 2005 Activity report
PPR 127
EBITDA
Earnings before interest, tax, depreciation and amortisation of non-current operating assets (EBITDA) totalled €1,477.6 million in 2005, up 7.4% on a pro forma basis compared to 2004.
Actual and pro forma EBITDA by division is broken down as follows:
Actual Pro forma (1)
(in € million) 2005 2004 % change 2005 2004 % change
Luxury Goods 522.4 544.8 -4.1% 522.4 423.0 23.5%
Retail 1,012.8 1,011.4 0.1% 1,012.8 1,011.4 0.1%
Holding companies and other (57.6) (59.0) 2.4% (57.6) (59.0) 2.4%
PPR – Continuing operations 1,477.6 1,497.2 -1.3% 1,477.6 1,375.4 7.4%
(1) Luxury Goods division consolidated over 12 months in 2005 and 2004 from January 1 to December 31.
The Luxury Goods division reported marked sustained growth in EBITDA of 23.5% due to the remarkable performances of its Gucci and Bottega Veneta divisions and the reduction in recurring operating losses in virtually all other brands, especially Yves Saint Laurent and Boucheron. Retail division EBITDA was stable over the period, undermined by the counter-performance of Conforama during the year mainly owing to rising operating expenses in France as a result of the policy to refurbish and expand its store network, and the sluggish-ness of the Italian market which curbed the performances of its Emmezeta subsidiary. The EBITDA of Fnac and CFAO rose substantially, by 7.6% and 5.2% respectively, demonstrating the companies’ ability to generate additional resources in markets faced with strong pressure on profi ts.
Recurring operating income
Group recurring operating income totalled €1,084.1 million in 2005, up 9.9% on a pro forma basis compared to the previous year.
Actual and pro forma recurring operating income by division was as follows:
Actual Pro forma (1)
(in € million) 2005 2004 % change 2005 2004 % change
Luxury Goods 389.5 387.4 0.5% 389.5 287.7 35.4%
Retail 754.3 759.5 -0.7% 754.3 759.5 -0.7%
Holding companies and other (59.7) (61.0) 2.1% (59.7) (61.0) 2.1%
PPR – Continuing operations 1,084.1 1,085.9 -0.2% 1,084.1 986.2 9.9%
(1) Luxury Goods division consolidated over 12 months in 2005 and 2004 from January 1 to December 31.
The substantial rise in recurring operating income refl ects the outstanding performance of the Luxury Goods division and the commendable results of the Retail division companies, with the exception of Conforama hindered by disappointing sales performances in France and Italy, and whose repositioning weighed heavily on operating costs for the year.
Recurring operating income of the Luxury Goods division increased by 35.4%, or €101.8 million on a pro forma basis, despite the negative foreign exchange impacts, and particularly the appreciation of the euro against the US dollar. On a constant exchange rate basis, the rise in the division’s recurring operating income totalled €179.8 million, demonstrating the strong operating leverage of its brands. These outstanding results are primarily attributable to the excellent performance of the Gucci brand, whose recurring operating income rose over the period by 14.7% on an actual exchange rate basis and 32.3% on a constant exchange rate basis, the upset in the balance of Bottega Veneta operations, and the very signifi cant decrease in the recurring operating losses of other brands.

127 Reference document 2005
The recurring operating income of the Retail division fell slightly by 0.7% in 2005 due to the counter-performance of Conforama. The recurring operating income of Conforama totalled €177.1 million, down 14.4%, hindered by the decline in operating performances in France and Italy. The division’s other brands recorded satisfactory results in a diffi cult economic environment. For example Fnac, whose recurring operating income rose considerably by 9.7% to €151.8 million, CFAO, whose recurring operating income rose by 5.1% to €167.0 million, or Printemps, whose recurring operating income rose by 11.8% to €25.5 million illustrate the relevance of the strategic model geared towards profi tability based on increasing sales in concession agreements.
The Group’s recurring operating profi t increased to 6.1% in 2005, compared to 5.8% in 2004 on a pro forma basis. Actual and pro forma operating profi t by division breaks down as follows:
(as % of revenue) Actual Pro forma (1)
2005 2004 2005 2004
Luxury Goods 12.8% 12.1% 12.8% 10.6%
Retail 5.1% 5.3% 5.1% 5.3%
Holding companies and other n/a n/a n/a n/a
PPR – Continuing operations 6.1% 6.2% 6.1% 5.8%
(1) Luxury Goods division consolidated over 12 months in 2005 and 2004 from January 1 to December 31.
The pro forma increase in recurring operating profi t was due to the performance by the Luxury Goods division, whose recurring operating profi t totalled 12.8%, compared to 10.6% in 2004. This performance was underpinned by the rise in the recurring operating profi t of the Gucci division to 26.9%, compared to 26.6% in 2004, and the substantial improvement in the recurring operating profi t of all the other brands, including Bottega Veneta which surpassed its objectives considerably with a recurring operating profi t of 8.6%.
The slight decline in the recurring operating profi t of the Retail division to 5.1% mainly refl ects the 1.1 point decrease to 5.6% for Conforama and the 0.4 point decrease to 8.2% for CFAO due to the intensifi cation of activities in Mediterranean Africa and the problems encountered in the Ivory Coast.
Other non-recurring operating income and expenses
Other non-recurring operating income and expenses of the Group consist of unusual items likely to disrupt the appraisal of the economic performance of each division and represented a net expense of €10.0 million in 2005. This included pre-tax capital gains of €90.0 million recognised on the sale of operating and fi nancial assets (including a capital gain of €70.3 million recognised on the sale of the Group’s interest in Facet), restructuring costs of €41.7 million and asset impairments of €57.7 million.
Operating income
Group operating income totalled €1,074.1 million in 2005, compared to €1,191.6 million in 2004 in actual terms, and €1,093.7 million on a pro forma basis. This slight decrease by 1.8% was mainly due to the change in other operating income and expenses. In 2004, this heading mainly included the capital gain on the sale of 24.5% of the consumer credit business in the amount of €322.9 million.
Net fi nancial expenses
The Group’s net fi nancial expenses totalled €311.6 million in 2005, up 4.4% compared to €298.9 million in actual terms and €298.5 million on a pro forma basis in 2004.
The €13.1 million rise in net fi nancial expenses compared to 2004 results primarily from the Group’s prospective adoption of IAS 32 and IAS 39 as of January 1, 2005. The adoption of these standards had a negative impact of €38.3 million on net fi nancial expenses, considering the recognition of Group fi nancing at amortised cost using the effective interest rate method, in particular, for OCEANE convertible bonds.

128
Financial Information – 2005 Activity report
PPR 129
Adjusted for this impact, the Group’s net fi nancial expenses sharply fell by €25.2 million, refl ecting the steady decline in average outstanding net debt, despite the increase in the average interest rate by around forty basis points in 2005.
This rise in the average interest rate on Group’s net debt stems from the refi nancing of debt facilities in the previous eighteen months in order to extend its debt maturity profi le.
Corporate tax
The Group’s income tax charge amounted to €192.2 million in 2005, compared to €318.9 million in actual terms and to €310.1 million on a pro forma basis in 2004.
This included a taxable income of €5.5 million relating to other operating income and expenses for the year. The 2004 pro forma income tax charge included a charge of €138.5 million relating to other operating income and expenses for the year, in particular the current and deferred capital gains tax of €127.7 million on the sale of the consumer credit business.
The effective tax rate, which measures the relationship between the income tax charge for the year and pre-tax income, stood at 25.2% over 2005. Adjusted for other net operating income and expenses, the effective tax rate stood at 25.6% over 2005, compared with 24.9% in the previous year.
The moderate rise in effective tax on income from operating activities was due primarily to the increase in the effective tax rate for the Retail division, considering this division’s favourable results at the international level.
Net income from continuing operations
In actual terms, net income from continuing operations totalled €573.7 million in 2005, compared to €588.2 million in 2004. On a pro forma basis, net income from continuing operations rose 14.9 % to €573.7 million in 2005.
Net income from discontinued operations
This heading includes all assets or groups of assets recognised under IFRS 5 – Non-current assets (or groups of assets) held for sale and discontinued operations. This standard applies to assets (or groups of assets) whose sale is highly probable.
No non-current assets held for sale were recognized in 2005. In 2004, net income from discontinued operations totalled €588.6 million and corresponds to the net income of Rexel before depreciation, amortisation and minority interests until its exit from the Group structure, and the post-tax capital gain reported by the Group following the company’s sale.
Minority interests
In actual terms, minority interests amounted to €38.3 million in 2005, compared to €111.7 million in 2004.
On a pro forma basis, minority interests totalled €38.3 million in 2005, compared to €88.1 million in 2004, mainly due to the impact of the sale of Rexel in December 2004.
Net income from continuing operations attributable to the equity holders of PPR
Net income from continuing operations attributable to the equity holders of PPR totalled €535.4 million in 2005, compared to €528.9 million in actual terms, and €463.8 million on a pro forma basis in 2004, up 15.4%.
On a pro forma basis and excluding non-recurring items, net income from continuing operations attributable to the equity holders of PPR totalled €539,0 million, compared to €484.7 million in 2004. This 11.2% increase refl ects the steady improvement in the Group’s operating performances through the 9.9% rise in recurring operating income, the stability of fi nancial expenses and the decrease in the income tax charge.

129 Reference document 2005
Net earnings per share
The weighted average number of PPR shares used for the earnings per share calculation was 119 million in 2005, compared to 119.4 million in 2004. The weighted average number of diluted shares was 132.8 million, compared to 134 million in 2004.
Net earnings per share from continuing operations in 2005 was €4.50, compared to €4.43 in actual terms and €3.89 on a pro forma basis in 2004.
Excluding non-recurring items, net earnings per share from continuing operations was €4.53 in 2005, compared to €4.62 in actual terms and €4.06 on a pro forma basis in 2004.
Analysis of operating performances by divisionLuxury Goods division
Actual Pro forma (1)
(in € million) 2005 2004 % change 2005 2004 % change
Revenue 3,036.2 3,202.1 -5.2% 3,036.2 2,712.4 11.9%
of which:
France 245.3 274.7 -10.7% 245.3 227.7 7.7%
Europe excluding France 1,084.5 1,125.3 -3.6% 1,084.5 972.4 11.5%
Americas 651.8 728.7 -10.6% 651.8 605.1 7.7%
Africa 5.7 5.8 -1.7% 5.7 4.3 32.6%
Oceania 29.1 32.6 -10.7% 29.1 34.1 -14.7%
Asia 1,019.9 1,035.0 -1.5% 1,019.9 868.8 17.4%
EBITDA 522.4 544.8 -4.1% 522.4 423.0 23.5%
Cash fl ow from operating activities (2) 467.1 510.7 -8.5% 467.1 375.1 24.5%
Gross operating investments (3) 115.7 138.6 -16.5% 115.7 121.7 -4.9%
(1) Luxury Goods division consolidated over 12 months in 2005 and 2004 from January 1 to December 31.(2) Net cash fl ow from operating activities.(3) Purchases of property, plant and equipment and intangible assets.
Sales performance
The revenue of the Luxury Goods division increased during the year by 11.9% in actual terms (from January 1 to December 31) and 15.9% on a comparable basis. Revenue by division breaks down as follows:
(in € million) 2005 2004 % change
Actual Comparable
Gucci Division 1,807.1 1,590.0 13.6% 18.4%
Bottega Veneta 159.7 99.6 60.2% 66.8%
Yves Saint Laurent 162.0 169.2 -4.3% -1.0%
YSL Beauté 613.2 621.4 -1.3% 1.3%
Other brands 294.2 232.2 26.7% 28.4%
Luxury Goods division (1) 3,036.2 2,712.4 11.9% 15.9%
(1) Luxury Goods division consolidated over 12 months in 2005 and 2004 from January 1 to December 31.

130
Financial Information – 2005 Activity report
PPR 131
The sales growth in the Luxury Goods division, already observed in the last quarter of 2004, continued in 2005 with a 15.9% rise in activity on a comparable basis that accelerated in the fourth quarter of 2005 with a 16.3% increase on a comparable basis. This performance is even more outstanding compared to the two fi gure increase recorded in 2004.
All geographical areas contributed to this performance, with sustained comparable growth in the division’s main locations (14.2% in Japan, 19.5% in North America and 10.7% in Spain) and spectacular growth in areas of expansion like the Asia-Pacifi c (excluding Japan) which reported growth of 27.3% in 2005.
The division benefi ted in particular from the success of leather goods (representing around 40% of division sales), for which comparable revenue increased by 30.9% in 2005, and the steady performance of shoes (up 12.9%) and the vitality of make-up and exclusive jewellery products.
Gucci Division
Gucci Division sales totalled €1,807.1 million, up 18.4% on a comparable basis. Growth was mainly attributable to leather goods (26.5%) in line with the success of the Flora range (Cruise Collection 2005) and the new La Pelle Guccissima leather goods line, not to mention the excellent response to the Treasure Bag (Autumn-Winter 2005) and Bouvier Bag (Cruise Collection 2006) handbag lines.
The brand’s pricing policy was maintained across its entire product range via the quality of products, their high-end positioning and improved communication. In 2005, on a comparable basis, Gucci reported growth rates of over 10% in all geographical areas, with accelerated growth in North America (24.9%) and Asia-Pacifi c (28.5%).
Nine new stores were opened during the year, including three in Japan, two in Asia-Pacifi c (excluding Japan) and two in North America, bringing the number of stores to 207 as of December 31, 2005.
Bottega Veneta
Bottega Veneta revenue rose by 66.8% on a comparable basis over the year, confi rming and accentuating quarter-on-quarter the formidable success of its collections (quarter 1: 54.2%, quarter 2: 55.8%, quarter 3: 72.1%, quarter 4: 79.8%). This increase is refl ected in both retail sales (87.2% of the division’s revenue), up 67.8%, and third party sales, up 59.9%.
Leather goods, up 69.0% on a comparable basis, are the brand’s main source of growth, particularly through the success of the best-seller Veneta, Baby Bag and Campana Bag handbags and the new Ball Bag and Cocker Bag handbags of the 2005 Autumn-Winter collection. The other product lines show very signifi cant potential, with growth on a comparable basis of 48.1% for shoes and 55.6% for ready-to-wear clothing. All the geographical areas posted growth on a comparable basis, with 67.3% in Europe, 48.5% in North America, 63.4% in Japan and 102.2% in Asia-Pacifi c (excluding Japan).Eighteen stores were opened during the period (including ten in Asia-Pacifi c, fi ve in Japan and three in Europe), bringing the total number of stores to 83 as of December 31, 2005.
Yves Saint Laurent
Yves Saint Laurent’s business declined slightly by 1.0% on a comparable basis during the year, mainly due to the disappointing performances in its leather goods in the second and third quarters. Nevertheless, the performance recorded in the fourth quarter, and more specifi cally in December, marked a trend reversal relating to the emergence of the Cruise collection, which showed promising initial success with substantial sales growth in women’s ready-to-wear and accessories.
Sales in Europe, Yves Saint Laurent’s leading market, fell slightly by 1.0% on a comparable basis during the year, but increased by 6.2% in the fourth quarter. In Asia-Pacifi c (excluding Japan), sales increased by 6.2% on a comparable basis over the year.
The Yves Saint Laurent brand was sold through a network of 62 stores worldwide as of December 31, 2005.

131 Reference document 2005
YSL Beauté
YSL Beauté’s sales increased by 1.3% on a comparable basis in 2005 to €613.2 million. Perfume sales fell 3.7% on a comparable basis in one year without any major launches. The perfumes sold under the Yves Saint Laurent brand showed contrasting performances with the success in Europe of Cinéma, and the more modest trends recorded for the remaining products in a mature and highly competitive market. Sales of perfumes sold under the Alexander McQueen “My Queen”, Stella McCartney “Stella” and Zegna “Z Zegna” brands roc-keted during the year.
Make-up sales increased by 18.5% on a comparable basis during the year, mainly due to the success of the lipstick sold under the Yves Saint Laurent brand, Rouge Pure Shine.
Other brands
The other brands of the Luxury Goods division recorded excellent performances during the year. Sales amounted to €294.2 million, up 28.4% on a comparable basis. Boucheron’s sales increased by more than 30%, whereas the brands of designers Alexander McQueen and Stella McCartney continued to develop steadily.
Balenciaga, which more than doubled its sales during the year, surpassed the Group’s objectives in terms of growth and development potential.
EBITDA
The EBITDA of the Luxury Goods division in 2005 totalled €522.4 million, down 23.5% compared to 2004 on a pro forma basis. This strong rise in EBITDA should be compared with a 11.9% growth in revenue during the period. This performance concerns all the division’s brands except for YSL Beauté. Gucci and Bottega Veneta recorded outstanding results and very high profi tability ratios, refl ecting the operating leverage of these brands in a period of high growth, and despite adverse exchange rate fl uctuations.
Cash fl ow
Net cash from operating activities stood at €467.1 million, up 24.5% compared to 2004 on a pro forma basis. This increase in net cash from operating activities, in line with EBITDA, demonstrates the division’s ability to meet its working capital requirement in a period of high growth. These results were obtained mainly due to the measures taken throughout the year to optimise supply fl ow.
The relative stability of gross operating investments compared to the prior year refl ects the more focused store opening strategy, following a period of considerable expansion, adopted in line with the Group’s strategic plan.
Retail division
(in € million) 2005 2004 % change
Revenue 14,760.0 14,357.9 2.8%
of which:
France 8,432.9 8,280.5 1.8%
Europe excluding France 3,148.4 3,108.0 1.3%
Americas 1,432.7 1,390.4 3.0%
Africa 1,589.7 1,413.8 12.4%
Oceania 153.4 161.2 -4.8%
Asia 2.9 4.0 -27.5%
EBITDA 1,012.8 1,011.3 0.1%
Cash fl ow from operating activities (1) 814.5 634.1 28.4%
Gross operating investments (2) 257.5 259.5 -0.6%
(1) Net cash fl ow from operating activities.(2) Purchases of property, plant and equipment and intangible assets.

132
Financial Information – 2005 Activity report
PPR 133
Sales performance
The revenue of the Retail division increased during the year by 2.8% in actual terms and on a comparable basis. Revenue by division breaks down as follows:
(in € million) 2005 2004 % change
Actual Comparable
Printemps 751.8 784.3 -4.1% -4.7%
Redcats 4,377.3 4,403.4 -0.6% 0.0%
Fnac 4,381.9 4,130.3 6.1% 5.3%
Conforama 3,140.0 3,096.9 1.4% 1.2%
CFAO 2,034.3 1,859.4 9.4% 9.3%
Other activities 74.7 83.6 -10.6% 3.2%
Retail division 14,760.0 14,357.9 2.8% 2.8%
In 2005, the Retail division recorded a solid performance with a 2.8% increase in sales on a comparable basis, which accelerated in the second half of the year with growths of 5.8% in the third quarter and 1.9% in the fourth quarter, after a 1.9% increase in the fi rst half.
In an environment characterised by lacklustre household consumption, especially in the second and fourth quarter, division sales in France rose moderately by 1.8% (1.6% on a comparable basis). Excluding France, division sales increased signifi cantly by 4.4% on a comparable basis during the year, due to the success of the Group’s internationalisation policy via the export of new concepts and expertise.
Printemps
Printemps revenue amounted to €751.8 million during the year, down 4.7% on a comparable basis. This fi gure does not take into account concession sales achieved through concession agreements, the sole commission for which is now recognised under IFRS. Taking into account the sales obtained in concession agreements, the decrease in revenue is limited to 1.6% on a comparable basis during the year. Concession agreement sales now represent 30.1% of department store sales.
Department store sales, including those obtained from concession agreements, declined slightly by 1.3% during the year. This fi gure refl ects the company’s repositioning in the more profi table product families, particularly fashion, luxury goods and accessories. The year was also marked by the decision to discontinue the toys activity, and the desire to limit promotions, especially for beauty products. Printemps Haussmann sales (including concession agreements) showed strong resilience with a 0.4% increase on a comparable basis due to the growth of the Women’s fashion and Luxury Goods, whereas the Chain store sales decreased by 2.6%, especially for the Household Furnishings sector.
The Sport division’s sales fell by 5.2% on a comparable basis over the year due to the substantial decline in the shoes market and to the absence of major sporting events.
Redcats
Redcats’ revenue totalled €4,377.3 million during the year, stable on a comparable basis compared to 2004. Excluding Sears, whose activity ceased during the year, revenue rose by 0.7% on a comparable basis.
In France, Redcats’ business remained stable in 2005, especially hindered by the diffi cult climatic conditions in the fourth quarter. La Redoute revenue in France fell 1.4% during the year, even though the brand continued to gain market shares over its direct competitors. The specialised brands increased signifi cantly in France with 11.1% and 12.4% growth in VertBaudet and Cyrillus respectively.
Revenue in Europe (excluding France) declined by 2.1% over the year, refl ecting the diffi culties encountered in the United Kingdom where all Redcats brands fell by 3.5% in line with the discontinuation of The Store catalogue in the third quarter, and in Scandinavia where sales fell 5.4% on a comparable basis.
In the US, the turnaround in all customer accounts initiated in 2004 enabled the Redcats business to increase by 5.3% during the year (on a comparable basis and excluding Sears). This growth was mainly due to the success of the large-size clothing catalogues, with a 13.3% rise in revenue during the year. Internet sales represented 32.7% of revenue in the US in 2005, compared to 27.6% in 2004.

133 Reference document 2005
International activity represented 52.8% of Redcats revenue at the end of December 2005, compared to 53% at the end of December 2004.The increase in Web activity gained momentum throughout the period, confi rming the huge success of the Internet as a major remote sales channel. Redcats e-commerce revenue totalled €1,099.3 million in 2005, up 35.8% on a comparable basis. This sales channel represented 25.7% of remote sales activity in 2005, compared to 18.7% in 2004.
Fnac
The annual revenue of Fnac totalled €4,381.9 million, up 5.3% on a comparable basis.
In France, Fnac reported solid growth of 4.0% on a comparable basis. Activity is based on the strong demand for technical products, the revenue of which increased by 5.5% on a comparable basis over the year, despite the decrease in average selling prices. Fnac increased its market share in editorial products, considering the scope of its offer and the sound performance of book sales. Fnac.com, whose sales rose by 39.8%, confi rmed its position as French leader of “Business to Consumer” sites in terms of ratings, while maintaining a pricing policy adapted to its targets.
In the international market, a primary growth engine for Fnac, the 9.9% rise in sales on a comparable basis confi rmed the company’s potential and the gain of market shares in most countries. Revenue on a comparable basis rose by 8.0% in Switzerland, 7.0% in Italy, 15.1% in Spain, 27.1% in Brazil and 10.5% in Portugal. Only Fnac in Belgium reported a decline in activity, due to fi erce competition and internal restructuring.
During the year, the company pursued its international expansion by opening four new stores outside France (two stores in Spain, one in Portugal and one in Greece). It also opened its sixty-eighth store in France, in Limoges, and completed its Éveil & Jeux store network with six new openings
Conforama
In a market shaped by a downward trend in average household spending, for both electro-domestic goods and furniture, Conforama recorded a 1.4% sales increase in actual terms and a 1.2% increase on a comparable basis in 2005. The company bolstered its discounter image and continued to develop its multi-style furniture range.
In France, Conforama sales rose 2.4% on a comparable basis, and this increase accelerated in the second half of the year, despite the disruptions caused by the refurbishment of the store network. This improvement was mainly due to the 5.9% growth in brown and grey goods, which generate considerable sales. The signifi cance of Conforama’s own brands in the White/Brown/Grey goods markets was strengthened throughout the period.
Excluding France, Conforama revenue fell by 1.3% on a comparable basis during the year mainly due to the decline reported in Italy, where furniture recorded sound performances with a comparable 2.1% increase, while revenue from brown and grey goods sharply declined due to a depressed market, marked by fi erce competition and falling average selling prices. Excluding Italy, international sales however rose by 2.3%.
Conforama opened six new stores in 2005 (two in Switzerland, two in Spain and two in France, including the reopening of the Morsbach store) and continued to actively refurbish stores in France.
CFAO
CFAO revenue totalled €2,034.3 million in 2005, up 9.3% on a comparable basis compared to the previous year, with an acceleration in the fourth quarter, up 15.5% on a comparable basis.
The growth in Mediterranean Africa, whose development was one of the priorities of CFAO’s strategy, amounted to 44.2%.
Automobile distribution increased by 10.0% on a comparable basis, underpinned by the growth in North African countries and the solid performance in the French overseas territories.

134
Financial Information – 2005 Activity report
PPR 135
Pharmaceuticals pursued its development with a comparable increase of 8.6%. Sales benefi ted, in particular, from very steady growth in Egypt and Senegal.
CFAO Technologies reported a 18.6% increase on a comparable basis, considering the development initiatives taken in 2005 that will continue in the future through the set-up of regional skills centres harnessing its most advanced resources and remaining in proximity to its customers.
Other activities
The revenue of other activities mainly corresponds to Orcanta and Kadeos.
Orcanta lingerie revenue amounted to €49.4 million in 2005, down 3.7% on a comparable basis.
Kadeos revenue, representing the commissions on the issue, distribution and conversion of vouchers and gift vouchers, totalled €19.1 million in 2005, up 23.2%, mainly refl ecting the initial success of the gift voucher launched at the beginning of the second quarter.
EBITDA
The EBITDA of the Retail division totalled €1,012.8 million, up 0.1% with growth in all companies apart from Conforama. The highest increases concern Fnac, up 7.6% to €237.6 million in addition to CFAO, up 5.2% and Printemps, up 2.3%. The EBITDA of Conforama decreased by 10.7% to €237.1 million and mainly refl ects the adaptation of logistical structures in France to the new method of sourcing, and rising indirect taxes. The EBITDA of Redcats increased slightly by 0.7% to €278.4 million.
Cash fl ow
Cash fl ow from operating activities of the Retail division totalled €814.5 million, up sharply by 28.4% compared to 2004. In a context of lacklustre consumption, the increase in cash fl ow from operating activities was due to the initial impact of the logistics fl ow streamlining policy initiated by the Group for working capital requirement.
Gross operating investments totalled €257.5 million. This slight decline was due to the selective investment policy that the Group adopted while prioritising high return investments such as the continued renovation of Conforama stores or the refurbishment of selling space at Printemps stores.

135 Reference document 2005
Financial structure and cash fl owNet non-current assets
The Group’s net non-current assets as of December 31, 2005 totalled €13,604.5 million, down slightly by 0.5% compared to January 1, 2005 (after prospective adoption of IAS 32 and 39) and break down as follows:
(in € million) 2005 2004 (1) % change
Goodwill 5,545.9 5,485.4 1.1%
Intangible assets 6,605.0 6,618.4 -0.2%
Property, plant and equipment 2,538.7 2,623.5 -3.2%
Investments in associates 44.0 46.9 -6.2%
Net non-current fi nancial assets 239.0 326.2 -26.7%
Net deferred tax assets (1,379.7) (1,441.6) 4.3%
Other net non-current assets 11.6 14.4 -19.4%
Total net non-current assets 13,604.5 13,673.2 -0.5%
(1) Situation as of January 1, 2005 after adoption of IAS 32 and 39.
The slight decrease in the Group’s net non-current assets does not call for any specifi c comment and refl ects the stability of the Group structure during the year.
Working capital requirement
Working capital requirement amounted to €103.2 million as of December 31, 2005, down sharply by 34.2% compared to January 1, 2005 due to the reduction in the operating working capital requirement of the two divisions.
Changes in the Group’s working capital requirement are shown below:
(in € million) 2005 2004 (1) % change
Operating working capital requirement 108.7 139.0 -21.8%
Other net current assets (422.1) (401.3) -5.2%
WCR related to operating activities (313.4) (262.3) -19.5%
Customer loans 416.6 419.1 -0.6%
Working capital requirement 103.2 156.8 -34.2%
(1) Situation as of January 1, 2005 after adoption of IAS 32 and 39.
The considerable 21.8% decrease in operating working capital requirement in 2005 resulted from the following factors:• a €88.4 million organic decrease in operating working capital requirement, refl ecting the measures implemented by the Group in terms
of its supply management policy;• a €58.1 million increase mainly relating to the impacts of exchange rate fl uctuations compared to December 31, 2004 regarding US
dollar-denominated assets.
The change in other net current assets during the year mainly results from the changes in tax receivables and liabilities.
The slight decrease in customer loans refl ected the policy of tightening credit conditions implemented by Redcats through its specialised fi nancing subsidiaries in the United Kingdom and Scandinavia.

136
Financial Information – 2005 Activity report
PPR 137
Equity
As of December 31, 2005, consolidated equity totalled €8,134.1 million, of which €7,985.3 million in equity attributable to the equity holders of PPR. Consolidated equity rose 6.8% compared to January 1, 2005 corresponding to the date for the fi rst-time adoption of IAS 32 and IAS 39 by the Group. This increase mainly results from the favourable impact of net income for the period, the impact of the net sale of 2,738,618 treasury shares in the amount of €225.4 million and the changes in translation differences less dividends paid.
Minority interests amounted to €148.8 million as of December 31, 2005 and mainly corresponded to third party interests in certain CFAO companies.
Provisions
Provisions for retirement and similar benefi ts increased by 12.9% to €279.4 million, compared to January 1, 2005, mainly due to the recognition of the cost of services rendered by employees during the period.
Other provisions totalled €227.7 million as of December 31, 2005, down €46.0 million compared to January 1, 2005. The decline in other provisions was mainly due to the extinguishment of vendor warranties with respect to the strategic disposals performed by the Group.
Net indebtedness
Group net indebtedness as of December 31, 2005 stood at €4,584.4 million, down 11.6% compared to January 1, 2005.
Group net indebtedness as of January 1, 2005 totalled €5,183.8 million, and, compared to December 31, 2004, included the impacts of the prospective adoption of IAS 32 and 39 as of January 1, 2005 in the amount of €458.5 million.
In 2005, and subsequent to the adoption of IAS 32 and IAS 39, the decrease in Group net indebtedness is attributable to the following factors:• substantial cash fl ow generated from operating activities in the amount of €1,301.2 illustrating the Group’s capacity to generate signifi cant
cash resources through the organic growth of its business;• controlled investment policy within its two divisions.
The net debt-to-equity ratio was 56.4% as of December 31, 2005, compared to 68.0% as of January 1, 2005.
Financing of customer loans amounted to €416.6 million as of December 31, 2005, down 0.6% on the previous year.

137 Reference document 2005
Cash fl ows for the fi scal year
(in € million) 2005 2004 (1) 2004 (2)
Cash fl ow from operating activities 946.9 890.6 1,009.9
Interest paid/received 228.4 264.1 263.7
Dividends received (15.1) (26.7) (26.7)
Net income tax payable 210.7 154.9 150.6
Cash fl ow from operating activities before tax, dividends and interest 1,370.9 1,282.9 1,397.5
Change in working capital requirement 63.9 (46.3) 1.0
Change in customer loans 8.3 28.6 28.6
Income tax paid (141.9) (178.4) (204.7)
Net cash from operating activities 1,301.2 1,086.8 1,222.4
Purchases of property, plant and equipment and intangible assets (379.5) (384.2) (401.1)
Proceeds from sale of property, plant and equipment and intangible assets 33.2 26.4 26.4
Acquisitions of subsidiaries, net of cash acquired (68.6) (2,686.3) (2,688.0)
Proceeds from disposal of subsidiaries net of cash transferred 3.1 2,338.7 2,338.7
Purchases of other fi nancial assets (18.6) (234.8) (234.8)
Proceeds from sale of other fi nancial assets 102.7 155.9 158.5
Interest and dividends received 48.0 55.9 60.0
Net cash used in investing activities (279.7) (728.4) (740.3)
Share capital increase/decrease 1.8 (0.2)
Treasury share transactions 185.5 100.4 100.4
Dividends paid to parent company shareholders (299.3) (278.9) (278.9)
Dividends paid to minority interests (27.0) (19.6) (19.9)
Increase (decrease) in other borrowings (2,935.4) 1,510.7 1,302.1
Interest paid and equivalent (227.5) (316.1) (319.6)
Net cash from (used in) fi nancing activities (3,301.9) 996.5 783.9
Net cash fl ow from assets classifi ed as held for sale 17.1 17.1
Impact of exchange rate variations 13.3 48.5 38.7
Net increase (decrease) in cash and cash equivalents (2,267.1) 1,420.5 1,321.8
Cash and cash equivalents at beginning of the year (3) 3,607.4 2,624.2 2,722.9
Cash and cash equivalents at end of the year 1,340.3 4,044.7 4,044.7
(1) Luxury Goods division consolidated over 12 months in 2005 and 2004 from January 1 to December 31.(2) Luxury Goods division consolidated over 14 months from November 1, 2003 to December 31, 2004 (published fi gures).(3) As of December 31, 2004, the net change in cash and cash equivalents includes short-term liabilities arising from the disposal of assets in the amount of €2,181.8 million.
Net cash from operating activities amounted to €1,301.2 million, a sharp improvement compared to 2004 on a pro forma basis, mainly refl ecting the rise in the operating income of the Luxury Goods division, and the increased stability of working capital requirements of the Retail division.
Net operating investments, corresponding to the purchases of property, plant and equipment and intangible assets, net of disposals, totalled €346.3 million. They include gross operating investments of €379.5 million, of which €257.5 million for the Retail division and €115.7 million for the Luxury Goods division. These investments correspond to the opening of selling formats in the amount of €83.1 million (€98.1 million in 2004), the conversion and renovation of sales outlets in the amount of €104.9 million (€118.6 million in 2004), and logistics and IT investments in the amount of €88 million (€105.2 million in 2004).

138
Financial Information – 2005 Activity report
PPR 139
Net cash from operating activities (net operating cash fl ow less net operating investments) amounted to €954.9 million for the year, up 31.0% on a pro forma basis (Luxury Goods division consolidated over the period from January 1 – December 31).
Net cash from investing activities corresponds to an outfl ow of €279.7 million in 2005. This breaks down into net operating investments for €346.3 million and net cash generated by fi nancial divestments for €66.6 million, mainly relating to the sale of Facet in the fi rst half of the year in the amount of €87.2 million.
Net cash from investing activities in 2004 included the cost for the acquisition of Gucci Group securities as part of the takeover bid initiated by the Group in April 2004, and the sale of Rexel in December 2004.
Other information• On January 20, 2005, Pinault-Printemps-Redoute announced its decision to adopt the name PPR, as well as a new visual identity.
The change symbolises the Group’s new image, in response to the strategic repositioning of Pinault-Printemps-Redoute in Retail and Luxury Goods. Shareholders approved the change in corporate name during the Annual General Meeting of May 19, 2005.
• On February 2, 2005, the Pinault-Printemps-Redoute Supervisory Board unanimously approved the appointment of François-Henri Pinault as Chairman of the Management Board, effective March 21, 2005. The Combined Ordinary and Extraordinary General Shareholders’ Meeting of May 19, 2005 approved the adoption of new articles of association refl ecting the legal change in corporate governance from a Management Board and Supervisory Board to a Board of Directors. Accordingly, the new Board of Directors elected François-Henri Pinault as Chairman and CEO of PPR effective the same date.
• On February 16, 2005, Gucci Group announced the payment to its shareholders of €4.24 per outstanding share in the form of a return on capital with effect as of February 28, 2005. The return on capital was proposed to Gucci Group shareholders by the Supervisory Board on October 22, 2004, and approved in an Extraordinary General Meeting held in Amsterdam on December 9, 2004.
• On March 22, 2005, Pinault-Printemps-Redoute secured a €2.75 billion syndicated revolving credit facility. The facility is for general corporate purposes including the refi nancing of a €2.5 billion syndicated facility established on October 30, 2002 and the €715 million syndicated facility established on May 26, 2004. This new facility, which has a maturity of fi ve years, provides two one-year extension options at the end of the fi rst and second years and is subject to a single fi nancial covenant (or net indebtedness/EBITDA below or equal to 3.75 times)
• On June 29, 2005, PPR carried out a €300 million bond issue, maturing on January 29, 2013 with a 4% coupon. This transaction was initiated as part of PPR’s EMTN (Euro Medium Term Note) programme.
• Gucci Group and Mr. Sergio Rossi announced on November 3, 2005 the end of Mr. Sergio Rossi and his family’s collaboration with the Sergio Rossi brand. This decision follows up from the agreements concluded between Mr. Sergio Rossi and Gucci Group in November 1999 and January 2004, when the Gucci Group’s stake in Sergio Rossi increased from 70% to 100%.

139 Reference document 2005
Subsequent events• Conforama announced on January 9, 2006 the takeover of Sodice Expansion Group, its main franchise holder, listed on the Eurolist
market (compartment B). This transaction involves the takeover of SAS du Parc, which holds 51.4% of the share capital of Sodice Expansion. Conforama already holds 31.98% of the share capital. This acquisition, which values the Sodice Expansion share at €150, will have a positive impact on Conforama net income from 2006. Following approval of this transaction by French competition authorities, a simplifi ed public offering will be launched for the remaining Sodice Expansion shares not held by Conforama at a price of €150 per share, in accordance with regulatory provisions.
• Revenue at the end of February:The Group reported a 6.9% increase in its business activities in the fi rst two months of 2006, in actual terms. This growth refl ects the Retail division’s healthy performance (up 4.2%) and the steady development of the Luxury Goods division (up 19.4%), mainly through the performances of Gucci and Bottega Veneta.
OutlookThe healthy performance of the Retail division and the continued strong growth of Luxury Goods over the fi rst two months of the fi scal year forecast a positive outlook for the Group in 2006.

140
Financial Information – Investment policy
PPR 141
Investment policy
In 2005, the Group concentrated on enhancing its Luxury Goods and Retail brand portfolio by boosting its organic growth capacities by being increasingly selective as regards its operating investments.
In 2004, PPR’s investment policy refl ected its strategic refocusing on Luxury Goods and Retail. This policy involving activities centred around specifi c customers was completed in 2004 as the Group divested all of its business-to-business activities, by selling Rexel and its residual stake in the consumer credit business and increasing its stake in the Gucci Group.
Financial investmentsSome terminology
The term “enterprise value” as used in this section represents the value of the sold company, including net fi nancial debt and securitisation of unconsolidated trade receivables.
The Group’s main fi nancial investments over the past two years are described below.
2005
Luxury Goods
In 2005, Gucci Group increased its stakes in Bottega Veneta and BEDAT & CO to 86.28% and 100%, respectively, under agreements previously entered into with the aim of buying out the minority interests held by third parties. The accounting principles for these commit-ments are described in note 2.9 to the consolidated fi nancial statements in the 2005 Reference Document.
In addition, Gucci Group and Mr. Sergio Rossi announced the end of Mr. Sergio Rossi and his family’s collaboration with the Sergio Rossi brand on November 3, 2005. Following this announcement, Mr. Sergio Rossi and his family no longer have any voting rights, dividend rights, or stock options.
Retail
On April 26, 2005, the Group sold its MobilePlanet subsidiary to eXpansys Holdings Limited for €2.1 million.
Credit and Financial Services
In the fi rst half of the year, the Group sold its remaining 9.69% stake in Facet to BNP Paribas for €87.2 million.
2004
Luxury Goods
Pinault-Printemps-Redoute’s acquisition of additional shares in Gucci Group
In accordance with the “Settlement and Stock Purchase Agreement” (SSPA) of September 9, 2001 between Pinault-Printemps-Redoute, Gucci Group NV and LVMH Moët Hennessy-Louis Vuitton SA, and the “Amended and Restated Strategic Investment Agreement” of September 10, 2001 between Gucci Group NV and Pinault-Printemps-Redoute, the Group launched an offer to purchase (“the Offer”) on April 1, 2004 for all of the outstanding ordinary shares of Gucci Group NV that the Group did not hold at that date, at a price of USD 85.52 per share.
When the Offer was completed on May 20, 2004, 34,906,084 Gucci shares had been tendered, bringing the Group’s stake in Gucci Group at that time to 99.39%, then to 99.41% as of December 31, 2004.

141 Reference document 2005
and outlook
Including the hedges described in note 23-2 to the consolidated fi nancial statements in the 2003 Reference Document, the cost of acquiring the shares tendered in response to the Offer was €2,459 million, excluding the cost of share purchases associated with the exercise of stock options. Including the latter, and after deducting the cash received upon exercise of the options, the total cost was €2,630 million.
On December 31, 2003, Gucci Group also held treasury shares in a total net amount of €206 million, for allocation to employee stock option plans. In accordance with its commitments, Pinault-Printemps-Redoute bought back these shares since the number of Gucci shares that had not been tendered at the expiry of the Offer was less than the highest of (i) 15% of Gucci Group shares issued at that time or (ii) 15 million Gucci Group shares.
Other Luxury Goods acquisitions
In 2004, Gucci Group acquired an additional 30% stake in Sergio Rossi SPA and Sergio Rossi International SARL for €41 million. The seller retains the voting and dividend rights to these shares until January 31, 2007 and also has an option to buy up to 28.5% of share capital at that time.
Retail
On July 1, 2004, Redcats signed an agreement to purchase the Scandinavian home shopping company Jotex, which is specialised in textiles. This is consistent with Redcats’ international expansion strategy and rounds out its product offering of household equipment. This agreement was based on an estimated enterprise value of €28.6 million.
In order to rationalize its real-estate portfolio, in the fi rst half of 2004 Conforama sold Conforama Investimenti SPA, which held some of Emmezeta’s property assets in Italy. This sale was made for €117 million.
Business-to-business
On December 10, 2004, the Group announced the signing of an agreement to sell its 73.45% stake in Rexel to the Ray Consortium, composed of Clayton, Dubilier & Rice, Eurazeo and Merrill Lynch Global Private Equity. Rexel is the world’s leading distributor of electrical parts and supplies. A price of €38.50 a share was agreed for this transaction, which includes the payment of an extraordinary dividend of €7.38 a share. Rexel’s enterprise value – which is the company’s value including net fi nancial debt and securitization of unconsolidated trade receivables – stands at €3.8 billion.
Credit and Financial Services
During the year, the Group sold its remaining 24.5% stake in its Credit and Financial Services division to Crédit Agricole SA for €636.7 million. This disposal was carried out in two steps, with 14.5% sold in March for €371.6 million and the remaining 10% sold in December for €265.1 million.
Pinault-Printemps-Redoute and Crédit Agricole also announced their agreement to ensure a long-term relationship between Finaref and Pinault-Printemps-Redoute.
Operating investmentsThe main objectives of the Group’s investment policy are to expand its store network, convert and renovate existing sales outlets, establish and maintain Luxury Goods production sites and Retail logistics centres and to develop information systems.
Over the past few years, the Group has instituted a targeted investment policy in order to enhance the image and the unique positioning of its brands and increase its return on investments. In the past two years, the Group has invested €781 million, of which €380 million in 2005 and €401 million in 2004.

142
Financial Information – Investment policy
PPR 143
International investments, the Group’s primary line of development, accounted for 52% of the total over the past two years, (52.2% in 2004 and 51.8% in 2005). It demonstrates the Group’s determination to leverage its know-how outside of France.
In 2005, Gucci Group invested €116 million, while pursuing its policy of opening, converting and renovating stores, representing 40.2% of its investments. In addition, 27.2% of investments were allocated to maintaining its logistics and information system tools so as to continue improving the supply chain.
After opening sixteen new stores in 2004, Gucci Group opened twenty-eight new stores worldwide, including eighteen for Bottega Veneta in 2005. In 2006, Gucci Group plans to increase its operating investments, particularly by creating around twenty new stores targeting high-potential areas and renovating and converting its existing network.
The Retail division has invested a total of €517 million over the past two years, of which €299 million were used for the opening and renovation, €115 million for maintenance (logistics and IT) and €103 million for other purposes. During this period, the Retail division focused on the conversion and renovation of its sales outlets, representing a total investment of €206 million.
Many stores were converted or renovated in the past two years, particularly by Conforama which continued to adapt its stores to its new visual identity and store layout. Fifty-seven stores have already been converted to the “new format” and an additional 20 stores will be converted in 2006. Printemps also continued and stepped up its store sales area renovation and reallocation program: between 2000 and 2005, almost all stores will have been renovated and modernised.
In 2006, the retail division’s companies plan to open more than twenty-fi ve stores.
The PPR Group also pursued the program launched in 2001 in order to optimise the management of its property assets. The aim of this policy is to allocate resources by constantly looking for the most effective means of fi nancing the expansion of its store network across its various markets and geographical areas.In the past two years, this policy has led to an additional €60 million debt reduction as a result of the sale of operating assets (€27 million in 2004 and €33 million in 2005).
Other investmentsPPR shares
In 2005, the Group sold 2,738,618 shares as follows:• 1,108,132 shares were sold in blocks between May 18 and June 10, 2005 through an independent market broker at an average price
of €81.058 per share;• 1,560,000 shares were sold on June 27, 2005 in an over-the-counter transaction at a price of €83.7 per share;• 195,000 shares were sold under the liquidity contract;• 124,514 shares were acquired following the exercise of PPR share purchase options set up to hedge share plans.
All these transactions resulted in the net collection of €225 million.
OutlookIn keeping with its strategy to develop both its Luxury Goods and Retail brands, the Group may perform programmed changes in scope of consolidation to supplement one or more of this activities.

143 Reference document 2005
Financial risksThe PPR Group has established a centralised structure for the management of liquidity, exchange rate and interest rate risks. The Group’s Financing and Treasury division, which reports to the Finance Department, is responsible for this team and has the necessary information systems and other resources. It deals in the various fi nancial markets with optimum effi ciency and security via PPR Finance SNC, which is dedicated to treasury and fi nancial management. This risk management organisation was moved to the Luxury Goods division after the completion of PPR’s public offer for Gucci Group NV in May 2004.
Counterparty risk
PPR minimises its exposure to counterparty risk by only dealing with high-rated companies and by spreading out its exposure among its various counterparties, up to their allocated amount. Counterparties to derivative transactions, which exclude any transactions of a speculative nature, require approval and are governed by limits and maturities that are reviewed on a regular basis. Counterparties must have a Standard & Poor’s rating of no less than “BBB” or the equivalent Moody’s rating.
Equity risk
In the normal course of its business, PPR only buys and sells equities related to its consolidated holdings and shares issued by PPR. PPR may trade in its own securities either directly or through derivatives in accordance with its share buyback program and with applicable regulations. PPR has also signed an agreement with a fi nancial intermediary to promote the liquidity of its shares and the stability of its share price. This agreement complies with the Ethics Charter defi ned by the AFEI, Association Française des Entreprises d’Investissement (the French Association of Investment Companies).
Currency risk
The Group’s policy is to hedge both committed currency risk exposure and that which is forecast to be highly probable. This mainly involves Retail imports and Luxury Goods exports.Currency risk management instructions and procedures are defi ned by the Executive Committee of each company and approved by PPR.Each company hedges its own currency risks in accordance with guidelines and procedures refl ecting its specifi c requirements.These procedures incorporate Group policies as defi ned by PPR:• PPR Finance SNC is the sole counterparty in currency transactions, unless there are any specifi c regulatory or operating constraints.• The amounts and maturities of all currency hedging transactions are backed by an underlying asset to prevent any speculative dealing.• All highly probable exposure is at least 85% hedged regarding budgeted exposure and 100% hedged in the case of fi rm commitments.• PPR has strictly limited the type of fi nancial instruments that may be used for hedging purposes.• Each company implements its own internal control system and conducts audits on a regular basis.PPR ensures that each company’s risk management policy is consistent with its underlying exposure, notably through a monthly currency reporting procedure.The Group also hedges currency risk on fi nancial assets and liabilities issued in foreign currencies by using currency swaps for refi nancing or by investing cash in euros or the local currency. The Group periodically conducts audits.PPR Finance SNC provides the control and administrative follow-up for all currency transactions on behalf of Group companies. Front-offi ce, middle-offi ce, back-offi ce and accounting tasks are separated to ensure security. PPR Finance SNC uses market-standard information systems and other resources to value currency instruments.
Interest rate risk
PPR manages interest rate risk on a consolidated basis, and allocates to Group consolidated net borrowings the breakdown between fi xed rates and fl oating rates (50% fl oating rate, 50% fi xed rate).
Risk management

144
Financial Information – Risk management
PPR 145
Interest rate risk is evaluated on the basis of current data and projections of consolidated net borrowings and the schedule of hedged positions and fi xed-rate issues. This enables interest-rate hedging in accordance with the Group’s target fi xed-to-fl oating rate ratio. Appropriate hedging products are set up through PPR Finance SNC, in close cooperation with PPR’s senior management. PPR mainly uses interest rate swaps in order to convert all or part of its fi xed-rate bonds and caps and collars to a fl oating rate in order to protect fl oating-rate fi nancing. PPR Finance SNC provides the control and administrative follow-up for all interest rate transactions on behalf of Group companies. Front-offi ce, middle-offi ce, back-offi ce and accounting tasks are separated to ensure security. PPR Finance SNC uses market-standard information systems and other resources to value fi xed-rate instruments.
Liquidity risk
PPR Finance SNC regularly assesses liquidity risk by closely monitoring Group and company fi nancial reporting procedures.Unused confi rmed credit lines as of December 31, 2005 totalled €4,913.1 million, compared with €3,218 million at the end of 2004. PPR also issued new bonds totalling €300 million and maturing in January 29, 2013 as part of its EMTN (Euro Medium Term Note) programme (see note 28.4 to the consolidated fi nancial statements) to extend the maturity of its debt and diversify its funding resources. In March 2005, PPR also set up a revolving syndicated credit facility of €2,750 million in order to refi nance the revolving syndicated credit facilities of €2,500 million and €715 million set up in October 2002 and May 2004, respectively. This new credit facility with a maturity of 5 years comprises two options to extend the maturity by one year , at the end of the fi rst and second years.PPR has an “A3” short-term credit rating from Standard & Poor’s and a “BBB-” long-term stable outlook rating.The Group’s bank loans and bonds are governed by the usual covenants, or pari passu ranking, a negative-pledge clause that limits the security that can be granted to other lenders and a cross-default obligation.Confi rmed credit lines are subject to a mandatory prepayment clause if the net fi nancial indebtedness/EBITDA ratio is not lower than or equal to 3.75 (see note 28.5 to the consolidated fi nancial statements). The ratio was 3.10 as of December 31, 2005 compared to 3.44 as of December 31, 2004.Public bond issues in the euro market are not governed by any fi nancial ratio obligation.All of these covenants were complied with at the end of 2005 and there is no foreseeable risk of breach.
Legal risksThe Group’s companies are involved in various lawsuits or disputes that have arisen in the normal course of business, including disputes with tax, social security or customs authorities. Provisions for contingencies and losses were recognised to cover the expenses that the Group’s companies and their legal advisers deem likely to arise from these disputes. According to the Group’s legal advisers, none of the disputes in which the Group’s companies are currently involved poses any threat to the Group’s normal business or development. All of these legal risks, including the impact of commitments relating to the disposal of controlling interests in companies, have been provided for in the Group’s consolidated fi nancial statements as of December 31, 2005. None of these risks have been qualifi ed as arising outside the scope of the normal course of business of the Group’s companies.
The Group believes that effective procedures and processes for identifying and managing its industrial and environmental risks at each of its relevant companies, and which rely on the professional advice of duly authorised external organisations and advisers, adequately satisfy, in terms of relevance and proportionality, prevailing professional and technical standards in the current applicable regulatory framework. An active prevention and safety policy is an integral part of these procedures and processes.
The Group owns the trademarks, patents or intellectual property (IP) rights which it exploits and there are no restrictions as to right of priority or use on all relevant markets, irrespective of the corporate names of the companies, the store brands or Group sales outlets, or irrespective of the product trademarks or services manufactured by the various Group entities. In connection with the Group’s trademark enhancement policy, this situation does not prohibit certain trademarks belonging to the Group from being licensed to third parties for the secondary distribution of related or accessory products and/or the Group from accepting to ensure the distribution of related or accessory products under trademark licensing agreements. In all cases, these licensing agreements have been entered into under fair commercial and fi nancial terms and conditions and have no impact on the ownership of the trademarks and signs belonging to the Group.

145 Reference document 2005
Regarding the warranties granted with respect to the disposal of Rexel to a consortium comprising Clayton, Dubilier & Rice, Eurazeo and Merrill Lynch Global Private Equity (the “Consortium”) and completed on March 16, 2005 pursuant to the public tender offer and takeover bid, PPR granted to the Consortium standard vendor warranties expiring on March 16, 2006. These warranties were capped at €50 million.
Regarding the warranties granted when the control of Guilbert SA was transferred to Offi ce Depot in May 2003, PPR granted standard vendor warranties for a period of two years, excluding tax-related warranties for a period equal to the applicable statute of limitations.
Regarding the warranties granted in 2003 when the control of Pinault Bois & Matériaux was transferred to the Wolseley Group in June 2003, Saprodis granted a general vendor warranty on the assets and liabilities that expired in June 2005.
Regarding the disposals which took place in 2002, none of which triggered any signifi cant implementation of the relevant warranties, it should be noted that:• a two-year vendor warranty capped at €85 million was granted to the Staples Group in October 2002 pursuant to the disposal of
the Group’s interest in Guilbert’s home shopping business;• no vendor warranties on the assets and liabilities were granted with respect to the disposal of Facet to Cetelem in December 2002;• standard net asset warranties capped at 20% of the selling price and expiring in April 2005 were granted with respect to the disposal
of 61% of the capital and voting rights of Finaref and Finaref Nordic to Crédit Agricole in December 2002. No additional warranties were granted with respect to the disposal of additional interests (14.5% in December 2003, 14.5% in March 2004 and 10% in December 2004).
Regarding laws or regulations applicable to the Group’s activities, it should be noted that none of its businesses are governed by any particular rules or requirements on any of the relevant markets. The Group’s businesses are governed by the same constraints and regulations as those directly applicable to the companies with which it competes on the relevant markets.
To the best of our knowledge, no foreseeable change in the legal or regulatory framework is likely to have any impact on the above.
Insurance riskPPR’s Insurance Division is responsible for identifying risks, quantifying the consequences thereof and reducing them:
- either by recommending preventive measures for risks that can be eliminated or reduced in that manner,- or by using fi nancing terms and conditions, in particular by transferring to the insurance market sudden and accidental risk with
potential severe consequences.
This Division reports directly to the PPR Corporate Secretary. It depends on each Group company, which is responsible for providing the necessary information to identify and quantify the risks and employ the appropriate means to ensure business continuity in the event of a claim.
On this basis, the Group’s Insurance Division negotiates with the major players in the insurance and reinsurance industry to provide the most appropriate coverage for insurable risks.
Risk Prevention
A decentralized policy of prevention, precaution and risk protection in accordance with PPR regulations applied to the Group’s companies, aimed at identifying, evaluating and reducing exposure to, as well as the occurrence and the intensity of losses, based on:
- an audit of the main operating sites,- an appraisal of risk values,- following the recommendations of security professionals,- internal control procedures,- staff training,- introducing appropriate emergency plans.
An inter-company task force (Risk Prevention Network) brings together professionals in protection and risk prevention from each company to design and introduce common standards for the most signifi cant risks.
(1) The main consolidated companies are Gucci Group, Printemps, Redcats, Fnac, Conforama and CFAO, collectively “the Subsidiaries” and each “Subsidiary”.

146
Financial Information – Risk management
PPR 147
Insurance
A policy of transferring signifi cant risks to insurance companies, determined by:- achieving the right fi nancial mix for the Group’s risk coverage, premiums and self-insurance insurance,- availability of insurance capacities, insurance market constraints and local regulations.
Coverage based on the “All risks except” approach, which is determined based on an assessment of the fi nancial consequences for the company of possible claims, especially in the area of :
- civil liability: bodily or property damage to third parties because of products, furniture and equipment installation,- fi re, explosions, water damage, etc.,- operating losses following direct damage.
The purchase of insurance coverage is based on the determination by site and company of a “reasonably estimated” potential occurrence of diverse risks (liability and damages). This estimate takes into account the analysis made by insurers as underwriters of PPR risks.
The insurance schemes now in force in the Group, which centralizes the purchase of insurance policies such as fi re, accident and diverse risks (IARD) for all subsidiaries, were taken out with the assistance of internationally recognized insurance brokers specialized in covering major risks, with reputable insurers in the industrial risk insurance sector.
Main existing insurance programs:
• property damage from fi re, explosion, fl oods, machine breakage, natural disasters to its own property : property/furnishings/equipment/ merchandise/IT installations, and to property for which it is responsible, as well as any resulting operating losses, for any period deemed necessary for normal business activities to resume,
• damage and loss of equipment, merchandise and/or goods in transport,
• insurance for damages resulting from theft, fraud, embezzlement, or act of malice to valuable assets, data and/or property,
• bodily or property damage after construction operations (new construction, renovation, rehabilitation, etc.) conducted as project owners (maîtres d’ouvrage),
• liability for bodily or property damage to third parties by motorised vehicles belonging to the different companies,
• responsibility under general and environmental civil liability for the “operating risk” and “post-delivery risk” and “risk after services rendered,” due to damages caused to third parties in the course of its business.
Other insurance contracts are taken out by the Group companies for specifi c risks or to take local constraints into consideration.
Uninsured risks are exposures for which there is no insurance coverage offered on the insurance market or insurance offers at unattractive prices compared to the advantage brought by the potential insurance coverage. This was the case in 2004 and 2005 for “terrorism coverage” in countries where there are no local schemes for insurance. In 2006 insurance offers for terrorism cover are more reasonable and we mana-ged to buy some policies for the Group.
PPR group handles insurable risks according to the state of the art and scientifi c knowledge allowing forecast on potential risks in a comparable way with other French or foreign industrial groups with same types of exposures. This is one of the reasons why we are able to place our risks with insurers ready to deal with the sudden and the accidental consequences of our activities.

147 Reference document 2005
Overall the amount of coverage for the main potential risks of the Group as a whole as of January 1, 2006, is shown below:
• Damage from fi re, explosions and water damage and resulting operating losses: .......................................................... €800 million
• General civil liability: ...................................................................................................................................................... €115 million
• Damage and loss of goods in transport: .......................................................................................................................... €15 million
• Damage from fraud and acts of malice to goods and valuable assets: ............................................................................ €20 million
Total “Cost of Risks” for PPR includes three main items (in addition to physical protection and prevention investments):
• Cost of deductibles and non-insured losses retained or self fi nanced by each entity: €4 million in 2005.
• Self-insured losses fi nanced by the Group through its internal reinsurance company: Printemps Reassurance: €3.5 million in 2005.
Taking out this reinsurance through a Group subsidiary reduces insurance costs and enhances performance because frequent risks are pooled within the Group and insured for an amount that is capped annually,
• Insurance premiums and associated costs and expenses including engineering and brokers fees, taxes: fi nal budget for 2005 amounts to ................................................................................................. €27.5 million.
In 2006 it amounts to around €26.9 million and as for the previous years, there will be additional premiums to be paid in case of new developments or an increase in activity volumes of during the year.
Specifi c additional insurance may also be bought by some entities in the Group to cover their own exposures or as a result of local specifi c requirements (accident at work, natural events contributions…).
Employee-related and environmental risksSee Corporate Social Responsibility (CSR) chapter from page 68 to page 119.

148
Financial Information – Consolidated fi nancial statements
PPR 149
The 2004 comparative information presented in this document was restated to comply with the IFRS in effect on the date the fi nancial statements were prepared.
Consolidated income statementFor the years ended December 31, 2005 and 2004
(in € million) Notes 2005 2004 (1)
CONTINUING OPERATIONS
Revenue 6 17,765.7 17,531.4
Cost of sales (10,032.1) (9,809.2)
Gross profi t 7,733.6 7,722.2
Payroll expenses 7-8 (2,661.9) (2,613.3)
Other recurring operating income and expenses (3,987.6) (4,023.0)
Recurring operating income (loss) 9 1,084.1 1,085.9
Other non-recurring operating income and expenses 10 (10.0) 105.7
Operating income 1,074.1 1,191.6
Finance costs 11 (311.6) (298.9)
Income before taxes 762.5 892.7
Income taxes 12 (192.2) (318.9)
Share in earnings of associates 3.4 14.4
Net income from continuing operations 573.7 588.2
o/w attributable to equity holders of the parent 535.4 528.9
o/w attributable to minority interests 38.3 59.3
DISCONTINUED OPERATIONS
Net income from discontinued operations 13 588.6
o/w attributable to equity holders of the parent 536.2
o/w attributable to minority interests 52.4
Net income of consolidated companies 573.7 1,176.8
o/w attributable to equity holders of the parent 535.4 1,065.1
o/w attributable to minority interests 38.3 111.7
Net income attributable to equity holders of the parent 2.18 535.4 1,065.1
Earnings per share (in €) 14.1 4.50 8.92
Fully diluted earnings per share (in €) 14.1 4.39 8.19
Net income from continuing operations attributable to equity holders of the parent 2.18 535.4 528.9
Earnings per share (in €) 14.1 4.50 4.43
Fully diluted earnings per share (in €) 14.1 4.39 4.19
Net income from continuing operations excluding non-recurring items attributable to equity holders of the parent
2.18 539.0 552.0
Earnings per share (in €) 14.2 4.53 4.62
Fully diluted earnings per share (in €) 14.2 4.42 4.36
(1) Figures restated according to IFRS, excluding IAS 32/39.
Consolidated fi nancial statements for

149 Reference document 2005
the year ended December 31, 2005
Consolidated balance sheetAs of December 31, 2005 and 2004
ASSETS(in € million) Notes 2005 2004 (1)
Goodwill 15 5,545.9 5,396.6 Other intangible assets 16 6,605.0 6,618.4 Property, plant and equipment 17 2,538.7 2,623.5 Investments in associates 19 44.0 46.9 Other non-current fi nancial assets 20 240.8 241.2 Deferred tax assets 12.2 585.6 425.7 Other non-current assets 11.6 14.4 Non-current assets 15,571.6 15,366.7 Inventories 21 2,827.2 2,632.6 Trade receivables 22 1,125.6 1,052.5 Customer loans 22 416.6 419.1 Current tax receivables 12.2 52.0 46.2 Other current fi nancial assets 23 50.1 146.5 Other current assets 22 1,147.3 1,225.5 Short-term receivables on divestments 24 2,181.8 Cash and cash equivalents 24 1,813.2 2,106.3 Current assets 7,432.0 9,810.5 Assets classifi ed as held for sale 13Total assets 23,003.6 25,177.2
LIABILITIES AND SHAREHOLDERS’ EQUITY(in € million) Notes 2005 2004 (1)
Shareholders’ equityShare capital 25 481.8 489.7 Capital reserves 2,011.7 2,165.6 Treasury shares (13.8) (51.6)Cumulative translation adjustments 78.6 (74.1)Remeasurement of fi nancial instruments (30.4)Other reserves 5,457.4 5,250.8
Shareholders’ equity attributable to equity holders of the parent 25 7,985.3 7,780.4 Shareholders’ equity attributable to minority interests 148.8 238.8 Shareholders’ equity 25 8,134.1 8,019.2
Long-term borrowings 28 4,398.9 6,103.2 Other non-current fi nancial liabilities 29 1.8 Provisions for retirement and similar benefi ts 26 266.1 233.3 Provisions 27 142.7 164.8 Deferred tax liabilities 12.2 1,965.3 1,859.7
Non-current liabilities 6,774.8 8,361.0 Short-term borrowings 28 2,064.2 2,910.2 Financing of customer loans 28 416.6 419.1 Other current fi nancial liabilities 29 19.5 11.2 Trade payables 22 2,758.1 2,643.8 Provisions for retirement and similar benefi ts 26 13.3 14.2 Provisions 27 85.0 183.5 Current tax liabilities 12.2 355.7 266.6 Other current liabilities 22 2,382.3 2,348.4
Current liabilities 8,094.7 8,797.0 Liabilities associated with assets classifi ed as held for sale 13Total liabilities and shareholders’ equity 23,003.6 25,177.2
(1) Figures restated according to IFRS, excluding IAS 32/39.

150
Financial Information – Consolidated fi nancial statements
PPR 151
Consolidated cash fl ow statementAs of December 31, 2005 and 2004
(in € million) Notes 2005 2004 (1)
Net income from continuing operations 573.7 588.2
Net recurring charges to depreciation, amortisation and provisions on non-current operating assets
393.5 411.3
Other non-cash income and expenses (20.3) 10.4
Cash fl ow from operating activities 32.1 946.9 1,009.9
Interest paid/received 228.4 263.7
Dividends received (15.1) (26.7)
Net income tax payable 210.7 150.6
Cash fl ow from operating activities before tax, dividends and interest 1,370.9 1,397.5
Change in working capital requirement 63.9 1.0
Change in customer loans 8.3 28.6
Income tax paid (141.9) (204.7)
Net cash from operating activities 1,301.2 1,222.4
Purchases of property, plant and equipment and intangible assets 32.2 (379.5) (401.1)
Proceeds from sale of property, plant and equipment and intangible assets 32.2 33.2 26.4
Acquisitions of subsidiaries, net of cash acquired (68.6) (2,688.0)
Proceeds from disposal of subsidiaries net of cash transferred 3.1 2,338.7
Purchases of other fi nancial assets (18.6) (234.8)
Proceeds from sale of other fi nancial assets 102.7 158.5
Interest and dividends received 48.0 60.0
Net cash used in investing activities (279.7) (740.3)
Share capital increase/decrease 1.8 (0.2)
Treasury share transactions 25 185.5 100.4
Dividends paid to parent company shareholders (299.3) (278.9)
Dividends paid to minority interests (27.0) (19.9)
Bond issues 28 621.1 1,343.5
Bond redemptions 28 (865.2) (1,507.9)
Increase (decrease) in other borrowings 28 (2,691.3) 1,466.5
Interest paid and equivalent (227.5) (319.6)
Net cash from (used in) fi nancing activities (3,301.9) 783.9
Net cash fl ow from assets classifi ed as held for sale 17.1
Impact of exchange rate variations 13.3 38.7
Net increase (decrease) in cash and cash equivalents (2,267.1) 1,321.8
Cash and cash equivalents at beginning of the year (2) 3,607.4 2,722.9
Cash and cash equivalents at end of the year 1,340.3 4,044.7
(1) Figures restated according to IFRS.(2) Cash and cash equivalents at the beginning of fi scal year 2005 of €3,607.4 million corresponds to cash and cash equivalents at the close of fi scal year 2004 adjusted for the impact of the
application of IAS 32 and 39 as of January 1, 2005 in the amount of €437.3 million.
As of December 31, 2004, “Net increase in cash and cash equivalents” and “Cash and cash equivalents at the end of the year” include short-term receivables on divestments of €2181.8 million (note 24).

151 Reference document 2005
Consolidated statement of change in shareholders’ equity
(Before appropriation of net income) Number of shares
outstanding (1)
Share capital
Capital reserves
Treasury shares
Cumulative translation
adjustments
Remeasurement of fi nancial instruments
Other reserves and net income attrib. to equity
holders of the parent
Shareholders’ equity
(in € million)
Equity holders
of the parent
Minority interest
Total
As of January 1, 2004 120,802,365 489.6 2,164.3 (273.5) 4,585.0 6,965.4 2,964.7 9,930.1
Cash fl ow hedges (2)
Currency translation adjustments (74.1) (74.1) (0.2) (74.3)
Actuarial gains/losses (2) (14.5) (14.5) (14.5)
Other fi nancial instruments (2)
Gains and losses recognised directly in shareholders’ equity
(74.1) (14.5) (88.6) (0.2) (88.8)
2004 net income 1,065.1 1,065.1 111.7 1,176.8
Total gains and losses recognised
(74.1) 1,050.6 976.5 111.5 1,088.0
Share capital increase/decrease 27,500 0.1 1.3 1.4 1.4
Treasury shares 1,300,000 221.9 (113.0) 108.9 108.9
Valuation of share option programmes
7.1 7.1 7.1
Dividends paid (278.9) (278.9) (29.9) (308.8)
Changes in Group structure (2,807.5) (2,807.5)
Other adjustments
As of December 31, 2004 122,129,865 489.7 2,165.6 (51.6) (74.1) 5,250.8 7,780.4 238.8 8,019.2
Application of IAS 32/39 (4,583,517) (509.4) 26.7 149.9 (332.8) (67.3) (400.1)
As of January 1, 2005 117,546,348 489.7 2,165.6 (561.0) (74.1) 26.7 5,400.7 7,447.6 171.5 7,619.1
Cash fl ow hedges (2) (31.7) (31.7) (0.4) (32.1)
Currency translation adjustments 152.7 152.7 1.0 153.7
Actuarial gains/losses (2) (13.0) (13.0) (13.0)
Other fi nancial instruments (2) (25.4) (25.4) (25.4)
Gains and losses recognised directly in shareholders’ equity
152.7 (57.1) (13.0) 82.6 0.6 83.2
2005 net income 535.4 535.4 38.3 573.7
Total gains and losses recognised
152.7 (57.1) 522.4 618.0 38.9 656.9
Share capital increase/decrease (1,986,250) (7.9) (153.9) (161.8) (161.8)
Treasury shares 4,738,618 547.2 (171.1) 376.1 376.1
Valuation of share option programmes
4.7 4.7 4.7
Dividends paid (299.3) (299.3) (26.7) (326.0)
Changes in Group structure (34.9) (34.9)
Other changes
As of December 31, 2005 (3) 120,298,716 481.8 2,011.7 (13.8) 78.6 (30.4) 5,457.4 7,985.3 148.8 8,134.1
(1) Par value of shares set at €4 pursuant to the Management Board decision of August 30, 2001.(2) Net of tax.(3) Number of shares outstanding as of December 31, 2005: 120,448,230.

152PPR 153
1. Introduction .....................................................................................................................................1542. Accounting policies and methods ..................................................................................................154
2.1. Basis of preparation of the consolidated fi nancial statements ...................................................1552.2 Consolidation principles ...........................................................................................................1552.3. Foreign currency translation .....................................................................................................1562.4. Goodwill ...................................................................................................................................1572.5. Other intangible assets .............................................................................................................1572.6. Property, plant and equipment .................................................................................................1582.7. Impairment of assets ................................................................................................................1582.8. Inventories ...............................................................................................................................1592.9. Financial assets and liabilities ...................................................................................................1592.10. Other current assets and liabilities ............................................................................................1622.11. Treasury shares ........................................................................................................................1622.12. Share-based payments ............................................................................................................1622.13. Treasury share options .............................................................................................................1632.14. Income tax ...............................................................................................................................1632.15. Provisions ................................................................................................................................1632.16. Employee benefi ts ....................................................................................................................1632.17. Revenue recognition ................................................................................................................1642.18. Earnings per share ...................................................................................................................1642.19. Non-current assets (and disposal groups) held for sale ............................................................1652.20. Segment reporting ...................................................................................................................1652.21. Financial information presentation ............................................................................................165
3. Scope of consolidation ...................................................................................................................1663.1. Changes in Group structure .....................................................................................................1663.2. Other changes in consolidation scope .....................................................................................166
4. Highlights .........................................................................................................................................1664.1. Treasury share transactions ......................................................................................................1664.2. Pro forma fi gures ......................................................................................................................166
5. Segment reporting ..........................................................................................................................1695.1. Information by brand ................................................................................................................1705.2. Information by geographical area .............................................................................................1725.3. Reconciliation of segment assets and liabilities ........................................................................172
6. Revenue ...........................................................................................................................................1737. Payroll expenses .............................................................................................................................1748. Share-based payments ...................................................................................................................175
8.1. Equity-settled share-based payment transactions ....................................................................1768.2. Cash-settled share-based payment transactions ......................................................................178
9. Recurring operating income ...........................................................................................................17910. Other non-recurring operating income and expenses ...................................................................18011. Finance costs ..................................................................................................................................18012. Income taxes ...................................................................................................................................181
12.1. Analysis of the income tax expense in respect of continuing operations ...................................18112.2. Movements in balance sheet headings .....................................................................................18212.3. Deferred tax not recognised .....................................................................................................183
13. Assets classifi ed as held for sale ...................................................................................................18414. Earnings per share ..........................................................................................................................185
14.1. Earnings per share ...................................................................................................................18514.2. Earnings per share from continuing operations excluding non-recurring items ..........................187
15. Goodwill ...........................................................................................................................................18816. Other intangible assets ...................................................................................................................18817. Property, plant and equipment .......................................................................................................19018. Impairment losses ...........................................................................................................................19119. Investments in associates ...............................................................................................................191
Notes to the consolidated fi nancial statements

Les activités du Groupe
153 Reference document 2005
for the year ended December 31, 2005
20. Non-current fi nancial assets ...........................................................................................................19121. Inventories .......................................................................................................................................19222. Other current assets and liabilities .................................................................................................19223. Other current fi nancial assets .........................................................................................................19224. Cash and cash equivalents .............................................................................................................193
24.1. Breakdown by category ...........................................................................................................19324.2. Breakdown by currency ...........................................................................................................193
25. Shareholders’ equity .......................................................................................................................19325.1. Treasury share transactions ......................................................................................................19325.2. Appropriation of 2005 net income ............................................................................................194
26. Employee benefi ts and equivalent .................................................................................................19426.1. Change during the year .............................................................................................................19526.2. Charge recognised in the Income Statement .............................................................................19626.3. Actuarial assumptions ...............................................................................................................196
27. Provisions ........................................................................................................................................19728. Borrowings .......................................................................................................................................198
28.1. Breakdown of borrowings by maturity ......................................................................................19828.2. Breakdown by repayment currency ..........................................................................................20028.3. Breakdown of gross borrowing by category .............................................................................20028.4. Bond issues .............................................................................................................................20128.5. Main long- and medium-term borrowings and confi rmed lines of credit ....................................20228.6. Commercial paper ...................................................................................................................204
29. Exposure to foreign exchange, interest rate and equity risk .........................................................20429.1. Exposure to interest rate risk ....................................................................................................20429.2. Exposure to foreign exchange risk ............................................................................................20929.3. Exposure to equity risk .............................................................................................................21029.4. Other market risks – Credit risk ................................................................................................21129.5. Derivative instruments at market value .....................................................................................211
30. Net fi nancial indebtedness .............................................................................................................21231. Market value of fi nancial instruments .............................................................................................21332. Cash fl ow statement .......................................................................................................................214
32.1. Cash fl ow from operating activities ...........................................................................................21432.2. Purchases and sales of property, plant and equipment and intangible assets ...........................214
33. Contingent liabilities, contractual commitments not recognised and risks .................................21433.1. Mandatory withdrawal of Gucci shares .....................................................................................21433.2. Commitments given and received following sales .....................................................................21433.3. Other commitments given ........................................................................................................21633.4. Group dependence on patents, licenses and supply contracts .................................................21733.5. Claims and litigation .................................................................................................................218
34. Transactions with related parties ....................................................................................................21834.1. Party controlling the Group .......................................................................................................21834.2. Associates ...............................................................................................................................21834.3. Management compensation .....................................................................................................218
35. Subsequent events ..........................................................................................................................21936. Transition to IFRS ............................................................................................................................219
36.1. Group choices for the fi rst-time adoption of international standards .........................................21936.2. Reconciliation of French GAAP and IFRS fi nancial statements ..................................................21936.3. Nature of IFRS restatements and reclassifi cations ....................................................................22836.4. Reconciliation of the 2004 consolidated fi nancial statements under IFRS with previously published versions ............................................................................................235
37. List of consolidated subsidiaries as of December 31, 2005 .........................................................237

154
Financial Information – Consolidated fi nancial statements
PPR 155
1. Introduction
The consolidated fi nancial statements for the year ended December 31, 2005 refl ect the accounting position of PPR and its subsidiaries, together with its interests in associates and joint ventures.
The Board of Directors approved the consolidated fi nancial statements for the year ended December 31, 2005 and authorized their pu-blication on March 8, 2006. These consolidated fi nancial statements will become defi nitive following their adoption by the Annual General Shareholders’ Meeting of May 23, 2006.
2. Accounting policies and methods
General principles
Pursuant to European regulation No.1606/2002 of July 19, 2002, the PPR consolidated fi nancial statements for the year ended Decem-ber 31, 2005 were prepared in accordance with the applicable international accounting standards adopted by the European Union as of that date. The international standards comprise the International Financial Reporting Standards (IFRS), the International Accounting Standards (IAS), and the interpretations of the Standing Interpretations Committee (SIC) and the International Financial Reporting Inter-pretations Committee (IFRIC).
IFRS transition (IFRS 1)
The 2004 comparative fi nancial information has been prepared in accordance with the IFRS applicable on the date the 2005 consolidated fi nancial statements were drawn up and in compliance with IFRS 1 on fi rst–time adoption of IFRS, with the exception of IAS 32 – Financial Instruments: Disclosure and Presentation and IAS 39 – Financial Instruments: Recognition and Measurement, which were applied by the Group prospectively from January 1, 2005.
The impacts of this change in accounting basis are reported in the reconciliation tables presented in note 36.2. Specifi cally:• as of January 1, 2004: a reconciliation note on the French GAAP and IFRS opening balance sheet and shareholders’ equity;• as of December 31, 2004: a reconciliation note on the balance sheet, shareholders’ equity, and the income and cash fl ow statements,
for the comparison of the French GAAP and IFRS annual fi nancial statements;• as of January 1, 2005: a note on the fi rst-time adoption of IAS 32 and IAS 39 on fi nancial instruments. The impact of this change in
method was recognised in shareholders’ equity as of January 1, 2005 and is described in note 36.3.3. Insofar as the application of these standards is prospective, the information provided for fi scal year 2004 is not comparable.
The 2004 consolidated fi nancial statements restated according to IFRS, as published in this report, may present non-material differences from preceding publications. Differences concerning the opening balance sheet and the fi nancial statements for the year ended Decem-ber 31, 2004 are presented in note 36.4.
Adopted IFRS base
The fi nancial statements do not take into account: • new standards and amendments to existing standards not yet approved by the European Accounting Regulation Committee, or draft
standards that are still at the exposure draft stage with the International Accounting Standards Board (IASB);• standards published by the IASB and adopted at European level, but with an application date post December 31, 2005. This notably
concerns IFRS 7 on fi nancial instrument disclosures. The Group has also opted for the early adoption of the following standards as of January 1, 2004:• IFRS 5 - Non-current assets held for sale and discontinued operations, mandatory from January 1, 2005;• IFRS 2 - Share-based payment for share option plans issued subsequent to November 7, 2002;• Amendment to IAS 19 – Employee benefi ts, on the recognition in shareholders’ equity of actuarial gains and losses arising on defi ned-
benefi t pension plans.

155 Reference document 2005
2.1. Basis of preparation of the consolidated fi nancial statements
Valuation bases
The consolidated fi nancial statements are prepared in accordance with the historical cost convention, with the exception of certain assets and liabilities recorded in accordance with IFRS. The asset and liability categories concerned are detailed, where appropriate, in the corresponding notes below.
Non-current assets and disposal groups held for sale are valued at the lower of net carrying amount and fair value less costs to sell.
Use of estimates
The preparation of consolidated fi nancial statements implies the consideration of estimates and assumptions by Group management that can affect the carrying amount of certain assets and liabilities, income and expenses, and the information disclosed in the notes to the fi nancial statements. Group management reviews these estimates and assumptions on a regular basis to ensure their pertinence with respect to past experience and the current economic situation. Items in future fi nancial statements could differ from current estimates as a result of changes in these assumptions.
The main estimates made by management in the preparation of the fi nancial statements concern the valuation and the useful life of operating assets, intangible assets, property, plant and equipment and goodwill, the amount of contingency provisions and other provisions relating to operations, and assumptions underlying the calculation of pension obligations and deferred tax balances.
The main assumptions made by the Group are detailed in the appropriate notes to the fi nancial statements.
2.2. Consolidation principles
The consolidation is based on fi nancial statements (or interim fi nancial statements) drawn up for a 12-month period ended December 31, 2005 for all Group companies.
As of December 31, 2004, the fi nancial statements were consolidated based on accounts for a 12-month period, with the exception of the Luxury Goods Division, consolidated based on accounts for a 14-month period ended December 31, following the decision to har-monize the year-end of all Group companies. Pro forma comparative data has been prepared for fi scal year 2004 in order to ensure the comparability of consolidation periods (note 4.2).
The consolidated fi nancial statements include the fi nancial statements of companies acquired as from the date of acquisition and com-panies sold up until the date of disposal.
Subsidiaries
Subsidiaries are all entities (including special-purpose entities) over which the Group exercises control. Control is defi ned as the ability to govern, directly or indirectly, the fi nancial and operating policies of an entity in order to obtain the benefi t of its activities. This situation is generally accompanied by the holding, directly or indirectly, of more than 50% of voting rights. The existence and impact of potential voting rights that are exercisable or convertible are taken into account in the assessment of control.
Subsidiaries are fully consolidated from the effective date of control.
Material inter-company assets and liabilities and transactions between fully consolidated companies are eliminated. Gains and losses on internal transactions with controlled companies are fully eliminated.
Accounting policies and methods are modifi ed where necessary to ensure consistency of accounting treatment at Group level.
Business combinations
Business combinations, where the Group acquires control of one or more other activities, are recognised using the purchase method.
The purchase cost is measured at the fair value, at the date of exchange, of the assets given, liabilities incurred or assumed, and equity instruments issued plus any costs directly attributable to the acquisition. The identifi able assets, liabilities and contingent liabilities of the acquired entity are measured at their fair value on the date of acquisition, including the minority interest share.

156
Financial Information – Consolidated fi nancial statements
PPR 157
The excess of the cost of the acquisition over the Group’s interest in the net fair value of the identifi able assets, liabilities and contingent liabilities of the acquired entity is recognised as goodwill. If the purchase cost is less than the Group’s interest in the net assets of the subsidiary acquired measured at fair value, the difference is recognised directly in net income for the period.
Associates
Associates are all entities in which the Group exercises a signifi cant infl uence over management and the fi nancial policy, without exercising control, and generally holds 20 to 50% of the voting rights.
Associates are recognised using the equity method and initially measured at cost. Subsequently, the share in profi ts or losses of the associate attributable to equity holders of the parent is recognised in net income and the change in equity attributable to equity holders of the parent is recognised in equity. Should the Group share in the losses of an associate equal or exceed the Group’s investment in the associate, the Group shall cease to recognise its share of losses, unless it has legal or constructive obligations to make payments on behalf of the associate.
Goodwill related to an associate is included in the carrying amount of the investment.
Gains or losses on internal transactions with equity associates are eliminated in the amount of the Group’s investment in these companies.
The accounting policies and methods of associates are modifi ed where necessary to ensure consistency of accounting treatment at Group level.
Joint ventures
In the event of joint control, which exists pursuant to the contractually agreed sharing of control over an economic activity, and when the strategic, fi nancial and operating decisions relating to the activity require the unanimous consent of the parties sharing control, the Group’s stake in the joint venture is recognised using the equity method.
Consolidation of consumer credit businesses
Exclusively controlled consumer credit companies are fully consolidated. These companies essentially fi nance sales of consumer goods within the Retail Division. Sales fi nancing revenue is presented in revenue, while sales fi nancing costs are considered as operating items classifi ed in recurring operating income. The asset and liability headings of these businesses have been allocated according to their nature to special headings of the Group consolidated balance sheet, with a distinction as to the asset and liability side of consumer loan fi nancing.
The consumer credit business contribution is included in Retail in the table presenting information by division. It does not represent a separate activity in accordance with IAS 14 – Segment reporting, criteria.
2.3. Foreign currency translation
Functional and presentation currency
Items included in the fi nancial statements of each Group entity are valued using the currency of the primary economic environment in which the entity operates (functional currency). The Group consolidated fi nancial statements are presented in euros, which serves as both the functional and presentation currency.
Foreign currency transactions
Transactions denominated in foreign currencies are recognised in the entity’s functional currency at the exchange rate prevailing on the transaction date. Monetary items in foreign currencies are translated at each balance sheet date using the closing rate. Translation adjustments arising from the settlement of the items are recognised in income or expenses of the period.
Non-monetary items in foreign currencies valued at historical cost are translated at the rate prevailing on the transaction date, and non-monetary items in foreign currencies valued at fair value are translated at the rate prevailing on the date the fair value is determined. When a gain or loss on a non-monetary item is recognised directly in equity, the foreign exchange component is also recognised in equity. Otherwise, the component is recognised in income or expenses of the period.

157 Reference document 2005
Translation of the fi nancial statements of foreign subsidiaries
The results and fi nancial statements of Group entities with a functional currency that differs from the presentation currency are translated into euros as follows:• balance sheet items other than shareholders’ equity are translated at the period-end exchange rate;• income and cash fl ow statement items are translated at the average rate for the year;• differences are recognised in consolidated shareholders’ equity under Cumulative translation adjustments, and notably differences on
foreign currency borrowings used to hedge foreign currency investments and on permanent advances to foreign subsidiaries.
The goodwill and fair value adjustments arising from a business combination with a foreign activity are recognised in the functional currency of the entity acquired. They are then translated at the closing exchange rate into the Group’s presentation currency, and the resulting differences transferred to consolidated shareholders’ equity.
Net investment in a foreign subsidiary
Foreign exchange gains or losses arising on the translation of a net investment in a foreign subsidiary are recognised in the consolidated fi nancial statements as a separate component of shareholders’ equity and in income on disposal of the net investment.Foreign exchange gains or losses in respect of foreign currency borrowings hedging foreign currency investments or permanent advances to subsidiaries are also recognised in consolidated shareholders’ equity and in income on disposal of the net investment.
2.4. Goodwill
Goodwill represents the excess of the cost of a business combination over the acquirer’s interest in the net fair value of the identifi able assets, liabilities and contingent liabilities on the date of acquisition. Goodwill is allocated as of the acquisition date to cash generating units (CGU) defi ned by the Group based on the characteristics of the core business, market or geographical segment of each brand. The CGUs are subject to annual impairment tests during the second half of the fi scal year or when events or circumstances indicate an impairment loss is likely.
Any impairment losses are recorded in “Other non-recurring operating income and expenses” in the consolidated income statement as part of operating income.
2.5. Other intangible assets
Software acquired as part of recurring operations is usually amortised over a period not exceeding 12 months.
Software developed by the Group and meeting all the criteria of IAS 38 is capitalised and amortised over its useful life, which is generally between 3 and 10 years.
Intangible assets acquired as part of a business combination, which are controlled by the Group and can be measured reliably, and which are separable or arise from contractual or other legal rights, are recognised separately from goodwill. These assets, in the same way as intangible assets acquired separately, are amortised over their useful life where this is fi nite and written down if their value in use is less than the net carrying amount. Indefi nite life intangible assets are not amortised but are subject to systematic annual impairment tests or more frequent tests where there is indication that an impairment loss is likely.
Brands representing a preponderant category of the Group’s assets are recognised separately from goodwill when they meet the criteria imposed by IAS 38. Recognition and durability criteria are then taken into account to assess the useful life of the brand.A brand representing an intangible asset with an indefi nite useful life is not amortised but is subject to a systematic annual impairment test or more frequent tests where there is indication that an impairment loss is likely. A brand representing an intangible asset with a fi nite useful life is amortised on a straight-line basis over its useful life, not exceeding 20 years.
Any impairment losses recognised at the time of impairment tests is recorded in the income statement under “Other non-recurring ope-rating income and expenses” as part of Group operating income.

158
Financial Information – Consolidated fi nancial statements
PPR 159
2.6. Property, plant and equipment
Property, plant and equipment are recognised at cost less accumulated depreciation and impairment losses with the exception of land, which is presented at cost less impairment losses. The various components of property, plant and equipment are recognised separately when their estimated useful life and therefore their depreciation periods are signifi cantly different. The cost of an asset includes the ex-penses that are directly attributable to its acquisition.
Subsequent costs are included in the carrying amount of the asset or recognised as a separate component, where necessary, if it is probable that future economic benefi ts will fl ow to the Group and the cost of the asset can be reliably measured. All other repair and maintenance costs are expensed in the year they are incurred except for expenses incurred for an increase in productivity or the extension of an asset’s useful life, which are capitalised.
Depreciation is calculated using the straight-line method, based on the purchase or production cost, less any residual value which is reviewed annually if considered material, over a period corresponding to the useful life of each asset category, i.e. 10 to 40 years for buildings and improvements to land and buildings, and 3 to 10 years for equipment.
Property, plant and equipment are tested for impairment when an indication of impairment loss exists, such as a scheduled closure, a redundancy plan or a downward review of market forecasts. When the asset’s recoverable value is less than its net carrying amount, an impairment loss is recognised. Where the recoverable value of an individual asset cannot be determined precisely, the Group determines the recoverable value of the CGU to which the asset belongs.
Lease contracts
Lease contracts which transfer to the Group substantially all the risks and rewards incidental to ownership of an asset are classifi ed as fi nance leases.
Assets acquired under fi nance leases are recognised in property, plant and equipment and a corresponding borrowing is recognised in the same amount, at the lower of the fair value of the asset and the present value of minimum lease payments. The corresponding assets are depreciated over a useful life identical to that of property, plant and equipment acquired outright.Deferred tax is recognised in respect of the capitalisation of fi nance leases where appropriate.
Lease contracts that do not confer substantially all the risks and rewards incidental to ownership are classifi ed as operating leases. Payments made under these operating leases are recognised in current operating expenses on a straight-line basis over the term of the contract.
Capital gains on the sale and leaseback of assets are fully recognised in income at the time of disposal when the lease qualifi es as an operating lease and the transaction is performed at fair value.
2.7. Impairment of assets
Goodwill and intangible assets with an indefi nite life are subject to systematic impairment tests during the second half of each fi scal year.
In addition, when events or circumstances indicate that an impairment loss is likely in respect of goodwill, other intangible assets or property, plant and equipment, an impairment test is performed. Such events or circumstances concern material unfavourable changes of a permanent nature affecting either the economic environment or the assumptions or objectives used on the acquisition date.
Impairment tests seek to determine whether the recoverable value of an asset or CGU is less than its net carrying amount.
The recoverable value of an asset or CGU is the higher of its fair value less costs to sell and its value in use. The value in use is determined with respect to forecast expected future cash fl ows, taking into account the time value of money and the specifi c risks attributable to the asset or CGU. Fair value less costs to sell is the amount obtainable from the sale of an asset or group of assets in an arm’s length transaction between knowledgeable, willing parties, less the costs of disposal. These values are determined based on market data (comparison with similar listed companies, values attributed in recent transactions and stock market prices).

159 Reference document 2005
When the recoverable value of an asset or CGU is less than its net carrying amount, an impairment loss is recognised in respect of the asset or CGU.In the case of a CGU, the impairment loss is allocated in priority against goodwill and recognised in “Other non-recurring operating income and expenses” in the income statement.
Impairment losses recognised in respect of property, plant and equipment and intangible assets may be reversed at a later date up to the amount of the losses initially recognised, when the recoverable value becomes greater than the net carrying amount. Impairment losses in respect of goodwill may not be reversed.
2.8. Inventories
Inventories are valued at the lower of cost and net realisable value. The net realisable value is the estimated sale price in the normal course of operations, net of costs to be incurred to complete the sale.
The same method for determining costs is adopted for inventory of a similar nature and use within the same entity. Inventory is valued using the retail method, on a fi rst-in-fi rst-out (FIFO) basis or at weighted average cost depending on the Group activity.
The Group may recognise an inventory provision if inventory is damaged or partially or completely obsolete.
2.9. Financial assets and liabilities
The Group has recognised and measured its fi nancial assets and liabilities in accordance with IAS 39 - Financial instrument since January 1, 2005, the date of fi rst-time adoption of international standards governing fi nancial instruments.
Derivative instruments must now be recognised in the balance sheet at fair value, in assets (positive fair value) or liabilities (negative fair value).
Financial assets
Pursuant to IAS 39, fi nancial assets are classifi ed within one of the following four categories:• fi nancial assets at fair value through the income statement;• loans and receivables;• held-to-maturity investments;• available-for-sale fi nancial assets.
The classifi cation determines the accounting treatment of the instrument. It is determined by the Group on the initial recognition date, based on the objective behind the assets’ purchase. Purchases and sales of fi nancial assets are recognised on the trade date, which is the date the Group is committed to the purchase or sale of the asset. A fi nancial asset is derecognised if the contractual rights to the cash fl ows from the fi nancial asset expire or the asset is transferred.
1. Financial assets at fair value through the income statement
These are fi nancial assets held by the Group for short-term profi t, or assets voluntarily classifi ed in this category. These assets are measured at fair value, with changes in fair value recognised in income.
Classifi ed as current assets under cash equivalents, these fi nancial instruments primarily comprise mutual or similar funds
2. Loans and receivables
Loans and receivables are non-derivative fi nancial assets with fi xed or determinable payments that are not listed in an active market and are not held for trading purposes or available for sale. These assets are initially recognised at fair value and subsequently at amortised cost using the effective interest method. Short-term receivables without a stated interest rate are valued at the amount of the original invoice unless the effective interest rate has a material impact.

160
Financial Information – Consolidated fi nancial statements
PPR 161
These assets are subject to impairment tests when there is an indication of impairment loss. An impairment loss is recognised if the carrying amount exceeds the estimated recoverable amount.
Loans to non-consolidated investments, other loans and receivables and trade receivables are included in this category and are presented in non-current fi nancial assets, trade receivables and other non-current fi nancial assets.
3. Held-to-maturity investments
Held-to-maturity investments are non-derivative fi nancial assets, other than loans or receivables, with fi xed or determinable payments and fi xed maturity that an entity has the positive intention and ability to hold to maturity. These assets are initially recognised at fair value and subsequently at amortised cost using the effective interest method. These assets are subject to impairment tests when there is an indication of impairment loss. An impairment loss is recognised if the carrying amount exceeds the estimated recoverable amount.
Held-to-maturity investments are presented in non-current fi nancial assets.
4. Available-for-sale fi nancial assets
Available-for-sale fi nancial assets are non-derivative fi nancial assets that are not included in the aforementioned categories. They are recognised at fair value. Unrealised capital gains or losses are recognised in shareholders’ equity until their disposal. However, where there is objective indication of loss in value of an available-for-sale fi nancial asset, the accumulated loss is recognised in income. Impairment losses recognised in respect of variable-income securities cannot be reversed at a subsequent period end.
For listed securities, fair value corresponds to a market price. For unlisted securities, fair value is determined by reference to recent transactions or using valuation techniques based on reliable and objective indicators. However, when the fair value of a security cannot be reasonably estimated, it is recorded at historical cost. These assets are subject to impairment tests in order to assess whether they are recoverable.
This category mainly comprises non-consolidated investments and marketable securities that do not meet other fi nancial asset defi nitions. They are presented in non-current fi nancial assets.
Financial liabilities
The valuation of fi nancial liabilities depends on their IAS 39 classifi cation. Within the group, and excluding liability derivatives, all fi nancial liabilities and particularly borrowings, trade payables and other liabilities are recognised initially at fair value and subsequently at amortised cost, using the effective interest method.
The effective interest rate is determined for each transaction and corresponds to the rate that would provide the net carrying amount of a fi nancial liability by discounting its estimated future cash fl ows until maturity or until the nearest date the price is reset to the market rate. The calculation includes transaction costs of the operation and any premiums and/or discounts. Transaction costs correspond to the costs directly attributable to the acquisition or issue of a fi nancial liability.
The net carrying amount of fi nancial liabilities that qualify as hedged items as part of fair value hedging relationships and are valued at amortised cost, is adjusted with respect to the hedged risk.
Hedging relationships are described in the section on derivative instruments.
Put options granted to minority interest shareholders
The Group has committed to repurchase the minority interests of shareholders of certain fully consolidated subsidiaries. These Group repurchase commitments correspond to optional commitments (written put options). The strike price of these options may be set or determined according to a predefi ned calculation formula, and the options may be exercised at any time or on a specifi c date.
Pending a decision from the IASB on the subject, the following accounting treatment has been adopted:• in accordance with IAS 32, the Group records a fi nancial liability with respect to put options granted to minority shareholders of the
entities concerned;• the liability is initially recognised at the present value of the strike price and at subsequent balance sheet dates based on the fair value
of the shares to be potentially purchased if the strike price is based on the fair value;

161 Reference document 2005
• the corresponding entry for this liability is deducted from minority interests and the balance from goodwill. The obligation to record a liability even though the put option is not exercised means, for purposes of consistency, that the same treatment applied to increases in percentage interests in controlled companies must initially be used for these transactions;
• the subsequent change in the value of the commitment is recognised through an adjustment to goodwill (excluding the discounting impact);
• net income attributable to equity holders of the parent continues to be calculated based on actual percentage interests in subsidiaries, and does not take into account the potential voting rights attaching to written put options.
The accounting principles described above may be reviewed based on the conclusions of IFRIC.
Hybrid instruments
Certain fi nancial instruments have both a standard debt component and an equity component.
For the Group, this primarily involves OCEANE bonds (bonds convertible and exchangeable into new or existing shares).
Under IAS 32, convertible bonds are considered hybrid instruments insofar as the conversion option provides for the repayment of the instrument against a fi xed number of equity instruments. There are several components:• a fi nancial liability (corresponding to the contractual commitment to pay cash), representing the bond component;• the conversion option into a fi xed number of ordinary shares, offered to the subscriber, similar to a call option written by the issuer,
representing an equity instrument;• potentially one or more embedded derivatives.
The accounting policies applicable to each of these components, at the issue date and subsequent period ends, are as follows:• debt component: the debt is initially recorded at the present value of future interest and capital payment fl ows discounted at the market
rate applicable to a similar bond without the conversion option. Should the convertible bond contain embedded derivatives closely related to the borrowing within the meaning of IAS 39, the value of these components is allocated to the debt, in order to determine the value of the equity component. The debt is subsequently recognised at amortised cost;
• embedded derivatives not closely related to the debt are recognised at fair value with changes in fair value recognised in income;• equity component: the value of the conversion option is determined by deducting the potential value of the embedded derivatives from
the amount of the issue less the carrying amount of the debt component . The conversion option continues to be recorded in equity at its initial value. Changes in value are not recognised;
• transaction costs are prorated over each component.
Derivative instruments
The Group uses various fi nancial instruments to reduce its exposure to foreign exchange, interest rate and equity risk. These instruments are listed on organised markets or traded over the counter with leading counterparties.
All derivatives are recognised in the balance sheet under other current and non-current assets and liabilities depending on their maturity and the accounting classifi cation and are valued at fair value as of the trade date. Changes in the fair value of derivatives are always recorded in income except in the case of cash fl ow and net investment hedging relationships.
Derivatives designated as hedging instruments are classifi ed by category of hedge based on the nature of the risks being hedged:• a cash fl ow hedge is used to hedge the risk of changes in cash fl ow from recognised assets or liabilities or a highly probable transaction
that would impact consolidated net income;• a fair value hedge is used to hedge the risk of changes in the fair value of recognised assets or liabilities or a fi rm commitment not yet
recognised that would impact consolidated net income;• a net investment hedge is used to hedge the foreign exchange risk of foreign activities.
Hedge accounting can only be applied if all the following conditions are met:• there exists a clearly identifi ed, formalised and documented hedging relationship as of the date of inception;• the effectiveness of the hedging relationship can be demonstrated on a prospective and retrospective basis. The results thus obtained
must attain a confi dence level of between 80% and 125%.

162
Financial Information – Consolidated fi nancial statements
PPR 163
The accounting treatment of fi nancial instruments qualifi ed as hedging instruments, and their impact on the income statement and the balance sheet, is distinguished based on the type of hedging relationship:• Cash fl ow and net investment hedges:
- the effective portion of fair value gains and losses on the hedging instrument is recognised directly in equity. Amounts recorded in equity are released to the income statement to match the recognition of the hedged items;
- the ineffective portion of the hedge is recognised in the income statement.• For fair value hedges, the hedged component of these items is measured on the balance sheet at fair value. Fair value gains and los-
ses are recorded in the income statement and offset, to the extent effective, by matching fair values gains and losses on the hedging instrument.
Cash and cash equivalents
The “Cash and cash equivalents” line item recorded on the assets side of the consolidated balance sheet comprises cash, short-term investments and other liquid and easily convertible instruments with a negligible risk of change in value and a maximum maturity of three months as of the purchase date.
Investments with a maturity exceeding three months, and blocked or pledged bank accounts are excluded from cash. Bank overdrafts are presented in borrowings on the liabilities side of the balance sheet.
In the cash fl ow statement, “Cash and cash equivalents” includes accrued interest receivable on assets presented in cash and cash equivalents and bank overdrafts. A schedule reconciling cash per the cash fl ow statement and cash per the balance sheet is presented in note 32.
2.10. Other current assets and liabilities
Catalogue costs
Catalogue costs include all expenditure which can be directly attributable or allocated on a reasonable, consistent and permanent basis to the creation, production and preparation of a catalogue with a view to its intended use.
Costs relating to catalogues dispatched are expensed on dispatch, while costs relating to catalogues not yet dispatched are recorded in prepaid expenses until the dispatch date.
2.11. Treasury shares
Treasury shares, whether specifi cally allocated for grant to employees or allocated to the liquidity contract or in any other case, as well as directly related transaction costs, are deducted from consolidated shareholders’ equity. On disposal, the consideration received for these shares, net of transaction costs and related tax impacts, is recognised in shareholders’ equity.
2.12. Share-based payments
Share purchase and subscription plans are attributed by the Group and settled in PPR shares. In accordance with IFRS 2 - Share-based payment, the fair value of these plans, corresponding to the fair value of the services rendered by the option holders, is valued defi nitively on the attribution date using a mathematical model with a trinomial algorithm such as the Black & Scholes model, taking into account the number of options potentially exercisable at the end of the rights vesting period.
During the four-year rights vesting period, the fair value of options thus determined is amortised in proportion to the vesting of rights. This expense is recorded in payroll expenses with an offsetting increase in shareholders’ equity. When the options are exercised, the strike price received is recorded in cash with an offsetting entry in shareholders’ equity.
Bonus share plans and share appreciation rights (SARs) granted by the Group also result in the recognition of a payroll expenses spread over the rights vesting period.
In accordance with the provisional measures of IFRS 2 concerning transactions settled in equity instruments, the Group has opted to apply the standard solely to those plans issued after November 7, 2002 and for which the rights had not vested as of January 1, 2005.

163 Reference document 2005
2.13. Treasury share options
Treasury share options are treated according to their characteristics as derivative instruments, equity instruments or fi nancial liabilities.
Options qualifi ed as derivatives are recorded at fair value through the income statement. Options qualifi ed as equity instruments are re-corded in shareholders’ equity for their initial amount. Changes in value are not recognised. The accounting treatment of fi nancial liabilities is described in note 2.9.
2.14. Income tax
The income tax charge for the period comprises the current and deferred tax charge.
Deferred tax is calculated using the liability method on all temporary differences between the accounting value recorded in the consoli-dated balance sheet and the tax value of assets and liabilities. The valuation of deferred tax amounts depends on the way in which the Group intends to recover or settle the carrying amount of assets and liabilities, using tax rates adopted at the balance sheet date.
Deferred tax assets and liabilities are not discounted and are classifi ed in the balance sheet under non-current assets and liabilities.
A deferred tax asset is recognised on deductible temporary differences and for tax loss carry-forwards and tax credits insofar as their future offset appears probable.
A deferred tax liability is recognised on taxable temporary differences relating to investments in subsidiaries, associates and joint ventures unless the Group is able to control the timing of the reversal of the temporary difference, and it is probable that the temporary difference will not reverse in the foreseeable future.
2.15. Provisions
Restructuring measures
A restructuring provision is recognised when there exists a formal and detailed restructuring plan and implementation has begun or the main features have been announced before the balance sheet date. Restructuring costs provided essentially represent employee costs (severance pay, early retirement plan, payment in lieu of notice, etc.), closures and penalties for breach of contract with third parties.
Other provisions
Provisions for litigation and disputes, and various contingencies and losses are recognised as soon as there exists a present obligation arising from past events, which will probably result in an outfl ow of resources, the amount of which can be reliably estimated.
Provisions maturing in more than one year are valued at the discounted amount representing the best estimate of the expense necessary to extinguish the current obligation at the balance sheet date. The discount rate used refl ects current assessments of the time value of money and specifi c risks related to this liability.
2.16. Employee benefi ts
Based on the laws and practices of each country, the Group recognises various types of employee benefi ts:
Short-term benefi ts
Group short-term benefi ts, primarily comprising remuneration, social security payments, compensated absences, profi t-sharing and bonuses payable within twelve months, are expensed in the corresponding period.
Post-employment benefi ts, other long-term benefi ts and termination benefi ts
Under defi ned contribution plans, the Group is not obliged to make additional payments over and above contributions already made to a fund, if the latter does not have suffi cient assets to cover the benefi ts corresponding to services rendered by personnel during the current period and prior periods. Contributions to these plans are expensed as incurred.

164
Financial Information – Consolidated fi nancial statements
PPR 165
Under defi ned benefi t plans, obligations are valued using the projected unit credit method based on agreements in effect in each com-pany. Under this method, each period of service gives rise to an additional unit of benefi t entitlement and each unit is measured separa-tely to build up the fi nal obligation. The obligation is then discounted. The actuarial assumptions used to determine the obligations vary according to the economic conditions of the country where the plan is established. These plans and the terminations benefi ts are valued by independent actuaries on an annual basis for the most signifi cant plans and at regular intervals for the other plans. These valuations take into account the level of future compensation, the probable active life of employees, life expectancy and staff turnover.Actuarial gains and losses are primarily due to changes in assumptions and the difference between estimated results based on actuarial assumptions and actual results. All actuarial differences in respect of defi ned benefi t plans are recognised immediately in shareholders’ equity, in accordance with the option offered by IAS 19, as revised in December 2004.
Past service cost designating the increase in an obligation following the introduction of a new plan or changes to an existing plan, is recognised on a straight-line basis over the average period until the benefi ts vest or is expensed immediately if the benefi t rights have already vested.
The expenses relating to this type of plan are recognised in recurring operating income (service cost) and fi nance costs (interest cost, expected return on assets). Curtailments, settlements and past service costs are recognised in recurring operating income or net fi nance costs according to their nature. The provision recognised in the balance sheet corresponds to the present value of the obligations thus valued, less the fair value of plan assets and non-amortised past service costs.
2.17. Revenue recognition
Revenue mainly comprise sales of goods for resale, general consumer goods and luxury goods, together with income from sales-related services, royalties and operating licenses.
Revenue is valued at the fair value of the consideration received for goods and services sold, royalties, licences and operating subsidies granted, excluding taxes, net of rebates and discounts and after elimination of inter-company sales.
In the event of deferred payment beyond the usual credit terms that is not supported by a fi nancing institution, the revenue from the sale is equal to the discounted price, with the difference between the discounted price and the cash payment recognised in fi nancial income over the life of the deferred payment should the transaction be material.
Sales of goods are recognised when a Group entity has transferred the risks and rewards incidental to ownership to the buyer, generally on delivery, revenue can be reliably measured and recovery is reasonably assured.
Following the sale of goods, and depending on the contractual clauses attached to these sales, provisions may be deducted from reve-nue to cover potential returns likely to occur after the balance sheet date.
Services, such as warranty extensions or services directly related to the sale of goods, are recognised based on the stage of completion of the transaction, during the period in which the services are rendered.
Revenue recognition in respect of Printemps concession contracts depends on the nature of the transaction: in the case of contracts where Printemps acts as the principal, sales are recognised in Revenue; in the case of contracts where Printemps acts as the agent, only concession commission received is recorded in Revenue.
2.18. Earnings per share
Net earnings per share are calculated by dividing net income (attributable to equity holders of the parent) by the weighted average number of outstanding shares during the year, after deduction of the weighted average number of own shares held by consolidated companies.
Diluted net earnings per share is calculated by adjusting net income attributable to equity holders of the parent and the number of outstanding shares for all instruments granting deferred access to the share capital of the company whether issued by PPR or one of its subsidiaries.

165 Reference document 2005
Dilution is determined separately for each instrument based on the following conditions:• when the proceeds corresponding to potential future share issues are received at the time dilutive securities are issued (e.g. convertible
bonds), the numerator is equal to net income before dilution plus the savings in interest expense that would be realised in the event of conversion, net of tax;
• when the proceeds are received at the time the rights are exercised (e.g. share subscription options), the dilution attached to the options is determined using the share purchase method (theoretical number of shares purchased at market price (average over the period) based on the proceeds received at the time the rights are exercised).
In the case of material non-recurring items, a net earnings per share excluding non-recurring items is calculated by adjusting net income attri-butable to equity holders of the parent for non-recurring items net of taxes and minority interests. Non-recurring items taken into account for this calculation correspond to all the items included under “Other non-recurring operating income and expenses” in the income statement.
2.19. Non-current assets (and disposal groups) held for sale
The Group applies IFRS 5 from January 1, 2004, which requires the specifi c recognition and presentation of assets (or disposal groups) held for sale. Non-current assets to which this standard applies are defi ned as assets (or disposal groups), the sale of which is considered highly probable.
Non-current assets (or disposal groups) held for sale are measured and recognised at the lower of their net carrying amount and their fair value less the costs of disposal as soon as the sale of these assets is considered highly probable. The assets are no longer depreciated from the time they qualify as assets (or disposal groups) held for sale.
2.20. Segment reporting
In accordance with IAS 14, Group segment reporting is presented at two levels. The choice of these levels and the breakdown refl ects the organisational structure of the Group and differences in risk exposure and profi tability.
A business segment is a distinguishable component of the Group that is engaged in providing products or services and is exposed to risks and returns that are different from those of other business segments. It constitutes the primary reporting format and represents a Group company or brand: Retail business segments are Conforama, Fnac, Printemps, Redcats and CFAO and Luxury Goods business segments are Gucci, Bottega Veneta, Yves Saint Laurent and YSL Beauté.
A geographical segment is a distinguishable component of the Group that is engaged in providing products or services within a particular economic environment and that is subject to risks and returns that are different from those of other business segments operating in other economic environments. It constitutes the secondary reporting format and represents a geographical area for the Group: France, Europe (excluding France), North and South America, Africa, Oceania, Asia.
2.21. Financial information presentation
Operating income and recurring operating income
Operating income includes all revenues and expenses directly related to Group activities, whether these revenues and expenses are recurring or arise from non-recurring decisions or transactions.
Recurring operating income, as defi ned within the meaning of the French National Accounting Council recommendation of October 27, 2004, is an analytical balance that should facilitate the understanding of the entity’s operating performance. It corresponds to operating income before impairment of goodwill and other operating income and expenses defi ned as follows:- gains or losses on disposals of property, plant and equipment and intangible assets, operating assets or investments;- restructuring costs and costs relating to worker retraining measures;- non-recurring items corresponding to revenue and expenses that are unusual due to their frequency, nature or amount.
Consolidated balance sheet
Assets and liabilities are classifi ed according to their nature in current or non-current items. Current items are assets and liabilities which will be realised or settled, sold or consumed within the normal operating cycle of the entity or for which the expected date of recovery or settlement is within twelve months of the balance sheet date.

166
Financial Information – Consolidated fi nancial statements
PPR 167
Cash fl ow statement
The Group cash fl ow statement is prepared in accordance with IAS 7 - Cash fl ow statements and the French National Accounting Council recommendation of October 27, 2004. The Group prepares its cash fl ow statement using the indirect method.
Defi nition of Group consolidated net indebtedness
The concept of net indebtedness used by the Group comprises gross indebtedness less net cash, as defi ned by French National Accounting Council recommendation 2004-R.02 of October 27, 2004. For fully consolidated consumer credit companies, the fi nancing of customer loans is presented in borrowings. Group net indebtedness excludes the fi nancing of customer loans by consumer credit businesses.
3. Scope of consolidation
The list of companies included in the PPR Group consolidated fi nancial statements as of December 31, 2005, is presented in note 37.
3.1. Principle changes in consolidation scope
Sale of the Group’s remaining interest in Facet
During the fi rst six months, the Group sold its remaining 9.69% interest in Facet to BNP Paribas for a sale price of €87.2 million. The transaction generated a capital gain before tax of €70.3 million and €56.8 million after tax.
Sale of MobilePlanet
On April 26, 2005, the Group sold its subsidiary Mobile Planet to eXpansys Holdings Limited for €2.1 million. The transaction generated a net capital gain of €3.2 million.
3.2. Other changes in consolidation scope
Other changes in consolidation scope had no material impact on the consolidated fi nancial statements.
4. Highlights
4.1. Treasury share transactions
On March 30, 2005, in accordance with the authorisations granted by the Annual General Meeting, the Group’s Management Board decided to cancel 2 million treasury shares, thus bringing PPR share capital to 120,438,230 shares with a par value of €4 each.
During 2005, the Group made net disposals of 2,738,618 shares as follows:- 1,108,132 shares were sold by blocks between May 18, and June 10, 2005 through market brokers acting independently, at an average
price of €81.058 per share;- 1,560,000 shares were sold on June 27, 2005 via an over-the-counter transaction at a price of €83.7 per share;- 195,000 shares were sold under the liquidity contract;- 124,514 shares were purchased following the exercise of PPR call options hedging the stock option plans.
Finally, the Group purchased 3,394,062 PPR call options in order to hedge the following transactions:- 3 million PPR call options maturing in 2008 to partially hedge the 2008 OCEANE bonds;- 394,062 PPR call options to hedge the stock option plans issued in 2005, including 124,514 options exercised during the year.
4.2. Pro forma fi gures
The 2004 comparative fi nancial statements published in this document include the consolidation of the Luxury Goods companies for the 14-month period from November 1, 2003 to December 31, 2004.

167 Reference document 2005
Given the Group’s decision to harmonise the period-ends of all its subsidiaries in fi scal year 2004, the pro forma fi gures, including an income statement, balance sheet and cash fl ow statement, take into account the consolidation of the Luxury Goods companies for the 12-month period from January 1, to December 31, 2004.
Income statement
(in € million) IFRS2004
Luxury Goods (1)
Proforma2004
CONTINUING OPERATIONS
Revenue 17,531.4 (489.7) 17,041.7
Cost of sales (9,809.2) 155.4 (9,653.8)
Gross profi t 7,722.2 (334.3) 7,387.9
Payroll expenses (2,613.3) 57.0 (2,556.3)
Other recurring operating income and expenses (4,023.0) 177.6 (3,845.4)
Recurring operating income 1,085.9 (99.7) 986.2
Other non-recurring operating income and expenses 105.7 1.8 107.5
Operating income 1,191.6 (97.9) 1,093.7
Finance costs (298.9) 0.4 (298.5)
Income before taxes 892.7 (97.5) 795.2
Income taxes (318.9) 8.8 (310.1)
Share in earnings of associates 14.4 14.4
Net income from continuing operations 588.2 (88.7) 499.5
o/w attributable to equity holders of the parent 528.9 (65.1) 463.8
o/w attributable to minority interests 59.3 (23.6) 35.7
DISCONTINUED OPERATIONS
Net income from discontinued operations 588.6 588.6
o/w attributable to equity holders of the parent 536.2 536.2
o/w attributable to minority interests 52.4 52.4
Net income of consolidated companies 1,176.8 (88.7) 1,088.1
o/w attributable to equity holders of the parent 1,065.1 (65.1) 1,000.0
o/w attributable to minority interests 111.7 (23.6) 88.1
Net income attributable to equity holders of the parent 1,065.1 1,000.0
Earnings per share (in €) 8.92 8.38
Diluted earnings per share (in €) 8.19 7.70
Net income from continuing operations attributable to equity holders of the parent
528.9 463.8
Earnings per share (in €) 4.43 3.89
Diluted earnings per share (in €) 4.19 3.70
Net income from continuing operations excluding non-recurring items attributable to equity holders of the parent
552.0 484.7
Earnings per share (in €) 4.62 4.06
Fully diluted earnings per share (in €) 4.36 3.86
(1) Impact of the change in the Luxury Goods Division consolidation period.

168
Financial Information – Consolidated fi nancial statements
PPR 169
Consolidated cash fl ow statement
(in € million) IFRS2004
Luxury Goods (1)
Proforma2004
Cash fl ow from (used in) operating activities 1,009.9 (119.3) 890.6
Interest paid/received 263.7 0.4 264.1
Dividends received (26.7) (26.7)
Net income tax payable 150.6 4.3 154.9
Cash fl ow from (used in) operating activities before tax, dividends and interest
1,397.5 (114.6) 1,282.9
Change in working capital requirement 1.0 (47.3) (46.3)
Change in customer loans 28.6 28.6
Income tax paid (204.7) 26.3 (178.4)
Net cash from (used in) operating activities 1,222.4 (135.6) 1,086.8
Purchases of property, plant and equipment and intangible assets (401.1) 16.9 (384.2)
Proceeds from sale of property, plant and equipment and intangible assets 26.4 26.4
Acquisitions of subsidiaries, net of cash acquired (2,688.0) 1.7 (2,686.3)
Proceeds from disposals of subsidiaries net of cash transferred 2,338.7 2,338.7
Purchases of other fi nancial assets (234.8) (234.8)
Proceeds from sale of other fi nancial assets 158.5 (2.6) 155.9
Interest and dividends received 60.0 (4.1) 55.9
Net cash from (used in) investing activities (740.3) 11.9 (728.4)
Share capital increase/decrease (0.2) 0.2
Treasury share transactions 100.4 100.4
Dividends paid to parent company shareholders (278.9) (278.9)
Dividends paid to minority interests (19.9) 0.3 (19.6)
Changes in borrowings 1,302.1 208.6 1,510.7
Interest paid and equivalent (319.6) 3.5 (316.1)
Net cash from (used in) fi nancing activities 783.9 212.6 996.5
Net cash fl ow from assets classifi ed as held for sale 17.1 17.1
Impact of exchange rate variations 38.7 9.8 48.5
Net increase (decrease) in cash and cash equivalents 1,321.8 98.7 1,420.5
Cash and cash equivalents at beginning of the year 2,722.9 (98.7) 2,624.2
Cash and cash equivalents at end of the year 4,044.7 4,044.7
(1) Impact of the change in the Luxury Goods Division consolidation period.

169 Reference document 2005
5. Segment reporting
Primary segment information of the Group is presented by brand and secondary segment information is presented by geographical area. A description of these segments is presented in note 2.20.
Segment information is prepared in accordance with the same accounting rules and methods as those adopted for the preparation of the consolidated fi nancial statements and presented in the notes to the fi nancial statements.
The performance of each brand is measured based on Recurring operating income.
Charges to depreciation, amortisation and provisions on non-current operating assets correspond to net charges to depreciation, amor-tisation and provisions on intangible assets and property, plant and equipment recorded in Recurring operating income.
Purchases of property, plant and equipment and intangible assets correspond to gross asset purchases, including cash timing differences but excluding assets purchased under fi nance lease.
Segment assets comprise goodwill, intangible assets, property, plant and equipment, other non-current assets, inventories, trade recei-vables, customer loans and other current assets.Segment liabilities comprise deferred tax liabilities on brands, other non-current liabilities, customer loan fi nancing, trade payables and other current liabilities.

170
Financial Information – Consolidated fi nancial statements
PPR 171
5.1. Information by brand
(in € million) Gucci BottegaVeneta
Yves SaintLaurent
YSL Beauté Other Luxury Goods
As of December 31, 2005
Revenue 1,807.1 159.7 162.0 613.2 294.2 3,036.2
- non-Group 1,806.3 159.7 162.0 610.0 294.2 3,032.2
- Group 0.8 3.2 4.0
Recurring operating income 485.4 13.7 (65.8) 15.4 (59.2) 389.5
Share in earnings of associates
Net recurring charges to depreciation, amortisation and provisions on non-current operating assets
64.2 8.5 15.1 21.8 23.3 132.9
Other non-cash recurring operating expenses 0.4 (0.1) (0.7) (0.1) (0.5)
Purchases of property, plant and equipment and intangible assets, gross
63.5 8.9 4.3 17.9 21.1 115.7
Segment assets 7,266.2 291.4 582.4 1,149.7 1,220.2 10,509.9
Segment liabilities 1,549.6 54.4 166.1 339.7 240.4 2,350.2
Investments in associates
As of December 31, 2004
Revenue 1,902.6 113.3 196.4 723.9 265.9 3,202.1
- non-Group 1,902.6 113.3 196.4 721.8 265.9 3,200.0
- Group 2.1 2.1
Recurring operating income 537.7 (8.7) (79.9) 26.0 (87.7) 387.4
Share in earnings of associates
Net recurring charges to depreciation, amortisation and provisions on non-current operating assets
72.3 8.2 18.9 29.2 28.8 157.4
Other non-cash recurring operating expenses 2.7 (0.3) (0.1) (5.0) (1.3) (4.0)
Purchases of property, plant and equipment and intangible assets, gross
63.3 15.2 9.6 27.7 22.8 138.6
Segment assets 7,275.6 259.3 583.3 1,159.7 1,136.1 10,414.0
Segment liabilities 1,462.7 57.7 156.1 323.7 227.5 2,227.7
Investments in associates

171 Reference document 2005
Printemps Redcats Fnac Conforama CFAO Other Retail Holding companies and other
Eliminations ConsolidatedTotal
751.8 4,377.3 4,381.9 3,140.0 2,034.3 74.7 14,760.0 (30.5) 17,765.7
748.8 4,373.3 4,381.6 3,136.7 2,034.3 58.8 14,733.5 17,765.7
3.0 4.0 0.3 3.3 15.9 26.5 30.5
25.5 231.3 151.8 177.1 167.0 1.6 754.3 (59.7) 1,084.1
(1.8) 3.4 1.8 3.4 3.4
36.9 47.1 85.8 60.0 26.2 2.5 258.5 2.1 393.5
(0.9) (2.6) 2.1 1.7 (5.0) (0.3) (5.0) 7.2 1.7
31.3 56.6 62.1 62.4 44.9 0.2 257.5 6.3 379.5
1,003.2 2,995.4 1,622.7 2,582.2 1,173.6 273.1 9,650.2 57.8 20,217.9
311.9 1,321.1 1,053.8 1,148.7 557.3 247.6 4,640.4 140.4 7,131.0
4.2 27.8 12.0 44.0 44.0
784.3 4,403.4 4,130.3 3,096.9 1,859.4 83.6 14,357.9 (28.6) 17,531.4
782.8 4,400.0 4,129.5 3,093.4 1,855.3 70.4 14,331.4 17,531.4
1.5 3.4 0.8 3.5 4.1 13.2 26.5 28.6
22.8 231.2 138.4 206.8 158.9 1.4 759.5 (61.0) 1,085.9
8.7 2.7 3.0 14.4 14.4
38.2 45.4 82.4 58.6 24.7 2.5 251.8 2.1 411.3
(0.7) (7.1) 6.4 (1.6) 2.3 (0.7) 8.3 3.6
26.8 41.6 78.0 75.0 36.9 0.7 259.0 3.5 401.1
1,014.6 2,921.2 1,692.8 2,573.7 1,009.6 281.9 9,493.8 74.8 19,982.6
298.9 1,351.0 1,098.4 1,112.1 471.5 253.9 4,585.8 188.5 7,002.0
26.9 20.0 46.9 46.9
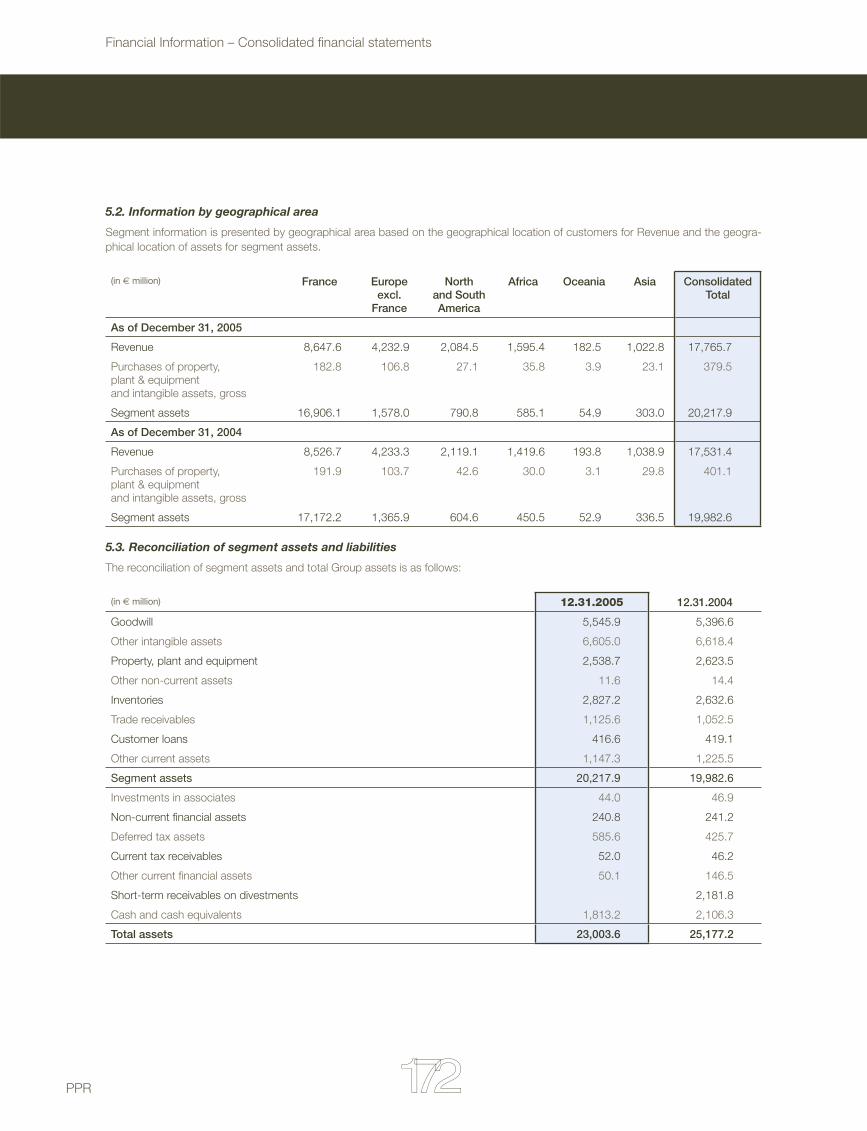
172
Financial Information – Consolidated fi nancial statements
PPR 173
5.2. Information by geographical area
Segment information is presented by geographical area based on the geographical location of customers for Revenue and the geogra-phical location of assets for segment assets.
(in € million) France Europeexcl.
France
North and South America
Africa Oceania Asia ConsolidatedTotal
As of December 31, 2005
Revenue 8,647.6 4,232.9 2,084.5 1,595.4 182.5 1,022.8 17,765.7
Purchases of property, plant & equipment and intangible assets, gross
182.8 106.8 27.1 35.8 3.9 23.1 379.5
Segment assets 16,906.1 1,578.0 790.8 585.1 54.9 303.0 20,217.9
As of December 31, 2004
Revenue 8,526.7 4,233.3 2,119.1 1,419.6 193.8 1,038.9 17,531.4
Purchases of property, plant & equipment and intangible assets, gross
191.9 103.7 42.6 30.0 3.1 29.8 401.1
Segment assets 17,172.2 1,365.9 604.6 450.5 52.9 336.5 19,982.6
5.3. Reconciliation of segment assets and liabilities
The reconciliation of segment assets and total Group assets is as follows:
(in € million) 12.31.2005 12.31.2004
Goodwill 5,545.9 5,396.6
Other intangible assets 6,605.0 6,618.4
Property, plant and equipment 2,538.7 2,623.5
Other non-current assets 11.6 14.4
Inventories 2,827.2 2,632.6
Trade receivables 1,125.6 1,052.5
Customer loans 416.6 419.1
Other current assets 1,147.3 1,225.5
Segment assets 20,217.9 19,982.6
Investments in associates 44.0 46.9
Non-current fi nancial assets 240.8 241.2
Deferred tax assets 585.6 425.7
Current tax receivables 52.0 46.2
Other current fi nancial assets 50.1 146.5
Short-term receivables on divestments 2,181.8
Cash and cash equivalents 1,813.2 2,106.3
Total assets 23,003.6 25,177.2

173 Reference document 2005
The reconciliation of segment liabilities and total Group liabilities is as follows:
(in € million) 12.31.2005 12.31.2004
Deferred tax liabilities on brands 1,574.0 1,590.7
Financing of customer loans 416.6 419.1
Trade payables 2,758.1 2,643.8
Other current liabilities 2,382.3 2,348.4
Segment liabilities 7,131.0 7,002.0
Shareholders’ equity 8,134.1 8,019.2
Long-term borrowings 4,398.9 6,103.2
Other non-current fi nancial liabilities 1.8
Non-current provisions for retirement and similar benefi ts 266.1 233.3
Non-current provisions 142.7 164.8
Other deferred tax liabilities 391.3 269.0
Short-term borrowings 2,064.2 2,910.2
Other current fi nancial liabilities 19.5 11.2
Current provisions for retirement and similar benefi ts 13.3 14.2
Current provisions 85.0 183.5
Current tax liabilities 355.7 266.6
Total liabilities and shareholders’ equity 23,003.6 25,177.2
6. Revenue
(in € million) 12.31.2005 12.31.2004
Net sales of goods 16,844.8 16,697.4
Net sales of services 367.9 343.5
Revenue from concessions and licenses 128.8 118.7
Other revenue 424.2 371.8
Total (17,765.7) (17,531.4)

174
Financial Information – Consolidated fi nancial statements
PPR 175
7. Payroll expenses
Payroll expenses include charges relating to share-based payments as described in note 8 below.
(in € million) 12.31.2005 12.31.2004
Luxury Goods Division (570.7) (556.2)
Retail Division (2,053.9) (2,020.3)
Holding companies and other (37.3) (36.8)
Total (2,661.9) (2,613.3)
“Holding companies and other” in payroll expenses includes a charge relating to application of IFRS 2 to share subscription and bonus share plans of the whole Group in the amount of €4.7 million in 2005 and €7.1 million in 2004.
The average number of Group employees on a full-time equivalent basis breaks down as follows:
(in € million) 12.31.2005 12.31.2004
Luxury Goods Division 11,967 11,524
Retail Division 64,556 63,816
Holding companies and other 146 153
Total 76,669 75,493
The total number of Group employees as of December 31, 2005 and 2004 breaks down as follows:
(in € million) 12.31.2005 12.31.2004
Luxury Goods Division 12,843 12,136
Retail Division 71,328 72,062
Holding companies and other 145 153
Total 84,316 84,351

175 Reference document 2005
8. Share-based payments
In return for services rendered, the Group grants certain employees share-based plans settled in shares or cash.
The Group recognises its obligation as services are rendered by benefi ciaries, over the period from the grant date to the rights vesting date.• The grant date is the date at which plans were individually approved by the Management Board in the case of plans approved before
May 19, 2005 and by the Board of Directors for plans approved after this date. • The rights vesting date is the date at which all vesting conditions are satisfi ed.
Rights vested may only be exercised by benefi ciaries at the end of a blocked period, the length of which varies depending on the type of plan.
8.1. Equity-settled share-based payment transactions
In accordance with the provisional measures of IFRS 2 on equity-settled plans, the Group has opted to apply the standard solely to those plans issued after November 7, 2002 and for which the rights are not vested as of January 1, 2005.
The nature and principle characteristics of ineligible plans (plans issued prior to November 7, 2002) are presented below:

176
Financial Information – Consolidated fi nancial statements
PPR 177
Share option and bonus share plans 1996 PlanSubscription
options
1997/1 PlanSubscription
options
1997/2 PlanSubscription
options
1998 PlanPurchase options
1999/1 PlanPurchase options
Grant date 03.27.1996 01.22.1997 06.05.1997 06.05.1998 01.20.1999
Expiry date 04.30.2006 03.31.2007 07.31.2007 07.31.2008 03.31.2009
Vesting of rights
Number of benefi ciaries 5 9 3 257 36
Number of options initially granted 95,000 100,000 13,250 347,050 27,495
Number outstanding as of 01.01.2005 10,000 28,750 3,250 178,875 12,295
Number forfeited in 2005 - 3,750 - 18,800 7,425
Number exercised in 2005 10,000 - - - -
Number expired in 2005 - - - - -
Number outstanding as of 12.31.05 25,000 3,250 160,075 4,870
Number exercisable as of 12.31.05 25,000 3,250 160,075 4,870
Strike price (€) 33.72 61.41 71.16 135.98 154.58
The nature and principle characteristics of eligible plans are presented below:
Share option and bonus share plans 2003/1 PlanSubscription
options
2003/2 PlanSubscription
options
2004/1 PlanSubscription
options
2004/2 PlanSubscription
options
2005/1 PlanSubscription
options
Grant date 07.09.2003 07.09.2003 05.25.2004 07.07.2004 01.03.2005
Expiry date 07.08.2013 07.08.2013 05.24.2014 07.06.2014 01.02.2015
Vesting of rights (a) (a) (a) (a) (a)
Number of benefi ciaries 721 18 846 1 13
Number of options initially granted 528,690 5,430 540,970 25,000 25,530
Number outstanding as of 01.01.2005 477,879 4,200 531,395 25,000 -
Number forfeited in 2005 36,275 206 45,911 - -
Number exercised in 2005 - - - - -
Number expired in 2005 - - - - -
Number outstanding as of 12.31.05 441,604 3,994 485,484 25,000 25,530
Number exercisable as of 12.31.05 - - - - -
Strike price (€) 66.00 67.50 85.57 84.17 75.29
Under all these plans, shares are blocked for a period of four years from the date of grant.
(a) Options vest at a rate of 25% per full year of presence in the Group, except on retirement (vesting of all rights). If an employee is dis-missed for gross negligence or misconduct, all rights are lost, including after the end of the blocked period.
(b) Options vest at a rate of 25% per full year of presence in the Group, except on retirement (vesting of all rights) and on resignation (loss of all rights). If an employee is dismissed for gross negligence or misconduct, all rights are lost, including after the end of the blocked period.
(c) Shares vest fully two years after being granted, except on resignation or dismissal for gross negligence or misconduct (loss of all rights).

177 Reference document 2005
1999/2 PlanPurchase options
1999/3 PlanPurchase options
2000/1 PlanPurchase options
2000/2 PlanPurchase options
2001/1 PlanPurchase options
2001/2 PlanPurchase options
2002/1 PlanSubscription
options
2002/2 PlanSubscription
options
05.21.1999 12.08.1999 01.26.2000 05.23.2000 01.17.2001 05.18.2001 05.03.2002 05.03.2002
06.30.2009 12.26.2009 02.28.2010 06.30.2010 01.31.2011 05.31.2011 05.02.2012 05.02.2012
44 560 26 125 722 206 1 074 1 053
25,455 412,350 12,100 93,100 340,240 87,260 438,296 410,271
13,180 306,585 8,750 67,830 264,756 70,486 356,390 331,151
3,960 89,335 1,050 33,030 37,306 6,424 23,765 15,750
- - - - - - - -
- -
9,220 217,250 7,700 34,800 227,450 64,062 332,625 315,401
9,220 217,250 7,700 34,800 227,450 64,062 - -
144.83 189.19 227.15 202.91 225.01 225.01 128.10 140.50
2005/2 PlanSubscription
options
2005/3 PlanSubscription
options
2005/4 PlanSubscription
options
2005 PlanBonus shares
05.19.2005 05.19.2005 07.06.2005 07.06.2005
05.18.2015 05.18.2015 07.05.2015 N/A
(b) (b) (b) (c)
458 22 15 338
333,750 39,960 20,520 23,133
- - - -
4,470 - - 362
- - - -
- - - -
329,280 39,960 20,520 22,771
- - - -
78.01 78.97 85.05 N/A
The fair value of services rendered by benefi ciaries is determined on the grant date of the plans.• For share subscription plans, using a model such as the Black & Scholes model with a trinomial algorithm and exercise thresholds,
notably taking into account the number of options potentially exercisable at the end of the rights vesting period.• For bonus share plans, using a model such as the Black & Scholes model with a Monte Carlo algorithm with two underlyings.
Exercise threshold and probability assumptions for the share subscription plans are as follows:
Threshold as a % of the strike price Probability of exercise
125% 15%
150% 20%
175% 20%
200% 20%

178
Financial Information – Consolidated fi nancial statements
PPR 179
Based on these assumptions, 25% of benefi ciaries do not exercise their options early before the expiry date.
The main valuation assumptions for the different plans are summarised below:
Share option and bonus share plans
2003/1 PlanSubscription
options
2003/2 PlanSubscription
options
2004/1 PlanSubscription
options
2004/2 PlanSubscription
options
2005/1 PlanSubscription
options
2005/2 PlanSubscription
options
2005/3 PlanSubscription
options
2005/4 PlanSubscription
options
2005 PlanBonus shares
Volatility 33.25% 33.25% 25.65% 25.65% 23.75% 21.00% 21.00% 20.50% 20.50%
Risk-free interest rate 4.08% 4.08% 4.45% 4.37% 3.83% 3.49% 3.49% 3.38% 3.38%
Volatilities indicated represent the expected volatility of each plan based on maturities and strike prices available at the grant date. Dividends used for valuation purposes are those expected by the market at the grant date.
The risk-free interest rate corresponds to the 1 to 10 year interest rate curve, at the grant date, for interbank swaps.
The total charge recognised in 2005 in respect of share subscription plans and bonus share plans is €4.7 million (€7.1 million in 2004).
8.2. Cash-settled share-based payment transactions
The Group (Gucci Group) also grants certain employees Share Appreciation Rights (SARs) which constitute cash-settled share-based plans.
The nature and principle characteristics of these plans are presented below:
Plans of SARs
SARs outstanding as of 01.01.2005 3,152,714
Weighted average exercise price (in €) 54.82
SARs granted in 2005 1,329,882
Weighted average exercise price (in €) 40.44
SARs exercised in 2005 57,907
Weighted average exercise price (in €) 44.73
SARs expired/forfeited in 2005 548,693
Weighted average exercise price (in €) 57.48
SARs outstanding as of 12.31.2005 3,875,996
Weighted average exercise price (in €) 50.01
SARs exercisable as of 12.31.2005 987,930
Weighted average exercise price (in €) 54.08
All SAR plans have a term of 10 years commencing on the grant date.
SARs vest at a rate of 25% per full year of presence, except on redundancy (excluding dismissal for gross negligence or misconduct) when all rights vest immediately. If an employee is dismissed for gross negligence or misconduct, all rights are lost.
The SAR exercise price is determined based on the results of the Luxury Goods Division and a basket of comparable companies.
The exercise price of SARs outstanding as of December 31, 2005 is between €31.75 and €103.96 and the weighted average residual contractual term is 7.8 years.

179 Reference document 2005
The fair value of services rendered by benefi ciaries is recalculated at each balance sheet date by an independent expert using an option valuation model corresponding to the intrinsic value, which is then adjusted for the time value of money.
The total charge recognised in 2005 in respect of SARs is €12.7 million.
The carrying amount of the SAR liability as of December 31, 2005 is €22.7 million, compared to an intrinsic value of €12.2 million.
9. Recurring operating income
Recurring operating income is the primary indicator of the Group’s operating performance. It breaks down by division as follows:
(in € million) 12.31.2005 12.31.2004
Gucci 485.4 537.7
Bottega Veneta 13.7 (8.7)
Yves Saint Laurent (65.8) (79.9)
YSL Beauté 15.4 26.0
Other (59.2) (87.7)
Luxury Goods Division 389.5 387.4
Printemps 25.5 22.8
Redcats 231.3 231.2
Fnac 151.8 138.4
Conforama 177.1 206.8
CFAO 167.0 158.9
Other 1.6 1.4
Retail Division 754.3 759.5
Holding companies and other (59.7) (61.0)
Total 1,084.1 1,085.9
Group recurring operating income is €1,084.1 million in 2005, compared to €1,085.9 million in 2004. Recurring operating income for 2004 includes 14-months of activity for the Luxury Goods Division from November 1, 2003 to December 31, 2004. Based on pro forma fi gures Group recurring operating income is €986.2 million for the period January 1, 2004 to December 31, 2004, including €287.7 million for the Luxury Goods Division. The increase in recurring operating income on a pro forma basis is 9.9%.
“Holding companies and other” in recurring operating income includes a charge relating to application of IFRS 2 to share subscription and bonus share plans of the whole Group in the amount of €4.7 million in 2005 and €7.1 million in 2004.
Depreciation, amortisation and charges to provisions on non-current operating assets of €393.5 million is included in recurring operating income in 2005 (€411.3 million in 2004). Other non-cash operating income and expenses total €1.7 million in 2005 (€3.6 million in 2004).

180
Financial Information – Consolidated fi nancial statements
PPR 181
10. Other non-recurring operating income and expenses
(in € million) 2005 2004
Non-recurring operating expenses (117.2) (234.6)
Restructuring costs (41.7) (67.1)
Asset impairment (57.7) (147.5)
Other (17.8) (20.0)
Non-recurring operating income 107.2 340.3
Capital gains on divestments 90.0 322.9
Other 17.2 17.4
Total (10.0) 105.7
Other non-recurring operating income and expenses of the Group consist of unusual items likely to disrupt the appraisal of the economic performance of each division. They represented a net expense of €10.0 million in 2005. This heading includes non-recurring operating income of €107.2 million, including pre-tax capital gains of €90.0 million recognised on the sale of operating and fi nancial assets (including a capital gain of €70.3 million recognised on the sale of the Group’s interest in Facet) and non-recurring operating expenses of €117.2 million, including restructuring costs of €41.7 million and asset impairments of €57.7 million.
This heading represented net income of €105.7 million in 2004 and included non-recurring operating income of €340.3 million, and nota-bly the pre-tax capital gain of €322.9 million recognised on the sale of residual Group interests in the consumer credit business and non-recurring operating expenses of €234.6 million. Non-recurring operating expenses mainly comprise restructuring costs of €67.1 million and asset impairments of €147.5 million recognised by the Luxury Goods Division following the reorganization of certain of its branches. Asset impairments include €50.3 million in respect of intangible assets and €97.2 million in respect of deferred tax assets recognised in the past but that did not, at the balance sheet date, appear likely to be reversed in the short term based on business plans developed by the division’s new management.
11. Finance costs
Finance costs break down as follows:
(in € million) 12.31.2005 12.31.2004
Cost of net fi nancial indebtedness (259.6) (270.9)
Income from cash and cash equivalents 11.5 29.1
Cost of gross fi nancial indebtedness (271.1) (300.0)
Other fi nancial income and fi nance costs (52.0) (28.0)
Dividends received 14.9 24.9
Foreign exchange gains and losses (1.0) (0.4)
Gains and losses on derivative instruments not qualifying for hedge accounting (foreign exchange and interest rate)
(6.4) (3.7)
Impact of discounting assets and liabilities (10.6) (10.5)
Other fi nance costs (48.9) (38.3)
Total (311.6) (298.9)
Following the prospective application of IAS 32 and IAS 39 from January 1, 2005, the cost of net fi nancial indebtedness for 2005 takes into account the recognition at amortised cost of borrowings and the results generated by derivative transactions used to hedge bond issues or bank loans and which qualifi ed for hedge accounting.

181 Reference document 2005
12. Income taxes
12.1. Analysis of the income tax expense in respect of continuing operations
Income tax expense
(in € million) 2005 2004
Income before tax 762.5 892.7
Taxes paid out of operating income (210.7) (150.6)
Other taxes payable not impacting operating cash fl ow (35.4) (77.9)
Income tax payable (246.1) (228.5)
Deferred tax income/(expense) 53.9 (90.4)
Total tax charge (192.2) (318.9)
Effective tax rate 25.21% 35.72%
Reconciliation of the tax rate
(as a % of pre-tax income) 2005
Tax rate applicable in France 34.93%
Impact of taxation of foreign subsidiaries - 9.93%
Theoretical tax rate 25.00%
Effect of items taxed at reduced rates - 2.82%
Effect of permanent differences 2.02%
Effect of temporary differences not recognised - 0.08%
Effect of tax losses carried forward not recognised - 0.03%
Effect of changes in tax rates - 0.06%
Other 1.18%
Effective tax rate 25.21%
The income tax rate applicable in France of 34.93% is equal to the base rate of 33.33% plus the exceptional surtax of 1.5% and the social surtax of 3.3% (35.43% in 2004).
Recurring income tax rate
Excluding non-recurring items, the Group income tax rate is as follows:
(in € million) 2005 2004
Income before tax 762.5 892.7
Non-recurring items (10.0) 105.7
Recurring income before tax 772.5 787.0
Total tax charge (192.2) (318.9)
Tax on non-recurring items 5.5 (133.9)
Recurring tax charge (197.7) (185.0)
Recurring tax rate 25.59% 23.51%

182
Financial Information – Consolidated fi nancial statements
PPR 183
12.2. Movements in balance sheet headings
Income tax payable
(in € million)
12.31.2004 Impact of
application of IAS 32/39
01.01.2005 Net income
Cash outfl ows Changes in Group structure
Other items recognised
directly in shareholders’
equity
12.31.2005
Current tax receivables
46.2 46.2 52.0
Current tax liabilities
(266.6) (266.6) (355.7)
Net current tax liabilities
(220.4) 0.0 (220.4) (210.7) 141.9 (0.6) (13.9) (303.7)
Deferred tax
(in € million)
12.31.2004 Impact of
application of IAS 32/39
01.01.2005 Net income
Changes in Group structure
Other items recognised directly
in shareholders’ equity
12.31.2005
Deferred tax assets
425.7 17.6 443.3 585.6
Deferred tax liabilities
(1,859.7) (25.2) (1,884.9) (1,965.3)
Deferred tax (1,434.0) (7.6) (1,441.6) 53.9 8.0 (1,379.7)
(in € million)
01.01.2005 Net income
Other items recognised directly
in shareholders’ equity
12.31.2005
Intangible assets (1,606.7) 23.7 (3.8) (1,586.8)
Property, plant and equipment (181.2) 4.9 1.2 (175.1)
Other non-current assets (35.0) 6.5 (28.5)
Other current assets 106.5 20.3 4.7 131.5
Shareholders’ equity (28.4) 1.0 0.1 (27.3)
Borrowings 8.7 7.4 0.4 16.5
Provisions for retirement and similar benefi ts 56.7 11.4 4.9 73.0
Provisions 50.8 (15.7) (0.4) 34.7
Other current liabilities 138.2 (35.6) (1.9) 100.7
Tax losses and tax credits not utilised 48.8 30.0 2.8 81.6
Net deferred tax assets/(liabilities) (1,441.6) 53.9 8.0 (1,379.7)
Deferred tax assets 443.3 585.6
Deferred tax liabilities (1,884.9) (1,965.3)
Deferred tax (1,441.6) 53.9 8.0 (1,379.7)
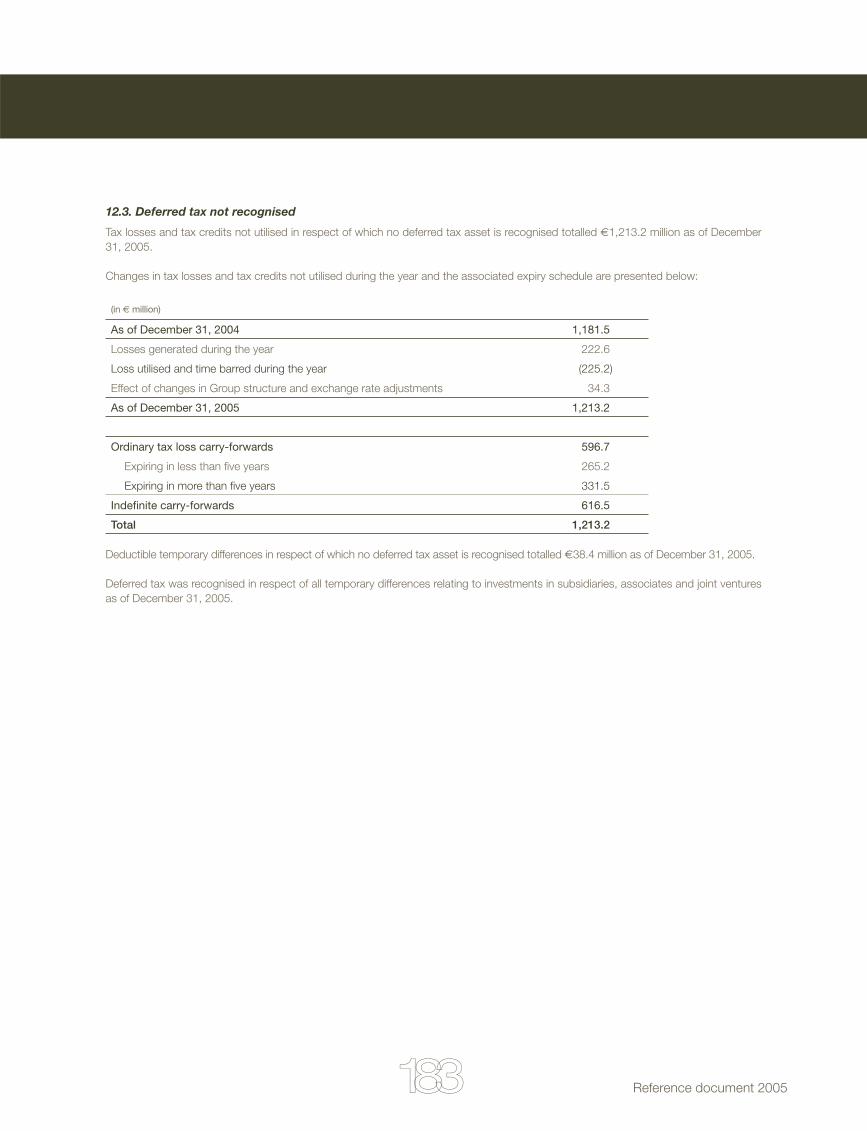
183 Reference document 2005
12.3. Deferred tax not recognised
Tax losses and tax credits not utilised in respect of which no deferred tax asset is recognised totalled €1,213.2 million as of December 31, 2005.
Changes in tax losses and tax credits not utilised during the year and the associated expiry schedule are presented below:
(in € million)
As of December 31, 2004 1,181.5
Losses generated during the year 222.6
Loss utilised and time barred during the year (225.2)
Effect of changes in Group structure and exchange rate adjustments 34.3
As of December 31, 2005 1,213.2
Ordinary tax loss carry-forwards 596.7
Expiring in less than fi ve years 265.2
Expiring in more than fi ve years 331.5
Indefi nite carry-forwards 616.5
Total 1,213.2
Deductible temporary differences in respect of which no deferred tax asset is recognised totalled €38.4 million as of December 31, 2005.
Deferred tax was recognised in respect of all temporary differences relating to investments in subsidiaries, associates and joint ventures as of December 31, 2005.

184
Financial Information – Consolidated fi nancial statements
PPR 185
13. Assets classifi ed as held for sale
Assets classifi ed as held for sale in 2004 concern the sale of the Group’s interest in Rexel.The Rexel group, control of which was transferred on December 10, 2004, meets IFRS 5 eligibility criteria as of January 1, 2004.Pursuant to IFRS 5, the Group ceased depreciating this disposal group and its assets from January 1, 2004.
Income Statement
(in € million) 12.31.2005 12.31.2004
Net income from discontinued operations 588.6
o/w attributable to equity holders of the parent 536.2
o/w attributable to minority interests 52.4
The Income statement of assets classifi ed as held for sale is as follows:
(in € million) 12.31.2005 12.31.2004
Revenue 6,485.5
Cost of sales (4,845.6)
Gross profi t 1,639.9
Payroll expenses (799.3)
Other recurring operating income and expenses (510.1)
Recurring operating income 330.5
Other non-recurring operating income and expenses (22.2)
Operating income 308.3
Finance costs, net (53.3)
Income before taxes 255.0
Income taxes (57.7)
Net income from the sale of discontinued operations 391.3
Net income 588.6
o/w attributable to equity holders of the parent 536.2
o/w attributable to minority interests 52.4
The change in cash with respect to assets classifi ed as held for sale breaks down as follows:
(in € million) 12.31.2005 12.31.2004
Net cash from operating activities 76.5
Net cash used in investing activities (31.8)
Net cash used in fi nancing activities (160.8)
Impact of exchange rate fl uctuations (0.4)
Net increase/(decrease) in cash and cash equivalents (116.5)
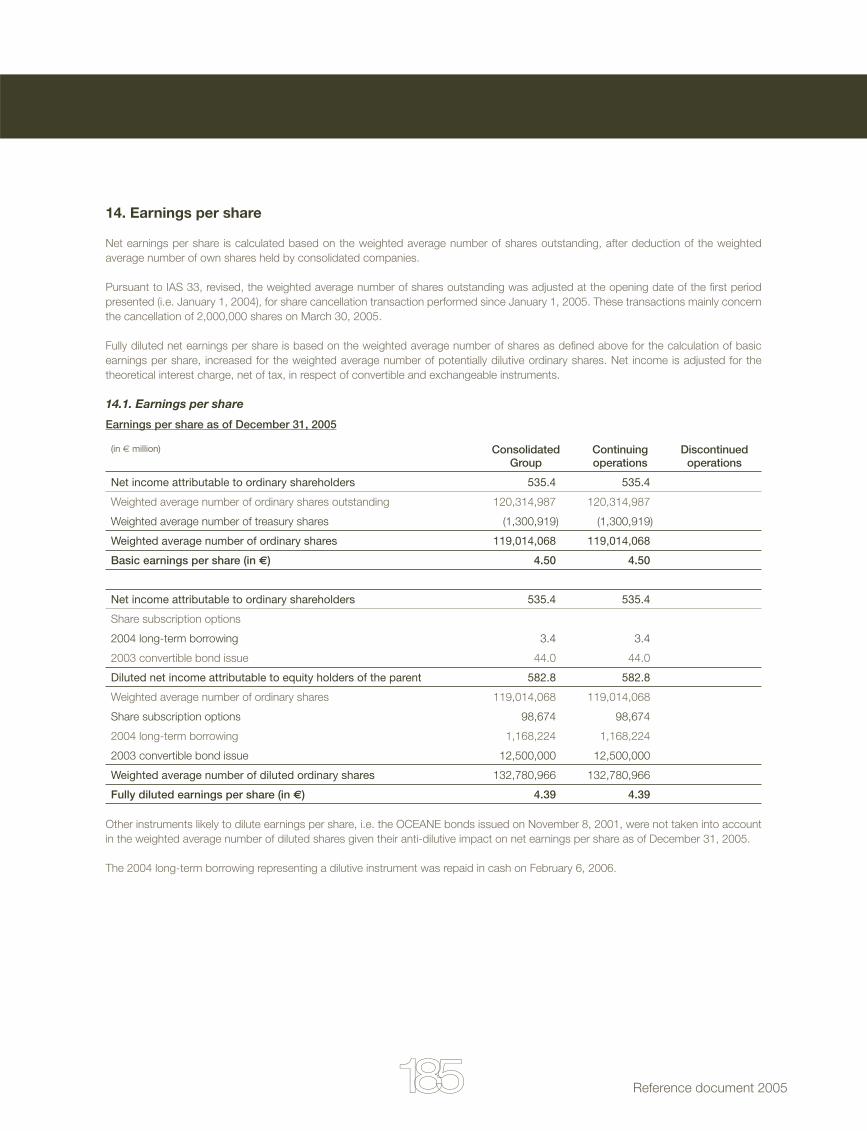
185 Reference document 2005
14. Earnings per share
Net earnings per share is calculated based on the weighted average number of shares outstanding, after deduction of the weighted average number of own shares held by consolidated companies.
Pursuant to IAS 33, revised, the weighted average number of shares outstanding was adjusted at the opening date of the fi rst period presented (i.e. January 1, 2004), for share cancellation transaction performed since January 1, 2005. These transactions mainly concern the cancellation of 2,000,000 shares on March 30, 2005.
Fully diluted net earnings per share is based on the weighted average number of shares as defi ned above for the calculation of basic earnings per share, increased for the weighted average number of potentially dilutive ordinary shares. Net income is adjusted for the theoretical interest charge, net of tax, in respect of convertible and exchangeable instruments.
14.1. Earnings per share
Earnings per share as of December 31, 2005
(in € million) Consolidated Group
Continuing operations
Discontinued operations
Net income attributable to ordinary shareholders 535.4 535.4
Weighted average number of ordinary shares outstanding 120,314,987 120,314,987
Weighted average number of treasury shares (1,300,919) (1,300,919)
Weighted average number of ordinary shares 119,014,068 119,014,068
Basic earnings per share (in €) 4.50 4.50
Net income attributable to ordinary shareholders 535.4 535.4
Share subscription options
2004 long-term borrowing 3.4 3.4
2003 convertible bond issue 44.0 44.0
Diluted net income attributable to equity holders of the parent 582.8 582.8
Weighted average number of ordinary shares 119,014,068 119,014,068
Share subscription options 98,674 98,674
2004 long-term borrowing 1,168,224 1,168,224
2003 convertible bond issue 12,500,000 12,500,000
Weighted average number of diluted ordinary shares 132,780,966 132,780,966
Fully diluted earnings per share (in €) 4.39 4.39
Other instruments likely to dilute earnings per share, i.e. the OCEANE bonds issued on November 8, 2001, were not taken into account in the weighted average number of diluted shares given their anti-dilutive impact on net earnings per share as of December 31, 2005.
The 2004 long-term borrowing representing a dilutive instrument was repaid in cash on February 6, 2006.

186
Financial Information – Consolidated fi nancial statements
PPR 187
Earnings per share as of December 31, 2004 (1)
(in € million) Consolidated Group
Continuing operations
Discontinued operations
Net income attributable to ordinary shareholders 1,065.1 528.9 536.2
Weighted average number of ordinary shares outstanding 120,297,138 120,297,138 120,297,138
Weighted average number of treasury shares (943,168) (943,168) (943,168)
Weighted average number of ordinary shares 119,353,970 119,353,970 119,353,970
Earnings per share (in €) 8.92 4.43 4.49
Net income attributable to ordinary shareholders 1,065.1 528.9 536.2
Share subscription options
2001 convertible bond issue 1.5 1.5
2004 long-term borrowing 1.9 1.9
2003 convertible bond issue 28.6 28.6
Diluted net income attributable to equity holders of the parent 1,097.1 560.9 536.2
Weighted average number of ordinary shares 119,353,970 119,353,970 119,353,970
Share subscription options 75,970 75,970 75,970
2001 convertible bond issue 991,605 991,605 991,605
2004 long-term borrowing 1,050,125 1,050,125 1,050,125
2003 convertible bond issue 12,500,000 12,500,000 12,500,000
Fully diluted earnings per share (in €) 133,971,670 133,971,670 133,971,670
Fully diluted earnings per share (in €) 8.19 4.19 4.00 (1) Gucci is consolidated for a 14-month period from November 2003 to December 2004.

187 Reference document 2005
14.2. Earnings per share from continuing operations excluding non-recurring items
Non-recurring items consist of the income statement line item “Other non-recurring operating income and expenses” net of tax and minority interests.
(in € million) As of December 31, 2005
As of December 31, 2004 (1)
Net income attributable to ordinary shareholders 535.4 528.9
Other non-recurring operating income and expenses (10.0) 105.7
Income tax on other non-recurring operating income and expenses 5.5 (133.9)
Minority interests in other non-recurring operating income and expenses 0.9 5.1
Net income excluding non-recurring items 539.0 552.0
Weighted average number of ordinary shares outstanding 120,314,987 120,297,138
Weighted average number of treasury shares (1,300,919) (943,168)
Weighted average number of ordinary shares 119,014,068 119,353,970
Basic earnings per share excluding non-recurring items (in €) 4.53 4.62
Net income excluding non-recurring items 539.0 552.0
Share subscription options
2001 convertible bond issue 1.5
2004 long-term borrowing 3.4 1.9
2003 convertible bond issue 44.0 28.6
Diluted net income attributable to equity holders of the parent 586.4 584.0
Weighted average number of ordinary shares 119,014,068 119,353,970
Share subscription options 98,674 75,970
2001 convertible bond issue 991,605
2004 long-term borrowing 1,168,224 1,050,125
2003 convertible bond issue 12,500,000 12,500,000
Weighted average number of diluted ordinary shares 132,780,966 133,971,670
Fully diluted earnings per share (in €) 4.42 4.36
(1) Gucci is consolidated for a 14-month period from November 2003 to December 2004.

188
Financial Information – Consolidated fi nancial statements
PPR 189
15. Goodwill
(in € million) Gross Impairment losses
Net
Goodwill as of January 1, 2004 5,147.8 (157.2) 4,990.6
Acquisitions 491.7 491.7
Disposals (27.5) (27.5)
Impairment losses (21.0) (21.0)
Translation adjustments (47.8) 10.6 (37.2)
Goodwill as of December 31, 2004 5,564.2 (167.6) 5,396.6
Impact of application of IAS 32/39 88.8 88.8
Goodwill as of January 1, 2005 5,653.0 (167.6) 5,485.4
Acquisitions 27.0 27.0
Impairment losses (31.2) (31.2)
Call options granted to minority interests (4.9) (4.9)
Translation adjustments 92.4 (22.8) 69.6
Goodwill as of December 31, 2005 5,767.5 (221.6) 5,545.9
All goodwill recognised in 2005 was allocated to cash generating units at the balance sheet date.
The application of IAS 32/39 as of January 1, 2005 impacted call options granted to minority interests (note 36.3.3).
16. Other intangible assets
(in € million) Brands Other intangible assets
Total
Gross carrying amount as of January 1, 2004 6,255.5 756.2 7,011.7
Acquisitions 67.0 67.0
Disposals (8.1) (8.1)
Translation adjustments (0.1) (13.6) (13.7)
Gross carrying amount as of December 31, 2004 6,255.4 801.5 7,056.9
Amortisation & impairment losses as of January 1, 2004 (9.3) (321.9) (331.2)
Disposals 5.1 5.1
Amortisation (1.8) (90.5) (92.3)
Impairment losses (14.6) (14.7) (29.3)
Translation adjustments 0.4 8.8 9.2
Amortisation & impairment losses as of December 31, 2004 (25.3) (413.2) (438.5)
Net carrying amount as of January 1, 2004 6,246.2 434.3 6,680.5
Acquisitions 67.0 67.0
Disposals (3.0) (3.0)
Amortisation (1.8) (90.5) (92.3)
Impairment losses (14.6) (14.7) (29.3)
Translation adjustments 0.3 (4.8) (4.5)
Net carrying amount as of December 31, 2004 6,230.1 388.3 6,618.4

189 Reference document 2005
(in € million) Brands Other intangible assets
Total
Gross carrying amount as of December 31, 2004 6,255.4 801.5 7,056.9
Changes in Group structure 0.5 0.5
Acquisitions 72.1 72.1
Disposals (19.0) (19.0)
Translation adjustments 1.0 10.4 11.4
Gross carrying amount as of December 31, 2005 6,256.4 865.5 7,121.9
Amortisation & impairment losses as of December 31, 2004 (25.3) (413.2) (438.5)
Disposals 18.6 18.6
Amortisation (2.6) (66.1) (68.7)
Impairment losses (2.0) (17.5) (19.5)
Translation adjustments (0.9) (7.9) (8.8)
Other movements 0.4 (0.4)
Amortisation & impairment losses as of December 31, 2005 (30.4) (486.5) (516.9)
Net carrying amount as of December 31, 2004 6,230.1 388.3 6,618.4
Change in Group structure 0.5 0.5
Acquisitions 72.1 72.1
Disposals (0.4) (0.4)
Amortisation (2.6) (66.1) (68.7)
Impairment losses (2.0) (17.5) (19.5)
Translation adjustments 0.1 2.5 2.6
Other movements 0.4 (0.4)
Net carrying amount as of December 31, 2005 6,226.0 379.0 6,605.0

190
Financial Information – Consolidated fi nancial statements
PPR 191
17. Property, plant and equipment
(in € million) Land and buildings
Plant and equipment
Other PP&E
Total
Gross carrying amount as of December 31, 2004 1,991.9 2,767.1 281.4 5,040.4
Changes in Group structure (72.4) (1.5) 0.1 (73.8)
Acquisitions 20.4 186.7 81.6 288.7
Disposals (22.2) (83.1) (9.2) (114.5)
Translation adjustments 27.5 54.2 6.4 88.1
Other movements 22.3 16.4 (61.4) (22.7)
Gross carrying amount as of December 31, 2005 1,967.5 2,939.8 298.9 5,206.2
Depreciation & impairment losses as of December 31, 2004
(569.4) (1,717.9) (129.6) (2,416.9)
Changes in Group structure (0.7) 1.8 0.1 1.2
Disposals 11.2 74.0 4.6 89.8
Depreciation (52.9) (258.8) (16.9) (328.6)
Impairment losses (7.0) (7.0)
Translation adjustments (5.7) (27.4) (1.1) (34.2)
Other movements 5.1 27.9 (4.8) 28.2
Depreciation & impairment losses as of December 31, 2005
(619.4) (1,900.4) (147.7) (2,667.5)
Net carrying amount as of December 31, 2004 1,422.5 1,049.2 151.8 2,623.5
Changes in Group structure (73.1) 0.3 0.2 (72.6)
Acquisitions 20.4 186.7 81.6 288.7
Disposals (11.0) (9.1) (4.6) (24.7)
Depreciation (52.9) (258.8) (16.9) (328.6)
Impairment losses (7.0) (7.0)
Translation adjustments 21.8 26.8 5.3 53.9
Other movements 27.4 44.3 (66.2) 5.5
Net carrying amount as of December 31, 2005 1,348.1 1,039.4 151.2 2,538.7
o/w assets owned outright 1,101.3 1,039.4 125.0 2,265.7
o/w assets held under fi nance lease 246.8 26.2 273.0
Charges to depreciation are recorded in “Cost of sales” and “Other recurring operating income and expenses” in the Income Statement.

191 Reference document 2005
18. Impairment losses
As a result of annual impairment tests performed in 2005, the Group recognised the following impairment losses:• irreversible impairment losses of €28.2 million in respect of goodwill relating to the Conforama Spain cash generating unit (CGU), equal
to the difference between the net carrying amount of the Conforama Spain CGU and its value in use calculated using a discount rate of 8.7% and a perpetual growth rate of 0.5%;
• impairment losses of €22.5 million in respect of other intangible assets of the Luxury Goods Division;• impairment losses of €7.0 million in respect of Conforama Poland property, plant and equipment.
These impairment losses were recorded in “Other non-recurring operating income and expenses” in the Income Statement.
Impairment tests performed in accordance with the method described in note 2.7 did not identify any impairment losses in 2005 in res-pect of intangible assets, property, plant and equipment and goodwill of CGUs, other than those described above in 2005.
The following pre-tax discount rates and perpetual growth rates are applied to estimated cash fl ows in determining economic assump-tions and in forecasting operating conditions used by the Group:
Discount rate Perpetual growth rate
2005 2004 2005 2004
Luxury Goods Division 9.0% - 11.4% 8.0% - 13.5% 2.0% - 3.5% 2.0% - 5.0%
Retail Division (excl. emerging geographical areas (1)) 7.0% - 10.9% 7.3% - 13.5% 0.5% - 1.5% 0.5% - 2.0%
Emerging geographical areas (1) 9.4% - 15.5% 8.4% - 18.8% 2.0% - 5.0% 3.0% - 5.0%
(1) Emerging geographical areas include African countries and some of the Latin American and Eastern European countries.
19. Investments in associates
12.31.2005 12.31.2004
(in € million) Reserves Net income Total Total
Sodice Expansion 21.4 3.3 24.7 24.0
Other 19.2 0.1 19.3 22.9
Total 40.6 3.4 44.0 46.9
Based on the share price as of December 31, 2005, the value of the Group investment in Sodice Expansion is €51.3 million.
20. Non-current fi nancial assets
Non-current fi nancial assets break down as follows:
(in € million) 12.31.2005 12.31.2004
Non-consolidated investments 40.7 73.6
Derivative fi nancial instruments 65.3
Non-consolidated investment loans and receivables 29.5 29.3
Deposits and guarantees 80.8 72.7
Other 24.5 65.6
Total 240.8 241.2

192
Financial Information – Consolidated fi nancial statements
PPR 193
21. Inventories
(in € million) 12.31.2005 12.31.2004
Commercial inventories 2,911.1 2,720.4
Industrial inventories 235.1 199.2
Gross carrying amount 3,146.2 2,919.6
Allowances (319.0) (287.0)
Net carrying amount 2,827.2 2,632.6
Movements in allowances
Allowances as of December 31, 2004 (287,0)
(Charge)/reversal (24,4)
Changes in Group structure (0,8)
Translation adjustments (6,8)
Allowances as of December 31, 2005 (319,0)
Inventories with a net carrying amount of €89.2 million have been pledged to secure liabilities as of December 31, 2005.
22. Other current assets and liabilities
(in € million) 12.31.2004 Impact of application of IAS 32/39
01.01.2005 Working capital cash fl ows
Other cash fl ows
Changes in Group structure
Translation adjustments
and other
12.31.2005
Inventories 2,632.6 2,632.6 130.1 1.2 63.3 2,827.2
Trade receivables 1,052.5 9.8 1,062.3 36.5 0.3 26.5 1,125.6
Customer loans 419.1 419.1 (8.3) 5.8 416.6
Other current fi nancial assets and liabilities
135.3 (86.7) 48.6 (1.1) (33.8) (0.1) 17.0 30.6
Current tax receivables/liabilities
(220.4) (220.4) (68.8) (0.6) (13.9) (303.7)
Trade payables (2,643.8) 4.3 (2,639.5) (90.1) (0.4) (28.1) (2,758.1)
Other current assets and liabilities
(1,122.9) (23.0) (1,145.9) (139.3) 123.0 (72.8) (1,235.0)
Working capital requirements
252.4 (95.6) 156.8 (72.2) 20.4 0.4 (2.2) 103.2
Given the nature of these activities, the Group’s exposure to customer default would not have a material impact on the Group’s business, fi nancial position or assets.
23. Other current fi nancial assets
Current fi nancial assets primarily comprise derivative fi nancial instruments.

193 Reference document 2005
24. Cash and cash equivalents
24.1. Breakdown by category
This item breaks down as follows:
(in € million) 12.31.2005 01.012005 12.31.2004
Short-term receivables on divestments 2,181.8 2,181.8
Cash 713.6 684.1 684.3
Cash equivalents 1 099.6 996.9 1,422.0
Total 1,813.2 3,862.8 4,288.1
Following the prospective application of IAS 32 as of January 1, 2005, treasury shares are deducted from consolidated shareholders’ equity (impact on “Cash and cash equivalents” of €345.8 million at this date).
As of December 31, 2005, cash equivalents include UCITS, certifi cates of deposits and term deposits with a maturity of less than 3 months.
As of December 31, 2004, short-term receivables on divestments concerned the sale of Rexel for €1,916.7 million and the sale of 10% of the consumer credit business for €265.1 million.
24.2. Breakdown by currency
(in € million) 12.31.2005 % 12.31.2004 %
Euro 1,309.5 72.2% 3,860.7 90.0%
US dollar 321.0 17.7% 202.2 4.7%
Swiss franc 55.1 3.0% 96.0 2.2%
Pound sterling 43.8 2.4% 21.0 0.5%
CFA franc 24.9 1.4% 15.3 0.4%
Other currencies 58.9 3.3% 92.9 2.2%
Total 1,813.2 4,288.1
25. Shareholders’ equity
The share capital as of December 31, 2005 is €481,792,920, comprising 120,448,230 fully paid-up shares with a par value of €4 each (122,434,480 shares with a par value of €4 each as of December 31, 2004).
25.1. Treasury share transactions
On March 30, 2005, in accordance with the authorisations granted by the Annual General Meeting, the Group’s Management Board decided to cancel 2 million treasury shares, thus bringing PPR share capital to 120,438,230 shares with a par value of €4 each.
During 2005, the Group made net disposals of 2,738,618 shares as follows:- 1,108,132 shares were sold by blocks between May 18, and June 10, 2005 through market brokers acting independently, at an average
price of €81.058 per share;- 1,560,000 shares were sold on June 27, 2005 via an over-the-counter transaction at a price of €83.7 per share;- 195,000 shares were sold under the liquidity contract;- 124,514 shares were purchased following the exercise of PPR call options hedging the share option plans.

194
Financial Information – Consolidated fi nancial statements
PPR 195
Finally, the Group purchased 3,394,062 PPR call options in order to hedge the following transactions:- -3 million PPR call options maturing in 2008 to partially hedge the 2008 OCEANE bonds;- 394,062 PPR call options to hedge the share option plans issued in 2005, including 124,514 options exercised during the year.
During 2004, and given that the Group opted to apply IAS 32 prospectively from January 1, 2005, the impact of acquisitions or disposals of treasury shares primarily represents:• the disposal of 1,300,000 PPR treasury shares recognised in Group consolidated shareholders’ equity for €108.9 million;• the mark-to-marketing of PPR treasury shares intended for employees or to stabilise the share price for negative €8.5 million. These
shares were previously recognised in cash equivalents in the Group fi nancial statements.
On May 26, 2004, PPR signed an agreement with a fi nancial broker in order to improve the liquidity of transactions and the stability of share prices.This agreement complies with the ethics charter defi ned by the AFEI (the French association of investment companies).The agreement was initially contracted for €40 million, equally divided between cash and PPR shares. On September 3, 2004, an additional €20 million in cash was added.
2,391,400 PPR shares were purchased and 2,586,400 shares disposed of under this agreement in 2005.
25.2. Appropriation of 2005 net income
The Board of Directors will propose a dividend distribution of €2.72 per share in respect of 2005, representing a total dividend distribution of €327.3 million, to the Ordinary Shareholders’ Meeting held to adopt the fi nancial statements for the year ended December 31, 2005A dividend of €2.52 per share was distributed in respect of 2004.
26. Employee benefi ts and equivalent
In accordance with the laws and practices in each country, Group employees receive long-term or post-employment benefi ts in addition to short-term remuneration. These additional benefi ts take the form of defi ned contribution or defi ned benefi t plans.
Under defi ned contribution plans, the Group is not obliged to make any additional payments above contributions already made. Contri-butions to these plans are expensed as incurred.
An actuarial valuation is performed of defi ned benefi t plans by independent experts. The benefi ts concerned primarily consist of retire-ment termination payments and jubilees in France, complementary pension schemes in the United Kingdom, statutory dismissal com-pensation in Italy (TFR), and mandatory complementary pension schemes (LPP) in Switzerland.
The Group does not have any obligations under medical plans.

195 Reference document 2005
26.1. Change during the year
The increase in the present value of the obligation in respect of defi ned benefi t plans breaks down as follows:
Present value of obligation as of December 31, 2004 470.8
Current service cost 28.4
Contributions by benefi ciaries 3.3
Interest cost 22.9
Benefi ts paid (22.0)
Past service cost 1.1
Actuarial gains and losses 31.6
Curtailments and settlements (5.8)
Changes in Group structure 3.0
Exchange differences 5.2
Present value of obligation as of December 31, 2005 538.5
The present value of the obligation as of December 31, 2005 of €538.5 million comprises:• €132.4 million in respect of fully unfunded plans;• €406.1 million in respect of fully or partially funded plans.
The increase in the fair value of defi ned benefi t plan assets breaks down as follows:
Fair value of defi ned benefi t plan assets as of December 31, 2004 212.2
Contributions by employer 25.0
Contributions by benefi ciaries 3.3
Expected return on plan assets 12.1
Benefi ts paid (22.0)
Actuarial gains and losses 14.0
Settlements
Changes in Group structure
Exchange differences 4.0
Fair value of defi ned benefi t plan assets as of December 31, 2005 248.6
Funded defi ned benefi t plan assets are invested as follows: • insurance contracts represent 50% of the total fair value of assets;• equity instruments represent 27%;• debt instruments represent 16%;• and other assets represent 7%.

196
Financial Information – Consolidated fi nancial statements
PPR 197
Balance sheet data can be reconciled with the actuarial obligation in respect of defi ned benefi t plans as follows as of December 31, 2005:
12.31.2005 12.31.2004
Present value of the obligation 538.5 470.8
Fair value of defi ned benefi t plan assets (248.6) (212.2)
Funding shortfall/(excess) 289.9 258.6
Actuarial gains and losses not recognised
Past service costs not recognised (10.5) (11.1)
Amount not recognised in assets
Fair value of redemption rights
Provisions (net assets) recognised in the balance sheet 279.4 247.5
Experience adjustments on plan liabilities 5.9% 7.1%
Experience adjustments on plan assets 5.6% 5.9%
As of the balance sheet date, the Group had not decided the amount of any contributions to the funds in the coming year.
26.2. Charge recognised in the Income Statement
The total charge of €35.0 million recognised in respect of defi ned benefi t plans breaks down as follows:
Current service cost 28.4
Interest cost 22.9
Expected return on plan assets (12.1)
Actuarial gains/losses recognised in net income
Past service costs expensed in net income 1.1
Curtailments and settlements (5.3)
Other
Total charge 35.0
o/w recognised in operating expenses 25.4
in fi nance costs 9.6
In accordance with the option offered by IAS 19, as amended in December 2004, the Group recognises actuarial gains and losses on defi ned benefi t plans directly in equity in the year arising.
Total actuarial differences of €17.9 million were taken to shareholders’ equity in 2005.Accumulated actuarial gains and losses recognised in shareholders’ equity since January 1, 2004 amount to €36.5 million as of December 31, 2005.
26.3. Actuarial assumptions
The main actuarial assumptions used to estimate the Group’s obligations are as follows:
Total France
TotalSwitzerland
TotalItaly
TotalUnited Kingdom
Totalother
2005 2004 2005 2004 2005 2004 2005 2004 2005 2004
Discount rate 4.50% 4.70% 2.75% 3.25% 4.50% 5.00% 5.00% 5.38% 4.74% 5.29%
Expected rate of return on plan assets
4.75% 5.25% 5.00% 5.00% 6.23% 6.21% 7.00% 7.00%
Expected rate of increase in salaries
2.89% 2.92% 2.00% 2.25% 4.36% 4.25% 3.51% 3.19% 2.84% 2.00%

197 Reference document 2005
27. Provisions
(in € million) 12.31.2004 Impact of application of IAS 32/39
01.01.2005 Charge Reversal used
Reversal unused
Translation adjustments
Changes in Group structure
Other 12.31.2005
Provisions for restructuring: non-current
2.1 2.1 (0.8) (0.5) 0.8
Provision for claims and litigation: non-current
25.2 25.2 5.7 (5.7) (2.6) 0.4 0.8 (4.0) 19.8
Other provisionsnon-current
137.5 (13.7) 123.9 1.1 (4.3) (0.1) 1.5 122.1
Other provisions for contingencies and losses: non-current
164.8 (13.7) 151.2 6.8 (10.8) (2.7) 0.4 0.8 (3.0) 142.7
Provisions for restructuring: current
1.6 1.6 1.6 (1.9) 0.5 1.7 3.5
Provision for claims and litigation: current
83.2 83.2 10.8 (22.7) (25.6) 3.9 49.6
Other provisions: current
98.7 (60.9) 37.7 4.1 (8.2) (0.2) 0.1 (1.6) 31.9
Other provisions for contingencies and losses: current
183.5 (60.9) 122.5 16.5 (32.8) (25.8) 0.1 0.5 4.0 85.0
Other provisions for contingencies and losses
348.3 (74.6) 273.7 23.3 (43.6) (28.5) 0.5 1.3 1.0 227.7
Income Statement impact (23.3) 28.5 5.2
Impact on recurring operating income
(13.1) 4.7 (8.4)
Impact on other non-recurring operating income and expenses
(9.0) 23.5 14.5
Impact on income taxes (1.2) 0.3 (0.9)
Provisions for claims and litigation mainly include employee disputes and litigation with tax authorities in various countries.
Other provisions mainly cover risks relating to vendor warranties.
Reversals of unused provisions mainly concern the settlement of tax disputes and the extinction of vendor warranty risks.

198
Financial Information – Consolidated fi nancial statements
PPR 199
28. Borrowings
28.1. Breakdown of borrowings by maturity
(in € million) 12.31.2005 Y+1 Y+2 Y+3 Y+4 Y+5 Beyond
Long-term borrowings 4,398.9 739.9 1,342.3 818.4 99.3 1,399.0
Convertible bonds 1,201.3 143.3 1,058.0
Other bonds 2,265.5 402.0 2.4 748.0 1,113.1
Confi rmed lines of credit
Other bank borrowings 607.6 135.2 254.1 48.8 75.3 94.2
Obligations under fi nance leases 149.5 27.7 17.4 9.0 8.4 87.0
Employee profi t-sharing 36.5 6.9 7.4 9.6 12.6
Other borrowings 138.5 24.8 3.0 3.0 3.0 104.7
Short-term borrowings 2,480.8 2,480.8
Other bonds 2.1 2.1
Confi rmed lines of credit 192.5 192.5
Draw-downs on unconfi rmed lines of credit
90.9 90.9
Other bank borrowings 527.9 527.9
Obligations under fi nance leases 28.9 28.9
Employee profi t-sharing 10.4 10.4
Bank overdrafts 472.9 472.9
Commercial paper 1,025.2 1,025.2
Other borrowings 130.0 130.0
Total 6,879.7 2,480.8 739.9 1,342.3 818.4 99.3 1,399.0
% 36.1% 10.8% 19.5% 11.9% 1.4% 20.3%

199 Reference document 2005
(in € million) 12.31.2004 Y+1 Y+2 Y+3 Y+4 Y+5 Beyond
Long-term borrowings 6,103.2 904.3 1,776.2 1,428.5 872.3 1,121.9
Convertible bonds 1,228.7 149.2 1,079.5
Other bonds 1,955.5 1.0 401.2 1.4 752.1 799.8
Confi rmed lines of credit 1,877.6 415.9 1,167.9 149.3 76.0 68.5
Other bank borrowings 815.3 446.4 21.4 170.6 20.2 156.7
Obligations under fi nance leases 168.6 31.1 25.8 16.5 11.1 84.1
Employee profi t-sharing 32.7 6.9 7.7 8.2 9.9
Other borrowings 24.8 3.0 3.0 3.0 3.0 12.8
Short-term borrowings 3,329.3 3,329.3
Short-term borrowings 837.1 837.1
Confi rmed lines of credit 324.3 324.3
Draw-downs on unconfi rmed lines of credit
136.2 136.2
Other bank borrowings 60.7 60.7
Obligations under fi nance leases 28.1 28.1
Employee profi t-sharing 6.5 6.5
Bank overdrafts 243.4 243.4
Commercial paper 1,310.3 1,310.3
Other borrowings 382.7 382.7
Total 9,432.5 3,329.3 904.3 1,776.2 1,428.5 872.3 1,121.9
% 35.3% 9.6% 18.8% 15.1% 9.3% 11.9%
The application of IAS 32 and IAS 39 as of January 1, 2005 resulted in the recognition of the OCEANE bonds issued on November 8, 2001 and May 21, 2003 based on their effective interest rate, after allocation of the conversion options component to shareholders’ equity.
As of December 31, 2005, all gross borrowings are recognised at amortised cost based on an effective interest rate taking into account any identifi ed issue costs and redemption or issue premiums relating to each liability.
In addition, fair value adjustments of €19.2 million were recognised as of December 31, 2005 in respect of borrowings, mainly in the form of bond issues, partially or fully hedged under fair value hedging relationships.
As of December 31, 2005, bonds, including convertible bonds, represented 50.4% of gross borrowings compared to 42.6% in 2004.
Debts maturing after more than one year represented 63.9% of total gross borrowings as of December 31, 2005, compared to 64.7% as of December 31, 2004.
Confi rmed lines of credit totalled €5,105.6 million at the balance sheet date and were drawn down €192.5 million.

200
Financial Information – Consolidated fi nancial statements
PPR 201
The undrawn balance on these confi rmed lines of credit backs the commercial paper issue programme, which represented total outstandings of €1,025.2 million as of December 31, 2005, compared to €1,310.3 million as of December 31, 2004.
Short-term drawdowns on facilities backed by confi rmed lines of credit of more than one year are included in long-term debt.Accrued interest is recorded in “Other borrowings”.
The fi nancing of customer loans contributed €416.6 million to gross borrowings as of December 31, 2005.
28.2. Breakdown by repayment currency
(in € million) 12.31.2005 Long-term borrowings
Short-term borrowings
% 12.31.2004 %
Euro 5,894.1 3,893.6 2,000.5 85.7% 8,439.7 89.4%
Yen 368.8 216.5 152.3 5.4% 406.0 4.3%
Pound Sterling 174.0 168.9 5.1 2.5% 184.9 2.0%
US dollar 132.7 87.4 45.3 1.9% 129.7 1.4%
CFA franc 88.7 2.4 86.3 1.3% 101.6 1.1%
Other currencies 221.4 30.1 191.3 3.2% 170.6 1.8%
Total 6,879.7 4,398.9 2,480.8 9,432.5
Borrowings denominated in currencies other than the euro are distributed to Group subsidiaries for local fi nancing purposes.
28.3. Breakdown of gross borrowing by category
PPR Group gross borrowing break downs as follows:
(in € million) 12.31.2005 01.01.2005 12.31.2004
Convertible bonds 1,201.3 1,158.7 1,228.7
Other bonds 2,267.6 2,818.2 2,792.6
Other bank borrowings 1,135.5 876.3 876.0
Confi rmed lines of credit 192.5 2,201.9 2,201.9
Draw-downs on unconfi rmed lines of credit 90.9 136.2 136.2
Commercial paper 1,025.2 1,307.9 1,310.3
Obligations under fi nance leases 178.4 196.7 196.7
Employee profi t-sharing 46.9 39.2 39.2
Bank overdrafts 472.9 255.5 243.4
Other borrowings 268.5 561.9 407.5
Total 6,879.7 9,552.5 9,432.5
Group borrowing primarily consist of bonds, bank borrowings, drawdowns on confi rmed lines of credit and commercial paper issues, which account for 88.5% of gross borrowings as of December 31, 2005.

201 Reference document 2005
28.4. Bond issues
Bonds convertible, exchangeable or redeemable in shares issued by PPR
(in € million)
Face value Issue interest
rate
Effective interest
rate
Issue date Documented/ non-documented
hedge
Maturity 12.31.2005 01.01.2005 12.31.2004
149.2 (1) 1.50%fi xed
5.72% 11.08.2001 Euribor 1 month fl oating rate swap
in the amount of €149 million
Not documented under IFRS
01.01.2007 143.3 137.6 149.2
1,079.5 (2) 2.50%fi xed
6.26% 05.21.2003 01.01.2008 1,058.0 1,021.1 1,079.5
(1) Issue price: bonds convertible and/or exchangeable for shares (OCEANE) issued on November 8, 2001, for €1,380,000,050 represented by 8,492,308 bonds with a face value of €162.50.Conversion and/or exchange for shares: until December 31, 2001 on the basis of 1.157 shares per bond, and as of January 1, 2002 on the basis of one share per bond.Normal redemption: in full on January 1, 2007 at a price of €162.50.Gross yield to maturity of unconverted bonds: 1.5%.The balance of 918,225 bonds outstanding as of December 31, 2005 refl ects:• the conversion of 3,077,000 bonds by Artémis in 2001,• the buyback of 107,422 bonds for €17,456,075 in 2002,• the buyback of 17,609 bonds for €2,861,462,50 in 2003, • the early redemption after the exercise of the investor Put in 2003 of 4,285,376 bonds with a face value of €696,373,600,• the early redemption after the exercise of the investor Put in 2004 of 86,603 bonds with a face value of €14,072,987,50.Issue swap: the OCEANE was swapped in the amount of €149.2 million in order to switch from a fi xed rate to a fl oating rate and to set the maturity. Hedge documentation has not been established for this swap pursuant to IAS 39.
(2) Issue price: issue of bonds convertible and/or exchangeable for shares (OCEANE) issued on May 21, 2003 represented by 12,500,000 bonds with a face value of €86.36.Conversion and/or exchange for shares: at any time from May 21, 2003 on the basis of one share for one bond.Normal redemption: the bonds will be fully redeemed on January 1, 2008 at a price of €91.14 per bond, i.e. approximately 105.535% of the bonds’ face value.Gross yield to maturity of unconverted bonds: 3.6250%.
Pursuant to transition to IFRS, the Group calculated retrospectively the fi nancial liability and equity components of these two hybrid instruments at the issue date, and deduced the value of the bond component to be recognised as of January 1, 2005.
The amounts recognised in the balance sheet as of January 1, 2005 and December 31, 2005 have been determined using amortised cost accounting rules based on the effective interest rate, after taking into account the equity component and the reallocation of issue costs and redemption premiums.
(in € million) 12.31.2005 01.01.2005
Face value of convertible bonds 1,228.7 1,228.7
Equity component (conversion option) (120.9) (120.9)
Debt component (EIR adjustment) 93.5 50.9
Amortised cost at the balance sheet date, excluding accrued interest 1,201.3 1,158.7 These amounts are presented before deferred tax. Accrued interest is recorded in “Other borrowings”.

202
Financial Information – Consolidated fi nancial statements
PPR 203
Bonds issued by PPR
The Group has a EMTN (Euro Medium-Term Note) programme with a ceiling of €3,000 million at the balance sheet date.As of December 31, 2005, bonds issued under this programme totalled €2,250 million.All borrowings benefi t from the PPR Group rating awarded by Standard & Poor’s, of BBB-with a stable outlook.
(in € million)
Face value Issue interest
rate
Effective interest
rate
Issue date Documented/ non-documented
hedge
Maturity 12.31.2005 01.01.2005 12.31.2004
750.0 (1) 5.00% fi xed
5.20% 07.23.2003 Euribor 3 month fl oating rate swap
in the amount of €500 million
Documented under IFRS
01.23.2009 745.7 749.0 750.0
800.0 (2) 5.25% fi xed
5.34% 03.29.2004 Euribor 3 month fl oating rate swap
in the amount of €650 million
Documented under IFRS
03.29.2011 814.7 814.1 800.0
400.0 (3) Euribor 3 months +0.50% fl oating
- 10.22.2004 - 10.22.2007 399.7 399.6 400.0
300.0 (4) 4.00% fi xed
4.08% 06.29.2005 - 01.29.2013 298.4 - -
(1) Issue price: bond issue on July 23, 2003, represented by 750,000 bonds with a face value of €1,000 as part of the EMTN program.Redemption: in full on January 23, 2009.
(2) Issue price: bond issue, represented by 800,000 bonds with a face value of €1,000 as part of the EMTN program , comprising 650,000 bonds issued on March 29, 2004 and 150,000 additional bonds issued on July 23, 2004, raising the issue to 800,000 bonds.Redemption: in full on March 29, 2011.
(3) Issue price: bond issue on October 22, 2004, represented by 400,000 bonds with a face value of €1,000 as part of the EMTN program.Redemption: in full on October 22, 2007.
(4) Issue price: bond issue on June 29, 2005, represented by 300,000 bonds with a face value of €1,000 as part of the EMTN program.Redemption: in full on January 29, 2013.
The amounts recognised in the balance sheet as of January 1, 2005 and December 31, 2005 have been determined using amortised cost accounting rules based on the effective interest rate and the fair value adjustment generated by the hedging relationship documen-ted pursuant to application of IAS 39. Accrued interest is recorded in “Other borrowings”.
28.5. Main long- and medium-term borrowings and confi rmed lines of credit
Breakdown of main long- and medium-term borrowings
The Group has the following borrowings:
Long-and medium-term borrowings secured by PPR Finance
(in € million)
Face value Issue interest
rate
Effective interest
rate
Issue date Documented/ non-documented
hedge
Maturity 12.31.2005 01.01.2005 12.31.2004
125.0 (1) 2.6130% fi xed
4.14% 02.06.2004 Euribor 3 month fl oating rate swap for the entire issue
Documented under IFRS
02.06.2004 124.8 123.0 125.0
(1) Private loan exchangeable for PPR shares with option of redemption in cash at the discretion of PPR, issued on February 6, 2004 for €125,000,000 and represented by 1,168,224 with a face value of €107.

203 Reference document 2005
This loan is subject to compliance with the same fi nancial covenants as the PPR confi rmed lines of credit.
The amounts recognised in the balance sheet as of January 1, 2005 and December 31, 2005 have been determined using amortised cost accounting rules based on the effective interest rate, after adjustment of the exchange option. Accrued interest is recorded in “Other borrowings”. Given the maturity of this borrowing, it is recorded in current borrowings.
Long- and medium-term borrowings secured by PPR Finance
(in € million)
Face value Issue interest
rate
Effective interest
rate
Issue date Documented/ non-documented
hedge
Maturity 12.31.2005 01.01.2005 12.31.2004
30.6 5.45% fi xed
5.45% 06.16.1998 06.16.2006 30.6 30.6 30.6
52.6 Euribor 3 months +0.40% fl oating
- 06.16.1998 Euribor 3 month fl oating rate swap for the entire issue
Not documented under IFRS
06.16.2010 52.6 52.6 52.6
9.1 5.46% fi xed
5.46% 06.16.1998 06.16.2006 9.1 9.1 9.1
9.1 5.50% fi xed
5.50% 06.16.1998 06.16.2006 9.1 9.1 9.1
15.2 5.20% fi xed
5.20% 09.15.1998 Euribor 3 month fl oating rate swap for the entire issue
Documented under IFRS
09.15.2006 15.5 15.9 15.2
50.3 5.30% fi xed
5.30% 12.01.1998 12.01.2006 50.3 50.3 50.3
17.5 5.39% fi xed
5.39% 12.01.1998 Euribor 3 month fl oating rate swap for the entire issue
Documented under IFRS
12.01.2006 17.9 18.4 17.5
170.0 Euribor 3 months +0.50% fl oating
- 09.25.2001 09.25.2006 170.0 170.0 170.0
The amounts recognised in the balance sheet as of January 1, 2005 and December 31, 2005 have been determined using amortised cost accounting rules based on the effective interest rate and the fair value adjustment generated by the hedging relationship documen-ted pursuant to application of IAS 39. Accrued interest is recorded in “Other borrowings”. Borrowings maturing in 2006 are presented in current borrowings.
Long- and medium-term borrowings secured by Redcats Finance UK
(in € million)
Face value Issue interest
rate
Effective interest
rate
Issue date Documented/ non-documented
hedge
Maturity 12.31.2005 01.01.2005 12.31.2004
157.6 (1) Market rate +0.42% fl oating
- 10.28.2003 - 10.28.2008 154.1 150.3 150.3
(1) Securitisation set up by Redcats Finance UK in the amount of £108 million (€157.6 million). The amount used as of December 31, 2005 is £105.6 million (€154.1 million).

204
Financial Information – Consolidated fi nancial statements
PPR 205
Long- and medium-term borrowings secured by Gucci Group
(in € million)
Face value Issue interest
rate
Effective interest
rate
Issue date Documented/ non-documented
hedge
Maturity 12.31.2005 01.01.2005 12.31.2004
50.0 (1) Market rate +0.6875%
fl oating
- 05.15.2003 - 05.18.2013 38.9 43.0 43.0
42.4 (2) USD Libor +1.00% fl oating
- 08.08.2003 - 05.18.2013 33.9 33.0 33.0
35.0 Euribor +0.70% fl oating
- 03.29.2004 - 06.30.2014 35.0 35.0 35.0
(1) Redeemable loan initially secured in the amount of €50 million.(2) Redeemable loan secured by Gucci America Inc. in the amount of US$ 50 million (€42.4 million); the outstanding balance on this loan as of December 31, 2005 is US$ 40 million (€33.9 million).
Confi rmed lines of credit
As of December 31, 2005, the Group had access to confi rmed lines of credit of €5,105.6 million, compared to €5,420 million as of December 31, 2004.
The undrawn balance on these confi rmed lines of credit as of December 31, 2005 was €4,913.1 million, compared to €3,218 million as of December 31, 2004.
Breakdown of confi rmed lines of credit
PPR and PPR Finance SNC : €4,611 million with the following maturities:
(in € million) 12.31.2005 Maturing in less than one year
Maturing in one to fi ve years
Maturing in more than
fi ve years
12.31.2004
Confi rmed lines of credit 4,611.0 - 4,557.7 53.3 4,775.0
Confi rmed lines of credit include the syndicated revolving credit facility of €2,750 million secured in March 2005. This credit facility has a 5-year term and provides two opportunities to extend maturity by one year, at the end of the fi rst and second years.
Other confi rmed lines of credit: €494.6 million with the following maturities:
(in € million) 12.31.2005 Maturing in less than one year
Maturing in one to fi ve years
Maturing in more than
fi ve years
12.31.2004
Redcats (1) 283.8 283.8 128.5
Gucci Group NV (2) 210.8 210.8 516.5
Total 494.6 494.6 645.0
(1) Redcats : including US$ 175 million (€148.3 million) and SEK 1,272 million (€135.5 million).(2) Gucci Group NV : including CHF 100 million (€64.3 million) and JPY 20,350 million (€146.5 million).
The Group’s confi rmed lines of credit are subject to the standard commitment and default clauses customarily included in this type of agreement: pari passu, negative pledge and cross default.
PPR and PPR Finance SNC confi rmed lines of credit comprise a default clause (early repayment) in the event of failure to satisfy the fol-lowing fi nancial covenant: Consolidated net fi nancial indebtedness/Consolidated EBITDA ≤ 3.75.
The Group was in compliance with all these clauses as of December 31, 2005 and there is no likely risk of default in this respect.

205 Reference document 2005
28.6. Commercial paper
As of December 31, 2005, PPR Finance SNC has a commercial paper issue programme with a ceiling of €4,000 million. Outstanding commercial paper issued at the balance sheet date totalled €1,025.2 million as of December 31, 2005, compared to €1,310.3 million as of December 31, 2004.
29. Exposure to foreign exchange, interest rate and equity risk
The Group uses derivative fi nancial instruments to manage its exposure to market risks. These instruments are negotiated solely to hedge exposures in respect of fi rm commitments or future transactions. The following derivative fi nancial instruments were used by the Group as of December 31, 2005.
29.1. Exposure to interest rate risk
The PPR Group uses various fi nancial instruments to manage interest rate risk on fi nancial assets and liabilities, including borrowings. The notional outstanding amounts of these instruments are as follows:
(in € million) 12.31.2005 Y+1 Y+2 Y+3 Y+4 Y+5 Beyond 12.31.2004
Swaps: fi xed rate lender 2,311.7 993.4 165.5 2.8 500.0 650.0 3,642.8
Swaps: fi xed rate borrower 306.9 223.0 81.1 2.8 692.9
Purchase of collars 42.4 42.4 561.0
Sale of collars 487.5
Purchase of caps 1,025.0 50.0 725.0 250.0 775.0
Other interest rate instruments (1) 58.7 6.1 52.6 58.7
Total 3,744.7 1,308.8 977.7 255.6 500.0 52.6 650.0 6,217.9
(1) o/w fl oating/fl oating rate swaps.
As part of the Group’s strategy to hedge interest rate exposure, these instruments are designed to:• convert fi xed-rate bonds into fl oating-rate debt: the Group entered into interest rate swaps as a fi xed-rate lender in the amount of
€1,299.2 million to hedge PPR bond issues;• convert fi xed-rate long and medium-term debt to fl oating-rate debt: the Group entered into interest rate swaps as a fi xed-rate lender
in the amount of €161.8 million;• convert fi xed-rate negotiable debt securities, fi xed-rate loans and credit-line draw-downs to fl oating rates: the Group entered into inte-
rest rate swaps as a fi xed-rate lender in the amount of €812.6 million;• set the rate of fl oating-rate borrowings: the Group entered into interest rate swaps as a fi xed-rate borrower in the amount of €268.6 million;• manage interest rate risk on borrowings via option transactions: the Group negotiated option transactions in the amount of €1,067.4 million
PPR on behalf of Finaref prior to its disposal, also entered into interest rate swaps representing an outstanding nominal amount of only €41.3 million as of December 31, 2005, compared with €97.6 million as of December 31, 2004. These swaps were fully hedged with highly-rated counterparties.
Pursuant to application of IAS 39, these fi nancial instruments were analysed with respect to hedge accounting eligibility criteria.

206
Financial Information – Consolidated fi nancial statements
PPR 207
As of December 31, 2005, documented and non-documented fi nancial instruments were as follows:
(in € million) 12.31.2005 Fair value hedge Cash fl ow hedge Hedge relationship not documented
Swaps: fi xed rate lender 2,311.7 1,182.8 1,128.9
Swaps: fi xed rate borrower 306.9 64.8 242.1
Purchase of collars 42.4 42.4
Purchase of caps 1,025.0 1,025.0
Other interest rate instruments (1) 58.7 58.7
Total 3,744.7 1,182.8 64.8 2,497.1
(1) o/w fl oating/fl oating rate swaps.
These interest rate derivative instruments are recognised in the balance sheet at their market value at the year end.
The accounting treatment of fair value movements depends on the purpose of the derivative instrument and the resulting accounting classifi cation.
In the case of interest rate derivative instruments designated as fair value hedges, fair value movements are recognised in net income of the period, offsetting in full or part the revaluation of the hedged debt. The ineffective portion of the fair value hedge is recorded in fi nance costs.
As of December 31, 2005, fair value hedges mainly concern fi xed-rate bonds issued by the Group in July 2003 and March 2004 and hedged by interest rate swaps in the nominal amount of €500 million and €650 million, respectively.
In the case of interest rate derivative instruments designated as cash fl ow hedges, the effective portion of the fair value movement is initially recognised in equity and reclassifi ed in net income when the hedged position affects net income.The ineffective portion of the fair value hedge is recorded in fi nance costs of the period.
As of December 31, 2005, cash fl ow hedges concern borrowings issued in Japanese yens and hedged in the amount of JPY 9 billion (€64.8 million).
Fair value movements in respect of non-documented derivative instruments are recognised directly in net income, within fi nance costs of the period.
As of December 31, 2005, derivative instruments not qualifying for hedge accounting under IAS 39 criteria primarily comprised optional instruments in the form of caps and collars, negotiated to hedge revolving fl oating-rate fi nancing.
Before management, the Group’s exposure to interest rate risk is presented below, with a distinction made between the following:
• Fixed-rate fi nancial assets and liabilities, exposed to a price risk before management:
12.31.2005 2005 maturities 12.31.2004
(in € million) Less thanone year
One tofi ve years
More thanfi ve years
Fixed-rate fi nancial assets 673.5 649.2 14.2 10.1 3,247.1
Bonds 3,069.2 2.1 1,954.0 1,113.1 3,514.6
Commercial paper 859.2 859.2 938.0
Other borrowings 506.9 325.1 179.9 1.9 716.7
Fixed-rate fi nancial liabilities 4,435.3 1,186.4 2,133.9 1,115.0 5,169.3

207 Reference document 2005
• Floating rate assets and liabilities exposed to a cash fl ow risk before management:
12.31.2005 2005 maturities 12.31.2004
(in € million) Less thanone year
One tofi ve years
More thanfi ve years
Floating-rate fi nancial assets 2,067.2 1,644.5 422.7 2,160.2
Bonds 399.7 399.7 506.7
Commercial paper 166.0 166.0 372.3
Other borrowings 1,878.7 1,128.4 466.3 284.0 3,384.2
Floating-rate fi nancial liabilities 2,444.4 1,294.4 866.0 284.0 4,263.2
After management, and taking into account the above hedging transactions, the Group’s exposure to interest rate risk is presented below, with a distinction made between the following:
• Fixed-rate assets and liabilities exposed to a price risk after management:
12.31.2005 2005 maturities 12.31.2004
(in € million) Less thanone year
One tofi ve years
More thanfi ve years
Fixed-rate fi nancial assets 673.5 649.2 14.2 10.1 3,247.1
Bonds 2,665.5 2.1 2,215.0 448.4 1,560.5
Commercial paper 246.6 246.6 66.0
Other borrowings 580.9 259.2 319.8 1.9 1,548.0
Fixed-rate fi nancial liabilities 3,493.0 507.9 2,534.8 450.3 3,174.5
• Floating rate assets and liabilities exposed to a cash fl ow risk after management:
12.31.2005 2005 maturities 12.31.2004
(in € million) Less thanone year
One tofi ve years
More thanfi ve years
Floating-rate fi nancial assets 2,067.2 1,644.5 422.7 2,160.2
Bonds 803.4 138.7 664.7 2,460.8
Commercial paper 778.6 778.6 1,244.3
Other borrowings 1,804.7 1,194.3 326.4 284.0 2,552.9
Floating-rate fi nancial liabilities 3,386.7 1,972.9 465.1 948.7 6,258.0
Financial assets and liabilities consist of interest-bearing balance sheet items.
Given this breakdown between fi xed rate and fl oating rate assets and liabilities after the impact of derivative instruments, a 1% increase or decrease in interest rates would have a full-year impact of €20.4 million on Group consolidated net income before tax, excluding fair value adjustments in respect of derivative instruments not qualifying for hedge accounting.
Based on market data at the year end, interest rate instruments not qualifying for hedge accounting would have an impact on fi nance costs of negative €1.5 million in the event of a 1% decrease in interest rates and of positive €6.1 million in the event of a 1% increase in interest rates.

208
Financial Information – Consolidated fi nancial statements
PPR 209
The break down of gross debt by type of rate before and after hedging transactions is as follows:
12.31.2005 Before hedging After hedging
(in € million) Fixed rate Floating rate Fixed rate Floating rate
Gross debt 6,879.7 4,435.3 2,444.4 3,493.0 3,386.7
% 64.5% 35.5% 50.8% 49.2%
12.31.2004 Before hedging After hedging
(in € million) Fixed rate Floating rate Fixed rate Floating rate
Gross debt 9,432.5 5,169.3 4,263.2 3,174.5 6,258.0
% 54.8% 45.2% 33.7% 66.3%
29.2. Exposure to foreign exchange risk
(in € million) 12.31.2005 CHF EUR GBP HKD HRK
Cash fl ow hedge
Forward purchases & forward purchase swaps 772.8 20.6 39.5 62.9
Forward sales & forward sale swaps (1,243.6) (26.3) (26.1) (244.9) (136.6)
Currency options - purchases of export tunnels (454.3)
Fair value hedge
Forward purchases & forward purchase swaps 180.8 14.2 2.3 16.9 3.8 6.8
Forward sales & forward sale swaps (738.9) (241.4) (12.0) (93.6) (9.7) (47.6)
Not documented
Forward purchases & forward purchase swaps 132.2 98.1 5.3 1.5
Forward sales & forward sale swaps (161.6) (12.7) (1.0) (0.2)
Currency options - purchases 168.7 2.6 21.0 4.4
Currency options - sales (8.5)
Maturity
Less than one year
Forward purchases & forward purchase swaps 1,083.6 112.3 28.2 57.9 66.7 6.8
Forward sales & forward sale swaps (2,129.4) (280.4) (38.1) (339.5) (146.5) (47.6)
Currency options - purchases of export tunnels (395.5)
Currency options - purchases 162.6 1.9 18.1 4.4
Currency options - sales (8.5)
More than one year
Forward purchases & forward purchase swaps 2.2
Forward sales & forward sale swaps (14.7)
Currency options - purchases of export tunnels (58.8)
Currency options - purchases 6.1 0.7 2.9
Currency options - sales

209 Reference document 2005
PPR Group uses instruments with the following outstanding notional amounts to manage foreign exchange risk:
(in € million) 12.31.2005 12.31.2004
Currency forwards and currency swaps (1,058.3) (1,032.5)
Currency options (294.1) (733.0)
Total (1,352.4) (1,765.5)
The Group primarily uses forward currency contracts and/or currency swaps to hedge commercial import/export risks and to hedge the fi nancial risks stemming in particular from inter-company refi nancing transactions in foreign currencies.
The Group can also be required to implement simple options strategies (purchase of options or tunnels) to hedge future exposures.
Pursuant to application of IAS 39, these fi nancial instruments were analysed with respect to hedge accounting eligibility criteria.
As of December 31, 2005, documented and non-documented fi nancial instruments were as follows:
JPY KRW NOK PLN SEK TWD USD Other
110.9 538.9
(22.5) (49.4) (18.8) (48.7) (652.0) (18.3)
(423.4) (30.9)
65.5 66.8 4.5
(40.3) (6.3) (4.2) (266.4) (17.4)
1.6 24.8 0.9
(2.2) (18.2) (0.4) (126.9)
3.8 136.9
(8.5)
178.0 628.3 5.4
(42.5) (24.9) (49.4) (18.2) (17.4) (44.4) (1,044.8) (35.7)
(364.6) (30.9)
1.3 136.9
(8.5)
2.2
(3.9) (1.8) (8.5) (0.5)
(58.8)
2.5

210
Financial Information – Consolidated fi nancial statements
PPR 211
Foreign exchange derivative instruments are recognised in the balance sheet at their market value at the year end.
Derivatives qualifying as cash fl ow hedges hedge highly probable future fl ows (not yet recognised) based on budgets for the current period (season or catalogue, quarter, half-year, etc.) or certain future fl ows not yet recognised (fi rm orders).
Derivatives qualifying as fair value hedges hedge items recognised in the Group balance sheet at the year end or certain future fl ows not yet recognised (fi rm orders). These hedges mainly concern the Luxury Goods Division in the case of hedges of items recognised in the balance sheet and some Retail Division brands in the case of fi rm commitments.
Some foreign exchange derivatives classifi ed for management purposes as being of a hedging nature are not documented for the purposes of hedge accounting under IAS 39 and as such fair value movements in respect of these derivative instruments are recorded in fi nance costs.These derivatives mainly hedge balance sheet items and future fl ows which do not satisfy the highly probable criteria required by IAS 39.
Based on market data at the year end, foreign exchange instruments not qualifying for hedge accounting would have an impact of €0.5 million on fi nance costs in the event of a 1% change in foreign exchange rates.
As of December 31, 2005, the exposure to foreign exchange risk on the balance sheet is as follows:
(in € million) 12.31.2005 CHF EUR GBP HKD HRK
Money market assets 1,272.7 295.0 17.9 140.1 9.7 40.2
Money market liabilities (1,002.7) (112.2) (29.9) (189.0) (4.2)
Group exposure in the balance sheet (before hedging)
270.0 182.8 (12.0) (48.9) 5.5 40.2
Group exposure in the balance sheet (after hedging)
(335.9) 40.8 (17.0) (127.2) 0.6
(in € million) JPY KRW NOK PLN SEK TWD
Money market assets 39.2 6.3 1.6 18.0 6.1 4.2
Money market liabilities (396.2) (4.7)
Group exposure in the balance sheet (before hedging)
(357.0) 6.3 1.6 18.0 1.4 4.2
Group exposure in the balance sheet (after hedging)
(355.0) 1.4
(in € million) USD Other 12.31.2004
Money market assets 678.2 16.1 510.0
Money market liabilities (259.1) (7.4) (800.1)
Group exposure in the balance sheet (before hedging)
419.1 8.7 (290.1)
Group exposure in the balance sheet (after hedging)
127.4 (6.9) (418.3)
Money market assets comprise loans and receivables, bank balances, investments and cash equivalents with a maturity of less than three months at the acquisition date.Money market liabilities comprise borrowings, operating payables and other payables.
29.3. Exposure to equity risk
In the normal course of its business, PPR only enters into transactions involving shares in consolidated companies or shares issued by PPR.
As of December 31, 2005, no transactions qualifi ed as derivative instruments pursuant to IAS 39.

211 Reference document 2005
29.4. Other market risks – Credit risk
The Group uses derivative instruments solely to reduce its overall exposure to foreign exchange, interest rate and equity risk arising in the normal course of business. All transactions involving derivatives are carried out on organised markets or over the counter with major players and do not carry any counterparty risk. The use of derivative instruments did not have a material impact on net income of the Group in 2005. Deferred capital gains or losses from commitments and future transactions hedged by derivatives were not material as of December 31, 2005.
The Group has a large number of customers in a wide range of business segments and is therefore not exposed to any concentration of credit risk. Generally, the Group considers that it is not exposed to any specifi c credit risk.
29.5. Derivative instruments at market value
As of December 31, 2005, the market value of derivative fi nancial instruments is recognised, in accordance with IAS 39, in balance sheet assets under the headings “Non-current fi nancial assets” and “Other current fi nancial assets” and in balance sheet liabilities under the headings “Other non-current fi nancial liabilities and “Other current fi nancial liabilities”.The fair value of derivatives hedging interest rate risks is recognised in non-current or current assets or liabilities depending on the maturity of the underlying debt to which they are allocated. The fair value of foreign exchange derivatives is recognised in other current fi nancial assets or liabilities.
(in € million) 12.31.2005 Interest rate risk
Foreign exchange
risk
Other market risks
01.01.2005
Derivative assets 113.8 77.1 36.7 200.4
Non-current 65.3 65.3 69.1
At fair value through the Income Statement 0.7 0.7 4.0
Cash fl ow hedges
Fair value hedges 64.6 64.6 65.1
Current 48.5 11.8 36.7 131.3
At fair value through the Income Statement 20.4 10.9 9.5 46.6
Cash fl ow hedges 25.1 25.1 58.9
Fair value hedges 3.0 0.9 2.1 25.7
Derivative liabilities 15.7 9.7 6.0 90.9
Non-current 1.8 1.8 2.0
At fair value through the Income Statement 1.8 1.8 2.0
Cash fl ow hedges
Fair value hedges
Current 13.9 7.9 6.0 88.9
At fair value through the Income Statement 9.9 7.9 2.0 39.4
Cash fl ow hedges 0.8 0.8 44.7
Fair value hedges 3.2 3.2 4.8
Total 98.1 67.4 30.7 109.5

212
Financial Information – Consolidated fi nancial statements
PPR 213
Derivatives qualifying for fair value hedge accounting mainly hedge long-term debt issued in the form of bonds and are presented in balance sheet assets in the amount of €65.5 million as of December 31, 2005 and €86.8 million as of January 1, 2005.
The effective portion of derivatives hedging future cash fl ows is recorded by offsetting against shareholders’ equity.
Based on year-end data, movements in the cash fl ow hedge reserve during 2005 were as follows:
(in € million) Attributable to equity holders of the parent
Cash fl ow reserve as of January 1, 2005 17.1
Transfer from the cash fl ow reserve to the Income Statement (16.1)
Fair value movements 3.8
Cash fl ow reserve as of December 31, 2005 4.9
These amounts are presented before deferred tax.
30. Net fi nancial indebtedness
Group net fi nancial indebtedness breaks down as follows:
(in € million) 12.31.2005 01.01.2005 12.31.2004
Gross borrowings excluding the fi nancing of customer loans 6,463.1 9,133.4 9,013.4
Fair value hedging derivative instruments (interest rate) (65.5) (86.8)
Cash and cash equivalents (1,813.2) (3,862 8) (4,288.1)
Net fi nancial indebtedness 4,584.4 5,183.8 4,725.3 As of December 31, 2004, “Cash and cash equivalents” include short-term receivables on divestments of €2,181.8 million (note 24).

213 Reference document 2005
31. Market value of fi nancial instruments
The market value of most of the Group’s fi nancial instruments is based on estimates, except for investments in non-consolidated listed companies, marketable securities and listed bonds, which are recorded on the basis of their last known price as of December 31, 2005.
12.31.2005 12.31.2004
(in € million) Net carrying amount
Market value
Net carrying amount
Market value
ASSETS
Non-current fi nancial assets - available for sale 40.7 40.7 73.6 73.6
Non-current fi nancial assets - amortised cost 134.8 134.8 167.6 167.6
Non-current fi nancial assets - derivative assets 65.3 65.3
Other current fi nancial assets - derivative assets 48.5 48.5
Cash and cash equivalents 1,813.2 1,813.2 4,288.1 4,219.1
LIABILITIES
Convertible bonds 1,201.3 1,426.9 1,228.7 1,337.0
Other bonds 2,267.6 2,345.8 2,792.6 2,883.1
Other bank borrowings 1,135.5 1,137.3 876.0 880.4
Confi rmed lines of credit 192.5 192.5 2,201.9 2,201.9
Drawdowns on unconfi rmed lines of credit 90.9 90.9 136.2 136.2
Commercial paper 1,025.2 1,025.2 1,310.3 1,310.3
Obligations under fi nance leases 178.4 178.4 196.7 196.7
Employee profi t-sharing 46.9 46.9 39.2 39.2
Bank overdrafts 472.9 472.9 243.4 243.4
Other borrowings 268.5 268.5 407.5 407.5
Other non-current fi nancial liabilities - derivative liabilities 1.8 1.8
Other current fi nancial liabilities - derivative liabilities 13.9 13.9
The following methods were used:
Financial instruments other than derivatives recorded in assets in the balance sheet:Net carrying amounts are based on reasonable estimates of market value, with the exception of listed marketable securities and listed investments in non-consolidated companies, whose market value was determined based on the last known price as of December 31, 2005. Non-current fi nancial assets are described in note 20.
Financial instruments other than derivatives recorded in liabilities in the balance sheet:The market value of listed bonds was determined on the basis of the last stock market price at the balance sheet date.For other borrowings, the market value was calculated using other valuation methods, such as discounted cash fl ow, taking into account the Group’s credit risk and interest rate conditions at the balance sheet date.
Derivative fi nancial instruments:The market value was provided by the fi nancial institutions involved in the transactions or calculated using standard valuation methods that incorporate market conditions at the balance sheet date.

214
Financial Information – Consolidated fi nancial statements
PPR 215
32. Cash fl ow statement
Cash and cash equivalents, net of bank overdrafts, is €1,340,3 million as of December 31, 2005 and corresponds to the amount of cash and cash equivalents presented in the cash fl ow statement.
(in € million) 12.31.2005 01.01.2005 12.31.2004
Cash and cash equivalents per the balance sheet 1,813.2 3,862.8 4,288.1
Bank overdrafts (472.9) (255.4) (243.4)
Cash and cash equivalents per the cash fl ow statement 1,340.3 3,607.4 4,044.7
As of December 31, 2004, “Cash and cash equivalents” includes short-term receivables on divestments of €2,181.8 million (note 24).
32.1. Cash fl ow from operating activities
Cash fl ow from operating activities breaks down as follows:
(in € million) 12.31.2005 12.31.2004
Net income from continuing activities 573.7 588.2
Recurring charges to depreciation, amortisation and provisions on non-current operating assets
393.5 411.3
Calculated charges on share options and equivalent 4.7 7.1
Impairment losses on non-current operating assets 57.7 147.5
Net proceeds on asset disposals, net of tax (75.7) (245.4)
Net proceeds on treasury shares 8.5
Income/(expenses) in respect of fair value movements 38.3
Deferred tax (53.9) 90.4
Share in earnings of associates (3.4) (14.4)
Dividends received from associates 5.4 4.6
Other non-cash income and expenses 6.6 12.1
Cash from operating activities 946.9 1,009.9
32.2. Purchases and sales of property, plant and equipment and intangible assets
Net purchases of property, plant and equipment and intangible assets break down as follows:
(in € million) 12.31.2005 12.31.2004
Retail Division (227.8) (232.7)
Luxury Goods Division (115.7) (138.6)
Holding companies and other (2.8) (3.4)
Total (346.3) (374.7)
Purchases of property, plant and equipment under fi nance leases totalled €3.0 million in 2005.

215 Reference document 2005
33. Contingent liabilities, contractual commitments not recognised and risks
33.1. Mandatory withdrawal of Gucci shares
Following the delisting of Gucci shares from the New York Stock Exchange on June 14, 2004 and on July 1, 2004 from the Amsterdam Euronext, the Group initiated, with the competent Dutch courts, a mandatory withdrawal process covering the Gucci ordinary shares that it did not hold following the April 2004 takeover bid. Accordingly, as of December 31, 2005, the Group valued its maximum commitment at €45 million.
33.2. Commitments given and received following sales
Review and update of the vendor warranties given on the sale of the consumer credit business,Guilbert, Pinault Bois & Matériaux and Rexel
Disposals Vendor warranties
December 2002Sale of Finaref Pursuant to the sale of 61% of the capital and voting rights of Finaref and Finaref
Nordic to Crédit Agricole SA in December 2002, usual asset warranties were grant-ed, capped at €505 million, which expired in April 2005.No additional warranties were granted in respect of the three additional stakes sold in December 2003 (14.5%), March 2004 (14.5%) and December 2004 (10%).
May 2003Sale of Guilbert “Contract” to Offi ce Depot Standard 2-year asset warranties, which expired in April 2005, except for tax-re-
lated warranties granted for a period equal to the legal time limits.The purchaser is only entitled to compensation:(i) if the amount of a loss or series of losses (of the same source and nature) exceeds
€60,000 and the total amount of losses exceeds €8 million, subject to a maxi-mum of €90 million; and
(ii) the request for compensation is submitted before March 11, 2005, except for tax aspects (legal time limit).
June 2003Sale of Pinault Bois & Matériaux to Wolseley Saprodis granted general asset and liabilities warranties which expired in June 2005
and were capped at €53 million.General asset and liability warranties:• individual threshold of €50,000 and overall threshold of €3 million;• maximum of €53 million up to June 30, 2005 for general claims and warranties;• specifi c maximum of €53 million for tax claims subject to corporate income tax
time limits, and €26 million for tax claims with time limits of more than 3 years;• specifi c maximum of €118 million of the selling price for claims and warranties
given in respect of off-balance sheet commitments;• term: expiry of warranties on June 30, 2005 and on the expiry of tax and
employee-related time limits.
December 2004Sale of Rexel On December 10, 2004, the Group signed a defi nitive agreement with the consortium
comprising Clayton, Dubilier & Rice, Eurazeo and Merrill Lynch Global Private Equity (“Ray Consortium”) for the sale of its 73.45% interest in Rexel.Limited vendor warranties excluding from their scope property, intellectual property, supplier relations and the environment were granted to the purchasing consortium. These warranties expire in March 2006 with the exception of tax warranties. Liability warranties are capped at €50 million.

216
Financial Information – Consolidated fi nancial statements
PPR 217
In addition to the liability warranties described above, liability warranty agreements with standard terms were set up for the purchasers of the other companies sold by the Group.
Other changes in commitments
To the Group’s knowledge, as of December 31, 2005, there were no signifi cant changes in commitments given and received by the Group for sales made between 2002 and 2004, except for those described in the foregoing section.
33.3. Other commitments given
Contractual obligations
The table below shows all the Group’s contractual commitments and obligations as of December 31, 2005, excluding employee benefi t obligations presented in the preceding notes.
(in € million) Total Payments due by period
Less than one year
One to fi ve years
More than five years
Long-term borrowings (note 28) 4,398.9 2, 999.9 1,399.0
Operating lease agreements 2,282.0 400.9 1,062.4 818.7
Binding purchase obligations 205.0 176.2 28.8
Total commitments given 6,885.9 577.1 4,091.1 2,217.7
Total commitments received
Operating leases
The amount of contractual obligations presented on the line “Operating lease agreements” represents minimum future lease payments under operating lease agreements which cannot be terminated. These mainly include rental payments which cannot be cancelled in respect of stores, logistic hubs and other buildings (head offi ces and administrative offi ces).As of December 31, 2005, total minimum future lease payments which the Group expects to receive under sub-lease agreements which cannot be terminated total €9.5 million.
The 2005 rental charge in respect of minimum lease payments is €365.0 million and that in respect of contingent payments is €173.7 million (based on actual sales).
Sub-lease revenue totalled €4.4 million in 2005.
Finance leases
The present value of future minimum lease payments included in “Borrowings” and relating to capitalised assets satisfying the fi nance lease defi nition in accordance with IAS 17 is as follows:
(in € million) 12.31.2005
Less than one year 46.8
One to fi ve years 115.6
More than five years 92.0
254.4
Finance costs included (76.0)
Present value of minimum lease payments 178.4
As of December 31, 2005, total future minimum lease payments under sub-lease agreements that the Group expects to receive on sub-lease agreements that cannot be terminated total €21.0 million.

217 Reference document 2005
Other commitments
As of December 31, 2005, other commercial commitments break down as follows:
(in € million) Total Payments due by period
Less than one year
One to fi ve years
More than five years
Confi rmed lines of credit (note 28) 5,105.6 494.6 4,557.7 53.3
Letters of credit 6.7 6.5 0.2
Other guarantees received 20.9 18.6 1.2 1.1
Total commitments received 5,133.2 519.7 4,559.1 54.4
Guarantees given to banks ensuring cash pooling 46.9 24.3 10.1 12.5
Rent guarantees, property guarantees 109.4 91.3 5.6 12.5
Guarantees on lease agreements 10.4 3.1 6.0 1.3
Other commitments (o/w customs warranties) 176.9 105.3 11.0 60.6
Total commitments given 343.6 224.0 32.7 86.9
Other commitments mainly comprise customs warranties and operating guarantees.
Other guarantees received mainly comprise documentary credits.
Guarantees and other collateral
As of December 31, 2005, guarantees and other collateral granted by the Group break down as follows:
(in € million) Pledge start date
Pledge expiry date
Amount of the asset pledged
Balance sheet total (NCA)
Corresponding %
Intangible assets - 6,605.0 0.0%
Property, plant and equipment 05.28.2003 03.12.2015 258.5 2,538.7 10.2%
Non-current fi nancial assets - 240.8 0.0%
Total non-current assets pledged as collateral
258.5 9,384.5 2.8%
Other commitments given
To the best of the Group’s knowledge, there are no other signifi cant commitments given or contingent liabilities.
33.4. Group dependence on patents, licenses and supply contracts
Brylane has a trademark licence agreement for the use of the Lane Bryant and Lerner trademarks up to October 20, 2007, without payment of any license fees. These catalogues realised sales of €346.0 million in 2005€(€338.4 million in 2004).
Brylane also has an exclusive license for the distribution to individuals listed in the Sear’s customer fi le of a selection of Brylane products included in the “Women’s View”, “Smart Choice” and “Big and Tall” catalogues until 2005. These catalogues realised sales of €11.6 million in 2005 (€42.9 million in 2004). This exclusive license was not continued beyond May 31, 2005.
Aside from the two licenses referred to above, the Group is not signifi cantly dependent on any patents, licenses or supply contracts.

218
Financial Information – Consolidated fi nancial statements
PPR 219
33.5. Claims and litigation
Group companies are involved in a number of lawsuits or disputes that arise in the normal course of business, including litigation with tax, social welfare or customs authorities. Reserves for contingencies and losses have been made for the probable estimated cost to the Group’s entities, based on the advice of legal counsel. According to the Group’s legal counsel, no litigation currently in progress is likely to have a material impact on normal or foreseeable operations or the planned development of the Group or any of its subsidiaries. To the Group’s knowledge, there are no claims or litigation, either in process or pending, likely to have a potential material impact on the Group’s operating results or fi nancial position that are not adequately covered by provisions recorded in the balance sheet.No individual claim is material to the company of the Group.
To the Group’s knowledge, no dispute or arbitration has had in the recent past or is likely to have in the future a signifi cant impact on the fi nancial position, activity or net income of the company of the Group.
34. Transactions with related parties
34.1. Party controlling the Group
PPR is controlled by Artémis, which holds 42.9% of its share capital. Artémis is in turn wholly-owned by Société Financière Pinault.
The main transactions carried out between the consolidated companies of the PPR Group and Artémis in 2005 are as follows:• payment of the dividend for 2004 of €130.1 million (€123.9 million for 2003);• payment of a fee of €6.8 million for 2005 (€8.8 million in 2004) for business development consulting services, support in connection
with complex transactions, and the supply of development opportunities, new business and cost reduction initiatives. The fees are covered by an agreement, approved and reviewed by the Board of Directors.
34.2. Associates
In the normal course of business, the Group enters into transactions with associates on an arm’s length basis.
The main transactions in 2005 with associates are summarised in the following table:
(in € million) 12.31.2005
Non-current receivables and loans to non-consolidated investments 0.9
Trade receivables 28.6
Other current assets 0.5
Other current liabilities 0.4
Sales of goods and services 62.0
Other operating income and expenses 1.2
34.3. Management compensation
Compensation paid in 2005 to members of the Board of Directors of PPR from May 19, 2005, and to members of the Supervisory Board and the Management Board of PPR prior to this date, and to members of the Group Executive Committee is as follows:
(in € million) 2005 2004
Salaries and other short-term benefi ts 16.5 10.6
Termination payments 9.8
Total 26.3 10.6

219 Reference document 2005
A list of the members of the Board of Directors, Supervisory Board, Management Board and Executive Committee is presented in the “Corporate Governance” section of the Reference Document.
35. Subsequent events
Conforama announced on January 9, 2006 the takeover of Sodice Expansion Group, its main franchise holder, listed on the Eurolist market (compartment B). This transaction involves the takeover of SAS du Parc, which holds 51.4% of the share capital of Sodice Ex-pansion. Conforama already holds 31.98% of the share capital. This acquisition, which values the Sodice Expansion share at €150, will have a positive impact on Conforama net income from 2006. Following approval of this transaction by French competition authorities, a simplifi ed public offering will be launched for the remaining Sodice Expansion shares not held by Conforama at a price of €150 per share, in accordance with regulatory provisions.
36. Transition to IFRS
36.1. Group choices for the fi rst-time adoption of international standards
As January 1, 2004 was selected as the transition date, the fi nancial statements drawn up for the fi rst time under IFRS standards were prepared as of that date as if the IAS/IFRS standards had always been applied, with the exception of certain optional exemptions provi-ded by IFRS 1. After an analysis of each of these exemptions, the Group adopted the following treatments:• Business combinations: in accordance with IFRS 3, the Group has elected to restate business combinations retroactively to January
1, 1999. The January 1, 1999 date was chosen by the Group because of the 1999 acquisition of Gucci Group, which is a major division of PPR and because Gucci Group already prepared its fi nancial statements in accordance with IFRS at this date. In accordance with section B1 of IFRS 1, the Group applied prospectively IAS 36 (Impairment of assets) and IAS 38 (Intangible assets) at the same date as IFRS 3, that is from January 1, 1999.
• Revaluation of property, plant and equipment at fair value and use of this fair value as a presumed cost: the Group has decided to apply this optional exemption in a targeted manner to some components of property, plant and equipment as of the transition date, based on expert appraisals. On a day-to-day basis, the Group will use the amortised cost method to value all its property, plant and equipment.
• Employee benefi ts: the Group has adopted the IFRS 1 option of recognising all actuarial gains and losses at the transition date, offset against opening shareholders’ equity.
• Cumulative translation differences: the Group has decided to use the optional exemption allowing the elimination of cumulative translation differences at the transition date through an offsetting entry in consolidated reserves.
• Assets and liabilities of subsidiaries, affi liates and joint venture partners: section 25 of IFRS 1 states that if the parent company of a group adopts IFRS for the fi rst time in its consolidated fi nancial statements after a subsidiary, the parent company must, in its opening IFRS consolidated balance sheet, value the assets and liabilities at the same carrying amount as that appearing in the subsidiary’s fi nan-cial statements, taking into account any consolidation adjustments. Since Gucci Group was already preparing its fi nancial statements in IFRS format before the fi rst-time adoption date, the Group complied with this treatment when preparing its opening balance sheet.
• Share-based payments: in accordance with the option allowed by IFRS 2 for equity-settled plans, the Group has decided to apply this standard solely to plans issued after November 7, 2002, which had not vested as of January 1, 2005.
• Insurance contracts and decommissioning liabilities included in the cost of PP&E: this optional exemptions do not apply to the Group.
• Lease contracts: the Group did not choose to apply this optional exemption.
In addition, following the option offered by the regulator on the application date of IAS 32 and IAS 39 on fi nancial instruments, the Group elected to apply these standards as of January 1, 2005. As such:• The Group opted, in the case of hybrid fi nancial instruments where the “liability” component is settled at the date of application of IAS 32
and IAS 39, not to separate the capitalised cumulative interest accreted on the liability component from the original equity component.• The designation of fi nancial assets and liabilities previously recognised in the fi nancial statements, as either at fair value through the
Income Statement or available-for-sale, was performed at the transition date (January 1, 2005).
36.2. Reconciliation of French GAAP and IFRS fi nancial statements
The following tables present a reconciliation of the IFRS fi nancial statements and the fi nancial statements prepared in accordance with French GAAP.

220
Financial Information – Consolidated fi nancial statements
PPR 221
Reconciliation as of January 1, 2004
Balance sheet
(in € million) Published under French GAAP
Business combinations
(IFRS 3)
Remeasurement of Printemps
land (IAS 16)
Employee benefi ts(IAS 19)
Intangible assets (IAS 38)
Application of IFRS 5 to Rexel
Deferred tax on associates
(IAS 12)
French GAAP formata b c d e g
Goodwill 3,356.0 1,718.2 1,235.5 (1,266.8)Other intangible assets 7,104.5 1,268.5 (1,246.4) (446.7)Property, plant and equipment 2,668.2 (0.2) 381.0 (14.6) (182.3)Investments in equity affi liates 171.6 Non-consolidated investments 83.9 (9.6)Other investments 180.5 (36.8)
15.6 23.5 7.5 106.7
0.3
FIXED ASSETS 13,564.7 3,002.1 381.0 23.8 (18.0) (1,942.2) 106.7Inventories and work-in-progress 3,417.5 0.5 (812.9)Operating receivables 3,168.6 1.6 (847.0)Customer loans 439.9
Non-operating receivables 979.3 0.2 (108.3) (183.9)Cash 3,069.4 (167.5)CURRENT ASSETS 11,074.7 0.7 (106.7) (2,011.3)
4,087.6
TOTAL ASSETS 24,639.4 3,002.8 381.0 23.8 (124.7) 134.1 106.7
Shareholders’ equity - Group share 6,899.2 88.7 245.7 (49.7) (98.6) (81.6) 45.5Minority interests 1,731.5 1,240.3 0.3 (0.7) (0.2) (3.8) (0.2)SHAREHOLDERS’ EQUITY 8,630.7 1,329.0 246.0 (50.4) (98.8) (85.4) 45.3Net borrowings excluding customer loans 8,101.2 (592.4)Financing of customer loans 439.9 Reserves for retirement and related commitments 166.0 87.1 (31.5)Reserves for contingencies and loses 392.8 (18.4) (99.1)
1,700.5 135.0 2.0 (26.5) 93.4 61.4
1,682.1 135.0 89.1 (26.5) (629.6) 61.4
Operating payables 5,980.3 (1,386.7)1.3
Non-operating payables 928.5 (8.3) (16.2) 0.6 (123.8)(8.3) (14.9) 0.6 (1,510.5)
2,359.6
TOTAL LIABILITIES AND SHAREHOLDERS’ EQUITY
24,639.4 3,002.8 381.0 23.8 (124.7) 134.1 106.7

221 Reference document 2005
Revenue(IAS 18)
Consolidation of special purpose entities(SIC 12)
Reclassifi cations Other restatements
Total impact
Published under IFRS
IFRS formath i j k
(51.5) (0.7) 1,634.7 4,990.7 Goodwill0.6 (424.0) 6,680.5 Other intangible assets
(30.2) 8.5 162.2 2,830.4 Property, plant and equipment51.5 51.5 223.1 Investments in associates(74.3) (83.9) 74.3 (2.1) 35.4 215.9 Non-current fi nancial assets
12.3 493.1 24.8 683.5 683.5 Deferred tax assets
29.2 0.1 29.6 29.6 Other non-current assets
12.3 492.7 30.6 2,089.0 15,653.7 NON-CURRENT ASSETS(13.3) (825.7) 2,591.8 Inventories
52.2 (1 278.1) (12.0) (2,083.3) 1,085.3 Trade receivables439.9 Customer loans
61.7 61.7 61.7 Current tax receivables145.0 145.0 145.0 Other current fi nancial assets597.3 (5.4) 299.9 1,279.2 Other current assets
(167.5) 2,901.9 Cash and cash equivalents52.2 (474.1) (30.7) (2,569.9) 8,504.8 CURRENT ASSETS
4,087.6 4,087.6 ASSETS HELD FOR SALE
12.3 52.2 18.6 (0.1) 3,606.7 28,246.1 TOTAL ASSETS
(73.5) (10.3) 66.2 6,965.4 Shareholders’ equity - Group share(1.1) (1.4) 1,233.2 2,964.7 Shareholders’ equity attributable to minority interests
(74.6) (11.7) 1,299.4 9,930.1 SHAREHOLDERS’ EQUITY(3,029.1) 15.8 (3,605.7) 4,495.5 Long-term borrowings
(439.9) (439.9)(16.6) 39.0 205.0 Provisions for retirement and similar benefi ts(59.6) (177.1) 215.7 Provisions
(28.7) 97.8 (2.8) 2,032.1 2,032.1 Deferred tax liabilitiesOther non-current liabilities
(28.7) (3,447.4) 13.0 6,948.3 NON-CURRENT LIABILITIES52.2 3,090.0 (0.1) 3,142.1 3,142.1 Short-term borrowings
439.9 439.9 439.9 Financing of customer loans18.5 18.5 18.5 Other current fi nancial liabilities
(1,883.0) 0.6 (3,269.1) 2,711.2 Trade payables16.6 17.9 17.9 Provisions for retirement and other benefi ts43.8 43.8 43.8 Provisions
410.7 0.1 410.8 410.8 Current tax liabilities115.6 1,329.5 (2.0) 1,295.4 2,223.9 Other current liabilities115.6 52.2 3,466.0 (1.4) 9 008.1 CURRENT LIABILITIES
2,359.6 2,359.6 LIABILITIES ASSOCIATED WITH ASSETS HELD FOR SALE
12.3 52.2 18.6 (0.1) 3,606.7 28,246.1 TOTAL LIABILITIES AND SHAREHOLDERS’ EQUITY

222
Financial Information – Consolidated fi nancial statements
PPR 223
Shareholders’ equity as of January 1, 2004
(in € million) Shareholders’ equity
Group share
Minority interests share
Under French GAAP 8,630.7 6,899.2 1,731.5
Impact of transition to IFRS 1,299.4 66.2 1,233.2
a - Restatements relating to business combinations (IFRS 3) 1,329.0 88.7 1,240.3
b - Remeasurement of Printemps land (IAS 16) 246.0 245.7 0.3
c - Employee benefi ts (IAS 19) (50.4) (49.7) (0.7)
d - Intangible assets (IAS 38) (98.8) (98.6) (0.2)
e - Application of IFRS 5 to Rexel (85.4) (81.6) (3.8)
g - Deferred tax on associates (IAS 12) 45.3 45.5 (0.2)
h - Revenue (IAS 18) (74.6) (73.5) (1.1)
Other restatements (11.7) (10.3) (1.4)
Under IFRS 9,930.1 6,965.4 2,964.7
Reconciliation as of December 31, 2004
Income Statement for the year ended December 31, 2004
(in € million) Published under French GAAP
Business combinations
(IFRS 3)
Employee benefi ts(IAS 19)
Intangible assets (IAS 38)
Application of IFRS 5 to Rexel
Share-based payment(IFRS 2)
French GAAP format a c d e fNet sales 24,212.7 (6,485.5)Cost of sales (14,782.0) (0.5) 4,850.8 Gross profi t 9 430.7 (0.5) (1,634.7)Payroll expenses (3,417.1) (0.9) (1.8) (3.9) 802.4 (11.8)Other operating income and expenses (4,546.9) (5.1) 0.2 7.9 538.4 Operating income from ordinary activities 1,466.7 (6.5) (1.6) 4.0 (293.9) (11.8)
(29.5) 1.2 (354.8) (1.4)Operating income 1,466.7 (36.0) (0.4) 4.0 (648.7) (13.2)Net fi nancial expenses (348.8) (0.4) (7.6) 52.9 Non-recurring items 418.2 25.8 Income before taxes 1,536.1 (36.4) (8.0) 4.0 (570.0) (13.2)Income taxes (414.7) 20.7 2.3 (0.7) 149.6 2.0 Share in earnings of affi liates 14.4 Amortisation of goodwill (106.6) 71.0 35.6 Net income of consolidated companies 1,029.2 55.3 (5.7) 3.3 (384.8) (11.2)
588.6 Net income before minority interests 1,029.2 55.3 (5.7) 3.3 203.8 (11.2)Minority interests 88.6 2.1 (0.2) 21.3 Attributable net income 940.6 53.2 (5.5) 3.3 182.5 (11.2)

223 Reference document 2005
Deferred tax on associates
(IAS 12)
Revenue(IAS 18)
Reclassifi cations Other restatements
Total impact
Published under IFRS
IFRS formatg h j k(202.3) 6.5 (6,681.3) 17 531.4 Revenue174.0 (46.4) (5.1) 4 972.8 (9,809.2) Cost of sales(28.3) (46.4) 1.4 (1,708.5) 7,722.2 Gross profi t
19.8 803.8 (2,613.3) Payroll expenses14.7 (24.9) (7.3) 523.9 (4,023.0) Other operating income and expenses(13.6) (51.5) (5.9) (380.8) 1,085.9 Operating income from ordinary activities
488.2 2.0 105.7 105.7 Other operating income and expenses(13.6) 436.7 (3.9) (275.1) 1,191.6 Operating income
2.7 2.3 49.9 (298.9) Finance costs(444.0) (418.2)
(10.9) (5.0) (3.9) (643.4) 892.7 Income before taxes(52.8) 3.8 5.0 (34.1) 95.8 (318.9) Income taxes
14.4 Share in earnings of associates106.6
(52.8) (7.1) (38.0) (441.0) 588.2 Net income from continuing operations588.6 588.6 Net income from discontinued operations
(52.8) (7.1) (38.0) 147.6 1,176.8 Net consolidated income(0.1) 23.1 111.7 Attributable to minority interests
(52.8) (7.0) (38.0) 124.5 1,065.1 Net income attributable to equity holders of the parent

224
Financial Information – Consolidated fi nancial statements
PPR 225
Balance sheet as of December 31, 2004
(in € million) Published
under French GAAP
Business combinations
(IFRS 3)
Remeasurement of Printemps land (IAS 16)
Employee benefi ts(IAS 19)
Intangible assets (IAS 38)
Share-based payment(IFRS 2)
Deferred tax on associates
(IAS 12)
French GAAP formata b c d f g
Goodwill 1,932.0 2,229.4 1,236.0 Other intangible assets 8,224.4 (358.4) (1,246.7)Property, plant and equipment 2,272.6 (0.2) 381.0 (13.4)Investments in equity affi liates 46.7 Non-consolidated investments 73.6 Other investments 170.0
18.7 18.7 9.1 2.8 0.3
FIXED ASSETS 12,719.3 1 889.5 381.0 19.0 (15.0) 2.8 Inventories and work-in-progress 2,640.8 Operating receivables 2,227.9 1.6 Customer loans 419.1
Non-operating receivables 655.6 0.3 (105.2)Cash 4,288.1 CURRENT ASSETS 10,231.5 0.3 (103.6)
TOTAL ASSETS 22,950.8 1 889.8 381.0 19.0 (118.6) 2.8
Shareholders’ equity – Group share 7,693.3 145.2 247.6 (69.2) (92.6) (4.1) (7.4)
Minority interest 171.4 70.5 0.3 (0.7) (0.2)SHAREHOLDERS’ EQUITY 7,864.7 215.7 247.9 (69.9) (92.8) (4.1) (7.4)Net borrowings excluding customer loans 8,820.8 Financing of customer loans 419.1 Reserves for retirement and related commitments
133.8 112.2
Reserves for contingencies and losses 383.6 (17.1)1,690.9 133.1 (11.0) (26.0) 0.7 7.4
1,673.8 133.1 101.2 (26.0) 0.7 7.4
Operating payables 4,560.0 1.6
Non-operating payables 768.8 0.3 (13.9) 0.2 6.2 0.3 (12.3) 0.2 6.2
TOTAL LIABILITIES AND SHAREHOLDERS’ EQUITY
22,950.8 1,889.8 381.0 19.0 (118.6) 2.8

225 Reference document 2005
Revenue(IAS 18)
Consolidation of special purpose entities(SIC 12)
Reclassifi cations Other restatements
Total Published under IFRS
IFRS formath i j k
(0.8) 3,464.6 5,396.6 Goodwill(0.9) (1,606.0) 6,618.4 Other intangible assets
(14.5) (2.0) 350.9 2,623.5 Property, plant and equipment0.2 0.2 46.9 Investments in associates
(73.6) (73.6)73.6 (2.4) 71.2 241.2 Other non-current fi nancial assets
12.9 375.3 (11.8) 425.7 425.7 Deferred tax assets
14.1 14.4 14.4 Other non-current assets
12.9 374.2 (17.0) 2,647.4 15,366.7 NON-CURRENT ASSETS(8.2) (8.2) 2 632.6 Inventories
57.0 (1,218.5) (15.5) (1,175.4) 1,052.5 Trade receivables419.1 Customer loans
46.2 46.2 46.2 Current tax receivables146.5 146.5 146.5 Other current fi nancial assets676.1 (1.3) 569.9 1,225.5 Other current assets
4,288.1 Cash and cash equivalents57.0 (349.7) (25.0) (421.0) 9,810.5 CURRENT ASSETS
ASSETS HELD FOR SALE
12.9 57.0 24.5 (42.0) 2,226.4 25,177.2 TOTAL ASSETS
(82.3) (50.1) 87.1 7,780.4 Shareholders’ equity attributable to equity holders of the parent
(1.2) (1.3) 67.4 238.8 Shareholders’ equity attributable to minority interests(83.5) (51.4) 154.5 8,019.2 SHAREHOLDERS’ EQUITY
(2,727.8) 10.2 (2,717.6) 6,103.2 Long-term borrowings(419.1) (419.1)(12.7) 99.5 233.3 Provisions for retirement and other benefi ts
(201.7) (218.8) 164.8 Provisions(30.0) 97.6 (3.0) 1,859.7 1,859.7 Deferred tax liabilities
Other non-current liabilities(30.0) (3,263.7) 7.2 8,361.0 NON-CURRENT LIABILITIES
57.0 2,853.2 2,910.2 2,910.2 Short-term borrowings419.1 419.1 419.1 Financing of customer loans11.2 11.2 11.2 Other current fi nancial liabilities
(1,917.9) 1.7 (1,916.2) 2,643.8 Trade payables12.6 14.2 14.2 Provisions for retirement and other benefi ts
183.5 183.5 183.5 Provisions266.6 266.6 266.6 Current tax liabilities
126.4 1,459.9 0.5 1,579.6 2,348.4 Other current liabilities126.4 57.0 3,288.2 2.2 8,797.0 CURRENT LIABILITIES
LIABILITIES ASSOCIATED WITH ASSETS HELD FOR SALE
12.9 57.0 24.5 (42.0) 2,226.4 25,177.2 TOTAL LIABILITIES AND SHAREHOLDERS’ EQUITY

226
Financial Information – Consolidated fi nancial statements
PPR 227
Cash fl ow statement for the year ended December 31, 2004
(in € million) Published under French GAAP
Business combinations
(IFRS 3)
Intangible assets (IAS 38)
Application of IFRS 5 to Rexel
French GAAP format a d e
Net cash from operating activities before changes in working capital requirement
1,257.8 (16.6) (18.7) (199.6)
Change in working capital requirement (211.9) 19.5 175.0
Change in customer loans 28.6
Net cash from operating activities 1,074.5 2.9 (18.7) (24.6)
Acquisitions of tangible and intangible assets (462.0) 18.7 43.1
Disposals of tangible and intangible assets 33.6 (7.8)
Net operating investments (428.4) 18.7 35.3
Acquisitions of subsidiaries and affi liates (2,691.3) (5.4) 8.8
Divestments of subsidiaries and affi liates 3,057.5 (493.1)
Acquisitions of other investments, net of disposals (80.8) 1.2
2.5 (4.6)
Net cash difference (225.7)
Net fi nancial investments 59.7 (2.9) (487.7)
Net cash from (used in) investing activities (368.7) (2.9) 18.7 (452.4)
Share capital increase 0.9 (0.6)
Dividends paid (308.3) 9.5
Change in borrowings 697.4 618.5
Net cash from (used in) fi nancing activities 390.0 627.4
Impact of treasury stock 100.4
17.1
Impact of changes in exchange rate 22.5
Net increase (decrease) in cash and cash equivalents 1,218.7 (0.0) 167.5
Cash and cash equivalents at beginning of the period 3,069.4 (167.5)
Cash and cash equivalents at end of the period 4,288.1

227 Reference document 2005
Revenue(IAS 18)
Other reclassifi cations
and restatements
Total impact
Published under IFRS
IFRS formath j and k
(5.2) (7.8) (247.9) 1,009.9 Cash fl ow from operating activities
263.7 263.7 263.7 Interest paid/received
(26.7) (26.7) (26.7) Dividends received
150.6 150.6 150.6 Net income tax payable
1,397.5 Cash fl ow from operating activities before tax, dividends and interest
5.2 13.2 212.9 1.0 Changes in working capital requirements
28.6 Changes in customer loans
(204.7) (204.7) (204.7) Income tax paid
188.3 147.9 1,222.4 Net cash from operating activities
(0.9) 60.9 (401.1) Purchases of PPE and intangible assets
0.6 (7.2) 26.4 Proceeds from sale of PPE and intangible assets
(0.3) 53.7 (374.7) Net operating investments
(0.1) 3.3 (2,688.0) Acquisitions of subsidiaries, net of cash acquired
(225.7) (718.8) 2,338.7 Proceeds from disposal of subsidiaries net of cash transferred
(155.2) (154.0) (234.8) Purchases of other fi nancial assets
160.6 158.5 158.5 Proceeds from sale of other fi nancial assets
225.7 225.7
60.0 60.0 60.0 Interest and dividends received
65.3 (425.3) (365.6) Net fi nancial investments
65.0 (371.6) (740.3) Net cash used in investing activities
(0.5) (1.1) (0.2) Share capital increase/decrease
100.4 100.4 100.4 Treasury share transactions
9.5 (298.8) Dividends paid
(13.8) 604.7 1,302.1 Increase (decrease) in borrowings
(319.6) (319.6) (319.6) Interest paid
(233.5) 393.9 783.9 Net cash from (used in) fi nancing activities
(100.4) (100.4)
17.1 17.1 Net cash fl ow from assets classifi ed as held for sale
16.2 16.2 38.7 Impact of exchange rate variations
(64.4) 103.1 1,321.8 Net increase (decrease) in cash and cash equivalents
(179.0) (346.5) 2,722.9 Cash and cash equivalents at beginning of the period
(243.4) (243.4) 4,044.7 Cash and cash equivalents at end of the period

228
Financial Information – Consolidated fi nancial statements
PPR 229
Shareholders’ equity as of December 31, 2004
(in € million) Shareholders’ equity
Group share Minority interests share
Under French GAAP 7,864.7 7,693.3 171.4
Impact of transition to IFRS 154.5 87.1 67.4
a - Restatements related to business combinations (IFRS 3) 215.7 145.2 70.5
b - Remeasurement of Printemps land (IAS 16) 247.9 247.6 0.3
c - Employee benefi ts (IAS 19) (69.9) (69.2) (0.7)
d - Intangible assets (IAS 38) (92.8) (92.6) (0.2)
f - Share-based payment (IFRS 2) (4.1) (4.1)
g - Deferred tax on associates (IAS 12) (7.4) (7.4)
h - Revenue (IAS 18) (83.5) (82.3) (1.2)
Other restatements (51.4) (50.1) (1.3)
Under IFRS 8,019.2 7,780.4 238.8
36.3. Nature of IFRS restatements and reclassifi cations
Income statement
a) Restatements related to business combinations (IFRS 3)
The application of IFRS 3 beginning January 1, 1999 has resulted in a restatement of the fi nancial statements as of this date and, specifi cally, application of the total revaluation method for all business combinations since January 1, 1999. The restatements mainly concerned:
• The recognition at fair value of identifi able assets and liabilities of all subsidiaries acquired by the Group on or after January 1, 1999. The impact of this difference is a €1,180 million increase in consolidated shareholders’ equity as of January 1, 2004, comprising a decrease of €53.8 million in shareholders’ equity attributable to equity holders of the parent and an increase of €1,233.8 million in minority interests. The impact primarily represents the recognition, as part of the takeover of the Gucci Group in 1999, of the minority interests share in the fair value of the assets and liabilities of this subsidiary. The Group’s purchase of virtually all of the Gucci Group NV outstanding shares during the fi rst half of 2004 reduces the impact of this accounting treatment to a €2.2 million decrease in consoli-dated shareholders’ equity as of December 31, 2004. The impact on 2004 net income of all restatements relating to the recognition of assets and liabilities meeting the IFRS 3 criteria is negative €15.7 million.
• The cancellation of goodwill amortisation recognised from January 1, 1999. The impact of this difference is a €161.5 million increase in consolidated shareholders’ equity as of January 1, 2004. This impact takes into account the positive impact of ceasing to amortise goodwill in respect of all Group companies between January 1, 1999 and January 1, 2004 of €316.1 million, and the negative impact of the prospective application from January 1, 1999 of IAS 36 – Impairment of Assets and IAS 38 – Intangible assets. Impairment tests performed on goodwill and indefi nite life intangible assets between 1999 and 2003 led to the recognition by the Group of an irreversible impairment loss in respect of the goodwill relating to the Redcats USA cash generating unit (CGU) of €150.8 million. This different in accounting policy also resulted in an increase in 2004 net income of €71 million.
• The translation of goodwill relating to the acquisition of foreign companies into euros based on historical exchange rates in the conso-lidated fi nancial statements drawn up under French GAAP.Pursuant to IAS 21 – The effects of changes in foreign exchange rates, goodwill is translated into euros based on period-end exchange rates. The impact of this difference is a €12.5 million decrease in consolidated shareholders’ equity and goodwill as of January 1, 2004.

229 Reference document 2005
• The recognition of a deferred tax liability on all brands acquired by the Group since January 1, 1999 to offset goodwill pursuant to appli-cation of IFRS 3 as of this date. This difference in treatment, which has no impact on consolidated shareholders’ equity at the transition date, results in the recording of a deferred tax liability in respect of Luxury Goods brands in the amount of €1,700,5 million.
b) Revaluation of property, plant and equipment (IAS 16)
Use of the fair value revaluation option for property, plant and equipment when preparing the opening balance sheet was limited to land held by the Printemps brand. This revaluation had a favourable impact of €246.0 million on shareholders’ equity on the transition date. This impact corresponds, in the amount of €381.0 million, to the difference between the net carrying amount of the land before revaluation (i.e. €25.0 million) and its fair value (i.e. €406.0 million) on the transition date less a deferred tax liability of €135.0 million. The revaluation of the Printemps land (non-depreciable) did not impact on 2004 net income.
c) Employee benefi ts (IAS 19)
As of January 1, 2004, actuarial gains and losses deferred in accordance with the corridor method were recognised in provisions for retirement and similar benefi ts, giving rise to a €50.4 million decrease in shareholders’ equity after recognition of a net deferred tax asset of €21.5 million.
The other restatements in respect of provisions for retirement and similar benefi ts as of January 1, 2004 primarily concern the reclas-sifi cation of employee benefi ts in the Conforama Italian group structure for €16.2 million. These benefi ts were previously recognised in non-operating employee-related liabilities.
Furthermore, in accordance with the option offered by IAS 19, as amended in December 2004, the Group has chosen to recognise new actuarial gains and losses on defi ned benefi t plans directly in equity from the transition date. The impact of this difference is a €14.5 million decrease in shareholders’ equity after taxes as of December 31, 2004.
In addition, as of January 1, 2004, the fi nancial component of expenses (or income) for employee benefi ts is presented in fi nance costs under IFRS, whereas it was presented in operating expenses (or income) under French GAAP.
d) Intangible assets (IAS 38)
IAS 38 and the IFRS conceptual framework defi ne asset recognition criteria which differ from French GAAP. Specifi cally, the IFRS do not allow the capitalisation of deferred charges. Accordingly, the Group has restated deferred charges capitalised under French GAAP with respect to store opening costs, IT project start-up costs and catalogue costs. The impact of this difference is a €98.8 million decrease in shareholders’ equity after taxes as of January 1, 2004, including €54.9 million in respect of the cancellation of catalogue costs re-cognised by Redcats and Fnac, and €38.6 million in respect of the cancellation of pre-opening expenses recognised by Fnac, Confo-rama and Gucci. Given the frequency of store openings for the brands concerned, application of this standard had a favourable impact of €3.3 million on 2004 net income.
In accordance with IFRS 3 – Business combinations, intangible assets acquired as part of business combinations are only recognised separately from goodwill if they arise from contractual or legal rights or are separable from the acquired entity. Purchased goodwill, brands and market shares previously recognised in intangible assets under French GAAP were therefore reclassifi ed as goodwill if they did not meet the criteria of international standards. A total of €1,235.5 million was reclassifi ed as goodwill as of January 1, 2004.

230
Financial Information – Consolidated fi nancial statements
PPR 231
e) Recognition of Rexel non-current assets held for sale (IFRS 5)
The application of IFRS 5 – Non-current assets held for sale and discontinued operations to the Rexel subgroup as of January 1, 2004 involves the valuation of the net carrying amount of Rexel assets and liabilities as of this date in accordance with the IFRS framework applied by the Group. In addition, application of IAS 12 – Income Taxes requires the recognition of a deferred tax liability with respect to the difference between the tax value and the consolidated net carrying amount of the Rexel subgroup (the sale of which is highly probable on the transition date). The impact of these differences is a €85.4 million net decrease in consolidated shareholders’ equity as of January 1, 2004, of which €81.6 million for shareholders’ equity attributable to equity holders of the parent and €3.8 million for minority interests. Application of IFRS 5 also requires the separate balance sheet presentation, without offset, of assets and liabilities that are part of a dispo-sal group held for sale. This presentation method results in a net increase in assets of €134.1 million, a net increase in liabilities excluding shareholders’ equity of €219.5 million, and a decrease in Group net fi nancial indebtedness of €424.9 million at the transition date.
Rexel net income before depreciation and amortisation and the corresponding post-tax capital gain on divestment were restated according to IFRS and reclassifi ed on a separate line “Discontinued operations” in the income statement for €588.6 million as of December 31, 2004.The accounting treatment of Rexel in accordance with IFRS 5 resulted in a €203.8 million increase in consolidated net income as of Decem-ber 31, 2004, representing the impact of restatements on the calculation of net proceeds from the Rexel sale on December 10, 2004.
f) Share-based payments (IFRS 2)
Application of IFRS 2 – Share-based payment modifi es the method of recognising equity-settled compensation plans. The Group has opted to apply this standard solely to those plans issued subsequent to November 7, 2002, which had not vested as of January 1, 2005. The commitment is expensed over the rights vesting period and adjusted to refl ect the best estimate of the number of equity instruments actually exercised.The fair values of eligible options, determined on their grant date, do not impact opening shareholders’ equity but do result in a net charge of €7.1 million in respect of PPR share subscription option plans issued in 2003 and 2004, prorated to the vested rights of employees and a net charge of €4.1 million in respect of cash-settled plans.
g) Deferred tax on associates (IAS 12)
In addition to the recognition of a tax impact for all the preceding differences, the application of IAS 12 led the Group to recognise defer-red tax on temporary differences relating to associates. Application of this principle had a positive impact on consolidated shareholders’ equity of €45.3 million as of January 1, 2004 and decreased 2004 net income by €52.8 million, specifi cally in connection with the dis-posal of 24.5% of consumer credit businesses during the year.
h) Revenue (IAS 18)
Application of IAS 18 modifi es the revenue recognition of sales with warranty extension contracts. Under French GAAP, the income relating to the warranty extension is recorded at the time of the sale; under IFRS, it is now deferred over the period of the warranty extension. This difference decreased consolidated shareholders’ equity by €74.6 million as of January 1, 2004, representing the cancellation of income recognised in advance less provisions previously intended to cover the warranty extension and the corresponding deferred tax. Given the pace at which sales with warranty extension contracts are growing, application of this principle reduced net income by €7.0 million in fi scal year 2004.In addition, the method used to recognise Printemps concession contracts decreased revenue by €173.8 million in fi scal year 2004, with no impact on net income.

231 Reference document 2005
i) Consolidation of special purpose entities (SIC 12)
SIC Interpretation 12 requires the recognition in the consolidated fi nancial statements of the Group’s securitised debt funds and simi-lar entities, in connection with programmes for the assignment of receivables, provided the Group retains the majority of the risks and rewards related to these programmes. The consolidation of all of these programmes under the new IFRS framework increased net fi nan-cial debt and trade receivables by €52.2 million as of January 1, 2004.
j) Reclassifi cations
The balance sheet accounts were reclassifi ed in order to align their presentation with IFRS, particularly in terms of IAS 1 – Presentation of fi nancial statements. This standard modifi es the presentation of balance sheet fi nancial information, particularly by distinguishing between current and non-current items.
Pursuant to this standard, the Group reclassifi ed interest accrued on borrowings in short-term borrowings. Previously, interest had been recognised in non-operating payables.
In accordance with IAS 28 – Investments in associates, the Group reclassifi ed goodwill related to associates in the carrying amount of the investment. This reclassifi cation, in the amount of €51.5 million as of January 1, 2004, primarily concerned consumer credit businesses.
In the income statement, application of IAS 1 results in the elimination of exceptional items, reclassifi ed in operating income according to the nature of the transactions.
Cash fl ow statement
The impact of restatements resulting from application of international standards to cash fl ows mainly concerns accrued interest receivable in “Cash and cash equivalents,” recognised in non-operating receivables under French GAAP, and bank overdrafts, recognised in short-term borrowings under French GAAP. This classifi cation was reiterated in the recommendation issued by the French National Accounting Council on October 27, 2004. This difference decreased cash and cash equivalents by €243 million as of December 31, 2004.
Impact of IAS 32/39 as of January 1, 2005
IAS 32 – Financial instruments: Disclosure and Presentation and IAS 39 – Financial instruments: Recognition and Measurement were applied prospectively by the Group as of January 1, 2005.
The following reconciliation table summarises the impact of application of these standards on the main balance sheet items as of January 1, 2005:

232
Financial Information – Consolidated fi nancial statements
PPR 233
(in € million) 12.31.2004 Published under
IFRS.excluding IAS 32/39
Treasury shares
Hybrid instruments
French GAAP format a bGoodwill 5,396.6
Other intangible assets 6,618.4
Property, plant and equipment 2,623.5
Investments in associates 46.9
Other non-current fi nancial assets 241.2
Deferred tax assets 425.7
Other current assets 14.4
NON-CURRENT ASSETS 15,366.7
Inventories 2,632.6
Trade receivables 1,052.5
Customer loans 419.1
Current tax receivables 46.2
Other current fi nancial assets 146.5
Other current assets 1,225.5 (1.7)
Cash and cash equivalents 4,288.1 (345.8)
CURRENT ASSETS 9,810.5 (345.8) (1.7)
ASSETS HELD FOR SALE
TOTAL ASSETS 25,177.2 (345.8) (1.7)
Shareholders’ equity attributable to equity holders of the parent 7,780.4 (345.8) 77.6
Shareholders’ equity attributable to minority interests 238.8
SHAREHOLDERS’ EQUITY 8,019.2 (345.8) 77.6
Long-term borrowings 6,103.2 (120.9)
Other non-current fi nancial liabilities
Provisions for retirement and similar benefi ts 233.3
Provisions 164.8
Deferred tax liabilities 1,859.7 41.6
Other non-current liabilities
NON-CURRENT LIABILITIES 8,361.0 (79.3)
Short-term borrowings 2,910.2
Financing of customer loans 419.1
Other current fi nancial liabilities 11.2
Trade payables 2,643.8
Provisions for retirement and similar benefi ts 14.2
Provisions 183.5
Current tax liabilities 266.6
Other current liabilities 2,348.4
CURRENT LIABILITIES 8,797.0
LIABILITIES ASSOCIATES WITH ASSETS HELD FOR SALE
TOTAL LIABILITIES AND SHAREHOLDERS’ EQUITY 25,177.2 (345.8) (1.7)

233 Reference document 2005
Minority interest options
Effective interest rate
Hedging derivatives
Derivatives not qualifying for
hedge accounting
Other Total impact
01.01.2005 Published under
IFRS.including IAS 32/39c d e f g
88.8 88.8 5,485.4
6,618.4
2,623.5
46.9
65.2 3.9 17.9 87.0 328.2
14.6 2.9 0.1 17.6 443.
14.4,
88.8 79.8 6.8 18.0 193.4 15,560.1
2,632.6
(3.1) 12.9 9.8 1,062.3
419.1
46.2
(27.7) 29.8 (1.2) 0.9 147.4
(1.0) (17.8) (15.4) (35.9) 1,189.6
(0.2) (79.3) (425.3) 3,862.8
(31.8) 11.8 (83.0) (450.5) 9,360.0
88.8 48.0 18.6 (65.0) (257.1) 24,920.1
(30.5) (28.2) (5.4) (0.5) (332.8) 7,447.6
(67.3) (67.3) 171.5
(67.3) (30.5) (28.2) (5.4) (0.5) (400.1) 7,619.1
110.7 49.8 21.8 (3.6) (1.4) 56.4 6,159.6
2.0 2.0 2.0
233.3
(13.7) (13.7) 151.1
(16.4) 0.2 (0.1) (0.1) 25.2 1,884.9
110.7 33.4 22.0 (1.7) (15.2) 69.9 8,430.9
45.4 (2.9) 8.2 1.0 11.9 63.6 2,973.8
419.1
49.7 36.7 1.2 87.6 98.8
(2.9) (1.4) (4.3) 2,639.5
14.2
(60.9) (60.9) 122.6
266.6
(0.8) (12.0) (0.1) (12.9) 2,335.5
45.4 (2.9) 54.2 25.7 (49.3) 73.1 8,870.1
88.8 (0.0) 48.0 18.6 (65.0) (257.1) 24,920.1

234
Financial Information – Consolidated fi nancial statements
PPR 235
a) Treasury shares
IAS 32 requires that treasury shares be deducted from consolidated shareholders’ equity, regardless of the reason for which they are acquired, without subsequent recognition of fair value movements. As of January 1, 2005, the Group held treasury shares classifi ed in marketable securities under French GAAP in the amount of €345.8 million, which were deducted from consolidated shareholders’ equity in accordance with IFRS.
b) Hybrid instruments
The Group has fi nancial instruments with both a debt component and an equity component, and specifi cally convertible bonds issued in the form of OCEANEs in 2001 and 2003. Under French GAAP, these bonds were presented in the December 31, 2004 balance sheet for €149.2 million and €1,079.5 million, respectively.
As part of transition to IFRS, the Group calculated retrospectively the fi nancial liability and equity components of these instruments at their issue date and deduced the value of the fi nancial liabilities to be recognised as of January 1, 2005.
As of January 1, 2005, the equity component of convertible bonds is €120.9 million. The recognition of this equity component decreases borrowings by €120.9 million and increases shareholders’ equity by €77.6 million after taking into account the related deferred taxes.
c) Minority interest options
The Group has committed to repurchase the minority interests of shareholders of certain fully consolidated subsidiaries. These Group repurchase commitments correspond to optional commitments (written put options). Under French GAAP, the commitments were recor-ded under “Off-balance sheet commitments” in the notes to the consolidated fi nancial statements. The strike price of these options may be set or determined according to a predefi ned calculation formula, and the options may be exercised at any time or on a specifi c date.
Pending a decision from the IASB on the subject, the following accounting treatment has been adopted by the Group:• in accordance with IAS 32, the Group records a fi nancial liability with respect to put options granted to minority shareholders of the
entities concerned;• the liability is initially recognised at the present value of the strike price and at subsequent balance sheet dates based on the fair value
of the shares to be potentially purchased if the strike price is based on the fair value;• the corresponding entry for this liability is deducted from minority interests and the balance from goodwill. The obligation to record a
liability even though the put option is not exercised means, for purposes of consistency, that the same treatment applied to increases in percentage interests in controlled companies must initially be used for these transactions;
• the subsequent change in the value of the commitment is recognised through an adjustment to goodwill (excluding the discounting impact).
As such, the Group recognised a fi nancial liability for the put options granted to the minority shareholders of the entities concerned in the amount of €156.1 million, with a reduction in minority interests and an increase in goodwill as a corresponding entry.
d) Effective interest rate
Under IFRS, identifi ed transaction costs and issue or redemption premiums directly related to and identifi ed on the issue of a fi nancial liability are initially deducted from the fi nancial liability as part of their recognition at amortised cost using the effective interest rate.
At January 1, 2005, the impact of this restatement increased borrowings by €46.9 million, of which €48.2 million with respect to the OCEANE bonds and corresponding to cumulative interests costs included in the liability component, and decreased consolidated shareholders’ equity by €30.5 million after taking into account the related deferred tax.
e/f) Hedging derivatives/Derivatives not qualifying for hedge accounting
To reduce its exposure to foreign exchange and interest rate risk, the Group uses derivative instruments which, pursuant to IAS 39, must be recognised at their fair value on the balance sheet.These instruments may be eligible for hedge accounting under IAS 39, provided they meet the documentation and effectiveness criteria described in note 2.9 and are recognised using specifi c methods based on the designated type of hedge.

235 Reference document 2005
As of January 1, 2005, the Group identifi ed asset derivative instruments in the amount of €200.4 million, including €69.1 million of non-current asset derivatives and liability derivative instruments in the amount of €90.9 million, including €2.0 million of non-current liability derivatives.
• Foreign exchange risk:The Group uses foreign exchange derivative instruments mainly to cover commercial commitments. The foreign exchange risk manage-ment policy covers highly probable budget exposure and/or fi rm commitments of the Retail and Luxury Goods Divisions.These instruments are usually eligible for cash fl ow hedge accounting particularly when their purpose is to hedge highly probable future cash fl ows or fair value accounting when their purpose is to hedge contractual fi rm commitments or foreign currency receivables and payables.
As of January 1, 2005, opening shareholders’ equity was decreased or increased according to the fair value revaluation of:- foreign exchange derivative instruments qualifying for hedge accounting under IFRS (particularly with respect to cash fl ow hedging
relationships);- foreign exchange derivative instruments not qualifying for hedge accounting.
• Interest rate risk:The Group uses interest rate derivatives to hedge a portion of its long or medium-term borrowings. These instruments generally qualify for fair value hedge accounting since they are matched to an underlying issued or contracted at a fi xed rate. The change in the value of the derivatives recorded in fi nancial income is then symmetrically offset by the change in value of the underlying debt, which is also recognised in fi nancial income.
As of January 1, 2005, the impact of these restatements on the consolidated balance sheet concerns the fair value revaluation of:- all interest rate derivatives;- the portion of borrowings, mainly bonds, hedged by interest rate swaps with respect to the fair value relationship.
The recognition of derivatives qualifying for hedge accounting (exchange and interest rate) decreased consolidated shareholders’ equity by €28.2 million, net of deferred tax.
The recognition of derivatives not qualifying for hedge accounting (exchange and interest rate) decreased consolidated shareholders’ equity by €5.4 million, net of deferred tax.
Group net fi nancial indebtedness, as defi ned in note 2 - Accounting policies and methods to the consolidated fi nancial statements, includes all interest rate derivative instruments, and amounts to €5,183.8 million as of January 1, 2005.
g) Other items
Other items, without a material impact on consolidated shareholders’ equity as of January 1, 2005, primarily concern the reclassifi cation of non-consolidated investments in line with IFRS.
36.4. Reconciliation of the 2004 consolidated fi nancial statements under IFRS with previously published versions
As advised by the Group at the time of previous publications, the 2004 consolidated fi nancial statements restated according to IFRS and published in the 2005 Reference Document, present immaterial differences from preceding publications.
These adjustments are due to developments concerning certain standards, or the issue of additional clarifi cation on the application of certain standards by the regulators. The main adjustments between the 2004 consolidated fi nancial statements previously published and the defi nitive 2004 consolidated fi nancial statements are presented below:
• Retrospective application of IFRS 3 – Business combinations, from January 1, 1999 had led the Group to cancel goodwill amortisation charges in respect of acquisitions after this date only and to extend this cancellation to all acquisitions from January 1, 2004. The French Securities Regulator’s (AMF) interpretation of the retrospective application of this standard led the Group to extend the cancellation of goodwill amortisation from January 1, 1999 to all acquisitions. Application of this divergence in treatment led the Group to modify its 2004 fi nancial statements under IFRS as follows:

236
Financial Information – Consolidated fi nancial statements
PPR 237
- the extension of the cessation of goodwill amortisation to all Group acquisitions as of the date of application of IFRS 3 had a positive impact on shareholders’ equity as of January 1, 2004 of €247.2 million (excluding Rexel);
- the prospective application as of January 1, 1999 of IAS 36 – Impairment of Assets and IAS 38 – Intangible assets notably led the Group to recognise an irreversible impairment loss in the respect of the goodwill relating to the Redcats USA cash generating unit, resulting in a decrease in shareholders’ equity at the transition date of €150.8 million.
- this interpretation, as applied to Rexel (recognised in accordance with IFRS 5 – Non-current assets held for sale and discontinued operations) had a positive impact on shareholders’ equity as of January 1, 2004 of €104.0 million, after deduction of an additional deferred tax liability of €20.5 million in accordance with IAS 12.
• Application of IFRS 5 – Non-current assets held for sale and discontinued operations, combined with the change in interpretation concerning application of IFRS 3 described above, led the Group to adjust the capital gain, net of tax, realised on the sale of Rexel in the amount of €61.9 million and reclassify this gain in “Discontinued operations”.
• The opinion issued by the French National Accounting Council on November 9, 2005 clarifi ed the accounting treatment to be adopted with respect to catalogue costs. Expenses in respect of catalogues delivered after the balance sheet date and costs incurred at the ba-lance sheet date but which will be effectively used after the balance sheet date, can be capitalised in “Prepaid expenses” as they satisfy the defi nition of an asset generating future economic benefi t. Conversely, costs in respect of catalogues already dispatched represent expenses of the period in which they are incurred. This opinion is consistent with the treatment of deferred charges under IAS 38 – Intangible assets. The Group adopted this treatment, resulting in a decrease in opening shareholders’ equity of €54.9 million after tax.
• The Group has chosen to apply, retrospectively from January 1, 2004, the option offered by IAS 19, as amended in December 2004, which enables the recognition in shareholders’ equity of actuarial differences on defi ned benefi t plans, instead of the corridor method previously adopted. The application of this option had a negative impact on shareholders’ equity as of December 31, 2004 of €14.5 million.
• The Group presents gross profi t as a management line item in its Income statement, consistent with IAS 1 – Presentation of fi nancial statements. Gross profi t is equal to revenues less the cost of sales. In accordance with IFRS, the Group has reclassifi ed the cost of free gifts granted by the Luxury Goods Division to customers from “Other recurring operating income and expenses” to “Cost of sales” in the amount of €13.4 million, thereby decreasing the 2004 gross profi t.

237 Reference document 2005
37. List of consolidated subsidiaries as of December 31, 2004
A list of the Group subsidiaries is presented below:
Consolidation full consolidation: F
equity method: E
Companies % interest
2005 2004
PPR Parent company
GUCCIGUCCI GROUP NV (NETHERLANDS) F 99.48 F 99.41
France
LUXURY GOODS France SA
(ex GUCCI FRANCE SAS) F 100.00 F 100.00
GG France HOLDING SARL F 100.00 F 100.00
GUCCI GROUP WATCHES France, SAS F 100.00 F 100.00
YVES SAINT LAURENT SAS F 100.00 F 100.00
BOUCHERON SAS F 100.00 F 100.00
BOUCHERON HOLDING SA F 100.00 F 100.00
PARFUMS ET COSMÉTIQUES INTERNATIONAL SAS F 100.00 F 100.00
BOUCHERON PARFUMS (SAS) F 100.00 F 100.00
C. MENDES SA F 100.00 F 100.00
YVES SAINT LAURENT BOUTIQUE France SAS F 100.00 F 100.00
YVES SAINT LAURENT SERVICES SAS F 100.00 F 100.00
YSL BEAUTÉ (SAS) F 100.00 F 100.00
ROGER & GALLET (SAS) F 100.00 F 100.00
YSL BEAUTÉ RECHERCHE ET INDUSTRIES (SAS) F 100.00 F 100.00
PARFUMS VAN CLEEF AND ARPELS SA F 100.00 F 97.32
YVES SAINT LAURENT PARFUMS LASSIGNY (SAS) F 100.00 F 100.00
YVES SAINT LAURENT PARFUMS SA F 100.00 F 100.00
PARFUMS STERN (SAS) F 100.00 F 100.00
BALENCIAGA SA F 91.00 F 91.00
BOTTEGA VENETA France HOLDING SAS F 86.28 F 78.46
BOTTEGA VENETA France SA F 86.28 F 78.46
ALEXANDER McQUEEN PARFUMS (SAS) F 100.00 F 100.00
CLASSIC PARFUMS (SAS) F 100.00 F 100.00
PARFUMS BALENCIAGA (EURL) F 100.00 F 100.00
STELLA McCARTNEY PARFUMS (SAS) F 100.00 F 100.00
STELLA McCARTNEY FRANCE SAS F 50.00 F 50.00
Germany
GG LUXURY GOODS GmbH F 100.00 F 100.00
YVES SAINT LAURENT GERMANY GmbH F 100.00 F 100.00
YSL BEAUTÉ GmbH F 100.00 F 100.00
BOTTEGA VENETA GERMANY GmbH F 86.28 F 78.46
Austria
GUCCI AUSTRIA GmbH F 100.00 F 100.00
YSL BEAUTÉ HGmbH F 100.00 F 100.00
Belgium
GUCCI BELGIUM SA F 100.00 F 100.00
LA MERIDIANA FASHION SA F 100.00 F 100.00
YSL BEAUTÉ SA NV F 100.00 F 100.00
YVES SAINT LAURENT BELGIUM SPRL F 100.00 F 100.00
Spain
LUXURY GOODS SPAIN SL F 100.00 F 100.00
LUXURY TIMEPIECES ESPAÑA SL F 100.00 F 51.00
YVES SAINT LAURENT SPAIN SA F 100.00 F 100.00
YSL BEAUTÉ SA F 100.00 F 100.00
FILDEMA XXI SL F 100.00 F 100.00
BOTTEGA VENETA ESPAÑA SL F 86.28 F 78.46
United Kingdom
GUCCI LIMITED F 100.00 F 100.00
GUCCI SERVICES LIMITED F 100.00 F 100.00
LUXURY TIMEPIECES (UK) Ltd F 100.00 F 100.00
YVES SAINT LAURENT UK Ltd F 100.00 F 100.00
YSL BEAUTÉ Ltd F 100.00 F 100.00
SERGIO ROSSI UK Limited F 100.00 F 100.00
BOUCHERON UK Ltd F 100.00 F 100.00
BOTTEGA VENETA UK Co. Limited F 86.28 F 78.46
AUTUMNPAPER Limited F 51.00 F 51.00
BIRDSWAN SOLUTIONS Ltd F 51.00 F 51.00
PAINTGATE Limited F 100.00 F 100.00
ALEXANDER McQUEEN TRADING Ltd F 51.00 F 51.00
STELLA McCARTNEY Limited F 50.00 F 50.00
JOHN FIELD Ltd F 51.00 F 51.00
Greece
YSL BEAUTÉ AEBE F 51.00 F 51.00
Ireland
GUCCI IRELAND LIMITED F 100.00 F 100.00
Italy
GUCCIO GUCCI SpA F 100.00 F 100.00
CAPRI GROUP Srl F 75.00 F 75.00
GUCCI IMMOBILLARE LECCIO Srl F 64.00 F 64.00
LUXURY GOODS ITALIA SpA F 100.00 F 100.00
GUCCI LOGISTICA SpA F 100.00 F 100.00
LUXURY GOODS OUTLET Srl F 100.00 F 100.00
GUCCI VENEZIA SpA F 51.00 F 51.00
G.F. LOGISTICA Srl F 100.00 F 100.00
G.F. SERVICES Srl F 100.00 F 100.00
FENDI PROFUMI SpA F 100.00 F 100.00
FLORBATH PROFUMI DI PARMA SpA F 100.00 F 51.00
YSL BEAUTÉ ITALIA SpA F 100.00 F 100.00
SERGIO ROSSI SpA F 100.00 F 70.00
ASCOT Srl F 100.00 F 70.00
B.V ITALIA Srl F 86.28 F 78.46
BOTTEGA VENETA Srl F 86.28 F 78.46
B.V. SERVIZI Srl F 86.28 F 78.46
REGAIN 1957 Srl F 70.00 F 70.00

238
Financial Information – Consolidated fi nancial statements
PPR 239
Companies % interest
2005 2004
CONCERIA BLU TONIC SpA F 51.00 F 51.00
CARAVEL PELLI PREGIATE Srl F 51.00 F 51.00
DESIGN MANAGEMENT Srl F 100.00 F 100.00
BARUFFI Srl F 67.00 F 67.00
PAOLETTI Srl F 51.00 F 51.00
TIGER FLEX Srl F 75.00 F 75.00
PIGINI Srl F 70.00 F 70.00
GAUGUIN Srl F 100.00 F 100.00
GUCCI FINANZIARIA SpA F 100.00 F 100.00
GG ITALIA HOLDINGS SpA F 100.00 F 100.00
Luxembourg
GUCCI LUXEMBOURG SA F 100.00 F 100.00
SERGIO ROSSI INTERNATIONAL SARL F 100.00 F 100.00
BOUCHERON Luxembourg SARL F 100.00 F 100.00
BOTTEGA VENETA INTERNATIONAL SARL F 86.28 F 78.46
Monaco
GUCCI Sam F 100.00 F 100.00
S.A.M YVES SAINT LAURENT MONACO Sam F 100.00 F 100.00
The Netherlands
GUCCI INTERNATIONAL NV F 100.00 F 100.00
GUCCI NETHERLANDS BV F 100.00 F 100.00
GUCCI PARTICIPATION BV F 100.00 F 100.00
GUCCI ASIAN HOLDING BV F 100.00 F 100.00
GEMINI ARUBA NV F 100.00 F 100.00
YVES SAINT LAURENT FASHION BV F 100.00 F 100.00
YVES SAINT LAURENT FRANCE BV F 100.00 F 100.00
YSL BEAUTÉ NEDERLAND BV F 100.00 F 100.00
SERGIO ROSSI NETHERLANDS BV F 100.00 F 100.00
BOTTEGA VENETA BV F 86.28 F 78.46
BOTTEGA VENETA ASIAN TRADE BV F 86.28 F 78.56
Portugal
YSL BEAUTÉ SA F 51.00 F 51.00
Switzerland
LUXURY GOODS INTERNATIONAL SA F 100.00 F 100.00
LUXURY TIMEPIECES INTERNATIONAL SA F 100.00 F 100.00
LUXURY GOODS LOGISTIC SA F 100.00 F 100.00
LUXURY TIMEPIECES DESIGN SA F 100.00 F 100.00
LUXURY TIMEPIECES MANUFACTURING SA F 100.00 F 100.00
YSL BEAUTÉ SUISSE F 100.00 F 100.00
BOUCHERON INTERNATIONAL SA F 100.00 F 100.00
BEDAT & CO SA F 100.00 F 85.00
BEDAT GROUP HOLDING SA F 100.00 F 85.00
LUXURY GOODS OPERATIONS (L.G.O.) SA F 51.00 F 51.00
Canada
LUXURY TIMEPIECES (Canada) Inc F 100.00 F 100.00
GUCCI SHOPS OF Canada Inc F 100.00 F 100.00
GUCCI BOUTIQUES, Inc F 100.00 F 100.00
YSL BEAUTÉ Canada Inc F 100.00 F 100.00
United States
GUCCI AMERICA Inc F 100.00 F 100.00
GUCCI NORTH AMERICA HOLDINGS Inc F 100.00 F 100.00
YVES SAINT LAURENT AMERICA Inc F 100.00 F 100.00
YVES SAINT LAURENT OF SOUTH AMERICA Inc F 100.00 F 100.00
YVES SAINT LAURENT AMERICA HOLDING Inc F 100.00 F 100.00
YSL BEAUTÉ Inc F 100.00 F 100.00
YSL BEAUTÉ MIAMI Inc F 100.00 F 100.00
SERGIO ROSSI USA Inc F 100.00 F 100.00
BOUCHERON US Ltd(ex. PARFUMS BOUCHERON Corp.) F 100.00 F 100.00
BOUCHERON JOAILLERIE (USA) Inc F 100.00 F 100.00
BALENCIAGA AMERICA Inc F 91.00 F 91.00
BEDAT & CO USA LLC F 100.00 F 85.00
BOTTEGA VENETA Inc F 86.28 F 78.46
STELLA McCARTNEY AMERICA Inc F 50.00 F 50.00
GUCCI GROUP WATCHES Inc F 100.00 F 100.00
Australia
YSL BEAUTÉ AUSTRALIA PTY Ltd F 100.00 F 100.00
GUCCI AUSTRALIA PTY Limited F 100.00 F 100.00
New Zealand
YSL BEAUTÉ NZ Ltd F 100.00 F 100.00
China
GUCCI GROUP (Hong Kong) Limited F 100.00 F 100.00
LUXURY TIMEPIECES (HONG KONG) LIMITED F 100.00 F 100.00
YSL BEAUTÉ HONG KONG Ltd F 100.00 F 100.00
BOTTEGA VENETA HONG KONG LIMITED F 86.28 F 78.46
Korea
GUCCI GROUP KOREA Ltd F 100.00 F 100.00
SERGIO ROSSI KOREA Ltd F 100.00 F 70.00
BOTTEGA VENETA KOREA Ltd F 86.28 F 78.46
United Arab Emirates
YSL BEAUTÉ MIDDLE EAST FZCO F 66.76 F 70.00
Guam
GUCCI GROUP GUAM Inc F 100.00 F 100.00
BOTTEGA VENETA GUAM F 86.28 F 78.46
Japan
GUCCI GROUP JAPAN LIMITED F 100.00 F 100.00
GUCCI GROUP JAPAN HOLDING LIMITED F 100.00 F 100.00
LUXURY TIMEPIECES JAPAN LIMITED F 100.00 F 100.00
YUGEN KAISHA GUCCI F 100.00 F 100.00
SERGIO ROSSI JAPAN LIMITED F 100.00 F 100.00
YVES SAINT LAURENT FASHION JAPAN Ltd F 100.00 F 100.00
YVES SAINT LAURENT PARFUMS KK F 100.00 F 100.00
BOUCHERON JAPAN F 100.00 F 100.00
BOTTEGA VENETA JAPAN LIMITED F 86.28 F 78.46
Malaysia
GUCCI (MALAYSIA) Sdn Bhd F 100.00 F 100.00
BOTTEGA VENETA MALAYSIA Sdn Bhd F 86.28 F 78.46
Singapore
GUCCI SINGAPORE Pte Limited F 100.00 F 100.00

239 Reference document 2005
Companies % interest
2005 2004
YSL BEAUTÉ SINGAPORE PTE Ltd F 100.00 F 100.00
BOTTEGA VENETA SINGAPORE PRIVATE LIMITED F 86.28 F 78.46
Taiwan
GUCCI TAIWAN LIMITED F 100.00 F 100.00
GUCCI GROUP WATCHES TAIWAN LIMITED F 100.00 F 100.00
BOUCHERON TAIWAN CO LTD F 100.00 F 100.00
Thailand
GUCCI THAILAND CO LTD F 100.00 F 100.00
CONFORAMACONFORAMA F 99.95 F 99.95
France
CENTRE TECHNIQUE DE L’EST F 100.00 F 100.00
COGEDEM F 100.00 F 100.00
CONFORAMA France F 100.00 F 100.00
CONFORAMA MANAGEMENT F 100.00 F 100.00
CONFO ON LINE F 100.00 F 100.00
IHTM FRANCE F 100.00 F 100.00
RABINEAU F 67.01 F 50.98
SODICE EXPANSION E 31.98 E 31.98
Croatia
FLIBA D.O.O. F 100.00 F 100.00
Spain
BRICO HOGAR F 100.00 F 100.00
Hong-Kong
CONFORAMA TRADING LIMITED F 100.00 F 100.00
Italy
CONFORAMA ITALIA F 100.00 F 100.00
CREDIRAMA E 49.00 E 49.00
IHTM ITALIE F 100.00 F 100.00
Luxembourg
FLIE SA Liquidation F 100.00
CONFORAMA LUXEMBOURG F 100.00 F 100.00
Poland
CONFORAMA POLSKA F 100.00 F 100.00
IHTM POLOGNE F 100.00 F 100.00
Romania
IHTM ROUMANIE F 100.00 F 100.00
Portugal
HIPERMOVEL F 100.00 F 100.00
Switzerland
IHTM F 100.00 F 100.00
CONFORAMA SUISSE F 100.00 F 100.00
Singapore
CONFORAMA ASIA F 100.00 F 100.00
Vietnam
IHTM VIETNAM F 100.00 F 100.00
FNACFNAC SA F 100.00 F 100.00
France
ATTITUDE F 100.00 F 100.00
BILLETEL F 100.00 F 100.00
BILLETTERIE DISTRIBUTION F 54.99 F 54.99
BILLETTERIE HOLDING F 100.00 F 100.00
ÉVEIL & JEUX Merger G 100.00
FNAC DIRECT F 100.00 F 100.00
FNAC DISTRIBUTION SA F 100.00 F 100.00
FNAC ÉVEIL & JEUX (ex Fnac Junior) F 100.00 F 100.00
FNAC LOGISTIQUE SAS F 100.00 F 100.00
FNAC PARIS SA F 100.00 F 100.00
FNAC SERVICE SARL F 100.00 F 100.00
FNAC TOURISME SARL F 100.00 F 100.00
FNAC VIDÉO ENTREPRISE SNC Merger F 100.00
MSS F 100.00 F 100.00
SAS RELAIS FNAC F 100.00 F 100.00
SFL (ALIZE) F 100.00 F 100.00
SNC CODIREP F 100.00 F 100.00
SURCOUF F 100.00 F 100.00
Belgium
FNAC BELGIUM F 100.00 F 100.00
Brazil
FNAC BRÉSIL F 100.00 F 100.00
Spain
FNAC ESPAÑA SA F 100.00 F 100.00
Greece
FMB GENERAL COMMERCIAL SA E 50.00 Creation
Italy
FNAC ITALIA SpA F 100.00 F 100.00
Monaco
SAM FNAC MONACO F 100.00 F 100.00
Portugal
FNAC PORTUGAL F 100.00 F 100.00
Switzerland
FNAC SUISSE F 100.00 F 100.00
PRINTEMPSFRANCE PRINTEMPS F 99.96 F 99.96
France
FERALIS F 100.00 F 100.00
MADE IN SPORT F 100.00 F 100.00
MAGASINS RÉUNIS DE L’EST F 94.86 F 94.86
PRINTEMPS DESIGN F 100.00 F 100.00
PRINTEMPS VOYAGE F 100.00 F 100.00
PRINTEMPS.COM F 100.00 F 100.00
PROFIDA F 100.00 F 100.00
SA DE LOGISTIQUE PRINTEMPS F 100.00 F 100.00
SA MAGASINS RÉUNIS F 95.34 F 95.34

240
Financial Information – Consolidated fi nancial statements
PPR 241
Companies % interest
2005 2004
SAPAC PRINTEMPS F 100.00 F 100.00
USSELOISE F 100.00 F 100.00
REDCATS
REDCATS F 100.00 F 100.00
France
CYRILLUS SA F 100.00 F 100.00
DIAM SA F 100.00 F 100.00
2.I.D (ex ENGENEERING GIE) F 100.00 F 100.00
HAVRAFI F 100.00 F 100.00
LA MAISON DE VALÉRIE F 100.00 F 100.00
LA REDOUTE F 100.00 F 100.00
LES AUBAINES VPC F 100.00 F 100.00
LES AUBAINES MAGASINS F 100.00 F 100.00
LES DÉFIS F 100.00 F 100.00
MOVITEX F 100.00 F 100.00
REDCATS INTERNATIONAL F 100.00 F 100.00
REDCATS MANAGEMENT SERVICES F 100.00 F 100.00
REDINVEST Merger F 100.00
RÉFÉRENCE BRÉSIL F 100.00 Acquisition
SADAS F 100.00 F 100.00
SNC LES TROUVAILLES F 100.00 F 100.00
SOGEP F 100.00 F 100.00
SOMEWHERE F 100.00 F 100.00
STE NVELLE D’EXPANSION REDOUTE (SNER) F 100.00 F 100.00
THOMAS INDUSTRIES F 100.00 F 100.00
VBMAG F 100.00 F 100.00
Germany
FNAC DEUTSCHLAND Gmbh F 100.00 G 100.00
MOVITEX ALLEMAGNE F 100.00 F 100.00
Austria
REDOUTE AUTRICHE F 100.00 F 100.00
REDCATS BETEILIGUNG Gmbh F 100.00 F 100.00
Belgium
CYRILLUS BENELUX F 100.00 F 100.00
MOVITEX BELGIQUE F 100.00 F 100.00
REDOUTE CATALOGUE BENELUX F 100.00 F 100.00
Brazil
REDCATS DO BRASIL F 100.00 Création
Denmark
ELLOS AS DK F 100.00 F 100.00
Spain
REDOUTE CATALOGO SA F 100.00 F 100.00
Estonia
ELLOS ESTONIE OY F 100.00 F 100.00
Finland
ELLOS HOME ENTERTAINEMENT F 100.00 F 100.00
ELLOS TILI OY (ex FINANS HOLDING OY) F 100.00 F 100.00
REDCATS OY (ex ELLOS POSTIMYYNTY OY) F 100.00 F 100.00
The Netherlands
REDCATS INT. HOLDING BV (ex BARBICAM BV) F 100.00 F 100.00
United Kingdom
CYRILLUS UK F 100.00 F 100.00
EMPIRE STORES GROUP PLC F 100.00 F 100.00
MOVITEX UK F 100.00 F 100.00
REDOUTE UK F 100.00 F 100.00
REDCATS FINANCE UK F 100.00 F 100.00
VERTBAUDET UK F 100.00 F 100.00
Greece
REDOUTE HELLAS F 100.00 Creation
Hong-Kong
REDCATS ASIA F 100.00 F 100.00
Norway
ELLOS HOLDING AS F 100.00 F 100.00
ELLOS KONTO A/S F 100.00 F 100.00
JOTEX NORGE AS (ex JOTEX NORWAY AS) F 100.00 F 100.00
REDCATS AS (ex ELLOS AS) F 100.00 F 100.00
REDOUTE NORGE AS F 100.00 Creation
Portugal
REDOUTE PORTUGAL F 100.00 F 100.00
VERTBAUDET PORTUGAL F 100.00 F 100.00
Sweden
ALVSREDS POSTORDER AB F 100.00 F 100.00
ELLOS AB F 100.00 F 100.00
ELLOS GRUPPEN AB Merger F 100.00
JOTEX AB HOLDING COMPANY F 100.00 F 100.00
JOTEX SVERIDGE AB F 100.00 F 100.00
REDCATS NORDIC AB F 100.00 F 100.00
REDOUTE SCANDINAVIE F 100.00 F 100.00
TRUCKEN DISTRIBUTION JP AB Merger F 100.00
REDCATS FINANS AB (ex FINAREF KONTO AB) F 100.00 F 100.00
REDCATS TREASURY AB(ex FINAREF NORDIC HOLDING AB) Merger F 100.00
REDCATS INVEST (ex FINAREF INVEST AB) Merger F 100.00
OY MOBINA AB F 100.00 F 100.00
VARNAMO INKASSO F 100.00 F 100.00
Switzerland
CYRILLUS SUISSE SA F 99.75 F 99.75
REDOUTE CH. SA F 100.00 F 100.00
Turkey
REDCATS TURKEY F 99.50 F 100.00
United States
REDCATS USA. INC. (ex BRYLANE INC.) F 100.00 F 100.00
REDCATS USA LLC F 100.00 F 100.00
Japan
CYRILLUS JAPON F 100.00 F 100.00

241 Reference document 2005
Companies % interest
2005 2004
ORCANTAORCANTA F 100.00 F 100.00
CFAOCFAO F 99.93 F 99.93
France
CONTINENTAL PHARMACEUTIQUE F 73.22 F 73.19
COTAFI F 100.00 F 100.00
CYCLEX F 99.99 F 99.99
DEPHI F 99.67 F 99.67
DOMAFI F 100.00 F 100.00
EPDIS F 99.68 F 99.67
EURAPHARMA F 99.68 F 99.68
GEREFI F 100.00 F 100.00
HOLDEFI E 24.27 E 35.00
HOLDINTER F 100.00 F 100.00
SECA F 99.68 F 99.68
SEI F 100.00 F 100.00
SEP E 49.00 E 49.00
SEROM F 99.90 F 99.90
SFCE F 100.00 F 100.00
United Kingdom
EURAFRIC TRADING F 100.00 F 100.00
MASSILIA HOLDING F 100.00 F 100.00
Switzerland
EURALAB F 99.68 F 99.68
French overseas departments and territories
CMM (La Réunion) F 98.02 F 98.02
CMM UD (La Réunion) E 45.00 E 45.00
LABOREX SAINT MARTIN (Les Antilles) F 63.10 F 99.68
LOCAUTO (La Nouvelle Calédonie) F 48.99 F 99.98
MENARD FRERES (La Nouvelle Calédonie) F 99.98 F 99.98
NCCIE (La Guyane) F 100.00 F 100.00
O.C.D.P. (La Nouvelle Calédonie) E 33.11 E 33.11
SEIGNEURIE OCEAN INDIEN (La Réunion) E 49.00 E 49.00
SOCIÉTÉ METO SA (La Nouvelle Calédonie) F 50.00 F 50.00
SOCIÉTÉ PHARMACEUTIQUE DES CARAIBES (Les Antilles) F 78.10 F 99.68
SOREDIP (La Réunion) F 67.80 F 67.79
SPA (Les Antilles) F 46.13 F 43.13
SPG (La Guyane) F 57.66 F 57.26
TAHITI PHARM (La Polynésie française) F 93.66 F 93.66
Algeria
ALBM F 75.00 F 75.00
DIAMAL F 60.00 F 60.00
Benin
PROMOPHARMA F 50.27 F 50.27
SOBEPAT F 88.56 F 88.56
Burkina Faso
CICA BURKINA F 73.09 F 73.09
LABOREX BURKINA F 85.31 F 85.64
LIPTINFOR F 99.99 F 99.99
SIFA F 58.71 F 58.71
Cameroon
CAMI F 67.49 F 67.49
CEP E 24.19 E 24.19
COMETAL E 50.00 E 50.00
ICRAFON F 52.23 F 52.23
LABOREX CAMEROUN F 65.65 F 65.63
SOCADA F 100.00 F 100.00
SOCCA Sale E 27.09
SOPHITEK F 85.10 F 85.10
SUPERDOLL E 45.00 E 45.00
Central African Republic
CFAO CENTRAFRIQUE F 100.00 F 100.00
Congo
CFAO CONGO F 100.00 F 100.00
LABOREX CONGO F 72.94 F 71.46
LES BRASSERIES DU CONGO F 50.00 F 50.00
Ivory Coast
CFAO CÔTE-D’IVOIRE F 96.38 F 96.38
CIDP F 100.00 F 100.00
COMPAGNIE PHARMACEUTIQUE ET MÉDICALE F 56.96 F 56.96
MAC Sale F 89.78
MIPA F 99.98 F 99.98
SAFCA Sale E 23.85
SARI F 89.77 F 89.77
TECHNOLOGIE CÔTE-D’IVOIRE LTD F 96.38 F 96.38
Egypt
IBN SINA LABOREX F 68.14 F 66.46
SICEP E 30.77 E 30.77
Gabon
CFAO GABON F 96.87 F 96.87
PHARMAGABON F 54.73 F 55.14
SOGACA Sale E 46.04
SPLV F 100.00 F 100.00
TECHNOLOGIE GABON LTD F 99.99 F 99.99
Gambia
CFAO GAMBIA F 78.99 F 78.95
Ghana
CFAO GHANA F 88.21 F 88.21
PENS & PLASTICS F 100.00 F 100.00
Guinea-Bissau
LABOREX GUINÉE F 81.85 F 81.85
Equatorial Guinea
SEGAMI F 100.00 F 100.00

242
Financial Information – Consolidated fi nancial statements
PPR 243
Companies % interest
2005 2004
Kenya
DT DOBIE KENYA F 100.00 F 100.00
EPDIS KENYA Limited F 99.68 F 99.68
HOWSE AND MCGEORGE LABOREX F 99.68 F 99.68
TRIDECON F 100.00 F 100.00
Malawi
CFAO MALAWI LIMITED F 99.99 F 99.99
Mali
COPREXIM INTERNATIONALE F 95.58 F 95.58
DIAMA F 90.00 F 90.00
IMACY F 100.00 F 100.00
LABOREX MALI F 54.44 F 54.44
Marocco
COMAMUSSY F 84.20 F 84.20
DAF INDUSTRIE F 100.00 Acquisition
DIMAC F 99.91 F 99.91
FANTASIA F 84.20 F 84.20
INTER MOTORS F 100.00 F 100.00
MUSSY BOIS F 84.19 F 84.19
MANORBOIS F 84.20 F 84.20
SUD PARTICIPATIONS F 84.20 F 84.20
Niger
CFAO NIGER F 99.85 F 99.85
CENTRALPHARM F 50.43 F 50.43
Nigeria
GROUPE CFAO NIGERIA F 65.33 F 65.33
Democratic Republic of Congo
AFRIMA F 100.00 F 100.00
AFRIMTRANSIT F 99.00 F 99.00
AUTO ONE F 100.00 F 100.00
Senegal
CFAO SÉNÉGAL F 84.94 F 84.94
LABOREX SÉNÉGAL F 58.40 F 58.18
POINT MICRO F 100.00 F 100.00
PM II F 100.00 F 100.00
Tanzania
DT DOBIE TANZANIA F 100.00 F 100.00
Tchad
CFAO MOTORS TCHAD (ex SOCOA TCHAD) F 97.70 F 99.00
LABOREX TCHAD F 67.30 F 69.79
TCHAMI Merger F 96.25
Togo
CFAO CICA TOGO F 69.72 F 69.72
STOCA E 27.22 E 37.46
Uganda
HOWSE ANS MC GEORGE UGANDA F 99.68 F 99.68
Zambia
CFAO ZAMBIA F 100.00 F 100.00
Mauritius
CAPSTONE F 100.00 F 100.00
IMC F 100.00 F 100.00
MASCAREIGNE DE PARTICIPATION E 48.99 E 48.99
Madagascar
AUSTRAL AUTO E 48.98 E 48.79
NAUTIC ILES E 24.01 E 24.88
SICAM E 27.39 E 27.39
SIGM E 49.00 E 48.93
SIRH E 48.88 E 48.98
SOCIMEX E 48.79 E 49.00
SOMADA E 27.43 E 27.44
SOMAPHAR F 88.86 F 88.86
SME E 48.50 E 48.50
OTHERFrance
KADÉOS F 99.99 F 99.99
United States
MOBILEPLANET Sale F 100.00
HOLDINGS & OTHERFrance
BUYCO F 100.00 F 100.00
CAUMARTIN PARTICIPATIONS F 100.00 F 100.00
CFP F 100.00 F 100.00
CONSEIL ET ASSISTANCE F 100.00 F 100.00
DISCODIS F 100.00 F 100.00
FINANCIÈRE MAROTHI F 100.00 F 100.00
GECCA F 100.00 F 100.00
LOCUTION F 100.00 F 100.00
MANAGECO F 100.00 F 100.00
PPR FINANCE F 100.00 F 100.00
PPR INTERACTIVE F 100.00 F 100.00
PPR PURCHASING F 100.00 F 100.00
SAPARDIS F 100.00 F 100.00
SAPRODIS F 100.00 F 100.00
SFGM F 100.00 F 100.00
Italy
REXCOURTA SPA F 100.00 F 100.00
Luxembourg
PPR INTERNATIONAL F 100.00 F 100.00
PRINTEMPS REASSURANCE F 100.00 F 100.00
The Netherlands
SCHOLEFIELD GOODMAN BV F 100.00 F 100.00
Switzerland
PPR MARKETING SERVICES F 100.00 F 100.00

243 Reference document 2005
Statutory Auditors’ report on the consolidated fi nancial statementsYear ended December 31, 2005
Dear Shareholders,
In accordance with our appointment as statutory auditors by your Annual General Meetings, we have audited the accompanying consoli-dated fi nancial statements of PPR S.A. for the year ended December 31, 2005.The consolidated fi nancial statements have been approved by the Board of Directors. Our role is to express an opinion on these consoli-dated fi nancial statements based on our audit. These fi nancial statements have been prepared for the fi rst-time in accordance with IFRS as adopted in the European Union and include comparative information for 2004 restated on the same basis, except for IAS 32 and IAS 39 which, in accordance with the option offered by IFRS 1, have only been applied by the Company as of January 1, 2005.
Opinion on the consolidated fi nancial statements
We conducted our audit in accordance with the professional standards applicable in France. Those standards require that we plan and perform the audit to obtain reasonable assurance that the consolidated fi nancial statements are free of any material misstatement. An audit includes examining, on a test basis, evidence supporting the amounts and disclosures in the fi nancial statements. An audit also includes assessing the accounting principles used and signifi cant estimates made by management, as well as evaluating the overall fi nancial statement presentation. We believe that our audit provides a reasonable basis for our opinion.In our opinion, the consolidated fi nancial statements give a true and fair view of the fi nancial position and the assets and liabilities of the Group as of December 31, 2005 and the results of its operations for the year then ended in accordance with IFRS as adopted in the European Union.
Justifi cation of assessments
Pursuant to Article L.823-9 of the French Commercial Code governing the justifi cation of our assessments, we draw your attention to the following:Your Company perform an annual impairment test on goodwill and assets with indefi nite lives and also assesses if there is an indication of an impairment loss of its long-term assets in accordance with the terms and conditions described in note 2.7 to the consolidated fi nancial statements. We have reviewed the methods by which this impairment test is performed as well as the projected cash fl ows and assumptions used.
Your Company recognises provisions as described in note 2.15. Our procedures consisted in, in particular, assessing the information and assumptions on which these estimates were based, reviewing the calculations performed by the Company as well as the procedures for approving these estimates by management. We have, on these bases, assessed the reasonableness of these estimates.Note 2.16 sets forth the methods for measuring post-employment benefi ts, other long-term benefi ts and retirement benefi ts. External actuaries have measured these obligations. Our procedures consisted in reviewing the information used, assessing the assumptions adopted and verifying that note 26 to the consolidated fi nancial statements provides appropriate disclosure.
These assessments were performed as part of our audit approach for the consolidated fi nancial statements taken as a whole and con-tributed to the expression of the unqualifi ed opinion in the fi rst part of this report..
Specifi c procedure
We have also performed certain procedures on the information given in the Group’s management report in accordance with professional standards applicable in France. We have no matters to report regarding the fairness of this information or its consistency with the con-solidated fi nancial statements.
Neuilly-sur-Seine and Paris-La Défense, March 9, 2006The Statutory Auditors
Deloitte & Associés KPMG Audit
Department of KPMG SA
Jean-Paul Picard Antoine de Riedmatten Patrick-Hubert Petit Hervé Chopin
This is a free translation of the original text in French for information purposes only.

244
Financial information – Parent company fi nancial statements
PPR 245
Parent company
Parent company balance sheetAs of December 31, 2005, 2004 and 2003
ASSETS
(in € million) 2005 2004 2003
Non-current assets
Long-term investments (1) 7,849.5 7,903.9 5,806.3
Provisions for impairment (21.9) (38.4) (158.5)
7,827.6 7,865.5 5,647.8
Other non-current assets 19.8 19.7 14.5
Depreciation and amortisation (13.1) (12.5) (10.7)
6.7 7.2 3.8
Total non-current assets 7,834.3 7,872.7 5,651.6
Current assets
Receivables (2) (3) 313.9 198.7 180.8
Marketable securities 64.3 345.8 372.7
Cash 714.7 732.0 2,754.4
Total current assets 1,092.9 1,276.5 3,307.9
Total assets 8,927.2 9,149.2 8,959.5 (1) o/w due within less than one year: 13.8 0.4 0.4(2) o/w due after more than one year: 15.9 82.2 (3) o/w concerning associates: 181.5 29.5 63.6
LIABILITIES AND SHAREHOLDERS’ EQUITY
(in € million) 2005 2004 2003
Shareholders’ equity
Share capital 481.8 489.7 489.6
Additional paid-in capital 1,635.7 1,789.6 1,788.3
Reserves and retained earnings 2,267.5 2,014.2 821.1
Net income for the year 506.8 559.5 1,476.6
Total shareholders’ equity 4,891.8 4,853.0 4,575.6
Provisions for contingencies and losses 80.5 144.1 139.8
Liabilities
Borrowings (1) 3,718.9 3,971.5 3,863.7
Other liabilities (2) (3) 236.0 180.6 380.4
3,954.9 4,152.1 4,244.1
Total liabilities and shareholders’ equity 8,927.2 9,149.2 8,959.5 (1) o/w due within less than one year: 3,478.7 3,303.7 2,468.9 (2) o/w due after more than one year: 3.8 1.3 1.6 (3) o/w concerning associates: 44.3 49.2 51.2

245 Reference document 2005
financial statements
Parent company income statement and statement of cash fl owFor the years ended December 31, 2005, 2004 and 2003
Income statement
(in € million) 2005 2004 2003
Operating income 50.2 42.4 37.3
Operating expenses (64.1) (64.0) (56.1)
Net operating income (13.9) (21.6) (18.8)
Net fi nancial income 348.1 428.5 606.7
Operating income before non-recurring items and tax 334.2 406.9 587.9
Non-recurring items 37.3 70.7 964.0
Income tax and employee profi t-sharing 135.3 81.9 (75.3)
Net income 506.8 559.5 1,476.6
Statement of cash fl ow
(in € million) 2005 2004 2003
Net cash from operating activities 186.3 354.0 740.6
(Acquisitions)/Disposal of operating assets 2.0 (3.4) 9.5
Change in medium- and long-term loans - - -
Change in investments (27.4) (2,096.6) 2,068.8
Net cash from/(used in) investing activities (25.4) (2,100.0) 2,078.3
Change in borrowings (161.0) (20.8) (3,234.2)
Share capital increase 0.6 1.4 0.4
Exit Tax - (5.0) -
Dividends paid by PPR (299.3) (278.9) (266.6)
Net cash used in fi nancing activities (459.7) (303.3) (3,500.4)
Net change in cash and cash equivalents (298.8) (2,049.3) (681.5)
Cash and cash equivalents at the beginning of the year 1,077.8 3,127.1 3,808.6
Cash and cash equivalents at the end of the year 779.0 1,077.8 3,127.1

246
Financial information – Parent company fi nancial statements
PPR 247
Statement of changes in shareholders’ equity of the parent company(in € million)(before appropriation of net income)
Number of
shares
ShareCapital
Additionalpaid-incapital
Reservesand retained
earnings
Net incomeof the year
Shareholders’equity
As of December 31, 2003 122,406,980 489.6 1,788.3 821.1 1,476.6 4,575.6
Appropriation of 2003 net income 1,476.6 (1,476.6)
Dividends paid (278.9) (278.9)
Exercise of share options 27,500 0.1 1.3 1.4
Changes in tax-driven provisions 0.4 0.4
Exit Tax (5.0) (5.0)
2004 net income 559.5 559.5
As of December 31, 2004 122,434,480 489.7 1,789.6 2,014.2 559.5 4,853.0
Appropriation of 2004 net income 559.5 (559.5)
Dividends paid (299.3) (299.3)
Cancellation of 2,000,000 shares (2,000,000) (8.0) (154.5) (162.5)
Exercise of share options 13,750 0.1 0.5 0.6
Changes in tax-driven provisions 0.2 0.2
Provision for retirement termination payments (1)
(7.0) (7.0)
2005 net income 506.8 506.8
As of December 31, 2005 120,448,230 481.8 1,635.8 2,267.4 506.8 4,891.8
(1) On July 22, 2004, the French National Accounting Council (CNC) authorised French companies to transfer to shareholders’ equity unamortised actuarial gains and losses in respect of retirement termination payments. The application of this exceptional treatment to actuarial gains and losses existing as of January 1, 2005 enables the absorption of the difference between the IFRS accounting provision and the provision previously recorded in the parent company accounts.
Notes to the fi nancial statements1. Highlights
During the year, PPR:• cancelled 2,000,000 shares on March 30, 2005 in the amount of €162,460,000, reducing the share capital of the Company by
€8,000,000 and additional paid-in capital by €154,460,000.• secured a €2,750 million syndicated revolving credit facility in March 2005, to refi nance the €2,500,000 syndicated revolving credit
facility secured in October 2002 and the €715 million syndicated revolving credit facility secured in May 2004. This new credit facility has a fi ve-year term which may be extended twice by one year, at the end of the fi rst and second years.
• performed a €300 million bond issue on June 29, 2005 (300,000 bonds with a face value of €1,000), maturing January 29, 2013 and with a coupon of 4%. This transaction was performed as part of the EMTN (Euro Medium-Term Note) programme.
2. Accounting rules and methods
The company fi nancial statements are prepared in accordance with the provisions of French Accounting Regulation Committee (CRC) Regulation No. 99.03 of April 29, 1999 on the amendment of the General Chart of Accounts and the new accounting rules concerning regulated assets, CRC Regulation No. 2002-10, as amended by CRC Regulation No. 2003-07 and CRC Regulation No. 2004-06. The application of the new regulations has no impact on equity as of January 1, 2005.
In addition, the Company seized the opportunity offered by the preparation of the consolidated fi nancial statements in accordance with international accounting standards (IFRS), to bring the accounting methods used to prepare the company fi nancial statements into line with international standards, where such changes are compatible with French GAAP applicable to company fi nancial statements. This concerned particularly the accounting methods adopted for the establishment and valuation of Company commitments and the presen-tation of accrued interest payable on borrowings.

247 Reference document 2005
The impact of the fi rst-time adoption of the preferred method for recognising company commitments was recognised in Retained earnings as of January 1, 2005, in accordance with the French National Accounting Council (CNC) recommendation 2003-R.01 of April 1, 2003 and the CNC communiqué issued on July 22, 2004 on pension obligations and similar benefi ts. The impact as of January 1, 2005 of this change in method was €7 million.
2.1. Long-term investments
Investments in non-consolidated companies
Investments classifi ed as “Investments in non-consolidated companies” are those considered useful to the Company’s activity, particularly because the Company has an infl uence over the issuing company or can control it.
The gross value of associates is recorded at cost less purchasing expenses, except for certain investments that underwent a legal revaluation in 1976.
At the year-end, the gross value of investments is compared with their value in use to the Company, determined according to the subsidiary’s estimated value and in consideration of the purpose of the original transaction. This value in use is determined based on the Group’s percentage interest in shareholders’ equity or revalued net assets of the Company.
An impairment loss is recognised when this value is lower than the gross value.
Other investments
Other investments are those that the Company plans or is required to retain on a permanent basis, but the ownership of which is not deemed necessary for the Company’s activity.
The gross value is equal to acquisition cost less purchasing expenses.
An impairment loss is recognised based on the value in use of these investments for the Company.
Shares bought back by PPR and not expressly allocated to employees are classifi ed as other investments.At the year-end, the cost is compared with the average market price during the last month of the fi scal year.An impairment loss is recognised if this price is less than the carrying amount. 2.2. Marketable securities and money market securities
Company shares
Company shares bought back by PPR are recorded under marketable securities as assets on the balance sheet if they are acquired in order to be allocated to employees.
At the year-end, the cost is compared with the average market price during the last month of the fi scal year.An impairment loss is recognised if this price is less than the carrying amount.
Other shares
Shares are recorded at cost. An impairment loss is recognised if the year-end price is less than the carrying amount.
Bonds
Bonds are recognised on the acquisition date at their face value adjusted for the premium or discount. Accrued interest at the acquisition date and at year-end is recorded under “related receivables”.
At the year-end, the cost is compared with the market price during the last month without accounting for accrued interest.

248
Financial information – Parent company fi nancial statements
PPR 249
Mutual funds
Shares in mutual funds (SICAVs) are stated at cost excluding subscription fees. At the year-end, they are estimated at their net asset value. Impairment losses are recognised in respect of any unrealised capital losses. Any unrealised capital gains are not taken into account.
Certifi cates of deposit
Certifi cates of deposit and fi nancing company notes. These money market securities are purchased on the primary or secondary market. They are stated at cost after deduction of accrued interest at the acquisition date, if acquired on the secondary market.
Prepaid interest is credited to interest income on an accruals basis.
Financial instruments
All exchange and interest rate positions are taken through instruments listed on exchange-traded or over-the-counter markets representing minimal counterparty risk. Any income or loss generated by fi nancial instruments used in hedging transactions is offset against any income or loss on hedged items.
If the fi nancial instruments do not qualify as a hedge, any gains or losses arising from changes in market price are recorded in the income statement, except for over-the-counter transactions. For these transactions, a provision is recognised for any unrealised losses, while unrealised gains are not recognised.
Currency transactions
Currency income and expenses are recorded at their foreign currency equivalent at the transaction date. Borrowings, receivables and liquidity positions are translated at the exchange rate on the last day of the fi scal year.
The foreign exchange difference resulting from the valuation of currency borrowings and receivables is recorded in accruals accounts, as an asset for an unrealised loss and as a liability for an unrealised gain. A contingency provision is recorded to cover unhedged unrealised losses.
2.3. Bond issue and capital increase feesBond redemption premiums
Bond issuance fees are recorded as expenses at the issue date. Costs associated with increases in capital, mergers or restructuring are charged against the share premium arising from the merger or restructuring.
Bond issues are recorded at their nominal value for ordinary and convertible bonds and at their indexed value for indexed bonds.
Any issue or redemption premiums are assigned to the relevant balance sheet item and amortised over the life of the bond. For convertible bonds, the redemption premium is spread over the life of the bond, in accordance with preferential accounting methods.
2.4. Employee benefi ts
Pension and retirement termination payment obligations are provided in full.

249 Reference document 2005
3. Operating income
Operating income breaks down as follows:
(in € million) 12.31.2005 12.31.2004
Group management fees 39.9 32.4
Property rental income 8.6 8.0
Payroll expenses (16.1) (15.6)
External purchases and expenses and taxes (42.6) (45.6)
Depreciation, amortisation and provisions (4.5) (1.9)
Other income and expenses 0.8 1.1
Total (13.9) (21.6)
4. Net fi nancial income
Net fi nancial income of the parent company breaks down as follows:
(in € million) 12.31.2005 12.31.2004
Net interest expense (135.1) (113.3)
Expenses and interest on non-Group debt (151.7) (147.6)
Interest on inter-company current accounts 16.6 34.3
Income and expenses on long-term investments 483.2 541.8
Dividends received 483.2 541.8
Total 348.1 428.5
o/w concerning associates:
- Interest on inter-company current accounts 16.6 34.3
- Dividends received 483.2 541.8
5. Non-recurring items
Non-recurring items of the parent company break down as follows:
(in € million) 12.31.2005 12.31.2004
Net proceeds from the sale of operating fi xed assets 3.3
Net proceeds from the sale of investments,impairment losses and related transactions
57.4 73.1
Income from assets 60.7 73.1
Cost of claims, litigation and restructuring (20.9) 0.1
Other non-recurring income/(expenses) (2.5) (2.5)
Total 37.3 70.7

250
Financial information – Parent company fi nancial statements
PPR 251
6. Income taxes – Employee profi t-sharing
These items break down as follows:
(in € million) 12.31.2005 12.31.2004
Income taxes (126.3) (24.2)
Tax consolidation benefi t 245.5 107.4
Reversal of provision for losses forfeited 17.4 -
Income taxes 136.6 83.2
Employee profi t-sharing (1.3) (1.3)
Total 135.3 81.9
Under a tax consolidation agreement which came into effect on January 1, 1988, PPR pays the tax due by the members of the consolidated group and fulfi ls all tax obligations on its behalf.
The tax consolidated structure comprised 111 companies in 2005, versus 116 in 2004. Each subsidiary records in its accounts the amount of tax that it would have paid on a stand-alone basis. The tax savings achieved by the Group through consolidation are retained by PPR, as parent company of the consolidated group.
7. Net long-term investments
(in € million) Investments in non-consolidated
companies
Otherinvestments
Loans Other Total
As of December 31, 2004 7,839.6 24.0 0.7 1.2 7,865.5
Increases
Acquisition of GUCCI shares 5.5 5.5
Subscription to MP EUROPE share capital increase 5.6 5.6
Subscription to PPR INTERACTIVE share capital increase 6.4 6.4
Subscription to SAPARDIS share capital increase 1.3 1.3
Subscription to TEAMTEL share capital increase 0.3 0.3
Loans to collection organisations 0.1 0.1
Decreases
Sale of PPR INTERACTIVE shares (29.3) (29.3)
Sale of TEAMTEL shares (6.2) (6.2)
Impairment of MP EUROPE shares (5.4) (5.4)
Impairment of PPR ASIA shares (2.0) (2.0)
Impairment of PPR Luxembourg shares (4.6) (4.6)
Rental guarantee (0.3) (0.3)
Treasury shares (1)
Acquisitions for cancellation 11.4 11.4
Acquisitions under the liquidity contract 2.4 2.4
Impairment of liquidity contract (0.1) (0.1)
Sales (51.6) (51.6)
Reversal of impairment following sales 28.6 28.6
As of December 31, 2005 7,811.2 14.7 0.8 0.9 7,827.6
(1) The amount corresponding to treasury shares is blocked in tax-driven reserves.
o/w concerning associates:- 2004 7,839.6 - - - 7,839.6 - 2005 7,811.2 - - - 7,811.2

251 Reference document 2005
8. Other non-current assets
Movements in other non-current assets break down as follows:
(in € million) Land and buildings
Plant and equipment
Other Total
Gross carrying amount
December 31, 2004 8.3 0.5 10.8 19.6
Additions 0.2 1.2 1.4
Disposals (1.1) (0.2) (1.3)
Account transfers 0.1 0.1
December 31, 2005 7.4 0.5 11.9 19.8
Depreciation and provisions
December 31, 2004 (5.7) (0.4) (6.3) (12.4)
Charge (0.5) (1.4) (1.9)
Disposals 0.9 0.1 1.0
Reversal Dehodencq impairment 0.2 0.2
December 31, 2005 (5.1) (0.4) (7.6) (13.1)
Net carrying amount
December 31, 2004 2.6 0.1 4.5 7.2
December 31, 2005 2.3 0.1 4.3 6.7
9. Marketable securities and cash
These items break down as follows:
(in € million) 12.31.2005 12.31.2004
Treasury shares (1) 509.4
Impairment (163.6)
Listed shares 64.3
Marketable securities 64.3 345.8
Bank deposits and fund transfers 0.4 46.3
Current cash accounts in debit 712.6 684.3
Interest on current cash accounts in debit 1.7 1.4
Cash 714.7 732.0
Cash and cash equivalents 779.0 1,077.8 (1) The amount corresponding to treasury shares is blocked in tax-driven reserves.
o/w concerning associates:
- Current cash accounts in debit 714.3 685.7

252
Financial information – Parent company fi nancial statements
PPR 253
10. Reserves and retained earnings
Reserves and retained earnings of the parent company, before appropriation of net income, break down as follows:
(in € million) 12.31.2005 12.31.2004
Legal reserve 49.0 49.0
Tax-driven reserves 1,293.6 1,493.6
Other reserves 240.3 45.3
Reserves 1,582.9 1,587.9
Retained earnings 681.3 423.2
Revaluation differences 0.2 0.2
Tax-driven provisions 3.1 2.9
Total 2,267.5 2,014.2
11. Provisions
(in € million) As of01.01.2005
Charge Reversalused
Reversalused
As of12.31.2005
Provisions for claims with authorities 27.4 1.6 15.0 10.8
Provisions for claims with third parties 31.9 1.7 17.7 7.5 8.4
Provisions for subsidiary risk 60.4 0.9 43.2 6.0 12.1
Provisions for IFC & other (1) 16.8 2.3 0.3 18.8
Other provisions 14.6 15.8 30.4
Provisions 151.1 20.7 62.5 28.8 80.5
(1) The balance as of January 1, 2005 includes the impact of the change in method resulting from application of the preferred method in the amount of €7 million.

253 Reference document 2005
12. Borrowings
Bonds
(in € million) Interest rate
Issue date
Hedge Maturity 12.31.2005 12.31.2004
Bonds convertible and/or exchangeable for new or existing shares (OCEANE) (1)
1.50% fi xed 11.08.2001 Euribor 1 month fl oating-rate swap
in the amount of €149 million
01.01.2007 149.20 149.20
Bonds convertible and/or exchangeable for new or existing shares (OCEANE) (2)
2.50% fi xed 05.21.2003 - 01.01.2008 1,079.50 1,079.50
Bond issue (3) 5.0% fi xed 07.23.2003 Euribor 3 month fl oating-rate swap
in the amount of €500 million
01.23.2009 750.00 750.00
Bond issue (4) 5.25% fi xed 03.29.2004 Euribor 3 month fl oating-rate swap
in the amount of €650 million
03.29.2011 800.00 800.00
Bond issue (5) Euribor 3 months +0.50% fl oating
10.22.2004 - 10.22.2007 400.00 400.00
Bond issue (6) 4.00% fi xed 06.29.2005 - 01.29.2013 300.00 -
(1) Issue price: bonds convertible and/or exchangeable for shares (OCEANE) issued on November 8, 2001, for €1,380,000,050 represented by 8,492,308 bonds with a face value of €162.50. Conversion and/or exchange for shares: until December 31, 2001 on the basis of 1,157 shares per bond, and as of January 1, 2002 on the basis of one share per bond.Normal redemption: in full on January 1, 2007 at a price of €162.50. Gross yield to maturity of unconverted bonds: 1.5%.
The balance of 918,225 bonds outstanding as of December 31, 2005 refl ects:- the conversion of 3,077,000 bonds by Artémis in 2001,- the buyback of 107,422 bonds for €17,456,075 in 2002,- the buyback of 17,609 bonds for €2,861,462,50 in 2003, - the early redemption after the exercise of the investor Put in 2003 of 4,285,376 bonds with a face value of €696,373,600,- the early redemption after the exercise of the investor Put in 2004 of 86,603 bonds with a face value of €14,072,987,50.
(2) Issue price: issue of bonds convertible and/or exchangeable for shares (OCEANE) issued on May 21, 2003 represented by 12,500,000 bonds with a face value of €86.36.Conversion and/or exchange for shares: at any time from May 21, 2003 on the basis of one share for one bond.Normal redemption: the bonds will be fully redeemed on January 1, 2008 at a price of €91.14 per bond, i.e. approximately 105.535% of the bonds’ face value.Gross yield to maturity of unconverted bonds: 3,6250 %.
(3) Issue price: bond issue on July 23, 2003, represented by 750,000 bonds with a face value of €1,000 as part of the EMTN program.Redemption: in full on January 23, 2009.
(4) Issue price: bond issue, represented by 800,000 bonds with a face value of €1,000 as part of the EMTN program, comprising 650,000 bonds issued on March 29, 2004 and 150,000 additional bonds issued on July 23, 2004, raising the issue to 800,000 bonds.Redemption: in full on March 29, 2011.
(5) Issue price: bond issue on October 22, 2004, represented by 400,000 bonds with a face value of €1,000 as part of the EMTN program.Redemption: in full on October 22, 2007.
(6) Issue price: bond issue on June 29, 2005, represented by 300,000 bonds with a face value of €1,000 as part of the EMTN program.Redemption: in full on January 29, 2013.
Other borrowings:
On February 6, 2004, PPR secured a loan redeemable in PPR shares, represented by 1,168,224 shares with a face value of €107 each, or in cash, and maturing on February 6, 2006. The transaction was performed in the amount of €125,000,000, based on a fi xed rate of 2.6130%. The loan is fully hedged through an interest rate hedge indexed to a 3-month Euribor fl oating-rate.

254
Financial information – Parent company fi nancial statements
PPR 255
12.1. Breakdown by category
(in € million) 12.31.2005 12.31.2004
Convertible bonds 1,228.7 1,228.7
Interest on convertible bonds 29.2 29.2
Other bonds 2,250.0 2,254.9
Interest on other bonds 75.4 78.8
Indexed-linked bonds 199.1
ABN-AMRO loan 125.0 125.0
Interest on ABN-AMRO loan 2.9 2.9
Short-term Crédit Agricole IDF loan 50.0
Interest on short-term Crédit Agricole IDF loan 0.1
Short-term bank loans and overdrafts 4.0 2.8
Brokers 3.2
Borrowings 3,718.4 3,971.5
Current accounts 0.5 -
Total 3,718.9 3,971.5
o/w: transactions with associates:
- Credit balances on current accounts 0.5 -
As of December 31, 2005, no borrowings were secured by collateral.
12.2. Breakdown by maturity
(in € million) 12.31.2005 12.31.2004
Due within one year 240.2 667.8
Due in one to fi ve years 2,378.7 2,503.7
Due after fi ve years 1,100.0 800.0
Total 3,718.9 3,971.5
12.3. Net fi nancial indebtedness
(in € million) 12.31.2005 12.31.2004
Borrowings 3,718.9 3,971.5
Marketable securities (64.3) (345.8)
Cash (714.7) (732.0)
Net fi nancial indebtedness 2,939.9 2,893.7
12.4. Information on interest rates
12.31.2005 12.31.2004
Average rate of interest for the year 3.91% 4.21%
% average fi xed-rate debt 56% 70%
% average fl oating-rate debt 44% 30%
The decrease in the average interest rate in 2005 compared with 2004 is mainly due to the impact of a higher level of fl oating rate medium-term debt in 2005 than in 2004, reducing the impact of fi xed rate bond issues hedged only partially with respect to interest rate risk.

255 Reference document 2005
13. Off-balance sheet commiments
13.1. Exposure to equity risk
PPR uses options to manage its exposure to equity risk. Option commitments are as follows:
12.31.2005 Y+1 Y+2 Y+3 Y+4 Y+5 Beyond 12.31.2004
Purchase of PPR call options
Number of shares 4,310,546 3,265,125 344,050 79,180 622,191 1,040,998
PPR maximum commitments (in € million)
468.0 287.2 64.0 16.3 100.5 195.7
As of December 31, 2005, the Group held the following call options:• 1,040,998 call options set up in September 2004 to enable PPR to present shares on the exercise of share purchase option plans
granted to employees. • 269,548 call options set up in August 2005 in order to partially manage the exercise of share subscription plans granted to employees.• 3,000,000 call options set up in June 2005 to partially hedge the risk of conversion of the OCEANE bonds issued in 2003 and maturing
in January 2008; 12,500,000 shares underlie this bond issue.
At the year-end share price, the majority of options set up in 2004 and 2005 to hedge employee plans were “out of the money” and as such not exercisable. The net carrying amount of these options at the year end was immaterial.
At the year-end share price, the 3,000,000 options set up in June 2005 were “in the money” and, as such, their market value exceeded their net carrying amount.
13.2. Interest rate hedging instruments
(in € million) 12.31.2005 Y+1 Y+2 Y+3 Y+4 Y+5 Beyond 12.31.2004
SWAPS: fi xed-rate lender 1,424.2 125.0 149.2 0.0 500.0 0.0 650.0 1,835.8
In accordance with the Group’s policy on the hedging of interest rate risk, PPR set up interest rate swaps to back the various bond issues:1 - Issue of bonds convertible and/or exchangeable for new or existing shares (OCEANE) maturing in January 2007, €149.2 million
of which was swapped versus 1-month Euribor.2 - Bond issue maturing in January 2009, €500 million of which was swapped versus 3-month Euribor.3 - Bond issue maturing in March 2011, €650 million of which was swapped versus 3-month Euribor.4 - Private exchangeable €125 million bond issue, maturing in February 2006, fully swapped versus 3-month Euribor.
All other off-balance sheet transactions designed to hedge against interest rate risk were performed by PPR Finance.
13.3. Other off-balance sheet commitments
(in € million) 12.31.2005 12.31.2004
Endorsements and guarantees in favour of:
associates - -
non-Group third parties 0.8 0.8
Endorsements and guarantees 0.8 0.8
Collateral:
in favour of subsidiaries - -
in favour of third parties - -

256
Financial information – Parent company fi nancial statements
PPR 257
Subsidiaries and associates as of December 31, 2005
(in € thousand) Share capital
Shareholders’ equity excl. capital and
income
% interest
I - DETAILED INFORMATION
A - Subsidiaries (more than 50% of share capital)
CAUMARTIN PARTICIPATIONS 10, avenue Hoche – 75008 Paris 6,132 74,842 100
CONFORAMA HOLDING 80, boulevard du Mandinet à Lognes77432 Marne-la-vallée
73,805 257,605 93
CLUB DE DÉVELOPPEMENT PPR 10, avenue Hoche – 75008 Paris 4,460 235 60
DISCODIS 10, avenue Hoche – 75008 Paris 153,567 22,003 100
FINANCIÈRE MAROTHI 10, avenue Hoche – 75008 Paris 388,457 2,004,551 100
France PRINTEMPS 102, rue de Provence – 75009 Paris 56,047 131,386 97
REDCATS 110 rue de Blanchemaille – 59 100 Roubaix 61,300 311,103 100
SAPRODIS 10, avenue Hoche – 75008 Paris 619,798 142,613 82
SFGM 10, avenue Hoche – 75008 Paris 4,500 5,616 100
B - Associates (less than 50% of share capital)
GUCCI GROUP NV The Rembrandt tower Amstelplain1096 ha Amasterdam-Netherlands
108,246 3,081,432 33
II - SUMMARY INFORMATION
A - Subsidiaries not listed in I
a) French subsidiaries (total)
b) Foreign subsidiaries
- PPR Luxembourg 25, route d’Esch – Luxembourg
- Au Printemps Réassurances 19, rue de Bitbourg – Luxembourg
- Other (total)
B - Associates not listed in I
a) French companies (total)
b) Foreign companies (total)
Total

257 Reference document 2005
Financial information
Carrying amount of shares
Outstanding loans granted
by the Company
Guarantees given by the
Company
Last published net sales
Last published net income/
(loss)
Dividends received during
the year
Comments
Gross Net
82,348 82,348 31,003 28,027
252,348 252,348 11,197 142,014 58,550
9,147 2,925 81
299,735 299,735 38,333 143,969
2,685,468 2,685,468 (39,825)
132,446 132,446 878,123 (3,099) 7,502
1,232,510 1,232,510 34,008 113,956 86,997
568,830 568,830 493,829 5,767
7,313 7,313 37 30 Revaluation difference
+180
2,514,243 2,514,243 33,544 249,253 148,207
19,343 12,051 4,185
14,416 9,803
10,188 10,188
1,968 0
295 295 15
757 757 0
7,831,355 7,811,260

258
Financial information – Parent company fi nancial statements
PPR 259
Securities portfolioAs of December 31, 2005
Company name(in € thousand)
Interests
Numberof shares
% Gross carrying amount
Impairment Net carrying amount
1 - Long-and short-term investments in French companies with a carrying amount by category of security equal to or in excess of €15,000:
BALZAN 2,994 99.80 48.7 48.7
BARYUM 182,991 100.00 2,745.6 2,745.6
CAUMARTIN PARTICIPATIONS 875,750 99.98 82,348.4 82,348.4
CLUB DE DÉVELOPPEMENT PPR 599,994 60.00 9,146.9 6,222.0 2,924.9
CONFORAMA HOLDING 4,284,632 92.89 252,348.2 252,348.2
DISCODIS 3,199,302 100.00 299,734.9 299,734.9
FINANCIÈRE MAROTHI 20,443,682 99.99 2,685,468.1 2,685,468.1
FRANCE PRINTEMPS 3,589,667 97.35 132,446.1 132,446.1
GECCA 995 99.50 1,036.6 1,036.6
KADÉOS 30,000 33.33 292.5 292.5
LOCUTION 2,990 99.67 45.6 45.6
MELITTE 2,994 99.80 45.6 45.6
MP EUROPE 386,100 99.00 5,793.9 5,564.6 229.3
PPR 149,514 0.12 13,780.2 63.7 13,716.5
PPR FINANCE 9,990 99.90 152.3 152.3
PRODISTRI 14,994 99.96 228.6 228.6
PPR PURCHASING 787,500 70.00 3,161.2 3,161.2
REDCATS 400,626 99.99 1,232,509.7 1,232,509.7
SAPARDIS 630,001 100.00 4,005.6 38.0 3,967.6
SAPRODIS 33,920,229 82.09 568,830.2 568,830.2
SAVOISIENNE 129,690 99.00 1,977.1 1,689.8 287.3
SOCIÉTÉ FINANCIÈRE DE GRANDS MAGASINS 298,502 99.50 7,313.4 7,313.4
TREMI 2,994 99.80 48.7 48.7
VARIANTE 2,994 99.80 48.7 48.7
2 - Long-and short-term investments in French companies with a carrying amount by category of security of less than €15,000
5.8 5.8
3 - Other service, property and other companies
SICAV ROTHSCHILD 64,273.5 64,273.5
Other 1,369.3 380.8 988.5
4 - Shares in foreign companies
GUCCI GROUP NV 35,030,668 33.01 2,514,243.2 2,514,243.2
Other 27,498.8 6,750.4 20,748.4
Total 7,910,947.4 20,709.3 7,890,238.1

259 Reference document 2005
Parent company management reportThe Company’s revenue consists primarily of dividends received from subsidiaries, rental revenue from real estate holdings, fi nancial income and advisory and assistance fees received from subsidiaries, determined as a percentage of their sales, in accordance with standard practice.
On March 21, 2005, the Supervisory Board appointed Mr François-Henri Pinault Chairman of the Management Board following Mr Serge Weinberg’s departure from the Group. The Combined General Shareholders Meeting of May 19, 2005 adopted a new management structure with a Board of Directors and appointed nine directors, all former members of the Supervisory Board for terms of 4 years. At the end of this Meeting, the Board of Directors appointed Mr François-Henri Pinault Chairman and Chief Executive Offi cer of the Company.
Impact of the adjustments relating to changes in accounting method
Your Company seized the opportunity offered by the preparation of the consolidated fi nancial statements in accordance with international accounting standards (IFRS), to bring the accounting methods used to prepare the company fi nancial statements into line with interna-tional standards, where such changes are compatible with French GAAP applicable to company fi nancial statements. This concerned particularly the accounting methods adopted for the establishment and valuation of employee-related obligations and the presentation of accrued interest payable on borrowings.The impact of the adjustments relating to this change in accounting method is €7 million as of January 1, 2005.
Financial activity
Your Company performed a new issuance of debt amounting to €300 million and maturing on January 29, 2013 as part of its EMTN (Euro Medium-Term Note) programme intended to extend the maturity of its debt and diversify the type of its fi nancing resources. This debt issuance has been rated “BBB-“by Standard & Poor’s, with a stable perspective. Pursuant to an update performed on December 23, 2005, the EMTN programme was made compliant with the European Prospectus Directive and the amount of the programme was increased from €3 billion to €4 billion in March 2006.
In March 2005, PPR also set up a fi ve-year revolving syndicated loan of €2,750 million to refi nance the revolving syndicated loan of €2,500 million that was set up in October 2002 and the revolving syndicated loan of €750 million set up in May 2004. This new loan with a 5-year maturity includes two 1-year maturity extension options, which can either be triggered at the end of the fi rst or second year.
The Company’s remaining cash requirements were funded entirely by the medium-term credit lines already in place. Cash surpluses were invested via the current account borrowings from PPR Finance, which manages the Group’s cash.
Results
The parent company posted an operating loss of €13.9 million in 2005, versus a loss of €21.6 million in the previous fi scal year.
Financial income totalled €348.1 million, versus €428.5 million in 2004. This includes dividends received from subsidiaries and debt service charges.
Non-recurring items totalled €37.3 million, compared to €70.7 million in 2004.
The Company, which is the parent company consolidating some of the Group’s French subsidiaries for tax purposes, recorded a tax conso-lidation prenium of €136.6 million, as against €83.2 million in the previous fi scal year.
The Company’s total net income was €506.8 million, compared with €559.5 million in 2004.

260
Financial information – Parent company fi nancial statements
PPR 261
Income appropriation
We propose a dividend payment of €2,72 per share, payable from June 2, 2006.
The recommended income allocation by the Board of Directors to the Ordinary General Shareholders Meeting is as follows:
(in €)
Source
Unappropriated retained earnings 681,347,865.83
Net income for the year 506,841,468.69
Total amount to be allocated 1,188,189,334.52
Allocations
Dividends 327,280,507.52
Unappropriated retained earnings 860,908,827.00
Total appropriation 1,188,189,334.52
Dividends paid in the last three years:
Year of payment Net dividend 50% tax credit Gross dividend
2003 €2.30 €1.15 €3.45
2004 €2.40 €1.20 €3.60
Year of payment Net dividend Eligible for 50% allowance
2005 €2,52 €2,52
Share buyback programme
At the General Shareholders Meeting of May 23, 2006, you authorised the Company to buy back up to 10% of the Company’s shares on the open market, just as you had authorised at the General Shareholders Meeting of May 19, 2005.
On May 26, 2004 PPR granted a mandate to a fi nancial intermediary in order to encourage the liquidity of transactions and the con-sistency of PPR share quotations. This contract funded in an amount of €40 million is equally split between cash and PPR shares. On September 3, 2004, an additional cash amount of €20 million was added to the contract.
This contract complies with the provisions of the Professional Code of Conduct established by the Association Française des Entreprises d’Investissement (A.F.E.I., French Association of Investment Companies).
During 2005, PPR cancelled 2,000,000 Company shares, which had previously been classifi ed in Long-term investments under cancellation.
The authorisation granted by the General Shareholders Meeting of May 19, 2005, as of the date of the accounts closing, was used du-ring the fi scal year for acquisitions of 2,264,052 shares totalling €199,513,170 at an average purchase price of €88.12 and for sales of 4,612,670 shares totalling €395,159,221. All of these shares have been sold under the above-mentioned liquidity contract, except for 2,513,132 shares sold under an independent sales contract involving the disposal of blocks of shares. On the same date, the Company held 45,000 shares representing 0.04% of the share capital.
In June 2005, your Company acquired 3,000,000 calls representing a commitment of €251,100,000 to partially hedge the possible conversion of OCEANE bonds issued in 2003 and maturing in January 2008 and in August 2005, your Company acquired 394,062 calls representing a maximum commitment of €21,171,900 to partially manage the exercising of stock subscription plans granted to Group corporate offi cers and employees. As of December 31, 2005, taking into consideration the exercise of 124,514 calls, the number of calls outstanding amounted to 4,310,546 for a total maximum commitment of €467,949,067.
On January 11, 2006, PPR cancelled 124,514 Company shares, previously classifi ed in Long-term investments under cancellation. These shares were acquired following the exercise of calls. Except for these shares, all the shares acquired during the share buyback programme, authorised on May 19, 2005, have been purchased under the liquidity contract.

261 Reference document 2005
As of March 31, 2006, the Company owned 10,000 treasury shares representing 0.1% of share capital. All of these shares are allocated to the liquidity contract.
We are recommending that you approve a new share buyback programme, for a period of eighteen months, to acquire Company shares, subject to a maximum of 10% of the share capital, in order to:• provide liquidity or volume to the market in the context of a liquidity contract with an independent fi nancial services company,• implement stock purchase option plans for the Group’s employees and corporate offi cers and to sell or grant shares to employees in
accordance with the law,• acquire equity interests or raise fi nancing in exchange for Company shares, in connection with acquisitions or the issue of securities
providing allocation rights on Company shares,• cancel the shares acquired in accordance with the authorisation granted by the Extraordinary General Shareholders Meeting of May 19, 2005.
Under the authorisation, the shares may be acquired by any appropriate means, including the use of fi nancial instruments or the acqui-sition of an unlimited block of shares.
Shares thus acquired may subsequently be held, sold or transferred by any means, including by contribution or exchange, or allotted, sold or transferred under stock option or employee ownership plans. They may also be cancelled in accordance with the law.
The maximum purchase price is set at €150 per share. However, in the event of a sale or transfer performed as part of stock purchase option plans or sales or grants of shares to employees, the sale or transfer price will be set in accordance with applicable legal provisions concerning these transactions and may be less than this amount.
The maximum total amount of the acquisitions would thus be set at €1,804,855,650.
The shares acquired under the buyback programme could be cancelled pursuant to the authorisation granted by the General Shareholders Meeting of May 19, 2005.
As of the date of the fi ling of the reference document, the share capital totalled €481,294,864 divided into 120,323,716 shares.
Treasury shares
In connection with the share buyback programs authorised by the shareholders, the Company acquired 2,391,400 shares at an average price of €84.25 in 2005. It sold 5,254,532 shares at an average transaction price of €83.29. All of the shares have been sold under the above-mentioned liquidity contract, except for 2,668,132 shares sold under an independent sales contract. The related transaction costs totalled €0.6 million.
At the end of the fi scal year, 149,514 shares with a par value of €4 per share, representing 0.12% of the capital, were carried as treasury shares, totalling €13.7 million, net of reserves, allocated to Other long-term investment securities, of which 124,514 were booked to other securities under cancellation.
Stock option plans and granting of bonus shares
In 2005, the Company set up two stock option plans for the Group’s senior managers, amounting to 25,530 shares at a price of €75.29 per share, 333,750 shares at a price of €78.01 per share, 39,960 shares at a price of €78.97 per share and 20,520 shares at a price of €85.05 per share, respectively.
The Company also set up a bonus share plan involving 23,133 existing shares for the Group’s senior managers.
Information concerning stock subscription and purchase option plans and bonus share plans are provided in the section “Legal and stock market - General information”.

262
Financial information – Parent company fi nancial statements
PPR 263
Regulated agreements
Your Company did not enter into any agreements falling under the scope of Article L. 225-86 of the Commercial Code during the year.
Please refer to the Statutory Auditors’ special report for information regarding the impact of regulated agreements entered into in previous years.
Share capital
At the end of 2005, the Company’s share capital stood at €481,792,920, divided into 120,448, 230 shares of €4 each.
At the end of the fi scal year, employees of the Company and the Group held 272,934 shares with a par value of €4 representing 0.2% of the share capital of the Company pursuant to the provisions of Article L. 225-102 of the Commercial Code.
At the Extraordinary General Shareholders Meeting of May 19, 2005, you authorised the Board of Directors to undertake issues of secu-rities that might provide immediate or subsequent entitlement to participate in capital increases of the Company, and to conduct capital increases by capitalisation of reserves, profi ts or additional paid-in capital. The Board of Directors did not use these authorisations in the past fi scal year.
Details of the breakdown of the share capital and changes in the capital during the fi scal years are given in the section “General Information”.
Directorships, positions and remuneration of corporate offi cers
Details regarding the directorships, positions and remuneration of corporate offi cers are provided in the section “Corporate Governance”.
Subsidiaries and affi liates
As a holding company, the Company carried out various transactions with its subsidiaries: reclassifi cations of affi liates and acquisitions and sales of shares.
Information about the business and fi nancial results of subsidiaries and affi liates, equity interests acquired during the year and changes in percentage interests in Group companies is provided in the Group section of the report and the notes to the consolidated fi nancial statements (see the list of the main consolidated subsidiaries).
Combined General Shareholders Meeting of May 23, 2006
At the Combined General Shareholders Meeting of May 23, 2006, shareholders will be asked to approve the 2005 parent company and consolidated fi nancial statements as well as the Statutory Auditors’ special report referred to in Articles L. 225-86 of the Commercial Code.
Shareholders will be asked to authorise the Board of Directors to buy back Company shares in compliance with the regulations of the Autorité des Marchés Financiers (French Financial Markets Authority).
Should shareholders approve these recommendations, they will be asked to adopt the resolutions which are presented.
Information on the Company’s operations, development, outlook and signifi cant post year-end events, and information on the employee-related and environmental impact of the Company’s activities, are provided in the other sections of the Group’s Management Report and in the notes to the Annual Report.
A table showing the Company’s results over the last fi ve years is provided in the notes to this report.

263 Reference document 2005
Parent company fi nancial results for the last fi ve years2001 2002 2003 2004 2005
Share capital at year-end
Share capital (in euros) 489,577,920 489,577,920 489,627,920 489,737,920 481,792, 920
Number of ordinary shares outstanding 122,394,480,(1) 122,394,480 122,406,980 122,434,480 120,448,230
Maximum number of potential shares to be issued 10,734,387,(1) 6,221,620 14,843,644 16,354,464 15,465,873
- by conversion of bonds 10,652,387,(1) 5,307,813 13,504,828 14,586,449 13,418,225
- by exercise of share subscription options 82,000,(1) 913,807 1,338,816 1,768,015 2,047,648
Results of operations(in € thousand)
Income from operating activities 41,611 34,831 29,179 32,365 39,943
Net income before tax, employee profi t-sharing, depreciation, amortisation and provisions
146,304 608,311 1,223,086 341,368 124,309
Income tax (charge)/credit 116,925 207,573 (74,306) 83,202 136,640
Employee profi t-sharing 1,288 1,362 960 1,261 1,255
Net income after tax, employee profi t-sharing, depreciation, amortisation and provisions
161,953 244,391 1,476,590 559,515 506,841
Dividend distribution 281,507 281,507 293,777 308,535 327,281,(2)
Per share data (in €)
Net income after tax and employee profi t-sharing, but before depreciation, amortisation and provisions
2.14 6.65 9.38 3.46 2.16
Net income after tax, employee profi t-sharing, depreciation, amortisation and provisions
1.32 2.00 12.06 4.57 4.21
Dividends:
- net dividend per share 2.30 2.30 2.40 2.52 2.72,(2)
- gross dividend per share (50% tax credit)
3.45,(3) 3.45,(3) 3.60,(3) (4) (5)
Employee data
Average number of employees 110 134 133 130 119
Total payroll(in € thousand)
9,587 11,573 10,998 10,790 11,436
Total benefi ts (social security, social works, etc.) (in € thousand)
4,116 5,862 5,024 4,777 4,887
(1) August 30, 2001, conversion of share capital into euro and increase in the par value to €4.(2) Subject to approval at the Combined Shareholders’ Meeting on May 23, 2005.(3) Subject to a reduced tax credit due to the nature of the benefi ciary.(4) In accordance with Article 243a of the General Tax Code, the entire dividend paid to private individuals domiciled in France for tax purposes qualifi es in full
for the 50% tax credit provided for under Article 158-3 2° of the General Tax Code. (5) In accordance with Article 243a of the General Tax Code, the entire dividend paid to private individuals domiciled in France for tax purposes qualifi es in full
for the 40% tax credit provided for under Article 158-3 2° of the General Tax Code.

264
Financial information – Parent company fi nancial statements
PPR 265
Statutory Auditors’ report on the fi nancial statements Year ended December 31, 2005
Dear Shareholders, In accordance with our appointment as statutory auditors by your Annual General Meetings, we hereby report to you for the year ended December 31, 2005 on:• the audit of the accompanying fi nancial statements of PPR SA;• the justifi cation of our assessments;• the specifi c procedures and disclosures required by Law.
These fi nancial statements have been approved by the Board of Directors. Our role is to express an opinion on these fi nancial statements, based on our audit.
Opinion on the fi nancial statements
We conducted our audit in accordance with professional standards applicable in France. Those standards require that we plan and per-form the audit to obtain reasonable assurance about whether the fi nancial statements are free of material misstatement. An audit includes examining, on a test basis, evidence supporting the amounts and disclosures in the fi nancial statements. An audit also includes assessing the accounting principles used and signifi cant estimates made by management, as well as evaluating the overall fi nancial statement pre-sentation. We believe that our audit provides a reasonable basis for our opinion.
In our opinion, the fi nancial statements give a true and fair view of the fi nancial position and the assets and liabilities of the Company as of December 31, 2005, and the results of its operations for the year then ended in accordance with accounting principles generally accepted in France.
Without qualifying the opinion expressed above and in accordance with Article L.232-6 of the French Commercial Code, we draw your attention to the changes in accounting methods which occurred during fi scal year 2005 and described in note 2 “Accounting rules and methods” to the fi nancial statements. These changes result from the application of the new accounting rules for assets, the fi rst time recognition of all the Company’s obligations relating to retirement benefi ts and pension obligations, and the change in presenting accrued interest payable on borrowings.
Justifi cation of assessments
Pursuant to Article L.823-9 of the French Commercial Code governing the justifi cation of our assessments, we hereby report on the following:• When assessing the accounting rules and methods used by your Company, we have verifi ed the merits and presentation of the changes in
accounting methods mentioned above.• Note 2.1 to the fi nancial statements presents the accounting rules and methods used to value long-term investments. We have verifi ed the
merits of these accounting methods and the consistency of the value of long-term investments with the value used when preparing the con-solidated fi nancial statements.
These assessments are part of our audit approach to the fi nancial statements taken as a whole and therefore contribute to the expression of the opinion given in the fi rst part of this report.
Specifi c procedures and disclosures
We have also performed the other procedures required by Law, in accordance with professional standards applicable in France.We have no comment to make as to the fair presentation and consistency with the fi nancial statements of the information given in the management report of the Board of Directors and in the documents addressed to the shareholders with respect to the fi nancial position and the fi nancial statements.Pursuant to the Law, we have verifi ed that the management report contains the appropriate disclosures as to the acquisition of participa-ting and controlling interests and to the percentage of interests and voting rights held by shareholders.
Neuilly-sur-Seine and Paris-La Défense, March 9, 2006The Statutory Auditors
Deloitte & Associés KPMG AuditDepartment of KPMG SA
Jean-Paul Picard Antoine de Riedmatten Patrick-Hubert Petit Hervé Chopin

265 Reference document 2005
Statutory Auditors’ special report on regulated agreementsYear ended December 31, 2005
Dear Shareholders,
In our capacity as statutory auditors of your Company, we hereby present you our report on regulated agreements.The terms of our engagement do not require us to identify such agreements, if any, but to communicate to you, based on information provided to us, the principal terms and conditions of those agreements brought to our attention, without expressing an opinion on their usefulness and appropriateness. It is your responsibility, pursuant to Article 92 of the Decree of March 23, 1967, to assess the interest involved in respect of the conclusion of these agreements for the purpose of approving them.
Agreement authorised during the current year
We hereby inform you that no agreement entered into during the year to which Articles L.225-38 or L.225-86 of the French Commercial Code would be applicable has been brought to our attention.
Agreements approved during previous years and continued during the current year
In addition, pursuant to the Decree of March 23, 1967, we have been advised that the following agreements entered into and approved in previous years have had continuing effect during the year.
Advisory agreement with Calyon Bank
During its September 28, 2004 meeting, the Supervisory Board authorised the Company to enter into an advisory agreement with Calyon Bank with respect to structuring and rendering services as a joint book runner should the total or partial divestment of Rexel take the form of an international private placement.
The total budget allocated for this engagement consisted of a fi xed amount of €5,000,000 and a variable amount based on the selling price of the Rexel shares. Provisions amounting to €9,500,000 (excluding taxes) had been set aside in the December 31, 2004 fi nancial statements to cover these fees.
In 2005, PPR paid €9,500,000 (excluding taxes) with respect to this agreement.
Advisory and valuation agreement with Rothschild et Compagnie Bank
During its September 28, 2004 meeting, the Supervisory Board authorised the Company to enter into an advisory and valuation agree-ment to assess the offers with the Rothschild et Compagnie Bank should the total or partial divestment of Rexel be performed via a sale to investors.
The total budget allocated for this engagement consisted of a fi xed amount of €5,000,000 and a variable amount based on the selling price of the Rexel shares. Provisions amounting to €9,500,000 (excluding taxes) had been set aside in the December 31, 2004 fi nancial statements to cover these fees.
In 2005, PPR paid €9,500,000 (excluding taxes) with respect to this agreement.
Rebilling agreement between PPR and Rexel concerning the granting of an exceptional bonus
During its September 1, 2004 meeting, the Supervisory Board authorised the granting of an exceptional bonus to certain Rexel senior executives and managers in the event that the PPR Group would perform a transaction, directly or indirectly, resulting in the reduction of its interest in Rexel to equal or less than 40% of Rexel’s share capital. The payment of this exceptional bonus represents the consideration for the work performed by these benefi ciaries in preparing the conditions so that the transaction is properly carried out with a view to sustaining Rexel Group growth. Upon completion of the sale of PPR’s interest in Rexel, twelve individuals were granted this exceptional

266
Financial information – Parent company fi nancial statements
PPR 267
bonus. In its fi nancial statements for the year ended December 31, 2004, PPR had recorded an expense for €10,000,000 with respect to this agreement.
In 2005, invoices recorded by PPR with respect to this agreement amount to €8,294,668 and represent about 70% of the total expenses related to these exceptional bonuses (including employers’ contributions).
Amendments to the employment agreement of the Chairman of the Management Board
During its September 1, 2004 meeting, the Supervisory Board authorised, after approval by its Remuneration Committee, amendments to the employment agreement that Mr. Serge Weinberg had signed with Conseil & Assistance, combined with his corporate offi ce as a member and Chairman of the PPR Management Board; these amendments concern the provisions relating to severance payments should he leave the Group or cease to perform his duties as Chairman of the Management Board.
These new contractual provisions (effective as of January 1, 2005) were applied when Mr. Weinberg left the Group on March 21, 2005. At such time, Conseil et Assistance awarded Mr. Weinberg a gross severance payment of €5,328,946.
Liquidity agreement with Rothschild et Cie Bank
During its meeting of May 25, 2004, the Supervisory Board authorised, in connection with its share buyback programme, a liquidity agreement to be entered into with Rothschild et Compagnie Bank to replace the agreement that had expired on May 3, 2004 with Crédit Lyonnais Securities Europe.This agreement involves 250,000 shares of PPR SA and an amount of €40,000,000; it complies with the Ethics Charter established by the AFEI. The commission owed under this agreement for the year ended December 31, 2005 amounts to €521,111.
Supplementary retirement plan for the Group’s senior executives
During its meeting of March 3, 2004, the Supervisory Board amended the eligibility conditions (broadening the eligibility criteria) and the level of services to be provided under the supplementary retirement plan for the Group’s senior executives, as previously approved by the Supervisory Board on February 28, 2001.
The terms and conditions of this plan shall provide the option of collecting a partially reversible and adjustable life annuity, the amount of which would be calculated at the rate of 1.5% of the base salary by year of participation in the Executive Committee and/or 1% per year of seniority with the Group based on a required minimum of three years of presence, capped at 30% of the average highest gross remu-neration paid during the last 36 months in the Group, excluding exceptional bonuses but including in-kind benefi ts as well as a notional amount of 60% of benefi ts received with respect to corporate offi ces and/or non-salaried duties paid by any Group entity.
As of December 31, 2005, cumulative payments made by your Company into funds intended to cover commitments towards all mem-bers of the Board of Directors and senior executives concerned amounted to €9,417,570. No payment was made in 2005.

267 Reference document 2005
Payment for services rendered by Artémis
Pursuant to an agreement between PPR and Artémis signed in September 27, 1993, Artémis performs research and advisory engage-ments for PPR in the following areas:• the strategy and growth of the PPR Group and support in carrying out complex legal, tax-related, fi nancial or real estate transactions;• providing opportunities for business development in France and abroad or cost-cutting factors.During its meeting of March 10, 1999, the PPR Supervisory Board authorised payment for these services at 0.037% of net pre-tax con-solidated revenue.
In connection with the appropriate adjustment of PPR’s corporate governance rules, on July 6, 2005 the PPR Board of Directors decided, without amending the agreement in force since September 27, 1993, that the PPR Audit Committee would henceforth, in addition to the usual annual review of the substance of the services provided by Artémis to PPR, perform an annual assessment of the equitable price of these services given the resources saved in the common interest. This assessment was carried out in January 2006 for the fi rst time.
In 2005, a payment of €6,781,596 was made under this agreement.
Agreements between PPR, Conforama Holding, BNP Paribas and Cetelem concerning the sale of 90% of the shares of Facet
During its meetings of October 21 and December 18, 2002, the Supervisory Board authorised the Management Board to enter into an agreement between PPR, Conforama Holding, BNP Paribas and Cetelem with a view to selling 90% of Facet, based on a total price of €965 million. In particular, these agreements provided that a shareholders’ agreement be entered into between PPR, Conforama Holding, Cetelem and BNP Paribas in order to organise, within Facet, the relations between Conforama Holding and Cetelem.
In accordance with the option set forth in Article 6 of the shareholders’ agreement, the PPR Group sold its residual 9.69% interest in Facet to BNP Paribas for a selling price of €87.2 million during the fi rst half of 2005.
We conducted our review in accordance with the professional standards applicable in France. These standards require that we carry out the necessary procedures to verify the consistency of the information disclosed to us with the source documents.
Neuilly-sur-Seine and Paris-La Défense, March 9, 2006The Statutory Auditors
Deloitte & Associés KPMG Audit
Département de KPMG SA
Jean-Paul Picard Antoine de Riedmatten Patrick-Hubert Petit Hervé Chopin
Corporate governance284 Organisation of powers
284 Board of Directors
289 Other information regarding the Board of Directors
289 Management of the Group
291 Report of the Chairman of the Board of Directors on the conditions
for the preparation and organisation of the work of the Board
and internal control procedures implemented by PPR (the “Company”)
302 Statutory Auditors’ report prepared pursuant to Article L. 225-235
of the French Commercial Code on the report prepared by the Chairman
of the Board of Directors of PPR S.A. with respect to the internal control
procedures for the preparation and treatment of fi nancial and accounting
information
284
General information270 General information about the Company
272 General information about the Company’s share capital
273 Shareholding and stock market
279 Pacts and agreements
279 Miscellaneous information
270
Legal and stock market
268 269PPR

303 Internal Rules of the Board of Directors
306 Supervisory Board (until May 19, 2005)
309 Management Board (until May 19, 2005)
312 Stock subscription options or stock purchase options granted
to board members and options exercised
312 Bonus shares granted to board members
313 Fees paid by the Group to the Statutory Auditors
and to the members of their organisations in 2005
314
information
Resolutions submitted to the Ordinary General Shareholders’ Meeting of May 23, 2006
268 269 Reference document 2005

270
Legal and stock market information – General information
PPR 271
1. General information about the CompanyCompany name and registered offi ce
Company name: PPRRegistered offi ce: 10 avenue Hoche – Paris 75008 France
Legal form
A limited liability company (Société anonyme).
Applicable law
The laws of France.
Date of incorporation and term
The Company was incorporated on June 24, 1881 for a term of 99 years. The term was extended to May 26, 2066 by the Extraordinary General Shareholders’ Meeting held on May 26, 1967. The Company may be wound up in advance or its term may be extended, subject to the approval of the Extraordinary General Shareholders’ Meeting.
Corporate purpose
The Company’s corporate purpose is as follows:
• to purchase and to sell, on a retail or wholesale basis, directly or indirectly, by any appropriate method and using any and all existing or future techniques, any and all goods, products and services;
• to create, acquire, lease, operate or sell, directly or indirectly, from any and all facilities, stores or warehouses used for the sale, on a retail or wholesale basis, by any appropriate method and using any and all existing or future techniques, any and all goods, products, produce and services;
• to manufacture or produce, directly or indirectly, any and all goods or produce for business purposes;• to provide any and all services, directly or indirectly;• to purchase, use or sell any and all real estate that may be used in the business;• to create any and all trading, non-trading, industrial, fi nancial, securities, real estate, service or other ventures, to acquire interests in
such ventures by any appropriate method including subscription to a share issue, acquiring shares in exchange for assets or by way of a merger and to manage these interests;
• and generally to carry out any and all trading, non-trading, industrial, fi nancial, real estate or securities transactions and perform any and all services directly or indirectly to the above purposes or any similar, complementary or related purposes or any purposes that may contribute to the implementation or furtherance of the above-mentioned purposes.
(Article 5 of the Articles of Association)
Register of Commerce and Companies
552 075 020 RCS ParisAPE business identifi er code: 741J
Consultation of offi cial legal documents
The Articles of Association, minutes of General Shareholders’ Meetings and other offi cial corporate documents may be consulted at the Company’s registered offi ce, in accordance with applicable law and regulations.
Fiscal year
The Company’s fi scal year begins on January 1 and ends on December 31 of the same year.
General information

271 Reference document 2005
Appropriation of earnings
A minimum of one-twentieth of net income for the year, less any losses brought forward from previous years, is allocated to the “legal re-serve”. This allocation is no longer required when it reaches one-tenth of the Company’s share capital.
Income available for distribution corresponds to net income for the year less any losses brought forward from previous years, any transfer made to the legal reserve as explained above and any amounts to be transferred to reserves in accordance with the law plus any unap-propriated retained earnings brought forward from the previous year. Pursuant to the proposal of the Board of Directors, the General Shareholders’ Meeting may decide to carry forward all or part of the amount to the following year, or to allocate all or part of the amount to extraordinary, general or special reserves to be used for the purposes specifi ed at the General Shareholders’ Meeting.
Any balance remaining after these allocations is distributed to shareholders.
The General Shareholders’ Meeting may decide, based on the Company’s results, to grant each shareholder the option to receive all or part of the fi nal dividend or any interim dividends in the form of cash or shares.
(Article 22 of the Articles of Association)
Dividends not claimed after fi ve years are paid over to the State.Dividends paid during the last three years are presented on page 260 of the Parent company management report.
General Shareholders’ Meetings – Double voting rights
General Shareholders’ Meetings are convened by the Board of Directors and deliberate on the agenda in accordance with the applicable egal and regulatory provisions.
Meetings are held at the Company’s registered offi ce or at any other venue specifi ed in the notice of meeting.
All shareholders are entitled to participate in General Shareholders’ Meetings in person or by proxy, in accordance with the law, upon presentation of proof of identity and proof of ownership of shares. Ownership of registered shares is evidenced by an entry in the Com-pany’s share register, recorded no less than three days before the date of the meeting. Shareholders may, at the discretion of the Board of Directors, attend meetings by videoconference or other means of telecommunication that enable them to be identifi ed as required by applicable regulations. Shareholders may also cast votes by mail, by returning the duly completed postal voting form to the Company as required by applicable regulations. For postal votes to be taken into account, the Company must receive the corresponding form at least three days prior to the date of the meeting. The Board of Directors may, however, reduce this deadline for the benefi t of all shareholders. Shareholders living outside France may appoint a proxy in accordance with applicable regulations.
General Shareholders’ Meetings are chaired by the Chairman of the Board of Directors or, in his absence, by a member of the Board designated to chair the meeting. If no member of the Board is designated, the General Shareholders’ Meeting will elect its own Chairman.
Shareholders’ Meeting minutes are drawn up and their copies certifi ed and delivered in accordance with the law.
Fully paid-up shares that have been registered for at least two years in the name of the same registered holder carry double voting rights at all General Shareholders’ Meetings.
Double voting rights may be cancelled at any time by a decision of the Extraordinary General Shareholders’ Meeting, ratifi ed by a special meeting of holders of shares with double voting rights.
(Article 20 of the Articles of Association)
Pursuant to the relevant legislation, double voting rights may be cancelled for any share converted to bearer ownership or in the event of a transfer of ownership except in the case of a transfer following inheritance, liquidation of joint property between spouses, or donation between living family members (spouse or relative).
The legal and regulatory disclosure thresholds apply. No specifi c disclosure thresholds are contained in the Company’s Articles of Association.

272
Legal and stock market information – General information
PPR 273
2. General information about the Company’s share capitalThe Company is authorised to obtain details of the identity of holders of shares carrying immediate or future voting rights at General Shareholders’ Meetings, as provided for by law.
(Article 7 of the Articles of Association)
In addition to the voting rights attached to shares in accordance with the law and the provisions of Article 20 of the Articles of Association, each share carries entitlement to a fraction of net assets pro rata to the number and par value of existing shares, as well as a fraction of earnings net of any deductions made pursuant to the law or the Articles of Association, and any liquidation surplus.
In order to ensure that the same net amount is paid on each share, without distinction, and to allow the shares to be quoted on the same line, the Company pays any proportional taxes certain on certain shares, notably in connection with the dissolution of the Company or a reduction in capital except in cases where this is not permitted by law. Proportional taxes will not be paid by the Company, however, in the event they are levied equally on all shares of the same class, in the event that several classes of shares carrying different rights are issued and outstanding.
In all cases where it is necessary to hold several shares in order to exercise a given right, shareholders shall be solely responsible for grouping their shares with other shareholders to attain the requisite number.
(Article 8 of the Articles of Association)
In the event of liquidation of the Company, the reserves remaining after repayment of the par value of the shares will be allocated among the shareholders pro rata to their respective interests in the capital.
(Article 24 of the Articles of Association)
Changes in the Company’s share capital and the rights attached to shares are governed by the relevant provisions of the law and the specifi c provisions of the Articles of Association summarised below.
Article 15 of the Articles of Association stipulates that under the Company’s internal rules, decisions by the CEO to issue shares and share equivalents require the prior approval by the Board of Directors.
Share capital as of December 31, 2005
As of December 31, 2005, the Company’s share capital amounted to €481,792,920 divided into 120,448,230 shares with a par value of €4 each, all fully paid up. The number of voting rights at the same date totalled 171,169,242.
As of the same date, to the best of the Company’s knowledge:
• The directors held directly 0.07% of the share capital representing 0.10% of the voting rights,• 149,514 shares were held as treasury shares in connection with the Company’s share buyback programs. None of the Company’s
shares were held by controlled companies.

273 Reference document 2005
3. Shareholding and stock market3.1. Change in shareholding and voting rights
2005 2004 2003
Numberof shares
% share capital
% voting rights (1)
% share capital
% voting rights (1)
% share capital
% voting rights (1)
Artémis Group 51,616,666 42.9 58.5 42.2 57.2 42.2 56.8
PPR 149,514 0.1 - 4.0 - 5.2 -
Employees 272,934 0.2 0.3 0.7 0.6 0.7 0.7
Public 68,409,116 56.8 (2) 41.2 (3) 53.1 42.2 51.9 42.5
Total 120,448,230 100 100 100 100 100 100
Artémis is wholly owned by Société Financière Pinault, itself controlled by the Pinault family.
(1) Shares held for more than two years in a registered account in the name of the same shareholder carry double voting rights (see General Information about the Company-General Shareholders’ Meetings).
(2) Including 1.75% registered shares and 55.05% bearer shares.(3) Including 1.40% registered shares and 39.80% bearer shares.
42.9%
24.9%
0.1%
Breakdown of share capital as of December 31, 2005
ARTÉMIS GROUP
FRENCH INSTITUTIONAL INVESTORS
NON-FRENCH INSTITUTIONAL INVESTORS
INDIVIDUAL SHAREHOLDERS
EMPLOYEE SHAREHOLDERS
TREASURY STOCK
21.8%
0.2%10.1%
On December 31, 2005, the Group had 129,983 individual shareholders compared to 143,197 in 2004, representing 10.1% of the Group’s share capital (vs. 11.2% at the end of 2004). Institutional investors owned 46.7% of share capital, of which 24.9% held by French companies and 21.8% by non-French institutional investors. Among the international institutional investors, the United States represented 10.9%, Continental Europe 7.7% (of which Ger-many 2.0%, Luxembourg 2.0% and Switzerland 1.1%) and the United Kingdom 2.6%.The main changes in the shareholding breakdown compared with the previous year are notably the increase in the percentage of French institutional investors (up 12.1% in number of shares), international institutional investors (up 6.2% in number of shares), the decrease in the number of individual shareholders (down 10.7% in number of shares) and the marked decline in treasury shares.
Source: Identifi able Bearer Shareholders as of December 31, 2005.

274
Legal and stock market information – General information
PPR 275
Breakdown of shareholding and voting rights as of March 31, 2006
Number of shares: 120,323,716.Number of voting rights: 172,136,773.
As of March 31, 2006 % of share capital % voting rights (1)
Artémis Group 43.0% 58.9%
PPR - (1) -
Employees 0.2% 0.3%
Public (2) 56.8% (2) 40.8% (3)
Total 100.0% 100.0%
(1) Less than 0.05%.(2) Including 2.16% registered shares and 54.64% bearer shares.(3) Including 2.65% registered shares and 38.19% bearer shares.
To the Company’s knowledge, there are no other shareholders who directly or indirectly or jointly hold 5% or more of the share capital or voting rights.
3.2. Stock market information
The PPR share
Place of listing Euronext Paris
Market Eurolist A
Benchmark index CAC 40
Initial public offering (IPO) 10/25/1988 on the Second marché
02/09/1995 in the CAC 40
Number of shares 120,448,230
Codes ISIN: FR 0000121485Reuters: PRTP.PABloomberg: PPFP
Performance of the PPR share compared with the CAC 40 index since January 1, 2005
71
76
81
86
91
96
100
CAC 40
In euros
PPR
Jan.
05
Feb.
05
Mar
ch 0
5
Mar
ch 0
6
Apr
il 05
May
05
June
05
July
05
Aug
. 05
Sept
. 05
Oct
. 05
Nov
. 05
Dec
. 05
Jan.
06
Feb.
06
Source: Fininfo.

275 Reference document 2005
In 2005, PPR saw its share price increase by 29%. This rise in the share price was mainly due to the excellent performance of Luxury Goods, due to the acceleration in organic growth of the Gucci brand and the reduction in losses for all brands of the Luxury Goods division. During the year, Distribution also held up very well, exceeding the anticipations of the fi nancial markets in a depressed economic environ-ment. The PPR share therefore outperformed the CAC 40 by 4.7%, benefi ting from renewed market confi dence in the Group’s strategy.
Market price and trading volume of the PPR share
2001 2002 2003 2004 2005
High (€) 235.3 154.7 88.9 90.7 95.6
Low (€) 97.1 53.9 44.5 67.5 73,1
Price at 12/31 (€) 144.6 70.1 76.7 73.7 95.2
Market capitalisation at 12/31 (millions of €) 17,698 8,580 9,382 9,017 11.461
Average daily trading volume 428,865 650,232 671,756 552,669 557,451
Number of shares at 12/31 122,394,480 122,394,480 122,406,980 122,434,480 120,448,230
Source: Euronext Paris SA.
Listed securities of the Group as of December 31, 2005
Securities listed on the Paris Stock Exchange (SRD) ISIN Code
Share
PPR FR 00 00 121 485
Bonds
PPR 4% January 2013 FR 00 10 208 660
PPR 5.25% March 2011 FR 00 10 068 486
PPR 5% January 2009 FR 00 10 002 121
PPR Euribor October 2007 FR 00 10 125 831
Convertible bonds
OCEANE PPR Coupon 1.5% January 2007 FR 00 00 188 047
OCEANE PPR Coupon 2.5% January 2008 FR 00 00 103 053
OCEANE: Bonds convertible into new shares and/or exchangeable for existing shares.

276
Legal and stock market information – General information
PPR 277
Stock market statistics
The PPR share
2004 Price (€) Monthly change
Volume
Average High Low Average daily trading volume
Shares traded
(€M) (number of shares)
January 80.8 85.2 75.8 +5.7% 512,616 872 10,764,931
February 82.6 87.8 79.1 +7.2% 452,132 750 9,042,639
March 84.5 89.2 80.6 -2.1% 547,556 1,059 12,593,798
April 85.6 87.9 82.1 +1.2% 511,617 874 10,232,336
May 85.3 90.7 81.7 -0.1% 547,474 984 11,496,949
June 84.5 87.4 82.8 -1.9% 597,315 1,109 13,140,935
July 81.3 86.3 79.0 -4.0% 433,846 780 9,544,605
August 76.1 81.4 71.2 -7.5% 432,681 721 9,518,988
September 71.9 75.5 67.5 -1.4% 832,503 1,320 18,315,057
October 73.5 76.0 71.4 -0.1% 603,696 935 12,677,623
November 76.0 79.6 73.2 +5.9% 642,343 1,082 14,131,556
December 75.4 78.6 73.0 -5.8% 507,905 889 11,681,811
Average 2004 79.8 83.8 67.5 -0.2% 552,669 948 11,928,436
2005 Price (€) Monthly change
Volume
Average High Low Average daily trading volume
Shares traded
(€M) (number of shares)
January 77.3 81.8 73.1 +9.8% 763,292 1,246 16,029,129
February 81.2 84.5 77.6 +4.2% 662,447 1,069 13,248,949
March 83.2 85.1 81.3 -2.1 % 569,442 994 11,958,273
April 80.0 83.0 74.9 -7.8 % 480,475 801 10,089,980
May 79.1 81.3 75.5 +5.9% 518,488 903 11,406,740
June 82.8 85.9 79.2 +6.0% 763,820 1,391 16,804,041
July 83.6 85.6 79.1 -2.4% 610,331 1,068 12,816,949
August 84.7 89.7 81.4 +4.4% 467,036 912 10,741,836
September 87.1 90.0 85.4 +0.5% 497,423 951 10,943,303
October 85.6 88.3 82.9 +0.4% 493,621 887 10,366,043
November 91.5 93.9 87.5 +4.3% 465,500 932 10,241,005
December 92.6 95.6 90.3 +4.0% 410,416 794 8,618,745
Average 2005 84.0 87.0 80.7 +2.3% 557,451 996 11,938,749
2006 Price (€) Monthly change
Volume
Average High Low Average daily trading volume
Shares traded
(€M) (number of shares)
January 95.7 99.4 92.9 +0.9% 620,440 1,306 13,649,672
February 95.1 98.4 93.7 +0.7% 372,243 709 7,444,853
March 98.0 101.0 93.7 +3.1% 546,294 1,220 12,564,763
Source: Euronext Paris SA.

277 Reference document 2005
OCEANE
PPR OCEANE, coupon 1.5%, December 2001
Month Price (€) Volume
Average High Low Average daily trading volume
Bonds traded
(€M) (number of shares)
November/ December 2001 177.1 184.0 165.7 3,940 28.0 157,582
January/March 2002 167.1 180.0 155.1 3,100 32.8 192,194
April/June 2002 165.1 172.0 155.1 523 5.3 31,916
July/September 2002 156.6 166.0 150.0 3,792 38.5 246,467
October/December 2002 161.9 169.7 157.0 4,805 49.9 307,533
January/March 2003 161.3 163.5 152.1 4,010 30.5 188,473
April/June 2003 160.2 163.2 146.9 36,203 100.2 615,457
July/September 2003 157.0 158.0 156.0 19 0.0 56
October/December 2003 160.8 162.0 160.0 2,016 1.6 10,079
January/March 2004 160.6 165.0 160.0 32 0.0 255
April/June 2004 167.0 174.0 160.0 46 0.0 92
July/September 2004 - - - - - -
October/December 2004 148.0 160.0 135.1 2 0.0 10
January/March 2005 152.0 152.0 152.0 43 0.0 43
April/June 2005 146.2 152.3 140.0 267 0.1 534
July/September 2005 140.0 140.0 140.0 38 0.0 38
October/December 2005 165.0 165.0 149.2 6 0.0 6
January/March 2006 - - - - - -
Source: Fininfo.
PPR OCEANE, coupon 2.5%, May 2003
Month Price (€) Volume
Average High Low Average daily trading volume
Bonds traded
(€M) (number of shares)
May/June 2003 92.9 95.6 86.4 5,317 10.3 111,650
July/September 2003 93.9 101.0 89.1 5,403 22.5 243,126
October/December 2003 98.1 102.4 93.5 3,676 18.4 187,485
January/March 2004 98.1 103.4 94.5 2,278 13.9 143,511
April/June 2004 98.9 101.4 96.7 1,230 6.2 62,734
July/September 2004 95.8 99.5 92.4 3,459 21.7 228,321
October/December 2004 95.5 99.0 92.0 404 2.5 26,285
January/March 2005 95.2 96.1 92.2 1,092 6.4 67,684
April/June 2005 95.3 98.4 90.2 869 5.1 52,990
July/September 2005 98.0 104.0 90.0 246 1.6 16,203
October/December 2005 99.2 102.0 95.5 543 2.5 24,992
January/March 2006 101.6 112.0 91.0 1,005 3.1 30,155
Source: Fininfo.

278
Legal and stock market information – General information
PPR 279
In the framework of share buyback programme, PPR granted a mandate to a fi nancial intermediary in order to encourage the liquidity of transactions and the consistency of PPR share quotations. This contract complies with the provisions of the Professional Code of Conduct established by the Association Française des Entreprises d’Investissement (A.F.E.I., French Association of Investment Companies).
3.3. Financial communications policy
The Group’s fi nancial communications policy consists in disseminating accurate, reliable information. Its actions are targeted and custo-mised to offer different audiences, individual shareholders and the fi nancial community, messages suited to their respective needs while complying with the principle of equal access to information.
Towards individual shareholders
Individual shareholders have access to a number of media and tools providing updates on Group news and share performance, including the Shareholders’ Newsletter, published twice a year, the dedicated website www.pprfi nance.com, the Shareholders’ hotline (+33 (0)1 45 64 61 22), legal announcements in the fi nancial press, the Annual Report and site visits. In 2005, the Group organised eight site visits which enabled nearly 220 shareholders to discover the Fnac store in Lille, the Madelios and Citadium stores in Paris, the Conforama store in Vitry-sur-Seine, the Eurapharma logistics platform near Rouen and the Christmas window displays and decorations at Printemps Haussmann.
Towards the fi nancial community
The Group maintains close relations with the French and international fi nancial community. A number of communication initiatives are designed to keep the fi nancial community informed of the performance of its businesses, its strategy and its perspectives. PPR has expanded its communication by organising conference calls at the release of quarterly sales fi gures, and meetings to present its annual and half-yearly results. PPR also participates regularly in industry conferences held by major banks. It meets with investors during road shows held in the major fi nancial centres around the world. In addition, the Group meets with individual investors upon request and main-tains proactive relations in terms of reporting with the Autorité des Marchés Financiers (French Financial Markets Regulatory Authority). In January 2005, the Group held a presentation on the transition to IFRS international accounting standards.
2006 Financial calendar
• April 27, 2006 2006 First quarter sales
• May 23, 2006 Annual General Shareholders’ Meeting
• July 27, 2006 2006 Second quarter sales
• September 7, 2006 2006 First half results
• October 26, 2006 2006 Third quarter sales

279 Reference document 2005
4. Pacts and agreementsTo the Company’s knowledge, there are no contractual provisions involving shares or voting rights that should have been disclosed to the Autorité des Marchés Financiers in accordance with Article L.233-11 of the French Commercial Code.
5. Miscellaneous information5.1. Changes in the share capital
Year Description Issue, contribution or merger premium
Par value amount change in share
capital
New share capital of the Company
(as of December 31)
Aggregate number of ordinary shares
2005 Exercise of options €512,491 €55,000 13,750 (1)
Cancellation of shares €(154,460,000) €(8,000,000) -2,000,000 (1)
€(153,947,509) €(7,945,000) €481,792,920 120,448,230 (1)
2004 Exercise of options €1,301,830 €110,000 27,500 (1)
€1,301,830 €110,000 €489,737,920 122,434,480 (1)
2003 Exercise of options €379,266 €50,000 12,500 (1)
€379,266 €50,000 €489,627,920 122,406,980 (1)
2002 – – – €489,577,920 122,394,480 (1)
2001 Conversion of share capital into euros, increase in par value to €4 each
€113,009,005
Exercise of options €2,308,163 €172,449 55,000 (1)
Conversion of OCEANE bonds
€485,783,887 €14,240,700 3,560,175 (1)
€488,092,050 €127,422,154 €489,577,920 122,394,480 (1)
2000 Share issues reserved for employees
FRF876,562,559 FRF15,984,160 799,208 (2)
Exercise of options FRF2,234,000 FRF100,000 5,000 (2)
Cancellation of shares FRF(1,794,240,942) FRF(24,120,060) -1,206,003 (2)
FRF(915,444,383) FRF(8,035,900) FRF2,375,586,100 118,779,305 (2)
(1) Shares with a par value of €4 each.(2) Shares with a par value of FRF 20 each.
On January 11, 2006, the Board of Directors decreased the share capital by €498,056 by way of the cancellation of 124,514 treasury shares. As a result, the share capital was reduced to €481,294,864 divided into 120,323,716 shares with a par value of €4 each.
The share capital could be increased by:• 13,418,225 shares (11.15% of the share capital as modifi ed on January 11, 2006) through requests to convert, if the Company chooses
this option, OCEANE bonds issued in 2001 and 2003 (conversion or parity exchange: one share for one bond). The main characteristics of these issues are provided in note 28.4 of the consolidated fi nancial statements.
• 2,047,648 shares (1.70% of the share capital as modifi ed on January 11, 2006) via the exercise of share subscription options of current shareoption plans (see share option plan tables p. 282 and 283).

280
Legal and stock market information – General information
PPR 281
5.2. Share pledges
As of December 31, 2005, 8,200,000 PPR shares held by pure registered shareholders “nominatif pur” were pledged to various lenders.
Pledges as at December 31, 2005
Name of registered shareholder
Benefi ciary Start date of pledge
Expiry date of pledge
Terms of cancellation of the pledge
Number of shares
of the issuer pledged
% of share capital of the issuer pledged (3)
Artémis SA Calyon 06/08/2000 Indefi nite (1) 6,500,000 5.4%
Artémis SA Calyon-ING Barings (2) 05/18/1998 Indefi nite (1) 1,700,000 1.4%
Total 8,200,000 6.8%
(1) Full reimbursement or repayment of the loan.(2) And other fi nancial institutions.(3) Based on the share capital as modifi ed on January 11, 2006, i.e. 120,323,716 shares with a par value of €4 each.
5.3. Authorised unissued capital, capital increase levels (as of March 8, 2006)
The Board of Directors, pursuant to the various resolutions adopted at the Extraordinary General Shareholders’ Meeting, is authorised to carry out the following issues of securities:
Authorisations Amount of equity warrants and/or securities issued
Maximum capital increase
Date of authorisation
Duration of the authorisation
Capital increase via share issue(s) with pre-emptive subscription rights, equity warrants and/or other share equivalents convertible either immediately or in the future into Company shares or debt securities (1)
€6 billion €200 million AGM of May 19, 2005
26 months
Capital increase via share issue(s) with waiver of pre-emptive subscription rights, equity warrants and/or share equivalents, convertible either immediately or in the future into Company shares and which can be used in payment of shares (or debt securities) tendered in a public exchange offer (1)
€6 billion €200 million AGM ofMay 19, 2005
26 months
Capital increase via capitalisation of reserves, earnings or additional paid-in capital (1)
€200 million AGM of May 19, 2005
26 months
Capital increase in consideration of in-kind contributions up to a maximum of 10% of the share capital (1)
€48.9 million AGM of May 19, 2005
26 months
Share subscription or purchase option plans for a total amount of 2,500,000 shares (2)
€10 million AGM of May 19, 2005
38 months
Allocation of bonus shares reserved for employees and corporate offi cers (3)
€4.8 million AGM of May 19, 2005
38 months
Issuance of shares reserved for Group employees (1)
€4.8 million AGM of May 19, 2005
26 months
(1) Authorisations not used(2) Authorisation used in 2005 for three share subscription option plans covering 394,230 shares. In addition, on January 3, 2005, the Management Board approved a share subscription
option plan covering 25,530 shares pursuant to the authorisation of May 25, 2004. (3) Authorisation used in 2005 for the granting of 23,133 existing bonus shares.

281 Reference document 2005
Furthermore, the Board of Directors was authorised, for a period of 5 years, by the Extraordinary General Shareholders’ Meeting of May 19, 2005 to decrease the share capital, under applicable legal conditions, via the cancellation of shares purchased by the Company as part of its share buyback programs. This authorisation was used once since May 19, 2005 via the cancellation of 124,514 treasury shares on January 11, 2006, thereby decreasing the share capital to €481,294,864 divided into 120,323,716 shares of €4 each.
Share option plans and granting of bonus shares
In 2005, the Company established four share subscription option plans for the Group’s senior managers, concerning 25,530 shares at €75.29 per share, 333,750 shares at €78.01 per share, 39,960 shares at €78.97 per share and 20,520 shares at €85.05 per share.
The policy regarding the granting of share options was extended in 1998 to senior managers of the Group, who receive a number of options according to their individual duties and responsibilities.
The option plans have a term of ten years. Since 2001, the option exercise price has not included a discount on the share price (5% dis-count for plans granted up to 2000) and options have a vesting period of four years following the grant date. Employees and corporate offi cers who leave the Group before exercising their options lose their option rights depending on their period of employment in the Group since the granting of the share options and the reasons for their departure.
Options granted to the Chief Executive Offi cer and other members of the Executive Committee are determined by the Board of Directors, based on the appreciation of the Remuneration Committee created by the Board.
The exercise by the benefi ciaries of the all of the share subscription options granted would give rise to the creation of 2,047,648 new shares, representing 1.70% of the share capital.
In 2005, for the fi rst time, the Company decided to grant bonus shares to certain Group executive managers. 23,133 existing shares were granted pursuant this plan on July 6, 2005. These shares will be granted defi nitively at the end of an allocation period of 2 years, followed by a holding period of 2 years during which time such shares may not be transferred. Benefi ciaries who are no longer employees or cor-porate offi cers of the Group at the end of the allocation period could lose their rights depending on the circumstances under which they leave the Group. As a result of the departure from the Group of certain benefi ciaries of this plan during 2005, the maximum number of shares to be granted totalled 22,771 on December 31, 2005. Moreover, should the PPR share price under perform the CAC 40 during the allocation period, the number of shares defi nitively granted would be adjusted downwards on a pro rata basis to this under performance as the case may be.
Bonus shares granted by PPR and its affi liated companies to the top ten employees (excluding directors)
Bonus shares granted to the top ten employees (excluding directors)
Total number of bonus shares granted
Shares granted, during the fi scal year, by the issuer and any other company included in the bonus share allocation plan, to the top ten employees of the issuer with the highest number of shares granted
2,553

282
Legal and stock market information – General information
PPR 283
Share option subscription or purchase plans granted by PPR and affi liated companies to the top ten employees (excluding directors) of the granty company and options exercised by them
Stock subscription or stock purchase option plans granted to the top ten employees (excluding directors) of the granting company and options exercised by them
Total number of PPR shares allocated/subscribed
or purchased
Weighted average price(in €)
Options granted during the fi scal year by the issuer and all companies included in the scope of the share option allocation plan to the top ten employees of the issuer andall companies included in this plan, with the highest number of options granted
23,828 78.01
Options held by the issuer and the above-mentioned companies, exercised during the fi scal year by the ten employees of the issuer and those companies, with the highest number of options purchased or subscribed
10,000 33.72
PPR share option plans as of December 31, 2005
1997/1 Plansubscription
options
1997/2 Plansubscription
options
1998 Planpurchase options
1999/1 Planpurchase options
1999/2 Planpurchase options
1999/3 Planpurchase options
2000/1 Planpurchase options
2000/2 Planpurchase options
2001/1 Planpurchase options
Date of shareholders’ meeting 06.18.1992 06.05.1997 06.05.1997 06.05.1997 06.05.1997 06.05.1997 06.05.1997 06.05.1997 06.05.1997
Date of Management Board/ Board of Directors’ meeting
01.22.1997 06.05.1997 06.05.1998 01.20.1999 05.21.1999 12.08.1999 01.26.2000 05.23.2000 01.17.2001
Number of options granted initially
100,000 13,250 347,050 27,495 25,455 412,350 12,100 93,100 340,240
Including: to members of the Management Board(1)
30,000 - 60,000 - - 52,400 - - 52,000
To fi rst ten salaried employees
22,970
Number of options exercised as at 12.31.2005
73,750 10,000 0 0 0 0 0 0 0
Cancelled options (as at 12.31.2005)
1,250 0 186,975 22,625 16,235 195,100 4,400 58,300 112,790
Number of options remaining to be exercised as at 12.31.2005
25,000 3,250 160,075 4,870 9,220 217,250 7,700 34 800 227,450
Number of benefi ciaries 9 3 257 36 44 560 26 125 722
Plan start date 04.01.1997 08.01.1997 08.01.1998 04.01.1999 07.01.1999 12.27.1999 03.01.2000 07.01.2000 02.01.2001
Plan expiration date 03.31.2007 07.31.2007 07.31.2008 03.31.2009 06.30.2009 12.26.2009 02.28.2010 06.30.2010 01.31.2011
Strike price €61.41 €71.16 €135.98 €154.58 €144.83 €189.19 €227.15 €202.91 €225.01
NB: each option gives the right to one share. (1) As of May 19, 2005.(2) After adjustments resulting from the division of the par value of shares.
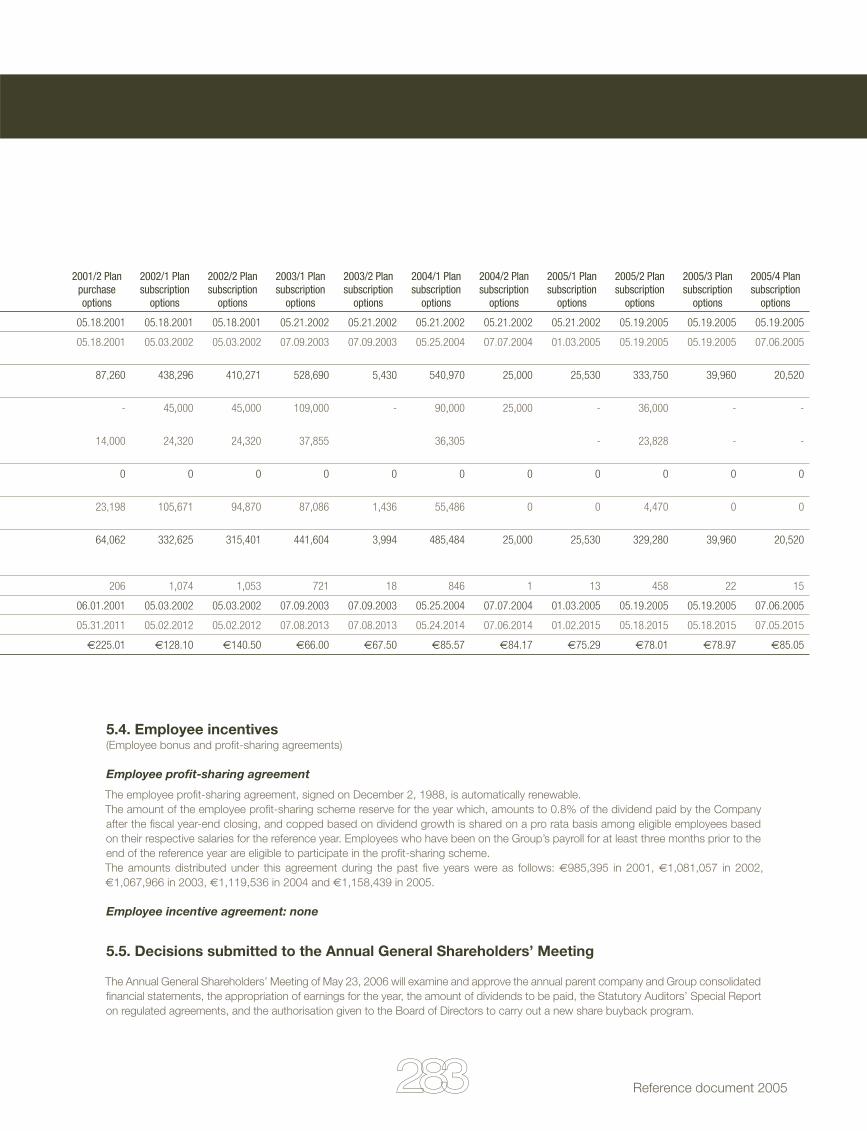
283 Reference document 2005
5.4. Employee incentives(Employee bonus and profi t-sharing agreements)
Employee profi t-sharing agreement
The employee profi t-sharing agreement, signed on December 2, 1988, is automatically renewable.The amount of the employee profi t-sharing scheme reserve for the year which, amounts to 0.8% of the dividend paid by the Company after the fi scal year-end closing, and copped based on dividend growth is shared on a pro rata basis among eligible employees based on their respective salaries for the reference year. Employees who have been on the Group’s payroll for at least three months prior to the end of the reference year are eligible to participate in the profi t-sharing scheme.The amounts distributed under this agreement during the past fi ve years were as follows: €985,395 in 2001, €1,081,057 in 2002, €1,067,966 in 2003, €1,119,536 in 2004 and €1,158,439 in 2005.
Employee incentive agreement: none
5.5. Decisions submitted to the Annual General Shareholders’ Meeting
The Annual General Shareholders’ Meeting of May 23, 2006 will examine and approve the annual parent company and Group consolidated fi nancial statements, the appropriation of earnings for the year, the amount of dividends to be paid, the Statutory Auditors’ Special Report on regulated agreements, and the authorisation given to the Board of Directors to carry out a new share buyback program.
2001/2 Planpurchase options
2002/1 Plansubscription
options
2002/2 Plansubscription
options
2003/1 Plansubscription
options
2003/2 Plansubscription
options
2004/1 Plansubscription
options
2004/2 Plansubscription
options
2005/1 Plansubscription
options
2005/2 Plansubscription
options
2005/3 Plansubscription
options
2005/4 Plansubscription
options
05.18.2001 05.18.2001 05.18.2001 05.21.2002 05.21.2002 05.21.2002 05.21.2002 05.21.2002 05.19.2005 05.19.2005 05.19.2005
05.18.2001 05.03.2002 05.03.2002 07.09.2003 07.09.2003 05.25.2004 07.07.2004 01.03.2005 05.19.2005 05.19.2005 07.06.2005
87,260 438,296 410,271 528,690 5,430 540,970 25,000 25,530 333,750 39,960 20,520
- 45,000 45,000 109,000 - 90,000 25,000 - 36,000 - -
14,000 24,320 24,320 37,855 36,305 - 23,828 - -
0 0 0 0 0 0 0 0 0 0 0
23,198 105,671 94,870 87,086 1,436 55,486 0 0 4,470 0 0
64,062 332,625 315,401 441,604 3,994 485,484 25,000 25,530 329,280 39,960 20,520
206 1,074 1,053 721 18 846 1 13 458 22 15
06.01.2001 05.03.2002 05.03.2002 07.09.2003 07.09.2003 05.25.2004 07.07.2004 01.03.2005 05.19.2005 05.19.2005 07.06.2005
05.31.2011 05.02.2012 05.02.2012 07.08.2013 07.08.2013 05.24.2014 07.06.2014 01.02.2015 05.18.2015 05.18.2015 07.05.2015
€225.01 €128.10 €140.50 €66.00 €67.50 €85.57 €84.17 €75.29 €78.01 €78.97 €85.05

284
Legal and stock market information – Corporate governance
PPR 285
Corporate governance
At the Combined General Shareholders’ Meeting of May 19, 2005, the shareholders adopted the new Articles of Association of PPR creating a management structure with a Board of Directors instead of a Supervisory Board and a Management Board and also appointed nine directors to terms of offi ce of four years. Five of these directors are independent according to the criteria set forth in the Bouton Report, representing more than half of the directors. The Board is international, comprised of directors from France, the UK, Italy and the US.
1. Organisation of powersChairman and Chief Executive Offi cer
At its fi rst meeting on May 19, 2005, the Board of Directors elected Mr. François-Henri Pinault Chairman and Chief Executive Offi cer of the Company.
2. Board of DirectorsComposition and activities of the Board of Directors
The directors’ duties and remuneration are described below.
In accordance with the Articles of Association, each director must own at least fi ve hundred shares of the Company.
The rules and activities of the Board of Directors are defi ned by the law, the Company’s Articles of Association and the internal rules of the Board and its specialised committees as set forth in these regulations (see the Chairman’s Report and Internal Rules).
The Board of Directors met four times in 2005 starting from its creation on May 19, 2005. The average attendance rate was 75%.
2.1. Information on members of the Board of Directors
Professional experience and expertise in the area of business management. Directorships and positions held during fi scal year 2005. Other directorships held during the last 5 years. Remuneration and benefi ts paid by the Company and received from controlled compa-nies in 2005 (gross amounts before withholding tax, if applicable); variable remuneration (gross amount) paid with respect to fi scal year 2005 in 2006; gross amount of remuneration and benefi ts paid in 2004.
François-Henri Pinault, born on May 28, 1962
A graduate of HEC, François-Henri Pinault joined the Pinault Group in 1987 where he carried out various duties in the Group’s main subsidiaries. After having started as a salesman at the Evreux branch of Pinault Distribution, a subsidiary specialised in the import and distribution of wood, in 1988, he created this company’s purchasing unit for which he was in charge until September 1989. Appointed CEO of France Bois Industries, the company comprising the industrial activities of the Pinault Group, he managed the 14 plants of this subsidiary until December 1990, date on which he returned to Pinault Distribution to become Chairman. In 1993, he enlarged his res-ponsibilities by being appointed Chairman of CFAO and a member of the Management Board of Pinault Printemps Redoute. Four years later, he was appointed Chairman and CEO of Fnac, a position which he held until February 2000. Then he was appointed Deputy CEO of Pinault Printemps Redoute in charge of developing the group’s Internet activities. In 2001, he became co-managing director of Financière Pinault. In 2003, he was appointed Chairman of the Artémis Group. In 2005, he was fi rst appointed Chairman of the Management Board and then Chairman of the Board of Directors and CEO of PPR. Moreover, he has been a member of the Board of Directors of Bouygues S.A. since December 1998.
CEO (from May 19, 2005 - current term expires in 2009)Chairman of the Management Board (from March 21, 2005 until May 19, 2005)Member of the Management Board (from June 17, 1993 until January 17, 2001 and from March 2005 to May 19, 2005)Vice-Chairman of the Supervisory Board (from May 22, 2003 until March 20, 2005)Member of the Supervisory Board (from January 17, 2001 until May 19, 2005)

285 Reference document 2005
Other directorships and positions held during the yearChairman of the Board of Directors of Artémis; General Manager of Financière Pinault; Director of Afi pa (2), Bouygues (1) , Fnac SA, Palazzo Grassi (1) , Simetra Obligations and Soft Computing; Member of the Supervisory Board of Boucheron Holding, Gucci Group NV and Yves Saint Laurent (1) ; Chairman of the Supervisory Board of Gucci Group NV (1) ; Vice-Chairman of the Supervisory Board of Boucheron Holding (1) ; Permanent Representative of Financière Pinault on the Board of Directors of Bouygues (2); Chairman and CEO of Simetra Obli-gations (2); Member of the Management Board of Château Latour; Director, Christie’s International Plc (UK).
Other directorships held during the last 5 yearsDirector of Finaref, Rexel and TV Breizh; Permanent Representative of Artémis on the Board of Directors of Conforama Holding and Guilbert; Deputy CEO of Artémis.
Remuneration and benefi ts paid in 2005: €936,564 (including €53,944 in directors’ fees, €9,898 in remuneration as Vice-Chairman of the Supervisory Board; €80,995 in remuneration as Chairman of the Management Board, €701,610 in remuneration as CEO, €85,778 in directors’ fees paid by the Gucci Group NV and €4,339 paid as in-kind benefi ts (company car).2005 variable remuneration paid in 2006 €750,000Remuneration and benefi ts in 2004: €156,927 (including €51,775 in attendance fees and €59,417 in directors’ fees paid by Gucci Group NV). Number of shares held: 78,390.
Patricia Barbizet, born on April 17, 1955
A graduate of the Ecole Supérieure de Commerce de Paris (Paris Business School), Patricia Barbizet began her career in the Renault Group as Treasurer of Renault Véhicules Industriels then CFO of Renault Crédit International. She joined the Pinault Group in 1989 as CFO. Since 1992, she has been the CEO of Financière Pinault and a Director and CEO of Artémis. She is the Vice-Chairman of the Board of Directors of PPR, Chairman of Christie’s and a Board member of various other companies.
Vice-Chairman of the Board of Directors (from May 19, 2005 – current term expires in 2009)Chairman of the Supervisory Board (from January 1, 2005 until May 19, 2005)Member of the Supervisory Board (from December 11, 1992 until May 19, 2005
Other directorships and positions held during the yearCEO of Financière Pinault; Director and CEO of Artémis and Palazzo Grassi (1) ; CEO of Piasa; Chairman of the Board of Directors of la Société Nouvelle du Théâtre Marigny (2); Chairman of Christies International Plc (UK); Director of Air France, Bouygues (1) , Fnac SA, Société Nouvelle du Théâtre Marigny and TF1; Member of the Supervisory Board of Financière Pinault, Gucci Group NV (The Netherlands) and Yves Saint Laurent; Permanent Representative of Artémis on the Board of Directors of Agefi , Bouygues (2) and Sebdo Le Point; Member of the Management Board of Château Latour.
Other directorships held during the last 5 years Member of the Supervisory Board of Yves Saint Laurent Haute Couture and Yves Saint Laurent Parfums; Permanent Representative of Artémis on the Board of Directors of Rexel; Member of the Conseil des Marchés Financiers (French Financial Markets Council).Remuneration and benefi ts paid in 2005: €197,855 (including €50,266 in directors’ fees, €60,000 in directors’ fees paid by Gucci Group NV and €87,589 in remuneration as Chairman of the Supervisory Board).Remuneration and benefi ts in 2004: €335,562 (including €45,562 in attendance fees and €60,000 in directors’ fees paid by Gucci Group NV).Number of shares held: 1,040.
René Barbier de La Serre, born on July 3, 1940
A former student at Ecole Polytechnique, engineer of the Manufactures de l’Etat, a graduate of IEP Paris, René de La Serre began his career in 1963 as an Engineer-adviser then Deputy Director of the European Union Bank. In 1973, he joined the Crédit Commercial de France where he was appointed Vice-Chairman and CEO of the group’s fi nancial activities (1993 -1999) and then Adviser to the Chairman (1999 - 2000). At the same time, he was President of the Conseil des Bourses de Valeurs (1994 - 1996) and then President of the Conseil des Marché Financiers (1996 - 1998).
Director (since May 19, 2005 – current term expires in 2009)Member of the Supervisory Board (from May 10, 1999 until May 19, 2005)Vice-Chairman of the Supervisory Board (from March 21, 2005 until May 19, 2005).
(1) Directorships or positions which started during 2005(2) Directorships or positions which ended during 2005 Directorships and main duties in bold.

286
Legal and stock market information – Corporate governance
PPR 287
Other directorships and positions held during the yearChairman of the Supervisory Board of Edmond de Rothschild Private Equity Partners SAS (1) ; Director of Calyon (2), Sanofi Aventis and Schneider Electric; Member of the Supervisory Board of Compagnie Financière Saint Honoré, La Compagnie Financière Edmond de Rothschild Banque and Euronext NV (The Netherlands); Adviser to the Board of Fimalac et Nord Est; Acting Director of Harwanne Com-pagnie de Participations Industrielles et Financières SA (Switzerland).
Other directorships held during the last 5 years CEO of Continentale d’Entreprises; Chairman of Tawa UK Ltd; Director of Aoba Life and Crédit Lyonnais.
Remuneration and benefi ts paid in 2005: €64,684 (including €41,684 in directors’ fees).Remuneration and benefi ts in 2004: €68,562 (including €45,562 in attendance fees).Number of shares held: 1,500.
Pierre Bellon, born on January 24, 1930
Pierre Bellon is the Chairman and founder of Sodexho Alliance, the worldwide leader in the food service industry. Created in 1966 in Marseille, Sodexho has become, in forty years, under his direction, an independent group of 324,000 employees, located across fi ve continents. On September 1, 2005, Pierre Bellon stepped down as CEO but kept his position as Chairman of the Board of Directors. Sodexho Alliance has been listed on the Paris Stock Exchange since 1983 and was listed for trading on the New York Stock Exchange in April 2002. Pierre Bellon is an Offi cer of the Légion d’Honneur, Commander of the Ordre National du Mérite and of the Brazilian order of Rio Branco and a Knight of Mérite Agricole. He was a member of the Conseil Economique et Social from 1969 to 1979. The former president of the National du Centre des Jeunes Dirigeants d’Entreprises, in 1986, Pierre Bellon founded the Association Progrès du Management. He was also Vice-Chairman of Medef from 1981 to 2005.
Director (since May 19, 2005 – current term expires in 2009)Member of the Supervisory Board (from December 19, 2001 until May 19, 2005)
Other directorships and positions held during the yearChairman of the Board of Directors of Sodexho Alliance; CEO of Sodexho Alliance (2); Chairman of the Supervisory Board of Bellon SA and Sobelnat SCA; Director of Abbar and Zainy Sodexho Catering Company; Member of the Supervisory Board of CMA CGM; Vice-Chairman of the Medef (2); Director of the Association Nationale des Sociétés par Actions – ANSA.
Other directorships held during the last 5 years CEO of Sodexho Alliance; Director of Sodexho Corporation, Sodexho Healthcare Limited, Sodexho Holdings, Sodexho Inc., Sodexho Ltd., Sodexho Nederland BV, Sodexho Services Group Ltd and Air Liquide.
Remuneration and benefi ts paid in 2005: €41,684 (directors’ fees).Remuneration and benefi ts in 2004: €35,207 (attendance fees).Number of shares held: 1,170.
Allan Chapin, born on August 28, 1941
A graduate of Yale Law School, Mr. Allan Chapin started his career at Sullivan & Cromwell in 1968 where he was named partner in 1976 then director of European operations. During his 31 years with the fi rm, he has represented various countries, commercial companies, banks and insurance companies. Before joining Compass Advisers as a New York-based partner in 2002, Mr. Chapin was the Managing Director of Lazard Frères & Co. LLC. Currently, he is also a director of both Scor and Inbev.
Director (since May 19, 2005 – current term expires in 2009)Member of the Supervisory Board (from May 21, 2002 until May 19, 2005)
Other directorships and positions held during the yearPartner in Compass Advisers LLC, Director of French American Foundation, General Security National Insurance Company, Inbev, Scor SA, Scor Reinsurance Co., Scor US and Taransay Investment Limited; Chairman of The American Friends of the Pompidou Foundation.
Other directorships held during the last 5 years Director of Calfp, Caliburn, General Security Insurance Company of New York, General Security Indemnity Co., General Security Property and Casualty Company and SCOR US Corporation; Member of the Advisory Board of Lazard Canada and Toronto Blue Jays.
(1) Directorships or positions which started during 2005(2) Directorships or positions which ended during 2005
Directorships and main duties in bold.

287 Reference document 2005
Remuneration and benefi ts paid in 2005: €39,232 (directors’ fees).Remuneration and benefi ts in 2004: €37,278 (attendance fees).Number of shares held: 500.
Luca Cordero di Montezemolo, born on August 31, 1947
A graduate of the law schools of the University of Rome and Columbia University in New York, Luca Cordero di Montezemolo began his career in 1973 as the assistant to the Chairman of Ferrari and Manager of the Formula 1 racing team which won world championship titles in 1975 and 1977. He was then appointed Director of Public Relations for Fiat in 1977, then in 1981 named Chairman and CEO of ITEDI, the holding company which manages the newspaper activities of the Fiat Group, including the daily, la Stampa. In 1984, he was appointed Chairman and CEO of Cinzano SpA in charge of the Azzurra Organisation, which was Italy’s fi rst participation in the America’s Cup. From 1985 to 1990, he was the general manager of the Italian Organisation Committee for the 1990 World Soccer Cup. Since 1991, he has been Chairman and CEO of Ferrari Spa. He is also Chairman of Confi dustria.
Director (since May 19, 2005 – current term expires in 2009)Member of the Supervisory Board (from December 19, 2001 until May 19, 2005)
Other directorships and positions held during the yearChairman of Ferrari and Fiat, Chairman of Bologna Congressi, Bologna Fiere, Confi dustria and Montezemolo & Partners; Director of Aelia, Bologna Football Club 1909 (2), Itama Cantieri Navali, Editrice La Stampa, Indesit Company, Linea Pelle, Parco di Roma and Tod’s.
Other directorships held during the last 5 years Chairman of Ferrari Deutschland, Ferrari Idea SA, Ferrari International, Ferrari Nord America, Fieg, Imprenditori Associati, Maserati and Unione Industriali Modena; Vice-chairman of ITEDI; Director of Acqua di Parma, IFI Iniziative Fieristiche Internazionali, Italiantouch, Uni-credit Banca d’Impresa and Victoria 2000.
Remuneration and benefi ts paid in 2005: €26,972 (directors’ fees).Remuneration and benefi ts in 2004: €24,852 (attendance fees).Number of shares held: 500.
Anthony Hamilton, born on October 11, 1941
A graduate of Oxford University (MA, D. Phil in physics), Anthony Hamilton started his career in London and New York as an investment banker with Schroders then Morgan Grenfell. In 1978, he joined the bank Fox-Pitt, Kelton and was appointed CEO of Fox-Pitt, Kelton Group in 1994. In March 1999, Fox-Pitt, Kelton was acquired by Swiss Re. In January 2003, he resigned from his position as Executive Chairman of Fox-Pitt Kelton and from his position as Chairman of Corporate Finance in January 2005. He is currently a director of Swiss Re Capital Markets Limited. He has also been a director of AXA Equity and Law Plc since 1993 and was appointed Chairman in 1995. In 2000, he was appointed Chairman of AXA UK Plc where he is also Chairman of the Investment Committee and the Remuneration and Nomination Committee. Since 1995, Anthony Hamilton has been a member of the AXA Supervisory Board and a director of AXA Financial Inc. (New York). He is also currently a member of the AXA Remuneration Committee.Director (since May 19, 2005 – current term expires in 2009)Member of the Supervisory Board (from May 21, 2002 until May 19, 2005)
Other directorships and positions held during the yearChairman AXA UK Plc; Director of Axa Financial Inc. (USA), Swiss Re Capital Markets Limited (UK) and Tawa UK Limited; Member of the Supervisory Board of Axa.
Other directorships held during the last 5 years Chairman, Corporate Finance of Fox-Pitt Kelton Group Limited (UK); Chairman of Axa Equity & Law plc (UK); Director of Binley Limited (UK), CX Reinsurance Company Limited (UK), Fox-Pitt, Kelton Limited (UK) and Fox-Pitt, Kelton Group Limited (UK).
Remuneration and benefi ts paid in 2005: €41,684 (directors’ fees).Remuneration and benefi ts in 2004: €40,384 (attendance fees).Number of shares held: 1,000.
(1) Directorships or positions which started during 2005(2) Directorships or positions which ended during 2005 Directorships and main duties in bold.

288
Legal and stock market information – Corporate governance
PPR 289
Philippe Lagayette, born on June 16, 1943
A graduate of Ecole Polytechnique and Ecole Nationale d’Administration (ENA), Philippe Lagayette has managed JPMorgan’s activities in France since July 1998. He is Chairman and Chief Executive Offi cer of JPMorgan et Cie SA, the French subsidiary of the JPMorgan Chase NA group. He began his career as a tax inspector for the Inspection Générale des Finances (1970). In 1974, he joined the Treasury department of the Minister of the Economy and Finance, and was appointed deputy director of that department in 1980. He became the cabinet director of the Minister of the Economy and Finance in 1981, then joined the Banque de France in 1984 as deputy governor. Appointed CEO of the Caisse des Dépôts et Consignations in 1992, he occupied this position until December 1997. Philippe Lagayette is also President of the Institut des Hautes Etudes Scientifi ques, specialised in mathematics and theoretical physics research, and President of the French American Foundation, French committee. Philippe Lagayette is an offi cer of the Légion d’Honneur and a Commander of the Ordre National du Mérite.
Director (since May 19, 2005 – current term expires in 2009)Member of the Supervisory Board (from January 20, 1999 until May 19, 2005)
Other directorships and positions held during the yearCEO of JP Morgan et Cie SA; Director of Fimalac and La Poste (2); Managing Director and Chairman of the Paris Management Commit-tee of JP Morgan Chase Bank.
Other directorships held during the last 5 years Director of Eurotunnel; Member of the Supervisory Board of Club Méditérranée; Managing Director and Chairman of the Management Commit-tee of Morgan Guaranty Trust Cie of NY (Paris branch), Chase Manhattan Bank ( Paris branch) and JP Morgan Chase Bank (Paris branch).
Remuneration and benefi ts paid in 2005: €38,006 euros (directors’ fees).Remuneration and benefi ts in 2004: €41,420 euros (attendance fees).Number of shares held: 500.
Baudouin Prot, born on May 24, 1951
A 1976 graduate of HEC, Baudouin Prot joined the Inspection Générale des Finances where he worked for four years before being appointed deputy to the CEO of energy and raw materials at the Ministry of Industry during 3 years. He joined BNP in 1983 as Deputy Director of the Banque Nationale de Paris Intercontinentale, before managing European activities in 1985. He joined the Direction Centrale des Réseaux in 1987 and was promoted to Central Director in 1990 then Deputy CEO of BNP in charge of operations in 1992. He became CEO of BNP in 1996 and Deputy CEO of BNP Paribas in 1999. In May 2000, he was appointed Director and Deputy CEO of BNP Paribas then Director and CEO of BNP Paribas in May 2003. He is a Knight of the Ordre National du Mérite and a Knight of the Légion d’Honneur.
Director (since May 19, 2005 – current term expires in 2009) Member of the Supervisory Board (from March 11, 1998 until May 19, 2005)
Other directorships and positions held during the yearDirector & CEO of BNP-Paribas; Director of Pargesa Holding SA (Switzerland) and Veolia Environnement; Member of the Supervisory Board of ERBE (Belgium); Permanent Representative of BNP-Paribas on the Supervisory Board of Accor.
Other directorships held during the last 5 years Chairman of the Board of Directors of BNP Paribas E3 and Compagnie Immobilière de France; Permanent representative of BNP Paribas on the Board of Directors of Answork, Banque Petrofi gaz, Cofi noga, and Fonds de Garantie de Dépôts; Member of the Supervisory Board of Cetelem and Eurosecurities Partners; Director of Banque National de Paris Intercontinentale, Leval Services and Pechiney.
Remuneration and benefi ts paid in 2005: €26,972 (directors’ fees).Remuneration and benefi ts in 2004: €28,994 (attendance fees).Number of shares held: 625.
2.2. Regulatory information concerny the directors
To the Company’s knowledge: • no director of the Company has been convicted of fraud during the last fi ve years;• no director of the Company has been associated with a bankruptcy, receivership or liquidation during the last fi ve years as a member
(1) Directorships or positions which started during 2005(2) Directorships or positions which ended during 2005
Directorships and main duties in bold.

289 Reference document 2005
of a management or supervisory body or as a chief executive offi cer;• no director of the Company has been convicted of any infraction that would prohibit him/her from being a board member of an issuer or
from participating in the management or operation of a company;• no incrimination and/or offi cial sanction has been pronounced against any director of the Company by statutory or regulatory authorities
(including any professional organization);• no director benefi ts from a commitment from the Company or any of its subsidiaries corresponding to elements of remuneration, in-
demnities or benefi ts of any kind whatsoever due or which could be due as a result of the commencement, termination or change of his/her duties or subsequently then to;
• no director has received any remuneration from the Company which directly controls PPR (Artémis SA) during the year;• no director has notifi ed the existence of an agreement with a major shareholder, customer or supplier of the Company pursuant to which
he/she was selected to be a board member.
3. Other information regarding the Board of Directors3.1. Honorary Chairman of the Board of Directors
In accordance with the option set forth in the Company’s Articles of Association, on May 19, 2005, the Board of Directors decided to ap-point Mr. François Pinault, founder of the PPR Group, Honorary Chairman of the Board of Directors. In this capacity, Mr. François Pinault is invited to the meetings of the Board of Directors and of the Strategy and Development Committee on a consultative basis.
3.2. Vice-Chairman of the Board of Directors
In accordance with the option set forth in the Company’s Articles of Association, on May 19, 2005, the Board of Directors decided to appoint Mrs. Patricia Barbizet Vice-Chairman of the Board of Directors. In this capacity, she may chair meetings of the Board of Directors when the Chairman is absent.
3.3. Advisers to the Board (Censeurs)
On May 19, 2005, the Board of Directors appointed the following senior managers of the Group as Advisers to the Board: Mr. Ross McIn-nes, Group Finance Director, Mr. Robert Polet, Chairman of the Management Board and CEO of Gucci Group NV, Mr. Denis Olivennes, CEO of FNAC, and Mr. Thierry Falque-Pierrotin, CEO of Redcats.
Following the departure of Mr. Ross McInnes from the Group in December 2005, the Board of Directors appointed Mr. Jean-François Palus, Group CFO, as Board Adviser with effect from January 11, 2006.
The main duties of the Advisers to the Board are to participate in meetings, to the extent needed, of the Board of Directors and of the Strategy and Development Committee and to contribute to the Board and this Committee their expertise and understanding of the va-rious business activities of the Group.
4. Management of the Group 4.1. The Executive Committee
The Executive Committee meets every month with the CEO, bringing together the major Subsidiaries (see defi nition page 295) CEOs and senior managers of PPR. The Executive Committee focuses on strategic planning of the Group’s activities, co-ordination and sharing of inter-company initiatives and monitoring cross-functional projects. Executive Committee meetings are held both at the PPR head offi ce and on a decentralised basis in France and abroad. Mr. Laurent Claquin, Director of Communications, is secretary of the Executive Committee.
(1) Directorships or positions which started during 2005(2) Directorships or positions which ended during 2005 Directorships and main duties in bold.

290
Legal and stock market information – Corporate governance
PPR 291
Members of the Executive Committee
François-Henri Pinault (since March 21, 2005)Chairman of the Management Board and then Chairman and CEO
Serge Weinberg (until March 20, 2005)Chairman of the Management Board
Christophe Cuvillier (since February 8, 2005)Chairman and CEO of Conforama Holding
Laurence DanonCEO of France-Printemps
Thierry Falque-PierrotinCEO of Redcats
Thomas Kamm (until June 30, 2005)Director of Communications and Institutional Relations
Per Kaufmann (until February 7, 2005)CEO of Conforama Holding
Philippe Klocanas (until June 30, 2005)Director of Planning and Corporate Development
Alain Luchez (since April 4, 2005)Director of Human Resources
Patrice Marteau Corporate Secretary
Ross McInnes (from July 1, 2005 until December 9, 2005)Group CFO
Denis OlivennesCEO of FNAC
Jean-François Palus (since December 13, 2005)Group CFO
Jean-Charles Pauze (until March 16, 2005)Chairman and CEO of Rexel
Robert Polet Chairman and CEO of Gucci Group NV
François Potier (until April 1, 2005)Director of Human Resources
Alain ViryChairman and CEO of CFAO
4.2. Monthly activity and budget review meetings
PPR’s Executive Management holds monthly meetings with the Subsidiaries’ CEOs and corporate secretaries to assess the evo-lution of the various businesses. This assessment is based on operational and fi nancial items, from periodic fi nancial reporting performed by the Group’s Subsidiaries and centralised by PPR Financial Management.
4.3. Group organisation and planning
Each Subsidiary draws up a medium-term plan, covering strategy, operational and fi nancial objectives that include among others the issues identifi ed by the Strategy and Development Committee in its annual guidelines intended for each Subsidiary. Strategic plan-ning covers the long-term development of the businesses, the growth outlook for the key markets and competitors’ positioning. Operating objectives are produced through strategic planning that is translated into distinct, priority action plans. The fi nancial plan refl ects the impact of these action plans on the Subsidiary’s ope-rating performance and on the fi nancial statements and fi nancial situation. Each year, a summary of these plans forms the basis of an in-depth presentation given during the strategy seminar held by the Executive Committee and the Strategy and Development Committee to discuss major strategy issues and Group projects. Each year, one Board of Directors meeting is devoted to presen-ting medium-term plans for each Subsidiary as well as their fi nan-cial summary for the Group.

291 Reference document 2005
4.4. Ethics Committee
Comprised of the CFO and the Corporate Secretary and reporting to the CEO, the Ethics Committee establishes the negative window periods relating to transactions on PPR shares, sends reminder letters concerning insider trading rules to certain Group executives and senior managers and clean up the lists of temporary and permanent insiders in accordance with the General Rules of the Autorité des Marchés Financiers (French Financial Markets Authority). The members of the Group’s Executive Committee are required to consult the Ethics Committee before trading in Company shares.
4.5. Committee for Ethics and Corporate Social Responsibility
Reporting to the Executive Committee, the Committee for Ethics and Corporate Social Responsibility (CECSR) is comprised of executives from PPR and other Group companies who contribute their experience in various areas: purchasing, human resources, risk prevention, communications, sustainable development, IT, legal affairs and business management. The Committee also includes a member, who is not an employee of the Group, specialised in corporate social responsibility and business risks. The main role of the Ethics and Social and Environmental Responsibility Committee is, for all of these topics, to gather relevant information, review the strategy for the Group’s existing or anticipated policies in this area, and consider the means needed to generate and implement them. The Committee can also be consulted by any employee of the Group with respect to any issue falling under the scope of the Code of Business Conduct.
5. Report of the Chairman of the Board of Directors on the conditions for the preparation and organisation of the work of the Board and internal control procedures implemented by the “PPR Company”Pursuant to Article L. 225-37, paragraph 6 of the Commercial Code, this report discusses the conditions pursuant to which the work of the Board of Directors is prepared and organised, as well as the internal control procedures implemented by the Company.
The second part of this report concerning the internal control procedures implemented by the Company was reviewed by the Audit Com-mittee on March 7, 2006. The complete report was reviewed by the Board of Directors at its March 8, 2006 meeting.
5.1. Conditions for the preparation and organisation of the work of the Board of Directors
The conditions for the preparation and organisation of the work of the Board of Directors are defi ned by the Law, the Company’s Articles of Association, the Internal Rules of the Board and of its specialised committees.
The Board is made up of nine directors with extensive experience in the areas of corporate strategy, fi nance, accounting, distribution and the management and supervision of commercial and term fi nancial companies. In accordance with the recommendations of the Bouton Report, the term of offi ce of directors is four years which term can be renewed.
Pursuant to its Internal Rules and the Law, the Board of Directors meets at least four times a year. In order to help the directors prepare for the subjects to be examined at each meeting, they receive in advance a fi le containing comprehensive information by topic on all agenda items.
In order to strengthen its functional procedures and to take into account the recommendations of the Viénot and Bouton reports, the Internal Rules of the Board of Directors set forth and formalise the rules governing the organisation and functional modalities of the Board of Directors and the missions of its four committees: the Audit Committee, the Remuneration Committee, the Appointments Committee and the Strategy and Development Committee (See Internal Rules).

292
Legal and stock market information – Corporate governance
PPR 293
The Internal Rules also reiterate the applicable regulatory provisions and establish restrictions on the trading of Company shares by defi -ning the negative window periods and requiring the reporting of all dealings in Company shares. They defi ne the frequency and modalities of Board meetings, and provide for attendance at Board meetings by videoconference and/or teleconference. The Internal Rules also include the principle of the regular assessment of the Board’s activities and defi ne the criteria used to allocate directors’ fees.
With respect to the Board of Directors’ statutory role to determine the strategy of the Company and ensure its implementation, and without prejudice to the legal provisions governing the authorisations that the Board is required to grant (regulated agreements, endor-sements, pledges and guarantees, divestments or sale of real property, etc.), the Company’s Articles of Association provide that certain decisions of the CEO by virtue of their nature or signifi cance must obtain the prior approval of the Board of Directors.
The Board of Directors carefully examines such transactions.
Independence of directors
In order to satisfy corporate governance principles, the Board of Directors follows the recommendations set forth in the Bouton report. Accordingly, to determine whether or not a director is independent and avoid any possible confl icts of interest, the Board has adopted the criteria set forth in this report. With regard to these criteria and after review by the Appointments Committee, the Board of Directors has designated the following directors as independent, without prejudging the independence of other directors: Messrs. René Barbier de La Serre, Pierre Bellon, Allan Chapin, Luca Cordero di Montezemolo and Anthony Hamilton, i.e. more than half of the directors sitting on the Board. The Bouton report recommends that at least one-third of the directors be independent in companies having a controlling shareholder. Furthermore, the Board has duly noted that if the PPR Group has ordinary and usual business relations with the BNP group and the JPMorgan group, the activities of these two groups on behalf of the PPR Group, with regard, in particular, to their signifi cance compared to all of their activities, cannot infl uence the independence of Messrs. Baudouin Prot and Philippe Lagayette respectively, as members of the PPR Board of Directors.
Audit Committee
Subject to the functions of the Board of Directors, the main role of the Audit Committee is to review the annual and half-yearly fi nancial statements, to ensure that the Company’s accounting methods are appropriate, permanent and reliable, and to review the effective im-plementation of internal control and risk management procedures.
The Audit Committee is made up of three directors of the Board: Mr. René Barbier de La Serre, Chairman, Mrs. Patricia Barbizet and Mr. Anthony Hamilton.
In accordance with the principles set forth in the Bouton Report, two-thirds of the members of the Committee are independent according to its independence criteria.
Remuneration Committee
The main role of the Remuneration Committee is to make proposals to the Board of Directors on the remuneration of the CEO and the method for dividing the directors’ fees allocated by the Shareholders’ Meeting to the Board of Directors. In addition, the Committee is informed of all remunerations and benefi ts paid or deferred, including in particular options, bonus shares and/or similar benefi ts to the members of the Executive Committee of the PPR Group, including retirement and all other benefi ts of any kind.
The Remuneration Committee is made up of six directors: Mr. Philippe Lagayette, Chairman, Mrs. Patricia Barbizet and Messrs. René Barbier de la Serre, Pierre Bellon, Allan Chapin and François-Henri Pinault.
One-half of the members of the Remuneration Committee are independent according to the applicable independence criteria used.
The Bouton report recommends that the Remuneration Committee be comprised of a majority of independent directors and that no corporate offi cer be a member. The remuneration policy in favour of the members of the Executive Committee being an important compo-nent of the Remuneration Committee’s work, it was therefore judged to be in the interest of the Company and for the proper functioning of the Committee that the CEO be a member of the Committee. Moreover, the CEO does not participate in deliberations of the Committee regarding his remuneration.

293 Reference document 2005
Appointments Committee
The role of the Appointments Committee is to examine proposals for appointments to the Board of Directors before they are presented to the General Shareholders’ Meeting for approval or to the Board of Directors in the event of a vacancy. The Committee is also responsible for assessing the independence of the Directors on the basis of the criteria defi ned by the Board.
The Appointments Committee is made up of three Directors: Mrs. Patricia Barbizet, Chairman, and Messrs. Baudouin Prot and Allan Chapin.
One-third of the members of the Appointments Committee are independent according to the applicable independence criteria.
The Bouton Report recommends that the Appointments Committee be comprised of a majority of independent directors as well as the Board of Directors itself; however, the latter percentage is reduced to only one-third in companies having a controlling shareholder.
Strategy and Development Committee
The purpose of the Strategy and Development Committee is, subject to the duties of the Board of Directors, to identify, study and support the initiatives for strategic development of the PPR Group.
The Strategy and Development Committee is comprised of four directors: Mrs. Patricia Barbizet, Chairman and Messrs. Pierre Bellon, Philippe Lagayette and François-Henri Pinault.
Mr. François Pinault, Honorary Chairman of the Board of directors is also an honorary member of the Strategy and Development Com-mittee and in this capacity is invited to participate at meetings of the Committee on a consultative basis.
Activity of the Board of Directors in 2005
Between May 19 and December 31, 2005, the Board of directors met four times, with an average attendance rate of 75%.
Date Number of directors present(Attendance rate)
May 19, 2005 6/9 (67%)
July 6, 2005 7/9 (78%)
September 7, 2005 7/9 (78%)
October 21, 2005 7/9 (78%)
The work of the Board of Directors mainly involved reviewing the half-yearly fi nancial statements and assessing strategic issues.
At its May 19, 2005 meeting, the Board of Directors made the following appointments: Mr. François-Henri Pinault, Chairman of the Board of Directors and CEO of the Company; Mr. François Pinault, Honorary Chairman of the Board of Directors and honorary member of the Strategy and Development Committee, Mrs. Patricia Barbizet, Vice-Chairman of the Board of Directors; and Messrs Ross McInnes, Robert Polet, Denis Olivennes and Thierry Falque-Pierrotin, Advisers to the Board of the Directors.
During that meeting, the Board also set the authorisations and delegated powers to the CEO in respect of guarantees and endorsements, sales of real estate and bond issues. The Board also created four specialised committees (Audit Committee, Remuneration Committee, Appointments Committee, Strategy and Development Committee).
On the recommendation of the Remuneration Committee, the Board established the CEO’s remuneration, reviewed the remuneration of members of the Executive Committee and granted various share subscription option plans and bonus shares to certain senior managers of the PPR Group.
The Board of Directors also approved its internal regulations as well as those of its four committees.

294
Legal and stock market information – Corporate governance
PPR 295
At its various meetings during the year, the Board of Directors heard reports from the managers of the Distribution and Luxury Goods divisions on specifi c points and the strategic issues of their company.
After review by the Audit Committee, the Board of Directors, at its September 7, 2005 meeting, approved the fi nancial statements and the reports for the semester ended June 30, 2005.
The Board of Directors also devoted one full meeting to presentations by each CEO of the major Subsidiaries of their medium-term plan and their Group fi nancial consolidation. Activity of the Board of Directors in 2006 until March 8
Between the beginning of the year and March 8, 2006, the Supervisory Board met twice with an attendance rate of 78%. The Board took due note of the departure from the Group of Mr. Ross McInnes, CFO and Board Adviser, with effect from December 9, 2005. The Board also appointed Mr. Jean-François Palus, Group CFO, as Board Adviser.
At its meeting of January 11, 2006, the Board deliberated on the 2006 budget and decided to decrease the share capital by way of the cancellation of 124,514 treasury shares.
The Board also distributed the 2005 directors’ fees according to the modalities set forth in its Internal Rules. The Board of Directors decided that the distribution basis for 2005 would be half of the total amount of €570,000 allocated by the Shareholders’ Meeting, or €285,000. The total amount of directors’ fees thus allocated with respect to 2005 amounts to €253,846 including the special portion of €11,500 in favor of the Chairman of the Audit Committee.
After examination by the Audit Committee, during its March 8, 2006 meeting the Board of Directors approved the annual fi nancial sta-tements and reports for 2005. Pursuant to the recommendation of the Remuneration Committee, the Board also fi xed the following elements of the remuneration of the CEO: fi xed 2006 remuneration and variable remuneration for 2005. Variable remuneration was determined based on 2005 performance compared to the Group’s consolidated operating free cash fl ow objective. Moreover, the Board reviewed the remuneration of members of the Executive Committee.
Assessment of the Board of Directors
In accordance with its Internal Rules, the Board of Directors conducted its annual evaluation for 2005 by means of a questionnaire sent to each director. The results of this evaluation were discussed during the Board of Directors’ meeting of March 8, 2006. This procedure designed to evaluate the work of the Board of Directors in 2005 confi rmed that major issues were properly reported, examined and discussed during meetings under suitable conditions, and the contribution of each member to the work of the Board was assessed
Activity of the Audit Committee from May 19, 2005 to March 8, 2006
The Committee met twice in 2005 (100% attendance). The fi rst meeting held in July was devoted to various topics included in the scope of the Committee’s duties, in particular, general risks, organisation of the audit committee for each Group company, fi nancial and treasury policy, accounting standards, the audit plan and monitoring and follow-up of internal audit assignments performed at the Company and Group levels. The September meeting was focused mainly on reviewing the fi nancial statements for the semester ended June 30, 2005. During that meeting, the Committee questioned the Statutory Auditors, outside of the presence of the CFO and the Company’s accoun-ting teams, regarding their review of the fi nancial statements.
Between the beginning of the year and March 8, 2006, the Committee met twice (100% attendance). It reviewed the 2005 annual fi nancial statements as presented by Executive Management. The review covered the scope of consolidated companies, the auditing procedures in effect, as well as any signifi cant off-balance sheet risks or commitments. To this end, the Committee interviewed representatives of the Company’s fi nance and accounts departments and the internal audit department. The Committee also discussed issues with the Statutory Auditors accounting teams concerning their reports on the fi nancial statements and other elements of the annual report. The work and the fees of the Statutory Auditors’ fees were also reviewed.
The Committee also reviewed the services provided by Artémis to PPR during 2005 pursuant to the terms of an assistance and advisory services agreement. Following this assessment, the Committee approved the lump sum contractual amount for 2005. In keeping with corporate governance principles, Mrs. Patricia Barbizet did not vote on this issue.
The Audit Committee submitted the results of its work and proposals to the Board of Directors.

295 Reference document 2005
Activity of the Remuneration Committee from May 19, 2005 to March 8, 2006
The Committee met once in 2005 (83% attendance rate) to inform itself of the general remuneration policy in favour of the members of the Executive Committee and the allocations of options to executives.
Between the beginning of 2006 and March 8, the Committee met twice (92% attendance rate).
The Committee was informed by Executive Management of the conditions relating to the departure and hiring of various members of the Executive Committee and established its recommendations regarding the allocation of directors’ fees for 2006.
The Committee also prepared recommendations to the Board of Directors regarding the 2006 fi xed remuneration and 2005 variable remuneration in favour of the Chairman and CEO.
Moreover, Executive Management informed the Committee of the elements comprising the remuneration of Executive Committee members, notably 2006 fi xed remuneration and 2005 variable remuneration. The latter remuneration is determined based on the 2005 performance compared to the Group consolidated operating free cash fl ow, operating income and ROCE objectives as well as certain qualitative criteria.
The Remuneration Committee submitted the results of its work and recommendations to the Board of Directors.
Activity of the Appointments Committee from May 19, 2005 to March 8, 2006
The Committee met once at the beginning of 2006 (100% attendance rate) to make recommendations to the Board of Directors regarding independence criteria to be adopted and the determination of the independent directors in accordance with the proposed criteria.
The Appointments Committee submitted the results of its work and recommendations to the Board of Directors.
Activity of the Strategy and Development Committee from May 19, 2005 to March 8, 2006
The Strategy and Development Committee met once in 2005 (75% attendance rate) to discuss the medium-term plans (2006 to 2008) of the Subsidiaries.
Between the beginning of the year and March 8, the Committee met once in 2006 (100% attendance rate) to prepare guidelines whose purpose is to assist the Subsidiaries in the preparation of their medium-term plans (2007 to 2009).
5.2. Internal control procedures implemented by the Company
PPR is the holding company of the PPR Group, European leader in specialised distribution and the world’s third leading player in the luxury goods industry. The main consolidated companies include Gucci Group, Printemps, Redcats, Fnac, Conforama and CFAO, collecti-vely refered to as the “Subsidiaries” and each as “Subsidiary”.
As a holding company, PPR’s main activity consists in organising and managing its investments, stimulating the development of its Sub-sidiaries, coordinating the fi nancing of their activities, ensuring support and communication functions and developing cross-functional resources for the entire PPR Group, notably in the area of purchasing (PPR Purchasing, Buyco, and GNX).
Internal control within the PPR Group
Defi nition of internal control
Given the decentralisation of functions and responsibilities, the internal control system is structured around a number of policies, proce-dures and practices which aim to ensure that the necessary measures are taken to control the risks that could have a signifi cant impact on the Company’s fi nancial position or the achievement of its objectives. The internal control process, formalised pursuant to the 2003 Financial Security Act, draws on the international COSO Report framework.
Internal control is a process coordinated by Executive Management under the supervision of the Board of Directors, implemented by senior managers and all employees, in order to provide reasonable assurance as to achieving objectives that fall into the following categories:• performance and optimisation of operations;• reliability of fi nancial information;• compliance with laws and regulations in force.

296
Legal and stock market information – Corporate governance
PPR 297
It is important to note that, regardless of the quality of internal control and the degree to which it is applied, it can provide only a reaso-nable assurance as to whether the above objectives can be met.In fact, the probability of meeting them is subject to the limits inherent in any internal control system, such as:• human error or malfunctions occurring when decisions are made or when they are applied;• deliberate collusion amongst several individuals, enabling them to elude the control system;• cases where a control is put in place and even maintained when it is more costly than the risk it is supposed to address.
Furthermore, it is understood that in pursuing the objectives indicated above, the Company is faced with events and uncertainties beyond its control (unexpected changes in the markets and in the competitive environment, unexpected changes in the geopolitical situation or in the assessment of the effects of such changes on the organisation, etc.).
Internal control environment
Internal control at the PPR Group is structured in order to help ensure that the parent company and consolidated fi nancial statements provide a fair and accurate view of its fi nancial position and offer a reasonable assessment of risks of any nature the Company may face. In order to do so, this process is applied at every level of the organisation within each Subsidiary and is overseen by the operating and functional departments.
PPR Group organisation
Each PPR Group Subsidiary manages directly the operating aspects of its own activity.
The PPR Group Executive Committee, the executive management body, is comprised of the CEOs of each Subsidiary and the following operating departments: corporate secretary’s department, human resources, communications and fi nance.The Executive Committee, which meets on a monthly basis as and when required, in accordance with the policies of the Strategy and Development Committee:• draws up and coordinates the Group’s operating strategy,• defi nes the priorities with objectives by Subsidiary and the main functional projects,• develops the synergies between Subsidiaries,• and submits acquisitions/divestments to the Board of Directors.
The PPR Group’s strategy and objectives are discussed annually through a number of medium-term plans and budgets of operating units of each Subsidiary.
Within each Subsidiary, management defi nes for employees its operating policies and procedures which aim to harmonise working methods and improve the effi ciency of the operations.
Representatives of the Subsidiaries meet regularly in committees to share information on operations and strategy, exchange skills and deploy best practices throughout the Group, for example, through strategic committees coordinated by PPR’s Strategy and Planning De-partment (E-commerce Committee and Customer Marketing Committee) or Country Committees which bring together senior managers from each Subsidiary with operations in a given foreign country.
This organisation is strengthened by the centralisation of technical expertise at the PPR level and applied at the Group level:
• The Planning, Strategy and Information Systems Department coordinates the Group’s annual planning process by contributing to the defi nition of the strategy and operations set out in the medium-term plans of the Subsidiaries and assists the Subsidiaries by providing them with a number of support services (market intelligence, research, etc.). This department participates in the technical and fi nancial assessment carried out by Subsidiaries when selecting IT solutions, notably when the budgets and medium-term plans are defi ned and also manages and coordinates all of the Group’s cross-functional projects. It runs the IT Club which brings together the IT departments of the Subsidiaries.
• The Communications Department and the Financial Communication Department oversee the external communication of the Group (fi nance, strategy, labour, etc.) with the exception of customer communication (sales, advertising, marketing, etc.) which is defi ned and managed at the Subsidiary level.

297 Reference document 2005
• The Finance and Treasury Department ensures the implementation of interest rate and currency derivative transactions and coordinates the cash management of the Subsidiaries. It provides instructions in terms of the allocation of bank transactions, coordinates Group bids and ensures consistency between published fi nancial information and policies governing interest rate, currency and liquidity risk mana-gement. Almost all of the fi nancing is set up by PPR or PPR Finance. Exceptions are analysed on a case-by-case basis according to specifi c opportunities or restrictions and require the approval of PPR.
• In addition to its functions at the Company level, the Legal Department assists the Subsidiaries on signifi cant legal matters and coordinates research and analysis on common subjects of interest to the Subsidiaries or on subjects of particular interest to the Group.
• The Tax Department coordinates the Group’s tax policy, advises and assists the Subsidiaries on all issues related to tax law as well as in the implementation of tax consolidation in France.
• The Real Estate Department manages and coordinates signifi cant real estate deals for the entire Group.
• The Insurance Department is responsible for implementing and monitoring the Group’s various insurance policies.
Group principles and values
The PPR Group ethical principles are listed in the Code of Business Conduct, distributed to each employee since 2004.
The Code contains the Group’s commitments and rules of conduct towards• its customers and consumers,• its employees,• its shareholders and fi nancial markets,• its business partners,• the environment and society.
In addition to the knowledge that each employee is required to have of the commitments and principles contained in this Code, a specifi c monitoring organisation was set up to advise employees and determine the ways and means of improving the application of the Code.
A Committee for Ethics and Corporate Social Responsibility, (CECSR) reporting to the PPR Executive Committee, was set up, comprising at least one representative from each Subsidiary, PPR functional executives and a third-party expert.The primary role of this Committee is to assist the Subsidiaries in implementing this Code and formulate recommendations on the resul-ting questions in addition to those submitted to it by the PPR Group employees.
To ensure the application of this Code and take into account the PPR Group’s decentralised structure, each Subsidiary appoints a cor-respondent to the Ethics Committee. This correspondent is the designated contact of employees for all issues regarding the application of the Code of Business Conduct.Furthermore, the Subsidiaries may set up additional organisations, particularly the designation of correspondent agents in certain coun-tries or entities in order to bring these correspondents closer to the teams.
Human resources policy
As for human resources management, the Group implements policies in order to improve professional performance and personal deve-lopment, applying high standards of employee dialogue and participation in the business, both in terms of the choice of union represen-tation and sharing development results, and has implemented measurement tools to assess its human resources environment (biennial opinion polls).
PPR also oversees the proper allocation of resources within the Group, notably through regular appraisals of positions, remuneration levels, skills and staffi ng. The employee succession plans for key positions also contribute to the development of the organisation.

298
Legal and stock market information – Corporate governance
PPR 299
Continued analysis of internal contr ol procedures
In accordance with the recommendations of the COB, in particular that of January 16, 2003 regarding the preparation of the 2002 reference documents and the recommendation of the AMF of January 23, 2004, the management of the various risks factors is presented in the PPR Annual Report.
The internal control procedures implemented by PPR senior managers and incorporated into their day-to-day functions as described above are part of an ongoing strategy designed to identify, assess and manage company risks.
In this regard, and as anticipated in our previous Annual Report, PPR continued the analysis of the internal control procedures used in its activities with the aim of assessing their adequacy and effectiveness.
The risk management department of an international auditing fi rm, which is neither a Statutory Auditor of the PPR Group, nor any of its participated in the analysis.
The purpose of this approach is to further improve the management and effi ciency of its operations in order to achieve both general and specifi c Group objectives and to specify the role of the operating departments in the area internal control.
The methodology applied is based on the following principles:• Interviews were held based on questionnaires with approximately 200 key operating staff in major entities involving 650 points of control
according to the segmentation by key process done in 2003:- strategic processes,- operating processes,- support processes.
• The approach was presented to the Audit Committee of the PPR Board of Directors and the PPR Executive Committee.• A summary of these interviews was submitted to the Executive Management as well as to the Audit Committees of each Subsidiary.
A summary for the entire Group was submitted to the Audit Committee of the PPR Board of Directors.
At this stage, the internal control documentation resulting from these questionnaires, communicated to each operating manager in the Subsidiaries• serves as an additional indicator for these managers in the assessment of the quality of the internal control procedures for which they
are responsible,• makes it possible to harmonise the level of internal control applied within the Group and for all activities to benefi t from best practices,• makes it possible to launch action plans for improvement, if necessary,• contributes to the establishment of the Group’s audit plan and improves both the scope and effi ciency of internal audit assignments.
Internal control management
Internal audit
The internal audit resources within the PPR Group refl ect the Group’s organisation.
• The Group’s internal audit, located at the PPR level and reporting to the Corporate Secretary, is responsible for the coordination of each Subsidiary’s Audit Department, the communication of methodologies or best practices and performs audits on transversal issues at the Group level. In 2005, the Group’s internal audit undertook an analysis of exposure to the ricks of fraud and an audit of physical inventory procedu-res. This analysis enhanced the management of internal control in these areas. An audit of the inventory measurement and impairment procedures was initiated in the last quarter of 2005.Since 2003, in accordance with the Financial Security Act, the Group’s internal audit has coordinated the analysis of internal control proce-dures as mentioned in the previous paragraph, based on self-appraisal questionnaires and interviews with the main operating managers.
• The Internal Control Departments located within each Subsidiary of the Group and reporting to each of their Executive Management, verify the internal control procedures set up by other departments and perform operational and fi nancial audits within the companies controlled by the Subsidiary.The main issues identifi ed in 2005 were made known to the Audit Committees of each Subsidiary. Each of the Commitees concluded that the issues identifi ed were non-signifi cant at Group level and familiarised themselves with the action plans set up by the relevant entities.

299 Reference document 2005
The analysis of the internal control procedures, initiated in 2003 in accordance with the Financial Security Act, is the responsibility of each Internal Audit Department within the scope of its Subsidiary.
In addition to these missions, all internal audit resources within the PPR Group are responsible for promoting internal control in all Company processes and activities, whether operational or fi nancial, and whether they concern stores, warehouses or head offi ces, distribution or manufacturing.
To date, there are 39 internal audit employees in the PPR Group.Their rules of conduct are described in the Audit Charter to which they refer.Generally speaking,• At the end of each mission, fi ndings and recommendations are presented to the managers of the audited area or areas,• Any agreements or disagreements made known by the audited parties concerning the proposed recommendations are included in the
fi nal report which outlines a possible action plan, responsibilities and the implementation timeframe,• Line staff are responsible for implementing recommendations,• Internal audit is responsible for verifying their implementation.
The internal audit activity is performed in accordance with the Audit Committees and the results of the work performed by the Statutory Auditors.Audit plans are prepared by the Internal Audit Departments using a risk-based approach and take into account the specifi c requests of Executive Managements and/or the other Operational Departments.The Internal Audit Departments present the audit plan’s progress at least twice a year to their Audit Committee.
Managerial coordination
All PPR Group levels have day-to-day responsibilities in terms of internal control procedures, in particular • At the Boards of Directors’ level, which rely on the work carried out by the Audit Committees, whose role includes overseeing the ef-
fective implementation of internal control procedures and managing risk according to the operating procedures outlined in their internal rules;
• At the Audit Committees’ level, the members of which come from the different Boards of Directors. These Committees have been es-tablished based on the Audit Committee of the PPR Board of Directors and are organised according to the specifi c risk characteristics of the different businesses, thereby enhancing the pyramidal structure of the internal control procedures within the Group;
• At the Financial Control Departments’ level, which contribute to management through the coordination of the planning and reporting processes and are responsible for monitoring the activities within their scope.
Some Company functions are also based on procedure manuals which outline the best practices to be applied within the scope of their respective businesses, for example in terms of accounting, fi nancial or cash management procedures.
Authorisations
At the PPR level, a structure has been set up that defi nes the area of responsibility of each major operational or functional department and any related authorisations in the other entities of the PPR Group.
For example, investments within the Group are subject to acceptance thresholds according to type:• strategic investments exceeding €15 million are subject to review by the Executive Committee of PPR. Over and above a threshold of
€500 million, they are subject to the approval of the PPR Board of Directors.• for operational investments, the Group determines a budget for the upcoming year and verifi es that the expenditure incurred does not
exceed the predetermined amount.
In certain Subsidiaries, the authorisation process was reviewed in 2005, particularly by the Legal and Human Resources Departments, in coordination with the internal audit teams. This analysis will be extended to all Subsidiaries in 2006.

300
Legal and stock market information – Corporate governance
PPR 301
Description of the internal control procedures relating to the preparation of accounting and fi nancial information
Organisation of the accounting and management function
Accounting and fi nancial information is prepared by the Finance Department, which supervises the Financial Control Department, the Finance and Treasury Department, the Tax Department, the Financial Reporting and Strategy Department in addition to the Development division within PPR.
The production and analysis of fi nancial information is based on a set of fi nance management procedures including:
• Medium-term plans, which measure impacts on the Group’s fi nancial structure and management. They also serve as a basis for the Group’s annual assessment of the carrying value of assets in relation to the various business units.
• Budgets, drawn up on the basis of discussions between the operating departments and the Group’s Executive Management, are broken down into two phases: a budget describing the fi nancial structure and operating action plans is defi ned in the fourth quarter of the previous year and approved early in the fi rst quarter of the following year, taking into account signifi cant intervening events, where applicable.
• The Group’s reporting, which monitors company performances throughout the year using specifi c indicators whose consistency and re-liability have been reviewed by the Financial Control Department. Since 2004, the Group’s reporting is based on a new consolidation/re-porting tool that provides an additional level of security in the transmission of fi nancial data as a result of a more complete management process (central administration of the database including data validation levels at each consolidation threshold) as well as new functions that can be used to develop additional indicators. The Financial Control Department also ensures that the accounting methods applied by the companies are consistent with Group rules and performs a comparative analysis with the budget and the previous year’s fi gures in conjunction with the fi nancial controllers of the companies.
• PPR’s Executive Management and the CEOs and corporate secretaries of Group Subsidiaries hold a meeting every month to assess Subsidiary activities on the basis of fi nancial results and operations.
• The statutory consolidation of the fi nancial statements is prepared at the end of June and December using the Group’s consolidationtool. The Subsidiaries’ consolidation packages are validated by the Statutory Auditors and signed by the Subsidiaries’ CFOs or accounting managers who are accountable for the reliability of their content. Before each consolidation, the Group’s Financial Control Department provides the Subsidiaries with instructions specifying the list of reports to be sent, the common assumptions to be used and the specifi c points to be taken into account.
• The Group regularly monitors changes in the off-balance sheet commitments of its Subsidiaries. This check is carried out as part of the statutory consolidation process whereby Subsidiaries are required to provide an exhaustive list of their commercial or fi nancial commit-ments along with a follow-up from year to year.
Statutory auditors
The role of the Statutory Auditors is to annually certify the consistency, reasonableness and fair presentation of the parent company fi nancial statements and the Group’s consolidated fi nancial statements and issue a limited review report on the Group’s half-yearly consolidated fi nancial statements.
Since 2005, audit engagements have been performed by only two statutory auditors: Deloitte and KPMG.
The main issues covered by the auditors are as follows:
• identifi cation of risk areas and performance of tests by sampling in order to validate the consistency, reasonableness and fair presentation of the fi nancial statements with regard to their company or consolidated materiality level,
• validation of the main accounting treatments and options throughout the year, in coordination with the management of the Subsidiaries and PPR,
• application of the accounting standards defi ned by PPR for all its Subsidiaries,• preparation of an audit report for each consolidated Subsidiary in order to certify the PPR consolidated fi nancial statements, including
comments on internal control,• presentation of a general summary of the PPR Group submitted to management and the PPR Audit Committee,• preparation of reports for the PPR shareholders.
Their reports appear in the reference document.

301 Reference document 2005
Transition to IFRS
Pursuant to European Regulation No. 1606/2002 of July 19, 2002, PPR adopted international accounting standards (IFRS) applicable as of December 31, 2005 in accordance with IFRS 1 (fi rst-time adoption), with comparative fi gures for 2004.
In order to publish this comparative information, PPR prepared its IFRS restated consolidated fi nancial statements for 2004, which were described in a reconciliation note presented in the notes to the consolidated fi nancial statements.
The consolidated fi nancial statements for the year ended December 31, 2005, prepared in accordance with IFRS and approved by the PPR Board of Directors’ meeting of March 8, 2006 include the impact of the most recent amendments to the standards as approved by the European Union as of December 31, 2005.
Analysis of internal control procedures of the PPR Group
Since 2003, an analysis of the internal control procedures has been formalised every year in order to update the Group’s internal controls from a strategic, operating and fi nancial perspective and to ensure that they comply with the regulatory changes recommended by the Autorité des Marchés Financiers (AMF, French Financial Markets Regulatory Authority).
Documentation of process controls
In 2005 the sales, fi nance/accounting/management and information systems processes that were selected by the Executive Commitee were documented in a fl ow chart, so as to identify and describe the key controls.
Self-appraisal and improvement plans
Every year, since 2003, self-appraisal questionnaires are completed in order to identify internal control procedures.
In 2006, the review of the fi nancial process will be enhanced both in terms of documentation and key control analysis through interviews and tests.
Development of the analysis
This analysis will be broadened to include a wider coverage of business activities as well as a higher level of detail of information and applied to all Group processes by:• increasing the number of appraisals,• continuing to document the main processes,• performing tests on key processes,• identifying areas of improvement,• implementing corrective measures where necessary.
Progress reports will be sent to the PPR Audit Committee and Board of Directors on a regular basis.
The Chairman of the Board of Directors

302
Legal and stock market information – Corporate governance
PPR 303
6. Statutory Auditors’ report prepared pursuant to Article L. 225-235 of the French Commercial Code on the report prepared by the Chair-man of the Board of Directors of PPR S.A. with respect to the internal control procedures for the preparation and treatment of fi nancial and accounting information Year ended December 31, 2005
Dear Shareholders,
In our capacity as statutory auditors of PPR S.A., and pursuant to Article L. 225-235 of the French Commercial Code, we hereby report to you on the report prepared by the Chairman of your company in accordance with Article L. 225-37 of the French Commercial Code for the year ended December 31, 2005.
In his report, the Chairman reports, in particular, on the conditions for the preparation and organisation of the Board of Directors’ work and the internal control procedures implemented by the company.
It is our responsibility to report to you our observations on the information and assertions set out in the Chairman’s report on the internal control procedures relating to the preparation and treatment of fi nancial and accounting information.
We performed our procedures in accordance with professional guidelines applicable in France. These require us to perform procedures to assess the fairness of the information set out in the Chairman’s report on the internal control procedures relating to the preparation and treatment of fi nancial and accounting information. These procedures notably consisted of:
• obtaining an understanding of the objectives and general organisation of internal control, as well as the internal control procedures relating to the preparation and treatment of fi nancial and accounting information, as set out in the Chairman’s report;
• obtaining an understanding of the underlying work performed to support the information given in the report.
On the basis of our procedures, we have no matters to report on the information given in respect of the internal control procedures relating to the preparation and treatment of fi nancial and accounting information, set forth in the report of the Chairman of the Board of Directors, prepared in accordance with the last paragraph of Article L. 225-37 of the French Commercial Code.
Neuilly-sur-Seine and Paris-La Défense, March 9, 2006The Statutory Auditors
Deloitte & Associés KPMG Audit
Department of KPMG SA
Jean-Paul Picard Antoine de Riedmatten Patrick-Hubert Petit Hervé Chopin

303 Reference document 2005
7. Internal Rules of the Board of DirectorsDuties and powers of the Board of Directors
The Board of Directors performs the duties and exercises the powers entrusted to it in accordance with applicable law and the Articles of Association.
The Board determines and assesses the strategies, objectives and performance of the Company and ensures their implementation. Subject to the powers expressly attributed to the shareholders and within the scope of the corporate purpose, the Board may review any issue involving the proper functioning of the Company and oversees the management of the business.
The Board performs any procedures and verifi cations that it deems appropriate.
The Board may grant, with or without the possibility of sub-delegating, all authorisations to its Chairman or any other corporate offi cers that it shall designate, subject to the limitations provided for by law.
Board of Directors’ meetings
The Board of Directors meets at least four times a year and as often as necessary, in the interests of the Company. Meetings are con-vened by the Chairman or at the request of at least one-third of the directors. Meetings take place at either the registered offi ce, or in any other location indicated in the notice of meeting. The meeting may be convened by any appropriate means, even verbally, by the Chairman, the Board Secretary (at the request of the Chairman), the Vice-Chairman (if the Chairman is unavailable) or the senior most director (if the Vice-Chairman is unavailable).
The Chairman decides on the Board’s agenda.
The Chairman ensures that the Company provides to its directors in due time before all meetings any relevant information and documents and takes into consideration, as the case maybe, their suggestions to enable the Board to understand and deliberate on all issues for which it is responsible in the most appropriate conditions.
Any person who participates in Board meetings is required to keep strictly private all confi dential information and data presented as such by the Chairman, and is obliged to keep discrete all information relating to the business activities of the Board and the Group.
Pursuant to Article L.225-37 of the Commercial Code, Board members who take part in a Board meeting by videoconference and/or teleconference, under the conditions authorised by applicable regulations as of the date of the meeting, are deemed to be present for the purposes of calculating the quorum and the majority. However, this provision is not applicable in the case of the decisions specifi cally exclu-ded by law, notably those set forth in Articles L. 232-1 and L. 233-16 (preparation of the annual parent company and consolidated fi nancial statements as well as the reports mentioned in these articles) of the Commercial Code. The videoconference and teleconference facilities used must ensure that the directors participating in the meeting can be identifi ed and guarantee their participation in the deliberations.
Members of the Board of Directors, who, while attending a meeting, do not wish to cast a vote, are counted in the quorum and are not counted in the vote calculation.
Authorisations of the Board of Directors
In accordance with the Articles of Association and without prejudice to the legal provisions relating to authorisations which must be gran-ted by the Board of Directors (regulated agreements, endorsements, pledges and guarantees, disposal of shareholding interests or sale of real estate assets), the following require the prior authorisation of the Board of Directors:• questions and transactions having a substantial impact on the Group’s strategy, fi nancial position or scope of activity,• except when decided to the contrary by the General Shareholders’ Meeting, issues of securities, regardless of their form, which could
result in a modifi cate of the Company’s share capital,• the following transactions by the Company or any other entity controlled by the Group when the amount set annually by the Board of
Directors is exceeded:- any investment or divestment, including the acquisition, disposal, or exchange of shareholding interests in any existing or future
companies, - the purchase or sale of any real estate of the Company.

304
Legal and stock market information – Corporate governance
PPR 305
Committees
In accordance with its concern for sound corporate gouvernance and in order to enable it to carry out its functions in compliance with legal provisions, the Board of Directors, has established four committees: the Audit, Remuneration, Appointments and Strategy and De-velopment Committees. The Chairman of the Board of Directors may in all circumstances discuss issues with these committees.
Each committee defi nes its operations while adhering to the collegial principle of the Board of Directors, in accordance with the committees’ Internal Rules adopted by the Board of Directors.
The Committees report to the Board of Directors on a regular basis.
Any Committee member may at any time, and as he or she sees fi t, update the Chairman of the Board of Directors on any aspect of the Committee’s work.
Any person called to attend committee meetings is required to treat information presented as being confi dential with the utmost discretion and is held to a general obligation of discretion with respect to all business of the committee and the Group.
In accordance with the law, these four committees are not exclusive of other committees that the Board of Directors may decide to set up on a temporary or ad hoc basis.
Audit Committee
Within the limits of the powers of the Board of Directors, the main role of the Audit Committee is to examine the draft annual and half-year fi nancial statements, ensure that the Company’s accounting methods are appropriate, permanent and reliable, verify the effective implementation of internal control and risk management and identifi cation procedures in the Company. The Committee must be informed of any material projects and/or decisions.
Each year it reviews the fees charged by the Company’s Statutory Auditors and assesses their independence.
The Audit Committee deliberates on the procedures to be carried out prior to the preparation of the annual and half-yearly parent com-pany and consolidated fi nancial statements.
It may interview, question, and request explanations from the Company’s and the consolidated companies’ Statutory Auditors and has access to all documents in order to perform its duties.
It may interview, question, and request explanations from any employee, the Board of Directors or third parties as well as departments of the Company, in particular, fi nancial departments.
The Audit Committee’s role also includes reviews of candidates for Statutory Auditor positions prior to their appointment by the General Shareholders’ Meeting. In this context, it examines their fees and assesses their independence. The Committee can also initiate the review of any potential candidate for appointment as Statutory Auditor.
The Company’s Statutory Auditors are required to attend Audit Committee meetings, as much as needed.
The Committee may meet at any time, at the request of its Chairman, or the Chairman of the Board of Directors. This notice of meeting will also be sent to the Company’s Statutory Auditors, as the case may be.
Remuneration Committee
Within the limits of the powers of the Board of Directors, the main role of the Remuneration Committee is to make proposals with respect to the remuneration of the Chairman-Chief Executive Offi cier and the method for distribution the directors’ fees allocated by the General Shareholders’ Meeting to the Board of Directors.
It may be requested to review all material questions relating to these matters.

305 Reference document 2005
Appointments Committee
Within the limits of the powers of the Board of Directors, the main role of the Remuneration Committee is to examine and recommend to the Board of Directors all candidates for appointment to the Board of Directors or co-opted by the Board or to be appointed by the sharehol-ders of the Company, and to examine and recommend the appointment of Deputy CEO’s (Directeurs généraux délégués) to the Board.
The Committee can initiate the review of any potential candidate for appointment as a director of the Company.
Prior to appointment or at any time deemed useful, the Committee examines, pursuant to the independence criteria defi ned by the Board of Directors, the independence of the Board members based upon the declaration of its Directors.
It may be requested to review all material questions relating to these matters.
Strategy and Development Committee
Within the limits of the powers of the Board of Directors, the main role of the Remuneration Committee is to identify, study, recommend, support, assess and verify the Company’s strategic development principles and initiatives and the Group’s business activities. It may be requested to review all material questions relating to these matters.
The Honorary Chairman of the Board is invited to attend meetings of the Committee.
Transactions in shares of the Company or companies in which the Group holds an interest
Directors must, at all times and all circumstances, comply with prevailing regulations and best practices on insider trading, confi dentiality and on dealing or trading involving publicly traded fi nancial instruments.
Moreover, the members of the Board of Directors are required to refrain from trading, directly or indirectly, in shares of any listed company of the Group during the six weeks prior to the publication of the annual or half-year results. In no way does this closed period replace the legal regulations regarding insider trading with which each member of the Board must comply at the time he decides to trade, no matter when this might occur outside the defi ned closed periods.
The same obligations apply to every director, in as much as he is aware, concerning the securities or fi nancial instruments issued by any company in which the Company holds and/or is likely to acquire or sell securities or fi nancial instruments which are listed on a regulated market and/or with which the Company has a business relationships which constitute insider information.
In the event of doubt with respect to these obligations, the concerned director must promptly and duly inform the Chairman of the Board of Directors or any person delegated by him, or one or more other directors of the Company.
All transactions in Company shares by members of the Board are made public in accordance with the regulations in force. Directors must report to the Company all of these transactions (as well as those which will have been reported by individuals who are closely related to them within the meaning of applicable regulations) whithin the next trading day following the transaction.
Directors, as well as their minor children and their spouses, must register all of their Company shares in a nominal registered account.
Assessment of the Board of Directors
In order to ensure the effi cient fulfi lment of its duties, the Board of Directors assesses its own performance each year. In conducting this evaluation, the Board of Directors assesses its operating methods, the manner in which matters are reported to it, the quality of the information made available to it, the preparation of its deliberations and decisions, as well as the effective contribution of each member to the work of the Board and its Committees.
Every three years at least the Board of Directors also conducts an assessment of its members and activity conducted by an independent director or third party expert appointed by the Board.

306
Legal and stock market information – Corporate governance
PPR 307
Directors’ fees
The fees allocated to the directors within the annual global amount decided on by the General Shareholders’ Meeting are made up of a fi xed portion, granted to all directors, and a variable portion which is contingent on their attendance at Board meetings. The members of the Audit Committee, the Remuneration Committee, the Appointments Committee and the Strategy and Development Committee receive, in addition, a fi xed half portion fi xed sum and a variable half portion, based on the same criteria.
The Board of Directors may decide to grant to one or more members a special portion taken from the global sum allocated, before pro-ceeding with the distribution as described above.
Honorary Chairman
The Board of Directors may appoint an Honorary Chairman who may attend all meetings of the Board and its committees on a consul-tative basis.
Advisers to the Board (Censeurs)
Unless stipulated otherwise by Law, the Board of Directors may appoint one or more Advisers to the Board, who must be physical per-sons, for a period that it shall determine. The Board determines the duties of these advisers.
8. Supervisory Board (until May 19, 2005)The Supervisory Board, comprised of individuals from different economic backgrounds, oversaw the management of the business, reviewed the parent and consolidated company fi nancial statements and deliberated on various authorisations in accordance with the Law and the Articles of Association, until the adjournment of the Combined General Shareholders’ Meeting of May 19, 2005.
8.1. Members of the Supervisory Board (until May 19, 2005)
Patricia Barbizet Chairman of the Supervisory Board
François-Henri Pinault (until March 20, 2005) Vice-Chairman of the Supervisory Board (until March 20, 2005)
René Barbier de La SerreVice-Chairman of the Supervisory Board (from March 21 until May 19, 2005)
Pierre Bellon
Allan Chapin
Luca Cordero di Montezemolo
Anthony Hamilton
François Henrot (until March 29, 2005)
Philippe Lagayette
Alain Minc
François Pinault
Baudouin Prot
Bruno Roger
(1) Directorships or positions which started during 2005(2) Directorships or positions which ended during 2005
Directorships and main duties in bold.

307 Reference document 2005
8.2. Information on Supervisory Board members
Directorships and positions held during 2005. Other directorships held during the last 5 years. Remuneration and benefi ts paid by the Company and received from controlled companies during 2005 (gross amounts before withholding tax, where applicable); disclosure of the gross amount of remuneration and benefi ts paid in 2004.
(For information concerning the members of the Supervisory Board that were appointed directors of the Company on May 19, 2005, see pages 284 to 288).
François Henrot, born on July 3, 1949
Member of the Supervisory Board (from September 20, 1995 until March 29, 2005)
Other directorships and positions held during the yearPartner-Managing Director of Rothschild et Cie Banque; Director of Carrefour (2) and Eramet; Member of the Supervisory Board of Cogedim and Vallourec.
Other directorships held during the last 5 years Director of BP France, Montupet and Téléimages International.
Remuneration and benefi ts paid in 2005: €44,136 (attendance fees).Remuneration and benefi ts in 2004: €38,314 (attendance fees).Number of shares held: 500.
Alain Minc, born on April 15, 1949
Member of the Supervisory Board (from November 27, 1991 until May 19, 2005)
Other directorships and positions held during the yearChairman of AM Conseil, Chairman of the Supervisory Board of Le Monde; Director of Fnac SA, Valeo and Vinci.
Other directorships held during the last 5 years Chairman of the Société des Lecteurs du Monde; Director of Ingenico and Yves Saint Laurent.
Remuneration and benefi ts paid in 2005: €305,282 (including €31,876 in attendance fees and fees from AM Conseil: €273,406).Remuneration and benefi ts in 2004: €310,684 (including €37,278 and fees from AM Conseil: €273,406).Number of shares held: 500.
François Pinault, born on August 21, 1936
Member of the Supervisory Board (since May 5, 1993 – current term expires in May 19, 2005), Managing Director of Financière Pinault
Other directorships and positions held during the yearDirector of Artémis, CEO of Garuda and Palazzo Grassi (1) ; Member of the Management Board of Château Latour; Director of Renault (2).
Other directorships held during the last 5 yearsCEO of Artémis; Vice-Chairman of the Supervisory Board of Pinault Printemps Redoute; Member of the Supervisory Board of Boucheron Holding and Gucci Group NV.
Remuneration and benefi ts paid in 2005: €29,424 euros.Remuneration and benefi ts in 2004: €37,278 euros.Number of shares held: 500.
(1) Directorships or positions which started during 2005(2) Directorships or positions which ended during 2005Directorships and main duties in bold.

308
Legal and stock market information – Corporate governance
PPR 309
Bruno Roger, born on August 6, 1933
Member of the Supervisory Board (since February 18, 1994 – current term expires in May 19, 2005).
Other directorships and positions held during the yearChairman of Lazard Frères SAS; Adviser to the Board of Eurazeo; Director of Cap Gemini Ernst & Young and Compagnie de Saint Gobain; Member of the Supervisory Board of Axa (2); Chairman, Lazard Global Investment Banking; Co-Chairman, Lazard European Advisory Board.
Other directorships held during the last 5 yearsCEO of Eurazeo; Chairman of the Supervisory Board of Eurazeo; Member of the Supervisory Board of Eurazeo; Director of Sofi na (Bel-gium) and Thalès.
Remuneration and benefi ts paid in 2005: €38,006 (attendance fees).Remuneration and benefi ts in 2004: €37,278 (attendance fees).Number of shares held: 1,000.
8.3. Regulatory information concerning the members of the Supervisory Board
With reference to the term of offi ce of each Supervisory Board member, to the knowledge of the Company:• no Supervisory Board member has been convicted of fraud during the past fi ve years,• no Supervisory Board member has been associated with a bankruptcy, receivership or liquidation during the past fi ve years in a capacity
as board member or chief executive offi cer,• no Supervisory Board member has been convicted of any infraction that would prohibit him/her from being a board member of an issuer
or participating in the management or operation of a company, • no incrimination and/or offi cial sanction has been pronounced against any Supervisory Board member by a statutory or regulatory
authority (including any professional organisation),• no Supervisory Board member benefi ted from a commitment from the Company or any of its subsidiaries corresponding to elements
of remuneration, indemnities or benefi ts of any kind whatsoever, due, or which could be due, as a result of the commencement, termi-nation or change of his/her duties or subsequently thereto,
• no Supervisory Board member has received any remuneration from the company which directly controls PPR (Artémis SA) during the year,• no Supervisory Board member has notifi ed the existence of an agreement with a major shareholder, client or supplier of the Company
pursuant to which he/she has been selected as board member.
8.4. Activity of the Supervisory Board and its committees from January 1 to May 19, 2005
The Supervisory Board met four times in 2005 (74% attendance rate) and took due note of the resignation of Mr. Per Kaufmann from the Management Board effective March 3, 2005 and the departure of Mr. Serge Weinberg effective March 20, 2005. On the recommendation of the Appointments Committee, the Supervisory Board appointed Mr. François-Henri Pinault member and Chairman of the Management Board as of March 21, 2005.
After being reviewed by the Audit Committee, at its March 16, 2005 meeting the Supervisory Board reviewed the annual parent company and consolidated fi nancial statements for 2004 as approved by the Management Board. The Board also took due note of the resignation of Mr. François-Henri Pinault as a member and Vice-Chairman of the Supervisory Board effective March 20, 2005, and appointed Mr. René Barbier de la Serre, Vice-Chairman of the Supervisory Board beginning March 21, 2005.
During its last meeting held on May 19, 2005, the Supervisory Board decided that the basis for the distribution of 2005 directors’ fees would be half of the annual allocation of €570,000, or €285,000. The total amount of directors’ fees thus attributed to members of the Supervisory Board with respect to 2005 amounts to €251,287 including the special portion of €11,500 in favor of the Chairman of the Audit Committee. The Audit Committee of the Supervisory Board met twice in 2005 (83% attendance rate) and examined the fi nancial statements for 2004 as approved by the Management Board. This review covered, in particular, the scope of consolidated companies, prevailing internal control procedures and material risks and off-balance sheet commitments. To this end, the Committee interviewed representatives of the Company’s fi nance and accounts departments, the internal audit department as well as the Statutory Auditors. The engagements and fees of the Statutory Auditors were carefully reviewed.The Remuneration Committee of the Supervisory Board met three times in 2005 (77% attendance rate) and ensured the strict application
(1) Directorships or positions which started during 2005(2) Directorships or positions which ended during 2005
Directorships and main duties in bold.

309 Reference document 2005
of Serge Weinberg’s employment agreement with respect to the conditions of his departure on March 20, 2005. The Committee also made recommendations concerning the remuneration of members of the Management Board, notably fi xed remuneration for 2005 and variable remuneration for 2004 as well as the granting of share options and bonus shares to members of the Executive Committee.
The Appointments Committee of the Supervisory Board met once in 2005 (100% attendance rate) to recommend the appointment of Mr. François-Henri Pinault as member and Chairman of the Company’s Management Board beginning March 21, 2005.
9. Management Board (until May 19, 2005)The Management Board was responsible for the Company’s corporate strategy and management until May 19, 2005, and approved the 2004 annual parent company and consolidated fi nancial statements.
9.1. Members of the Management Board
François-Henri Pinault Chairman of the Management Board (since March 21, 2005)
Serge Weinberg Chairman of the Management Board (until March 20, 2005)
Thierry Falque-Pierrotin
Per Kaufmann (until February 3, 2005)
Denis Olivennes
Robert Polet
9.2. Information concerning the members of the Management Board
Directorships and positions held during 2005. Other directorships held during the last 5 years. Remuneration and benefi ts paid by the Company and received from controlled companies during 2005 (gross amounts before any withholding tax, where applicable); disclosure of gross amount of remuneration and benefi ts paid in 2004. Commitments of the Company or any of its subsidiaries corresponding to elements of remuneration, indemnities or benefi ts of any kind whatsoever due or which could be due as a result of the commencement, termination or change in his duties or subsequently thereto. No member of the Management Board has received any remuneration from the company which controls PPR (Artémis SA) during the year.
(For information concerning François-Henri Pinault, appointed director of the Company by the Combined General Shareholders’ Meeting of May 19, 2005, see page 284 and 285).
Serge Weinberg, born on February 10, 1951
Chairman of the Management Board (member of the Management Board from June 17, 1993 until March 20, 2005).
Other directorships and positions held during the yearCEO of Weinberg Capital Partners (1); Chairman of the Supervisory Board of France-Printemps (2), Gucci Group NV (The Netherlands) (2), Redcats (2); Member of the Supervisory Board of Accor (1) , Gucci Group NV (The Netherlands) and Yves Saint Laurent (2); Director of Artémis (1) (2), of Fnac SA, Rexel (2) and Schneider Electric (1) ; Permanent Representative of Tennessee on the Board of Directors of Bouygues (2); Managing Director of Adoval and Maremma.
Other directorships held during the last 5 yearsChairman of the Supervisory Board of Conforama Holding and Guilbert; Member of the Supervisory Board of Boucheron and YSL Parfums; Director of Redcats; Representative of PPR on the Supervisory Board of PPR Interactive.
(1) Directorships or positions which started during 2005(2) Directorships or positions which ended during 2005Directorships and main duties in bold.

310
Legal and stock market information – Corporate governance
PPR 311
Remuneration and benefi ts paid in 2005: €6,836,119, including €5,328,946 in contractual severance compensation, €168,468 in remuneration as Chairman of the Management Board, €88,452 with respect to the unperformed notice period, €99,783 with respect to unused paid holidays, €163,053 in fi xed remuneration as an employee, €800,000 in variable remuneration with respect to 2004, €102,419 in variable remuneration with respect to 2005; €998 with respect to in-kind benefi ts (company car), and €84,000 with respect to directors’ fees”.Deferred or conditional remuneration: participation in the complementary defi ned benefi ts retirement plan currently in force in the PPR Group as approved by the Supervisory Board on March 3, 2004.Remuneration and benefi ts in 2004: €2,226,525.Number of shares held: 119,900.
Thierry Falque-Pierrotin, born on November 1, 1959
Member of the Management Board (from December 19, 2001 to May 19, 2005).
Other directorships and positions held during the yearCEO of Redcats; Chairman of Redcats International; Member of the Supervisory Board of Finaref; Non-executive director of Redcats UK PLC; Director of Redcats Inc. and Redcats USA LLC; Permanent Representative of Redcats, Director of La Redoute (1) ; Adviser to the Board of PPR (1).
Other directorships held during the last 5 yearsDirector of Ellos Gruppen, Fantasud, Manorbois and IMS International Metal Service; Director of Redcats Nordic; Member of the Super-visory Board of Conforama Holding; Chairman of the Management Board of Redcats; Chairman of the Supervisory Board of Brylane, la Redoute and Rouafi (Orcanta); Chairman of Pinault Bois & Matériaux; Permanent Representative of PBM, Managing Director of PBM Conseil and SCI de Lhoumaille.
Remuneration and benefi ts paid in 2005: €1,031,162 euros, including €741,752 in total annual fi xed remuneration,€8,248 in remu-neration as a member of the Management Board, €275,498 in variable remuneration with respect to 2004 paid in 2005 and €5,664 with respect to in-kind benefi ts (company car).Remuneration and benefi ts in 2004: €935,664.Deferred or conditional remuneration: Contractual severance clause: 18 months of total salary in the event of dismissal other than for gross negligence; participation in the complementary retirement plan currently in force in the PPR Group as approved by the Supervisory Board on March 3, 2004.Number of shares held: 16,663.
Per Kaufmann, born on March 30, 1956
Member of the Management Board (from January 21, 1998 to February 3, 2005).
Other directorships and positions held during the yearCEO of Conforama Holding (2); Chairman of the Board of Directors of Conforama Espana (2), Conforama France (2), Conforama Italia (2), Conforama Luxembourg (2) and Conforama SA (Switzerland) (2); Chairman of Cogedem (2); Director of Conforama Asia Pte Ltd. (Singapore) (2), and Finaref (2); Chairman of the Supervisory Board of Conforama Polska (Poland) (2) and Hipermovel Mobiliario e Decoraçao (Portugal) (2); Managing Director of Conforama Management Services (2).Other directorships held during the last 5 yearsDirector of Brico Hogar SA (Spain), Conforama Investimenti (Italy), Confo on Line, Klastek Invest. SL (Spain), Madelios, Salzam Merca-tone (Italy) and Société de développement de litterie; CEO of Caudiv, Gdcm, Hdi, Imedia Expansion, Nidam, Printemps.com and Profi da; Director Copres Corporation (Taiwan); Member of the Supervisory Board of SNFA; Permanent Representative of Conforama Holding, Chairman of the Supervisory Board of Kadeos, Permanent Representative of Conforama Holding on the Supervisory Board of PPR In-teractive; Chairman of the Management Board of France Printemps, Permanent Representative of Conforama Holding, Chairman of the Board of Bigameubles, Managing Director of Sapac Printemps.
Remuneration and benefi ts paid in 2005: €1,755,777, including €1,310,625 in contractual settlement compensation, €304,992 in an-nual total fi xed remuneration including notice period and in-kind benefi ts (car), €29,903 with respect to unused paid holidays, €2,046 in remuneration as a member of the Management Board, €83,811 in variable remuneration with respect to 2004 paid in 2005 and €24,400 representing the value of the company car transferred.Remuneration and benefi ts in 2004: €576,497.Number of shares held: 0.
(1) Directorships or positions which started during 2005(2) Directorships or positions which ended during 2005
Directorships and main duties in bold.

311 Reference document 2005
Denis Olivennes, born on October 18, 1960
Member of the Management Board (from September 4, 2002 to May 19, 2005).
Other directorships and positions held during the yearCEO of Fnac SA; Chairman of the Board of Directors and deputy director of Grandes Almacenes Fnac España (2) and Fnac Belgique (2); Chairman of the Board of Directors of Fnac Suisse (2); Vice-chairman of FNAC Italie; Managing Director of Fnac Portugal (2); Member of the Supervisory Board of Finaref; Director of Cineteve (2); Adviser to the Board of PPR (1).
Other directorships held during the last 5 yearsPermanent Representative on the Board of Directors of Surcouf; Chairman of the Supervisory Board of Conforama Holding and Guil-bert; Vice-Chairman of the Board of Directors of Culturae Communicazione; Member of the Supervisory Board of PSG; Member of the Management Board of Canal+; CEO of Holding Sports et Evenements; Director of Canal+ Belgique, Canal Horizon, Canal Satellite, Sportfi ve and Studio Canal; Permanent Representative of Groupe Canal+ on the Board of Directors of Canal Numedia, Financière de Vidéocummunication, Satellite Service and Studio Canal France; Permanent Representative of Hethold France on the Board of Directors of SIG; Director of Polish Pay TV BV (The Netherlands); Chairman de Polcom Invest (Poland); Managing Director of Canal+ Participations; Member of the Management Board of Canal+ Distribution.
Remuneration and benefi ts paid in 2005: €1,293,156, including €850,000 in total annual fi xed remuneration, €8,248 in remuneration as a member of the Management Board, €428,488 in variable remuneration with respect to 2004 paid in 2005 and €6,420 with respect to in-kind benefi ts (company car).Remuneration and benefi ts in 2004: €1,111,696.Deferred or conditional remuneration: Contractual severance clause: 12 months of total salary in the event of dismissal other than for gross negligence; participation in the complementary retirement plan currently in force in the PPR Group as approved by the Supervisory Board on March 3, 2004.Number of shares held: 200.
Robert Polet, born on July 25, 1955
Member of the Management Board (from July 7, 2004 to May 19, 2005).
Other directorships and positions held during the yearChairman of the Management Board and CEO of Gucci Group NV; Director of Autumn Paper Ltd., Bedat SA, Bedat Holding SA, Bottega Veneta BV (1) , Gucci America Inc., Gucci Group Holding Limited, Gucci Group Hong Kong Ltd., Gucci Group Japan Limited, Gucci Korea Limited, Gucci Luxembourg SA, Luxury Timepieces International, Sergio Rossi, Stella McCartney Ltd. and Yugen Kaisha; Chairman of the Board of Directors of Gucci Logistica Spa, Guccio Gucci Spa, Luxury Goods International and Luxury Goods Italia Spa; Member of the Supervisory Board of Boucheron Holding; Chairman of the Supervisory Board of Yves Saint Laurent (1) ; Adviser to the Board of PPR (1)
Remuneration and benefi ts paid in 2005: €2,651,696, including €8,248 in remuneration as a member of the Management Board, €1,191,752 in total annual fi xed remuneration, €1,200,000 in variable remuneration paid in 2005 with respect to 2004 and €251,696 with respect to in-kind benefi ts (including housing and a company car).Remuneration and benefi ts in 2004: €604,764.Deferred and/or conditional remuneration: Contractual severance clause: 3 years of total salary in the event of dismissal other than for gross negligence; 50,000 Gucci Stock Appreciation Rights; 10% of total annual salary is paid into a retirement fund approved by the UK Inland Revenue in accordance with his employment agreement.Number of shares held: 0.
9.3. Regulatory information concerning the members of the Management Board
With reference to the term of offi ce of each Management Board member, to the knowledge of the Company:• no Management Board member has been convicted of fraud during the past fi ve years,• no Management Board member has been associated with a bankruptcy, receivership or liquidation during the past fi ve years in a ca-
pacity as board member or chief executive offi cer,• no Management Board member has been convicted of any infraction that would prohibit him from being a board member of an issuer
or participating in the management or operation of a company,
(1) Directorships or positions which started during 2005(2) Directorships or positions which ended during 2005Directorships and main duties in bold.

312
Legal and stock market information – Corporate governance
PPR 313
• no incrimination and/or offi cial sanction has been pronounced against any Managment Board member by a statutory or regulatory authority (including any professional organisation),
• no Management Board member has received any remuneration from the company which directly controls PPR (Artémis SA) during the year,• no Management Board member has notifi ed the existence of an agreement with a major shareholder, client or supplier of the Company
pursuant to which has been selected as board member.
10. Stock subscription options or stock purchase options granted to board members and options exercisedStock subscription option or stock purchase options granted to each board members and options exercised by the latter
Number of options granted Number of shares
subscribed or purchased
Price Maturity dates
Plans
François-Henri Pinault 50,000 €78.01 19/05/2015 PPR stock option subscription plan 2005-II
Thierry Falque-Pierrotin 10,500 €78.01 19/05/2015 PPR stock option subscription plan 2005-II
Denis Olivennes 10,500 €78.01 19/05/2015 PPR stock option subscription plan 2005-II
Robert Polet 15,000 €78.01 19/05/2015 PPR stock option subscription plan 2005-II
Options exercised by each board members during the year
- None – – – –
11. Bonus shares granted to board membersBonus shares granted to board members by the Company and controlled companies
Number of shares granted (1)
Grant period
Holding period
Plans
Thierry Falque-Pierrotin 1,125 From 07/06/2005 until 07/06/2007
From 07/07/2007 until 07/07/2009
PPR bonus share plan 2005-I
Denis Olivennes 1,125 From 07/06/2005 until 07/06/2007
From 07/07/2007 until 07/07/2009
PPR bonus share plan 2005-I
(1) The shares will be defi nitively granted at the end of the grant period. The number of shares granted will be adjusted downwards should the PPR share under perform the CAC 40 during the grant period.
No assets belonging directly or indirectly to the senior managers of the Company are used in Group operations.

313 Reference document 2005
12. Fees paid by the Group to the Statutory Auditors and to the members of their organisations in 2005
2005 2004
KPMG Audit Deloitte & Associés KPMG Audit Deloitte & Associés
(in € thousands) Amount in % Amount in % Amount in % Amount in %
Audit
Statutory auditors, certifi cation, review of parent company and consolidated fi nancial statements
3,258.1 3,645.0 4,256.3 4,121.4
Other assignments 282.0 175.0 4,229.1(1) 892.6
Sub-total 3,540.1 96.9% 3,820.0 84.0% 8,485.4 97.6% 5,014.0 92.1%
Other services
Legal, tax, human resources (2) 112.2 725.0 209.0 324.2
Consulting - -
Other - 106.0
Sub-total 112.2 3.1% 725.0 16.0% 209.0 2.4% 430.2 7.9%
Total 3,652.3 100.0% 4,545.0 100.0% 8,694.4 100.0% 5,444.2 100.0%
(1) Mainly concerns the sale of Rexel.(2) Mainly concerns foreign subsidiaries.

314
Legal and stock market information – Corporate governance
PPR 315
First resolution (Approval of the annual fi nancial statements
The General Shareholders’ Meeting, acting as an Ordinary Meeting, after reviewing the following:- the management report of the Board of Directors for the 2005 fi scal year,- the Statutory Auditors’ report on the completion of their assignment during the fi scal year,
hereby approves the annual fi nancial statements for the 2005 fi scal year as presented together with the transactions refl ected in these fi nancial statements and summarised in these reports.
Second resolution (Approval of the consolidated fi nancial statements)
The General Shareholders’ Meeting, acting as an Ordinary Meeting, after reviewing the following:- the report of the Board of Directors of the Group in 2005,- the Statutory Auditors’ report on the 2005 consolidated fi nancial statements,
hereby approves the consolidated fi nancial statements for 2005 as presented together with the transactions refl ected in these fi nancial statements and summarised in these reports.
Third resolution (Agreements referred to in Articles L. 225-38 et seq. of the Commercial Code)
The General Shareholders’ Meeting, acting as an Ordinary Meeting, after reviewing the Statutory Auditors’ Special Report on the agreements referred to in Articles L. 225-38 et seq. of the Commercial Code, hereby approves the report and the information contained therein.
Fourth resolution (Appropriation of earnings)
The General Shareholders’ Meeting, acting as an Ordinary Meeting, after approving the annual fi nancial statements as presented to it, which show:A profi t of ....................................................................................................... €506,841,468.69 which, together with previous retained earnings of ......................................... €681,347,865.83show a positive balance available for distribution in the amount of .............. €1,188,189,334.52
which it decides to allocate as follows:- to shares as a dividend payment in the amount of ........................................ €327,280,507.52- and to retained earnings in the amount of ................................................... €860,908,827.00Total equal to ............................................................................................. €1,188,189,334. 52
The General Shareholders’ Meeting hereby resolves to pay out as from June 2, 2006 a net amount of €2.72 per share. Any dividend amounts included in this distribution that apply to shares held by the Company on the distribution date or to any shares cancelled shall be allocated to retained earnings.
Pursuant to Article 243 bis of the General Tax Code, the dividend distributed to individuals resident for tax purposes in France is entirely eligible for the 40% tax allowance, provided for in Article 158-3 2° of the General Tax Code, with respect to 2006 income tax.
Resolutions submitted to the Ordinary General

315 Reference document 2005
The General Shareholders’ Meeting acknowledges that the earnings per share (EPS) over the past three years is as follows:
Year of payment Net dividend Tax credit of 50% Gross dividend
2003 €2.30 €1.15 €3.45
2004 €2.40 €1.20 €3.60
Year of payment Net dividend Eligible for the 50%tax allowance
2005 €2.52 €2.52
Fifth resolution (Authorisation to purchase Company shares)
The General Shareholders’ Meeting, acting as an Ordinary Meeting, after reviewing the report by the Board of Directors, hereby authorises the Board of Directors, pursuant to Articles L. 225-209 et seq. of the Commercial Code, to purchase on one or more occasions and at times to be determined by it, shares in the Company representing up to 10% of the share capital as of April 1, 2006, or 12,032,371 shares. The shares may be purchased by any means, including by the use of derivatives or in the form of blocks of shares, at such times as the Board of Directors may determine, including during public offer or exchange periods in order to:• provide liquidity or volume to the market in the context of a liquidity contract with an independent fi nancial services company, acting
independently pursuant a liquidity contract in compliance with the Ethics Code recognised by the French Financial Markets Authority.• to use all or any of the acquired shares to hedge stock option plans, bonus share plans and employee saving schemes granted in favor
of Group employees and corporate offi cers and to sell or grant the shares to them, as provided by law,• acquire equity interests or raise fi nancing in exchange of Company shares in connection with acquisitions or the issuance of marketable
securities exchangeable or redeemable for shares in the Company.• cancel any shares purchased, in accordance with the authorisation granted by the Extraordinary General Shareholders’ Meeting of May 19, 2005.
The shares acquired by the Company pursuant to this authorisation may be kept, sold or transferred by any appropriate means, including the use of derivatives or in blocks of shares, or cancelled.
Concerning the possible recourse to derivatives in the context of this share buy-back programme, the latter would be done in accordance with applicable laws and regulations and could aim, notably, to hedge the undertakings of the company in the context of share purchase options granted to group employees and corporate offi cers or those relating to the OCEANEs convertible bond issuances.
The maximum purchase price is set at €150 per share. In the event of a capital increase by capitalisation of reserves or the awarding of bonus shares, or in the event of a share split or reverse split, such amount shall be adjusted by a multiplier equal to the ratio of the number of shares comprising the equity capital before the transaction and the number after the transaction.
Hence, the maximum amount of the transaction shall be set at €1,804,855,650.
The General Shareholders’ Meeting hereby grants full powers to the Board of Directors, with the authority to delegate, to carry out such transactions, to determine the terms and conditions thereof and to enter into any and all agreements and to carry out any and all formalities.
This authorisation, which cancels the unused portion of the authorisation granted to the Board of Directors by the General Shareholders’ Meeting of May 19, 2005, is granted for a period of 18 months as from the date of this Meeting.
Sixth resolution (Powers)
The General Shareholders’ Meeting, acting as an Ordinary Meeting, hereby grants full powers to the bearer of a copy or an excerpt of the minutes of this Meeting to carry out all legal announcement formalities.
Shareholders’ Meeting of May 23, 2006

316PPR 317
Person responsible for the Reference Document and the Statutory Auditors
Person responsible for the Reference DocumentJean-François PalusChief Financial Offi cer
Attestation of the person responsible for the Reference DocumentTo my knowledge, after having taken all reasonable measures for this purpose, I hereby attest that the information presented in this Re-ference Document fairly refl ects the current situation and that no material omissions have been made.
I have obtained from KPMG Audit and Deloitte & Associés, the statutory auditors, a letter drawn up at the end of their audit engagement in which they state that they have carried out procedures in accordance with professional standards applicable in France, verifi ed the information relating to the fi nancial position and the fi nancial statements presented in this Reference Document and have read the Reference Document in full.
Paris, April 11, 2006
Chief Financial Offi cerJean-François Palus
Statutory AuditorsPrincipal Statutory Auditors
KPMG Audit Department of KPMG SA1, cours Valmy, 92923 Paris La DéfensePatrick-Hubert Petit Hervé Chopin
Deloitte & Associés185, avenue Charles de Gaulle, 92200 Neuilly-sur-SeineJean-Paul Picard Antoine de Riedmatten
Date of fi rst appointment
Annual General Meeting of June 18, 1992 Annual General Meeting of May 18, 1994
Term of appointment and expiry date
From May 25, 2004 until the Annual General Meeting called to approve the fi nancial statements for the year ended December 31, 2009.
From May 21, 2002 until the Annual General Meeting called to approve the fi nancial statements for the year ended December 31, 2007.
Deputy Statutory Auditors
SCP Jean-Claude André2 bis, rue de Villiers, 92309 Levallois-Perret
BEAS7-9, Villa Houssay, 92524 Neuilly-sur-Seine Cedex
Date of the fi rst appointment
Annual General Meeting of May 25, 2004 Annual General Meeting of May 19, 2005
Term of appointment and expiry date
From May 25, 2004 until the Annual General Meeting called to approve the fi nancial statements for the year ended December 31, 2009.
From May 19, 2005 until the Annual General Meeting called to approve the fi nancial statements for the year ended December 31, 2007.
Person responsible for the Reference

317 Reference document 2005
In accordance with Article 28 of EC Regulation no. 809/2004 of April 29, 2004, this Reference Document incorporates by reference the following information to which the reader is invited to refer:
- With respect to the fi scal year ended December 31, 2004: key fi gures, activity report, consolidated fi nancial statements, parent com-pany fi nancial statements and the related statutory auditors’ reports appearing in the Reference Document which was fi led on April 11, 2005 with the French Financial Markets Authority, the AMF or Autorité des Marchés Financiers, on pages 6 to 9, 122 to 141, 160 to 220, 222 to 237, 221 and 245, respectively;
- With respect to the fi scal year ended December 31, 2003: key fi gures, activity report, consolidated fi nancial statements, parent com-pany fi nancial statements and the related statutory auditors’ reports appearing in the Reference Document which was fi led on March 16, 2004 with the French Financial Markets Authority, the AMF or Autorité des Marchés Financiers, on pages 7 to 8, 46 to 64, 127 to 185, 192 to 207, 126 and 187, respectively.
The information included in these two Reference Documents, other than that referred to above, has been, if necessary, replaced or updated by the information included in this Reference Document. These two Reference Documents are available under the conditions described in Section 24 “Documents available to the public” of this Reference Document.
Document and the Statutory Auditors
This Reference Document was fi led with the Autorité des Marchés Financiers on April 11, 2006, in accordance with Article 212-13 of its General Regulations. It may be used in support of any fi nancial transaction if it is supplemented by a prospectus approved by the Autorité des Marchés Financiers.

318PPR 319
Reference Document
Sections of appendix I of EC regulation no. 809/2004
Chapters Pages
1. PERSONS RESPONSIBLE 316
2. STATUTORY AUDITORS 316
3. SELECTED FINANCIAL INFORMATION 8–9
4. RISK FACTORS 84–87, 143–147
5. INFORMATION ABOUT THE ISSUER
5.1. History and development of the Company 6, 7, 12–19
5.2. Investments 140–142
6. BUSINESS OVERVIEW
6.1. Principal activities 22–67
6.2. Principal markets 22–67
6.3. Exceptional events N/A
6.4. Possible dependence N/A
6.5. Information reported by the issuer with respect to its competitive position 43, 49, 53, 59, 63, 66
7. ORGANISATIONAL STRUCTURE
7.1. Brief description of the Group 10–11
7.2. List of the Company’s subsidiaries 237–242
8. PROPERTY, PLANT AND EQUIPMENT
8.1. Signifi cant existing or planned items of property, plant and equipment 12–19
8.2. Environmental issues which could infl uence the use made by the issuer of its items of property, plant and equipment.
88–103
9. OPERATING AND FINANCIAL REVIEW
9.1. Financial position 122–139
9.2. Operating income 122–139
10. CASH AND CAPITAL RESOURCES
10.1. Information on the Company’s short-term and long-term capital 136
10.2. Source and amount of the Company’s cash fl ows 135–137
10.3. Information on the Company’s borrowing terms and conditions and fi nancing structure 136
10.4. Information concerning any restriction on using capital which has signifi cantly infl uenced or could signifi cantly infl uence, directly or indirectly, the Company’s operations
N/A
10.5. Information concerning expected sources of fi nancing 135–137
11. RESEARCH AND DEVELOPMENT, PATENTS AND LICENCES N/A
12. TREND INFORMATION 14–19, 139
13. PROFIT FORECASTS OR ESTIMATES N/A
14. ADMINISTRATIVE, MANAGEMENT, SUPERVISORY BODIES AND EXECUTIVE MANAGEMENT
14.1. Administrative, management and supervisory bodies 284–289
14.2. Confl icts of interest at the level of administrative, management and supervisory bodies 288–289
Reference Document cross-reference table
N/A: Non applicable

319 Reference document 2005
cross-reference table
Chapters Pages
15. REMUNERATION AND BENEFITS
15.1. Remuneration of corporate offi cers 284–288, 307–308, 309–311
15.2. Total amounts provided for or recorded for pensions, retirement and other benefi ts 266
16. ADMINISTRATIVE AND MANAGEMENT BODY PRACTICES
16.1. Expiration date of current terms of offi ce 284–288
16.2. Service contracts binding members of the administrative, management or supervisory bodies N/A
16.3. Information on the Company’s Audit Committee and Remuneration Committee 294–295, 304–305
16.4. Declaration of compliance with corporate governance principles prevailing in the country of origin 291
17. EMPLOYEES
17.1. Number of employees 72–84
17.2. Investments and share options 281–283, 312
17.3. Agreement providing for employee ownership in the Company’s share capital 283
18. MAIN SHAREHOLDERS
18.1. Shareholders owing more than 5% of the share or voting rights 273, 274
18.2. Existence of different voting rights 271, 273
18.3. Control of the Company 273, 274
18.4. Any agreement, known by the Company, the implementation of which could, at a subsequent date, lead to a change in its control
N/A
19. RELATED PARTY TRANSACTIONS 265–267
20. FINANCIAL INFORMATION CONCERNING THE ASSETS, FINANCIAL POSITION AND RESULTS OF THE ISSUER
20.1. Historical fi nancial information 148–243, 317
20.2. Pro forma fi nancial information N/A
20.3. Financial statements 148–151
20.4 Audit of annual historical fi nancial information 243, 317
20.5. Date of most recent fi nancial information 148
20.6. Interim and other fi nancial information N/A
20.7. Dividend distribution policy 260, 271
20.8. Legal and arbitration proceedings 144–145, 197
20.9. Material change in the issuer’s fi nancial or trading position N/A
21. ADDITIONAL INFORMATION
21.1. Share capital 270–272
21.2. Incorporating document and Articles of Association 270–272
22. MATERIAL CONTRACTS N/A
23. THIRD-PARTY INFORMATION, ASSERTIONS MADE BY EXPERTS AND REPORTING OF ANY INTEREST
N/A
24. DOCUMENTS AVAILABLE TO THE PUBLIC 270
25. INFORMATION ON INVESTMENTS 256–258
N/A: Non applicable

PPRSociété anonyme (commercial company) with a share capital of €481,294 864
Registered Offi ce: 10, avenue Hoche – 75381 Paris Cedex 08Tel: +33 (0)1 45 64 61 00 – Fax: +33 (0)1 45 64 60 00
www.ppr.com552 075 020 RCS Paris
This document was printed on matt Magno paper, using white, chlorine-free wood pulp, also from forests managed for sustainable growth (27% certified under PEFC)
This is an English translation of the French original Reference document fi led with the French Financial Markets Regulatory Authority (Autorité desMarchés Financiers - AMF) on April 11, 2006. In the event of any discrepancy between the French version and the English translation, the Frenchversion shall prevail in all cases.

Related Documents


![Resep Kue Kering Terbaru___ue Kering] - Thekaltara](https://static.cupdf.com/doc/110x72/55cf9417550346f57b9f94be/resep-kue-kering-terbaruue-kering-thekaltara.jpg)