Department of Agriculture and Fisheries for Scotland ~engthl weight Relationships for 88 Species of Fish Encountered in the North East Atlantic K A Coull A S Jermyn A W Newton G I Henderson and W B Hall Scottish Fisheries Research Report Number 43 1989 ISSN 0308 8022

Welcome message from author
This document is posted to help you gain knowledge. Please leave a comment to let me know what you think about it! Share it to your friends and learn new things together.
Transcript

Department of Agriculture and Fisheries for Scotland
~ength l weight Relationships for 88 Species of Fish Encountered in the North East Atlantic
K A Coull A S Jermyn A W Newton G I Henderson and W B Hall
Scottish Fisheries Research Report Number 43 1989 ISSN 0308 8022
Lengthmeight Relationships for 88 Species of Fish Encountered in the North East Atlantic
by
K A Coull, A S Jermyn, A W Newton, G I Henderson and W B Hall
Marine Laboratory, Aberdeen
Introduction As a necessary adjunct to monitoring fish stocks the Marine Laboratory has obtained a large volume of lengthlweight data for al l species of major commercial importance to Scottish fishermen. In addition a limited amount of information has also been obtained on a variety of minor species. This paper summarises the data currently available.
Material Material was collected from the middle and northern North Sea, the west coast of Scotland, Rockall and, to a lesser extent, Faeroese and Icelandic waters.
Information has been obtained from four separate sources:
a. Samples were collected during research vessel surveys. Prior to 1981 fish were deep frozen a t sea, transported back to the Laboratory and measured and weighed after defrosting. Since 1981 fish have been weighed a t sea using a Mettler PC8000 electronic balance linked to a micro-computer (Newton, 1982).
b. Samples were obtained while monitoring discards aboard commercial fishing vessels (Jermyn and Hall, 1978). These samples were kept on ice until they could be processed in the Laboratory, usual1 y three or four days after capture.
c. Rare fish records dating back to 1900 were used to provide information on species not encountered on a regular basis. It is not possible to estimate how long after death these specimens were weighed or, for the earlier part of the century, how they were preserved prior to weighing. Later specimens were preserved on ice.
d. The bulk of the data for the most common commercial species were obtained from samples purchased a t local markets. These fish had been caught 1 - 10 days before weighing, and had been kept on ice until processed.
Methods The lengths of most species were determined by measuring the distance from the tip of the snout to the extreme tip of the caudal fin. However, for skates and rays the term length refers to the distance from wing tip to wing tip. Prior to 1967 measurements were recorded to the nearest centimetre, but from January 1967 measurements have been made to the centimetre below. In order to standardise measurements 0.5 cm was deducted from the length of fish measured prior to 1967.
The total ungutted weight of each fish was recorded in grammes and for many species the gutted weight was also obtained.
Programs provided by the Laboratory's Computing and Statistics Section were used in data preparation and analysis. Where length (L), total weight (MI) and gutted weight (GW) were recorded, relationships and plots have been produced for lengthltotal weight, lengthlgutted weight and total weightlgutted weight. In the case of species for which there were no gutted weight data, only a lengthltotal weight relationship was calculated. For relationship between length and weight (total or gutted) a function of the form:
was fitted to the data, where W = weight (g) and L = length (cm).
For a relationship between total weight and gutted weight a function of the form:
was fitted to the data, where TW = total weight and GW = gutted weight.
Results The weight a t length of many species is known to vary seasonally, and wherever possible lengthlweight relationships have been prepared for each calendar month. A desirable secondary division is into the relevant sampling areas (see Appendix I, Figs 1-4) so as to make allowance for any regional variation in growth rates. Monthlylarea relationships are available only for herring (Clupea harengus (L.) 1, mackerel (Scomber scombrus (L.)), Raitt 's sandeel (Ammodytes maximus Raitt 1 934) and sprat (Sprattus sprattus (L.)) (Tables I, I I and I I I). For the main demersal species, viz cod (Gadus morhua ( L.) I,, haddock (Melanogrammus aeglefinus ( L.) 1, whiting (Merlangius merlangus ( L.) 1, sai t he (Pollachius virens ( L.) ) , lemon sole (Microstomus kik (Walbaum)) and plaice (Pleuronectes platessa (L.)), data from all areas were combined to give a monthly relationship (Table IV). Quarterly relationships are provided for spurdogs (Sgualus acanthias (L.)) (Table V) whilst for porbeagles (Lamna nasus (Bonnaterre)) an annual relationship for each sex is provided (Table VI). For all other species the available data were sufficient to provide only an annual relationship.
Plots for species where relationships are available for lengthltotal weight, lengthlgutted weight and total weightlgutted weight are shown in Appendix I I, Figures 5 to 43. Plots for species for which there are only sufficient data for a lengthltotal weight relationship are shown in Appendix I I - Figures 44 to 81. All the plots are accompanied by a table indicating the source area and number of observations. For the majority of species the source area is based on demersal market sampling areas (Fig. 1 and Appendix I) which, in turn, are associated with biological andlor geographical boundaries.
An index of species, cross-referenced by common and scientific names, is provided in Appendix 1 1 1.

Table I Herring (Clupea harengus) - total weightllength relationship
Annual value for 'b', monthly and annual mean values for 'a' are given below
Area North Rona Hebrides NW Ireland North and all North and South M inch
Sea Minch
Area Code 2,3,4,5, 1 7,9 8 6,11,12
'b' Value 3.0904 2.9776 3.0083 3.0256
'a' Values
Jan Feb Mar A P ~ May Jun Jul AwJ S ~ P oct Nov Dec
Mean Annual Values 0.00603 0.00863 0.00791 0.00742
Irish Sea and
Clyde
See Figure 4 for herring sampling areas and Appendix I for area codes.
Table II Total weightllength relationships
Annual values for 'b', monthly values for 'a' and annual mean values for 'a' are given below for mackerel (Scomber scombrus) and Raitt's sandeel (Ammodytes marinus) by sampling area
Species Mackerel Raitt's sandeel
Areas Clyde Others Shetland West Coast
Area Code 11 - -
'b' Value 3.21 3.29 3.32 3.32
'a' Values
Jan Feb Mar A P ~ May Jun Jul Aug S ~ P Oct Nov Dec
Mean Annual Values 0.0038 10 0.003001 0.001243 0.001317
See Figure 2 for mackerel sampling areas and Appendix I for area codes.

Table Ill Sprat (Sprattus spratms) - total weightllength relationship
TW = a ~ ~
Annual values for 'b', monthly and annual mean values for 'a' are given below
Area North Sea areas West Scotland Clyde
Area Code 1,2,3,4 5 6
'b' Value 3.4746 3.4746 3.4788
'a' Values
Jan Feb Mar Apr May Jun Jul Aug Sep Oct Nov Dec
Mean Annual Values "'
1
See Figure 3 for sprat bhlpling areas and Appendix I for area codes.
Table IV I, ;, Gutted weighthernth nlationlript
G W = ~ L ~ ( T W = G W x R F I
Annual values for 'b',mnt###atueD for 'a' and annual mean values for 'a' are given below each species. Raising factors (RF) for converting gutted weight t o total weight are also given
Cod Haddock
'b' Value 2.8571' 28268
'a' Values
Jan Feb Mar A P ~ May Jun Jul Aug S ~ P Oct Nov Dec
Mean Annual Values
Whiting
2.9456
0.0100 0.0094 0.0090 0 .0088 0.0088 0.0089 0.0090 0.0092 0.0095 0.0096 0.0097 0.0097
0.0093
1.13
Saithe
2.7374
0.0241 0.0222 0.0219 0.0227 0.0229 0.0238 0.0236 0.0243 0.025 1 0.0252 0.0255 0.0246
0.0238
1.19
Lemon Plaice Sole
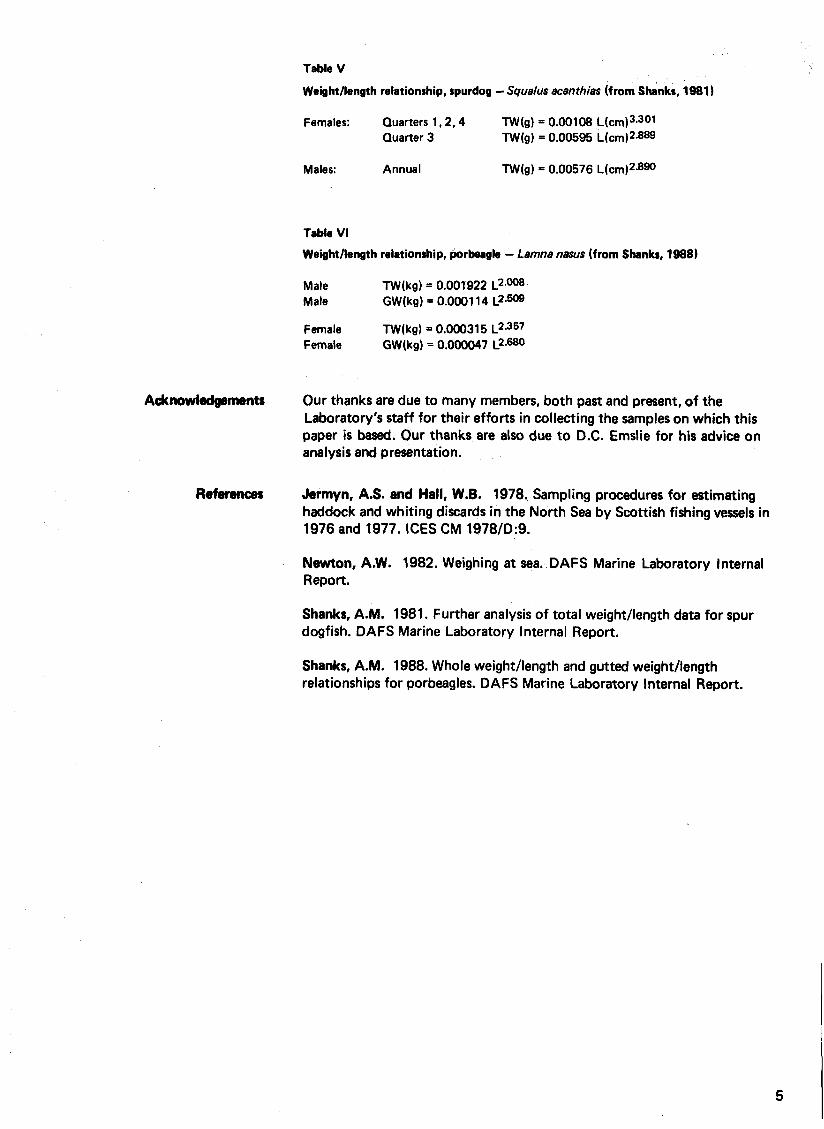
Table V
Weightnength relationship, spurdog - Squalus scanthias (from Shanks, 1981 1
Females: Quarters 1 ,2 ,4 TW(g) = 0.00108 Quarter 3 TW(g1 = 0.00595 ~(cm)2 .8~9
Males: Annual TW(g) = 0.00576 ~ ( c m ) ~ . ~ ~ ~
Table VI
Weighttlength relationship, porbeagle - Lamna nasus (from Shanks, 1988)
Male lW(kg) = O.OOl'922 L ~ . ~ ~ Male GW(kg) = 0.0001 14 ~ 2 . ~ ~ ~
Female TW(kg) = 0.000315 L ~ - ~ ~ ~ Female GW(kg) = 0.000047 L ~ . ~ ~ ~
Acknowledgemcmnts Our thanks are due to many members, both past and present, of the Laboratory's staff for their efforts in collecting the samples on which this paper is based. Our thanks are also due to D.C. Emslie for his advice on analysis and presentation.
References Jsrmyn, AS. and Hall, W.B. 1978. Sampling procedures for estimating haddock and whiting discards in the North Sea by Scottish fishing vessels in 1976 and 1977. ICES CM 1978/0:9.
Newton, A.W. 1982. Weighing at sea. DAFS Marine Laboratory Internal Report.
Shanks, A.M. 1981. Further analysis of total weightllength data for spur dogfish. DAFS Marine Laboratory lnternal Report.
Shanks, A.M. 1988. Whole weightllength and gutted weightllength relationships for porbeagles. DAFS Marine Laboratory Internal Report.
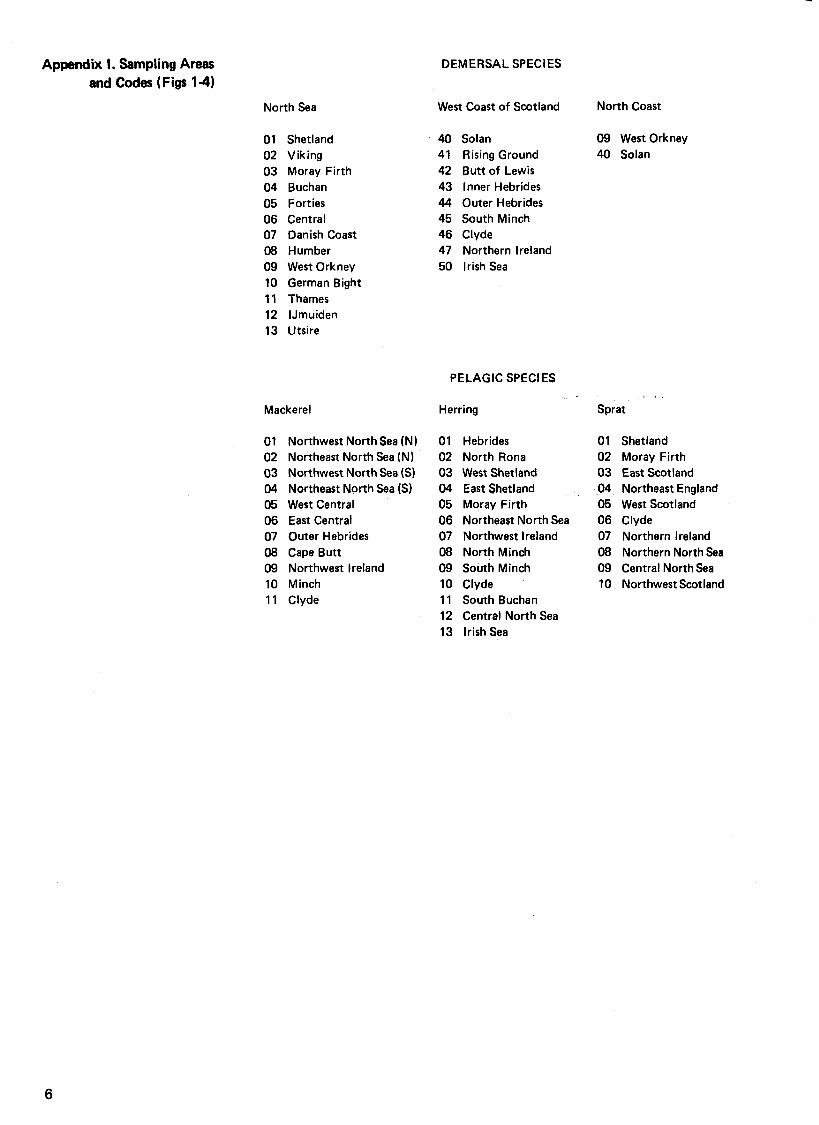
Appendix I. Sampling Areas and Codes (Figs 14)
North Sea
01 Shetland 02 Viking 03 Moray Firth 04 Buchan 05 Forties 06 Central 07 Danish Coast 08 Humber 09 West Orkney 10 German Bight 11 Thames 12 IJmuiden 13 Utsire
Mackerel
01 Northwest North Sea (N) 02 Northeast North Sea (N) 03 Northwest North Sea (S) 04 Northeast North Sea (S) 05 West Central 06 East Central 07 Outer Hebrides 08 Cape Butt 09 Northwest lreland 10 Minch 11 Clyde
DEMERSAL SPECIES
West Coast of Scotland North Coast
Solan 09 West Orkney Rising Ground 40 Solan Butt of Lewis Inner Hebrides Outer Hebrides South Minch Clyde Northern lreland lrish Sea
PELAGIC SPECIES
Herring
01 Hebrides 02 North Rona 03 West Shetland 04 East Shetland 05 Moray Firth 06 Northeast North Sea 07 Northwest lreland 08 North Minch 09 South Minch 10 Clyde 11 South Buchan 12 Central North Sea 13 lrish Sea
Sprat
01 Shetland 02 Moray Firth 03 East Scotland ,04 Northeast England 05 West Scotland 06 Clyde 07 Northern lreland 08 Northern North Sea 09 Central North Sea 10 Northwest Scotland

Figure 1. Demersal Market Sampling Areas

Figure 2. Mackerel Sampling Areas
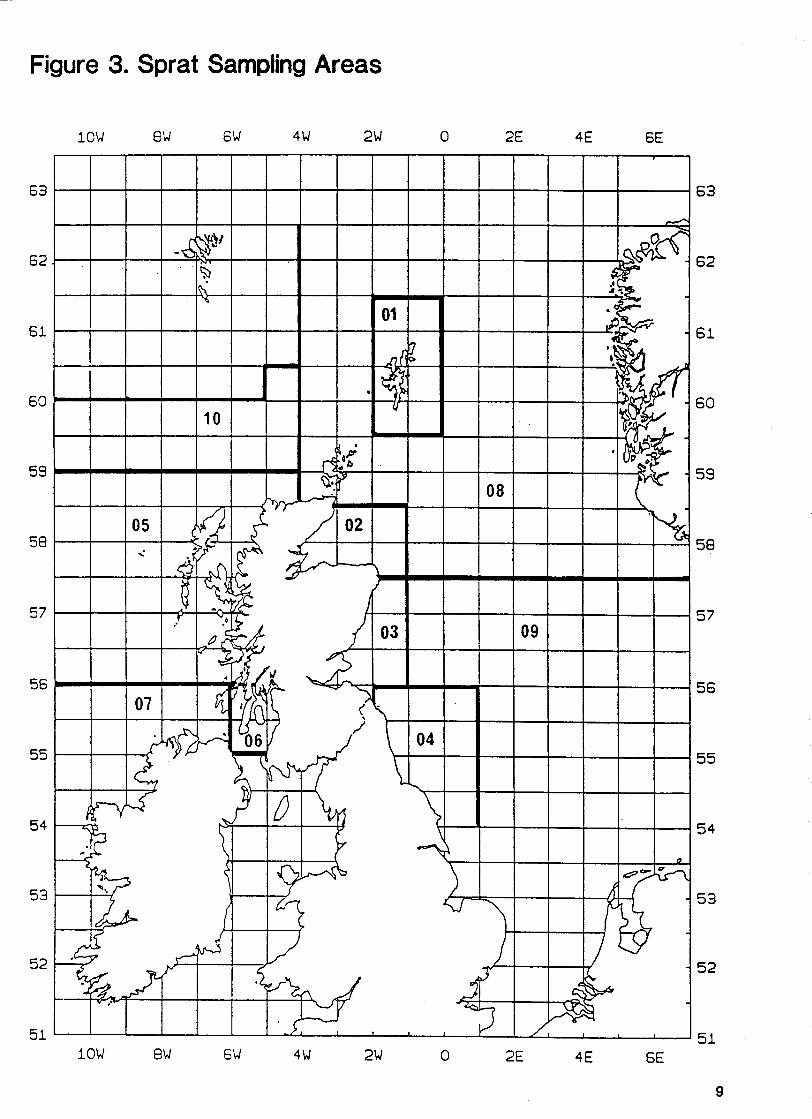
Figure 3. Sprat Sampling Areas

Figure 4. Herring Sampling Areas
1 O W 8W 6 W 4W 2W 0 2E 4E 6E

Appendix I I . Figures 5-81 showing relationships between length, total weight, and gutted weight for various species

Figure 5 . Cuckoo Ray - Raja naevus Mul,ler & Henle
Length Ccm)
0 500 1000 1500 2000
Gutted Weight Cg)
8 16 24 32 40
Length C c m l
Areas collected : Shetland
Buchan
Butt of Lewis
Data source : Discard trips
Date collected : 1981 - 1984 How measured : cm below Cwingspsn)
Annual Relationship
L/TW L/GW GW/TW
obs used 173 173 173
min L 8 8 - max L 30 30 - min TW 19 - 19
max TW 1974 - 1974
min GW - 17 17
max GW 1832 1832

Figure 6 . Blue Skate - RaJa batis Linnaeus
20 30 40
Length Ccml Length Ccml
Are- collected : Inner Hebrides
Morw Fir th
South Hi nch
Data swrce : Diecard tripe
Date collected : 1982 - 1985 cm below How measured :
obs used
min L
max L
min TW
max TW
min GW
max GW
Relationship
L/GW GW/TW
e e ie - 49 - - 88
- 1686
79 79
1713 1713
Gutted Weight Cg)

Figure 7. Spotted Ray - Raja montagui Fowler
Length Ccml Length (cml
0 500 1000 1500 2000
Gutted Weight (gl
Areas col lected : Shetland
North Coast
West Coast
of Scotland
Data source : Research vessels
Discard t r i p s
Date collected : 1977 - 1985 How measured : cm below
Annua l
L/TW
obs used 87
min L 12
max L 42
rnin TW 27
max TW 1890
rnin GW - rnax GW
Relationship
L/GW GW/TW
87 87
12 - 42 - - 27
- 1890
25 25
1794 1794
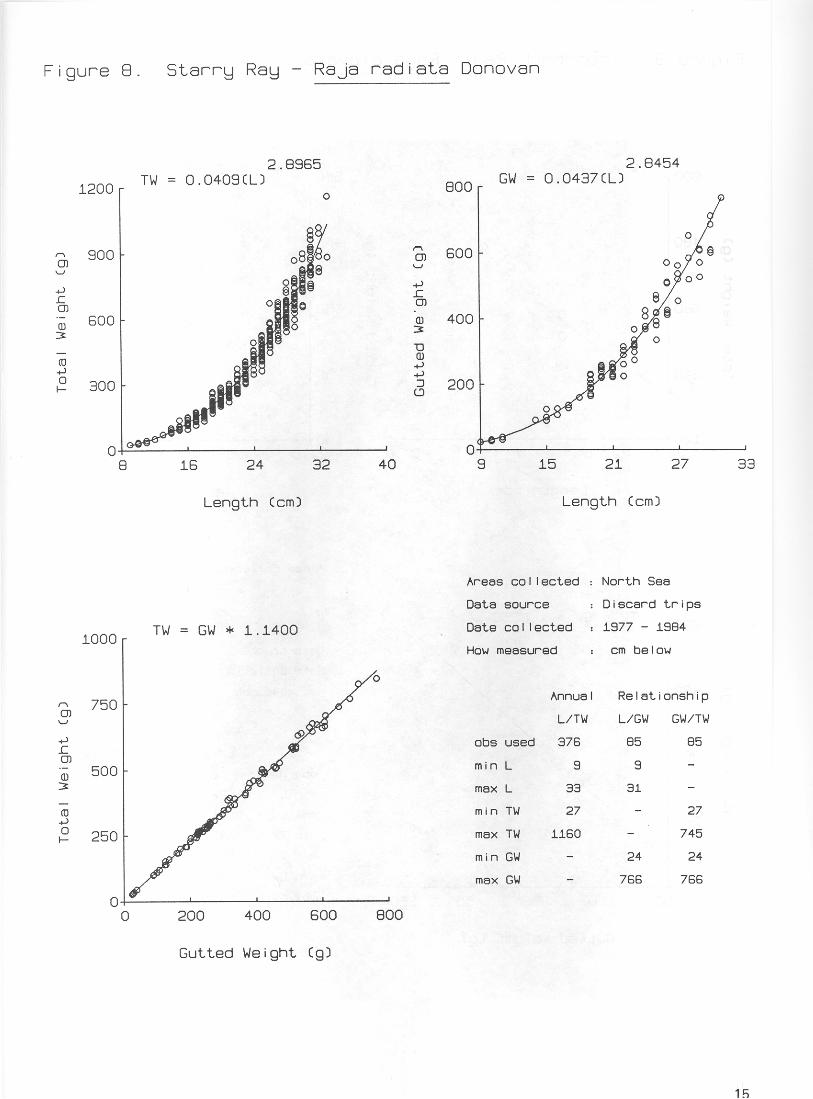
Figure 8. Starry Ray - Raja radiata Donovan
8 16 24 32 40
Length Ccrnl
9 15 21 27 33
Length (cml
Areas collected : North Sea
Data source : Discard t r i p s
Data collected : 1977 - 1984 HOW measured : cm below
obs used
min L
max L
rnin TW
max TW
rnin GW
max GW
Annual Relationship
L/TW L/GW GW/TW
376 85 85
9 9 -
33 31 -
27 - 27
1160 - 745
- 24 24
- 766 766
Gutted Weight (91

Figure 9. Thornback Ray - Raja clavata Linnaeus
24.5 27.0 29.5
Length Ccml Length Ccml
How measured :
Areas collected : Shetland
Moray Fir th
Buchan
South Min*,,)i % L -..
Data source : Discard ripe
Date collected : 1981 - 1 84
Annua l
L/TW
obs used 12
min L 22
max L 31
min TW 197
max TW 572
min GW - max GW
Gutted Weight Cgl
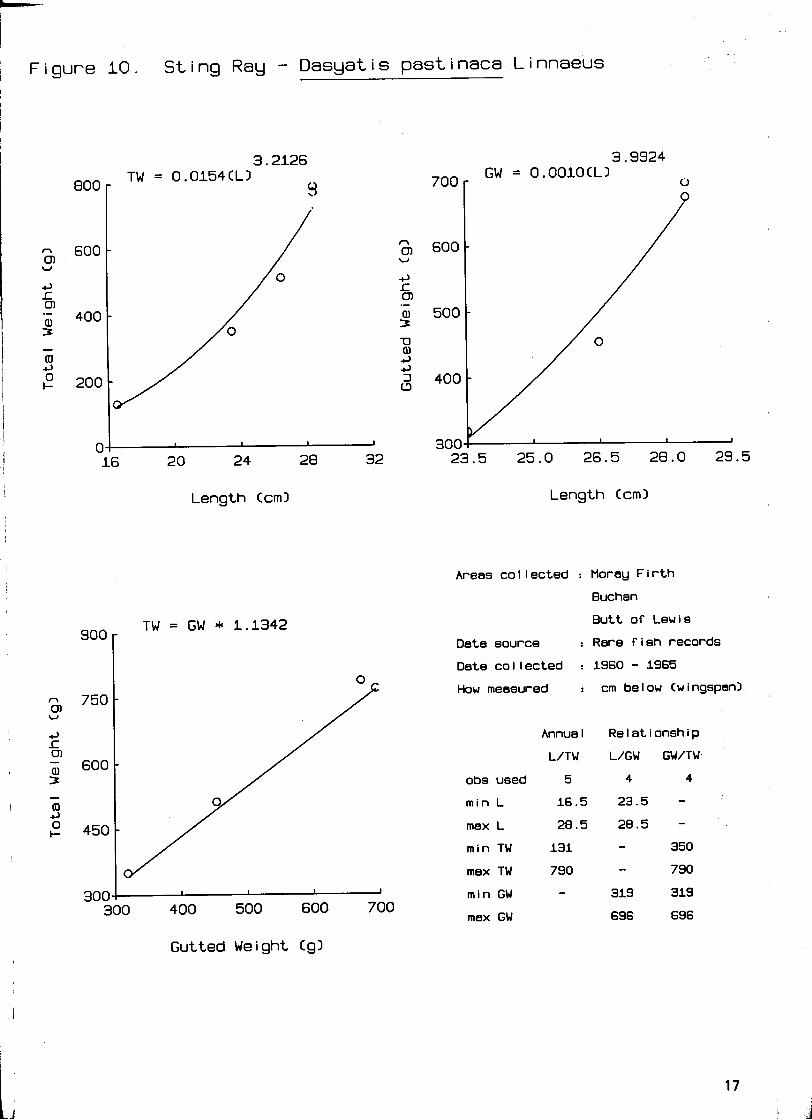
Figure 10. St ing Ray - Dasyatis pastinaca Linnaeus
20 24 28 32 23.5 25.0 26.5 28.0 29.5
Length Ccml Length tcml
Areas collected : Moray Firth
Buchan
Butt of Lewis
Data source : Rare fish records
Date col lected : 1960 - 1965
9.' How measured :
/ Annua l
L/TW
obs used 5
min L 16.5
max L 28.5
min TW 131
mex TW 790
300 I I I I min GW - 300 400 500 600 700 max GW
cm below Cwingspanl
Relationship
L/GW GW/TW
4 4
23.5 - 28.5 - - 350
- 790
319 319
696 696
Gutted Weight Cgl

Figure 11. Eagle Ray - Myl iobatis aqui la Linnaeus
Length Ccml Length Ccml
Areas collected : Buchan
Data source : Rare f i sh records
Date collected : 1957 - 1970
How measured : cm below
Annual Relationship
L/TW L/GW GW/TW .'
obs used 12 3 3
min L 27.5 27.5 - max L 58.5 51.5 - min TW 612 - 612 7
max TW 3690 - 2054
min GW - 554 554
max GW
Gutted Weight Cgl
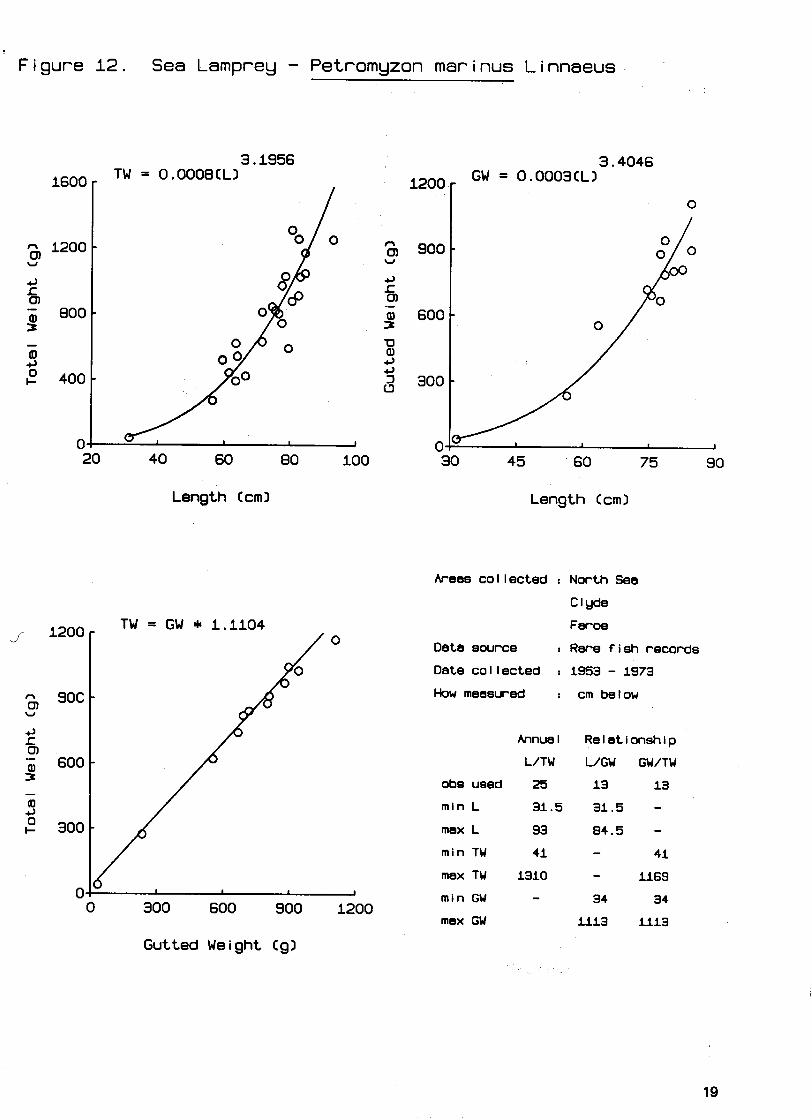
I' F igure 12. Sea Lamprey - Petromyzon mar i nus L innaeus I
40 60 80
Length Ccm)
0 300 600 900 1200
Gutted Weight Cgl
45 60 75
Length Ccm)
Areas collected : North Sea
Clyde
Faroe
Data source : Rare fish records
Date collected : 1953 - 1973 How measured : cm below
Annua I
L/TW
obs used 25
min L 31.5
max L 93
min TW 41
max TW 1310
min GW - mex GW
Relationship
L/GW GW/TW
13 13
31.5 - 84.5 - - 41
- 1169
34 34
1113 1113

Figure 13. Three-bearded Rockl ing - Gaidropsarus v u l g a r i s Cloquet
Length Ccml
32 36 40
Length Ccml
Areas collected : Shetland
Buchan
West Coast of
Scot l and
Data source : Rare fish records
Research vessels
Date collected : 1952 - 1985 How measured : cm below
Annua l Re l at i onsh i p
L/TW L/GW GW/TW
obs used 17 I1 11
min L 29.5 29.5 - max L 47 43.5 - min TW 230 - 230
max TW 972 - 764
min GW - 210 210
max GW 726 726
Gutted Weight Cgl
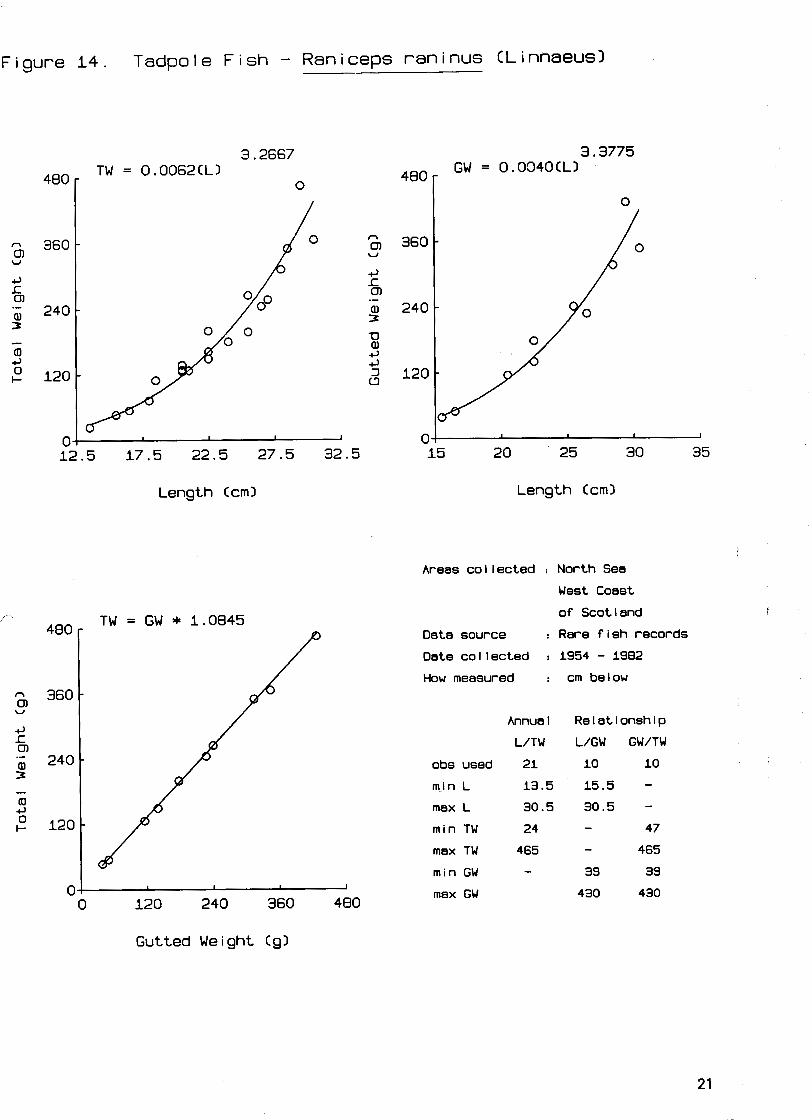
Figure 14. Tadpole F i s h - Raniceps raninus (Linnaeusl
Length Ccml
TW = GW * 1.0845
o ! I I I I
15 20 25 30 35
Length Ccml
Areas collected : North Sea
West Coast
of Scotland
Data source : Rare fish records
Date collected : 1954 - 1982 How measured : crn below
Annual Relationship
L/TW L/GW GW/TW
obs used 21 10 10
min L 13.5 15.5 - max L 30.5 30.5 - min TW 24 - 47
max TW 465 - 465
min GW - 39 39
rnax GW 430 430
Gutted Weight Cgl

Figure 15. Skipper - Scornberesox saurus CWalbauml
Length Ccml
804 I I I I
100 130 160 190 220
Gutted Weight Cgl
Length Ccm)
Areas collected : North Sea
West Coast
of Sco
Data source : Rare f
Date collected : 1932 - How measured :
Annua l
L/TW
obs used 22
min L 17
max L 40.5
min TW 13
max TW 233
min GW - rnax GW
t l and
ish records
1983
Relationship
L/GW GW/TW
13 13
30.5 - 40.5 -

1 F igure 16. Red Sea Bream - Pagel lus bogaraveo CBrunnichl
35 40 45
Length Ccml
400 800 1200 1600 2000
Gutted Weight Cgl
30 35 40 45 50
Length Ccml
Areas collected : Shetland
Buchan
Outer Hebrides
Data source : Rare f i sh records
Date collected : 1957 - 1983 How measured : cm below
Annua l
L/TW
obs used 6
min L 31.5
max L 47
min TW 520
max TW 2050
min GW - max GW
Relationship
L/GW GW/TW
6 6
31.5 - 47 - - 520
- 2050
490 490
1787 1787

Figure 17. Trigger fish - Balistes carolinensis (Gmelinl
25 30 35
Length Ccml Length Ccml
Areas collected : Butt of Lewia
Inner Hebrides
Data source : Rare f ish records
Date collected : 1984
How measured : cm below
obs used
min L
mex L
min TW
max TW
min GW
max GW
Annual Relationship
Gutted Weight Cgl
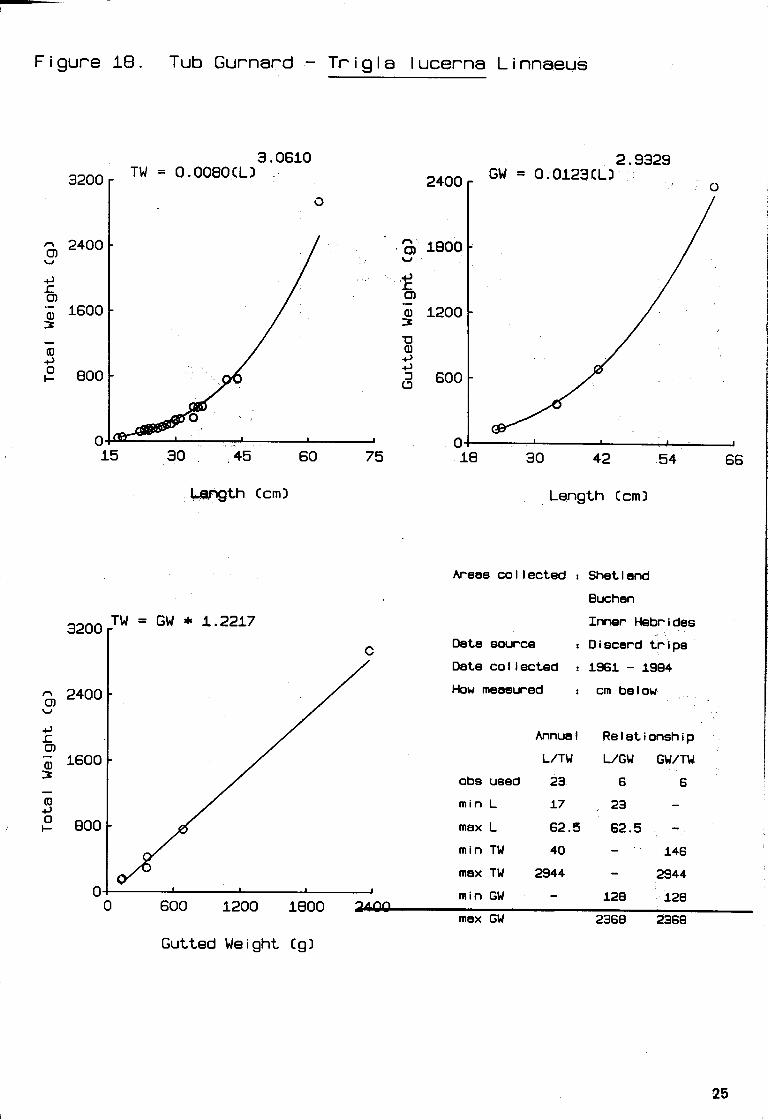
Figure 18. Tub Gurnard - T r i g l a lucerna Linnaeus
3200
2400 a, V
4 s a - 1600 3: - (0 4
eoo
0 30 42 54 66
Length C c m l
Areas collected : Shetland
Buchan
Inner Hebrides
Dete source : Discard t r ips
Date collected : 1961 - 1984
How measured : cm below
Annual Relationship
L/TW L/GW GW/TW
obs used 23 6 6
min L 17 23 - max L 62.5 62.5 - min TW 40 - 146
max TW 2944 - 2944
min GW - 0 600 n
128 1200 1800
128
max GW 2368 2368
Gutted Weiaht (a)

Figure 19. Black Fish - Centrolophus niger (Gmelinl
Length (cml Length Ccml
Areas collected : North Sea
West Coast
of Scotland
Faroe
Ice l and
Data source : Rare fish records
Date collected : 1931 - 1984 How measured I cm below
Annue I
L/TW
obs used 33
min L 39
max L 65.5
min TW 409
max TW 2462
min GW - max GW
Relationship
L/GW GW/TW
19 19
39 - 65.5 - - 409 - 2380
368 368
2110 2110

Figure 20. Bass - Dicentrarchus labrax (Linnaeusl
36 44 52
Length Ccml Length Ccml
Areas collected : Buchan
Clyde
Inner Hebrides
Data source : Rare f ish records
Date collected : 1955 - 1977 How measured
obs used
min L
max L
min TW
max TW
min GW
max GW
Annua l
L/TW
32
29.5
58
275
2050
-
Relationship
L/GW GW/TW
21 21
29.5. - 54.5 - - 275
- 2041
259 259
1906 1906
Gutted Weight Cgl

Figure 21. Ling - Molva molva (Linnaeus)
30 42 54
Length Ccm)
32 40 48 56 64
Length Ccm)
Areas collected : North Sea
Data source
Date collected :
How measured
Annua l
L/TW
obs used 19
min L 20
max L 60
min TW 33
max TW 1358
min GW - max GW
Research vessels
Discard trips
1978 - 1985 cm be l ow
Relationship
L/GW GW/TW
16 16
33 - 60 - - 125
- 1358
117 117
1194 1194
Gutted Weight Cgl
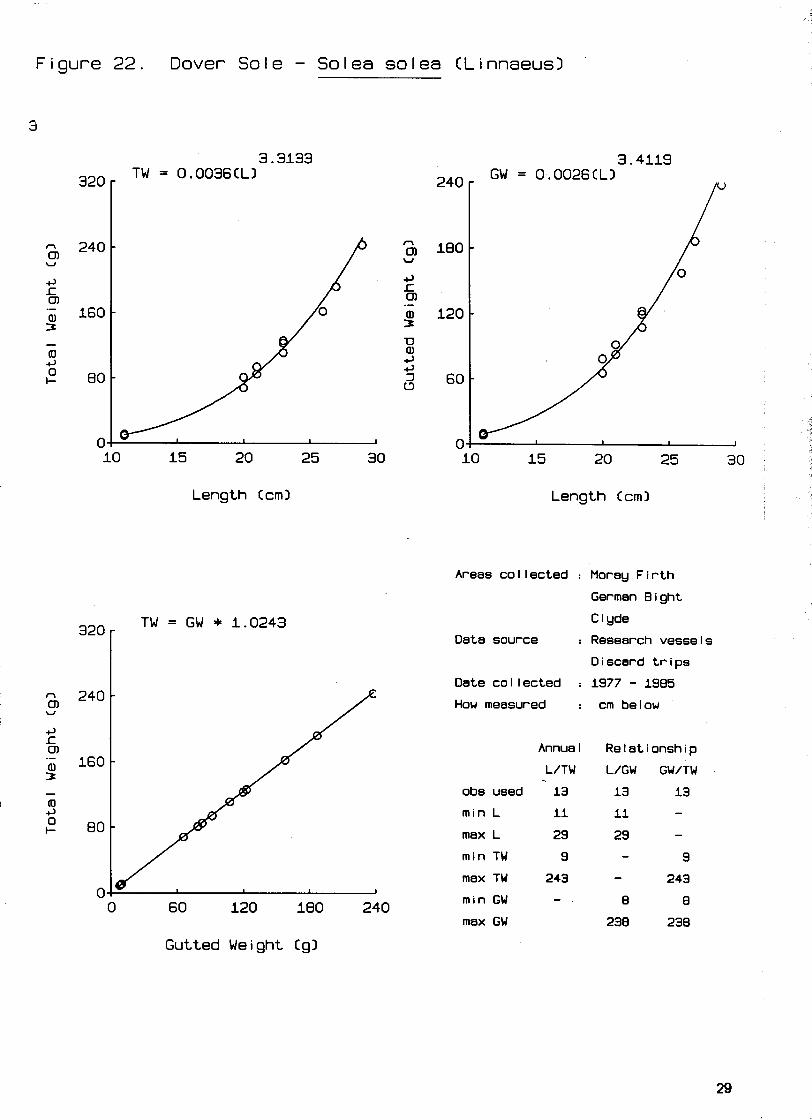
Figure 22. Dover Sole - Solea solea (Linnaeusl
3
15 20 25
Length Ccml
- 0 60 120 180 240
Gutted Weight Cgl
Length Ccml t
Areas collected : Moray Firth
German Bight
Clyde
Data source : Research vessels
Discard trips
Date collected :
How measured
Annua l
L/TW
obs used 13
min L 11
max L 29
min TW 9
max TW 243
min GW - max GW
Relationship
L/GW GW/TW
13 13
11 - 29 - - 9
- 243
8 8
238 238

Figure 23. Gar f i sh - Belone belone (Linnaeusl
Length Ccm) Length Ccml
Areas col lected : North Sea
West Coast
of Scotland
Data source : Rare f ish records
Date collected : 1958 - 1984
How measured
Annua l
L/TW
obs used 20
min L 30.5
max L 76.5
min TW 24
max TW 609
min GW - max GW
Relationship
L/GW GW/TW
9 9
30.5 - 71 - - 24 - 529
22 22
494 494
Gutted Weight Cgl
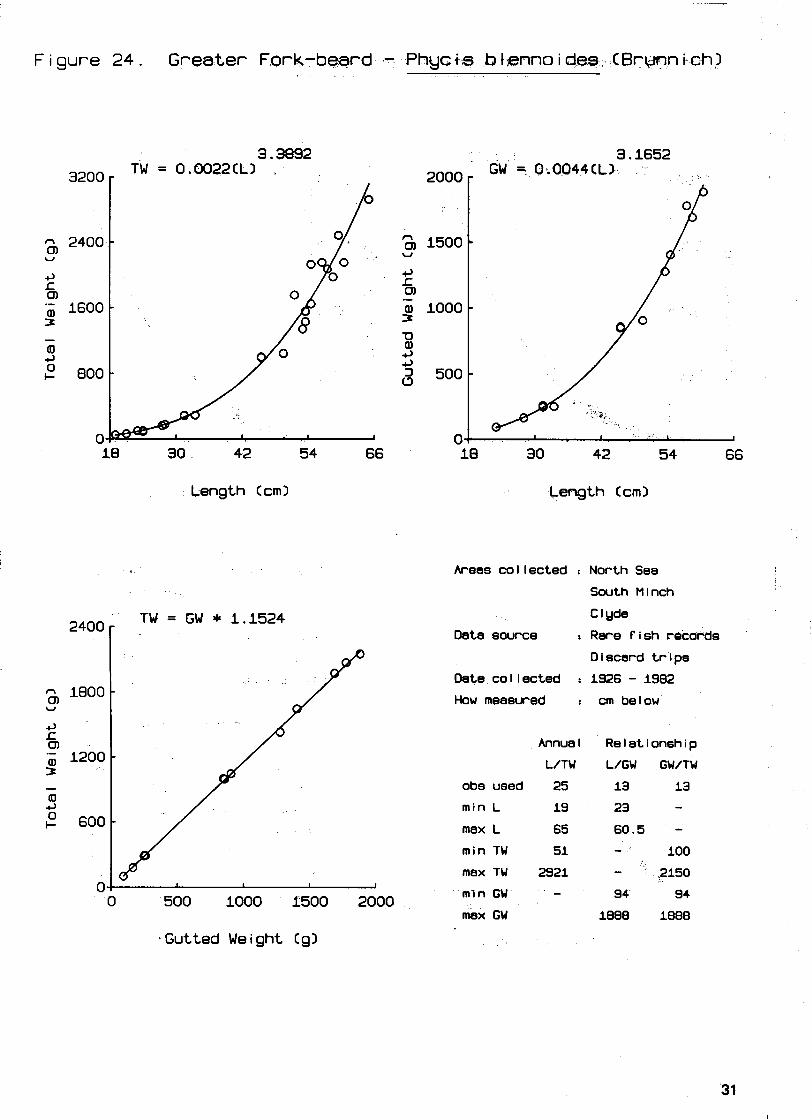
Figure 24. Greater Fork-beard - Phycis blennoides ( B r ~ n i c h l
Length Ccml
30 42 54 66
Length Ccml
Areas collected : North Sea
Swth Minch
Clyde
Data source : Rare fish records
Discard trips
Date collected : 1926 - 1982 HOW measured
obs used
min L
max L
min TW
max TW
0 500 1000 1500 2000 m-in GW
max GW
.Gutted Weight Cgl
cm be l ow
Relationship
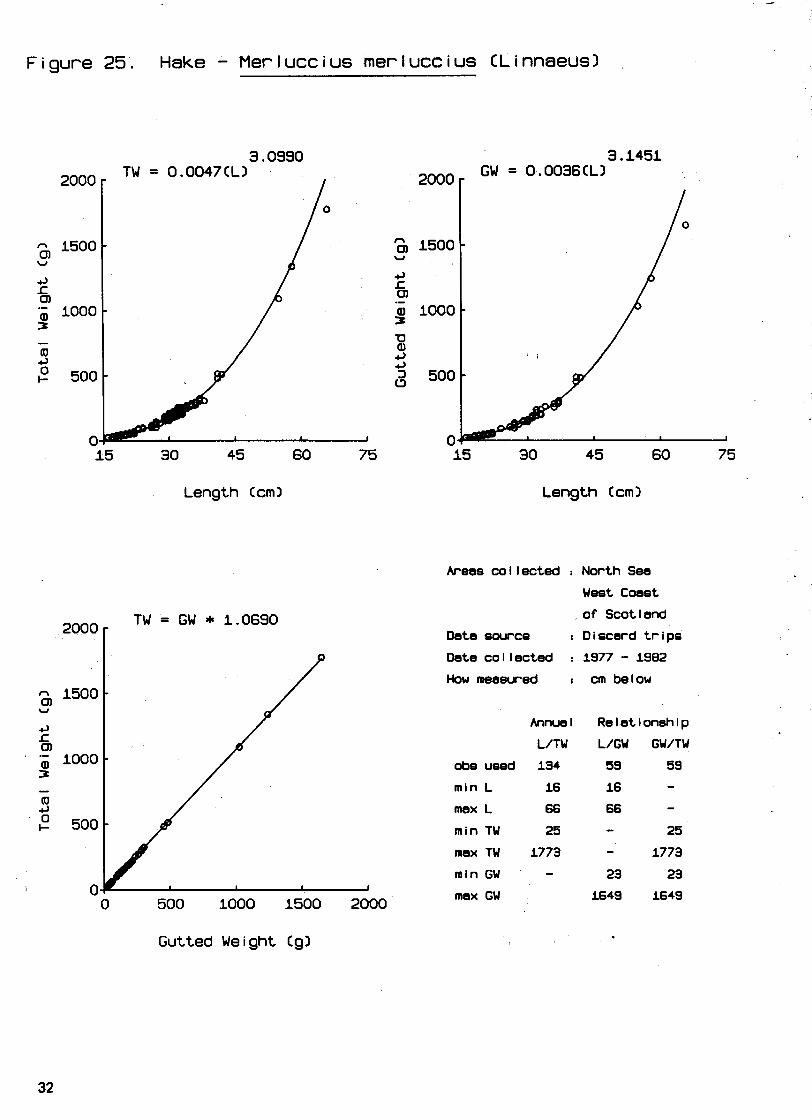
Figure 25. Hake - Merluccius merluccius CLinnaeusl
Length Ccml
Gutted Weight Cgl
15 30 45 60 75
Length Ccml
Areas collected : North Sea
West Coast
of Scotland
Data source I Discard t r ipe
Date collected : 1977 - 1992 HOW measured :
obs used
min L
mex L
min TW
max TW
min GW
msx GW
Annual
L/TW
134
16
66
25
1773 -
cm below
Relationship

Figure 26. Greater Weever - Trachinus draco Linnaeus
Length Ccml Length Ccml
Areas collected : Shetland
Moray F i r t h
Buchan
Data source : Rare f ish records
Discard t r i p s
Date collected : 1957 - 1984 How measured : cm below
Annua l
L/TW
obs used 29
min L 24.5
max L 35
min TW 73
max TW 344
min GW - max GW
Relationship
L/GW GW/TW
14 14
25 -
31.5 - - 90 - 244
84 84
231 231
Gutted Weight Cg)

Figure 27. Grey Mullet - Mugi l cephalus Linnaeus
-
20 30 40 50
Length Ccml
- 24 32 40 48 56
Length Ccml
Areas collected : Moray F i r t h
Buchan
West Coast
of Scot I and
Data source : Rare f ish records
Date collected : 1937 - 1970
How measured : cm below
Annual Relationship - L/TW L/GW GW/TW
obs used 32 8 8
min L 26.5 26.5 - max L 56.5 51 , - min TW 220 - 220
mex TW 2314 - 1603
Gutted Weight Cgl
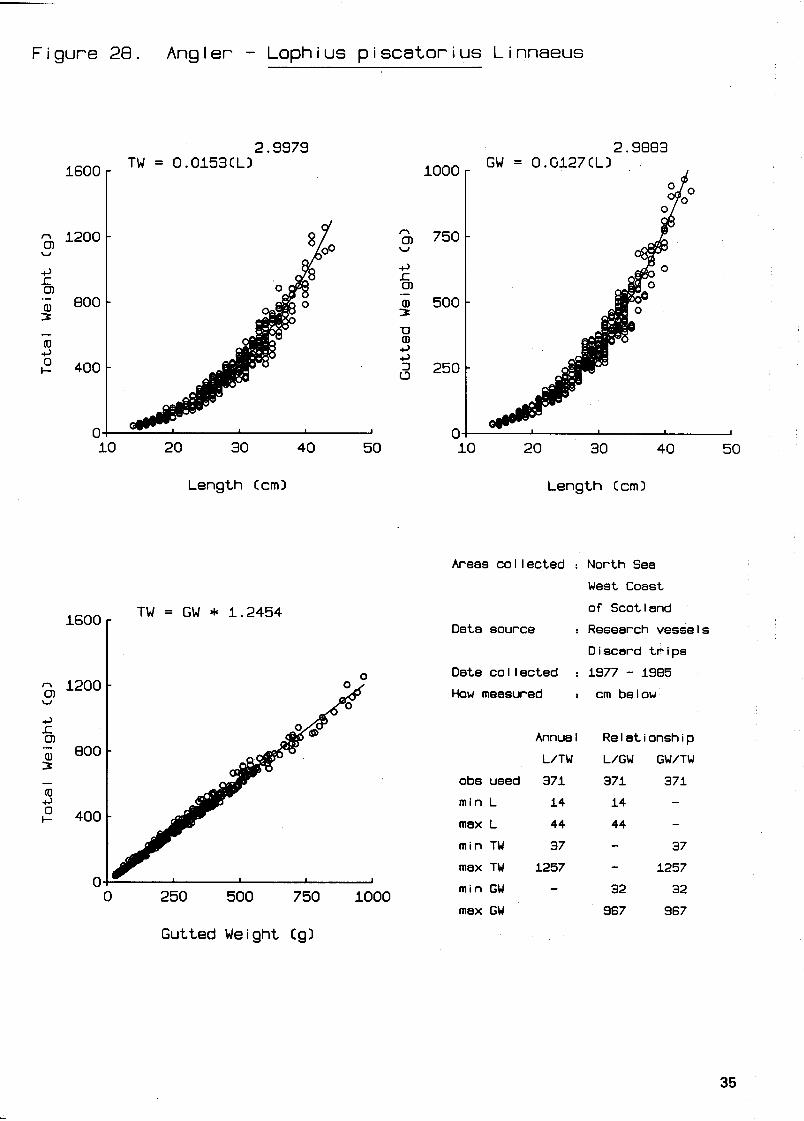
Figure 28. Angler - Lophius piscatorius Linnaeus
10 20 30 40 50
Length Ccml
0 250 500 750 1000
Gutted Weight Cgl
10 20 30 40
Length Ccml
Areas collected : North Sea
West Coast
of Scotland
Data source : Research vessels
Discard t r i p s
Date collected : 1977 - 1985
How measured : cm below
Annua l
L/TW
obs used 371
min L 14
max L 44
min TW 37
max TW 1257
min GW - max GW
Relationship
L/GW GW/TW
371 371
14 - 44 - - 37 - 1257
32 32
967 967

Figure 29. Black Sea Bream - Spondyl iosoma cantharusCLinnaeus1
Length Ccm)
Gutted Weight Cg3
Length Ccml
Areas collected : North Sea
West Coast
of Scotland
Data source : Rare f i s h records
Date collected : 1955 - 1974
H o w measured : cm below
Annual Relationship
L/TW L/GW GW/TW
obs used 43 16 16
min L 18.5 23.5 - max L 41.5 41.5 - min TW 106 - 209
msx TW 1268 - 1268
m i n GW AW+'-%, b , 198 ' *
m x ow 4 wd ' ' ' 1174
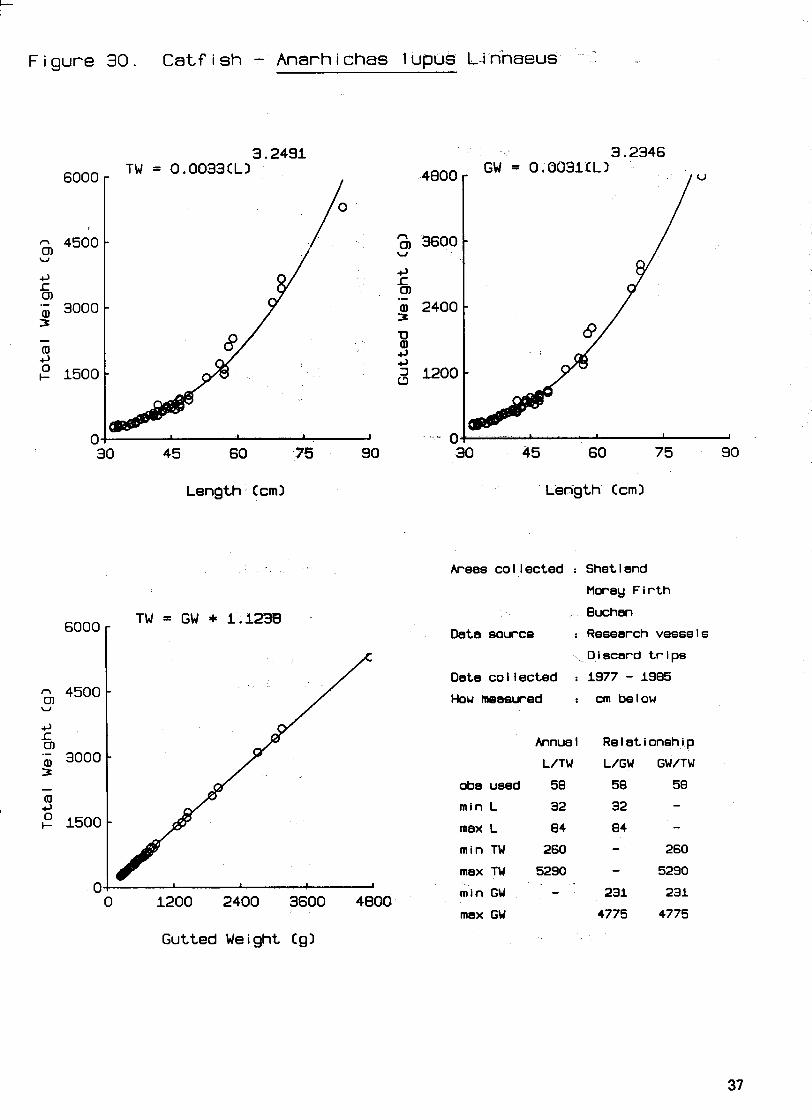
Figure 3 0 . Catfish - Anarhichas lupus L-innaeus
45 60 35 90
Length Ccm)
Gutted Weight Cgl
Length Ccm)
Areas collected : Shetland
Moray F i r th
k h a n
Data source : Research vessels
Discard t r ips
Date collected : 1977 - 1985
obs used
min L
max L
min TW
max TW
min GW
max GW
cm be l ow
Relationship

Figure 31. B r i I I - Scophthalmus rhombus CLinnaeus)
0 0 25 30 35 40 45
Length Ccml Length Ccml
Areas collected : North Sea
Clyde
Data emume I Resesrch vessels
Diacsrd t r ips
Date collected : 1979 - 1985
How measured : cm below
AmKlsI
L/TW
obs used 7
min L 25
msx L 43
min TW 242
max TW 1562
min GW - msx GW '
Relationship
L/GW GW/TW
4 4
25 - 43 - - 242
- 1562
228 228
1529 1529
Gutted Weight Cgl

Figure 32. Blue-Mouth - He l icolenus dactylopterusCDelaroche3
21 27 33 39
Length Ccml Length Ccml
Areas col lected : Moray F i r t h
Buchan
For t i es
Data source : Rare f i s h records
Date col lected : 1956 - 1968 How measured : cm below
Annua l Re l a t i onsh i p
L/TW L/GW GW/TW
obs used 6 6 6
rnin L 15.5 15.5 - max L 38.5 38.5 - m i n TW 68 - 68
mex TW 1044 - 1044
m i n GW - 63 63
max GW 954 954
Gutted Weight Cgl
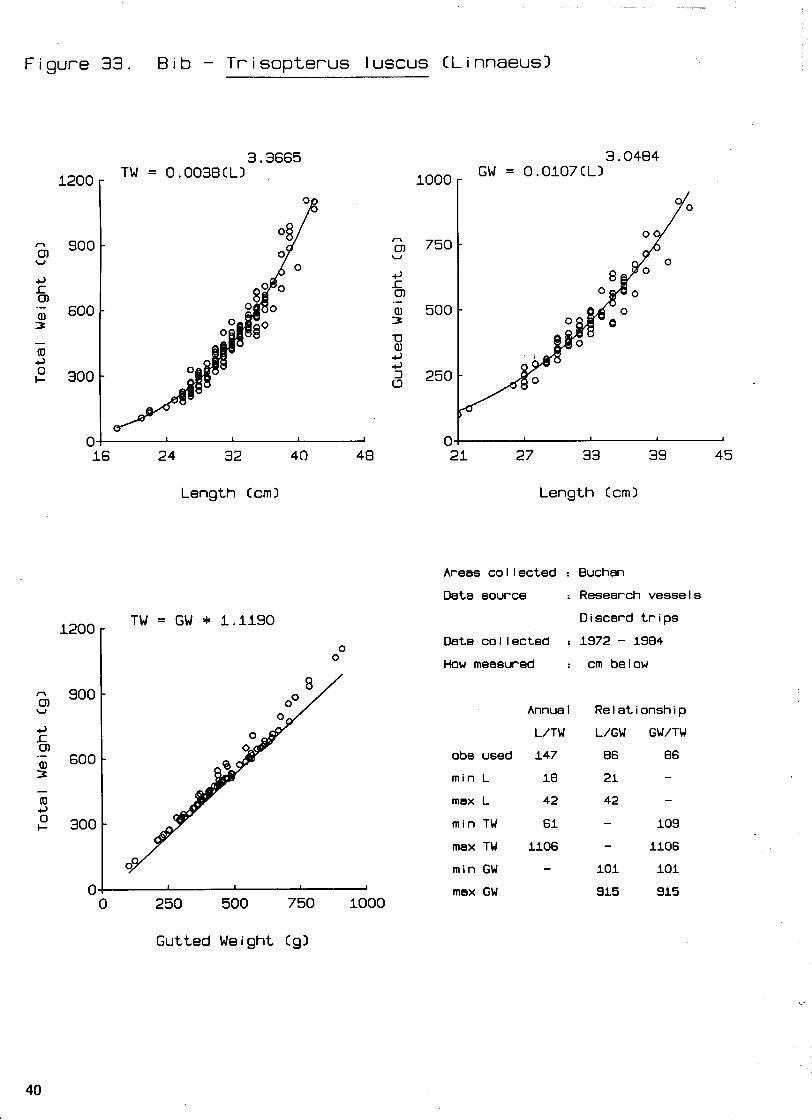
Figure 33. Bib - Trisopterus luscus CLinnaeus3
Length C c m l Length Ccml
Areas collected : Buchan
Data source : Research vessels
Discard t r ips
Date collected : 1972 - 1984 How measured : cm below
Annua l
L/TW
obs used 147
min L 18
max L 42
min TW 61
rnax TW 1106
min GW - max GW
Relationship
L/GW GW/TW
86 86
21 -
42 -
- 109
- 1106
101 101
915 915
Gutted Weight Cgl
!
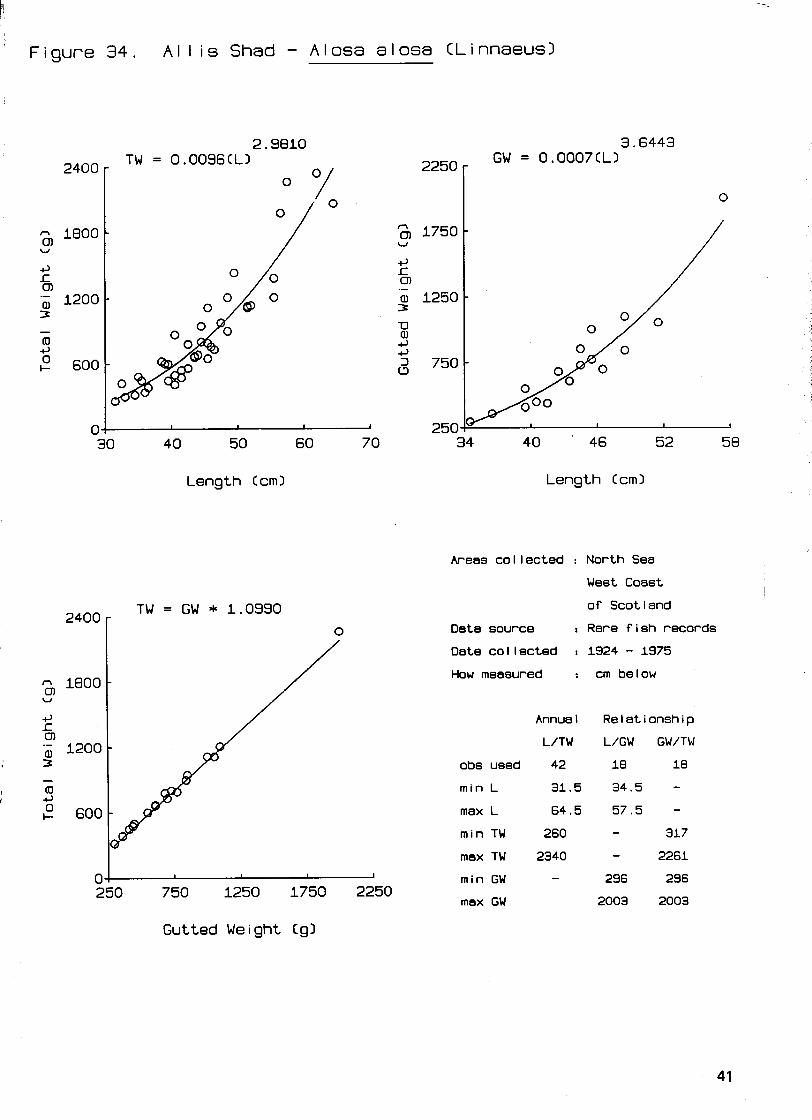
F igure 34. All i s Shad - Alosa alosa CLinnaeusl
Length Ccml Length Ccml
Areas collected : North Sea
West Coast
of Scotland
Data source : Rare f i sh records
Date collected : 1924 - 1975 How measured : cm below
Annua l
L/TW
obs used 42
min L 31.5
max L 64.5
min TW 260
max TW 2340
min GW - max GW
Relationship
L/GW GW/TW
18 18
34.5 - 57.5 - - 317
- 2261
296 296
2003 2003
Gutted Weight Cgl

Figure 35. Cuckoo Wrasse - Labrus mixtus Linnaeus
16 24 32 40 48 20 24 28 32 36
Length (cml Length Ccml
Areas collected : North Sea
West Coast
TW = GW * 1.0653 of Scotland
Data source : Rare fish records
Date collected : 1957 - 1984
How measured
Annua l
L/TW
obs used 80
min L 18
max L 43
min TW 65
max TW 1318 I I I 1 I min GW - 60 180 300 420 540
max GW
cm be l ow
Relationship
L/GW GW/TW
9 9
20.5 - 32.5 - - 107
- 522
102 102
506 506
Gutted Weight Cgl
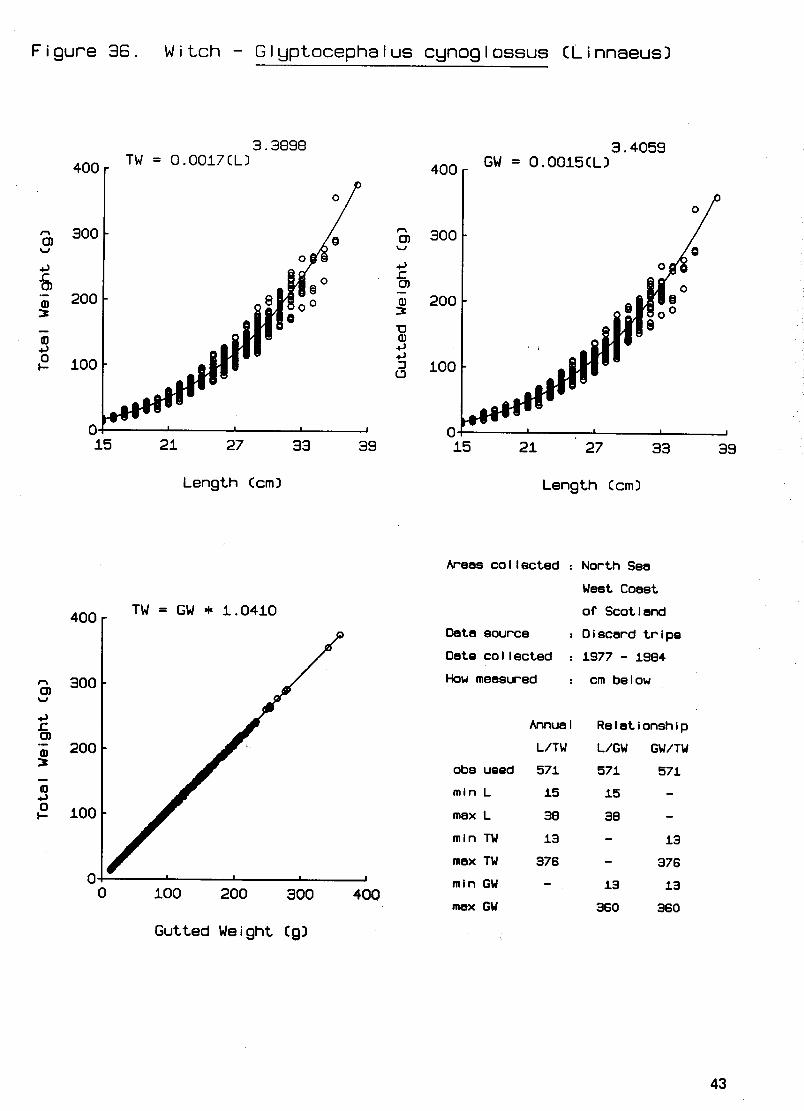
Figure 36. Witch - Glyptocephalus cynoglossus CLinnaeusl
Length Ccml
Gutted Weight Cgl
15 21 27 33 39
Length Ccml
Areas collected : North Sea
West Coast
of Scotland
Data source I Discard t r ipe
Date col lected : 1977 - 1984
How measured : cm below
Annual Relationship
obs used
min L
max L
min TW
max TW
mln GW
mex GW
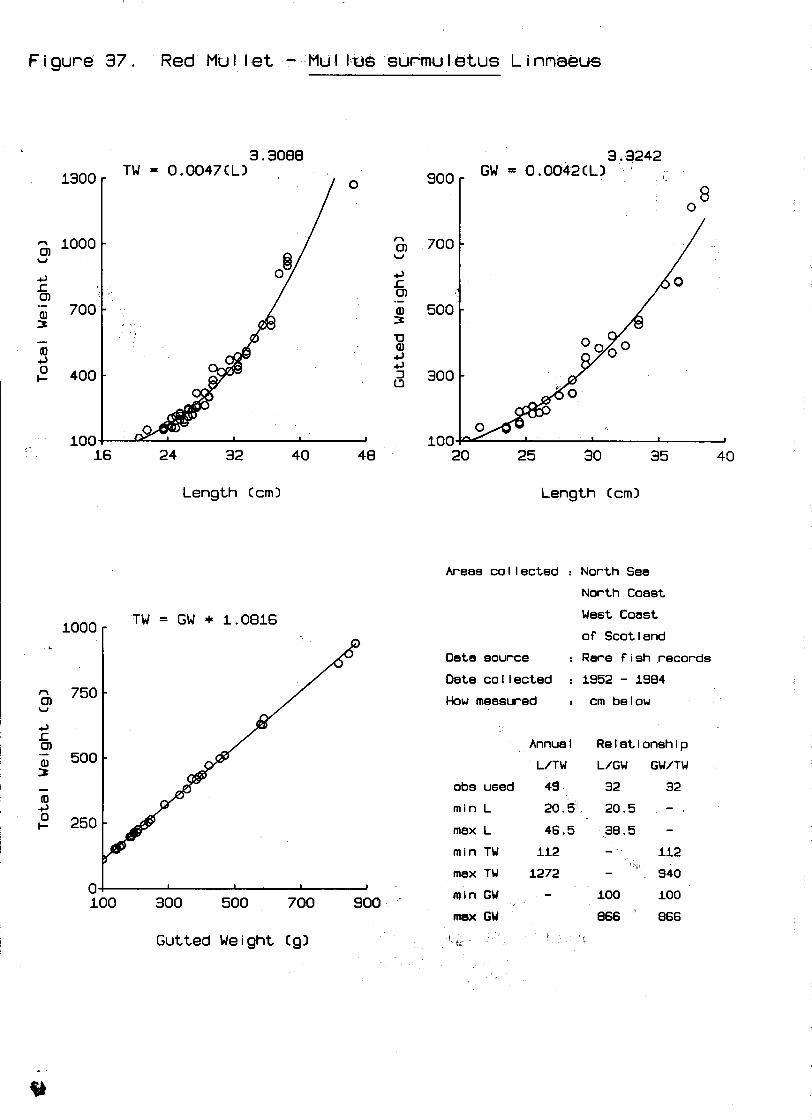
Figure 37. Red Mul le t - MU1 1 . ~ 6 swrnuletus Linnabs
24 32 40
Length Ccml
Gutted Weight Cgl
Length Ccm)
Areas collected : North Sea
North Coast
West Coast
of Scotland
Data source : Rare f i sh records
Date collected : 1952 - 1984
How measured : cm below
Annual Relationship
L/TW L/GW GW/TW
obs used 49 32 32
min L 20.5 20.5 - . max L 46.5 30.5 - min TW 112 - . 112
max TW 1272 - 940
min GW - 100 100
max GW 866 ' 866
' L
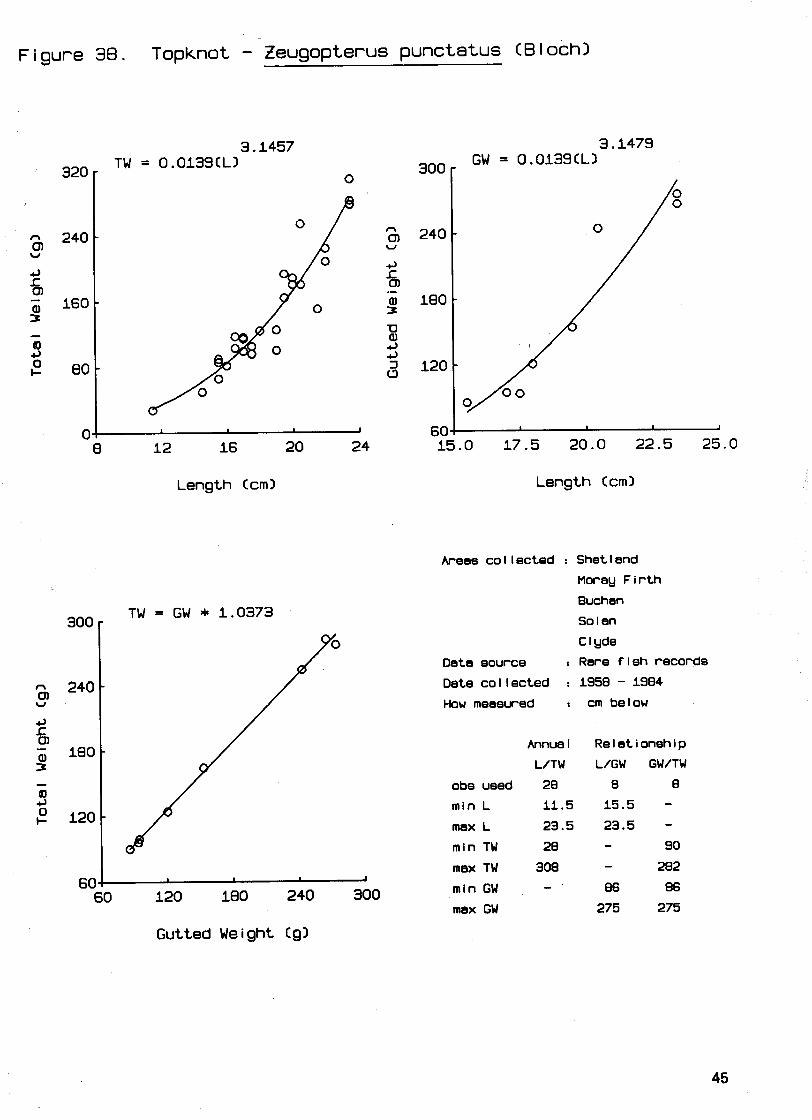
Figure 38. Topknot - Zeugopterus punctatus (Bloch)
12 16 20
Length (cml Length Ccml
Areas collected : Shetland
Moray Firth
Buchen
So l an
Clyde
Data source : Rare fish records
Date collected : 1958 - 1984 How measured I cm below
Annual Relationship
L/TW L/GW GW/TW
obs used 28 8 8
min L 11.5 15.5 - max L 23.5 23.5 - min TW 28 - 90
max TW 308 - 282 60 ! 1 I 1 1
min GW - 120 180 240 300 86 86 60
max GW 275 275
Gutted Weight Cgl

Figure 39. Turbot - Scophthalmus maximus (Linnaeusl
Length Ccrnl
48 56 64 72 80
Length Ccrnl
Areas collected : Buchan
Data source : Research vessels
TW = GW * 1.0643 Oate collected : 1901 - 1985 loo00 -
How measured : cm below
n 8000 - Annual Relationship 0) u L/TW L/GW GW/TW
4 s obs used 4 4 4 m .- 6000 - min L 50 50 - al 3 mex L 75 75 - -
m i n TW 2457 - 2457
mex TW 9720 - 9720
min GW - 2317 2317
max GW 9184 9184
2000 4000 6000 8000 loo00
Gutted Weight Cgl

Figure 40 . Twaite Shad - Alosa f a l l a x (Lacepedel I
33 39 45
Length Ccml Length Ccml
Areas collected : North Sea
West Cmst
TW = GW * 1.1362 of Scotland 0 . Data source I Rare f ish records
Date collected : 1931 - 1979
00 How measured : cm below
Annual Relationship
L/TW L/GW GW/TW
obs used 80 58 58
min L 27.5 27.5 - max L 50.5 50.5 - min TW 167 - 168
max TW 1335 - 1335
min GW - 156 156 150
0 300 600 900 1200 max GW 1165 1165
Gutted Weight Cg)

Figure 41. Red Band-fish - Cepois rubescens Linnaeus
40 50 60
Length Ccml
30 40 . 50 60 70
Length Ccml
Areas collected : South Minch
Clyde
I r i s h Sea
Date source : Rare f i sh records
Date collected : 1959 - 1984
How measured :
Annua I
L/TW
obs used 12
min L 33.5
mex L 60
min TW 34
mex TW 142
min GW - max GW
Relationship
L/GW GW/TW
6 6
33.5 - 68 - - 42
- 142
38 38
136 136
Gutted Weight Cg)

Figure 4 2 . Common Dab - Limanda l imanda CLinnaeusl
Length Ccm) Length Ccm)
Areas collected : Shetland
Moray F i r th
Buchen
Swth Minch
Dsts source : Discard t r ips
Date collected : 1977 - 1904
How measured r cm below
Annual Relationship
L/TW L/GW GW/TW
obs used 575 575 575
min L 9 9 - msx L 37 37 - min TW 7 - 7
mex TW 608 - 608
min GW - 7 7
max GW 567 567
Gutted Weight Cgl
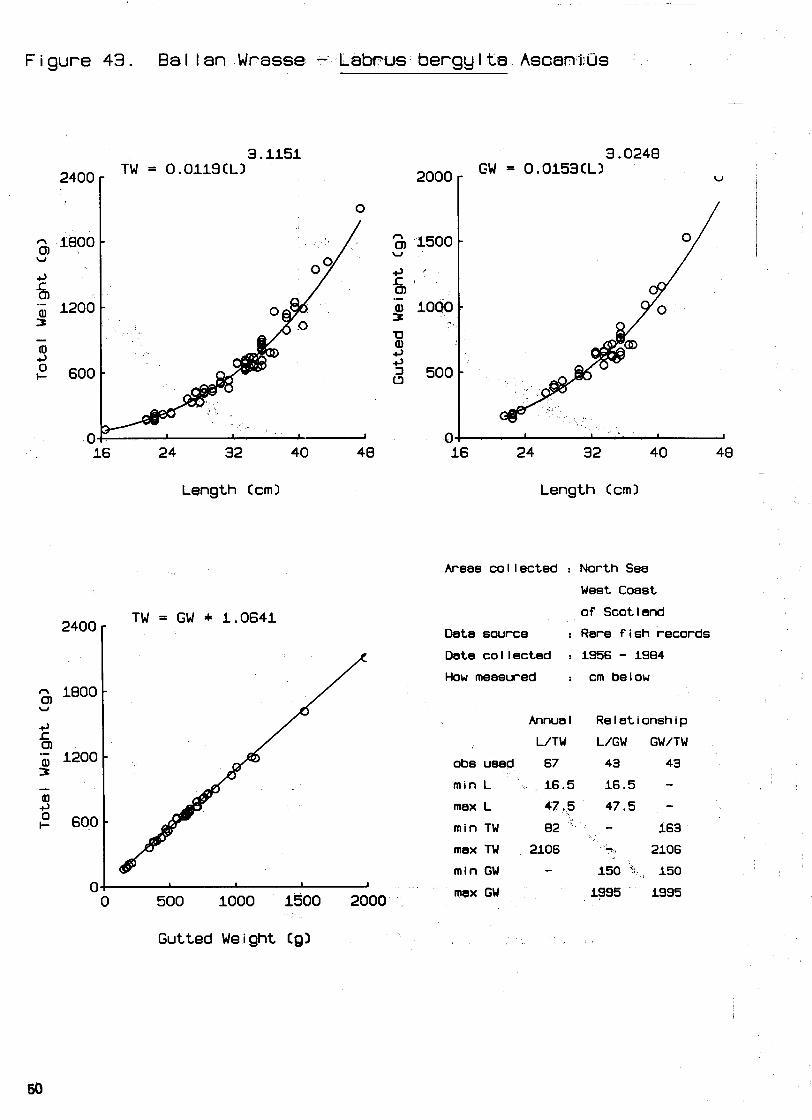
Figure 43. Bat tan Wrasse - Labus bergytte Ascentijs
Length Ccm) Length Ccm)
Areas collected : North Sea
West Coast
of Scotland
Data source r Rare f i sh records
Date collected : 1956 - 1984 How measured : cm below
1800 - a, u
4 Annual Relationship
L 0 L/TW L/GW GW/TW . 1200 - 3
obs ueed 67 43 43
- min L 16.5 16.5 - (0 4 max L 47.5 47.5 - f 600 - min TW - 82 163
max TW 2106 4, 2106
min GW - 150 5 a 150 0 8
I 1 I 1
0 500 1000 1500 2000 max GW 19S5 1995
Gutted Weight Cgl
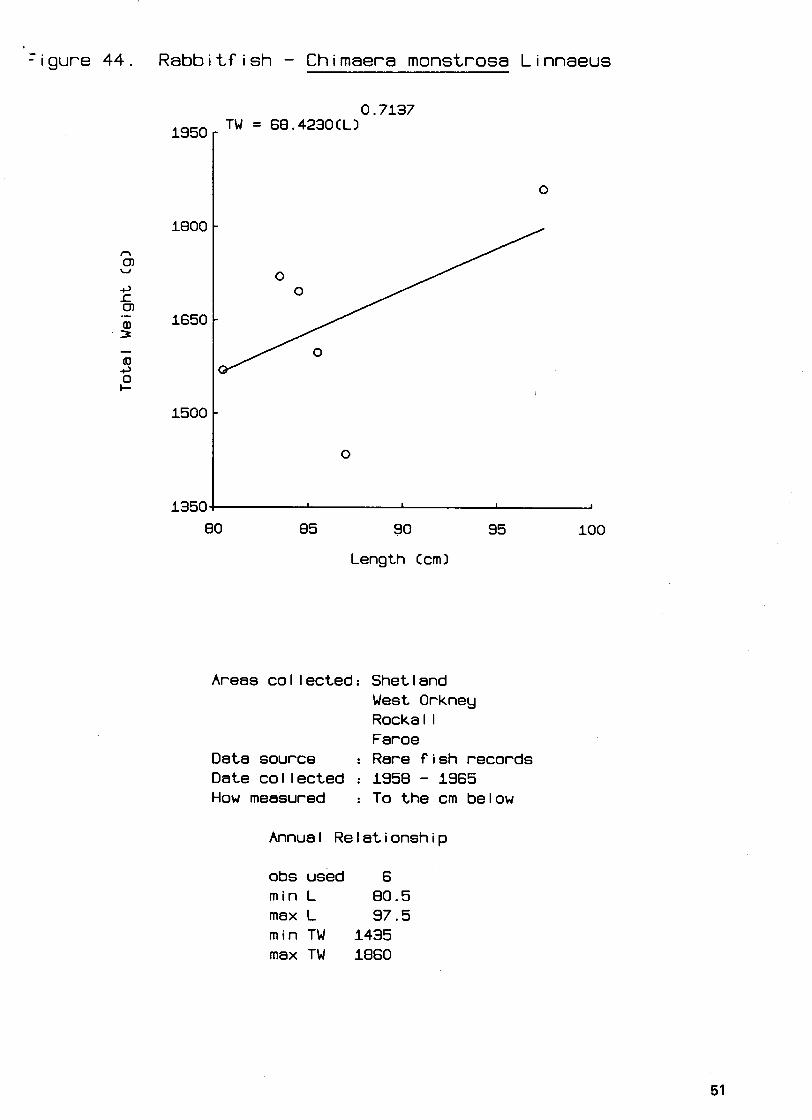
- -igure 44. Rabbitfish - Chimaera monstrosa Linnaeus
Length Ccml
Areas collected: Shetland West Orkney Rocka l I Faroe
Data source : Rare fish records Date collected : 1958 - 1965 How measured : To the cm below
Annual Relationship
obs used 6 min L 80.5 max L 97.5 min TW 1435 max TW 1860
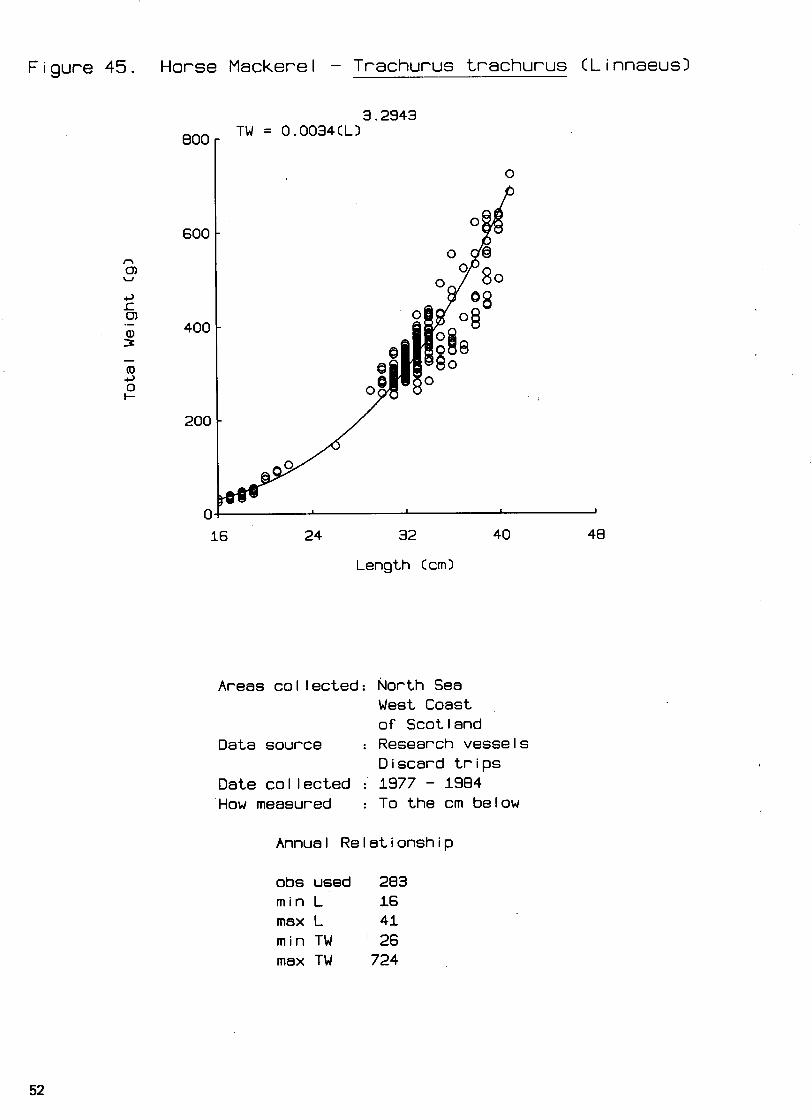
Figure 45. Horse Mackerel - Trachurus trachurus (Linnaeusl
16 24 32 40 48
Length Ccml
Areas col lected: North Sea West Coast of Scotland
Data source : Research vessels Discard t r i p s
Date col lected : 1977 - 1984 How measured : To the cm below
Annual Relationship
obs used 283 min L 16 max L 41 min TW 26 max TW 724
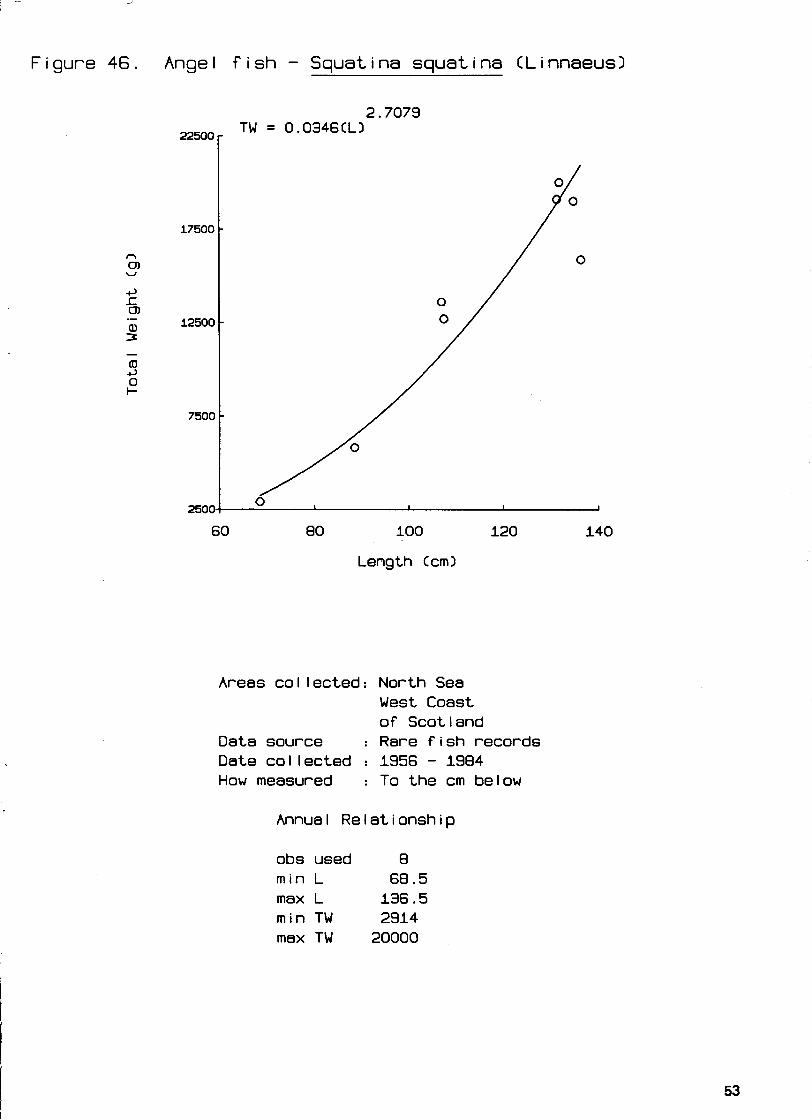
Figure 46. Angel fish - Squatina squatina CLinnaeusI
60 80 100 120 140
Length Ccml
Areas collected: North Sea West Coast of Scotland
Data source : Rare f i sh records Date collected : 1956 - 1984 How measured : To the cm below
Annual Relationship
obs used 8 min L 68.5 max L 136.5 min TW 2914 max TW 20000

Figure 47. Bogue - Boops boops CLinnaeusl
1.6484
23.4 24 .O 24.6 25.2 25.8
Length Ccm3
Areas collected: Buchan Humber South Minch
Data source : Rare fish records Date collected : 1959 - 1964 How measured : To the cm below
Annual Relationship
obs used 3 min L 23.5 max L 25.5 min TW 146 max TW 171
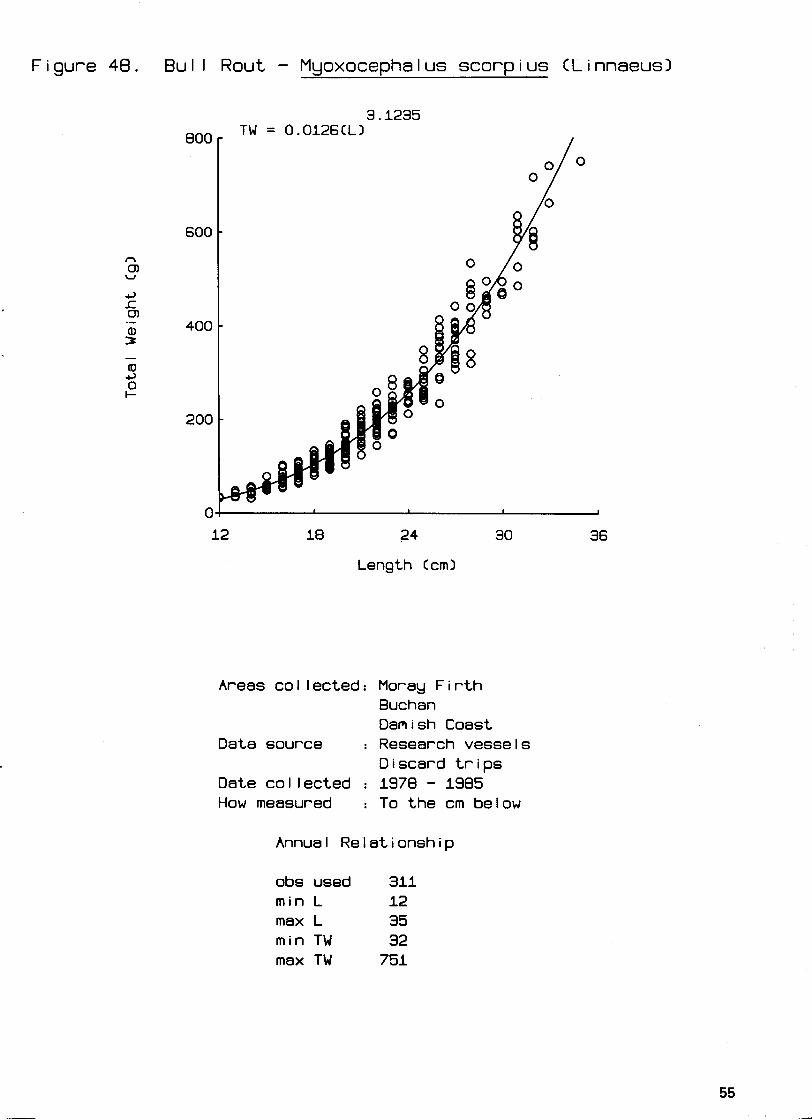
Figure 48. Bull Rout - Myoxocephalus scorpius CLinnaeusl
12 18 ?4 30 36
Length Ccml
Areas col lected: Moray F i r t h Buchan Danish Coast
Data source : Research vessels Discard t r i p s
Date col lected : 1978 - 1985 How measured : To the cm below
Annual Relationship
obs used 311 m i n L 12 max L 35 min TW 32 max TW 751
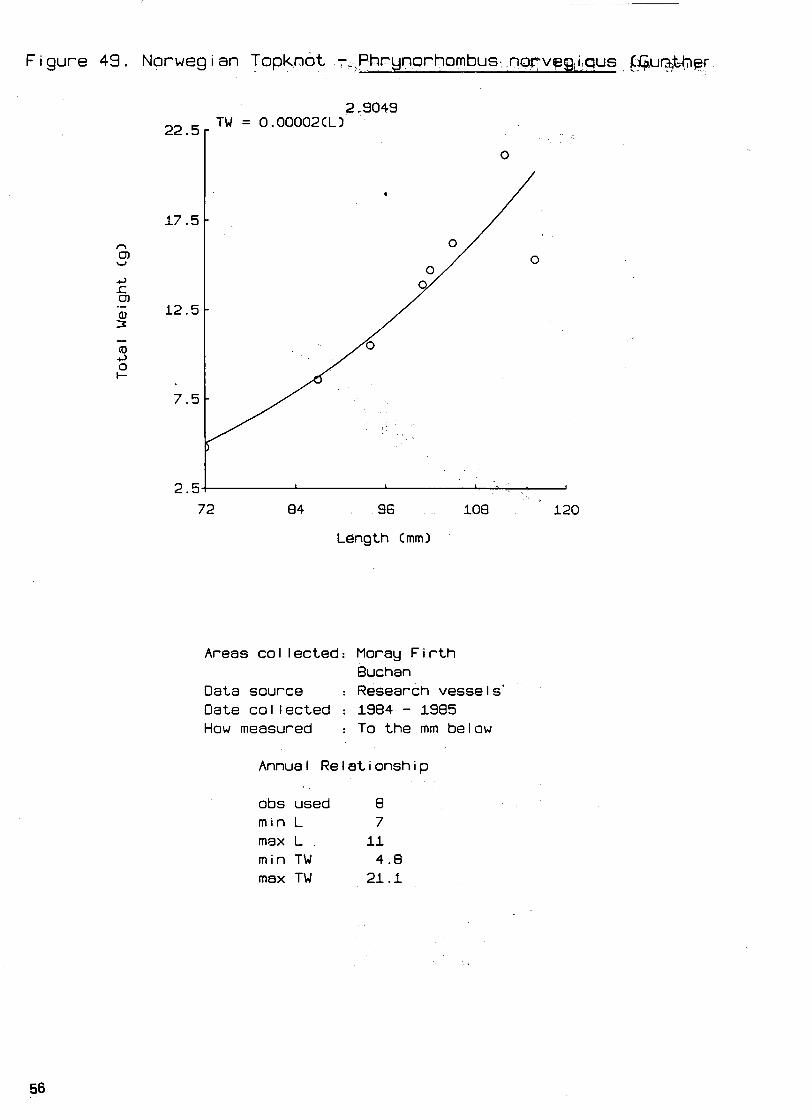
72 84 96 108 120
Length Cmm)
Areas cot lected: Moray Firth Buchan
Data source : Research vessels' Date collected : 1984 - 1985 How measured : To the mm below
Annual Relationship
obs used 8 min L 7 msx L 11 min TW 4.8 max TW 21.1

-igure 50. Sunfish - Mola mola CLinnaeusl
Areas collected: Danish Coast Humber North Coast
Data source : Rare fish records Date collected : 1941 - 1984 How measured : To the cm below
Annual Relationship
obs used 13 m i n L 46 max L 213 min TW 4.90 max TW 762.00

8 .
Figure 51. Ray's Bream - Brama brama CBonnaterreI
32 40 48 56 64
Length Ccml
Areas col lected: North Sea South Minch
Data source : Rare fish records Date collected : 1965 - 1984 How measured : To the cm below
Annual Relationship
obs used 11 min L 35 max L 61 min TW 374 max TW 2860
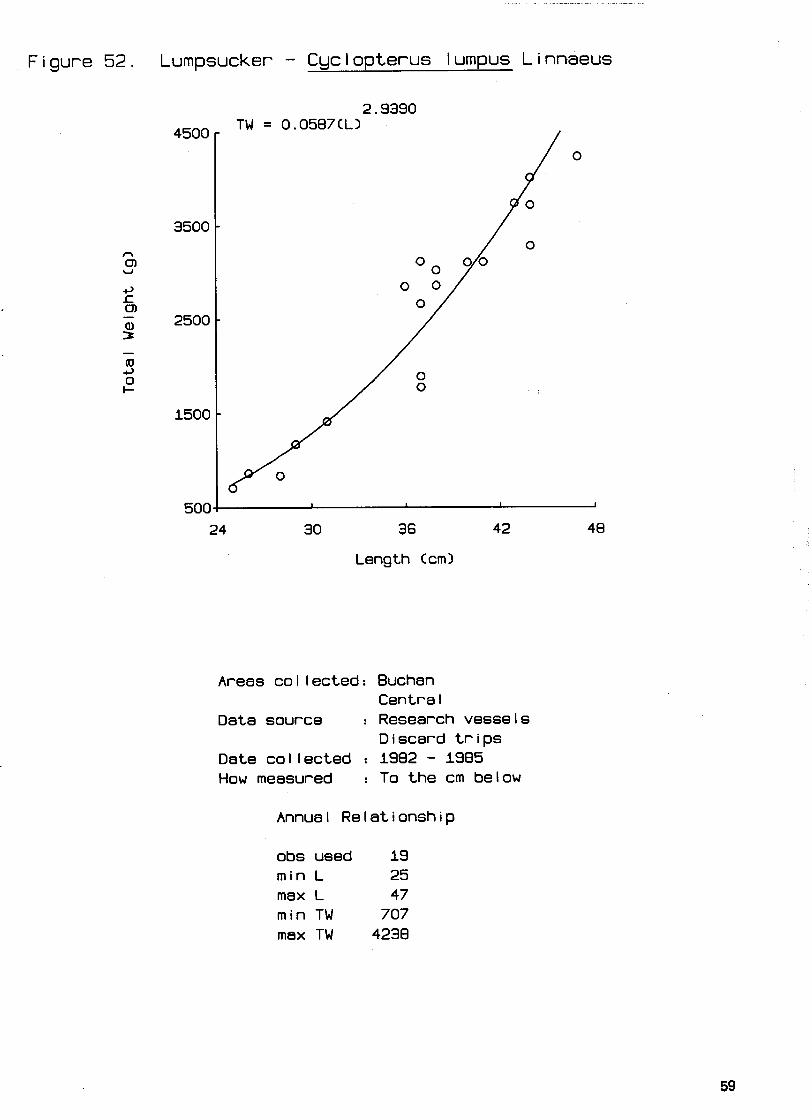
Figure 52. Lumpsucker - Cyclopterus lumpus Linnaeus
Length Ccml
Areas collected: Buchan Centra l
Data source : Research vessels Discard trips
Date collected : 1982 - 1985 How measured : To the cm below
Annual Relationship
obs used 19 min L 25 max L 47 min TW 707 max TW 4238

Figure 53. Meagre - Argyrosomosus regium (Ass03
60 85 110 135 160
Length Ccml
Areas col lected: Buchan Data source : Rare fish records Date collected : 1939 - 1962 How measured : To the cm below
Annual Relationship
obs used 4 min L 62.5 rr ,
max L 152.5 min TW 2154 max TW 26989

Figure 54. Norway Haddock - Sebastes viviparus Kroyer
Areas collected: Shetland So l an
Data source : Research vessels Discard trips
Date collected : 1977 - 1985 How measured : To the cm below
Annual Relationship
obs used 350 min L 9 max L 31 min TW 11 max TW 561

Figure 55. Electric Ray - Torpedo nobi l iana Bonaparte
20 40 60 80 100
Length Ccml
Areas collected: North Sea West Coast of Scotland
Data source : Rare fish records Date collected : 1927 - 1978 How measured : To the cm below
Annual Relationship
obs used 8 min L 20 max L 83.5 min TW 277 max TW 25855
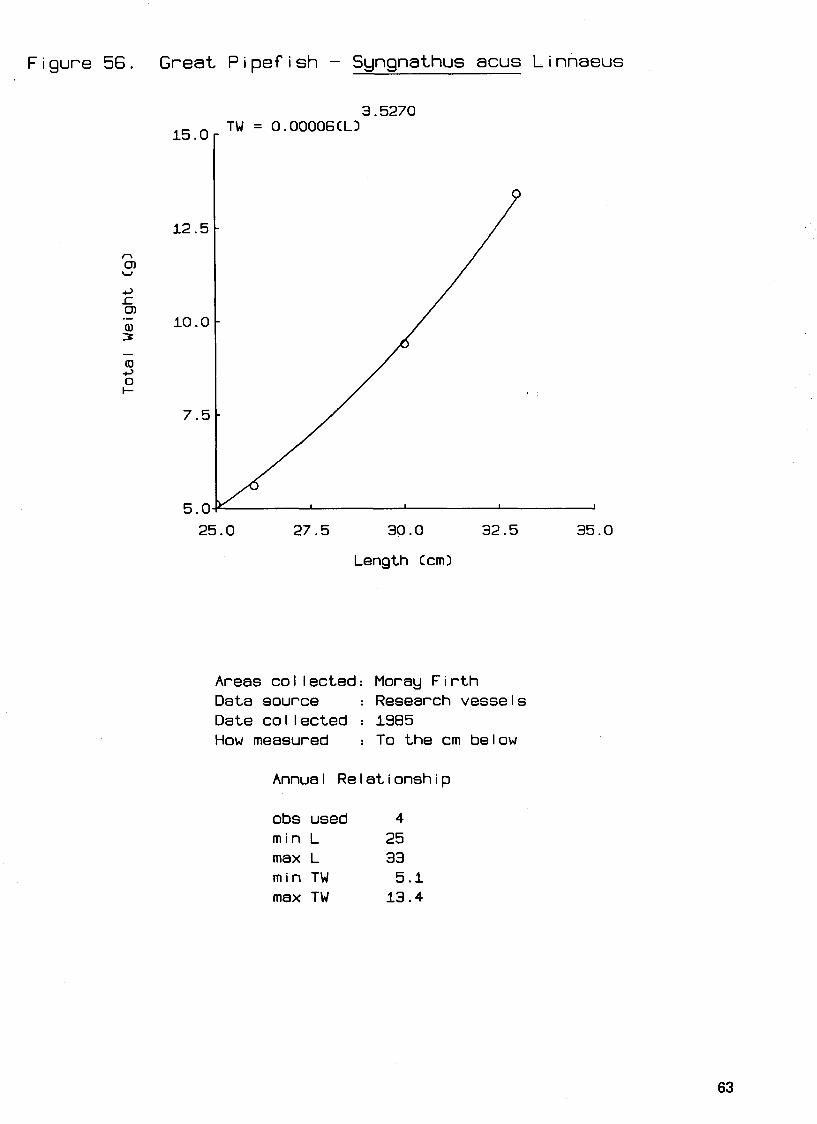
Figure 5 6 . Great Pipefish - Syngnathus acus Linnaeus
3.5270
25.0 27.5 30 .O 32.5 35.0
Length Ccml
Areas collected: Moray Firth Data source : Research vessels Date collected : 1985 How measured : To the cm below
Annual Relationship
obs used 4 min L 25 max L 33 min TW 5.1 max TW 13.4

Figure 57. Hook-nose - Agonus cataphractus CLinnaeusl
90 110 130 150 170
Length Cmml
Areas collected: Moray Firth Buchan
Data source : Discard trips Date collected : 1977 - 1985 How measured : To the mm below
Annual Relationship
obs used 82 min L 9 max L 16 min TW 5.6 max TW 29.6
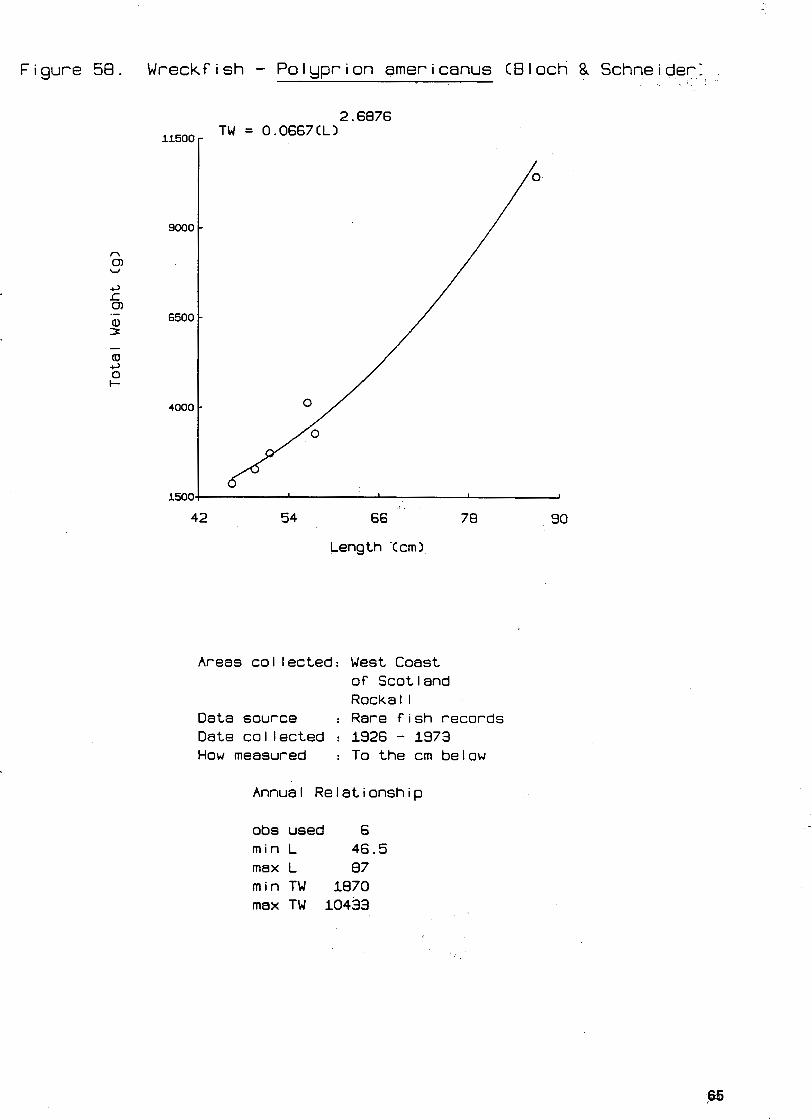
Figure 58. Wreckfish - Po lypr ion arnericanus CBloch & Schneider:
42 54 66 78 90
Length .Ccml
Areas collected: West Coast of Scotland Rocka I I
Data source : Rare fish records Date collected : 1926 - 1973 How measured : To the cm below
Annual Relationship
obs used 6 min L 46.5 max L 87 m i n TW 1870 max TW 10433

Figure 59. Sturgeon
40 120 200 280 360
Length Ccml
Areas co l lec ted: North Sea West Coast o f Scotland
Data source : Rare f i s h records Date co l lec ted : 1931 - 1984 How meas. : To the cm below
Annual Relat ionship
obs used 72 min L 75.5 max L 352.5 min TW 4.80 max TW 317.50

Figure 60. Opah - * Lsmpris gutkatus CBrunnichl
Areas collected: Shetland Buchen West Coast of Scotland
Data source : Rere f i sh recdrds Date cotlected : 1948 - 1983 How measured : To the cm below
Annual Relationship
obs usea 13 min L 77 mex L 136.5 min TW 20900 max TW 63500
Length Ccm)
Figure 61. ,Deal f i sh - Trachipterus arcticus (Brunnich)
04 6 I
105 135 165 195 225
Length (cml
Areas cot lected: North Sea West Coast of Scotland Rocka l I Faroe
Data source : Rare f i s h records Date col lected : 1963 - 1983 How measured : To the cm below
Annua I , Re I a t i onsh i p
obs used 18 min L 111:5 max L 218 , ' ". . m i n TW 1500 max TW M O O 0

-
Figure 62. Snake Blenny - Lumpenus lampretaeforrni:~ ~ W ~ l b e w l
L
Areas collected: Buchen South Minch
Date source : Discard t r ips Date collected 1 1982 - 1984 How measured : To the cm below
Annual Relationship
obs used 11
min L 16 mex L 27 min TW 6 mex TW 19
Length Ccml
Figure 63. Bu t te r f i sh - Phol is ~ u n n e l l u s (Linnaeusl
Areas collected: Buchen Data swrce : Discard t r ips Date collected : 1984 How measured : To the mm below
Annual Relationship
obs used 59
min L 15 max L 25 min TW 14.5 max TW 73.9
Length Cmml

I Figure 64. . ,
Long Rough Dab - H i ppog l osso i des p l atesso i des CFabr i c i us)
Areas collected: Shetland Viking Moray Firth Buchan
Data source : Research vessels Discard trips
Date collected : 1977 - 1984 How measured : To the cm below
Annual Relationship
obs used 534 min L 10 mex L , 36 min TW 7 max TW 444
8 16 24 32 40
Length Ccml
Figure 65. Flounder - Platichthus flesus CLinnaeus)
Areas collected: Moray Firth Buchan
Data source : Discard trips Date collected : 1979 - 1985 How measured : To the cm below
Annual Relationship
obs used 178 min L 12 max L 38 min TW 21 max TW 783
8 16 24 32 40
Length Ccml
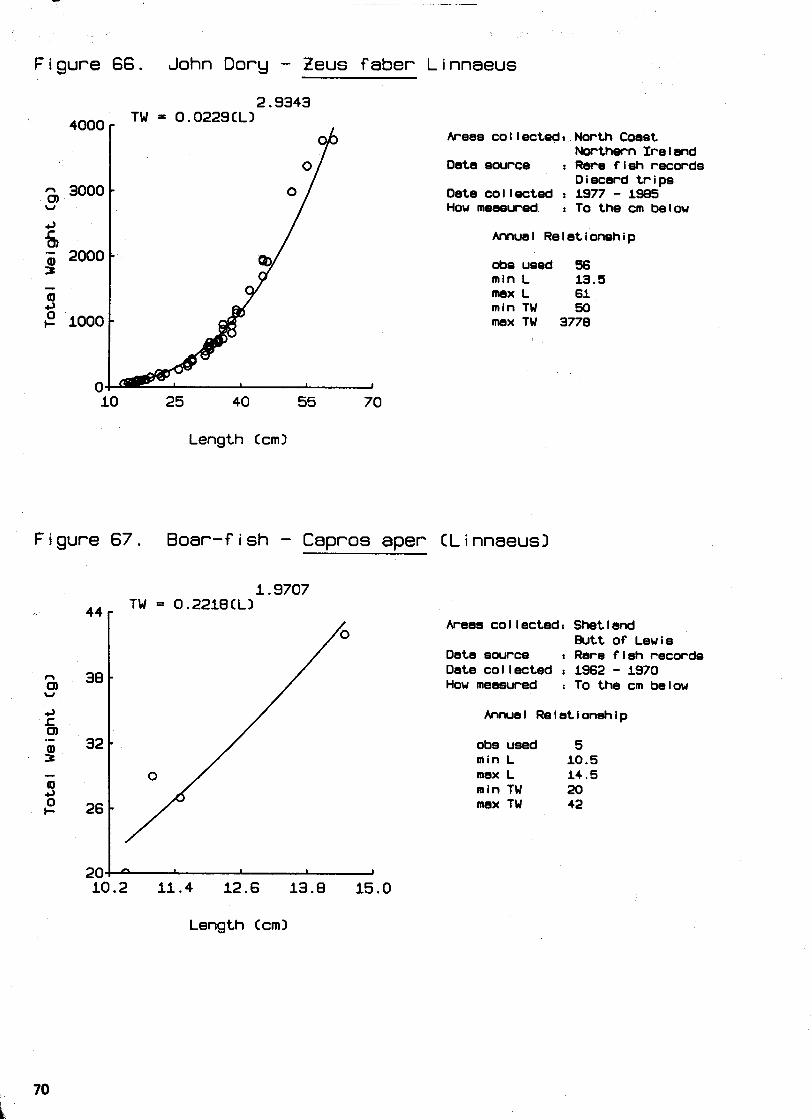
Figure 66. John Dory - Zeus faber Linnaeus
2.9343
Areas cot lected: North Coast Northern Ireland
Data swrce : Rere f i sh records Discard t r i p s
Date collected : 1977 - 1385 How meesured : To the cm below
Amual Relationship
obs used 56 min L 13.5 mex L 61 min TW 50 mex TW 3778
10 25 40 55 70
Length C c m l
Figure 67. Boar-fish - Capros aper CLinnaeusl
Areas collected: Shetland Bu t t of Lewis
Data swrce : Rare f i sh records Date collected : 1962 - 1970 How measured : To the cm below
Annual Relationship
obs used 5 min L 10.5 max L 14.5 min TW 20 max TW 42
Length Ccm)
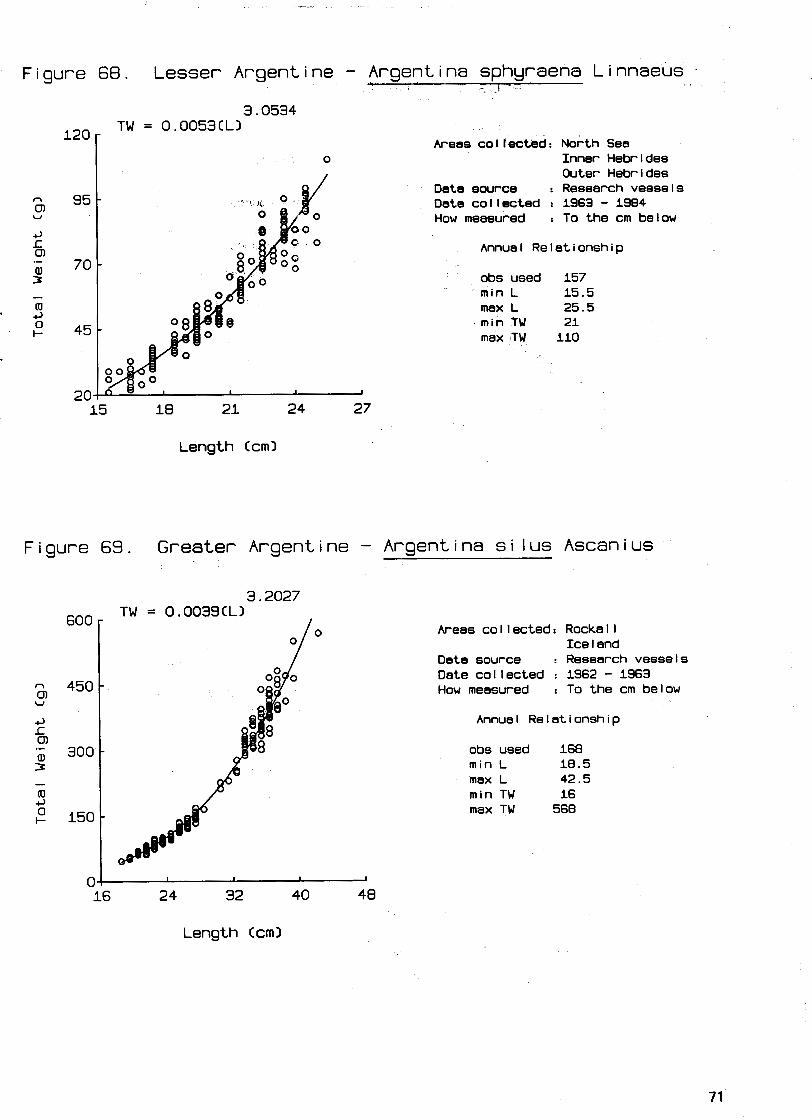
Figure 68. Lesser Argentine - Argentina sphyraena Linnaeus - '' - -1 -
3.0534
120 TW = 0.0053CLl
Areas collected: North Sea Inner Hebrides Outer Hebrides
Data ewrce : Research vessels 95 Date collected : 1963 - 1984
How measured : To the cm below
Annual Relationship 70
obs used 157 min L 15.5 max L 25.5 min TW 21
45 max TW 110
20 15 18 21 24 27
Length Ccml
Figure 69. Greater Argentine - Argentina s i l us Ascanius
3.2027
Areas collected: Rockall Ice l and
Data source : Research vessels Date collected : 1362 - 1963 How measured : To the cm below
Annual Relationship
obs used 168 min L 18.5 max L 42.5 min TW 16 max TW 568
Length Ccml

Figure 70. Poor Cod - Trisopterus minutus CLinnaeusl
Areas collected: North Sea Inner Hebrides Clyde
Date swrce : Research vessels 150 -
0 Discard trips u Date collected : 1971 - 1984 c, How measured : To the cm below s a, .;; 100 - Annual Relationship
3 - obs used 452 do min L 9 4 max L 26
50 - min TW 6 max TW 172
0 1 I
7.5 12.5 17.5 22.5 27.5
Length Ccm3
Figure 71. Four-bearded Rockling - Rhinonemus cimbrius (Linnaeusl
Areas collected: North Sea Date swrce : Research vessels
0 Discard trips
P Date collected : 1982 - 1985 How measured : To the cm below
I AMwel Relationship
obs uaed 63 min L 11 max L 29 min TW 5 max TW 134
Length C c m l

Figure 72. Grey Gurnard - Eutrigla gurnardus CLinnaeusl
3.1003
800 TW = 0.0062CLl Areas col lected: North Sea
West Coast of Scotland
600 Data source : Research vessels
Discard t r i p s Date col lected : 1976 - 1984 How measured : To the cm below
400 Annual Relat ionship
obs used 747 m i n L 7
200 max L 44 m i n TW 3 max TW ' 776
0 5 15 25 35 45
Length Ccml
Figure 73. Red Gurnard - Aspitrigla cuculus CLinnaeusl
Areas col lected: West Coast of Scotland
Data source : Research vessels
900 D i scard tr i ps
a, u
Date co l lec ted : 1977 - 1982 How measured : To the cm below
c, L a, Annual Relat ionship
600 3: obs used 480 - min L m
12
c, max L 46 c" 300 min TW 14
max TW 1062
0 10 20 30 40 50
Length Ccml
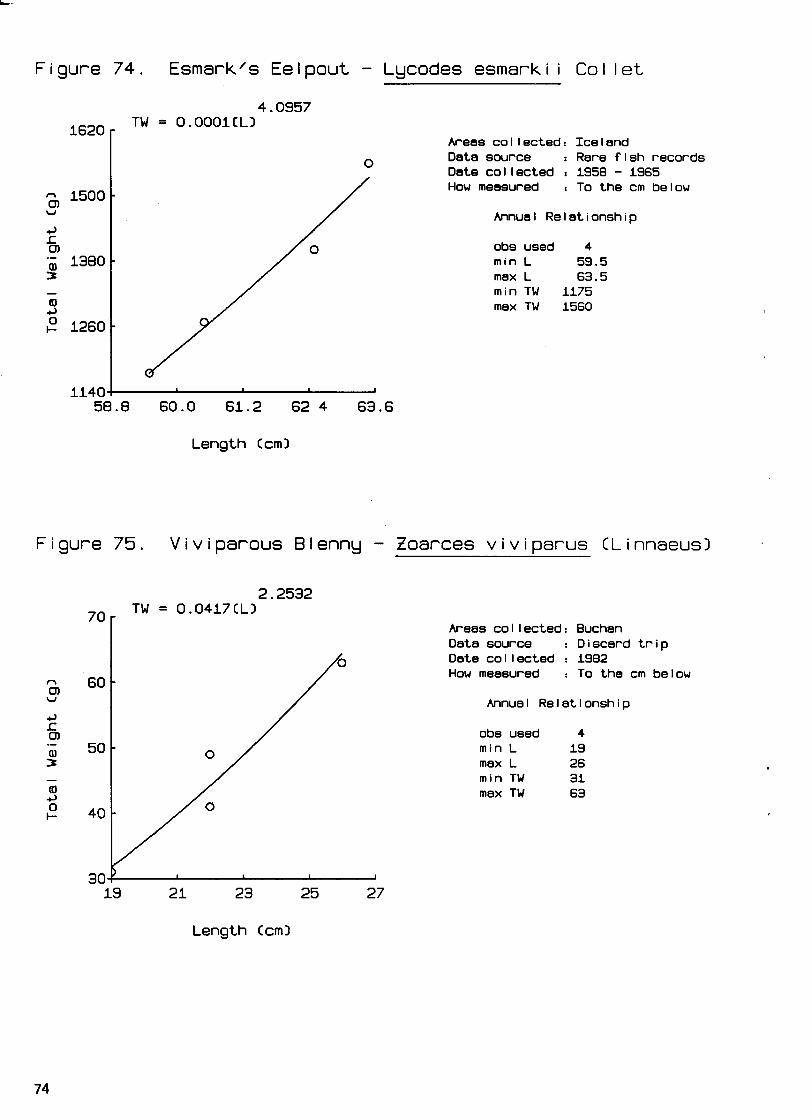
Figure 74. Esmark's Eelpout - Lycodes esmarki i Col l e t
Areas col lected: Iceland Data source : Rare f i s h records Date col lected : 1958 - 1965 How measured : To the cm below
Annual Relationship
obs used 4 min L 59.5 max L 63.5 min TW 1175 max TW 1560
Length Ccml
Figure 75. Viviparous Blenny - Zoarces viviparus (Linnaeusl
Areas col lected: Buchan Data source : Discard t r i p Date col lected : 1982 How measured : To the cm below
Annual Relationship
obs used 4 min L 19 max L 26 min TW 31 max TW 63
19 21 23 25 27
Length (cml

Figure 76. Dragonet - Cal l ionymus lyra Linnaeus
Length Ccm1
Areas collected: Moray F i r t h Buchan South Minch
Data swrce : Research vessels Discard t r i p s
Date col lected : 1977 - 1984 How measured : To the cm below
Annual Relationship
obs used 417 min L 8 max L 28 min TW 4 max TW ' 132
Figure 77. Spotted Dragonet - Cal l ionymus maculatus Rafinesque-Schmaltz
Areas collected: Morsy F i r t h Buchan
Date swrce : Research veesele Discard t r ips
Date col lected : 1977 - 1983 How measured To the cm below
Annual Relationship
obs used 66 m i n L 10 max L 16 min TW 6 max TW 20
Length Ccml
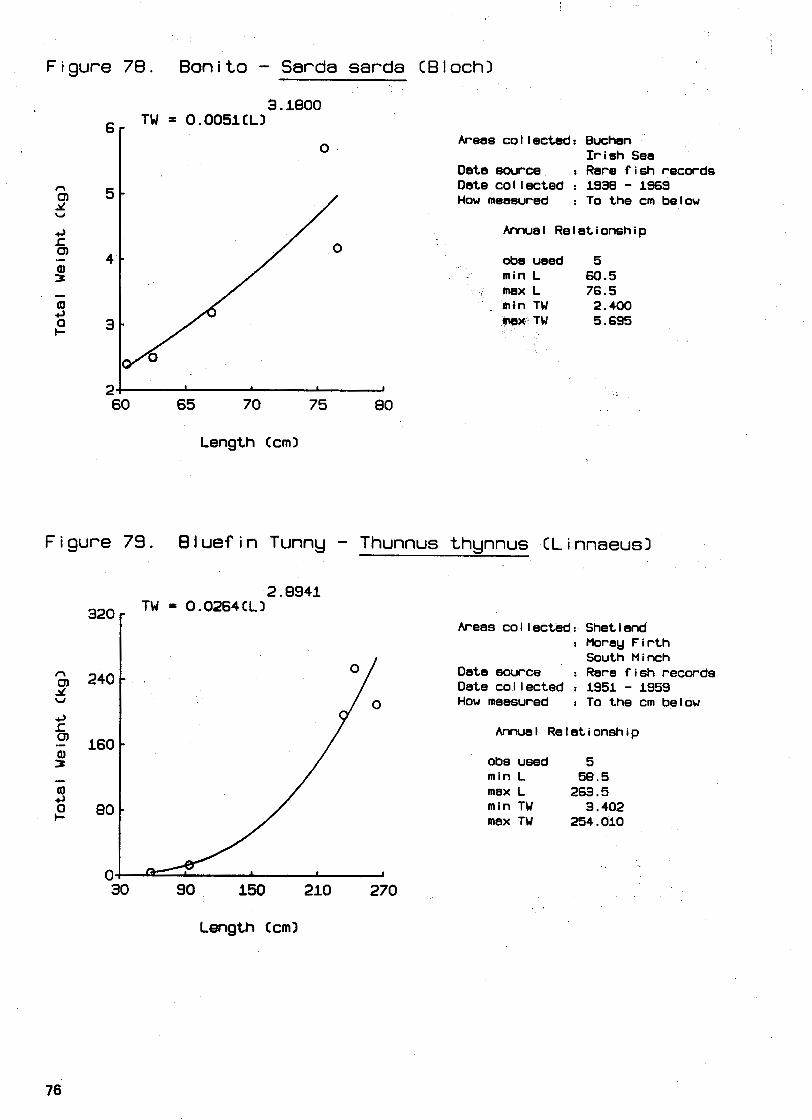
Figure 78. Boni to - Sarda sarda
3.1000 TW = O.OO51CLl
CB loch)
Areas collected: Buchen I r i s h Sea
Data source : Rare f i s h records Date col lected : 1938 - 1969 How meesured : To the cm below
Amual Relationship
obs used 5 m i n L 60.5 m x L 76.5
. inin TW 2.400 hsxl TW 5.695
Length Ccml
Figure 79. B l u e f i n Tunny - Thunnus thynnus (Linnaeus)
Areas collected: Shetland I Morey F i r t h
South Minch
240 - Data source : Rare f i s h records Date col lected : 1951 - 1959 How measured I To the cm below
Annual Relationship 160 -
obs used 5 m i n L 58.5 max L 263.5
80 - min TW 3.402 mex TW 254.010
0 I
30 90 150 210 270
Length Ccml
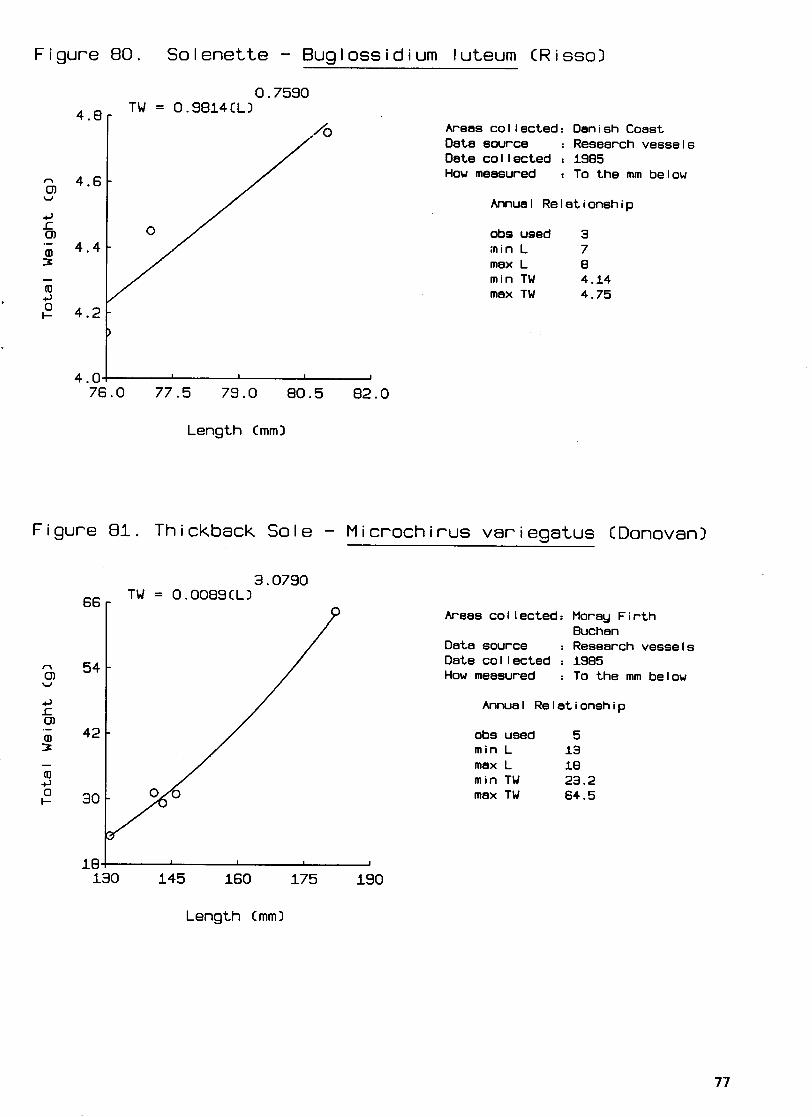
Figure 80. Solenette - Buglossidium luteum (Rissol
Areas col lected: Danish Coast Data swrce : Research vessels Date col lected : 1985 How measured : To the mm below
Annual Relationship
obs used 3 inin L 7 max L 8 m i n TW 4.14 max TW 4.75
Length Cmml
Figure 81. Thickback Sole - Microchirus variegatus (Donovan1
Areas col lected: Moray F i r t h Buchan
Data source : Research vessels Date col lected : 1985 How measured : To the mm below
Annual Relationship
obs used 5 min L 13 max L 18 m i n TW 23.2 max TW 64.5
Length Cmml
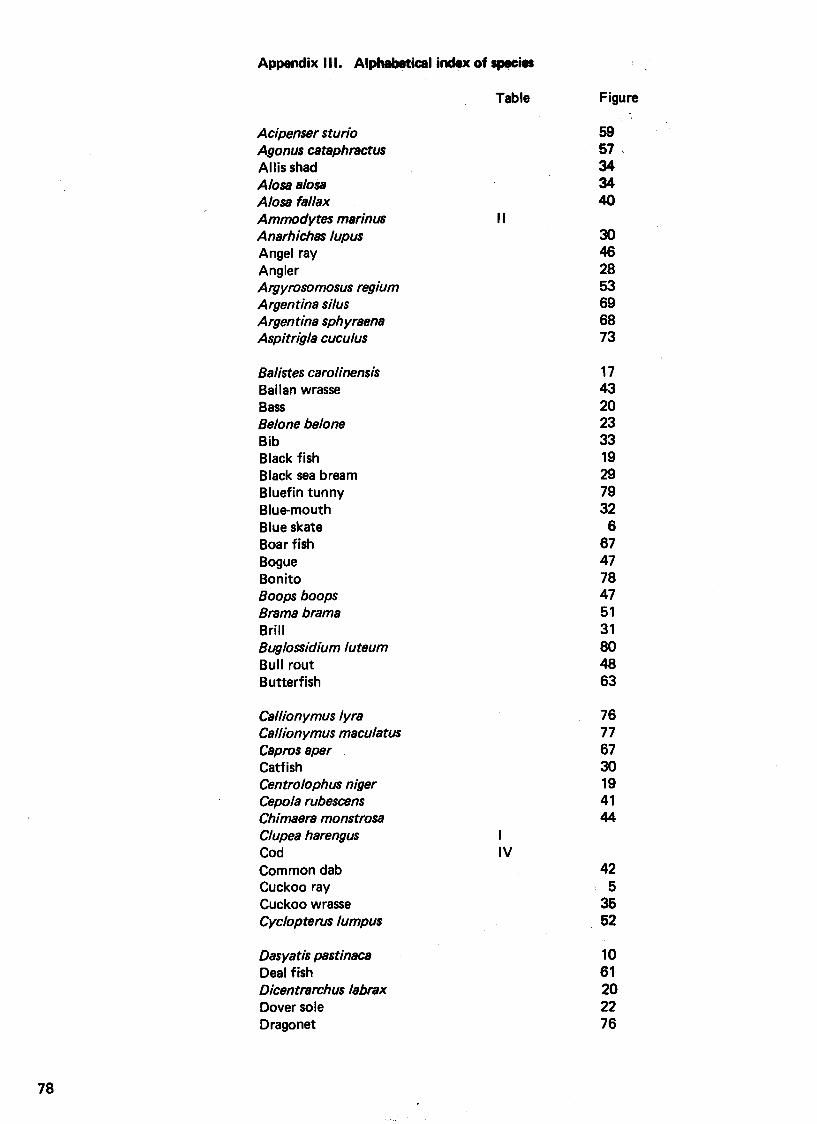
Appendix I I I. Alph&mtical i*x of spmim
Table Figure
Acipenser sturio Agonus cataphrttctus Allis shad Alosa alosa Alosa fallax Amrnodytes marinus Anarhichas lupus Angel ray Angler Argyrosomosus regium Argentina silus Argentina sph yraena Aspitrigla cuculus
Balistes carolinensis Ballan wrasse Bass Belone belone Bib Black fish Black sea bream Bluefin tunny Bluemouth Blue skate Boar fish Bogue Bonito Boops boops Brama brama Brill Buglossidium luteum Bull rout Butterfish
Callionymus lyra Callionymus maculatus Capms aper Catfish Cen trolophus niger Cepola rubescens Chimaera monstrosa Clupea harengus Cod Common dab Cuckoo ray Cuckoo wrasse Cyclopterus lumpus
Dasyatis pastinaca Deal fish Dicentrarchus labrax Dover sole Dragonet

Table Figure
Eagle ray Electric ray Esmark's eelpout Eutrigla gurnardus
Flounder Four-bearded rockling
Gadus morhua Gaidropsarus vulgaris Garfish Glyptocephalus cynoglossus Greater argentine Greater fork-beard Greater weever Great pipefish Grey gurnard Grey mullet
Haddock Hake Helicolenus dactylopterus Herring Hippoglossoides platessoides Hooknose Horse mackerel
John Dory
Labrus bergylta Labrus mixtus Lamna nasus Lampris guttatus Lemon sole Lesser argentine Limanda limanda Ling Long rough dab Lophius pisca torius L umpenus lampretae formis Lumpsucker L ycodes esmarkii
Mackerel Meagre Melanogrammus aegle finus Merlangius merlangus Merluccius merluccius Microchirus variegatus Microstomus kit t Mola mola Molva molva Mugil cephalus Mullus surmuletus Mylioba tis aquila Myoxocephalus scorpius

Table Figure
Norway haddock Norwegian topknot
Opah
Pageflus bogaraveo Petromyzon marinus Pholis gunnellus Phrynorhombus norvegicus Phycis blennoides Plaice Platichth ys flews Pleuronectes platessa Pollachius virens Polyprion americanus Poor cod Probeagle
Rabbitfish Raitt's sandeel Raja batis Raja clavata Raja montagui Raja naevus Raja radiata Raniceps raninus Ray's bream R e d band-fish Red gurnard Red mullet Red sea bream Rhinonemus cimbrius
Saithe Sarda sarda Scomber scombrus Scomberesox saurus Scophthalmus maximus Scophthalmus rhombus Sea lamprey Sebastes viviparus Skipper Snake blenny Solea solea Solenette Spondyliosoma cantharus Spotted dragonet Spotted ray Sprat 1 1 1 Sprattus sprattus 111 Spurdog V Squalus acanthias V Sguatina sguatina Starry ray Sting ray Sturgeon Sunfish Syngnathus acus

Tadpole fish Thickback sole Thornback ray Three-bearded rockiing Thunnus thynnus Topknot Torpedo nobiliana Trachinus draco Trachipterus arcticus Trachurus trachurus Trigger-f ish Trigla lucerna Trisopterus luscus Trisopterus minutus Tub gurnard Turbot Twaite shad
Viviparous blenny
Whiting Witch Wreckfish
Zeugopterus punctatus Zeus faber Zoarces viviparus
Table Figure
Printed by HMSO Reprographic Unit, Edinburgh 7/89 750 (025212)
Related Documents