* ECONOMIC IMPACTS * OF RECREATION I ON THE UPPER MISSISSIPPI RIVER SYSTEM AD-A265 154-- I _ I - FVI-, RECREATION EXPENDITURE I REPORT IFINAL VERSION -2 9 ,, ' r AT, ,,,,W MARCH 1993 93 I •?,P• .•.Dish* Prepared by: i~)• ! 11,11oil111311 IIH I;I Michigan State University for U.S. Army Corps of Engineers I REPORT "....

Welcome message from author
This document is posted to help you gain knowledge. Please leave a comment to let me know what you think about it! Share it to your friends and learn new things together.
Transcript
* ECONOMIC IMPACTS* OF RECREATIONI ON THE UPPER MISSISSIPPI RIVER SYSTEM
AD-A265 154--
I _
I - FVI-,
RECREATION EXPENDITUREI REPORT
IFINAL VERSION -2 9,, ' r AT, ,,,,W MARCH 1993 93
I •?,P• .•.Dish* Prepared by: i~)• ! 11,11oil111311I!i IIH I;IMichigan State University
forU.S. Army Corps of Engineers
I REPORT "....
UNCLASSIFIED
SECURITY Cl ASSIFICATION OF THIS PAGE
form ApprovedREPORT DOCUMENTATION PAGE oM o 0704 0188
_.........__ _ _xp Date Jun30 Y986la REPORT SECURITY CLASSIFICATION lb RESTRICTIVE MARKINGS
Unclassified2a SECURITY CLASSIFICATION AUTHORITY 3 DISTRIBUTION /AVAILABILITY OF REPORT
2b. OECLASSIFICATION/DOWNGRADING SCHEDULE Approved for public release; distributionunlimited.
4 PERFORMING ORGANIZATION REPORT NUMBER(S) S MONITORING ORGANIZATION REPORT NUMBER(S)
6a NAME OF PERFORMING ORGANIZATION 6b OFFICE SYMBOL 7a NAME OF MONITORING ORGANIZATION
(If applicable)
Michigan State University U.S. Army Engineer Waterways Experiment Stat.
6c. ADDRESS (City, State, and ZIPCode) 7b ADDRESS (Cry, State, and ZIP Code)
Dept. of Park and Recreation Resources Environmental LaboratoryEast Lansing, MI 48824 3909 Halls Ferry Rd.
E Lragh8lra. Mq 39180-6199Ba. NAME OF FUNDING/SPONSORING 8b. OFFICE SYMBOL 9 PROCUREME"NT INSTRUMENT IDENTIFICATION NUMBER
ORGANIZATION (If applicable)
U.S. Engr. Dist., ST Paul PD-ES8c. ADDRESS (City, State, and ZIP Code) 10. SOURCE OF FUNDING NUMBI:RS180 E. Kellogg Blvd. Rm 1421 PROGRAM PROJECT TASK WORK UNITSt Paul, MN 55101-1479 ELEMENT NO. NO NO ACCESSION NO
11 TITLE (Include Security Classification)
ECONOMIC IMPACTS OF RECREATION ON THE UPPER MISSISSIPPI RIVER; RECREATION EXPENDITUREREPORT: Development of visitor spending profiles for the Upper MississiDni River System.
12- PERSONAL AUTHOR(S)
Dennis B. Propst; Daniel J. Stynes; Hui Jiao and 1Peri, Koesler.13a. TYPE OF REPORT 13b. TIME COVERED 14. DATE OF REPORT (Year, Month, Day) S PAGE COUNT
Final FROM -TO 9303 14116. SUPPLEMENTARY NOTATION
See also: AD-A 263599; AD-A263796; AD-A263761
17. COSATI CODES 18. SUBJECT TERMS (Continue on reverse if necessary and identify by block number)
FIELD GROUP SUB-GROUP (RECREATIONMISSISSIPPI RIVERECONOMIC IMPACTS
19- ABSTRACT (Continue on reverse if necessary and identify by block number)The purpose of this report is to provide measurement of recreation-related spending in theUpper Mississippi River system. The report is divided into two parts. Part one presentsboth trip and durable goods spending profiles for visitors to developed recreation areas onthe Upper Mississippi River system. Spending was measured through a series of on-siteinterviews used to measure recreation use and durable goods, and a mailback questionairewhich measured trip spending was ten distributed to visitors responding to the on-siteinterview. The study design captured the most significant segments and categories of spend-ing. For day users, residents outnjmber nonresidents by more than five to one. Among over-night visitors, nonresidents were more than twice as numerous as residents.
The second part provides both trip and durable goods spending profiles for dock owners apdmarina users. These spending profiles were derived from the household telephone and mail-back questionnaire phase of the total study.Many tables included which provide data on user profiles and expenditures.
20 DISTRIBUTION /AVAILABILITY OF ABSTRACT 21 ABSTRACT SECURITY CLASSIFICATION
U UNCLASSIFIED/UNLIMITED C0 SAME AS RPT. El DTIC USERS Unclassifled
22a NAME OF RESPONSIBLE INDIVIDUAL 22b TELEPHONE (Include Area Code) 22c OFFICE SYMBOL -
DO FORM 1473, 84 MAR All ADD ed!tio 'ay be ,isd 0rZ- eAhaustCu SE( uRITY CLASSIFICATION OF .4S PACEAc Ot)'er edit~ons are obsolete UNCI,ASS T F1 ED
I
IDEVELOPMENT OF VISITOR SPENDING PROFILES
FOR THE UPPER MISSISSIPPI RIVER SYSTEM
II
byIDr. Dennis B. Propst, Dr. Daniel J. Stvnes
Hui Jiao, and Rena Koesler
Michigan State UniversityDepartment of Park and Recreation Resources
East Lansing, Michigan 48824
Accesion For
NTIS CRA&IDTIC TABUnannounced ElJustification ............
B B y -----........... ............ ....... .... .. .
Disht ibution I
3 Availabilty Codes
A-vail a;Ind 1 or
Dist Special
IIMonitored by Environmental Laboratory
U.S. Army Engineer Waterways Experiment Station3909 Halls Ferry Road, Vicksburg, MS 39180-6199
I
I

II
I
U In 1986, Congress authorized a study to assess the economicimportance of recreation in the Upper Mississippi River System.The study findings have been published in a series of reports bythe U.S. Army Corps of Engineers, St. Paul District. A listing ofthese reports follows:
-Plan of Study for the Recreation Econo-ics Study on the UpperMississippi River System (September 1986)
-Recreation-Economics Data Review, Upper Mississippi RiverBasin (February 1988)
-Economic Impacts of Recreation on the Upper Mississippi RiverSystem: Study Sampling Plan (May 1989)
-Economic Impacts of Recreation on the Upper Mississippi River3 System: Recreation Use and Activities Report (March 1993)
-Economic Impacts of Recreation on the Upper Mississippi River3 System: Recreation Expenditure Report (March 1993)
-Economic Impacts of Recreation on the Upper Mississippi RiverSystem: Economic Impacts Report (March 1993)
-Economic Impacts of Recreation on the Upper Mississippi RiverSystem: Summary Report (June 1993)
A related document summarizes the economic input-output modelapplications prepared in conjunction with this study:
-MI-REC: Micro-jmplan Recreation Economic Impact EstimationSystem Users' Manual
1IIII

I3 CONTENTS
3 INTRODUCTION . . . . . . . . . . . . ... .
PURPOSE . . . . . . . . . . . . . . . . . .. 6
PART ONE: DEVELOPED RECREATION AREA VISITORS; RECREATION SPENDING ON THE
UPPER MISSISSIPPI RIVER SYSTEM . . . . . . . . . . . . .
BACKGROUND . . . . . . . . . . . . . . . . . ... 9
5PROCEDURESNational Study and Current Study Compared ...................... 10
Survey Site Selection ..................... ........................ 1i
Subregions .............................................. ..7urvey Procedures ...................................... ..
RESULTS ..................................................... 15
Sample Sizes and Response Rates ............................ ..Visitor Segments . . . . . . . . . . . . . . . . . . . . . . . . . . 1-
Nights Spent per Trip ............. .................... 23
Trip Expenditures ....................................... .. 26Durable Goods Spending ............................... 39
LIMITATIONS ................................................. 52
DISCU SSION . . . . . . . . . . . . . . . . . . . . . . . . . . . . . .. . :;
APPLICATIONS OF RESULTS ............................................... :9
SUGGESTIONS FOR FURTHER RESEARCH ............................. .. 61
LITERATURE CITED - PART ONE ....................................... 64
3 APPENDIX A: ON-SITE INTERVIEW INSTRUMENT AND DURABLE GOODS FORM ... ..... 65
APPENDIX B: MAILBACK QUESTIONNAIRE ........................... 77
3 APPENDIX C: TRIP SPENDING STATISTICS .................................. 83
APPENDIX D: DATA CLEANING AND EDITING TASKS ...... ............... ... 91
I PART TWO: DOCK OWNERS AND MARINA USERS; RECREATION SPENDING ON THE UPPERMISSISSIPPI RIVER SYSTEM ........... ................... 95
I BACKGROUND ...................................................... .. 97
PROCEDURES . . . . . . . . . . . . . . . . . . . . . . . . . . . . . . .. 97
Sample Selection .......................................... .. 98
Methods .............................................. 98Trip Spending Analysis ................................. .. 99Durable Goods Analysis ................................ 101
Residents versus Nonresidents .......................... ... 102
RESULTS: DOCK OWNERS ......................................... .. 103a Sample Sizes and Respons ....
Trip Expendicures ............. ...................... 104
Durable Goods Spending ........................................ 110
I

IRESULTS: MARINA SLIP RENTERS .... .
Sample Sizes and Response Rates .
Trip Expenditures . . . . . . . . ........Durable Goods Spending 3... ... .
DISCUSSION . . . . . . . . . . . . . ... .
Visitor Segment Profiles .. . . . . . . . . ............ . 132Sampling Error ..... . . . . . . . . ................. . 135Limitations . . 3Liiain..............................................13•6
Applications .......... ...... ........................ 137
LITERATURE CITED PART TWO ..... ....................... 139
III!IUIIIIIII
2!
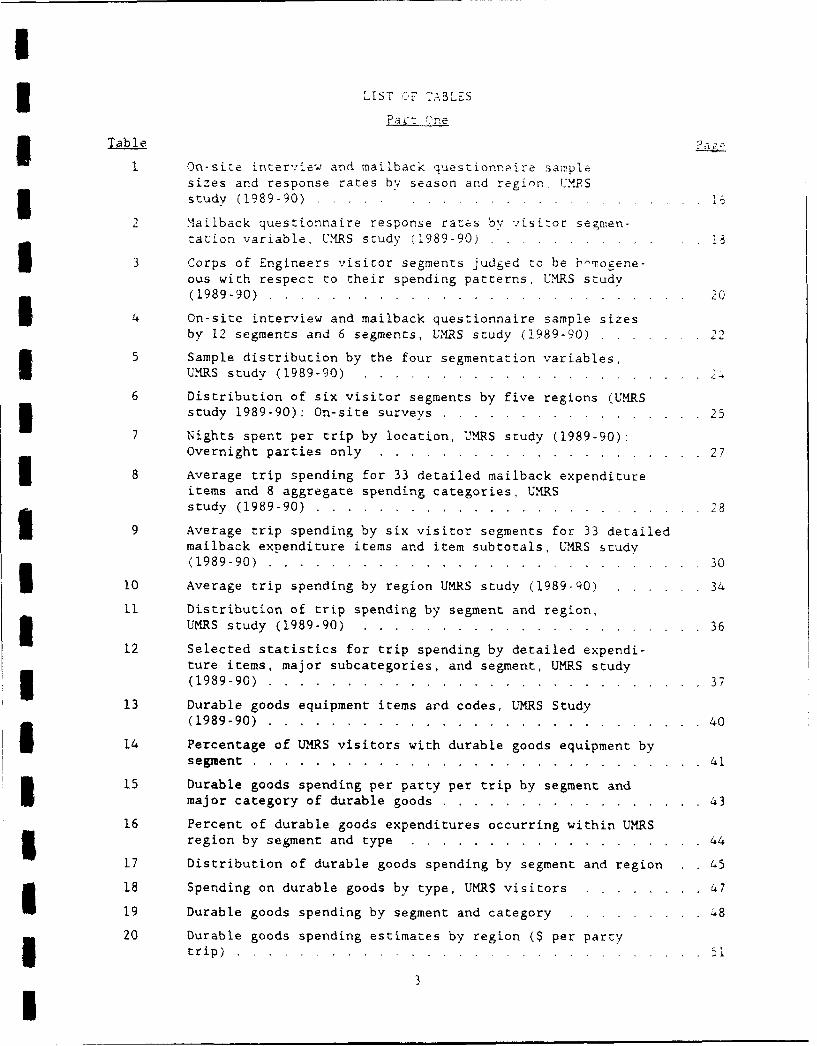
I3 LIST CF TABLES
Tabl__e
I On-site intervilew and mailback questionnaire samplesizes and response rates by season and region. UMPS5 study (1989-90) ..... ... ...................... .6
2 Mailback questionnaire response rates by visitor segmen-tation variable. !MRS study (1989-90) ..................... ..8
£ 3 Corps of Engineers visitor segments judged to be h"mogene-ous with respect to their spending patterns, UMRS study(1989-90) .................................................
S4 On-site interview and mailback questionnaire sample sizesby 12 segments and 6 segments, ULRS study (1989-90) .......
5 Sample distribution by the four segmentation variables,
UMRS study (1989-90) . . . . . . . . . . . . . . . . . . . . . .
6 Distribution of six visitor segments by five regions (UMRSSstudy 1989-90): On-site surveys ........ ................. ... 25
7 Nights spent per trip by location, UMRS study (1989-90):Overnight parties only ............ ..................... .. 27
S8 Average trip spending for 33 detailed mailback expenditureitems and 8 aggregate spending categories, UMRS
study (1989-90) ................ ......................... 28S9 Average trip spending by six visitor segments for 33 detailed
mailback expenditure items and item subtotals, UMRS study
(1989-90) ................... ............................. .. 30
10 Average trip spending by region UMRS study (1989-90) ........ .. 34
ii Distribution of trip spending by segment and region,
SUMRS study (1989-90) .................................... 36
12 Selected statistics for trip spending by detailed expendi-ture items, major subcategories, and segment, UKRS study
(1989-90) .............................................. .. 37
13 Durable goods equipment items ard codes, UMRS Study(1989-90) .................................................... 40
14 Percentage of UMRS visitors with durable goods equipment bysegment ................. ............................. .... 41
15 Durable goods spending per party per trip by segment andmajor category of durable goods .............. ................. 43
16 Percent of durable goods expenditures occurring within UMRSSregion by segment and type .......... ................... .. 44
17 Distribution of durable goods spending by segment and region . 45
18 Spending on durable goods by type, UMRS visitors ..... ........ 47
19 Durable goods spending by segment and category ............... 48
20 Durable goods spending estimates by region ($ per partytrip) .................................................. .. 51
3I

ITable
21 Sampling errors for durable goods spending estimates
Part T-wo
1 Dock owner sample sizes and response rates (U24RS Istudy , 1990-91) . . . . . . . . . . . . . . . . . . . . . . . . . 103
2 Average trip spending for 33 detailed mailback expenditureitems and 8 aggregate spending categories, UMRS Dock Owners IStudy (1990-91) ...................... ......................... 105
3 Average trip spending by dock owner residents and nonresidents jfor 33 detailed mailback expenditure items and 8 aggregatespending categories ............ ...................... .. 107
4 Selected error statistics for trip spending per week 3by detailed expenditure items and aggregate categories.UMRS Dock Owners Study (1990-91) ............... ................. 109
5 Spending on durable goods by type, UMRS dock owners .... ....... 111.
6 Durable goods spending by place of purchase and place ofresidence, UMRS dock owners ............ ................... .. 113
7 Durable goods spending on new versus used goods by type,UMRS dock owners ............... ......................... 114
8 Sampling errors for durable goods spending estimates, 3UMRS dock owners ..................... ......................... 115
9 Other annual or durable goods expenses by type, UMRSdock owners .................. ........................... .. 116 U
10 Marina user sample sizes and response rates (UMRSstudy, 1990-91) ................ ......................... .. 118
11 Average trip spending for 33 detailed mailback expenditureitems, and 8 aggregate spending categories, UMRS MarinaUsers Study (1990-91) ............ ...................... 119
12 Average trip spending by marina user residents andnonresidents for 33 detailed mailback expenditure itemsand 8 aggregate spending categories ..................... 121 5
13 Selected error statistics for trip spending per week bydetailed expenditure items and aggregate categories,UMRS Marina Users Study (1990-91) ........ ................ .. 123
14 Spending on durable goods by type, UMRS marina users ......... .. 125
15 Durable goods spending by place of purchase and place ofresidence, UMRS marina users ........... ................... .. 127 I
16 Durable goods spending on new versus used goods by type,UMRS marina users ................ ........................ 129
17 Sampling errors for durable goods spending estimates,UMRS marina users .............. ........................ 130
4 U

I3 Table
18 Other annual or durable goods expenses b-: ' -'pe M RSmarina users . . . . . . . . . .. . . . . . .... .
I5
III!IIIIIIIIIIII
I
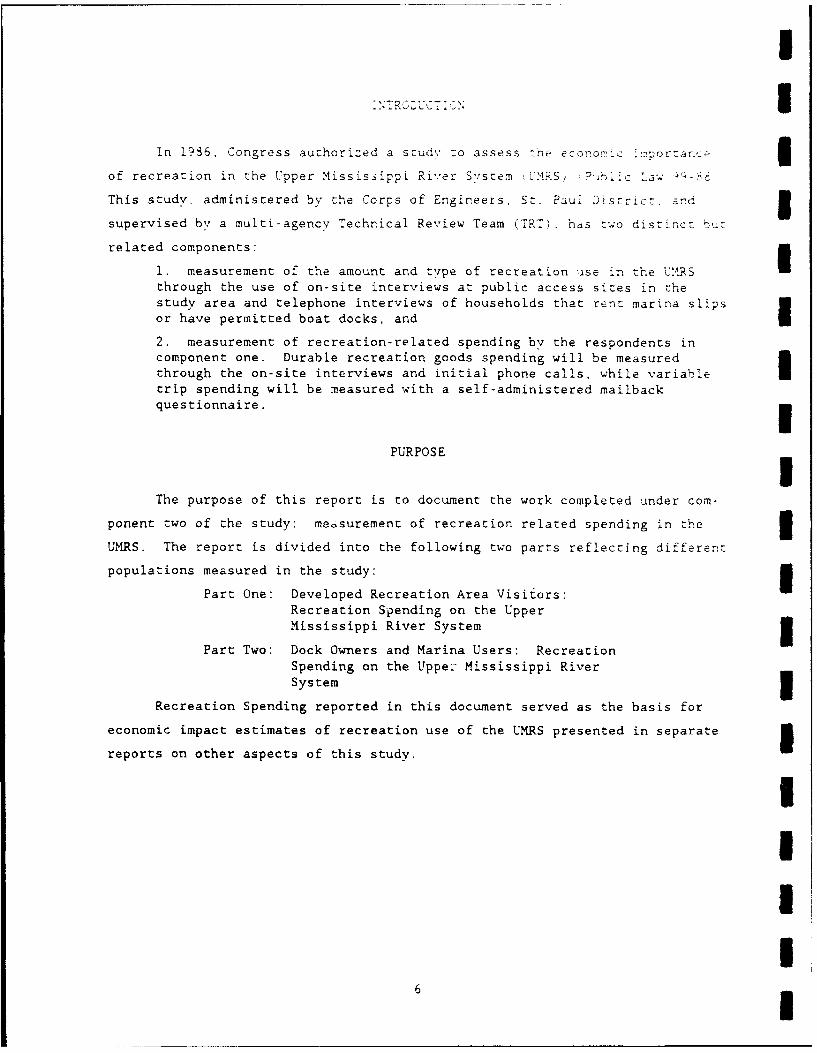
In 1936. Congress authorized a stud',- to assess the economic importance
of recreation in the Upper Mississippi River Sy.'sterm (UMRS! P'-b 1 a -
This study, administered by the Corps of Engineers, St- Paul District, and 5supervised by a multi-agency Technical Review Team (TRT.) has two distinct
related components:
1. measurement of the amount and type of recreation use in the U>¶R5through the use of on-site interviews at public access sites in thestudy area and telephone interviews of households that rent marina slips
or have permitted boat docks, and
2. measurement of recreation-related spending by the respondents incomponent one. Durable recreation goods spending will be measuredthrough the on-site interviews and initial phone calls, while variabletrip spending will be measured with a self-administered mailbackquestionnaire.
PURPOSE
The purpose of this report is to document the work completed under com-
ponent two of the study: measurement of recreation related spending in the
UMRS. The report is divided into the following two parts reflecting different
populations measured in the study:
Part One: Developed Recreation Area Visitors:Recreation Spending on the Upper
Mississippi River System 3Part Two: Dock Owners and Marina Users: Recreation
Spending on the Upper Mississippi RiverSystem
Recreation Spending reported in this document served as the basis for
economic impact estimates of recreation use of the UMRS presented in separate 3reports on other aspects of this study.
IIII

IIIII
PA-R T ONE5DEVELOPED RECREATION AREA VISITORS"REGREAfION SPENDING ON THE UPPER
MISSISSIPPI RIVER SYSTEM
IIIUIIIIIIII
II I
II°Ii
I
I
IIUIIIII
I
I
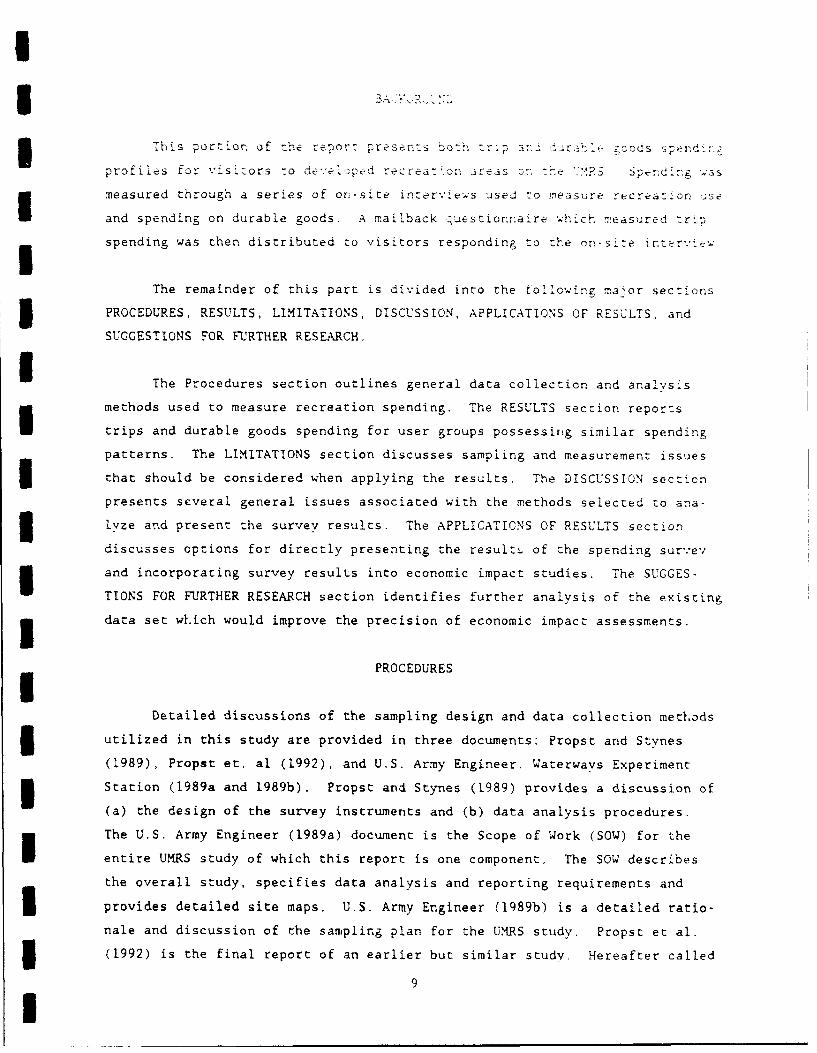
This port ion of the repor- prese-nzs both 7",p .:%r< h zoo s s ',p
profiles for visitors to deveooped recreat:on areas or th 'RS 5perding ,as
measured through a series of on-site intervies used -o measure recreation Ise
and spending on durable goods. A mailback questionnaire which measured trip
spending was then distributed to visitors responding to the on-sieiterview
The remainder of this part is divided into the following major sections
5 PROCEDURES, RESULTS, LIMITATIONS, DISCUSSION, APPLICATIONS OF RESULTS, and
SUGGESTIONS FOR FURTHER RESEARCH.
K The Procedures section outlines general data collection and analysis
methods used to measure recreation spending. The RESULTS section reports
trips and durable goods spending for user groups possessing similar spending
patterns. The LI4ITATIONS section discusses sampling and measurement issues
that should be considered when applying the results. The DISCUSSION section
presents several general issues associated with the methods selected to ana-
3 Lyze and present the survey results. The APPLICATIONS OF RESULTS section
discusses options for directly presenting the results of the spending surv.ey
and incorporating survey results into economic impact studies. The SUGGES-
TIONS FOR FURTHER RESEARCH section identifies further analysis of the existing
data set which would improve the precision of economic impact assessments.
PROCEDURES
Detailed discussions of the sampling design and data collection methods5 utilized in this study are provided in three documents: Propst and Stynes
(1989), Propst et. al (1992), and U.S. Army Engineer, Waterways Experiment
Station (1989a and 1989b). Propst and Stynes (1989) provides a discussion of
(a) the design of the survey instruments and (b) data analysis procedures.
The U.S. Army Engineer (1989a) document is the Scope of Work (SOW) for the
entire UMRS study of which this report is one component. The SOW describes
the overall study, specifies data analysis and reporting requirements and
3 provides detailed site maps. U.S. Army Engineer (1989b) is a detailed ratio-
nale and discussion of the sampling plan for the UMRS study. Propst et al.
3 (1992) is the final report of an earlier but similar study. Hereafter called
9I

ithe "national stud-', " rops t c :i" " -:-*.'-
files associated wizh the recreat ifonal o.• or:H-7. >:2e -
projects in the United States. The cdata c 1c:1or: .:s. ,..•zs ,nd C iIS
techniques are :-earlv identical in ?ropst al *r. - i :2 d this report
Current Study and National Study Compared iThis study and the national study iPropst et al. 1992) were almost iden-
tical in the survev instruments used but quite different with respect to the
sampling design. The purposes of the national study and the UMRS study are
also somewhat different. The purpose of the UMRS study was to measure both
visitor use and visitor spending along the UMRS. The intent was to achieve a
representative sample of visitors to the UMRS. This purpose required that 3both recreation sites and visitors were randomly selected. This random selec-
tion of sites and visitors is the key distinguishing feature between the cur-
rent study and the national study. Unlike the national study, there was no
attempt in this study to represent the full national range of spending behav- Iior by COE visitors. Instead, the focus was on deriving both use and spending
estimates in proportion to the population of visitors within one specific
geographic region: the UMRS. 3The purpose of the national study was not to obtain a representative
sample of visitors at any given lake, but to garner a reasonable quota of 5parties across all lakes within each of the visitor segments thought to be
homogeneous with respect to their spending patterns. To this end, certain 5segments were oversampled with respect to their true proportion in the popula-
tion while others were undersampled. Unlike the current study, no attempt was
made in the national study to estimate visitor use from the on-site interview
procedures. In the national study, estimates of visitor use were obtained
from the internal reporting methods and documents developed by each of the 312 COE projects where spending data were collected.
Similar to the national study, the goal of this study was to measure the i
total amount spent on a recreation trip, the distribution of that spending
among economic sectors, and the geographic location of spending in relation to 3the UMRS. As in the national study, spending profiles were derived for major
subgroups of visitors. 3
I10 I

U
3 Survey Site Selection
On-site interviews were condu. ted at I> of olerc .paelv -
ation sites in the study region. Efforts were made 7o nsurle representation
of sites across the spectrum of providers t-ommercial recreation enterprises
local, state, and federal agencies) and dominant activity types (sightseeing
areas, boat ramps, campgrounds, etc.). Specific details regarding the sam-
pling design are provided in (U.S. Army Engineer 1989a and b). In suxrn'arv.
sites were randomly assigned to several strata reflecting locational (sub-
regions within the UMRS), temporal (season, month, weekday .vs. weekend, and
5 morning vs. afternoon vs. evening), and visitation-related (high vs. low use
areas) use patterns. Unlike the national study, the interview locations were
3 not necessarily on Corps property.
Subregions
For the purposes of this study, the Corps of Engineers divided the UMRS
into 5 subregions: St. Paul District, Rock Island District, Sr. Louis Dis-
trict, Illinois River Waterway, and "sightseeing areas." The first
4 subregions represent true geographic boundaries corresponding to the loca-
3 tions of "pools" created by a series of locks and dams constructed and main-
tained by the Corps of Engineers. The St. Paul District roughly includes that
portion of the Mississippi River that forms the boundary between Wisconsin and
Minnesota south of Minneapolis/St. Paul. The Rock Island District includes
most of the eastern boundary of the state of Iowa plus the northern half of
the western boundary of Illinois and a portion of northeastern Missouri. The
St. Louis District covers the rest of Illinois' western boundary plus the
eastern boundary of the state of Missouri southward to the confluence of the
Mississippi and Kaskaskia Rivers (south of St. Louis). The Illinois River
SWaterway is contained entirely within the state of Illinois and extends from
St. Louis almost to Chicago. The "sightseeing areas" do not represent a sepa-
3 rate subregion. Sightseeing areas include visitor centers and scenic over-
looks that may be located anywhere within the UMRS.
I Survey Procedures
Fconomic impact analysis utilizing IMPLAN requires the development of
visitor expenditure "profiles." A trip expenditure profile is a vector of
expenditures for individual goods and services purchased during a recreation
3 trip (gasoline, equipment rental, etc.). Similarly, durable goods expenditure
1iI

Iprofiles may be created for Soods boats. recreation 'N.<ies..
used on trips to the UMRS (and often elsewhere) over a period of time
To develop both trip and durable goods expenditare profi>es, a sample
survey was conducted at 150 sites along the UXRS between November L5,.4 and
December 15. 1990 Thus, the survey period allows for reporting of reslts on
an annual or seasonal basis. Data collection procedures included a
combination of personal, on-site interviews and nailback questionraires
(Appendix A and B).
The other contractor was responsible for supervising the interviewers
that collected the on-site interview data. Furthermore, the other contractor
coded, edited, and entered the on-site data as DBase files. The other con-
tractor sent these files to COE staff in the St. Paul District for further 3verification before they were sent to Michigan State University (MSU) for
analysis.
During the on-site interviews, visitors provided recreation activity
information, durable goods spending estimates, and trip characteristics. To
meet the requirements of I/O analysis, much of this information was gathered 3on a regional basis. For example, tespondents were asked to report place of
residence as being either within the UMRS as previously defined or outside the 3UMRS. They were also asked to report the county where durable goods purchases
were made and to divide trip-related expenses into two groups: expenditures 3within 30 miles of the interview site and expenditures beyond 30 miles.
Data Processing. A number of data cleaning and editing tasks were performed. IThese tasks, described in Appendix D, included the joining of the mailback and
on-site data sets and the removal of outliers.
Trip Expenses. To obtain variable trip costs, visitors were asked to complete 5an expense questionnaire (Appendix B) and return it by mail as soon as possi-
ble after they had returned to their permanent residence. The mailback ques- 3tionnaire asked for trip expenses for as many as 33 items per trip. Parties
were asked to report the dollar amount spent per category both within 30 miles
of the interview site and outside 30 miles. These "local" and "nonlocal"
spending figures were summed to derive a total trip spending estimate.
Sufficient informat.on was duplicated (e.g., site, data, identification Inumber) in the on-site and mailback surveys so that data from the same party
could be merged at a later date. 512 I
U
bhe two-stae, ~iner'.-iew a rd ma i Is';r".'e r. :•e ;as. :e
confusion on the part of the respondenz and 7o elicit reliable and complete
trip spending information. Propst et al. lO9 I) fecund that dividing the q!ues-
tions between two instruments not onlv substantiallv lowered the length of the
interview but also lessened confusion between trip and durable goods expenses.
Furthermore. since a major objective of this study was to measure total trip
spending, providing the respondents a mailback questionnaire and asking them
l to return it upon return to their residence, erables the estimation of spend-
ing for the entire trip. Moreover, the two-step design permits the use of
5 on-site interview data to evaluate and adjust for nonresponse bias in the
mailed survey.
This study employed a relatively standardized procedure for improving
mailback response rates: the use of two follow-up, mailed reminders. Follow-
ing Dillman (1978) the first reminder was a postcard mailed to nonrespondents
approximately two weeks from the reported end of their current trip. The
second reminder was a certified mailing consisting of a different cover letter
3 and another questionnaire. The second reminder was mailed approximately one
month after the end of the trip (two weeks after the postcard reminder).
Durable Goods. Spending on durable goods was measured in the on-site portion
of the survey. Sampled visitors were asked to report durable goods brought
with them on their current trip for use within the UMRS (see Appendix A,
questions 42-51). For each major durable goods item (Table 13. List No. i),
the type, year of purchase, cost, county of purchase. and whether the item was
purchased new or used was measured. These variables were also gathered for
each smaller durable goods item (Table 13, List No. 2) purchased within the
past year.
The 40 durable goods categories, including separation of new and used
items, were designed to insure consistency with IMPLAN sectors as much as
possible. Up to 10 durable goods per interview were coded. The location of
purchase was coded as county or city names. At MSU, these names were edited
and recorded into county Federal Information Processing Standard (FIPS) codes.
The purpose of the analysis of durable goods equipment spending was to
generate profiles comparable to the trip spending profiles. A difference
3 between durable goods purchases and trip spending is that durable goods may be
used on many different trips and at different sites. This presents difficul-
5 ties in attributing a portion of the spending to use of the UMRS during the
13I
I
study period. To partially; account :or isro!lcm >e h 3issue) durable goods spending was conve 7:&. to an annuaI and per trip Ials
As was the case with trip spending. an average spending per par%," per trip w•as 3desired. This :number can be multiplied b. -ar:',. r ips per %-'ear to obtain an
annual estimate of total spending on durable goods associated with trips to
the UMRS.
We emphasize the qualifier "associated with" as durable goods items used
on the UMRS may also be used elsewhere. We do not attempt to apportion the Icosts of durable goods to UMRS sites versus other places where they may be
used, for example, based on frequency of use on the UMRS vs. elsewhere. Any 5such allocation must be largely ad hoc. Lacking valid methods for allocating
durable goods costs across multiple sites, one must either assume the durable 3goods would not have been purchased if opportunities to use this equipment
along the UMRS did not exist, or one must refer to durable goods expenses as
"associated with trips to the UMRS." Adjusting durable goods costs to a p~r
trip per year basis does not account for the portion of durable goods costs
that could be associated with other sites where that equipment may be used.
This problem is discussed further in the limitations section.
To obtain estimates of durable goods spending on a party trip basis, the n
cost of each durable goods item was divided by the number of trips that the
party had taken to the UMRS within the past year. For durable goods from List
No. 2 in Table 13, only goods purchased within the past year were included in
order to obtain an annual estimate. For major durable goods (List No. 1 in
Table 13), items purchased in the last 6 years were included, but the
resulting estimates were divided by six to put estimates on an annual basis.
The choice of a 6-year period for major purchases was based upon an
examination of results based on all purchases, durable goods purchased within
the past 6 years, and durable goods bought within the past year. Using 36 years of data provides a larger sample of durable goods than the I-year fig-
ures, while also avoiding the inclusion of items purchased many years ago at 3presumably much lower prices. This procedure distributes the costs of durable
goods evenly across several years under the assumption that the past year is
representative of the number of trips per year to the UMRS for each party.
The cost estimates will be somewhat understated as we did not attempt to
adjust for price increases in durable goods costs over the 6 year period. IBased on IMPLAN deflators for relevaat durable goods sectors, changes in dura-
ble goods prices from 1985 to 1990 were less than five percent. Of 983 items 514 I

I
reported from Lis: No. I. itens
half were purchased within the previous 6 .ears .
chased within the past ,-ear was particularly, weak for vsia ;rchas
major camping equipment.
To avoid problems caused by small sample sizes for particular segments
or durable goods items and large variation in durable goods expenses across
items and parties, we estimated durable goods spending at aggregate levels
first. Profiles of durable goods spending by segment and detailed equipment
categories were produced by distributing the spending estimated in major cate-
Sgories (boat, hunt, fish, camp, and other) to detailed subcategories according
to the proportions of durable goods spending reported over the past 6 years in
3 the full sample.
RESULTS
The results section is divided into four major parts. The first part
3 provides sample size and response rate information. Part two discusses the
formation and selection of visitor segments, segment distribution in the sam-
3 ples, and length of stay for overnight segments. Part three reports the find-
ings pertaining to trip spending (mailback portion of study). Part four
describes the results of the durable goods analysis.
Sample Sizes and Response Rates
A total of 1,697 parties, defined as occupants of one vehicle, were
approached (Table 1). Three hundred eighty-one (381) of the parties refused
to be interviewed. The range of interview refusals was 46 refusals (12.1%) in
the winter season to 160 (42.0%) in the spring. By region, a low of 11 refus-
3 als (3.1%) in the St. Paul District and a high of 141 (37.0%) in the St. Louis
District were encountered. Two hundred twenty-eight (228) of the interviewed
I parties declined to participate in the trip expense portion of the study,
leaving a mailback sampling frame of 1,088 parties (1,316 minus 228). Of the
1,088 parties Iho agreed to participate in the mailback portion of the study,
683 parties returned useable trip expense questionnaires, yielding a response
rate of 62.8 percent. At least 90 of the non-responding parties did not
receive follow-up reminders due to insufficient or wrong addresses. Because
interviewers were not allowed to obtain the names of persons interviewed, it
3 was nearly impossible to deliver the reminders to them.
15I

(II(A0 A
44 .14 -a4
0 L 04l2
a *o
0 0
W* wac..~~0
0to1 N N n4C '-0- 0ff!
41)
4n a94 4447; c- (% 0l It 0 (D an I 0 o ?. 0
r4~~~~ ~ ~ -C4-,M ( V N pý c
151 10 0N N.0fA.*
(A 41
0 0. g 1
4- 2 0 m CK
a, IOU . 0
'o0I n N 0 .0
-0 M to, - n 0 00 .t- * 0o 00 3(
0. 1.o 0' I 0 0 0 4 -
4- ~ ~ ~ ~ ~ ~ ~ L 0* 0IIN ' 0 0 '~ ~ I - 4
A 4*.- 4134
NO 0 0A 0n s- In ' U C
0. '
40 404 4 4 4 4 4 4 4 4 44 04
A ~ h - I - w 4- ON 0 0 AO 00?NC-1
o0 0 Z4 4** .- - "'C i AOO M ' N. O 2 . ':
A) 0 Q 4*
0 0 0 w
iz4 4 =- 1!0 .( ý
16 i *. - 44

I
Some variations in response razes 'ere observed .ic ross .s
and population subgroups (Tables 1 and 2). Response rates during winter and
spring seasons were below average (38% and 46%, respecctiel,; wflle response
rates for summer and fall seasons were above average (66% and 35%, respec-
tively). Response rates were slightly below average in the Rock Island and
St. Louis Districts (59% each). The response rate for sightseers was 70%. in
terms of population subgroups (Table 2), response rates were lower for day
3 users (61%). nonboaters (58%), and campers (57%), and higher for boaters 1'67%)
and other overnight visitors (74%). Residents and nonresidents displayed
3 response rates that were nearly identical to the overall response rate.
Due to some differences between segments in response rates to the mail-
back questionnaire, overnight visitors and boaters are slightly overrepre-
sented in the mailback sample (Table 2). This bias is corrected in estimates
of trip spending by weighing the sample according to the segment shares in the
on-site sample.
Visitor Segments
The calculation of total economic impacts requires the multiplication of
3 three entities: total number of visitors by segment (Y), spending by segment
(S), and a multiplier (M) (Tyrrell 1985):
I TEl - V X S X M
TEl - Total Economic Impact (income or jobs, usually)V - number of visitors in a given segment, where segments are defined
according to similarity in spending patterns (nonresident boat-
Iers, campers, people just visiting for the day, overnight visitors,
festival attendees, etc,)S - average spending by each of these groupsH - a multiplier expressing the change in the amount of employment or
income per unit of spending.
3 Errors in any of the multiplicands can cause large errors in total economic
impacts.
3 In order to reduce the amount of variation in expenditure estimates, it
is useful to segment visitors into subgroups that are relatively homogeneous
with respect to their spending patterns (Stynes and Chung 1986, Tyrrell 1985,
Propst et al. 1991). Due to the integral relationship between visitation and
17I
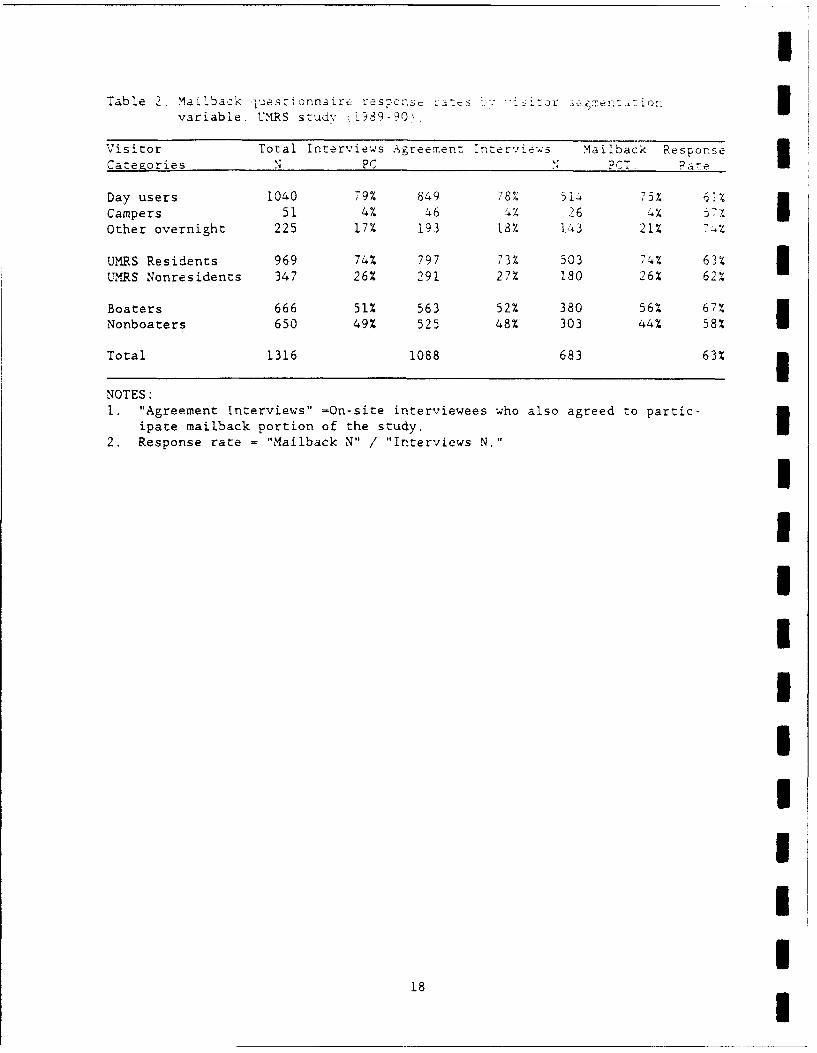
ITable 2. Mailback iuestionnair& respnsý t v :.)r S e~me:;a: on 3
variable, UMtRS study il989-90T
Visitor Total Interviews Agreement interviews Malilback ResponseCategories N PC N PCT. IateDay users 1040 79% 849 78% 5i4 75% 6i%Campers 51 4% 46 4% 26 4% 57%Other overnight 225 17% 193 18% 143 21% 74%
UMRS Residents 969 74% 797 73% 503 74% 63% IUMRS Nonresidents 347 26% 291 27% 180 26% 62%
Boaters 666 51% 563 52% 380 56% 67%Nonboaters 650 49% 525 48% 303 44% 58%
Total 1316 1088 683 63% 3NOTES:1. "Agreement Interviews" =On-site interviewees who also agreed to partic-
ipate mailback portion of the study.I2. Response rate - "Mailback N" / "Interviews N."
IUIIIIIIII
18!
I
spending in deriv-ing total impacts, v.'i r sprdi:.g r:es e
consistently with the way in which the Corps defines visitor use segments
boater vs. nonboater and day user vs. camper vs, other overnight accommodaticn
user. The category "other overnight" includes overnight visitors who lodged
either (a) in rented accommodations (hotels, etc.); (b) with family, friends.
or in a second home; or (c) on a boat.
Furthermore, in order to separate spending by local residents from
spending by tourists, it is necessary to know if the visitor is a resident or
nonresident of the region of interest. In most economic impact analyses,
spending within the region by visitors from outside the region (i.e., nonresi-
dents) is used to derive S in the above equation. Spending by residents of a
given region is excluded for economic impact purposes, but may be used to
estimate total spending (Propst and Stynes 1988). Combining the user/activity
matrix with visitor origin yields the preliminary set of 18 segments identi-
fied in Table 3.
Reduction of Visitor Segments. Similar to the findings of Propst et al.
(1991), the number and proportion of sampled overnight parties who lodged
3 either with friends or relatives, or on a boat were relatively minor. Because
of small samples for these segments, the three overnight noncamping segments
were merged into one group for reporting purposes. This merger results in a
reduction from the 18 segments in Table 3 to the following 12 segments which
were employed in the national study:
I R/D/B: resident, day use boaterR/D/NB: resident, day use nonboaterR/O/B: resident, overnight boaterI. R/O/NB: resident, overnight nonboaterR/C/B: resident, camper, boaterR/C/NB: resident, camper, nonboater
I NR/D/B: nonresident, day use boaterNR/D/NB: nonresident, day use nonboaterNR/O/B: nonresident, overnight boaterI. NR/O/NB: nonresident, overnight nonboaterNR/C/B: nonresident, camper, boaterNR/C/NB: nonresident, camper, nonboater
These 12 segments are defined in terms of four dichotomous variables:
day use/overnight, resident/nonresident, camper/noncamper, boater/nonboater.
The proportions of each of these visitor subgroups were provided in Table 2.
I19I

I
Table 3. Corps of Engineers visitor segments judged to be homogeneous with .respect to their spending patterns. U'IRS study 11939-90),
ISegment O Overnight Boater Resident Type of Lodging
1 day yes yes I2 day yes no --
3 overnight yes yes campground4 overnight yes yes rented accommodations5* overnight yes yes friends/relatives/2nd home6* overnight yes yes boat7 overnight yes no campground8 overnight yes no rented accommodations I9* overnight yes no friends/relatives/2nd home10* overnight yes no boat11 day no yes I12 day no no --
13 overnight no yes campground14 overnight no yes rented accommodations15* overnight no yes friends/relatives/2nd home16 overnight no no campground17 overnight no no rented accommodations18* overnight no no friends/relativesi2nd home
In the national study (Propst et. al 1992), these 6 segments were mergedinto an "other overnight" category due to inadequate sample sizes. Sincethe same pattern held in this study (i.e., small sample sizes in these6 segments), the same segments were again merged for further analyses. Sub-sequent analyses, where possible, are therefore based on 12 visitorsegments.
IIIIII
20

An important d:-.:enco te e
tion of "resident." Here a resident is scmeone who ives withL the •o,'ie•
that define the 'UHRS region. not a local area defined by a 30 mnile radius of
the site where a subject was interv:iewed.
The full sample in this study (on-site portion) was dominated by day
users (79% of parties) as compared to campers (4%) and other overnight, non-
camping parties (17%). There was a preponderance of residents over nonresi-
dent.3 (74% vs 26%, respectivelv). Boateis and nor,boaters were evenly divided.
Only minor variations in these prop)rtions are observed in the mailback por-
3 tion of the study (Table 2).
The top half of Table 4 shows the number and proportion of cases in each
of the 12 segmentj for both the on-site and mailback portions of the study.
Dividing the sample into 12 segments yields some segments with relatively low
sample sizes. For _xample, none of the four camping segments contain sample
sizes greater rhan 23. The two resident, overnight segments contain less than
40 cases each. Corresponding samples sizes for the mailback portion of the
survey, which were used to estimate trip spending, are even smaller. To be
able to analyze and report results by visitor segment with some degree of
3 confidence, the 12 visitor segments described above were therefore narrowed
into 6 segments. The segment definitions follow with the number of cases and
segment shares for each segment in parentheses.
R/D/B: resident, day use boater (N-480, 36%)R/D/NB: resident, day use nonboater (N-405, 31%)R/OVN: resident, overnight visitors (N-84, 6%)NR/D/B: nonresident, day use boater (N-60, 5%)NR/D/NB: nonresident, day use nonboater (N-95. 7%)NR/OVN: nonresident, overnight visitors (N-192, 15%)
To make this reduction, the four overnight segments (campers and non-
campers) weie combined into "resident, overnight" and "nonresident, overni C"
categoris,. The resident/nonresident split was maintained as this separation
is necessary to distinguish resident and nonresident spending for economic
3 impact analysis. The four day use segments were not altered. The bottom half
of Table 4 displeys sample sizes and proportions based on the 6 aggregated
3 segrents. This reconfiguration of segments results in the ability to analyze
and report results by segment based on no less than 60 cases for variables
gathered in the on-site survey and no less than 30 cases for trip spending
estimates from :he mailback survey. The smallest sample size (N-60) is for
I21I

I
Table 4'. On-sine interview and mailback qesionniLIsample sYzes by 12 segments and 6 sezmenzs.UMRS studv (1989-90).
on-site mailback12 Segments N Pct. N Pct.
R/D/B 400 36% 260 38%R/D/NB 405 31% 185 27%R/O/B 3 3% 33 5%R/O/NB 23 2% 13 2%R/C/B 9 1% 6 1%R/C/NB 13 1% 6 1%UMRS Residents 969 74% 503 74% INR/D/B 60 5% 30 4%NR/D/NB 95 7% 39 6%NR/O/B 72 5% 47 7%
NR/O/NB 91 7% 50 7%NR/C/B 6 0% 4 1%NR/C/NB 23 2% 10 1% IUMRS Nonreside 347 26% 180 26%
Total 1316 100% 683 100% 1on-site mailback
6 Segments N Pct. N PCt.R/D/B 480 36% 260 38%R/D/NB 405 31% 185 27%R/OVN 84 6% 58 8%UMRS Residents 969 74% 503 74%
NR/D/B 60 5% 30 4%NR/D/NB 95 7% 39 6% INR/OVN 192 15% ill 16%UMRS Nonreside 347 26% 180 26% 3Total 1316 100% 683 101.
R/NR: Resident /Nonresident of the UMRS 3B/NB: Boater /NonboaterD/C/O: Day users /Campers / Other overnight usersOVN: All overnight users
IIU
22 !

I
nonresident:.: s who
resident, day use boaters.
The on-site segment percentages '1c-er: al ct Table provide esti-
mates of the segment shares for the entire population or LMRS visitors. These
on-site percentages are used in subsequent trip-related spending tables --
adjust for nonresponse bias in the mailback ques-ionrnaire sample Adjustmernts
are not necessary for durable goods analyses as these data were gathered on-
site from the full sample.
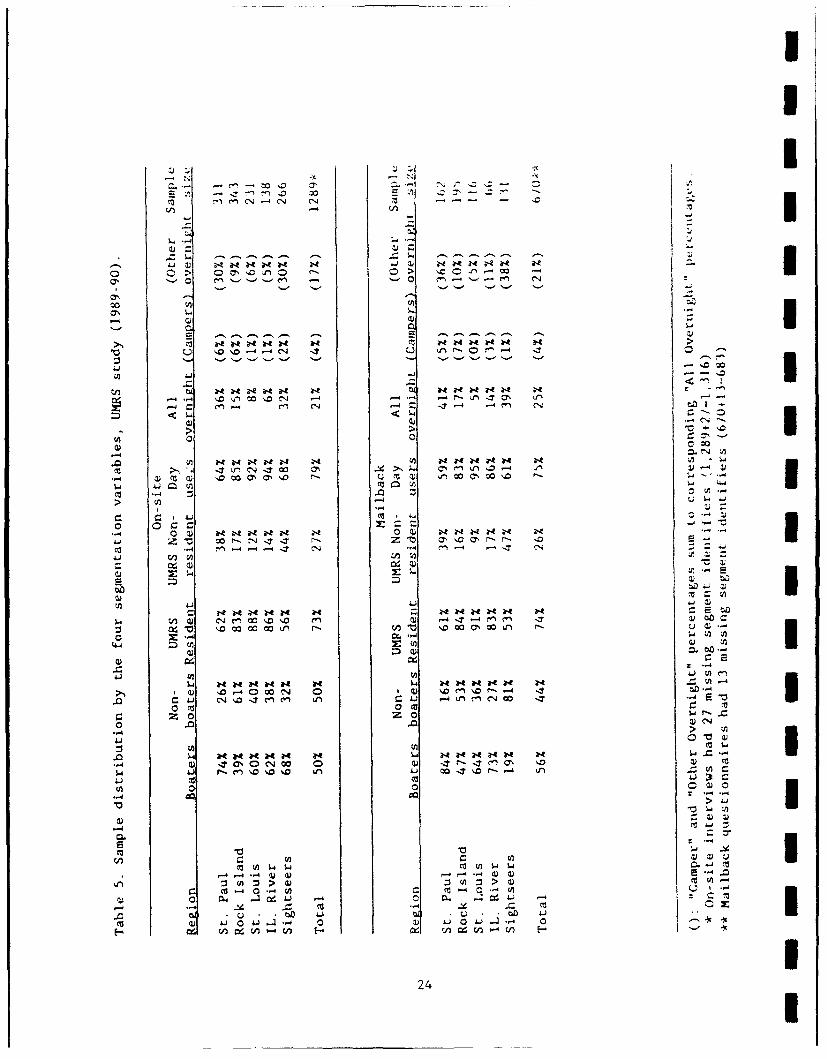
Regional Segment Distributions. Regional variations in the distribution )f
the six aggregated segments within the sample are documented in Tables 5 and
6. Appendix Table C-1 provides the distribution of the 12 segments by region
for both the mailback questionnaires and on-site interviews.
Among residents, the largest proportions of day use boaters (55% and
54%, respectively) were found in the St. Louis District and Illinois River
Waterway (Table 6). The greatest percentages of resident nonboaters were
found in the Rock Island District (46%) and among sightseers (33%), For the
St. Paul District visitors and the sightseer category, nonresident overnight
visitors comprised over one fourth of the parties sampled, a significantly
higher proportion than found in the other regions.
In general, the data in Table 5 further confirm the relatively close
correspondence between mailback and on-site interview percentages. However,
there are two exceptions. First, across the four regions, there is a pattern
of higher percentages of boaters returning their mailback questionnaires than
the cori •sponding percentages of boaters who were interviewed on-site. The
reverse is true for sightseers who were also boaters (22% interviewed on site:
19% returned mailback questionnaires), Secondly, the percentage of Illinois
3 River overnight visitors who returned their mailback questionnaires (14%) is
more than twice the percentage of Illinois River overnight visitors who par-
ticipated in the on-site interview (6%).
Nights Spent per Trip
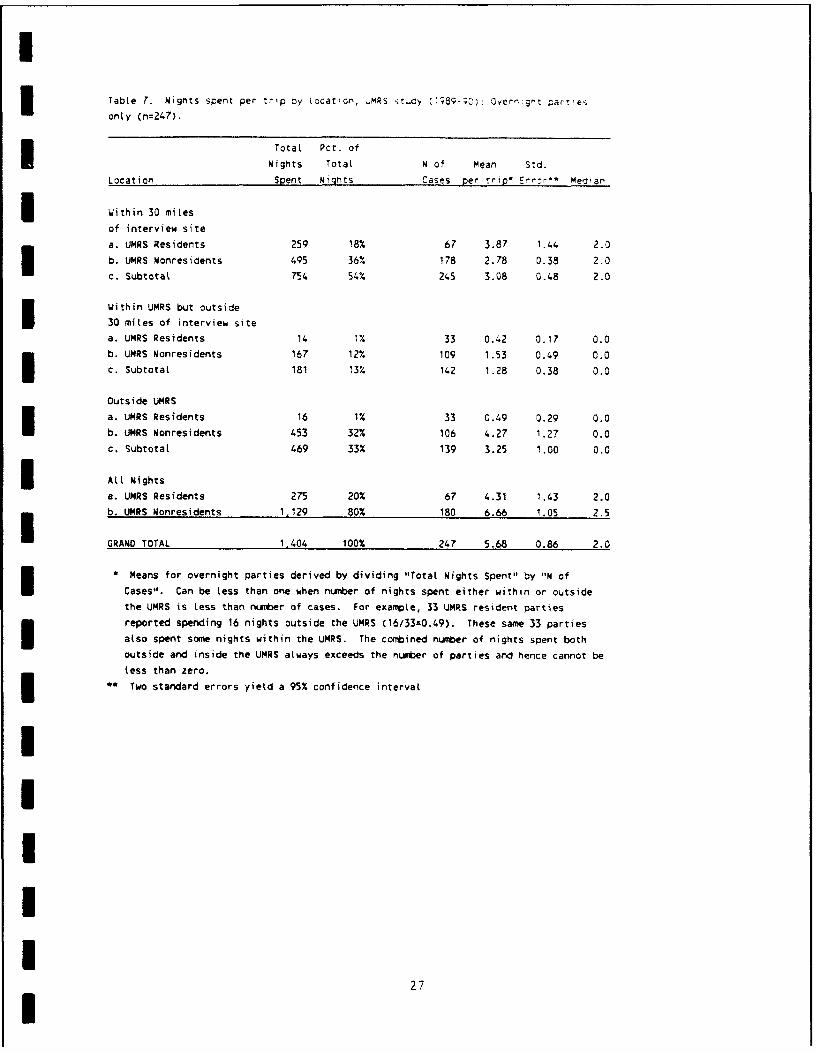
A total of 1,404 nights were spent on all trips reported by the 247
overnight parties (Table 7). Fifty-four percent (54%) of all nights were
spent within 30 miles of the interview site, 13% within the UMRS but further
than 30 miles from the site, and 33% outside the UMRS. Overnight visitors
I23I
-1 CA-2 5N 14C41
0 L 0- - * - -
~ NNNN N J W 'NNN
r-4 Z1 C-' =UD-4t
-4 f"N CN -4 CNNN I
un ý-4 00
.1 a) J cc w'.. 30 a Ný c Z) nc 0
41 COC*
al IlIl . 4-o 0 cZ o- -0 a, -"f-
.140 1.4N a N t4 .1J NN NN
W CL,
2Z
4-1 C1 I"- C". Li ý LM ý) 4 co -Z
a)) t4
w- a- NN4 P4 a-4 a-4 tNt.4 ?U DON 040 0 C) Q) CO~-)c o4
11 0, (1)
.2 40 ~ ' co~ -4 2 J 2
:- W- *-
2 -4
u W- u t 4
W, - IA
24

ITable 6. Dist ri'O~imuz of .'.~:o s v xj
1989-90• On-site s:r'evs
3 Re~Lon
St. Paul Rock Island St. Louis IL Rive r Sightseers TotalN PCT N PCT N PCT N PCT N PCT 1" PC-
SegmentR/D/B 118 38% 97 28% 128 55% 75 54% 49 18% 467 36%R/D/NB 42 14% 158 46% 68 29% 40 29% 88 33% 396 31%R/OVN 32 10% 28 8% 7 3% 3 2% 13 5% 83 6%UMRS Resid 192 62% 283 83% 203 88% 118 86% 150 56% 946 73%
I NR/D/B 32 10% 15 4% 4 2% 4 3% 3 1% 58 4%NR/D/NB 9 3% 22 6% 13 6% 11 8% 40 15% 95 7%NR/OVN 78 25% 23 7% 11 5% 5 4% 73 27% 190 15%Nonresiden 119 38% 60 17% 28 12% 20 14% 116 44% 343 27%
N 311 100% 343 100% 231 100% 138 100% 266 100% 1,289* 100%Pct. 24% 27% 18% 11% 21% i00%
R/NR: Resident /Nonresident of the UMRSB/NB: Boater /NonboaterD/OVN: Day users /Overnight usersI On-site interviews had 27 missing segment identifiers (1289+27-1316)
IIIIIIII
25I
I
spent an average of 5.7 nights per :rip f:r o'. ni ; a.ir: o:ier:. 3interval - 4.0 to 7,5 nights). The averaze trip ength for residents .;as
4.3 nights compared to 6.7 nights for nonresidencs.
Residents spent fewer nights per trip than nonresidents and most nights
spent by UMRS residents were spent within 30 miles of the interview site
(Table 7). Very few nights were spent either outside the U.MRS or within the
UMRS but farther than 30 miles from the site. It is still' possible that M.MRS
resident overnight groups travel substantial distances along the river in one
day to reach their destination and then spend most of their nights near the
site.
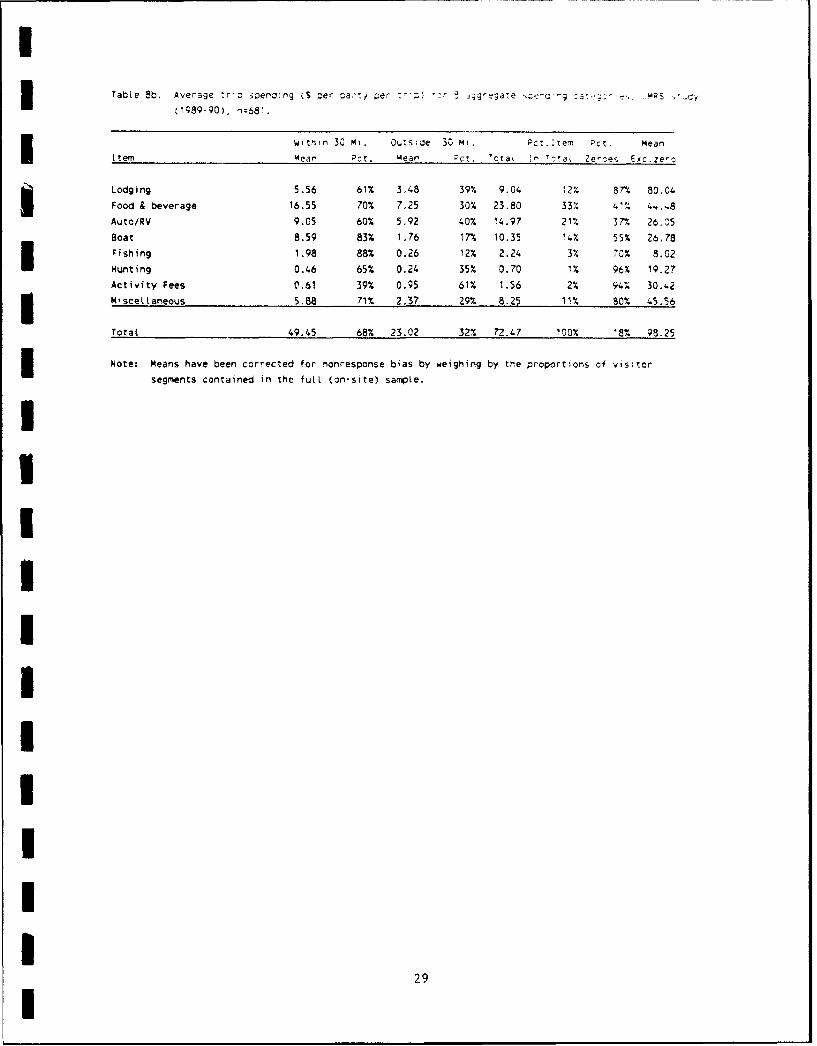
Trip Expenditures
Across the i-year sampling period, the 683 parties who returned their
mailback questionnaires averaged $72 in variable costs per trip (Table 8).
Sixty-eight percent of these expenditi-re. were made within 30 miles of the
project. Trip spending means were weighted by the proportions of the six
segments in the on-site sample (lower half of Table 4) to adjust for non-
response bias.
Trip Spending by Segment. Given that segments were formed to obtain subgroups
with relatively homogeneous spending patterns, we find considerable variation
in trip spending across the six segments. Trip spending varied from an aver-
age of $22 per trip for resident, day users who do not boat to around $200 per
trip for the two overnight segments (see "Total" columns in Table 9A).
All six segments spent more than half of variable trip purchases within
30 miles of the interview site. Day users not boating spent the least on
trip-related goods and services. Resident day users (boaters and nonboaters)
made the largest portion of their variable trip purchases within the local
region (89% and 75%, respectively). Nonresident, day users who boat and non-
resident overnight groups also spent relatively large proportions within the
local region (66% and 62%, respectively).
Appendix Tables C-2 and C-3 report trip spending profiles for the 12
visitor segments defined in the national study (Propst et al. 1992). Table C-2
displays total trip spending; Table C-3 shows spending by all 12 segments
within 30 miles of the interview site. Small sample sizes for some segments m(e.g., n - 6 for the nonresident, campers who boat segment) suggest caution in
the use of some of these more detailed segments.
26
ITable 7. Nights spent per trip by Location, JMRS O.y C89-9•: Cve'Gnvt parý,esonly (n=247).
Total Pct. of
Nights Total N of Mean Std.
Location Spent Nights Cases per ýIrip Errr* Mecian
Within 30 miLes
of interview site
a. UMRS Residents 259 M8% 67 3.87 1.44 2.0
b. UMRS Nonresidents 495 36% 178 2.78 0.38 2.0
c. Subtotal 754 54% 245 3.08 0.48 2.0
Within UMRS but outside
30 mites of interview site
a. UMRS Residents 14 1% 33 0.42 0.17 0.0
b. UMRS Nonresidents 167 12% 109 1.53 0.49 0.0
c. Subtotal 181 13% 142 1.28 0.38 0.0
Outside UMRS
a. UMRS Residents 16 1% 33 0.49 0.29 0.0
b. UMRS Nonresidents 453 32% 106 4.27 1.27 0.0
c. Subtotal 469 33% 139 3.25 1.00 0.0
AUl Nights
a. UMRS Residents 275 20% 67 4.31 1.43 2.0
b. UMRS Nonresidents 1.129 80% 180 6.66 1.05 2.5
GRAND TOTAL 1,404 100% 247 5.68 0.86 2.0
Means for overnight parties derived by dividing "Total Nights Spent" by "N of
Cases". Can be less than one when number of nights spent either within or outside
the UMRS is less than number of cases. For example, 33 UMRS resident parties
reported spending 16 nights outside the UMRS (16/33:0.49). These same 33 parties
also spent some nights within the UMRS. The comrbined numbr•er of nights spent both
outside and inside the UMRS always exceeds the number of parties and hence cannot be
less than zero.
* Two standard errors yield a 95% confidence interval
IIIII
27I

1
Table BA. Average trip spending (S per oarty per trio) *-r 33 3etavej aai cacK eApenol?.re :ets, ,
UMRS study (1989-90), n=681.
Within 30 mi. Cutsioe 30 mi. Pct.ltem Pet. Mean
Item Mean Pct. mean PC,. 'ota7 a .a Zew;es EAc.Zer:
LOOGING
Hotel 4.40 58% 3.16 42% 7.56 10% 91% 96.10
Campgrounds 1.15 78% 0.33 22% 1.48 2% 95% 33.82
FOOD AND BEVERAGE
Grocery 8.18 71% 3.33 29% 11.51 16% 52% 26.31
Restaurant 8.37 68% 3.92 32% 12.29 17% 64% 37.83
AUTO/RV
Auto/RV gas & oil 7.11 58% 5.12 42% 12.23 17% 38% 21.17
Auto/RV rental 0.25 34% 0.48 66% 0.73 1% 99% 129.40
Auto/RV repairs 0.44 92% 0.04 8% 0.48 1% 96% 14.33
Auto/RV tires 0.85 83% 0.18 17% 1.03 1% 99% 95.88
Auto/RV parts 0.28 92% 0.02 8% 0.30 99% 33.57
Auto/RV parking & tolls 0.12 60% 0.08 40% 0.20 * 95% 4.62
BOAT-RELATED
Boat gas & oil 4.90 84% 0.96 16% 5.86 8% 56% 15.45
Boat rental 0.08 82% 0.02 18% 0.10 * 99% 45.00
Boat repairs 0.91 91% 0.09 9% 1.00 1% 98% 57.20
Boat parts 1.81 83% 0.36 171 2.17 3% 97% 78.62
Boat Launch fees 0.89 77% 0.27 23% 1.16 2% 96% 32.96
Boat fares 0.00 0% 0.06 100% 0.06 * 99% 18.50 IFISHING
Fishing License 0.41 85% 0.07 15% 0.48 1% 98% 20.88
Boat charter fee 0.01 73% 0.00 27% 0.01 * 99% 5.00 IFishing bait 1.57 89% 0.18 11% 1.75 2% 71% 6.52
HUNTING
Hunting License 0.13 90% 0.02 10% 0.15 99% 17.83
Ammunition 0.32 59% 0.23 41% 0.55 1% 97% 17.13
ACTIVITY TEES
Equipment rental 0.25 85% 0.05 15% 0.30 * 99% 22.50
Guide fees 0.04 33% 0.07 67% 0.11 99% 33.33 ISpectator sports fee 0.04 35% 0.07 65% 0.11 * 99% 16.67
Tourist attraction fee 0.12 19% 0.52 81% 0.64 1% 97% 22.18 IOther recreation fee 0.16 39% 0.24 61% 0.40 1% 98% 23.38
MISCELLANEOUS
Film purchase 0.86 62% 0.53 38% 1.39 2% 86% 10.95
FiLm developing 0.40 48% 0.44 52% 0.84 1% 92% 12.13
Souvenirs 1.17 61% 0.75 39% 1.92 3% 94% 34.20
Footwear 0.86 80% 0.21 20% 1.07 1% 97% 44.28
Men's clothing 1.07 96% 0.04 4% 1.11 2% 96% 34.04
Women's clothing 1.53 79% 0.39 21% 1.92 3% 95% 44.65
ALL other 0.78 49% 0.80 51% 1.58 2% 95% 33.00
Note: Means have been corrected for nonresponse bias by weighing by the proportions of visitor Isegments contained in the full (on-site) sample.
(') =Less than 0.5%.
28
I3 ~ ~table 8b. Average tr'p svernclig (S per ,a-!/ per 3z) : ;ýga-e -MR :;;.. YS
within 30 mi. Outs~oe 30 Mi. Pct.:tem Pct. Mean
Item Mean Pct. - ea n ;¢t. Iota( 11 7 taý Ze roes Egc.ze~o
Lodging 5.56 61% 3,48 39% 9.04 12% 87" 80.04
Food & beverage 16.55 70% 7.25 30% 23.80 33% 41. 4...8
Auto/RV 9.05 60% 5.92 40% 14.97 21% 37% 26.35
Boat 8.59 83% 1.76 17% 10.35 1% 55% 26.78
Fishing 1.98 88% 0.26 12% 2.24 3% 70% 8.02
Munting 0.46 65% 0.24 35% 0.70 1% 96% 19.27
Activity Fees 0.61 39% 0.95 61% 1.56 2% 94% 30.,2
Miscellaneous 5.88 71% 2.37 29% 8.25 11% 80% 45.56
Total 49.45 68% 23.02 32% 72.47 i00% '8% 98.25
Note: Means have been corrected for nonresponse bias by weighing by the proportions of visitor
segments contained in the futl (on-site) sample.
III3IIIIIII
29I

~~~ 000 0 0 0 0 00 0 0 0 00
In v 00 - f 4 ) 00 000P000 000 -0 0 00 00 ýf
Z> 00 0 0 0 0 0 0 '0 00 00 "00 'fb N 0 0
- 0f- v In e0t0ooo 0 g V ý O 0 00 0n 000 M000C>00000n0000 0 I
0 N 00-0 0 00 000a" 0 0 a00 Q0 ý
NE - no oo!oo ooo ~ o o o ~ o o o ~ o o . o
0 Zg 00 r88 88 0 08 3 8 8 888 U o 00 W
0 0 e.J e ~ -0 t00 0 0 0 0-0 0 0 0-0 0-0 0~ 00 0- a' f 0 -
- 000- OOn 000O 000 0 0o00e0000 0 0 am 0 0.e40 00
C0
ccZ000m - 0 0a0 OO OU 0 00 0 00 0 00 80 G f0 N0 0 'Io ( o 0 N0 00QaC>0 0(a0 0 0 0 0 t0 0 0 0 0 0 .0 0 aW
0 000- a C-ooIDoeQooooooC eooeeaoooooooooo0 00 00 0 - '
E 0 0C>000'm ,0 000 00 00 a00m0 av0 0 9 00 000 F- 0 a0 0m .0) 0 0 9W N90 990 0 0 IN00 0 In000 0 0 " m0 0 0 0
.0 0
* 00 * 0Q0 @ @ 000 00- P lw 00OD 200 0t,0 00 0 0 a0 0 00 00 0 00 0 a 0
~~c "0 00 ~ 80 ~ ~ ~ G 00~0 0z 6 0 0 m00U 0 a o o 00a 0
a,"- CY cu mI
CC
%n q 0 I - mvr ,f
0 0000N000 0 0 0 0 0 0C 0
C4
(n w0 0L0~ 0 0 0C00
o o o o o o0 o 6 0 o 30 oooaQ00oaoo0 4
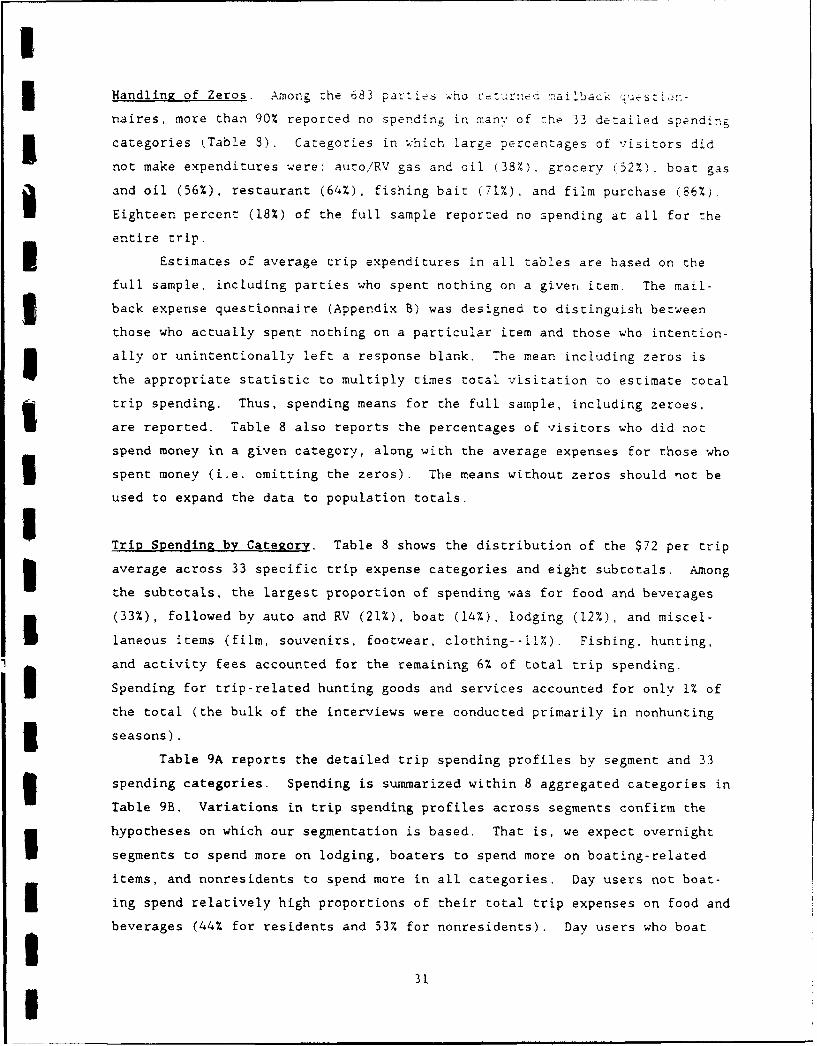
IHandling of Zeros. %mong the 683 parties who ret' TIrred ibaJZ
naires, more than 90% reported no spending in many of the 33 detailed spending
categories (Table 8). Categories in which large percentages of visitors did
not make expenditures were: auto/RV gas and oil (38%), grocery (52%), boat gas
and oil (56%), restaurant (64%), fishing bait (71%), and film purchase (86%).
Eighteen percent (18%) of the full sample reported no spending at all for the
entire trip.
Estimates of average trip expenditures in all tables are based on the
full sample, including parties who spent nothing on a given item. The mail-
Sback expense questionnaire (Appendix B) was designed to distinguish between
those who actually spent nothing on a particular item and those who intention-
ally or unintentionally left a response blank. The mean including zeros is
the appropriate statistic to multiply times total visitation to estimate total
trip spending. Thus, spending means for the full sample, including zeroes.
are reported. Table 8 also reports the percentages of visitors who did not
spend money in a given category, along with the average expenses for those who
spent money (i.e. omitting the zeros). The means without zeros should not be
used to expand the data to population totals.
Trip Spending by Category. Table 8 shows the distribution of the $72 per trip
3 average across 33 specific trip expense categories and eight subtotals. Among
the subtotals, the largest proportion of spending was for food and beverages
(33%), followed by auto and RV (21%), boat (14%), lodging (12%), and miscel-
laneous items (film, souvenirs, footwear, clothing--ll%). Fishing, hunting,
and activity fees accounted for the remaining 6% of total trip spending.
Spending for trip-related hunting goods and services accounted for only 1% of
the total (the bulk of the interviews were conducted primarily in nonhunting
3 seasons).
Table 9A reports the detailed trip spending profiles by segment and 33
3 spending categories. Spending is summarized within 8 aggregated categories in
Table 9B. Variations in trip spending profiles across segments confirm the
hypotheses on which our segmentation is based, That is, we expect overnight
segments to spend more on lodging, boaters to spend more on boating-related
items, and nonresidents to spend more in all categories. Day users not boat-
ing spend relatively high proportions of their total trip expenses on food and
beverages (44% for residents and 53% for nonresidents). Day users who boat
I

UTable 98. Average trip spending for item subtotals (S per party per tr'p),
RIO/8 0=~259) RDN r~5% Item Pct. X item Pct,
Item In 30 Out 30 Total in Total Error In 30 Out 30 Total in Total Ecrr-
Lodging 0.00 0.00 0.00 0% 0% 0.00 0.00 0.00 0% c%
Food and beverage 12.15 2.12 14.27 26% 11% 7.73 2.11 9.84 44A 1%
Auto and RV 10.16 1.98 12.14 22% 22% 3.86 1.36 5.22 24% 16%
Boat 15.49 1.10 16.59 30% 21% 0.00 0.00 0.00 0% 0%
Fishing 2.63 0.39 3.02 5% 27% 1.07 0.05 1.12 5% 21%
Hunting 0.76 0.23 0.99 2% 27% 0.29 0.00 0.29 1% ICC%
Activity Fees 0.29 0.00 0.29 1% 48% 0.00 0.51 0.51 2% 57%
Miscellaneous 6.94 0.53 7.47 14% 36% 2.36 0.85 3.21 14% 36%
Total 48.80 6.33 55.13 100% 13% 16.59 5.56 22.15 100% 14%
NR/O/B Cn=30) NR!0/NS (n.39) 5% Item Pct. % Item Pct.
In 30 Out 30 Total in Total Error In 30 Out 30 Total in Total Error
Lodging 0.00 0.00 0.00 0% 0% 0.00 0.00 0.00 0% 0%
Food and beverage 11.63 4.84 16.47 34% 30% 9.92 7.54 17.46 53% 25%
Auto and RV 8.90 7.27 16.17 33% 20% 2.77 5.46 8.23 25% 21% I
Boat 9.07 2.70 11.77 24% 19% 0.00 0.00 0.00 0% 0%
Fishing 1.63 0.34 1.97 4% 31% 0.79 0.29 1.08 3% 54%
Hunting 0.40 0.00 0.40 1% 100% 0.00 0.92 0.92 3% 130%Activity Fees 0.00 0.00 0.00 OX 0% 0.05 2.03 2.08 6% 89%
Miscellaneous 0.23 0.57 0.80 2% 52% 3.03 0.00 3.03 9% 57%/
Total 31.87 16.43 48.30 100% 20% 16.56 16.23 32.79 100% 23% 3R/OVN (n=58) NR/OVd (n=110)
% Item Pct. % Item Pct.
in 30 Out 30 Total in Total Error In 30 Out 30 Total in Total Error
Lodging 22.45 16.45 38.90 18% 25% 29.05 15.93 44.98 23% 15%
Food and beverage 37.93 25.36 63.29 30% 20% 43.99 23.96 67.95 34% 10%
Auto and RV 21.24 23.88 45.12 21% 30% 14.92 17.97 32.89 17% 12%
Boat 16.72 7.81 24.53 12% 37% 12.75 6.55 19.30 10% 24%
Fishing 2.81 0.19 3.00 1% 25% 3.09 0.37 3.46 2% 27%
Hunting 0.31 0.26 0.57 0% 70% 0.42 0.57 0.99 1% 56% UActivity Fees 2.12 5.52 7.64 4% 46% 1.93 2.83 4.76 2% 44%
Miscellaneous 7.09 17.25 24.34 12% 39% 14.15 4.66 18.81 10% 25% 3Total 113.02 97.84 210.86 100% 24% 121.88 75.26 197.14 100% 9%
R/NR: Resident /Nonresident of UMRS
B/NB: Boater /Nonboater ID/OVN: Day users /Overnight users
Pct.Error: Standard error of the mean as a percentage of the mean. Two standard errors yield a 95% confidence interval.
I32 I

divide their expenses more evenly among food and beverages. aitoR', and boa:-
related costs.
S Variation Across Regions. Table 10 compares trip spending according to desti-
nation region (where party was interviewed). The four geographic regions con-
tain sites on both banks of the river and thus do not correspond to state
boundaries. Given that the river itself may confine expenditures to one side
or the other, further analyses with different regional boundaries (e.g., bv
state) are recommended.
The most striking feature of Table 10 is that there is little consis-
tency in spending profiles across regions. Average spending ranges from $603 per trip in the Rock Island District to $109 per trip in the St. Paul Dis-
trict. The proportion of spending within 30 miles of the interview site
varies from 51% among sightseers to 85% in the Illinois River Waterway.
The Rock Island and St. Louis District profiles are the most similar,
with the exception of lower proportions spent on lodging and food and a higher
proportion spent on miscellaneous items in the St. Louis District. The
St. Paul District and sightseer subgroup also display similar profiles except
Sin lodging and boating expenses, Parties interviewed in the Illinois River
Waterway reported, by far, the largest percentage of costs related to boating
1 (39%). These groups also incurred the lowest proportion of lodging expenses
(2%).
Comparisons by region alone do not necessarily account for the varia-
tions in spending profiles. Other factors may interact with regional influ-
ences. For example, differences in the percentages of visitors from each of
the six segments account for some of the regional variation. The Rock Island,
St. Louis, and Illinois River regions contained a much higher percentage of
day users than the other two regions (see Table 5 and Appendix Table C-I).
Day users have fewer trip-related expenses than overnight visitors. The
St. Paul District and sightseers contained a relatively high proportion of
nonresidents who were staying overnight. In addition, the St. Paul District3 sample included the largest ratio of boaters (84%). Due to the uncertainty
concerning the extent to which regions may be influencing these variations,
the full sample spending profiles (Table 8) may be more reliable than the
I regional sample estimates for assessing regional impacts.
333I

-4 z m 3q
0 a ) 0 al - 1 lAr ARý ?.R ~ N ale -tA -~ 34 .R 1
- C
(1) (-1 -4 - CN (NJ ~- I* J.' x
ul 0 00~-
4-I4
-41 C' - o -T - 0
*N CN ,4 (N ~ -N C4.
a4.
M
cu - 04(J,4-
-40* r- r-~ Cn -h- \I- - L T I 4rý r . C co-4If ~ 04 - ~ L~ C 0 0 -
V-4 ý- -4 '
(D0 14ak 3ZC'N ~ O N-'~ 34 a a4 ac'Ne-J eaNrN-N.1' -
41 0 - -L -O~~ 4 C (3 Lra, "o c -4a
w- -4 -
3-4 (3.-
wl CJo 1 0 C)L , M 0 1 li w C4r-ý
-4. C7 0r 1 C 004L nV- cC) P
4) 0. r4 0A41 aý -4 r4 -4 - al 00 t0.-'t4 '-
-4 1l

I
5 Resident vs. Nonresident Spending. bdblc !i :h: i ib or oIrir
spending by origin of visitor and location of spending. For this analsls.
residents of the UMRS were divided into two subcategories: (1) Local. visitors
living within 30 miles of the site (defined operationally as in the same
county), and (2) UMRS residents living more than 30 miles from the site.
Visitors from outside the UMRS region make up the third category based on
visitor origins. Forty percent of visitors live within 30 miles of the site,
a third (33%) live within the UMRS, but beyond 30 miles, and 24% reside out-
side the UMRS.
3 The location where the spending occurred is divided into two groups:
(1) within 30 miles of the site, and (2) ou-side of 30 miles. A small por-
tion of spending outside of 30 miles will still be within the UMKRS region.
About two thirds (68%) of trip spending occurred within 30 miles of the inrer-
view site and one-third was spent outside 30 miles. We cannot directly esti-
mate how much of the spending outside of 30 miles is within the UMRS, but
conservatively estimate that at least 85% of all trip spending by visitors to
3 the UMRS occurred within the UMRS region.
To obtain the portions of total trip spending by residence and where the
3 spending takes place, we begin with the distribution of spending on a typical
trip for each segment (Step I in Table 11). The three segments must then be
weighted according to the numbers of trips that each generates (40% by local
residents, 33% by UMRS residents living beyond 30 miles, and 26% bv nonresi-
dents). This is done by generating total spending for a representative set of
1000 party trips in step 2. These figures are then converted to percentages
in step 3.3spLocal residents account for about a third of all trip spending (32%),
visitors from outside the UMRS contribute 44% of the total and other residents
3 of the UMRS from beyond 30 miles make up the remaining 23%. Forty-three per-
cent (43%) of all trip costs are spent locally by visitors from outside of the
local area (includes UMRS residents from outside 30 miles and nonresidents of
UMRS). About one fourth (24%) of local spending is by local residents.
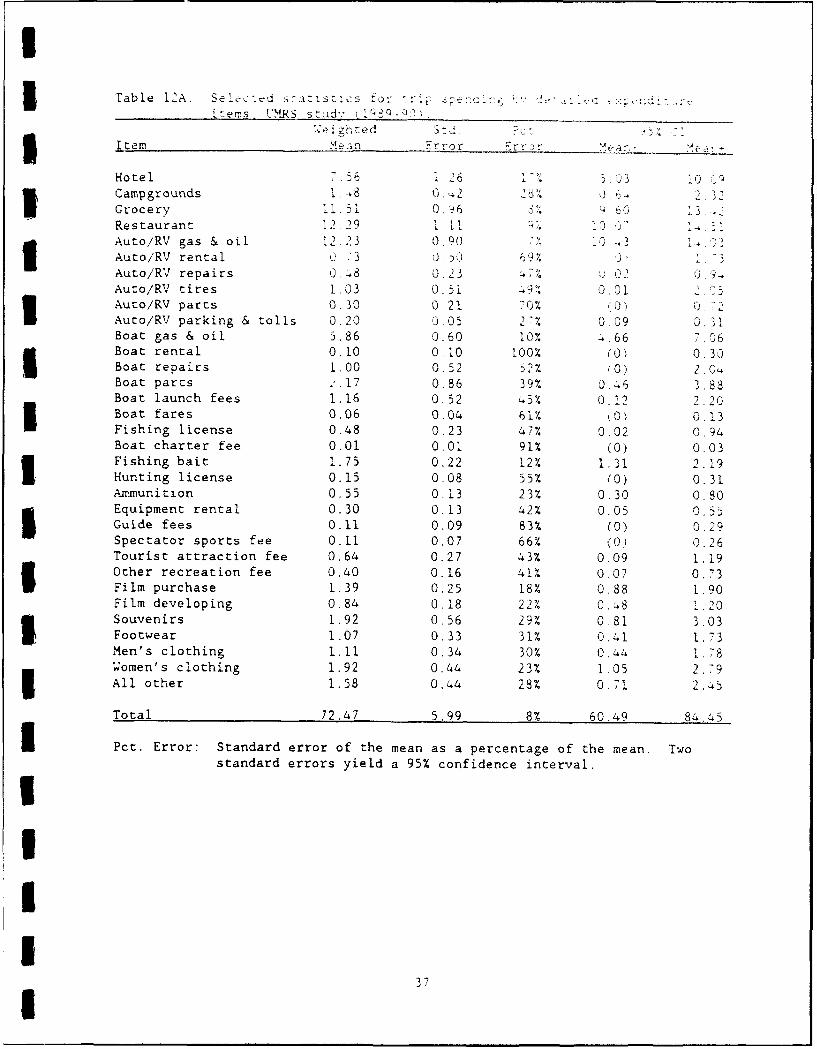
I Errors in Estimates of Trip Spending. Table 12 reports sampling errors asso-
ciated with trip spending estimates. The "percent error" is the standard
error divided by the mean and multiplied by 100. Presenting the standard
error as a percentage aids in interpretation of variance. For example,
3 Table 12B indicates, that for all 683 cases, the error associated with the
35I

UTable 11. Distribution of trip spendin.g b- :eret aLd regior i
UMRS stud- (1989-90).
Percent Spending Spending Tota,of Within OuDtside Trip £
trirs UMRS U:MRS Spending
STEP 1: Dollars per part',; per trip --------
Residents within 30 40% 48.78 16,08 64.86UMRS Resident 34% 39.13 17.31 56.44UMRS Nonresident 26% 83.85 52.54 136.39Total 100% 49.45* 23.02* 72.47* ISTEP 2: --- Trip Spending per 1,000 Party-Trips---
Residents within 30 (400 tri 19,720 6,500 26,220UMRS Resident (240 trips) 13,024 5.761 18,785UMRS Nonresident (260 trips) 22,046 13,814 35,859Total (1000 trips) 54,789 26,075 80,864 5STEP 3: --- Percent of Total Trip Spending- ---
Residents within 30 24% 8% 32% 3UMRS Resident 16% 7% 23%UMRS Nonresident 27% 17% 44%Total 68% 32% 100%
NOTES:I. (*) Averages have been corrected for nonresponse bias by weighing
by the proportion of visitor segments found in the full (on-site) Isample.
2. Entries in step 2 obtained by multiplying per trip figures instep 1 by 400 trips (residents within 30 miles of site), 240 trips I,other UMRS residents), and 260 trips (nonresidents of UMRS),respectively.
3. Percentages in step 3 obtained by dividing step 2 figures by thetotal ($80,864).
IIII
36 I
ITable 12A. SeL "" r
te ms, UMR S std I' SQ
Item Me:in Err-or E1rr0r >'-..irr-
Hotel 7.56 1.26 65 .
Campgrounds 1,48 0.42 612Grocery i1 51 0.%6 13Restaurant 12 29 1.11
Auto/RV gas & oil 12.23 0.90 7.Y 14
Auto/RV rental 0.-3 0 50 64 I
Auto/RV repairs 0.48 0.23Auco/RV tires 1.03 0.5i 49% 0.013 Auco/RV parts 0.30 0.21 70% (0) 0Auto/RV parking & tolls 0.20 0.05 -Y. 0 09 0.31Boat gas & oil 5.86 0.60 10L0 ý -ý 66 7-C36
Boat rental 0.10 0.10 100% (0) 0.30Boat repairs 1.00 0.52 52% (0) 2.0Q
Boat parts z.17 0.86 39% 0.46 3A88Boat launch fees 1.16 0.52 45% 0.12 2.20Boat fares 0.06 0.04 61% .0" 0.13Fishing license 0.48 0.23 47% 0,02 0,94Boat charter fee 0.01 0.01 91% (0) 0.03Fishing bait 1.75 0.22 12% 1.31 2.19Hunting license 0.15 0.08 55% (0) 0.31Ammunition 0.55 0.13 23% 0.30 0.80Equipment rental 0.30 0.13 42% 0.05 0.55Guide fees 0.11 0.09 83% (0) 0.29Spectator sports fee 0.11 0.07 66% (0) 0.26Tourist attraction fee 0.64 0.27 43% 0.09 1,19Other recreation fee 0.40 0.16 41% 0.07 0.73Film purchase 1.39 0.25 18% 0.88 1.90Film developing 0.84 0.18 22% 0.-8 1-20Souvenirs 1.92 0.56 29% 0.81 3.03Footwear 1.07 0.33 31% 0.41 1.73Men's clothing 1.11 0.34 30% 0.44 .178Women's clothing 1.92 0.44 23% 1.05 2.795 All other 1.58 0.44 28% 0.71 2.45
Total 72.47 5.99 8% 60.49 84.45
I Pct. Error: Standard error of the mean as a percentage of the mean. Twostandard errors yield a 95% confidence interval.
3UII
37I
I
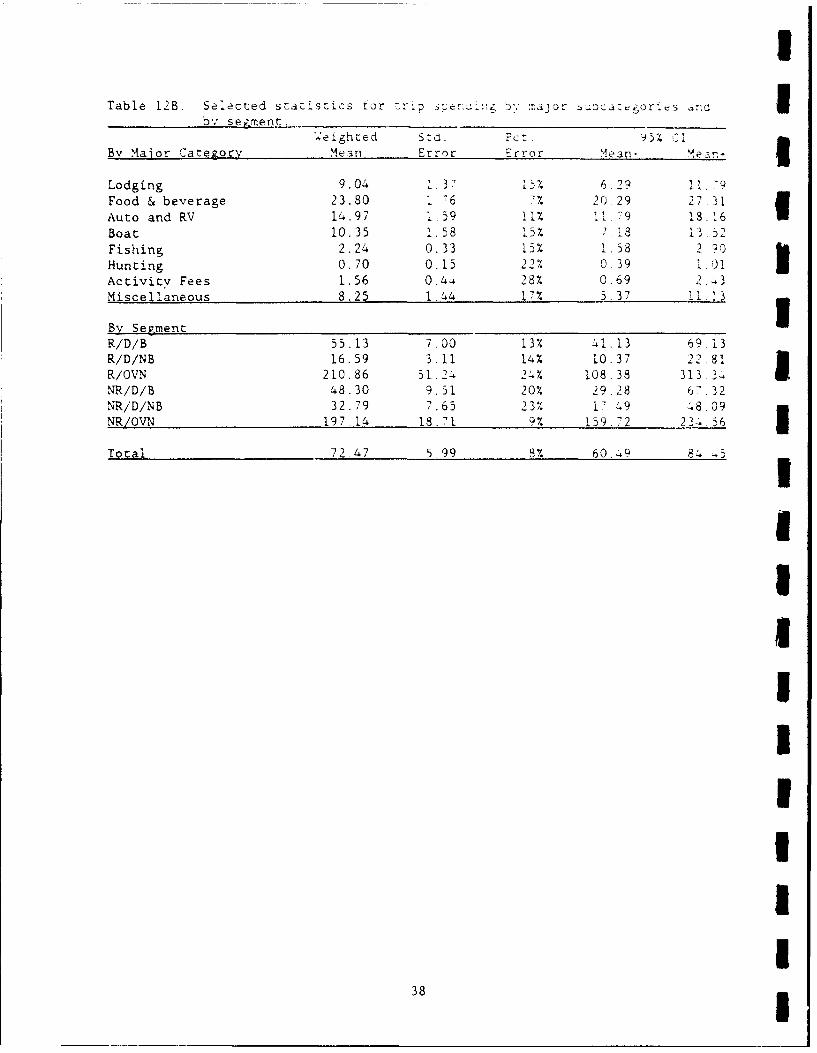
Table 12B. Selected statistics for trip &eciL2; b* ::.ajo. bca:egori~s :•by segment.
Weighted Std. Pct- , CI
By Maior Category Mean Error Error Mean- Meana
Lodging 9.04 1.37 15% 6.29 11.79
Food & beverage 23.80 1,76 7%y 20,29 27-31Auto and RV 14.97 1.59 !1% 11.79 18,16
Boat 10.35 1.58 15% Z.18 137A2
Fishing 2.24 0.33 15% 1.58 2 90
Hunting 0.70 0.15 22% 0.39 1.01Activity Fees 1.56 0.44 28% 0.69 2.31Miscellaneous 8.25 1.44 17% 5.37 ii '3
By Segment
L
R/D/B 55.13 7.00 13% 41.13 69.13R/D/NB 16.59 3.11 14% 10.37 22.81R/OVN 210.86 51.24 24% 108.38 313 .NR/D/B 48.30 9.51 20% 29.28 6-.32NR/D/NB 32.79 7.65 23% 1- 49 48,09NR/OVN 197.14 18.71 9% 159.72 234 56
Total 72.47 5.99 8% 60.49
IiIIIIIIII
3
hunting categor.' mean is 3 times rea han 7:i e errc i thae
food/beverage mean: 22% vs. 7%, respectiivel,.
The standard error for the estimate of total trip spendin. is plus or
minus 8 percent of the mean of $72.47 per trip :Table -A. The 95 percent
confidence interval for the mean is two standard errors on eit:her side of the
mean. Thus, the 95 percent confidence interval for the overall trip spending
estimate is between $60.49 and $84.45 per party per trip. Ihe standard errors
for trip spending estimates by segment range from 9 to 24 percent of the means
(Table 12B).
The standard error of the mean decreases as sample size increases. For
example, the highest percent errors for any of the 6 segments in Table 12B are
20%, 23%, and 24%. These percentages are associated with the segments with
the smallest sample sizes (nonresident, day use boaters; nonresident, day use
nonboaters; resident overnight visitors, respectively).
The standard error also reflects the dispersion of sample estimates
about the mean in repeated samples. In Table 12B, for example, the 28% error
for the average spending on activity fees results from a high variance in
activity fee expenses.IDurable Goods Spending
During the 1-year study period, 59% of visiting parties brought one or
more durable goods items with them on the sampled trip for use on the UMRS.
Fifty-three percent (53%) brought one or more major durable goods items
(Table 13, List 1) and 29% had brought one or more smaller durable items
(Table 13, List 2). The propensity to bring durable goods varied with user
3 segments, as expected. Ninety-four percent (94%) of day users who boated on
the UMRS brought a durable goods item, compared with 19% of day users who did
not boat. Sixty-two percent (62%) of overnight visitors brought a durable
goods item, with those boating or camping most likely to bring durable equip-
3 ment. UMRS residents were more likely than nonresidents to bring durable
goods, largely due to a higher incidence of boating among residents
* (Table 14).
Durable Goods Spending Per Trip. Within the past year, the average UMRS visi-
tor spent the equivalent of $56 per party per trip on durable items that were
used for recreation on the UMRS; $49 dollars per trip was spent for major
5 durable goods and $7 for smaller items. Of the $56 in durable spending. $28
39I
U
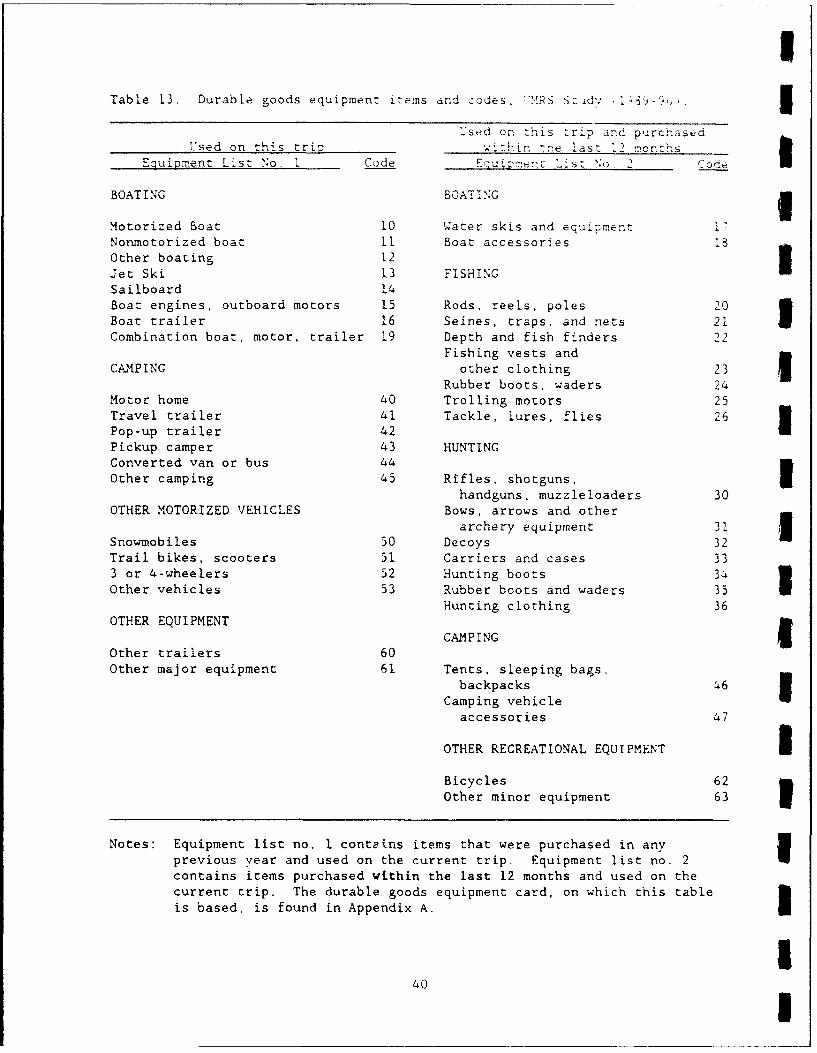
Table 13. Durable goods equipment items and codes, -,.RS Sztd , -
Used on this trip and purchasedUsed on this trip within the last 12 montths
Equipment List No. I Code Equi ment List zNo. 2 coe
BOATING BOATING gMotorized Boat 10 W'ater skis and equipment 17Nonmotorized boat 11 Boat accessories ISOther boating 12Jet Ski 13 FISHINGSailboard 14Boat engines, outboard motors 15 Rods, reels, poles 20Boat trailer 16 Seines, traps, and nets 21Combination boat, motor, trailer 19 Depth and fish finders 22
Fishing vests andCAMPING other clothing 23
Rubber boots, waders 24Motor home 40 Trolling motors 25Travel trailer 41 Tackle, lures, flies 26Pop-up trailer 42Pickup camper 43 HUNTINGConverted van or bus 44Other camping 45 Rifles, shotguns, U
handguns, muzzleloaders 30
OTHER MOTORIZED VEHICLES Bows, arrows and otherarchery equipment 31
Snowmobiles 50 Decoys 32Trail bikes, scooters 51 Carriers and cases 333 or 4-wheelers 52 Hunting boots 34Other vehicles 53 Rubber boots and waders 35 I
Hunting clothing 36OTHER EQUIPMENT
Other trailers 60
Other major equipment 61 Tents, sleeping bags.
backpacks 46Camping vehicle
accessories 47
OTHER RECREATIONAL EQUIPMENT UBicycles 62Other minor equipment 63
Notes: Equipment list no. I conteins items that were purchased in anyprevious year and used on the current trip. Equipment list no. 2contains items purchased within the last 12 months and used on thecurrent trip. The durable goods equipment card, on which this table
is based, is found in Appendix A.
040 I
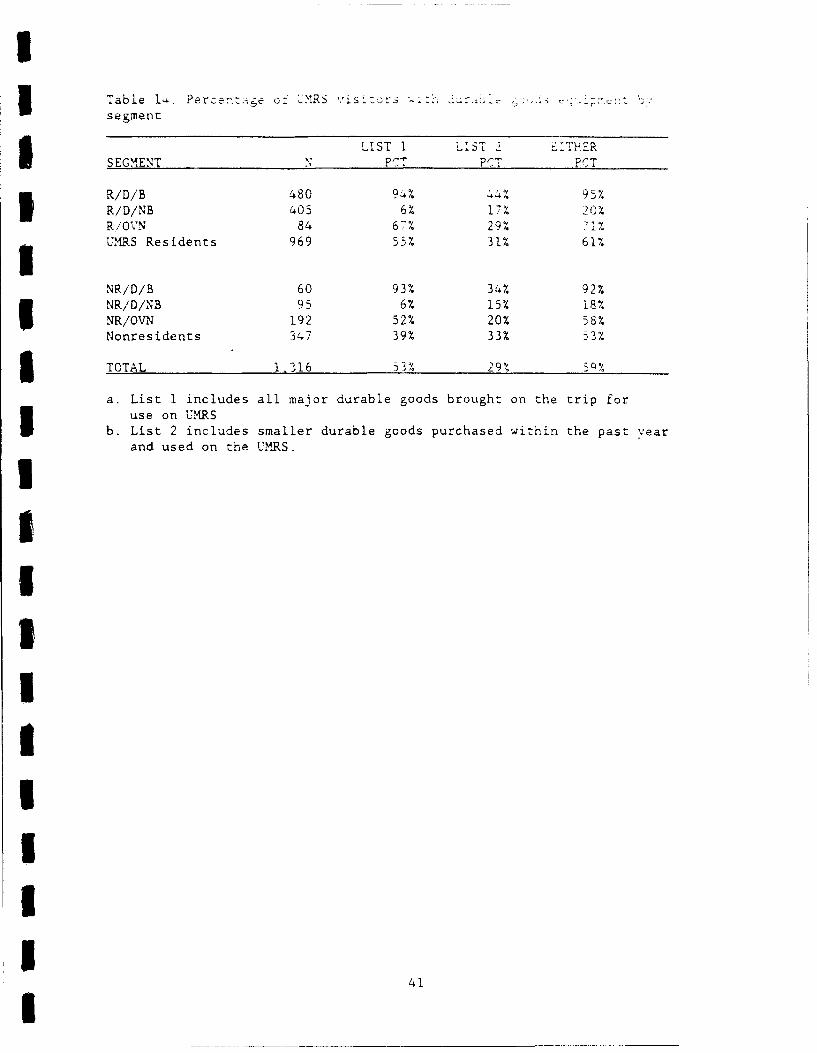
ITable 14. Percenrz:ge oisegment
LST EITHER
SEGMENT , PC Pc: PCT
R/D/B 480 9Qh 44% 95%R/D/NB 405 6% 17% 20ZR/OVN 84 67% 29% 71%UMRS Residents 969 55% 31% 61%
NR/D/B 60 93% 34% 92%NR/D/NB 95 6% 15% I8%NR/OVN 192 52% 20% 58%Nonresidents 347 39% 33% 53%
TOTAL 1,316 53% 29% 50%
a. List 1 includes all major durable goods brought on the trip foruse on UMRS
b. List 2 includes smaller durable goods purchased within the past yearand used on the UMRS.
IIIIII
II£
14
Iwas for boating equipment. $22 for 'r..... tS r
gear, and about $1 for everything else Tdble 15ý.
About half 46%) of all durable goods spending -oiiars spentJ took
place within the UMRS region. Of $26 dollars per trip spent within the UM.IS
region, $16 was spent on boating equipment, $5 on camping vehicles, about $4
for fishing gear, and less than $1 for other items. The tendency' of visitors Ito purchase durable goods within the UMRS varied across segments and durable
items. By major category of equipment, 79% of all spending on fishing gear
and 58% of spending on boating equipment was within the UMRS, while only 24%
of spending on camping equipment occurred within the region (Table 16). UMRS 5residents were more likely than nonresidents to buy durable goods within the
region. Sixty-eight percent (68%) of resident durable goods spending occurred 3within the UMRS as compared to 16% for nonresidents.
Durable Goods Spending by Segment. Durable goods spending, like trip spend- I
ing, varied considerably by visitor segment. Nonresidents spent $89 dollars
per trip on durable goods as compared to $44 for UMRS residents. Overnight
visitors spent the largest amounts on durable goods, primarily due to large
camping vehicle purchases. Boaters also reported significant durable goods 3purchases and account for the majority of all durable goods spending
(Table 15). 3The distribution of durable goods spending by visitor origin and where
the spending takes place is summarized in Table 17. UMRS residents accounted
for 58% of all durable goods spending. Just under half (46%) of all durable
goods spending occurred within the UMRS region. For regional economic impact
analysis the crucial spending is that of nonresidents within the UMRS. For
durable goods, nonresident spending within the UMRS was only 7% of the total,
or the equivalent of $4 per party-trip. i
Durable Goods Spending Estimates by Individual Items. The sample of 1,316
visitor parties reported 1,732 durable items or groups of items that were
brought with them for use on the UMRS. About 60% of the items reported were 3major durable gooas such as boats, engines, trailers, and recreational vehi-
cles (Table 13, List i), while 40% were fishing tackle, boating and camping
accessories and other smaller items (Table 13, List 2). For smaller durable
goods, only items purchased within the past year were recorded. About one
fourth of major durable items (List i) were bought within the past year, and 342
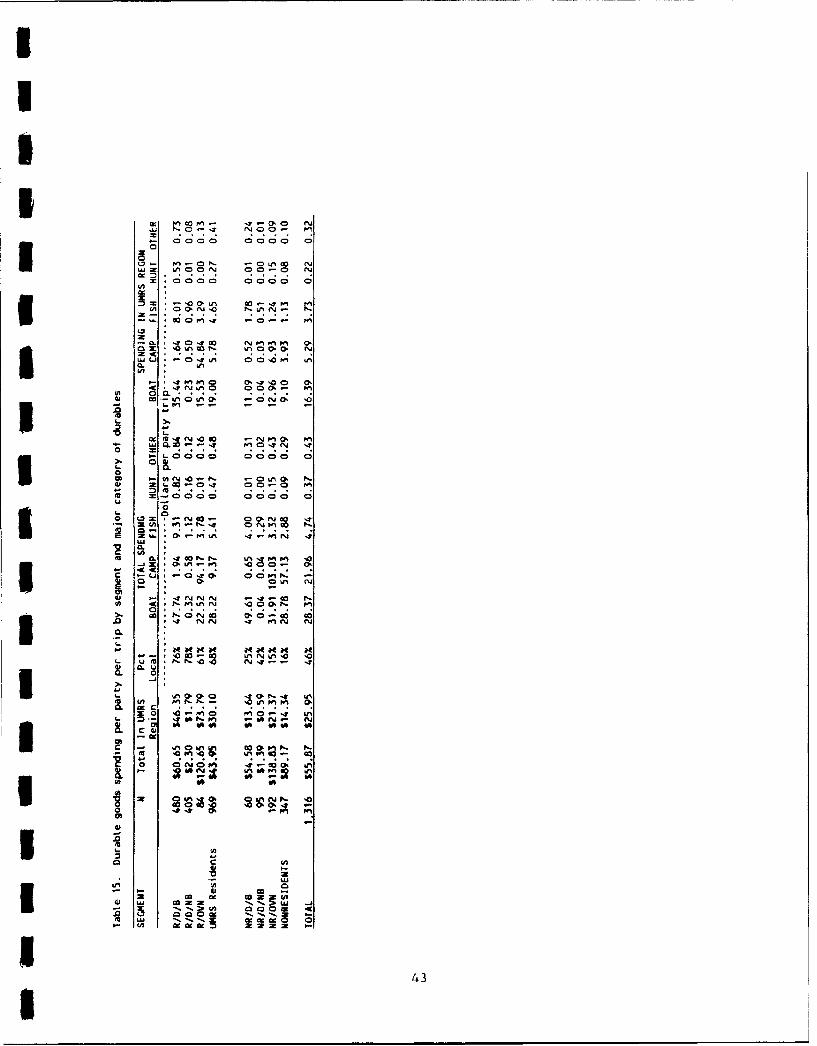
ccIS M ~0 N 0 000
C!O000 0 0
40 0 'r C
Lj U Cý ItOPU0. In
L'ul 00
4A cc n '0 - "' ' 0. ~
0~~ ~ Z- 0m0 0 0ý
r4~ 00 .40 r
::0.
4J .--tNN -4-
Ln(
0.UN0!'0In 0*0. r U
10 ý ;2
07, to.S 00
arN
U' c
00 ew An 4AS.-t U, Z z z
443co 0 o2 90

I
Table 16. Percent of durable goods expendit'res occurrin; wi th 'MRS-nregion by segment and type
Type of Durable EquipmentSEGMENT BOAT C.kMP FISH HUNT OTHER TOTAL
UMRS ResidentsR/D/B 74% NR 86% NR NR 76%R/D/NB 72% NR 86% NR NR 78%R/OVN 69% 58% 87% NR .'R 61%RESIDENT TOTAL 67% 62% 86% NR NR 68%
NonResidentsNR/D/B 22% NR 44% NR .NR 25%NR/D/NB 86% NR 39% NR NR 42%NR/OVN 41% 7% 37% NR NR 15%NONRESIDENT TOTAL 32% 7% 39% NR NR 16%
TOTAL 58% 24% 79% 59% 76% 46% INR - Estimate unreliable due to small samples.
4aIIII
III
44!

U
Table 17 Diszritbizion or JurabL• •oouj spI tu,:.c 2•o." deon
Percent stendinrz Spending :otalof hithin 'tsjde Durable
Tritps VM-RS !'MRS Spending
ISTEP 1: ------- Dollars per party per trip ----------
UMRS Resident 74% 30.10 13.85 43.95
Nonresident 26% 14.34 7483 89.17
Total 100% 25.95 29.93 55.87
STEP 2: ------- Durable spending per 1,000 trips ------
i UMRS Resident (740 trips) 22,277 10.247 32.524
NonResident (260 trips) 3,729 19,455 23,185i Total (1000 trips) 26,006 29.702 55,708
STEP 3:- ------- Percent of total durable spending -----
UMRS Resident 40% 18% 58%Nonresident 7% 35% 42%Total 46% 54% 100%
3 a. Entries in step 2 obtained by multiplying per trip figures in step I by
740 resident trips and 260 nonresident trips, respectively.b. Percentages in step 3 obtained by dividing step 2 figures by the total
($55,708).
II
iI
III
45I
U
one half were purchased within the past 6 .ears. Boats. engines and trailers 5account for the preponderance of major durable goods. Fishing equipment con-
stitutes the vast majority of smaller durable goods reported. 3Spending reported by UMRS visitors on individual durable items is sun'ma-
rized in Table 18. The "Subgroup Percentages" in column 8 of this table were Iused to generate the detailed durable goods spending profiles in Tables 19A
and 19B. Using all durable goods purchased within the past 6 years, we esti-
mated the percentage of spending on each major category to be allocated to Iindividual items within that category. For example, 58% of spending on fish-
ing gear is allocated to "rods and reels" and 68% of camping expenses is allo- 3cated to "motorhomes." The subgroup percentages are calculated by multiplying
the number of items purchased in the last 6 years by the average cost per item £and then dividing each individual category by the subgroup total. The final
column of Table 18 illustrates how these percentages are used to allocate
subgroup spending totals to individual items. For example, the $28.37 spent
on boating equipment is distributed to the 10 kinds of boating items using the
subgroup percentages. IThe percentages for the full sample are used to develop the detailed
profiles for both totals and individual segments. This avoids some of the 5problems associated with small sample sizes for some segments and individual
durable items. The procedure allows the totals for subgroups of durable items
(boating, camping, fishing, etc.) to vary across segments, while generating
estimates for individual categories without excessive distortions that could
be caused by small samples for particular segments and a few large expenses
for individual durable items. The resulting detailed spending profiles for
the six segments are reported in Table 19. Table 19A reports all durable goods
spending and Table 19B reports durable goods spending within the UMRS.
Corresponding tables for the original 12 segments are included in Appen-
dix C (Tables C-4, C-5, C-6 and C-7). but caution is urged in using results
for segments with less than 50 cases. These detailed durable goods spending 1profiles can be bridged directly to IMPLAN sectors in the same way as the trip
spending profiles. 3
Variations by Re2ion. Direct estimates from the sample of durable goods Ispending at regional levels were deemed unreliable due to the usual small
sample and high variance problems. We therefore used two indirect methods to
estimate durable goods spending by region. The first approach estimates
46 I

I5 Table 18. Spending On nuraDte gocos ny type, .MRS .,'t:rs
ALL ITEMS ITEMS P.RCHASED 1N .AS' 6 YEARSCATEGORY N $S per N St per Total COs PCt Of Pct of S$ per
Iitem !tem $otaý Snr-p ;arty-rtp
Motor boat 175 277.53 69 465.37 32.1 7.3% 14.0% 3.;8Non-Motor 24 190.38 10 83.75 0.8 0.2% 0..% 0.10Other boats 4 5.61 4 5.61 0.0 0.0% 0.0% 0.00Jet ski 5 1,000.99 5 1,000.99 5.0 1.1% 2.2% 0.62Sailboard 1 0.00 0 0.00 0.0 0.0% 0.0% 0.00Boat engines 139 63.44 79 75.97 6.0 1.4% 2.6% 0.74
Boat trailer 146 49.23 88 36.14 3.2 0.7% 1.4% 0.39Waterski 72 15.89 72 15.89 6.9 1.6% 3.0% 0.85Boat
accessories 97 11.75 96 11.86 6.8 1.6% 3.0% 3.85Boat/engine/
trailercomb. 431 599.55 202 830.68 167.8 38.2% 73.4% 20.82
BOAT TOTAL 1,094 306.09 625 365.84 228.6 52.1% 100% 28.37
Rods & reeLs 280 12.67 277 12.75 21.2 4.8% 58.4% 2.77Nets, traps 33 11.13 33 11.13 2.2 0.5% 6.1% 0.29Depth finders 61 13.41 60 13.63 4.9 1.1¶% 13.5% 0.64Fishing
clothing 61 3.72 61 3.72 1.4 0.3% 3.8% 0.18Boots &
waders 52 3.25 52 3.25 1.0 0.2% 2.8% 0.13Trotting
motors 49 18.97 49 18.97 5.6 1.3% 15.4% 0.73FISH TOTAL 536 11.30 532 68.16 36.3 8.3% 100% 4.74
Rifles 8 51.49 8 51.49 2.5 0.6% 86.6% 0.32Decoys 2 1.03 2 1.03 0.0 0.0% 0.4% 0.00Carriers 1 0.20 1 0.20 0.0 0.0% 0.0% 0.00Hunting boots 4 1.03 4 1.03 0.0 0.0% 0.9% 0.00Rubber boots 2 0.59 2 0.59 0.0 0.0% 0.2% 0.00Hunting
clothing 8 6.99 8 6.99 0.3 0.1% 11.8% 0.04HUNT TOTAL 25 19.02 25 114.10 2.9 0.6% 100% 0.37
Motor home 13 10,851.72 10 11,457.23 114.6 26.1% 68.0% 14.93Travel
trailer 25 2,213.79 13 3,008.38 39.1 8.9% 23.2% 5.10Pop-uptrailer 3 559.66 1 1,166.67 1.2 9.3% 0.7% 0.15
S~Pickupcamper 3 566.67 1 0.00 0.0 0.0% 0.0% 0.00
Van/buJsconversion 3 5,227.27 2 6,590.91 13.2 3.0% 7.8% 1.72
Ot. r camp 2 156.46 0 0.00 0.0 0.0.% 0.0% 0.00Tents 6 19.00 5 17.08 0.5 0.1% 0.3% 0.07CAMP TOTAL 55 3,925.54 32 5,266.95 168.5 38.4% 100% 21.96
Other trailer 5 11.02 3 15.52 0.0 0.0% 1.6% 0.01Other equip 4 12.69 4 12.69 0.1 0.0% 1.7% 0.01Bikes 5 35.29 3 23.85 0.4 0.1% 14.8% 0.06Other 8 49.52 8 49.52 2.4 0.5% 81.9% 0.35OTHER TOTAL 22 30.84 18 161.32 2.9 1.7"% 100% 0.43
ALL ITEMS TOTAL 1,732 322.16 1,232 318.53 439.2 100.0% 55.87
a. All expense variables expressed on a per trip basis.
b. List 2 items multiplied by six to obtain 6-year total.
II
47I

U
Table 19A. Duraote goods spending by iegment and categcry ,$ per oarzy-tr~p) -ALL SPE40;NG
SEGMENTS UMRS Non-
CATEGORY R/D/B R/D/NB RES/OVN NR/D/B NR/D/NS NR/CVN Resident Residents TOTAL IMotor boat 6.70 0.05 3.16 6.97 0.01 4.48 3.96 4.04 3.98
Nornmotorized boat 0.17 0.00 0.08 0.18 0.00 0.12 0D10 0.11 0.10 IOther boats 0.00 0.00 0.00 0.00 0.00 0.00 0.00 0.00 0.00
Jet ski 1.05 0.01 0.49 1.09 0.00 0.70 0.62 0.63 0.62
SaiLboard 0.00 0.00 0.00 0.00 0.00 0.00 0.00 0.00 0.00
Boat engines 1.25 0.01 0.59 1.30 0.00 0.84 0.74 0.76 0.74
Boat trailer 0.66 0.00 0.31 0.69 0.?0 0.44 0.39 0.40 0.39
Waterski 1.43 0.01 0.68 1.49 0. 0.96 0.85 0.86 0.85
Boat accessories 1.43 0.01 0.67 1.48 0.00 0.95 0.84 0.86 0.85
Boat/engine/traiter c 35.04 0.24 16.52 36.41 0.03 23.42 20.71 21.12 20.82
Rods & reels 5.44 0.66 2.21 2.34 0.76 1.94 3.16 1.68 2.77
Nets, traps 0.57 0.07 0.23 0.24 0.08 0.20 0.33 0.18 0.29
Depth finders 1.26 0.15 0.51 0.54 0.18 0.45 0.73 0.39 0.64
Fishing clothing 0.35 0.04 0.14 0.15 0.05 0.12 0.20 0.11 0.18
Boots & waders 0.26 0.03 0.11 0.11 0.04 0.09 0.15 0.08 0.13
Trotting motors 1.43 0.17 0.58 0.62 0.20 0.51 0.83 0.44 0.73
Rifles 0.71 0.14 0.01 0.01 0.00 0.13 0.41 0.07 0.32
Decoys 0.00 0.00 0.00 0.00 0.00 0.00 0.00 0.00 0.00
Carriers and cases 0.00 0.00 0.00 0.00 0.00 0.00 0.00 0.00 0.00
Hunting boots 0.01 0.00 0.00 0.00 0.00 0.00 0.00 0.00 0.00
Rubber boots 0.00 0.00 0.00 0.00 0.00 0.00 0.00 0.00 0.00
Hunting cLothing 0.10 0.02 0.00 0.00 0.00 0.02 0.06 0.01 0.04
Motor home 1.32 0.39 64.02 0.44 0.02 70.04 6.37 38.84 14.93
Travel trailer 0.45 0.13 21.85 0.15 0.01 23.91 2.17 13.26 5.10
Pop-up trailer 0.01 0.00 0.65 0.00 0.00 0.71 0.06 0.40 0.15
Pickup camper 0.00 0.00 0.00 0.00 0.00 0.00 0.00 0.00 0.00
Van/bus conversion 0.15 0.05 7.37 0.05 0.00 8.06 0.73 4.47 1.72
Other camp 0.00 0.00 0.00 0.00 0.00 0.00 0.00 0.00 0.00
Tents 0.01 0.00 0.29 0.00 0.00 0.31 0.03 0.17 0.07
Other trailer 0.01 0.00 0.00 0.00 0.00 0.01 0.01 0.00 0.01I
Other equip 0.01 0.00 0.00 0.01 0.00 0.01 0.01 0.01 0.01
Bikes 0.12 0.02 0.02 0.05 0.00 0.06 0.07 0.04 0.06
Other 0.69 0.10 0.13 0.25 0.01 0.35 0.39 0.24 0.35 I
CATEGORY TOTALS
BOAT 47.74 0.32 22.52 49.61 0.04 31.91 28.22 28.78 28.37
FISH 9.31 1.12 3.78 4.00 1.29 3.32 5.41 2.88 4.74
HUNT 0.82 0.16 0.01 0.01 0.00 0.15 0.47 0.09 0.37
CAMP 1.94 0.58 94.17 0.65 0.04 103.03 9.37 57.13 21.96
OTHER 0.84 0.12 0.16 0.31 0.02 0.43 0.48 0.29 0.43
TOTAL 60.65 2.30 120.65 54.58 1.39 138.83 43.95 89.17 55.87
4I
48 I

i
3 Table 198. Durable goods spending by segment and category (S per party-trp) within ,MRS Region
SEGMENTS jMRS MGM-
CATEGORY R/D/B R/D/NB RES/OVN NRý'DI NR/OiNB NRIOVN Resident Resic its TOTAL
Motor boat 4.98 0.03 2.18 1.56 0.01 32 2.67 1.28 2.30
Non-Motorized boat 0.13 0.00 0.06 0.04 0.00 0.05 0.07 0.03 0.06
Other boats 0.00 0.00 0.00 0.00 0.00 0.00 0.00 0.00 0.00
Jet ski 0.78 0.01 0.34 0.24 0.00 0.28 0.42 0.20 0.36
Sailboard 0.00 0.00 0.00 0.00 0.00 0.00 0.00 0.00 0.00
Boat engines 0.93 0.01 0.41 0.29 0.00 0.34 0.50 0.24 0.43
Boat trailer 0.49 0.00 0.22 0.15 0.00 0.18 0.26 0.13 0.23Waterski 1.06 0.01 0.47 0.33 0.00 0.39 0.57 0.27 0.49
Boat accessories 1.06 0.01 0.46 0.33 0.00 0.39 0.57 0.27 0.49
Boat/engine/trailer c 26.01 0.17 11.40 8.14 0.03 9.51 13.94 6.68 12.00Rods & reels 4.68 0.56 1.92 1.04 0.30 0.73 2.72 0.66 2.14
Nets, traps 0.49 0.06 0.20 0.11 0.03 0.08 0.28 0.07 0.22
Depth finders 1.08 0.13 0.45 0.24 0.07 0,17 0.63 0.15 0.50
Fishing clothing 0.30 0.04 0.12 0.07 0.02 0.05 0.18 0.04 0.14
"Boots & waders 0.22 0.03 0.09 0.05 0.01 0.03 0.13 0.03 0.10
Trolling motors 1.23 0.15 0.51 0.27 0.08 0.19 0.72 0.17 0.56
RifLes 0.46 0.01 0.00 0.00 0.00 0.13 0.23 0.07 0.19
Decoys 0.00 0.00 0.00 0.00 0.00 0.00 0.00 0.00 0.00
Carriers and cases 0.00 0.00 0.00 0.00 0.00 0.00 0.00 0.00 0.00Hunting boots 0.00 0.00 0.00 0.00 0.00 0.00 0.00 0.00 0.00Rubber boots 0.00 0.00 0.00 0.00 0.00 0.00 0.00 0.00 0.00
Hunting clothing 0.06 0.00 0.00 0.00 0.00 0.02 0.03 0.01 u.OaMotor home 1.12 0.34 37.28 0.35 0.02 4.71 3.93 2.67 3.48
Travel trailer 0.38 0.12 12.72 0.12 0.01 1.61 1.34 0.91 1.19
Pop-up trailer 0.01 0.00 0.38 0.00 0.00 0.05 0.04 0.03 0.04
Pickup camper 0.00 0.00 0.00 0.00 0.00 0.00 0.00 0.00 0.00
I Van/bus conversion 0.13 0.04 4.29 C.04 0.00 0.54 0.45 0.31 0.40
Other camp 0.00 0.00 0.00 0.00 0.00 0.00 0.00 0.00 0.00
Tents 0.00 0.00 0.17 0.00 0.00 0.02 0.0- 0.01 0.02
Other trailer 0.01 0.00 0.00 0.00 0.00 0.00 0.01 0.00 0.01Other equip 0.01 0.00 0.00 0.00 0.00 0.00 0.01 0.00 0.01
Bikes 0.11 0.01 0.02 0.04 0.00 0.01 0.06 0.01 0.05
Other 0.60 0.07 0.10 0.20 0.01 0.08 0.33 0.08 0.26
CATEGORY TOTALS
BOAT 35.44 0.23 15.53 11.09 0.04 12.96 19.00 9.10 16.36FISH 8.01 0.96 3.29 1.78 0.51 1.24 4.65 1.13 3.67HUNT 0.53 0.01 0.00 0.01 0.00 0.15 0.27 0.08 0.21
CAMP 1.64 0.50 54.84 0.52 0.03 6.93 5.78 3.93 5.11
OTHER 0.73 0.08 0.13 0.24 0.01 0.09 0.41 0.10 0.32
TOTAL 46.35 1.79 73.79 13.64 0.59 21.37 30.13 14.34 25.67
I
II
U
durable expenses by region using interview site locations, while the second 5uses county FIPS codes where durable purchases were made.
Estimates based on interview site locations were derived by applying the
durable goods spending profiles for the six visitor segments (Table 15) to the
distributions of visitors for each of the five regions (Table 6). This proce-
dure assumes that spending profiles for particular segments do not vary by
region and that the shares of visitors by segment for each region in the sam- Ipie are representative of the population of visitors In each region. Results
are given in Table 20 for both total durable goods spending and spending
within the UMRS. The latter should be a reasonable approximation of durable 3goods spending within the smaller regions.
Reflecting the differences in segment shares across regions, visitors to 5the St. Paul region have the highest durable goods spending per party per
trip. Regional differences in spending within the UMRS (bottom of table) are
not significant, with the exception of sightseers who spend less on durable
goods within the region than other user groups. Sightseers were more likely
to have purchased camping vehicles than boating equipment or fishing gear, and Icamping vehicles tended to be bought near their home.
In the second approach, we directly estimated durable goods spending 5within each UMRS subregion based on where the durable items were purchased.
The county of purchase for each item provided by the subjects in the on-site 5interview was used to identify where durable goods were bought. Of all durable
goods expenses accruing to the UMRS region, 19% were in the St. Paul region,
29% in Rock Island, 33% in the St. Louis region and 19% in the Illinois River
region. Comparing these results with Table 20 (the "Within the UMRS Region"
estimates are the appropriate figures to compare with), we conclude that there
is no strong evidence of significant differences among these four regions in
patterns of durable goods spending. We therefore recommend applying the UMRS- 5wide estimates of durable goods spending per party-trip by segment (Table 15)
to generate regional estimates, as we have done in Table 20. ,
Sampling Errors. Sampling errors for estimates of durable expenses are 3slightly larger than for trip spending in spite of somewhat larger sample
sizes (the 1,316 on-site sample is used to estimate durable goods spendi-g,
compared with the sample of 683 mailback responses to estimate trip spending).
The larger errors in durable goods sFending are due to greater variance in the
350

I
Table 20, Durable goods spenrding es: aes K':' ,party- trip)
Durable Goods Spendi.rng liS gor'REG iON BOAT F iS H 'P "T"E .. -*T,
------- SPENDING .'-T, [, OR LTSI RS-------------
St. Paul 33.58 5.35 0.37 26.i 0.-.9 76 21Rock Island 19.80 3.94 0.32 15i. 0.35 3,4 ý5St. Louis 29.61 5.90 0.51 9.02 0.53 ,5.57Illinois River 29.13 5.81 0.50 7,03 0.52 .2.97
Sightseers 19.32 3,42 0.25 33.44 0.32 ;6.76
-------------- SPENEING WITHIN THE UMRS REGION -------
St. Paul 19.47 4.02 0.24 8.12 0.35 32.20Rock Island 12.75 3.17 0.16 5.66 0.27 22.02St. Louis 20.99 4.94 0.30 3.06 0.44 29. 73Illinois River 20.46 4.84 0.30 2.50 0.43 28.53Sightseers 11.05 2.39 0,14 5.06 0.20 18.84
Note: Regional estimates derived by applying regional segmentshares (Table 6) to the durable goods spending profiles bysegment (Table 15).
5IUIIIIIII
51I

costs of durable items. As a percentai Qt :nE uear.. S-nda;rn errors >,•
durable goods are about 13" for totals, ...ca.i totals, -rid boai:r:g i:ems .... ?
21). Errors are larger for individual segments and other subcategories of
durable goods. Only resident day user-boater segment and fishing items are
near the 13% level of sampling error, Errors for ocher segments and catego-
ries of equipment exceed 25%. The estimates for camping equipment are
particularly troublesome as large campinlg vehicles account for about 40% of Idurable goods expenses, but are subject to 32% sampling errors. The sampling
scheme did not obtain a sufficient number of campers to accurately portray the
amount spent on camping equipment. Campers are a small proportion of UMRS 3visitors, but spend large amounts on durable goods. Camping equipment is,
however, often used at many sites and less directly associated with the UHRS 3than boating equipment. The estimates for boating are much more accurate.
LIMITATIONS I
Three limitations deserve some discussion: (i) limitations due to sample Usizes, (2) questions about representativeness of the sample with respect to
segment shares, and (3) problems in attributing durable goods purchases to
opportunities along the UM-RS.
Sample Size. While the overall sample size of 1,316 on-site interviews and
683 mailback questionnaires are adequate to estimate the spending of an aver-
age visitor to the UMRS, there are constraints to generating accurate esti-
mates for some subgroups of visitors. The original set of 18 segments were
aggregated into six segments for which reasonably reliable spending profiles
can be reported. In doing so, however, campers and other overnight visitor
segments had to be combined. This limits the estimation of the impacts of 5actions that will primarily affect smaller subgroups of visitors, such as
campers. 3Unlike the previous study of 12 reservoirs, sampling plans were aimed
at obtaining a representative sample of users, versus quotas of visitors 3within predefined categories (segments). Reflecting the population distribu-
tions, the sample therefore contains large numbers of day users and local
visitors, and correspondingly small numbers of less frequent visitors. Esti-
mates are therefore most reliable for the most frequently encountered user
groups. Nonresident and overnight user segments are represented by 352 I
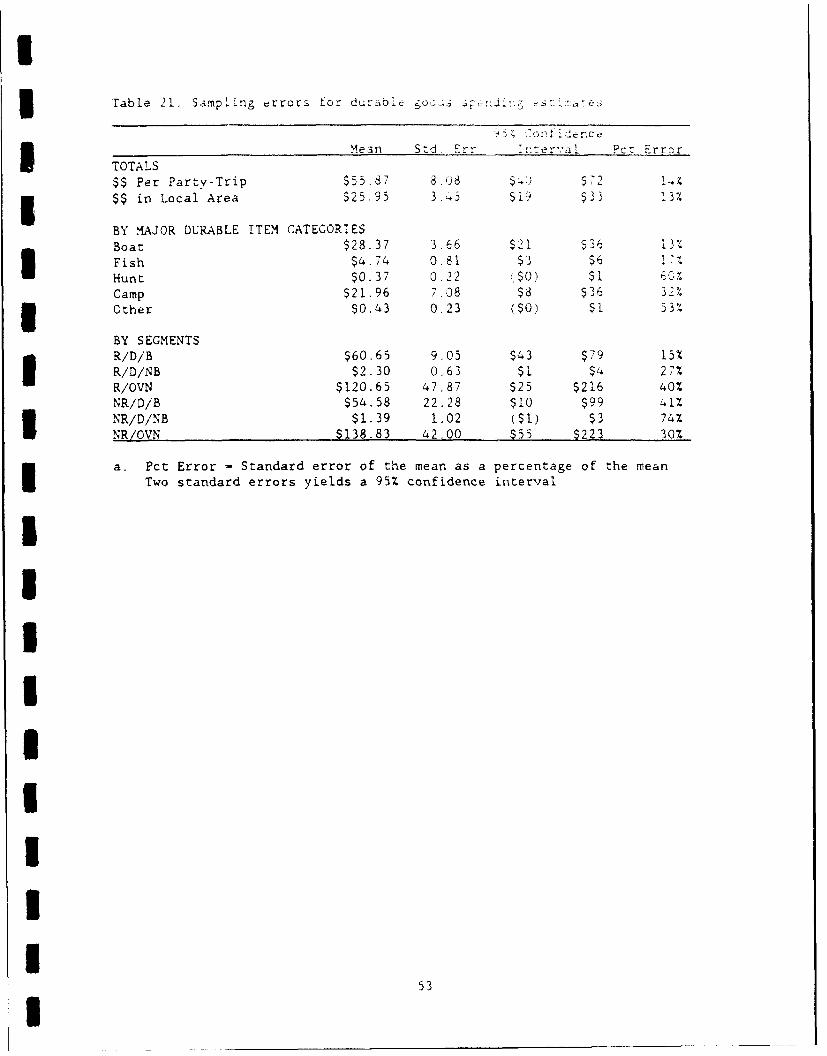
I3 Table 21, Sampling errors for durable
T Mean S d Err Thner'.'a ? ErrorI TOTALS$$ Per Party-Trip $55.87 8.08 $723 $$ in Local Area $25.95 3 ,3 $il $33 1 3%
BY .MAJOR DURABLE ITEM CATEGORIES
Boat $28.37 3.66 $21 $36 13%
Fish $4.74 0.81 $3 $6
Hunt $0.37 0.22 l$0) $1
Camp $21.96 7.08 $8 $36 32%3 Other $0.43 0.23 ($0) $1 53%
BY SEGMENTSR/D/B $60.65 9.05 $43 $79 15%R/D/NB $2.30 0.63 $1 $4 27%
R/OVN $120.65 47.87 $25 $216 40%
NR/D/B $54.58 22.28 $10 $99 41%
NR/D/NB $1.39 1.02 ($1) $3 74%
NR/OVN $138.83 42.00 $55 $223 30%
a. Pct Error - Standard error of the mean as a percentage of the meanTwo standard errors yields a 95% confidence interval
I
III
II
I53U
U
considerably smaller samples. This liaits the app'i-.tions f the s~udv for
estimating impacts of actions that ycild largely.ý affecz ýhese smaller sub-
groups. Some of these groups may be small in numbers, but have significant
impacts on particular areas or economic sectors. The data also contain small
samples of off-season visitors, such as hunters and ice anglers.
Segment Shares. An advantage of the sampling scheme is that the sample Isegment shares provide estimates of the distribution of segments in the popu-
lation of all UM!RS visitors. However, the estimates of segment shares are
subject to sampling errors and potential biases in the sampling plan. The 3sample was stratified by region, time, and a rough measure of use (high or
low). Distinct visitor segments will be differentially attracted to sites 3based more on site characteristics than these stratification variable-. For
example, boaters will be found at sites with boat launch facilities or 3marinas, campers at sites near at least once indicates broad site coverage,
but the representativeness of the sample of visitors (as contrasted with
sites) will also depend on the degree to which sample sizes at particular
types of sites and times are proportionate to total use.
Although the sample generated in this study will be used to estimate
use of the UMRS, reliable estimates of use or segment shares cannot be made at
a site or sub-regional level. Segment shares will be more prone to errors at i
the subregional level than at the aggregate level. Therefore, for applica-
tions to smaller geographic regions, independent estimates will be required.
As some of the differences in segment shares across the four subregions
(reported in Tables 5 and 6) are hard to explain, we urge that local and
regional sources of information be used to validate or modify estimates of
segment shares, whenever possible.
Durable Goods Spending Allocations. Durable goods spending impacts are
reported as "associated with" the UMRS. 1e have intentionally avoided ad hoc 3procedures for assigning some portion of durable goods spending to the UMRS.
In assessing the regional economic impacts of the UMRS in terms of durable 3goods purchases, the question is whether the item would have been purchased
given a specific change in the quality or quantity of recreation opportunities
on the UMRS. The answer to this question will vary across subjects, regions, Itypes of equipment, and exactly what alternative is being evaluated. It is
unrealistic to assume that visitors can determine their durable goods spending i
54 I

U
3 behavior under the all-or-none alternazit.- of
nities in the entire UMRS (Appendix A. Question T The durable goods
spending effects of marginal changes in UMRS recreation opportunities will
generally be small, but will depend on the availability of substitutes which
will vary from region to region.
As the purpose of this study was to generate spending profiles that
could be applied to a variety of decisions across a range of sites, no single
question or set of questions could determine what share of durable purchases
could be validly assigned to management decisions on the UMRS. Even a simple
Sallocation of durable goods expenses based upon where the equipment was used
would require that visitors be capable of estimating the proportions of use of
each durable item at different sites. In light of the questions about
reliability of such reports, as well as concerns about complicating the survey
instrument, we did not attempt any such allocations.
Related considerations are involved in estimating trip spending impacts.
What management actions will lead to the gain or loss of recreation trips and
* associated spending in an area? Only thirty percent of visitors indicated
they would not have taken the recreation trip if "no sites were available for
3 recreation along the UMRS." Thirty-seven percent (37%) would have taken a
trip to the area and visited non-river sites, 18% would have taken a trip
outside the UMRS, and 15% would visit both the UMRS and outside areas. Thus.
about half of the trips (and probably a slightly higher proportion of all
spending) would be lost to the region if UMRS recreation opportunities did not
exist. Responses to hypothetical questions, however, provide at best a rough
estimate of how people would actually respond to changes in the quality or
3 quantity of recreation opportunities along the UMRS.
Further research on how the supply of recreation opportunities affects
3 demand for recreation trips and durable goods is needed to better assess the
impacts of recreation policy and management alternatives. This is one of
3 several important linkages between demand and economic impact assessment.
* DISCUSSION
In addition to the findings discussed above, the contract for this study
required an assessment of several issues. These issues are discussed in the
order in which they appear in the proposal and SOW for this study.
I55I

I1. What is the most precise unit of measure? 3
The contract for this study required the authors' recommendation as to 3the most precise unit of measure. The most common choices include: dollars
per party per trip, dollars per person per trip, dollars per party per day,
and dollars per person per day.
Precision refers to the relative ability to make fine distinctions
between attributes of a variable (Babbie 1986). For example, describing some- 3one as being "six feet three inches tall" is more precise that saying "around
si'- feet." The desirability and necessity of precision depends on the purpose 3of the study. Precision and accuracy should not be confused. Saying that a
person is "six feet three inches" is precise but inaccurate if, in fact, the 3person is "six feet ten inches" tall.
The decision to measure spending in dollars per party trip had less to
do with precision and more to do with the measurement, sampling, and analyti-
cal considerations that affect the reliability and validity of our estimates.
The UMRS sampling procedures use the party trip as the unit of analysis. IConsistent with this sampling unit, trip spending was also measured on a party
trip basis and durable goods spending was converted to this basis by dividing 5the costs of durable goods by the number of trips to the UMRS within the past
year. The desire to estimate all expenses associated with trips to the UMRS 3argues for a trip-based estimate and the combination on-site, mail-back proce-
dure that was employed in this study. This procedure measures all spending
from when the party leaves home until they return home. UEstimating expenses on a per person basis can reduce variance associ-
ated with different party sizes for expenses on food and souvenirs that will Imore likely vary with party size. However, it adds variation for expenses
like gasoline and durable goods that do not depend much on the size of the
party. We do not recommend attempting to measure spending on a per person
basis, as too many expenses associated with trips are shared by the traveling 3party. Another complication in per person estimates is how to account for
children. For all of these reasons, we feel the party is preferred as the i
unit for measuring and reporting spending.
There are also some expenses that are better explained on a per day or
per night basis. For example, lodging and food expenses will vary systemati- ically with length of stay. However, other items like transportation costs and
durable purchases depend less on length of stay than on trip distance and 356 I

U
activities. There are a number of problems .n n sp~ndi..ata that
have been gathered on a per night basis Ae.g., Peire and Renfro YAM5). First.
surveys that request spending only in the past 24 hours encounter telescoping
problems and errors of omission, including those associated with credit card
purchases or expenses paid before or at the end of the trip. Other errors can
be caused by complications associated with a possible need to weight the sam-
ple based on length of stay or to adjust for "days vs. nights" (i.e. overnight
visitors incur only 3 nights lodging for a 4 day stay). Again, for reasons
related to a combination of measurement, sampling and analysis considerations,
* we find the trip preferred to the day or night as the temporal unit for
reporting and analyzing spending data in most situations.
As spending applies best to the party-trip, we recommend converting
units of use to party trips as needed, rather than vice versa, if use is
measured in person days, this entails multiplying use by a party size estimate
and a length of trip estimate. These conversions should be carried out for
individual segments, when party size and length of stay data permit.I2. What is sufficient sample size for segments?I
The minimum sample size required to estimate spending by segment depends
on the amount of sampling error one can tolerate. Taking into account the
likelihood of a variety of potential nonsampling errors (e.g., measurement
errors, sensitivity of measures to outliers, nonresponse) and the expected
accuracy of use estimates which will be multiplied by spending, we believe
that sampling errors of below 20% are reasonable. Sampling errors for total
3 trip and durable goods spending are 8% and 14%, respectively.
By segment, three of the six segments are below the 20% error threshold
3 for trip spending and one out of six for durable goods spending. For trip
spending (Table 12B), the three segments that equal or exceed the 20% error
3 guideline contain sample sizes of less than 100 parties. Thus, for trip
spending, a reasonable sampling goal in future studies is 100 to 120 parties
per segment. For durable goods spending (Table 21), the only segment below
the 20% error level (resident, day use boaters) has a sample size of
480 parties. The next lowest percent error (27%) is associated with a segment3 containing 405 parties. It appears that future studies interested in report-
ing durable goods spending by segment would need to consider a goal of 420 to
450 parties per segment or tolerate errors larger than 20%. Note, however,
57U

I
that this contract called for durable goods spendinz to be reported primarily 3on an aggregate basis, not segment by segment. Thus. the 14% error associated
with the full sample is well within the 210% guideline and implies that future 3studies where aggregate estimates of durable goods spending are required will
need to consider a sampling goal of at least 1000 parties.
3. How much regional variation exists in spending and segments?
While some regional variations in spending can be observed in the sample
(Tables 10 and 20), these differences generally are not statistically signifi- -cant. Much of the difference can be attributable to differences in segment
shares. The degree of representativeness in the regional samples of the seg- -ment distributions is uncertain. As only a small portion of sites could be
sampled in each region, and these were not stratified by variables related to
our segments, there is a good chance that variations in segment shares across
regions are random or the result of sampling bias. While trip spending esti-
mates are adjusted for nonresponse bias, the adjustment procedures assume the Isegment shares estimated in the on-site portion of the study are accurate. We
urge that applications make use of independent estimates of segment shares for
regions below the full UMRS level. Although there is no strong evidence for
major differences in either trip or durable spending across broad subregions
of the UMRS, there will be variations for smaller regions due to types of
available sites and the levels of local economic development. 34. How well did the study capture the most significant segments and categories
of spending?
The study design has captured the most significant segments and catego- 3ries of spending. The low proportion of campers in the sample is more a
reflection of the true nature of the study area (relatively few campgrounds) 3rather than some integral design flaw. The segments with the largest sample
sizes are consistent with the use of the UMRS and the overall study design.
For day users, residents of the UMRS outnumber nonresidents by more than five
to one. Among overnight visitors, nonresidents were more than twice as numer-
ous as residents.
Some segments have higher variances (and hence higher standard errors)
than others and may require further disaggregation in future studies. For 158 I
I
3 example, the resident, da'; use boater segment his nore than :'ce the saifpme
size than the nonresident, overnight segment (n=239 vs n-l1O, respectively?.
3 but a somewhat larger percent error (13% vs 9%, respectivelv;). For durable
goods, reasonably reliable estimates for the most significant boating segments
were obtained. The greatest weakness in durable goods spending estimates is
for camping equipment. The sample is very thin for overnight visitors in
general and in particular for campers. As large camping vehicles are very
expensive, a small number of campers can contribute a large amount of total
durable goods spending. More so than boating, however, camping equipment is
usually not bought locally, and is likely used on trips to a variety of sites
other than the UMRS.
5. What is the sum of trip and durable goods estimates by IMPIAN sector and
3 region of expenditures?
One may combine overall trip spending ($72 per trip) and durable goods
spending ($56 per trip) to obtain a total per trip spending of $128 per party
per trip. Similarly, one may combine the local portions of these expenses.
5 However, for most analysis we urge that durable and trip spending be handled
separately. The two classes of goods must generally be treated differently,
3 as durable goods tend to be purchased near home and used at many sites, while
most of the trip expenses occur at the destination and can be more directly
associated with a particular site. The pattern of errors in durable and trip
spending estimates are also different. When an estimate with considerable
error is combined with a more precise estimate, precision is lost. Most appli-
cations would suggest a focus on either durable goods or trip spending sepa-
rately, rather than combined.IAPPLICATIONS OF RESULTS
There are many ways in which the results of this study may be applied.
Before discussing those related to spending and economic impacts, we note that
there are numerous analyses of the survey data set that could be carried out
to support a variety of management and planning issues not related to economic
impacts. For example, survey data include origin-destination information and
descriptions of UMRS visitors and their trips to UMRS sites. These data can
559I
I
be used in addressing many planning and marketing questions that So bey.'ond the
scope of this report.
The visitor spending analyses have been directed at estimating economic
impacts of recreational use of the UM'RS. These analyses have been further
focused by the objective of developing final demand vectors that can be used
with MICRO-IMPLAN software. In addition to a range of impact analyses that
can be carried out using IMPLAN, the spending profile data can also be used by
themselves. To derive estimates of total spending, the trip and durable
spending profiles can be multiplied by estimates of party trips: (1) either in
total or by segment, or (2) for the entire UMRS region, 5 subregions, or (with
some adjustments) to individual states, communities or sites. These calcula-
tions can be readily carried out on spreadsheets to estimate shares of 3spending by sector or segment. Regional or local multipliers can be applied
to these spending totals to derive rough estimates of indirect and induced 3effects. Impact estimates can also be converted to income and employment
effects using appropriate sales to income and sales to employment ratios.
These procedures would be appropriate for users who may not have ready access
to IMPLAN or who may only want quick, aggregate estimates of impacts. Each of
the IMPLAN applications discussed below has a corresponding application that 3relies on published multipliers or ratios rather than direct use of an input-
output model. 3
General IMPLAN Procedures
As to applications that would directly involve IMPLAN or a similar
input-output model, the general procedures are: I(1) Select a suitable spending profile from the tables.
(2) In some cases make adjustments to the profile.
(3) Obtain an estimate of visits to the area. Convert the visitation Iestimate to party-trips by applying appropriate party size and length of stay
estimates. 3(4) Estimate the proportion of party visits within the six defined
segments. Multiply these proportions by the total visits to estimate the 3number of party visits by segment.
(5) Multiply party visits for each segment by the appropriate segment
spending profile and sum across segments to estimate total final demand.
(6) Bridge final demand vector to the 528 IMPLAN sectors.
60
(7) Estimate an input-output model for 7he desigrated region using
MICRO-IMPLAN and run the IMPLAŽ "Impact Analysis" on the resulting final3- demand vector. If interested in impacts by segment, runs can be made for
individual segments.
Software has been developed in Lotus 1-2-3 version 2.0 to help estimate
U, segment shares (steps 1-4) and to carry out steps 5 and 6 (Stvnes and Propst
1992). It should be noted, that while the survey data vields estimates of
3 segment shares for the UMRS region in total, local data will be needed to
estimate segment shares for particular sites or counties and to vai.idate seg-
ment shares at the regional level. A manual is under development to explain
the entire process including a specialized interface with IMPLAN for these
data (Stynes and Propst 1992). Specific economic impact applications using
the results presented in this report are also contained in this manual.
I SUGGESTIONS FOR FURTHER RESEARCH
3 The UMRS study provides a rich database for further analysis. Addi-
tional opportunities are presented by combining the UMRS data with data from
3 other studies. The consistency in format for measuring spending within desig-
nated segments in the National Study, UMRS study, and other studies permits
the combining of these data to (1) increase sample sizes (and thus accuracy of
spending estimates) for segments and durable items that are not well repre-
sented, in the UMRS sample, e.g. overnight visitors and camping equipment; and
(2) to test the generalizability of spending profiles over space and time.
The latter is particularly important for applying the results of this study at
I a local level.
Somewhat different kinds of analysis are required to focus on local3 impacts, as contrasted with impacts for the entire UMRS region. At the local
level, the primary concern should be trip spending, not durable goods.
3 Resident segments must be defined based upon within 30 miles rather than
within the UMRS and more attention should be given to origin-destination pat-
terns of visitors. We recommend four interrelated areas for further study.
1. Developing models to predict variations in trip spending based upon visi-
tor segment variables, site factors, and characteristics of the local economy.
We have begun the task of recording all locational designators in the UMRS
survey data files to facilitate spatial modeling. We have also assembled
61I
I
selected economic data for all counties within the ."TRS region. Tnce trhese 3data are matched with site designators on the sur%;ey data files, we will be
able to estimate trip spending models. Matching will entail a closer examina- 3tion of local economic regions along the UMRS. In particular, locations of
survey sites relative to population centers and bridges spanning these rivers
must be evaluated. Bridge locations will dictate when local regions may
extend to both sides of the river.
2. Developing guidelines for extending the local region beyond 30 miles. The
proportion of trip spending that occurred outside 30 miles of the site but
within the UHRS is not directly available in the survey data. Previous
experience indicates that visitors can or will not be able to report spending
within more than two regions. Simply defining the appropriate regions for
subjects at many different sites is too complex. Instead of attempting to
directly measure spending for local regions of differing sizes, we recommend
developing adjustment factors that can be applied to our estimates to expand
the region of interest. The task involves shifting some portion of the spend- Iing outside 30 miles to the "local spending" category. The portion will
depend on how much larger a radius than 30 miles is chosen for the local 3region. Further analysis of origins of visitors is useful here, '.:_h to
estimate segment shares for modified definitions of "local resident" and to 5estimate the adjustment factors to be applied to the spending profiles.
3. Identifying origin-destination patterns of UMRS visitors. Origin- i
destination analysis is needed to estimate demand for sites along the UMRS and
to estimate the shares of visitors by resident and nonresident segments.
Origin-destination studies would also help in identifying appropriate sub-
regions within the UMRS and interregional flows of dollars between these i
regions. I4. Comparing I-0 models for various counties and subregions in the UI.MRS.
Applications of the spending profiles will involve estimation of input-output
models for the UMRS and various subregions thereof. Comparisons of the
regional economic structures of counties along the UMRS are recommended to Iprovide further guidance for generalizing estimates of impacts from one area
to another.
I62 I

Further research on durable goods sperding and )cs impacts are also
recommended. Household surveys offer some advantages over On-site surveys for
gathering data on durable goods. Durable goods purchases are often not trip
or site specific. Spending on durable goods often cannot be attributed to a
particular site. For impact analysis, the appropriate question is whether or
not the item would have been purchased if the given site or sites were not
available or were altered in quantity or quality. Camping vehicles in partic-
ular are purchased for a variety of purposes and are used at mar'," sJi.c, as
well as at home. These purchases can seldom be attributed to the presence of
a particular site or even set of sites. Boating equipment is more susceptible
to impact analyses, although boats too can be used at many si.es. Studies to
correlate boat sales within designated regions with boating opportunities
could provide more direct evidence of the impacts of supply on demand. His-
torical studies or trend analyses in areas where boating opportunities have
Schanged over time may shed further light on this matter. More complete pat-
terns of where boats of various size and type are used could also be helpful
"3 in attributing boat purchases to particular management decisions.
I
U
II
I
I63
U

I
LITERATURE CITED - PART ONE 3Babbie, E. (1986). fhe practice of social research. Belmont, CA: Wadsworth
(4th Ed.). IDillman, D. A. (1978). Mail and telephone surveys: The total design method.
New York: John Wiley.
Peine, J. D. and J. R. Renfro. (1985). Visitor Use Patterns at Creat SmokyMountains National Park. National Park Service Research/Resources Man-agement Report SER-90. Atlanta, CA: National Park Service Southeast IRegion.
Propst, D. B. and Stynes, D. J. (1989). Methods, questionnaires, and statis-tical analysis procedures: UM!LS study. (Addendum to interim report to UU.S. Army Engineer Waterways Experiment Station, 28pp.). East Lansing,MI: Michigan State University, Department of Park and RecreationResources. 3
Propst, D. B., Stynes, D. J., Lee, J. H. and Jackson, R. S. (1992). Develop-ment of spending profiles for recreation visitors to Corps of Engineersprojects. (Technical Report R-92-4, 112 pp.). Vicksburg, MS: U.S. Army
Engineer, Waterways Experiment Station.
Stynes, D. J. and Win-Jing Chung. (1986). Resistant measures of recreationand travel spending. Paper presented at the National Recreation and IParks Association Leisure Research Symposium. Anaheim, CA.
Stynes, D. J. and Propst, D. B. (1992). Users' Manual for MI-REC: Micro-
Implan Recreation Economic Impact Estimation System. East Lansing, MI: IMichigan State University, Department of Park and Recreation Resources,
Tyrrell, T. J. (1985). Data considerations in assessing economic impacts of
recreation and tourism. Pages 40-46 in D. B. Propst, compiler. Assess- Iing the economic impacts of recreation and tourism: Conference andworkshop. Asheville, NC: US Forest Service, Southeastern Forest Exper-
iment Station.
U.S. Army Corps of Engineers. (1988). Recreation use estimation procedures.Vicksburg, MS: USAE Waterways, Experiment Station, Resource Analysis
Group (Environmental Lab).
U.S. Army Corps of Engineers. (1989a). Statement of Work: Upper MississippiRiver Basin Recreation-Use Survey. St. Paul, MN: St. Paul District,
Corps of Engineers.
U.S. Army Corps of Engineers. (1989b). Sampling plan for the study of theeconomic impacts of recreation in the UMRS. (Final report). Vicksburg,
MS: 'JSAE Waterways, Experiment Station, Resource Analysis Group (Envi- Ironmental Lab) and East Lansing, MI: Michigan State University, Depart-ment of Park & Recreation Resources.
II
64 I

I
I,
IIIII3 APPENDIX A
IIIIII
i 65

IIIU
III
This page intentionally left blank. 3IIIIIIIII
66I

D. E.
I FILE IPPER MISSISSIPPI RIVER STUDYRECREATION EXPENDITURE SURVEY
On-site Portion OMB# 0702- 0016
I Site NameDate.IStratum: _ __AM / PM / ALL. DAY
River BL lCX IKA1IL/IMS WEEKDAY / WEEKENDMM DD YYI River mile: FALL / WINTER / SPRING I SUMMER
ICode. a now rwmber for .vety form, beginning wfth 001 for each 8ft, and date. 1D num•rber
Hello. My name is and I am workng for PECO Enterpxtss under government corsc.We wre interviewing visitors to MWn act about thei recreational use W~ong 1200 miles of the Upper
I Mislisslppi River System and how their eenmdiltures In this wasa ffect the region's economy.
1. What was your Primary p for visiting this recreation site today? Record below.
(vehicle 1) (vehicle 2) (vehicle 3)
If NON-RECREATION, say: That Is all of the Information ta I need,thank you for stopping. End intervew;, record as a non-rec vehicle. 123
If RECREATION, continue. ot2a
2. Will you be returning to t ite todW
N IYES, say: That Is al of thwe Vormaton tht I need, tak you for [77stopping. End kinterviw reo as a ruur"kg vehicle. 123 total
It NO, cortinus. totanSreaturning
May I talk with you about your trip? Your awers we very important as they will help usU understand current recreation use of the river system and make decisions about Its future use. Thequestions that I hav, to ask will take adout 10 minute. of your tme. AM of your answers will be keptIn confidence and you will not be Identified In the results. You may ask any questions at any timeduring the Interview.
IN YES, corftiue7If NO, tally a is al and dthan person for their time 123 totalI llpersonagreestothetiranulew, recor timle - am. / p.m. and cortius.
Keep ti of the number of exling vehicle. pased during the Interview.
3 67
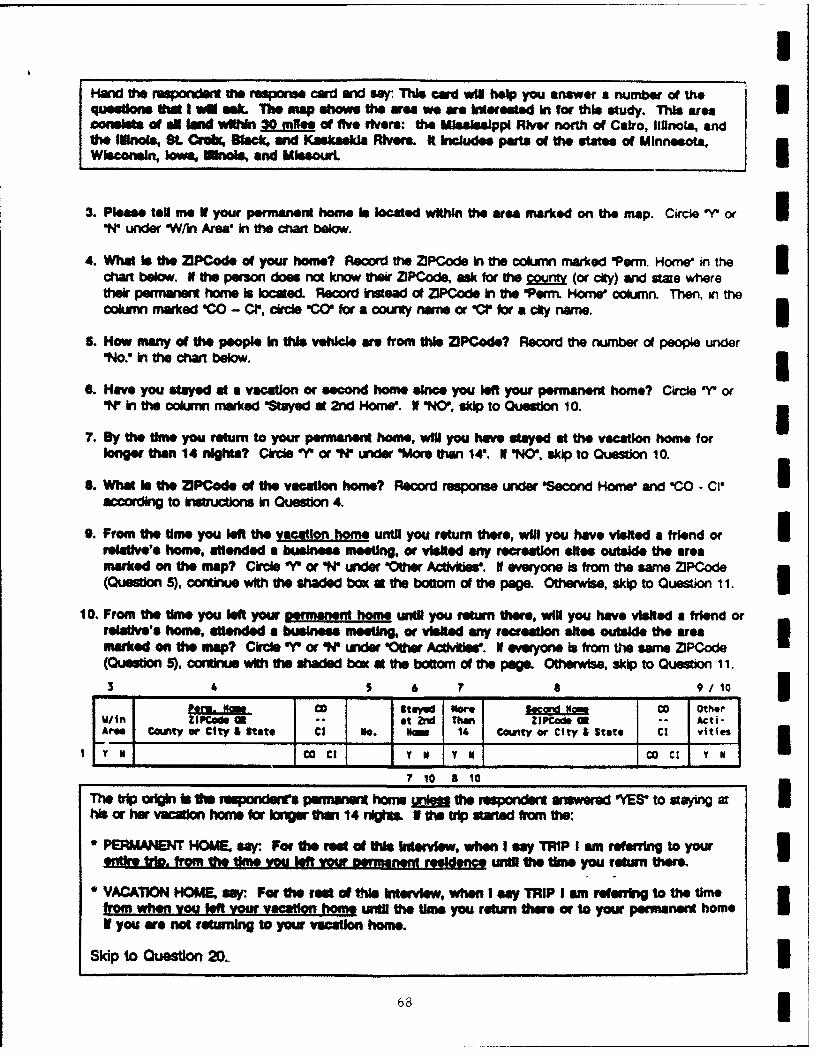
Hadthe respondert the response card aid say: This card wil htwo you answer a number of thequestions owa I vm sasi The map shwse the area we we bkerssts in for this study. This aweoconsistse CC &N land wihin 3C miles of five rivers: the Mississippi River north of Calo, Illinois, anthe lUnols, 9L Cek~ Waecic and Kaskaskia Rivers. it ncludes parts of the stte of Minnesota.
Wisconsin, lowe, Mgncie, and Missouri.
3. Please teog me 9 your permanent home Is located within the area marked on Ohe map. Circie 'Y orWN under OW/in Areas in the chart below.
4. What Is the MWCode of your home? Record the ZJPCode in the column marked oPorrn. Homes in thechart below. it the person does not know thei ZIPCode, ask for the cont (or city) and saxe wheretheir pemwuner lome is locaed. Record insead of ZIP~ode In the 'Perm Homne' colwnn. Then, in thsecolumn marked 'CO - Ce. circle 'OW for a courty nawme or *C' for a city name.
S. How ma"y of the people In this vehicle awe from this ZPCode? Record the mnuber dA people under"No.8 In the chart below.
6. Have you stayd at a vacation or second home since you left your permanent home? Circle 'Y' or-N' In the column marked 'Stayed at 2nd Horns'. IN 'NO'. skip to Question 10.1
7. By the time you return: to your pernmanet home, will you have stayed at the vacation home forlonger than 14 nights? Circle -Ysn or 'N' under 'More than 14'. Nf 'O', skip to Question 10.
S.What Is the ZICode df the vacation home? Record response under 'Second Homes and 'CO - Ci'according to instructions In Question 4.
9. From the time you Mef the vocation homes until you return there, will you have visitd a friend orIrelativet's home, attendd a business meeting, or visited any recreation sites outside the areamarked an the map? Circle "v' or 'N' under 'Other AcIMAes. If everyone is from the same ZiPCode(Question 5). coflnuei with the shaded boxc at the bottomn of the page. Otherwise, skip to Question 11. I
10. From the time you left your permanent home untill you return thee, will you have visited a friend orrelative's home, attended a busliness moeetn, or visite any recreation site* outaide the waremarked on the map? Circle Or or 1W' uider 'Other Actiites. If everyone is from the same ZlPCode(Question 5), continu with the shadled box at the bottom, o the page. Otherwise, skip to Question 11.3 4 5 6 7 a 91/10 3
Co Stav~d more Scn mc teWin ~ OS -.t at bid Than Z IPCod. OR Acti-
¶ Arm, CoutyorCity & Sate CI No jNow 14 Cont or Cf ty & tt itI oC1YN TNCO C1 Y N
The trip origin in ft respndetfs perrnwwt horns -*- the respondent answered -YEW* to staying athis or her vacatio home fo bWg tha 14 nlgfts I the tri stated from the:
* PERLWAENT HOWE say: For thw res of this literview, when I say TRIP I am Wrefrrin to your3entire trip, from Ithe time You left vowimnerwanet residec until 1he tme you return there
* VACATION HOME. say: For the resd of "Mte Interview, wten I esy TRIP I am reerring to the ftimfrom When you lef your vacation home unti the tim you return thee at to yawt permanent homeIf you we not returning to your vacation home.
Skip to Questio 20,
683

1 ~11 whiat oiMe Cod~e do people In thi vehtcle com, from? Rlecard answers in the Chant belowv
E Ask Quesions 12 -18 of somneon rom tw2A ZIPCocie.
I ~12. Please refe to tie map nd teN me I your permanent home isloat$ed wtthln the area marked onthe map. Circle 'Y' or 'W under 'Win Area in the chart below.
I ~13. How nmany of the people In Othi vehicle are, fkm thie ZIPCdoe? Record the numiber of people in thechart below.
E ~14. Have you "tayd at a vacation or second home sinc you left your permanert home? Cvcle Or' orWN in fte colurnn fmarked 'Stayed at 2nd Home'. If 'NO'. ski to Quesion 18.
1 L By tie tOme you return to your permanent home,- wIN you have stayed at the vacAtIon home forI longer t#%an 14 nlghts? Circle 'r or WN undler 'More than 14'. I 'NO', skip to Question 18.
16I. What Is the MPCode of the vacaton home? Record reponse uder 'Second Home' and 'C0 - CI'accodingto instructions in Question 4.
17. From the time you MR thYwl oe until you return #wer, will you have viitd a friend orrelatives home, attende a business meeting, or vialed any recreation Msite outsid tie areamarked on the map? Circle 'Y' or 'N' under 'Other Ac&Mee. C~ontinue with Question 12 If there areother ZiP~odes, or Question 19 N &inwishd
I ~I&. From the time you leM your permanent hoeuntil you return thiere, will you have visited a friend orrelative's home, attended a business wmeetng, or visited any recreation site* outside the areamarked on the mnap? Circle or' or WN under 'Othe Actwities. Continue with Question 12 V thee areother ZIPC~odea or Question 19 1 finished.12 11 13 14 Is 16 17 /18
Pem 0~3. CO StWaWe bberd C CO OtherZIP~dsU - at~ TanZIPC~de G - Acti
1Arv Coun~ty or City, & State C1 NO. NOW 14 Coun~ty or Cf ty, & State C1 vities
2 Txca C1 Y U Y 9 CO C1 T a
3 co C1 Y U T I -CO CI* Y 9U19. Ask ad viskta,% incaluddin fromi u ZIPCode #1: Who has Iraved the ahofteedistance to reac h Vthi reocrechon sit? Askc that person: What ZICode did you I1!2/3come from? Crcl fte mnmber masoclaWe with that ZIPde nearest ZIP
U-The trip origin Is to iw O ff ~ t iiM osots sa Qeto
In that came fthei rghI f or her vacation ftme.I ~ ~Refe to One perao whoms hom, was selected as the trip origin and If the trip staited fro a:
*PEF*AANENT HOME, .y For the roes of this knteview, when I say TRI P I -am referring to3 h~~Is Gm kmet w!e you leit your ggrmhIngfflJ unti he time you return thee.
*VACATiON HOME, *ay: For tie rest of Othi ktervlew, when I say TRIP I am referring tothe Ume trom when you lef Ithe ym a until tie time you return ther or to yourpermanent home 9 you we not returning to your vacation home.
* 69

20. Have you epest or do you plan to spend an nights away from your YI/N(pennanet / vacaton) homew vwtul on this trip? Cki rcl or ON" nights &way
Nf YES, cortinue.If NO, goto Question 35,page 6.
OVERNIGHT VISITORS ONLY
21. How many night* have you spent away from homne so far on Othi tri?Wf 0 skip to Question 24. [ 1 nights J
22. How many of these nights have you spent within 30 miles of Vhiss*Ne? Nf equal to the number nig"w away from horns (Question 21), skipSpnto Questiont 24. LIJ 3
23. Please refer to the map that I gave, you. Excluding the _ nightsthat you have spsot wthn 30 mies at Vhile oft, how many nights spenhave ywou pert within Vie ame marked on the map? jJWtIn
24. How many additional nights do you plan to spend away from home?IN V0 skip to Question 21. ad~
25. How many of thee nights will be within 30 m~les of Vhile site? INequal to the numnber of additional nihts away from home, (Question 24), ~ ~ adskip to Question 27.
wn3 -26. Please refer to Vie map again. Excluding the _ nights OWa you
plan to Spend within 30 miles, of ftle asi, how mnyM additional nights r~- dldo you plan to spend within the wee marked on the map? L within
27. Folow-Wq: 0
a. Sum rew$apas Quatons 21 8id 24 - =0 rigWU Rew~d t0taan fsite*rl Urns as Wo hav defined it. y Wu w have
spent -MWayfo home? fJor
b. &uM seponewss' Oueens 22 OW 25 - rd"~w wlthu 30 miles ofIthissaft. PAcd otal. Vg Wm than4Wask: Of these, atotal of
- nights wg be opset witin 30 mNte of Thi site? ~J w/ n3 o 4-M. Sum loopcress to Quesations 23 and 28 - Wahs opert wEiti ares
marked an m=W beyond 30 mdlss of thie ske. Rlecord to tal greater toulithan V0 asic A tota of - inights wil be spent within the area witiuwitid on the map &nW beyond 30 miles of this els?U
The surn of If ad ge hoijd r41 exceed Or'. 9 it does, cluckr rasponses
to Questons 21 -29 with the visior.
70
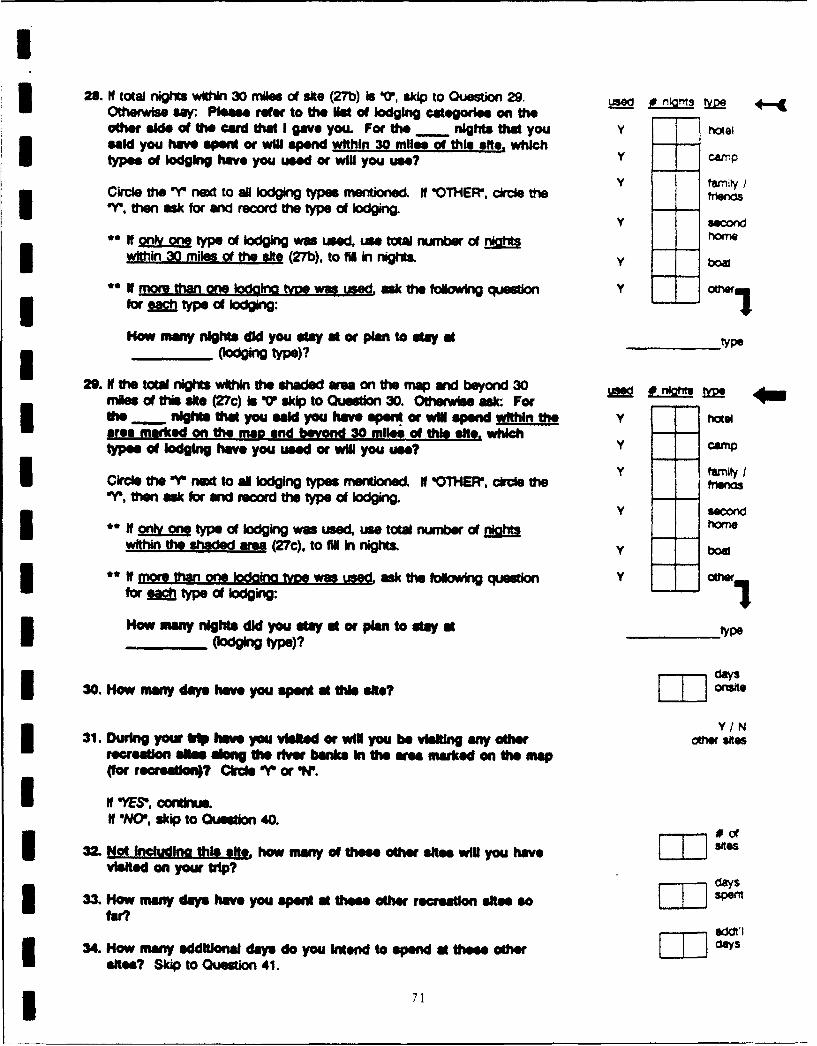
326. if total nig wh i n30 m~ies;ofslMe (27b) is , skip to Question 29. La 0 n~msN-Othewise say: Please refer to the Ilis of lodging categoriso on the -
othe sie of the card that I gave you. For the nights tha you Y"9said you have spe.V or will spend wlthin 30 miles of this *Its, which YCmtypes of Woging have you used or wil you use?
Y tami?y ICircle the or nect to all lodgn types mentioned. If O0THER, circle thefred-r, then ask for and record the type of Iodgng. YsoIfol ootp oflognwausdustoa xbrdý=he
within 30 miles of the site (27b), to fill in nights. Y b
*It more than one Wodhia type wa sed vsk the following question Y VWfor eac type of loidging.
HNow nde dynig tsddyouWyator planto stay at_ _ _ _
______(o ging type)?
29. Nf the total night within the shaided are on the map and beyond 30 ___frltt pmniles o this site (27c) is V0 skip to Question 30. Otheriwse ask: For ' ~ r5the nights;ta you sadyou have spent or il spend within the oofree marked on the map and beyond 30 miles of this site, which YCm
tesof "odIng have, you used or will you use?
I ~Ckrcl the -r' nod to a&I lodging type mentioned. V -OTHER-, circle fth MenasOr, henaskfor arnd rectrd type of lodging.
V second3 *0If onl typ of lodging was used, use total nurnber of DIgMl~ homewithin the habaed are (27c). to fill in nights. Y ba
N* ~More thin 2ne boalftYh e wa Al ed ask the following question Y "1rfor 20type of Woging:I
How many nighte didyou stay ator plan to day at -___ type___lodging type)?
do"SI30. How aman days have you spot~ at this s*No? LU oEn't
31. During your WV hove you visited or will you be vsitng any other 00We sitesrecreation sime doing the river banks In the area marked on the mapPfr roared"on? Cicle Or' or WN.
I'NO', skip to Qeto 0
132. Not Including hs # how mn fU eohrso C o ae$eVisited on you tri?
3W3. Hotw many days have yvou peW at these other recreationfstes soLJ
.U3. How many additional days do you Intend to spend at thes teo cli ays* sites? Skip to Question 41.
* 71

* II
DAY USERS ONLY
35. How many hours have you spent at this ste today? LonII36. During your trip today have you visited or will you be vislting my YIN I
other recreason ses along the river banks In he am marked on the 0Wwasmap (fpor recreation)? Circle O'r or W.m
If W", continue.It "NO, s.p to Question 4Q.
37. Not Including s osit, how many of these other ites will you havevisted on your trip?
3-. How many hom have you spet M, r t thee other recreation I-M I411es?
3.How many additional hours dlo You Intendl to spend at thes cothrw] u
sMe today Ski to Qestion 41.
ALL RESPONDENTS
40. Please refer to the M•t of actities on tw card tot I gave you and tell me how many of the peopleIn this vehicle pariipated in each of Utee recreation actvltes while at this qfte. Recond the 3number d patctptng in each aMty. When fnse skip to Ouestmon 42.
41. Ple"e refer to the fla of activities on the card that I gave you and tell me how many of the peopleIn this veh• e partIcipte or plan to participate in each of thes recreation activities while on thistrio. Include all recreation sis Oth you have visd or plan to vislt and that wre located along thebanks of the river In the shaded area Recor the mx~o fpeolepticipating in each sa~ity.3
BOATING FALL I *7NTER ACTM77ES
Total Lusing boat Big game Irin ***
PlMe boafing Sel GA m lhwunfing * b •d w= umsd.. • brete oesee wSt
W uW W•W1 hwtng .6" .ude,.
FRW"i bum botSrovwxxbling
NON-BO0QATIMQkeN&
Crouna-co y skingC,,ringFishing from shore- cc sbeig, socialuing, sm.
Swimming Record type of acviy:
PicnickngHiking / w9fllng / bicycling
An kIdvuI swpM be r eýymrd - soghwoi- D I ~I he or she is rut pm~pftipng &V -dwr ac"t.I
72

U42. The card VWe myou has twol MWofeoqulpmentonftIL Plesaslook at YINEquipmen UMt Number I and tell me 9 anyone In your vehicle owns any of thee, equip #1Rtome and has used It or Witl use It on this trio within the area marked on themap. Circle *N' or 'N. It thee is no equnipet, go to Ouestion 4.
43. For each piece of equipment tha has been used or will be used, please giveI ~me the number Neted beside IL. I also need to know the following:
a. approximnate coat,b. whetheir the Rem was Purchased no or Used and If used, from a1 ~dealer or riot, -
d. te year# hequpnntwsprhsdI e. For boats, I need to know tihe type of boat power type, and length In foeet
Reord the ruponsas In dhe chart below, placn each kern on a sepware Hne.U When finilhe condmiue with Quseeton 4.
4.Please look at Equipment Ulet Number 2. This Ume I am on" hiterled in Y NequipmneiN that was pugcho some time fudna fth Rs 12 moe"' Please teo equip 9-2U me Itanyorn In your vehkf ows a"y of Viese Rome and has used R or will use
is no 9Wreupmet go to QueSton 46.
45. Please give me Vie leote Dete beside each category of equipment tha has5 been Used or wil be used. I aleo need to know the following for each cmgor:
a. Vhie number of Rtems used hIn the area marked on the map,b. the approxmate coa for all Rem in thet cateory,c. whethe moat of the eMa hIn the category were Purchased new or used and
N used, from a dealer or not, andd. #we county and eate where mo" df the Rom In the categoiry were purchased.
Record the responses in the chart below, using a Wwsept lins for each equipmentcategoy. Vf equipent was puchsdW from a catalog, write the cattalog nami undlerTCotyi. When finished contr iuewth Question 46&
Et~f NOMW / Yea WATS ONLYrwt ss ed-esateI COmxvt) ui ST C~WWYT rI Line or Of Used-No Seal. CAor 0 Is $0at Power Length
0 totter Items cost (41rcet onm) City old ST city Onty Type Type (feet)
*2 _ _ _ I_ _ _ _ _ _ _O _ _
3 0 toifUn c CJ
4N / If USD co C1
5 0 I/WD U10c C6 N D If D /Lnco ICI
a 0t / we UN cc C1
10 N / If /M lBco /C1
73
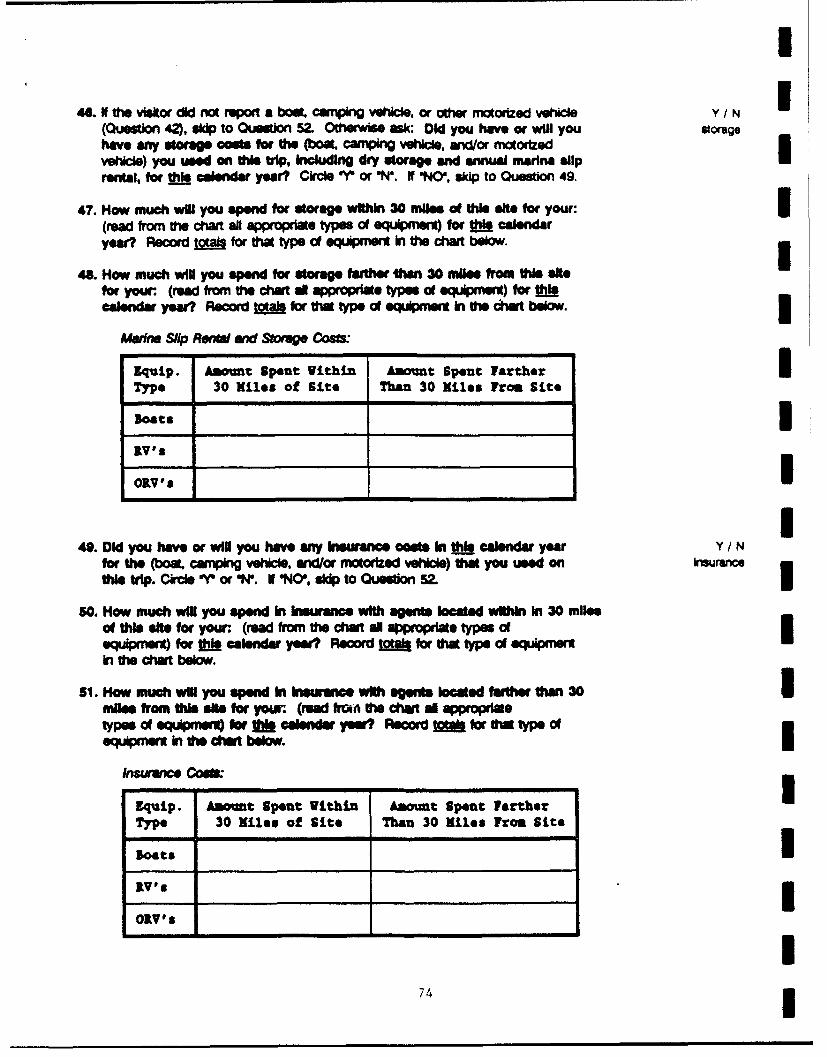
m
44. If the viskor did nU report Oa book camping vOile, or otawe mnortzed vehicle Y / N(Ouestion 42), sW to Question 52. Oterwas ask: Did you have or will you storagehave any tor/ e costs for the (boat, camping vehicle. and/or motortzedvehicle) you used on this trip, Including dry storge and annual marina sliprental, for this calendar year? Cicle oYr or ON. If ONO', skip to Question 49.
47. How much will you spend for storage within 30 miles ot this ste for your:(read from the chart al apropriate types of equpmert) for f calernaryear? Pc totals for that type ot equprmt in the chart below.
48. How much will you spend for storage father than 30 miles from this sitefor your. (read from the chart d al ropriate types of eq*me) for ftjcalendar yea? Record 100 for a type •" e.pmerit in th chs t below.
Madnn Slip Ren0w a Storage Cots:
rquip. Amount Spent VLthLn Amt Spent Farther IType 30 Miles of Site Than 30 Miles From Site
oat I
O0kV' s
ORV~I'a- DW you have or wil you have any Insurance co In this calendar year Y/ N
for the (boat, canping vehicle, and/or mnorized vehicle) that you used oan kur•nethis trip. Circie 'or or 'O'. I 'NO, skip to Ouestion 52. m
50. How much will you spend in Insurance with "gents ocated within In 30 milesof this siMe for your. (read fronm the chat al appropae type omequpm t) for ti calendr year? Record totrl tha type of aqimentin the chart below.
51. How much wil you spend hIn Insurance with age is laca-ted farthe than 30Imiles from thie sise for yew. (rmad fro the chat a appropriatetype df equipment) 11for P @1alendar year? Recor Ig for that type of
equipment in to chart below.
Invurance Co8.~
Equip. Anount Spent Within Amount Spent FartherType 30 Miles of Site Than 30 Miles From Site
- In m•
OV's
ORV 's
74I

I
SIfthe visitor reported no upendlures(Oueion 42. 51) skip to V R / N / DQuestion 53. OfewMas ask: For most of the expenditures you accuracy of responsesreported do you feel that the Information you Just gave Is: Cirde "V',9W. ON' or V.
a. Very accurate? (V)b. Reasonably accurate? (R)c. Not very accurate? (N)d. Or you don't know (D)
53. Not countina this trip how many tripe have you made since this tme ] Oflast yew to recreation ektee located in the we@ marked on the map? tr
Count only to ekes that we eltuated on the rdver&enka.
5 54. On this trp, no eMoen w avallable for recration A g the river, A C / D IEwhich of the following would you have done: (Circie the latter3 COtTMV.fli-Ig to reepone.) DO NOT R.D OPTION 3C OR 'a. Ot nK aaabie
a. Stil made a trip, but visited nonwrve recreation elte In theshaded area?
b. SUN made a trip, but visited sitee outalde the shaded area?c. Not ude a trip?
DO NOT READ:d. Both a + b.e. Dot krxw.
55. Including yourself, how many people are In your vehicle? O
I8. How many of these people are 17 or youger? Record runumb.
How mare r we 1S to 61? Record numi, up tol?7How many wre 2 or older? Rord number. •1 -61
U 7. Which ot the felolitn goupe beat deecribee the people In thisvehicle? Y a
Y familya. FPmily Y friendsb. Friends Y rnttvesc.. Relatives Yoh
d. OtherCircle te"Y' for AL.L appropriate categories. I the reMpWndet specilftes o cogg5rya cate"o not kted, write his response i the space provided and circlethe "Y beside orhe,
75I
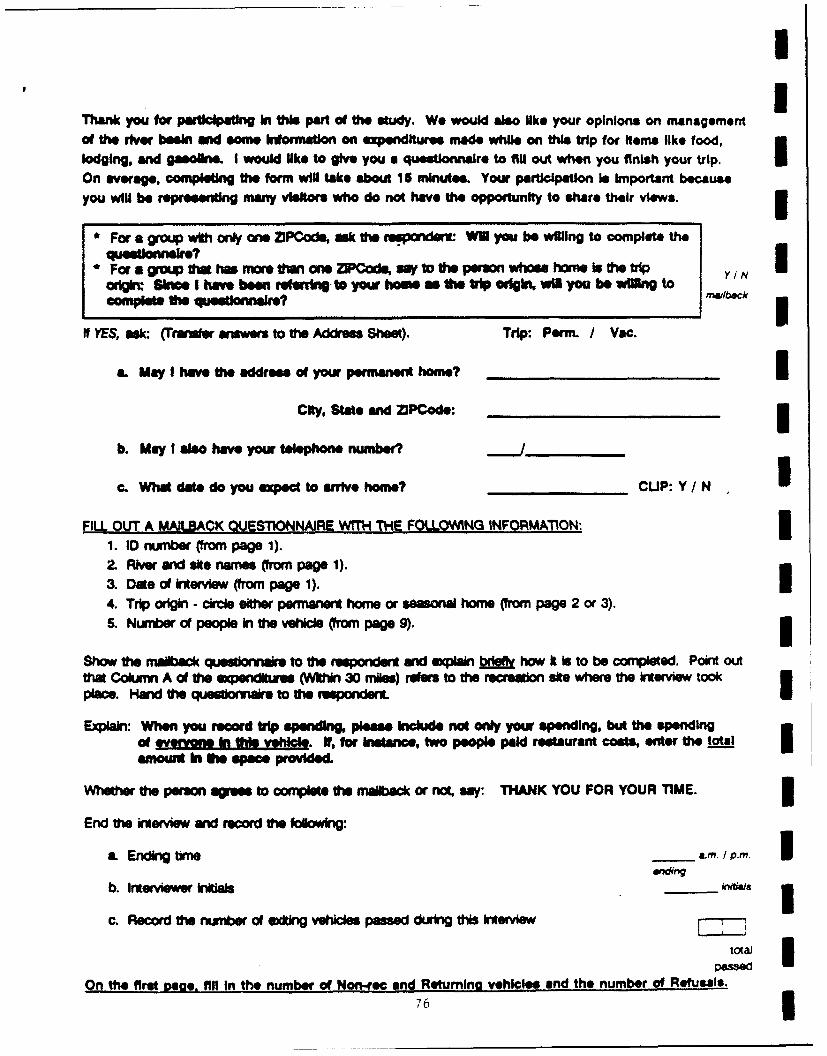
II
Thank you for prc~pV In this part of the study. We would also like your opinion. on managementof the river bes1n end - som kiormaton on expenditures made while on this trip for Items like food,
lodging, and gaslcne. I would like to give you a questionnaire to fill out when you finish your trip. IOn everage, completing the form will take about 15 minutes. Your participation is Important becauseyou will be representing many visitors who do not have the opportunity to share their views.
* For a goup with ol one ZIPCod, ask the responden* WW you be willing to complete the
qnstonnare?* For a gop 9W ha moram*t#n one ZPCds, sayto " pe m who home is Ithe tip YIN
orirm SinPe I have be rmef I* your h moas *Aetrip rtimgn, wM you be Miling toF!1pV mad~back I
If YES, ask: (TCremfe wwers to the Address Sheet). Trip: Perm. / Vac.
a. May I have the address of your permanent home? ICity, State and ZIPCode: i
b. May I also have your telephone number? ____/
c. What date do you exqped to arrive home? CUP:Y/N
FILL OUT A MAJILBACK QUESTIONNAIRE WITH THE FOLLOWING INFORMATION: 31. 10 number (from page 1).2. River and site names (fom page 1).
3 Date of inervlew (from page 1).4. Trip origin - circle either permarnt home or smsonal home (fom page 2 or 3).
5. Number Of people in the vehicle (from page 9).
Show the mmilbac queslionna•ie to the respondent and explain bdeft how it Is to be completed. Point outthat Column A of the expenditures (Wktn 30 miles) refe to the recreation site whee the rterview tookp-ae. Hand the quesdonnr to the r Wponda
Explan: When you record trip qmpenng, please Include not only your spending, but the spendingof everyone In thiO vehicle. If, for Instance, two people paid restaurant costs, enter the totalamouffl In Vie space provided.
Wheh the peown agrees to complete te mailback or not, say: THANK YOU FOR YOUR TIME.
End te interview and record te following:
a Ending time &M. P.m
b. Interviewer initials _ _ns
c. Record th number of e•itin vehicles puesd during this Iwerew
On the first cape. fill in the number of Non-ree and Retuming vehicles and the number of Refusals.
76

IIIa
I
IIU APPENDIX B
IIII
II
I 77
[
IIIIIIIII
This page intentionally left blank. U
Ii
I78
i

.~40 E.
Hn c n-~~~ CL ~ 0oE
c .- aa
0Z5 z -c si CL
E .2 C-D
> 0 C
c CL 1cL a . ~Co a a-- 0
E
0 ; ~ *0:
0~0
6 0 .0 c, -0~ a 0 .>a
C U D
c E 0 CS
> ' o--lo a
e6C~~' 'E0 0 0-0 00. r z -J
t, --
a~C 0. 7a .' ~ 4
4!6
0 O a 4;g 0. %a," @. -- -
EM 00 a
u 0.,l
06 0C 0
1 '0 0.M 0 Q "I
CC 40 In
ma co 0 0U. M
0~~~~ CC ia L d .
c.. M L.~.O 6 6 .0 1%
L16 0 0000 w
(C .00. re e 06 0 0 -1 1% r A.
Ce a0 2 bo"6.).D c l- 6 = *a .6 0 0.O- L. 0- 00
~~~~~24.0 0 10 m. ' L S00 0 _. 0 '1.* *C0 A 14O
CC. IV0 4 C0 O .0) a > a
CL 1.. O C -~ CO - 0 -0
. 9L a- ma v . a U~ u 46.0 " a A)1.. u 0f . 0-. 0 1- 0 0--. Ln0 UM'..I 60V 6 0 D
J 0 0 2 r C 31 A -1 >l 3, a)66
I3L
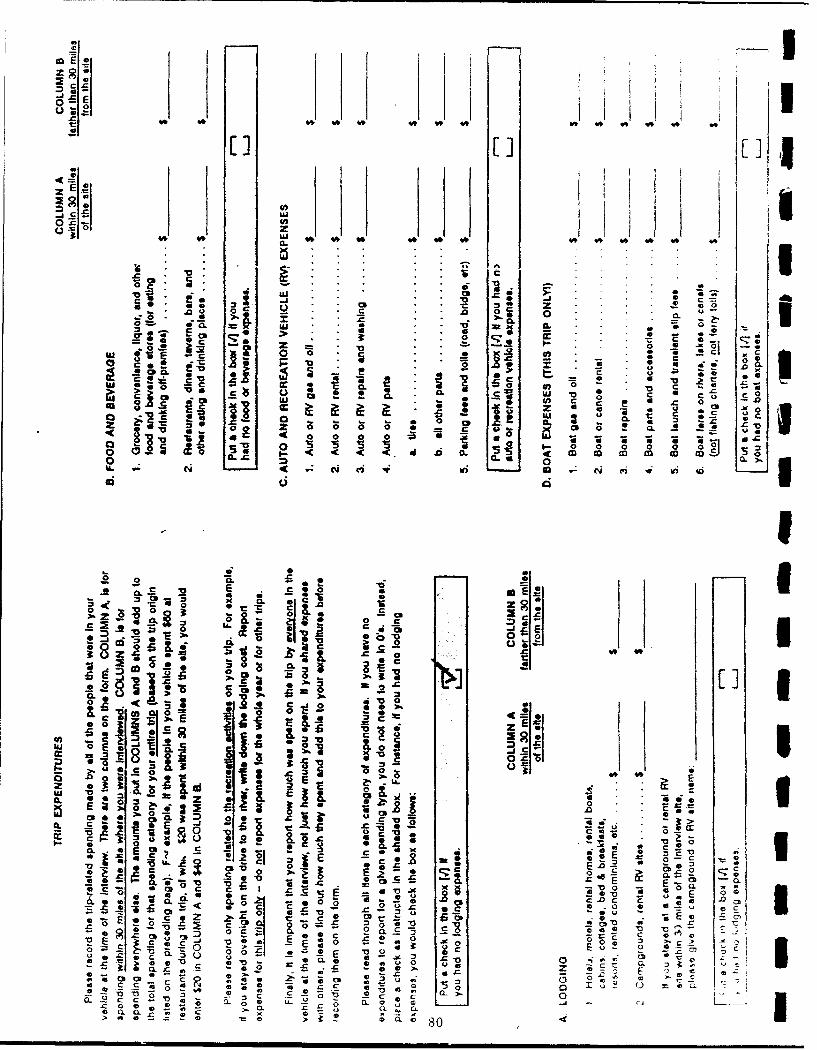
U)Uc .c
0 49j
>U0 '0
11 1~ -j i --j re E- c a
c ** 0 - s .
0 c
- t CL :
z z - ? 0'. ! i-" 65 'm '0 00 0~~ 0 0 00 S
0 I I0a0i o Ad CO Cd M~ CD CD CO a.4 SiU. -C Iz C i l o (N i 4 li
CL 00
*E -
0 0. CL z0 U.
0 2 C.
4112 0 0o
ci5 -. -
'. s- 0-sc z *Ezg
0 Kwe 7F I. L. 'z cd
-9 *ac a- 0.1 4i :*p 1 --.
a c. Zc ,U -. -0=~ ~ 0. Q.E 2 c; Cc
IM 40 Cc 7* "0 0.Z0 0 : CL S . o * 2,..-b c- 9, , 2 - 4- 0 u -
za aI

aa I *
.J -
Gi 6 to~, U~
a V 0 A 0c-C c C
* .* -- - U..*A I *
CD C4S
0 -E >.
00 0.
* 0 C ix' ~C0c~a - .2
E ; 0 ~ I * C a 6~ CDa * .. ~a CL -
;0 17 aI'M 0~ go. ;
_..1 a 2
U)C 0 d 0:00
a 2 m 4 w0 ci ci li
MIID
i E
4, 4, ,4, 4, 4, 4, too 4,1
Coo
a. z *E . .
a.;- .0 0<..~
Oc .2~
x Lc J x xN eN = - = E
81 w

II
I
I
SI
This page intentionally left blank. I
I
I
I
II• I

III3(4LIIiII3 APPENDIX C
3I3
I1I
S 83
I
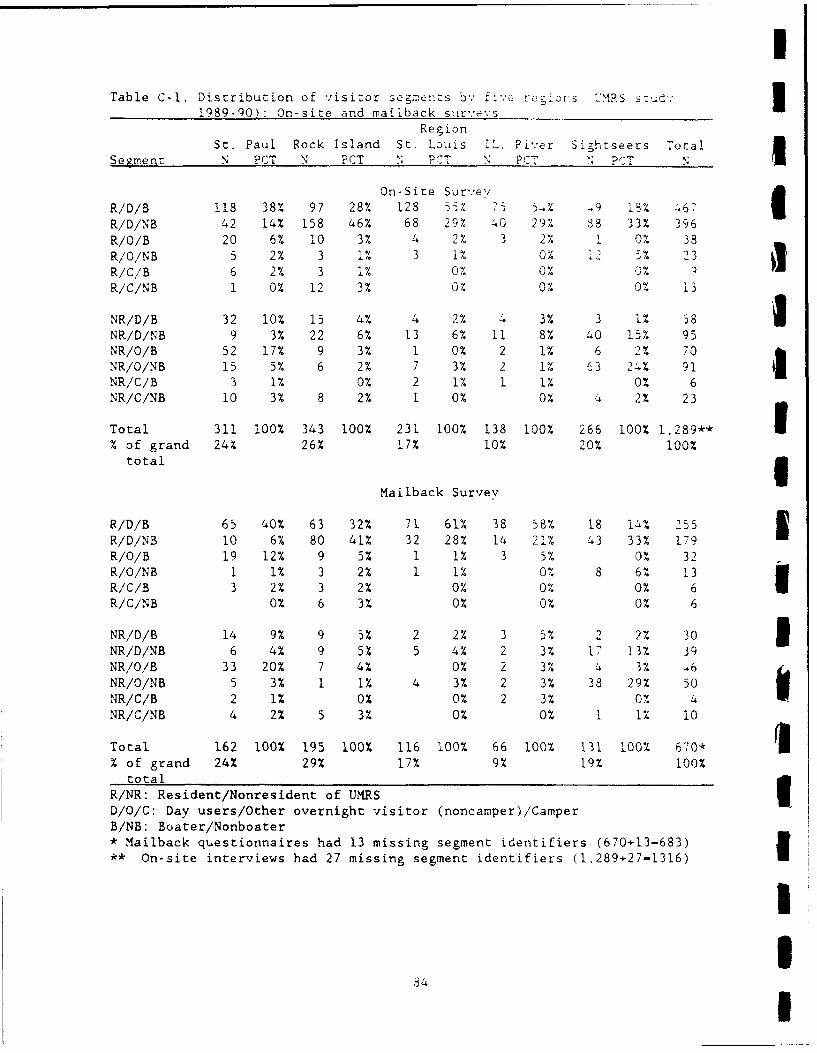
ITable C-1. Distribution of .,isitor segre::ts bv five rejir~s <2IRS C:udv 3
1989-90): On-site and maiiback sur-veysnRegion
St. Paul Rock Island St. Louis 1L. River Sightseers Total
Segment N PCT N PCT N PrT N PCV N PCT
On-Site Survey aR/D/B 118 38% 97 28% 128 553 75 54% Z9 13% 467RiD/NB 42 14% 158 46% 68 29% 40 29% 38 33% 396
R/O/B 20 6% 10 3% 4 2% 3 2% 1 0% 38
R/O/NB 5 2% 3 1% 3 1% 0% 12 5% 23R/C/B 6 2% 3 1% 0% 0% 0% 9R/C/NB 1 0% 12 3% 0% 0% 0% 13
NR/D/B 32 10% 15 4% 4 2% 4 3% 3 1% 58 1NR/D/NB 9 3% 22 6% 13 6% 11 8% 40 15% 95NR/O/B 52 17% 9 3% 1 0% 2 1% 6 2% 70
NR/O/NB 15 5% 6 2% 7 3% 2 1% 63 24% 91NR/C/B 3 1% 0% 2 1% 1 1% 0% 6NR/C/NB 10 3% 8 2% 1 0% 0% 4 2% 23
Total 311 100% 343 100% 231 100% 138 100% 266 100% 1,289"* I% of grand 24% 26% 17% 10% 20% 100%
total
Mailback Survey
R/D/B 65 40% 63 32% 71 61% 38 58% 18 14% 255R/D/NB 10 6% 80 41% 32 28% 14 21% 43 33% 179
R/O/B 19 12% 9 5% 1 1% 3 5% 0% 32RIO/NB 1 1% 3 2% 1 1% 0% 8 6% 13R/C/B 3 2% 3 2% 0% 0% 0% 6 IR/C/NB 0% 6 3% 0% 0% 0% 6
NR/D/B 14 9% 9 5% 2 2% 3 5% 2 2% 30NR/D/NB 6 4% 9 5% 5 4% 2 3% 17 13% 39NR/O/B 33 20% 7 4% 0% 2 3% 4 3% 46NR/O/NB 5 3% 1 1% 4 3% 2 3% 38 29% 50NR/C/B 2 1% 0% 0% 2 3% 0% 4NR/C/NB 4 2% 5 3% 0% 0% 1 1% 10
Total 162 100% 195 100% 116 100% 66 100% 131 100% 670* (3% of grand 24% 29% 17% 9% 19% 100%
totalR/NR: Resident/Nonresident of UMRSD/O/C: Day users/Other overnight visitor (noncamper)/CamperB/NB: Boater/Nonboater* Mailback questionnaires had 13 missing segment identifiers (670+13-683)
** On-site interviews had 27 missing segment identifiers (1,289+27-1316)
IS34 I

6- I 0 C K - r 4
G o r r- nK * I 000, 0 000 0 0 0 000 0 ar,0 a -
0
Q,0 rr r~ej
o 14 L
cz 0 oNu - o oe ooro 00yo~ ?-1. ~ ucc
- o-0 0 o o 0 0 00 0 o ~ ' ~ 0 -N
00 o. -0 0 0- 0 -0 o \ 00 0 0 oo 0 0 0 0 00
a4
c~a
x V- Go -t0C ( D~ 0 -000L $ ommI j fm1
Z au m -* 00ao0N00Q0 rL
c 41
4, 0:a l C 1 la, 00
00
0U 4,0 4,4>. - 1, c
ix u- to 0 0, ,-No- 0' o 0 -0 0 a 0 -a 0 00Ir(8D9"9"9c-9 I9"99

CD co gI9 199 n ý C' Cý .U
0 03 0 ,a N0 T0 0 00 00 00 0 0 1=aC 0 0 0
> 0
0 N
co
>0 - Ioac = 0 e4 toV
*.r 0
-- 0
> z
L2 0 4n~ F- O N a 0 ý lc r
NO 0-.Jj~-0 O 4)*m
0 0
=- - =! a I.
C 0 -
0
Q ~ ~ ~ ~ ~ ~ ~ ( 0( 'a CP (U-C ',o0 , r0 r 0 w , c
4) 4J) 4) (U ~ - 0Go0) ('- ( - L . .
co C C C .
-6 'A 0- - -- ~ ( c>. c.0 ~ ~~~~ UJ W- 0 0,-.444((((((( W UU t 4.
(A A- 0 L. 0.L -A
-m ý 11 0...n..% Lom t " , c 0 41 ft- c 3 a w cK . T F-t -86w to
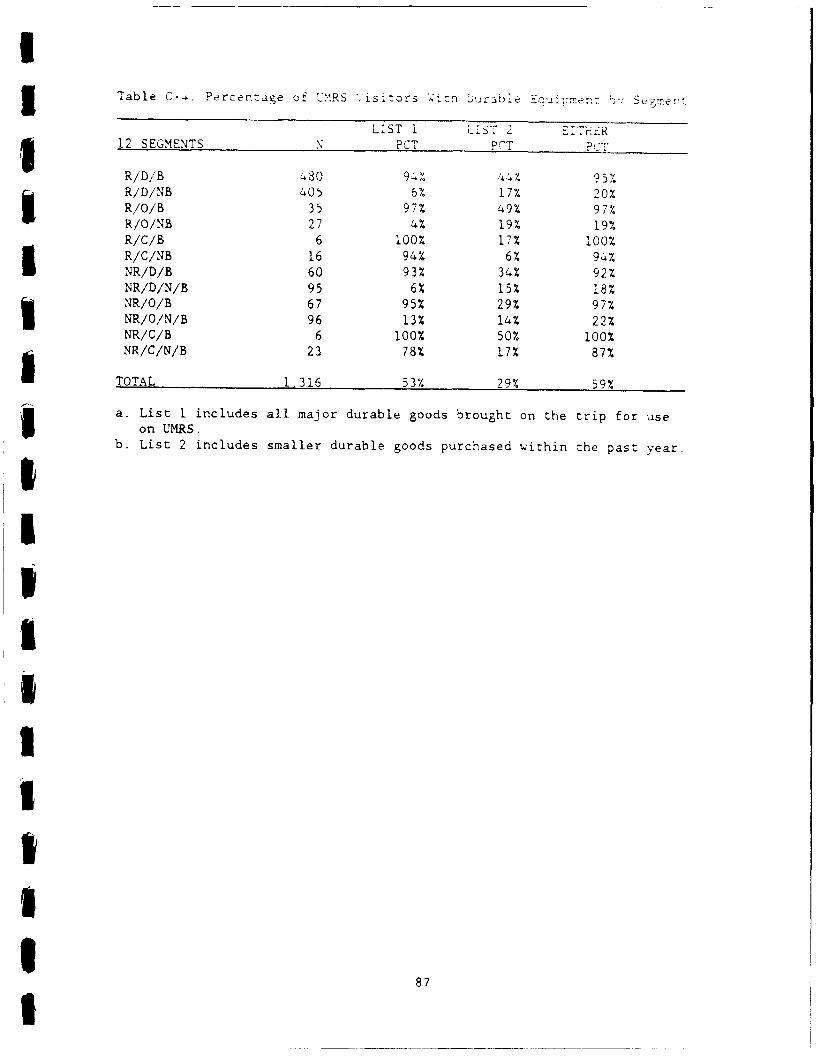
!3 Table C-4. Percen:tage of U'MRS Visizors '.ýitm r.awe me .' "
L:ST 1 L7S? 2 ETi-TERg 12 SEGMENTS N PCT PCT POT
R/D/B 480 9-. 44% 95%R/D/NB 405 6% 17% 20%R/O/B 35 97% 49% 97%R/O/NB 27 4% 19% 19%R/C/B 6 100% 17% 100%R/C/NB 16 94% 6% 94%INR/D/B 60 93% 34% 92%NR/D/N/B 95 6% 15% 18%NR/O/B 67 95% 29% 97%NR/O/N/B 96 13% 14% 22%NR/C/B 6 100% 50% 100%NR/C/N/B 23 78% 17% 87%
TOTAL 1,316 53% 29% 59%
a. List I includes all major durable goods brought on the trip for useon UMRS.
b. List 2 includes smaller durable goods purchased within the past year.
SIIIIIjIiIIS
87I

w CDC 0 0 (ýro ci
6 666a 66a6w ol
a~ 00 o a0d o 0~ COJ
0
z iA I ( n 6Jim u
o) a a 6 o 6 o i C) D
an C- - 0 - ()MI
'-a.,0D I
E o C) o C~~0 O 't (n
00 zIcl '4R L.9 9 ! 4 ,
0 £0) f 4'
CL m 0 L0v(
E C? Ci CR WCý zCCiD
CL t--( N I- U -jv U
E 88
U)I

1. ~00000~0000 0000000" <a0 0- 0o00 00 co0.- 0
2 - 000 O00 0- O00 00- e'000,0 0c
0 00 0 0 0 0 0 0 0 0 00 00000000a o0' ýC , C 0' J4 o
"I CD2.~M MA00 0 C ~ . 0 0 0 0 -0 0 0 O -. t 0-''
c !2 'm0000g00000- p 7r-j 02 00t-.4OWN0C,0 0 0000000000CDV) 0D ,-00 CO W a.00 ýo P
(D 0 QC 'Q(IW -000-00 00 0 0 0000 0 M SO 00000 0- >C r000 a
0n x
-z w
a. m0~
Z 000 00 01,0 0 0 00 0 0 00 000 0u0 00 .0
Go 0 - r 'w,, g ,P,0o 0g0P 0Z 0c ~O0- -0-- 000
w~0~0O0r0j ~ rJ00 - 0o0u ( ,0; , W u0 l D0Výa000fi0 m ~ 04 lamI ýC 9C ý 99C i 999999Cl--00,.~~~~C C>-O 0p9-0-00, A l
(A' 0 - --C, 00K00 0 - 0 0 0 0 0 ~ O 00 '
""I fn I ý ' n 0 ,ý . 1 ; v I
2J U
0 - 0 ~ (zA 'AI IV (A ( -0
10 10v v a72 1I , ..
89
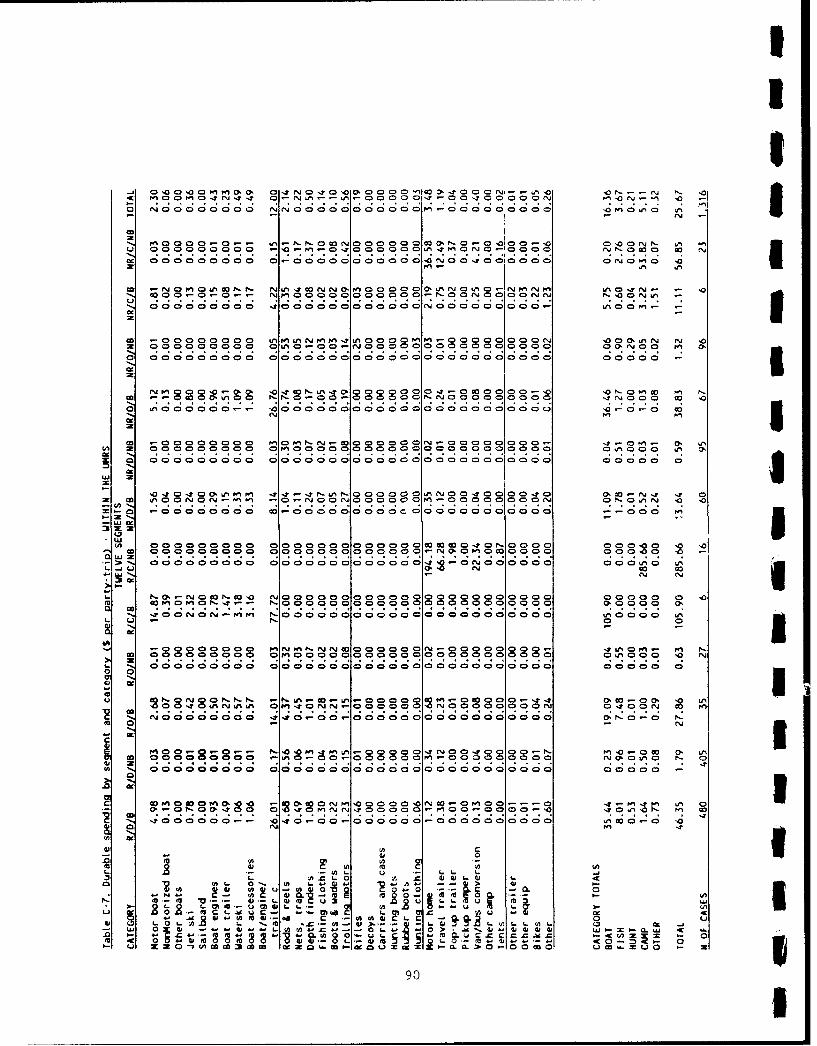
CD C 10C2 ?- cp 0ý 0 ' CA 'Ia aa r1,4
(% C C ( D D D D0 , 0a0 00 000 Fl 0CDCDCýmrn0 I6
co 000000000 P~ - L -0 ~ 0 0 C0 0 ~*0 0 0 01 L'. n00 0
0 00 0 0 0 0 C )C 30 DC D00C)00C0o0 0 0 C=00 C 00 4= 00C ýC 00 0 0N0PO 0 O
00 g0PJr0Ft NNCD 00000 CC 0U 0 a CDý; ' 1~0~?% r C) c00 .0- -- 00 00a0 N OO O 0 t~s
(A0 -0 CD0 00000CD O l rk O 000 ~ ~ o 0~ 00 < uGC 20CD0 0 C) 'T 0O 0 N r% '
0 D 000 0000 0 0DCD 0 C D00 00 00 000D000MC0 0000CDCD00000 0000(D0 4= C
0 -D O O O 40 - M a~0 0 0 00 00C.NOOOOOOOOO CN 0 (D- 0 '0 D 3(
1 ~~~~~~~~~0 00 00 00 00 0 0 0 0 0 0 0 0 0 0 0000 0
:JJ 3
>0 0 0 u N 0 0 00 000N.
> III- 000000000 OOJ.0I- -J00 0 0 0 0 0 0 ~ 0 0 0 0
P, NWa ,P N N n c; Q0CDO0 ýcaa I-I-000 0000 VI('V~N NN00 0000 0000 000 -~0~- pr N
O 0 0 0 0 fC00 0 0 0 0 0 0 0 00 00I00 'Q Q. ,' 20C " 0c . L
00 0'nLU OO (J-000 ' 00 00G-. 0-.?ONOOOOOOOO N
04
00 Q
1A.2~0 - ar. 0' 010
m (o. Q - L
LA 40V 4t AL
.0 L- 'A 4) 0 0 )40 (D " CL ~ 8 A 0 O C: 'v L-M
L 0 0. mA 0 0L m. 0 -" 0 0ZZO ')(CD C0 .COO cz zcc G 0 09 . Z 0,~.4 9L> 0c c c
0 'AL~ ~ -4, 90
UIIS1iIIi APNI
I APNI
pUIIIII
i 91

IDATA CLEANING AND EDITING TASKS 1
A numwber of data cleaning and editing tasks ý-ere -erformed. The mostimportant ones are briefly described below.
I. Length of Variable Names. On-site interview data were received from theother contractor as Dbase IV files. Twenty-six variable names in the Dbase Ifiles exceeded the character length limitation or SPSS-PC and had to berenamed.
2. Missings. Whenever means were computed using SPSS-PC, all user-definedmissings (e.g., 9's) were excluded from analysis.
3. Identification Numbers. For a given date, interviewers numbered the on- Isite interview forms sequentially beginning with "001." Thus, the identifica-tion number consisted of the date plus the ID number. The interview date wascoded b-' the other contractor as an alphanumeric variable. In order to sortthe data nd perform other analyses, the date variable had to be recoded intothree numeric variables consisting of month, day, and year of the interview,
4. Alphanumeric to Numeric. A ilanber of variables had to be recoded from Itheir character codes into a numeric form. These variables included countyand city names of place of residence, types of overnight lodging accommoda-
tions other than the ones Listed in the interview, recreation activities other Uthan the ones listed, county and city names where durable goods were pur-chased, end types of groups other than family, friends, and so on.
5. Out-of-Range Codes. A nwnber of variables as received from the other con-tractor contained out-of-range codes and had to be corrected. For example,both the beginning time and ending time variables contained codes which
exceeded the military time maximum of 2400 hours.
6. Joining On-site and Mailback Databases. When these two databases weremerged using the "JOIN MATCH" procedure in SPSS-PC, two major problems arose. IThe first was the presence of mailback surveys with no corresponding on-s'te
interviews. In most cases, the problem was the incorrect coding of date,identification number, or site number on the on-site interview. The second
problem related to logical inconsistencies in segment specification. A numberof parties identified az day users reported spending money on lodging. Anumber of groups defined as nonboaters reported boat-related expenses. Appar-ently, there was either confusion during the on-site interview or a change in Itrip plans after the interview. For instance, those who said they were spend.ing no nights away from home on :his trip (i.e., day users) may have laterchanged their minds and used overnight accomnodations. Those who said they vdid not engage in boating may have thought the question pertaining only to thesite where they were interviewed. They may have incurred boating expenseslater on the same trip at a different site and included these expenses on themailback questionnaire. Those "day users" who reported lodging expenses wererecoded into "overnight users." Likewise, "nonboaters" who reported boatingexpenses were recoded into "boaters."
7. Outliers. For trip spending, each instance of more than $500 in spendingfor any item on the mailback questionnaire was identified. The effect ofthese outliers was assessed by examining the proportional change in mean
92 I

Ispending for a given item with and without the outliers. Fo, the ...D c :aservices purchased by few parties and where the effect ef outliers on a%'eraespending was noticeable (i.e. varied by more than a few rc•ntaze pointsthe outliers were excluded from analysis. This process resu 'ted in the exclu-sion of two outliers, both of which were autoR,'. repair costs e:ceedin• $iACper trip.
3 There were 31 durable items with no cost figure reported and 37with a cost of greater than one hundred thousand dollars. Tne latter 'ere
primarily boat/trailer combinations and motorhomes. Th•en converted to a per5trip basis 7 durable items exceeded $30,000 per trip. These items weredeleted from the durable goods analysis as outliers. Their exclusion reduceslarge variances for subcategories, segments and regions based upon which largecost items happen to be included, while not significantly altering the overallpopulation mean. Exclusion of these outliers yields results that are less
sensitive to the particular sample chosen, and makes the resulting estimatesmore conservative.
9I
IIIIS
93
I
I
II
I
This page intentionally left blank. I
'I
I
IIII
94 1

I
I
IPART T'O
DOCK OWNERS AND MARINA USERS:RECREATION SPENDING ON THE UPPER
MISSISSIPPI RIVER SYSTEM
IIIipIUIII!
U~95

I
This page intentionally left blank. I
i
II
II
96i

IB BACKCRGU',D
This portion of the report provides both trip and durable goods spending
profiles for dock owners and marina users utilizing the Upper Mississippi
River System (UMRS). These spending profiles were derived from the household
telephone and mailback questionnaire phase of the totdl UMRS study and are
based on households that rent marina slips or have licensed boat docks.
The remainder of this part is divided into the following major sections:
PROCEDURES, RESULTS, and DISCUSSION. The PROCEDURES section outlines the
general data collection and analysis methods for both dock owners and marina
slip renters. The RESULTS section divides the findings into two subcatego-
ries, "trip expenditures" and "durable goods spending." Trip and durable
goods expenditure profiles are prc-ented for dock owners and marina slip
renters, respectively. In the DISCUSSION section, the findings are inter-
preted in relation to the results of the developed areas study and the limita-
tions inherent in this study. rhe DISCUSSION section also describes
applications of the dock owner and marina user results. Specifically,
economic impact applications through the use of IMPLAN and non-IMPLAmN proce-
ft dures are recommended.
p PROCEDURES
To achieve stated objectives, the methods employed in this phase of the
total UMRS study also take into account the most common uses of recreational
spending data, including the specific requirements of IMPLAN-PC. For purposes
U of definition and measurement, recreational spending is divided into two
distinct categories: durable goods spending (e.g., boats, RV's, bicycles) and
variable trip costs (eg., hotels, meals). Two separate contractors (one for
dock owners and one for marina users) conducted the household telephone inter-
view, a modification of the on-site interview developed for the UMRS developed
areas study. The telephone interview obtained recreation use and durable
goods spending data. Variable trip costs were measured through the use of a
mailback questionnaire distributed by the telephone interview contractors, By
separating durable goods spending from variable trip expenditures, the two-
5 step, telephone interview and mailback questionnaire procedure minimizes
997I

lconfusion on :he part of :ie r:`-oe:de.: This A'•AL rT>och 5s:r:.i><s 5respondent burden by reducing the length of the telephone interview.
The principaL investigator (PI) of this phase of the study received the Uresults of the telephone interviews from the two contractors and the mailback
questionnaires directly from the households. The PI analyzed these data in Isuch a manner s- as to produce the spending profiles.
Sample Selection 3Detailed procedures for the random selection of sampling frames for both
the marina users and dock owners are provided in the sampling plan for the 5full UMRS study (C.S. Army Engineer Corps of Engineers, 1989). The names and
addre3ses of marina users were obtained from marina owners while similar
information regarding dock owners was provided by the Corps of Engineers for
all licensed boat docks along the UMRS. From the two lists, panels of
150 households for each of the two groups (marina users and dock owners) were
randomly drawn. Each household was contacted to ascertain willingness to
participate in the study. Those households who were unwilling to participate
were replaced by those who were until the goal of 150 households per panel was
achieved. 5
Methods
Profile telephone interviews (Appendix A) were conducted for each house-
hold to obtain background information as well as durable goods spending data.
Thereafter, follow-up telephone calls (Appendix B) were made to households on Urandomly selected dates throughout the year. Follow-up calls were placed to
the marina panel three times in each of three seasons (spring, summer, and 3fall) for a total of nine attempted follow-up contacts. One additional
follow-up call was placed to the dock owner panel during the winter season for 3a total of ten follow-up calls for this group. During the follow-up calls,
the slip renter or dock owner was asked if any member or guest of the house-
hold participated in one or more recreation trips associated with the dock or Iwith the boat in the marina slip during the previous seven days. If the
answer was "yes," use information was collected for those trips. That is, the Iaffirmative response was followed by questions which measured (a) the number
of trips taken during the previous seven days, (b) the number of people l
involved in each trip, and (c) the types of recreation activities in which
household members engaged during each trip.
98 'I

IIn addition. :he respondent was asked to re:urn 'is Or &er ple%.oi•Siv
mailed trip expenditure questionnaire (Appendix C) to Michigan State
University's Department of Park and Recreation Resources for cding and ana.v-
sis. This questionnaire contained the trip-related expenditures incurred for
all recreation trips that took place the previous seven days. As in the5 developed areas study, the questionnaire asked for trip e:xpenses for as Man';
as 33 items during the previous week. The difference was that the marina
3 user/dock owner questionnaire obtained the sum of trip expenditures for all
trips during an entire week, whereas the developed site questionnaire obtained
gI such data for each trip.
Trip Spending Analysis
Households were asked to report the dollar amount spent per applicable
item within 30 miles of their dock or marina slip and outside 30 miles. These
"local" and "nonlocal" spending figures were summed to derive a total trip
spending esti, 1 tate.
Estimates of average trip expenditures in all tables are based on the
full sample, including parties who spent nothing on a given item. The mail-$ back expense questionnaire (Appendix C) was designed to distinguish between
those who actually spent nothing on a particular item and those who intention-
ally or unintentionally left a response blank. The mean including zeros is
the appropriate statistic to multiply times total visitation to estimate total
trip spending. Thus, spending means for the full sample, including zeros, are
reported.
The SPSS-PC Data Entry (DE) II system developed for the UMRS developed5 areas study was modified and used to code, clean and edit the mailback ques-
tionnaire data. The DE II system identified out-of-range values for question-
naire variables, In addition, a number of within-range but extremely large
outliers were identified. These large outliers, which were dropped from fur-
ther analyses, resulted from respondents reporting annual or seasonal expenses
rather than expenditures for the previous week. These outliers were typically
ascertained by the units written by the respondents (e.g., $3.000 "per year",
$1,500 "all summer"). Furthermore, respondents sometimes filled the open-
ended "other" expenditure category (item H.5.a.,b.,c. in the mailback
questionnaire) with items and expenditures clearly not related to recreation
trips. This situation was particularly true for dock owners. Examples
!99

Iincluded lawn maintenance, home maintenance, and tooLs These ite:>s"re 3deleted from the trip expenditure analysis
Once cleaned and coded, the weekly expenditures for a!l dock ovr.er and Uslip renter trips were divided, respectively, by the average nu'mber of recre-
ation trips the previous week incurred by dock owners (2.2 trips/week) and
slip renters (1.9 trips/week). The number of recreation trips was obtained 5from the telephone, follow-up interviews (Appendix B). These computations
converted the weekly expenditures to a per trip basis. No attempt was made to 3partition trips into day use versus overnight categories. Follow-up telephone
interviews distinguished between day and overnight trips the previous week, 5but the mailback questionnaire did not, and, as indicated below, merging the
two data sets was deemed to be inappropriate. The mailback questionnaire
obtained trip expenditures on a weekly basis, and provided no valid way to Iallocate expenses to either day or overnight trips. Ad hoc procedures for
dividing trip expenditures into day and overnight categories would be
questionable and, worse yet, would result interpretation difficulties stemming
from small sample sizes.
An alternative analytical procedure for computing weekly trip expendi-
tures on a per trip basis was initially planned. Certain variables (i.e.,
identification number and date) were duplicated in the follow-up telephone
interview and mailback questionnaire so that the two databases could be merged
at a later date. The plan was to use the merged data set to derive expendi-
tures on a per trip basis by dividing the weekly expenditures for a given case
by the matched number of trips incurred that week by the identical case. 3However, the merger of data sets was deemed to be invalid due the large number
of either missing or inconsistently coded identification numbers and dates. ,
Approximately only half of the dock owner or marina user questionnaires and
corresponding follow-up telephone interviews could be successfully merged. 3Trip spending means from the cases that were successfully merged were compared
to the means from full sample reporting weekly expenditures, and some substan-
tial differences in spending patterns were revealed. Differences between the Itwo samples were greatest for boat-related expenses. Thus, the decision was
made to employ the full sample data set (all mailback questionnaires reporting
trip spending) and divide average weekly expenditures by sample averages of
the number of trips per week in order to convert to units of expenditures per I
party per trip.
100 I
I3 Durable Goods Analysis
Spending on durable goods was measured in the profile lnter-i w Ape.-
dix A) portion of this study. The panel was asked :o report tne amount s-ent
during any year on durable goods associated with the recreational use of tfeir
boat docks or marina slips. For each major durable item (Appendix A), tl,e
type, year of purchase, cost, county of purchase, and whether thc item was
purchased new or used was measured.
3 The 32 durable goods categories (merged to 26 for analysis due to miss-
ing data for some categories) were selected to insure maximum compatibility
with IMPLAN-PC sectors. The separation of spending into "new" vs. "used" also
insures consistency with IMPLAN-PC requirements. In economic impact analysis,
only new purchases create sales and jobs in manufacturing sectors. Purchases
of used items contribute to the retail margin if bought from dealers and pio-
vide income directly to households if purchased privately.
5 The location of purchase was coded as county or city names. At MSU,
these names were edited and recoded into county FIPS codes.
3 The goal of the durable goods analysis was to compute spending in
IMPLAN-compatible units which could be expanded to the total population of
dock owners and marina users. Therefore. the units derived were dollars mer
household per year. Spending expressed in these units can by multiplied by
the total number of dock owners or marina slip renters per year to obtain an
annual estimate of total spending on durable goods associated with trips to
the UMRS. "Associated with" is highlighted because one cannot assume that
5 durable goods are used solely in conjunction with trips to the UMRS and
nowhere eisp This point is address-d further in the limitations portion of
5 the DISCUSSION section.
To compute durable goods spending means, items purchased in the last
3 seven years were included, but the resulting estimates were divided by seven
to convert the means to an annual basis. As in the develoned arpas study, the
choice of a seven year period for durable goods was based upon the examination
of results from (a) all purchases in all years, (b) durable goods purchased
within the past seven years, and (c) durable goods bought within the past
year. Using seven years of data provides a larger sample of durable goods
than the one-year data. For both panels, the sample of items purchased within
5 the past year was particularly weak for estimating purchases of boats and
fishing equipment. For marina users, the sample of hunting, camping, and
1101
U

Iother items purchased ' >ia .'e,. i _ ..3 1 .ý .7 • .... d:.v.. 1
analysis also avoLds the inc .usion of itnems p.rsha,-d .,:, ,ia!'s Zo ad :re-
simablv 1','-r priceS. Thus, the ana!tss distributes J`e -:os; - sf dura-le
goods evenly across seven ,ears under the assrpion thItn `e -,as- ,ear is
representative of the number of trips per year to tire RS ffr each household
A further advantage of the seven year period is its =cnsistencv wih e 1
on-site data base. In the developed site durable goods analvsLs a six -;ear
time period was chosen: 1985 to 1990. The dock owner/marina user stud'-, was 1
conducted one year later than the developed site study. Thus, the seven year
time period spans the years: 1985 to 1991. This means that the beginning ,'ear 5is the same in the two data sets and that the number of years for which dura-
ble goods are analyzed are nearly identical.
For both dock owners and marina users, a number of households (dock
owners in particular) reported multiple years of spending for various items,
For example, one household reported buying a Lutal of 5 fishing rods and reels 1
between 1970 and present. If the multiple year time frame was clearly outside
the seven year period of 1985 to 1991 as in the above example, then the items 1
were dropped from analysis. However, if the multiple year time frame fell
within the seven year period, the items were included.
Durable goods cost estimates will be somewhat conservative as they were
not adjusted for price increases over the seven Year period. Based on IMPLA-kN
deflators for relevant durable goods sectors, changes in durable goods prices
from 1985 to 1991 were less than 5 percent. 1
Residents versus Nonresidents
For the purposes of this study and subsequent analyses, "residents" were
deLined as -hose households who, during the profile interviews (Appendix A)
reported their permanent address as being within one of the UMRS border coun- -ties. Based on this definition, 108 dock owners were UMRS residents: 42 were
nonresidents. For marina users, there wece 104 UMRS residents arA 67 non-
residents.
In the following sections, results are presented separately for dock
owners and marina slip renters. For each user type, there are three major 3categories of results: sample sizes and response rates, trip expenditures. and
durable goods spending. 3
102 I

II3 RESULTS DOCK OWNERS
Sample Sizes and Response Rates
The stuA: plan called tor me other contorac-tow m arm'pp
phone cal> .o the 150 households that constituted The panel of dock owners
3 along the UMRS. Thus, the total number of possible telephone :ontacts was
1500. As indicated in Table 1. 1407 contacts were actuall, attempted. Of
I these attempted contacts, 361 telephone calls 26%6) resulted in dock ow.ners
reporting at least one recreation trip the previous week: 243 maiibacK
questionnaires were received from this group, yielding a response rate of
67 percent.
I Table 1. Dock owner sample sizes and response rates (UMRS study,1990-91).
A. # Households 150B. # Calls/Household 10 (1)
C. Total Possible Contacts (A. X B.) 1 500D. Actual # Attempted Contacts 1407
E. # Recreation Trips the Previous Week 361F. % "Hits" (E./D.) 26 % (2)
G. # Mailback Q'naires Received 484 (3)H. # Mailback Q'naires Reporting a
Recreation Trip the Previous Week 243
I. Mailback Response Rate (H./E.) 67 %3Notes:
S(1) 3 calls each in spring, summer, fall; 1 call in winter(2) % of contacts for which there was a recreation trip the previous week(3) Exceeds # reporting recreation trips the previous week (Part E.) because,
part way through the study, households were asked to return theirmailback questionnaires even if they incurred no recreation trips theprevious week
103
U
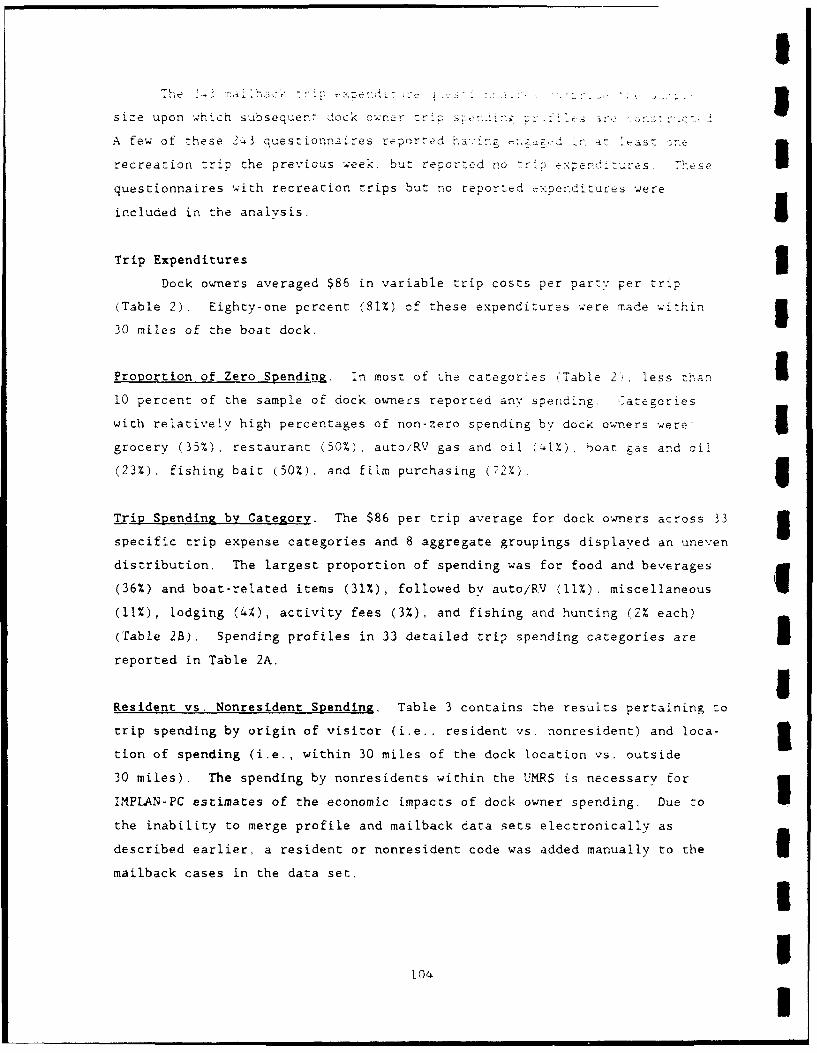
m-I e . .... I . . ..
size upon wh2iclh subsequent dock ownerr tLrp r_--'-
A few of these 243 quesztonnaires repor... - - " 1
recreation trip the previous week, but reported o expnod&>..s T
questionnaires with recreation trips but no reported exrperditures -ere
included in the analysis. 5
Trip Expenditures 3Dock owners averaged $86 in variable trip costs per party per trip
(Table 2). Eighty-one pcrcent (81%) of these expenditures were made within 330 miles of the boat dock.
Proportion of Zero Spending. In most of the categories (Table 2, less than I10 percent of the sample of dock owners reported any spending. Categories
with relatively high percentages of non-zero spending by dock owners were 5grocery (35%), restaurant (50%), auto!RV gas and oil (•1%). boat zas and oil
(23%), fishing bait (50%), and film purchasing (72%). 5TIrip Spendina by Category. The $86 per trip average for dock owners across 33 3specific trip expense categories and 8 aggregate groupings displayed an uneven
distribution. The largest proportion of spending was for food and beverages
(36%) and boat-related items (31%), followed by auto/RV (11%), miscellaneous
(11%), lodging (4%), activity fees (3%), and fishing and hunting (2% each)
(Table 2B). Spending profiles in 33 detailed trip spending categories are m
reported in Table 2A.
Resident vs. Nonresident Spending. Table 3 contains the results pertaining to
trip spending by origin of visitor (i.e., resident vs. nonresident) and loca- 3tion of spending (i.e., within 30 miles of the dock location vs. outside
30 miles). The spending by nonresidents within the UMRS is necessary for
IMPL.AN-PC estimates of the economic impacts of dock owner spending. Due to
the inability to merge profile and mailback data sets electronically as
described earlier, a resident or nonresident code was added manually to the m
mailback cases in the data set.
II
104
U
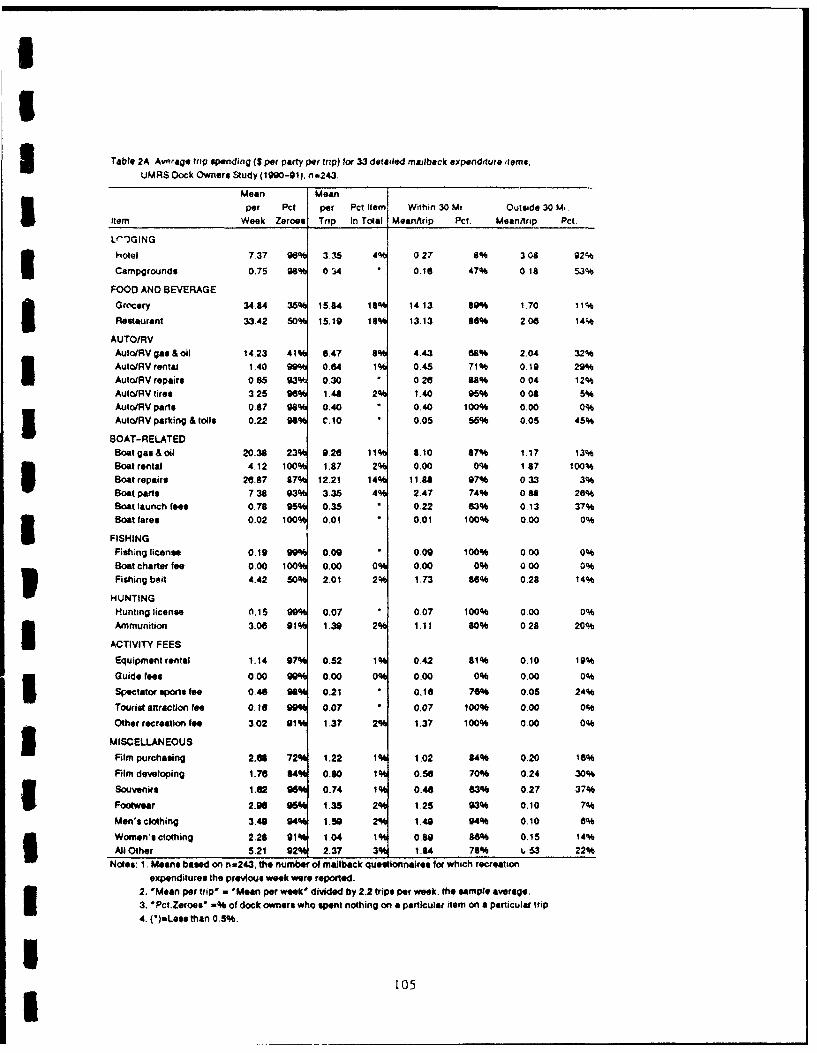
U£3 Table 2A Average trip spending (S per party per trp) Wr 33 detailed mailback expenddture items,
UMRS Dock Owners Study (1990-91). n 243.
Mean Mean
per Pct per Pct.ltem Within 30 Mt Outside 30 M4
Item Week Zeroes Trip In Total Mean/rip Pct. MeanArip Pct
Lr")GING
hotel 737 96% 3_15 4% 027 8% 308 92%
Campgrounds 0.75 8% 0 i4 * 0.16 47% 0 18 53%
FOOD AND BEVERAGE
Grocery 34.84 35% 15.84 18% 14.13 89% 1.70 11%
Re0aurant 33.42 SO% 15.19 189 13.13 8% 2,06 14%
AUTOIRV
Auto/RV gas & oil 14.23 41% 6,47 6% 4.43 68% 204 32%
AutoJRV rental 1.40 99% 0.64 1% 0.45 71% 0.19 29%
AutoJRV repairs 0.65 93% 0,30 0.26 8.11% 004 12%AutolRV tires 3.25 96% 1.48 2% 1.40 95% 0 08 5%
AuoIoRV parts 0.87 08% 0.40 0,40 100% 0.00 0%Auto/RV parking & tolls 0.22 98% O.10 0.05 56% 0.05 45%
BOAT-RELATED
Boat gas & oil 20.38 23% 9.26 11% 8.10 87% 1.17 13%Boat rental 4.12 100% 1.17 2% 0.00 0% 1 87 100%
Boat repairs 26.87 87% 12.21 14% 11.88 97% 033 3%
Boat parts 7.38 93% 3.35 4 2.47 74% 0 88 26%
Boat launch fees 0.78 95% 0.35 " 0.22 63% 0.13 37%
Boat fares 0.02 100% 0.01 0.01 100% 000 0%
FISHINGFishing license 0.19 9 0.09 0.09 100% 0.00 0%Boat charter fee 0.00 100% 0.00 0% 0.00 0% 000 0%
Fishing bait 4.42 50% 2.01 2% 1.73 86% 0.28 14%
HUNTING
Hunting license 0.15 990 0.07 ° 0.07 100% 0.00 0%
Ammunition 3.06 91% 1.3 2 1.11 80% 0.28 20%
ACTIVITY FEES
Equipment rental 1.14 97% 0.52 1% 0.42 81% 0.10 19%Guide fees 0.00 9 0.00 0% 0.00 0% 0.00 0%
Spectator sports fee 0.48 98% 0.21 0.16 76% 0.05 24%
Tou1s atraction fee 0.16 9M 0.07 " 0,07 100% 0.00 0%
Other recreation fee 3.02 91% 1.37 2% 1,37 100% 0,00 0%
3 MISCELLANEOUS
Film purchasing 2.68 72% 1.22 1% 1.02 84% 0.20 16%
Film developing I 76 84ý 0-80 1% 0.56 70% 0.24 30%
SSouvenirs 1,62 06 0.74 1% 0.46 83% 0.27 37%
Footwear 2.96 1.35 2 1.25 93% 0.10 7%
Men's clothing 3.40 94 1.59 2% 1.40 94% 0.10 6%
Women's clothing 2.28 91 1.04 1% 08.9 86% 015 14%
All Other 5.21 9 2.37 3 1.84 78% 1, 53 22%
Notes: 1, Means based on n-243, the number of mailback questionnaires for which recreation
expenditures the previous week were reported.
2. 'Mean per trip' a Memn per week* divided by 2.2 trips per week. the sample average.
3. 'Pct.Zeroes' -% of dock owners who spent nothing on a particular item on a particular trip.
4. (*)=Les than 0.5%.
105a
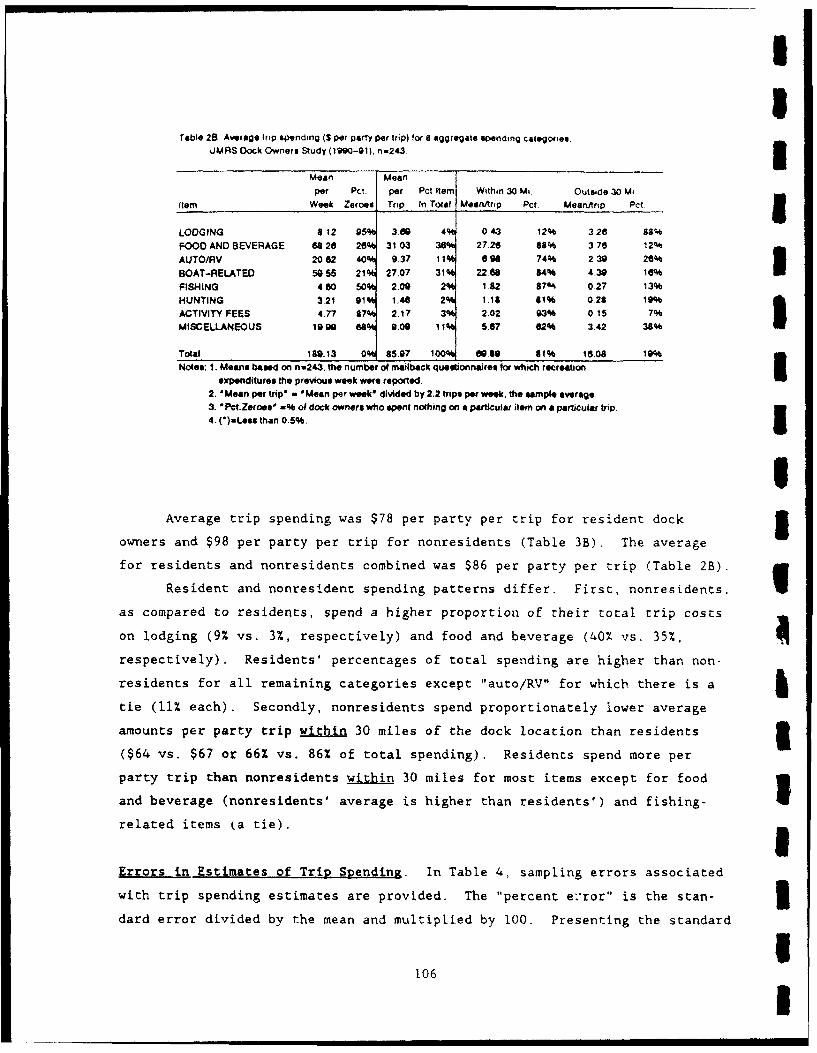
UI
Table 28 Average trip spending (S per party per trip) for 8 aggregate spending categories.UMAS Dock Owners Study (1000-91). n=243 .
Mean Meanper Pci per Pct Item Within 30 Mi. Outside 30 Mi
Item Week Zeroes Trip In Total Mean/trip Pct. Mean/trip Pct ILODGING 8612 95% 369 4% 043 12% 326 8814%FOOD AND BEVERAGE 6826 26% 31.03 36% 2726 8% 376 12%AUTO/RV 20.62 40 937 11 A 6894 74% 239 26%BOAT-RELATED 50.55 21 27.07 31% 22,68 84% 430 16%FISHING 4.60 50 2.09 2% 1.82 87% 027 13%HUNTING 3.21 91 1.44 2% 1.11 61% 028 10%ACTIVITY FEES 4.77 871 2.17 3% 2.02 93% 0.15 7% IMISCELLANEOUS 19.90 6841 9.09 11% 567 62% 3.42 38%
Total 189.13 0% 85.97 100% 8099 81% 16.08 19%Notes: 1. Moans based on n-243. the number of mailback questionnaires for which recreation
expenditures the previous week were reported.2. 'Mean per trip' - 'Mean pqr week' divided by 2.2 tripe per week. the sample average.3. "Pet.Zeroes' -% of dock owners who spent nothing on a particular item on a particular trip.
4. (*)-Le" than 0.5%. IU
Average trip spending was $78 per party per trip for resident dock 3owners and $98 per party per trip for nonresidents (Table 3B). The average
for residents and nonresidents combined was $86 per party per trip (Table 2B).
Resident and nonresident spending patterns differ. First, nonresidents.
as compared to residents, spend a higher proportion of their total trip costs aon lodging (9% vs. 3%, respectively) and food and beverage (40% vs. 35%,
respectively). Residents' percentages of total spending are higher than non-
residents for all remaining categories except "auto/RV" for which there is a &tie (11% each). Secondly, nonresidents spend proportionately lower average
amounts per party trip within 30 miles of the dock location than residents £($64 vs. $67 or 66% vs. 86% of total spending). Residents spend more per
party trip than nonresidents within 30 miles for most items except for food
and beverage (nonresidents' average is higher than residents') and fishing- Irelated items (a tie).
Errors in Estimates of Trip Spending. In Table 4, sampling errors associated
with trip spending estimates are provided. The "percent e:ror" is the stan- 3dard error divided by the mean and multiplied by 100. Presenting the standard
1106
I

II
m Table 3A. Average trip spending ($ per party per trip) by dock owner residents
and nonresidents for 33 detailed mailback expenditure items, n=229.
I Residents (n=1 69) Nonresidents (n=60)
Item In 30 Out 30 Total In 30 Out 30 Total
Hotel 0.29 1.33 1.62 0.30 8.71 9.01
Campgrounds 0.23 0.26 0.49 0.00 0.00 0.00
Grocery 12.25 1.05 13.30 17.10 3.86 20.97
Restaurant 12.30 1.88 14.17 15.72 2.61 18.33
SAuto/RV gas & oil 4.12 1.06 5.18 4.39 5.14 9.52
Auto/RV rental 0.65 0.27 0.91 0.00 0.00 0.00
AutolRV repairs 0.30 0.00 0.30 0.00 0.16 0.16
m AutolRV tires 1.60 0.11 1.70 1.18 0.00 1.18
Auto/RV parts 0.55 0.00 0.55 0.06 0.00 0.06
AutoiRV parking & tolls 0.08 0.06 0.14 0.00 0.00 0.00
Boat gas & oil 7.78 1.23 9.00 8.30 1.27 9.57
Boat rental 0.00 0.00 0.00 0.00 7.58 7.58
Boat repairs 10.58 0.00 10.58 6.00 1.10 7.10
Boat parts 2.75 1.26 4.01 1.25 0.00 1.25Boat launch fees 0.31 0.16 0.48 0.00 0.08 0.08
Boat fares 0.00 0.00 0.00 0.04 0.00 0.04
SFishing license 0.12 0.00 0.12 0.00 0.00 0.00
Boat charter fee 0.00 0.00 0.00 0.00 0.00 0.00
Fishing bait 1.70 0.30 2.00 1.82 0.24 2.05
Hunting license 0.10 0.00 0.10 0.00 0.00 0.00
Ammunition 1.54 0.04 1.58 0.19 1.00 1.19
Equipment rental 0.36 0.14 0.50 0.45 0.00 0.45
Guide fees 0.00 0.00 0.00 0.00 0.00 0.00
Spectator sports fee 0.19 0.07 0.26 0.11 0.00 0.11
Tourist attraction fee 0.10 0.00 0.10 0.00 0.00 0.00
Other recreation fee 1.30 0.00 1.30 0.68 0.00 0.68
Film purchasing 1.01 0.19 1.20 1.00 0.26 1.26
Film developing 0.58 0.19 0.76 0.46 041 0.88
Souvenirs 0.48 0.27 0.75 0.54 0.34 0.88
Footwear 1.63 0.15 1.78 0.00 0.00 0.00
Men's clothing 1.45 0.14 1.59 1.30 0.01 1.31
Women's clothing 1.00 0.21 1.21 0.76 0.00 0.76
All Other 1.69 0.63 2.32 2.69 0.38 3.07
Notes: 1. Sample size is slightly smaller here than in Table 2 due to missing
identification numbers.
2. "In 30 /Out 30" = Within and outside 30 miles of the dock.
3. (*)=Less than 0.5%.
II
107
£
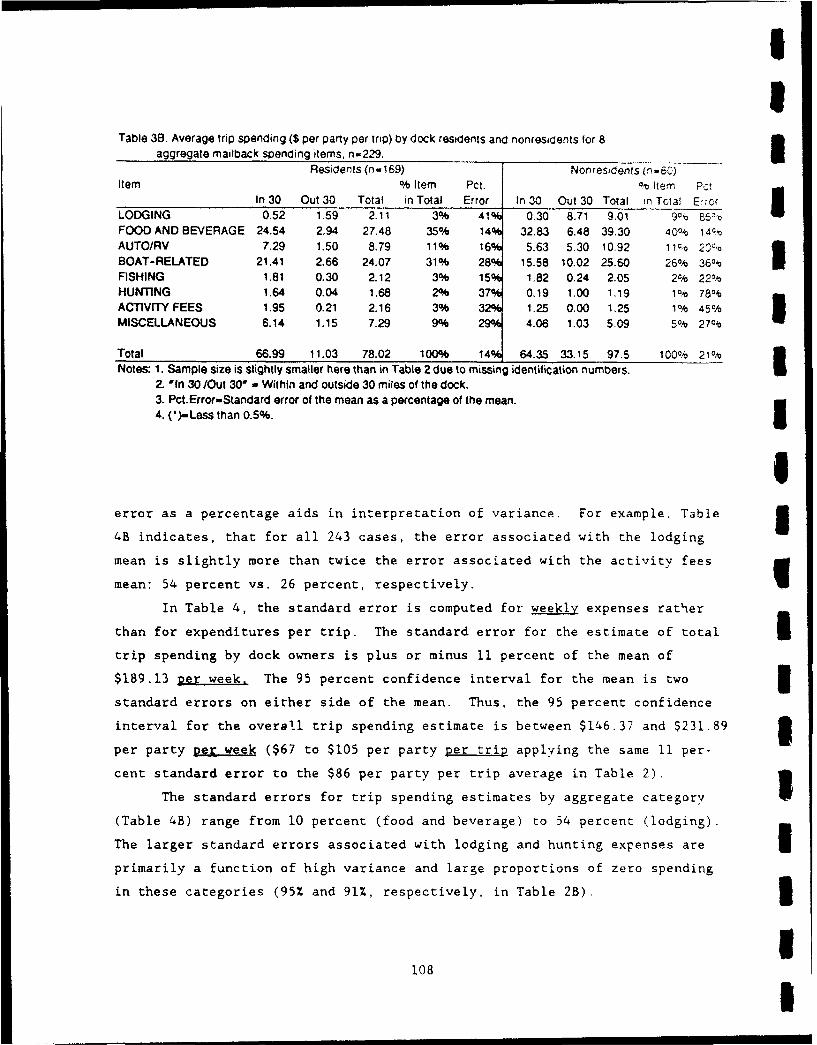
II mI
!
Table 3B. Average trip spending ($ per party per trip) by dock residents and nonresidents for 8aggregate mailback spending items, n-229. __
Residents (n= 169) Nonresidents (n-S6C)Item % Item Pct. % Item Pcr
In 30 Out 30 Total in Total Error In 30 Out 30 Total in Total EorrLODGING 0.52 1.59 2-11 3% 41% 0.30 8.71 9.01 9% 65% ;FOOD AND BEVERAGE 24.54 2.94 27.48 35% 14% 32.83 6.48 39.30 40% 14%AUTO/RV 7.29 1.50 8.79 11% 16% 5.63 5.30 10.92 11 qo 2^4010BOAT-RELATED 21.41 2.66 24.07 31% 28% 15.58 10.02 25.60 26% 36%0,FISHING 1.81 0.30 2.12 3% 15% 1.82 0.24 2.05 2% 22%HUNTING 1.64 0.04 1.68 2% 37% 0.19 1,00 1.19 1% 78%ACTIVI'Y FEES 1.95 0.21 2.16 3% 32% 1.25 0.00 1.25 1%/0 45%
MISCELLANEOUS 6.14 1.15 7.29 9% 29% 4.06 1.03 5,09 5% 27%
Total 66.99 11.03 78.02 100% 14N 64.35 33.15 97.5 100% 21% •Notes: 1. Sample size is slightly smaller here than in Table 2 due to missing identification numbers.
2. 'In 30/Out 30' - Within and outside 30 miles of the dock.3. Pct.Error=Standard error of the mean as a percentage of the mean.
4. (*)-Less than 0.5%. IS
error as a percentage aids in interpretation of variance. For example, Table 54B indicates, that for all 243 cases, the error associated with the lodging
mean is slightly more than twice the error associated with the activity fees
mean: 54 percent vs. 26 percent, respectively. 1In Table 4, the standard error is computed for weekly expenses rather
than for expenditures per trip. The standard error for the estimate of total 3trip spending by dock owners is plus or minus 11 percent of the mean of
$189.13 per week, The 95 percent confidence interval for the mean is two 5standard errors on either side of the mean. Thus, the 95 percent confidence
interval for the overall trip spending estimate is between $146.37 and $231.89 3per party per week ($67 to $105 per party per trip applying the same 11 per-
cent standard error to the $86 per party per trip average in Table 2).
The standard errors for trip spending estimates by aggregate category
(Table 4B) range from 10 percent (food and beverage) to 54 percent (lodging).
The larger standard errors associated with lodging and hunting expenses are Iprimarily a function of high variance and large proportions of zero spending
in these categories (95% and 91%, respectively, in Table 2B). 31
108 I

I
3 Table 4A. Selected error statistics for trip spending per week by detailed expenditureitems, UMRS Dock Owners Study (1990-91), n=243.
3 Total Std. Pct. 95% Cl
Item Mean Error Error Mean- Mean+
3 Hotel 7.37 4.31 58% (0) 15.99Campgrounds 0.75 0.38 51% (0) 1.51Grocery 34.84 3.13 9% 28.58 41.10Restaurant 33.42 4.33 13% 24.76 42.08AutolRV gas & oil 14.23 1.44 10% 11.35 17.11Auto/RV rental 1.40 1.04 74% (0) 3.48
Auto/RV repairs 0.65 0.20 31% 0.25 1.05Auto/RV tires 3.25 1.35 42% 0.55 5.95AutoIRV parts 0.87 0.63 72% (0) 2.13Auto/RV parking & tolls 0.22 0.10 45% 0.02 0.42Boat gas & oil 20.38 2.41 12% 15.56 25.20Boat rental 4.12 4.12 100% (0) 12.36
Boat repairs 26.87 10.25 38% 6.37 47.37Boat parts 7.38 3.74 51% (0) 14.86Boat launch fees 0.78 0.32 41% 0.14 1.42
Boat fares 0.02 0.02 100% (0) 0.06Fishing license 0.19 0.17 89% (0) 0.53Boat charter fee 0.00 0.00 0% 0.00 0.00Fishing bait 4.42 0.52 12% 3.38 5.46Hunting license 0.15 0.11 73% (0) 0.37
iAmmunition 3.06 1.07 35%/' 0.92 5.20
equipment rental 1.14 0.52 46% 0.10 2.18Guide fees 0.00 0.00 0% 0.00 0.00Spectator sports fee 0.46 0.21 46% 0.04 0.88Tourist attraction fee 0.16 0.14 88% (0) 0.44
Other recreation fee 3.02 1.11 37% 0.80 5.24film purchasing 2.68 0.50 19% 1.68 3.68Film developing 1.76 0.47 27% 0.82 2.70Souvenirs 1.62 0.86 53% (0) 3.34Footwear 2.96 0.94 32% 1.08 4.84I Men's clothing 3.49 1.23 35% 1.03 5.95Women's clothing 2.28 1.14 50% 0.00 4,56All Other 5.21 1.78 34% 1.65 8.77
Total 189.13 21.38 11% 146.37 231.89Pct.Error: Standard error of the mean as a percentage of the mean. Two standard
errors yield a 95% confidence interval (CI).
1 109
I

Table 48. Selected error statistics for trip spending per week by 8 aggregate spending
categories, UMRS Dock Owners Study (1990-91), n=243. 3Total Std. Pct. 95% Cl
Item Mean Error Error Mean- Mean+ 3LODGING 8.12 4.36 54% (0) 16.84
FOOD AND BEVERAGE 68.26 6.70 10% 54.86 81.66
AUTO/RV 20.62 2.45 12% 15.72 25.52BOAT-RELATED 59.55 12.66 21% 34.23 84.87FISHING 4.60 0.56 12% 3.48 5.72
HUNTING 3.21 1.08 34% 1.05 5.37 IACTIVITY FEES 4.77 1.25 26% 2.27 7.27
MISCELLANEOUS 19.99 5.12 26% 9.75 30.23 3TOTAL 189.13 21.38 11% 146.37 231.89
Pct. Error: Standard error of the mean as a percentage of the mean. Two standard
errors yield a 95% confidence interval (CI).
SDurable Goods Spending 5
Within the past year, dock owners spent an average of $668 per household
on durable items that were used for recreation trips associated with the use
of their docks (Table 5). Ninety percent (90%) of this amount, $602 per
household per year, was spent on boat-related durable goods. The remainder of
the $668 in durable goods spending was distributed as: $38 (6%) for fishing
gear, $17 (3%) for hunting gear, $7 (1%) for camping equipment, and $4 (0.6%)
for all other durable recreation equipment. Seventy-four percent (74%), $496 3per household per year, was spent on motorized boats alone.
Durable Goods Spendini by Item. The sample of 150 dock owners reported
2,890 durable items used for recreation purposes (Table 5). About 26% of the 3items reported were major durable goods such as boats, engines, trailers,
rifles, and tents. Among these major durable items, thirteen percent (13%)
were boats and engines alone. Seven percent (7%) were rifles and shotguns
used in hunting; 4 percent were tents.
Seventy-four percent (74%) of all durable goods were smaller items like
fishing tackle, hunting equipment, and boating and camping accessories.
III• I
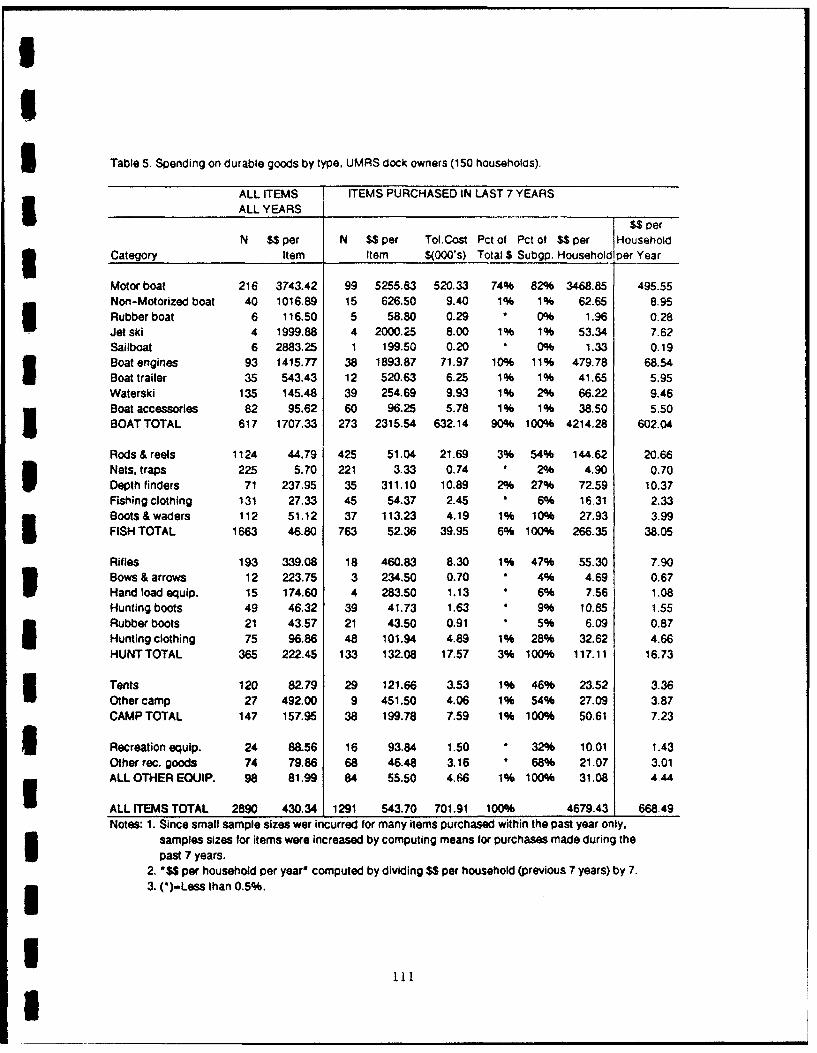
5!
5 Table S. Spending on durable goods by type, UMRS dock owners (150 households).
ALL ITEMS ITEMS PURCHASED IN LAST 7 YEARS5 ALL YEARSS1$$ per
N $$ per N $$ per Tol.Cost Pct of Pct of $S per HHousehold3 Category Item Item $(000's) Total $ Subgp. Householdlper Year
Motor boat 216 3743.42 99 5255.83 520.33 74% 82% 3468.85 495.55Non-Motorized boat 40 1016.89 15 626.50 9.40 1% 1% 62.65 8.95Rubberboat 6 116.50 5 58.80 0.29 " 0% 1.96 0.28Jet ski 4 1999.88 4 2000.25 8.00 1% 1% 53.34 7.62Sailboat 6 2883.25 1 199.50 0.20 * 0% 1.33 0.19Boat engines 93 1415.77 38 1893.87 71.97 10% 11% 479.78 68.54Boat trailer 35 543.43 12 520.63 6.25 1% 1% 41.65 5.95Waterski 135 145.48 39 254.69 9.93 1% 2% 66.22 9.46Boat accessories 82 95.62 60 96.25 5.78 1% 1% 38.50 5.50BOATTOTAL 617 1707.33 273 2315.54 632.14 90% 100% 4214.28 602.04
Rods & reels 1124 44.79 425 51,04 21.69 3% 54% 144.62 20.66Nets, traps 225 5.70 221 3.33 0.74 * 2% 4.90 0.70
Depth finders 71 237.95 35 311.10 10.89 2% 27% 72.59 10.37Fishing clothing 131 27.33 45 54.37 2.45 6% 16.31 2.33Boots&waders 112 51.12 37 113.23 4.19 1% 10% 27.93 3.99FISH TOTAL 1663 46.80 763 52.36 39.95 6% 100% 266.35 38.05
Rifles 193 339.08 18 460.83 8.30 1% 47% 55.30 7.90Bows & arrows 12 223.75 3 234.50 0.70 " 4% 4.69 0.67Hand load equip. 15 174.60 4 283.50 1.13 * 6% 7.56 1.08Hunting boots 49 46.32 39 41.73 1.63 " 9% 10.85 1.55Rubber boots 21 43.57 21 43.50 0.91 " 5% 6.09 0.87
Hunting clothing 75 96.86 48 101.94 4.89 1% 28% 32.62 4.66HUNT TOTAL 365 222.45 133 132.08 17.57 3% 100% 117.11 16.73
Tents 120 82.79 29 121.66 3.53 1% 46% 23.52 3.36Other camp 27 492.00 9 451.50 4.06 1% 54% 27.09 3.87CAMP TOTAL 147 157.95 38 199.78 7.59 1% 100% 50.61 7.23
URecreation equip. 24 88.56 16 93.84 1.50 ° 32% 10.01 1.43Other rec. goods 74 79.86 68 46.48 3.16 * 68% 21.07 3.01ALL OTHER EOUIP. 98 81.99 84 55.50 4,66 1% 100% 31.08 4.44
ALL ITEMS TOTAL 2890 430.34 1291 543.70 701.91 100% 4679.43 668.49Notes: 1. Since small sample sizes wer incurred for many items purchased within the past year only,
samples sizes for items were increased by computing means for purchases made during thepast 7 years.
2. "$$ per household per yearo computed by dividing $$ per household (previous 7 years) by 7.3. (I)-Less than 0.5%.
I[111
I

!I
Fishing rods and reels, other fishing gear, and waterskis constizuied the i
majority of smaller items.
Of the 2,890 items purchased by dock owners, 20 percent w.;re purchased
within the past year and 45 percent were purchased within the previous seven
years. These 20 percent and 45 percent figures are somewhat conservative
since items purchased in multiple years were excluded from the one-year and 3seven-year analyses but not from the analysis for all items in all years (this
data editing step was discussed in the PROCEDURES section above). 3Durable Goods Spending by Location and Residence. About 75 percent of the 3$668 in durable goods spending, $502 per household per year, took place within
the UMRS (Table 6). UMRS residents accounted for approximately two-thirds
(66%) of all durable goods spending anywhere and 77 percent of such spending
within the UMRS. Residents were more likely to buy durable goods within the
region than nonresidents. Eighty-nine percent (89%) of resident durable goods Ispending occurred within the UMRS as compared to 54% for nonresidents.
Of the $502 per household spent within the UMRS region, $454 was spent i
on boats and boating equipment, $28 on fishing gear, $14 on hunting gear, $4
on camping equipment, and $3 on other recreation durable goods. Across dura- -ble items, with the exception of hunting gear, three fourths or more of all
spending occurred within the UMRS. Fifty-seven percent (57%) of all spending
on hunting gear occurred within the UMRS (Table 6).
Residents spent an average of $600 per household per year on durable
goods, whereas nonresidents spent an average of $781 (Table 6). Both resident 3and nonresident durable goods spending was dominated by boats and boat-related
durable goods (88% and 92% of total durable goods spending, respectively). 3However, within individual items and categories, there were some noticeable
differences. For example, residents spent more per household than nonresi- 3dents on boat engines ($87 vs. $21), water skis ($12 vs. $2), fishing gear
($40 vs. $32), and hunting gear ($20 vs. $9). Nonresidents spent more on the
average than residents for all types of boats and camping equipment other than
tents.
New vs. Used Durable Goods Spendinu. In the past seven years, dock owners
purchased 979 new and 312 used recreation durable goods used in conjunction
with their boat docks (Table 7). Sixty-four percent (64%) of total spending
i112
I

!I
I Table 6. Durable spending by place of purchase and place of residence ($ per household per year),UMRS Dock owners.
ALL SPENDING WITHIN UMRSPct. Pct.
UMRS Non- Resident UMRS Non- ResidentCategory Resident resident Total to Total Resident resident Total to Total3 n-108 n=42 n-150 n-108 n-42 n=150
Motor boat 413.20 643.02 495.55 62% 370.67 367.51 369.79 72%Non-Motorized boat 2.58 25.34 8.95 21% 1.79 1.02 1.57 82%Rubber boat 0.40 0.00 0.28 100% 0.40 0.00 0.28 100%Jet Ski 3.97 17.01 7.62 382 3.97 10.54 5.81 49%Sailboat 0.26 0.00 0.19 1000%Boat engines 87.12 20.75 68.54 92% 77.67 14.29 59.92 93%Boat trailer 4.76 9.01 5.95 58% 4.56 3.74 4.33 76%Waterski 12.34 2.06 9.46 94% 10.36 1.29 7-82 95%Boat accessories 5.65 5.10 5.50 74% 5.54 0.20 4.05 99%BOAT TOTAL 530.28 722.29 602.04 65% 475.22 398.59 453.76 75%
Rods & reels 22.19 16.73 20.66 771 20.32 7.48 16.73 87%Nets, traps 0.92 0.13 0.70 95% 0.67 0.09 0.50 95%Depth finders 10.74 9.42 10.37 75% 5.46 2.57 4.65 85%Fishing clothing 1.70 3.94 2.33 53% 1.63 3.50 2.16 54%Boc0s & wadern 4.88 1.68 3.99 88% 4.43 1.11 3.50 91%FISH TOTAL 40.43 31.90 38.05 77% 32.51 14.75 27.54 85%
Rifles 10.31 1.70 7.90 94% 10.31 1.70 7.90 94%Bows & arrows 0.21 1.84 0.67 23% 0.21 1.19 0.49 31%Hand load equip. 1.51 0.00 08 100% 1.31 0.00 0.94 100%Hunting boots 1.70 1.16 1.55 79% 0.97 0.00 0.70 100%Rubber boots 0.67 1.38 0,87 56% 0.51 0.20 0.42 87%Hunting clothing 5.15 3.40 4.66 80/ 4.86 0.68 3.69 95%HUNT TOTAL 19.55 9.48 16.73 84% 18.17 3.77 14.14 93%
Tents 4.23 1.12 3.36 91% 4.23 0.10 3.08 99%Other camp 0.19 13.33 3.87 4% 0.19 1.28 0.49 28%CAMP TOTAL 4,42 14.45 7.23 44% 4.42 1.38 3.57 89%
I Recreation equip. 0.89 2.84 1.43 45% 0.89 0.26 0.71 90%Other rec. goods 4.18 0.00 3.01 100/ 3.72 0.00 2.68 100%
* ALL OTHER EQUIP. 5.07 2.84 4.44 82% 4.61 0.26 3.39 98%
ALL ITEMS TOTAL 599.75 780.96 668.49 66% 534.93 418.75 502.40 77%
1UU
i 113
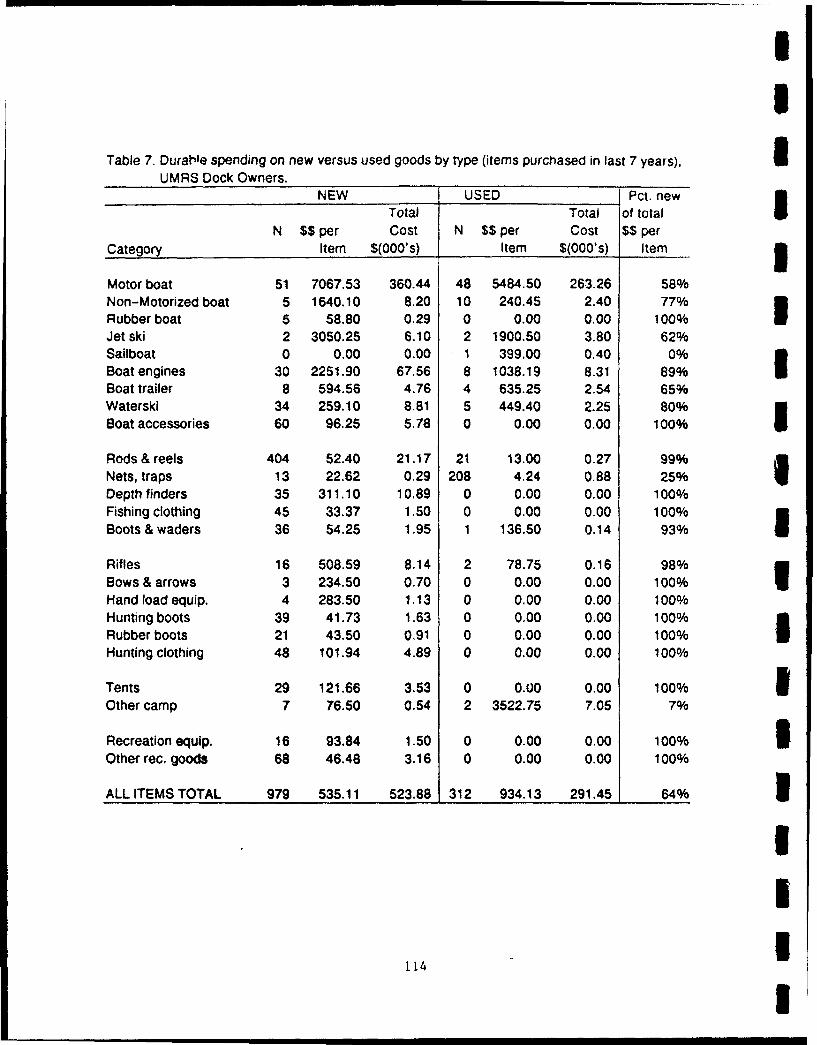
!!
Table 7. Durable spending on new versus used goods by type (items purchased in last 7 years), IUMRS Dock Owners.
NEW USED Pct. newTotal Total of total I
N $$ per Cost N $$ per Cost $$ perCategory Item $(000's) Item $(000's) Item 3Motor boat 51 7067.53 360.44 48 5484.50 263.26 58%Non-Motorized boat 5 1640.10 8.20 10 240.45 2.40 77%Rubber boat 5 58.80 0.29 0 0.00 0.00 100% 1Jet ski 2 3050.25 6.10 2 1900.50 3.80 62%Sailboat 0 0.00 0.00 1 399.00 0.40 0%Boat engines 30 2251.90 67.56 8 1038.19 8.31 89% 3Boat trailer 8 594.56 4.76 4 635.25 2.54 65%Waterski 34 259.10 8.81 5 449.40 2.25 80%Boat accessories 60 96.25 5.78 0 0.00 0.00 100%
Rods & reels 404 52.40 21.17 21 13.00 0.27 99%Nets, traps 13 22.62 0.29 208 4.24 0.88 25% IDepth finders 35 311.10 10.89 0 0.00 0.00 100%Fishing clothing 45 33.37 1.50 0 0.00 0.00 100%Boots & waders 36 54.25 1.95 1 136.50 0.14 93%
Rifles 16 508.59 8.14 2 78.75 0.16 98%Bows & arrows 3 234.50 0.70 0 0.00 0.00 100% IHand load equip. 4 283.50 1.13 0 0.00 0,00 100%Hunting boots 39 41.73 1.63 0 0.00 0.00 100%Rubber boots 21 43.50 0.91 0 0.00 0.00 100% IHunting clothing 48 101.94 4.89 0 0.00 0.00 100%
Tents 29 121.66 3.53 0 0.00 0.00 100% 1Other camp 7 76.50 0.54 2 3522.75 7.05 7%
Recreation equip. 16 93.84 1.50 0 0.00 0.00 100% 1Other rec. goods 68 46.48 3.16 0 0.00 0.00 100%
ALLITEMS TOTAL 979 535.11 523.88 312 934.13 291.45 64% 1
II
I[4 1I

Iwas for new durable items, The used mean jf $ý-, per item iS r-as er ante
new mean of $535 per item because the total av.erage cost per item reflects
both the cost and the kinds of items purchased. Higher cozt items, such as
boats and trailers, are more likely to be purchased used. Thus, the new dura-
ble goods average is based on a larger number and higher proportion of less
I expensive items than the used durable goods average. The percentages of new
to total spending, which are based on total expenditures and not averages, are
3 the most useful figures for IMPLAN analysis.
Samrling Errors. Sampling errors for estimates of durable goods expenses are
slightly higher than for trip spending. These larger errors are due to
smaller sample sizes and greater variance for the cost of durable items. As a
3 percentage of the mean, standard errors for durable goods are 13 percent over-
all and 15 percent for spending within the UMRS (Table 8).
3 Errors are larger for some individual item categories (i.e., hunting,
camping, and other). However, since hunting, camping, and other durable goods
5 account for such a small proportion of dock owner spending, these errors are
not too disturbing. The estimates for boating and fishing equipment are much
more accurate.
The error associated with nonresident spending is moderately large
(20%). Future sampling schemes may have to increase the number of dock owners
slightly to portray more accurately the amount spent by nonresidents.
Table 8. Sampling errors for durable goods spending estimates, UMRS dock owners.
95% ConfidenceMean Std.Err Interval Pct Error
TOTALS$$ Per Household/Year 668.49 83.75 500.99 835.99 13%$$ in Local Area 502.40 76.84 348.72 656.08 15%
I BY MAJOR DURABLE ITEM CATEGORIES
Boat 602.04 79.91 442.22 761.86 13%Fish 38.05 5.89 26.27 49.83 15%
Hunt 16.73 6.00 4.73 28.73 36%
Camp 7.23 3.68 (0) 14.59 51%3 Other 4.44 2.51 (0) 9.46 57%
BY SEGMENTS
Residents 599.75 98.51 402.73 796.77 16%
Nonresidents 780.96 159.17 462.62 1099.30 20%
Note: Pct Error=Standard error of the mean as a percentage of the mean
3 Two standard errors yields a 95% confidence interval
115
3

Other Annual Expenses. 'UMRS dock ow'rers - ;e ,.sc:>. r 3year in other annual expenses (Table 9). ohe o-i-nai cost of buI ding the
dock accounts for the preponderance (68%) of these expenses, fo1lowed b; dock
maintenance (18%), and boat insurance 8%). F'ishing and/or hurting licenses
account for less than 2 percent of other annual expenses. I
Table 9. Other annual or durable goods expenses by type, UMRS dock owners.
Category $$ per Tol.Cost Pct of Pct ofHousehold $(000's) Total Subgp.
Hunt/Fish. License (MN) 4.51 0.68 16%Hunt/Fish. License (WI) 6.75 1.01 1% 24%Hunt/Fish. License 0IL) 5.74 0.86 21%oHunt/Fish. License (IA) 9.83 1.47 1% 36%
Hunt/Fish. License (MO) 0.80 0.12 • 3%ALL Hunt/FISH. LICENSE 27.63 4.14 2% 100% ICost of dock 797.03 119.55 68%Dock Maintenance 216.04 32.41 18%Boat Registration 14.43 2.16 1%Boat Storage 25.30 3.80 2%Boat Insurance 96.99 14.55 8%
TOTAL 1177.42 176.61 100%Notes: (*)=Less than 0.5%. 3The annual costs of boat storage and boat insurance can be directly B
bridged to IMPLAN sectors in order to derive corresponding economic impacts.
The cost of dock construction and maintenance could also be subjected to
input-output analysis, but first more must be known about the economic sectors 5affected by these activities as well as the length of time since construction.
Fishing and hunting licenses and boat registration fees are generally consid- -ered transfer payments to other units of government, Therefore, licenses and
fees are excluded from local impact analyses unless some portion is returned
from the state to local units of government and that portion can be
ascertained. 3
II
116 I

Ig RESULTS. MARINA SL'P? RENTERS
Sample Sizes and Response Rates
The study plan called for the o':her contractor to attempt 9 follow-up
phone calls to the 150 households that constituted the panel of marina slip
3 renters along the UMRS. Thus, the total number of possible telephone contacts
was 1350 (Table 10). Of these attempted contacts, 331 telephone calls (25%)
3 resulted in slip renters reporting at least one recreation trip the previous
week. Three hundred ninety-two (392) mailback questionnaires were received
from this group, yielding an apparently nonsensical response rate of
119 percent.
There are two likely explanations for why more mailback questionnaires
than telephone contacts pertained to slip renters who reported recreation
trips and expenditures the previous week. First, although 1,350 telephone
I contacts were possible, not all contacts were actually made. However, since
all were sent mailback questionnaires prior to the attempted contacts, a num-
5 ber of those who could not be contacted apparently returned their question-
naires anyway. Secondly, there were a number of telephone contacts (28) for
whom no trips were reported but who returned a mailback questionnaire contain-
ing trip expenditures for the previous week.
The 395 mailback trip expenditure questionnaires comprise the sample
size upon which subsequent marina user trip spending profiles are constructed.
A few of these 395 questionnaires reported having engaged in at least one
3 recreation trip the previous week, but reported no trip expenditures. These
questionnaires with recreation trips but no reported expenditures were
3 included in the analysis.
Trip Expenditures
Marina slip renters averaged $132 in variable trip costs per party per
trip (Table 11). Eighty-five percent (85%) of these expenditures were made
3 within 30 miles of the marina slip.
3 Proportion of Zero Spending. In most of the categories (Table 11), less than
10 percent of the sample of marina users reported any spending. Categories
3 with relatively high percentages of non-zero spending by marina users were:
117
I

Table 10. Marina user sample sizes and response rates (UMRS Istudy, 1990-91).
IA. # Households 150B. # Calls/Household 9 (1) 3C. Total Possible Contacts (A. X B.) 1350D. Actual # Completed Contacts 1082 3E. # Recreation Trips the Previous Week 33.1F. % "Hits" (E./D.) 30 % (2)I
G. # Mailback Q'naires Rc'd. 748 (3)H. # Mailback Q'naires Reporting a I
Recreation Trip the Previous Week 395
1. Mailback Response Rate (H./E.) 119 % (4)
Notes:(1) 3 calls each in spring, summer, fall(2) % of contacts for which there was a recreation trip the previous week I(3) Exceeds # of recreation trips the previous week (part E.) because, part
way through the study, households were asked to return their maiibackexpenditure questionnaires even if they incurred no recreation trips the Iprevious week
(4) Exceeds 100% because part H. exceeds part E. There are two likely £explanations. First, many could not be contacted by phone. Since theywere sent mailback questionnaires prior to the attempted contacts (partD.), a number of those who could not be contacted returned their Iquestionnaires anyway. Secondly, there were 28 telephone contacts forwhom no trips were reported but who returned a mailback questionnairecontaining trip expenditures for the previous week.I
I
I
I

5 Table I1 A, Average trip spending [$ per party per trip) for 33 detailed maitbacit expenditure items,.UMRS Marina U)sers Study (119W-91), n-326.
Mean Meanof Pct. per PcI itemn Within 30 Mi, Outside 30 Mi
Item Week Zeroes Trip In Total Mean/trip Pct, Mean/trip PctLODGINGHotel 5.16 93% 2 72 2% 1.09 40% 1 62 80%Campgrounds 0.41 0.22 0.22 100% 000 0%
FOCO AND BEVERAGEGrocery 37.39 23% 19.66 is 16.63 851% 305 15%restaurant 38.89 35% 19.42 15% 15.97 82% 3.44 18%
AUTOIRVAutoIRV gas &oil 12.20 30 8.42 5% 4898 76% 1.54 24%
Ato/RV rentla 0.01 100 0.01 0.01 100% 0.00 0%5uoR repairs 1.38 94 0.72 1% 0.69 96% 0.03 4%AutoIRV tire* 0.27 0.14 0.14 100% 0.00 0%Auto/RV parts 0.02 97 0.43 0.38 89% 0.05 11%AutoItRV parkting &tolls 0.05 971 0.03 * 003 100% 0.00 0%U BOAT-FIELATEIDBoat gas &oil 44.6a 26% 23.52 18% 19.44 83% 4.08 17%Boat rental 0.01 100% 0.01 001 100% 0ý00 0%
Bote pairs 38.7S 820o 20.30 16% 19.59 96% 0.80 4%BoIart Pat 23.18 73A 12.19 9% 10 14 83% 205S 17%Boat launch fees 21.08 a8 11.09 8% 10.50 95% 0ý50 5%Boat fares 0.15 10 0.084 0.00 0% 0.08 100%3 FISHINGFishing license 0.28 98 0.14 * 0.12 88% 0.02 12%Boat charter fee 0.00 100% 0.00 0O 0.00 0% 0.00 0%Fishing bait 1.13 83% 0.50 0.58 95% 0.03 5%U HUNTINGHunting license 0.04 100 0.02 * 0.00 0% 0.02 100%Ammunition 0.31 99% 0.16 * 0.15 90% 0,02 10%3 ACTIVITY FEESequipment rental 0.56 98% 0.29 0 22 73% 0 08 27%Guide fees 0.00 100% 0.00 0% 0.00 0% 000 0%Spectator sports fee 0.52 97% 0.27 008 31% 0 19 89%ITourist attraction too 0.87 97% 0.35 * 0.15 43% 0.20 57%Other recreation fee 1.65 96% 0.87 1% n146 53% 0.41 47%
MISCELLANEOUSfilm purchasing 2.34 77% 1.23 1 1.06 88% 0.17 14%SFilm developing 1.69 85 0.89 1 CA 0.77 87% 0.12 13%Souvenirs 2.73 95 1.44 1% 1,27 88% 0.17 12%Footwear 2.31 95 1,22 1% 1.13 93% 0.08 7%
Mnsclotftirg 3.04 93 1.60 1% 1.37 88% 0.23 14%W omen's clothing 4.72 92 2.48 2ý 1.S9 76% 0-59 24%All Other 5.57 91 2.93 2 2.83 97% 0.10 3%
Notes: 1. Means based 0n n-395. the number of mailback questionnaireis for which recreationI expenditures 1?' 9 previous week were reported.2. 'Mean per trip' - 'Mean per week' divided by 1.9 trips per week. the sample average.3. 'Pct.Zefoes' -% of dock owners who spent nothing on a particular item on a particular trip.3 4. (*)-Less thani 0. 5%.
119

II
Table 118. Average trip spending ($ per party peý trip) for 8 aggregate sWending categories.
UMRS Marina Users Sludy (1990-91). n.395. _I
Mean Mean
per Pct. per Pct item Within 30 Mi Outside 30 Mt
Item Week Zeroes Trip In Total Mean/trip Pct. Meanftrip Pctt
LODGING 5.57 93% 293 2% 1 31 45% 1 62 55%
FOOD AND BEVERAGE 74.28 16 3.00 30% 3281 83% 649 17%
AUTOIRV 14.71 301 7.74 6% 6.13 79% 1681 21%
BOAT-RELATEO 127.83 17 67.28 51 s1eT.6 899% 7 61 11%
FISHING 1.39 82 0.73 1% 0.68 94% 005 6%
HUNTING 0.35 0.18 0.15 60% 004 20%
ACTIVITY FEES 3.40 go 1.70 1% 09.2 51% 087 49%
MISCELLANEOUS 22.40 68% 11,79 10.32 8U% 1 47 12% ,
Total 249.94 0 131.55 100 111,78 85% 197' 15% INotes: 1, Means basled on 11u395, the number of mailb41ck questionnaires for which recreation
expenditures the previous week were reported.
2. *Mean per trip' I Mean per week' divided by 1.9 trips per week. the sample average-
3. *Pct.Zeroea =% of dock owners who spent nothing on a paxticular item on a partlicular trip.
4. (')-Leos than 0.5%.
Igrocery (23%), restaurant (35%), auto/RV gas and oil (30%), boat gas and oil
(26%), boat parts (73%), and film purchasing (77%). I
TriR Siending by Category. The $132 per trip average for marina users across U33 specific trip expense categories and 8 aggregate groupings displayed an
uneven distributic-. The largest proportion of spending was for boat-related Iitems (51%) and food and beverages (30%), followed by miscellaneous (9%).
auto/RV (6%), and lodging (2%). Activity fees. fishing expenses, and hunting 1expenses each comprised one percent or less of the total jTable 11B). Spend-
ing profiles in 33 detailed trip spending categories are reported in 3Table 11A.
Resident vs. Nonresident Spending. Average trip spending was $127 per party Iper trip for resident marina users and $143 per party per trip for nonresi-
dents (Table 12B). The average for residents and nonresidents combined was I$132 per party per trip (Table 12B).
Resident and nonresident spending patterns differ slightly. First, 3residents spend a higher proportion of their total trip costs than
1
120
I

Table 12A. Average trip spending ($ per party per trip) by marina user residentsand nonresidents for 33 detailed mailback expenditure items, n=391.3 Residents (n=270) Nonresidents (n=121)
Item In 30 Out 30 Total In 30 Out 30 TotalHotel 0.34 1.81 2.14 2.83 1.26 4.09Campgrounds 0.04 0.00 0.04 0.61 0.00 0.61Grocery 15.72 3.66 19.38 18.70 1.78 20.48Restaurant 13.52 3.68 17.20 20.95 3.02 23.97Auto/RV gas & oil 3.72 1.17 4.89 7.42 2.30 9.72Auto/RV rental 0.00 0.00 0.00 0.02 0.00 0.02Auto/RV repairs 0.92 0,01 0.93 0.20 0.04 0.24Auto/RV tires 0.19 0.00 0.19 0.03 0.00 0.03Auto/RV parts 0.45 0.07 0.52 0.25 0.00 0.25Auto/RV parking & tolls 0.02 0.00 0.02 0.04 0.01 0.05Boat gas & oil 20.19 4.48 24.67 17.64 3.32 20.96Boat rental 0.01 0.00 0.01 0.00 0.00 0.00Boat repairs 18.67 1.17 19.84 22.31 0.00 22.31Boat parts 12.98 2.33 15.31 4.11 1.52 5.63Boat launch fees 7.72 0.51 8.23 17.05 0.81 17.86Boat fares 0.00 0.00 0.00 0.00 0.26 0.26Fishing license 0.07 0.03 0.10 0.24 0.00 0.24Boat charter fee 0.00 0.00 0.00 0.00 0.00 0.00Fishing bait 0.52 0.05 0.57 0.66 0.00 0.66Hunting license 0.00 0.00 0.00 0.00 0.06 0.06Ammunition 0.22 0.00 0.22 0.00 0.05 0.05Equipment rental 0.21 0.09 0.30 0.24 0.05 0.29Guide fees 0.00 0.00 0.00 0.00 0.00 0.00Spectator sports fee C.07 0.01 0.08 0.13 0.59 0.72Tourist attraction fee 0.10 0.19 0.29 0.27 0.23 0.49Other recreation fee 0.54 0.51 1.05 0.32 0.18 0.49Film purchasing 1.19 0.19 1.38 0.74 0.15 0.89Film developing 0.94 0.14 1.07 0.44 0.07 0.51Souvenirs 1.24 0.14 1.38 1.37 0.22 1.59Footwear 1.22 0.00 1.22 0.99 0.26 1.25Men's clothing 1.68 0,11 1.79 0.72 0.00 0.72Women's clothing 1.95 0.64 2.59 1.82 0.17 1.99All Other 1.43 0.11 1.53 6.06 0.10 6.16Notes: 1. Sample size is slightly smaller here than in Table 11 due to missing
identification numbers.2. "In 30 /Out 30' = Within and outside 30 miles of the marina slip.3. (*)=Less than 0.5%.
5 121
3

Table 12B. Average trip spending ($ per oarty per trip) by marina user residents and nonresidents Ifor 8 aggregate mailback spending items, n-391.
Residents (n=270) Nonres4dents (n- 121)
Item o/0 Item Pct. % Item Pct.
In 30 Out 30 Total in Total Error In 30 Out 30 Total in Total Error
LODGING 0.38 1.81 2.18 2% 31% 3.44 1.26 4.70 3%No 30%
FOOD AND BEVERAGE 29.24 7.34 36.58 29% 70 39.65 4.80 44.45 3100 9%
AUTO/RV 5.29 1.25 6.54 5% 18 7.96 2.35 10.31 7% 9%
BOAT-RELATED 59.58 8.48 68.06 54% 1 1 61.12 5.91 67.02 47% 16%
FISHING 0.59 0.08 0.67 1% 23 0.89 0.00 0.89 1% 21%
HUNTING 0.22 0.00 0.22 * 0.00 0.12 0.12 100% UACTIVITY FEES 0.91 0.81 1.72 1% 354 0.95 1.05 2.00 1% 41%
MISCELLANEOUS 8.22 1.22 9.44 7% 16% 6.06 0.88 6.94 5% 28%
Total 105.85 21.08 126.94 100% 8% 126.13 16.46 142.59 100% 9% 1Notes: 1. Sample size is slightly smaller here than in Table 11 due to missing identification numbers.
2. In 30 lOut 30' - Within and outside 30 miles of the marina slip.
3. Pct.Error-Standard error of the mean as a percentage of the mean.
4. (')-Less than 0.5%. I
nonresidents on boat-related items (54% vs. 47%, respectively) and food and £beverage (40% vs. 35%, respectively). Second, resident average spending per
party trip is higher than nonresidents for miscellaneous items ($9.44 vs.
$6.94). Third, nonresident average spending is noticeably higher than resi-
dent average spending for lodging ($4.70 vs. $2.18), food and beverage ($44.45 Uvs. $36.58) and auto/RV ($10.31 vs. $6.54), Boat-related averages are nearly
the same for both residents and nonresidents.
There is little difference proportionately between resident and non- 5resident spending within 30 miles of the marina slip location. The percentage
of nonresident spending locally is slightly greater than resident spending £locally (88% vs. 83%, respectively in Table 12B). Nonresident average spend-
ing per party trip within 30 miles exceed similar resident spending for most
items except hunting-related and miscellaneous items.
Errors in Estimates of Trip Spending. In Table 13, sampling errors associated Iwith trip spending estimates are reported. The standard error is computed for
weekly expen•ses rather than for expenditures per trip. The standard error for 3the estimate of total trip spending by marina users is plus or minus 6 percent
1122 U
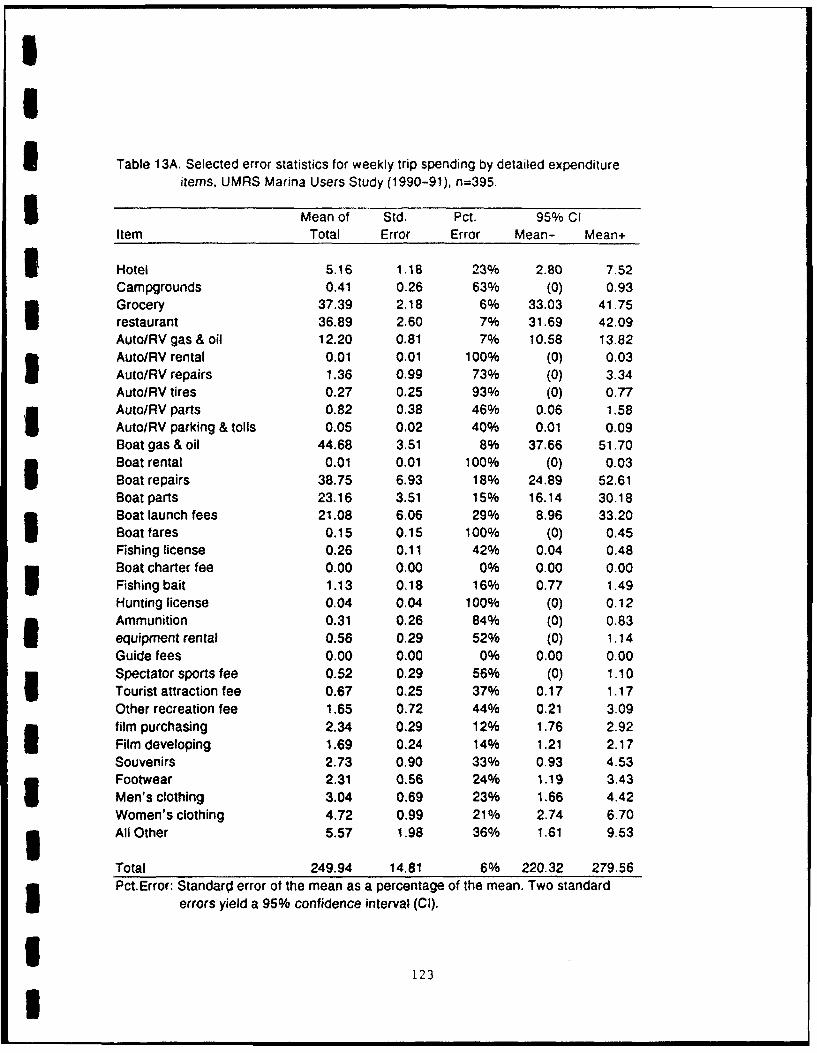
!I
I Table 13A. Selected error statistics for weekly trip spending by detailed expenditureitems, UMRS Marina Users Study (1990-91), n=395.
3Mean of Std. Pct. 95% Cl
Item Total Error Error Mean- Mean+
I Hotel 5.16 1.18 23% 2.80 7.52Campgrounds 0.41 0.26 63% (0) 0.93Grocery 37.39 2.18 6% 33.03 41.75restaurant 36.89 2.60 7% 31.69 42.09Auto/RV gas & oil 12.20 0.81 7% 10.58 13.82Auto/RV rental 0.01 0.01 100% (0) 0.03
Auto/RV repairs 1.36 0.99 73% (0) 3.34Auto/RV tires 0.27 0.25 93% (0) 0.77Auto/RV parts 0.82 0.38 46% 0.06 1.58Auto/RV parking & tolls 0.05 0.02 40% 0.01 0.09Boat gas & oil 44.68 3.51 8% 37.66 51.70Boat rental 0.01 0.01 100% (0) 0.03Boat repairs 38.75 6.93 18% 24.89 52.61Boat parts 23.16 3.51 15% 16.14 30.18Boat launch fees 21.08 6.06 29% 8.96 33.20Boat fares 0.15 0.15 100% (0) 0.45Fishing license 0.26 0.11 42% 0.04 0.48Boat charter fee 0.00 0.00 0% 0.00 0.00
Fishing bait 1.13 0.18 16% 0.77 1.49Hunting license 0.04 0.04 100% (0) 0.12Ammunition 0.31 0,26 84% (0) 0.83equipment rental 0.56 0.29 52% (0) 1.14Guide fees 0.00 0.00 0% 0.00 0.00
Spectator sports fee 0.52 0.29 56% (0) 1.10Tourist attraction fee 0.67 0.25 37% 0.17 1.17Other recreation fee 1.65 0.72 44% 0.21 3.09film purchasing 2.34 0.29 12% 1.76 2.92
Film developing 1.69 0.24 14% 1.21 2.17Souvenirs 2.73 0.90 33% 0.93 4.53Footwear 2.31 0.56 24% 1.19 3.43
Men's clothing 3.04 0.69 23% 1.66 4.42Women's clothing 4.72 0.99 21%o 2.74 6.703 All Other 5.57 1.98 36% 1.61 9.53
Total 249.94 14.81 60% 220.32 279.56Pct. Error: Standard error of the mean as a percentage of the mean. Two standard
errors yield a 95% confidence interval (Cl).
II23
I

II
Table 13B. Selected error statistics for weekly trip spending by 8 aggregate spending
categories, UMRS Marina Users Study (1990-91), n=395. £Mean of Std. Pct. 95% Cl
Item Total Error Error Mean- Mean+
LODGING 5.57 1.21 22% 3.15 7.99
FOOD AND BEVERAGE 74.28 4.16 6% 65.96 82.60
AUTOIRV 14.71 1.63 11% 11.45 17.97
BOAT-RELATED 127.83 11.38 9% 105.07 150.59
FISHING 1.39 0.23 17% 0.93 1.85HUNTING 0.35 0.26 74% (0) 0.87ACTIVITY FEES 3.40 0.91 27% 1.58 5.22MISCELLANEOUS 22.40 2.28 10% 17.84 26.96 3Total 249.94 14.81 6% 220.32 279.56Pct. Error: Standard error of the mean as a percentage of the mean. Two standard
errors yield a 95% confidence interval (CI).
Iof the mean of $249.94 per week. The 95 percent confidence interval for the 3mean is two standard errors on either side of the mean. Thus, the 95 percent
confidence interval for the overall trip spending estimate is between $220.32
and $279.56 per party per week ($116 to $148 per party per trip applying the
same 6 percent standard error to the $132 per party per trip average in
Table liB).
The standard errors for trip spending estimates by aggregate category
(Table 13B) range from 6 percent (food and beverage) to 74 percent (hunting). 5The error associated with the activity fees mean is three times the error
associated with the boating mean: 27 percent vs. 9 percent, respectively. The 3larger standard error associated with hunting expenses is primarily a function
of the high variance and large proportion of zero spending (99%) in this cate- 3gory (Table liB).
Durable Goods Spending IWithin the past year, marina slip renters spent an average of $3,087 per
household on durable items that were used for recreation trips associated with 3mthe use of their marina slips (Table 14). Nearly all of this amount (99%) was
spent on boat-related durable goods. Ninety-five percent (95%) of the total 3124 I
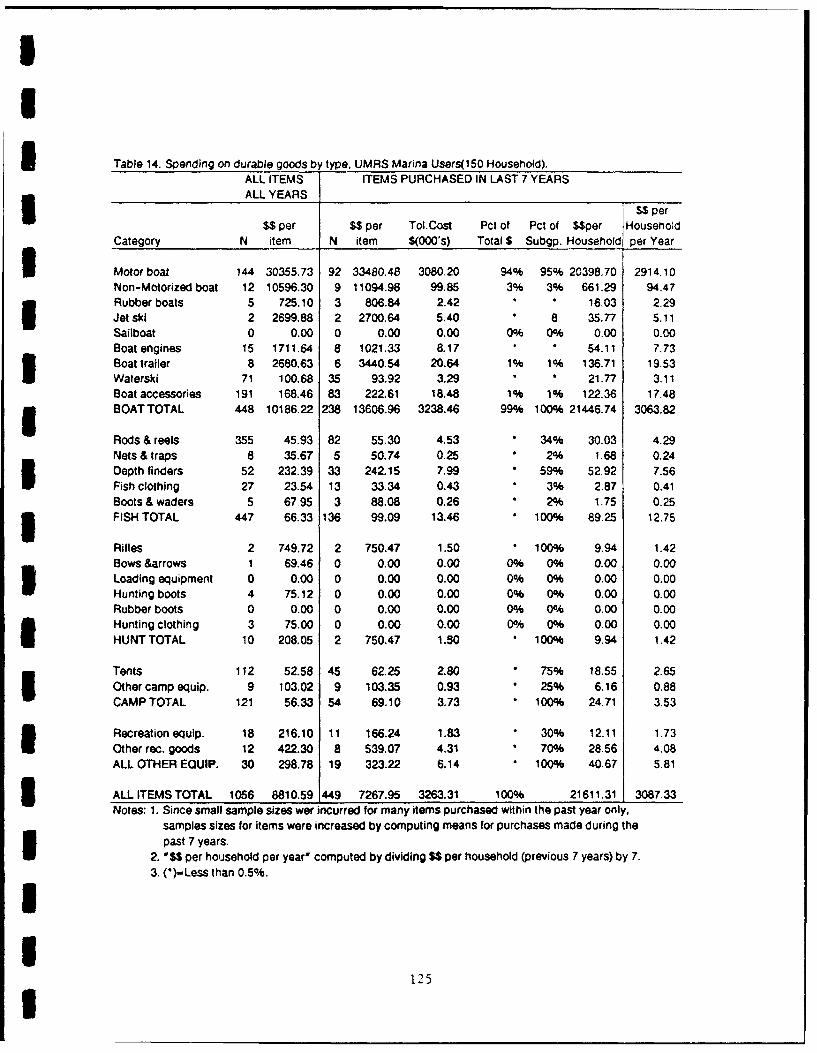
IU
I Table 14. Spending on durable goods by type, UMRS Marina Users(150 Household).ALL ITEMS ITEMS PURCHASED IN LAST 7 YEARSALL YEARS
S $ per
$, per $$ per Tol.Cost Pct of Pct of S$per HouseholdCategory N item N item $(000's) Total S Subgp. Householdl per Year
I Motor boat 144 30355.73 92 33480.48 3080.20 94% 95% 20398.70 2914.10Non-Motorized boat 12 10596.30 9 11094.98 99.85 3% 3% 661.29 94.47Rubber boats 5 725.10 3 806.84 2.42 * 16.03 2.29Jet ski 2 2699.88 2 2700.64 5.40 * 8 35.77 5.11Sailboat 0 0.00 0 0.00 0.00 0% 0% 0.00 0.00Boat engines 15 1711,64 8 1021.33 8.17 1 54.11 7,73
Boat trailer 8 2680.63 6 3440.54 20.64 1% 1% 136.71 19,53Waterski 71 100.68 35 93.92 3129 21.77 3.11Boat accessories 191 168.46 83 222.61 18.48 1% 1% 122.36 17.48
SBOATTOTAL 448 10186.22 238 13606.96 3238.46 99% 100% 21446.74 3063.82
Rods & reels 355 45.93 82 55.30 4.53 34% 30.03 4.29Nets & traps 8 35.67 5 50.74 0.25 " 2% 1.68 0.24Depth finders 52 232.39 33 242.15 7.99 " 59% 52.92 7.56Fish clothing 27 23.54 13 33.34 0.43 * 3% 2.87 0.41Boots & waders 5 6795 3 88.08 0.26 2% 1.75 0.253 FISH TOTAL 447 66.33 136 99.09 13.46 * 100% 89.25 12.75
Rifles 2 749.72 2 750.47 1.50 . 100% 9.94 1.42Bows &arrows 1 69.46 0 0.00 0.00 0% 0% 0.00 0.00Loading equipment 0 0.00 0 0.00 0.00 0% 0% 0.00 0.00Hunting boots 4 75.12 0 0.00 0.00 0% 0% 0.00 0.00Rubber boots 0 0.00 0 0.00 0.00 0% 0% 0.00 0.00Hunting clothing 3 75.00 0 0.00 0.00 0% 0% 0.00 0.00HUNT TOTAL 10 208.05 2 750.47 1.50 " 100% 9.94 1.42
Tents 112 52.58 45 62.25 2.80 75% 18.55 2.65Othercamp equip. 9 103.02 9 103.35 0.93 25% 6.16 0.88CAMP TOTAL 121 56.33 54 69.10 3.73 * 100% 24.71 3.53
Recreation equip. 18 216.10 11 166.24 1.83 30% 12,11 1.73Other rec. goods 12 422.30 8 539.07 4.31 * 70% 28.56 4.08ALL OTHER EQUIP. 30 298.78 19 323.22 6.14 100% 40,67 5.81
3 ALL ITEMS TOTAL 1056 8810.59 449 7267.95 3263.31 100% 21611.31 3087.33Notes: 1. Since small sample sizes wer incurred for many items purchased within the past year only,
samples sizes for items were increased by computing means for purchases made during thepast 7 years.
2. 0$$ per household per yearff computed by dividing $$ per household (previous 7 years) by 7.3. (*)-Less than 0.5%.
II
125I

Iamount was spent on one category :notori:~J . : h ,lc . t ýIfle Cemaig Uone percent in durable goods spending was spen: oan fishing gear,
Durable Goods Spending by Item. The sample of 151 marina users reported buy-
ing 1,056 durable items used for recreation purposes (Table 14). About 28% of
the items reported were major durable goods such as boats, engines, trailers, 3rifles, and tents. Seventeen percent (17%) of these major durable goods were
boats and engines alone. Eleven percent (11%) were tents. 3Seventy-two percent (72%) of all durable goods were smaller items like
fishing tackle, hunting equipment, and boating and camping accessories. Fish- 3ing rods and reels, other fishing gear, boating accessories, and waterskis
constituted the majority of smaller items.
Of the 1,056 items purchased by marina users, 12 percent were purchased Iwithin the past year and 43 percent were purchased within the previous seven
years. The 12 percent and 43 percent figures are somewhat conservative since Iitems purchased in multiple years were excluded from the one-year and seven-
year analyses but not from the analysis for all items in all years (this data
editing step was discussed in the PROCEDURES section above)
Durable Goods Spending by Location and Residence. About 35 percent of the
$3,087 in durable goods spending, $1,077 per household per year, took place
within the UMRS (Table 15). UMRS residents accounted for approximately two-
thirds (65%) of all durable goods spending anywhere and 76 percent of such
spending within the UMRS. Residents were more likely to buy durable goods
within the region than nonresidents. Forty percent (40%) of resident durable
goods spending occurred within the UMRS as compared to 24% for nonrer:dents. 3Of the $1,077 per household spent within the UMRS region, $1,069 was spent on
boats and boating equipment, $4 on fishing gear, less than $1 on camping 3equipment, and $4 on other recreation durable goods. Across durable items,
with the exception of other recreation durable goods, 35 percent or less of 3all spending occurred within the UMRS. Fifty-one percent (51%) of all spend-
ing on other recreation durable goods occurred within the UMRS (Table 15).
Residents spent an average of $600 per household per year on durable
goods, whereas nonresidents spent an average of $781 (Table 15). Both resi-
dent and nonresident durable goods spending was dominated by boats and boat- 3related durable goods (99% of total durable goods spending for each).
1126
U

UI
Table 15. Durable spending by place of purchase and place of residence (S per household per year),UMRS Marina users.
ALL SPENDING WITHIN UMRSPct. Pct.' UMRS Non- Resident UMRS Non- Resident
Category Resident resident Total to Total Resident resident Total to Totaln-104 n-47 n-151 n-104 n=47 n=151
Motor boat 2726.92 3328.27 2914.10 64% 1136.81 797.87 1031.32 76%Non-Motorized boat 137.16 0.00 94.47 100% 22.39 0.00 15.42 100%Rubberboat 0.55 6.16 2.29 16% 0.00 1.90 0.59 0%Jet ski 0.14 16.11 5.11 0.14 0.00 0.09 100o/oSailboat 0.00 0.00 0.00 0.00 0.00 0.00 0%Boat engines 6.70 10.03 7.73 5.63 0.00 3.88 100%Boat trailer 14.00 31.76 19.53 49 8.51 30.40 15.32 38%Waterski 2.58 4.29 3.11 57% 1.41 1.82 1.54 63%Boat accessories 20.26 11.34 17.48 80% 1.62 0.00 1.12 100%BOAT TOTAL 2908.31 3407.96 3063.82 65% 1176.51 831.99 1069.28 76%
Rods &reels 4.94 2.84 4.29 79, 1.88 0.00 1.29 100%Nets, traps 0.02 0.71 0.24 6% 0.02 0.03 0.02 60%Depth finders 5.87 11.29 7.56 53% 1.50 3.50 2.12 49%Fishing clothing 0.56 0.09 0.41 93% 0.56 0.00 0.38 100%oiBoots & waders 0.36 0.00 0.25 100% 0.36 0.00 0.25 100%
FISH TOTAL 11.75 14.93 12.75 64 4.32 353 4.06 73%
Rifles 2.06 0.00 1.42 100% 0.00 0.00 0.00 0%Bows & arrows 0.00 0.00 0.00 0% 0.00 0.00 0.00 0%Hand load equip. 0.00 0.00 0.00 0% 0.00 0.00 0 00 0%0Hunting boots 0.00 0.00 0.00 0% 0.00 0.00 0.00 0%Rubber boots 0.00 0.00 0.00 0% 0.00 0.00 0.00 0%Hunting clothing 0.00 0.00 0.00 0% 0.00 0.00 0.00 0%HUNT TOTAL 2.06 0.00 1.42 100% 0.00 0.00 0.00 0%
Tents 3.34 1.12 2.65 87% 0.36 0.00 0.25 100%Other camp 1.22 0.12 0.88 96% 0.39 0.00 0.27 100%CAMP TOTAL 4.56 1.24 3.53 89% 0.75 0.00 0.52 100%
SRecreation equip. 2.27 0.55 1.73 90/ 2.14 0.00 1.48 100%Other rec. goods 2.61 7.35 4.08 44 2.61 0.85 2.06 87%ALL OTHER EQUIP. 4.88 7.90 5.81 58% 4.75 0.85 3.54 93%
ALL ITEMS TOTAL 2931.56 3432.03 3087.33 65% 1186.33 836.37 1077.40 76%
1U
S~127
I
IHowever, within individual items and categories, there were some noticeabie 3differences. For example, resident marina users spent ;nore per household than
nonresidents on non-motorized boats ($137 vs. $0), hunting gear ý$2 vs. $0),
and camping equipment ($5 vs. $1). Nonresidents spent more on the average
than residents for rubber boats, jet skis. boat trailers, and depth finders.
New vs. Used Durable Goods Spending. In the past seven years, marina slip
renters purchased 387 new and 62 used recreation durable goods used in con- 3junction with their marina slips (Table 16). Fifty percent (50%) of total
spending was for new durable items. 3The used mean of $26,371 per item is larger than the new mean of $4,168
per item because the total average cost per item reflects both the cost and Uthe kinds of items purchased. Higher cost items, such as boats and trailers,
are more likely to be purchased used. Thus, the new durable goods average is
based on a larger number and higher proportion of less expensive items than Uthe used durable goods average. The percentages of new to total spending,
which are based on total expenditures and not averages, are the most useful i
figures for IMPLAN analysis.
SamRling Errors. For marina users, sampling errors for estimates of durable
expenses are slightly higher than for trip spending. These larger errors are Udue to smaller sample sizes and greater variance for the cost of durable
items. As a percentage of the mean, standard errors for durable goods are U12 percent overall and 23 percent for spending within the UMRS (Table 17).
Errors are larger for some individual item categories (i.e., hunting,
camping, and other). However, since hunting, camping, and other durable goods 5account for such a small proportion of marina user spending, these errors are
not too disturbing. The estimates for boating and fishing equipment are much 3more accurate.
Errors associated with spending inside the UMRS and total nonresident
spending are moderately large (23% each). Future sampling schemes may have to
increase the number of marina users slightly to portray more accurately the 3amount spent by nonresidents and the amount spent within the local area.
Other Annual Expenses. UMRS marina slip renters averaged $2,255 per household £per year in other annual expenses (Table 18). The one-time slip purchase fee
1128
U

IU
Table 16. Durable spending on new versus used goods by type (items purchased in last 7 years),UMRS Marina Users.
NEW USED Pct. newTotal Total of total
N $$ per Cost N $$ per Cost $$ per3 Category Item $(000's) Item $(000's) Item
Motor boat 43 34402.40 1479.30 49 32365.34 1585.90 48%Non-Motorized boat 4 13249,50 53.00 5 9371.36 46.86 53%Rubber boat 2 512.65 1.03 1 1395.24 1.40 42%Jet ski 2 2700.64 5.40 0 0.00 0.00 100%Sailboat 0 0.00 0.00 0 0.00 0.00 0%Boat engines 7 1057.00 7.40 1 771.61 0.77 91%Boat trailer 6 3440.54 20.64 0 0.00 0.00 100%Waterski 35 86.98 3.04 0 0.00 0.00 100%Boat accessories 82 224.42 18.40 1 73.99 0.07 100%
Rods & reels 82 55.30 4.53 0 0.00 0.00 100%Nets, traps 5 50.74 0.25 0 0.00 0.00 100%Depth finders 33 242.15 7.99 0 0.00 0.00 100%Fishing clothing 13 33.34 0.43 0 0.00 0.00 100%Boots & waders 3 88.08 0.26 0 0.00 0.00 100%o
Rifles 2 750.47 1.50 0 0.00 0.00 100%Bows & arrows 0 0.00 0.00 0 0.00 0.00 0%Hand load equip. 0 0.00 0.00 0 0.00 0.00 0%Hunting boots 0 0.00 0.00 0 0.00 0.00 0%Rubber boots 0 0.00 0.00 0 0.00 0.00 0%Hunting clothing 0 0.00 0.00 0 0.00 0.00 0%
3 Tents 40 69.23 2.77 5 6.34 0.03 99%Other camp 9 103.35 0.93 0 0.00 0.00 100%
Recreation equip. 11 166.24 1.83 0 0.00 0.00 100%Other rec. goods 8 539.07 4.31 0 0.00 0.00 100%
3 ALL ITEMS TOTAL 387 4168.05 1613.03 62 26371.47 1635.03 50%
!II
i 129

I
Table 17. Sampling errors for durable goods spending estimates, UMRS marina users.
95% ConfidenceMean Std.Err Interval Pct Error
TOTALS
$$ Per Household/Year 3087.33 375.52 2336.29 3838.37 12%$$ in Local Area 1077.40 252.82 571.76 1583.04 23%0/
BY MAJOR DURABLE ITEM CATEGORIESBoat 3063.83 375.29 2313.25 3814.41 12%Fish 12.74 2.04 8.66 16.82 16%Hunt 1.42 1.42 (0) 4.26 100%oCamp 3.53 1.44 0.65 6.41 41% 3Other 5.82 2.83 0.06 11.58 49%
BY SEGMENTS 3Residents 2931.56 416.23 2099.10 3764.02 14%Nonresidents 3432.03 784.34 1863.35 5000.71 23%Note: Pct Error=Standard error of the mean as a percentage of the mean3
Two standard errors yields a 95% confidence interval
(37%) and annual slip fees (35%) account for the preponderance of these 3expenses, followed by boat insurance (16%), and boat storage (9%). Fishing
and/or hunting licenses account for less than I percent of other annual 3expenses.
The annual costs of slip fees (private), boat storage, and boat insur-
ance can be directly bridged to IMPLAN sectors in order to derive correspond-
ing economic impacts. The cost of slip improvements and maintenance could
also be subjected to input-output analysis, but first more must be known about Uthe economic sectors affected by these activities, the years in which improve-
ments were made, and whether these expenditures were incurred by the boat 3owner or the marina operator. Fishing and hunting licenses and boat registra-
tion fees are generally considered transfer payments to other units of govarn- 3ment. Licenses and fees are excluded from local impact analyses unless some
portion is returned from the state to local units of government and that por- Ution can be ascertained.
DISCUSSION UThis section is divided into four major parts. The first part deals
with the relative similarities and differences between dock owner and marina
1130 I

IU
3 Table 18. Other annual or durable goods expenses by type, UMRS Marina Users.
Category $$ per ToI.Cost Pct of Pct ofHousehold $(000's) Total subgp.
Hunt/Fish. License (MN) 3.07 0.46 36%Hunt/Fish. License (WI) 1.28 0.19 15%Hunt/Fish. License (IL) 1,14 0.17 130/aHunt/Fish, License (IA) 2.54 0.38 30%Hunt/Fish. License (MO) 0.48 0.07 6%ALL HUNT/FISH. LICENSE 8.51 1.29 1000/a
3 Maintenance Cost 30.71 4.64 1 %Boat Registration 23.91 3.61 1%Boat Storage 205.80 31.08 9%Boat Insurance 354.05 53.46 16%Annual Slip Fee 779.77 117.75 35%Slipfeature Installed 28.41 4.29 10/One-time Slip Purchase 823.84 124.40 37%
ALL TOTAL 2255.00 340.51 100%3 (*)=Less than 0.5%.
II3
IIII
I

user spendinz zrottiles In ý,_ c. ...,,
six visitor segment profiles genera-ed in L:n ,'ev=K s •:rziono: e
total CMRS study (Propst et. al .992. S co:1 s I i c rs bet'&e n "e IItwo portions of the total UMRS study are compared. Thirdv :n assessment of
study limitations is provided. The fourth part sumirarizes general applica-
tions of the spending profiles and contains references to the sources where Ispecific applications may be found. IVisitor Segment Profiles
In the developed site portion of the total UARS study, spending profiles 3for six predefined visitor segments were developed:
1. resident, day use boaters2. resident, day use nonboaters I3. resident, overnight visitors4. nonresident, day use boaters5. nonresident, day use nonboaters6. nonresident, overnight visitors
These segments were formed by the combination of factors (i.e., resident or
nonresident, day or overnight visitor, boater or nonboater) which minimized
the variation in expenditures within each segment. Thus, these six segments
are relatively homogeneous with respect to their spending patterns.
Dock owners and marina slip renters constitute two additional visitor
segments assumed to be relatively homogeneous in their expenditures. These 3two segments represent distinct subgroups in terms of recreation use and
expenditure patterns. 3
Dock Owner vs. Marina User Profiles. In terms of variable trip costs, marina
users outspent dock owners substantially on a per trip basis ($132 vs. $86,
dollars per trip, respectively). The same is true for total expenditures as
marina users reported more trips than dock owners (see St. Paul District's 3"Recreation Use and Activity Report" -- 1992). Trip expenditures within the
UMiRS exceeded 80 percent for both groups. 3By expenditure category, the most noticeable difference between the two
groups was that marina users spent, proportionately, 20 percent more on boat- 3related items than dock owners (51% vs. 31% of the overall average, respec-
tively). The sample of dock owners tended to spread this 20% differential
among more items as reflected in slightly higher proportions of dock owner
spending for all remaining categories (Tables 2B and liB). This difference is
132 I

I3 not too surprising given :hat marina .:sersi.> v •pc:.i ; : .,
ation activities directly related to the sse ::*: e>a: -as dock c'i.:vrs
may engage in more of a mix of boating a=d no2-eoatiug recreation activities
Furthermore, marina users have much more expe-s-ve boats than dock owners.
The average boat cost for marina users was more than six t:imes tie average
cost per boat for dock owners ($33,480 vs. $5,2%6. respective'v.%'. Thus, it
reasonable for marina users to spend more money than dock owners on such var-.
Sable trip costs as boat gas and oil, boat repairs, and boat parts. Again.
these conclusions are based on the averages per trip and not on total expendi-
3 tures. However, given the substantially higher number of trips reported bv
marina users than dock owners (see St. Paul District's "Recreation Use and
3 Activity Report" -- 1992), it is logical to conclude that total expenditures
by marina users, for the items directly measured in this study, exceed those
of dock owners.
By place of residence (Tables 3 and 12), nonresident marina users spent
a higher proportion locally than nonresident dock owners (88% vs. 66%, respec-
Stively, spent within 30 miles). Both resident and nonresident marina users
spent 3 to 4 times as much on boat-related items as dock owners. Furthermore,
3 unlike dock owners, a substantial proportion of nonresident marina user spend-
ing on boat-related item occurred locally.
The pattern of dock owners purchasing a wider variety of items but
spending less per comparable item than marina users appears in both trip and
durable goods spending. The extreme difference in average boat cost has
already been highlighted. There were other differences in durable goods
spending patterns as well:
SOn an item-by-item basis,
I. dock owners purchased about three times as many durable items in the pastseven years as compared to marina users (1,291 vs. 449 items,respectively, in Tables 5 and 14).
2. dock owner dominance in the number of durable fishing and hunting itemspurchased was particularly noticeable (Tables 5 and 14).
On a total cost basis,
1. marina users outspent dock owners by a factor of 4.6 ($3,263,000 vs.$702,000), a clear result of much more expensive boats purchased by marinausers (Tables 5 and 14).
Within the UMRS,
1. the average durable spending by marina users ($1,077 per household peryear) was twice that of dock owners ($502 per household per year) (seeTables 6 and 15).
133U

II
2. howveer. %iarina -,sers speýnt ::::~:~.~c ~ ui~tures outside of the UMRS ($. 1- 51 077,.V dock o'. .ers Ipercent (1- $502/$668)) outside the UMh.S Taules 6 and 15).
3. the same pattern of proportionately more average spending outside the LMRS Uthan within by marina users held for both residents and nonresidents(Tables 6 and 15).
For motorized boats only, 31. marina users outspent dock owners outside the UMRS by a ratio of 2 3 to
($1,031 vs. $370 per household per year in Tables 6 and 15),
2. 58 percent of the average amount spent by resident marina users for all
motorized boats was spent outside the UMRS (l-($1,37/$2,727)): the compa-rable ratio for resident dock owners was 10 percent outside the region ti-($371/$413)) (Tables 6 and 15).
Developed Site Segments Compared to Dock Owners. in comparison to the devel- 3oped site study, dock owners' average trip spending is slightly higher ($86
vs. $72 per party per trip). Dock owners deviate from the full sample of 3on-site visitors by spending proportionately less on lodging (4% vs. 12%),
less on auto/RV items (11% vs. 21%), and more on boat-related items (31% vs. I14%).
Dock owners most closely resemble the spending pattern of resident/day
use/boaters (R/D/B) because the proportionate spending on lodging, boating, Ifishing, hunting, activity fees, and miscellaneous items is similar between
the two segments. Also, both segments makt igh proportions (more than 80%)
of trip expenditures locally. Differences include higher average spending by
dock owners than the R/D/B segment ($86 vs. $55 per party trip), a greater 3proportion spent on food and beverages, and a lower proportion spent on auto!
RV items.
Durable goods spending comparisons are more difficult to make as aver-
ages are reported in different units for reasons explained earlier: dollars
spent per party trip for the developed site segments and dollars spent per Ihousehold per year for dock owners and marina users. Therefore, the only
valid comparisons are those made on a proportional basis, in which case dock 3owners closely resemble resident/day use/boaters in percentages spent on boat-
related durable goods, fishing gear, and all other durable goods. Like the 3R/D/B segment, dock owners also spend a large proportion on durable goods in
the UMRS region (75% vs. 76%). 3
I134 I

15 Developed Site Segments Compared to Marina Users. :• :':ai . e'e
oped site study, marina users' average trip s-pnding is nearl, twice as high
($132 vs. $72 per party per trip). Marina users dev'iate from the full sample
of on-site visitors by spending proportionately less on lodging 12% vs. 12%1)
less on auto/RV items (6% vs. 21%), and substantially more on boat related
5 items (51% vs. 14%).
Marina users do not resemble any of the six developed site segments in
Stheir trip spending patterns. A high proportion spent on boat-related items.
coupled with low spending for lodging and auto/RU, sets marina users apart
from the rest.
In terms of durable goods spending, marina users most closely resemble
nonresident/day use/boaters (NR/D/B) in percentages spent on boat-related
durable goods (99% vs. 91%) and all other durable goods (1% vs. 9%). However.
the almost total domination of durable goods spending on boat-related items to
3 the exclusion of all else is a distinguishing feature of the marina user seg-
ment. Marina users spend slightly higher within the UMRS than the NR/D/B
3 segment (35% vs. 25%).
* Sampling Error
Standard errors (expressed as a percentage of the mean) for dock owrners
and marina users are comparable to those resulting from the developed site
portion of this study. They are also within the 20 percent error tolerance
limit recommended in Propst et. al (1992). For the developed site study,
3 sampling errors for total trip and durable goods spending were 8 percent and
14 percent, respectively. For dock owners, the sampling errors were 11 per-
Scent for total trip spending and 13 percent for durable goods spending. The
marina user sample displayed sampling errors of 6 percent (trip) and 12 per-
* cent (durable).
By place of residence for durable goods only, UMRS resident spending is
below the 20 percent error threshold for both dock owners and marina users.
For dock owners, nonresident sampling error for durable goods spending is
20 percent; for nonresident marina users, the error is 23 percent. Thus,
future studies interested in reporting durable goods spending by nonresidents
would need to consider a goal of 200 to 250 dock owner or marina user house-
Sholds or tolerate errors larger than 20 percent.
I135
U

ILimitations 31. The potential for double counting of visitor segments is not known.
The design of the overall U•RS study did noz incorporate a clear means of
determining if those surveyed at developed sites yere also dock ovners or
marina slip renters. This is not so much a problem for estimates of average Itrip and durable goods spending as it is for estimates of total recreation use
and spending.
2. Computing durable goods costs on a yearly basis per household does not
account for the portion of durable expenditures that could be associated
with non-UMRS sites where that equipment may be used.
No attempt was made to apportion the costs of durable goods to the UMRS 3versus other places where they may be used. Allocation schemes based, for
example, on frequency of use on the UMRS versus elsewhere are largely ad hoc 3Without valid methods for allocating durable goods spending across multiple
locations, it must either be assumed that durable goods would not have been 3purchased if docks and marina slips along the UMRS did not exist, or durable
expenses must be expressed as being "associated with trips to the UMRS." The
assumption that durable goods would not have been purchased if opportunities
along the UMRS did not exist is likely not as problematic for the dock ow-ner
or marina user results as it is for the developed site results. There may be 3fewer substitute dock or marina slip opportunities than developed site oppor-
tunities outside the UMRS. 33. The extent to which use of seasonal homes might effect resident and non-
resident spending patterns could not be assessed due to low sample sizes. IDuring the profile interviews, information concerning the ownership and
location of seasonal homes was gathered. Twenty-three (23) of the 42 dock
owner nonresidents owned seasonal homes with docks inside the UMRS. Keeping 3all nonresidents in one segment is valid if one assumes that the amount of
time they spend on a given trip to their seasonal homes is relatively short, 3Under this assumption, the seasonal home is treated like another type of tem-
porary lodging, in which case the spending by these 42 households resembles 3the spending pattern of, say, nonresidents lodging with friends or relatives.
If, however, these households (or some portion) spend a significant Iamount of time at their seasonal homes, then their spending patterns may be
more like those of residents. In this case, some nonresident households
should perhaps be treated as a separate segment for computation of total use 3and spending.
3136 I

IThis separation would not change :he acnrtcounred as ::onresident
spending for economic impact analysis. ALL •2. households would still be
considered nonresidents whose spending injects new dollars into the stud'
region. However, instead of two dock owner segments Iresidents and nonresi-
dents), there would be three: residents. nonresidents who spend like resi-
dents, and other nonresidents. The purpose of further segmentation would be
to create dock owner groups that are relatively homogeneous in their spending
patterns. Increasing homogeneity in spending patterns reduces the variance in
spending estimates.
5 One hundred seven (107) dock owners reported owning a seasonal home.
One hundred three (103) out of 150 dock owners (69%) said they had a dock at
their seasonal home. Since the expenditure items asked dock owners to report
expenses for recreation trips associated with their docks, the finding that
over two-thirds of docks are located at the seasonal residence of dock owners
* makes the seasonal home spending issue an important one to discuss.
For marina users, only 9 out of 151 reported owning a seasonal home.
3 Thus, segmenting marina nonresidents based on seasonal homes usagc is likely
unnecessary. However, if some slip renters use their boats like seasonal
homes for a portion of the year, then the same dichotomy of marina nonresi-
dents may be valid.
The sample of nonresidents in this study is not large enough to provide
valid results with any further splitting into segments. However, future
studies of dock owner or marina user expenditures may want to consider
increasing the sample size of nonresidents sufficiently to allow for further
segmentation.IApplications
For the entire UMRS study, a total of eight visitor spending profiles
are available. The ways in which these profiles may be used to address
management, planning, and policy issues associated with the UMRS are discussed
in detail in the developed site report (Propst et al. 1992). To summarize
from this report, economic impact applications may be divided into those
involving the use of IMPLAN and those which do not.
As to the non-IMPLAN applications, the eight spending profiles may be
3 expanded to the total population of users and then to total recreation expen-
ditures for each segment or in various combinations of segments (e.g., all
5 boater segments). This calculation of total recreation expenditures requires
137I

Ithe multiplication of spending profiles by est:.• or 3case of dock owner and marina user durable goods spending, profiles must be
multiplied by estimates of the total number of households "not party tripsl to
der.ve total expenditure figures.
Total expenditure estimates may be derived not only by visitor segment,
but also for the entire UMRS region, the five subregions described in the
developed areas report, or (with some adjustments), for individual states,
communities, or sites. Total expenditure calculations can readily be carried 3out on spreadsheets to estimate shares of spending by sector or segment.
These total expenditures may be further modified for input into IMPLAN- 3PC, thus permitting more precise estimation of economic effects. IMPLAN
applications are discussed in Stynes and Propst (1992) and illustrated in the
St. Paul District's Economic Impacts report (1992 -- available from St. Paul
District).
IiU
IIIiii
138 I
ILITERATURE CITED - PART TWO
Propst, D. B., D. J. Stynes, and H. Jiao. ,1992), Devel~otferit of .tspending profiles for the Upper Mississippi Ri:er Svstem. Final Reportsubmitted to the Environmental Laboratorv, U.S. Army Engineer WaterwavsExperiment Station, Vicksburg, MS. East Lansing, Mi: Michigan State
University, Department of Park and Recreation Resources.
Stynes, D. J. & D. B. Propst. (1992). MI-REC: Micro-implan Recreation Eco-
nomic Impact Estimation System Users' Manual. Version 1.0, Easr
Lansing, Mi: Department of Park and Recreation Resources, Michigan state
University.
U.S. Army Corps of Engineers. (1989). Sampling plan for the study of theeconomic impacts of recreation in the UMRS. (Final Report). Vicksburg,
MS: USAE Waterways Experiment Station, Resource Analysis Group (Environ-mental Lab.) and East Lansing, MI: Michigan State University. Department
* of Park and Recreation Resources.
1i,I
IlIIii
l139
I

i I
U
IIII
This page intentionally left blank. i
IIIIIIIIII
140i
Related Documents