1 Q3 2019 OESA AUTOMOTIVE SUPPLIER BAROMETER OESA AUTOMOTIVE SUPPLIER BAROMETER Q3 2019 SUPPLY CHAIN & GLOBALIZATION

Welcome message from author
This document is posted to help you gain knowledge. Please leave a comment to let me know what you think about it! Share it to your friends and learn new things together.
Transcript

1Q3 2019 OESA AUTOMOTIVE SUPPLIER BAROMETER
OESA AUTOMOTIVE SUPPLIER BAROMETERQ3 2019
SUPPLY CHAIN & GLOBALIZATION

2Q3 2019 OESA AUTOMOTIVE SUPPLIER BAROMETER
Executive Summary
Supplier Barometer Index (SBI)
SBI Score = 37;
up 2 points from Q2
Despite a modest gain, the outlook
remains deep in negative territory, 13
points below the neutral threshold of
50, remaining near the lowest levels
since 2009. Continued trade tensions
and poor vehicle sales of programs
supplied weigh on the outlook of
supplier executives across firms of all
sizes, with larger suppliers reflecting
greater pessimism.
Trade policy is identified as the
greatest industry threat, followed
by the impact of weak demand of
programs supplied.
Trade policy remains the greatest
industry threat within a dynamic
environment. As progress is being
made on USMCA, threats remain
including proposed 232 tariffs on
autos and auto parts and others.
Net profitability is deteriorating
across a wide range of system
areas and program segments
Growing margins are only reflected
for electrical/electronics systems
that support SUV and truck
programs.
Margins for products that support
car programs show the greatest
level of decline.
Tariffs along with higher labor rates,
material prices and interest rates
are raising supplier cost pressures.
U.S. is the regional leader
in N.A. production with
expected growth in U.S.
and Mexico
For supplier products
produced in North America,
respondents expect growth in
U.S. and Mexico.
Surveyed supplier
import/export balance is
skewed
As a median value, 10% of
current U.S. production is
exported outside of the U.S.
while 30% of material (on a
dollar basis) needed for
production is purchased
outside of the U.S.
Most exports are sent to
Mexico, Canada and Europe.
The rate of exports is
increasing to Mexico and Asia
excluding China.

3Q3 2019 OESA AUTOMOTIVE SUPPLIER BAROMETER
Executive Summary
Most suppliers anticipate supply chain rationalization
14% of respondent companies have a direct supply base that is too
large. Given that, a 13% average reduction in the number of their
direct suppliers is planned by those companies.
17% of respondent companies have an indirect supply base that is
too large with an equal percentage reduction planned for.
One of the primary causal factors in supply chain
concerns is timing issues
Respondents indicate that timing issues and quality concerns
are not only the most likely scenarios that would disrupt their
supply chains but would also have the most severe impact on
their business.
Labor issues and shortages of raw materials and/or
components are also of great concern.
Risks associated with meeting customer production
requirements:
Supply Chain Risks are timing or delay related, quality and a
rising trend of financial distress within the supply base.
Internal production risks are lead times, labor issues and
launch related issues.
The supply base remains healthy on average, yet weak
financial metrics are a key contributor to rising quality issues.
On average, 17% of company suppliers are
directed buy as required by customers, down
from 20% last year
Increasing risk with “watch list” direct suppliers
On average, respondents include 3.4% of their direct suppliers on
internal company “watch lists” up from 3.0% last year.
Quality and financial metrics were the primary reasons for direct
suppliers being added to or continuing on the “watch list”.
Sourcing constraints for electrical/electronics and
powertrain systems are at the highest risk
Survey participants indicate sourcing constraints are impacted
by trade policy uncertainty as customers delay decisions.
Suppliers are cautious to make new capital investments.
4Q3 2019 OESA AUTOMOTIVE SUPPLIER BAROMETER
SUPPLIER OUTLOOK

5Q3 2019 OESA AUTOMOTIVE SUPPLIER BAROMETER
SBI Score = 53; drops 4 points from the Q1 level of 57
Tax reform supports optimism while trade and declining sales drive pessimism
37
20
30
40
50
60
70
80
Ja
n-2
009
Ja
n-2
010
Ja
n-2
011
Ja
n-2
012
Ja
n-2
013
Ja
n-2
014
Ja
n-2
015
Ja
n-2
016
Ja
n-2
017
Ja
n-2
018
Ja
n-2
019
Euro
Crisis
Begins
Japan
Tsunami/
Grexit Crisis
US
Fiscal
Cliff
Lehman
Collapse
0%
20%
40%
60%
80%
Sig
nific
an
tly m
ore
optim
istic
So
mew
ha
t m
ore
optim
istic
Un
ch
ang
ed
So
mew
ha
t m
ore
pessim
istic
Sig
nific
an
tly m
ore
pessim
istic
Q2 2019 Q3 2019
293 responses
Describe the general twelve month outlook for your business. Over the past three months, has your opinion become…?
Current Supplier Outlook (Share of Respondents) Supplier Barometer Index: (SBI and 6m Average)
SBI Score = 37; increased 2 points from Q2, but remains deep in negative territory on
continued trade tensions, poor sales of programs supplied and weakness in the U.S. economy
OESA Supplier Barometer: Q3 2019 Results
US Tax
Reform

6Q3 2019 OESA AUTOMOTIVE SUPPLIER BAROMETER
SBI Score = 53; drops 4 points from the Q1 level of 57
Tax reform supports optimism while trade and declining sales drive pessimism
>$1
billion
7%17%
11%17%
24%
6% 9%14% 14%
6% 8%
33% 33% 42%36%
24%
36% 21%31%
21%23%
50% 44%42% 39%
71%51%
57%
56%
68% 62%
4%4% 7% 6% 7%
0%
10%
20%
30%
40%
50%
60%
70%
80%
90%
100%
Significantly more pessimistic
Somewhat more pessimistic
Unchanged
Somewhat more optimistic
Significantly more optimistic
41.7 43.5 43.8 46.2 33.8 37.2 35.7 39.6 31.6 33.3
<$50
million$50-$150
million
$501 million –
$1 billion
Quarterly
SBI ∆
$151-$500
million
Regardless of revenue size, responses continue to reflect a high level of pessimism;
Smaller firms were slightly more optimistic in comparison to larger size firms, but remain pessimistic on net
OESA Supplier Barometer: Q3 2019 Results By Revenue
Describe the general twelve month outlook for your business. Over the past three months, has your opinion become..?
May July May July May July May July May July

7Q3 2019 OESA AUTOMOTIVE SUPPLIER BAROMETER
SBI Score = 53; drops 4 points from the Q1 level of 57
Tax reform supports optimism while trade and declining sales drive pessimism
0% 10% 20% 30% 40% 50% 60% 70% 80% 90% 100%
Changes in government trade policy
Poor sales of vehicles in programs supplied
Weakness in the U.S. Economy
Implementation of new government regulations
Likelihood of higher interest rates
Inability to address internal labor constraints
Terrorism or some type of international event
Inability to fulfill customer volumes
1=Greatest threat 2 3 4 5 6 7 8 9 10=Smallest threat
Average
Rating
3.4
4.2
4.6
5.4
6.2
6.3
7.2
7.4
2.9
3.9
4.4
5.4
6.0
5.5
6.7
7.4
MayJuly
Trade policy remains the greatest industry threat, at 3.4 in the third quarter, up slightly from Q2
Poor sales of programs supplied was identified as the second largest threat at 4.2
OESA Supplier Barometer: Industry Threats
What are the greatest threats to the industry over the next 12 months?

8Q3 2019 OESA AUTOMOTIVE SUPPLIER BAROMETER
SBI Score = 53; drops 4 points from the Q1 level of 57
Tax reform supports optimism while trade and declining sales drive pessimism
Increased Profitability Unchanged Decreased Profitability
Net profitability is deteriorating across nearly all system areas and program segments;
Net profitability increased for electrical/electronics for SUV and Truck programs
OESA Supplier Barometer: Industry ProfitabilityFor each of the following system areas, please indicate the direction of profit margins.
Powertrain
Chassis
Exterior
Interior/HVAC
Electrical/Electronics
-0.48
-0.46
-0.42
-0.36
-0.21
-0.13
-0.14
-0.16
-0.07
0.07
-0.11
-0.13
-0.16
-0.13
0.09
-0.29
-0.31
-0.27
-0.15
-0.04
Passenger car programs SUV programs Truck programs Overall*Net
Profitability
*Net
Profitability
*Net
Profitability
*Net
Profitability
0% 50% 100% 0% 50% 100% 0% 50% 100% 0% 50% 100%
*Net profitability is a weighted average where increased profitability = 1,
unchanged = 0, and decreased profitability = -1
9Q3 2019 OESA AUTOMOTIVE SUPPLIER BAROMETER
GLOBALIZATION

10Q3 2019 OESA AUTOMOTIVE SUPPLIER BAROMETER
5770
6
6
3724
0%
20%
40%
60%
80%
100%
2019 2018
United States Canada Mexico
For your products produced in North America,
identify the percent manufactured in each of the
following countries.
How do you expect that these percentages will
change over the next 5 years?
8%
35%
10%
44%
36%
74%
35%
23%
14%
13%
0% 20% 40% 60% 80% 100%
United States
Canada
Mexico
Significant Increase Some Increase No Change
Some Decrease Significant Decrease
North American ProductionU.S. leads North American production and is expected to grow along with Mexico

11Q3 2019 OESA AUTOMOTIVE SUPPLIER BAROMETER
SourcingCustomer and supplier sourcing localization continued to increase in 2019
4%
6%
3%
24%
31%
24%
19%
28%
29%
21%
21%
39%
31%
47%
59%
0% 20% 40% 60% 80% 100%
2019
2018
2019
2018
Extensive Increase Moderate Increase Minimal Increase No Change
Minimal Decrease Moderate Decrease Extensive Decrease
... pursue with your suppliers?
... see from your customers?
Over the past year, what level of manufacturing localization activity/effort did you...
12Q3 2019 OESA AUTOMOTIVE SUPPLIER BAROMETER
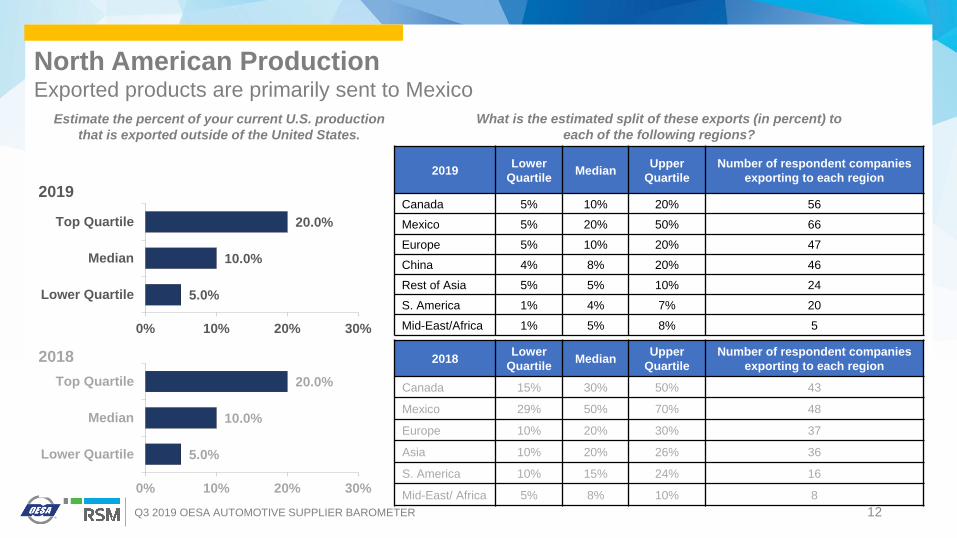
2019Lower
QuartileMedian
Upper
Quartile
Number of respondent companies
exporting to each region
Canada 5% 10% 20% 56
Mexico 5% 20% 50% 66
Europe 5% 10% 20% 47
China 4% 8% 20% 46
Rest of Asia 5% 5% 10% 24
S. America 1% 4% 7% 20
Mid-East/Africa 1% 5% 8% 5
5.0%
10.0%
20.0%
0% 10% 20% 30%
Lower Quartile
Median
Top Quartile
Estimate the percent of your current U.S. production
that is exported outside of the United States.
What is the estimated split of these exports (in percent) to
each of the following regions?
5.0%
10.0%
20.0%
0% 10% 20% 30%
Lower Quartile
Median
Top Quartile
2018
2019
2018Lower
QuartileMedian
Upper
Quartile
Number of respondent companies
exporting to each region
Canada 15% 30% 50% 43
Mexico 29% 50% 70% 48
Europe 10% 20% 30% 37
Asia 10% 20% 26% 36
S. America 10% 15% 24% 16
Mid-East/ Africa 5% 8% 10% 8
North American ProductionExported products are primarily sent to Mexico

13Q3 2019 OESA AUTOMOTIVE SUPPLIER BAROMETER
For each region, please describe the direction of
your export plan over the next 5 years.
36%
17%
15%
15%
8%
7%
58%
72%
80%
85%
74%
89%
92%
6%
11%
18%
0% 20% 40% 60% 80% 100%
Mexico
China
Europe
Rest of Asia
Canada
South America
MidEast/Africa
Increasing No Change Decreasing2018
2019
28%
25%
11%
10%
7%
63%
63%
80%
80%
78%
93%
9%
12%
9%
10%
16%
Mexico
Asia
S. America
Europe
Canada
Mid-East/Africa
What major factors drive this regional export plan?
Canada
• Lower demand for cars is driving lower shipments.
• GM plant shutdowns.
• OEM Reductions.
Mexico
• Focused on utilizing local production for facilities in
Mexico for Mexico market.
• Supplementing Mexico facility with US plant capabilities.
Europe • OEM global vehicles.
China• Moving south.
• New program increasing this customer destination.
Rest of
Asia
• OEM global vehicles.
• Tooling capacity.
S. America • OEM global vehicles.
Mid-East/
Africa• No comments provided
SourcingThe majority of U.S. exports are planned for Mexico and China, with less exports to Canada

14Q3 2019 OESA AUTOMOTIVE SUPPLIER BAROMETER
What is the regional split of your total (by dollar value) of
materials/components purchased for U.S. production?
20.0%
30.0%
50.0%
0% 20% 40% 60%
Lower Quartile
Median
Top Quartile
Estimate the percent of your current material costs for
U.S. production (by dollar value) that is purchased
outside of the United States.
20.0%
45.0%
55.0%
0% 20% 40% 60%
Lower Quartile
Median
Top Quartile
2018
2019
U.S. Production ImportsImbalance between imports and exports
2019Lower
QuartileMedian
Upper
Quartile
Number of respondent companies
exporting to each region
Canada 5% 5% 15% 39
Mexico 10% 20% 40% 51
Europe 5% 10% 17% 50
China 10% 23% 40% 56
Rest of Asia 5% 13% 22% 29
S. America 1% 10% 15% 7
Mid-East/Africa 6% 25% 48% 4
2018Lower
QuartileMedian
Upper
Quartile
Number of respondent companies
exporting to each region
Canada 5% 10% 25% 33
Mexico 10% 25% 40% 33
Europe 5% 7% 20% 35
Asia 14% 35% 60% 48
S. America 9% 10% 15% 4
Mid-East/Africa 13% 23% 44% 4
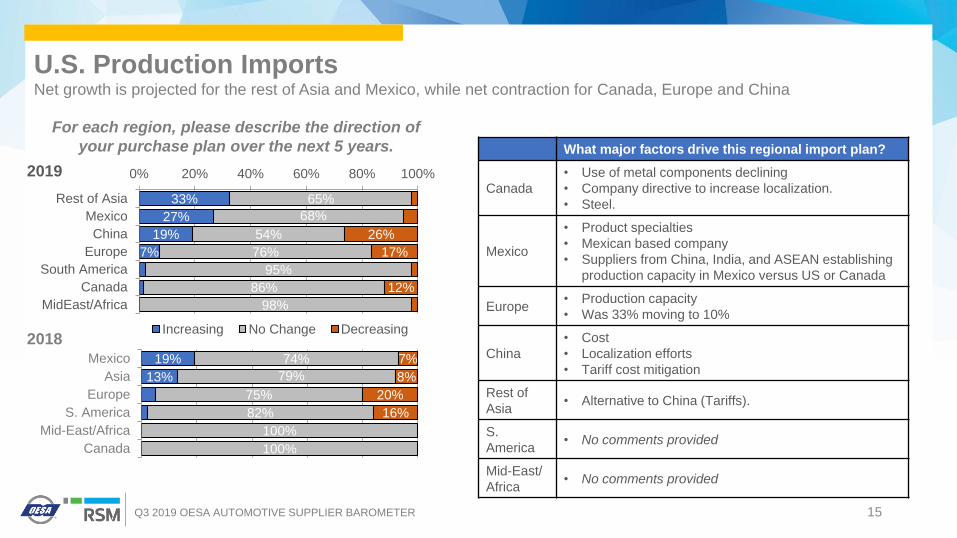
15Q3 2019 OESA AUTOMOTIVE SUPPLIER BAROMETER
2018
2019
19%
13%
74%
79%
75%
82%
100%
100%
7%
8%
20%
16%
Mexico
Asia
Europe
S. America
Mid-East/Africa
Canada
What major factors drive this regional import plan?
Canada
• Use of metal components declining
• Company directive to increase localization.
• Steel.
Mexico
• Product specialties
• Mexican based company
• Suppliers from China, India, and ASEAN establishing
production capacity in Mexico versus US or Canada
Europe• Production capacity
• Was 33% moving to 10%
China
• Cost
• Localization efforts
• Tariff cost mitigation
Rest of
Asia• Alternative to China (Tariffs).
S.
America• No comments provided
Mid-East/
Africa• No comments provided
33%
27%
19%
7%
65%
68%
54%
76%
95%
86%
98%
26%
17%
12%
0% 20% 40% 60% 80% 100%
Rest of Asia
Mexico
China
Europe
South America
Canada
MidEast/Africa
Increasing No Change Decreasing
For each region, please describe the direction of
your purchase plan over the next 5 years.
U.S. Production ImportsNet growth is projected for the rest of Asia and Mexico, while net contraction for Canada, Europe and China

16Q3 2019 OESA AUTOMOTIVE SUPPLIER BAROMETER
SUPPLY CHAIN

17Q3 2019 OESA AUTOMOTIVE SUPPLIER BAROMETER
3415%
13963%
3315%
167%
NA capacity expansion will occur
NA capacity rationalization will occur
NA production constraints will occur
None of these
How do you see North American supply chain capacity changing over the next year?
Comments (Selected):
• Expansion into new vehicle architecture; Rationalization of traditional manufacturing
• Troubled suppliers are already starting to be identified.
• There is more focus on localizing NA production leading to a requirement to expand NA capacity. This is coupled with
a decrease in customer demands over the next 12 months.
• Capacity planning based upon market trends verses customer projected volumes.
• Impact of tariff policy
• Any of these outcomes are equally possible, hence the uncertainty to make investments.
• With the reduction of car assembly there will be a rationalization of these types of plants.
• The use of digital technology in the Tier-1 operations is evolving from volume driven OEM programs to respond more
quickly to more trim levels with high speed flexibility.
• Suppliers will work to ensure proper capacity and breakeven points, so will likely avoid over-capacity and actually
remove excess capacity.
• Much business moving back from Asia (in particular) to North America.
• As a result of the 301 tariffs, we are moving production to Europe, not North America.
• I think companies will wait and see what happens with China tariffs and USMCA before making decisions.
• Electric car maker entrants and Chinese entrants will complicate the picture for overall capacity, but will negatively
impact many existing participants.
• I believe we'll see companies fold due to poor quote assumptions and losing money on high volume.
• Volumes decline and we have too much capacity.
• Due to Section 403 in NAFTA goes away
• High amount of capacity in the market currently drive profitability down
• I feel we will have open capacity that will need to be filled.
CapacityRationalization is anticipated

18Q3 2019 OESA AUTOMOTIVE SUPPLIER BAROMETER
12% 12%5%
71% 75%
66%
17% 12%
29%
0%
20%
40%
60%
80%
100%
2019 2018 2017
Too Small Appropriately Sized Too Large
23% 18%26%
64% 68% 58%
14% 13% 16%
0%
20%
40%
60%
80%
100%
2019 2018 2017
Too Small Appropriately Sized Too Large
Direct Suppliers
Considering your 2019-2020 North American production planning volumes expectation, in terms of the number of
your NA suppliers, select the relative size of your current supply base
If your supply base is too large, over the next year, what percent
reduction levels are you planning for (based on number of suppliers)?Average -13% Average -17%
Size of Supply Base
Indirect Suppliers

19Q3 2019 OESA AUTOMOTIVE SUPPLIER BAROMETER
23%
24%
32%
11%
10%
23%
33%
29%
10%
6%
0% 10% 20% 30% 40%
None
1% - 2%
3% - 5%
6% - 8%
> 8%
Percent of Respondents
What percent of your North American direct material
suppliers are currently on your “watch list?”
Direct Supplier RiskQuality issues and financial metrics increased the percentage of “watch list” suppliers
31%
28%
21%
13%
3%
3%
26%
23%
20%
24%
3%
4%
0% 10% 20% 30% 40%
Quality
Financialmetrics
Deliveryperformance
Capacityconstraints
Managementrelated
Other
Percent of Respondents
2019
2018
What is the primary reason companies are being added
to or continuing on the supplier “watch list?”

20Q3 2019 OESA AUTOMOTIVE SUPPLIER BAROMETER
37%
36%
48%
51%
53%
20%
30%
26%
23%
24%
19%
26%
20%
9%
7%
15%
8%
1%
6%
4%
0% 10% 20% 30% 40% 50% 60% 70% 80% 90% 100%
Electrical/Electronics
Powertrain
Chassis
Interior/HVAC
Exterior
No Concern Minimal Concern Moderate Concern Significant Concern
Percent of respondents
For each of the following system areas, select your level of concern in having future sourcing constraints
Sourcing ConstraintsElectrical/Electronics and Powertrain systems face the highest sourcing risks

21Q3 2019 OESA AUTOMOTIVE SUPPLIER BAROMETER
Severity on your Business
Pro
babili
ty o
f O
ccurr
ence
Short shipments from suppliers
Long-lead product/system delivery constraints
Sub-tier financial distressSub-tier capacity constraints from suppliers
shared across other customers
Logistics constraints Raw material shortages
Quality related concerns
Receiving late customer engineering change
orders
Having late or delayed critical part validation
3.00
3.25
3.50
3.75
4.00
4.25
4.50
4.75
3.50 3.75 4.00 4.25 4.50 4.75 5.00
Rating scale for both probability and severity is 1-7, with 7 being highly probable and very severe
Within your supply chain, over the next 12 months, rate the likelihood of occurrence and the severity that each of the
following possible scenarios would have on your business.
Supplier Concern ScenariosTiming issues are not only the most disruptive, but also the most likely
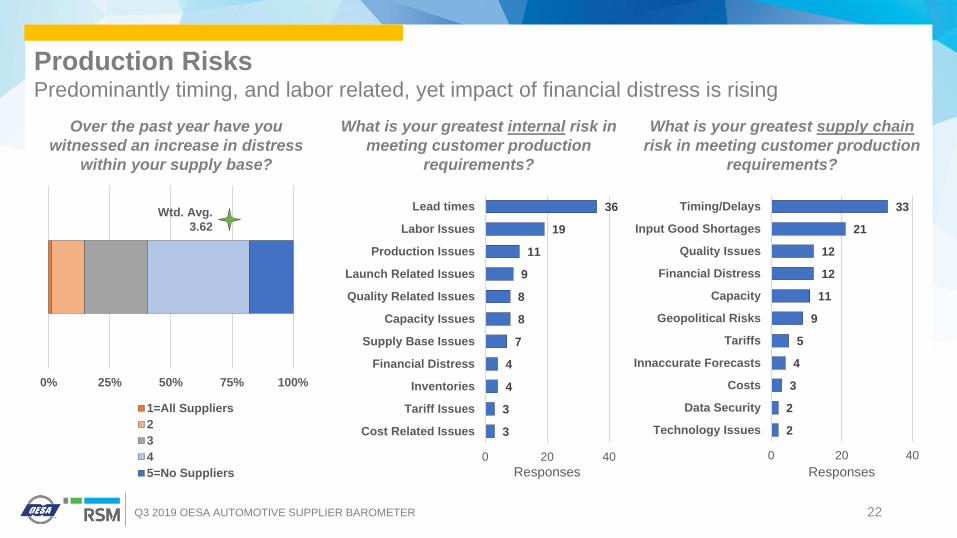
22Q3 2019 OESA AUTOMOTIVE SUPPLIER BAROMETER
What is your greatest internal risk in
meeting customer production
requirements?
Production RisksPredominantly timing, and labor related, yet impact of financial distress is rising
3
3
4
4
7
8
8
9
11
19
36
0 20 40
Cost Related Issues
Tariff Issues
Inventories
Financial Distress
Supply Base Issues
Capacity Issues
Quality Related Issues
Launch Related Issues
Production Issues
Labor Issues
Lead times
Responses
2
2
3
4
5
9
11
12
12
21
33
0 20 40
Technology Issues
Data Security
Costs
Innaccurate Forecasts
Tariffs
Geopolitical Risks
Capacity
Financial Distress
Quality Issues
Input Good Shortages
Timing/Delays
Responses
What is your greatest supply chain
risk in meeting customer production
requirements?
0% 25% 50% 75% 100%
1=All Suppliers
2
3
4
5=No Suppliers
Over the past year have you
witnessed an increase in distress
within your supply base?
Wtd. Avg.
3.62

23Q3 2019 OESA AUTOMOTIVE SUPPLIER BAROMETER
3.5%
1.7%
8.7%
9.2%
17.3%
59.5%
0.0% 10.0% 20.0% 30.0% 40.0% 50.0% 60.0% 70.0%
Greater than 80 Less thanor equal to 100
Greater than 60 Less thanor equal to 80
Greater than 40 Less thanor equal to 60
Greater than 20 Less thanor equal to 40
Greater than 10 Less thanor equal to 20
Less than or equal to 10
What percent of your suppliers are customer required directed buy arrangements?
Median = 5%
Mean = 16.5%
Percent of Respondents
Directed BuyThe majority of respondents indicate that fewer than 10% of their suppliers are directed buy
Less than or
equal to 10
Greater than 10 Less than
or equal to 20
Greater than 20 Less than
or equal to 40
Greater than 40 Less than
or equal to 60
Greater than 60 Less than
or equal to 80
Greater than 80 Less than
or equal to 100

24Q3 2019 OESA AUTOMOTIVE SUPPLIER BAROMETER
The information and opinions contained in this report are for general information purposes. Comments are edited only for
spelling and may contain grammatical errors due to their verbatim nature. Responses to this survey are confidential.
Therefore, only aggregated results will be reported and individual responses will not be released or shared.
Antitrust Statement:
Respondents/participants should not contact competitors to discuss responses, or to discuss the issues dealt with in the
survey. It is an absolute imperative to consult legal counsel about any contacts with competitors. All pricing and other terms
of sale decisions and negotiating strategies should be handled on an individual company basis.
OESA Automotive Supplier Barometer is a survey of the top
executives of OESA regular member companies. The OESA
Automotive Supplier Barometer takes the pulse of the suppliers'
twelve month business sentiment. In addition, it provides a snapshot
of the industry commercial issues, business environment and
business strategies that influence the supplier industry.
www.oesa.org.
Survey Methodology
• Data collected July 15 – July 23 via invitation to online survey.
• Executives of OESA supplier companies.
• 176 complete survey responses were received, with 293 responses total.
Contacts
Mike Jackson
Executive Director
Strategy and Research
248.430.5954
Joe Zaciek
Manager
Research and Industry Analysis
248.430.5960
Larry Keyler
RSM Detroit Office Managing Partner
317.805.6205
Original Equipment Suppliers Association
25925 Telegraph Road
Suite 350
Southfield, Michigan 48033
RSM US LLP is the leading provider of audit, tax and consulting
services focused on the middle market, with nearly 10,000
professionals nationwide. It is a licensed CPA firm and the U.S.
member of RSM International, a global network of independent audit,
tax and consulting firms with more than 41,000 people in 116
countries. RSM uses its deep understanding of the needs and
aspirations of clients to help them succeed. For more information, visit
rsmus.com, like us on Facebook at RSM US LLP, follow us on Twitter
@RSMUSLLP or connect with us on LinkedIn.
Related Documents