Trachyte Phase Relations and Implication for Magma Storage Conditions in the Cha| Œ ne des Puys (French Massif Central) CAROLINE MARTEL 1,2,3 *, RE ¤ MI CHAMPALLIER 1,2,3 , GAE « LLE PROUTEAU 1,2,3 , MICHEL PICHAVANT 1,2,3 , LAURENT ARBARET 1,2,3 , HE ¤ LE ' NE BALCONE-BOISSARD 4 , GEORGES BOUDON 5 , PIERRE BOIVIN 6 , JEAN-LOUIS BOURDIER 1,2,3 AND BRUNO SCAILLET 1,2,3 1 UNIVERSITE ¤ D’ORLE ¤ ANS, ISTO, UMR 7327, 45071 ORLE ¤ ANS, FRANCE 2 CNRS/INSU, ISTO, UMR 7327, 45071 ORLE ¤ ANS, FRANCE 3 BRGM, ISTO, UMR 7327, 45071 ORLE ¤ ANS, FRANCE 4 INSTITUT DES SCIENCES DE LA TERRE DE PARIS (ISTEP), UNIVERSITE PIERRE ET MARIE CURIE^CNRS, UMR 7193, 75005 PARIS, FRANCE 5 INSTITUT DE PHYSIQUE DU GLOBE (IPGP), 75005 PARIS, FRANCE 6 LABORATOIRE MAGMAS ET VOLCANS (LMV), 63038 CLERMONT-FERRAND, FRANCE RECEIVED JUNE 6, 2012; ACCEPTED JANUARY 14, 2013 ADVANCE ACCESS PUBLICATION MARCH 8, 2013 Petrological data have been acquired on natural trachytes from the Cha| Œ ne des Puys, French Massif Central, and on experimental prod- ucts from phase equilibria to (1) constrain the storage conditions of trachytic magmas that lead to explosive eruptions (dome destructions as block-and-ash flows or pumice-and-ash flows) and (2) provide phase relationships and chemical compositions for differentiated alkaline liquids in an intraplate continental context. Phase assem- blages, proportions, and compositions have been determined on six trachytes with SiO 2 contents varying from 62 to 69 wt % and alkali contents of 10· 5^12·0 wt %. The samples contain up to 30% of phenocrysts, mainly consisting of feldspar (15^17%; plagioclase and/or alkali-feldspar), biotite (2^6%; except in the most SiO 2 -poor sample), Fe^Ti oxides (1^3%) ɔ amphibole ( 5 5%), ɔ clinopyroxene ( 1%). All samples have apatite and zircon as minor phases and titanite was found in one sample. Pristine glasses (melt inclusions or residual glasses) in pumice from explosive events are trachytic to rhyolitic (65^73wt % SiO 2 and 10· 5^13·0wt % alkali). H 2 O dissolved in melt inclusions and the biotite þ alkali feldspar þ magnetite hygrobarometer both sug- gest pre-eruptive H 2 O contents up to 8 wt %.These are so far the highest H 2 O contents ever reported for alkaline liquids in an intra- plate continental context. Melt inclusions also contain 3400 ppm chlorine, 700 ppm fluorine, and 300 ppm sulphur. Crystallization experiments on the six trachytes were performed be- tween 200 and 400MPa, 700 and 9008C, at H 2 O saturation, and oxygen fugacity of NNOɔ1. A comparison between the natural and experimental phase assemblage, proportions, and composition suggests magma storage conditions at a pressure of 300^350MPa ( 10^12 km deep), melt H 2 O content 8 wt % (close to satur- ation), an oxygen fugacity close to NNO 0· 5, and temperatures increasing from 700 to 8258C with decreasing bulk SiO 2 content of the trachyte. The high H 2 O contents of the trachytes show that wet conditions may prevail during the differentiation of continen- tal alkaline series. Regardless of the size of the magma reservoir *Corresponding author. Present address: Universite¤ d’Orle¤ ans, ISTO, UMR 7327,45071, Orle¤ ans, France. E-mail: [email protected] ß The Author 2013. Published by Oxford University Press. All rights reserved. For Permissions, please e-mail: journals.permissions@ oup.com JOURNAL OF PETROLOGY VOLUME 54 NUMBER 6 PAGES 1071^1107 2013 doi:10.1093/petrology/egt006 Downloaded from https://academic.oup.com/petrology/article/54/6/1071/1407557 by guest on 05 July 2022

Welcome message from author
This document is posted to help you gain knowledge. Please leave a comment to let me know what you think about it! Share it to your friends and learn new things together.
Transcript

Trachyte Phase Relations and Implication forMagma Storage Conditions in the Cha|Πne desPuys (French Massif Central)
CAROLINE MARTEL1,2,3*, RE¤ MI CHAMPALLIER1,2,3,GAE« LLE PROUTEAU1,2,3, MICHEL PICHAVANT1,2,3,LAURENTARBARET1,2,3, HE¤ LE' NE BALCONE-BOISSARD4,GEORGES BOUDON5, PIERRE BOIVIN6, JEAN-LOUIS BOURDIER1,2,3
AND BRUNO SCAILLET1,2,3
1UNIVERSITE¤ D’ORLE¤ ANS, ISTO, UMR 7327, 45071 ORLE¤ ANS, FRANCE2CNRS/INSU, ISTO, UMR 7327, 45071 ORLE¤ ANS, FRANCE3BRGM, ISTO, UMR 7327, 45071 ORLE¤ ANS, FRANCE4INSTITUT DES SCIENCES DE LA TERRE DE PARIS (ISTEP), UNIVERSITE PIERRE ET MARIE CURIE^CNRS, UMR 7193,
75005 PARIS, FRANCE5INSTITUT DE PHYSIQUE DU GLOBE (IPGP), 75005 PARIS, FRANCE6LABORATOIRE MAGMAS ET VOLCANS (LMV), 63038 CLERMONT-FERRAND, FRANCE
RECEIVEDJUNE 6, 2012; ACCEPTEDJANUARY 14, 2013ADVANCE ACCESS PUBLICATION MARCH 8, 2013
Petrological data have been acquired on natural trachytes from the
Cha|Πne des Puys, French Massif Central, and on experimental prod-
ucts from phase equilibria to (1) constrain the storage conditions of
trachytic magmas that lead to explosive eruptions (dome destructions
as block-and-ash flows or pumice-and-ash flows) and (2) provide
phase relationships and chemical compositions for differentiated
alkaline liquids in an intraplate continental context. Phase assem-
blages, proportions, and compositions have been determined on six
trachytes with SiO2 contents varying from 62 to 69 wt % and
alkali contents of 10·5^12·0 wt %. The samples contain up to
30% of phenocrysts, mainly consisting of feldspar (15^17%;
plagioclase and/or alkali-feldspar), biotite (2^6%; except in the
most SiO2-poor sample), Fe^Ti oxides (1^3%)� amphibole
(55%), � clinopyroxene (�1%). All samples have apatite and
zircon as minor phases and titanite was found in one sample.
Pristine glasses (melt inclusions or residual glasses) in pumice
from explosive events are trachytic to rhyolitic (65^73 wt % SiO2
and 10·5^13·0 wt % alkali). H2O dissolved in melt inclusions and
the biotiteþ alkali feldsparþmagnetite hygrobarometer both sug-
gest pre-eruptive H2O contents up to 8 wt %.These are so far the
highest H2O contents ever reported for alkaline liquids in an intra-
plate continental context. Melt inclusions also contain �3400 ppm
chlorine, �700 ppm fluorine, and �300 ppm sulphur.
Crystallization experiments on the six trachytes were performed be-
tween 200 and 400MPa, 700 and 9008C, at H2O saturation, and
oxygen fugacity of �NNO� 1. A comparison between the natural
and experimental phase assemblage, proportions, and composition
suggests magma storage conditions at a pressure of 300^350MPa
(�10^12 km deep), melt H2O content �8 wt % (close to satur-
ation), an oxygen fugacity close to �NNO �0·5, and temperaturesincreasing from 700 to 8258C with decreasing bulk SiO2 content
of the trachyte. The high H2O contents of the trachytes show that
wet conditions may prevail during the differentiation of continen-
tal alkaline series. Regardless of the size of the magma reservoir
*Corresponding author. Present address: Universite¤ d’Orle¤ ans, ISTO,UMR 7327, 45071, Orle¤ ans, France. E-mail: [email protected]
� The Author 2013. Published by Oxford University Press. Allrights reserved. For Permissions, please e-mail: [email protected]
JOURNALOFPETROLOGY VOLUME 54 NUMBER 6 PAGES1071^1107 2013 doi:10.1093/petrology/egt006D
ownloaded from
https://academic.oup.com
/petrology/article/54/6/1071/1407557 by guest on 05 July 2022
assumed to have fed the trachyte eruptions, calculation of thermal
relaxation timescales indicates that the tapped magma reservoir(s)
are likely to be still partially molten. The four northernmost edi-
fices may correspond to a single large reservoir with a lateral
extent of up to 10 km, which could be possibly reactivated in
weeks to months if intercepted by new rising mafic magma
batches.
I NTRODUCTIONAlkali-rich magmas can produce highly explosive erup-tions as illustrated by eruptions of Vesuvius (Italy, AD 79),Phlegrean Fields (Italy, 39 ka BP), Neapolitan Yellow Tuff(Italy, 12 ka BP), Tenerife (Canary Islands, AD 1563 and1640) and Tambora (Indonesia, 1815). However, whereasmany experimental studies have been carried out onphase relationships in rhyolitic or granitic systems(e.g. Tuttle & Bowen, 1958; Holtz & Johannes, 1991;Scaillet et al.,1995) and calc-alkaline series (e.g. Rutherfordet al., 1985; Martel et al., 1999; Prouteau & Scaillet, 2003)there is less information on evolved alkaline magma com-positions. Most of the studies concern phonolite (Berndtet al., 2001; Signorelli & Carroll, 2002; Freise et al., 2003;Harms et al., 2004; Andujar et al., 2008; Scaillet et al.,2008) and peralkaline rhyolite (e.g. Scaillet & Macdonald,2001, 2003; Di Carlo et al., 2010), whereas trachyte hasreceived much less attention (Nelson & Hegre, 1990;Nekvasil et al., 2004; Fowler et al., 2007; Fabbrizio &Carroll, 2008).Petrological approaches combining the characterization
of natural volcanic products and experimental phaserelationships have been shown to be particularly powerfulfor the determination of pre-eruptive conditions, suchas magma reservoir depth, temperature, and meltvolatile content (e.g. Gardner et al., 1995; Martel et al.,1998; Scaillet & Evans, 1999). Nevertheless, only a few ofsuch studies have been dedicated to the determination ofthe storage conditions of trachytic magmas (e.g. PhlegreanFields; Fabbrizio & Carroll, 2008; Fabbrizio et al., 2009).Existing experimental data suggest that this class ofmagmas may contain a significant amount of dissolvedwater. Combined with their silica-rich nature, this makestrachyte magmas prone to explosive behaviour, throughprocesses that need to be fully understood to minimize theassociated volcanic hazards.Beyond volcanological purposes, trachytes and alkaline
rhyolites represent end-members of alkaline magma series,whose origin is still a matter of debate (e.g. Nekvasil et al.,2004). Several processes have been proposed to explainthe alkaline affinity (e.g. Scaillet & Macdonald, 2003;Caricchi et al., 2008) or the transition between silica-undersaturated and silica-oversaturated magmatic trends(e.g. crystallization of non-stoichiometric minerals, amphi-bole crystallization, contamination by the continental
crust), but the mechanisms that apply in specific cases stillneed clarification.The Cha|Πne des Puys (CDP) suite represents a world
reference in continental alkaline magma series (Mauryet al., 1980; Villemant et al., 1980), displaying a com-positional continuum from alkali basalt to trachyte,interpreted as resulting from fractional crystallizationin a nearly closed system. The CDP thus represents anideal case for further investigation via experimentalpetrology.In this study, we have acquired new petrological data for
the CDP trachytes and compared them with experimentalphase equilibria data obtained on the same rocks, to deter-mine (1) the pre-eruptive conditions of the trachyticmagma reservoirs beneath the CDP volcanoes and (2) thephase relationships in differentiated alkaline magmaseries between 200 and 400MPa.
VOLCANOLOGICAL SETTINGAND SAMPLE SELECT IONTertiary to Quaternary volcanism in the French MassifCentral is of typical intraplate alkaline affinity (e.g. Ville-mant et al., 1980), erupted during two major episodes:Oligocene to early Miocene and late Miocene to Plio-Quaternary. Of the many volcanic fields formed in thistime span, the CDP is the northernmost and among theyoungest (c. 100 to 5^7 kyr old).The volcanic chain consistsof a narrow (3^4 km wide and c. 30 km long) north^south-trending group of about 80 monogenetic volcanoes,to the west of the city of Clermont-Ferrand. As it featuresspectacular volcanic morphologies, the CDP has been oneof the cradles of volcanology as a science and the focus ofconsiderable geological literature. Modern volcanologicalknowledge acquired in the last three decades has beensummarized in successive versions of a volcanologicalmap of the CDP at 1/25000 scale and its accompanyingbooklet (first edition by Camus et al., 1975; most recent edi-tion by Boivin et al., 2009). The CDP volcanoes include avariety of volcanic forms and structures, mostly scoriacones and a few phreatomagmatic maars, silicic explosivecraters, and lava domes.The CDP lavas provide a good ex-ample of a differentiation series produced by fractionalcrystallization (Maury et al., 1980; Villemant et al., 1981)that ranges from slightly K-rich, alkali basalts to mugear-ites and less voluminous benmoreites and trachytes. About8 km3 of basalt were emitted as lava flows during a periodof �90 kyr, in addition to 1^2 km3 of trachytic derivativeswhich were extruded mostly as lava domes (Boivin et al.,2009).Trachytic eruptions in the CDP have produced seven
discrete lava domes or spines (Kilian, Vasset, Puy deDo“ me, Clierzou, Aumone, Grand Sarcouy and Chopine),the growth of which may have been preceded by explosive
JOURNAL OF PETROLOGY VOLUME 54 NUMBER 6 JUNE 2013
1072
Dow
nloaded from https://academ
ic.oup.com/petrology/article/54/6/1071/1407557 by guest on 05 July 2022

eruption episodes. These explosive events are in some casesevidenced by conspicuous small-size (c. 1km wide) explo-sion craters cut within the basement rocks (Kilian andVasset) and by associated pumice-rich pyroclastic deposits(Kilian and Puy Chopine). Early explosive episodescannot be proved nor ruled out for the other volcanoes,as craters from an early phase might be concealed be-neath the lava domes. The growth of lava domes andspines may have been accompanied by destabilizationinto pyroclastic density currents (e.g. at Puy de Do“ meand Grand Sarcouy) or more explosive events (e.g. atPuy Chopine). For each event, the total volumes emittedare less than 0·5 km3. Trachytic activity in the CDP hasbeen restricted in both time and space. The seven volca-noes cluster along a 4 km segment in the central part ofthe chain and thorough dating of the edifices yields agesfalling within the range 9^15 ka (Miallier et al., 2004;Boivin et al., 2009).Of the seven trachytic volcanoes of the CDP, six are
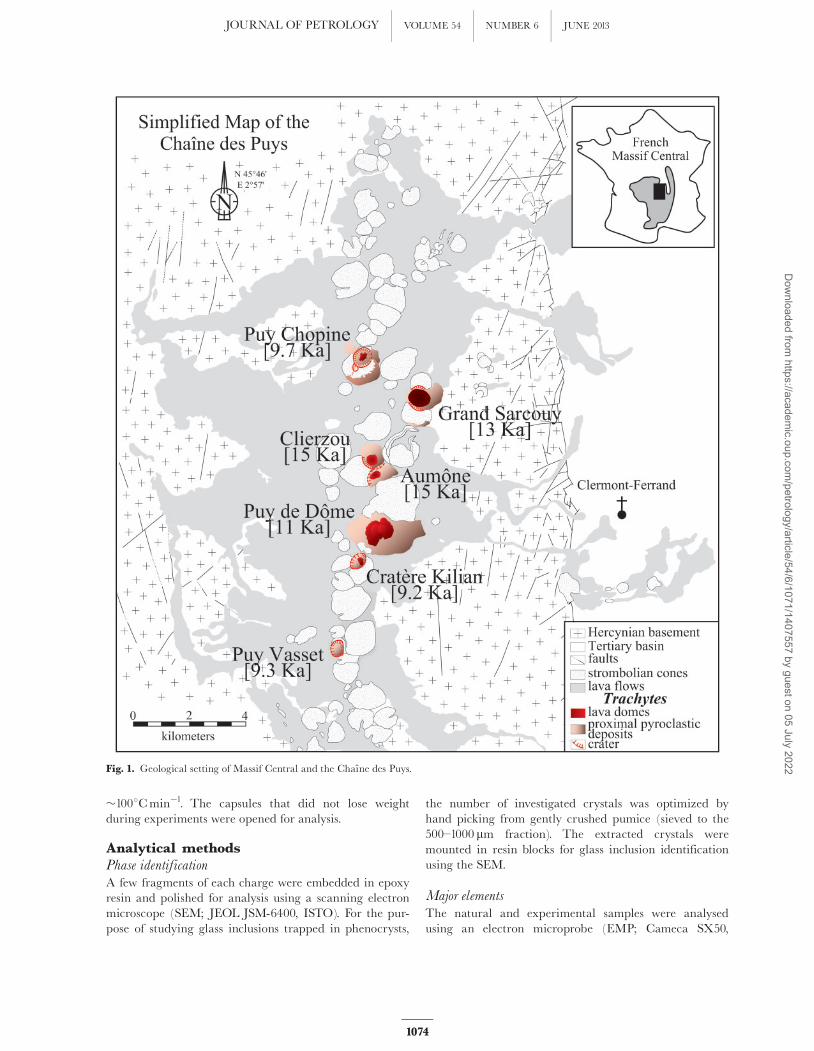
included in this study. The Aumone trachyte is not con-sidered as it is very similar to the nearby Clierzou trach-yte in mineralogy, chemical composition and age. Mostof the trachyte samples used herein (Table 1) come frommassive lava bodies; that is, lava domes and spines:Grand Sarcouy (SAR), Clierzou (CLI), Puy de Do“ me(DOM), Chopine (CHO), Kilian (KIL). The other sam-ples studied are juvenile clasts from pyroclastic deposits:Vasset (VAS) and pumice from explosive events ofChopine (CHO_Pumice) and Kilian (KIL_Pumice)(Fig. 1). These two pumiceous samples were specificallyused for glass analyses. Pumice from explosive eventsprobably experienced faster magma ascent rates andquenching than dome lavas, thus better preserving thetrapped volatiles in melt inclusions and preventingextensive crystallization of the residual glasses (Martelet al., 2000).
EXPER IMENTAL ANDANALYT ICAL METHODSExperimental methodsStarting material
The experiments were performed in parallel on all trachytes.Block samples, either from the lava domes or pyroclastic de-posit, were fused in a Pt crucible at 14008C and 1atm for3 h, quenched and then powdered in an automatic mortar(grain size550mm). The cycle of fusion and grinding wasrepeated once to ensure chemical homogeneity of the start-ing glasses. Around 30^50mg of the glass powder andenough deionized H2O to achieve H2O saturation at thetarget P^Twere introduced into Au capsules (2·5mm i.d.,2·9mm o.d., and 20mm long) and sealed by arc-welding.
Equipment and run procedure
For each run, the six capsules were loaded together in aninternally heated pressure vessel pressurized with an Ar^H2 gas mixture. Total pressure was continuously recordedby a transducer calibrated against a Heise Bourdon tubegauge, giving an uncertainty of �20 bar (including dailyfluctuations). The capsules were placed at the hotspot of aMo-windings furnace, where the thermal gradient is lessthan 58C over �3 cm. The furnace temperature was regu-lated by a Eurotherm controller and sample temperaturewas read continuously by S-type thermocouples withgiven uncertainty of �58C. To keep the oxygen fugacity(fO2) within �1 log unit around the Ni^NiO buffer(NNO), 0·1MPa of pure hydrogen was added cold to theAr gas for each experiment (Martel et al., 1999). Run dur-ations varied from 2 to 17 days, typically increasing withdecreasing temperature. Phases were compositionallyhomogeneous, attesting to chemical equilibrium. The sam-ples were isobarically quenched by switching off thefurnace power, inducing a temperature drop of
Table 1: Location, lithology and age of the Cha|Πne des Puys trachytes used in this study
Sample Abbreviation Age Characteristics Location
(ka)
Cratere Kilian KIL 9·2 Block of the lava dome crater rim, part of the dome
Kilian pumices KIL_Pumice 9·2 Explosive event deposit next to crater
Puy Vasset VAS 9·3 Block from a pyroclastic flow Moreno Pass
Puy Chopine CHO 9·7 Spine, grey and pinkish facies spine
Chopine pumices CHO_Pumice 9·7 Explosive event deposit Lemptegy quarry
Puy de Dome DOM 11 Lava dome block (main facies) East side of the dome
Grand Sarcouy SAR 13 Block of the lava dome Southeastern quarry
Clierzou CLI 15 Block of the lava dome South quarry
Edifice ages were determined by radiocarbon on charcoal and tephrochronology (Miallier et al., 2004; personalcommunication).
MARTEL et al. TRACHYTES, CHAI“ NE DES PUYS
1073
Dow
nloaded from https://academ
ic.oup.com/petrology/article/54/6/1071/1407557 by guest on 05 July 2022
�1008Cmin�1. The capsules that did not lose weightduring experiments were opened for analysis.
Analytical methodsPhase identification
A few fragments of each charge were embedded in epoxyresin and polished for analysis using a scanning electronmicroscope (SEM; JEOL JSM-6400, ISTO). For the pur-pose of studying glass inclusions trapped in phenocrysts,
the number of investigated crystals was optimized byhand picking from gently crushed pumice (sieved to the500^1000 mm fraction). The extracted crystals weremounted in resin blocks for glass inclusion identificationusing the SEM.
Major elements
The natural and experimental samples were analysedusing an electron microprobe (EMP; Cameca SX50,
Fig. 1. Geological setting of Massif Central and the Cha|Πne des Puys.
JOURNAL OF PETROLOGY VOLUME 54 NUMBER 6 JUNE 2013
1074
Dow
nloaded from https://academ
ic.oup.com/petrology/article/54/6/1071/1407557 by guest on 05 July 2022

BRGM-ISTO) with an acceleration voltage of 15 kV,counting time of 10 s, and beam current of 6 nA (glasses)or 10 nA (crystals). The beam size was focused (�2 mm)for mineral phases and enlarged to a spot size of 8 mmfor glasses, to minimize alkali migration. EMP analyticalerrors are 1% for SiO2, Al2O3 and CaO, 3% for FeO,MgO and TiO2, 5% for MnO, Na2O and K2O,�300 ppm for P2O5, �500 ppm for Cl and S, and700 ppm for F.Na2O tends to volatilize during sample fusion (prepar-
ation of the starting glass for the experiments) and duringEMP analysis under the electron beam. To evaluate thetotal Na loss during fusion and EMP analysis, the Na2Ocontent of the trachyte from Puy Chopine was analysedby atomic absorption spectrophotometry (AAS; HitachiZ-8100, ISTO). The finely ground whole-rock powder wasdissolved by HF attack and diluted before AAS analysis.The Na2O content obtained byAAS (6·84wt %) was com-pared with the Na2O content measured by EMP on thedry and hydrated fused trachyte, because Na volatilizationtends to be greater in H2O-rich glasses (Pichavant, 1987).For glasses with 6·9 to �10wt % dissolved H2O, the Nacorrection factor was about 1·23. Because our experimentswere performed within this relatively restricted range ofH2O contents (pressure range of 200^400MPa), weapplied a constant correction factor of 1·23 to all EMPana-lyses of experimental glasses, as well as the most H2O-richmelt inclusions (6^8wt % H2O).
Water content
The water contents of three experimental liquidus and sub-liquidus glasses (800CHO3, 800CHO2, and 900CHO2)were determined by Karl-Fischer titration, following theprocedure described by Behrens (1995) and using pyrophyl-lite crystals containing 5·3wt % H2O as standards. Thesethree glasses were used as H2O-standard glasses for H2Ocontent determination following the EMP ‘by-difference’method (Devine et al., 1995) in the other experimentalcrystal-bearing glasses and the natural glasses. H2O con-tents determined by the EMP ‘by-difference’ method aregiven with an uncertainty of �0·5wt %.
Phase proportions
The area proportions of phenocrysts and matrix(bubble-free residual glass plus microlites) in the naturalsamples were determined by point counting on thin sec-tions (653^1300 points per sample), and converted intowt % using the following phase densities (in g cm�3): 2·7for feldspars (oligoclase or orthoclase), 5·2 for magnetite,3·0 for biotite, 3·3 for clinopyroxene (augite), 3·1 for amphi-bole (pargasite), and 2·4 for the glass (Knoche et al., 1995).Because the experimental products were too small to de-
termine phase proportion by point counting, the relativeproportions of glass and crystals (without discriminationbetween the mineral phases) were determined by image
analysis. The relative proportions of the different mineralphases were determined by mass balance using the ap-proach of Stormer (1978), but the results are sparse, be-cause many crystals are too small to be accuratelyanalysed; also, calculation residuals are often too high forNa2O, despite the Na correction applied to the EMP glassanalyses.
PETROLOGY ANDGEOCHEMISTRY OF THETRACHYTES FROM THE CHA I“ NEDES PUYSPhase assemblage and chemicalcompositionBulk-rock compositions
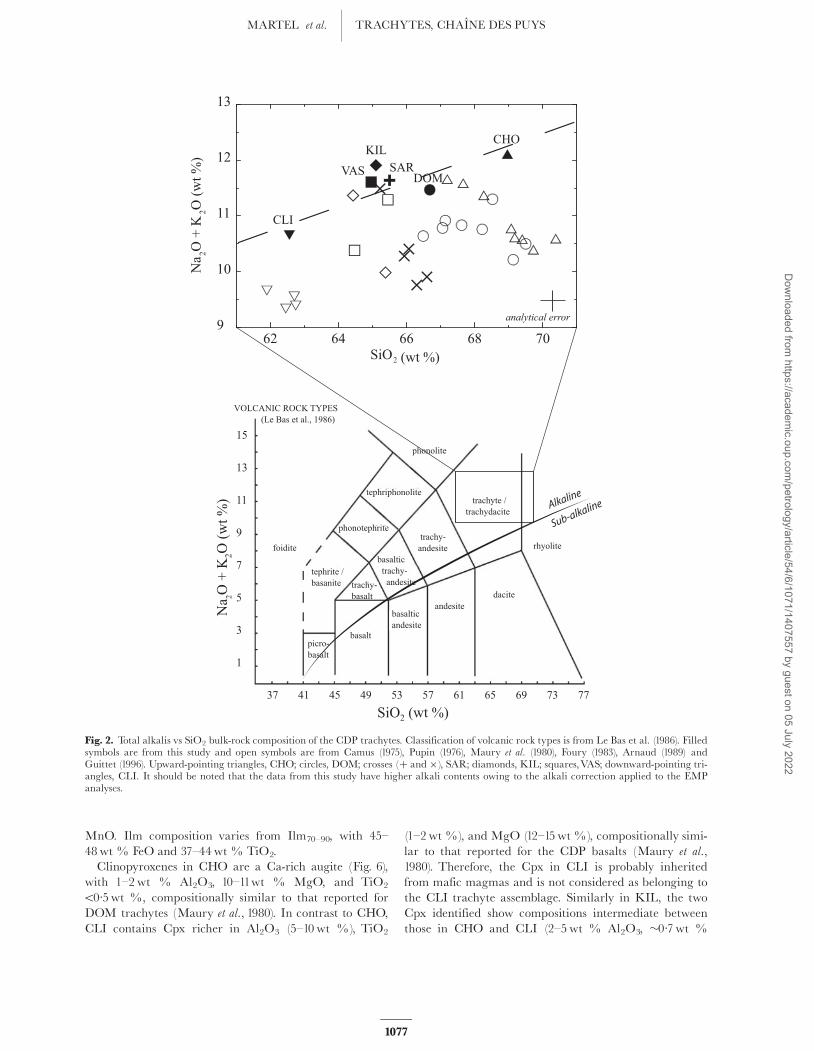
The six samples are metaluminous to slightly alkalinetrachytes, with bulk SiO2 contents varying from 62·6 to69·0wt %, alkali (Na2OþK2O) contents from 10·5 to12·1wt %, and a peralkalinity index (PI) from 0·89 to1·08 (Table 2). The CIPW norms indicate silica-oversaturation (presence of normative quartz), rich in feld-spars and pyroxenes (Table 2). These compositions are ingood agreement with the previous bulk-rock analyses ofthese trachytes (Camus, 1975; Pupin, 1976; Maury et al.,1980; Foury, 1983; Arnaud, 1989; Guittet, 1996), althoughour alkali contents are slightly higher on average (Fig. 2),owing to the Na2O corrections we made on the EMP glassanalyses, whereas the previous researchers provided rawEMP data (our data show similar Na2O contents withoutalkali corrections). With bulk SiO2 increasing from 62 to69 wt % (CLI to CHO), K2O increases from 4·1 to5·3wt %, CaO decreases from 3·2 to 0·9wt %, FeO de-creases from 4·0 to 1·6wt %, and MgO decreases from1·0 to 0·2wt %, whereas Na2O remains constant at6·6^7·3wt %. With the increase of bulk SiO2, the P2O5
content decreases from 0·29wt % (CLI) to 0·03wt %(CHO). All samples have F contents between 0·1 and0·2wt %, Cl contents50·5wt %, and SO3 �0·1wt %.
Phenocryst assemblage and proportions
The main phenocryst assemblage was taken as crystals freeof reaction rims and systematically varies with the SiO2
bulk-content of the trachyte (Table 2). All samples havetwo mineral groups in common: Fe^Ti oxides and plagio-clase (Pl). Fe^Ti oxides are titanomagnetite (Mt) and il-menite (Ilm). DOM and CHO also contain alkalifeldspar (Afs) up to sanidine in composition, CHO havinga continuous trend from Pl to Afs. All samples contain bio-tite (Bt), except CLI. Amphibole (Am) is present in CLI,VAS, and KIL. CHO contains clinopyroxene (Cpx). Itshould be noted that DOM is Cpx-free, as seen in themain facies of Puy de Do“ me, whereas other minor faciescontain green Cpx (Miallier et al., 2010). Some rare Cpx
MARTEL et al. TRACHYTES, CHAI“ NE DES PUYS
1075
Dow
nloaded from https://academ
ic.oup.com/petrology/article/54/6/1071/1407557 by guest on 05 July 2022

has been detected in KIL and CLI samples; their basalt-like compositions (see below) suggest an inherited nature.All trachytes contain accessory apatite (Ap) and zircon(Zr). CHO additionally contains titanite (Tit). The pheno-cryst assemblages in CHO_Pumice and KIL_Pumice areidentical to their respective dome-related trachytes.The major phenocrysts have modal proportions varying
from 7 to 24% (mass proportions from 10 to 27wt %;Table 2). For all samples, Fe^Ti oxides do not exceed1^3% and feldspars range from 7 to 17%. In anotherCHO sample, Foury (1983) reported 8 and 10wt % of Pland Afs, respectively. Bt varies between 1 and 5%. Amrepresents about 2^4% and Cpx in CHO is �1%.Accessory minerals (Ap, Zr, andTit) are51wt %.From a textural point of view, the feldspars sometimes
show cloudy cores (full of devitrified glass inclusions) andstrong optical zoning that is more reflective of the presenceof growth rims than true chemical zoning (Fig. 3c). InCHO, Afs is dominant over Pl and commonly rims Pl,whereas the opposite is true in DOM samples. The ferro-magnesian phases (Am, Bt, Cpx) can be strongly oxidized,especially Bt in SAR samples (Fig. 3e). Although thephenocrysts are mostly free of reaction rims (e.g. Fig. 3aand d), all samples also contain small amounts of des-tabilized phenocrysts (Fig. 3b) or small mafic enclaves(more abundant in CLI). Mafic xenocrysts appear in suchsmall proportions that they probably do not affect signifi-cantly the trachytic equilibrium. Groundmasses in allsamples, except pumice from CHO and KIL, are micro-crystalline, with mainly feldspars showing typical trach-ytic textures (oriented elongated microlites; e.g. Fig. 3a, band d). CHO_Pumice and KIL_Pumice have a glassy(microlite-free) matrix.
Compositions of the natural phenocrysts and glasses
Selected compositions of the natural phenocrysts andglasses are reported inTable 3.As the bulk SiO2 content increases from 62 to 69wt %
(CLI to CHO), Pl evolves from andesine (An30^42) tooligoclase (An11^27) and becomes progressively enrichedin K2O towards anorthoclase (10^20mol % of orthoclase,Or10^20) and sanidine compositions (4Or35). For conveni-ence, we will hereafter associate anorthoclase with the Plgroup, as it forms a continuous compositional trend, incontrast to the sanidine group, which is referred to as Afs.Afs in DOM and CHO is �An3^Or50 (Fig. 4). Most of thePl shows limited chemical zoning, with a maximum vari-ation of �15mol % An (i.e. An42^28 and An28^12 fromcore to rim in CLI and CHO, respectively).Fe^Ti oxides are solid solutions of magnetite^ulvo« spinel
and more rarely, of ilmenite^hematite. Most of the Mt con-tains 80^90mol % magnetite [Mt80^90, using the projec-tion scheme of Andersen et al. (1993)], but the fullcompositional range for a given sample is Mt74^92 (Fig. 5),with 74^84wt % FeO, 2^8wt % TiO2, and 2^5wt %
Table 2: Bulk-rock composition, CIPW norm and pheno-
cryst proportion of the CDP trachytes
Sample: CHO DOM SAR KIL VAS CLI
Bulk-rock composition
SiO2 68·96(12) 66·68(13) 65·50(14) 65·10(36) 64·96(36) 62·56(23)
Al2O3 15·70(23) 16·49(11) 16·98(13) 17·02(18) 17·11(16) 17·16(12)
CaO 0·90(5) 1·30(5) 1·66(8) 1·93(7) 2·04(9) 3·21(8)
Na2O 6·84(8) 6·61(8) 6·91(17) 7·32(21) 7·09(47) 6·58(6)
K2O 5·27(12) 4·86(13) 4·73(9) 4·59(7) 4·52(9) 4·08(3)
FeO 1·56(22) 2·69(13) 2·68(10) 2·60(15) 2·60(19) 4·04(15)
MgO 0·18(2) 0·42(4) 0·53(2) 0·47(4) 0·55(5) 0·96(5)
MnO 0·21(10) 0·19(4) 0·23(8) 0·19(6) 0·26(5) 0·19(9)
TiO2 0·20(12) 0·40(5) 0·42(5) 0·48(3) 0·50(6) 0·75(5)
P2O5 0·03(3) 0·17(2) 0·17(3) 0·16(7) 0·18(4) 0·29(4)
F 0·11(2) 0·16(3) 0·14(3) 0·13(2) 0·15(2) 0·14(2)
Cl 0·01(1) 0·01(1) 0·04(2) 0·01(1) 0·02(1) 0·01(1)
SO3 0·01(1) 0·01(1) 0·01(1) 0·01(1) 0·01(1) 0·01(1)
Total 99·98 99·99 100·00 100·01 99·99 99·98
PI 1·08 0·99 0·97 1·00 0·97 0·89
CIPW norm (wt %)
Quartz 10·33 5·53 2·46 0·43 1·32 0·10
Orthoclase 31·62 28·73 27·96 27·13 26·72 24·11
Albite 52·20 55·93 58·46 61·93 59·99 55·67
Anorthite 0·00 0·98 1·35 0·03 1·52 5·24
Diopside 3·78 3·78 4·97 7·32 6·38 7·51
Hypersthene 1·45 3·72 3·41 1·73 2·52 5·08
Ilmenite 0·39 0·76 0·80 0·91 0·95 1·42
Apatite 0·07 0·40 0·40 0·38 0·43 0·69
Phenocryst proportion
Total 21/24 20/23 7/10 24/27 17/20 12/15
Mtþ Ilm 1/2 1/2 51/1 2/3 1/2 1/2
Pl 17/18 14/15 4/5 15/16 13/14 7/8
Afs present present
Bt 2/3 5/6 3/4 5/6 1/2
Cpx 1/1
Am 2/2 2/2 4/5
Ap 51 51 51 51 51 51
Zr 51 51 51 51 51 51
Tit 51
Sample abbreviations are as in Table 1. Bulk-rock compos-itions were determined by EMP (corrected for Na loss),recalculated on anhydrous basis; numbers in parenthesesgive the statistical uncertainty on the last digits. All iron isrecalculated as FeO. PI is the peralkalinity index given asmolar (Na2OþK2O)/Al2O3. Phenocryst proportion wasrecalculated on the basis of a bubble-free matrix; Mt, mag-netite; Ilm, ilmenite; Bt, biotite; Pl, plagioclase; Afs, alkalifeldspar; Cpx, clinopyroxenes; Am, amphibole; Ap, apatite;Zr, zircon; Tit, titanite. The first number gives the modalproportions determined by point counting (with Pl and Afscounted together for CHO and DOM). The second numbergives the phase proportion in wt % recalculated by massbalance with the appropriate mineral density (see text).
JOURNAL OF PETROLOGY VOLUME 54 NUMBER 6 JUNE 2013
1076
Dow
nloaded from https://academ
ic.oup.com/petrology/article/54/6/1071/1407557 by guest on 05 July 2022
MnO. Ilm composition varies from Ilm70^90, with 45^48wt % FeO and 37^44wt % TiO2.Clinopyroxenes in CHO are a Ca-rich augite (Fig. 6),
with 1^2wt % Al2O3, 10^11wt % MgO, and TiO2
50·5wt %, compositionally similar to that reported forDOM trachytes (Maury et al., 1980). In contrast to CHO,CLI contains Cpx richer in Al2O3 (5^10wt %), TiO2
(1^2wt %), and MgO (12^15wt %), compositionally simi-lar to that reported for the CDP basalts (Maury et al.,1980). Therefore, the Cpx in CLI is probably inheritedfrom mafic magmas and is not considered as belonging tothe CLI trachyte assemblage. Similarly in KIL, the twoCpx identified show compositions intermediate betweenthose in CHO and CLI (2^5 wt % Al2O3, �0·7wt %
analytical error
62 64 66 68 70SiO2 (wt %)
9
10
11
12
13
Na 2O
+ K
2O (w
t %)
CHO
DOMSARVAS
KIL
CLI
Alkaline
Sub-alkaline
15
13
11
9
7
5
3
1
Na 2O
+ K
2O (w
t %)
37 41 45 49 53 57 61 65 69 73 77
SiO2 (wt %)
phonolite
tephriphonolite
phonotephrite
tephrite /basanite
foidite
picro-basalt
trachy-basalt
basaltic trachy- andesite
trachy-andesite
basalt
basalticandesite
andesitedacite
rhyolite
trachyte /trachydacite
VOLCANIC ROCK TYPES (Le Bas et al., 1986)
Fig. 2. Total alkalis vs SiO2 bulk-rock composition of the CDP trachytes. Classification of volcanic rock types is from Le Bas et al. (1986). Filledsymbols are from this study and open symbols are from Camus (1975), Pupin (1976), Maury et al. (1980), Foury (1983), Arnaud (1989) andGuittet (1996). Upward-pointing triangles, CHO; circles, DOM; crosses (þ and �), SAR; diamonds, KIL; squares,VAS; downward-pointing tri-angles, CLI. It should be noted that the data from this study have higher alkali contents owing to the alkali correction applied to the EMPanalyses.
MARTEL et al. TRACHYTES, CHAI“ NE DES PUYS
1077
Dow
nloaded from https://academ
ic.oup.com/petrology/article/54/6/1071/1407557 by guest on 05 July 2022

(b)DOM
BtIlm
Pl(An18Or8)
Afs(An3Or48)
(a)CHO
Afs(An2Or48)
Pl(An18Or7)
Bt
(f)CLI
Am(kaersutite)
(d)KIL
Am(pargasite)
An41Or3 x An39Or4
x An35Or4 x An32Or5 xAn36Or4 x
(c)CLI(Pl)
(e)SAR
Bt (oxidized)
300 µm 300 µm
300 µm300 µm
150 µm 150 µm
(g)CHO-Pumice
(Titanite)
(h)KIL-Pumice(Amphibole)
Glass inclusion with7.7 wt % H2O Glass inclusion with
6.7 wt % H2O~3400 ppm Cl~670 ppm F~300 ppm S
20 µm 50 µm
Fig. 3. Textural details of the natural trachytes. Photomicrographs of minerals in CHO (a), DOM (b), CLI (c) and (f), KIL (d), and SAR (e).SEM images of glass inclusions trapped in a titanite from CHO_Pumice (g) and in an amphibole from KIL_Pumice (h).
JOURNAL OF PETROLOGY VOLUME 54 NUMBER 6 JUNE 2013
1078
Dow
nloaded from https://academ
ic.oup.com/petrology/article/54/6/1071/1407557 by guest on 05 July 2022
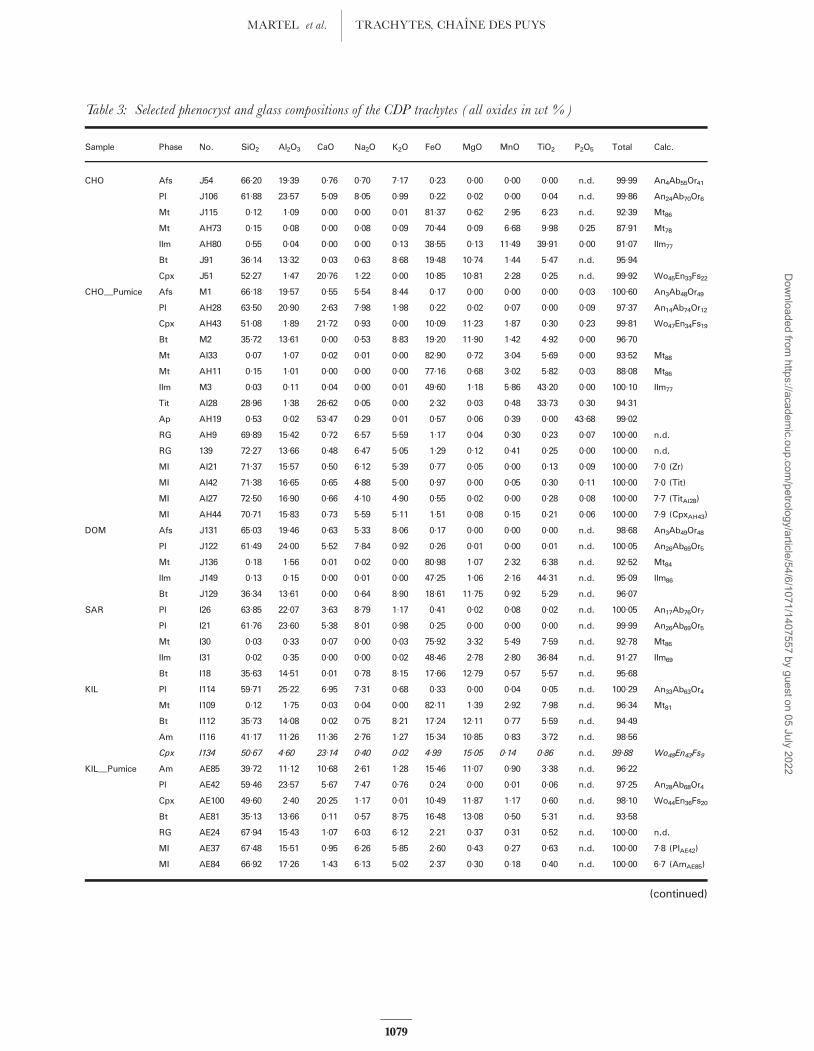
Table 3: Selected phenocryst and glass compositions of the CDP trachytes (all oxides in wt %)
Sample Phase No. SiO2 Al2O3 CaO Na2O K2O FeO MgO MnO TiO2 P2O5 Total Calc.
CHO Afs J54 66·20 19·39 0·76 0·70 7·17 0·23 0·00 0·00 0·00 n.d. 99·99 An4Ab55Or41
Pl J106 61·88 23·57 5·09 8·05 0·99 0·22 0·02 0·00 0·04 n.d. 99·86 An24Ab70Or6
Mt J115 0·12 1·09 0·00 0·00 0·01 81·37 0·62 2·95 6·23 n.d. 92·39 Mt86
Mt AH73 0·15 0·08 0·00 0·08 0·09 70·44 0·09 6·68 9·98 0·25 87·91 Mt78
Ilm AH80 0·55 0·04 0·00 0·00 0·13 38·55 0·13 11·49 39·91 0·00 91·07 Ilm77
Bt J91 36·14 13·32 0·03 0·63 8·68 19·48 10·74 1·44 5·47 n.d. 95·94
Cpx J51 52·27 1·47 20·76 1·22 0·00 10·85 10·81 2·28 0·25 n.d. 99·92 Wo45En33Fs22
CHO_Pumice Afs M1 66·18 19·57 0·55 5·54 8·44 0·17 0·00 0·00 0·00 0·03 100·60 An3Ab48Or49
Pl AH28 63·50 20·90 2·63 7·98 1·98 0·22 0·02 0·07 0·00 0·09 97·37 An14Ab74Or12
Cpx AH43 51·08 1·89 21·72 0·93 0·00 10·09 11·23 1·87 0·30 0·23 99·81 Wo47En34Fs19
Bt M2 35·72 13·61 0·00 0·53 8·83 19·20 11·90 1·42 4·92 0·00 96·70
Mt AI33 0·07 1·07 0·02 0·01 0·00 82·90 0·72 3·04 5·69 0·00 93·52 Mt88
Mt AH11 0·15 1·01 0·00 0·00 0·00 77·16 0·68 3·02 5·82 0·03 88·08 Mt86
Ilm M3 0·03 0·11 0·04 0·00 0·01 49·60 1·18 5·86 43·20 0·00 100·10 Ilm77
Tit AI28 28·96 1·38 26·62 0·05 0·00 2·32 0·03 0·48 33·73 0·30 94·31
Ap AH19 0·53 0·02 53·47 0·29 0·01 0·57 0·06 0·39 0·00 43·68 99·02
RG AH9 69·89 15·42 0·72 6·57 5·59 1·17 0·04 0·30 0·23 0·07 100·00 n.d.
RG 139 72·27 13·66 0·48 6·47 5·05 1·29 0·12 0·41 0·25 0·00 100·00 n.d.
MI AI21 71·37 15·57 0·50 6·12 5·39 0·77 0·05 0·00 0·13 0·09 100·00 7·0 (Zr)
MI AI42 71·38 16·65 0·65 4·88 5·00 0·97 0·00 0·05 0·30 0·11 100·00 7·0 (Tit)
MI AI27 72·50 16·90 0·66 4·10 4·90 0·55 0·02 0·00 0·28 0·08 100·00 7·7 (TitAI28)
MI AH44 70·71 15·83 0·73 5·59 5·11 1·51 0·08 0·15 0·21 0·06 100·00 7·9 (CpxAH43)
DOM Afs J131 65·03 19·46 0·63 5·33 8·06 0·17 0·00 0·00 0·00 n.d. 98·68 An3Ab49Or48
Pl J122 61·49 24·00 5·52 7·84 0·92 0·26 0·01 0·00 0·01 n.d. 100·05 An26Ab69Or5
Mt J136 0·18 1·56 0·01 0·02 0·00 80·98 1·07 2·32 6·38 n.d. 92·52 Mt84
Ilm J149 0·13 0·15 0·00 0·01 0·00 47·25 1·06 2·16 44·31 n.d. 95·09 Ilm86
Bt J129 36·34 13·61 0·00 0·64 8·90 18·61 11·75 0·92 5·29 n.d. 96·07
SAR Pl I26 63·85 22·07 3·63 8·79 1·17 0·41 0·02 0·08 0·02 n.d. 100·05 An17Ab76Or7
Pl I21 61·76 23·60 5·38 8·01 0·98 0·25 0·00 0·00 0·00 n.d. 99·99 An26Ab69Or5
Mt I30 0·03 0·33 0·07 0·00 0·03 75·92 3·32 5·49 7·59 n.d. 92·78 Mt86
Ilm I31 0·02 0·35 0·00 0·00 0·02 48·46 2·78 2·80 36·84 n.d. 91·27 Ilm69
Bt I18 35·63 14·51 0·01 0·78 8·15 17·66 12·79 0·57 5·57 n.d. 95·68
KIL Pl I114 59·71 25·22 6·95 7·31 0·68 0·33 0·00 0·04 0·05 n.d. 100·29 An33Ab63Or4
Mt I109 0·12 1·75 0·03 0·04 0·00 82·11 1·39 2·92 7·98 n.d. 96·34 Mt81
Bt I112 35·73 14·08 0·02 0·75 8·21 17·24 12·11 0·77 5·59 n.d. 94·49
Am I116 41·17 11·26 11·36 2·76 1·27 15·34 10·85 0·83 3·72 n.d. 98·56
Cpx I134 50·67 4·60 23·14 0·40 0·02 4·99 15·05 0·14 0·86 n.d. 99·88 Wo48En43Fs9
KIL_Pumice Am AE85 39·72 11·12 10·68 2·61 1·28 15·46 11·07 0·90 3·38 n.d. 96·22
Pl AE42 59·46 23·57 5·67 7·47 0·76 0·24 0·00 0·01 0·06 n.d. 97·25 An28Ab68Or4
Cpx AE100 49·60 2·40 20·25 1·17 0·01 10·49 11·87 1·17 0·60 n.d. 98·10 Wo44En36Fs20
Bt AE81 35·13 13·66 0·11 0·57 8·75 16·48 13·08 0·50 5·31 n.d. 93·58
RG AE24 67·94 15·43 1·07 6·03 6·12 2·21 0·37 0·31 0·52 n.d. 100·00 n.d.
MI AE37 67·48 15·51 0·95 6·26 5·85 2·60 0·43 0·27 0·63 n.d. 100·00 7·8 (PlAE42)
MI AE84 66·92 17·26 1·43 6·13 5·02 2·37 0·30 0·18 0·40 n.d. 100·00 6·7 (AmAE85)
(continued)
MARTEL et al. TRACHYTES, CHAI“ NE DES PUYS
1079
Dow
nloaded from https://academ
ic.oup.com/petrology/article/54/6/1071/1407557 by guest on 05 July 2022

0 20 40 6050
80
An
50
70
90
10 30
100
60
40
Ab
CLI
DOM
SAR
KIL
VAS
Feldspars
750°C/400 MPa750°C/350 MPa700°C/300 MPa750°C/300 MPa800°C/300 MPa775°C/240 MPa750°C/200 MPa800°C/200 MPaNatural
60
40
20
0
10
50
30
CHO
Or
Fig. 4. Feldspar compositions in the experiments compared with the natural compositions, including those from Maury et al. (1980) for SARand CLI, Foury (1983) for CLI, and Arnaud (1989) for CHO, DOM,VAS, and CLI.
Table 3: Continued
Sample Phase No. SiO2 Al2O3 CaO Na2O K2O FeO MgO MnO TiO2 P2O5 Total Calc.
VAS Pl I89 59·76 24·80 6·58 7·38 0·73 0·22 0·00 0·00 0·06 n.d. 99·55 An32Ab64Or4
Pl I80 61·49 23·49 5·36 8·01 0·97 0·29 0·00 0·03 0·00 n.d. 99·65 An25Ab69Or6
Pl I88 63·51 22·41 3·94 8·42 1·39 0·20 0·00 0·00 0·03 n.d. 99·90 An19Ab73Or8
Mt I69 0·13 1·92 0·00 0·04 0·00 80·51 1·47 2·73 8·14 n.d. 94·94 Mt80
Bt I64 36·22 13·49 0·00 0·70 8·34 16·96 12·41 0·70 5·50 n.d. 94·32
Am I61 40·52 11·36 10·82 2·77 1·24 16·46 10·21 0·87 3·31 n.d. 97·56
Am I173 39·96 12·34 11·12 2·79 1·19 15·36 10·49 0·69 3·92 n.d. 97·85
CLI Pl J10 60·48 24·79 6·96 7·36 0·83 0·34 0·00 0·00 0·05 n.d. 100·76 An33Ab62Or5
Mt J41 0·14 0·32 0·00 0·08 0·08 79·58 2·19 3·15 4·88 n.d. 90·41 Mt90
Ilm J42 0·03 0·35 0·02 0·02 0·00 45·38 1·31 1·73 43·92 n.d. 92·78 Ilm88
Am J30 41·26 11·60 11·38 2·65 1·25 15·17 11·18 0·70 3·63 n.d. 98·84
Am J7 39·72 13·63 11·7 2·58 1·07 13·39 11·49 0·22 5·14 n.d. 98·95
Cpx J2 48·14 8·47 20·86 0·82 0·00 8·13 12·51 0·14 2·09 n.d. 101·15 Wo47En39Fs14
Sample names are as in Table 1. n.d., not determined. Afs, alkali feldspar; Pl, plagioclase; Mt, titano-magnetite; Ilm,ilmenite; Cpx, clinopyroxenes; Am, amphibole; Tit, titanite; RG, residual glass; MI, melt inclusion; inherited phenocrysts initalic (not stable in the trachyte paragenesis). Glass compositions are recalculated on anhydrous basis. Calc. gives thecalculated structural formulae in mol % of anorthite (An), albite (Ab), and orthoclase (Or) for Pl, wollastonite (Wo),enstatite (En), and ferrosilite (Fs) for Cpx, magnetite (Mt), ilmenite (Ilm), and the H2O content of the glass inclusion withthe host crystal in parentheses.
JOURNAL OF PETROLOGY VOLUME 54 NUMBER 6 JUNE 2013
1080
Dow
nloaded from https://academ
ic.oup.com/petrology/article/54/6/1071/1407557 by guest on 05 July 2022

TiO2, and 12^15wt % MgO), and are not considered asstable phases in the KIL trachyte.Biotites contain 5^6wt % TiO2,14^15wt % Al2O3, and
12^13wt % MgO, with those in CHO being slightly en-riched in FeO with respect to the other samples (Fig. 7);that is, having Mg* [Mg/(FeþMg)] �0·50 versus�0·54^0·57.Amphiboles in KIL, VAS, and CLI are titanian-
hastingsite to titanian-pargasite in composition after thenomenclature of Leake et al. (1997), with �11wt % Al2O3
(AlIV �1·7^1·9 p.f.u.; Fig. 8a), �11 wt % CaO, 3^4wt %TiO2, and Mg* �0·55. In CLI, a second population ofAm, which are kaersutite (AlIV �2·0^2·2 p.f.u.; Figs 3fand 8b), coexist with the hastingsite or pargasite. Onekaersutite has also been analysed inVAS. These kaersutitesare similar in composition to the amphiboles analysed inthe CDP basalts (Maury et al., 1980), suggesting theirinherited nature in CLI andVAS.The glasses in the lava dome related samples, either as
melt inclusions or matrix glasses, were too crystallizedfor analysis. Therefore, glasses were analysed inKIL_Pumice and CHO_Pumice, associated with explosiveevents (Table 3). In CHO_Pumice, the glasses are rhyolites,with SiO2 ranging from 70 to 73wt %.The matrix glassesare compositionally more evolved than the glass inclusions(SiO2 �72 vs 70wt % on average, respectively; Fig. 9a).In KIL_Pumice, glasses in both matrix and inclusions(hosted in Pl, Am, Mt, and Bt) are rhyodacite, with65^70wt % SiO2, 15^17·5wt % Al2O3, 0·6^18 wt % CaO,�2^3wt % FeO, and 6^7·5wt % Na2O (Fig. 9b).
Volatile content of the glasses
The volatiles dissolved in glasses are assumed to be mainlyH2O, with minor contents of F, Cl, and S (50·5wt %;Table 4).In CHO_Pumice, the glass inclusions trapped in Cpx,Tit
or Zr contain up to 7·9 � 0·5wt % H2O (Table 4; Fig. 3g).
60
40
60
60
40
40
40
0 20 40 60Fs (mol %)
4060
CHO
SAR
KIL
VAS
CLI
60
6040
Wo (m
ol %)
En (m
ol %
)
Clinopyroxenes
825°C /400 MPa 750°C/400 MPa750°C/350 MPa700°C/300 MPa750°C/300 MPa 775°C/240 MPa750°C/200 MPa800°C/200 MPa
+NaturalInherited ?
Fig. 6. Clinopyroxene compositions in the experiments comparedwith the natural compositions, including those from Maury et al.(1980) for CLI and Foury (1983) for CHO. The dashed circles delimitcrystals that may be inherited from a mafic component.
50 60 70 80 90 100Magnetite (mol % )
Titanomagnetite
825°C / 400 MPa700°C / 300 MPa750°C / 300 MPa800°C / 300 MPa750°C / 200 MPa775°C / 240 MPa800°C / 200 MPa900°C / 200 MPaNatural
CHO
DOM
SAR
KIL
VAS
CLI
Approximate ΔNNO-1.0 +0.0 +1.0
+Ilm
Fig. 5. Magnetite compositions in the experiments compared with the natural compositions, including those fromMaury et al. (1980) for DOM,SAR and CLI, Foury (1983) for CHO, SAR, and CLI, and Arnaud (1989) for DOM andVAS.
MARTEL et al. TRACHYTES, CHAI“ NE DES PUYS
1081
Dow
nloaded from https://academ
ic.oup.com/petrology/article/54/6/1071/1407557 by guest on 05 July 2022

30
10
30
50
40
20M
g
Al
60
40
20
Fe + Mn
750°C / 400 MPa825°C / 400 MPa
750°C / 350 MPa700°C / 300 MPa800°C / 300 MPa
750°C / 200 MPa775°C / 240 MPa
800°C / 200 MPa Natural
Biotites
50
30
40 6050 70
CHO DOM SAR KIL VAS CLI50 100
Al (mol %)
100
50
Fe + Mn (m
ol %)
100
50
Mg (
mol
%)
(a)
(b)
30
50 55 60 65 70 75 80 85 90 95 100Mt
[Magnetite] (mol %)
20
30
40
50
Fe+M
n[B
iotit
e] (m
ol. %
) Approximate ΔNNO
-1.5 -0.5 +0.0 +0.5 +1.0
+Ilm
CHO
SARDOMVAS
KIL
700°C750°C
800°C
Fig. 7. Experimental biotite compositions (a) compared with magnetite compositions (b). The dots are the natural compositions, includingthose from Maury et al. (1980) for DOM and SAR, Foury (1983) for CHO and SAR, and Arnaud (1989) for DOM.
0.8 0.9 1 1.1Cations in A-site
1.7
1.8
1.9
2
2.1
2.2
AlIV
(pfu
)
0.4 0.5 0.6 0.7 0.8Mg / (Mg + Fe)
VAS
errormax.
er rormax.
Amphibolesexperimental natural 825°C / 400 MPa KIL 800°C / 300 MPa VAS 800°C / 200 MPa CLI 900°C / 200 MPa
(a) (b)
-0.5 +0.5
+1
CLI CLI
CLI
CLI
VAS
VAS VAS
CLI
CLI
CLI
CLI
Fig. 8. Amphibole compositions calculated after Richard & Clarke (1990): (a) AlIV vs number of cations in the A-site; (b) AlIV vsMg*¼Mg/(MgþFe). The natural compositions include those from Maury et al. (1980) for CLI, Foury (1983) for CLI, and Arnaud (1989)forVAS and CLI.
JOURNAL OF PETROLOGY VOLUME 54 NUMBER 6 JUNE 2013
1082
Dow
nloaded from https://academ
ic.oup.com/petrology/article/54/6/1071/1407557 by guest on 05 July 2022

In contrast, glass inclusions in Bt and Afs phenocrysts arepoorer in H2O (�4wt %), which may be explained byvolatile loss through the cleavage planes typical for thesecrystals. Matrix glasses show maximum H2O contents of1^2wt %.The melt inclusions have relatively high concen-trations in chlorine (i.e. 3400 � 1400 ppm), which decreaseto �1700 ppm in the matrix glasses. Sulphur concentra-tions are 300 � 300 ppm in the glass inclusions. Only oneresidual glass has been analysed for S, yielding �900 ppm,
so that comparison with the melt inclusions may not be re-liable. Fluorine contents in melt inclusions or residualglasses are around the limit of detection of our analyticaltechnique (i.e. �700 ppm).In KIL_Pumice, the glass inclusions trapped in pheno-
crysts of Pl and Am (Fig. 3h) have H2O contents up to7·8 � 0·5wt % (Table 4; the shrinkage air-bubble in one ofthese inclusions gives confidence in its volatile-tightnature). The maximum H2O contents analysed in the
68 70 72 74 760.2
0.4
0.6
0.8
1
1.2
68 70 72 74 76
1
2
3
1
2
1
2
3
1
2
1
2
3
CaO
(wt %
)
FeO
(wt %
)
62 64 66 68 70 72 74 76SiO2 (wt %)
62 64 66 68 70 72 74 76SiO2 (wt %)
CHO CHO
MODMOD
RASRAS
7.7Tit
7.0Zr
7.0Tit
7.9Cpx7.1Cpx
7.7Tit
7.0Tit
7.0Zr
7.9Cpx7.1Cpx
in Mt
+Bt+Bt
+Bt+Bt+Bt
+Bt
analytical error
Mt
Cpx
Afs Pl
Mt
Bt
Afs+Pl
Mt Bt
Cpx+A
fs+Pl
Mt
Cpx
Afs Pl
Mt
Bt
Afs
+Pl
Mt
Bt
Cpx+
Afs
+Pl
Fig. 9. Experimental glass compositions. The dots represent the natural compositions of the interstitial glasses and the small open circles aremelt inclusions, some of them labelled with their volatile content and host mineral (abbreviation as inTable 2). The dashed lines represent theappearance curves of the experimental phases.
(continued)
MARTEL et al. TRACHYTES, CHAI“ NE DES PUYS
1083
Dow
nloaded from https://academ
ic.oup.com/petrology/article/54/6/1071/1407557 by guest on 05 July 2022

1
2
3
1
2
3
0
1
2
3
1
2
3
62 64 66 68 70 72 74 76SiO2 (wt %)
0
1
2
3
62 64 66 68 70 72 74 76SiO2 (wt %)
0
1
2
3
4
LIKLIK
SAVSAV
ILCILC
analytical error
6.7Am
7.8Plag
7.8Plag
6.7Am
GLASSESExperimental 825°C / 400 MPa
750°C / 400 MPa 750°C / 350 MPa
700°C / 300 MPa 750°C / 300 MPa 800°C / 300 MPa 775°C / 240 MPa 750°C / 200 MPa 800°C / 200 MPa
900°C / 200 MPa
NaturalBulk rock
Interstitial glass Melt inclusion
CaO
(wt %
)
FeO
(wt %
)
H2O wt%(host mineral)
Mt
Bt+Cpx
/Am
Pl+A
fs
Mt
Bt
Cpx+P
l+Afs
Am
Mt+
Am
Bt+Pl
Am out
Cpx
Mt
Bt+C
px Pl+A
fs
Mt
Bt
Cpx+
Pl+A
fs
Am
Mt+
Am
Bt+P
l
Am ou
tCp
x
Fig. 9. Continued.
JOURNAL OF PETROLOGY VOLUME 54 NUMBER 6 JUNE 2013
1084
Dow
nloaded from https://academ
ic.oup.com/petrology/article/54/6/1071/1407557 by guest on 05 July 2022
matrix glasses is 1^2wt %. Cl, S, and F have not been ana-lysed in KIL_Pumice.
Results and limitations of the estimates ofthe trachyte magma storage conditionsTemperature and fO2The presence of coexisting Mt and Ilm as phenocrysts inmost trachyte samples can be used to constrain theT^fO2
crystallization conditions. Before using the Mt^Ilm oxy-thermometer of Ghiorso & Sack (1991), which was not for-mulated originally for trachytic compositions, we tested itfor one of our experimental charges (800DOM2) that crys-tallized Mt and Ilm at 8008C, 200MPa, and reducing con-ditions (��NNO ^1). The formulation gives a T of834 � 388C and �NNO ^1·3 at 200MPa (Table 5), thusvalidating its use for trachytes. Pairs of spatially close Mtand Ilm that passed the test of chemical equilibrium(Bacon & Hirschmann,1988) were therefore used to calcu-late T^fO2 values using the method of Ghiorso & Sack(1991). The results show a negative correlation betweenT
and the bulk SiO2 content of the host-rock, withT increas-ing from �7728C in DOM to 8748C in SAR and �9558Cin VAS, for �NNO varying from þ0·4 to þ1·7 (Table 5).For the CLI sample, the Mt^Ilm geothermometer suggestsan unrealistically lowTof 6358C, which probably reflectsMt^Ilm re-equilibration processes during magma cooling.Indeed, it has been experimentally shown that 5 mm sizedFe^Ti oxides can re-equilibrate within 4^5 days (Venezky& Rutherford, 1999; Devine et al., 2003; Martel &Schmidt, 2003).
Temperature may also be estimated from amphibole^plagioclase equilibrium. Testing the geothermometer ofHolland & Blundy (1994) on an experimental charge(800CLI2) that crystallized both phases at 8008C and200MPa yields a T of 7908C at 200MPa (Table 6);thus this formulation can be used with confidence fortrachytic compositions. Assuming a P of 200^300MPa,the natural minerals suggest crystallization temperaturesof 821^8248C for VAS and 815^8408C for CLI (Table 6),which are significantly lower than those obtained fromthe Mt^Ilm oxythermometer (9558C forVAS).Tand fO2 may be retrieved from the amphibole compos-
ition using the formulations of Ridolfi & Renzulli (2012).This model is based on amphibole composition recalcu-lated on the basis of 13 cations and has been calibrated forbasaltic to dacitic compositions. Tested against ourAm-bearing run products, the calculated T values agreewithin error (258C) with run T, except for two runs inwhich the calculated T is about 1208C away from run T
(Table 7). Applied to the CDP, this thermometer yieldsTfrom 780 to 9408C. Similarly, using the formulation ofRidolfi & Renzulli (2012) to calculate fO2 from the amphi-bole composition suggests conditions from �NNO ^0·5 toþ3·4 for the natural trachytes (Table 7).
Pressure
Pressure may also be estimated from amphibole compos-ition. Because the existing Am-barometers have not beencalibrated on trachytic compositions (at best on quartzlatite; Johnson & Rutherford, 1989; or calc-alkaline tonal-ite; Schmidt, 1992), we first tested our run products with
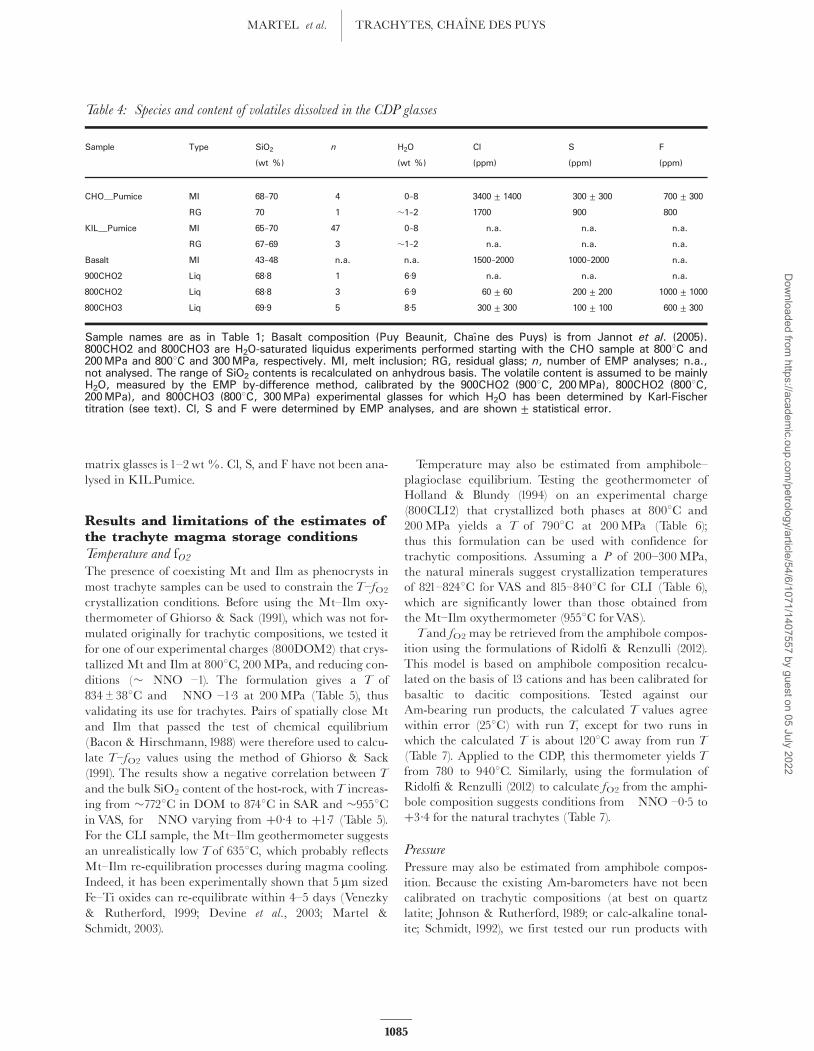
Table 4: Species and content of volatiles dissolved in the CDP glasses
Sample Type SiO2 n H2O Cl S F
(wt %) (wt %) (ppm) (ppm) (ppm)
CHO_Pumice MI 68–70 4 0–8 3400±1400 300±300 700±300
RG 70 1 �1–2 1700 900 800
KIL_Pumice MI 65–70 47 0–8 n.a. n.a. n.a.
RG 67–69 3 �1–2 n.a. n.a. n.a.
Basalt MI 43–48 n.a. n.a. 1500–2000 1000–2000 n.a.
900CHO2 Liq 68·8 1 6·9 n.a. n.a. n.a.
800CHO2 Liq 68·8 3 6·9 60±60 200±200 1000±1000
800CHO3 Liq 69·9 5 8·5 300±300 100±100 600±300
Sample names are as in Table 1; Basalt composition (Puy Beaunit, Cha|Œ ne des Puys) is from Jannot et al. (2005).800CHO2 and 800CHO3 are H2O-saturated liquidus experiments performed starting with the CHO sample at 8008C and200MPa and 8008C and 300MPa, respectively. MI, melt inclusion; RG, residual glass; n, number of EMP analyses; n.a.,not analysed. The range of SiO2 contents is recalculated on anhydrous basis. The volatile content is assumed to be mainlyH2O, measured by the EMP by-difference method, calibrated by the 900CHO2 (9008C, 200MPa), 800CHO2 (8008C,200MPa), and 800CHO3 (8008C, 300MPa) experimental glasses for which H2O has been determined by Karl-Fischertitration (see text). Cl, S and F were determined by EMP analyses, and are shown±statistical error.
MARTEL et al. TRACHYTES, CHAI“ NE DES PUYS
1085
Dow
nloaded from https://academ
ic.oup.com/petrology/article/54/6/1071/1407557 by guest on 05 July 2022

the formulation of Anderson & Smith (1995). This model isvalid in the 620^8208C T range for P from 100 to1000MPa, and for a phase assemblage consisting ofAmþQzþPl (An25^35)þAfs (sanidine)þBtþMt(þmeltþ fluid). Only two of our experiments have therequired paragenesis, with the exception of Afs (thus cal-culating maximum P): CLI sample at 8008C and200MPa (800CLI2) and 8008C and 300MPa (800CLI3).For both runs, the formulation yields a P of 300 � 60MPaat 8008C, which agrees with the run performed at300MPa (Table 7). The run performed at 200MPa showsa dominance of Ilm over Mt, which reflects reducing con-ditions that induce Altot enrichment in Am, and possiblyresult in P overestimation (Anderson & Smith, 1995).Regardless, we used the formulation of Anderson &Smith (1995) to estimate the crystallization P in the CDPtrachytes. This geobarometer is highly sensitive to T (upto 200MPa per 1008C), so that in the absence of conclusiveT estimates for the natural trachytes, we calculated P at800 and 8508C (Table 7). In the natural trachytes, Amhave mean Altot from 1·98 in KIL to 2·37 in CLI, giving P
from 391 to 547MPa at 8008C and from 236 to 380MPa
at 8508C. However, as suggested above, some of these Ambelong to a different (basaltic) phase assemblage, whichmay lead to higher P than expected for the trachyticreservoirs.The formulation of Ridolfi & Renzulli (2012) that gives
P from Am composition has the advantage of being cali-brated for alkaline magmas and does not require a givenphase assemblage. Tested against our run products, the for-mulation suggests the correct P for the runs at 400 and300MPa, whereas P is overestimated by 150MPa at200MPa (Table 7). Applied to the natural Am, the calcu-lated P range is from 288 to 380MPa for Am with Altotfrom 1·98 to 2·20, and a P of 469MPa for the CLI Amthat has 2·37 Altot (Table 7).
Pre-eruptive volatile content
The pre-eruptive volatile content may be retrieved fromthe volatiles dissolved in the glass inclusions, assumingthat they were trapped in the magma chamber and re-mained volatile-tight after entrapment. The highest H2Oconcentrations in CHO and KIL glass inclusions are�8·0wt %, which corresponds to a minimum value in the
Table 5: Magnetite^ilmenite oxythermometry
Sample Mt* Ilm* log(Mg/Mn)y GEOTHERMz
Mt Ilm T (8C) log fO2 �NNO Mean
CHO_Pumice AI33 M3 �0·38 �0·45 740 �14·38 þ0·8 750±108C
AH11 M3 �0·40 �0·45 760 �13·85 þ0·7 �NNOþ 0·7
DOM J141 J149 �0·06 �0·07 787 �13·63 þ0·4 772±388C
J136 J149 �0·10 �0·07 722 �14·85 þ0·7 �NNO þ0·7
J141 J130 �0·06 �0·30 825 �12·54 þ0·7
J136 J130 �0·10 �0·30 756 �13·75 þ1·0
SAR I30 I31 0·03 0·24 888 �10·38 þ1·6 874±298C
I30 I32 0·03 0·30 884 �10·46 þ1·6 �NNO þ1·6
I33 I31 0·00 0·24 892 �10·36 þ1·6
I33 I32 0·00 0·30 888 �10·44 þ1·6
I58 I54 0·16 0·37 816 �11·74 þ1·7
VAS A_I32 A_I33 �0·08 �0·03 976 �9·27 þ1·2 955±218C
A_I34 A_I33 �0·02 �0·03 934 �9·81 þ1·4 �NNO þ1·3
CLI J41 J42 0·09 0·12 635 �16·96 þ1·0 680±458C
J31 J42 0·18 0·12 725 �14·87 þ0·6 �NNO þ0·8
800DOM2 P8 P7 0·04 0·09 796 �15·40 �1·6 834±388C
P8 P12 0·04 0·06 872 �13·35 �1·0 �NNO –1·3
Sample names are as in Table 1, except for VAS (data from Arnaud, 1989) and 800DOM2 (run product using DOMsample and performed at 8008C, 200MPa, and �NNO –1).*Magnetite (Mt) and ilmenite (Ilm) analysis reference as in Table 3.yChemical equilibrium test after Bacon & Hirschmann (1988).zCalculation after the formulation of Ghiorso & Sack (1991); �NNO¼ log fO2 – log fO2 of the NNO buffer calculated atthe reference pressure of 300MPa after Chou (1987).
JOURNAL OF PETROLOGY VOLUME 54 NUMBER 6 JUNE 2013
1086
Dow
nloaded from https://academ
ic.oup.com/petrology/article/54/6/1071/1407557 by guest on 05 July 2022

case of leakage after entrapment. Because Cl, S, and Fcon-centrations in the glass inclusions are50·5wt % (Table 4),we consider H2O as the main dissolved volatile species.H2O solubility models place constraints on minimumpre-eruptive pressures. The H2O solubility model of DiMatteo et al. (2004; calibrated for trachytic compositions)predicts a P of �250MPa at �8508C for a melt H2O con-tent of 8·0wt %. Our own H2O solubility data acquiredon the CHO composition give 6·9 and 8·5wt % dissolvedH2O at 200 and 300MPa, respectively (Table 4).Further insight on the magma water concentration may
be obtained from the Bt^Afs^Mt equilibrium(Czamanske & Wones, 1973), three phases that are presentas phenocrysts in the CHO_Pumice (Table 3). For Afs, theactivity^composition model of Waldbaum & Thompson(1969) yields an activity for the KAlSi3O8 component of0·6 (Fabbrizio et al., 2006). For Mt, structural formulae cal-culations and activity^composition relations as given byFabbrizio et al. (2006) have been adopted, yielding activ-ities for the Fe3O4 component of around 0·9. Fe3þ in Btwas calculated as equal to AlIV ^ 2þ (NaþK ^ 2) (Deeret al., 1992), corresponding to a proportion of Fe as Fe3þ
around 10^15% in CHO_Pumice Bt. The activity^compos-ition model of Czamanske & Wones (1973), also used byFabbrizio et al. (2006), was adopted in this study for Bt.Results (Table 8) sensitively depend on T and fO2, butfH2O values corresponding to near H2O-saturation are ob-tained for 7508C and �NNO þ0·7; that is, for theT^fO2
determined from Mt^Ilm oxythermometry for theCHO_Pumice (Table 5). This suggests that the phenocrystscrystallized under H2O-rich conditions in the CHOmagma.
Pre-eruptive conditions
In summary, the pre-eruptive conditions determined fromthe petrological study of the natural trachytes are (1) Tof�780^8508C for CLI, �806^9558C for VAS, �7758C forDOM, depending on the geothermometer used, (2) fO2 be-tween ^0·5 and þ3·4, (3) P from 200 to 400MPa, and (4)melt H2O contents up to 8·0wt %. Besides potential differ-ences in storage conditions specific to each studied trach-ytic centre, the variation in the estimated pre-eruptiveconditions may arise from (1) mineral re-equilibrationsupon magma ascent or emplacement as a dome, (2) use ofinappropriate phase assemblage (crystal inheritance frommafic magmas), and (3) application of models outside thecompositional calibration range.
PHASE EQU IL I BR IAPhase relationsTo better constrain the pre-eruptive P^T^fO2^H2O condi-tions for the CDP trachytes, phase equilibria were deter-mined for P ranging from 200 to 400MPa,T between 700and 9008C, �NNO from ^1 to þ1, and H2O-saturatedconditions (Table 9). Such data also provide informationon the phase relationships of variously fractionated trach-ytic liquids in a given P^Trange.
Effect of bulk-rock composition
The phase relationships show a general consistency in theorder of crystallization with melt evolution (Table 9). At8008C and 200MPa, liquidus conditions are obtained for69·0wt % SiO2 (CHO), then Fe^Ti oxides and Bt appearin melts with 66·7wt % SiO2 (DOM), followed by Cpxfor 65·0wt % SiO2 (KIL,VAS), whereas Pl þ Am replaceCpx in melts with SiO2562·6wt % (CLI). Although theorder of phase appearance is consistent for most of theP^T conditions investigated, some cases show more com-plicated relations. For instance, Cpx is present in CHO inthe range 700^7508C and 200^350MPa (runs 4, 5, 10 and11), disappears in DOM, and is present again in meltswith lower SiO2 contents, which we attribute to differencesin bulk composition. In particular, the bulk compositionof DOM is slightly depleted in alkali components com-pared with the other trachytes with SiO2464wt %(Fig. 2), which may explain the absence of Cpx. As notedin other experimental studies (Dall’Agnol et al., 1999),some Am can display Cpx cores, which possibly reflectsgrowth of the Cpx during the early stages of the run(heating up period) when H2O has not yet diffused homo-geneously throughout the melt. This, together with theoverall small size of the crystals, makes the straightforwarddistinction between Am and Cpx in some charges (KILin particular) difficult. As a result, whenever positive iden-tification was lacking, the corresponding phase boundary
Table 6: Amphibole^plagioclase thermobarometry
Sample Am Pl GEOTHERM*
P (MPa) T (8C)
VAS I61 I80 200 823
300 824
I73 I89 300 821
CLI J7 J10 300 830
J30 J10 300 815
800CLI2 P75 P64 200 790
Sample names are as in Table 1, except for 800CLI2 (runproduct using CLI sample and performed 8008C and200MPa). Amphibole (Am) and plagioclase (Pl) analysesare given in Table 3.*Calculated temperature (T) for an assumed pressure (P) of200 and 300MPa, after the formulation of Holland &Blundy (1994).
MARTEL et al. TRACHYTES, CHAI“ NE DES PUYS
1087
Dow
nloaded from https://academ
ic.oup.com/petrology/article/54/6/1071/1407557 by guest on 05 July 2022

was inferred on the basis of phase relationships observed inother trachytes.
Effect of pressure and temperature
The phase relations in the range 700^9008C and200^400MPa for each trachytic composition are shown inFig. 10. For all compositions, Fe^Ti oxides are the liquidusphase, crystallizing at T49008C and at 800^8508C inCHO. Fe^Ti oxides are mostly Mt under moderately oxi-dized conditions (�NNO �0 to þ1), together with Ilm inthe reduced experiment (��NNO ^1).In CHO (69·0wt % SiO2; Fig. 10a), Mt crystallization is
shortly followed by Cpx appearance. Bt crystallizationoccurs only within the low-Tand high-P space (below 7258Cand 300MPa, and 8008C and 400MPa). Afs rimmed by Pl
appear atT57508C, in roughlyequalAfs-Pl volumepropor-tions.Minor phases have been detected, such as Zr at 9008Cand 200MPa (liquidus conditions for the other phases) andtitanite in two charges atP� 300MPa.In DOM (66·7wt % SiO2; Fig. 10b), Fe^Ti oxide crystal-
lization is followed by Bt atT �8508C. Pl and Afs coexistbelow 8008C. In contrast to CHO, Pl is rimmed by Afsand is volumetrically dominant over Afs. Cpx is absent inthe investigated P^T range. Zr was detected in nearly allcharges.SAR (65·5wt % SiO2; Fig. 10c) shows Mt, Bt, Pl, and
Afs phase appearance very close to DOM, and addition-ally crystallizes Cpx at T58008C. It was not possible todiscriminate the saturation curves of Cpx from PlþAfs.Zr and Tit are present in most charges.
Table 7: Amphibole thermobarometry
Sample Amphibole* AS95y RR12z
No. Altot T P±60 T±25 P±45 �NNO±0·5
(8C) (MPa) (8C) (MPa)
KIL I116 1·98 800 391 910 341 þ3·0
850 236
KIL_Pumice AE85 1·99 800 394 939 380 þ3·4
850 250
VAS I61 2·02 800 406 915 362 þ3·0
850 250
I173 2·20 800 477 806 351 þ0·9
850 315
CLI J30 2·04 800 414 782 288 þ1·3
850 257
J7 2·37 800 547 821 469 �0·5
850 380
825VAS4 2·00 942 378 þ5·2
825CLI4 2·15 858 399 þ3·6
800VAS3 2·03 779 270 þ1·0
800CLI3 2·12 800 300 684 252 �0·3
800CLI2 2·11 800 290 828 342 þ1·5
900CLI2 1·99 876 370 þ4·5
Sample names are as in Table 1, except for the following run products: 825VAS4 and 825CLI4 performed at 8258C,400MPa, �NNO þ1, using VAS and CLI samples, respectively; 800VAS3 and 800CLI3 performed at 8008C, 300MPa,�NNO, and using VAS and CLI samples, respectively; 800CLI2 and 900CLI2 performed at 8008C and 9008C, respectively,200MPa, �NNO þ1, and using CLI sample.*No. gives the amphibole analysis number as in Table 3, with total Al content, Altot (in mol) recalculated on the basis of13 cations after Leake et al. (1997).yFormulation of Anderson & Smith (1995) based on Altot in Am; pressure (P) calculated for temperatures (T) of 800 and8508C.zFormulation of Ridolfi & Renzulli (2012), based on Am composition (recalculated on the basis of 13 cations; Leake et al.,1997) with pressure (P) calculated after their equation (1b), temperature (T) after their equation (2) (without consideringthe last parameter on pressure ‘24·41LnP’, which increases T about 1008C and thus strongly deviates from the experi-mental T), and �NNO after their equation (3).
JOURNAL OF PETROLOGY VOLUME 54 NUMBER 6 JUNE 2013
1088
Dow
nloaded from https://academ
ic.oup.com/petrology/article/54/6/1071/1407557 by guest on 05 July 2022

KIL (65·1wt % SiO2; Fig. 10d) shows similar Mt, Bt, Pland Afs phase relationships to DOM and SAR (with avolumetrically dominant Pl rimmed by Afs). In KIL, Cpxcrystallizes at a higherT than in SAR (i.e. between 825and 9008C; potentially close to Bt). ForT58008C and P
of 300^400MPa, the composition of the ferromagnesianphase is intermediate between Am and Cpx, suggestingAm crystallization at lowT and high P and intergrowthsbetween the two phases. Zr and Tit were observed asminor phases in some charges.TheVAS sample (65·0wt %; Fig. 10e), which has a SiO2
content similar to KIL, displays similar phase boundariesfor feldspars (with Afs finely rimming Pl), Mt, and Bt.The Cpx^Am phase relations appear different from thosein KIL, but significant intergrowths and the very smallsize of these crystals probably distort the exact Cpx^Amtopological relationships. Am appears between 825 and9008C in VAS and is replaced by Cpx at T between 750and 8008C, whereas in KIL, Cpx appears first (between825 and 9008C) and is replaced with Am at lower T.Therefore, Am stability is favoured inVAS at the expenseof Cpx, whereas the opposite is true in KIL. This can beattributed to differences in minor element contents such asF that would favour Am crystallization inVAS. Zr and Titare present in most charges.CLI (62·6wt %; Fig. 10f) shows phase relations distinct
from those of the other trachytes. Mt and Am are the liqui-dus phases atT49008C. Am destabilizes into Cpx below aP^T domain defined by 7508C and 400MPa and 8008Cand 200MPa. Co-precipitation of Pl and Bt occurs in a re-strictedTrange of 800^8258C. Afs is stable only atT below�7508C. The determination of the mineral phases in thecharges atT� 7508C was particularly difficult owing to thehigh fractions and small sizes of the crystals.
Phase compositionsThe compositions of the experimental Fe^Ti oxides are re-ported inTable 10. Fe^Ti oxides are liquidus or near-liquidusphases. Mt seems to be little dependent on the bulk compos-ition of the starting melt (Fig. 5). In contrast, Fe^Ti oxidesare strongly fO2 dependent, with crystallization of Mt88^98with 2^5wt % of TiO2 in the experiments performed at�NNO40, Mt68^74 with 10^11wt % of TiO2 for��NNO ^0·5, and Mt53 withTiO2 up to 15wt % when co-existing with Ilm91^93 at ��NNO ^1·3.The compositions of the experimental Bt are reported in
Table 11. Bt has Al contents between 30 and 40mol %,Mg contents between 20 and 45mol %, and FeþMn ran-ging from 20 to 45mol % (Fig. 7a). In DOM, SAR, KIL,and VAS, Bt is the sub-liquidus phase (crystallizing afterMt), whereas it appears later (at lowerT) in the crystal-lization sequence of CHO and CLI (Fig. 10). However, thesimilarity in Bt composition in the different trachytes forthe given P^T^fO2 conditions suggests little compositionalcontrol (Fig. 7a). All other parameters being equal, Btcomposition is also little affected by P (slight increase of�5^10Mg mol % with P decreasing from 400 to200MPa at 7508C). In contrast, T and fO2 both havestrong effects on Bt composition, with FeþMn increasingfrom 22 to 45mol % for aT increase from 700 to 8258Cat ��NNO þ0·5 and from 22 to 35mol % with fO2
decreasing over �1·5 log units at 8008C. The combinedvariations of Mt and Bt compositions were used as an oxy-thermometer (Fig. 7b).The experimental Cpx are augite to salite in com-
position, with 40^50 Wo mol % and 15^35 En mol %(Table 12; Fig. 6). The experimental Cpx tend to becomepoorer in theWo component with starting melt enrichmentin bulk SiO2 content (^5mol % Wo from CLI to CHO).In the most differentiated melts (CHO, SAR, and KIL),Cpx have similar compositions within error for givenP^T^fO2 conditions, whereas they are slightly enriched inthe En content (�5mol %) inVAS and CLI.Amphibole is present only in the two less evolved com-
positions, VAS and CLI. These are titanian-hastingsites totitanian-pargasites after Leake et al. (1997), containing 11^12wt % Al2O3, �2·5wt % Na2O, and �3wt % TiO2
(Table 13). Am is very sensitive to P,T, fO2, and melt com-position (Fig. 8). For the CLI composition, all other param-eters being equal, increasing P from 200 to 400MPa at800^8258C increases the cation number in the A-sitefrom �0·82 to 1·02 p.f.u. and AlIV from 1·78 to 1·94 p.f.u.(Fig. 8a). IncreasingT from 800 to 9008C at 200MPa in-creases the cation number in the A-site from 0·82 to 0·90p.f.u. whereas AlIV decreases slightly. The effect of thestarting melt composition is highlighted by the runs per-formed either at 8008C and 300MPa or at 8258C and400MPa, in which AlIV slightly decreases and the cationnumber in the A-site slightly increases with increasing
Table 8: Biotite^alkali feldspar (sanidine)^magnetite
geohygrometry
T log fO2 �NNO fH2O aH2O H2O melt
(8C) (bar) (bar) (wt %)
700 �15·42 þ0·7 1177 0·59 4·0
725 �14·78 þ0·7 1629 0·78 5·2
750 �14·17 þ0·7 2221 1·01 47·0
750 �14·37 þ0·5 1764 0·80 5·4
750 �13·97 þ0·9 2796 1·27 47·0
All calculations were performed for a pressure of 3000 bar.Bt, Afs, and Mt compositions are from Table 3 (analysesM2, M1, and AI33, respectively). (See text for the calcula-tion of fH2O). aH2O¼ fH2O/fH2O8 with fH2O8 taken fromBurnham et al. (1969). H2O melt is calculated from P, Tand aH2O (Burnham, 1979) for a melt having the compos-ition of the melt inclusion AI21 (Table 3).
MARTEL et al. TRACHYTES, CHAI“ NE DES PUYS
1089
Dow
nloaded from https://academ
ic.oup.com/petrology/article/54/6/1071/1407557 by guest on 05 July 2022

Table 9: Experimental conditions, phase assemblages and proportions
Sample Phase assemblage and proportion
Major phases (proportions in wt %) �R2 Gl/cryst (vol. %) Minor phases
Run 2, 200MPa, 9008C, fO2 �NNO þ1, 4 days
900CHO2 Gl(100) 0 100/0 Zr
900DOM2 Gl(99)þMt(1) 0·1 99/1 Zr
900SAR2 Gl(99)þMt(1) 0·1 99/1
900KIL2 Gl(99)þMt(1) 0·3 99/1
900VAS2 Gl(99)þMt(1) 0·7 99/1
900CLI2 Gl(95)þMt(2)þAm(3) 0·3 96/4
Run 3, 200MPa, 8008C, fO2 5NNO, 12 days
800CHO2 Gl(100) 0 100/0
800DOM2 Gl(98)þ Ilm(51)þMt(51)þBt(1) 0·2 99/1 Zr
800SAR2 Glþ IlmþBt 99/1 Zr
800KIL2 Glþ IlmþBtþCpx 0·3 98/2
800VAS2 Gl(98)þ Ilm(51)þBt(1)þCpx(1) 0·1 99/1 Zr
800CLI2 Gl(86)þ Ilm(1)þBt(1)þPl(2)þAm(10) 0·4 86/14
Run 4, 210MPa, 7508C, fO2 �NNO, 10 days
750CHO2 Gl(68)þMt(1)þCpx(3)þAfs(29) 0·8 78/22 Zr
750DOM2 Gl(52)þMt(2)þBt(1)þPl(22)þAfs(23) 0·4(1·2) 65/35
750SAR2 GlþMtþBtþCpxþPlþAfs 56/44
750KIL2 GlþMtþBtþCpxþPlþAfs 51/49
750VAS2 GlþMtþBtþCpxþPlþAfs 50/50
750CLI2 GlþMtþBtþCpxþPl 47/53
Run 5, 300MPa, 7508C, fO2 �NNO þ1, 7 days
750CHO3 Gl(97)þMt(1)þCpx(3) 3·2(0·8) 98/2 Tit
750DOM3 GlþMtþBtþPlþAfs 71/29
750SAR3 GlþMtþBtþCpxþPlþAfs 64/36 Zr
750KIL3 GlþMtþBtþCPx/AmþPlþAfs 46/54
750VAS3 GlþMtþBtþCpxþPlþAfs 53/47 Zr
750CLI3 GlþMtþBtþCpxþAmþPlþAfs 38/62
Run 6, 290MPa, 8008C, fO2 �NNO –0·5, 7 days
800CHO3 GlþMtþCpx 99/1
800SAR3 Gl(93)þMt(1)þBt(6) 0·6(4·3) 93/7 Zr
800KIL3 GlþMtþBtþCpx/Am 93/7
800VAS3 Gl(92)þMt(1)þBt(2)þAm(5) 0·6(4·0) 94/6
800CLI3 Gl(77)þMt(2)þBt(2)þPl(10)þAm(11) 0·9(3·8) 74/26 Zr
Run 7, 240MPa, 7758C, fO2 �NNO þ1, 17 days
775CHO2.5 GlþMtþCpx 98/2 Tit
775DOM2.5 GlþMtþBtþPlþAfs 79/21 Zr
775SAR2.5 Gl(55)þMt(2)þBt(2)þCpx(1)þPl(28)þAfs(12) 0·5(1·6) 59/41 ZrþTit
775VAS2.5 GlþMtþBtþCpxþPlþAfs 52/48 ZrþTit
775CLI2.5 GlþMtþBtþCpxþPlþAm 39/61
Run 8, 400MPa, 8258C, fO2 �NNO þ1, 10 days
825CHO4 Gl(99)þMt(1) 1·1(3·5) 99/1
825DOM4 Gl(96)þMt(2)þBt(3) 0·3(2·0) 97/3 Zr
825SAR4 Gl(94)þMt(1)þBt(5) 0·4(2·9) 95/5
825KIL4 GlþMtþBtþCpx 1·7(4·5) 95/5
(continued)
JOURNAL OF PETROLOGY VOLUME 54 NUMBER 6 JUNE 2013
1090
Dow
nloaded from https://academ
ic.oup.com/petrology/article/54/6/1071/1407557 by guest on 05 July 2022

bulk-SiO2 content of the starting melts (from CLI toVAS).The Mg* of Am reflects the redox conditions (Fig. 8b),with Mg* �0·45 characterizing runs performed at��NNO ^0·5, Mg* �0·6 for ��NNO þ0·5, and Mg*�0·7 for ��NNO þ1 (the redox conditions are deducedfrom the Fe^Ti oxide compositions; Fig. 5).The experimental feldspar compositions are reported in
Table 14. Both Pl and Afs crystallized in all the samples,except from CLI, in which only Pl is present.With increas-ing degree of differentiation of the bulk-rock, the feldsparsbecome slightly enriched in alkali components (i.e. shiftingtowards the Ab and Or components from CLI to CHO;Fig. 4). Pl composition is known to be particularly sensitiveto bothTand melt H2O content, as observed in our experi-ments. All other parameters being equal, the An contentin Pl increases in CLI from An19 to An35 whenT increases
from 750 to 8008C at 300MPa, or from An26 to An42 forthe same T increase at 200MPa. The influence of meltH2O content is here directly related to P (H2O-saturatedconditions) and has little effect on Pl composition in the Prange of 200-400 MPa.The experimental residual glasses are trachyte to rhyo-
lite in composition, with SiO2 ranging from 65·2 to75·8wt %, CaO from 2·8 to 0·5wt % (Fig. 9), and alkalicontent from 11·0 to 7·9wt % (Table 15). The residualglass compositions directly reflect the P-T crystallizationconditions, and thus, the proportion and nature of thecrystallized phases. Plotting rock-glass tie-lines as a func-tion of P-T for a given bulk-rock composition shows thatdecreasing T leads to more differentiated residual melts(enriched in normative Qz in relation to Ab, but constantin Or; Fig. 11) and to a decreasing peralkalinity index (e.g.
Table 9: Continued
Sample Phase assemblage and proportion
Major phases (proportions in wt %) �R2 Gl/cryst (vol. %) Minor phases
825VAS4 Gl(94)þMt(1)þBt(51)þAm(5) 0·3(2·7) 95/5 Tit
825CLI4 Gl(88)þMt(2)þAm(10) 0·9(4·7) 94/6
Run 9, 400MPa, 7508C, fO2 �NNO þ1, 10 days
750CHO4 Gl(92)þMt(1)þBt(8)þCpx(51) 0·8(6·2) 94/6
750DOM4 GlþMtþBtþPlþAfs 88/12 Zr
750SAR4 GlþMtþBtþCpxþPlþAfs 75/25 Tit
750KIL4 GlþMtþBtþCpx/AmþPlþAfs 68/32 ZrþTit
750VAS4 GlþMtþBtþAmþPlþAfs 62/38 Tit
750CLI4 GlþMtþBtþAmþPlþAfs 47/53 Tit
Run 10, 300MPa, 7008C, fO2 �NNO þ1, 10 days
700CHO3 GlþMtþBtþCpxþPlþAfs 59/41
700DOM3 GlþMtþBtþPlþAfs 56/44 Zr
700SAR3 GlþMtþBtþCpxþPlþAfs 36/64
700KIL3 GlþMtþBtþCpx/AmþPlþAfs �15/85 Zr
700VAS3 GlþMtþBtþCpxþPlþAfs �15/85
700CLI3 GlþMtþBtþCpxþPlþAfs �5/95
Run 11, 350MPa, 7508C, fO2 �NNO þ1, 4 days
750CHO3.5 GlþMtþBtþCpx 97/3
750DOM3.5 Gl(79)þMt(2)þBt(4)þPl(15)þAfs 1·1(2·6) 80/20 Zr
750SAR3.5 GlþMtþBtþCpxþPlþAfs 73/27
750KIL3.5 GlþMtþBtþCpx/AmþPlþAfs 68/32 Tit
750VAS3.5 GlþMtþBtþCpxþPlþAfs 63/37 Tit
750CLI3.5 GlþMtþBtþCpx/AmþPlþAfs 51/49 Tit
Run product is either CHO, DOM, SAR, KIL, VAS, or CLI (bulk-rock compositions in Table 2). Phase abbreviations are asin Table 2; phases are in italics when not clearly identified. Numbers in parentheses are phase proportions calculated bymass balance, with residual squares (�R2) given in the next column (the main number and the number in parentheses givethe residual square without considering Na2O and with whole oxides, respectively, showing that the Na analysis is themain cause for some far too high �R2). For 750DOM2, Mt composition is from 750DOM3; for 775SAR2.5, Mt and Bt arefrom 775VAS2.5 and Afs is from 750VAS3; for 750CHO4, Mt is from 750CHO3; for 750DOM3.5, Mt and Afs are from700DOM3. Glass/crystal proportion (Gl/cryst) was determined by image analysis.
MARTEL et al. TRACHYTES, CHAI“ NE DES PUYS
1091
Dow
nloaded from https://academ
ic.oup.com/petrology/article/54/6/1071/1407557 by guest on 05 July 2022

200
250
300
350
400
Pres
sure
( MPa
)
Pl
Afs
Cpx Bt
Ox+Tit+Zr+Ap
+Zr+Zr
+Tit
Ox
AfsPl
Bt
+Tit
Cpx
+Zr
+Zr
Bt
Pl+
Afs
+Zr
+Zr
+Zr
+Zr?
+Zr
Ox
Pl Bt
Ox+Zr+Ap
(a) (b)
?
6
3
2
22
41
1
1
2
0 0
24 2312
20
29
35
44
3
1 1
21
Pl Bt
Ox+Zr
+Zr+Tit
Bt
Afs+
Cpx
+Zr
+Zr+Zr
+Tit
?
?
?
Pl
Ox
(c) 25
27
36
41
64
44
1
5
1 1
10 (d)Pl
Am
Bt
Ox
+Ap
Bt+
Cpx+
Am?
Pl
+Zr+Tit
?
+Zr
?
+Tit
Afs
?
?
Ox
Am??
?
??
?
275
7
12
32
32
54
49
Cpx??
?
Solid
us~90
700 750 800 850 900Temperature (°C)
Pl
Am
Bt
Ox+Ap
+Zr+Tit
Bt+
Am
Afs
+Zr
+Tit
Cpx Am
?
?
+Tit
?
+Tit
+Zr
Pl
Ox
700 750 800 850 900
Pl
Am Ox+Ap
Cpx Am
+Tit
?
+Zr
+Tit
+Tit
? ?
Bt
?
Afs
+Tit?
?
??
?
Pl
Am+
Ox
?
(e) (f)
? ?
?
Solid
us
Solid
us
~90
38
37
47
50
5
6
1 1
48
4
6
26
53
49
62
53
~95
61
14
18 15
200
250
300
350
400
200
250
300
350
400
MODOHC
SAR KIL
VAS CLI
Afs
Fig. 10. Phase relations for the six CDP trachytes under H2O saturation conditions and fO2 �NNO ^1 to NNO þ1.The block of six squares in theupper right corner of each phase diagram gives the natural phase assemblage (phase abbreviations as inTable 2) for a given trachyte sample, to-gether with the phenocryst modal proportion in vol. % (Table 2). The experimental phase assemblages are given by the black filled squares (sameorder as for the natural ones), with question marks where the phases could not be clearly identified. The corresponding numbers show the experi-mental modal proportion in vol. % (Table 9). The continuous-line curves delimit the phase stability fields and the dashed line shows the solidus.The diagonally shaded area characterizes the P^Tconditions at which the natural and experimental phase assemblages are similar.
JOURNAL OF PETROLOGY VOLUME 54 NUMBER 6 JUNE 2013
1092
Dow
nloaded from https://academ
ic.oup.com/petrology/article/54/6/1071/1407557 by guest on 05 July 2022
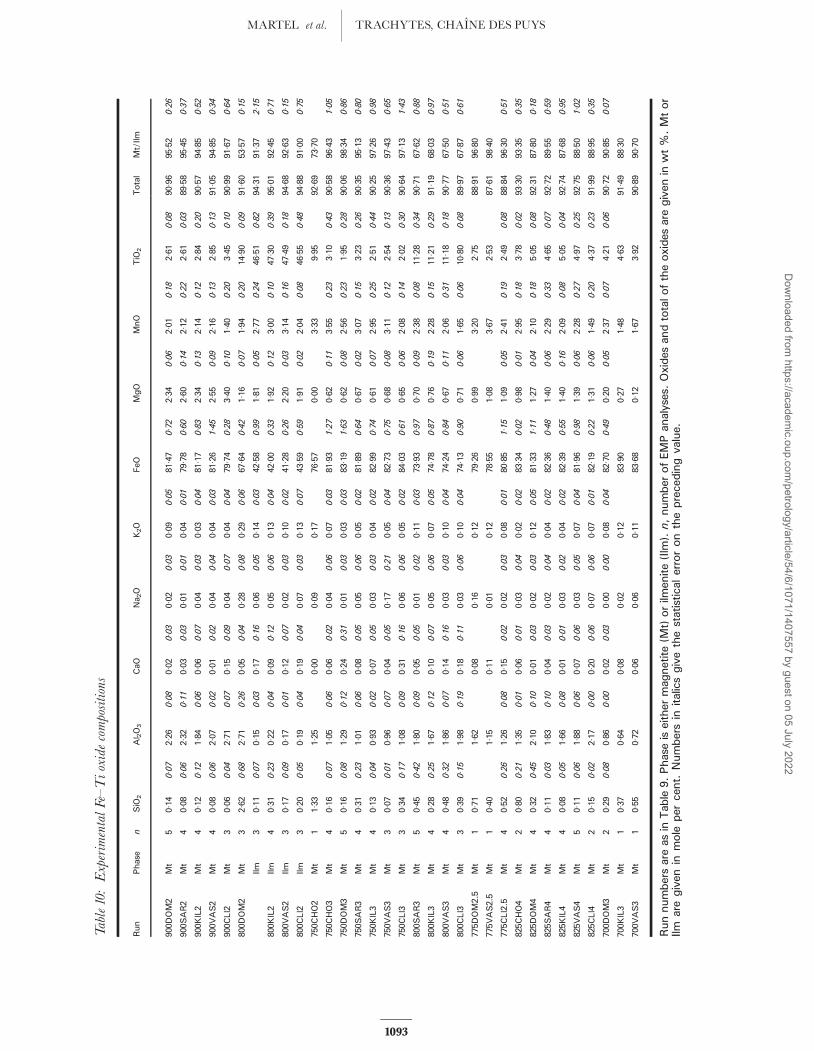
Table10:ExperimentalFe^Tioxidecompositions
Run
Phase
nSiO
2Al 2O3
CaO
Na 2O
K2O
FeO
MgO
MnO
TiO
2Total
Mt/Ilm
900D
OM2
Mt
50·14
0·07
2·26
0·08
0·02
0·03
0·02
0·03
0·09
0·05
81·47
0·72
2·34
0·06
2·01
0·18
2·61
0·08
90·96
95·52
0·26
900S
AR2
Mt
40·08
0·06
2·32
0·11
0·03
0·03
0·01
0·01
0·04
0·01
79·78
0·60
2·60
0·14
2·12
0·22
2·61
0·03
89·58
95·45
0·37
900K
IL2
Mt
40·12
0·12
1·84
0·06
0·06
0·07
0·04
0·03
0·03
0·04
81·17
0·83
2·34
0·13
2·14
0·12
2·84
0·20
90·57
94·85
0·52
900V
AS2
Mt
40·08
0·06
2·07
0·02
0·01
0·02
0·04
0·04
0·04
0·03
81·26
1·45
2·55
0·09
2·16
0·13
2·85
0·13
91·05
94·85
0·34
900C
LI2
Mt
30·06
0·04
2·71
0·07
0·15
0·09
0·04
0·07
0·04
0·04
79·74
0·28
3·40
0·10
1·40
0·20
3·45
0·10
90·99
91·67
0·64
800D
OM2
Mt
32·62
0·68
2·71
0·26
0·05
0·04
0·28
0·08
0·29
0·06
67·64
0·42
1·16
0·07
1·94
0·20
14·90
0·09
91·60
53·57
0·15
Ilm3
0·11
0·07
0·15
0·03
0·17
0·16
0·06
0·05
0·14
0·03
42·58
0·99
1·81
0·05
2·77
0·24
46·51
0·82
94·31
91·37
2·15
800K
IL2
Ilm4
0·31
0·23
0·22
0·04
0·09
0·12
0·05
0·06
0·13
0·04
42·00
0·33
1·92
0·12
3·00
0·10
47·30
0·39
95·01
92·45
0·71
800V
AS2
Ilm3
0·17
0·09
0·17
0·01
0·12
0·07
0·02
0·03
0·10
0·02
41·28
0·26
2·20
0·03
3·14
0·16
47·49
0·18
94·68
92·63
0·15
800C
LI2
Ilm3
0·20
0·05
0·19
0·04
0·19
0·04
0·07
0·03
0·13
0·07
43·59
0·59
1·91
0·02
2·04
0·08
46·55
0·48
94·88
91·00
0·75
750C
HO2
Mt
11·33
1·25
0·00
0·09
0·17
76·57
0·00
3·33
9·95
92·69
73·70
750C
HO3
Mt
40·16
0·07
1·05
0·06
0·06
0·02
0·04
0·06
0·07
0·03
81·93
1·27
0·62
0·11
3·55
0·23
3·10
0·43
90·58
96·43
1·05
750D
OM3
Mt
50 ·16
0·08
1·29
0·12
0·24
0·31
0·01
0·03
0·03
0·03
83·19
1·63
0·62
0·08
2·56
0·23
1·95
0·28
90·06
98·34
0·86
750S
AR3
Mt
40·31
0·23
1·01
0·06
0·08
0·05
0·05
0·06
0·05
0·02
81·89
0·64
0·67
0 ·02
3·07
0·15
3·23
0·26
90·35
95·13
0·80
750K
IL3
Mt
40·13
0·04
0·93
0·02
0·07
0·05
0·03
0·03
0·04
0·02
82·99
0·74
0·61
0·07
2·95
0·25
2·51
0·44
90·25
97·26
0·98
750V
AS3
Mt
30·07
0·01
0·96
0·07
0·04
0·05
0·17
0·21
0·05
0·04
82·73
0·75
0·68
0·08
3·11
0·12
2·54
0·13
90·36
97·43
0·65
750C
LI3
Mt
30·34
0·17
1·08
0·09
0·31
0·16
0·06
0·06
0·05
0·02
84·03
0·61
0·65
0·06
2·08
0·14
2·02
0·30
90· 64
97·13
1·43
800S
AR3
Mt
50·45
0·42
1·80
0·09
0·05
0·05
0·01
0·02
0·11
0·03
73·93
0·97
0·70
0·09
2·38
0·08
11·28
0·34
90·71
67·62
0·88
800K
IL3
Mt
40·28
0·25
1·67
0·12
0·10
0·07
0·05
0·06
0·07
0·05
74·78
0·87
0·76
0·19
2·28
0·15
11·21
0·29
91·19
68·03
0·97
800V
AS3
Mt
40·48
0·32
1·86
0·07
0·14
0·16
0·03
0·03
0·10
0·04
74·24
0·84
0·67
0·11
2·06
0·31
11·18
0·18
90·77
67·50
0·51
800C
LI3
Mt
30·39
0·15
1·98
0 ·19
0·18
0·11
0·03
0·06
0·10
0·04
74·13
0·90
0·71
0·06
1·65
0·06
10·80
0·08
89·97
67·87
0·61
775D
OM2.5
Mt
10·71
1·62
0·08
0·16
0·12
79·26
0·99
3·20
2·75
88·91
96·80
775V
AS2.5
Mt
10·40
1·15
0·11
0·01
0·12
78·55
1·08
3·67
2·53
87·61
98·40
775C
LI2.5
Mt
40·52
0·26
1·26
0·08
0·15
0·02
0·02
0·03
0·08
0·01
80·85
1·15
1·09
0·05
2·41
0·19
2·49
0·08
88·84
96·30
0·51
825C
HO4
Mt
20·80
0·21
1·35
0·01
0·06
0·01
0·03
0·04
0·02
0·02
83·34
0·02
0·98
0·01
2·95
0·18
3·78
0·02
93·30
93·35
0·35
825D
OM4
Mt
40·32
0·45
2·10
0·10
0·01
0·03
0·02
0·03
0·12
0·05
81·33
1·11
1·27
0·04
2·10
0·18
5·05
0·08
92·31
87·80
0·18
825S
AR4
Mt
40·11
0·03
1·83
0·10
0·04
0·03
0 ·02
0·04
0·04
0·02
82·36
0·48
1·40
0·06
2·29
0·33
4·65
0·07
92·72
89·55
0·59
825K
IL4
Mt
40·08
0·05
1·66
0·08
0·01
0·01
0·03
0·02
0·04
0·02
82·39
0·55
1·40
0·16
2·09
0·08
5·05
0·04
92·74
87·68
0·95
825V
AS4
Mt
50·11
0·06
1·88
0·06
0·07
0·06
0·03
0·05
0·07
0·04
81·96
0·98
1·39
0·06
2·28
0·27
4·97
0·25
92·75
88·50
1·02
825C
LI4
Mt
20·15
0·02
2·17
0·00
0·20
0·06
0·07
0·06
0·07
0·01
82·19
0·22
1·31
0·06
1·49
0·20
4·37
0·23
91·99
88·95
0·35
700D
OM3
Mt
20·29
0·08
0·86
0·00
0·02
0·03
0·00
0·00
0·08
0·04
82·70
0·49
0·20
0·05
2·37
0·07
4·21
0·06
90·72
90·85
0·07
700K
IL3
Mt
10·37
0·64
0·08
0·02
0·12
83· 90
0·27
1·48
4·63
91·49
88·30
700V
AS3
Mt
10·55
0·72
0·06
0·06
0·11
83·68
0·12
1·67
3·92
90·89
90·70
Runnumbersareas
inTab
le9.
Phaseiseither
mag
netite(M
t)orilm
enite(Ilm
).n,number
ofEMPan
alyses.Oxides
andtotaloftheoxides
aregiven
inwt%.Mtor
Ilmaregiven
inmole
per
cent.
Numbersin
italicsgivethestatisticalerrorontheprecedingvalue.
MARTEL et al. TRACHYTES, CHAI“ NE DES PUYS
1093
Dow
nloaded from https://academ
ic.oup.com/petrology/article/54/6/1071/1407557 by guest on 05 July 2022

Table11:Experimentalbiotitecompositions
Run
nSiO
2Al 2O3
CaO
Na 2O
K2O
FeO
MgO
MnO
TiO
2Total
Mg*
800D
OM2
835·66
0·35
14·03
0·45
0·02
0·05
0·74
0·06
8·19
0·14
17·57
0·39
11·17
0·55
0·45
0·11
4·45
0·47
92·26
0·53
800S
AR2
435·75
0·40
14·17
0·30
0·00
0·00
0·82
0·04
8·34
0·14
17·48
0·55
11·63
0·28
0·50
0·11
4·09
0·52
92·77
0·54
800K
IL2
235·39
0·21
14·07
0·25
0·09
0·03
0·80
0·03
8·19
0·24
17·27
0·40
11·58
0·20
0·34
0·08
4·72
0·25
92·45
0·55
800V
AS2
435·49
0·82
13·96
0·16
0·04
0·03
0·88
0·03
8·14
0·12
16·60
0·48
12·11
0·63
0·47
0·10
4·53
0·77
92·21
0·57
800C
LI2
235·03
0·08
14·98
0·22
0·06
0·02
0·93
0·07
8·30
0·13
18·04
0·62
10·94
0·10
0·48
0·05
4·92
0·57
93·68
0·52
750D
OM2
133·40
12·81
0·35
0·44
8·46
22·08
7·80
0·00
4·27
89·61
0·39
750K
IL2
134·12
12·42
0·88
0·82
6·85
19·81
9·21
0·90
3·22
88·24
0·45
800S
AR3
334·51
0·21
14·16
0·09
0·06
0·05
0·60
0·09
8·39
0·27
19·97
0·22
10·36
0·21
0·73
0·05
4·41
0·10
93·17
0·48
800K
IL3
435·71
0·43
14·25
0·36
0·05
0·03
0·98
0·20
7·96
0·16
19·24
0·25
9·44
0·25
0·75
0·06
4·51
0·23
92·86
0·47
800V
AS3
135·20
14·51
0·24
0·77
7·96
19·61
10·04
0·76
3·90
92·98
0·48
800C
LI3
234·64
0·36
14·91
0·25
0·16
0·11
0·66
0 ·02
8·26
0·18
19·73
0·34
10·20
0·11
0·56
0·08
4·23
0·03
93·32
0·48
775D
OM2.5
238·93
0·37
14·28
0·11
0·14
0·03
0·91
0·10
8·53
0·01
12·19
0·20
13·51
0·49
1·09
0·03
3·60
0·13
93·17
0·67
775V
AS2.5
240·50
0·30
14·27
0·01
0·23
0·12
1·14
0·17
8·31
0·29
11·59
0·48
13·78
0·69
1·17
0·18
3·39
0·30
94·37
0·68
775C
LI2.5
236·97
1·17
13·64
0·11
0·27
0·08
0·71
0·30
8·97
0·32
12·31
0·42
14·11
1·01
0·78
0·01
3·59
0·19
91·34
0·68
825D
OM4
435·88
0·74
14·48
0·25
0·25
0·32
0·66
0·15
8·77
0·34
13·98
0·55
14·34
0·56
0·56
0·10
4·20
0·16
93·12
0·65
825S
AR4
337·17
1·71
14·20
0·06
0·10
0·08
0·90
0·20
8·69
0·27
13·82
0·79
14·25
0·88
0·61
0·10
3·62
0·58
93·37
0·65
825K
IL4
235·96
0·57
14·45
0·16
0·05
0·07
0·81
0·13
8·82
0·16
13·85
0·60
15·12
0·11
0·61
0·10
4·25
0·02
93·90
0·67
825V
AS4
435·51
0·48
14·55
0·22
0·03
0·02
0·73
0·08
8·72
0·17
14·44
0·59
14·68
0·44
0·71
0·19
4·20
0·20
93·58
0·64
750C
HO4
235·74
2·80
12·92
0·51
0·11
0·08
0·54
0·05
8·27
0·64
23·49
1·46
6·66
0·57
1·33
0·16
4·65
0·51
93·71
0·34
750D
OM4
335·75
1·28
14·46
0·16
0·04
0·04
0·57
0·09
8·37
0·29
24·44
0·41
6·42
0·42
0·92
0·06
4·55
0·22
95·52
0·32
750S
AR4
236·64
1·30
13·73
0·11
0·17
0·09
0·73
0·27
8·18
0·17
23·60
0·28
6·51
0·22
0·90
0·15
4·28
0·01
94·72
0·33
750K
IL4
334·90
0·41
14·05
0·16
0·13
0·03
0·62
0·16
8·28
0·14
24·99
0·33
6·42
0·13
0·89
0·06
4·52
0·31
94·81
0·31
750V
AS4
435·19
0·75
14·07
0·19
0·06
0·05
0·58
0·07
8·52
0·18
23·81
1·27
6·94
0·30
1·03
0·12
4·65
0·13
94·83
0·35
750C
LI4
334·32
0·20
13·93
0·13
0·22
0·16
0·53
0·09
8·68
0·26
24·24
0·96
7·07
0·29
0·70
0·15
4·56
0·14
94·24
0·34
750C
HO3.5
140·21
13·47
0·07
0·96
7·90
20·85
6·56
1·05
3·98
95·05
0·36
750D
OM3.5
235·98
3·95
14·32
0·01
0·14
0·08
0·79
0·40
8·19
0·54
23·04
2·82
6·00
1·37
0·97
0·04
4·07
0·73
93·48
0·32
750S
AR3.5
138·95
14·62
0·16
0·98
8·33
21·91
6·57
0·94
4·04
96·50
0·35
750K
IL3.5
437·42
1·84
13·98
0·24
0·17
0·04
0·85
0·17
7·88
0·68
22·86
1·70
5·56
0·43
1·00
0·08
3·94
0·46
93·66
0·30
750V
AS3.5
138·98
13·53
0·30
1·32
7·59
21·19
4·65
0·99
3·47
92·01
0·28
750C
LI3·5
135·86
14·12
0·35
0·62
8·33
23·89
6·75
0·67
4 ·39
94·98
0·34
700D
OM3
142·16
13·23
0·29
0·81
7·55
21·37
5·95
1·62
3·20
96·16
0·33
Runnumbersareas
inTab
le9.
n,number
ofEMPan
alyses.Oxides
andtotalaregiven
inwt%;numbersin
italicsgivethestatisticalerrorontheprecedingvalue.
Mg*¼[M
g/(MgþFe)]in
mol%.
JOURNAL OF PETROLOGY VOLUME 54 NUMBER 6 JUNE 2013
1094
Dow
nloaded from https://academ
ic.oup.com/petrology/article/54/6/1071/1407557 by guest on 05 July 2022

Table12:Experimentalclinopyroxenecompositions
Run
nSiO
2Al 2O3
CaO
Na 2O
K2O
FeO
MgO
MnO
TiO
2Total
Wo
En
Fs
800K
IL2
449·40
0·93
2·31
1·00
21·22
0·18
0·56
0·20
0·07
0·01
10·47
1·18
11·27
0·60
1·41
0·23
0·73
0·21
97·43
45·96
33·94
20·10
800V
AS2
850·33
1·01
1·70
0·76
21·52
0·32
0·44
0·13
0·05
0·03
10·58
0·61
11·44
0·43
1·36
0·17
0·66
0·28
98·07
46·01
34·03
19·96
750C
HO2
549·22
0·75
3·82
0·74
19·44
0·59
1·35
0·21
0·33
0·16
13·65
0·92
7·64
0·45
3·24
0·55
1·19
0·33
99·89
44·91
24·58
30·51
750S
AR2
548·86
1·30
2·30
0·69
20·40
0·63
0·94
0·14
0·08
0·06
14·95
1·17
7·57
0·44
3·31
0·36
0·97
0·36
99·39
45·11
23·31
31·58
750K
IL2
153·10
4·32
18·42
1·82
0·60
12·75
7·75
2·24
0·61
101·62
45·00
26·35
28·65
750V
AS2
148·61
5·19
17·72
1·92
0·88
11·36
7·09
2·83
2·39
97·99
45·81
25·49
28·70
750C
HO3
848·59
1·39
4·52
0·61
19·25
0·94
1·54
0·13
0·29
0·25
10·15
0·87
9·97
0·35
2·98
0·38
0·97
0·31
98·26
44·36
31·99
23·65
750S
AR3
349·08
1·02
4·34
0·21
19·88
0·28
1·47
0·09
0·16
0·02
11·41
0 ·82
9·30
0·32
2·64
0·63
0·66
0·28
98·94
45·37
29·54
25·09
750K
IL3*
156·47
11·58
10·01
3·11
2·41
5·70
4·52
1·26
1·03
96·09
46·05
28·89
25·06
750V
AS3
448·21
1·83
7·42
0·84
17·93
2·03
1·88
0·29
0·76
0·46
10·40
1·04
8·01
0·79
1·93
0·30
1·85
0·36
98·37
46·29
28·80
24·91
750C
LI3
149·70
6·67
17·67
1·64
1·01
7·77
8·66
1·16
0·98
95·25
48·14
32·83
19·03
750C
LI3*
157·18
10·47
11·40
2·99
2·09
6·22
5·65
1·06
0·38
97·43
45·69
31·49
22·82
775C
HO2.5
148·61
2·73
19·60
0·88
0·04
16·02
7·41
2·83
0·49
98·62
43·89
23·10
33·01
775S
AR2.5
148·55
2·76
20·85
1·19
0·07
10·88
9·92
2·55
1·10
97·87
46·17
30·57
23·26
775V
AS2.5
148·29
4·47
17·94
1·25
0·76
7·81
8·59
1·84
3·25
94·18
47·92
31·92
20·16
775C
LI2.5
148·95
5·62
19·49
0·97
0·57
10·24
9·60
1·29
1·29
98·02
46·57
31·90
21·53
825K
IL4
349·72
0·99
2·66
0·53
21·37
0·58
0·89
0 ·08
0·20
0·08
10·48
1·32
10·96
1·33
1·32
0·40
0·59
0·12
98·18
46·62
33·20
20·18
750C
HO4
449·07
0·41
1·88
0·31
20·45
0·57
0·84
0·11
0·10
0·06
17·10
0·57
6·62
0·16
3·30
0·36
0·93
0·27
100·27
44·84
20· 18
34·98
750S
AR4
447·80
0·58
3·01
0·44
21·34
0·23
0·71
0·05
0·04
0·03
17·44
0·39
6·12
0·19
2·21
0·22
0·88
0·19
99·56
47·20
18·84
33·96
750K
IL4*
256·22
0·96
11·12
0·20
11·87
0·01
2·19
0·21
2·63
0·61
9·98
0·34
2·87
0·36
1·54
0·11
1·00
0·11
99·40
47·78
16·01
36·21
750V
AS4
143·97
5·87
21·27
0·95
0·04
16·45
5·91
2·03
2·17
98·65
48·40
18·72
32·88
750C
LI4*
252·14
2·39
7·88
0·80
16·14
1·80
1·85
0·17
1·02
0·32
11·93
1·95
5·80
0·05
1·16
0·04
1·20
0·50
99·09
46·85
23·53
29·62
700C
HO3
254·35
1·99
6·34
1·00
13·26
1·35
1·69
0·43
1·33
0·54
12·27
0·21
4·44
0·21
3·11
0·11
0·35
0·17
97·12
42·09
19·62
38·29
700S
AR3
347·29
0·56
3·13
0·27
18·91
0·40
1·29
0·02
0·23
0·11
15·59
0·73
6·35
0·56
4·14
0·27
1·22
0·39
98·16
43·79
20·43
35·78
700V
AS3
345·98
4·96
5·38
1·36
16·80
1·98
1·83
0·06
0·62
0·72
11·22
0·71
7·60
0·77
3·06
0·49
1·89
0·09
94·38
43·52
27·44
29·04
750C
HO3.5
549·47
0·57
2·02
0·51
20·07
0·52
0·85
0·16
0·16
0·07
15·73
0·26
6·99
0·20
3·30
0·32
0·51
0·18
99·10
44·92
21·79
33·29
750S
AR3.5
447·86
1·02
3·77
0·57
20·07
1·11
1·02
0·16
0·24
0·20
15·94
0 ·73
6·09
0·32
2·22
0·23
0·77
0·07
98·00
46·94
19·83
33·23
*Sam
plesthat
giveco
mpositionsinterm
ediate
betweenclinopyroxenean
dam
phibole,probab
lyresultingfrom
intergrowthsofboth
phases.
Runnumbersareas
inTab
le9.
n,number
ofEMPan
alyses.Oxides
andtotalaregiven
inwt%.Numbersin
italicsgivethestatisticalerrorontheprecedingvalue.
Wo,En,an
dFsaremole
per
centofwollastonite,
enstatite,
andferrosilite,
respectively.
MARTEL et al. TRACHYTES, CHAI“ NE DES PUYS
1095
Dow
nloaded from https://academ
ic.oup.com/petrology/article/54/6/1071/1407557 by guest on 05 July 2022

from 0·88 to 0·70 with T decreasing from 900 to 7758C;Table 15).The less-evolved trachyte (CLI) seems to have re-sidual melts enriched in normative Or with decreasing P
(Fig. 11). For given P^Tconditions, increasing SiO2 contentof the starting melt (from CLI to CHO) leads to residualmelts that show (1) a decrease in SiO2 and CaO (Fig. 9),(2) quasi-constant FeO contents (Fig. 9), and (3) a decreasein peralkalinity (Table 15).
TRACHYTE MAGMA STORAGECONDIT IONS AT CHA I“ NE DESPUYSWe compare below the paragenesis, phase proportions andcompositions of each of the six sampled trachytes withtheir respective experimental phase equilibria to deducepre-eruptive P^T^fO2^melt H2O conditions for the CDPtrachytes and a petrogenetic model for the magmareservoirs.
Puy Chopine (CHO; 69·0wt % SiO2)The natural phase assemblage of CHO consists of Fe^TioxidesþCpxþBtþAfsþPl, which is experimentallyreproduced for T57258C and P between 250 and400MPa (Fig. 10a). Only one experiment (7008C and300MPa) falls within the natural paragenesis field, butthe Mt, Pl, and Bt crystals were too small to be accuratelyanalysed, so that we lack both phase compositions andmass-balance calculations. However, the total crystal pro-portion of 41% determined by image analysis in thischarge (Table 9) is too high compared with the naturalcrystallinity of 21^24 % (Table 2). Crystallinity can be low-ered either by getting closer to the phase liquidus(increasingT) or by increasing P (as illustrated for DOMat 7508C in Fig. 10b). It follows that the 21^24% of pheno-crysts analysed in the natural CHO sample can beproduced by crystallization at �7008C and �350MPa.The natural Cpx compositions are not well reproduced
experimentally in terms of their Fe^Mg ratio (En30^40 vsEn15^30), except for the most oxidized experiment at��NNO þ1·1 (run at 7508C and 300MPa; Fig. 6). Thissuggests pre-eruptive conditions slightly more oxidizedthan those inferred from the Fe^Ti oxides (05�NNO5þ0·5; Fig. 5). The natural feldspars show a continuoustrend from Pl to Afs, which turns out to be of little help inconstraining P^Tconditions. The compositions of the nat-ural Bt and Mt are compatible with crystallization atT� 7508C, especially if Mt compositions underestimatefO2 (Fig. 7b). The melt inclusions trapped in Cpx, Tit, orZr phenocrysts suggest H2O contents �8wt % (Fig. 9),corresponding to a saturation pressure of �300MPa(Table 4). Therefore, we suggest pre-eruptive conditionsfor CHO close to 720 � 208C, 300^350MPa, �8wt %H2O, and �NNO þ1.
Puy de Do“ me (DOM; 66·7wt % SiO2)The DOM sample contains Fe^Ti oxidesþBtþPlþAfs, aparagenesis experimentally reproduced for T57758C(Fig. 10b). The natural Bt and Mt compositions in DOMare compatible with crystallization atT between 750 and8008C at ��NNO þ0·5 (Fig. 7b). However, the experi-mental phase assemblages at T �7508C poorly constrainP, which requires phase proportions and compositions tobe determined. The natural Pl and Afs compositions arereproduced at 7508C for P between 200 and 400MPa(Fig. 4), so that feldspars do not help in constraining P.The crystallinity of 20^23% measured in the natural prod-ucts is, however, reproduced at 7508C between 325 and350MPa (Fig. 10b). In detail, the phase proportions(14^15wt % of PlþAfs, 5^6wt % of Bt, 77^80wt % ofGl; Table 2) are reproduced in the experiments at 7508Cand 350MPa (15wt % of PlþAfs, 4 wt % of Bt, 79wt %of Gl; Table 9). Therefore, we propose pre-eruptive condi-tions of 750 � 208C, 350MPa, �NNO þ0·5, and H2O con-tents close to saturation conditions.
Table 13: Experimental amphibole compositions
Run n SiO2 Al2O3 CaO Na2O K2O FeO MgO MnO TiO2 Total [4]Al SumA Mg*
900CLI2 3 41·71 0·70 11·36 0·36 11·53 0·09 2·54 0·11 1·06 0·02 9·81 0·55 14·52 0·42 0·47 0·09 2·91 0·13 95·91 1·75 0·90 0·73
800CLI2 6 39·87 0·83 11·48 0·52 11·15 0·16 2·47 0·14 1·01 0·08 15·89 0·33 9·27 0·17 0·61 0·10 3·10 0·09 94·84 1·77 0·83 0·51
800VAS3 4 39·21 0·31 10·91 0·24 10·89 0·09 2·44 0·06 1·24 0·04 18·14 0·57 8·45 0·13 1·18 0·22 2·93 0·16 95·37 1·81 0·95 0·45
800CLI3 5 39·30 0·57 11·46 0·70 11·17 0·20 2·28 0·10 1·12 0·08 17·93 0·51 8·87 0·16 0·81 0·05 2·72 0·24 95·65 1·84 0·92 0·47
825VAS4 4 39·76 0·75 11·14 0·47 11·54 0·08 2·61 0·05 1·35 0·10 14·47 0·82 11·55 0·38 1·08 0·11 2·71 0·14 96·19 1·87 1·07 0·59
825CLI4 5 39·80 0·75 12·13 0·52 11·79 0·32 2·36 0·09 1·21 0·18 14·69 0·97 11·69 0·72 0·65 0·09 2·53 0·34 96·84 1·93 1·02 0·59
Run numbers are as in Table 9. n, number of EMP analyses. Oxides and total are given in wt %; numbers in italics givethe statistical error on the preceding value. [4]Al and SumA are the tetra-coordinated Al (in mol %) and the number ofcations in the A site, respectively (calculation on the basis of 23 O with all Fe as FeO, after Richard & Clarke, 1990);Mg*¼ [Mg/(Mgþ Fe)].
JOURNAL OF PETROLOGY VOLUME 54 NUMBER 6 JUNE 2013
1096
Dow
nloaded from https://academ
ic.oup.com/petrology/article/54/6/1071/1407557 by guest on 05 July 2022

Table14:Experimentalfeldsparcompositions
Run
Phase
nSiO
2Al 2O3
CaO
Na 2O
K2O
FeO
MgO
MnO
TiO
2Total
Or
An
Ab
800C
LI2
Pl
556·60
0·38
26·41
0·24
8·58
0·19
6·24
0·08
0·43
0·04
0·48
0·18
0·03
0·02
0·06
0·06
0·02
0·02
98·84
2·50
42·09
55·41
750C
HO2
Afs
665·07
0·87
19·56
0·30
1·14
0·26
6·48
0·68
6·29
1·05
0·42
0·11
0·01
0·01
0·01
0·01
0·05
0·05
99·01
36·83
5·60
57·57
750D
OM2
Pl
263·18
0·06
21·87
0·88
3·75
0·74
8·14
0·47
1·91
0·45
0·70
0·36
0·09
0·09
0·00
0·00
0·02
0·02
99·66
11·05
17·98
70·97
Afs
165·41
17·96
0·78
4·60
7·22
0·87
0·03
0·00
0·37
97·23
48·57
4·38
47·05
750S
AR2
Afs
164·95
19·76
1·60
6·67
5·56
0·98
0·02
0·00
0·13
99·67
32·60
7·91
59·49
750K
IL2
Afs
466·11
0·42
19·95
0·22
1·47
0·58
7·27
0·89
5·01
1·72
0·32
0·15
0·01
0·01
0·02
0·02
0·02
0·02
100·17
29·01
7·11
63·88
750V
AS2
Afs
165·85
18·72
0·32
4·96
8·99
0·55
0·03
0·00
0·08
99·50
53·53
1·59
44·88
750C
LI2
Pl
260·25
0·30
22·15
0·78
5·24
0·46
7·65
0·37
1·13
0·30
1·02
0·09
0·03
0·01
0·09
0·09
0·04
0·01
97·56
6·53
25·70
67·77
750D
OM3
Pl
162·94
22·16
4·20
7·57
2·07
0·51
0·01
0·00
0·07
99·53
12·09
20·64
67·27
750S
AR3
Pl
161·99
22·06
4·29
7·78
1·58
0·70
0·00
0·00
0·11
98·52
9·31
21·21
69·48
750K
IL3
Afs
264·04
0·25
18·94
0·22
0·44
0·07
4·08
0·08
9·94
0·11
0·29
0·01
0·04
0·04
0·00
0·00
0·01
0·01
97·76
60·22
2·23
37·55
Pl
161·72
21·78
4·08
7·46
2·00
0·85
0·29
0·02
0·00
98·21
11·92
20·44
67·64
750V
AS3
Afs
163·98
18·91
0·41
3·98
10·09
0·35
0·01
0·10
0·00
97·82
61·25
2·08
36·67
Pl
160·91
22·47
4·14
7·69
1·69
0·98
0·47
0·03
0·17
98·54
10·05
20·62
69·33
750C
LI3
Pl
164·04
22·23
4·03
8·33
1·82
0·69
0·00
0·00
0·00
101·15
10·17
18·96
70·87
800C
LI3
Pl
457·95
0·72
25·32
0·36
7·23
0·31
6·89
0·18
0·57
0·04
0·34
0·10
0·03
0·03
0·03
0·03
0·04
0·03
98·39
3·31
35·49
61·20
775D
OM2.5
Pl
462·14
0·55
21·00
0·49
3·62
0·41
7·63
0·10
2·52
0·35
0·54
0·07
0·04
0·03
0·07
0·07
0·04
0·03
97·60
14·71
17·72
67·57
775S
AR2.5
Pl
562·59
0·30
21·24
0·28
3·82
0·35
8·05
0·11
1·88
0·18
0·82
0·28
0·06
0·05
0·07
0·07
0·06
0·05
98·58
10·86
18·49
70·65
775V
AS2.5
Pl
461·90
0·39
21·29
0·76
3·79
0·46
7·94
0·21
1·79
0·38
0·84
0·21
0·01
0·01
0·04
0·04
0·06
0·03
97·65
10·55
18·67
70·78
775C
LI2.5
Pl
263·09
0·18
21·69
0·28
4·11
0·16
7·61
0·35
2·37
0·52
0·60
0·41
0·00
0·00
0·06
0·05
0·00
0·00
99·51
13·66
19·84
66·50
750D
OM4
Pl
462·54
0·33
21·94
0·67
4·36
0·17
8·12
0·20
1·22
0·19
0·17
0·20
0·01
0·01
0·06
0·03
98·44
7·10
21·25
71·65
750S
AR4
Pl
362·11
0·57
21·63
0·74
4·32
0·38
7·65
0·30
1·70
0·77
0·30
0·08
0·00
0·00
0·06
0·06
0·07
0·02
97·85
10·02
21·42
68·56
750K
IL4
Pl
161·88
21·08
4·18
7·81
1·48
0·81
0·01
0·07
0·10
97·41
8·76
20·83
70·41
750V
AS4
Pl
262·57
1·06
21·75
0·37
4·36
0·40
7·74
0·56
1·49
0·33
0·67
0·11
0·02
0·02
0·08
0·08
0·07
0·05
98·77
8·87
21·63
69·50
750C
LI4
Pl
562·16
1·02
22·17
0·67
4·95
0·55
7·76
0·29
1·26
0·14
0·90
0·50
0·04
0·04
0·04
0·04
0·11
0·01
99·38
7·31
24·15
68·54
700C
HO3
Afs
263·53
0·14
18·24
0·65
0·42
0·11
4·99
0·26
9·22
0·34
0·53
0·20
0·09
0·06
0·01
0·01
0·04
0·04
97·06
53·76
2·09
44·15
700D
OM3
Afs
164·33
18·67
0·59
5·21
9·03
0·47
0·16
0·04
0·34
98·84
51·75
2·86
45·39
700S
AR3
Afs
163·59
17·94
1·17
5·93
6·82
1·49
0·13
0·13
0·54
97·75
40·57
5·87
53·56
Pl
264·01
0·42
20·17
1·08
2·78
0·57
8·86
0·34
2·13
0·33
1·09
0·37
0·09
0·09
0·17
0·01
0·11
0·08
99·40
11·93
12·97
75·10
700K
IL3
Afs
264·75
0·52
19·23
0·07
1·16
0·08
7·58
1·20
5·68
1·45
0·64
0·06
0·09
0·02
0·00
0·00
0·04
0·02
99·16
31·30
5·37
63·33
700V
AS3
Pl
163·45
19·61
2·30
9·07
3·05
0·82
0·25
0·02
0·05
98·62
16·27
10·29
73·44
750D
OM3.5
Pl
162·58
22·87
4·46
7·88
1·24
0·30
0·00
0·00
0·00
99·34
7·33
22·09
70·58
750S
AR3.5
Pl
462·13
0·62
21·56
0·78
4·08
0·41
7·48
0·22
2·00
0·68
0·69
0·22
0·03
0·02
0·06
0·05
0·10
0·09
98·11
11·88
20·44
67·68
750K
IL3.5
Pl
163·89
21·11
3·20
7·30
2·51
0·57
0·05
0·11
0·02
98·75
15·42
16·50
68·08
750V
AS3.5
Pl
261·37
0·47
21·61
0·14
4·09
0·06
7·97
0·16
1·40
0·23
1·22
0·52
0·05
0·05
0·03
0·03
0·45
0·23
98·17
8·26
20·28
71·46
Runnumbersareas
inTab
le9.
Phaseiseither
plagioclase(Pl)oralkalifeldspar
(Afs).n,number
ofEMPan
alyses.Oxides
andtotalaregiven
inwt%;numbersin
italicsgivethestatisticalerrorontheprecedingvalue.
Or,
An,an
dAbareorthoclase,
anorthite,
andalbitein
mol%,respectively.
MARTEL et al. TRACHYTES, CHAI“ NE DES PUYS
1097
Dow
nloaded from https://academ
ic.oup.com/petrology/article/54/6/1071/1407557 by guest on 05 July 2022

Table 15: Experimental glass compositions
Sample n SiO2 Al2O3 CaO Na2O K2O FeO MgO MnO TiO2 Mg* PI
900CHO2 7 68·84 16·08 0·91 6·84 5·23 1·51 0·17 0·18 0·25 0·10 1·08
900DOM2 7 67·24 16·94 1·34 6·85 5·03 1·67 0·39 0·15 0·39 0·19 0·98
900SAR2 6 65·77 17·36 1·64 7·27 4·96 1·86 0·45 0·29 0·39 0·20 1·00
900KIL2 5 64·79 17·75 1·88 7·60 4·75 2·03 0·44 0·21 0·54 0·18 0·99
900VAS2 6 64·17 17·69 2·48 7·23 4·63 2·29 0·52 0·51 0·48 0·19 0·95
900CLI2 6 64·38 18·10 2·74 6·88 4·32 2·08 0·70 0·24 0·54 0·25 0·88
800CHO2 5 68·71 16·07 0·97 7·00 5·12 1·43 0·19 0·26 0·25 0·12 1·06
800DOM2 4 67·36 16·99 1·31 6·68 4·77 2·06 0·26 0·19 0·38 0·11 0·95
800SAR2 5 66·56 17·32 1·58 6·81 4·65 2·23 0·26 0·24 0·36 0·10 0·93
800KIL2 5 65·70 17·71 1·60 7·45 4·42 2·36 0·25 0·15 0·38 0·09 0·96
800VAS2 5 65·29 17·68 1·85 7·48 4·52 2·33 0·32 0·16 0·37 0·12 0·97
800CLI2 5 66·24 17·82 2·22 6·66 4·24 2·14 0·25 0·13 0·32 0·10 0·87
750CHO2 4 72·08 15·61 0·48 5·47 5·07 1·10 0·03 0·07 0·10 0·03 0·93
750DOM2 3 72·88 15·76 0·73 4·52 4·91 0·93 0·05 0·07 0·14 0·05 0·81
750SAR2 3 72·16 15·81 0·74 4·71 5·16 1·27 0·01 0·00 0·14 0·01 0·84
750CHO3 6 70·88 16·46 0·69 5·29 5·30 0·94 0·09 0·20 0·16 0·09 0·88
750DOM3 4 71·28 16·73 0·93 5·42 4·54 0·84 0·02 0·10 0·14 0·02 0·82
750SAR3 4 71·02 16·82 0·92 5·27 4·69 0·91 0·06 0·11 0·19 0·06 0·82
750KIL3 3 69·75 17·24 1·00 6·19 3·86 1·37 0·25 0·13 0·22 0·15 0·83
750VAS3 2 70·40 17·12 0·99 6·14 4·10 0·95 0·03 0·22 0·05 0·03 0·85
800CHO3 5 69·87 16·61 0·94 5·23 5·17 1·51 0·15 0·28 0·26 0·09 0·85
800SAR3 4 69·06 18·21 1·89 5·19 4·52 0·96 0·00 0·01 0·15 0·00 0·74
800KIL3 4 68·48 18·39 1·44 5·67 4·53 0·96 0·01 0·18 0·34 0·01 0·77
800VAS3 3 68·16 18·59 1·79 5·61 4·26 1·16 0·02 0·24 0·17 0·02 0·74
800CLI3 4 68·96 18·51 1·91 5·15 4·20 0·98 0·02 0·09 0·18 0·02 0·70
775CHO2.5 6 71·14 16·44 0·67 5·22 5·24 0·98 0·01 0·14 0·16 0·01 0·87
775DOM2.5 2 71·55 16·76 0·93 4·66 5·06 0·67 0·01 0·23 0·13 0·01 0·78
775SAR2.5 2 71·64 16·84 0·93 4·65 4·73 0·87 0·09 0·12 0·13 0·09 0·76
775VAS2.5 4 71·32 17·29 0·88 4·82 4·28 1·06 0·01 0·18 0·16 0·01 0·72
775CLI2.5 4 72·19 16·73 1·10 4·27 4·35 1·03 0·06 0·06 0·22 0·05 0·70
825CHO4 6 70·32 16·23 0·91 5·24 5·17 1·54 0·16 0·22 0·21 0·09 0·87
825DOM4 6 69·08 17·17 1·33 5·51 5·05 1·24 0·11 0·19 0·33 0·08 0·84
825SAR4 4 68·69 17·62 1·57 5·57 4·71 1·23 0·12 0·11 0·38 0·09 0·81
825KIL4 4 67·16 18·07 1·66 6·04 4·80 1·48 0·20 0·27 0·32 0·12 0·84
825VAS4 6 67·44 18·20 1·78 5·86 4·68 1·41 0·13 0·14 0·36 0·08 0·81
825CLI4 3 67·51 18·79 2·42 5·01 4·27 1·30 0·21 0·13 0·37 0·14 0·68
750CHO4 4 72·07 16·35 0·81 4·50 5·14 0·78 0·01 0·21 0·13 0·01 0·79
750DOM4 4 71·32 17·11 1·43 4·74 4·43 0·69 0·00 0·14 0·14 0·00 0·73
750SAR4 4 70·40 17·29 1·49 5·55 3·96 0·99 0·00 0·13 0·18 0·00 0·77
750KIL4 5 69·64 17·81 1·29 7·12 3·32 0·64 0·00 0·09 0·09 0·00 0·86
750VAS4 4 70·23 17·70 1·32 6·20 3·59 0·68 0·05 0·15 0·08 0·07 0·79
750CLI4 1 71·60 17·39 1·89 5·15 3·27 0·57 0·00 0·00 0·13 0·00 0·69
700CHO3 3 75·18 14·61 0·35 4·54 4·37 0·75 0·02 0·10 0·08 0·03 0·83
750CHO3.5 4 70·80 16·47 0·76 5·36 5·40 1·05 0·02 0·06 0·08 0·02 0·89
750DOM3.5 3 70·84 17·34 1·12 5·19 4·63 0·59 0·01 0·18 0·10 0·02 0·78
750SAR3.5 2 70·41 17·37 1·46 5·15 4·49 0·85 0·03 0·17 0·07 0·03 0·77
750KIL3.5 2 69·64 17·75 1·05 7·30 3·31 0·75 0·00 0·13 0·07 0·00 0·88
750VAS3.5 2 69·40 17·38 1·24 6·97 3·75 0·98 0·03 0·19 0·07 0·03 0·89
750CLI3.5 1 72·16 17·61 1·37 4·52 3·65 0·43 0·02 0·17 0·08 0·04 0·64
Run numbers are as in Table 9. n, number of EMP analyses. Mg*¼ [MgO/(MgOþ FeO)], with an error of 0·01. PI,peralkalinity index given as molar [(Na2OþK2O)/Al2O3]. Oxides are given in wt %, recalculated on anhydrous basis.
JOURNAL OF PETROLOGY VOLUME 54 NUMBER 6 JUNE 2013
1098
Dow
nloaded from https://academ
ic.oup.com/petrology/article/54/6/1071/1407557 by guest on 05 July 2022

Grand Sarcouy (SAR; 65·5wt % SiO2)SAR naturally contains Fe^Ti oxidesþBtþPl. This as-semblage lacks a ferromagnesian phase such as Am orCpx (in addition to Bt) and the low phase proportions of10% are distinct in comparison with the other trachytes.Although our experimental results do not allow separationbetween the saturation curves of Pl and Afs, there couldbe a restricted P^T domain between 775 and 8008C andbetween 200 and 400MPa of PlþMtþBt coexistencewithout Afs (Fig. 10c). The natural Bt and Mt suggest anfO2 close to �NNO5þ0·5 and a crystallizationT between750 and 8008C (Fig. 7b). The natural Pl are depleted inthe Or component with respect to the experimental ones(Fig. 4), and Pl^Afs co-precipitation in the experimentsmay reflect a starting material slightly too rich in K,possibly resulting from some Na loss during fusion of thestarting SAR dome sample. The very low crystallinity ofthe natural SAR sample (10 %) would be compatiblewith crystallization at high P (300^400MPa), as suggestedby the experimental products at 7508C, in whichcrystallinity decreases with increasing P. Therefore,we propose pre-eruptive conditions around 775 � 208C,200^400MPa, �NNO þ0·5, and H2O contents close tosaturation conditions.
Crate' re Kilian (KIL; 65·1wt % SiO2)The KIL sample contains Fe^Ti oxidesþPlþBtþAm. Inthe experiments Cpx crystallizes atT58508C. In the low-T and high-P domain of the KIL phase diagram
(T58008C and P of 300^400MPa; Fig. 10d), some un-usual, but reproducible, analyses of a ferromagnesianphase probably suggest intimate mixing between Cpx andAm (analyses marked with an asterisk in Table 12).Assuming Am replaces Cpx at T58008C and P of 300^400MPa, and considering a T domain between 750 and8008C (P¼ 200^400MPa) where Pl exists without Afs,there may be a P^T domain at 300^400MPa and 750^8008C for which the experiments reproduce the naturalparagenesis (Fig. 10d). The compositions of natural Bt andMt are compatible with a crystallization T between 750and 8008C and �NNO þ0·5 (Fig.7b), whereas the Pl com-positions are closely approached (Fig. 4). The slight misfitbetween the compositions of the experimental glasses andthat of melt inclusions trapped in Am, Pl, and Bt pheno-crysts (especially in FeO content; Fig. 9) may result from adifference in fO2. Nevertheless, the highest H2O contentsmeasured in the glass inclusions (i.e. �8wt %; Fig. 9), com-pare well with those found in the CHO sample (Table 4).We thus propose pre-eruptive conditions close to775 � 208C, 300^400MPa, �NNO þ0·5, and 8wt %H2O in the melt.
Puy Vasset (VAS; 65·0wt % SiO2)The VAS sample contains Fe^Ti oxidesþPlþBtþAm, aphase assemblage experimentally reproduced for T be-tween 775 and 8008C and P between 300 and 400MPa,assuming an experimental domain where Pl exists withoutAfs (Fig. 10e). The compositions of the natural Mt and Bt
Or2
Qz
OrAb
CHODOM
SARVAS
KILCLI
EXPERIMENTAL GLASSES
825°C / 400 MPa 750°C / 400 MPa 750°C / 350 MPa
700°C / 300 MPa 750°C / 300 MPa
775°C / 240 MPa 750°C / 200 MPa
800°C / 200 MPa900°C / 200 MPa
Bulk rock
800°C / 300 MPa
T de
crea
se
900°C800°C
775°C
750°C
800°C
750°C750°C
825°C
P increase?
Fig. 11. Experimental melt compositions in term of CIPW normative quartz (Qz), albite (Ab), orthoclase (Or) for each trachyte. The arrowsindicate the effect of decreasing temperature on melt composition at constant pressure (i.e. an increase in crystallization), and the effect ofincreasing pressure at fixed temperature.
MARTEL et al. TRACHYTES, CHAI“ NE DES PUYS
1099
Dow
nloaded from https://academ
ic.oup.com/petrology/article/54/6/1071/1407557 by guest on 05 July 2022

are compatible with a crystallization T �8008C and05�NNO5þ0·5 (Fig. 7b). The natural Am compositionshave been experimentally reproduced at 8008C and300MPa. From the compositional change of the experi-mental Am with P^T, we can infer that the natural com-positions would be also reproduced for P ranging from250 to 350MPa and T from 700 to 9008C (Fig. 8a). TheMg* of the natural Am suggests ^0·55�NNO5þ0·5(Fig. 8b). The natural Pl compositions are experimentallyreproduced in theT range 750^7758C and P from 200 to400MPa (Fig. 4). Assuming glass inclusion compositionssimilar to those in KIL (owing to the similarities in bothbulk-rock compositions; Table 2), we suggest a similarTof750^8258C, P of 300^400MPa, and 7^8wt % of dissolvedH2O in the melt.We propose pre-eruptive conditions closeto those for KIL; that is, 775 � 208C, 300^400MPa,05�NNO5þ0·5, and H2O contents close to saturationconditions.
Clierzou (CLI; 62·6wt % SiO2)The CLI sample contains Fe^Ti oxidesþPlþAm, a para-genesis that is reproduced for a restricted range of T be-tween 800 and 8258C for P between 200 and 400MPa,assuming a T field where Pl exists without Bt; Fig. 10f).The natural Mt span a relatively large compositionalrange from Mt80 to Mt94 (Fig. 5) suggesting 05�NNO5þ1. The Mg* of the natural Am in CLI confirms redoxconditions close to �NNO þ0·5 (Fig. 8b). Figure 8ashows that the natural Am covers a wide range of compos-itions, with AlIV from �1·75 to 2·25 and 0·8^0·9 cations inthe A site. The experiments also highlight that Am withAlIV42·0 cannot crystallize from trachytic melts atP� 400MPa. Therefore, some of the Am in CLI are prob-ably inherited from more mafic melts, whereas the othersare consistent with crystallization from a trachytic liquidatT �8008C and P of 200^350MPa. The natural Pl com-positions are experimentally reproduced atT between 750and 8008C and P of 200^300MPa (Fig. 4). Therefore, wepropose pre-eruptive conditions close to 800^8258C,200^350MPa, 05�NNO5þ1 and H2O contents close tosaturation conditions.
The trachytic reservoirs: pre-eruptiveconditions and petrogenetic relationsThe comparison between the natural and experimentalphase assemblages, proportions, and compositions for alltrachytes points to a pre-eruptive P of 300^350MPa(�10^11km depth), fO2 around 05�NNO5þ1, and meltH2O contents of �8 wt %. Besides H2O, 300 � 300 ppm S,670 � 300 ppm F, and 3400 � 1400 ppm Cl have been ana-lysed in the CHO glass inclusions (EMP; Table 4), showingthat the CDP trachytic liquids are not strictly saturatedwith H2O, but also contain less than 0·5wt % of Cl, S,and F. In comparison, 1500^2000 ppm Cl and �1000^2000 ppm S have been analysed in olivine-hosted basaltic
glass inclusions in scoria from CDP Puy Beaunit (Jannotet al., 2005), hinting at some volatile loss between the deepmafic source and the upper trachytic magma chamber(s).Although no dissolved CO2 in the basaltic melt inclusionshas been reported, Jannot et al. (2005) documented the oc-currence of CO2-rich fluid inclusions strongly suggestingthe presence of CO2 in the magmas parental to the trach-ytes. Considering that trachytes are produced by c.80^90wt % fractional crystallization of basalt (Mauryet al.,1980;Villemant et al.,1980), a strictly incompatible be-haviour of Cl would have resulted in Cl contents higherthan 1wt % in the trachytic derivatives. This is muchhigher than accepted solubility values for such melts atmid-crustal pressures (e.g. Signorelli & Carroll, 2002),hence pointing to significant degassing of Cl during frac-tionation. Similarly, the fact that the S content drasticallydrops from 1000^2000 ppm in the basaltic melt inclusionsto �300 ppm in the trachyte melt inclusions suggestsstrong S degassing at the level of the magma chamber ordeeper. Therefore, determining phase equilibria underH2O-saturated conditions (aH2O¼1) represents anend-member case that may not fully reproduce the realconditions, as some Cl, S, and F were present in the trach-ytic magmas, and possibly CO2 at early stages. Both Fand S have been shown to affect amphibole stability in arcmagmas (e.g. Costa et al., 2004), and future work willhave to explore the role of such elements in trachyte phaseequilibria.In contrast to the other parameters, pre-eruptive T
varies in a systematic way with the bulk SiO2 content ofthe trachyte, decreasing from 800^8258C in CLI to�7208C in CHO (Fig. 12). Similarly, the pre-eruptive con-ditions deduced from the phase equilibria suggest storageat a constant depth of �10^11km, so that the compos-itional differences probably represent various stages ofmagma differentiation with fallingT. The experimental re-sults provide further evidence for the hypothesis of
700 725 750 775 800 825Temperature (°C)
62
63
64
65
66
67
68
69
70
71
Bul
k Si
O2
cont
ent (
wt %
) CHO9.7 ky
DOM11 ky
SAR13 ky
KIL-VAS9.2-9.3 ky
CLI15 ky
Pre-eruptive conditions
P ∼ 300-350 MPafO2
∼ ΔNNO +0.5(+0.5) H2O ∼ 8 wt %
Trachytes from Chaîne des Puys
Fig. 12. Pre-eruptive conditions of the CDP trachytes.
JOURNAL OF PETROLOGY VOLUME 54 NUMBER 6 JUNE 2013
1100
Dow
nloaded from https://academ
ic.oup.com/petrology/article/54/6/1071/1407557 by guest on 05 July 2022

magma differentiation, by showing residual melt compos-itions for the less differentiated trachytes at P^Tconditionsclose to pre-eruptive (e.g. 750KIL3 or 800CLI3 inTable 15) that are very close to the bulk-rock compositionof the most differentiated trachytes (e.g. CHO or DOM;Table 2). However, there is no correlation between thebulk SiO2 content of the trachytes (Table 2) and theireruption age (CLI, SAR, DOM, CHO, VAS, KIL inchronological order; Table 1), which at first sight arguesagainst the idea of a magma differentiation sequence withtime. In detail, however, the four northernmost edificesdefine a coherent trend of bulk SiO2 versus age, whichopens up the possibility that these vents were connected toa common magma reservoir, which would have beentapped to produce the CLI, SAR DOM and CHOmagmas, whereas VAS and KIL would belong to a dis-tinct, southernmost chamber, albeit located at about thesame depth.The depth of �10^11km determined experimentally for
the trachyte reservoirs fully agrees with the seismic dataof Zeyen et al. (1997). Those workers suggested a three-layercrust below the CDP, corresponding to different velocities:an upper crust to 10^12 km depth, a felsic lower crust to18^20 km depth, and a mafic lower crust to �26 kmdepth. The second reflector has been interpreted as achange in rheology between the mafic and felsic crust;
thus there is possibly an intermediate level of magma dif-ferentiation and storage at 18^20 km depth. The rising bas-altic magmas therefore make their way to the surfacethrough a network of connected extensional fractures,with or without temporary intermediate storage (Fig. 13).The mafic lower crust might represent a zone of underplat-ing of primitive, mantle-derived, basaltic magma.
Implications for the CDP plumbing systemand future eruptive scenariosThe prevailing view is that each trachytic vent was fed bysmall, isolated, and ephemeral magma reservoirs (Boivinet al., 2009).The size of each reservoir can be approximatedassuming a spherical shape, and considering the volumeof trachytic magma ejected, which is in the range0·2^0·4 km3 for each event. Because about 80% of basaltcrystallization is needed to produce these felsic derivatives,this implies a volume of 1^2 km3 for each reservoir(assuming trachyte production in the mid-crust), whichtranslates into a sphere with radius R of 0·6^0·8 km. Theconductive cooling time t of a sphere can be calculatedusing analytical solutions developed by Carslaw & Jaeger(1959). Here for simplicity we use the following standardapproximation:
t ¼ R2=kl
0
-10
-20
-30
km asl Sillon HouillerCHAÎNE DES PUYS
Great Limagne Fault Limagne RiftTauve-Aigueperse
Fault
MOHO
MOHO
UPPER MANTLE
MAFIC LOWER CRUST
FELSIC LOWER CRUST
UPPER CRUST
1
2
3
BASALTIC MAGMAS
SEDIMENTS
W E
Fig. 13. Schematic section of the continental crust below the CDP showing the possible levels of magma storage, after Zeyen et al. (1997), Merle& Michon (2001), Babuska et al. (2002), and Boivin et al. (2009). The horizontal and vertical scales are comparable (the size of the magma reser-voirs is overestimated). The crust is extensively crosscut by a late Hercynian and Cenozoic network of N10^30-directed faults. Based on seismicdata, the crust can be divided into three parts separated by two discontinuities at 10^12 and 18^20 km. Primitive basaltic magma ascendingfrom the Moho uplift (1) may be temporarily retained by both discontinuities (2) and (3), with the trachytic magmas differentiating in theuppermost reservoirs (3).
MARTEL et al. TRACHYTES, CHAI“ NE DES PUYS
1101
Dow
nloaded from https://academ
ic.oup.com/petrology/article/54/6/1071/1407557 by guest on 05 July 2022

where kl is the thermal diffusivity (7·7�10�7m2 s�1). Forthe above radius range, cooling times of 15^25 kyr arefound. This shows that, albeit small, such reservoirs arelikely to be still hot at the present day, if not partiallymolten. Reactivation of any such reservoir will thusdepend on the likelihood that subsequent basalt magmabatches intercept one of the cooling magma bodies. Theobserved scattered pattern of basalt emission centresalong the chain, both in time and space, makes such a hy-pothesis relatively unlikely.However, the existence of a coherentT versus age trend
among the northernmost edifices opens up the possibilityof their being a single magma reservoir at depth. In sucha view, the area of a putative single reservoir is constrainedto a first-order approximation by the surface dispersion ofthe four related vents, which is roughly equivalent to 4km� 8 km (Fig. 1). Our data document a continuous Tdecrease from 8208C to 7208C. According to available geo-chronological constraints (Boivin et al., 2009), such a de-crease occurred within 5^6 kyr. These data can becompared with fluid dynamical analyses of the thermalregime of magmatic reservoirs to assess whether they arecompatible with the existence of a large magma volume atdepth.We first address the question of the size of the reservoir
using the analysis put forward by Koyaguchi & Kaneko(2000). Those workers have shown that under steady-stateconditions (i.e. periods during which magma input versusoutputarebroadlybalanced) theaverage sizeRofa felsic res-ervoir is governed by the long-term heat balance �Q (heatloss owing to eruption minus heat gain owing to basaltinput), according to the following equation, which corres-ponds to the steady solution of heat loss by conduction of asphere embedded in a solidmediumat atemperatureTs:
R ¼ �Q =4pk TEFT �Tsð Þ
whereTEFT is the effective fusion temperature and k is thethermal conductivity (2·4Wm�1K�1). The effective fusiontemperature is the temperature at which the magma vis-cosity becomes too high for thermal convection to occur,which is generally considered to happen when the crystal-linity approaches or exceeds 50%. For trachytic compos-itions at 300^400MPa, TEFT can be inferred from ourdata to be around 7008C (solidus in Fig. 10). FollowingKoyaguchi & Kaneko (2000), �Q can be approximatedby the long-term eruption rate when the silicic reservoirwas active. Over the time span of 5^6 kyr, �2 km3 oftrachytic magma was erupted from the four consideredvents. The equation for �Q hence can be written as
�Q ¼ Er c Tb �TEFTð Þ þ L 1� Xcritð Þ½ �
where E is the long-term eruption rate (m3 s�1), r is themagma density (2400 kgm�3), c is the specific heat(1300 J kg�1K�1),Tb is the temperature of the input basalt
(12008C), L is the latent heat (2·5�105 J kg�1) and Xcrit isthe critical melt fraction beyond which the magma locksup (0·5). For a time span of 6 kyr, �Q is found to equal0·8�105kJ s�1. Considering a far-fieldTs of 3008C, this inturn yields an average R of about 6 km for the reservoir ora sphere whose diameter would correspond broadly to thenorth^south extension of the four vents of interest. Itneeds to be stressed that this estimate is sensitive to thelong-term eruption rate. For instance, if E was 1·5 km3 in6 kyr (instead of 2 km3 in 6 kyr), then R would drop to2·7 km. In contrast, an increase of the far-field temperatureto 3508C would increase R to 7·5 km (for E¼ 2 km3 in 6kyr). Considering the error associated with dating (�1kyr), and using a time interval of 4 kyr, would increase R
to 11km (for 2 km3). Regardless, our point is to show thattheT trend recorded between some CDP silicic centres iscompatible with the existence of a large reservoir at depthwith a lateral extension of several kilometres, possibly ex-ceeding 10 km, at least when the silicic chain was active.The next question obviously arising is that of the possible
present-day existence of such a reservoir, in view of its con-siderable size and of the relatively recent age of the erup-tions. To address this question, we first calculate the heatflux F corresponding to the case of a vigorously convectingreservoir. The classical relationship is (Turner, 1973)
F ¼ lkðag=klvÞ1=3 Tl �TEFTð Þ
4=3
where l is a constant (0·1), k is the thermal conductivity(2·4Wm�1k�1), a is the coefficient of thermal expansionof the liquid (5�10�5K�1), g is the gravitational acceler-ation (9·8m s�2), kl is the thermal diffusivity (7·7�10�7m2 s�1), n is the kinematic viscosity (4�10�2m2 s�1
calculated for a melt with 8wt % H2O, which gives a vis-cosity of c. 100 Pa s; Whittington et al., 2001), andTl is thetemperature of the magma interior taken as the trachyteliquidus at saturation and 300^400MPa (�8508C). Thisyields a convective heat flux F¼ 4·7 kJ s�1m�2. If the docu-mented cooling �Tof c. 1008C was due to convection thenits timescale can be estimated by calculating the heat lossHloss corresponding to such aTdrop. This is given by thefollowing relationship:
Hloss ¼Mtrachyte½�Tcþ L 1� Xð Þ�
where Mtrachyte is the mass of the cooling trachytic magmabody (kg), and X is the per cent of crystallization occurringduring cooling, with other parameters as above.Themass ofthe magma body can be approximated as that of a tabularbody with 4 km� 8 km edges, with a conservative thicknessof 0·5 km. The extent of crystallization needed to evolvefrom the more mafic toward the more felsic trachyte is�20% (X¼ 0·2). This gives an Hloss of 5�10
18 J. The time t(s) is nowgivenby the simple relationship
t ¼ Hloss=FS
JOURNAL OF PETROLOGY VOLUME 54 NUMBER 6 JUNE 2013
1102
Dow
nloaded from https://academ
ic.oup.com/petrology/article/54/6/1071/1407557 by guest on 05 July 2022

S being the surface of heat exchange (4 km� 8 km).Thisyields a cooling time of about 1 year. A similar result wasobtained by Cottrell et al. (1999) for the Santorini Minoanmagma; which shows evidence of a fast T change (858Cheating of 30 km3 of magma in 3 months) prior to erup-tion. Admittedly, most of the parameter values adoptedhere, in particular those concerning the dimensions of thereservoir, are loosely constrained, but the essential result,already expressed in previous studies (e.g. Huppert &Sparks, 1988a, 1988b), is that the timescale of cooling for avigorously convecting system is exceedingly short on geolo-gical timescales (see also Koyaguchi & Kaneko, 2000).Increasing the mass of magma by a factor of 100, clearlyan unrealistic scenario, would increase the timescale bythe same factor, which will remain still well below thethousands of years range of thermal relaxation docu-mented by radiometric dating.That is not to say that any reservoir at depth has com-
pletely solidified by now, as already illustrated for the caseof isolated reservoirs first discussed. As emphasized bymany workers (e.g. Koyaguchi & Kaneko, 2000), conduc-tion timescales are much longer than those by convection,typically of the order of 104^105 years. In detail, accordingto Koyaguchi & Kaneko (1999, 2000), most silicic reser-voirs exhibit a two-stage evolution, with a first shortlivedstage (few years to decades) during which convection isactive, followed by a conduction-dominated regime lastingseveral millennia, which sets in as soon as the crystallinityis higher than a characteristic threshold (say 50%). A typ-ical conduction timescale is given by the simple conductionequation
t ¼ D2=kl
where D is the thickness of the cooling magma layer.A layer of 500m will cool in about 10 kyr, which is indeedcomparable with the radiometric time span recorded atCDP silicic centres. In other words, any sizeable reservoir(i.e. several kilometres of lateral extension and half a kilo-metre thick) could still be present today in a partiallymolten state. The amount of silicic magma required bysuch a hypothesis is of the order of 6^15 km3 (for a layer200^500m thick). Because trachyte production needs�80% basalt crystallization (Maury et al., 1980; Villemantet al., 1980), this in turn implies that some 30^75 km3 ofbasalt was intruded in the crust. About 8 km3 of basalthave been extruded during the last 80^90 kyr at the CDP(Boivin et al., 2009). Considering an intrusive/extrusiveratio of 4^5 (White et al., 2006), this suggests that at least32^40 km3 of basalt has entered the system during the last80 kyr, thus falling at the low end of the previous estimate,but in general agreement with it.The possibility of having a present-day magma reservoir
containing a silicic mush has implications for the timescaleof volcanic unrest at the CDP. Clearly, owing to its high
crystallinity, any such reservoir is unlikely to erupt on itsown. Replenishment of the reservoir by fresh, hot basaltmay, however, drive the system above the threshold ofmagma mobility, thereby unlocking it for an eruption.Various studies have modelled such a situation (e.g.Snyder, 2000; Couch et al., 2001; Burgisser & Bergantz,2011), which is commonplace in subduction settings (e.g.Pallister et al., 1992), and concluded that reactivation of sili-cic mushes can occur over periods as short as hours tomonths following basalt injection. The problem is conveni-ently treated in the context of a thermal boundary layeroccurring when two fluids of different temperature (hencedifferent viscosities) are juxtaposed. Following classicalfluid dynamic theory (e.g. Brandeis & Jaupart, 1986;Snyder, 2000), the thickness of the boundary layer d (m)that develops before convection starts, is calculated as
d ¼ ðRcklm=ga�TrÞ1=3
where Rc is the critical Rayleigh number defining theonset of convection (here taken as �103), and �T is thethermal gradient across the boundary layer. Applicationof the above relationship to an extensively crystallizedCDP cool trachyte (i.e. with a viscosity of �106Pa s and a�Tof 4008C) yields a boundary layer half a meter thick.The timescale ti for layer instability (taken as a proxy tothe timescale of eruption triggering following basalt injec-tion; see Snyder, 2000) is now given by
ti ¼ d2rc=kp:
Application to the CDP context gives a timescale ofabout 5 days. Use of a viscosity two orders of magnitudehigher (108Pa s) will increase ti to about 3 months.The main conclusion that emerges from the above scal-
ing analysis is the possible existence of a single large felsicmagma reservoir, which implies that a felsic eruptionshould not be ruled out for the near future, although abasalt eruption is generally considered as the most likelyscenario. More generally, the temporal geochemical evolu-tion of the whole CDP series clearly shows that felsic de-rivatives were almost exclusively produced at the end ofthe activity of the CDP (Boivin et al., 2009); that is, closeto the present day. Because CDP trachytes are derived pri-marily from basalt fractionation (Maury et al., 1980;Villemant et al., 1980), as opposed to crustal melting, thisin turn implies that the rate of basalt influx must haveslowed down prior to the period of trachyte production(10^20 kyr) so as to allow the system to cool substantially.Such a decrease may correspond to a progressive and irre-versible magmatic shutdown of the area. However, fluctu-ations in magma recharge rates are known in subductionsettings (e.g. Druitt et al., 2012) and there are no reasonswhy basalt supply rates should not also fluctuate in contin-ental settings. On this basis, the observed decay in basalteruption rate following trachyte eruptions cannot be
MARTEL et al. TRACHYTES, CHAI“ NE DES PUYS
1103
Dow
nloaded from https://academ
ic.oup.com/petrology/article/54/6/1071/1407557 by guest on 05 July 2022

taken as evidence of the waning stage of magmatic activityat the CDP.
Comparison with the trachytic system ofthe Phlegrean FieldsOnly one experimental study has been performed startingfrom a phono-trachytic liquid, to determine the storageconditions of the Breccia Museo eruption in thePhlegrean Fields in Italy (Fabbrizio & Carroll, 2008;Fabbrizio et al., 2009). However, this study concerns alka-line magmas generated in a subduction context (not riftingas for the CDP). Two starting compositions were used,PR8 pumice with 60·4 SiO2, 3·9 Na2O, 9·1 K2O, in wt %,and ZAC obsidian with 62·2 SiO2, 6·2 Na2O, 7·1 K2O, inwt %, which both represent less evolved compositions (nonormative quartz and presence of nepheline and olivine)than the CDP trachytic series. The investigated range ofexperimental conditions covers P from 50 to 200MPa,Tfrom 700 to 8858C, NNO þ1 and H2O saturation. At200MPa, the liquidus phases in PR8 and ZAC are theFe^Ti oxides, crystallizing at T48508C, followed by Bt,Cpx, and Afs asTdecreases. The main difference betweenthe phase assemblages at 200MPa of Breccia Museo andthe less differentiated CDP trachytes is the absence of Amin Breccia Museo, whereas it is present at T47758C inCLI and VAS (Fig. 10e and f). Fabbrizio & Carroll (2008)proposed that the higher K2O/Na2O molar ratio (0·9 inthe Breccia Museo versus 0·7 in CLI) favours Bt crystal-lization at the expense of Am. However, Am and Bt areboth found in CLI, so that it is not clear whether the differ-ence in phase appearance can be ascribed to the K2O/Na2O ratio.We note that at 200MPa, theTappearance ofboth Cpx and Afs decreases with increasing bulk SiO2
content of the trachyte (i.e. from PR8 to ZAC to CLI).The major-phase assemblage and proportion of the
Breccia Museo rocks have been experimentally reproducedunder H2O-saturated conditions at 7808C and P from 140to 200MPa, which are shallower storage conditions thanfor the CDP, but otherwise comparable. The BrecciaMuseo eruption has been interpreted as originating froma chemically zoned reservoir in which the early eruptivephase tapped the most differentiated level followed by thedrainage of the underlying less evolved magma (Fabbrizio& Carroll, 2008). Such models of a compositionally zonedsingle reservoir are often proposed where large magma vol-umes are involved (e.g. Bishop Tuff; Johnson et al., 1994),but they may also apply to smaller magma volumes suchas those involved in the CDP monogenetic volcanoes, con-sistent with evidence of compositional zoning of someeruptions (e.g. the Pariou eruptive sequence successivelydisplayed trachyandesite and basaltic products; Boivinet al., 2009). Both studies agree on the H2O-rich nature ofthe trachytic or phono-trachytic liquids.
PETROGENET IC IMPL ICATIONSThe CDP volcanic series results from the fractional crystal-lization of silica-deficient alkali basalts. Differentiation ischaracterized by an important increase of silica activityand leads to oversaturated trachytes. Maury et al. (1980)proposed that the increase of silica activity results mainlyfrom the fractionation of amphibole (depleted in SiO2
with respect to the residual liquid) from intermediatemagma compositions. Those workers used least-squaresmass-balance calculations to estimate the fractionatingminerals and their proportions in the successive cumulates.Amphibole is a major fractionating phase (up to28wt %), suggesting that high water fugacity prevailsduring this process. Considering a water content of�8wt % in the trachytic liquids (based on melt inclusionsand phase equilibria) and assuming a water content of2 wt % in amphibole, we calculate a minimum amount ofdissolved water in the parental basaltic magmas of�1·5wt %, using the modal proportions of fractionatingphases calculated by Maury et al. (1980) (Table 16). Thissuggests that hydrous conditions prevail during the differ-entiation of continental alkaline magma series, whichagrees with the model of ‘wetspots’, rather than ‘hotspots’proposed byWilson (2008).
Table 16: Water content in parental basalts calculated from
the model of fractional crystallization of Maury et al. (1980)
Parental magma: CDP1 CDP2 CDP3 CDP4 CDP5
(SiO2):* (47·2) (48·5) (52·2) (53·1) (57·1)
Derived magma: CDP2 CDP3 CDP4 CDP5 CDP6
(SiO2):* (48·5) (52·2) (53·1) (57·1) (60·2)
F 74·7 64·3 79·7 67·9 75·0
Olivine 4·1 0·9
Pyroxene 10·0 15·4 10·0 2·9 2·1
Magnetite 1·7 3·8 6·6 5·7
Amphibole 6·6 4·6 9·5 14·7
Plagioclase 9·1 9·5 6·2 15·0
Bulk H2Oy 1·5 2·0 2·9 3·5 4·9
*The formulation is based on the distribution of Si, Ti, Al,Fe, Mg, Ca, Na and K, and is calculated following theleast-squares method; it calculates for each step theweight percentages of derived magma (F) and fractionatedminerals from parental magma with a precision �2%;CDP1 to CPD6 are magma compositions given by Mauryet al. (1980), with bulk SiO2 in wt % reported inparentheses.yBulk H2O content (in wt %) of the parental magma, start-ing with a bulk H2O content of 6·4wt % in the trachytes(CDP6, close to CLI sample) corresponding to 8wt % inthe melt in thermodynamic equilibrium with �20 wt %phenocrysts (Table 2).
JOURNAL OF PETROLOGY VOLUME 54 NUMBER 6 JUNE 2013
1104
Dow
nloaded from https://academ
ic.oup.com/petrology/article/54/6/1071/1407557 by guest on 05 July 2022
The documented water content of �1·5wt % is compar-able with that in ocean island basalts (OIB): Reunionbasalt (0·7^1wt %; Bureau et al., 1999) or Hawaii alkalicbasalt (1·3^1·9wt %; Dixon et al., 1997).Water has alreadybeen recognized as playing a key role in generating OIB(e.g. Schilling et al., 1980; Dixon et al., 1997). However,liquid lines of descent observed in oceanic and continentalintra-plate contexts are radically different. Indeed, the dif-ferentiated magmas are undersaturated in silica in mostoceanic contexts (e.g. phonolites), whereas they aresilica-oversaturated in continental contexts (e.g. trachytes),which suggests contrasting processes in the magma enroute to the surface for these two geodynamic contextsand/or substantial differences in mantle sources.
ACKNOWLEDGEMENTSWe thank Olivier Rouer and Ida Di Carlo for assistancewith SEM and EMP, and Patricia Benoist for the AASmeasurements.We also thank Juan Andujar for discussionsabout alkaline magmas and amphiboles. We are gratefulto Catherine Deniel and Didier Miallier for updated infor-mation on the paragenesis and ages of the CDP trachytes.We are grateful to Jenni Barclay, Ray Macdonald, andMike Carroll for their beneficial reviews, and to MarjorieWilson for the careful editorial handling.
FUNDINGThis project mostly benefited from the resources of theInstitut des Sciences de la Terre d’Orle¤ ans (ISTO), whichmainly come from the Institut des Sciences de l’Univers(INSU), Centre National de la Recherche Scientifique(CNRS), and Orle¤ ans University.
REFERENCESAndersen, D. J., Lindsley, D. H. & Davidson, P. M. (1993). Quilf: a
Pascal program to assess equilibria among Fe^Mg^Ti oxides, pyr-oxenes, olivine, and quartz. Computers and Geosciences 19(9),1333^1350.
Anderson, J. L. & Smith, D. R. (1995). The effect of temperature andfO2 on the Al-in-hornblende barometer. American Mineralogist 80,549^559.
Andujar, J., Costa, F., Marti, J.,Wolff, J. A. & Carroll, M. R. (2008).Experimental constraints on pre-eruptive conditions of phonoliticmagma from the caldera-forming El Abrigo eruption, Tenerife(Canary Islands). Chemical Geology 257, 173^191.
Arnaud, N. (1989). Les e¤ ruptions trachytiques de la Cha|Œ ne des Puys:Apport de l’e¤ tude des enclaves conge¤ ne' res a' l’e¤ volution des magmastrachytiques, Masters Memoir, University of Clermont-Ferrand.
Babuska, V., Plomerova, J., Vecsey, L., Granet, M. & Achauer, U.(2002). Seismic anisotropy of the French Massif Central and predis-position of Cenozoic rifting and volcanism by Variscan suturehidden in the mantle lithosphere.Tectonics 21, 11^20.
Bacon, C. R. & Hirschmann, M. M. (1988). Mg/Mn partitioning as atest for equilibrium between coexisting Fe^Ti oxides. American
Mineralogist 73, 57^61.
Behrens, H. (1995). Determination of water solubilities in high-viscosity melts: an experimental study on NaAlSi3O8 andKAlSi3O8 melts. EuropeanJournal of Mineralogy 7, 905^920.
Berndt, J., Holtz, F. & Koepke, J. (2001). Experimental constraints onstorage conditions in the chemically zoned phonolitic magmachamber of the Laacher See volcano. Contributions to Mineralogy and
Petrology 140, 469^486.Boivin, P., Besson, J.-C., Briot, D., Camus, G., Goe« r De Herve, A.,
Gourgaud, A., Labazuy, P., Langlois, E., Larouzie' re, F.-D.,Livet, M., Mergoil, J., Miallier, D., Morel, J.-M., Vernet, G. &Vincent, P. M. (2009).Volcanologie de la Cha|Πne des Puys, Massif Central
Franc� ais (58 e¤ dition). Parc Naturel Re¤ gional des Volcans d’AuvergneClermont-Ferrand, 196 p, þ1/25 000 map.
Brandeis, G. & Jaupart, C. (1986). On the interaction between convec-tion and crystallization in cooling magma chambers. Earth and
Planetary Science Letters 77, 345^361.Bureau, H., Me¤ trich, N., Semet, M. P. & Staudacher,T. (1999). Fluid^
magma decoupling in a hot-spot volcano. Geophysical Research
Letters 26, 3501^3504.Burgisser, A. & Bergantz, G.W. (2011). A rapid mechanism to remobi-
lize and homogenize highly crystalline magma bodies. Nature 471,212^215.
Burnham, C. W. (1979). The importance of volatiles constituents. In:Yoder, H. S. (ed.) The Evolution of the Igneous Rocks: Fiftieth
Anniversary Perspectives. Princeton, NJ: Princeton University Press,pp. 439^482.
Burnham, C. W., Holloway, J. R. & Davis, N. F. (1969).Thermodynamic properties of water to 10008C and 10 000 bars.In: Geological Society of America Special Papers 132, 1^96
Camus, G. (1975). La Cha|Œ ne des Puys (Massif Central Franc� ais):Etude structurale et volcanologique, PhD thesis, University ofClermont-Ferrand.
Camus, G., Goer de Herve, A., Kieffer, G., Mergoil, J. & Vincent, P.M. (1975). Volcanologie de la Cha|Œ ne des Puys. Parc NaturelRe¤ gional des Volcans d’Auvergne Clermont-Ferrand, 112 p, þ 1/25 000 map.
Caricchi, L., Ulmer, P. & Peccerillo, A. (2008). A high-pressure ex-perimental study on the evolution of the silicic magmatism of theMain Ethiopian Rift. Lithos 91, 46^58.
Carslaw, H. S. & Jaeger, J. C. (1959). Conduction of Heat in Solids.Oxford: Oxford University Press, 510 p.
Chou, I.-M. (1987). Oxygen buffer and hydrogen sensor technique atelevated pressures and temperatures. In: Barnes, H. L. &Ulmer, G. C. (eds) Hydrothermal Experimental Techniques. New York:JohnWiley, pp. 61^99.
Costa, F., Scaillet, B. & Pichavant, M. (2004). Petrological and experi-mental constraints on the pre-eruption conditions of Holocenedacite fromVolca¤ n San Pedro (368S, Chilean Andes) and the im-portance of sulphur in silicic subduction-related magmas. Journalof Petrology 45, 855^881.
Cottrell, E., Gardner, J. E. & Rutherford, M. J. (1999). Petrologic andexperimental evidence for the movement and heating of thepre-eruptive Minoan rhyodacite (Santorini, Greece). Contributionsto Mineralogy and Petrology 135, 315^331.
Couch, S., Sparks, R. S. J. & Carroll, M. R. (2001). Mineral disequi-librium in lava explained by convective self-mixing in openmagma chambers. Nature 411, 1037^1039.
Czamanske, G. K. &Wones, D. R. (1973). Oxidation during magmaticdifferentiation, Finmarka Complex, Oslo area, Norway: Part 2:the mafic silicates. Journal of Petrology 14, 349^380.
Dall’Agnol, R., Scaillet, B. & Pichavant, M. (1999). An experimentalstudy of a lower Proterozoic A-type granite from the EasternAmazonian craton, Brazil. Journal of Petrology 40, 1673^1698.
MARTEL et al. TRACHYTES, CHAI“ NE DES PUYS
1105
Dow
nloaded from https://academ
ic.oup.com/petrology/article/54/6/1071/1407557 by guest on 05 July 2022

Deer, W. A., Howie, R. A. & Zussman, J. (1992). An Introduction to theRock-forming Minerals, 2nd edn.. Harlow: Longman.
Devine, J. D., Gardner, J. E., Brack, H. P., Layne, G. D. &Rutherford, M. J. (1995). Comparison of microanalytical methodsfor estimating H2O contents of silicic volcanic glasses. AmericanMineralogist 80, 319^328.
Devine, J. D., Rutherford, M. J., Norton, G. E. & Young, S. R. (2003).Magma storage region processes inferred from geochemistry ofFe^Ti oxides in andesitic magma, Soufrie' re Hills volcano,Montserrat,W.I. Journal of Petrology 44, 1375^1400.
Di Carlo, I., Rotolo, S. G., Scaillet, B., Buccheri, V. & Pichavant, M.(2010). Phase equilibrium constraints on pre-eruptive conditions ofrecent felsic explosive volcanism at Pantelleria Island, Italy.Journal of Petrology 51, 2245^2276.
Di Matteo,V., Carroll, M. R., Behrens, H.,Vetere, F. & Brooker, R. A.(2004).Water solubility in trachytic melts. Chemical Geology 213,187^196.
Dixon, J. E., Clague, D. A.,Wallace, P. & Poreda, R. (1997).Volatilesin alkalic basalts from the North ArchVolcanic Field, Hawaii: ex-tensive degassing of deep submarine-erupted alkalic series lavas.Journal of Petrology 38, 911^939.
Druitt, T., Costa, F., Deloule, E., Dungan, M. & Scaillet, B. (2012).Decadal to monthly timescales of magma transfer and reservoirgrowth at a caldera volcano. Nature 482, 77^80, doi:10.1038/nature10706.
Fabbrizio, A. & Carroll, M. R. (2008). Experimental studies of the dif-ferentiation process and pre-eruptive conditions in the magmaticsystem of Phlegrean Fields (Naples, Italy). Journal of Volcanology andGeothermal Research 171, 88^102.
Fabbrizio, A., Rouse, P. J. & Carroll, M. J. (2006). New experimentaldata on the biotite þ magnetite þ sanidine saturated phonoliticmelts and application to the estimation of magmatic water fugacity.American Mineralogist 91, 1863^1870.
Fabbrizio, A., Scaillet, B. & Carroll, M. J. (2009). Estimation ofpre-eruptive magmatic water fugacity in the Phlegrean Fields,Naples, Italy. EuropeanJournal of Mineralogy 21, 107^116.
Foury, P. (1983). Etude pe¤ trologique et expe¤ rimentale (a' une atmo-sphe' re) d’une se¤ rie alcaline continentale: la se¤ rie de la Cha|Œ ne desPuys (MCF), 3rd Cycle thesis, University of Clermont-Ferrand.
Fowler, S. J., Spera, F. J., Bohrson,W. A., Belkin, H. E. & DeVivo, B.(2007). Phase equilibria constraints on the chemical and physicalevolution of the Campanian ignimbrite. Journal of Petrology 48,459^493.
Freise, M., Holtz, F., Koepke, J., Scoates, J. & Leyrit, H. (2003).Experimental constraints on the storage conditions of phonolitesfrom Kerguelen Archipelago. Contributions to Mineralogy and
Petrology 145, 659^672.Gardner, J. E., Rutherford, M. J., Carey, S. & Sigurdsson, H. (1995).
Experimental constraints on pre-eruptive water contents and chan-ging magma storage prior to explosive eruptions of Mount StHelens volcano. Bulletin of Volcanology 57, 1^17.
Ghiorso, M. S. & Sack, R. O. (1991). Fe^Ti oxide geothermometry:thermodynamic formulation and estimation of intensive variablesin silicic magmas. Contributions to Mineralogy and Petrology 108,485^510.
Guittet, J. (1996). Ge¤ ochimie isotopique Sr et Nd des trachytes de laCha|Œ ne des Puys (MCF): Datation par thermoluminescence etde¤ se¤ quilibres radiocatifs du do“ me du Sarcoui, M2 memoir,University of Clermont-Ferrand.
Harms, E., Gardner, J. E. & Schmincke, H.-U. (2004). Phase equili-bria of the Lower Laacher See tephra (east Eifel, Germany):constraints on pre-eruptive storage conditions of a phonoliticmagma reservoir. Journal of Volcanology and Geothermal Research 134,125^138.
Holland, T. & Blundy, J. (1994). Non-ideal interactions in calcicamphiboles and their bearing on amphibole^plagioclase thermom-etry. Contributions to Mineralogy and Petrology 116, 433^447.
Holtz, F. & Johannes, W. (1991). Genesis of peraluminous granites I.Experimental investigation of melt compositions at 3 and 5 kbarsand various H2O activities. Journal of Petrology 32, 935^958.
Huppert, H. E. & Sparks, R. S. J. (1988a). Melting of the roof of achamber containing a hot, turbulently convecting fluid. Journal ofFluid Mechanics 188, 107^131.
Huppert, H. E. & Sparks, R. S. J. (1988b). The generation of graniticmagma by intrusion of basalt into continental crust. Journal of
Petrology 29(3), 599^624.Jannot, S., Schiano, P. & Boivin, P. (2005). Melt inclusions in scoria
and associated mantle xenoliths of Puy Beaunit Volcano, Cha|Πnedes Puys, Massif Central, France. Contributions to Mineralogy and
Petrology 149, 600^612.Johnson, M. C. & Rutherford, M. J. (1989). Experimentally deter-
mined conditions in the Fish CanyonTuff, Colorado, magma cham-ber. Journal of Petrology 30(3), 711^737.
Johnson, M. C., Anderson, A. T., Jr & Rutherford, M. J. (1994). Pre-eruptive volatile contents of magmas. In: Carroll, M. R. &Holloway, J. R. (eds) Volatiles in magmas. Mineralogical Society of
America, Reviews in Mineralogy 30, 281^330.Knoche, R., Dingwell, D. B. & Webb, S. L. (1995). Melt densities for
leucogranites and granitic pegmatites: partial molar volumes forSiO2, Al2O3, Na2O, K2O, Li2O, Rb2O, Cs2O, MgO, CaO, SrO,BaO, B2O3, P2O5, F2O^1, TiO2, Nb2O5, Ta2O5, and WO3.Geochimica and Cosmochimica Acta 59(22), 4645^4652.
Koyaguchi,T.&Kaneko,K.(1999).Atwo-stagethermalevolutionmodelofmagmas incontinentalcrust.JournalofPetrology40(2),241^254.
Koyaguchi, T. & Kaneko, K. (2000). Thermal evolution of silicicmagma chambers after basalt replenishments. Transactions of the
Royal Society of Edinburgh, Earth Sciences 91, 47^60.Leake, B. E.,Woolley, A. R. et al. (1997). Nomenclature of amphiboles:
Report of the subcommittee on amphiboles of the InternationalMineralogical Association, Commission on New Minerals andMineral Names. Canadian Mineralogist 35, 219^246.
Le Bas, M. J., Le Ma|Πtre, R.W., Streckeisen, A. & Zanettin, B. (1986).A chemical classification of volcanic rocks based on the totalalkali^silica diagram. Journal of Petrology 27, 745^750.
Martel, C. & Schmidt, B. C. (2003). Decompression experiments as aninsight into ascent rates of silicic magmas. Contributions to
Mineralogy and Petrology 144, 397^415.Martel, C., Pichavant, M., Bourdier, J.-L., Traineau, H., Holtz, F. &
Scaillet, B. (1998). Magma storage conditions and control of erup-tion regime in silicic volcanoes: experimental evidence from Mt.Pele¤ e. Earth and Planetary Science Letters 156, 89^99.
Martel, C., Pichavant, M., Holtz, F., Scaillet, B., Bourdier, J.-L. &Traineau, H. (1999). Effect of fO2 and H2O on andesite phase rela-tions between 2 and 4 kbars. Journal of Geophysical Research 104,29453^29470.
Martel, C., Bourdier, J.-L., Pichavant, M. & Traineau, H. (2000).Textures, water content and degassing of silicic andesites fromrecent plinian and dome-forming eruptions at Mount Pele¤ e volcano(Martinique, Lesser Antilles arc). Journal of Volcanology and Geother-
mal Research 96, 191^206.Maury, R., Brousse, R., Villemant, B., Joron, J.-L., Jaffrezic, H. &
Treuil, M. (1980). Cristallisation fractionne¤ e d’un magma basal-tique alcalin: la se¤ rie de la Cha|Œ ne des Puys (Massif Central,France). I. Pe¤ trologie. Bulletin de Mine¤ ralogie 103, 250^266.
Merle, O. & Michon, L. (2001). The formation of theWest Europeanrift: a new model as exemplified by the Massif Central area.Bulletin de la Socie¤ te¤ Ge¤ ologique de France 172, 213^221.
JOURNAL OF PETROLOGY VOLUME 54 NUMBER 6 JUNE 2013
1106
Dow
nloaded from https://academ
ic.oup.com/petrology/article/54/6/1071/1407557 by guest on 05 July 2022

Miallier, D., Michon, L., Evin, J., Pilleyre, T., Sanzelle, S. &Vernet, G. (2004). Volcans de la cha|Œ ne des Puys (Massif Central,France): point sur la chronologie Vasset^Kilian^Pariou^Chopine.Comptes Rendus Ge¤ oscience 336, 1345^1353.
Miallier, D., Boivin, P., Deniel, C., Gourgaud, A., Lanos, P.,Sforna, M. & Pilleyre, T. (2010). The ultimate summit eruption ofPuy de Do“ me volcano (Cha|Œ ne des Puys, French Massif Central)about 10,700 years ago. Comptes Rendus Ge¤ oscience 342, 847^854.
Nekvasil, H., Dondolini, A., Horn, J., Filiberto, J., Long, H. &Lindsley, D. H. (2004). The origin and evolution of silica-saturatedalkalic suites: an experimental study. Journal of Petrology 45, 693^721.
Nelson, S. A. & Hegre, J. (1990). Volcan Las Navajas, a Pliocene^Pleistocene trachyte/peralkaline rhyolite volcano in the northwes-tern Mexican volcanic belt. Bulletin of Volcanology 52, 186^204.
Pallister, J. S., Hoblitt, R. P. & Reyes, A. G. (1992). A basalt trigger forthe 1991 eruptions of Pinatubo volcano? Nature 356, 436^428.
Pichavant, M. (1987).The effects of boron and water on liquidus phaserelations in the haplogranite at 1 kbar. American Mineralogist 72,1056^1070.
Prouteau, G. & Scaillet, B. (2003). Experimental constraints onthe origin of the 1991 Pinatubo dacite. Journal of Petrology 44,2203^2241.
Pupin, J.-P. (1976). Signification des caracte' res morphologiques duzircon commun des roches en pe¤ trologieçbase de la me¤ thodetypologique et applications, PhD thesis, University of Nice.
Richard, L. R. & Clarke, D. B. (1990). Amphibol: a program for calcu-lating structural formulae and for classifying and plotting chemicalanalyses of amphiboles. American Mineralogist 75, 421^423.
Ridolfi, F. & Renzulli, A. (2012). Calcic amphiboles in calc-alkalineand alkaline magmas: thermobarometric and chemometric empir-ical equations valid up to 11308C and 2·2 GPa. Contributions to
Mineralogy and Petrology. 163, 877^895.Rutherford, M. J., Sigurdsson, H., Carey, S. & Davis, A. (1985). The
May 18, 1980, eruption of Mount St. Helens 1. Melt compositionand experimental phase equilibria. Journal of Geophysical Research
90(B4), 2929^2947.Scaillet, B. & Evans, B.W. (1999). The 15 June 1991 eruption of Mount
Pinatubo. I. Phase equilibria and pre-eruption P^T^fO2^aH2O.Journal of Petrology 40, 381^411.
Scaillet, B. & Macdonald, R. (2001). Phase relations of peralkaline si-licic magmas and petrogenetic implications. Journal of Petrology 42,825^845.
Scaillet, B. & Macdonald, R. (2003). Experimental constraints on therelationships between peralkaline rhyolites of the Kenya RiftValley. Journal of Petrology 44, 1867^1894.
Scaillet, B., Pichavant, M. & Roux, J. (1995). Experimental crystal-lization of leucogranite magmas. Journal of Petrology 36(3), 663^705.
Scaillet, B., Pichavant, M. & Cioni, R. (2008). Upward migration ofVesuvius magma chamber over the past 20,000 years. Nature 455,216^219.
Schilling, J.-G., Bergeron, M. B. & Evans, R. (1980). Halogens in themantle beneath the North Atlantic. Philosophical Transactions of theRoyal Society of London 297, 147^178.
Schmidt, M.W. (1992). Amphibole composition in tonalite as a func-tion of pressure: an experimental calibration of theAl-in-hornblende barometer. Contributions to Mineralogy and Petrology
110, 304^310.Signorelli, S. & Carroll, M. R. (2002). Experimental study of Cl solu-
bility in hydrous alkaline melts: constraints on the theoretical max-imum amount of Cl in trachytic and phonolitic melts. Contributionsto Mineralogy and Petrology 143, 209^218.
Snyder, D. (2000). Thermal effects of the intrusion of basaltic magmainto a more silicic magma chamber and implications for eruptiontriggering. Earth and Planetary Science Letters 175, 257^273.
Stormer, J. (1978). XLFRAC: a program for the interactive testing ofmagmatic differentiation models. Computers and Geosciences 4,143^159.
Turner, J. S. (1973). Buoyancy Effects in Fluids. Cambridge: CambridgeUniversity Press.
Tuttle, O. F. & Bowen, N. L. (1958). Origin of granite in the light of ex-perimental studies in the system NaAlSi3O8^KAlSi3O8^SiO2^H2O. Geological Society of America, Memoirs 74, 153.
Venezky, D.Y. & Rutherford, M. J. (1999). Petrology and Fe^Ti oxidereequilibration of the 1991Mount Unzen mixed magma. Journal ofVolcanology and Geothermal Research 89, UnzenVolcano Special Issue,213^230.
Villemant, B., Joron, J.-L., Jaffrezic, H., Treuil, M., Maury, R. &Brousse, R. (1980). Cristallisation fractionne¤ e d’un magma basal-tique alcalin: la se¤ rie de la Cha|Œ ne des Puys (Massif Central,France). II. Ge¤ ochimie. Bulletin de Mine¤ ralogie 103, 267^286.
Villemant, B., Joron, J.-L., Jaffrezic, H. & Treuil, M. (1981).Distribution coefficients of major and trace elements: fractionalcrystallization in the alkali basalt series of Cha|Πne des Puys(Massif Central, France). Geochimica and Cosmochimica Acta 45,1997^2016.
Waldbaum, D. R. & Thompson, J. B., Jr (1969). Mixing properties ofsanidine crystalline solutions IV: phase diagram from equation ofstate. American Mineralogist 54, 1274^1298.
White, S. M., Crisp, J. A. & Spera, F. J. (2006). Long-term volumetriceruption rates and magma budgets. Geochemistry, Geophysics,
Geosystems 7, Q03010, doi:10.1029/2005GC001002.Whittington, A., Richet, P., Linard,Y. & Holtz, F. (2001). The viscos-
ity of hydrous phonolites and trachytes. Chemical Geology 174,209^223.
Wilson, M. (2008). Upper mantle plumesçhotspots or wetspots?International Geological Congress: Oslo, Available from:http://wwwcprm.gov.br/33IGC/1343986.html.
Zeyen, H., Novak, O., Landes, M., Prodehl, C., Driad, L. & Hirn, A.(1997). Refraction-seismic investigations of the northern MassifCentral (France).Tectonophysics 275, 99^117.
MARTEL et al. TRACHYTES, CHAI“ NE DES PUYS
1107
Dow
nloaded from https://academ
ic.oup.com/petrology/article/54/6/1071/1407557 by guest on 05 July 2022
Related Documents