DELSA/ELSA/WD/SEM(2006)3 OECD SOCIAL, EMPLOYMENT AND MIGRATION WORKING PAPERS An Age Perspective on Economic Well-Being and Social Protection in Nine OECD Countries Thai-Thanh Dang, Herwig Immervoll, Daniela Mantovani, Kristian Orsini, Holly Sutherland 34

Welcome message from author
This document is posted to help you gain knowledge. Please leave a comment to let me know what you think about it! Share it to your friends and learn new things together.
Transcript

DELSA/ELSA/WD/SEM(2006)3
OECD SOCIAL, EMPLOYMENT AND MIGRATION WORKING PAPERS
An Age Perspective on Economic Well-Being and Social Protection in Nine OECD
Countries
Thai-Thanh Dang, Herwig Immervoll, Daniela Mantovani, Kristian Orsini, Holly Sutherland
34

Unclassified DELSA/ELSA/WD/SEM(2006)3 Organisation de Coopération et de Développement Economiques Organisation for Economic Co-operation and Development 09-Jun-2006 ___________________________________________________________________________________________
English - Or. English DIRECTORATE FOR EMPLOYMENT, LABOUR AND SOCIAL AFFAIRS EMPLOYMENT, LABOUR AND SOCIAL AFFAIRS COMMITTEE
OECD SOCIAL, EMPLOYMENT AND MIGRATION WORKING PAPERS NO. 34 AN AGE PERSPECTIVE ON ECONOMIC WELL-BEING AND SOCIAL PROTECTION IN NINE OECD COUNTRIES
Thai-Thanh Dang, Herwig Immervoll, Daniela Mantovani, Kristian Orsini, Holly Sutherland
JEL Classification: C81, D31, H22, H55
All Social, Employment and Migration Working Papers are now available through OECD's Internet website at http://www.oecd.org/els
JT03210337
Document complet disponible sur OLIS dans son format d'origine Complete document available on OLIS in its original format
DE
LSA
/EL
SA/W
D/SE
M(2006)3
Unclassified
English - O
r. English
Cancels & replaces the same document of 09 June 2006
DELSA/ELSA/WD/SEM(2006)3
DIRECTORATE FOR EMPLOYMENT, LABOUR AND SOCIAL AFFAIRS
http://www.oecd.org/els
OECD SOCIAL, EMPLOYMENT AND MIGRATION WORKING PAPERS
http://www.oecd.org/els/workingpapers
This series is designed to make available to a wider readership selected labour market, social policy and migration studies prepared for use within the OECD. Authorship is usually collective, but principal writers are named. The papers are generally available only in their original language – English or French – with a summary in the other. Comment on the series is welcome, and should be sent to the Directorate for Employment, Labour and Social Affairs, 2, rue André-Pascal, 75775 PARIS CEDEX 16, France.
The opinions expressed and arguments employed here are the responsibility of the author(s) and do not necessarily reflect those of the OECD
Applications for permission to reproduce or translate all or part of this material should be made to:
Head of Publications Service
OECD 2, rue André-Pascal
75775 Paris, CEDEX 16 France
Copyright OECD 2006
2

DELSA/ELSA/WD/SEM(2006)3
ACKNOWLEDGEMENTS
Thai-Thanh Dang is currently a consultant for the OECD Economics Department; Herwig Immervoll is Economist and Social Policy Analyst at the OECD, Research Associate at ISER, University of Essex, Research Affiliate at the European Centre, Vienna and Research Fellow at IZA, Bonn; Daniela Mantovani is Lecturer at Universita di Modena e Reggio Emilia; Kristian Orsini is PhD student at Katholieke Universiteit Leuven; Holly Sutherland is Professor at ISER, University of Essex. The results reported in this study are based on EUROMOD and four national tax-benefit models using household micro-data from nine countries (see Table 1). We wish to thank CEPS/INSTEAD, the EUROMOD consortium, Statistics Norway, the Swedish Ministry of Finance and the Urban Institute for providing us with the data and for assisting with validating the results, and Mark Pearson and Monika Queisser for providing valuable comments on earlier drafts. However, any errors and the views expressed in this paper are the authors' responsibility. In particular, the paper does not represent the views of the institutions to which the authors are affiliated. Similarly, providers of the micro-data underlying the tax-benefit models do not bear any responsibility for the analysis or interpretation of the data reported here.
3

DELSA/ELSA/WD/SEM(2006)3
SUMMARY
1. For a number of reasons, incomes vary strongly with age. The nature of this variation is of interest for a wide range of policy purposes. Since age structures differ across countries, knowledge about the incomes earned by different age groups is also necessary for understanding and interpreting international comparisons of overall inequality. This paper quantifies the economic well-being of different age groups and the extent to which they rely on incomes from public and private sources. The analysis aims at establishing how social benefits, and the taxes needed to finance them, affect income levels and income disparities across different age groups. Results are compared across nine OECD countries.
2. We use tax-benefit microsimulation models in conjunction with detailed household micro-data in order to illustrate the influence of patterns of market incomes, household structures and different types of social protection measures on the income distribution among and between individual age groups during the late 1990s. The aim is to establish a “baseline” using information from a period that represents an early phase of the projected increase in dependency ratios and therefore also pre-dates some of the major reforms that are being introduced to address these demographic developments. Given the strong existing focus on macro-economic and fiscal consequences of demographic changes, we argue that such an explicit distributional perspective is urgently needed. The results for the late 1990s provide a counter-factual for determining the relative importance of demographic trends and policy reforms in driving observed changes in resource distributions and financial well-being.
3. Results show that existing social protection systems are to a very large extent “old-age” protection systems, with those aged 65 and over typically receiving almost three times the (net) cash transfers of the average person. In some countries, cash benefits are even more targeted towards elderly individuals, while comparatively little is spent on securing adequate resources for younger generations. Nevertheless, in most countries, the incidence of “low” incomes is higher among old-age individuals than for the population as a whole.
4. Even without accounting for health-related spending, which is not considered here, these patterns clearly highlight the challenges associated with ageing populations. The results also underline the importance of carefully designed safety-net measures, however. Existing spending patterns and distributional outcomes suggest that there is considerable scope for re-balancing social protection spending without necessarily compromising distributional objectives.
4

DELSA/ELSA/WD/SEM(2006)3
RÉSUMÉ
5. Les revenus varient grandement avec l’âge pour un certain nombre de raisons. La nature de ces variations est intéressante à plus d’un égard à des fins politiques. Comme la structure des âges diffère d’un pays à l’autre, l’information relative aux revenus perçus par les différents groupes d’âge est aussi nécessaire pour comprendre et interpréter les comparaisons internationales de l’inégalité. Ce document quantifie le bien-être économique des différents groupes d’âge et montre dans quelle mesure ces derniers dépendent de revenus provenant de sources publiques et privées. L’analyse tend à établir comment les prestations sociales, ainsi que les impôts et contributions sociales devant les financer, influencent les niveaux et les disparités des revenus parmi différents groupes d’âge. Le document compare les résultats pour neuf pays de l’OCDE.
6. Nous utilisons des modèles de microsimulation d’impôts et de prestations conjointement avec des micro-données détaillées sur les ménages afin d’illustrer l’influence des modes des revenus marchands, des structures des ménages et des différents types de mesures de protection sociale sur la distribution des revenus parmi et entre les groupes d’âge à la fin des années 90. L’objectif est d’établir un « point de référence » qui utilise l’information provenant d’une période représentant la première étape de l’augmentation prévue des ratios de dépendance et qui par conséquent précède aussi quelques-unes des principales réformes qui sont actuellement introduites pour faire face à ces évolutions démographiques. Vu le fort accent mis sur les conséquences fiscales et macro-économiques des changements démographiques, nous pensons qu’il est urgent d’avoir une telle perspective distributive clairement définie. Les résultats pour la fin des années 90 fournissent un contre-factuel afin de déterminer l’importance relative des évolutions démographiques et des réformes de politiques conduisant à des changements dans la distribution de revenus et le bien-être financier.
7. Les résultats montrent que des systèmes de protection sociale en place sont dans une large mesure des systèmes de protection pour les personnes âgées, avec ceux âgés de 65 et plus recevant presque trois fois les transferts en liquide nets d’une personne moyenne. Dans certains pays, les prestations en liquide sont encore plus ciblées vers les individus âgés alors que comparativement peu est dépensé pour assurer des ressources suffisantes pour les plus jeunes générations. Toutefois, dans la plupart des pays, l’incidence des bas revenus est plus forte parmi les individus âgés que parmi la population dans son ensemble.
8. Même sans comptabiliser les dépenses liées à la santé qui ne sont pas analysées dans ce document, ces tendances soulignent clairement le défi associé avec les populations vieillissantes. Les résultats soulignent aussi l’importance d’avoir des mesures de systèmes de protection soigneusement conçus. Des types de dépenses actuelles et des résultats de distribution suggèrent qu’il y a de fortes possibilités pour rééquilibrer les dépenses de protection sociale sans nécessairement compromettre les objectifs distributionnels.
5

DELSA/ELSA/WD/SEM(2006)3
TABLE OF CONTENTS
ACKNOWLEDGEMENTS ............................................................................................................................3 SUMMARY ....................................................................................................................................................4 RÉSUMÉ.........................................................................................................................................................5 1. INTRODUCTION ................................................................................................................................7 2. SCOPE AND METHODOLOGY ......................................................................................................10
2.1. Economic well-being of different age groups in a cross-sectional perspective ..............................10 2.2. Methodology: combining household data with tax and benefit simulation models........................11
3. AGE STRUCTURE AND INCOME SITUATION ...........................................................................14 3.1. The income situation by age group............................................................................................16 3.2 Income distribution within and between age groups .................................................................17
4. AGE-PROFILES OF SOCIAL PROTECTION EXPENDITURES ..................................................21 4.1 Levels and composition of benefit expenditure.........................................................................21 4.2 How is the money spent? Social benefits by age group ............................................................22 4.3 Which age groups are best protected from poverty? .................................................................28
5. AGE PROFILES OF DIFFERENT INCOME COMPONENTS .......................................................30 5.1 Income from work .....................................................................................................................30 5.2 Old-age pensions .......................................................................................................................34 5.3 Financing social expenditure: Age-incidence of taxes and contributions .................................35
CONCLUSIONS ...........................................................................................................................................40 ANNEX INCOME COMPONENTS ...........................................................................................................41 BIBLIOGRAPHY .........................................................................................................................................52 Boxes
Box 1. Interpretation and limitations of cross-sectional income data........................................................10 Box 2. EUROMOD: A multi-country tool for analysing social and fiscal policies...................................12
6

DELSA/ELSA/WD/SEM(2006)3
1. INTRODUCTION
9. Levels and disparities of household incomes are two of the main criteria used in assessing the outcomes of economic and social policies. At the most elementary level, they are a reflection of individual households’ economic circumstances. In addition, and depending on society’s preferences, the distribution of incomes is presumed to affect social well-being as a whole. Importantly, the degree of income inequality is also a measure of the effectiveness of social policies designed to reduce it. Indeed, the impact of policy measures on inequalities can be a decisive determinant of the political feasibility of reforms.
10. For a number of reasons, incomes vary strongly with age. The nature of this variation is of interest for a wide range of policy purposes. Since age structures differ across countries, knowledge about the incomes earned by different age groups is also necessary for understanding and interpreting international comparisons of overall inequality. The association between income and age, how it differs across countries, and the role of taxes and cash transfers in equalising incomes, are the subjects of this paper. It quantifies the economic well-being of different age groups and the extent to which they rely on incomes from public and private sources. More specifically, the analysis aims at establishing how social benefits, and the taxes needed to finance them, affect income levels and income disparities across different age groups. Results are compared across nine OECD countries.
11. Since most tax and benefit provisions are either directly age-related or depend on contingencies and circumstances that tend to occur at particular ages, one would expect a strong influence of age on tax burdens and benefit entitlements. Child benefits and old-age pensions are the most obvious examples of age-related transfers. More generally, however, taxes and benefits are strongly dependent on market incomes, which tend to increase with age before dropping sharply following retirement.
12. Other contingencies and “life-events” that affect earning capabilities, such as education, family formation and child rearing, as well as disability or unemployment, are also more prevalent among particular age groups. Household formation and increasing family sizes can contribute to well-known “poverty cycles” as meeting the additional needs of new family members can strain family budgets. At the same time, sharing resources within the household provides an important mechanism for cushioning the negative consequences of contingencies, such as unemployment, affecting individual family members. At both the individual and household levels, social protection measures and progressive tax systems are likely to provide some degree of smoothing of age-related income fluctuations.
13. Understanding how market incomes, tax burdens and benefit entitlements differ by age group is important for a number of reasons:
• Age profiles of aggregate spending and revenue patterns are of political interest. They are a reflection of past and present trade-offs between the interests of different constituencies and therefore reveal information about their respective weights in the political process. Further, the distribution of current social protection spending by age can indicate the degree of political support one might expect for particular reform measures.
7
DELSA/ELSA/WD/SEM(2006)3
• At the household level, differences in market incomes, tax burdens and benefit receipt across age group reveal how particular contingencies are concentrated among age groups and to what extent transfers moderate the resulting income differences.
• Comparing across countries, the relative sizes of different types of benefits and taxes show whether different institutional setups (e.g. generous pensions/high social contributions versus basic pension/low contributions) are associated with particular outcomes for each age group.
• With age structures differing markedly across countries, age-income profiles are crucial ingredients for understanding country differences in income inequality and redistribution.
• Changes of demographic variables can have major effects on income disparities, even in the absence of policy reforms. Confronted with “greying” populations, current age differentials in both income levels and dispersion are useful for illustrating the orders of magnitude of these forces.
• Public pensions systems are subject to major reform efforts in most OECD countries. While these are driven by fiscal requirements (which are now well-understood), they will invariably have distributional implications (which are currently largely unknown). Information on contemporary income distributions represents an important element of a more balanced research agenda. It establishes the counter-factual or “baseline” that is required for assessing the distributional consequences of pension reforms.
• More generally, the composition of total household incomes shows to what extent people in particular circumstances rely on different income sources, including social benefits. This provides valuable clues about the immediate impact of reforms such as modifying entitlements to government transfers.
14. The present study employs tax-benefit simulation models to generate and analyse unusually rich income data for representative samples of households and individuals in nine OECD countries (Finland, France, Germany, Italy, Luxembourg, Norway, Sweden, the United Kingdom and the United States). These data provide new insights into how incomes vary by age and the extent to which taxes and social protection systems drive or respond to these differences.
15. The structure of the paper is as follows. Section 2 defines the scope of this study. It explains why “snapshots” of current incomes at one particular point in time are of interest, distinguishes between measures of current and lifetime income and clarifies the meaning of redistribution across the lifecycle, as well as between and within age groups. Different methods can be used to assess income situations across countries. We briefly explain the approach adopted here along with its advantages and limitations.
16. The remainder of the paper presents results and discusses a number of policy implications. As a first step, Section 3 compares population age-structures across countries using so-called “age-pyramids”. To provide a first indication of how income situations vary by age, the number of people with ”low” and “high” incomes are shown for each age group and, where data are available, separately for men and women.
17. The next two sections analyse what drives income differences across age groups. This is done by assessing the influences of market incomes, taxes and transfers as well as household composition on the resources of individuals and households. Section 4 provides an overview of the incidence of social benefits by deriving age-profiles of total benefit expenditures. The purpose here is not to determine which age groups “benefit most” from public transfers (a cross-sectional perspective of benefit receipt that ignores
8

DELSA/ELSA/WD/SEM(2006)3
people’s past contributions is insufficient to investigate this question). Instead, by demonstrating how social transfers differ between age and income groups, the aim is to better understand the mechanisms built into existing social protection systems. To achieve comparability across countries with different institutional setups, benefit expenditures are evaluated on a net basis, i.e. any taxes paid on gross benefits are taken into account.
18. A more finely-grained picture of individual policy instruments is presented in Section 5. Total taxes and benefits are disaggregated to separately assess the influence of income taxes, social contributions and different types of insurance-based, means-tested and universal benefits on the income situation. For each type of transfer, we show how benefit coverage and generosity vary between countries and by age and what this implies for income levels. Conclusions follow.
9

DELSA/ELSA/WD/SEM(2006)3
2. SCOPE AND METHODOLOGY
2.1. Economic well-being of different age groups in a cross-sectional perspective
19. Cross-sectional analyses of household incomes are widely used for both country-specific studies and international comparisons (recent examples are Gottschalk and Smeeding, 2000 and Förster and Mira d’Ercole, 2005). This paper focuses explicitly on the variation of incomes by age. It utilises unusually rich data on individual types of taxes and benefits to examine the links between observed incomes and particular features of social protection systems (discussed in more detail below).
Box 1. Interpretation and limitations of cross-sectional income data
Cross-sectional analyses examine cash incomes, taxes and benefits for a single and “short” period, often one particular year. This approach is common but has a number of implications for the interpretation of results:
• The “snapshot” perspective means that distributions of incomes relate to a particular year. They do not capture differences in lifetime incomes. This is significant in the present context as some of the tax-benefit instruments considered here are in fact designed to redistribute across the life-cycle rather than across individuals (e.g. pensions and other insurance-based benefits as well as the taxes earmarked to finance them).
• Age-profiles of incomes, taxes and benefits show how current economic circumstances differ between individuals who were born at different times characterised by specific socio-economic conditions and opportunities. They do not reflect the experiences of particular individuals (or cohorts) over their lifetime.
• In-kind transfers (to individual households or provided as collective goods and services) can represent a significant portion of the resources transferred from governments to households. Private forms of non-cash incomes (e.g. from household production or owner-occupied housing) can also be an important source of well-being. The present study documents cash incomes only as consistent information on non-cash incomes across countries is unavailable.
• Finally, taxes and cash benefits are crucial determinants of household incomes in general and the relative incomes of different age groups in particular. The size and distribution of taxes and transfers in relation to total household incomes, as documented in this paper, are therefore of considerable interest. Yet, such data provide a partial measure of the overall effects of taxes and transfers on household incomes (see, for instance, Boadway and Keen, 2000). Apart from their direct mechanical influence on household incomes, taxes and benefits are likely to affect prices and household behaviour. The resulting influences on both market incomes and economic welfare are not captured by looking at the amounts of taxes and benefits alone.
20. The focus of the paper is on current cash incomes. It does not consider longer-term or dynamic aspects of income distribution (see Box 1). While a long-term view is useful for many purposes, the distribution of current incomes remains an essential yardstick for assessing policy outcomes. Indeed, policy measures that are designed to redistribute inter-temporally can, as shown in the results reported here, have marked effects on cross-sectional inequality. In turn, these effects may significantly influence the political feasibility of introducing certain social policy measures in the first place. Income disparities in any given year are a measure of the effectiveness of measures that aim to provide financial assistance for those in
10
DELSA/ELSA/WD/SEM(2006)3
need. Indeed, present disparities are likely to be perceived differently, perhaps as more acute, than inequalities that materialise over long periods of time.
2.2. Methodology: combining household data with tax and benefit simulation models
21. The results reported here come from an OECD-funded project on the design of social protection systems and their effects on household incomes. The project used household micro-data in combination with tax-benefit simulation models to obtain detailed information on incomes as well as individual and household characteristics.
22. Essentially, tax-benefit models supplement income information contained in conventional household data-sets with calculated tax and benefit amounts. Using exact policy rules for a given year, the models compute taxes and benefits for each individual or household conditional on relevant characteristics as recorded in the data, such as market income, family situation, labour market status, etc. The resulting tax and benefit amounts provide a good estimate of the size and distribution of tax liabilities and benefit entitlements.
23. This information, while essential for studying and monitoring social and fiscal policy measures, is often either not recorded in the household micro-data at all or not at the required levels of detail. Many income surveys do not, for example, record tax payments; or different benefit categories may be aggregated into one single variable, inhibiting the analysis of the distributional consequences of individual policy instruments. The simulation approach addresses some of these problems and permits a thorough assessment of the characteristics and distributive effects of individual social and fiscal policy instruments. For instance, it is possible:
• To separate the effects of income taxes, social security contributions, and different types of transfer payments. Simulated taxes and benefits often provide a finer breakdown of individual social and fiscal policy instruments than could be obtained from household data directly.
• To assess incomes for the household as a whole and at the individual level. Available sources of household micro-data sometimes record incomes at the household level, whereas tax-benefit models are able to compute taxes and benefits separately for each fiscal unit; and
• To provide more informative cross-country comparisons of redistributive policies by deriving measures of net benefit payments (gross benefits minus the taxes paid on them).
24. Governments and researchers in most OECD countries routinely turn to this type of model for analysing existing tax-benefit policies and evaluating reforms. Until recently, the country-specific architecture of tax-benefit models has, however, precluded their use for international comparisons. The present attempt to overcome these difficulties and provide results on a comparable basis has greatly benefited from the experience of a recent European exercise to develop a multi-country model for the European Union (EUROMOD: see Box 2). EUROMOD also provides the results for most of the European countries covered in this paper. The main features of the methodology are as follows.
11

DELSA/ELSA/WD/SEM(2006)3
Box 2. EUROMOD: A multi-country tool for analysing social and fiscal policies
EUROMOD is a tax benefit microsimulation model that covers many countries within one framework: currently the 15 Member States that made up the European Union prior to the 2004 enlargement. As such it can simulate the rules behind all 15 tax-benefit systems, which are very diverse, as well as including databases broadly representative of 15 household populations.
The idea of EUROMOD first originated among a group of academics from several countries working together on social policy and taxation comparisons. It was constructed specifically to maximise comparability across countries, recognising that national models tend to run with national assumptions and conventions “hardwired” in. Such factors as the definition of a dependent child, the unit of analysis, the coverage of taxes and benefits, the reference time period, the policy year that is simulated, the method used to update the microdata to that year and the assumptions about benefit take-up and tax evasion can vary widely across national models. Conducting comparable analysis with a set of national models is difficult or impossible. Furthermore, access to many models at once may be difficult to negotiate. The initial construction of EUROMOD and subsequent development, mainly funded by a succession of European Commission research grants, drew on national expertise at each stage. A large consortium is involved: a total of 60 or so individuals, with 35 at any one time in 18 institutions across the 15 countries. This has required a significant amount of scientific coordination, with a special focus on the comparability of model results across countries. EUROMOD is much more flexible than a national model and it is this flexibility in many dimensions that enables comparability of results is to be achieved.
In this study EUROMOD is used to provide comparable measures of the effects of taxes and benefits under existing policies.1 It can also be used to estimate the impact of tax-benefit reforms on income distributions and work incentives, with (a) the specification of policy changes, (b) the application of revenue constraints and (c) the evaluation of results, each taking place at either the national or the European level. This makes it possible to assess the consequences of common social policies or to examine how different policies in different countries may contribute to common objectives. It can be used to evaluate national policies within a European perspective, as well as policies at the level of the European Union, and to evaluate the effect of one country’s policies on another country’s population.
For more information about EUROMOD see http://www.iser.essex.ac.uk/msu/emod/
1. While the study includes results from other national models as well, the process of producing comparable results from these different models has substantially benefited from the experience of the EUROMOD construction project.
25. Nationally representative household micro-data used in each of the nine countries are listed in Table 1. All datasets describe household circumstances in the late 1990s but some differences in reference years exist; this should be kept in mind when interpreting results as the age-composition of populations can change noticeably even in a few years and is therefore affected to some degree by the choice of reference year. In addition, the late 1990s have seen the introduction of a number of policy reforms, notably in the area of pensions. As a result, old-age benefits as recorded in the data may also be sensitive to the choice of reference year, although most pension reforms affect mostly future rather than current pensioners.
12
DELSA/ELSA/WD/SEM(2006)3
Table 1. Data sources and tax-benefit models
Country Base Dataset Tax-benefit model, Institution
Sample size (households)
Data collection
Reference period for incomes
Finland Income distribution survey EUROMOD 10 010 1997 annual 1997 France Budget de Famille EUROMOD 11 291 1994/5 annual 1993/4 Germany German Socio-Economic Panel (W15) EUROMOD 7 494 1998 annual 1997 Italy Survey of Households Income and Wealth EUROMOD 8 135 1996 annual 1995 Luxembourg PSELL-2 (W5) CEPS/INSTEAD 2 539 1999 annual 1998 Norway Income and Property Statistics for Households Statistics Norway 21 000 1998 annual 1998 Sweden Income Distribution Survey Finance Ministry 13 153 1998 annual 1998 United Kingdom Family Expenditure Survey EUROMOD 6 797 1995/6 monthly 1995/6
United States Current Population Survey TRIM3, Urban Institute 56 161 1998 annual 1998
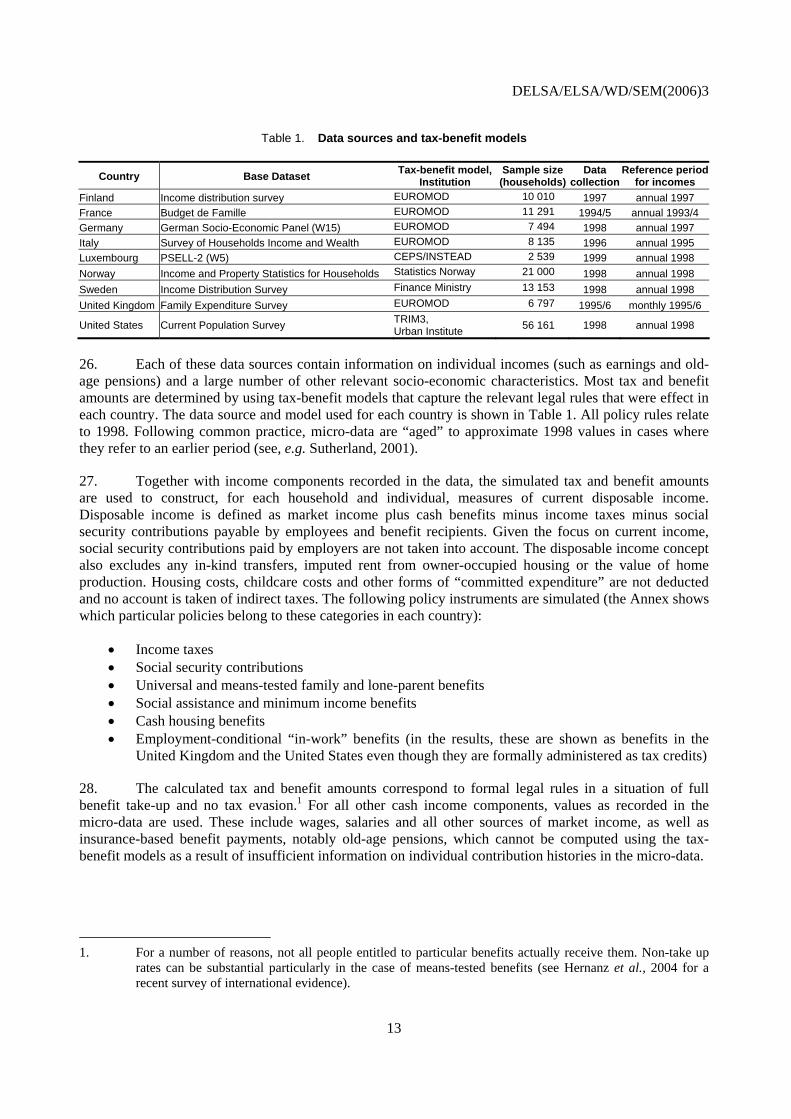
26. Each of these data sources contain information on individual incomes (such as earnings and old-age pensions) and a large number of other relevant socio-economic characteristics. Most tax and benefit amounts are determined by using tax-benefit models that capture the relevant legal rules that were effect in each country. The data source and model used for each country is shown in Table 1. All policy rules relate to 1998. Following common practice, micro-data are “aged” to approximate 1998 values in cases where they refer to an earlier period (see, e.g. Sutherland, 2001).
27. Together with income components recorded in the data, the simulated tax and benefit amounts are used to construct, for each household and individual, measures of current disposable income. Disposable income is defined as market income plus cash benefits minus income taxes minus social security contributions payable by employees and benefit recipients. Given the focus on current income, social security contributions paid by employers are not taken into account. The disposable income concept also excludes any in-kind transfers, imputed rent from owner-occupied housing or the value of home production. Housing costs, childcare costs and other forms of “committed expenditure” are not deducted and no account is taken of indirect taxes. The following policy instruments are simulated (the Annex shows which particular policies belong to these categories in each country):
• Income taxes • Social security contributions • Universal and means-tested family and lone-parent benefits • Social assistance and minimum income benefits • Cash housing benefits • Employment-conditional “in-work” benefits (in the results, these are shown as benefits in the
United Kingdom and the United States even though they are formally administered as tax credits)
28. The calculated tax and benefit amounts correspond to formal legal rules in a situation of full benefit take-up and no tax evasion.1 For all other cash income components, values as recorded in the micro-data are used. These include wages, salaries and all other sources of market income, as well as insurance-based benefit payments, notably old-age pensions, which cannot be computed using the tax-benefit models as a result of insufficient information on individual contribution histories in the micro-data.
1. For a number of reasons, not all people entitled to particular benefits actually receive them. Non-take up
rates can be substantial particularly in the case of means-tested benefits (see Hernanz et al., 2004 for a recent survey of international evidence).
13

DELSA/ELSA/WD/SEM(2006)3
3. AGE STRUCTURE AND INCOME SITUATION
29. How many old and young people live in each country and in what circumstances? Information on a population’s age structure is needed to understand both the impact of age-related policies and the political feasibility of proposed policy measures. It is also required for assessing the implications of demographic developments such as the “greying” of populations on the shape of the income distribution. This section presents countries’ age structures by using one common type of summary pictures, so-called age-pyramids.
30. Age pyramids are derived here from samples of households and individuals as described in Section 2. As such, they are not as detailed as results derived from census data.2 But contrary to census data, household surveys (as well as the register-based data sources listed in Table 1) facilitate a simple break-down of the size of each age group by income level, providing a first indication of how incomes vary by age. While all data relate to the mid-late 1990’s, it should be noted that they are not from exactly the same year. However, the resulting age profiles provide a useful starting point for the analysis of incomes and the operation of social protection systems.
31. Age pyramids for the nine countries is shown in Figure 1. A first inspection of the shape of these graphs shows marked country differences. Cohort sizes, represented by the total width of the relevant bars, are particularly unequal in Luxembourg and the United States but remarkably uniform in Sweden. Low contemporary birth rates are reflected in small cohorts of children in Germany and Italy. At the other end of the age-spectrum, the survey data indicate large numbers of soon-to-retire 45-59 year-olds in Finland, Germany, Italy and Sweden. For countries where the necessary data have been provided, results are also presented by gender. For Norway, Sweden and the United States, no gender break-downs were available (and the pyramids are therefore symmetrical).
32. The largest share of young people, defined as those under age 20, is found in the United States with 23%, followed by France and the United Kingdom where young people make up one fifth of the population. In contrast, in Germany and Italy, young people account for less than 15% of the total population. Older people, aged 65 years and older, represent between 14 and 17% of the population in the nine countries. The lowest share is found in Finland while Germany and Sweden record the highest proportions of older people, followed by Italy and Norway. In all of the countries studied here, the fattest cohorts are those of the 30-40 year-olds.
2. See for instance the international data provided by the US Census Bureau
(www.census.gov/ipc/www/idbpyr.html) and the Council of Europe demographic year book series (http://www.coe.int/t/e/social_cohesion/population/demographic_year_book/). In addition to the statistical error margin associated with population samples, there can also be differences in scope. While census-based data aim to record the entire population, household surveys generally exclude individuals living in institutions, such as nursing homes, hospices or prisons. Where the number of people residing in these facilities are significant, survey data may underestimate the number of elderly people in particular.
14

DELSA/ELSA/WD/SEM(2006)3
15
Figure 1. Age profiles and incidence of low and high incomes by age group
0-4
10-14
2 0-24
3 0-34
4 0-44
50 -54
6 0-64
70 -74
80 +
0-4
10-14
20 -24
30 -34
40 -44
50-54
60 -64
70-74
80+
0 -4
10-14
20-2 4
30-3 4
40-4 4
50-54
60-6 4
70-74
80+Bottom uintile QQuintiles 2-4Top Quintile
FIN: women FIN: men FRA: women FRA: men
DEU: women DEU: men
0-4
10-14
2 0-24
3 0-34
4 0-44
50 -54
6 0-64
70 -74
80 +
0-4
10-14
20 -24
30 -34
40 -44
50-54
60 -64
70-74
80+
0 -4
10-14
20-2 4
30-3 4
40-4 4
50-54
60-6 4
70-74
80+ LUX: women LUX: menITA: women ITA: menGBR: women GBR: men
4.5 3.5 2.5 1.5 0.5% o ta
0.5 1.5 2.5 3.5 4.5
0-4
10-14
2 0-24
3 0-34
4 0-44
50 -54
6 0-64
70 -74
80 +
o f t l po pulat io n
NOR: total
5.0 4.0 3.0 2.0 1.0f t
0.0 1.0 2.0 3.0 4.0 5.0
0-4
10-14
20 -24
30 -34
40 -44
50-54
60 -64
70-74
80+
% o o tal po pulat io n
SWE: total
4.5 3.5 2.5 1.5 0.5% o ta
0.5 1.5 2.5 3.5 4.5
0 -4
10-14
20-2 4
30-3 4
40-4 4
50-54
60-6 4
70-74
80+
o f t l po pulat io n
USA: total
Notes: The female/male population is shown on the left/right side of the pyramids. No gender breakdowns are available for Norway, Sweden and the United States. Income quintiles are based on a ranking of individuals by equivalent household income using the “square root of household size” equivalence scale.

DELSA/ELSA/WD/SEM(2006)3
3.1. The income situation by age group
33. The age profiles in Figure 1 also show proportions in each age group with high, middle and low incomes. These represent current incomes in the late 1990s and relate to one particular point in time. Nevertheless, several of the observed patterns can be related to the evolution of income over the life cycle. Following common practice, incomes for individuals are assessed by assuming income sharing within households and are “equivalised” in order to be able to compare households of different sizes. This means that all individuals in a household potentially benefit from transfers targeted at particular household members. Pension payments, for example, are assumed to also benefit younger people if the pensioner lives in a household with other generations and contributes to household expenses. Similarly, child benefits received by a household would improve the incomes of both children and their parents.
34. The incidence of low incomes, defined here as the bottom income quintile, is shown more clearly in Table 2. In all countries, a large number of children belong to this group. Young children, whose parents are often at the initial stages of both their careers and the family formation phase, are particularly likely to experience low incomes. In the United States and the United Kingdom, both countries where high poverty rates among children are a particular concern, almost one third of children under ten live in low-income households. Similar rates are also observed for Luxembourg, but child poverty rates are nevertheless low in this country, as generous social protection programs prevent income poverty for most individuals in the bottom quintile (we come back to this below).
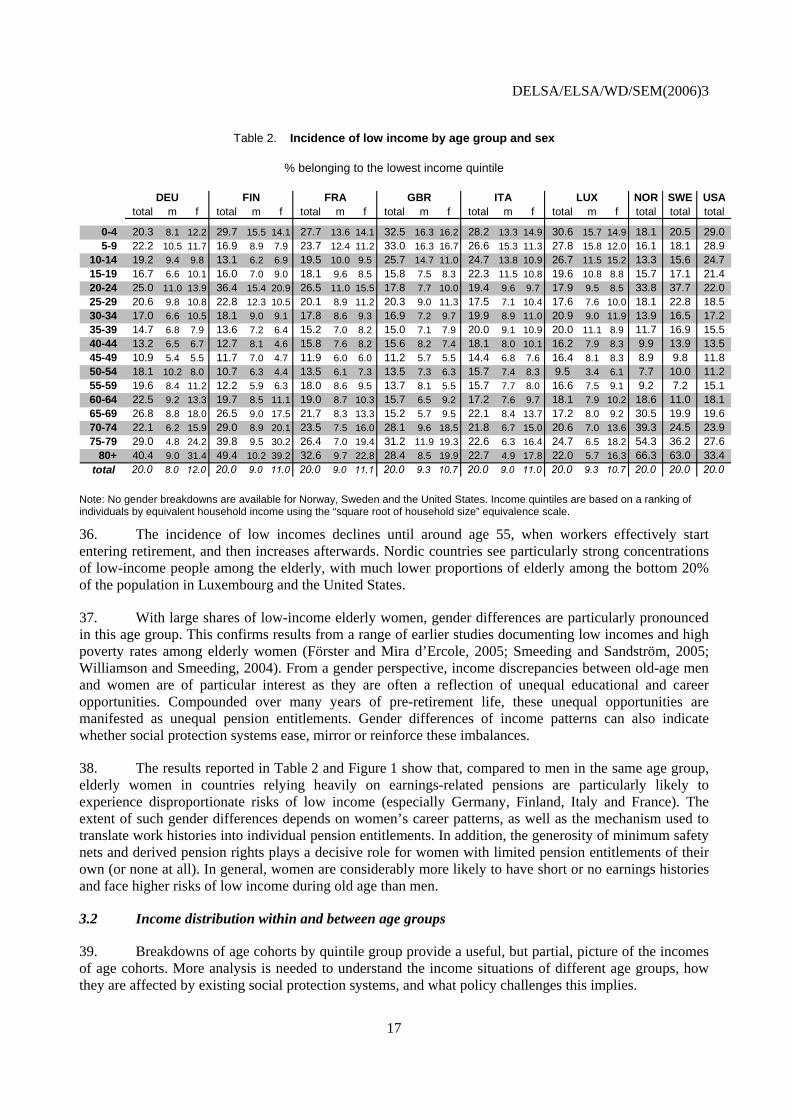
35. In most countries, the incidence of low income then declines up until the age when leaving the parental home, investing in human capital and raising children combined with a lower earnings capacity put a strain on people’s budgets. The precise patterns vary across countries, however, with little variation of low-income incidence rates among young adults in the United States but pronounced peaks (and subsequent declines) in Nordic countries and, to a lesser extent, France and Germany. This turn-around point is reached at a much higher age in Italy and Luxembourg, where low incomes are in fact more prevalent among 30 to 39 year-olds than among people in their twenties. In countries where gender breakdowns are available, Table 2 indicates that women aged 20-35 are more likely to belong to the “low income” group than men. This is mostly a result of lone parenthood, which tends to be more frequent among recent cohorts.
16
DELSA/ELSA/WD/SEM(2006)3
Table 2. Incidence of low income by age group and sex
% belonging to the lowest income quintile
NOR SWE USAtotal m f total m f total m f total m f total m f total m f total total total
0-4 20.3 8.1 12.2 29.7 15.5 14.1 27.7 13.6 14.1 32.5 16.3 16.2 28.2 13.3 14.9 30.6 15.7 14.9 18.1 20.5 29.05-9 22.2 10.5 11.7 16.9 8.9 7.9 23.7 12.4 11.2 33.0 16.3 16.7 26.6 15.3 11.3 27.8 15.8 12.0 16.1 18.1 28.9
10-14 19.2 9.4 9.8 13.1 6.2 6.9 19.5 10.0 9.5 25.7 14.7 11.0 24.7 13.8 10.9 26.7 11.5 15.2 13.3 15.6 24.715-19 16.7 6.6 10.1 16.0 7.0 9.0 18.1 9.6 8.5 15.8 7.5 8.3 22.3 11.5 10.8 19.6 10.8 8.8 15.7 17.1 21.420-24 25.0 11.0 13.9 36.4 15.4 20.9 26.5 11.0 15.5 17.8 7.7 10.0 19.4 9.6 9.7 17.9 9.5 8.5 33.8 37.7 22.025-29 20.6 9.8 10.8 22.8 12.3 10.5 20.1 8.9 11.2 20.3 9.0 11.3 17.5 7.1 10.4 17.6 7.6 10.0 18.1 22.8 18.530-34 17.0 6.6 10.5 18.1 9.0 9.1 17.8 8.6 9.3 16.9 7.2 9.7 19.9 8.9 11.0 20.9 9.0 11.9 13.9 16.5 17.235-39 14.7 6.8 7.9 13.6 7.2 6.4 15.2 7.0 8.2 15.0 7.1 7.9 20.0 9.1 10.9 20.0 11.1 8.9 11.7 16.9 15.540-44 13.2 6.5 6.7 12.7 8.1 4.6 15.8 7.6 8.2 15.6 8.2 7.4 18.1 8.0 10.1 16.2 7.9 8.3 9.9 13.9 13.545-49 10.9 5.4 5.5 11.7 7.0 4.7 11.9 6.0 6.0 11.2 5.7 5.5 14.4 6.8 7.6 16.4 8.1 8.3 8.9 9.8 11.850-54 18.1 10.2 8.0 10.7 6.3 4.4 13.5 6.1 7.3 13.5 7.3 6.3 15.7 7.4 8.3 9.5 3.4 6.1 7.7 10.0 11.255-59 19.6 8.4 11.2 12.2 5.9 6.3 18.0 8.6 9.5 13.7 8.1 5.5 15.7 7.7 8.0 16.6 7.5 9.1 9.2 7.2 15.160-64 22.5 9.2 13.3 19.7 8.5 11.1 19.0 8.7 10.3 15.7 6.5 9.2 17.2 7.6 9.7 18.1 7.9 10.2 18.6 11.0 18.165-69 26.8 8.8 18.0 26.5 9.0 17.5 21.7 8.3 13.3 15.2 5.7 9.5 22.1 8.4 13.7 17.2 8.0 9.2 30.5 19.9 19.670-74 22.1 6.2 15.9 29.0 8.9 20.1 23.5 7.5 16.0 28.1 9.6 18.5 21.8 6.7 15.0 20.6 7.0 13.6 39.3 24.5 23.975-79 29.0 4.8 24.2 39.8 9.5 30.2 26.4 7.0 19.4 31.2 11.9 19.3 22.6 6.3 16.4 24.7 6.5 18.2 54.3 36.2 27.6
80+ 40.4 9.0 31.4 49.4 10.2 39.2 32.6 9.7 22.8 28.4 8.5 19.9 22.7 4.9 17.8 22.0 5.7 16.3 66.3 63.0 33.4total 20.0 8.0 12.0 20.0 9.0 11.0 20.0 9.0 11.1 20.0 9.3 10.7 20.0 9.0 11.0 20.0 9.3 10.7 20.0 20.0 20.0
ITA LUXDEU FIN FRA GBR
Note: No gender breakdowns are available for Norway, Sweden and the United States. Income quintiles are based on a ranking of individuals by equivalent household income using the “square root of household size” equivalence scale.
36. The incidence of low incomes declines until around age 55, when workers effectively start entering retirement, and then increases afterwards. Nordic countries see particularly strong concentrations of low-income people among the elderly, with much lower proportions of elderly among the bottom 20% of the population in Luxembourg and the United States.
37. With large shares of low-income elderly women, gender differences are particularly pronounced in this age group. This confirms results from a range of earlier studies documenting low incomes and high poverty rates among elderly women (Förster and Mira d’Ercole, 2005; Smeeding and Sandström, 2005; Williamson and Smeeding, 2004). From a gender perspective, income discrepancies between old-age men and women are of particular interest as they are often a reflection of unequal educational and career opportunities. Compounded over many years of pre-retirement life, these unequal opportunities are manifested as unequal pension entitlements. Gender differences of income patterns can also indicate whether social protection systems ease, mirror or reinforce these imbalances.
38. The results reported in Table 2 and Figure 1 show that, compared to men in the same age group, elderly women in countries relying heavily on earnings-related pensions are particularly likely to experience disproportionate risks of low income (especially Germany, Finland, Italy and France). The extent of such gender differences depends on women’s career patterns, as well as the mechanism used to translate work histories into individual pension entitlements. In addition, the generosity of minimum safety nets and derived pension rights plays a decisive role for women with limited pension entitlements of their own (or none at all). In general, women are considerably more likely to have short or no earnings histories and face higher risks of low income during old age than men.
3.2 Income distribution within and between age groups
39. Breakdowns of age cohorts by quintile group provide a useful, but partial, picture of the incomes of age cohorts. More analysis is needed to understand the income situations of different age groups, how they are affected by existing social protection systems, and what policy challenges this implies.
17

DELSA/ELSA/WD/SEM(2006)3
40. To get a better understanding of income disparities in each country, it is useful to complement the results of the previous section with indicators of income poverty (Table 3). Comparing this with Table 2, it is apparent that, depending on the magnitude of income disparities within a country, the “bottom 20%” of the income distribution can be at high risk of poverty or have incomes that are still relatively close to average income levels.
Table 3. Relative income poverty during childhood, working-age and old-age
DEU FIN FRA GBR ITA LUX NOR SWE USAPoverty line
National currency 7,554 7,144 7,994 4,882 6,024 11,694 91,185 68,595 11,517USD, ppp 7,724 7,172 8,216 7,511 7,501 11,896 9,858 7,116 11,517
Poverty headcountAll 6.0% 4.4% 5.5% 11.1% 13.2% 4.3% 6.2% 2.2% 17.2%
Children 4.0% 3.6% 5.4% 16.9% 17.8% 5.5% 3.3% 0.9% 22.8%Working-age 5.7% 4.3% 5.5% 8.7% 11.8% 4.3% 6.0% 2.5% 13.7%
Old-age 9.3% 6.0% 5.4% 12.0% 13.2% 2.9% 11.1% 2.8% 22.1%Poverty gap
All 1.17% 0.56% 0.83% 1.79% 4.04% 0.56% 1.60% 0.57% 5.37%
Notes: All figures relate to 1998. The poverty line is defined as 50% of median household incomes using the “square root of household size” equivalence scale and expressed in annual terms. Purchasing power parity (ppp) adjusted US dollar amounts are derived using OECD purchasing power parity figures for private household expenditure. National currencies are euros for Euro-zone countries. Children, working-age and old-age persons are defined as persons aged 0-17, 18-64 and 65+, respectively. The poverty headcount is the share of each group living in households whose equivalised income falls below the poverty line. The poverty gap measure used here is the so-called “Foster-Greer-Thorbecke” index with poverty aversion parameter β=1 (i.e. the average distance between household income and the poverty line, expressed in percent of the poverty line, and weighted by the poverty headcount).
41. For instance, despite a large number of people in the bottom income quintile, low poverty rates are reported for children in Luxembourg as well as the old-age group in Finland and Sweden. Elderly people represent a very sizable share of the low-income population in these Nordic countries, yet their incomes are mostly sufficient to avoid falling below the poverty line. Conversely, old-age poverty rates are high in the United States despite lower shares of elderly in the low-income group. This indicates large income disparities among the elderly. A large number of “low income” elderly in the United States live on incomes much lower than the population average. The sizable poverty gap also shows that poor families would require considerable additional resources to escape poverty: compared to other countries, poverty is “deeper” in the United States, with incomes of the poor well below the poverty threshold.
42. Large poverty gaps suggest significant income disparities among certain parts of the population, particularly at the bottom of the income distribution. For instance, if some groups are left with little or no social protection, they can face very low incomes as a result of retirement, unemployment or other contingencies. For pensioners, social protection is a particularly decisive influence on living standards as earning opportunities are more limited for this group.
43. When considering the effectiveness of retirement income programmes, measures of inequalities within and between age groups provide a useful starting point. The magnitude of existing income gaps between working-age and old-age populations can suggest reform priorities and signal whether reform initiatives that would affect these gaps might attract support or opposition from current and future retirees. For instance, reducing the replacement rates built into public pension systems may be more feasible in countries where current pensioners enjoy generous retirement incomes that are relatively close to those of the working-age population.
18

DELSA/ELSA/WD/SEM(2006)3
Figure 2. Income inequality: overall and within age groups
Gini coefficients
0.200.220.240.260.280.300.320.340.360.380.40
SWE FIN NOR DEU LUX FRA GBR ITA USA0.20
0.22
0.24
0.26
0.28
0.30
0.32
0.34
0.36
0.38
0.40
TotalWorking AgeOld Age
Note: Gini measures are for individuals using equivalised household incomes for each of them. Age groups are 18-64 (“working-age”) and 65+ (“old-age”).
Figure 3. Income inequality between age groups
Average incomes of working-age individuals, % of old-age average
100%
110%
120%
130%
140%
150%
SWE FIN NOR DEU LUX FRA GBR ITA USA
Note: Figures relate to equivalised household incomes for both groups. Age groups are 18-64 (“working-age”) and 65+ (“old-age”).
44. Figure 2 takes a closer look at income inequality among different age groups. In most of the nine countries, the Gini values for the sub-groups and the total populations lie close together. This pattern reflects the fact that, with earnings-related pension schemes, retirement income distributions tend to mirror the distribution of earnings during the contribution phase.3 Retirement income arrangements in most
3. Even with a pension system that fully mirrors contribution histories, inequalities among the old-age group
would still be lower than for the working-age population if earnings inequalities have increased over time. It should also be noted that, while the distribution of pension entitlements may largely mirror past earnings, this does not necessarily produce similar disparities of household incomes shown in Figure 2. Differences
19

DELSA/ELSA/WD/SEM(2006)3
countries are predominantly based on personal earnings histories and therefore contribute little to reducing income inequality during old age (see OECD, 2001; 2005a). Indeed, despite redistributive elements built into public pension systems in Germany and Italy, income inequalities are practically identical for the working-age and old-age groups in these countries. The basic and means-tested pension elements in the United Kingdom, however, do help to reduce inequalities among the elderly. To a lesser extent, social protection systems in the Nordic countries also have an equalising effect, although income disparities there are already relatively limited among the working-age group. The United States, with the highest inequality levels, is the only country shown where the elderly show larger income disparities than the working-age group. Retirement income arrangements in this country appear to further exacerbate already high degrees of inequality during people’s working careers.
45. As one would expect, Figure 3 shows that there are also significant income differences between the two different age groups. They are largest in Norway, where old-age incomes are concentrated around a low average, and the United Kingdom, where incomes are much more dispersed, especially among working-age individuals. Similar observations can be made comparing results between the United States and the other two Nordic countries. While within-group inequalities are much less pronounced in Finland and Sweden, average income differentials between the two age groups are about the same as in the United States. The smallest average income gaps are reported for the continental European countries, suggesting relatively generous retirement incomes on average.
46. One interesting aspect of the results in Figure 2 is that overall inequality is not simply a weighted average of the sub-group Gini measures. This is for two reasons. First, income inequality for children, which enters the overall measure, is not shown separately. More fundamentally, however, overall income disparities depend on both within group and between group inequalities. If average incomes of the working-age and the old-age groups are very different, overall inequality can exceed the inequality measures of both sub-groups. This is the case in the United Kingdom where income disparities within the old-age group is much lower than for the working-age group. At the same time, Figure 3 shows that the elderly live on incomes that are almost 40% below those of the average working-age person. The income gap between these two groups is thus sufficiently large to introduce a strong element of inequality and widen the overall income distribution.
47. Clearly, the precise nature of this effect will depend on the relative sizes of the different age-groups (for instance, a large income gap between groups has little impact on overall inequality if one of the groups is very small). This observation is vital for understanding consequences of demographic changes, such as population ageing, for the shape of income distributions. Even in the absence of policy reforms and other socio-economic changes (i.e. if income patterns during working age and retirement were to remain exactly as today), a re-balancing of group sizes (notably through growing shares of pensioners) can significantly alter inequality levels. The nature of these composition effects has been thoroughly investigated by demographers and economists (Weizsäcker, 1996; Lam, 1997); but they are frequently not considered in discussions of the economic effects of population ageing. Yet, in addition to considerations of the fiscal sustainability of pension systems, such ageing-related changes in the income distribution may also call for modification of the structure and allocation of social expenditures.
in household incomes between the two age groups are also driven by other factors, notably family composition.
20
DELSA/ELSA/WD/SEM(2006)3
4. AGE-PROFILES OF SOCIAL PROTECTION EXPENDITURES
48. Social protection policies are a major influence on the income situation of different age groups. This section provides an overview of the incidence of social benefits by deriving age-profiles of total benefit expenditures. As before, this is done using a “snapshot” of income data for a single year. The purpose is to understand how social protection measures are targeted towards different age groups in the nine countries, and the effect this has on poverty among children, working-age adults and the elderly. Social benefits are examined on an aggregate, and after-tax, basis to assess their overall impact. A more finely-grained picture of individual policy instruments is presented in the next section.
4.1 Levels and composition of benefit expenditure
49. An examination of social protection spending patterns reveals very large differences in overall spending on cash transfers (Figure 4a). In Sweden, cash benefits (net of taxes paid on them) make up almost a third of household disposable income, more than three times as much as in the United States.
50. How do these aggregate figures relate to the need for cash support in each country? To see this, it is interesting to contrast spending levels with the resources required by poor individuals to escape poverty. This is shown by the dot-shaped markers in Figure 4a. It is striking that overall spending levels in all countries would be sufficient to eradicate poverty. In the United States, benefits available to the population as a whole amount to about 125% of the funds needed to bring incomes up to the poverty line for all those who are poor without any transfers. At 2.4, the largest ratio of “benefit spending” to “aggregate poverty gap” is found for Italy. With spending more than twice the poverty gap, it would be possible to eliminate income poverty and, at the same time, distribute more than half of all benefits to non-poor individuals.
51. Panel b of Figure 4 shows a breakdown of total net spending by type of benefit. After subtracting taxes and contributions payable on benefit income, all components sum to 100%. Tax burdens on benefit income are very small in France, Germany, United Kingdom and United States. They can be considerable, however, where benefit incomes are high (e.g. among pensioners in Italy and Luxembourg: see Figure 3) or tax rates are high in general (Nordic countries).
52. While old-age pensions represent the largest component of total spending in all countries, shares range from little over one third in the United Kingdom to almost 90% in Italy. Sickness and disability-related transfers, which tend to benefit older working-age individuals, represent particularly sizable shares of total cash transfers in Norway, United Kingdom and United States. Like old-age pensions, they can serve as a substitute for unemployment benefits (OECD, 2003) and therefore depend on the labour market situation in each country. Five out of nine countries do, in fact, spend considerably more on sickness and invalidity benefits than on unemployment support.
53. Labour market conditions are of course a major determinant of unemployment benefit expenditures. They are largest in Finland, France, Germany and Sweden – all countries with particularly high unemployment rates in the mid-to-late 1990’s. Means-tested social assistance and housing benefits are most important in the United Kingdom, where unemployment benefit durations are short and longer-term unemployed typically rely on minimum income benefits. All European countries provide significant support for families with children, with the most generous systems operated by the Nordic countries. In the United States, there exists no cash payment where the presence of children is the main eligibility criterion.
21

DELSA/ELSA/WD/SEM(2006)3
Yet, as in all other countries, a number of other US policy measures incorporate child-related provisions (such as the Earned Income Tax Credit, classified as in-work benefit in Figure 4b, and the Temporary Assistance to Needy Families, shown as a Social Assistance benefit).
Figure 4. Aggregate net spending on cash benefits
(a) Overall levels
0%
5%
10%
15%
20%
25%
30%
USA NOR GBR ITA LUX FRA FIN DEU SWE0%
50%
100%
150%
200%
250%
300%
% of total disposable income
% of aggregate poverty gap(right-hand scale)
(b) Composition by type of benefit
-30%-10%10%
30%50%70%90%
110%130%
USA NOR GBR ITA LUX FRA FIN DEU SWEOld-age Sickness and InvalidityUnemployment FamilyHousing Social AssistanceIn-work Taxes (on benefits only)
Note: Overall benefits are shown net of the taxes and contributions payable on them. Taxes paid on market incomes are not considered here. See the Annex for a list of benefits in each category. The aggregate poverty gap is the difference between market incomes and the poverty line summed over all individuals whose market incomes are less than the poverty threshold (defined as 50% of median equivalised household income: see Table 3).
4.2 How is the money spent? Social benefits by age group
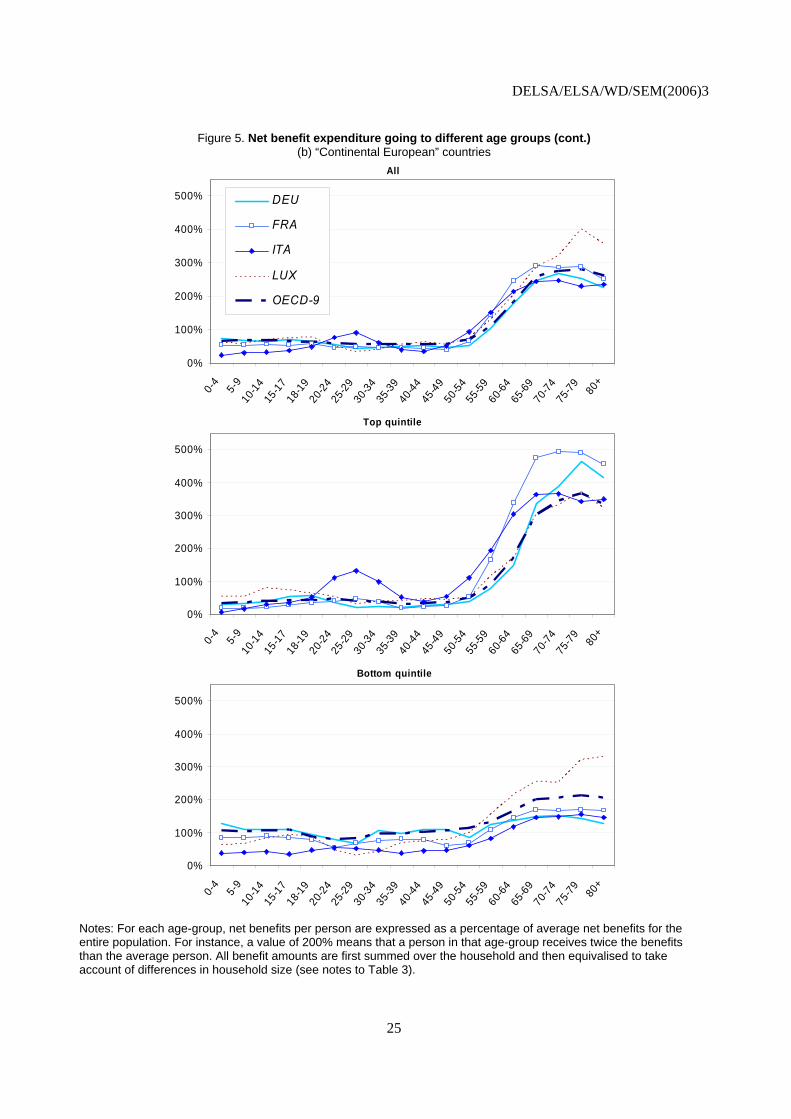
54. Data on the overall size of different types of transfers provides useful clues about the availability of social benefits to different age groups. A more direct and detailed picture of how benefit receipt varies by age-group is shown in Figure 5. This plots benefits per person going to each age-group, expressed as percentages of per-capita benefits available to the population as a whole. As in Figure 4 above, benefit expenditures are evaluated on a net basis in order to improve comparability across countries with different institutional setups (i.e. any taxes paid on gross benefits are taken into account).
22
DELSA/ELSA/WD/SEM(2006)3
55. This method isolates the effect of (net) benefit payments but, because it does not consider taxes paid on non-benefit income, indirect taxes or non-cash benefits, it does not show full redistribution between age-groups. Also, and as before, the figures relate to the incomes of individuals in one single year, and therefore do not represent life-time redistribution between cohorts (see Box 1). Hence, the results show the extent to which cash transfers are directed towards different age groups, but not which generations “benefit most” from social protection. Moreover, the age-profile of social benefits is the result of a combination of transfers between and within age-cohorts. A particular transfer may aim at smoothing incomes across the life-cycle or at redistributing in favour of those facing particular contingencies at a given point in time. Regardless of the purpose of transfer payments and their sources of financing, the age-profiles show which age groups are the focus of interventions by the social protection system.
56. Values above 100% indicate that per capita benefits paid to persons of a given age exceed those paid to the population as a whole (or, alternatively, that the share of benefits going to persons of a given age exceeds their population share). In other words, age groups with values above 100% receive a disproportionate share of social benefits. As before, benefits are shown on a household basis and are equivalised to be able to compare households of different sizes. Household members of all ages can therefore potentially benefit from transfers directed at particular age groups. Pension payments, for example, are assumed to benefit younger people if the pensioner lives in a multi-generation household. Similarly, appropriate fractions of child benefits received by a household would count towards the per-capita benefits shown for both children and their parents.
57. Results are presented separately for three country groups in Figures 5a to 5c; for comparison, the average of the nine OECD countries is shown as well. Each figure presents age profiles for the whole population as well as the richest and the poorest 20%.
58. On average across the nine countries, net benefits received by those younger than 55 are less than their population share. Conversely, persons aged 65 or older typically receive a share that is twice to three times their population share. Benefits typically decline for the oldest age group as pension entitlements tend to be lower for surviving spouses, who are mostly women.
59. To an important extent, this pattern of higher social benefits among the elderly reflects the contributions they have paid over their life-course. But it also suggests that social protection systems mainly redistribute resources across different age groups rather than between persons of a given age confronting different contingencies, such as unemployment. Differences in benefit receipt between age groups are particularly pronounced for higher-income individuals. Earnings-related pension systems provide generous retirement benefits for individuals who managed to build up a strong contribution base while benefits tend to be available mainly to low-income groups at younger ages. Indeed, benefit entitlements of low-income groups tend to be much more similar across all ages. But while the “OECD-9” profile is clearly flatter for the bottom income quintile, a heavier dependence on benefit payments among the elderly nevertheless produce upwards-sloping benefit profiles even for this low-income group. Elderly people in this group typically still receive about twice the transfers available to younger individuals.
23

DELSA/ELSA/WD/SEM(2006)3
Figure 5. Net benefit expenditure going to different age groups (a) “Anglo-saxon” countries
All
0%
100%
200%
300%
400%
500%0-
45-
910
-1415
-1718
-1920
-2425
-2930
-3435
-3940
-4445
-4950
-5455
-5960
-6465
-6970
-7475
-79 80+
GBR
USA
OECD-9
Top Quintile
0%
100%
200%
300%
400%
500%
0-4
5-9
10-14
15-17
18-19
20-24
25-29
30-34
35-39
40-44
45-49
50-54
55-59
60-64
65-69
70-74
75-79 80
+
Bottom Quintile
0%
100%
200%
300%
400%
500%
0-4
5-9
10-14
15-17
18-19
20-24
25-29
30-34
35-39
40-44
45-49
50-54
55-59
60-64
65-69
70-74
75-79 80
+
Notes: For each age-group, net benefits per person are expressed as a percentage of average net benefits for the entire population. For instance, a value of 200% means that a person in that age-group receives twice the benefits than the average person. All benefit amounts are first summed over the household and then equivalised to take account of differences in household size (see notes to Table 3).
24
DELSA/ELSA/WD/SEM(2006)3
Figure 5. Net benefit expenditure going to different age groups (cont.) (b) “Continental European” countries
All
0%
100%
200%
300%
400%
500%0-
45-
910
-1415
-1718
-1920
-2425
-2930
-3435
-3940
-4445
-4950
-5455
-5960
-6465
-6970
-7475
-79 80+
DEU
FRA
ITA
LUX
OECD-9
Top quintile
0%
100%
200%
300%
400%
500%
0-4
5-9
10-14
15-17
18-19
20-24
25-29
30-34
35-39
40-44
45-49
50-54
55-59
60-64
65-69
70-74
75-79 80
+
Bottom quintile
0%
100%
200%
300%
400%
500%
0-4
5-9
10-14
15-17
18-19
20-24
25-29
30-34
35-39
40-44
45-49
50-54
55-59
60-64
65-69
70-74
75-79 80
+
Notes: For each age-group, net benefits per person are expressed as a percentage of average net benefits for the entire population. For instance, a value of 200% means that a person in that age-group receives twice the benefits than the average person. All benefit amounts are first summed over the household and then equivalised to take account of differences in household size (see notes to Table 3).
25

DELSA/ELSA/WD/SEM(2006)3
Figure 5. Net benefit expenditure going to different age groups (cont.) (c) “Nordic” countries
All
0%
100%
200%
300%
400%
500%0-
45-
910
-1415
-1718
-1920
-2425
-2930
-3435
-3940
-4445
-4950
-5455
-5960
-6465
-6970
-7475
-79 80+
FIN
NOR
SWE
OECD-9
Top quintile
0%
100%
200%
300%
400%
500%
0-4
5-9
10-14
15-17
18-19
20-24
25-29
30-34
35-39
40-44
45-49
50-54
55-59
60-64
65-69
70-74
75-79 80
+
Bottom quintile
0%
100%
200%
300%
400%
500%
0-4
5-9
10-14
15-17
18-19
20-24
25-29
30-34
35-39
40-44
45-49
50-54
55-59
60-64
65-69
70-74
75-79 80
+
Notes: For each age-group, net benefits per person are expressed as a percentage of average net benefits for the entire population. For instance, a value of 200% means that a person in that age-group receives twice the benefits than the average person. All benefit amounts are first summed over the household and then equivalised to take account of differences in household size (see notes to Table 3).
26

DELSA/ELSA/WD/SEM(2006)3
60. Similar to the country average, benefits in the United Kingdom and the United States start to increase at age 55 (Figure 5a). Benefit expenditures are very much focused on old-age support in the United States. With around four times the amount of social benefits available to Americans on average, elderly individuals in the United States receive, relative to their number, a larger share of total expenditures than in any of the other countries. In both English-speaking countries, the richest 20% benefit little from social transfers before entering retirement. But while total expenditures in the United States are particularly skewed towards the elderly, benefits available to rich retirees in the United Kingdom are substantially below the country average: With low public pension ceilings, British pensioners in the top income quintile tend to be there because they have access to private income sources, not because of generous public pensions. It is also apparent that old-age benefits in the United Kingdom are, in fact, very similar for different income groups. This suggests that public pensions contribute much less to income differences between old-age individuals than in other countries. For the bottom quintile, the UK profile is the flattest of all countries, reflecting the importance of means-testing in this country: Benefits received by the elderly are similar to the amounts available to younger low-income individuals. Children in the United Kingdom receive larger shares of social transfers than in any of the other eight countries.
61. Results for Central and Southern European countries (France, Germany, Italy and Luxembourg) are shown in Figure 5b. In this group, the steep increase of per-capita benefits starts mostly at ages 50-54 and 45-49 in Italy, i.e. earlier than in the United Kingdom and United States. This can be explained by the lower effective retirement ages in continental European countries (OECD 2005b). Examining benefits by income groups shows that the benefits of rich (poor) older people is above (below) the OECD-9 average. Pension systems in these countries, all of which are characterised by strong links between earnings histories and pension entitlements, therefore contribute significantly to income inequalities among the elderly.
62. Unlike in the United Kingdom, benefits available to non-elderly populations in Italy and Luxembourg are not significantly higher for low-income individuals than for the top quintile. This suggests that means tests are not the primary entitlement criteria. In fact, rich Italians aged 20-35 live in households with higher benefit incomes than those in the low-income group. For a conclusive explanation of this observation, it is necessary to examine in detail which type of benefit payments are causing this “hump” in the Italian data (see next section). One can speculate, however, that this pattern is related to the unusually large number of young Italian adults living with their parents and, thus, potentially benefiting from social transfers that are primarily intended for older individuals.
63. Finally, Figure 5c presents results for the three Nordic countries, Finland, Norway, and Sweden. The retirement-related steep increase of per-capita benefits starts at age 55-59 in Norway and Sweden but earlier, at age 50-54, in Finland – partly as a result of the extensive use of early retirement during the economic recession in the 1990s. The patterns for the three countries are otherwise remarkably uniform (and similar to the 9-country average). Compared to the previous group of countries, benefits in the top quintile are much lower and below the OECD-9 average. Relatively large shares of benefits go to the low-income group. The bottom panel of Figures 5c is, in fact, closer to the Anglo-Saxon group than to the other European countries.
64. In combination with the other indicators discussed in this paper, the age profiles of benefit shares yield important information on the design and projected evolution of social protection systems in the context of ageing societies. Age profiles alone do not inform about the size of the different age groups and thus their relevance for aggregate spending levels. By combining age profiles and age pyramids, however, this information can be derived. Another relevant question is to what extent differences in benefit shares actually have an impact on household incomes. Age profiles of benefit receipt should therefore also be looked at in combination with the income levels by age group.
27

DELSA/ELSA/WD/SEM(2006)3
4.3 Which age groups are best protected from poverty?
65. In all OECD countries, taxes and transfers play a role in reducing inequalities. Poverty avoidance is a primary aim of social protection and social benefits significantly reduce the extent of income poverty (Table 4). Using the same poverty thresholds as previously in Table 3, a comparison of the first two rows in Table 4 shows that social transfers lift between around 7% and 25% of the total population out of poverty. The outcome in terms of the number who remain in poverty is to a very large extent driven by differences in scope and design of social systems. This is evident from the fact that, while headcount measures vary markedly when measured in terms of net incomes, those for market incomes are, in fact, remarkably similar across countries.
66. In several cases, social benefits, and the taxes needed to finance them, affect the poverty ranking of countries, notably between the United States and European countries. Clearly, this reflects both the direct “mechanical” effects of taxes and benefits on individuals’ incomes and the impact of social and fiscal policies on the size and distribution of market incomes. For instance, the poverty gap measures at the bottom of the table suggest that households with no market incomes are relatively rare in the United States so that they are not entirely without income even in the absence of social benefits. Conversely, comparatively large numbers of European individuals appear to rely entirely on social transfers – because they experience difficulties in earning additional income from market activities and/or because more generous benefit levels reduce the need to do so.
Table 4. Impact of social protection on measures of relative income poverty
DEU FIN FRA GBR ITA LUX NOR SWE USA
Poverty headcountAll groups
market incomes 31.5% 29.9% 30.5% 31.8% 29.2% 28.7% 22.8% 29.0% 24.5%after taxes and transfers 6.0% 4.4% 5.5% 11.1% 13.2% 4.3% 6.2% 2.2% 17.2%
Childrenmarket incomes 19.9% 15.2% 19.6% 35.4% 20.7% 21.0% 12.2% 18.1% 26.7%
after taxes and transfers 4.0% 3.6% 5.4% 16.9% 17.8% 5.5% 3.3% 0.9% 22.8%Working age
market incomes 20.4% 22.1% 21.2% 22.2% 21.9% 19.6% 13.9% 18.6% 16.8%after taxes and transfers 5.7% 4.3% 5.5% 8.7% 11.8% 4.3% 6.0% 2.5% 13.7%
Old agemarket incomes 85.1% 87.5% 84.1% 64.8% 67.8% 78.2% 74.1% 80.2% 58.5%
after taxes and transfers 9.3% 6.0% 5.4% 12.0% 13.2% 2.9% 11.1% 2.8% 22.1%
Poverty gapAll groups
market incomes 24.28% 22.20% 21.00% 24.01% 19.21% 19.42% 14.90% 24.99% 14.49%after taxes and transfers 1.17% 0.56% 0.83% 1.79% 4.04% 0.56% 1.60% 0.57% 5.37%
See notes to Table 3. Identical poverty thresholds are used for evaluating poverty measures in the “market incomes” and “after taxes and transfers” scenarios.
67. However, the poverty-reducing capacities of social protection measures vary markedly not only across countries but also between age groups. Without public old-age pensions, a sizable majority of elderly individuals would have incomes below the poverty line in all nine countries. While more than 40% of elderly Americans would manage to escape poverty even without a public pension, more than one fifth experience poverty despite existing public pension schemes. Relating the poverty measures in Table 4 to the spending patterns shown earlier in Figure 4, it is striking that countries spending much more on public pensions are not necessarily more successful at reducing old-age poverty rates. Norway and the United Kingdom achieve lower old-age poverty rates than Italy despite spending a fraction on old-age support. Similarly, spending on public pensions is high in both France and Germany but much fewer French elderly
28
DELSA/ELSA/WD/SEM(2006)3
live in poverty as low-income pensioners in France receive a larger share of benefits than in Germany (see bottom panel of Figure 5b). Apart from the United States, only Italy and the United Kingdom show “market income” old-age poverty rates below 70%. In these three countries, pensioners rely more extensively on private pensions and other types of market incomes (including the earnings of younger family members) brought into the household than in Nordic and Central European countries. But older Italians on low incomes benefit little from the generous pension system. Despite a comparatively low poverty rate before public transfers and a social protection system that, in the late 1990s, redistributed a striking 90% of all cash benefits in the form of pensions, Italy still shows the highest old-age poverty rate of all European countries considered here.
68. Compared to the elderly group, the circumstances of children and working-age individuals, as well as the social protection measures addressing the contingencies they face, are likely to be much more heterogeneous both within and across countries. In the two English-speaking countries, children appear to be particularly affected by a lack of market income opportunities afforded to their parents. In both these countries, market income poverty rates are very high among children – significantly higher, in fact, than among working-age individuals. While social protection systems in all countries lift large numbers of jobless or working-poor adults out of poverty, the effectiveness of social benefits in terms of reducing child poverty differs markedly. Although children can, in terms of the resource situation in the household, benefit from social protection measures that address the needs of their parents, it is evident that measures explicitly targeting families with children are likely to be more successful at reducing child poverty rates. Countries that spend little on child support (Italy, United States) do badly in terms of reducing child poverty (see also Corak et al., 2005).
29
DELSA/ELSA/WD/SEM(2006)3
5. AGE PROFILES OF DIFFERENT INCOME COMPONENTS
69. The analysis so far has shown that the effectiveness of income protection varies across age-groups and that existing gaps in social protection tend to be particularly pronounced at certain ages. Policy makers wishing to address perceived imbalances in the provision of social protection need to know how specific policy measures shape these observed income profiles. To provide such information, this section examines the role of selected income components. It separately shows the age incidence of in-work earnings, old-age pensions and taxes in order to determine the main driving factors of family incomes for particular age groups.4
5.1 Income from work
70. As a determinant of both current living standards and future pension levels, age profiles of in-work earnings are of particular interest. They are therefore discussed in some detail here.
Earnings at the individual level are shown in Figure 6 for all those with employment or self-employment income. To compare across countries, earnings are normalised as percentages of median household income (a value of 50% therefore means that an individual living alone would have sufficient earnings to reach the “50% of median” poverty line).
71. There is clear evidence of high degrees of age-related earnings progression in France, Italy, Luxembourg and Germany (second panel).5 Steep earnings profiles are also found for younger age groups in the United Kingdom. The graphs are flattest for the Nordic countries (bottom panel). In most countries, earnings tend to peak at ages 50-54. The turn-around point is reached at younger ages, however, in the Nordic countries and, especially, the United Kingdom. In France and Italy, earnings appear to peak just before retirement (age-group 55-59). For those who continue to work past retirement age, earnings are highest in the United States and France and lowest in the Nordic countries (graphs for Italy and Luxembourg stop at age 65 as there are insufficient numbers of observations with positive earnings at older ages).
72. These results for the working population need to be complemented in two ways to understand the role earnings play in determining family resources and, hence, the need for income supplements from other sources, including social benefits. First, the incidence of joblessness varies between age groups. And, secondly, incomes of other family members can alleviate situations of individual need.
73. Social protection for working-age individuals is, to an important extent, targeted to those without a job. Patterns of joblessness therefore have a major influence on the incidence and overall levels of benefit payments. In the late 1990’s more than 90% of “prime-age” individuals in Nordic countries had access to earnings while at least 30% of Italians were left without any income for employment or self-employment of their own (Figure 7, top panel). For individuals younger than 30 or older than 50, country differences are
4. Age profiles for the other income components listed in Section 2.2 are not shown here for presentational
reasons. They are available on request by e-mailing [email protected].
5. To the extent that earnings levels grew over time, the cross-sectional profiles are flatter than they would be for a single cohort.
30

DELSA/ELSA/WD/SEM(2006)3
even more pronounced. In Norway and the United States, roughly one third of 65-69 year-olds retain some form of labour market attachment. Conversely, in the United Kingdom and the four “continental” European countries, earnings contribute to retirement incomes for less than 10% in this age group. Youth unemployment, education durations, family formation patterns and work-family life reconciliation polices shape employment rates among young individuals. In the Nordic countries, shares of employed or self-employed people are only slightly lower for young individuals reflecting, among other things, successful work/family-life reconciliation policies. At the other extreme, income from work is recorded for only about one third of 20-24 year-old Italians.
74. As one would expect, participation rates are generally higher among individuals living in high-income households (top quintile). Compared to the top panel, differences are, however, less noticeable for young adults and elderly people in “continental” European countries. In these countries, larger shares of younger and older people in high-income families have no earnings of their own – instead, they have access to other income sources, such as more generous old-age pensions, or they benefit from high incomes of other family members.
75. Patterns of access to paid employment in the lowest income quintile are very different across countries (bottom panel of Figure 7). In the United Kingdom, the share of people in low-income families with earnings remains below 40% for all age groups. With such low numbers of people in employment, a large share of families is left without any work income. This feature of the low-income population – a much-debated policy concern in the United Kingdom – indicates that extending employment opportunities could produce very significant income improvements for the poorest Britons and that back-to-work strategies are likely to be effective in reducing poverty. A number of such policies have in fact been implemented or extended in the United Kingdom since the mid-1990s. As unemployment rates have also gone down, analyses of later data would likely show a more favourable picture compared to the 1998 situation considered here (a similar qualification applies of course in other countries where employment patterns and unemployment rates have changed significantly since the mid-1990s). In the three Nordic countries, very large shares of young adults under 30 are in the bottom quintile (see Table 2). The vast majority of them lack access to paid employment. This pattern is remarkable similar in Finland, Norway and Sweden, resulting in the distinctive downward-sloping profile in the bottom-right panel of Figure 7.
31

DELSA/ELSA/WD/SEM(2006)3
Figure 6. Individual earnings levels
Average amount earned by those with positive earnings in each age group
"Continental European"
0%
25%50%
75%
100%125%
150%
175%200%
225%
18-1
920
-24
25-2
930
-34
35-3
940
-44
45-4
950
-54
55-5
960
-64
65-6
970
-74
75-7
980
+
% o
f med
ian
equi
valis
ed in
com
e
DEU
FRA
LUX
ITA
"Anglo-saxon"
0%
25%50%
75%100%
125%150%
175%200%
225%
18-1
920
-24
25-2
930
-34
35-3
940
-44
45-4
950
-54
55-5
960
-64
65-6
970
-74
75-7
980
+
% o
f med
ian
equi
valis
ed in
com
e
USAGBR
"Nordic"
0%
25%50%
75%100%
125%150%
175%200%
225%
18-1
920
-24
25-2
930
-34
35-3
940
-44
45-4
950
-54
55-5
960
-64
65-6
970
-74
75-7
980
+
% o
f med
ian
equi
valis
ed in
com
e
FIN
SWE
NOR
Notes: Earnings include employment and self-employment incomes. They are measured at the individual level and expressed as a percentage of median equivalised household income (see notes to Table 3). See text for further details.
32
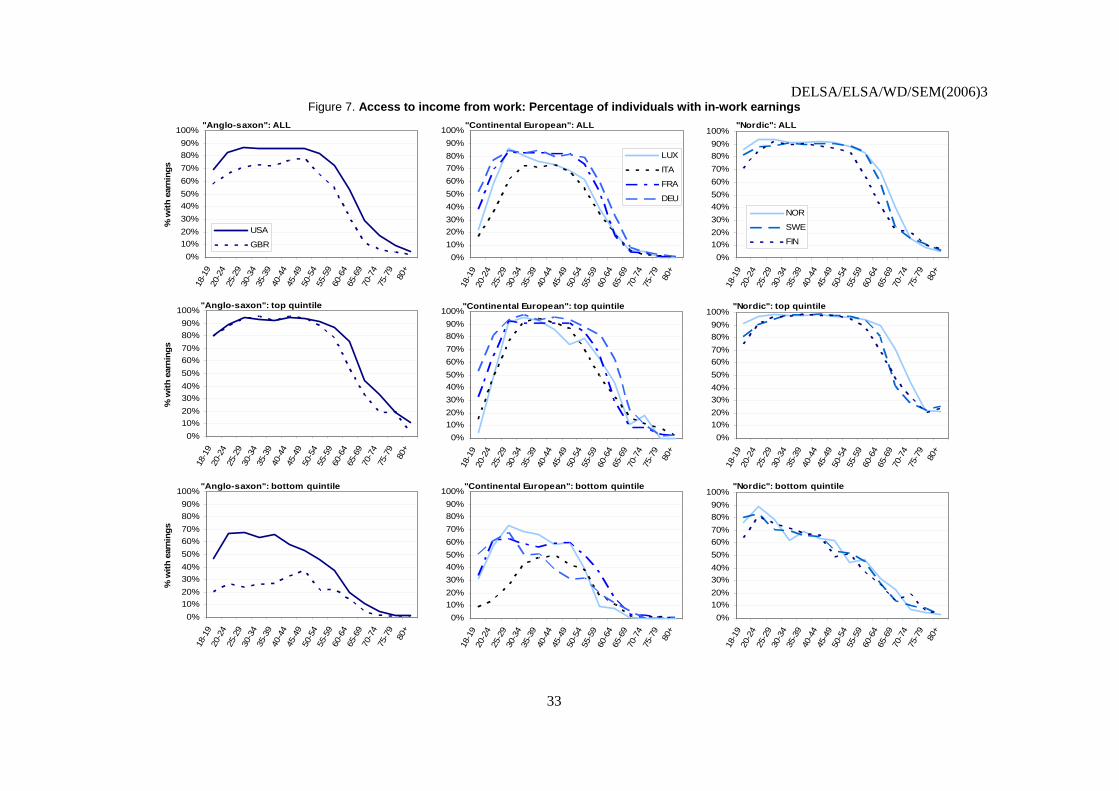
DELSA/ELSA/WD/SEM(2006)3
33
Figure 7. Access to income from work: Percentage of individuals with in-work earnings "Continental European": ALL
0%10%20%30%40%50%60%70%80%90%
100%
18-1
920
-24
25-2
930
-34
35-3
940
-44
45-4
950
-54
55-5
960
-64
65-6
970
-74
75-7
980
+
LUX
ITA
FRA
DEU
"Anglo-saxon": ALL
0%10%20%30%40%50%60%70%80%90%
100%
18-1
920
-24
25-2
930
-34
35-3
940
-44
45-4
950
-54
55-5
960
-64
65-6
970
-74
75-7
980
+
% w
ith e
arni
ngs
USA
GBR
"Nordic": ALL
0%10%20%30%40%50%60%70%80%90%
100%
18-1
920
-24
25-2
930
-34
35-3
940
-44
45-4
950
-54
55-5
960
-64
65-6
970
-74
75-7
980
+
NOR
SWE
FIN
"Anglo-saxon": top quintile
0%10%20%30%40%50%60%70%80%90%
100%
18-1
920
-24
25-2
930
-34
35-3
940
-44
45-4
950
-54
55-5
960
-64
65-6
970
-74
75-7
980
+
% w
ith e
arni
ngs
"Continental European": top quintile
0%10%20%30%40%50%60%70%80%90%
100%
18-1
920
-24
25-2
930
-34
35-3
940
-44
45-4
950
-54
55-5
960
-64
65-6
970
-74
75-7
980
+
"Nordic": top quintile
0%10%20%30%40%50%60%70%80%90%
100%
18-1
920
-24
25-2
930
-34
35-3
940
-44
45-4
950
-54
55-5
960
-64
65-6
970
-74
75-7
980
+
"Anglo-saxon": bottom quintile
0%10%20%30%40%50%60%70%80%90%
100%
18-1
920
-24
25-2
930
-34
35-3
940
-44
45-4
950
-54
55-5
960
-64
65-6
970
-74
75-7
980
+
% w
ith e
arni
ngs
"Continental European": bottom quintile
0%10%20%30%40%50%60%70%80%90%
100%
18-1
920
-24
25-2
930
-34
35-3
940
-44
45-4
950
-54
55-5
960
-64
65-6
970
-74
75-7
980
+
"Nordic": bottom quintile
0%10%20%30%40%50%60%70%80%90%
100%
18-1
920
-24
25-2
930
-34
35-3
940
-44
45-4
950
-54
55-5
960
-64
65-6
970
-74
75-7
980
+

DELSA/ELSA/WD/SEM(2006)3
76. Like the United Kingdom, Italy also shows very low employment rates in the bottom income quintile. However, in the absence of well-developed minimum income safety nets, low-income Italians tend to depend more heavily on other family members to provide a degree of income security. As a result, average earnings levels at the family level are considerably above the very low levels seen in the United Kingdom. This is shown in Figure 8, which plots average earnings for each age group, but now taking account of earnings of other household members as well. As before, median household incomes are used as a common scaling factor across countries. Averages are taken across all individuals (rather than just those with earnings as in Figure 6). The results therefore reflect the combined effects of differences in individual earnings, employment rates, and sharing with other family members. Contrary to Figures 6 and 7, children are also included here as they can benefit from the earnings of other family members even if they do not have any in-work earnings themselves.
77. Averaged across all individuals in the bottom quintile, earnings in the United Kingdom provide only about one fifth of the resources required to reach the (50% of median) poverty line. Means-tested benefits therefore have to fill a rather large gap to reduce poverty headcounts. The differences between the “top” and “bottom” quintile bars are a measure of the spread of the household earnings distribution. Owing to the large number of households without any income from work, the top quintile in the United Kingdom is shown to enjoy more than 20 times the in-work earnings available to the bottom 20%. Interestingly, this ratio is considerably higher than in the United States (14), while earnings are much more equally distributed in the Nordic countries.
78. Inspection of the fat bars (“ALL” income groups) shows that, relative to median incomes, average household earnings are remarkably similar across most countries, ranging between about 100% during childhood and 150 to 175% before retirement. However, as a result of household sharing between high- and low-earning individuals, the household earnings profiles are generally much flatter than those for individuals in Figure 6. This income smoothing effect is most noticeable in Italy where, despite steep age-progression of individual earnings, the household profile is practically horizontal for the working-age population. The later departure of young Italian adults from their parent household appears to be particularly relevant here, depressing the earnings available to older Italians while enhancing those of their children.
5.2 Old-age pensions
79. Average old-age pension amounts available to different age groups are presented in Figure 9. In most countries, household incomes of elderly relying exclusively on public pensions would be close to 80% of median household incomes of the population at large. Yet, with average public pension entitlements below the “50% of median income” poverty threshold, public pensions in the United Kingdom and the United States are, on average, insufficient to prevent income poverty. Elderly individuals in Norway find their incomes very close to the poverty threshold, even before subtracting tax payments and social contributions. In these latter three countries, pension entitlements are rather “flat”, with only small differences between the public pensions received by the elderly in the bottom and top quintiles. In fact, the levels for the bottom quintile are remarkably similar across most countries. But compared to Norway, United Kingdom and United States, pension systems in the remaining countries provide more substantial rewards for those who have built up a strong contribution base. In Finland and France, public pensions can be very high in these cases.
80. In countries where the majority of benefit expenditure is in the form of old-age pensions, average amounts of public pensions mirror the age profiles of total net benefit expenditures (compare Figures 4b and 5). For Italy, Figure 9 confirms that the significant benefit entitlements of families with young adults is due to the old-age pensions paid to elderly Italians living in the same household. Consequently, while the Italian social protection system directs almost all resources towards old-age support, a significant share of
34

DELSA/ELSA/WD/SEM(2006)3
resources does, in fact, provide a degree of income security for younger individuals. This is an important and easily overlooked aspect when considering the effects of pension reforms.
81. Next to public old-age benefits, the second major income source during retirement is private pensions or, more generally, capital income. The relevant age profiles are shown in Figure 10. Capital incomes during old age are largest in countries with limited public old-age support. At roughly 40% of median household incomes, average capital incomes in both the United Kingdom and the United States are, in fact, of similar in magnitude to public pensions. But importantly, capital incomes are distributed much more unequally with low-income groups having very limited access to private income sources.
5.3 Financing social expenditure: Age-incidence of taxes and contributions
82. This last sub-section examines to what extent the taxes needed to finance social protection measures are borne by different age groups. This is, again, done using a household perspective, i.e. assuming that taxes paid by anybody in the household reduce the living standards of all household members. Figure 11 shows the resulting profiles for income taxes and social security contributions (contributions paid by employers are not shown). Relative to median household incomes, taxes are lowest in the United States and highest in Finland, Germany and Sweden. For working-age individuals, the age profile of taxes essentially mirrors that of pre-tax incomes. Old-age pensions are often exempt from certain taxes or contributions or subject to preferential tax treatment. As a result, even elderly in the top quintile contribute little to the financing of social protection expenditures in France and, especially, Germany.
83. The tax burden difference between the top and bottom quintiles provides a measure of tax progressivity. The overall inequality-reducing capacity is low in countries where tax burdens are comparatively small and tax burdens vary little between low and high-income groups (i.e. where they are relatively close to the average). The tax system in the United States appears to do more in terms of reducing inequalities than the tax and contribution system in France and, possibly, Luxembourg. With high tax rates and particularly sizable tax burdens borne by high-income groups, the German tax system appears more redistributive overall. However, very low tax burdens of high-income pensioners reduce the equalising effect for the old-age group.
35

DELSA/ELSA/WD/SEM(2006)3
36
Figure 8. Earnings at the household level DEU
0%
50%
100%
150%
200%
250%
300%
350%
% o
f med
ian
equi
valis
ed in
com
e
FIN
0%
50%
100%
150%
200%
250%
300%
350%
NOR
0%
50%
100%
150%
200%
250%
300%
350%
0-4
10-1
4
18-1
925
-29
35-3
9
45-4
9
55-5
9
65-6
9
75-7
9
% o
f med
ian
equi
valis
ed in
com
e
Top QuintileAllBottom Quintile
SWE
0%
50%
100%
150%
200%
250%
300%
350%0-
4
10-1
4
18-1
925
-29
35-3
9
45-4
9
55-5
9
65-6
9
75-7
9
FRA
0%
50%
100%
150%
200%
250%
300%
350%
GBR
0%
50%
100%
150%
200%
250%
300%
350%
% o
f med
ian
equi
valis
ed in
com
e
ITA
0%
50%
100%
150%
200%
250%
300%
350%LUX
0%
50%
100%
150%
200%
250%
300%
350%
USA
0%
50%
100%
150%
200%
250%
300%
350%
0-4
10-1
4
18-1
925
-29
35-3
9
45-4
9
55-5
9
65-6
9
75-7
9
Note: Amounts are equivalised to account for household size differences; see notes to Table 3.
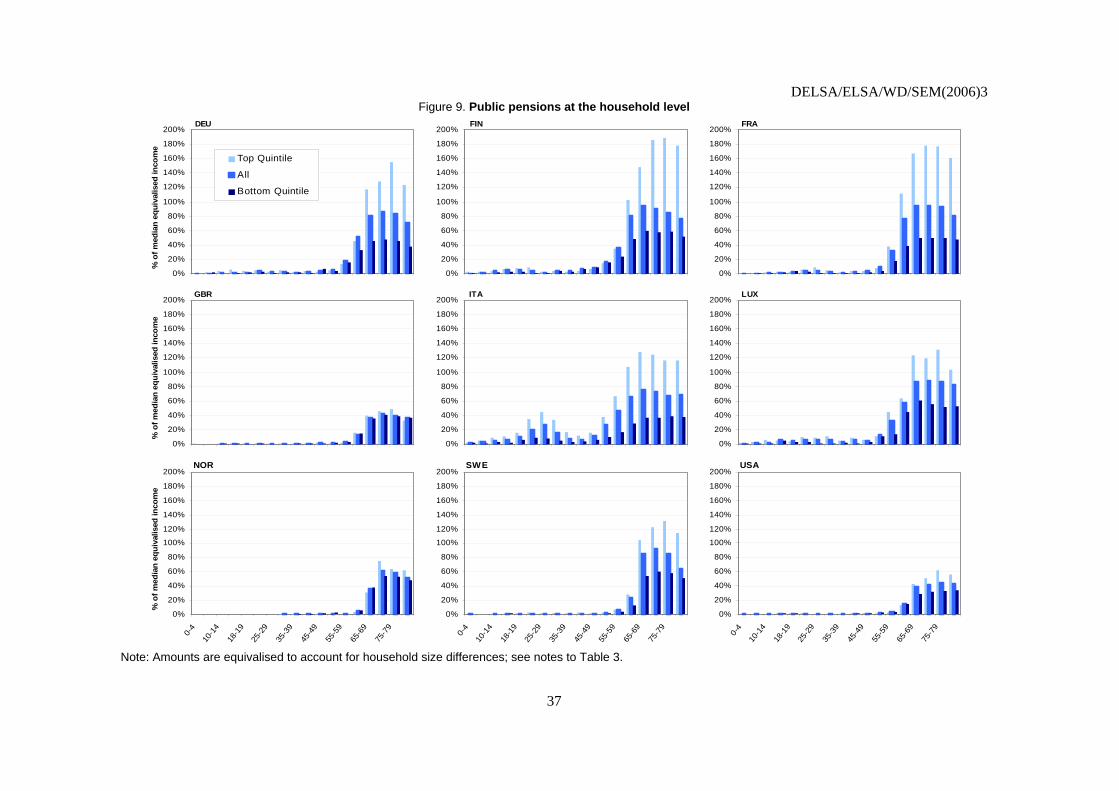
DELSA/ELSA/WD/SEM(2006)3
37
Figure 9. Public pensions at the household level DEU
0%
20%
40%
60%
80%
100%
120%
140%
160%
180%
200%
% o
f med
ian
equi
valis
ed in
com
eTop Quintile
All
Bottom Quintile
FIN
0%
20%
40%
60%
80%
100%
120%
140%
160%
180%
200%
NOR
0%
20%
40%
60%
80%
100%
120%
140%
160%
180%
200%
0-4
10-1
4
18-1
9
25-2
9
35-3
9
45-4
9
55-5
9
65-6
9
75-7
9
% o
f med
ian
equi
valis
ed in
com
e
SWE
0%
20%
40%
60%
80%
100%
120%
140%
160%
180%
200%
0-4
10-1
4
18-1
9
25-2
9
35-3
9
45-4
9
55-5
9
65-6
9
75-7
9
FRA
0%
20%
40%
60%
80%
100%
120%
140%
160%
180%
200%
GBR
0%
20%
40%
60%
80%
100%
120%
140%
160%
180%
200%
% o
f med
ian
equi
valis
ed in
com
e
ITA
0%
20%
40%
60%
80%
100%
120%
140%
160%
180%
200%LUX
0%
20%
40%
60%
80%
100%
120%
140%
160%
180%
200%
USA
0%
20%
40%
60%
80%
100%
120%
140%
160%
180%
200%
0-4
10-1
4
18-1
9
25-2
9
35-3
9
45-4
9
55-5
9
65-6
9
75-7
9
Note: Amounts are equivalised to account for household size differences; see notes to Table 3.

DELSA/ELSA/WD/SEM(2006)3
38
Figure 10. Capital incomes, including private and occupational pensions, at the household level DEU
0%
20%
40%
60%
80%
100%
120%
140%
160%
180%
200%
% o
f med
ian
equi
valis
ed in
com
e
Top Quintile
All
Bottom Quintile
FIN
0%
20%
40%
60%
80%
100%
120%
140%
160%
180%
200%
NOR
0%
20%
40%
60%
80%
100%
120%
140%
160%
180%
200%
0-4
10-1
4
18-1
9
25-2
9
35-3
9
45-4
9
55-5
9
65-6
9
75-7
9
% o
f med
ian
equi
valis
ed in
com
e
SWE
0%
20%
40%
60%
80%
100%
120%
140%
160%
180%
200%0-
4
10-1
4
18-1
9
25-2
9
35-3
9
45-4
9
55-5
9
65-6
9
75-7
9
FRA
0%
20%
40%
60%
80%
100%
120%
140%
160%
180%
200%
GBR
0%
20%
40%
60%
80%
100%
120%
140%
160%
180%
200%
% o
f med
ian
equi
valis
ed in
com
e
ITA
0%
20%
40%
60%
80%
100%
120%
140%
160%
180%
200%LUX
0%
20%
40%
60%
80%
100%
120%
140%
160%
180%
200%
USA
0%
20%
40%
60%
80%
100%
120%
140%
160%
180%
200%
0-4
10-1
4
18-1
9
25-2
9
35-3
9
45-4
9
55-5
9
65-6
9
75-7
9
Note: Amounts are equivalised to account for household size differences; see notes to Table 3.

DELSA/ELSA/WD/SEM(2006)3
39
Figure 11. Income taxes and social contributions at the household level DEU
0%
20%
40%
60%
80%
100%
120%
140%
% o
f med
ian
equi
valis
ed in
com
e
Top QuintileAllBottom Quintile
FIN
0%
20%
40%
60%
80%
100%
120%
140%
NOR
0%
20%
40%
60%
80%
100%
120%
140%
0-4
10-1
4
18-1
9
25-2
9
35-3
9
45-4
9
55-5
9
65-6
9
75-7
9
% o
f med
ian
equi
valis
ed in
com
e
SWE
0%
20%
40%
60%
80%
100%
120%
140%0-
4
10-1
4
18-1
9
25-2
9
35-3
9
45-4
9
55-5
9
65-6
9
75-7
9
FRA
0%
20%
40%
60%
80%
100%
120%
140%
GBR
0%
20%
40%
60%
80%
100%
120%
140%
% o
f med
ian
equi
valis
ed in
com
e
ITA
0%
20%
40%
60%
80%
100%
120%
140%LUX
0%
20%
40%
60%
80%
100%
120%
140%
USA
0%
20%
40%
60%
80%
100%
120%
140%
0-4
10-1
4
18-1
9
25-2
9
35-3
9
45-4
9
55-5
9
65-6
9
75-7
9
Note: Amounts are equivalised to account for household size differences; see notes to Table 3.
DELSA/ELSA/WD/SEM(2006)3
CONCLUSIONS
84. This paper has examined the functioning of social protection systems in nine OECD countries by focussing on how market incomes, taxes and social benefits vary by age group. The microsimulation approach taken here allows different taxes and benefits to be identified separately. It shows the contribution of each of these policy instruments to the individual income situation while taking full account of the household context.
85. An explicit age perspective on the distribution of incomes is useful as life events and contingencies affecting people’s earning capabilities, as well as the social protection measures aiming to address them, tend to be most pertinent at particular ages. While much research has investigated the fiscal and macro-economic implications of projected demographic changes, relatively little is known about their effects on the income distribution and how they compare across countries. Demographic changes, such as population ageing, alter income distributions through a simple compositional effect, i.e. by changing the relative sizes of groups with different incomes. At the same time, policy reforms aiming to address the fiscal challenges of ageing will also affect income disparities. The income information presented for different age groups in this paper provides a basis for analysing the nature of these distributional consequences.
86. Results were presented for the late 1990s in order to establish a “baseline” using information from a period that represents an early phase of the projected increase in dependency ratios and therefore also pre-dates some of the major reforms that are being introduced to address these demographic developments. The results therefore provide a useful counter-factual for assessing the effects of such policy reforms on income inequality and poverty. By later comparing with similar analyses for future periods, it should be possible to determine the relative importance of demographic trends and policy reforms in driving observed changes in resource distributions and financial well-being.
87. The analysis for the late 1990s shows that existing social protection systems are to a very large extent “old-age” protection systems, with those aged 65 and over typically receiving almost three times the (net) cash transfers of the average person. In some countries, cash benefits are even more targeted towards elderly individuals, while comparatively little is spent on securing adequate resources for younger generations. Even without accounting for health-related spending, which is not considered here, these patterns clearly highlight the challenges associated with ageing populations. If spending patterns remain the same, age imbalances will grow, leading to more pressure on overall social protection budgets, higher tax burdens for the economically active population, and fewer funds available for non-age related policy priorities, such as reducing child poverty, education, reconciling work and family life, or promoting continued labour market attachment for those facing employment difficulties.
88. Yet, there appears to be considerable scope for re-balancing social protection spending without necessarily compromising distributional objectives. In fact, the results show that high old-age expenditure levels can nevertheless leave substantial shares of the elderly without adequate resources while countries spending relatively smaller amounts can succeed at limiting poverty risks. There is also scope in some countries to re-consider the balance of tax burdens with a view to ease tax liabilities for economically active individuals while ensuring that high-income pensioners contribute a share that corresponds to their financial position.
89. This suggests that income security for the elderly needs not be at risk if pension reforms incorporate proper safety-net measures. In fact, a rebalancing of social protection spending can arguably reduce future budget pressures if well-structured support for younger generations succeeds at increasing self-sufficiency and reduces social and financial problems later in life.
40

DELSA/ELSA/WD/SEM(2006)3
ANNEX
INCOME COMPONENTS
90. The definition of current disposable income adopted in this project is based on earlier OECD work (Atkinson et al., 1995, “Income distribution in OECD Countries: Evidence from the Luxembourg Income Study”, OECD). Using this definition as a basis, total disposable income has the following components: regular market incomes (income from labour, capital and property); plus private transfers; plus public transfers; less social security contributions paid by the employee/self-employed/benefit recipient; less income taxes. Housing and childcare costs as well as other forms of committed expenditures, taxes on property and wealth as well as social insurance contributions paid by the employer are not taken into account. Labour income does not include employers’ social security contributions.
91. Total disposable income, as defined above, is only a partial measure of consumption capability. Non-cash incomes in the form of subsidised housing and other in-kind and near-cash benefits such as publicly provided or subsidised child- or medical care, education and transports public services, as well as the rental value (imputed rent) of owner-occupied housing and home production are not included in the income concept.
92. For the purpose of the present analysis the relevant income components are further broken down as follows:
1. Labour income (E): all regular income from dependent employment or self employment activities (excluding employers’ contributions to social security, but including short term sickness payments paid by social security)
2. Income from capital and private transfers (K): private pensions, income from financial and real assets (including capital gains) and all types of private transfers;
3. Old-age pension benefits (OAB): universal flat rate state pensions, minimum means tested pensions, earnings-related pensions, war pensions and survivor pensions;
4. Sickness and invalidity benefits (SIB): work injury pensions, civil invalidity pension, special benefits for handicapped persons, allowances for particular care necessities;
5. Unemployment benefits (UB): contributory and means tested unemployment benefits and other allowances associated to active labour market policies, such as training allowances;
6. Child and family benefits (FB): child birth allowances, maternity payments, universal child benefits, child raising benefits, child care benefits, specific lone parents benefits as well as schooling benefits and public grants for schooling or university;
7. Housing benefits (HB): Cash benefits received in relation to rented accommodation (excluding any indirect subsidies, favourable loan facilities, etc.);
41

DELSA/ELSA/WD/SEM(2006)3
8. Social assistance (SA): means tested social assistance from minimum income support schemes, allowances received from semi public institutions;
9. In-work benefits (IW): work-tested benefits or tax credits designed with the intention of providing additional incentives to take up or increase employment activities.
10. Social security contributions (SS): employees’ and self employed contributions to social security;
11. Social security contributions paid on benefits (SB): contributions paid on gross benefits by the benefit recipient;
12. Income taxes (TA): national and local taxes on labour and capital income;
13. Income taxes paid on social transfers (TB): national and local taxes on taxable gross benefits.
93. The country tables A1.1 to A1.9 below provide further details on each relevant income component.
42

DELSA/ELSA/WD/SEM(2006)3
Table A1.1. Finland
Income components taken from micro-data Simulated income components Not Available
Pension income (OAB)
Basic Pension, Earnings-related Pensions, Pension from abroad, Survivor's Pension
Unemployment benefits (UB)
Basic Unemployment Benefit, Earnings Related Unemployment Benefit, Labour Market Support, Training Subsidy for Unemployed
Sick and invalidity benfits (SIB)
Work Injury Pension,Military Injury Compensation,Pension from medical treatment injury,Sickness Benefit
Family and child benefits (FB)
Child Benefit,Lone Parent Child Benefit
Housing benefits (HB) Pensioners' housing benefit, Student housing benefit General Cash Housing Benefit
In-work benefits (IW)Social assistance (SA) Social Assistance Benefit
Taxes (TA, TB)
National Income tax, Capital Income Tax, Deposit Interest Income Tax, Local Non-Capital Income Taxation (Municipal Taxation)
Social security contributions (SS, SB)
Self-employed contributions to pension insurance,Employee Social Contributions,Employee Sickness Contribution
Earnings (E)
Gross income from employment (current), Self-employment income (current), Other regular primaryincome from odd jobs and childrens’ income, Amount ofmaternity benefit and statutory maternity pay received
Income from Capital (K)
Gross Investment income, Gross Property income, GrossPrivate pension benefit payments, Other private transfersreceived, Other regular cash payments
43

DELSA/ELSA/WD/SEM(2006)3
Table A1.2. France
Income components taken from micro-data Simulated income components Not Available
Pension income (OAB)
War pension,Pension Benefits,Alimony (pension de reversion) (gross),Pre-Retirement Pension
Minimum pension
Unemployment benefits (UB)
Gross unemployment compensation Allocation Solidarite Specifique - Unemployment Assistance
Sick and invalidity benfits (SIB)
Social Benefit for dependent elderly adults (Aide aux Personnes Agees Dependentes (originally APAD)),Social Benefit for special education (Allocation d'education speciale…destinee aux enfants handicapes),Invalidity pension,Invalidity Benefit
Means Tested Invalidity Benefit (Allocation Aux Adultes Handicapes
Family and child benefits (FB)
Social Benefit for parental education (Allocation Parental d'Education),Social Benefit for Lone Parents with certain characteristics (Allocation de Soutien Familial),Help for child guard (aide a la garde d'enfant)
Allocation Familial,APJE Family Benefit with young children,Allocation de rentrèe scolaire,Aide à la Scol,Family Benefit for many children,Allocation de Parent Isolé
Housing benefits (HB) Allocation Logement
In-work benefits (IW)
Social assistance (SA) Revenu Minimum d'Insertion
Taxes (TA, TB)National Income tax,Social Contributions on Capital Income,Capital Income Taxation
Social security contributions (SS, SB)
General Employee social insurance contributions, Unemployment Benefit Income "CSG" Social Contribution,Social contribution paid on unemployment income, Social contribution paid on employment income, Employment Income "CSG" Social Contribution, Social contribution paid on pension income (“Cottisation Maladie”), Social contribution paid on pension income, Pension Income "CSG" Social Contribution, CSG social contribution paid on family benefits
Earnings (E)
Current Gross Employment Income, Self-Employment Income, Secondary or temporary activity incomes (revenus d'activites secondaires ou occasionnelles) (gross), Payment to soldiers (compulsory military service) (solde des appeles) (gross), Participation bonus (prime de participation et interessement) (gross)
Income from Capital (K)
Gross Investment income, Gross Property income, Other private transfers received, Other regular cash payments
44
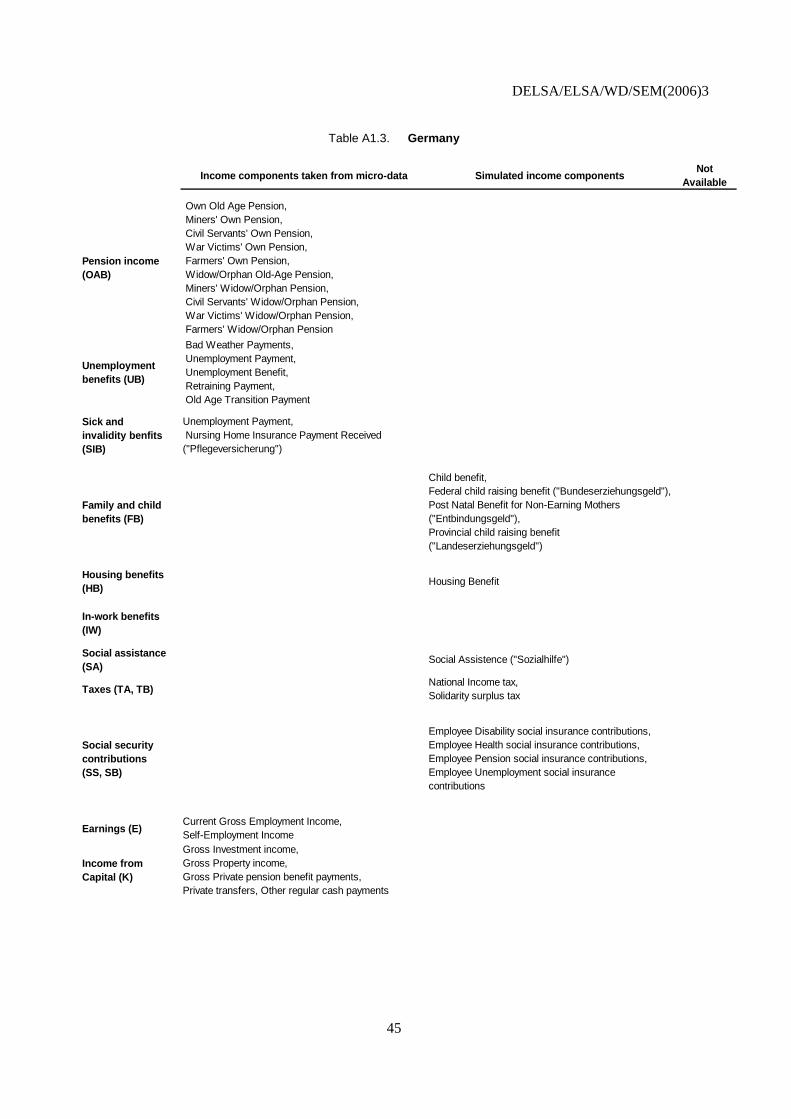
DELSA/ELSA/WD/SEM(2006)3
Table A1.3. Germany
Income components taken from micro-data Simulated income components Not Available
Pension income (OAB)
Own Old Age Pension, Miners' Own Pension, Civil Servants' Own Pension, War Victims' Own Pension, Farmers' Own Pension, Widow/Orphan Old-Age Pension, Miners' Widow/Orphan Pension, Civil Servants' Widow/Orphan Pension, War Victims' Widow/Orphan Pension, Farmers' Widow/Orphan Pension
Unemployment benefits (UB)
Bad Weather Payments, Unemployment Payment, Unemployment Benefit, Retraining Payment, Old Age Transition Payment
Sick and invalidity benfits (SIB)
Unemployment Payment, Nursing Home Insurance Payment Received ("Pflegeversicherung")
Family and child benefits (FB)
Child benefit,Federal child raising benefit ("Bundeserziehungsgeld"),Post Natal Benefit for Non-Earning Mothers ("Entbindungsgeld"),Provincial child raising benefit ("Landeserziehungsgeld")
Housing benefits (HB) Housing Benefit
In-work benefits (IW)
Social assistance (SA)
Social Assistence ("Sozialhilfe")
Taxes (TA, TB) National Income tax,Solidarity surplus tax
Social security contributions (SS, SB)
Employee Disability social insurance contributions,Employee Health social insurance contributions,Employee Pension social insurance contributions,Employee Unemployment social insurance contributions
Earnings (E)Current Gross Employment Income,Self-Employment Income
Income from Capital (K)
Gross Investment income,Gross Property income,Gross Private pension benefit payments,Private transfers, Other regular cash payments
45

DELSA/ELSA/WD/SEM(2006)3
Table A1.4. Italy
Income components taken from micro-data Simulated income components Not Available
Pension income (OAB)
Social Pension (INPS), War pension, (excluding supp.), Pension: INPS (NATIONAL INSTITUTE OF SOCIAL INSURANCE): old age, retirement pension, (excluding supp.),Pension: INPS: Widow’s pension, (excluding supp.), Pension: IPAT (INSTITUTE OF TREASURY-MANAGED INSURANCE): old age, retirement pension, (excluding supp.), Pension: STATE: old age, retirement pension, Other pension, Foreign pension, State: Widow’s Pension
Supplementary pension paid on INPS Pension,Supplementary pension paid on Widow’s Pension,Supplementary pension paid on IPAT Pension,Supplementary pension paid on IPAT Widow’s Pension,Supplementary pension paid on State Pension
Unemployment benefits (UB)
Social insurance unemployment CIG, Socialinsurance unemployment compensation, Socialinsurance unemployment mobility benefit
Sick and invalidity benfits (SIB)
State disability non contributory pension (tax free), INAIL Disability non-contributory pension (tax free),(excluding supp). Pension: INPS: Disability Pension, (excluding supp). Pension: IPAT: Disability Pension
Supplementary pension paid on INPS: Disability Pension,Supplementary pension paid on IPAT: Disability Pension
Family and child benefits (FB)
Family Allowance 2 adults plus Children, Family Allowance 1 adult, plus Children
Housing benefits (HB)In-work benefits (IW)
Social assistance (SA)
Social security: national administrations,Social security: regional administrations,Social security: provincial administrations,Social security: municipal administrations,Social security: local health centre,Social security: other local P.A.
Family Allowance 2 adult, no Children,Family Allowance 1 adult, no Children
Taxes (TA, TB)
Deposit Tax,Tax on dividends,Tax on productive activities of self-employed,National and local income tax (IRPEF),Tax on other bonds,Tax on government Bonds
Social security contributions (SS, SB)
General Employee social insurance contributions
Earnings (E)Current Gross Employment Income, Self-Employment Income, Fringe benefits
Income from Capital (K)
Gross Investment income, Gross Property income,Gross Private pension benefit payments, Otherprivate transfers received, Other regular cashpayments, Social security: other private institutions
46
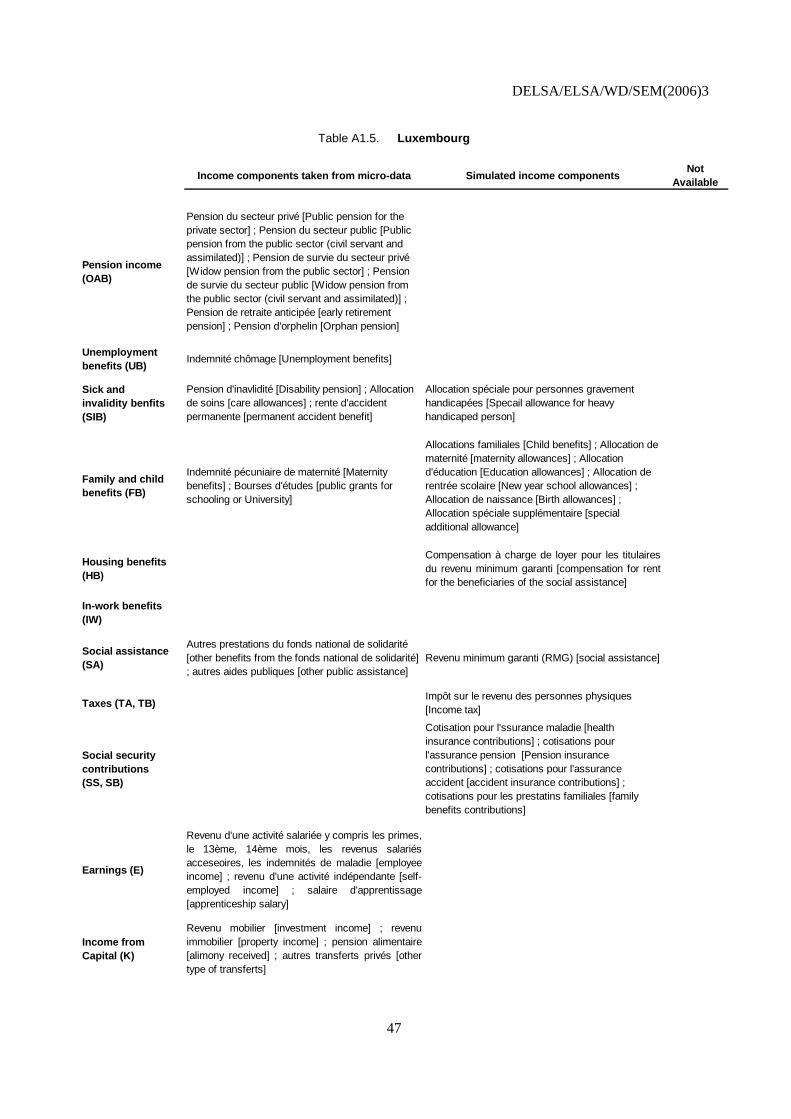
DELSA/ELSA/WD/SEM(2006)3
Table A1.5. Luxembourg
Income components taken from micro-data Simulated income components Not Available
Pension income (OAB)
Pension du secteur privé [Public pension for the private sector] ; Pension du secteur public [Public pension from the public sector (civil servant and assimilated)] ; Pension de survie du secteur privé [Widow pension from the public sector] ; Pension de survie du secteur public [Widow pension from the public sector (civil servant and assimilated)] ; Pension de retraite anticipée [early retirement pension] ; Pension d'orphelin [Orphan pension]
Unemployment benefits (UB) Indemnité chômage [Unemployment benefits]
Sick and invalidity benfits (SIB)
Pension d'inavlidité [Disability pension] ; Allocation de soins [care allowances] ; rente d'accident permanente [permanent accident benefit]
Allocation spéciale pour personnes gravement handicapées [Specail allowance for heavy handicaped person]
Family and child benefits (FB)
Indemnité pécuniaire de maternité [Maternity benefits] ; Bourses d'études [public grants for schooling or University]
Allocations familiales [Child benefits] ; Allocation de maternité [maternity allowances] ; Allocation d'éducation [Education allowances] ; Allocation de rentrée scolaire [New year school allowances] ; Allocation de naissance [Birth allowances] ; Allocation spéciale supplémentaire [special additional allowance]
Housing benefits (HB)
Compensation à charge de loyer pour les titulairesdu revenu minimum garanti [compensation for rentfor the beneficiaries of the social assistance]
In-work benefits (IW)
Social assistance (SA)
Autres prestations du fonds national de solidarité [other benefits from the fonds national de solidarité] ; autres aides publiques [other public assistance]
Revenu minimum garanti (RMG) [social assistance]
Taxes (TA, TB)Impôt sur le revenu des personnes physiques [Income tax]
Social security contributions (SS, SB)
Cotisation pour l'ssurance maladie [health insurance contributions] ; cotisations pour l'assurance pension [Pension insurance contributions] ; cotisations pour l'assurance accident [accident insurance contributions] ; cotisations pour les prestatins familiales [family benefits contributions]
Earnings (E)
Revenu d'une activité salariée y compris les primes,le 13ème, 14ème mois, les revenus salariésacceseoires, les indemnités de maladie [employeeincome] ; revenu d'une activité indépendante [self-employed income] ; salaire d'apprentissage[apprenticeship salary]
Income from Capital (K)
Revenu mobilier [investment income] ; revenuimmobilier [property income] ; pension alimentaire[alimony received] ; autres transferts privés [othertype of transferts]
47

DELSA/ELSA/WD/SEM(2006)3
Table A1.6. Norway
Income components taken from micro-data Simulated income components Not
Available
Pension income (OAB)
National Insurance Administration (RTV), old age pension; Rikstrygdeverket(RTV) alderspensjon og ektefelletillegg.
Unemployment benefits (UB)
RTV Unemployment benefits; RTV Dagpenger.
Sick and invalidity benfits (SIB)
RTV, Sick and invalidity pension. RTV uførepensjon, grunn og hjelpestønad
Family and child benefits (FB)
RTV, Home Care Allowance; RTV Kontantstøtte
RTV, Child allowances. RTV and State Educational Loan Fund(grant); Barnetrygd, småbarnstrygd og forsørgerfrad. i skatt. Stipend fra Lånekassa for utdanning.
Housing benefits (HB)
Norwegian State Housing Bank, dwelling support; Husbanken, bostøtte
In-work benefits (IW)
Social assistance (SA)
Local authorities, social assistance; Sosialstøtte
Taxes (TA, TB)
National/local authority tax on net income(capital income included) and national tax on adjusted gross income(wage income and self employment income) ; Skatt til kommune/fylke og toppskatt.
Social security contributions (SS, SB)
Social Security Contribution; Trygdeavgift
48

DELSA/ELSA/WD/SEM(2006)3
Table A1.7. Sweden
Income components taken from micro-data Simulated income components Not Available
Pension income (OAB)
National basic pension (folkpension) and National supplementary pensions (ATP) for old age pensioneers, survivors (widows and children) and adjustment. Pension supplements (pensionstillskott) for old age pensioneers, survivors (widows only) and adjustment. Childrens and wife supplements. Supplements for care of sick or handicapped children.
Unemployment benefits (UB)
Unemployment insurance, basic insurance (KAS) and voluntary income related insurance (A-KASSA). Work experience scheme (ALU). Employment training (AMU).
Sick and invalidity benfits (SIB)
Benefit for work injuries.
National basic pension (folkpension), Pension supplements (pensionstillskott) and National supplementary pensions (ATP) for disabled. Benefit for care of handicapped children
Family and child benefits (FB)
Tax free student benefits (allowances and loans) less repaid loans. Taxable student benefits (post graduates and adults). Taxable periodic support. Residual tax free benefits.
Parental allowance: pregnancy allowance, parental allowance in connection with birth/adoption, temporary parental allowance for the father and temporary parental allowance. Childrens allowance. Maintenance support
Housing benefits (HB)
Housing allowance, housing supplement for pensioners (BTP) and special housing supplement for pensioners (SBTP)
In-work benefits (IW)
Social assistance (SA)
Social assistance
Taxes (TA, TB)Tax reductions from real estate tax and from building on own home
National and local income tax. Tax on capital income. Reductions for capital losses.
Social security contributions (SS, SB)
General pension fee
Earnings (E)
Wages + car privileges etc. + sickness allowance + income close company + income liable to tax, with no pension rights + income from cooperative insurance from employer (blue collar) + income from hobby + residual taxable income + received compensation for costs -reduction business travels - deduction for travels between home and work - standard deduction various costs - deduction double living - sickness allowance, self employed + income from business - deduction private pension insurances - deduction periodic maintenance paid - deduction new started company.
Income from Capital (K)
Interests (bank, bonds and other securities) + dividends + positive + income from hiring out dwelling + occupational pensions + private pensions
49
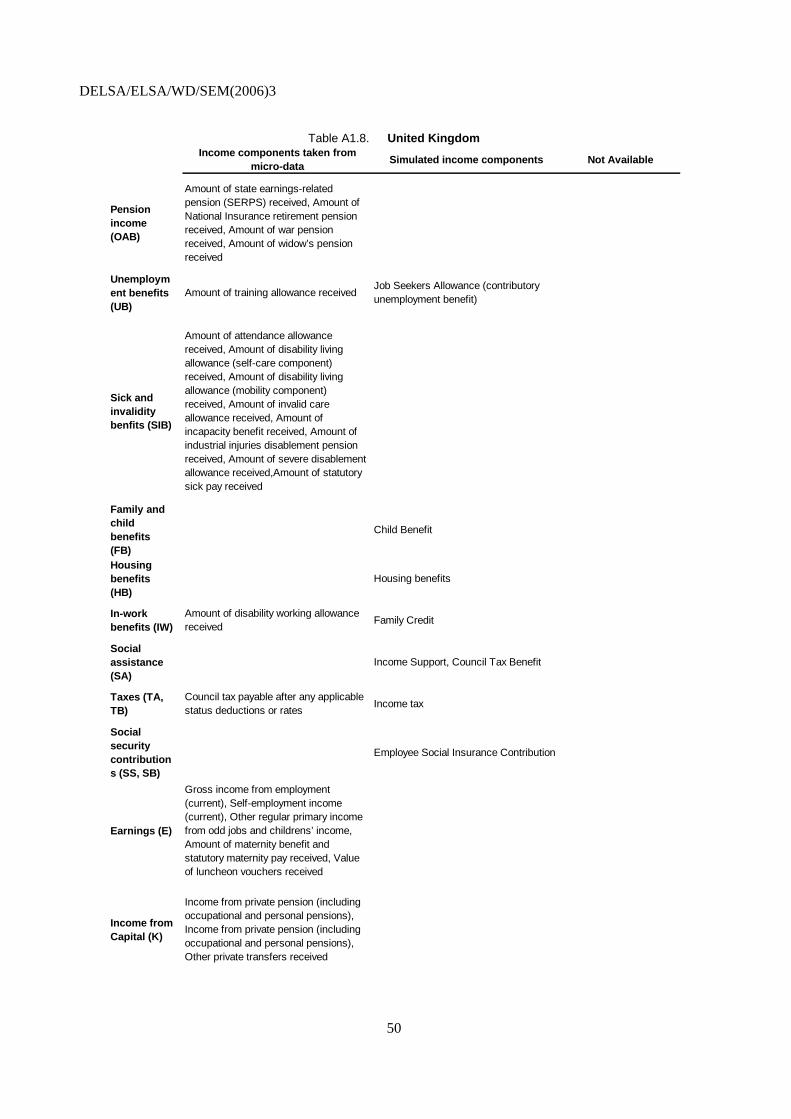
DELSA/ELSA/WD/SEM(2006)3
Table A1.8. United Kingdom Income components taken from
micro-data Simulated income components Not Available
Pension income (OAB)
Amount of state earnings-related pension (SERPS) received, Amount of National Insurance retirement pension received, Amount of war pension received, Amount of widow’s pension received
Unemployment benefits (UB)
Amount of training allowance receivedJob Seekers Allowance (contributory unemployment benefit)
Sick and invalidity benfits (SIB)
Amount of attendance allowance received, Amount of disability living allowance (self-care component) received, Amount of disability living allowance (mobility component) received, Amount of invalid care allowance received, Amount of incapacity benefit received, Amount of industrial injuries disablement pension received, Amount of severe disablement allowance received,Amount of statutory sick pay received
Family and child benefits (FB)
Child Benefit
Housing benefits (HB)
Housing benefits
In-work benefits (IW)
Amount of disability working allowance received Family Credit
Social assistance (SA)
Income Support, Council Tax Benefit
Taxes (TA, TB)
Council tax payable after any applicable status deductions or rates Income tax
Social security contributions (SS, SB)
Employee Social Insurance Contribution
Earnings (E)
Gross income from employment (current), Self-employment income (current), Other regular primary income from odd jobs and childrens’ income, Amount of maternity benefit and statutory maternity pay received, Value of luncheon vouchers received
Income from Capital (K)
Income from private pension (including occupational and personal pensions), Income from private pension (including occupational and personal pensions), Other private transfers received
50

DELSA/ELSA/WD/SEM(2006)3
Table A1.9. United States
Income components taken from micro-data
Simulated income components Not Available
Pension income (OAB)
Social Security benefits (for reasons other than disability); veterans benefits
Supplemental Security Income (SSI) for people 65+
Unemployment benefits (UB) unemployment compensation
Sick and invalidity benfits (SIB)
Social Security benefits due to disability; workers compensation
Supplemental Security Income (SSI) for disabled people <65
Family and child benefits (FB)
none meeting definition used in this paper
Housing benefits (HB)
value of public housing or subsidized housing, for households reported to be in such housing
In-work benefits (IW) Earned Income Tax Credit (EITC)
Social assistance (SA)
"general assistance" funded by some local governments
Temporary Assistance to Needy Families (TANF)
Taxes (TA, TB) federal income tax liability (before the EITC)
state income taxes
Social security contributions (SS, SB)
payroll taxes on earnings
there are no Social Security contributions paid on benefits in the U.S.
Earnings (E)
wages, farm and non-farm self-employment income; note that wages would include pay for "sick leave" and "maternity leave"
Income from Capital (K)
interest, dividends, rent, alimony, regular contributions, private and government pensions (including disability pensions), grants for college education, child support
51

DELSA/ELSA/WD/SEM(2006)3
BIBLIOGRAPHY
Corak, M., C. Lietz and H. Sutherland (2005), “The Impact of Tax and Transfer Systems on Children in the European Union”, Innocenti Working Paper No. 2005-04. Florence, UNICEF Innocenti Research Centre. http://www.unicef.org/irc.
Förster, M. and M. Mira d’Ercole (2005), “Income Distribution and Poverty in OECD Countries in the Second Half of the 1990s”, OECD Social, Employment and Migration Working Papers No. 22, OECD, Paris.
Gottschalk, P. and T. M. Smeeding (2000), “Empirical evidence on income inequality in industrialized countries”, Handbook of Income Distribution, in A.B. Atkinson and F. Bourguignon (eds.), Handbook of Income Distribution, Elsevier, Edition 1, Vol. 1, Chapter 5, pp. 261-307.
Hernanz, V., F. Malherbet and M. Pellizzari (2004), “Take-up of Welfare Benefits in OECD Countries: A Review of the Evidence”, OECD Social, Employment and Migration Working Papers No. 17, OECD, Paris.
Lam, D. (1997), “Demographic variables and income inequality”, in M. R. Rosenzweig and O. Stark (eds.), Handbook of Population Economics, Elsevier, pp. 1015-1059.
OECD (2001), Ageing and Income. Financial Resources and Retirement in 9 OECD Countries, OECD, Paris.
OECD (2003), Transforming Disability into Ability: Policies to Promote Work and Income Security, OECD, Paris.
OECD (2005a), Pensions at a Glance, OECD, Paris.
OECD (2005b), Live Longer, Work Longer: Ageing and Employment Policies, OECD, Paris.
Smeeding, T. M. and S. Sandström (2005), “Poverty and income maintenance in old age: A cross-national view of low-income older women”, LIS Working paper No. 398, Luxembourg Income Study.
Sutherland, H. (2000), “EUROMOD: A tax-benefit model for the European Union”, Transfer, 6 (2), pp. 312-316.
Sutherland, H. (2001), “Final Report. EUROMOD: An integrated European benefit-tax model”, EUROMOD Working Paper EM9/01. Available at www.iser.essex.ac.uk/msu/emod/.
Torrey, B. B. and T. M. Smeeding (1992), “Comparative Economic Status of the Elderly in Eight Countries: Policy Lessons from the Luxembourg Income Study and the International Database on Aging”, Research on Economic Inequality, 3.
Weizsäcker, R. K. (1996), “Distributive implications of an aging society”, European Economic Review, 40, pp. 729-746.
Williamson, J. M. and T. M. Smeeding (2004), “Sliding into Poverty? Cross-national patterns of income source change and income decay in old age”, CRR Working Paper 2004-25, Center for Retirement Research at Boston College.
52

DELSA/ELSA/WD/SEM(2006)3
OECD SOCIAL, EMPLOYMENT AND MIGRATION WORKING PAPERS
Most recent releases are:
No. 33 ALTERNATIVE MEASURES OF WELL-BEING (2006) Romina Boarini, Asa Johansson and Marco Mira d’Ercole
No: 32 SOCIAL DISADVANTAGE AND EDUCATION EXPERIENCES (2006) Stephen Machin
No. 31 CAN PARENTS AFFORD TO WORK? CHILDCARE COSTS, TAX-BENEFIT POLICIES AND WORK INCENTIVES (2005) Herwig Immervoll and David Barber
No. 30 CHALLENGES FACING LABOUR OFFICES AND SOCIAL INSURANCE (2005) Anders Reutersward
No. 29 NET SOCIAL EXPENDITURE, 2005 EDITION Willem Adema & Maxime Ladaique
No. 28 WELFARE REFORM IN EUROPEAN COUNTRIES: A MICROSIMULATION ANALYSIS (2005) Herwig Immervoll, Henrik Jacobsen Kleven, Claus Thustrup Kreiner and Emmanuel Saez
No. 27 TRENDS AND DETERMINANTS OF FERTILITY RATES: THE ROLE OF POLICIES (2005) Cristina d'Addio & Marco Mira d'Ercole
No. 26 THE “ENABLING STATE?” (2005) Neil Guilbert
No. 25 COUNTING IMMIGRANTS AND EXPATRIATES IN OECD COUNTRIES: A NEW PERSPECTIVE (2005) Jean-Christophe Dumont and Georges Lemaître
No. 24 TAXATION, ETHNIC TIES AND THE LOCATION CHOICE OF HIGHLY SKILLED IMMIGRANTS (2005) Thomas Liebig and Alfonso Sousa-Poza
No. 23 SHOULD WE EXTEND THE ROLE OF PRIVATE SOCIAL EXPENDITURE? (2005) Mark Pearson and John P. Martin
No. 22 INCOME DISTRIBUTION AND POVERTY IN OECD COUNTRIES IN THE SECOND HALF OF THE 1990S (2005) Michael Förster and Marco Mira d'Ercole
No. 21 DESIGN CHOICES IN MARKET COMPETITION FOR EMPLOYMENT SERVICES FOR THE LONG-TERM UNEMPLOYED (2004) Ludo Struyven
No. 20 BENEFIT COVERAGE RATES AND HOUSEHOLD TYPOLOGIES: SCOPE AND LIMITATIONS OF TAX-BENEFIT INDICATORS (2004) Herwig Immervoll, Pascal Marianna and Marco Mira D’Ercole
No. 19 AVERAGE AND MARGINAL EFFECTIVE TAX RATES FACING WORKERS IN THE EU. A MICRO-LEVEL ANALYSIS OF LEVELS, DISTRIBUTIONS AND DRIVING FACTORS (2004) Herwig Immervoll
No. 18 INDICATORS OF UNEMPLOYMENT AND LOW-WAGE TRAPS (Marginal Effective Tax Rates on Employment Incomes) (2004) Giuseppe Carone, Herwig Immervoll, Dominique Paturot and Aino Salomäki
Recent available working papers can be found on the OECD website: http://www.oecd.org/els/workingpapers.
Other series of working papers available from the OECD include: OECD HEALTH WORKING PAPERS
53

DELSA/ELSA/WD/SEM(2006)3
RECENT RELATED OECD PUBLICATIONS:
INTERNATIONAL MIGRATION OUTLOOK: SOPEMI - 2006 Edition
AGEING AND EMPLOYMENT POLICIES: LIVE LONGER, WORK LONGER (2006)
BABIES AND BOSSES: Reconciling Work and Family Life, Volume 4 Canada, Finland, Sweden and the United Kingdom (2005)
PENSIONS AT A GLANCE: Public policies across OECD countries (2005)
EXTENDING OPPORTUNITIES – How active social policy can benefit us all (2005)
SOCIETY AT A GLANCE: OECD Social Indicators (2005)
OECD EMPLOYMENT OUTLOOK (2006) forthcoming
AGEING AND EMPLOYMENT POLICIES: AUSTRALIA (2005)
AGEING AND EMPLOYMENT POLICIES: AUSTRIA (2005)
AGEING AND EMPLOYMENT POLICIES: CANADA (2005)
AGEING AND EMPLOYMENT POLICIES: DENMARK (2005)
AGEING AND EMPLOYMENT POLICIES: FRANCE (2005)
AGEING AND EMPLOYMENT POLICIES: GERMANY (2005)
AGEING AND EMPLOYMENT POLICIES: IRELAND (2006)
AGEING AND EMPLOYMENT POLICIES: NETHERLANDS (2005)
AGEING AND EMPLOYMENT POLICIES: UNITED STATES (2005)
PROMOTING ADULT LEARNING (2005)
MIGRATION, REMITTANCES AND DEVELOPMENT (2005)
MIGRATION FOR EMPLOYMENT: BILATERAL AGREEMENTS AT A CROSSROADS (2004)
INCOME DISPARITIES IN CHINA: AN OECD PERSPECTIVE (2004)
BENEFITS AND WAGES: OECD Indicators (2004)
REFORMING PUBLIC PENSIONS: SHARING THE EXPERIENCES OF TRANSITION AND OECD COUNTRIES (2004)
BABIES AND BOSSES: Reconciling Work and Family Life, Volume 3, New Zealand, Portugal, Switzerland (2004)
ASSET BUILDING AND THE ESCAPE FROM POVERTY: A NEW WELFARE POLICY DEBATE (2003)
MANAGING DECENTRALISATION: A NEW ROLE FOR LABOUR MARKET POLICY (2003)
COMBATING CHILD LABOUR: A REVIEW OF POLICIES (2003)
BABIES AND BOSSES: Reconciling Work and Family Life, Volume 2, Austria, Ireland and Japan (2003)
For a full list, consult the OECD On-Line Bookstore at www.oecd.org
54

DELSA/ELSA/WD/SEM(2006)3
55
Related Documents