Ministry of National Development Planning/ National Development Planning Agency Indonesia’s Agenda: How to Address the Middle Income Trap Presented at 2nd OECD-AMRO Joint Asian Regional Roundtable Singapore, 19 July 2013 Dr. Prasetijono Widjojo MJ, MA Deputy Minister for Economic Affairs

Oecd amro s2 02_indonesia dr prasetijono widjojo
Oct 19, 2014
2nd OECD-AMRO Asian Regional Roundtable
Welcome message from author
This document is posted to help you gain knowledge. Please leave a comment to let me know what you think about it! Share it to your friends and learn new things together.
Transcript
Ministry of National Development Planning/ National Development Planning Agency
Indonesia’s Agenda: How to Address the Middle Income Trap
Presented at 2nd OECD-AMRO Joint Asian Regional Roundtable
Singapore, 19 July 2013
Dr. Prasetijono Widjojo MJ, MA Deputy Minister for Economic Affairs
KEMENTERIAN PPN/ BAPPENAS
1. Middle Income Countries: An Overview 2. Indonesia’s Priority in Addressing Middle Income Trap 3. MP3KI: Masterplan for Acceleration and Expansion of Poverty Alleviation 4. MP3EI: Masterplan for Acceleration and Expansion of Indonesian
Economic Development 5. Financial Inclusion 6. Conclusion
Outline
KEMENTERIAN PPN/ BAPPENAS
Middle Income Countries: An Overview
KEMENTERIAN PPN/ BAPPENAS
Middle Income Countries: An Overview
16.3%
26.0%
25.1%
18.6%
14.0%
Low IncomeLower middle incomeUpper middle incomeHigh income: nonOECDHigh income: OECD
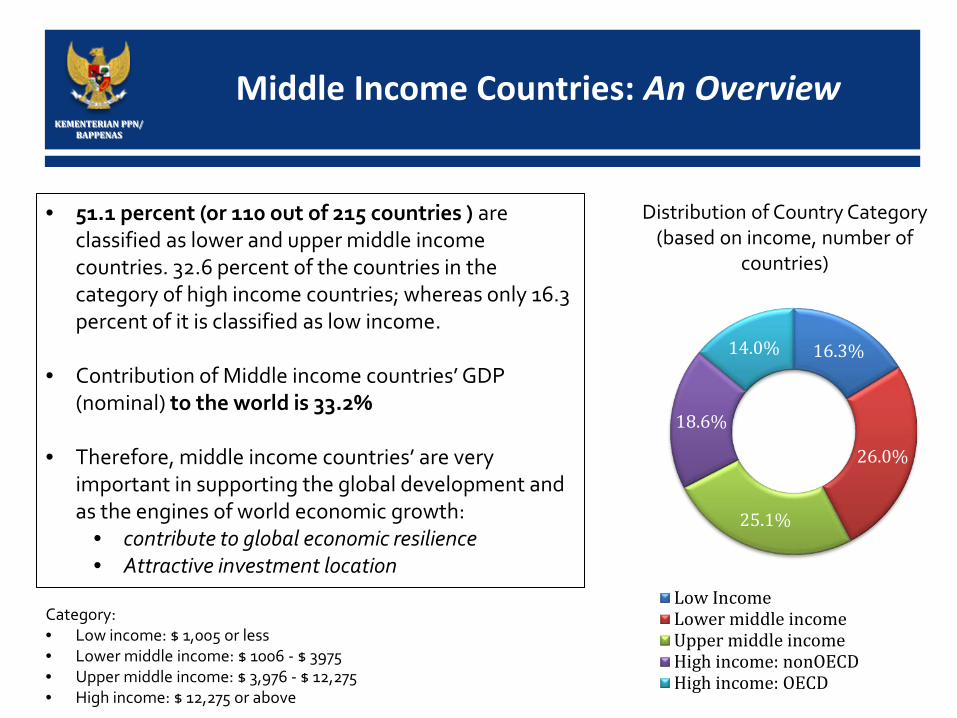
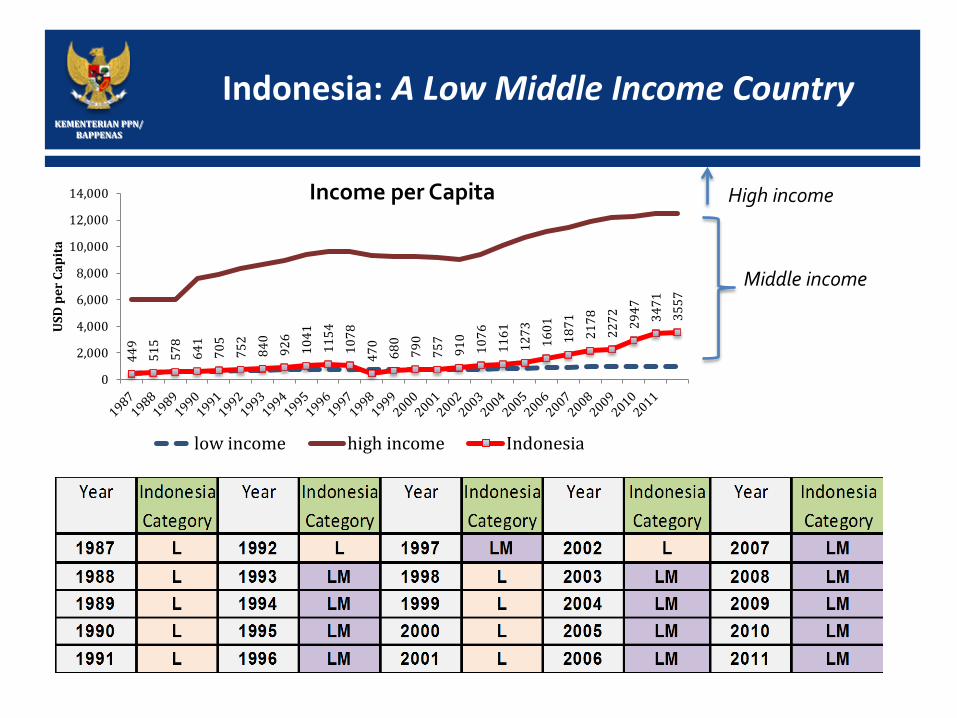
• 51.1 percent (or 110 out of 215 countries ) are classified as lower and upper middle income countries. 32.6 percent of the countries in the category of high income countries; whereas only 16.3 percent of it is classified as low income.
• Contribution of Middle income countries’ GDP (nominal) to the world is 33.2%
• Therefore, middle income countries’ are very important in supporting the global development and as the engines of world economic growth:
• contribute to global economic resilience • Attractive investment location
Category: • Low income: $ 1,005 or less • Lower middle income: $ 1006 - $ 3975 • Upper middle income: $ 3,976 - $ 12,275 • High income: $ 12,275 or above
Distribution of Country Category (based on income, number of
countries)
KEMENTERIAN PPN/ BAPPENAS
Indonesia: A Low Middle Income Country 44
9 51
5 57
8 64
1 70
5 75
2 84
0 92
6 10
41
1154
10
78
470
680
790
757
910
1076
11
61
1273
16
01
1871
21
78
2272
29
47
3471
35
57
0
2,000
4,000
6,000
8,000
10,000
12,000
14,000
USD
per
Cap
ita
low income high income Indonesia
Middle income
High income Income per Capita
Other Countries’ Experiences: Development of Income Per Capita
0
5,000
10,000
15,000
20,000
25,000
1987
1988
1989
1990
1991
1992
1993
1994
1995
1996
1997
1998
1999
2000
2001
2002
2003
2004
2005
2006
2007
2008
2009
2010
2011
USD
per
cap
ita low income
high incomeKorea
Korea
0
2,000
4,000
6,000
8,000
10,000
12,000
14,000
1987
1988
1989
1990
1991
1992
1993
1994
1995
1996
1997
1998
1999
2000
2001
2002
2003
2004
2005
2006
2007
2008
2009
2010
2011
USD
per
cap
ita
Brazil low incomehigh incomeBrazil
02,0004,0006,0008,000
10,00012,00014,00016,00018,000
1987
1988
1989
1990
1991
1992
1993
1994
1995
1996
1997
1998
1999
2000
2001
2002
2003
2004
2005
2006
2007
2008
2009
2010
2011
USD
per
cap
ita Chile
0
2,000
4,000
6,000
8,000
10,000
12,000
14,000
1987
1988
1989
1990
1991
1992
1993
1994
1995
1996
1997
1998
1999
2000
2001
2002
2003
2004
2005
2006
2007
2008
2009
2010
2011
USD
per
cap
ita
South Africa
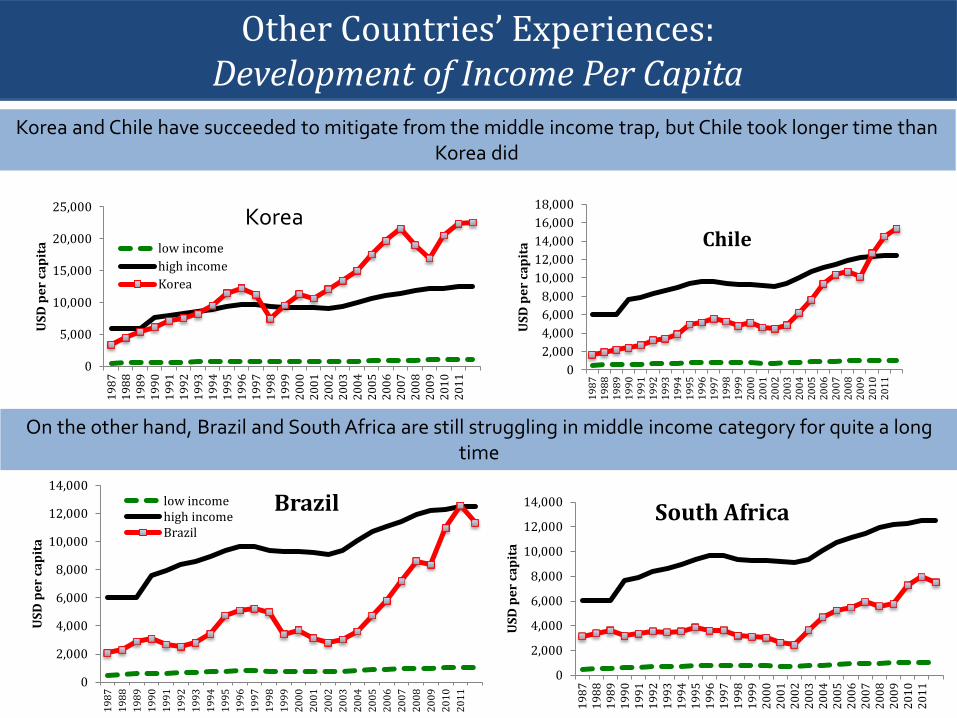
Korea and Chile have succeeded to mitigate from the middle income trap, but Chile took longer time than Korea did
On the other hand, Brazil and South Africa are still struggling in middle income category for quite a long time
KEMENTERIAN PPN/ BAPPENAS
Other Country Experiences: Korea and Chile
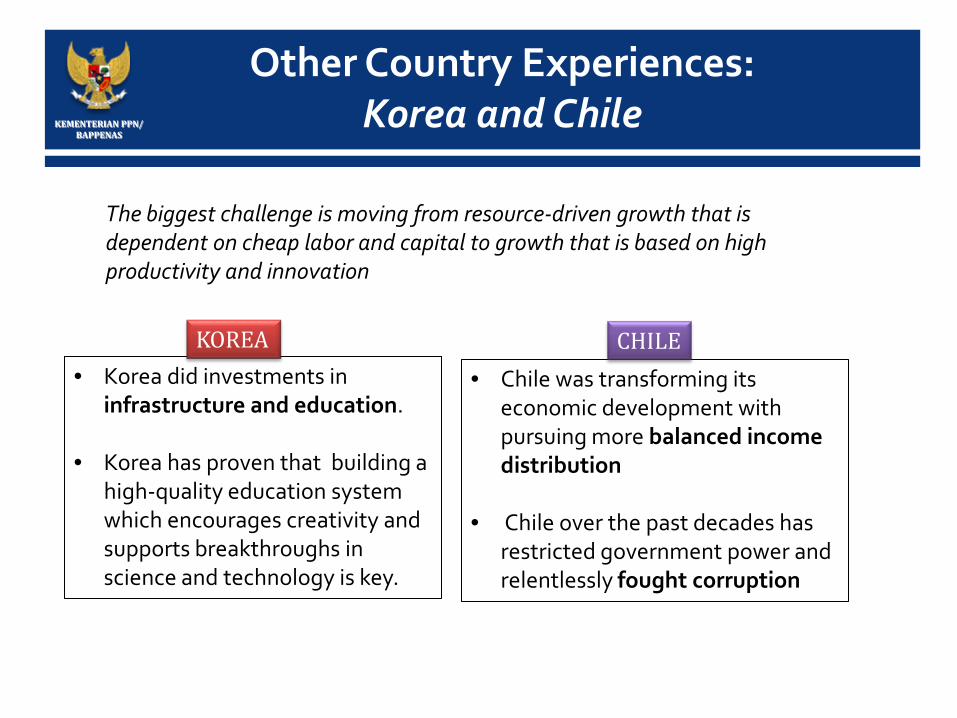
• Korea did investments in infrastructure and education.
• Korea has proven that building a high-quality education system which encourages creativity and supports breakthroughs in science and technology is key.
The biggest challenge is moving from resource-driven growth that is dependent on cheap labor and capital to growth that is based on high productivity and innovation
KOREA • Chile was transforming its
economic development with pursuing more balanced income distribution
• Chile over the past decades has restricted government power and relentlessly fought corruption
CHILE
KEMENTERIAN PPN/ BAPPENAS
A Risk of Middle Income Trap: Does Indonesia need to be worried?
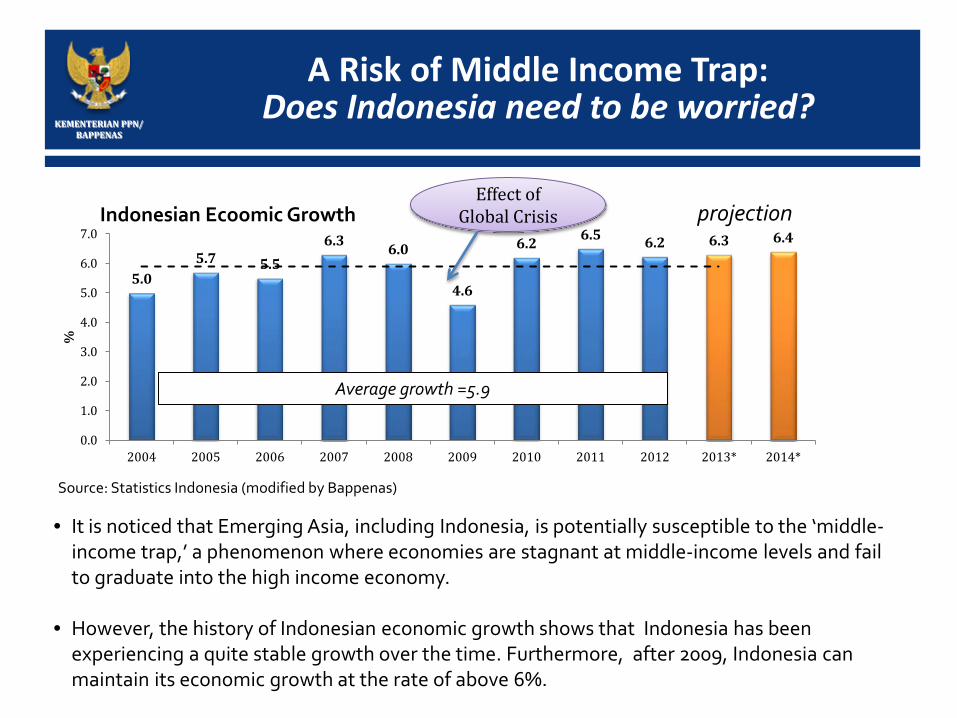
Source: Statistics Indonesia (modified by Bappenas)
5.0 5.7 5.5
6.3 6.0
4.6
6.2 6.5 6.2 6.3 6.4
0.0
1.0
2.0
3.0
4.0
5.0
6.0
7.0
2004 2005 2006 2007 2008 2009 2010 2011 2012 2013* 2014*
%
Average growth =5.9
projection Indonesian Ecoomic Growth Effect of
Global Crisis
• It is noticed that Emerging Asia, including Indonesia, is potentially susceptible to the ‘middle-income trap,’ a phenomenon where economies are stagnant at middle-income levels and fail to graduate into the high income economy.
• However, the history of Indonesian economic growth shows that Indonesia has been experiencing a quite stable growth over the time. Furthermore, after 2009, Indonesia can maintain its economic growth at the rate of above 6%.
KEMENTERIAN PPN/ BAPPENAS
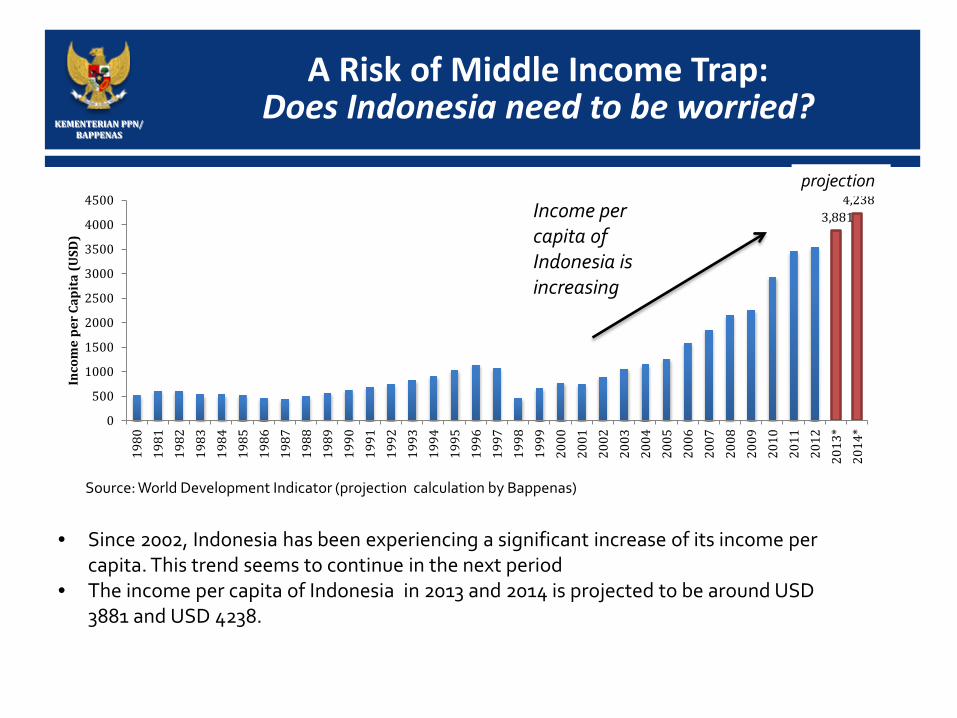
A Risk of Middle Income Trap: Does Indonesia need to be worried?
Source: World Development Indicator (projection calculation by Bappenas)
3,881 4,238
0
500
1000
1500
2000
2500
3000
3500
4000
4500
1980
1981
1982
1983
1984
1985
1986
1987
1988
1989
1990
1991
1992
1993
1994
1995
1996
1997
1998
1999
2000
2001
2002
2003
2004
2005
2006
2007
2008
2009
2010
2011
2012
2013
*20
14*
Inco
me
per
Capi
ta (U
SD)
Income per capita of Indonesia is increasing
• Since 2002, Indonesia has been experiencing a significant increase of its income per capita. This trend seems to continue in the next period
• The income per capita of Indonesia in 2013 and 2014 is projected to be around USD 3881 and USD 4238.
projection
KEMENTERIAN PPN/ BAPPENAS
Indonesia’s Priority in Addressing Middle Income Trap
KEMENTERIAN PPN/ BAPPENAS
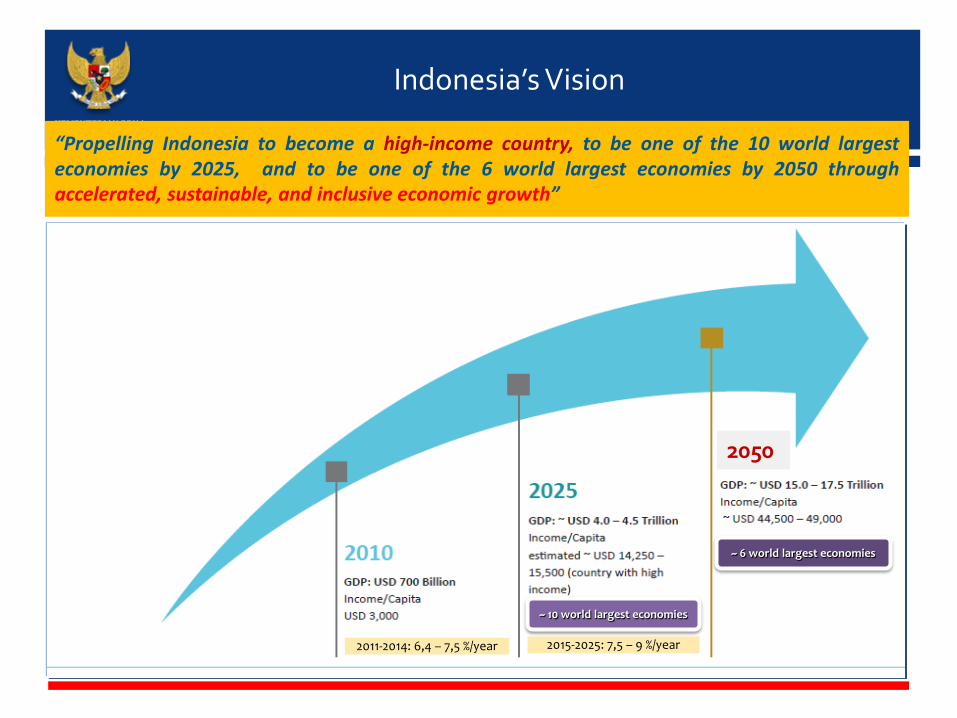
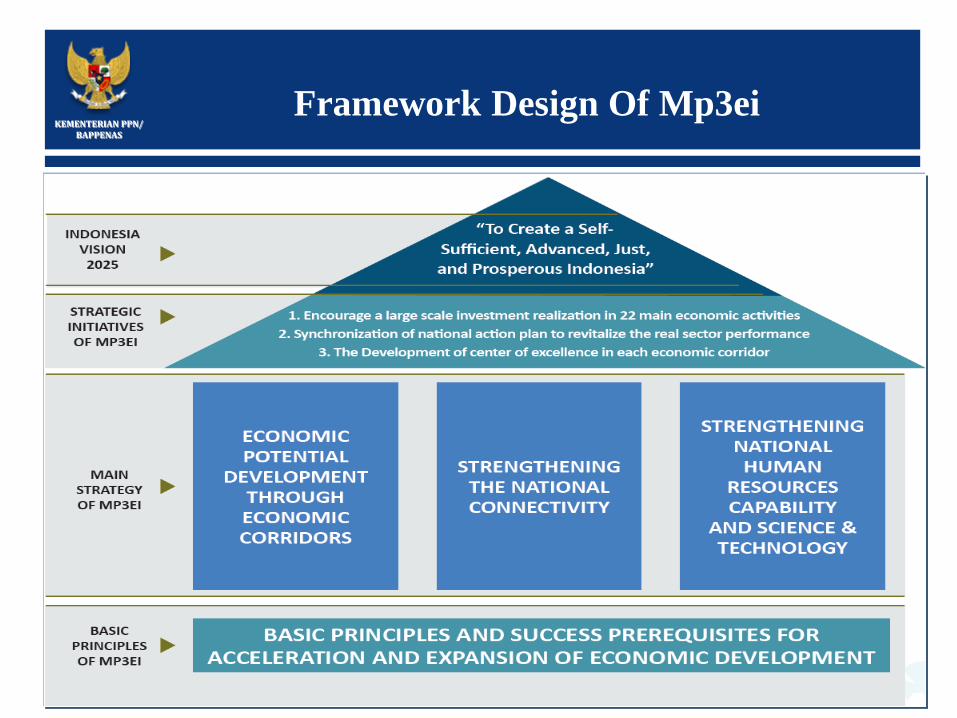
Indonesia’s Vision
“Propelling Indonesia to become a high-income country, to be one of the 10 world largest economies by 2025, and to be one of the 6 world largest economies by 2050 through accelerated, sustainable, and inclusive economic growth”
2011-2014: 6,4 – 7,5 %/year 2015-2025: 7,5 – 9 %/year
~ 10 world largest economies
~ 6 world largest economies
2050
KEMENTERIAN PPN/ BAPPENAS
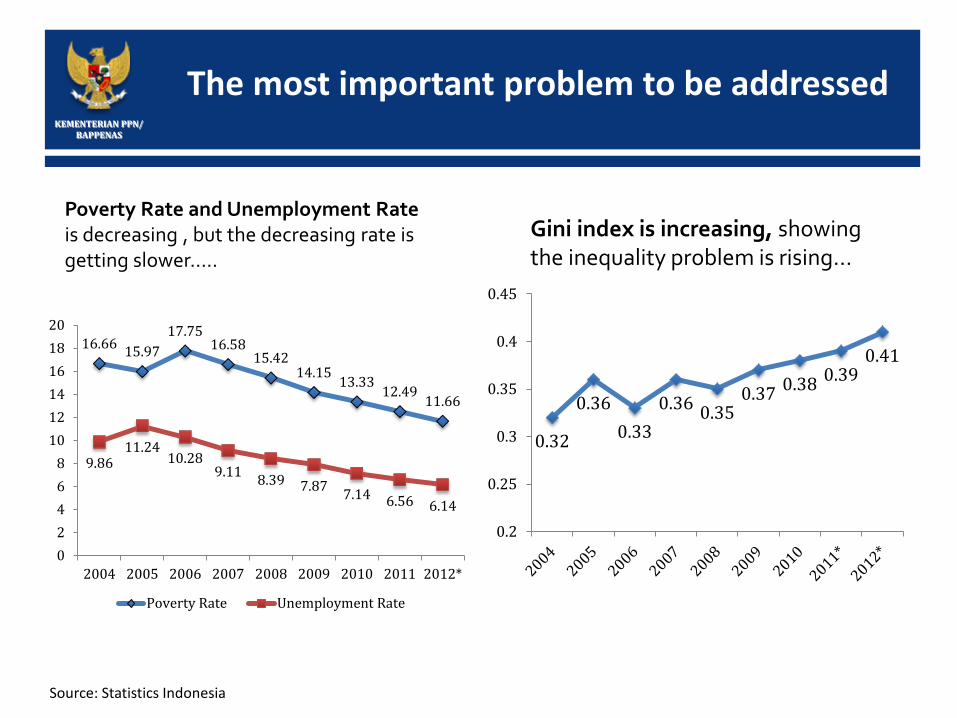
The most important problem to be addressed
Source: Statistics Indonesia
0.32
0.36 0.33
0.36 0.35 0.37 0.38 0.39
0.41
0.2
0.25
0.3
0.35
0.4
0.45
Gini index is increasing, showing the inequality problem is rising…
16.66 15.97 17.75
16.58 15.42
14.15 13.33 12.49 11.66
9.86 11.24
10.28 9.11 8.39 7.87 7.14 6.56 6.14
02468
101214161820
2004 2005 2006 2007 2008 2009 2010 2011 2012*
Poverty Rate Unemployment Rate
Poverty Rate and Unemployment Rate is decreasing , but the decreasing rate is getting slower…..
KEMENTERIAN PPN/ BAPPENAS
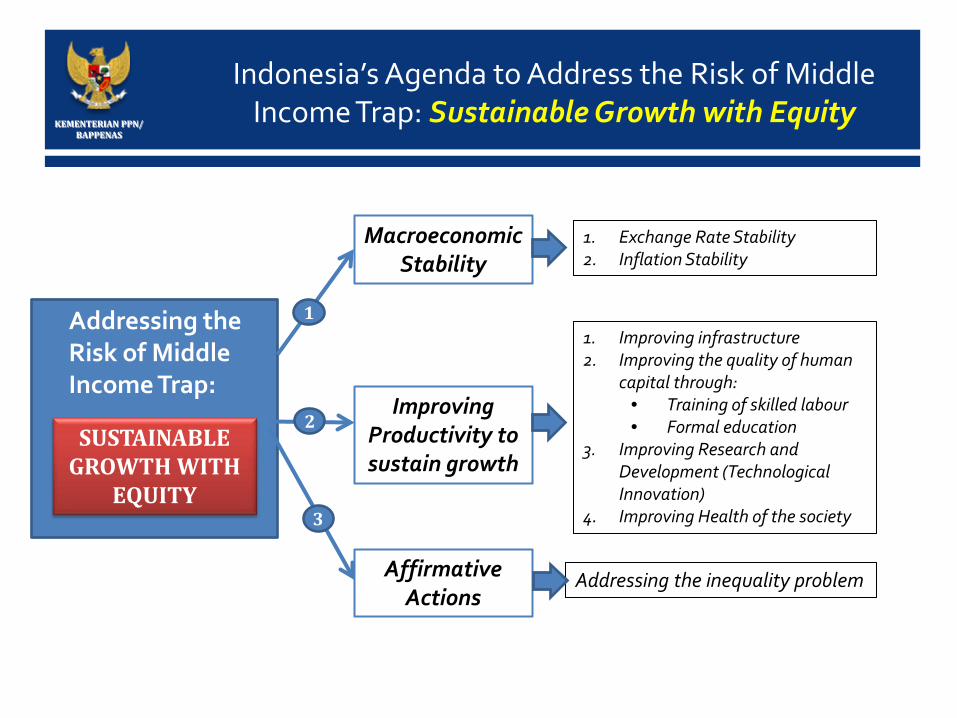
Indonesia’s Agenda to Address the Risk of Middle Income Trap: Sustainable Growth with Equity
Addressing the Risk of Middle Income Trap:
SUSTAINABLE GROWTH WITH
EQUITY
Addressing the inequality problem
Macroeconomic Stability
1. Improving infrastructure 2. Improving the quality of human
capital through: • Training of skilled labour • Formal education
3. Improving Research and Development (Technological Innovation)
4. Improving Health of the society
Improving Productivity to sustain growth
Affirmative Actions
1
2
3
1. Exchange Rate Stability 2. Inflation Stability
KEMENTERIAN PPN/ BAPPENAS
Macroeconomic Stability
KEMENTERIAN PPN/ BAPPENAS
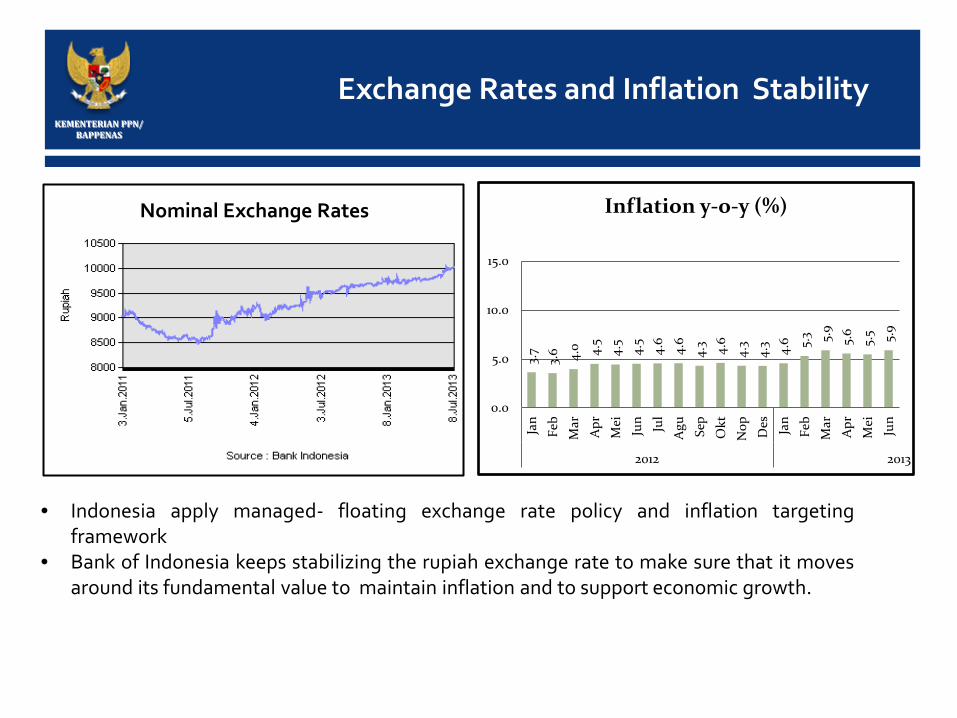
Exchange Rates and Inflation Stability
• Indonesia apply managed- floating exchange rate policy and inflation targeting framework
• Bank of Indonesia keeps stabilizing the rupiah exchange rate to make sure that it moves around its fundamental value to maintain inflation and to support economic growth.
Inflation Rates
3.7
3.6 4.0 4.5
4.5
4.5
4.6
4.6
4.3 4.6
4.3
4.3 4.6 5.3 5.9
5.6
5.5 5.9
0.0
5.0
10.0
15.0
Jan
Feb
Mar
Apr
Mei
Jun Jul
Agu Se
pO
ktN
op Des Jan
Feb
Mar
Apr
Mei
Jun
2012 2013
Inflation y-o-y (%)
Nominal Exchange Rates
KEMENTERIAN PPN/ BAPPENAS
MP3KI: Masterplan of Acceleration and
Expansion of Poverty Alleviation
KEMENTERIAN PPN/ BAPPENAS
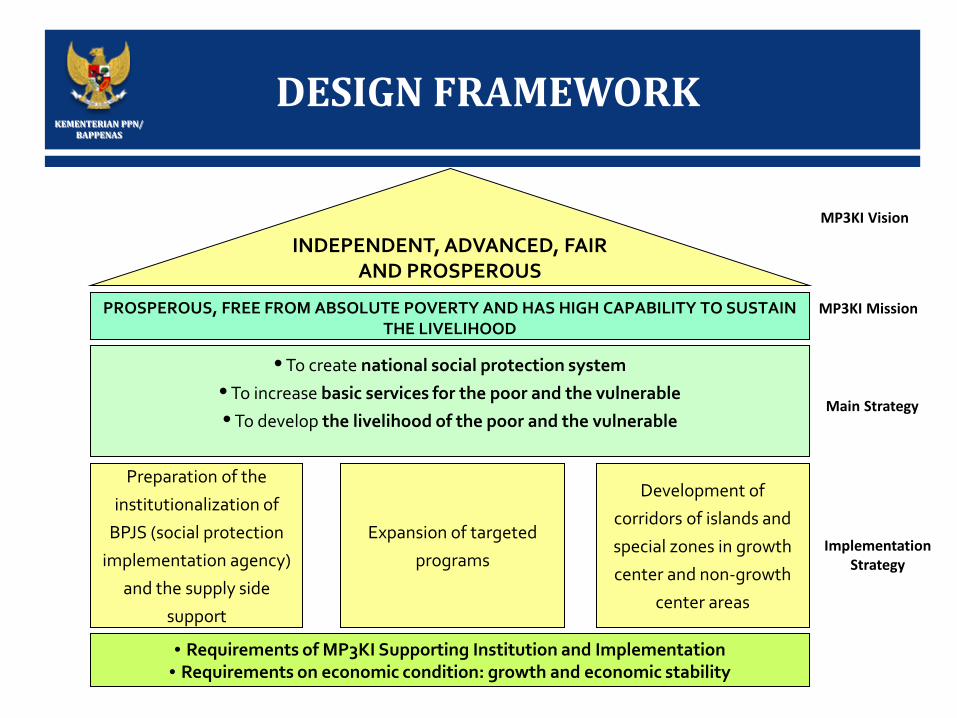
DESIGN FRAMEWORK
PROSPEROUS, FREE FROM ABSOLUTE POVERTY AND HAS HIGH CAPABILITY TO SUSTAIN THE LIVELIHOOD
• To create national social protection system
• To increase basic services for the poor and the vulnerable
• To develop the livelihood of the poor and the vulnerable
Preparation of the
institutionalization of
BPJS (social protection
implementation agency)
and the supply side
support
Expansion of targeted
programs
Development of
corridors of islands and
special zones in growth
center and non-growth
center areas
• Requirements of MP3KI Supporting Institution and Implementation • Requirements on economic condition: growth and economic stability
INDEPENDENT, ADVANCED, FAIR AND PROSPEROUS
MP3KI Vision
Main Strategy
Implementation Strategy
MP3KI Mission
KEMENTERIAN PPN/ BAPPENAS
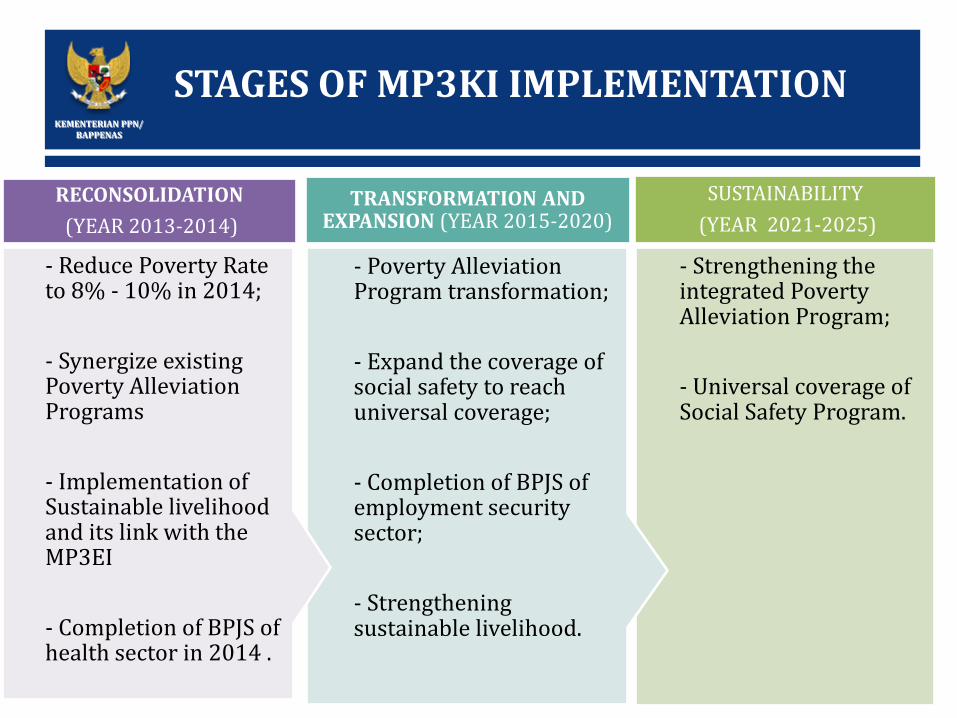
- Strengthening the integrated Poverty Alleviation Program; - Universal coverage of Social Safety Program.
SUSTAINABILITY (YEAR 2021-2025)
- Poverty Alleviation Program transformation; - Expand the coverage of social safety to reach universal coverage; - Completion of BPJS of employment security sector; - Strengthening sustainable livelihood.
TRANSFORMATION AND EXPANSION (YEAR 2015-2020)
- Reduce Poverty Rate to 8% - 10% in 2014; - Synergize existing Poverty Alleviation Programs - Implementation of Sustainable livelihood and its link with the MP3EI - Completion of BPJS of health sector in 2014 .
RECONSOLIDATION (YEAR 2013-2014)
STAGES OF MP3KI IMPLEMENTATION
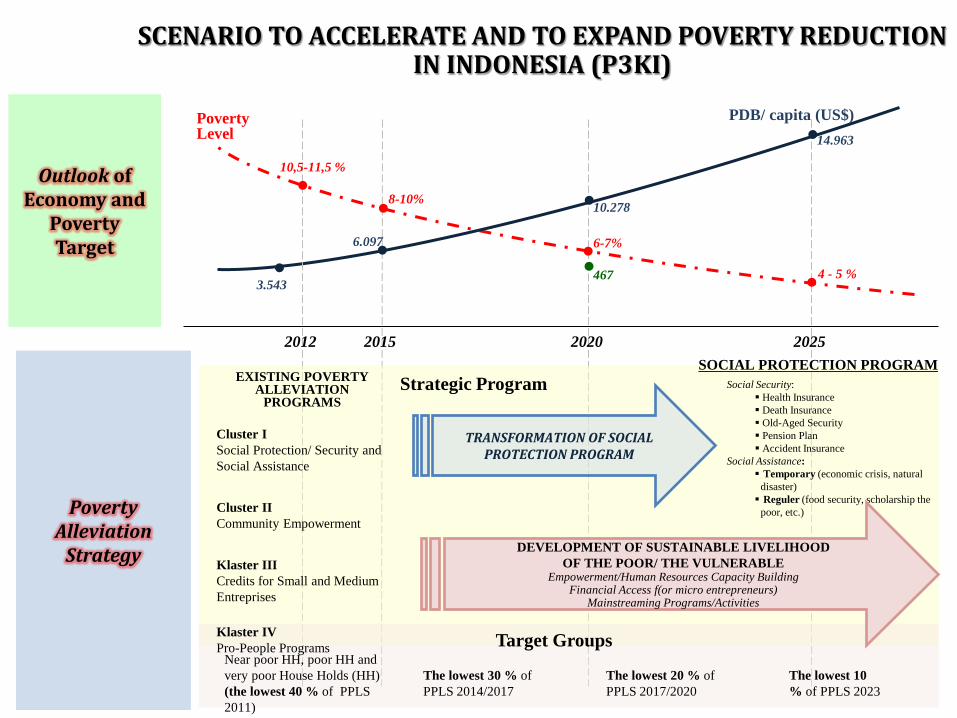
SCENARIO TO ACCELERATE AND TO EXPAND POVERTY REDUCTION IN INDONESIA (P3KI)
Outlook of Economy and
Poverty Target
Poverty Alleviation
Strategy
2012 2015 2020 2025
PDB/ capita (US$) Poverty Level
3.543
6.097
10.278
14.963
10,5-11,5 %
8-10%
6-7%
4 - 5 %
Strategic Program
Target Groups
Near poor HH, poor HH and very poor House Holds (HH) (the lowest 40 % of PPLS 2011)
The lowest 30 % of PPLS 2014/2017
The lowest 20 % of PPLS 2017/2020
The lowest 10 % of PPLS 2023
EXISTING POVERTY ALLEVIATION
PROGRAMS Cluster I Social Protection/ Security and Social Assistance Cluster II Community Empowerment Klaster III Credits for Small and Medium Entreprises
Klaster IV Pro-People Programs
SOCIAL PROTECTION PROGRAM
Social Security: Health Insurance Death Insurance Old-Aged Security Pension Plan Accident Insurance
Social Assistance: Temporary (economic crisis, natural
disaster) Reguler (food security, scholarship the
poor, etc.)
TRANSFORMATION OF SOCIAL PROTECTION PROGRAM
467
DEVELOPMENT OF SUSTAINABLE LIVELIHOOD OF THE POOR/ THE VULNERABLE
Empowerment/Human Resources Capacity Building Financial Access f(or micro entrepreneurs)
Mainstreaming Programs/Activities
KEMENTERIAN PPN/ BAPPENAS
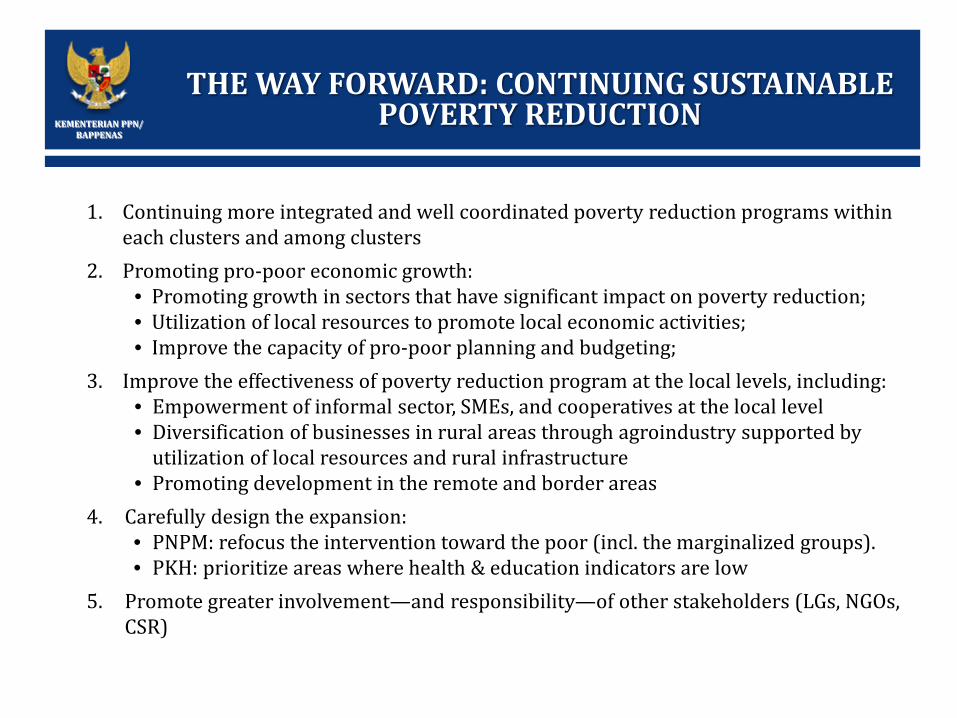
THE WAY FORWARD: CONTINUING SUSTAINABLE POVERTY REDUCTION
1. Continuing more integrated and well coordinated poverty reduction programs within each clusters and among clusters
2. Promoting pro-poor economic growth: • Promoting growth in sectors that have significant impact on poverty reduction; • Utilization of local resources to promote local economic activities; • Improve the capacity of pro-poor planning and budgeting;
3. Improve the effectiveness of poverty reduction program at the local levels, including: • Empowerment of informal sector, SMEs, and cooperatives at the local level • Diversification of businesses in rural areas through agroindustry supported by
utilization of local resources and rural infrastructure • Promoting development in the remote and border areas
4. Carefully design the expansion: • PNPM: refocus the intervention toward the poor (incl. the marginalized groups). • PKH: prioritize areas where health & education indicators are low
5. Promote greater involvement—and responsibility—of other stakeholders (LGs, NGOs, CSR)
KEMENTERIAN PPN/ BAPPENAS
MP3EI: Masterplan of Acceleration and Expansion of
Indonesian Economic Growth
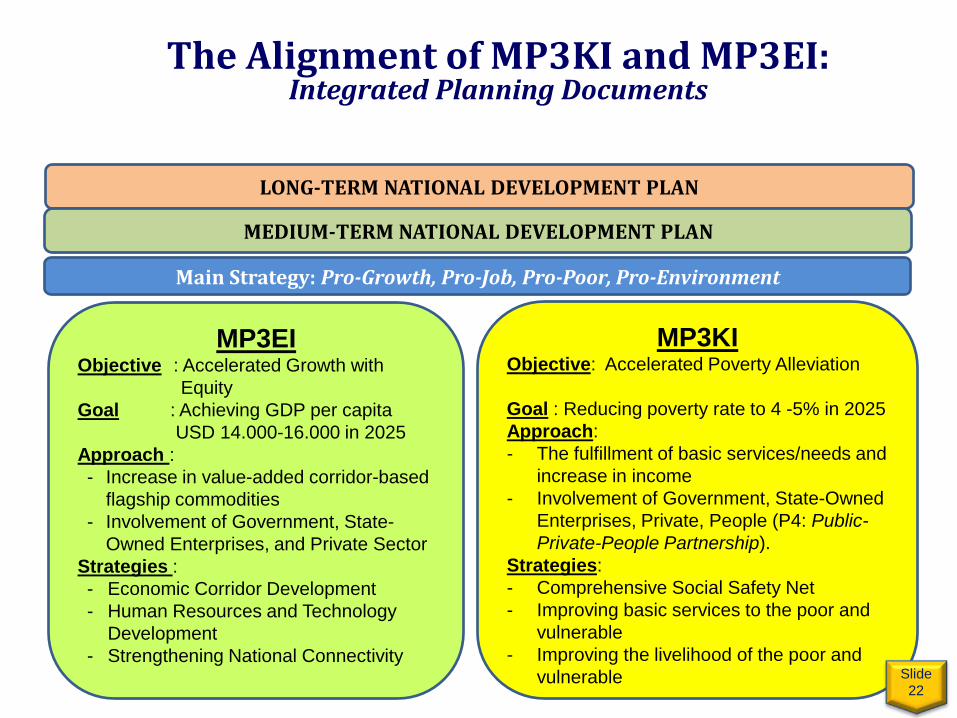
MP3EI Objective : Accelerated Growth with Equity Goal : Achieving GDP per capita USD 14.000-16.000 in 2025 Approach : - Increase in value-added corridor-based
flagship commodities - Involvement of Government, State-
Owned Enterprises, and Private Sector Strategies : - Economic Corridor Development - Human Resources and Technology
Development - Strengthening National Connectivity
MP3KI Objective: Accelerated Poverty Alleviation Goal : Reducing poverty rate to 4 -5% in 2025 Approach: - The fulfillment of basic services/needs and
increase in income - Involvement of Government, State-Owned
Enterprises, Private, People (P4: Public-Private-People Partnership).
Strategies: - Comprehensive Social Safety Net - Improving basic services to the poor and
vulnerable - Improving the livelihood of the poor and
vulnerable
LONG-TERM NATIONAL DEVELOPMENT PLAN
Main Strategy: Pro-Growth, Pro-Job, Pro-Poor, Pro-Environment
MEDIUM-TERM NATIONAL DEVELOPMENT PLAN
The Alignment of MP3KI and MP3EI: Integrated Planning Documents
Slide 22
KEMENTERIAN PPN/ BAPPENAS
Framework Design Of Mp3ei
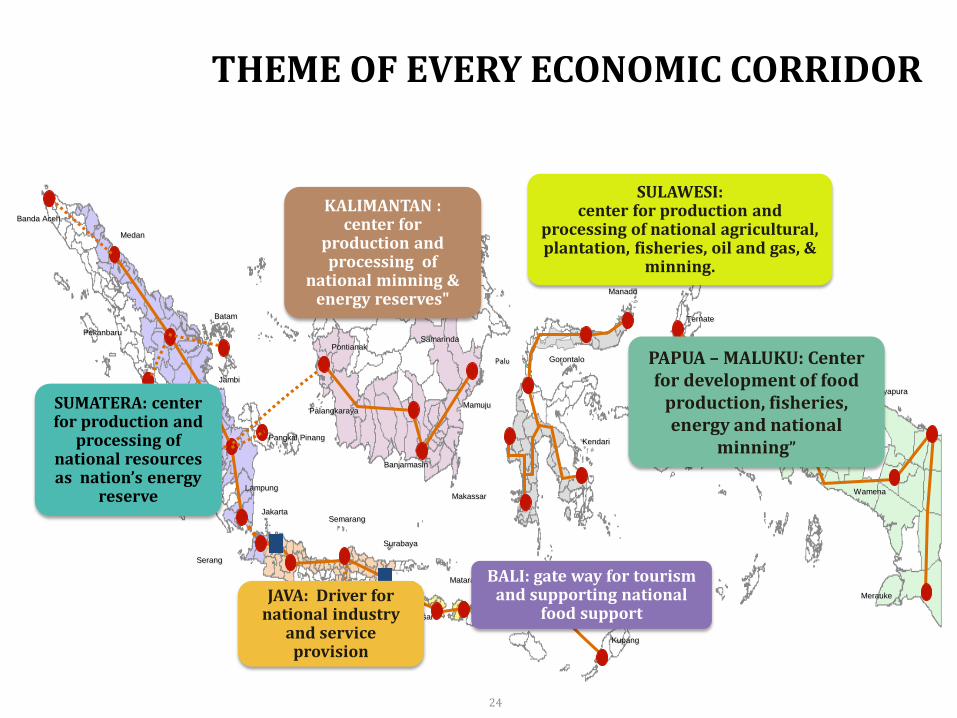
THEME OF EVERY ECONOMIC CORRIDOR
Denpasar
Mataram
Jakarta
Medan
Pekanbaru
Jambi
Lampung
Semarang
Banjarmasin
Palangkaraya
Pontianak
Makassar
Manado
Kendari
Gorontalo
Manokwari
Jayapura
Serang
Mamuju
Surabaya
Merauke
Kupang
Samarinda
Ternate
Wamena
Sorong
Ambon
Palu
Padang
Palembang
Bengkulu
Jogjakarta
Banda Aceh
Pangkal Pinang
Batam
KALIMANTAN : center for
production and processing of
national minning & energy reserves"
SUMATERA: center for production and
processing of national resources as nation’s energy
reserve
JAVA: Driver for national industry
and service provision
BALI: gate way for tourism and supporting national
food support
PAPUA – MALUKU: Center for development of food
production, fisheries, energy and national
minning”
SULAWESI: center for production and
processing of national agricultural, plantation, fisheries, oil and gas, &
minning.
24
KEMENTERIAN PPN/ BAPPENAS
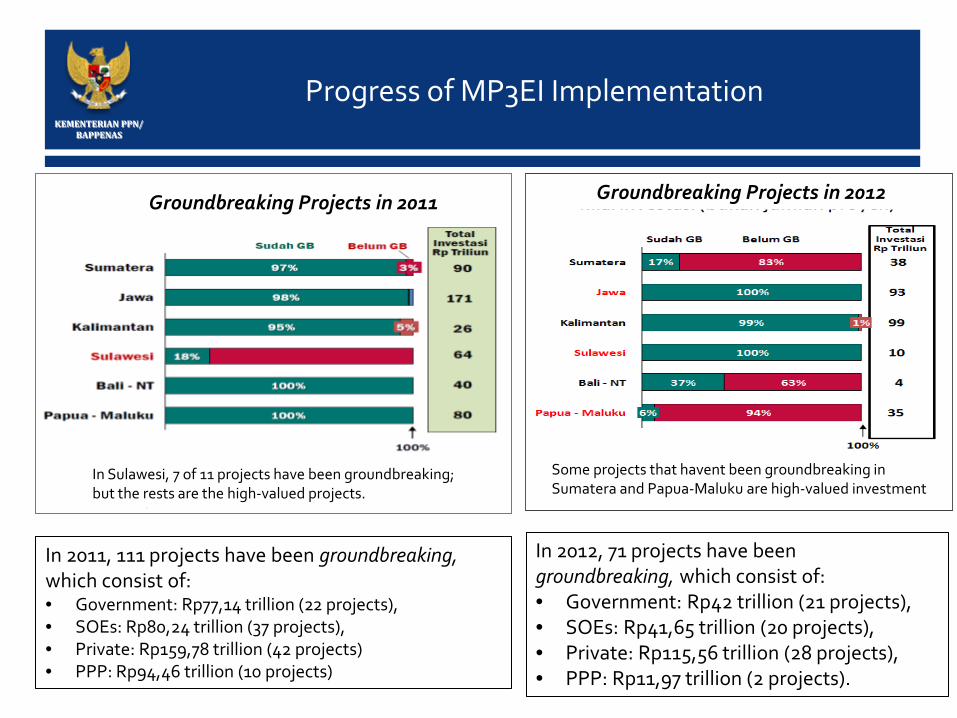
Progress of MP3EI Implementation
Groundbreaking Projects in 2011
In 2011, 111 projects have been groundbreaking, which consist of: • Government: Rp77,14 trillion (22 projects), • SOEs: Rp80,24 trillion (37 projects), • Private: Rp159,78 trillion (42 projects) • PPP: Rp94,46 trillion (10 projects)
Groundbreaking Projects in 2012
In Sulawesi, 7 of 11 projects have been groundbreaking; but the rests are the high-valued projects.
Some projects that havent been groundbreaking in Sumatera and Papua-Maluku are high-valued investment
In 2012, 71 projects have been groundbreaking, which consist of: • Government: Rp42 trillion (21 projects), • SOEs: Rp41,65 trillion (20 projects), • Private: Rp115,56 trillion (28 projects), • PPP: Rp11,97 trillion (2 projects).
KEMENTERIAN PPN/ BAPPENAS
Financial Inclusion
KEMENTERIAN PPN/ BAPPENAS
27
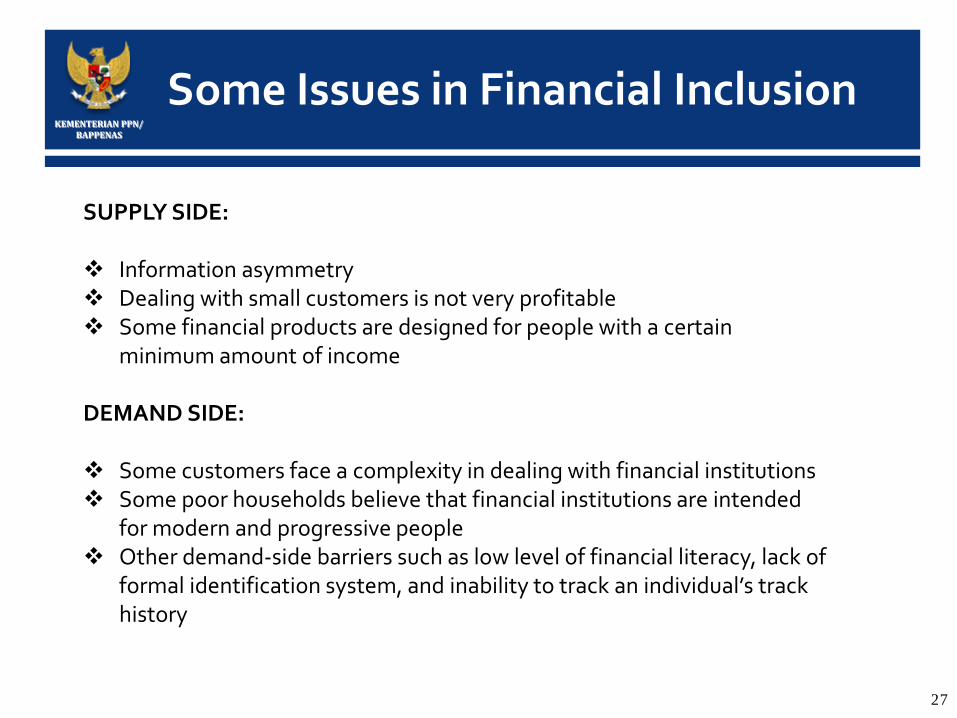
SUPPLY SIDE: Information asymmetry Dealing with small customers is not very profitable Some financial products are designed for people with a certain
minimum amount of income DEMAND SIDE: Some customers face a complexity in dealing with financial institutions Some poor households believe that financial institutions are intended
for modern and progressive people Other demand-side barriers such as low level of financial literacy, lack of
formal identification system, and inability to track an individual’s track history
Some Issues in Financial Inclusion
KEMENTERIAN PPN/ BAPPENAS
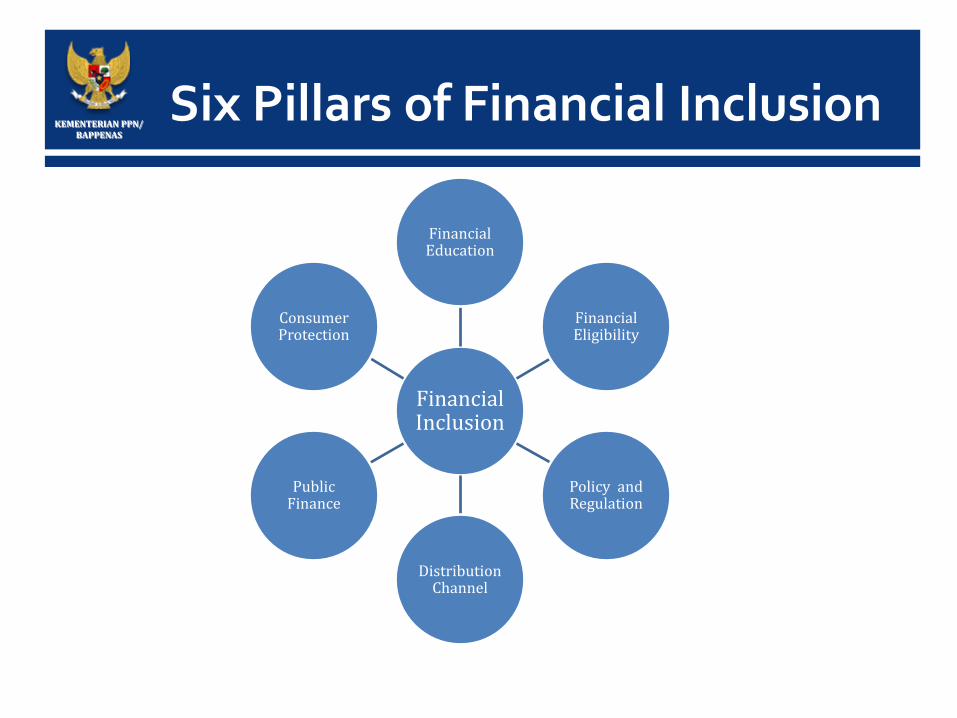
Financial Inclusion
Financial Education
Financial Eligibility
Policy and Regulation
Distribution Channel
Public Finance
Consumer Protection
Six Pillars of Financial Inclusion
KEMENTERIAN PPN/ BAPPENAS
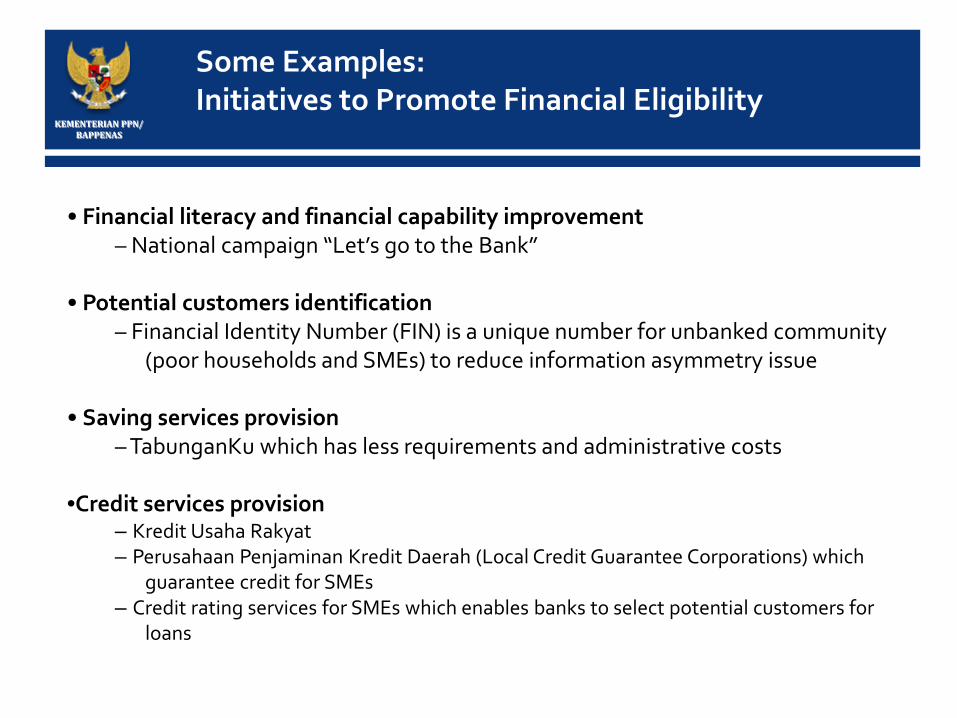
• Financial literacy and financial capability improvement
– National campaign “Let’s go to the Bank”
• Potential customers identification – Financial Identity Number (FIN) is a unique number for unbanked community
(poor households and SMEs) to reduce information asymmetry issue
• Saving services provision – TabunganKu which has less requirements and administrative costs
•Credit services provision – Kredit Usaha Rakyat – Perusahaan Penjaminan Kredit Daerah (Local Credit Guarantee Corporations) which
guarantee credit for SMEs – Credit rating services for SMEs which enables banks to select potential customers for
loans
Some Examples: Initiatives to Promote Financial Eligibility
KEMENTERIAN PPN/ BAPPENAS
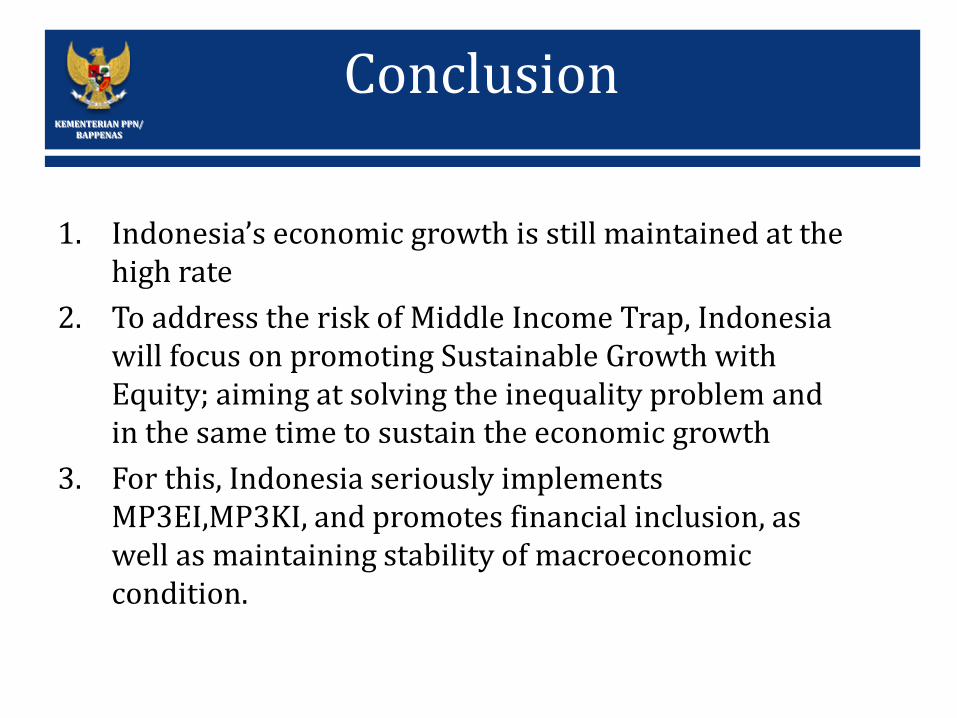
Conclusion
1. Indonesia’s economic growth is still maintained at the high rate
2. To address the risk of Middle Income Trap, Indonesia will focus on promoting Sustainable Growth with Equity; aiming at solving the inequality problem and in the same time to sustain the economic growth
3. For this, Indonesia seriously implements MP3EI,MP3KI, and promotes financial inclusion, as well as maintaining stability of macroeconomic condition.
KEMENTERIAN PPN/ BAPPENAS
THANK YOU
KEMENTERIAN PPN/ BAPPENAS
ATTACHMENT
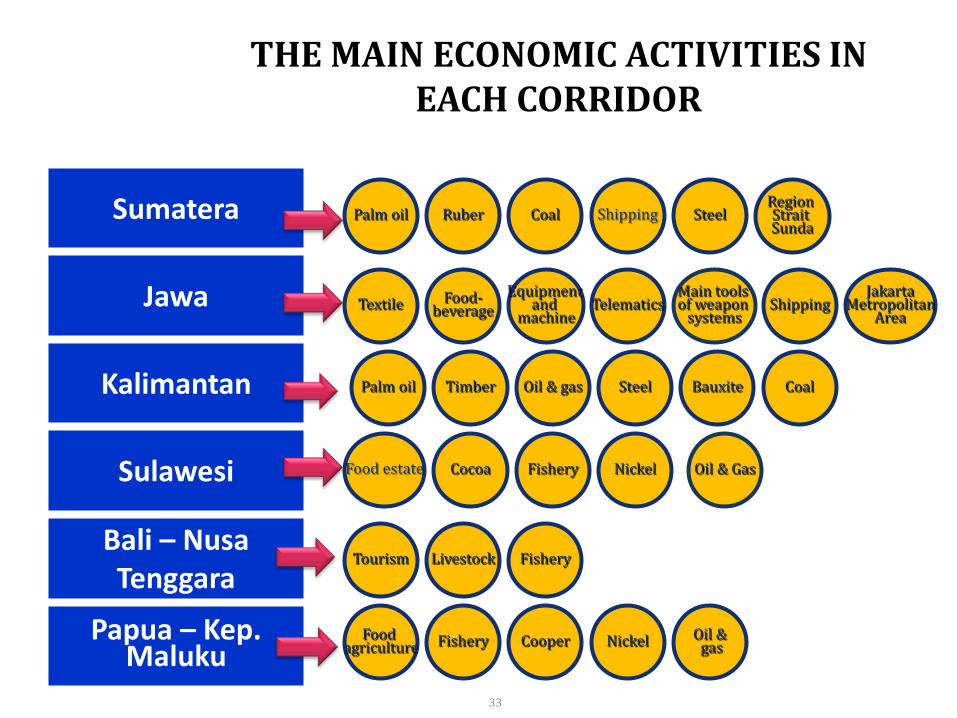
THE MAIN ECONOMIC ACTIVITIES IN EACH CORRIDOR
Sumatera
Jawa
Kalimantan
Sulawesi
Bali – Nusa Tenggara
Papua – Kep. Maluku
Palm oil Ruber
Coal
Shipping Steel Region Strait Sunda
Textile Food- beverage
Equipment and
machine Telematics
Main tools of weapon
systems Shipping
Jakarta Metropolitan
Area
Palm oil Timber Oil & gas Steel Bauxite
Coal
Food estate Cocoa Fishery Nickel Oil & Gas
Tourism Livestock Fishery
Food agriculture Fishery Cooper Nickel Oil &
gas
33
KEMENTERIAN PPN/ BAPPENAS
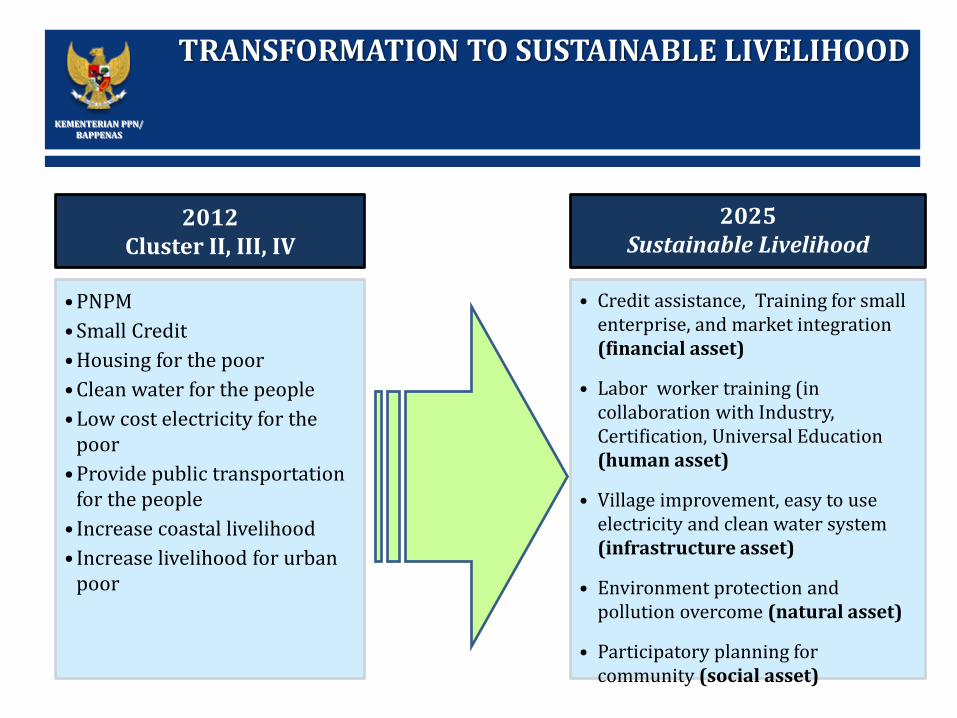
TRANSFORMATION TO SUSTAINABLE LIVELIHOOD
2012
Cluster II, III, IV
•PNPM •Small Credit •Housing for the poor •Clean water for the people •Low cost electricity for the
poor •Provide public transportation
for the people • Increase coastal livelihood • Increase livelihood for urban
poor
2025
Sustainable Livelihood
• Credit assistance, Training for small enterprise, and market integration (financial asset)
• Labor worker training (in collaboration with Industry, Certification, Universal Education (human asset)
• Village improvement, easy to use electricity and clean water system (infrastructure asset)
• Environment protection and pollution overcome (natural asset)
• Participatory planning for community (social asset)
Related Documents