1 ODS EXCEL Tips and Tricks for PROC TABULATE Richard A. DeVenezia, Johnson & Johnson Abstract You might scream in pain or cry with joy that SAS software can directly produce output as Excel workbooks in .xlsx format. Excel is an excellent vehicle for delivering large amounts of summary information that needs to be partitioned for human review, exploratory filtering and sorting. ODS EXCEL as a production destination means there is dedicated SAS support for it. This paper will discuss using ODS EXCEL and PROC TABULATE in the domain of summarizing cross-sectional data extracted from a medical claims database. The discussion will cover data preparation, report preparation and tabulation statements such as CLASS, CLASSLEV and TABLE. The effects of STYLE options and the TAGATTR sub-option for inserting Excel specific features such as formulas, formats and alignment will be covered in detail. A short discussion of reusing these concepts in PROC REPORT statements such as DEFINE, COMPUTE and CALL DEFINE will also be covered. Sample domain Observational epidemiologic studies based on claims data require many criteria and rules for identifying a cohort, detailing medical conditions, measurements and outcomes. An investigator and programmer work together to create an analytic data set for modeling and reporting. Data preparation Consider a study about colorectal surgeries based on medical claims data. A set of ICD procedure codes are used to select patients having an index event. Data elements such as gender, age, age group, marital status, geographic region, insurance enrollment, surgery or treatment classification, admittance type, provider type, hospital type, length of stay, costs at index are gathered together. A variety of indicator variables for items such as previous surgeries, diagnoses and the same as outcomes post index are computed. The indicators themselves are organized into groups or sets of indicators. Some of the variables are used to perform attrition to reach a study cohort. The resultant data set is called the analytic file and has one row per patient. Tip In the sample code the analytic file is a data set named SGF17. ODS EXCEL statement The default syntax is truly simple ODS EXCEL FILE="filename.xlsx"; Repeated submissions Developing a complex tabulation and exploring the effects of TABULATE syntax is an iterative process requiring repeated submissions of SAS code. A common situation is when you are adapting existing

Welcome message from author
This document is posted to help you gain knowledge. Please leave a comment to let me know what you think about it! Share it to your friends and learn new things together.
Transcript

1
ODS EXCEL Tips and Tricks for PROC TABULATE
Richard A. DeVenezia, Johnson & Johnson
Abstract You might scream in pain or cry with joy that SAS software can directly produce output as Excel
workbooks in .xlsx format. Excel is an excellent vehicle for delivering large amounts of summary
information that needs to be partitioned for human review, exploratory filtering and sorting. ODS
EXCEL as a production destination means there is dedicated SAS support for it. This paper will discuss
using ODS EXCEL and PROC TABULATE in the domain of summarizing cross-sectional data
extracted from a medical claims database. The discussion will cover data preparation, report preparation
and tabulation statements such as CLASS, CLASSLEV and TABLE. The effects of STYLE options and
the TAGATTR sub-option for inserting Excel specific features such as formulas, formats and alignment
will be covered in detail. A short discussion of reusing these concepts in PROC REPORT statements
such as DEFINE, COMPUTE and CALL DEFINE will also be covered.
Sample domain Observational epidemiologic studies based on claims data require many criteria and rules for identifying
a cohort, detailing medical conditions, measurements and outcomes. An investigator and programmer
work together to create an analytic data set for modeling and reporting.
Data preparation Consider a study about colorectal surgeries based on medical claims data. A set of ICD procedure codes
are used to select patients having an index event. Data elements such as gender, age, age group, marital
status, geographic region, insurance enrollment, surgery or treatment classification, admittance type,
provider type, hospital type, length of stay, costs at index are gathered together. A variety of indicator
variables for items such as previous surgeries, diagnoses and the same as outcomes post index are
computed. The indicators themselves are organized into groups or sets of indicators. Some of the
variables are used to perform attrition to reach a study cohort. The resultant data set is called the
analytic file and has one row per patient. Tip
In the sample code the analytic file is a data set named SGF17.
ODS EXCEL statement The default syntax is truly simple
ODS EXCEL FILE="filename.xlsx";
Repeated submissions
Developing a complex tabulation and exploring the effects of TABULATE syntax is an iterative process
requiring repeated submissions of SAS code. A common situation is when you are adapting existing

2
code to new data, another is tweaking fonts and colors to get the right look. If you leave the file open in
Excel, then the next iteration will show an error in the log: ERROR: File is in use
You will close the workbook or change your SAS code in order to continue. Tip
While developing use a macro to generate a different filename for each submission.
%macro NextFilename(basename);
%global nextfile;
%let nextfile = "%sysfunc(pathname(WORK))\&basename (%sysfunc(DATE(),yymmdd10.))
#%sysfunc(monotonic()).xlsx";
&nextfile
%mend;
ODS EXCEL FILE=%NextFilename(StudyDataReview);
…
ODS EXCEL CLOSE; %sysexec start "review" scalc -nologo &nextfile;
Tip
While developing a program, you will select small sections of code (a snippet) and submit the selected text.
Occasionally you will submit the entire program by accident; either because you forgot to select a snippet, or mishit a
key that deselected your snippet. Add the following snippet as the first lines to prevent running the entire program.
data _null_; %*remove or comment out this snippet when program goes production or is complete;
abort cancel;
run;
Variable roles
Categorical
The variable takes on one value from a set of values, also known as level-values. Nested categorical
variables create a hierarchy. Tip
Categorical variables are listed in a CLASS statement to make them available to a TABLE statement. The same
variables are listed in CLASSLEV statements when you need to specify how the values are styled.
Examples: Procedure classification - study specific surgery type (Sigmoidectomy or Left
Hemicolectomy) and approach (Open or Laparoscopic), age groups, marital status, geographic region
(census region for Medicare based data, or state / province for different or international health data
source), hospital type, ethnicity, HbA1c and Glucose
Partitioning
I use the term partitioning when referring to categorical variables that will be used to define the
tabulation columns. In health study data sets the variables will correspond to a procedure or treatment.
In some studies, there will be partitions for year (temporal) or region (geo).
Distribution
Categorical variables that appear as rows show the distribution of their level-values within the partitions.
The most useful values displayed are COLPCTN (percentage within the partition) and N (raw counts)
The COLPCTN are useful for comparing the prevalence of a level-value between the different

3
partitions. The N value informs the reader on the absolute size of a partition and its relative size to the
other partitions. Tip
The CLASSDATA= option is used when you need to report the level-values in a collectively exhaustive manner. This
means some of the level-values can show 0 for N or COLPCTN.
Tip
FORMATS are used to reduce the number of level-values shown. Normal formats are 1:1 or N:1 mappings.
Tip Advanced
Multilabel FORMATS are used to show level-values that can overlap. MLF formats are 1:N mappings.
Exploding a category
An investigator may require the programmer create one binary flag variable per level-value. The new
variables would be used in modeling. I call this a mini-transpose. The flags are mutually exclusive. If
the flags combine level-values as subsets that overlap the mutual exclusion is lost. For example:
id ctgry1 ctgry2
⇒
id ctgry1 ctgry2 ctgry1_A ctgry1_B ctgry1_C ctgry1_D ctgry1_E
1 A X 1 A X 1 0 0 0 0
2 B X 2 B X 0 1 0 0 0
3 A Y 3 A Y 1 0 0 0 0
4 C Z 4 C Z 0 0 1 0 0
Mutually Exclusive And Collectively
Exhaustive
Binary (0/1 Flags)
The variable records the yes/no, true/false, or assertion state of a concept. Programmers may choose a
naming convention that indicates the binary-ness of the variable. The best practice is to choose a
convention and be consistent throughout the study. Some conventions you might consider or encounter:
● prefixes such as is_, has_, was_ or flag_
● suffixes such as _flag, _yn or _tf
Conditions
Comorbidity flags - Elixhauser, Charlson, Functional
Procedure flags - Procedure Px1..Pxn occurring apriori
Diagnosis flags - Diagnosis Dx1..Dxn occurring apriori
Medication flags - Prescription drug class Rx1..Rxn occurring apriori
The investigator will also collaborate with the programmer in creating binary variables representing
complex situations. For instance, a variable named MED2OP1_flag could represent the case of the
patient having at least one outpatient visit before their second medication refill. Tip
Binary variables are listed in a VAR statement. There are some cases when a binary variable is used in a categorical
way. The MEAN of a binary variable in a VAR context, is the same as the COLPCTN of the ‘1’ level of the same
variable in a CLASS context. In both cases the value is n/N.
A single variable cannot appear in both a VAR and CLASS statement. To use a variable as both VAR and CLASS you
need to create a copy of the variable in the data set.
Continuous
Cost, Lab result, Surgery time, Length of Stay

4
Tip
Continuous variables are listed in a VAR statement. The statistics N, MEAN, and STD are most commonly reported.
The next most common are MIN, MAX and MODE.
Outcomes
Information for outcomes post-index are encoded in variables for follow-up procedures, diagnoses,
medication discontinuance, readmission, medication or medical supplies costs. The roles of these
variables will be any of categorical, binary and continuous.
Tabulation and Reporting preparation
Computing TOPN by frequency
Consider the case of the primary diagnosis at admission. Every patient has one and the full gamut could
be more than one hundred different values. The investigator, for variable PRIMARY_DX_CODE,
wants to report only the N most frequent and clump all the rest into a single bin. A new variable can be
added to the analytic file for reporting purposes, or a separate tabulate step can reuse the same variable
with a new custom format. This example shows both: Trick
proc sql; * compute and order by descending freq;
create table pdx_freq as
select primary_dx_code as PDX_TOP10, count (*) as freq
from SGF17 group by primary_dx_code order by freq descending;
data cntl_in; * create custom format that refers back to the original format;
set pdx_freq end=end;
fmtname = '$pdx_top10_'; hlo='F'; start = PDX_TOP10; label = vformat(PDX_TOP10);
if _n_ > 10 then do; * count the others;
other_count + 1; if not end then delete;
hlo='O'; label = cats ('Other (', other_count,')');
* format system will use the other mapping for any value that is not in 10 most frequent;
end;
run;
proc format cntlin=cntl_in; run;
data SGF17; set SGF17; pdx_top10 = primary_dx_code; format pdx_top10 $pdx_top10_.; run;
Sample tabulation A series of tabulation code will demonstrate the transition from simple to complex reporting.
Columns
proc tabulate data=SGF17;
class type approach;
table n, type*approach;
label type = 'Surgery';
label approach = 'Technique';
run;
Surgery
Left Hemicolectomy Sigmoidectomy
Technique Technique
Lap Open Lap Open
N 3866 4602 19027 13922
The default for tabulate is to have a cell for the class variable, showing the name or label, above cells
containing the level-values, and then doing the same for each nested level. The investigator chimes in:
Please remove the variable names and have commas for the counts. Tip

5
Use the variable='' specifier in the table statement to remove class cells Use a the *format= specifier to modify how a
value is displayed in a cell.
proc tabulate data=SGF17;
class type approach;
table n*f=comma9., type=''*approach='';
run;
Left Hemicolectomy Sigmoidectomy
Lap Open Lap Open
N 3,866 4,602 19,027 13,922
Can you add total columns for type and approach? Tip
Use the ALL keyword to get a cell (and thus a column or row) corresponding to all the level-values. Parenthetical
grouping helps clarify the level at which a specifier is being applied. class type approach;
table
n*f=comma9.
, (all type='')
* (all approach='')
;
All Left Hemicolectomy Sigmoidectomy
All Lap Open All Lap Open All Lap Open
N 41,417 22,893 18,524 8,468 3,866 4,602 32,949 19,027 13,922
That’s too much ALL. I need only a single ALL column for the N=41,417 Tip
The dimensional expressions in TABULATE are powerful constructs. Small changes in an expression can become big
changes in the table produced.
class type approach;
table
n*f=comma9.
, all type='' * approach='';
All
Left Hemicolectomy Sigmoidectomy
Lap Open Lap Open
N 41,417 3,866 4,602 19,027 13,922
My friend, Sir Counts A Lot, has reports with the N counts in the column headers. Can we do that in our report? Trick
The values shown in the column headers come from class variables. Use SUMMARY to compute by group counts
corresponding to the column header hierarchy. Add those counts as ‘synthetic’ variables to the analytic file.
proc summary data=SGF17 chartype; * This could be macroized as %MakeHeaderCount(data=, by=);
class type approach;
types () ()*(type) ()*(type)*(approach);
output out=ways;
run;
proc sql;
create table SGF17_v2 as select SGF17.*
, cats("(n=",put(level0._freq_, comma9.),")") as level0_label
, cats("(n=",put(level1._freq_, comma9.),")") as level1_label
, cats("(n=",put(level2._freq_, comma9.),")") as level2_label
, level0._freq_ as level0_count
, level1._freq_ as level1_count
, level2._freq_ as level2_count
from SGF17
left join ways as level0 on level0._type_ = '00' and 1=1
left join ways as level1 on level1._type_ = '10' and SGF17.type = level1.type
left join ways as level2 on level2._type_ = '11' and SGF17.type = level2.type and
SGF17.approach=level2.approach
;
quit;
proc tabulate data=SGF17_v2;
class
level0_count
type level1_count approach;
table n*f=comma9.
, all
level0_count=''
* type=''
* level1_count=''
* approach='';
All
(n=41,417)
Left Hemicolectomy Sigmoidectomy
(n=8,468) (n=32,949)
Lap Open Lap Open
N 41,417 3,866 4,602 19,027 13,922

6
run;
Tip
Use a macro to generate the column expression. This is helpful when the expression is complicated and used in several
TABULATE steps. The macro will not contain any semi-colons because it is generating only part of a statement.
%macro columns_TypeApproach; all type='' * approach='' %mend;
%macro columns_TypeApproach_withCounts;
all
level0_count='' * type=''
* level1_count='' * approach=''
%mend;
Rejiggering the order
The default display order for level-values is ascending order of unformatted value. In the case of only
two level-values swapping positions is done by changing to descending order. Tip
For class variables with three or more level-values you can specify the desired ordering in a custom format with the
NOTSORTED option. The CLASS statement must use options PRELOADFMT ORDER=DATA
proc format;
value $OpenLap (NOTSORTED)
'Open' = 'Open'
'Lap' = 'Lap'
;
run;
class level0_count level1_count;
class type / descending;
class approach / preloadfmt order=data;
format approach $OpenLap.;
table n*f=comma9.
, %columns_TypeApproach ;
All
Sigmoidectomy Left Hemicolectomy
Open Lap Open Lap
N 41,417 13,922 19,027 4,602 3,866
Alphabetic jiggering
Trick
In some cases, you may want to retain default ordering and boost a single value to the first or last
position. A quick trick is to modify the data. Prepend the value with a space to boost it to the first
position. Prepend the value with the hard space character ‘A0’x to boost it to the last position.
data letters; * NOTE: data values are being tweaked for boosting purposes when used in TABULATE;
do letter = 'A0'x||'A', 'B', ' C', 'D', 'E', 'F';
output;
end;
run;
proc tabulate data=letters;
class letter;
table n, letter;
run;
letter
C B D E F A
N 1 1 1 1 1 1
The same trick can be used when using a formatted variable. Tip
CLASS categoryVariable / ORDER=FORMATTED

7
Rows These changes will make more space available on the page for focusing on the effects of row
expressions.
The sample code in this section will reduce the columns to be just for Sigmoidectomy and removing the
ALL item. The column expression used will be the one without the synthetic variables level0_count and
level1_count. Also, the Proc TABULATE data=SGF17_v2 is not shown in the sample code. Tip
Another macro is written for column variables. This further reduces the amount of setup code shown in the samples.
%macro colvars_TypeApproach_slim;
class type / descending;
class approach / preloadfmt order=data;
format approach $OpenLap.;
where also type =: 'Sig';
%mend;
%macro columns_TypeApproach_slim;
type='' * approach='' /* no ALL */
%mend;
%colvars_TypeApproach_slim;
table n*f=comma9.
, %columns_TypeApproach_slim
;
Sigmoidectomy
Open Lap
N 13,922 19,027
Categorical variables in the row expression
Let’s take a look at variables age, gender and std_payor. The gender and std_payor variables are coded, such as, M or F and 1, 2, 7, 12, 15. A permanent custom
format transforms the coded value to descriptive text. Tip
TABULATE will log errors if the variable formats cannot be found. Change the system setting OPTIONS
FMTSEARCH=(libname_where_formats_are), or turn off the error trigger OPTIONS NOFMTERR;
proc tabulate data=SGF17_v2;
%colvars_TypeApproach_slim;
class age gender std_payor;
table
(age gender std_payor) * n * f=comma9.
, %columns_TypeApproach_slim
;
run;
Sigmoidectomy
Open Lap
Age
1,486 2,862 18-44 N
45-54 N 2,929 4,832
55-64 N 3,782 5,360
65-74 N 3,406 4,055
75 plus N 2,319 1,918
Gender
7,539 9,863 Female N
Male N 6,383 9,164
Payer
5,798 5,986 Medicare N
Medicaid N 792 736
Commercial N 6,347 11,253
Other N 985 1,052
8
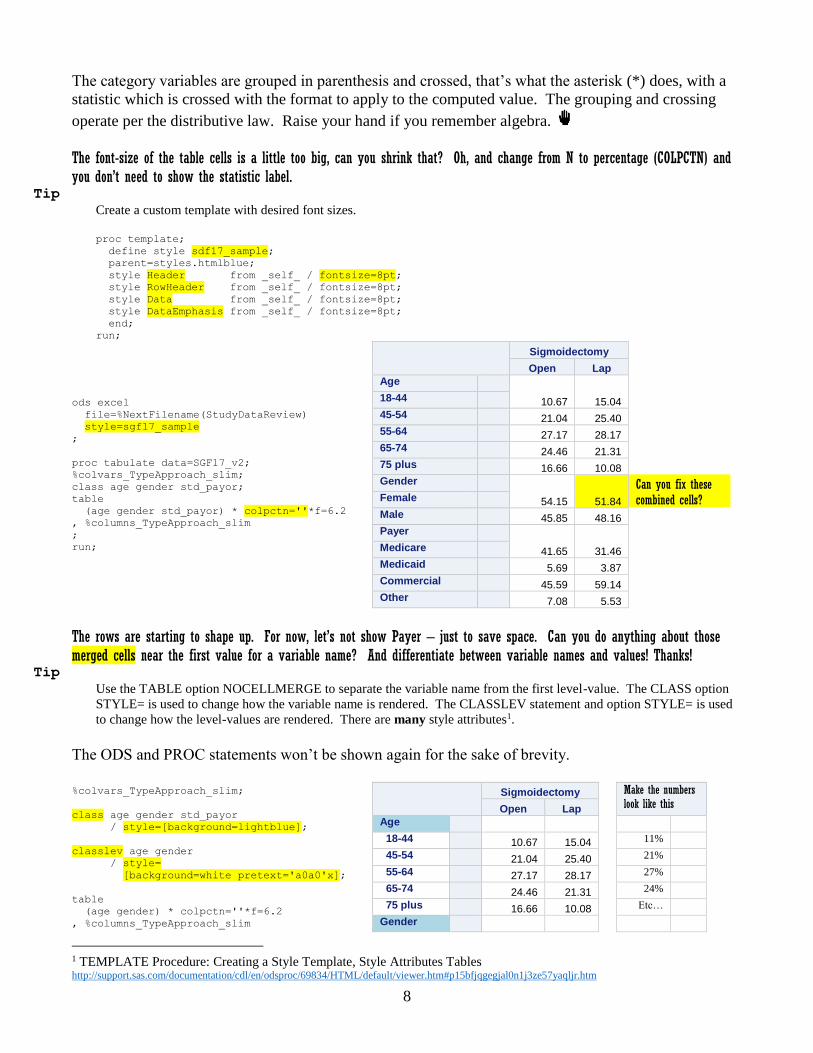
The category variables are grouped in parenthesis and crossed, that’s what the asterisk (*) does, with a
statistic which is crossed with the format to apply to the computed value. The grouping and crossing
operate per the distributive law. Raise your hand if you remember algebra.
The font-size of the table cells is a little too big, can you shrink that? Oh, and change from N to percentage (COLPCTN) and you don’t need to show the statistic label.
Tip
Create a custom template with desired font sizes.
proc template;
define style sdf17_sample;
parent=styles.htmlblue;
style Header from _self_ / fontsize=8pt;
style RowHeader from _self_ / fontsize=8pt;
style Data from _self_ / fontsize=8pt;
style DataEmphasis from _self_ / fontsize=8pt;
end;
run;
ods excel
file=%NextFilename(StudyDataReview)
style=sgf17_sample
;
proc tabulate data=SGF17_v2;
%colvars_TypeApproach_slim;
class age gender std_payor;
table
(age gender std_payor) * colpctn=''*f=6.2
, %columns_TypeApproach_slim
;
run;
Sigmoidectomy
Open Lap
Age
10.67 15.04
18-44
45-54 21.04 25.40
55-64 27.17 28.17
65-74 24.46 21.31
75 plus 16.66 10.08
Gender
54.15 51.84
Can you fix these combined cells? Female
Male 45.85 48.16
Payer
41.65 31.46
Medicare
Medicaid 5.69 3.87
Commercial 45.59 59.14
Other 7.08 5.53
The rows are starting to shape up. For now, let’s not show Payer – just to save space. Can you do anything about those merged cells near the first value for a variable name? And differentiate between variable names and values! Thanks!
Tip
Use the TABLE option NOCELLMERGE to separate the variable name from the first level-value. The CLASS option
STYLE= is used to change how the variable name is rendered. The CLASSLEV statement and option STYLE= is used
to change how the level-values are rendered. There are many style attributes1.
The ODS and PROC statements won’t be shown again for the sake of brevity.
%colvars_TypeApproach_slim;
class age gender std_payor
/ style=[background=lightblue];
classlev age gender
/ style=
[background=white pretext='a0a0'x];
table
(age gender) * colpctn=''*f=6.2
, %columns_TypeApproach_slim
Sigmoidectomy Make the numbers
look like this Open Lap
Age
18-44 10.67 15.04 11%
45-54 21.04 25.40 21%
55-64 27.17 28.17 27%
65-74 24.46 21.31 24%
75 plus 16.66 10.08 Etc…
Gender
1 TEMPLATE Procedure: Creating a Style Template, Style Attributes Tables http://support.sas.com/documentation/cdl/en/odsproc/69834/HTML/default/viewer.htm#p15bfjqgegjal0n1j3ze57yaqljr.htm

9
/ nocellmerge
;
Female 54.15 51.84
Male 45.85 48.16
Those numbers look great, but we must make sure the reader knows they are percentages – and lose the fractions of a percent.
The SAS format PERCENTw.d seems a good possibility -- it outputs a number followed by the % sign. Age
18-44 1067% 1504%
Problem is that the format “multiplies values by 100” before doing so. COLPCTN computes values 0-
100, not 0-1. If only there was a statistic COLFRACTN. Even if there were, the PERCENT formatted
value output by ODS EXCEL destination creates a “Number stored as text.”
What if we use a style attribute to add a percent sign? For example (age gender std_payor) * colpctn=''*f=3.*style=[posttext='%']]
Age
18-44 11% 15%
Looks great, but Excel still sees the cell as a “number stored as text”. What to do, oh what to do.
Tip
Use the style attribute TAGATTR and the native Excel attribute-name format with a custom format as the attribute-
value. Inception-worthy! Tip-tip: The right-hand side of tagattr= is passed through for Excel side processing. The \%,
backslash percent, tells Excel to escape the % and append the % glyph after the cell value. An un-escaped % would be a
formatting directive that tells Excel to multiply the cell value by 100 and append the % glyph.
%colvars_TypeApproach_slim;
class age gender std_payor
/ style=[background=lightblue];
classlev age gender std_payor
/ style=
[background=white pretext='a0a0'x];
table
(age gender)
* colpctn=''*f=9.2
* [s=[tagattr='format:0\%;;-_)']]
, %columns_TypeApproach_slim
/ nocellmerge
;
Sigmoidectomy
Open Lap
Age
18-44 11% 15%
45-54 21% 25%
55-64 27% 28%
65-74 24% 21%
75 plus 17% 10%
Gender
Female 54% 52%
Male 46% 48%
Excel sees the values in the cells as numbers and can become part of native Excel charting and graphing.
Caution
Some Excel compatible programs will see the % in the custom format and multiply by 100 before rendering in their own
viewer. Such behavior has been seen in Box’s Excel document previewer.
One last thing… we see the percentages, but I need to see the counts. Tip
Add the N statistic as parallel row expression. It will allow formatting that is different than other row expressions.
Caution: If N or a VAR variable is present in a column expression, then the column can have only a single format,
regardless of the row expressions. If the same VAR variable is in both a column and a row expression TABULATE will
send warning messages to the log.
%colvars_TypeApproach_slim;
class age gender std_payor /
style=[background=lightblue];
classlev age gender std_payor /
Sigmoidectomy
Open Lap
N 13,922 19,027

10
style=[background=white pretext='a0a0'x];
table
N * f=comma9.
(age gender) * colpctn='' *
f=9.2*[s=[tagattr='format:0\%;;-_)']]
, %columns_TypeApproach_slim
/ nocellmerge
;
Age
18-44 11% 15%
45-54 21% 25%
55-64 27% 28%
65-74 24% 21%
75 plus 17% 10%
Gender
Female 54% 52%
Male 46% 48%
Binary variables in the row expression
Each row will report the prevalence of the variable within the column by the way of the MEAN value.
Each row corresponds to one variable listed in the VAR statement. Tip
Use special variable lists when the data set variables are organized.
Name1 – NameN is a numbered range lists, best known as arrays.
Name1 – numeric – Name2 is a name range list.
Name: is a name prefix list.
_numeric_ is all numeric variables.
The data includes arrays of flag variables for Charlson and Elixhauser comorbidity indices. The first
example code will list only the first each array and have no styles or formats.
%colvars_TypeApproach_slim;
var
poa_cm_cci_01
poa_cm_elx_grp_01
;
table
N
poa_cm_cci_01 * mean
poa_cm_elx_grp_01 * mean
, %columns_TypeApproach_slim
/ nocellmerge;
Sigmoidectomy
Open Lap
N 13922 19027
poa CCI 01 Myocardial Infarction Mean 0.00 0.00
poa Elx. Gr. 01 Congestive Heart Failure Mean 0.04 0.02
Good start, show me the percentages to two decimal places. And make the rows look the same as the categorical variables.
The mean value of a binary variable is the prevalence as a unit fraction. These issues need to be
addressed to make the output look the same as the categorical variables:
Commas
White background, indented
Mean statistic hidden, data values converted to percentages (unit fraction * 100) %
Add the second variable from each array Tip
The Excel custom format 0.00%;;-_) specified via the tagattr style attribute will work wonders here.
Tip-tip

11
The Excel custom format2 alphabet soup is rich and varied. The % is not escaped, so the percent-sign character is a
formatting directive that tells Excel to multiply the cell value by 100 and append the % glyph.
%colvars_TypeApproach_slim;
var
poa_cm_cci_01 - poa_cm_cci_02
poa_cm_elx_grp_01 - poa_cm_elx_grp_02
/ style=[background=white pretext='A0A0'x]; %* white background, indented;
table
N * f=comma12.
poa_cm_cci_01 - poa_cm_cci_02 * mean=''*f=9.4*[s=[tagattr='format:0.00%;;-_)']]
poa_cm_elx_grp_01 - poa_cm_elx_grp_02 * mean=''*f=9.4*[s=[tagattr='format:0.00%;;-_)']]
, %columns_TypeApproach_slim
/ nocellmerge;
Sigmoidectomy
Open Lap
N 13,922 19,027
poa CCI 01 Myocardial Infarction 0.21% 0.12%
poa CCI 02 Congestive Heart Failure 3.71% 1.88%
poa Elx. Gr. 01 Congestive Heart Failure 3.71% 1.88%
poa Elx. Gr. 02 Cardiac Arrhythmia 7.43% 4.88%
Great, the look is improving. We need a labeling row above each group of variables.
Trick
Use a dummy variable to create a separator row. The data set has a variable named “separator” which has a missing
value in every row.
%macro binvarFormat;/* macro for complex tabulation expression that is used repeatedly */
mean=''*f=9.4*[s=[tagattr='format:0.00%;;-_)']]
%mend;
%colvars_TypeApproach_slim;
var poa_cm_cci_01 - poa_cm_cci_02
poa_cm_elx_grp_01 - poa_cm_elx_grp_02 / style=[background=white pretext='A0A0'x];
var separator;
table
N * f=comma12.
separator poa_cm_cci_01 - poa_cm_cci_02 * %binvarFormat
separator poa_cm_elx_grp_01 - poa_cm_elx_grp_02 * %binVarFormat
, %columns_TypeApproach_slim / nocellmerge;
Sigmoidectomy
Open Lap
N 13,922 19,027
Separator Sum . .
poa CCI 01 Myocardial Infarction 0.21% 0.12%
poa CCI 02 Congestive Heart Failure 3.71% 1.88%
Separator Sum . .
poa Elx. Gr. 01 Congestive Heart Failure 3.71% 1.88%
poa Elx. Gr. 02 Cardiac Arrhythmia 7.43% 4.88%
I see what you did…, nice! Put some group text on those separators and get rid of the missing value period. Also, the N is lonely off to the left, please right-align it.
Tip
2 Create or delete a custom number format https://support.office.com/en-us/article/Create-or-delete-a-custom-number-format-78f2a361-936b-4c03-8772-09fab54be7f4#bm1

12
Use the TABULATE inline labeling feature varname=”label text”. The actual text shown is variable name if no
variable label, the label from data set if no label statement, the label from the label statement if no inline label and finally
the inline label if it is present.
%colvars_TypeApproach_slim;
var poa_cm_cci_01 - poa_cm_cci_02
poa_cm_elx_grp_01 - poa_cm_elx_grp_02
/ style=[background=white pretext='A0A0'x]; %* white background, indented;
var separator;
options missing=' ';
keyword N / style=[textalign=right];
table
N='N =>' * f=comma12.
separator='Charlson comorbidity indices (showing first 2 of 17)'*sum=''
poa_cm_cci_01 - poa_cm_cci_02 * %binvarFormat
separator='Elixhauser comorbidity indices (showing first 2 of 31)'*sum=''
poa_cm_elx_grp_01 - poa_cm_elx_grp_02 * %binVarFormat
, %columns_TypeApproach_slim / nocellmerge;
Sigmoidectomy
Open Lap
N => 13,922 19,027
Charlson comorbidity indices (showing first 2 of 17)
poa CCI 01 Myocardial Infarction 0.21% 0.12%
poa CCI 02 Congestive Heart Failure 3.71% 1.88%
Elixhauser comorbidity indices (showing first 2 of 17)
poa Elx. Gr. 01 Congestive Heart Failure 3.71% 1.88%
poa Elx. Gr. 02 Cardiac Arrhythmia 7.43% 4.88%
Thanks! All that’s left is the continuous variables. And making separate tabs. And consistent titles. And auto-filtering. And a little bit more.
When there are many variables you will want the top N rows locked from scrolling. N depends on the
number of title statements and the number of rows needed by the column headers. When the
partitioning creates many columns, you will also want to lock the first M columns from scrolling. Tip
Use the ODS OPTIONS option to specify destination specific options.
The FROZEN_HEADERS option is for column headers, freeze one extra row to so that the N statistic is always visible
during scrolling. The FROZEN_ROWHEADERS option is for locking the leftmost columns.
ODS EXCEL FILE="filename.xlsx" …
OPTIONS (
EMBEDDED_TITLES='ON'
FROZEN_HEADERS='6' FROZEN_ROWHEADERS='2'
);
Continuous variables in the row expression
These variables are the easiest in terms of syntax. Remember the distributive law? Statistics grouping
can be crossed after or before variable grouping. Tip
Use the TABLE statement option BOX= to put text in the upper left corner cell.
%colvars_TypeApproach_slim;
var los los_postindex optime_hour;
keyword N / style=[textalign=right];
table
N='N =>' * f=comma12.
(los /*los_postindex*/ optime_hour) * (mean std max)
(mean std max) * (los /*los_postindex*/ optime_hour) /* distribution law at work */

13
, %columns_TypeApproach_slim / nocellmerge box='The distribution law applies to crossed
groups';
The distribution law applies to crossed groups Sigmoidectomy
Open Lap
N => 13,922 19,027
Length of hospital stay Mean 7.11 4.69
Std 5.00 3.27
Max 121.00 79.00
Index surgery time, hour Mean 3.53 3.77
Std 4.53 5.40
Max 161.50 238.00
Mean Length of hospital stay 7.11 4.69
Index surgery time, hour 3.53 3.77
Std Length of hospital stay 5.00 3.27
Index surgery time, hour 4.53 5.40
Max Length of hospital stay 121.00 79.00
Index surgery time, hour 161.50 238.00
The BOX cell can also be styled. Tip
BOX = {
label='Continuous valued metrics'
style=[fontfamily="Courier New" fontsize=14pt background=gray3 color=white]
}
Continuous valued metrics Sigmoidectomy
Open Lap
N => 13,922 19,027
Length of hospital stay Mean 7.11 4.69
Std 5.00 3.27
Max 121.00 79.00
Accounting format
A cost variable will show a $ when the DOLLAR9. format is applied. The dollar sign is directly
adjacent to the value. An accounting format lines up the dollar signs on the left-hand side of the cell. Tip
Use tagattr=”format: to specify the Excel custom format. Tip-tip: The ODS system has an attribute parser that gets
confused when the Excel custom format contains a space. Use a hard space (ASCII character #160) in the custom format
so that SAS will be able to parse the attrtag. A hard space cannot be typed in from the keyboard, however, the function
BYTE (160) does work.
%colvars_TypeApproach_slim; keyword N / style=[textalign=right];
var total_cost;
table
N='N =>' * f=comma12.
total_cost='Total Cost (DOLLAR format)' * (mean std max min) * f=dollar9.
total_cost='Total Cost (Accounting format)' * (mean std max min)
* [s=[tagattr="format:_($*%sysfunc(byte(160))#,##0_)"
]]
, %columns_TypeApproach_slim
/ nocellmerge box='Compare formats: SAS DOLLAR versus Excel Accounting';
Compare formats: SAS DOLLAR versus Excel Accounting
Sigmoidectomy
Open Lap
N => 13,922 19,027

14
Total Cost (DOLLAR format) Mean $17,783 $15,087
Std $20,050 $10,419
Max $1,514,592 $385,931
Min $19 $621
Total Cost (Accounting format) Mean $ 17,783 $ 15,087
Std $ 20,050 $ 10,419
Max $ 1,514,592 $ 385,931
Min $ 19 $ 621
ODS inline functions The ability to highlight a part of text is important. Inline formatting can be done just about anywhere.
Tip
The ODS inline formatting functions can enhance your output. Best practice is to use inline formatting sparingly. The
next sample uses a label statement to color the “hours” green and prepends a hard space. All the moving parts have been
colored to their functional use.
%colvars_TypeApproach_slim;
var los los_postindex optime_hour;
keyword N / style=[textalign=right];
table
N='N =>' * f=comma12. optime_hour*(mean std)
, %columns_TypeApproach_slim / nocellmerge ;
label optime_hour
= "Index surgery time,(*ESC*){style [color=green]%sysfunc(byte(160))Hour}";
Sigmoidectomy
Open Lap
N => 13,922 19,027
Index surgery time, Hour Mean 3.53 3.77
Std 4.53 5.40
Multiline text in cell
An Excel text value that contains the newline character, \n or BYTE(10), will be shown as multiple
lines. Tip
Use the ODS formatting function newline to insert a newline.
table
N='N =>' * f=comma12.
total_cost='Total Cost(*ESC*){newline}(Accounting format)'
* (mean std max min)
* [s=[tagattr="format:_($*%sysfunc(byte(160))#,##0_)"]]
Sigmoidectomy
Open Lap
N => 13,922 19,027
Total Cost (Accounting format)
Mean
$ 17,783 $ 15,087
Std $ 20,050 $ 10,419
Max $ 1,514,592 $ 385,931
Min $ 19 $ 621
The ODS layout engine makes a small mistake here. The Mean row can be the same height as the
others, because the multi-line label is inside a merge of cells that is taller than the label.
15
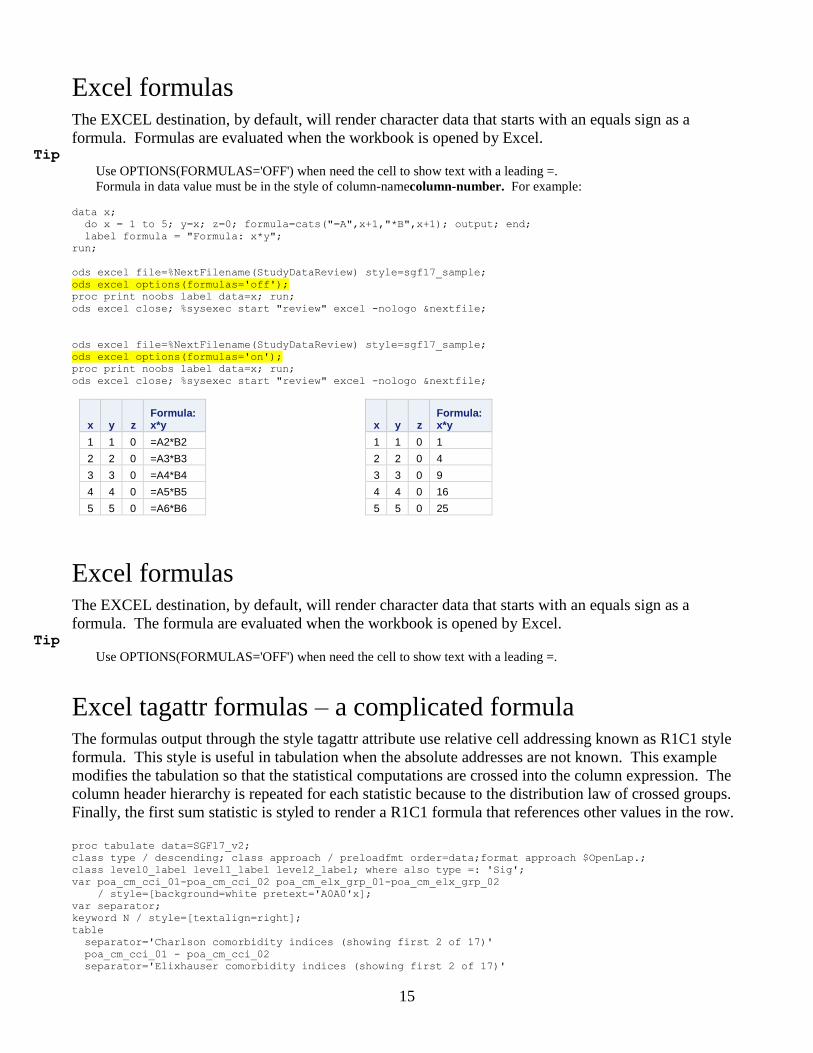
Excel formulas The EXCEL destination, by default, will render character data that starts with an equals sign as a
formula. Formulas are evaluated when the workbook is opened by Excel. Tip
Use OPTIONS(FORMULAS='OFF') when need the cell to show text with a leading =.
Formula in data value must be in the style of column-namecolumn-number. For example:
data x;
do x = 1 to 5; y=x; z=0; formula=cats("=A",x+1,"*B",x+1); output; end;
label formula = "Formula: x*y";
run;
ods excel file=%NextFilename(StudyDataReview) style=sgf17_sample;
ods excel options(formulas='off');
proc print noobs label data=x; run;
ods excel close; %sysexec start "review" excel -nologo &nextfile;
ods excel file=%NextFilename(StudyDataReview) style=sgf17_sample;
ods excel options(formulas='on');
proc print noobs label data=x; run;
ods excel close; %sysexec start "review" excel -nologo &nextfile;
x y z Formula: x*y
1 1 0 =A2*B2
2 2 0 =A3*B3
3 3 0 =A4*B4
4 4 0 =A5*B5
5 5 0 =A6*B6
x y z Formula: x*y
1 1 0 1
2 2 0 4
3 3 0 9
4 4 0 16
5 5 0 25
Excel formulas The EXCEL destination, by default, will render character data that starts with an equals sign as a
formula. The formula are evaluated when the workbook is opened by Excel. Tip
Use OPTIONS(FORMULAS='OFF') when need the cell to show text with a leading =.
Excel tagattr formulas – a complicated formula The formulas output through the style tagattr attribute use relative cell addressing known as R1C1 style
formula. This style is useful in tabulation when the absolute addresses are not known. This example
modifies the tabulation so that the statistical computations are crossed into the column expression. The
column header hierarchy is repeated for each statistic because to the distribution law of crossed groups.
Finally, the first sum statistic is styled to render a R1C1 formula that references other values in the row.
proc tabulate data=SGF17_v2;
class type / descending; class approach / preloadfmt order=data;format approach $OpenLap.;
class level0_label level1_label level2_label; where also type =: 'Sig';
var poa_cm_cci_01-poa_cm_cci_02 poa_cm_elx_grp_01-poa_cm_elx_grp_02
/ style=[background=white pretext='A0A0'x];
var separator;
keyword N / style=[textalign=right];
table
separator='Charlson comorbidity indices (showing first 2 of 17)'
poa_cm_cci_01 - poa_cm_cci_02
separator='Elixhauser comorbidity indices (showing first 2 of 17)'

16
poa_cm_elx_grp_01 - poa_cm_elx_grp_02
,
( sum=' ' * f=9.4
*[s=[tagattr='formula:RC[2]&char(32)&"("&TEXT(RC[4],"0.00%")&")"']]
sum='n'*f=comma9.
mean='%'*f=9.4*[s=[tagattr='format:0.00%;;-_)']]
)
*
( level0_label='' * type='' * level1_label='' * approach='' * level2_label=''
) / nocellmerge;
The tabulation outputs the n and % statistics in separate columns. The formula concatenates those
columns into a single combined value of the construct n (n%N). The & in the formula is an
escape of &, the Excel concatenation operator. The Excel function CHAR(32) is used to put a space
between the values. If there were an actual space character in the same place in the SAS code, the
tagattr formula parsing would be clipped at the space.
Debugging destination output
Formulas and formats injected into the Excel destination via tagattr can cause the workbook to be
unreadable.
Trick
.xlsx files are actually .zip files! Change the filename extension to .zip and you will be able to explore the ooxml
workbook. The most useful files are named xl/worksheets/sheetN.xml. This is where the ‘problems’ occur.
Here is a sample of the destination xml when the formula was not quite right <row r="8" ht="12" customHeight="1">
<c r="A8" s="7" t="s"><v>12</v></c>
<c r="B8" s="8"><f>D8&</f></c>
<c r="C8" s="8"><f>E8&</f></c>
Conversely, you can create a custom format or formula in Excel and then review the xml that Microsoft
wrote. This is how I found out that & was needed in the complicated formula.
ODS TEXT= Sometimes you just need to get a message out. For example: A macro runs a Proc TABULATE and the
data set has no rows. No output is generated. The macro can check for no data and output a message
about missing or empty data sets.
%macro renderComorbidityWorksheet(data=);

17
%if not %sysfunc(exist(&data)) %then %do;
ODS TEXT="WARNING: data=&data is MIA.";
%return;
%end;
%if %nobs(&data) = 0 %then %do;
ODS TEXT="WARNING: data=&data is empty.";
%return;
%end;
/*
PROC TABULATE ...
*/
%mend;
ods excel file=%NextFilename(StudyDataReview) style=sgf17_sample;
%renderComorbidityWorksheet(data=foobar_7);
%renderComorbidityWorksheet(data=foobar_8);
ods excel close;
WARNING: data=foobar_7 is MIA.
WARNING: data=foobar_8 is empty.
Multiple worksheets The EXCEL destination, by default, will create one new worksheet per Proc step. Complete control
over sheet creation is achieve by using the statement
ODS EXCEL OPTION(sheet_interval='none');
Output from multiple Proc steps will remain in the same worksheet until a new sheet name is specified.
ODS EXCEL OPTION(sheet_name='next-sheet-name');
My experience in SAS 9.4M3 is that the sheet_name technique can fail. You can use this macro to
ensures a new worksheet is created when desired.
%macro new_sheet(name=);
ODS EXCEL OPTIONS(SHEET_INTERVAL="TABLE" SHEET_NAME=&NAME);
ODS SELECT NONE; DATA _NULL_; DCL odsout obj(); RUN; ODS SELECT ALL;
ODS EXCEL OPTIONS(SHEET_INTERVAL="NONE" SHEET_NAME=&NAME);
ODS SELECT NONE; DATA _NULL_; DCL odsout obj(); RUN; ODS SELECT ALL;
%mend;
* Sample use pseudo-code;
ODS EXCEL file="file" options(sheet_interval="none") …;
%new_sheet(name="Atttrition details");
Title "Age"; Proc tabulate … ;
Title "Enrollment"; Proc tabulate … ;
Title "Prior surgeries"; Proc tabulate … ;
%new_sheet(name="Demographics");
Proc tabulate … ;
%new_sheet(name="Comorbidities");
Proc tabulate … ;
ODS EXCEL CLOSE;
ODS EXCEL conclusion The EXCEL destination is an excellent addition to the stable of ODS destinations. The feature set and
extensibility is not quite as rich as the ExcelXP tagsets. Regardless, all the ODS renderings a SAS user
would expect are functioning and documented. The destination has simplified the process of generating
native Excel workbooks and its use is highly recommended by the author.
Related Documents