IBISWorld Industry Report OD4559 Online Survey Software in the US March 2014 Sarah Kahn Filled out: Acquisitions will abound, as industry demand continues to soar 2 About this Industry 2 Industry Definition 2 Main Activities 2 Similar Industries 2 Additional Resources 3 Industry at a Glance 4 Industry Performance 4 Executive Summary 4 Key External Drivers 6 Current Performance 8 Industry Outlook 10 Industry Life Cycle 12 Products & Markets 12 Supply Chain 12 Products & Services 13 Demand Determinants 13 Major Markets 14 International Trade 15 Business Locations 17 Competitive Landscape 17 Market Share Concentration 17 Key Success Factors 17 Cost Structure Benchmarks 19 Basis of Competition 20 Barriers to Entry 20 Industry Globalization 21 Major Companies 21 SurveyMonkey 23 Operating Conditions 23 Capital Intensity 24 Technology & Systems 24 Revenue Volatility 25 Regulation & Policy 25 Industry Assistance 26 Key Statistics 26 Industry Data 26 Annual Change 26 Key Ratios 27 Jargon & Glossary www.ibisworld.com | 1-800-330-3772 | info @ ibisworld.com

Welcome message from author
This document is posted to help you gain knowledge. Please leave a comment to let me know what you think about it! Share it to your friends and learn new things together.
Transcript

WWW.IBISWORLD.COM Online Survey Software in the US March 2014 1
IBISWorld Industry Report OD4559Online Survey Software in the USMarch 2014 Sarah Kahn
Filled out: Acquisitions will abound, as industry demand continues to soar
2 About this Industry2 Industry Definition
2 Main Activities
2 Similar Industries
2 Additional Resources
3 Industry at a Glance
4 Industry Performance4 Executive Summary
4 Key External Drivers
6 Current Performance
8 Industry Outlook
10 Industry Life Cycle
12 Products & Markets12 Supply Chain
12 Products & Services
13 Demand Determinants
13 Major Markets
14 International Trade
15 Business Locations
17 Competitive Landscape17 Market Share Concentration
17 Key Success Factors
17 Cost Structure Benchmarks
19 Basis of Competition
20 Barriers to Entry
20 Industry Globalization
21 Major Companies21 SurveyMonkey
23 Operating Conditions23 Capital Intensity
24 Technology & Systems
24 Revenue Volatility
25 Regulation & Policy
25 Industry Assistance
26 Key Statistics26 Industry Data
26 Annual Change
26 Key Ratios
27 Jargon & Glossary
www.ibisworld.com | 1-800-330-3772 | [email protected]
WWW.IBISWORLD.COM Online Survey Software in the US March 2014 2
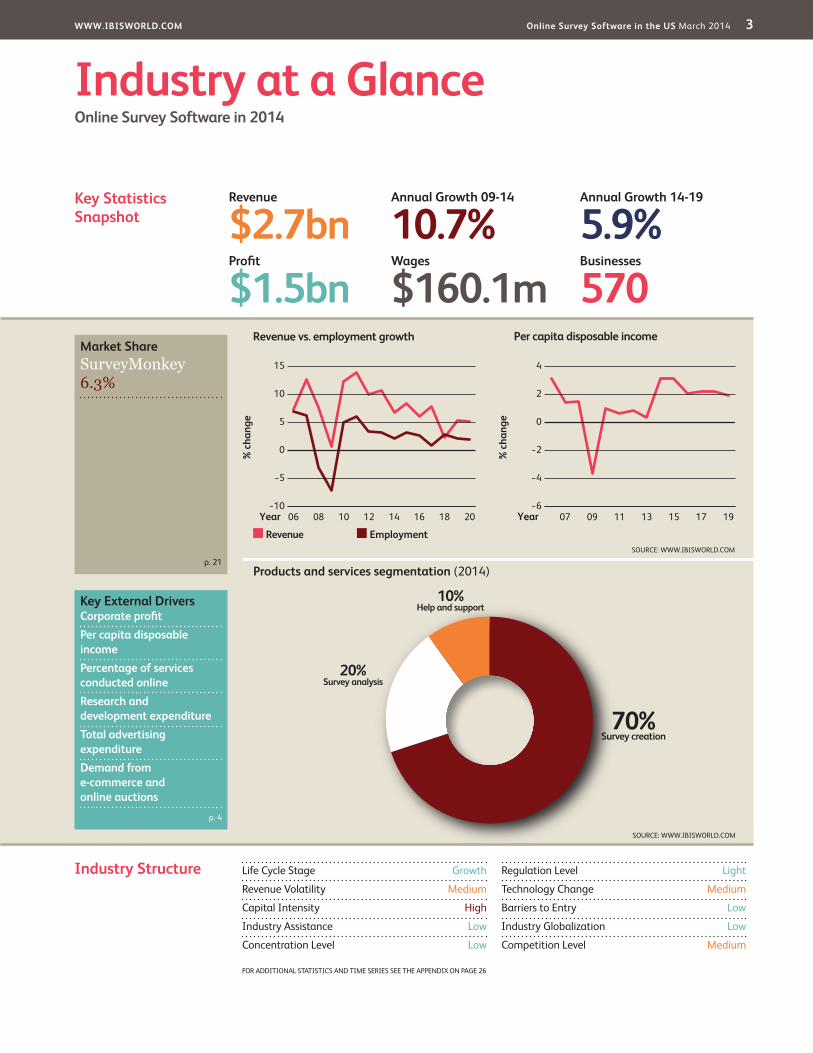
This industry develops online survey software for use in market research, product testing and gathering information on customer and employee satisfaction.
Online surveys ask respondents a list of specific questions in order to gauge their opinions. Results are then collated and supplied to the author of the questions.
The primary activities of this industry are
Survey design
Online application development
Marketing online survey software
Consulting regarding surveys
51121 Software Publishing in the USSoftware publishers are involved in the dissemination of licenses to customers for the right to execute software on their own computers.
54151 IT Consulting in the USIT consultants provide expert advice and assistance in the fields of writing, modifying, testing and supporting software to meet the needs of particular customers.
54191 Market Research in the USMarket research firms are companies that systematically gather, record, tabulate and present marketing and public opinion data.
Industry Definition
Main Activities
Similar Industries
Additional Resources
About this Industry
For additional information on this industry
www.comscore.com ComScore
www.executiveboard.com Corporate Executive Board
www.casro.org Council of American Survey Research Organizations
www.techcrunch.com TechCrunch
The major products and services in this industry are
Help and support
Survey analysis
Survey creation
WWW.IBISWORLD.COM Online Survey Software in the US March 2014 3
% c
hang
e
4
−6
−4
−2
0
2
1907 09 11 13 15 17Year
Per capita disposable income
SOURCE: WWW.IBISWORLD.COM
% c
hang
e
15
−10
−5
0
5
10
2006 08 10 12 14 16 18Year
Revenue Employment
Revenue vs. employment growth
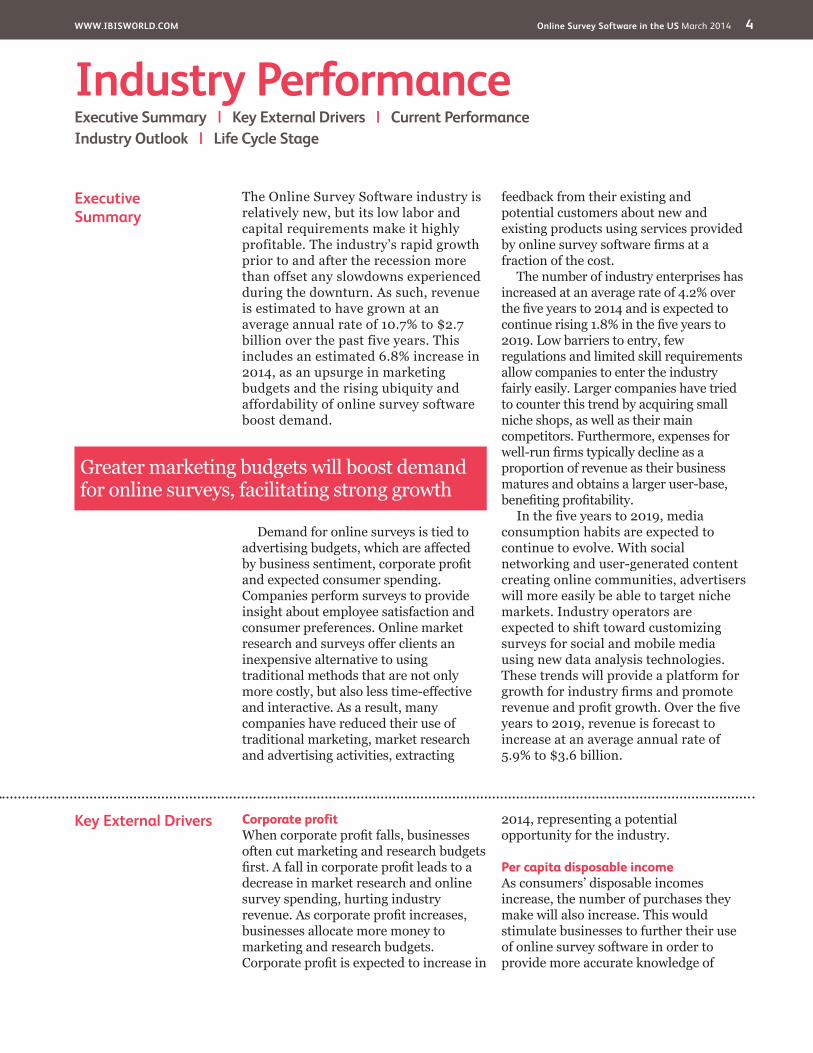
Products and services segmentation (2014)
70%Survey creation
20%Survey analysis
10%Help and support
SOURCE: WWW.IBISWORLD.COM
Key Statistics Snapshot
Industry at a GlanceOnline Survey Software in 2014
Industry Structure Life Cycle Stage Growth
Revenue Volatility Medium
Capital Intensity High
Industry Assistance Low
Concentration Level Low
Regulation Level Light
Technology Change Medium
Barriers to Entry Low
Industry Globalization Low
Competition Level Medium
Revenue
$2.7bnProfit
$1.5bnWages
$160.1mBusinesses
570
Annual Growth 14-19
5.9%Annual Growth 09-14
10.7%
Key External DriversCorporate profitPer capita disposable incomePercentage of services conducted onlineResearch and development expenditureTotal advertising expenditureDemand from e-commerce and online auctions
Market ShareSurveyMonkey 6.3%
p. 21
p. 4
FOR ADDITIONAL STATISTICS AND TIME SERIES SEE THE APPENDIX ON PAGE 26
SOURCE: WWW.IBISWORLD.COM
WWW.IBISWORLD.COM Online Survey Software in the US March 2014 4
Key External Drivers Corporate profitWhen corporate profit falls, businesses often cut marketing and research budgets first. A fall in corporate profit leads to a decrease in market research and online survey spending, hurting industry revenue. As corporate profit increases, businesses allocate more money to marketing and research budgets. Corporate profit is expected to increase in
2014, representing a potential opportunity for the industry.
Per capita disposable incomeAs consumers’ disposable incomes increase, the number of purchases they make will also increase. This would stimulate businesses to further their use of online survey software in order to provide more accurate knowledge of
Executive Summary
The Online Survey Software industry is relatively new, but its low labor and capital requirements make it highly profitable. The industry’s rapid growth prior to and after the recession more than offset any slowdowns experienced during the downturn. As such, revenue is estimated to have grown at an average annual rate of 10.7% to $2.7 billion over the past five years. This includes an estimated 6.8% increase in 2014, as an upsurge in marketing budgets and the rising ubiquity and affordability of online survey software boost demand.
Demand for online surveys is tied to advertising budgets, which are affected by business sentiment, corporate profit and expected consumer spending. Companies perform surveys to provide insight about employee satisfaction and consumer preferences. Online market research and surveys offer clients an inexpensive alternative to using traditional methods that are not only more costly, but also less time-effective and interactive. As a result, many companies have reduced their use of traditional marketing, market research and advertising activities, extracting
feedback from their existing and potential customers about new and existing products using services provided by online survey software firms at a fraction of the cost.
The number of industry enterprises has increased at an average rate of 4.2% over the five years to 2014 and is expected to continue rising 1.8% in the five years to 2019. Low barriers to entry, few regulations and limited skill requirements allow companies to enter the industry fairly easily. Larger companies have tried to counter this trend by acquiring small niche shops, as well as their main competitors. Furthermore, expenses for well-run firms typically decline as a proportion of revenue as their business matures and obtains a larger user-base, benefiting profitability.
In the five years to 2019, media consumption habits are expected to continue to evolve. With social networking and user-generated content creating online communities, advertisers will more easily be able to target niche markets. Industry operators are expected to shift toward customizing surveys for social and mobile media using new data analysis technologies. These trends will provide a platform for growth for industry firms and promote revenue and profit growth. Over the five years to 2019, revenue is forecast to increase at an average annual rate of 5.9% to $3.6 billion.
Industry PerformanceExecutive Summary | Key External Drivers | Current Performance Industry Outlook | Life Cycle Stage
Greater marketing budgets will boost demand for online surveys, facilitating strong growth
WWW.IBISWORLD.COM Online Survey Software in the US March 2014 5
Industry Performance
Key External Driverscontinued
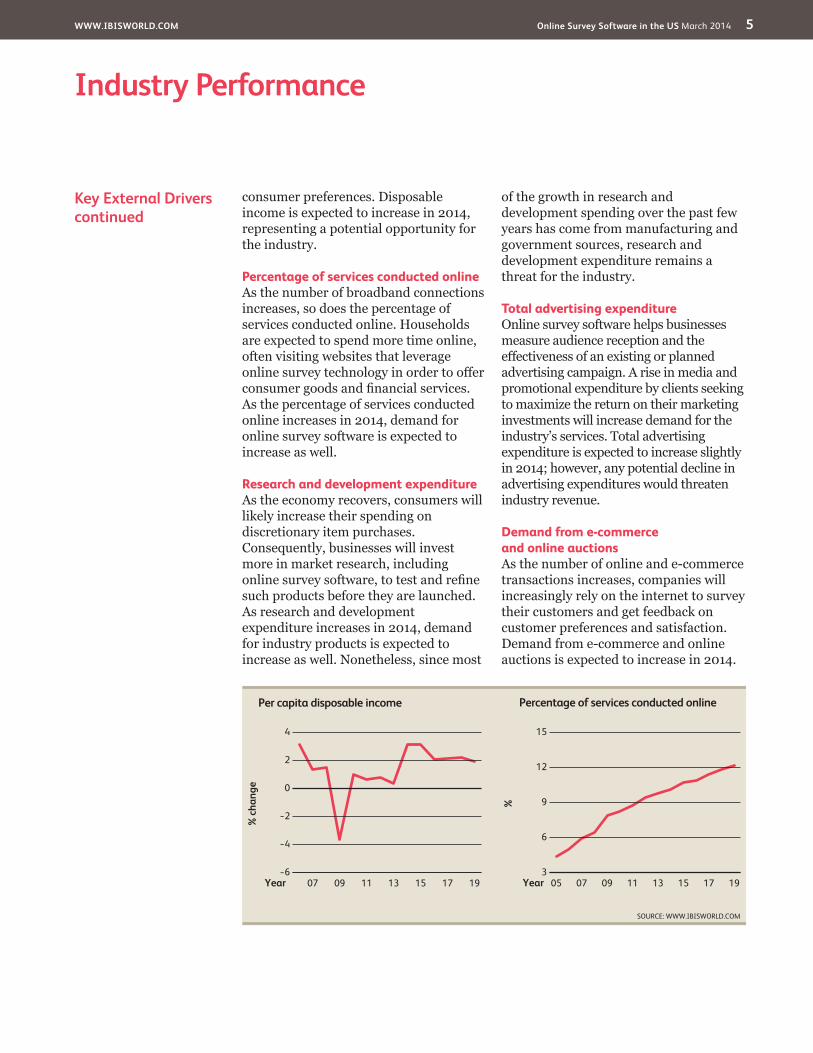
consumer preferences. Disposable income is expected to increase in 2014, representing a potential opportunity for the industry.
Percentage of services conducted onlineAs the number of broadband connections increases, so does the percentage of services conducted online. Households are expected to spend more time online, often visiting websites that leverage online survey technology in order to offer consumer goods and financial services. As the percentage of services conducted online increases in 2014, demand for online survey software is expected to increase as well.
Research and development expenditureAs the economy recovers, consumers will likely increase their spending on discretionary item purchases. Consequently, businesses will invest more in market research, including online survey software, to test and refine such products before they are launched. As research and development expenditure increases in 2014, demand for industry products is expected to increase as well. Nonetheless, since most
of the growth in research and development spending over the past few years has come from manufacturing and government sources, research and development expenditure remains a threat for the industry.
Total advertising expenditureOnline survey software helps businesses measure audience reception and the effectiveness of an existing or planned advertising campaign. A rise in media and promotional expenditure by clients seeking to maximize the return on their marketing investments will increase demand for the industry’s services. Total advertising expenditure is expected to increase slightly in 2014; however, any potential decline in advertising expenditures would threaten industry revenue.
Demand from e-commerce and online auctionsAs the number of online and e-commerce transactions increases, companies will increasingly rely on the internet to survey their customers and get feedback on customer preferences and satisfaction. Demand from e-commerce and online auctions is expected to increase in 2014.
%
15
3
6
9
12
1905 07 09 11 13 15 17Year
Percentage of services conducted online
SOURCE: WWW.IBISWORLD.COM
% c
hang
e
4
−6
−4
−2
0
2
1907 09 11 13 15 17Year
Per capita disposable income
WWW.IBISWORLD.COM Online Survey Software in the US March 2014 6
Industry Performance
Current Performance
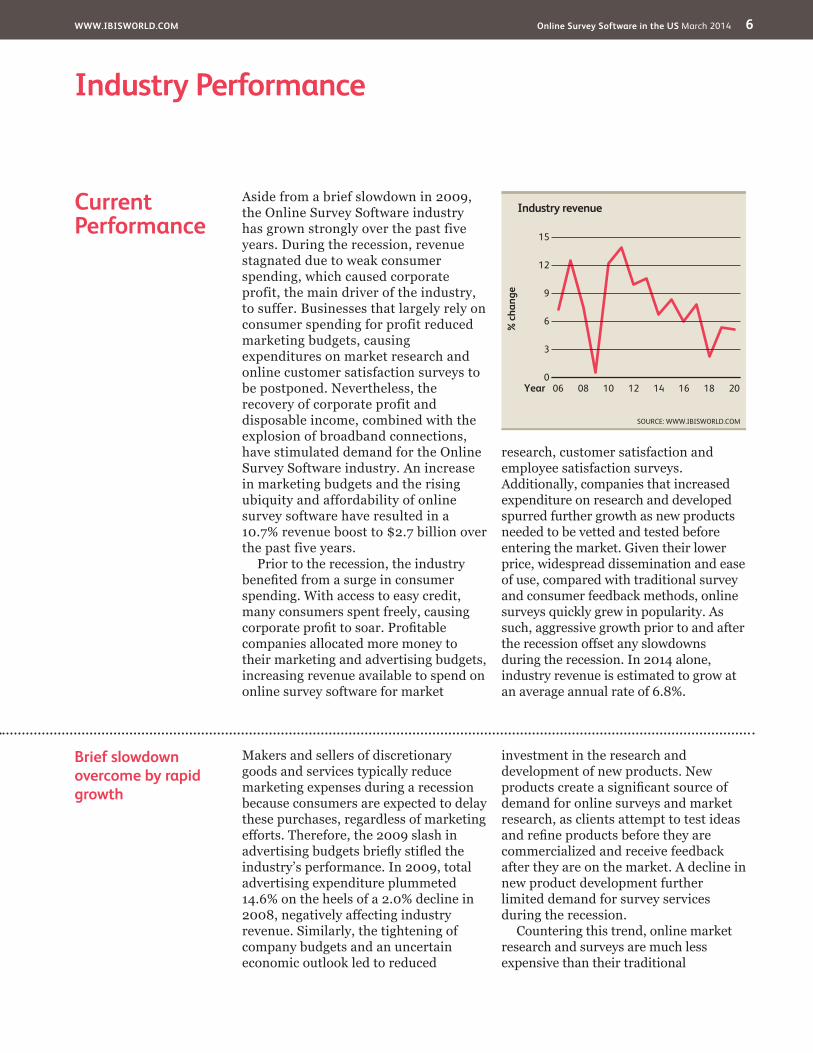
Aside from a brief slowdown in 2009, the Online Survey Software industry has grown strongly over the past five years. During the recession, revenue stagnated due to weak consumer spending, which caused corporate profit, the main driver of the industry, to suffer. Businesses that largely rely on consumer spending for profit reduced marketing budgets, causing expenditures on market research and online customer satisfaction surveys to be postponed. Nevertheless, the recovery of corporate profit and disposable income, combined with the explosion of broadband connections, have stimulated demand for the Online Survey Software industry. An increase in marketing budgets and the rising ubiquity and affordability of online survey software have resulted in a 10.7% revenue boost to $2.7 billion over the past five years.
Prior to the recession, the industry benefited from a surge in consumer spending. With access to easy credit, many consumers spent freely, causing corporate profit to soar. Profitable companies allocated more money to their marketing and advertising budgets, increasing revenue available to spend on online survey software for market
research, customer satisfaction and employee satisfaction surveys. Additionally, companies that increased expenditure on research and developed spurred further growth as new products needed to be vetted and tested before entering the market. Given their lower price, widespread dissemination and ease of use, compared with traditional survey and consumer feedback methods, online surveys quickly grew in popularity. As such, aggressive growth prior to and after the recession offset any slowdowns during the recession. In 2014 alone, industry revenue is estimated to grow at an average annual rate of 6.8%.
Brief slowdown overcome by rapid growth
Makers and sellers of discretionary goods and services typically reduce marketing expenses during a recession because consumers are expected to delay these purchases, regardless of marketing efforts. Therefore, the 2009 slash in advertising budgets briefly stifled the industry’s performance. In 2009, total advertising expenditure plummeted 14.6% on the heels of a 2.0% decline in 2008, negatively affecting industry revenue. Similarly, the tightening of company budgets and an uncertain economic outlook led to reduced
investment in the research and development of new products. New products create a significant source of demand for online surveys and market research, as clients attempt to test ideas and refine products before they are commercialized and receive feedback after they are on the market. A decline in new product development further limited demand for survey services during the recession.
Countering this trend, online market research and surveys are much less expensive than their traditional
% c
hang
e
15
0
3
6
9
12
2006 08 10 12 14 16 18Year
Industry revenue
SOURCE: WWW.IBISWORLD.COM

WWW.IBISWORLD.COM Online Survey Software in the US March 2014 7
Industry Performance
Brief slowdown overcome by rapid growthcontinued
counterparts, providing the industry with a small counter-cyclical boost. While companies chose to reduce their use of marketing, market research and advertising firms, many opted for online survey software as a way to engage their existing and potential customers at a fraction of the cost. Over the past five years, these services have become
increasingly affordable and are becoming a more acceptable way for companies to get feedback from their customers and test the market for their products. The slowdown did not last long and revenue followed the total advertising expenditure increase of 4.5% over the five years to 2014 as corporate profit returned to strong growth.
High profit entices new entrants
Industry firms with a strong understanding of unique market conditions and success factors can expect a hefty return on their investment. Well-run firms’ operational expenses decline as a percentage of revenue as start-up costs are spread over an increasing user-base; their profit and revenue grow as their business matures. Certain companies, such as industry leader SurveyMonkey, are estimated to achieve profit margins as high as 54.0% of revenue.
The number of industry enterprises has increased over the five years to 2014 at an average annual rate of 4.2% to an estimated 570 businesses. Employment has followed enterprises and is expected to increase at an average annual 3.9% to 1,930 over the same period. Low barriers to entry and technical skill requirements (besides programming and web design knowledge) allow companies to enter the industry with little difficulty. This trend
has caused increased competition in recent years. Larger companies have tried to counter these trends by acquiring small niche shops and some of their main competitors. For example, in December 2011, SurveyMonkey partnered with TPG Capital to acquire MarketTools’ Zoomerang, ZoomPanel and TrueSample products. In April 2011, SurveyMonkey acquired WuFoo; in January 2011, SurveyMonkey acquired a 49.9% stake in ClickTools. The company’s aggressive acquisition strategy has allowed it to grow its economy of scale, further contributing to its impressive profit growth.
New media fuels growth
The growth of this relatively new industry has coincided with the increasing ubiquity of internet access, an increasing number of broadband connections and a rising percentage of services conducted online. The costs to obtain an internet connection and a personal computer are relatively low and have declined in recent years. Furthermore, broadband internet provides faster speeds, greater bandwidth
and more stable connections than aging dial-up internet connections. As connecting to the internet becomes easier and more affordable, online retailers become more accessible. As a result, consumers are more likely to purchase from these stores, making internet polling and surveys more valuable for companies. According to ComScore, an internet market research firm, consumers
The industry’s relatively new and high-profit technology helped mitigate declining demand

WWW.IBISWORLD.COM Online Survey Software in the US March 2014 8
Industry Performance
New media fuels growthcontinued
that use broadband connections typically make more online purchases than those that use dial-up internet connections.
Opportunities to measure and survey online media audiences have increased over the five years to 2014. Many companies allow consumers to provide ratings, comments and feedback for a product. As more consumers use social networking websites, companies have more options to engage them in conversations about a product. By conversing with customers online, companies can improve their understanding of consumer wants and needs.
The internet has also caused demographic markets to fragment by allowing people with increasingly specialized interests to interact. While this factor has made it difficult to reach a mass audience, it allows market researchers and advertisers to reach highly targeted groups of consumers. Reaching a target audience is now easier thanks to improved online advertising metrics. By providing unique page views and click-through rates in conjunction with customized online surveys, advertisers can make sure that their target market is being reached.
Industry Outlook
Increasing disposable income and corporate profit in the coming five years will stimulate a rise in consumer spending, causing businesses to increase their expenditures on market research, including online survey software. Revenue for the Online Survey Software industry is set to increase as businesses expand marketing and research budgets and new entrants pursue the industry’s high potential profit margins. The industry will also continue to benefit from its relatively new nature, since it is nowhere near approaching its market saturation point. Many companies are still transitioning from traditional market research and surveying to internet-based technology, which will continue to drive demand. Due to these trends, revenue is forecast to increase at an average annual rate of 5.9% to reach $3.6 billion in the five years to 2019.
The fragmentation of the media landscape, with consumers moving from cable and satellite TV to internet streaming, as well as from newspapers to blogs, is anticipated to benefit online
survey software providers. The magazine and newspaper industries have shrunk rapidly over the past decade and will continue their decline in the coming years. However, internet advertising will continue to grow at a swift rate, driving demand for online surveys (since the two are often used in conjunction with each other). Total advertising output will continue to increase, but the move to more cost-effective advertising forms (such as online and mobile) will flourish and promote the use of internet-based surveys, pushing most market research and consumer feedback toward the internet. The ability to judge consumer preferences and get instantaneous feedback about new products will continue to attract new markets.
Companies will move to more cost-effective advertising, bolstering demand for online surveys
WWW.IBISWORLD.COM Online Survey Software in the US March 2014 9
Industry Performance
New media brings new opportunities
The way individuals consume media has significantly changed, profoundly affecting the way that marketing and advertising campaigns are structured. A major shift toward online and mobile media is underway as downloadable content and the streaming of music, TV and movies are displacing the role of traditional media. Industry operators will need to continue to harness new media’s potential to be successful and relevant going forward. Online survey companies will need to adapt their services to reflect this shift by enhancing the measurement of online media and advertising and adapting their approach to make sure they stay up to date with the newest browsing platforms.
The number of mobile internet connections will continue to grow strongly in the five years to 2019, albeit at a decelerating rate due to saturation. However, as phones and data plans become cheaper, more people will purchase smartphones (and, to a lesser extent, wireless laptop modems). As a growing proportion of consumers experience the internet through mobile devices, existing players and new entrants will have to cater to these platforms. At the same time, this continued shift will open the door for new firms that specialize in these new mediums, such as mobile and tablet surveying. Some consolidation is also expected, causing firms to grow at a slower rate in the next five years than they did over the past five. In the five years to 2019, IBISWorld projects that the number of firms will increase at an
average rate of 1.8% annually to reach 623. Employment is expected to follow and increase an average annual 2.2% to 2,157 over the same period.
The continued fragmentation of consumer markets will highlight the importance of targeted and adaptable survey software. Over the five years to 2014, social networking and user-generated content have increasingly allowed specific interest groups to create communities online. As a result, advertisers are able to better target niche consumer segments. Moving forward, this trend will become more prevalent as measurement and data analysis technologies continue to improve. Companies are beginning to, and will increasingly, employ technology to track comments that consumers make about their brands on Facebook, Twitter and message boards to manage brand development and reputation. Consequently, the research of online media platforms will become crucial to understanding the complexities of consumers’ thoughts, purchases and actions. Industry operators will need to develop survey products that take advantage of social networking, since internet users spend a rising proportion of time on these websites and services.
Operators will need to develop survey products that take advantage of social networking
WWW.IBISWORLD.COM Online Survey Software in the US March 2014 10
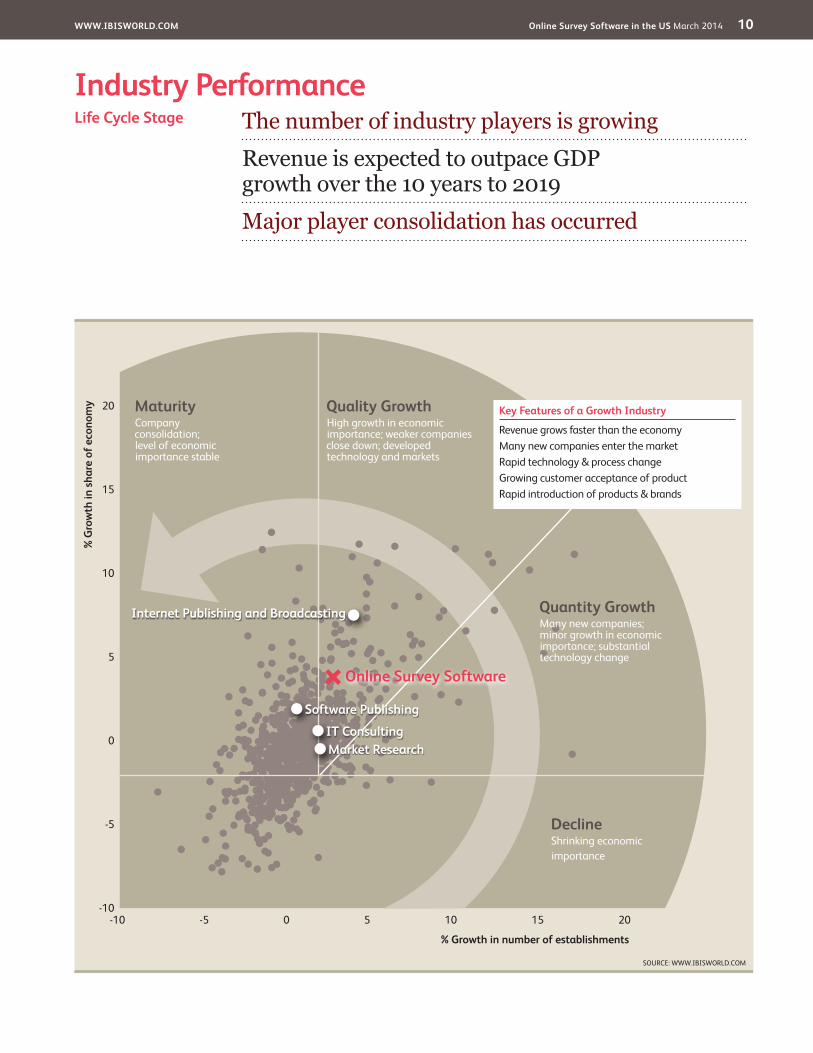
Industry PerformanceThe number of industry players is growingRevenue is expected to outpace GDP growth over the 10 years to 2019Major player consolidation has occurred
Life Cycle Stage
SOURCE: WWW.IBISWORLD.COM
20
15
10
5
0
-5
-10
% G
row
th in
sha
re o
f eco
nom
y
% Growth in number of establishments
-10 -5 0 5 10 15 20
DeclineShrinking economicimportance
Quality GrowthHigh growth in economic importance; weaker companies close down; developed technology and markets
MaturityCompany consolidation;level of economic importance stable
Quantity GrowthMany new companies; minor growth in economic importance; substantial technology change
Key Features of a Growth Industry
Revenue grows faster than the economyMany new companies enter the marketRapid technology & process changeGrowing customer acceptance of productRapid introduction of products & brands
Software Publishing
IT ConsultingMarket Research
Internet Publishing and Broadcasting
Online Survey Software
WWW.IBISWORLD.COM Online Survey Software in the US March 2014 11
Industry Performance
Industry Life Cycle Over the 10 years to 2019, industry value added, which measures the industry’s contribution to the US economy, is expected to increase at an average annual rate of 6.6%. Meanwhile, US GDP is forecast to rise at an average annual rate of 2.7% over this same period. These rates indicate that the industry is in a growth phase of its life cycle since its growth rate outpaces GDP over a 10-year period. Rising industry participation and new forms of businesses also indicate a growing industry.
Over the 10 years to 2019, the number of firms in this industry is expected to increase at an average annual rate of 3.0% to 623 businesses. This growth in industry participation can be attributed to an increase in e-commerce demand, mainly driven by the rising prevalence of broadband connections and other high-speed internet services. These services have allowed more consumers to surf the net and buy products without experiencing any lag time; consequently,
more consumers have made purchases online. With an increasing percentage of services being conducted online, the internet has become an increasingly valuable source for companies of all types to survey customers and get real time feedback. The comparative affordability of online survey methods compared to traditional ones and the high profit margins this industry offers have also enticed new entrants to enter this industry.
Furthermore, the industry’s low barriers to entry and skill requirements have allowed companies to enter the industry without much difficulty, leading to higher participation. Larger companies have tried to counter these trends by acquiring small niche shops and many of their main competitors. For example, in 2011 alone, SurveyMonkey acquired MarketTools’ Zoomerang, ZoomPanel and TrueSample products. Earlier in the year, the company also acquired WuFoo and a 49.9% stake in ClickTools.
This industry is Growing
WWW.IBISWORLD.COM Online Survey Software in the US March 2014 12
Products & Services
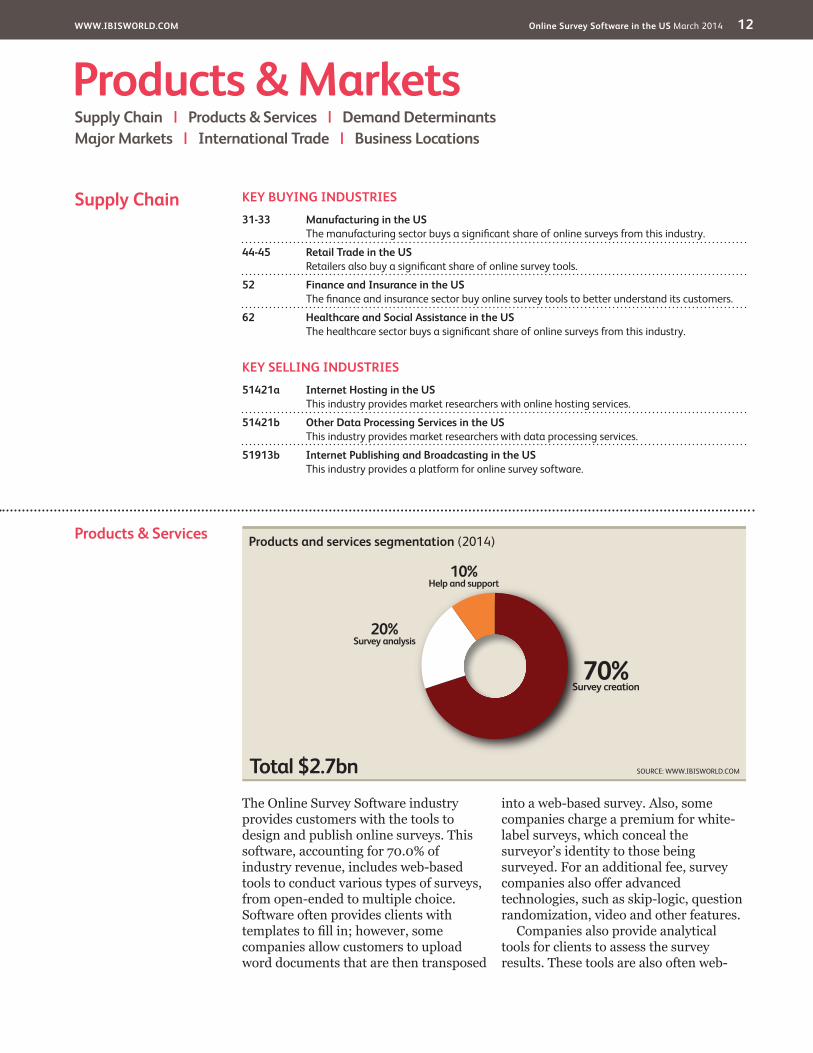
The Online Survey Software industry provides customers with the tools to design and publish online surveys. This software, accounting for 70.0% of industry revenue, includes web-based tools to conduct various types of surveys, from open-ended to multiple choice. Software often provides clients with templates to fill in; however, some companies allow customers to upload word documents that are then transposed
into a web-based survey. Also, some companies charge a premium for white-label surveys, which conceal the surveyor’s identity to those being surveyed. For an additional fee, survey companies also offer advanced technologies, such as skip-logic, question randomization, video and other features.
Companies also provide analytical tools for clients to assess the survey results. These tools are also often web-
Products & MarketsSupply Chain | Products & Services | Demand Determinants Major Markets | International Trade | Business Locations
KEY BUYING INDUSTRIES
31-33 Manufacturing in the US The manufacturing sector buys a significant share of online surveys from this industry.
44-45 Retail Trade in the US Retailers also buy a significant share of online survey tools.
52 Finance and Insurance in the US The finance and insurance sector buy online survey tools to better understand its customers.
62 Healthcare and Social Assistance in the US The healthcare sector buys a significant share of online surveys from this industry.
KEY SELLING INDUSTRIES
51421a Internet Hosting in the US This industry provides market researchers with online hosting services.
51421b Other Data Processing Services in the US This industry provides market researchers with data processing services.
51913b Internet Publishing and Broadcasting in the US This industry provides a platform for online survey software.
Supply Chain
Products and services segmentation (2014)
Total $2.7bn
70%Survey creation
20%Survey analysis
10%Help and support
SOURCE: WWW.IBISWORLD.COM
WWW.IBISWORLD.COM Online Survey Software in the US March 2014 13
Products & Markets
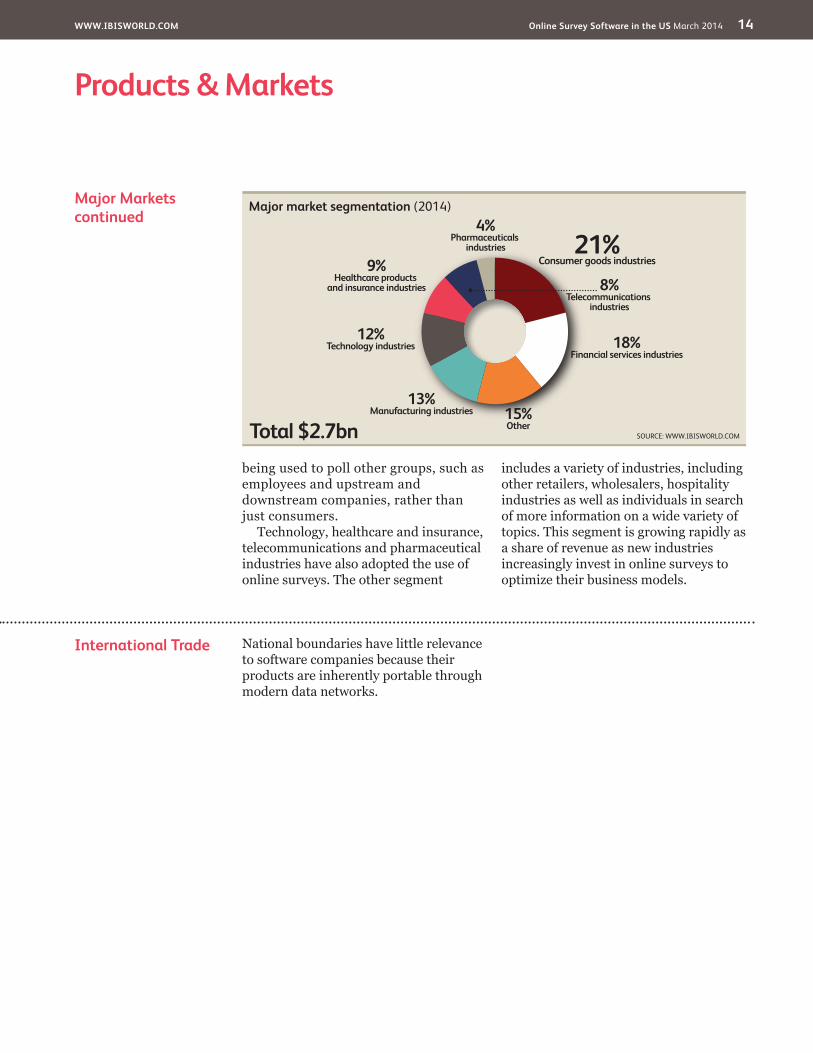
Major Markets The industries that use online surveys the most include consumer goods retailers, financial services and manufacturing industries. Companies in these industries can gain a lot from consumer knowledge and, therefore, pioneered the use of survey research. Such companies developed surveys as an addition to, or even an alternative for, focus groups in
order to measure the expected consumer reaction to a product or marketing pitch. This allows companies to maximize the benefits of various investments across marketing, stocking, production, and research and development departments. These industries are, however, decreasing as a share of the online survey industry’s customer base as surveys are increasingly
DemandDeterminants
Demand for online surveys is directly tied marketing and advertising budgets, which are affected by business sentiment, corporate profit and expected consumer spending. Marketing budget appropriation to online surveys depends heavily on business sentiment. Companies do not spend much of their revenue on surveying clients if they anticipate low profit; instead, they often cut costs by relying on older, secondary or syndicated research. Similarly, companies perform more extensive internal surveys to optimize processes when they can afford it. Potential insights from surveying consumers or employees are, however, most significant in a difficult operating environment, making online survey tools an investment that cash-strapped companies may continue to make during a difficult economic environment. Online survey software is often cheaper than other market research alternatives, and provides the industry with the potential for a counter-cyclical boost.
The popularity of online services, the attractiveness (e.g. price and quality) of substitute products and the effectiveness of past surveys in helping companies achieve goals all affect industry performance. For example, online survey tools are increasingly popular as the pervasiveness of internet use grows among all demographics. As more companies use digital platforms to sell and promote products and services, they are more likely to incorporate online surveys into their business model.
Demand is also derived from political polling via online surveys on voting intentions, issues and views, linking the industry to the election cycle. Governments typically undertake online surveys as a precursor to development of a policy or a public information or education campaign and to promote a response to and recognition of these campaigns.
Products & Servicescontinued
based, though a portion of results can also be downloaded in excel, text or CSV formats. A few companies offer advanced features like full cross-tabs, text analysis and SPSS (statistical analysis software) integration. As traditional market research firms begin to offer online alternatives, these advanced tools are increasing as a share
of the products offered by this industry. Escalating internal and external competition is pushing companies to offer additional services. The industry also offers customer support for users that have questions or issues with online survey software; they can often talk to or e-mail company representatives to resolve the issues.
WWW.IBISWORLD.COM Online Survey Software in the US March 2014 14
Products & Markets
International Trade National boundaries have little relevance to software companies because their products are inherently portable through modern data networks.
Major Marketscontinued
being used to poll other groups, such as employees and upstream and downstream companies, rather than just consumers.
Technology, healthcare and insurance, telecommunications and pharmaceutical industries have also adopted the use of online surveys. The other segment
includes a variety of industries, including other retailers, wholesalers, hospitality industries as well as individuals in search of more information on a wide variety of topics. This segment is growing rapidly as a share of revenue as new industries increasingly invest in online surveys to optimize their business models.
Major market segmentation (2014)
Total $2.7bn
21%Consumer goods industries9%
Healthcare products and insurance industries
18%Financial services industries
8%Telecommunications
industries
4%Pharmaceuticals
industries
15%Other
13%Manufacturing industries
12%Technology industries
SOURCE: WWW.IBISWORLD.COM

WWW.IBISWORLD.COM Online Survey Software in the US March 2014 15
Products & Markets
Business Locations 2014
MO2.4
West
West
West
Rocky Mountains Plains
Southwest
Southeast
New England
VT0.8
MA4.6
RI0.1
NJ5.5
DE0.4
NH0.9
CT1.3
MD2.4
DC0.5
1
5
3
7
2
6
4
8 9
Additional States (as marked on map)
AZ1.3
CA15.6
NV0.3
OR1.5
WA5.6
MT0.1
NE0.7
MN2.9
IA0.8
OH3.9 VA
0.2
FL4.1
KS0.6
CO4.0
UT7.0
ID0.3
TX0.7
OK0.5
NC3.0
AK0.1
WY2.0
TN0.1
KY0.8
GA2.2
IL3.0
ME0.2
ND0.2
WI0.1 MI
2.0 PA2.9
WV5.4
SD0.6
NM0.2
AR0.3
MS0.1
AL0.7
SC0.2
LA0.2
HI0.2
IN1.2
NY5.5 5
67
8
321
4
9
SOURCE: WWW.IBISWORLD.COM
Mid- Atlantic
Employment by region (%)
Less than 3% 3% to less than 10% 10% to less than 20% 20% or more
Great Lakes
WWW.IBISWORLD.COM Online Survey Software in the US March 2014 16
Products & Markets
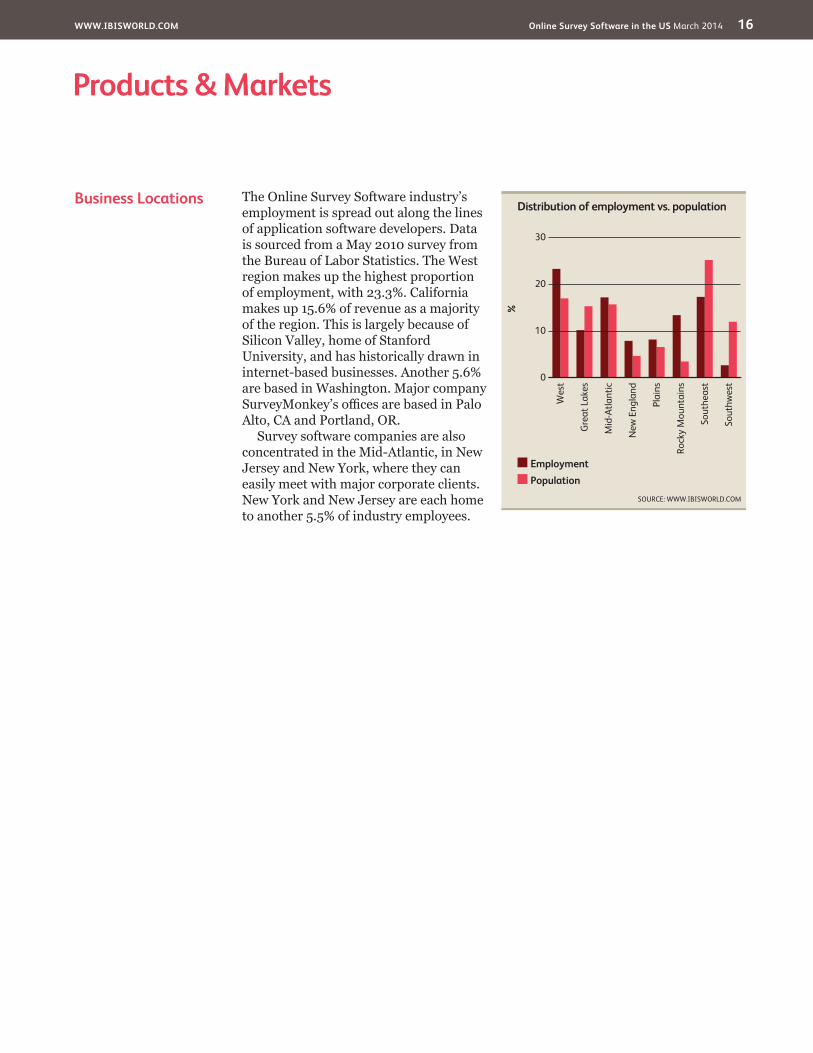
Business Locations The Online Survey Software industry’s employment is spread out along the lines of application software developers. Data is sourced from a May 2010 survey from the Bureau of Labor Statistics. The West region makes up the highest proportion of employment, with 23.3%. California makes up 15.6% of revenue as a majority of the region. This is largely because of Silicon Valley, home of Stanford University, and has historically drawn in internet-based businesses. Another 5.6% are based in Washington. Major company SurveyMonkey’s offices are based in Palo Alto, CA and Portland, OR.
Survey software companies are also concentrated in the Mid-Atlantic, in New Jersey and New York, where they can easily meet with major corporate clients. New York and New Jersey are each home to another 5.5% of industry employees.
%
30
0
10
20
Sout
hwes
t
Wes
t
Gre
at L
akes
Mid
-Atla
ntic
New
Eng
land
Plai
ns
Rock
y M
ount
ains
Sout
heas
t
Employment Population
Distribution of employment vs. population
SOURCE: WWW.IBISWORLD.COM
WWW.IBISWORLD.COM Online Survey Software in the US March 2014 17
Cost Structure Benchmarks
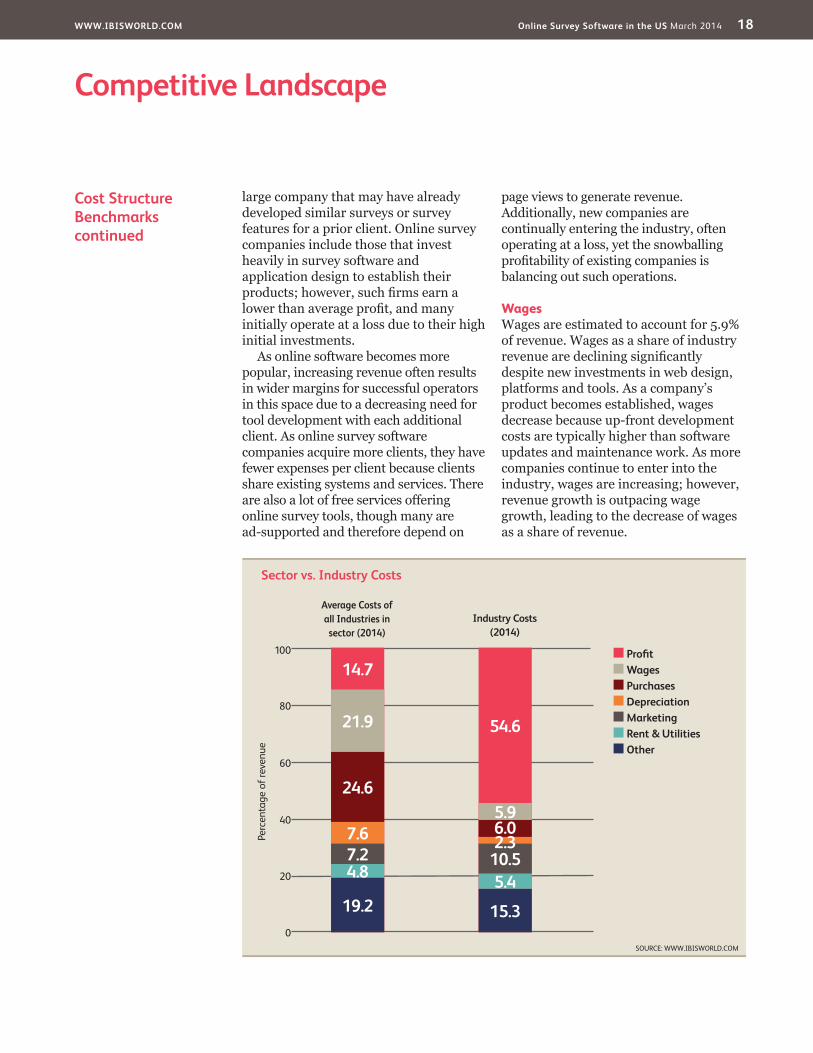
ProfitIndustry profit is defined as earnings before interest and taxes. IBISWorld estimates that this industry is highly profitable, with about a 54.6% margin in 2014. Some successful companies may
earn a much higher profit. This large disparity is due to the industry’s fragmented nature, as it is composed of a variety of smaller companies, which generally must spend a higher share of revenue in order to satisfy clients than a
Key Success Factors Access to a highly skilled workforceDesigning online survey tools often requires excruciatingly long hours. A skilled and flexible work force will work efficiently for extended periods of time, covering many areas of operations from undertaking interviews to collating results.
Adoption to new technology and prompt delivery to marketOnline survey software companies must quickly adopt new survey or programming techniques to provide clients with what they are searching for. The industry depends on the relevancy of the often time-sensitive insights gained from its surveys.
Attractive product presentationOnline survey software companies face competition from similar survey providers within the industry. Companies must positively present survey software to attract and retain clients and users.
Developing relationships with other industriesOnline survey software are useful to many industries, such as consumer goods retailers, financial services and manufacturing industries. Firms that attract a large amount of merchant partners typically see stronger adoption rates of their service.
Ensure pricing policy is appropriateTo maintain a competitive edge, firms must monitor the prices that their competitors (internal and external) charge merchants and adjust their own pricing structure accordingly.
Having a good reputationConsumers will not use an online survey software if they do not trust that their information and finances will be secure. Firms must establish extensive security measures and offer users fraud protection to allay security concerns.
Market Share Concentration
Market share concentration in the Online Survey Software industry is low, as the industry is relatively new, and thus highly fragmented with low barriers to entry. Entry requires low initial investment and a high potentials high return for new entrants. Because a growing market for online surveys and high profit margins make it an attractive investment, new companies are continuously entering the industry. While the number of enterprises is
projected to grow over the next five years, the market share concentration is expected to remain steady as industry companies look to acquire their competitors in order to retain a significant share of the growing market. For example, in December 2011, the industry’s largest player with only 6.3% market share in 2013, Survey Monkey, announced the acquisition of MarketTools Inc. (the creators of Zoomerang).
Competitive LandscapeMarket Share Concentration | Key Success Factors | Cost Structure Benchmarks Basis of Competition | Barriers to Entry | Industry Globalization
Level Concentration in this industry is Low
IBISWorld identifies 250 Key Success Factors for a business. The most important for this industry are:
WWW.IBISWORLD.COM Online Survey Software in the US March 2014 18
Competitive Landscape
Cost Structure Benchmarkscontinued
large company that may have already developed similar surveys or survey features for a prior client. Online survey companies include those that invest heavily in survey software and application design to establish their products; however, such firms earn a lower than average profit, and many initially operate at a loss due to their high initial investments.
As online software becomes more popular, increasing revenue often results in wider margins for successful operators in this space due to a decreasing need for tool development with each additional client. As online survey software companies acquire more clients, they have fewer expenses per client because clients share existing systems and services. There are also a lot of free services offering online survey tools, though many are ad-supported and therefore depend on
page views to generate revenue. Additionally, new companies are continually entering the industry, often operating at a loss, yet the snowballing profitability of existing companies is balancing out such operations.
WagesWages are estimated to account for 5.9% of revenue. Wages as a share of industry revenue are declining significantly despite new investments in web design, platforms and tools. As a company’s product becomes established, wages decrease because up-front development costs are typically higher than software updates and maintenance work. As more companies continue to enter into the industry, wages are increasing; however, revenue growth is outpacing wage growth, leading to the decrease of wages as a share of revenue.
Sector vs. Industry Costs
■ Profi t■ Wages■ Purchases■ Depreciation■ Marketing■ Rent & Utilities■ Other
Average Costs of all Industries in sector (2014)
Industry Costs (2014)
0
20
40
60
Perc
enta
ge o
f rev
enue
80
100
14.7
19.2
4.87.27.6
24.6
21.9 54.6
15.3
5.410.52.36.05.9
SOURCE: WWW.IBISWORLD.COM
WWW.IBISWORLD.COM Online Survey Software in the US March 2014 19
Competitive Landscape
Basis of Competition Internal competitionCompanies compete with each other based on product pricing, features and quality. Due to the intense price competition, many companies, including major player SurveyMonkey, operate using the Freemium business model in which service providers offers basic features at no cost and charge a premium for supplemental or advanced features. These tactics draw in users, with the expectation that some will upgrade to paid online survey packages. Price competition and free access to basic survey software keeps prices low for industry products. As more companies enter the industry, price competition is expected to escalate.
Product features and quality are key for companies in search of high profit margins. In order to be highly profitable, companies must retain and attract major corporate clients by supplying innovative and useful features at high levels of quality. Product quality is reflected in survey loading time and processing time for results. It also involves ease of use for clients and the population being surveyed and timeliness of client services. Companies primarily compete based on
the ease of use of their products, which gives an advantage to well-established companies because more users are familiar with their software design.
External competitionCompanies in this industry primarily compete against traditional market research companies that have relied on phone and mail surveys in the past but are increasingly offering online survey capabilities. Industry operators compete with market research companies based on quality of service, the survey and sampling techniques used and their appropriateness, and the timely presentation of the results. The competition is focused on the quality of the analysis of the results obtained. In particular, the availability of services (including value-added ones) to clients is important. Quality also depends on the speed of the website, the convenience of setting up surveys and costs.
Market research businesses must also perform strategic analysis and professional interpretation of the research results within the client’s time and budget constraints. The emphasis is not just on presenting
Cost Structure Benchmarkscontinued
Other costsThe industry spends about 10.5% of revenue on marketing its products. For example, online survey software companies usually spend heavily on search engine optimization efforts to promote their products. Many also conduct consumer assessment studies in order to publicize the positive results of companies that used their surveys. As more companies enter into the industry, marketing efforts are expected to increase as a share of revenue.
Purchases have accounted for a fairly steady as a share of industry revenue in the past five years, at about 6.0%.
However, purchases decline in the long term as technologies that the industry uses become cheaper. The main purchases that this industry makes include servers, development platforms and web hosting.
Other costs, including rent, utilities and back office operations are decreasing as a share of revenue for reasons similar to wages decreasing as a share of revenue. As companies establish processes and complete their software, it becomes cheaper to operate per each additional client. This trend is expected to continue over the next five years.
Level & Trend Competition in this industry is Medium and the trend is Increasing
WWW.IBISWORLD.COM Online Survey Software in the US March 2014 20
Competitive Landscape
Industry Globalization
This highly fragmented industry includes some companies that are foreign owned; however, they do not make up a significant market share. International
trade does not have a tangible impact on this industry because software can be digitally distributed instantly, making borders of little importance.
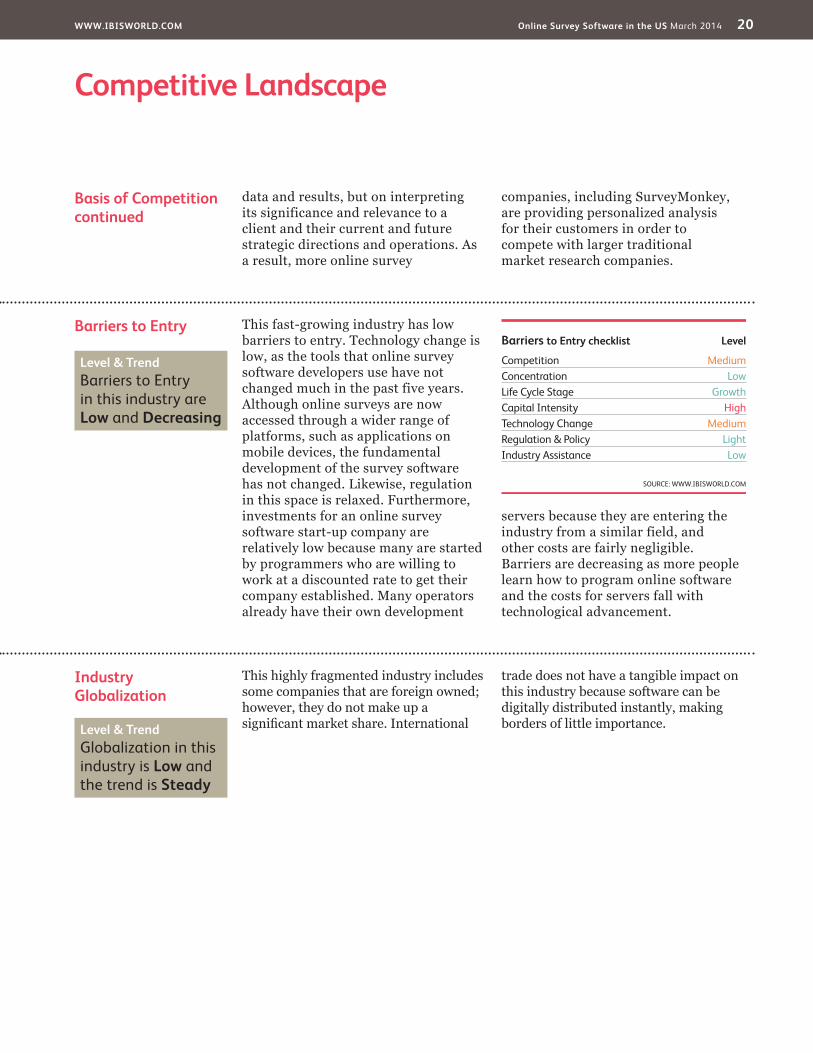
Barriers to Entry This fast-growing industry has low barriers to entry. Technology change is low, as the tools that online survey software developers use have not changed much in the past five years. Although online surveys are now accessed through a wider range of platforms, such as applications on mobile devices, the fundamental development of the survey software has not changed. Likewise, regulation in this space is relaxed. Furthermore, investments for an online survey software start-up company are relatively low because many are started by programmers who are willing to work at a discounted rate to get their company established. Many operators already have their own development
servers because they are entering the industry from a similar field, and other costs are fairly negligible. Barriers are decreasing as more people learn how to program online software and the costs for servers fall with technological advancement.
Basis of Competitioncontinued
data and results, but on interpreting its significance and relevance to a client and their current and future strategic directions and operations. As a result, more online survey
companies, including SurveyMonkey, are providing personalized analysis for their customers in order to compete with larger traditional market research companies.
Barriers to Entry checklist Level
Competition MediumConcentration LowLife Cycle Stage GrowthCapital Intensity HighTechnology Change MediumRegulation & Policy LightIndustry Assistance Low
SOURCE: WWW.IBISWORLD.COM
Level & Trend Barriers to Entry in this industry are Low and Decreasing
Level & Trend Globalization in this industry is Low and the trend is Steady
WWW.IBISWORLD.COM Online Survey Software in the US March 2014 21
Player Performance SurveyMonkey is one of the world’s leading providers of web-based survey solutions. It serves 100.0% of the Fortune 100 companies and 99.0% of the Fortune 500. It also provides services to other businesses, academic institutions and various other types of organizations. The company is rapidly expanding, having doubled its employees to about 250 over the past two years, according to IBISWorld estimates. It is headquartered in Palo Alto, CA, with offices in Portland and Funchal, Portugal.
SurveyMonkey was founded in 1999 in Portland by Ryan and Chris Finley. In April 2009, private investors Bain Capital Ventures and Spectrum Equity Investors used a leverage buyout to acquire a majority stake in SurveyMonkey from its founders for an undisclosed sum. The founders remained with the firm in the Portland office, while the private investors brought in the entrepreneur and previous head of
Yahoo’s music business, David Goldberg, to run the company as CEO from Palo Alto. In the 10 years to 2009, SurveyMonkey acquired 2.0 million registered users, created more than 6.0 million surveys and generated over 200 million survey completions.
In 2010, SurveyMonkey secured $100.0 million in senior debt financing from a consortium of financers lead by Bank of America Merrill Lynch and SunTrust Robinson Humphrey. In 2011, SurveyMonkey partnered with TPG Capital to acquire its primary rival, MarketTools. MarketTools was one of the first companies to make online surveys widely available on the internet and was a leading provider of enterprise-feedback management and market research. The acquisition gives SurveyMonkey a portfolio of industry-leading technologies and brands, including CustomerStat, TrueSample, Zoomerang and ZoomPanel. The deal is
Major CompaniesSurveyMonkey | Other Companies
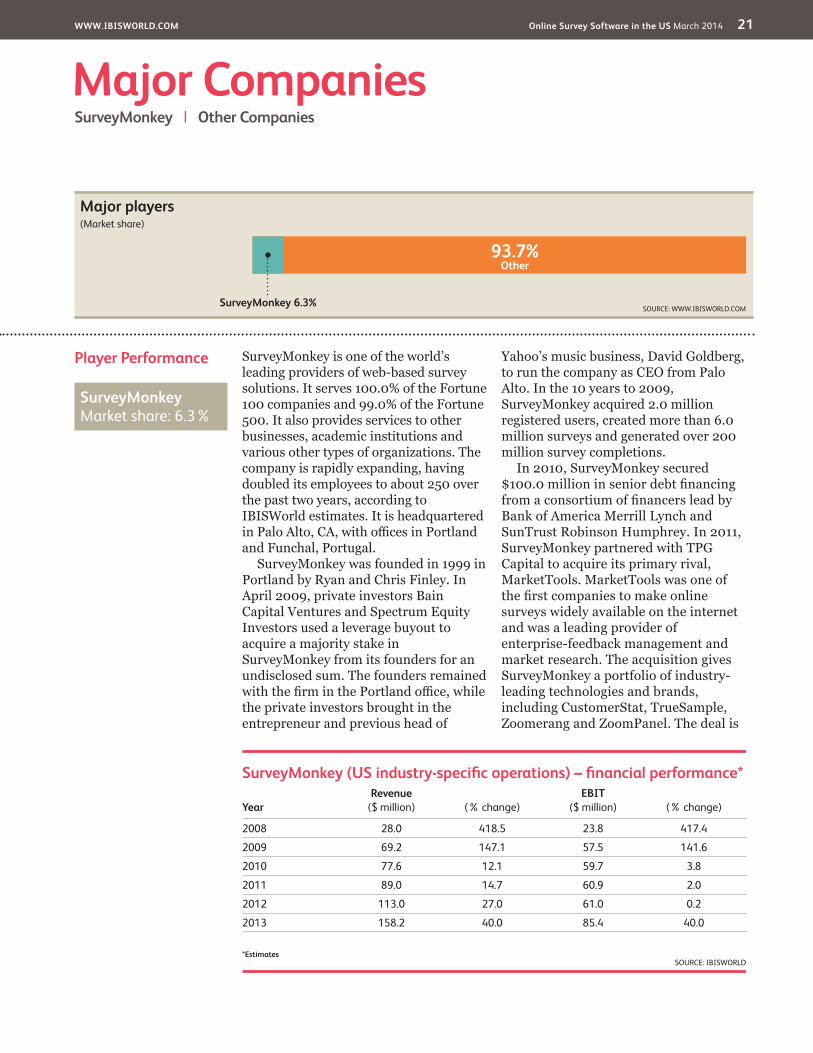
93.7%Other
SurveyMonkey 6.3%SOURCE: WWW.IBISWORLD.COM
Major players(Market share)
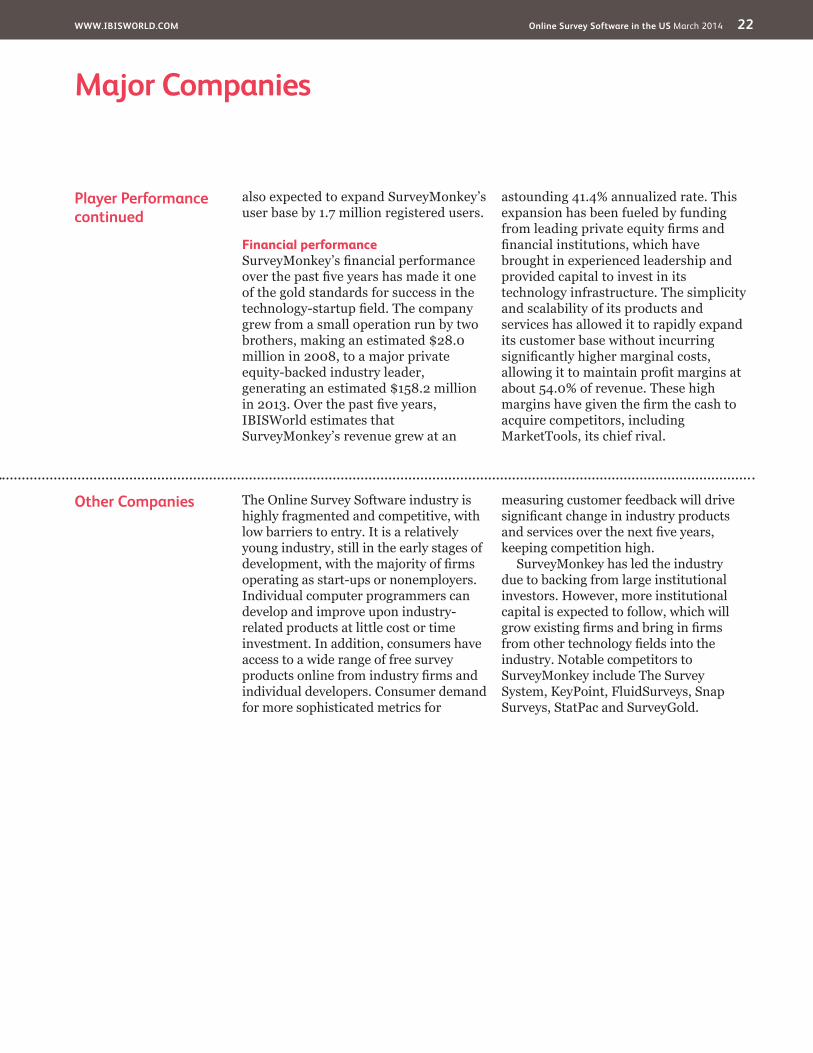
SurveyMonkey (US industry-specifi c operations) – fi nancial performance*
YearRevenue
($ million) (% change)EBIT
($ million) (% change)
2008 28.0 418.5 23.8 417.4
2009 69.2 147.1 57.5 141.6
2010 77.6 12.1 59.7 3.8
2011 89.0 14.7 60.9 2.0
2012 113.0 27.0 61.0 0.2
2013 158.2 40.0 85.4 40.0
*EstimatesSOURCE: IBISWORLD
SurveyMonkey Market share: 6.3%
WWW.IBISWORLD.COM Online Survey Software in the US March 2014 22
Major Companies
Other Companies The Online Survey Software industry is highly fragmented and competitive, with low barriers to entry. It is a relatively young industry, still in the early stages of development, with the majority of firms operating as start-ups or nonemployers. Individual computer programmers can develop and improve upon industry-related products at little cost or time investment. In addition, consumers have access to a wide range of free survey products online from industry firms and individual developers. Consumer demand for more sophisticated metrics for
measuring customer feedback will drive significant change in industry products and services over the next five years, keeping competition high.
SurveyMonkey has led the industry due to backing from large institutional investors. However, more institutional capital is expected to follow, which will grow existing firms and bring in firms from other technology fields into the industry. Notable competitors to SurveyMonkey include The Survey System, KeyPoint, FluidSurveys, Snap Surveys, StatPac and SurveyGold.
Player Performancecontinued
also expected to expand SurveyMonkey’s user base by 1.7 million registered users.
Financial performanceSurveyMonkey’s financial performance over the past five years has made it one of the gold standards for success in the technology-startup field. The company grew from a small operation run by two brothers, making an estimated $28.0 million in 2008, to a major private equity-backed industry leader, generating an estimated $158.2 million in 2013. Over the past five years, IBISWorld estimates that SurveyMonkey’s revenue grew at an
astounding 41.4% annualized rate. This expansion has been fueled by funding from leading private equity firms and financial institutions, which have brought in experienced leadership and provided capital to invest in its technology infrastructure. The simplicity and scalability of its products and services has allowed it to rapidly expand its customer base without incurring significantly higher marginal costs, allowing it to maintain profit margins at about 54.0% of revenue. These high margins have given the firm the cash to acquire competitors, including MarketTools, its chief rival.
WWW.IBISWORLD.COM Online Survey Software in the US March 2014 23
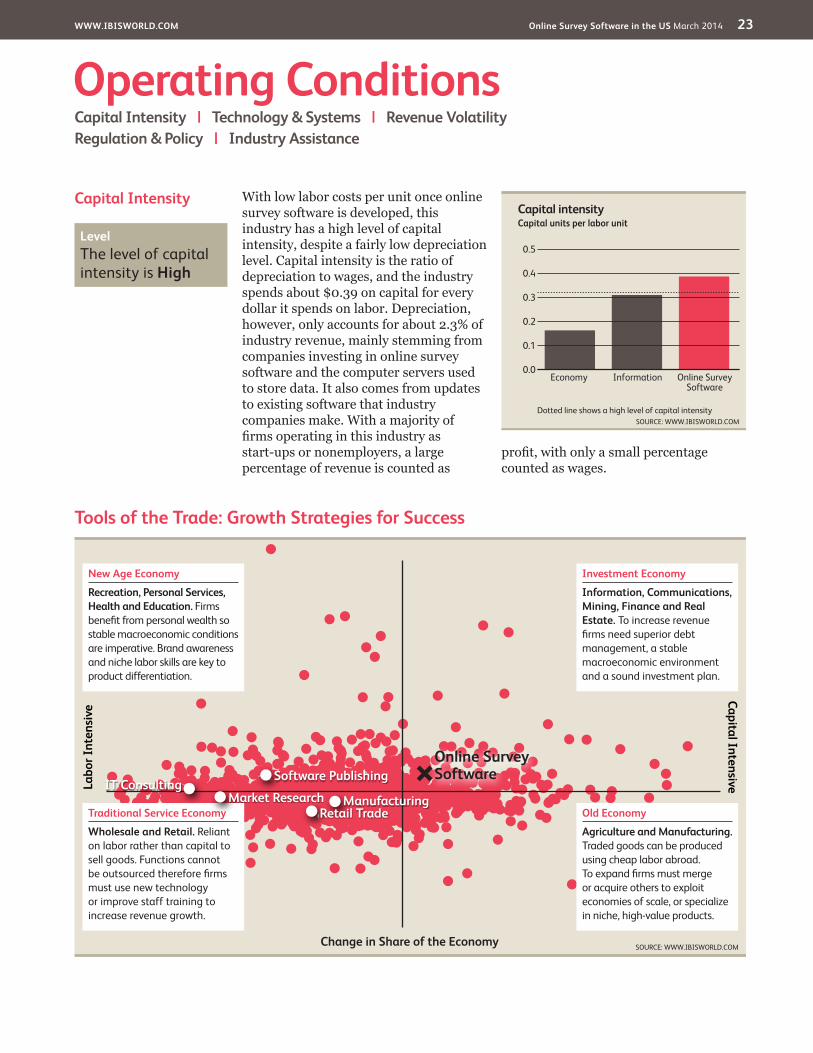
Capital Intensity With low labor costs per unit once online survey software is developed, this industry has a high level of capital intensity, despite a fairly low depreciation level. Capital intensity is the ratio of depreciation to wages, and the industry spends about $0.39 on capital for every dollar it spends on labor. Depreciation, however, only accounts for about 2.3% of industry revenue, mainly stemming from companies investing in online survey software and the computer servers used to store data. It also comes from updates to existing software that industry companies make. With a majority of firms operating in this industry as start-ups or nonemployers, a large percentage of revenue is counted as
profit, with only a small percentage counted as wages.
Operating ConditionsCapital Intensity | Technology & Systems | Revenue VolatilityRegulation & Policy | Industry Assistance
Tools of the Trade: Growth Strategies for Success
SOURCE: WWW.IBISWORLD.COM
Labo
r Int
ensi
veCapital Intensive
Change in Share of the Economy
New Age Economy
Recreation, Personal Services, Health and Education. Firms benefi t from personal wealth so stable macroeconomic conditions are imperative. Brand awareness and niche labor skills are key to product differentiation.
Traditional Service Economy
Wholesale and Retail. Reliant on labor rather than capital to sell goods. Functions cannot be outsourced therefore fi rms must use new technology or improve staff training to increase revenue growth.
Old Economy
Agriculture and Manufacturing. Traded goods can be produced using cheap labor abroad. To expand fi rms must merge or acquire others to exploit economies of scale, or specialize in niche, high-value products.
Investment Economy
Information, Communications, Mining, Finance and Real Estate. To increase revenue fi rms need superior debt management, a stable macroeconomic environment and a sound investment plan.
Software Publishing
ManufacturingIT Consulting
Retail TradeMarket Research
Online Survey Software
Capital intensity
0.5
0.0
0.1
0.2
0.3
0.4
SOURCE: WWW.IBISWORLD.COMDotted line shows a high level of capital intensity
Capital units per labor unit
Online Survey Software
InformationEconomy
Level The level of capital intensity is High
WWW.IBISWORLD.COM Online Survey Software in the US March 2014 24
Operating Conditions
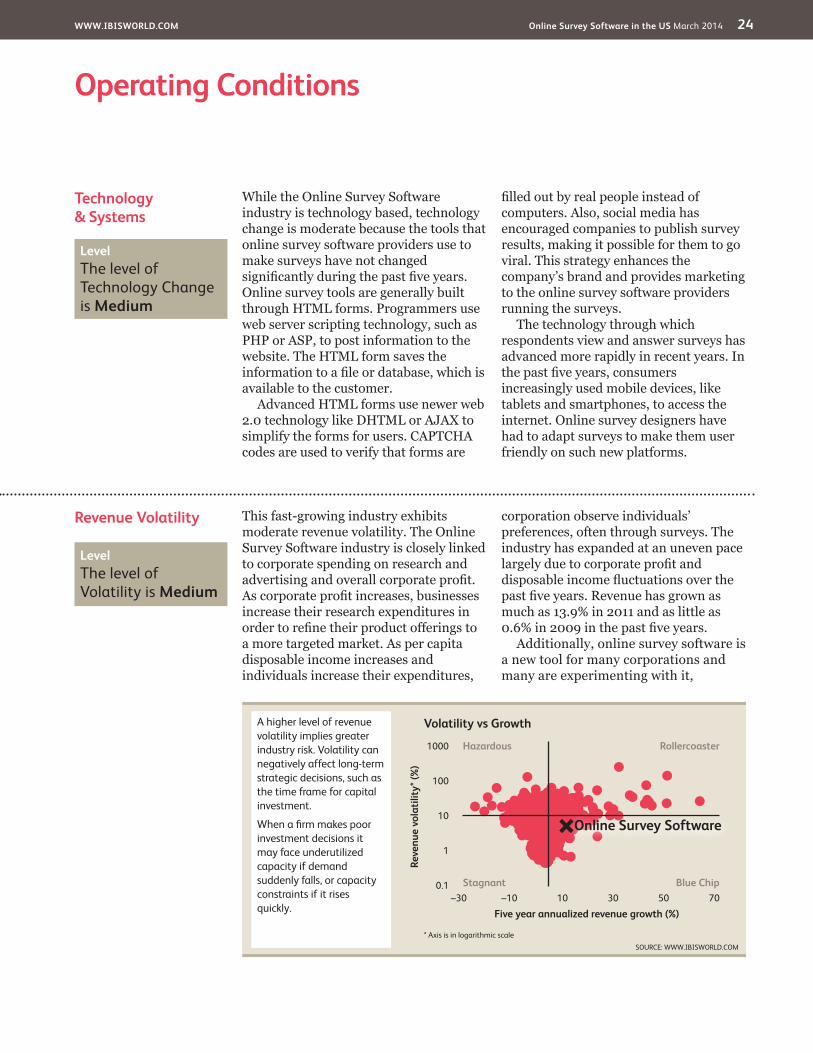
Revenue Volatility This fast-growing industry exhibits moderate revenue volatility. The Online Survey Software industry is closely linked to corporate spending on research and advertising and overall corporate profit. As corporate profit increases, businesses increase their research expenditures in order to refine their product offerings to a more targeted market. As per capita disposable income increases and individuals increase their expenditures,
corporation observe individuals’ preferences, often through surveys. The industry has expanded at an uneven pace largely due to corporate profit and disposable income fluctuations over the past five years. Revenue has grown as much as 13.9% in 2011 and as little as 0.6% in 2009 in the past five years.
Additionally, online survey software is a new tool for many corporations and many are experimenting with it,
Technology& Systems
While the Online Survey Software industry is technology based, technology change is moderate because the tools that online survey software providers use to make surveys have not changed significantly during the past five years. Online survey tools are generally built through HTML forms. Programmers use web server scripting technology, such as PHP or ASP, to post information to the website. The HTML form saves the information to a file or database, which is available to the customer.
Advanced HTML forms use newer web 2.0 technology like DHTML or AJAX to simplify the forms for users. CAPTCHA codes are used to verify that forms are
filled out by real people instead of computers. Also, social media has encouraged companies to publish survey results, making it possible for them to go viral. This strategy enhances the company’s brand and provides marketing to the online survey software providers running the surveys.
The technology through which respondents view and answer surveys has advanced more rapidly in recent years. In the past five years, consumers increasingly used mobile devices, like tablets and smartphones, to access the internet. Online survey designers have had to adapt surveys to make them user friendly on such new platforms.
Level The level of Technology Change is Medium
SOURCE: WWW.IBISWORLD.COM
Volatility vs Growth
Reve
nue
vola
tility
* (%
)
1000
100
10
1
0.1
Five year annualized revenue growth (%)–30 –10 10 30 50 70
Hazardous
Stagnant
Rollercoaster
Blue Chip
* Axis is in logarithmic scale
Online Survey Software
A higher level of revenue volatility implies greater industry risk. Volatility can negatively affect long-term strategic decisions, such as the time frame for capital investment.
When a fi rm makes poor investment decisions it may face underutilized capacity if demand suddenly falls, or capacity constraints if it rises quickly.
Level The level of Volatility is Medium
WWW.IBISWORLD.COM Online Survey Software in the US March 2014 25
Operating Conditions
Industry Assistance While the industry does not receive direct government assistance, it is supported by the Council of American Survey Research Organizations (CASRO), an association that promotes survey research. CASRO supports lobbying initiatives and provides
standards to members, representing more than 300 companies globally. CASRO has also established international survey research standards that are approved by the International Standardization Organization (ISO). See Regulation section for more information.
Regulation & Policy The Online Survey Software industry is still very young and little regulation has been put in place for online surveys. There are, however, optional standards to follow in order to ensure that a particular survey is legitimate and respected.
Market, opinion and social research surveys can be approved through the American National Standards Institute under two separate international standards. The CASRO Institute for Research Quality (CIRQ) provides auditing and certification for both standards, which are classified as ISO 20252 and ISO 26362:2009. The first standard establishes the terms and definitions as well as the service requirements for organizations and
professionals that conduct market, opinion and social research. The second standard specifies the terms and definitions, as well as the service requirements, for organizations and professionals that own or use access panels for market, opinion and social research. It develops the criteria that access panel providers can be evaluated against and the quality by which access panels are assessed. ISO 26362:2009 applies to all types of access panels, whether recruited and used online (e.g. via internet) or offline (e.g. via telephone, mail or face-to-face interaction). While these standards are not mandatory, they signal the professionalism and credibility of certified online survey software.
Revenue Volatilitycontinued
resulting in unpredictable bursts of demand. As demand for this industry’s products becomes more regular and the
services become more mainstream, the industry is expected to expand at a more constant pace.
Level & Trend The level of Regulation is Light and the trend is Steady
Level & Trend The level of Industry Assistance is Low and the trend is Steady
WWW.IBISWORLD.COM Online Survey Software in the US March 2014 26
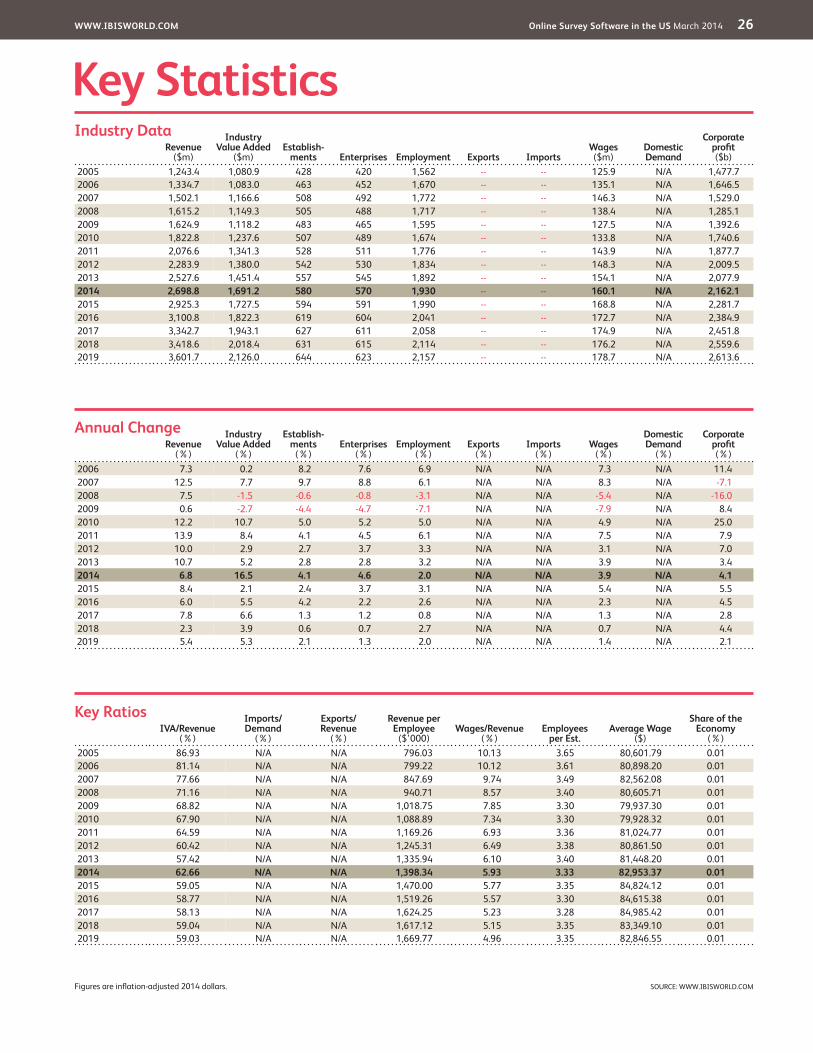
Key StatisticsRevenue
($m)
Industry Value Added
($m)Establish-
ments Enterprises Employment Exports ImportsWages ($m)
Domestic Demand
Corporate profit ($b)
2005 1,243.4 1,080.9 428 420 1,562 -- -- 125.9 N/A 1,477.72006 1,334.7 1,083.0 463 452 1,670 -- -- 135.1 N/A 1,646.52007 1,502.1 1,166.6 508 492 1,772 -- -- 146.3 N/A 1,529.02008 1,615.2 1,149.3 505 488 1,717 -- -- 138.4 N/A 1,285.12009 1,624.9 1,118.2 483 465 1,595 -- -- 127.5 N/A 1,392.62010 1,822.8 1,237.6 507 489 1,674 -- -- 133.8 N/A 1,740.62011 2,076.6 1,341.3 528 511 1,776 -- -- 143.9 N/A 1,877.72012 2,283.9 1,380.0 542 530 1,834 -- -- 148.3 N/A 2,009.52013 2,527.6 1,451.4 557 545 1,892 -- -- 154.1 N/A 2,077.92014 2,698.8 1,691.2 580 570 1,930 -- -- 160.1 N/A 2,162.12015 2,925.3 1,727.5 594 591 1,990 -- -- 168.8 N/A 2,281.72016 3,100.8 1,822.3 619 604 2,041 -- -- 172.7 N/A 2,384.92017 3,342.7 1,943.1 627 611 2,058 -- -- 174.9 N/A 2,451.82018 3,418.6 2,018.4 631 615 2,114 -- -- 176.2 N/A 2,559.62019 3,601.7 2,126.0 644 623 2,157 -- -- 178.7 N/A 2,613.6
IVA/Revenue (%)
Imports/Demand
(%)
Exports/Revenue
(%)
Revenue per Employee
($’000)Wages/Revenue
(%)Employees
per Est.Average Wage
($)
Share of the Economy
(%)2005 86.93 N/A N/A 796.03 10.13 3.65 80,601.79 0.012006 81.14 N/A N/A 799.22 10.12 3.61 80,898.20 0.012007 77.66 N/A N/A 847.69 9.74 3.49 82,562.08 0.012008 71.16 N/A N/A 940.71 8.57 3.40 80,605.71 0.012009 68.82 N/A N/A 1,018.75 7.85 3.30 79,937.30 0.012010 67.90 N/A N/A 1,088.89 7.34 3.30 79,928.32 0.012011 64.59 N/A N/A 1,169.26 6.93 3.36 81,024.77 0.012012 60.42 N/A N/A 1,245.31 6.49 3.38 80,861.50 0.012013 57.42 N/A N/A 1,335.94 6.10 3.40 81,448.20 0.012014 62.66 N/A N/A 1,398.34 5.93 3.33 82,953.37 0.012015 59.05 N/A N/A 1,470.00 5.77 3.35 84,824.12 0.012016 58.77 N/A N/A 1,519.26 5.57 3.30 84,615.38 0.012017 58.13 N/A N/A 1,624.25 5.23 3.28 84,985.42 0.012018 59.04 N/A N/A 1,617.12 5.15 3.35 83,349.10 0.012019 59.03 N/A N/A 1,669.77 4.96 3.35 82,846.55 0.01
Figures are inflation-adjusted 2014 dollars.
Revenue (%)
Industry Value Added
(%)
Establish-ments
(%)Enterprises
(%)Employment
(%)Exports
(%)Imports
(%)Wages
(%)
Domestic Demand
(%)
Corporate profit (%)
2006 7.3 0.2 8.2 7.6 6.9 N/A N/A 7.3 N/A 11.42007 12.5 7.7 9.7 8.8 6.1 N/A N/A 8.3 N/A -7.12008 7.5 -1.5 -0.6 -0.8 -3.1 N/A N/A -5.4 N/A -16.02009 0.6 -2.7 -4.4 -4.7 -7.1 N/A N/A -7.9 N/A 8.42010 12.2 10.7 5.0 5.2 5.0 N/A N/A 4.9 N/A 25.02011 13.9 8.4 4.1 4.5 6.1 N/A N/A 7.5 N/A 7.92012 10.0 2.9 2.7 3.7 3.3 N/A N/A 3.1 N/A 7.02013 10.7 5.2 2.8 2.8 3.2 N/A N/A 3.9 N/A 3.42014 6.8 16.5 4.1 4.6 2.0 N/A N/A 3.9 N/A 4.12015 8.4 2.1 2.4 3.7 3.1 N/A N/A 5.4 N/A 5.52016 6.0 5.5 4.2 2.2 2.6 N/A N/A 2.3 N/A 4.52017 7.8 6.6 1.3 1.2 0.8 N/A N/A 1.3 N/A 2.82018 2.3 3.9 0.6 0.7 2.7 N/A N/A 0.7 N/A 4.4
2019 5.4 5.3 2.1 1.3 2.0 N/A N/A 1.4 N/A 2.1
Annual Change
Key Ratios
Industry Data
SOURCE: WWW.IBISWORLD.COM
WWW.IBISWORLD.COM Online Survey Software in the US March 2014 27
Jargon & Glossary
BARRIERS TO ENTRY High barriers to entry mean that new companies struggle to enter an industry, while low barriers mean it is easy for new companies to enter an industry.
CAPITAL INTENSITY Compares the amount of money spent on capital (plant, machinery and equipment) with that spent on labor. IBISWorld uses the ratio of depreciation to wages as a proxy for capital intensity. High capital intensity is more than $0.333 of capital to $1 of labor; medium is $0.125 to $0.333 of capital to $1 of labor; low is less than $0.125 of capital for every $1 of labor.
CONSTANT PRICES The dollar figures in the Key Statistics table, including forecasts, are adjusted for inflation using the current year (i.e. year published) as the base year. This removes the impact of changes in the purchasing power of the dollar, leaving only the “real” growth or decline in industry metrics. The inflation adjustments in IBISWorld’s reports are made using the US Bureau of Economic Analysis’ implicit GDP price deflator.
DOMESTIC DEMAND Spending on industry goods and services within the United States, regardless of their country of origin. It is derived by adding imports to industry revenue, and then subtracting exports.
EMPLOYMENT The number of permanent, part-time, temporary and seasonal employees, working proprietors, partners, managers and executives within the industry.
ENTERPRISE A division that is separately managed and keeps management accounts. Each enterprise consists of one or more establishments that are under common ownership or control.
ESTABLISHMENT The smallest type of accounting unit within an enterprise, an establishment is a single physical location where business is conducted or where services or industrial operations are performed. Multiple establishments under common control make up an enterprise.
EXPORTS Total value of industry goods and services sold by US companies to customers abroad.
IMPORTS Total value of industry goods and services brought in from foreign countries to be sold in the United States.
INDUSTRY CONCENTRATION An indicator of the dominance of the top four players in an industry. Concentration is considered high if the top players account for more than 70% of industry revenue. Medium is 40% to 70% of industry revenue. Low is less than 40%.
INDUSTRY REVENUE The total sales of industry goods and services (exclusive of excise and sales tax); subsidies on production; all other operating income from outside the firm (such as commission income, repair and service income, and rent, leasing and hiring income); and capital work done by rental or lease. Receipts from interest royalties, dividends and the sale of fixed tangible assets are excluded.
INDUSTRY VALUE ADDED (IVA) The market value of goods and services produced by the industry minus the cost of goods and services used in production. IVA is also described as the industry’s contribution to GDP, or profit plus wages and depreciation.
INTERNATIONAL TRADE The level of international trade is determined by ratios of exports to revenue and imports to domestic demand. For exports/revenue: low is less than 5%, medium is 5% to 20%, and high is more than 20%. Imports/domestic demand: low is less than 5%, medium is 5% to 35%, and high is more than 35%.
LIFE CYCLE All industries go through periods of growth, maturity and decline. IBISWorld determines an industry’s life cycle by considering its growth rate (measured by IVA) compared with GDP; the growth rate of the number of establishments; the amount of change the industry’s products are undergoing; the rate of technological change; and the level of customer acceptance of industry products and services.
NONEMPLOYING ESTABLISHMENT Businesses with no paid employment or payroll, also known as nonemployers. These are mostly set up by self-employed individuals.
PROFIT IBISWorld uses earnings before interest and tax (EBIT) as an indicator of a company’s profitability. It is calculated as revenue minus expenses, excluding interest and tax.
Industry Jargon
IBISWorld Glossary
CLICK-THROUGH A method of internet advertising that tracks the number of consumers that click on an advertisement on a website.
SMARTPHONE A mobile phone that offers advanced PC-like capabilities.
SPSS A computer program used for survey authoring and deployment published by IBM.
SYNDICATED RESEARCH Studies in which the sponsoring research company defines an audience to survey and the interval between studies and the survey questions. Clients share the results through a subscription service.

WWW.IBISWORLD.COM Online Survey Software in the US March 2014 28
Jargon & Glossary
VOLATILITY The level of volatility is determined by averaging the absolute change in revenue in each of the past five years. Volatility levels: very high is more than ±20%; high volatility is ±10% to ±20%; moderate volatility is ±3% to ±10%; and low volatility is less than ±3%.
WAGES The gross total wages and salaries of all employees in the industry. The cost of benefits is also included in this figure.
IBISWorld Glossarycontinued

Disclaimer
This product has been supplied by IBISWorld Inc. (‘IBISWorld’) solely for use by its authorized licensees strictly in accordance with their license agreements with IBISWorld. IBISWorld makes no representation to any other person with regard to the completeness or accuracy of the data or information contained herein, and it accepts no responsibility and disclaims all liability (save for liability which cannot be lawfully disclaimed) for loss or damage whatsoever suffered or incurred by any other person resulting from
the use of, or reliance upon, the data or information contained herein. Copyright in this publication is owned by IBISWorld Inc. The publication is sold on the basis that the purchaser agrees not to copy the material contained within it for other than the purchasers own purposes. In the event that the purchaser uses or quotes from the material in this publication – in papers, reports, or opinions prepared for any other person – it is agreed that it will be sourced to: IBISWorld Inc.
At IBISWorld we know that industry intelligence is more than assembling factsIt is combining data with analysis to answer the questions that successful businesses askIdentify high growth, emerging & shrinking marketsArm yourself with the latest industry intelligenceAssess competitive threats from existing & new entrantsBenchmark your performance against the competitionMake speedy market-ready, profit-maximizing decisions
Who is IBISWorld?We are strategists, analysts, researchers, and marketers. We provide answers to information-hungry, time-poor businesses. Our goal is to provide real world answers that matter to your business in our 700 US industry reports. When tough strategic, budget, sales and marketing decisions need to be made, our suite of Industry and Risk intelligence products give you deeply-researched answers quickly.
IBISWorld MembershipIBISWorld offers tailored membership packages to meet your needs.
Copyright 2014 IBISWorld Inc
www.ibisworld.com | 1-800-330-3772 | [email protected]
Related Documents