OCULAR COUNTER ROTATION DURING GAZE SHIFTS by Bernard Philimon Bechara Bachelor of Biomedical Engineering, University of Minnesota, 2005 Submitted to the Graduate Faculty of Swanson School of Engineering in partial fulfillment of the requirements for the degree of Master of Science University of Pittsburgh 2008

Welcome message from author
This document is posted to help you gain knowledge. Please leave a comment to let me know what you think about it! Share it to your friends and learn new things together.
Transcript
OCULAR COUNTER ROTATION DURING GAZE SHIFTS
by
Bernard Philimon Bechara
Bachelor of Biomedical Engineering, University of Minnesota, 2005
Submitted to the Graduate Faculty of
Swanson School of Engineering in partial fulfillment
of the requirements for the degree of
Master of Science
University of Pittsburgh
2008

UNIVERSITY OF PITTSBURGH
SWANSON SCHOOL OF ENGINEERING
This thesis was presented
by
Bernard Philimon Bechara
It was defended on
April 8, 2008
and approved by
Sanjeev G. Shroff, Professor, Department of Bioengineering
Douglas J. Weber, Assistant Professor, Department of Physical Medicine and
Rehabilitation
Marc A. Sommer, Assistant Professor, Department of Neuroscience and Center for the
Neural Basis of Cognition
Thesis Advisor: Neeraj J. Gandhi, Assistant Professor, Department of Otolaryngology
ii

Copyright © by Bernard Philimon Bechara
2008
iii

OCULAR COUNTER ROTATION DURING GAZE SHIFTS Bernard Philimon Bechara, M.S. University of Pittsburgh, 2008
Abducens motor neurons (ABD) are known to receive oculomotor signals via the
excitatory and inhibitory burst neurons (BN) as well as head velocity related signals via the
vestibular nucleus (VN). If the oculomotor input to the ABD was the same, would there be a
difference in the properties of the observed eye movement between head restrained (HR) and
head unrestrained (HU) gaze shifts? To answer this question, the activity of 22 BN was recorded
during HR and HU visual motor tasks performed by non human primates. A template matching
algorithm was used to find a pair of trials (HR, HU) with matching BN activity. This guaranteed
that the oculomotor input to the ABD was the same. Matched trials were found to have similar
gaze amplitudes, but the peak eye velocity of HU movement was lower than HR movement. A
time varying gain of the head velocity input was calculated as the ratio of the difference between
the eye velocities over the head velocity. This yielded a gain that was high at the onset of the
movement, decreased through out the gaze shift and plateau at one after gaze shift offset. Thus
the head movement was highly inhibiting the eye movement at HU gaze onset which decreased
throughout the gaze shift until it reached and remained at one at the end of the gaze shift. Finally
a computer simulation was used to check if the difference in the eye velocities could be
explained by VN inputs. The simulation modeled the difference in ABD firing rate (ΔABD)
between HR and HU matched trials as the weighted sum of the difference in the firing rate of VN
(ΔPVPc, ΔPVPi and ΔEHc) input. The BN input was not used in this model because for matched
iv
bechbp
Typewritten Text
bechbp
Typewritten Text

trials the input was the same, thus the difference was equal to zero. The simulation showed that
the weight of EHc cells input was the highest, thus accounting for most of the difference in the
ABD. This lead to the conclusion that EHc cells played a major role in reducing the eye velocity
during head unrestrained gaze shifts.
v

TABLE OF CONTENTS
PREFACE .................................................................................................................................... XI
1.0 INTRODUCTION ........................................................................................................ 1
2.0 METHODS ................................................................................................................... 5
2.1 SURGICAL METHODS ..................................................................................... 5
2.2 EXPERIMENTAL SETUP AND BEHAVIORAL TASKS ............................. 6
2.3 SINGLE UNIT RECORDINGS ......................................................................... 8
2.4 DATA ANALYSIS ............................................................................................... 9
2.4.1 Identification of BN: ..................................................................................... 9
2.4.2 Template matching: .................................................................................... 10
2.4.3 Counter rotation gain: ................................................................................ 11
2.4.4 Model simulation: ....................................................................................... 12
3.0 RESULTS ................................................................................................................... 15
3.1 CHARACTERIZING BN ................................................................................. 15
3.2 TEMPLATE MATCHING ............................................................................... 17
3.3 COUNTER ROTATION GAIN ....................................................................... 21
3.4 ADDITIONAL CONSIDERATIONS .............................................................. 25
3.5 SIMULATION RESULTS ................................................................................ 26
4.0 DISCUSSION ............................................................................................................. 29
vi

4.1 NEURAL SUBSTRATES MEDIATING THE COUNTER-ROTATION
GAIN 30
4.2 FUNCTIONAL SIGNIFICANCE OF COUNTER-ROTATION GAIN ...... 32
BIBLIOGRAPHY ....................................................................................................................... 36
vii

LIST OF TABLES
Table 1: Parameters used in equation 6 to calculate the weights of the simulation model. ......... 13
viii
LIST OF FIGURES
Figure 1: Schematic diagram of inputs and output to the ABD during head restrained (panel A), and head unrestrained (panel B) movements. ................................................................................. 2
Figure 2: Panel A and B display the HR “delay” and HU “head align delay” tasks respectively. The dotted circle indicates a window constraint of 4deg around each eye target. Moreover during the head align step in HU task the window was increased to 7 deg. .............................................. 7
Figure 3: A weighted model of the inputs to the ABD. ipsilateral PVP as well as contralateral PVP and EH are the inputs from the vestibular system. The oculomotor neural integrator is represented as the integral of the BN. These two inputs reflect the oculomotor input to the ABD. Filled circle indicates inhibitory input, while filled arrows are excitatory. .................................. 12
Figure 4: HR gaze amplitude and duration are linearly correlated to BN number of spikes and burst duration respectively in panels A and B. Each line represents one cell. Linear regression was used to fit this data as shown in the inset as an example cell. ............................................... 17
Figure 5: Two examples of matching bursts (A and B) and their respective eye position (C and D) and eye velocity (E and F). Blue and red traces represent HR and HU trials respectively. The bursts are aligned on burst onset, while the position and velocity traces are aligned on eye movement onset. ........................................................................................................................... 18
Figure 6: Burst duration and peak burst activity of HR and HU trials with matched bursts. The slope of the linear regression fit was 1.03 and 0.992 for panels A and B respectively indicating that the matched bursts had similar durations and peaks. ............................................................. 19
Figure 7: Panel A shows HR gaze amplitude compared to HU gaze amplitude of matched trials across all cells. In addition Panel B compares HR gaze amplitude and HU eye amplitude across all cells. Dashed lines represent the unity line. ............................................................................. 20
ix

Figure 8: Panel A plots HR gaze velocity and HU gaze velocity. Panel B compares HR gaze velocity to HU eye velocity. The solid line represents the linear regression fit with slopes for A and B equal to 0.896 and 0.869 respectively. ............................................................................... 20
Figure 9: An example of the calculation of the counter rotation gain α (green) using equation 3. Dashed horizontal line indicates an α of value one. Panel A shows HR eye (blue), HU eye (red) and HU head (black) velocities traces for a matched pair. Panel B displays α profiles aligned on gaze onset for similar HU gaze amplitude. The decreasing trend is clear with high variability at the beginning and the dip around gaze offset. Panel C is the same as Panel B but all profiles are aligned on gaze offset to better show the decreaseing trend and the dip artifact. Panel D shows the velocity profiles with the HR eye velocity stretched such that the duration of HR and HU are equal (indicated by the arrows). This was done to account for the dip artifact at gaze offset as shown in Panel E and F. ................................................................................................................ 22
Figure 10: Alpha profiles aligned on gaze offset and grouped according to HU gaze amplitude (30, 40 and 50 deg) for four example cells after stretching the HR eye velocity. Each panel contains 6 profiles. The dashed horizontal line indicates alpha value equal to one. α is variable at the onset of the gaze shift, decreases throughout the movement and stabilizes at one after gaze shift offset. .................................................................................................................................... 24
Figure 11: Top row shows the firing rates of VN inputs and the ABD during HR (blue) and HU (red) movements for matched BN. The difference in the firing rate (blue-red) is shown in the middle row as they are used in equation 6 to calculate the optimal weight for the physiologic model using linear regression. The weighted inputs are summed (thick black dotted trace in bottom right panel) and compared to the difference in the ABD firing rate. The calculations show that EH cells have the highest weight and role in accounting for the ABD difference. ............... 28
x

xi
PREFACE
This work could not have been done without those who surrounded me through my graduate
years; advisors, coworkers and friends whom with their great support, motivated me and
strengthened me through out this learning journey. Great thanks to Raj Gandhi for his advice and
mentorship. Also I would like to thank Gloria Duffy for her help in the experiments and handling
the animals. And finally I thank my friends and family for always being there when I need them.

1.0 INTRODUCTION
To align the visual axis on an object of interest one must shift the line of sight (gaze) by rapidly
moving the eyes in their orbits. For large changes in gaze, a head movement typically
accompanies the eye-in-head movement. Such combined movements of the eyes in the orbits and
the head in space are referred to as head-unrestrained (HU) gaze shifts. For smaller changes in
gaze or when the head is immobilized, rapid changes in the visual axis are limited to eye
movements within the orbits. We refer to such movements as head-restrained (HR) gaze shifts
or saccades.
Extraocular motoneurons in the brain stem control eye movements within the orbits. For
a conjugate horizontal eye movement, abducens (ABD) motoneurons directly innervate the
lateral rectus muscle of the ipsilateral eye, and abducens internuclear neurons project to the
medial rectus muscle of the contralateral eye via the oculomotor motoneuron. The ABD, in turn,
receives major oculomotor and vestibular afferent inputs from the paramedian pontine reticular
formation (PPRF) and the vestibular nucleus (VN), respectively as shown in Figure 1 [1]. Each
input, in isolation, commands a specific type of eye movement. Premotor burst neurons (BN), or
saccadic burst generator neurons, in the PPRF issue a time variant eye velocity command. The
signal is relayed by the ABD to generate a rapid, horizontal movement of the eyes within the
orbits. When the head is restrained, contributions from the VN pathway are considered negligible
because the presumed dominant input of the position-vestibular-pause (PVP) neurons is
1

suppressed during ipsiversive saccades [2] Thus the observed eye velocity during HR gaze
shifts equals the eye velocity command . )(tEor& )(tEc
&
)()( tEtE cor&& = (1)
On the other hand, inputs from the vestibular pathway are generally analyzed in the
context of the vestibulo-ocular reflex (VOR). During slow-phase eye movement responses to
vestibular stimulation, such as during whole-body rotation in the dark, the oculomotor input is
absent ( ). The putative PVP neurons encode a head velocity related signal
(Figure 1), and the ABD response to this input is a counter rotation movement of the eye relative
to the head. Under normal conditions, the observed eye velocity equals the head velocity
but is 180° out of phase . Hence α is constant, equals one, and reflects the VOR
gain.
0)( =tEc& )(tH&α−
)(tEo&
))()(( tHtEo&& −=
Figure 1: Schematic diagram of inputs and output to the ABD during head restrained (panel A), and head
unrestrained (panel B) movements.
During coordinated eye-head movements, however, the two inputs do not operate in
isolation, and the ABD output must account for both oculomotor and vestibular signals. Thus, as
shown in Figure 1, the observed eye velocity during HU gaze shifts is a function of both inputs.
)()()( tHtEtE cou&&& α−= (2)
2

The primary aim of this study is to characterize the gain α during HU gaze shifts. To
address our objective, we matched the burst profiles of BN activity recorded from the same
neuron during HR and HU gaze shifts. In other words, we identified HR and HU trials with a
near identical . Using this approach, equations 1 and 2 can be combined to form: )(tEc&
)()()()()()(
tHtEtEtHtEtE ouor
orou &
&&&&& −
=⇒−= αα (3)
This characterization indicates that the gain α 1) no longer equals the negative of the
ratio of eye and head velocities, as used for standard VOR gain calculations, and 2) is a time-
varying function that depends on the dynamics of eye and head velocity profiles. Furthermore, α
should not be viewed as an indicator of VOR gain alone. Typically, VOR gain is calculated
based on passive head movements and, from a neurophysiological perspective, the PVP neurons
have been argued to reveal the neural correlate of this gain. Our rationale depends on a different
formulation (equation 3) and is based solely on active head movements. Furthermore, our results
suggest that in addition to the presumed dominant contribution of the PVP neurons, eye-head
(EH) neurons also participate in the VOR pathway, which is supported by the significant
modulation reported in their activity patterns during HU gaze shifts [3]. Thus, we view gain α as
a generalized counter-rotation gain that incorporates but is not limited to the VOR dynamics.
In addition to the above approach, this study also addresses the possible neural
correlates of this counter rotation gain. From equation 3 it can be inferred that any difference in
the eye velocity between HR and HU gaze shifts is attributed to the counter rotation gain that is
due to the head movement. Within the framework of Figure 1, the difference in the observed eye
velocities can be modeled as the difference in the ABD firing rate that, in turn, can be simulated
as the difference in the firing rates of the vestibular pathway inputs during matched HU and HR
3

trials. Note that the difference in the oculomotor input is zero because of the matched burst
profiles in two trials. We constructed a model that simulates the firing rates of the ABD as well
as the VN inputs (PVP and EH) during both HR and HU gaze shifts. Then, we modeled the
difference in the ABD firing rate as a weighted sum of the differences in the PVP and EH firing
rates during HR and HU gaze shifts. A set of optimal weights were calculated for this model to
further understand the role of these individual VN inputs during HU gaze shifts.
4

2.0 METHODS
2.1 SURGICAL METHODS
Approval for this study was granted by the Insitutional Animal Care and Use Committee for the
University of Pittsburgh, and all procedures were in compliance with guidelines of the Public
Health Service Policy on Humane Care of Laboratory Animals. Two male rhesus macaque
monkeys (Macaca mulatta) served as subjects. Under aseptic techniques and isoflurane
anesthesia, each monkey underwent surgery to implant a Teflon-coated stainless steel coil
beneath the conjunctiva of one eye. In the same procedure, a head restraining post was attached
with bone cement (Palacos) to titanium screws that were implanted in the skull. A second Teflon
coated coil was placed in the bone cement to monitor head position. In a second surgical
procedure performed following training on behavioral tasks (see below), a stainless steel
chamber was secured over a craniotomy. The receptacle was tilted 26° in the frontal plane [4].
Microelectrode penetrations from this angle provided access to the excitatory and inhibitory
burst neuron regions on both sides of the midline.
5

2.2 EXPERIMENTAL SETUP AND BEHAVIORAL TASKS
Monkeys were trained to sit in a primate chair that was equipped to easily restrain or release the
head during HR and HU tasks. Control of the experimental setup and data collection were
accomplished through the use of custom software written in LabView [5]. Visual targets were
presented on a cylindrical board fitted with tri-state light emitting diodes (LEDs) that spanned
96° horizontally and 80° vertically in 2° increments. A miniature laser module was mounted on
the head-restraint post. When turned on, the laser emitted a red beam and served to provide
visual feedback regarding head position. The magnetic field induction technique was used to
sense gaze (eye-in-space) and head-in-space positions from the stainless steel coils implanted on
the eye and head, respectively. Eye-in-head position was calculated online as the difference
between gaze and head positions. Moreover blinks were recorded by taping a stainless steel coil
on the monkey’s eye lid during the experiment. Additional details on blink measurements can be
found elsewhere [6]. Gaze, head and blink position data were sampled at 1 KHz.
When the head was restrained, the monkey was presented with a delayed saccade task
(Figure 2A). The monkey was required to first direct its visual axis on a green LED. While
maintaining this fixation, a yellow LED was presented in the periphery. After a random “delay”
period (300-1000 ms) the green LED was turned off, which cued the monkey to perform a HR
gaze shift toward the yellow LED to receive a liquid reward. To achieve a wide range of saccade
amplitudes the position of the green target was varied. As a consequence, the eyes were not
always initially centered in their orbits. When the head was unrestrained, the monkey was
presented with a delayed gaze shift task associated with a head alignment requirement (Fig. 2B).
In this task the head-mounted miniature laser and a red LED were illuminated, and the animal
had to align both the laser and its gaze with the red stimulus. This step ensured that the eyes are
6

roughly centered in their orbits because both the eyes and the head were aligned on the same
target. After a random period of gaze and head fixation (400-800 msec), the laser was turned off,
and the red LED was switched to green. The animal had to continue to fixate the green LED for
another 500-900 msec, but no additional constraint was placed on the head alignment although it
was typically maintained. As the monkey maintained fixation, a yellow LED was presented in
the periphery. The animal was required to hold fixation on the green LED for a random “delay”
period (300-1000 msec), after which the green LED was turned off. The animal then initiated a
gaze shift to the yellow LED and held fixation for 500-900 msec to obtain the liquid reward.
Through out both HR and HU tasks, visual fixation and head alignment were required to be
within 4° and 7° radius windows, respectively.
Figure 2: Panel A and B display the HR “delay” and HU “head align delay” tasks respectively. The dotted
circle indicates a window constraint of 4deg around each eye target. Moreover during the head align step in HU task
the window was increased to 7 deg.
A B
7

2.3 SINGLE UNIT RECORDINGS
Tungsten microelectrodes (~1.5MΩ impedance, Microprobe) were used to record extracellular
activity of burst neurons within the PPRF. These cells were identified on the basis of their
anatomical location (EBNs: 1–2 mm rostral to the ABD nucleus, 0.5–1.5 mm from the midline;
IBNs: 0–2 mm caudal to the ABD nucleus, 0.5–1.5 mm from the midline)[7]. Microstimulation
was also used occasionally to identify the region. Stimulation (intensity: 30μA, duration: 200 ms,
frequency: 300 Hz) of the BN region evoked a ramp-like horizontal eye movement which
brought the eyes to a new eye position without a return [4, 8]. Well isolated action potentials of
BN were amplified, filtered and detected using a window threshold discriminator (Bak
Electronics), and time-stamped at a frequency of 20 MHz.. The cell’s on-direction was denoted
as the direction of the eye movement evoking a high frequency neuronal burst. The activity of
BN was first recorded as the animal performed the oculomotor tasks in one condition (e.g., head-
restrained). After a sufficient number of trials were collected, the head was unrestrained (or
restrained, if the head was initially free to move) while maintaining isolation of the same cell and
the activity was recorded as the animal produced movements in the second condition (e.g. head-
unrestrained).
8

2.4 DATA ANALYSIS
Data was analyzed offline using Matlab and custom software. For the behavioral data, the onset
and offset of gaze and eye-in-head components were identified using a velocity threshold
criterion of 50°/sec and 30°/sec, respectively. Head movements were identified using a slightly
more complex velocity threshold algorithm, as described previously [9, 10]. Blinks were also
detected using a velocity threshold (50°/sec) but they were visually inspected and corrected to
ensure accurate measurement. Trials in which blinks occurred during gaze shifts were removed
from further analyses because blinks alter the dynamics of the eye velocity time profile [11] and
modify the discharge pattern of burst neurons in the superior colliculus [12] and the PPRF
(Bechara and Gandhi, unpublished observations). Inclusion of such trials would have added
unwanted variance in the burst matching algorithm.
2.4.1 Identification of BN:
Both excitatory burst neurons (EBNs) and inhibitory burst neurons (IBNs) exhibit similar
discharge characteristics during saccades [13-18], and each is thought to be driven by the same
motor error signal [19, 20]. Anatomically, the EBNs project to the IBNs [21, 22] and both
groups innervate the abducens nucleus [22, 23]. These properties have often led to a combined
treatment of EBNs and IBNs into one group of burst neurons [e.g., 7], and we have adopted the
same strategy as well. Confidence in the assessment of BN was gained by correlating neural
activity and movement parameters. Burst onset was defined as the instant of the first spike, while
the offset was considered as the time when 95% of the spikes have occurred. Visual inspection
was used to monitor the automatic detection measures. Detecting the exact onset and offset times
9

was not critical, however, since analyses dependent on these static parameter were used for
assessment purposes only. Linear regression analysis was performed to determine the relation
between the number of spikes in the BN burst and the amplitude of HR gaze shifts, as well as
between the durations of the burst and the saccade. The spike density function of BNs, which
was obtained by convolving a Gaussian function of 5 ms width with the spike train, was also
modeled as a linear combination of bias and eye velocity ( ). The
parameters of the model, b (Hz) and r (Hz/deg/sec), were estimated using system identification
techniques [24]. Half of the trials were picked at random and used to estimate the parameters
while the other half were used to test the goodness of fit. This was executed 10,000 times to
ensure robust calculation of b and r. The parameter td (msec) represents the time needed for the
signal from the neuron to reach the muscles, and the time for the muscle to get activated and
generate a movement. A range of td values (0-25 ms) were tested, and the delay that minimized
the root mean-squared error (rmse) between the simulated and actual firing rates was considered
optimal. The goodness of fit of the model with the optimal td was determined by calculating the
variance accounted for (VAF) criterion, defined as
)(* tdtErbFREBN −+= &
))
datadata
var(var( fit1 −
− . Note that the VAF of a
linear model is equivalent to square of the correlation coefficient.
2.4.2 Template matching:
Burst activity during each HU gaze shift was compared to the activity of every HR gaze shift.
Each pair of bursts was aligned on its onset and compared for the duration of the HU burst. The
pair with the lowest rmse value was considered a matched pair. These matches were visually
inspected to ensure reasonable matching. For each neuron, the matched pair was further
10
evaluated quantitatively by comparing the burst durations and the peak firing rates of the paired
HR and HU trials and by computing the variance accounted for by a linear regression between
the burst profiles.
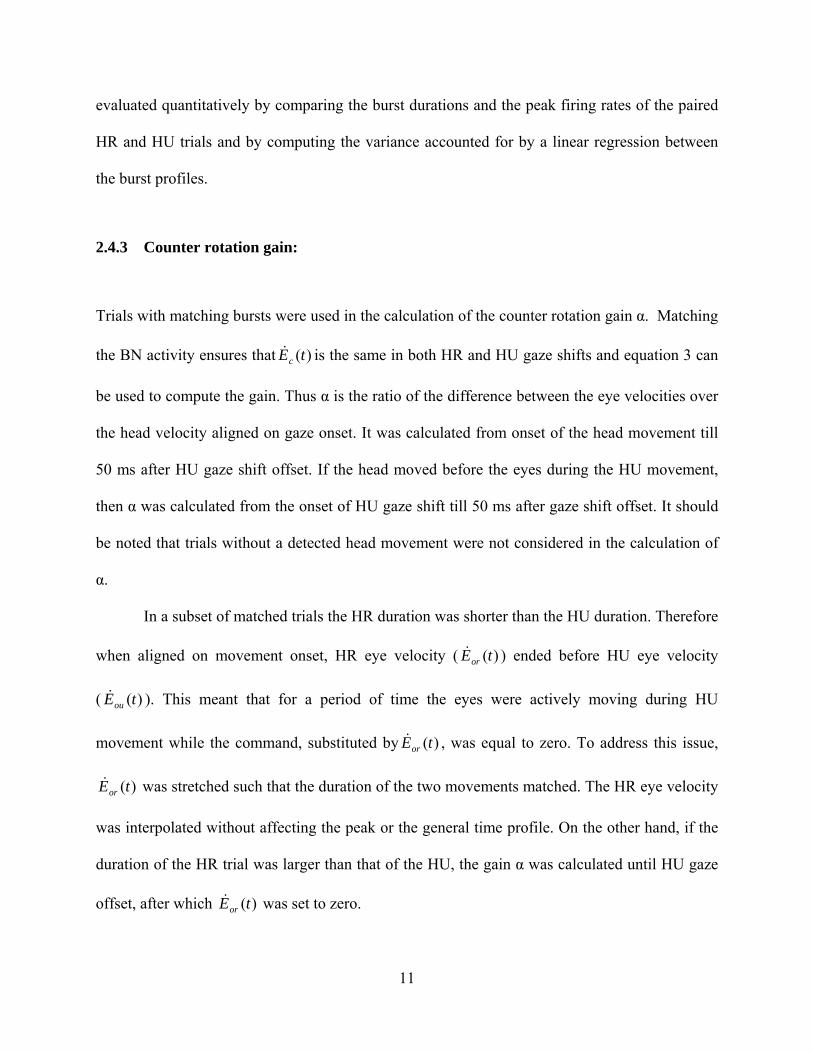
2.4.3 Counter rotation gain:
Trials with matching bursts were used in the calculation of the counter rotation gain α. Matching
the BN activity ensures that is the same in both HR and HU gaze shifts and equation 3 can
be used to compute the gain. Thus α is the ratio of the difference between the eye velocities over
the head velocity aligned on gaze onset. It was calculated from onset of the head movement till
50 ms after HU gaze shift offset. If the head moved before the eyes during the HU movement,
then α was calculated from the onset of HU gaze shift till 50 ms after gaze shift offset. It should
be noted that trials without a detected head movement were not considered in the calculation of
α.
)(tEc&
In a subset of matched trials the HR duration was shorter than the HU duration. Therefore
when aligned on movement onset, HR eye velocity ( ) ended before HU eye velocity
( ) ). This meant that for a period of time the eyes were actively moving during HU
movement while the command, substituted by , was equal to zero. To address this issue,
was stretched such that the duration of the two movements matched. The HR eye velocity
was interpolated without affecting the peak or the general time profile. On the other hand, if the
duration of the HR trial was larger than that of the HU, the gain α was calculated until HU gaze
offset, after which was set to zero.
)(tEor&
(tEou&
)(tEor&
)(tEor&
)(tEor&
11
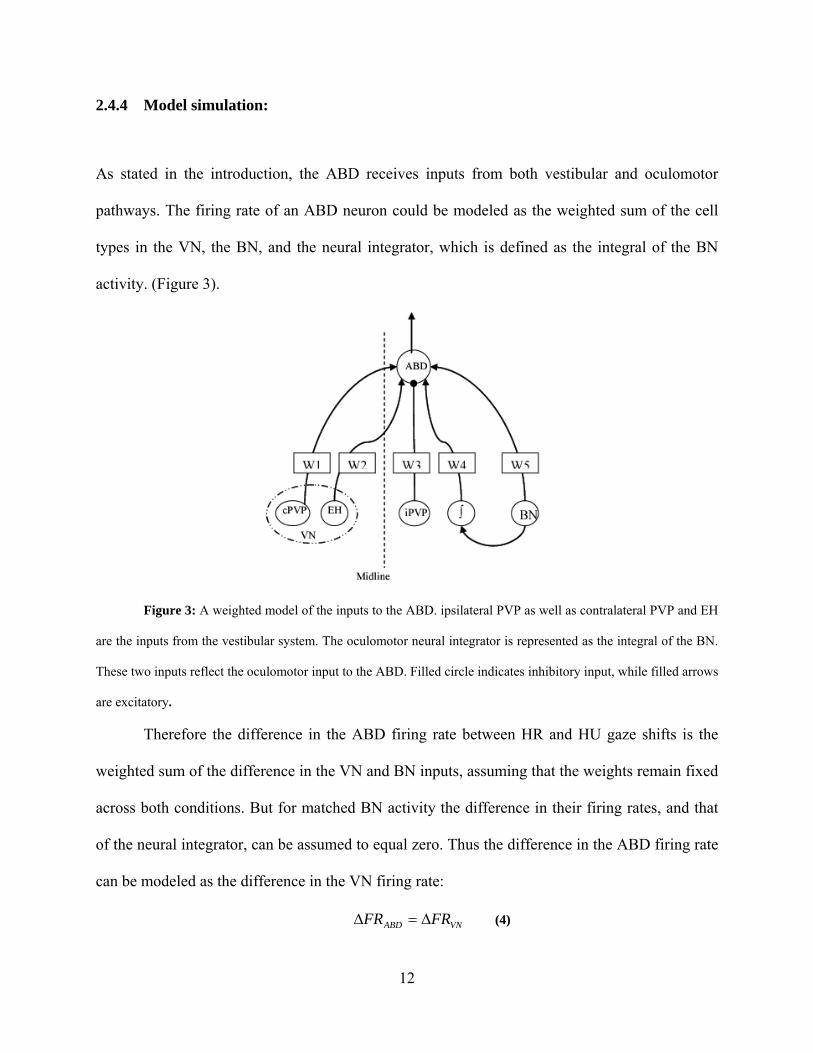
2.4.4 Model simulation:
As stated in the introduction, the ABD receives inputs from both vestibular and oculomotor
pathways. The firing rate of an ABD neuron could be modeled as the weighted sum of the cell
types in the VN, the BN, and the neural integrator, which is defined as the integral of the BN
activity. (Figure 3).
Figure 3: A weighted model of the inputs to the ABD. ipsilateral PVP as well as contralateral PVP and EH
are the inputs from the vestibular system. The oculomotor neural integrator is represented as the integral of the BN.
These two inputs reflect the oculomotor input to the ABD. Filled circle indicates inhibitory input, while filled arrows
are excitatory.
Therefore the difference in the ABD firing rate between HR and HU gaze shifts is the
weighted sum of the difference in the VN and BN inputs, assuming that the weights remain fixed
across both conditions. But for matched BN activity the difference in their firing rates, and that
of the neural integrator, can be assumed to equal zero. Thus the difference in the ABD firing rate
can be modeled as the difference in the VN firing rate:
VNABD FRFR Δ=Δ (4)
12

The major source of VN inputs arises from PVP neurons from both sides of the midline
[25]. While the PVP cells are considered the dominant player, inputs also arise from EH neurons,
and the majority of these projections innervate the contralateral ABD [3]. The activity patterns of
contralateral EH (cEH), contralateral PVP (cPVP) and ipsilateral PVP (iPVP) have been
recorded during HU and HR gaze shifts [2, 26-29]and their firing rates have been modeled as
shown in equation 5
HdEvEpbFR uuuuiu&& +++= (5)
EvEpbFR rrrir&++=
where i is the cell type (ABD cEH, cPVP, iPVP), b, p, v, and d are the bias, eye position,
eye velocity, and head velocity coefficients respectively during HU and HR movements. The
values of these coefficients have been documented elsewhere as shown in Table 1.
Table 1: Parameters used in equation 6 to calculate the weights of the simulation model.
Head Fixed:
orE
rvorE
rp
rbFR &** ++=
Head Free:
H
udouE
uvouE
up
ubFR && *** +++=
Ref.
Cell br
pr vr bu pu vu du
PVPi Cell pauses 98±13 -1.32±0.14 -0.27±0.05 0.18±0.21 Roy 2002
PVPc 98±13 1.18±0.7 0 98±13 1.32±0.14 0 -1.25±0.15 Roy 1998, 2003
EH 106±56 1.97±1.10 0.22±0.7 118±56 1.98±1.51 0.16±0.14 0.66±0.63 Roy 2003
ABD 156±80 4.2±2.4 0.42±0.35 N/A thus used same values as head fixed Sylvestre 1999
Thus equation 5 can be modified to:
biasFRwFRwFRwFR iPVPcPVPcEHABD +Δ+Δ+Δ=Δ 321 (6)
13
with . iuiri FRFRFR −=Δ
A bootstrap algorithm was used to simulate the model. Half of the matched trials were
picked at random and a linear regression algorithm was used to calculate the most optimal set of
weights in equation 6. The bias was introduced to account for any errors that are present in the
models of the inputs. The second half of the trials was used to test the model’s goodness of fit by
calculating a variance accounted for criterion. This was repeated 10,000 times to ensure robust
averaging of the calculated weights.
14
3.0 RESULTS
Neural activity was recorded from a total of 169 neurons in 2 animals performing oculomotor
tasks. Of these, 107 were classified as burst neurons based on their discharge characteristics.
Activity of 38 neurons was collected during head-unrestrained gaze shifts and of 47 cells during
head-restrained saccades. This report focuses on data recorded from 22 burst neurons, whose
isolation was maintained in both HR and HU conditions. Data from both excitatory (14) and
inhibitory (8) burst neurons, as assessed from their location relative to the abducens nucleus, are
treated together. The number of head-unrestrained trails for each neuron ranged from 34 to 277
(mean±sd 120±66; median: 115), and the number of head-restrained trials ranged from 43 to 256
(mean±sd 130±66; median: 120).
3.1 CHARACTERIZING BN
Two different analyses were used to characterize burst neurons. The first relies on the traditional
approach of correlating the static properties of the burst and associated HR gaze shifts. The
number of spikes and duration of the high frequency discharge have been repeatedly shown to
correlate linearly with saccade amplitude and duration, respectively [7, 13, 14]. Figure 4A
shows the best fit lines for the individual neurons in our sample, and the inset plots data from one
example cell. These linear fits had an r-squared value of 0.85±0.06, thus resembling a high
15

correlation. The mean±sd slope across these neurons was 0.99±0.38 spikes/deg. Figure 4B
illustrates the results of a linear analysis between burst and saccade durations, and the inset
displays data from an individual neuron. The mean±sd r-squared value across the neurons was
0.92±0.07 and the slope across all neurons was 1.01±0.06.
The second analysis relates the dynamics of the neural activity to the accompanying
behavioral output. The optimal model [19, 30] describes the burst profile as a function of eye
velocity recorded when the head is restrained, . The time-varying
functions and represent firing rate and eye velocity, respectively. The coefficient
)(* tdtErbFRBN −+= &
BNFR )(tE& r
indicates the eye velocity sensitivity and has units of spikes/deg, and the coefficient b represents
a constant bias term in units of spikes/sec. Also note that is shifted in time by ms to
model the neural and mechanical conduction delay between the neuron and the observed
movement. Using the methods described in the Methods section and elsewhere [19, 24], the
optimal delay td was 15±3 msec for the neurons in our study. For this shift, the mean±sd values
for coefficients
)(tE& td
r and were 0.69±0.20 spikes/deg and 142±73 spikes/sec, respectively. These
parameters were associated with a mean±sd VAF of 0.51±0.14. The collective results of these
two analyses are in agreement with previously published reports [e.g., 19, 30] and, therefore,
strongly suggest that the data reported in our study are from BNs in the PPRF.
b
16
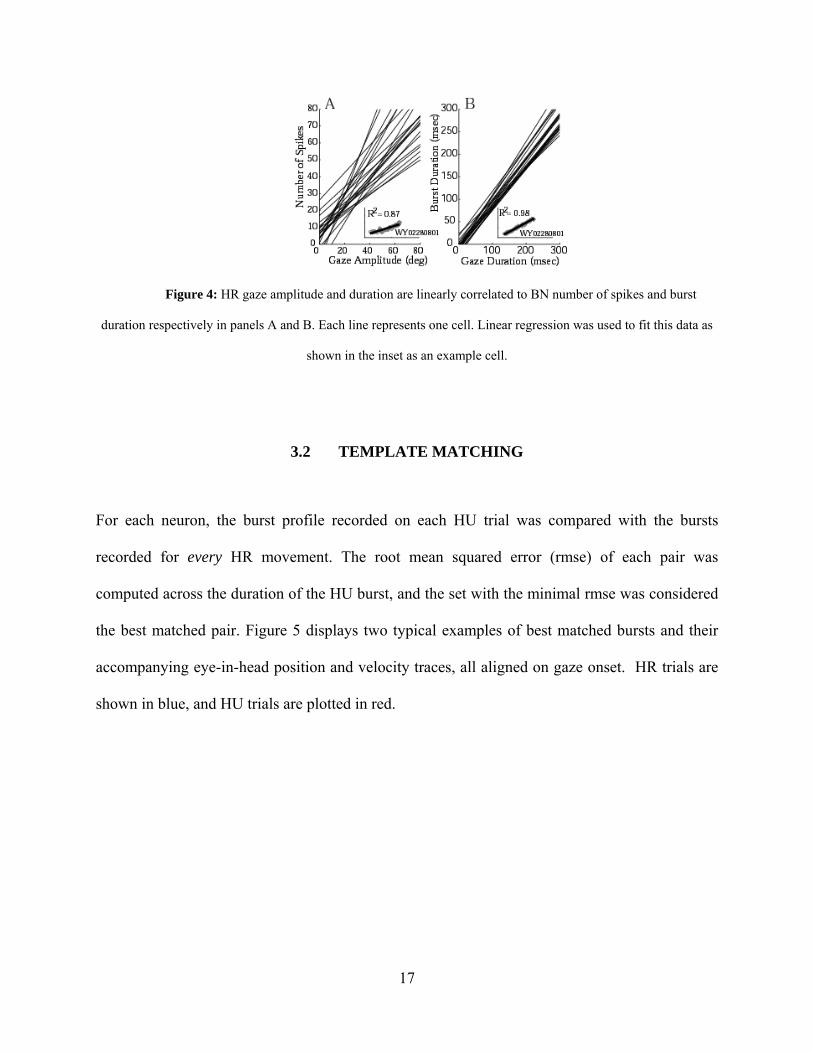
Figure 4: HR gaze amplitude and duration are linearly correlated to BN number of spikes and burst
duration respectively in panels A and B. Each line represents one cell. Linear regression was used to fit this data as
shown in the inset as an example cell.
3.2 TEMPLATE MATCHING
For each neuron, the burst profile recorded on each HU trial was compared with the bursts
recorded for every HR movement. The root mean squared error (rmse) of each pair was
computed across the duration of the HU burst, and the set with the minimal rmse was considered
the best matched pair. Figure 5 displays two typical examples of best matched bursts and their
accompanying eye-in-head position and velocity traces, all aligned on gaze onset. HR trials are
shown in blue, and HU trials are plotted in red.
17
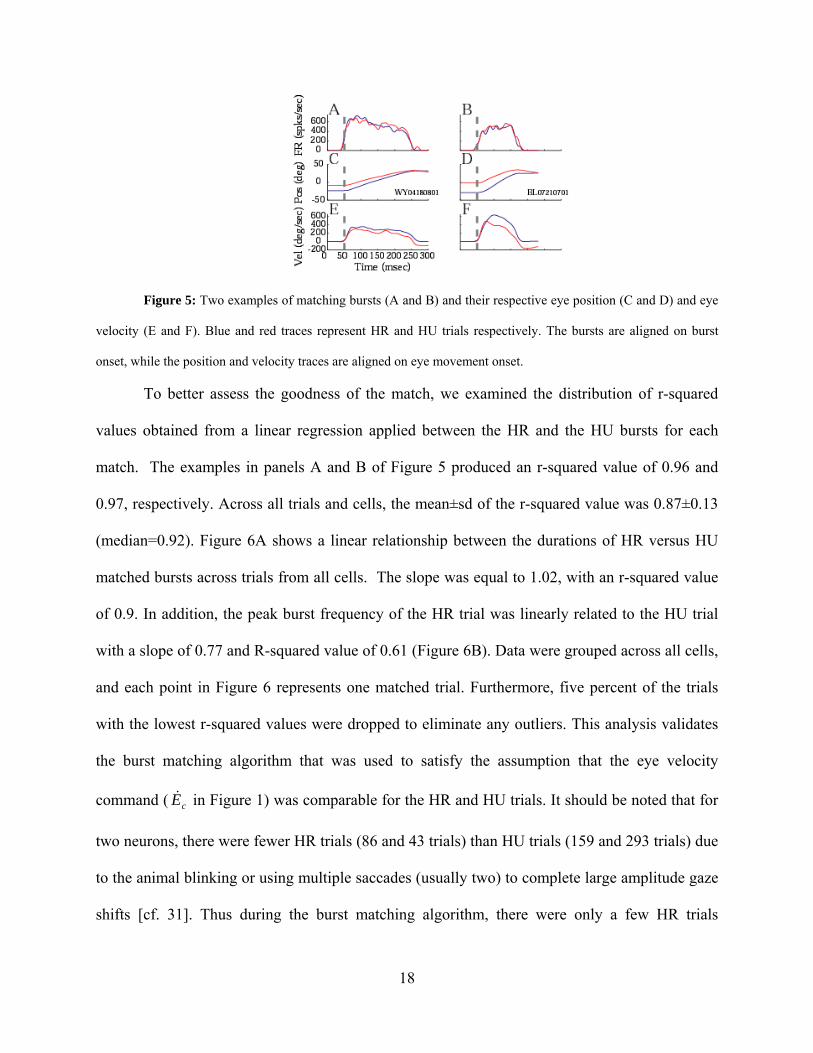
Figure 5: Two examples of matching bursts (A and B) and their respective eye position (C and D) and eye
velocity (E and F). Blue and red traces represent HR and HU trials respectively. The bursts are aligned on burst
onset, while the position and velocity traces are aligned on eye movement onset.
To better assess the goodness of the match, we examined the distribution of r-squared
values obtained from a linear regression applied between the HR and the HU bursts for each
match. The examples in panels A and B of Figure 5 produced an r-squared value of 0.96 and
0.97, respectively. Across all trials and cells, the mean±sd of the r-squared value was 0.87±0.13
(median=0.92). Figure 6A shows a linear relationship between the durations of HR versus HU
matched bursts across trials from all cells. The slope was equal to 1.02, with an r-squared value
of 0.9. In addition, the peak burst frequency of the HR trial was linearly related to the HU trial
with a slope of 0.77 and R-squared value of 0.61 (Figure 6B). Data were grouped across all cells,
and each point in Figure 6 represents one matched trial. Furthermore, five percent of the trials
with the lowest r-squared values were dropped to eliminate any outliers. This analysis validates
the burst matching algorithm that was used to satisfy the assumption that the eye velocity
command ( in Figure 1) was comparable for the HR and HU trials. It should be noted that for
two neurons, there were fewer HR trials (86 and 43 trials) than HU trials (159 and 293 trials) due
to the animal blinking or using multiple saccades (usually two) to complete large amplitude gaze
shifts [cf. 31]. Thus during the burst matching algorithm, there were only a few HR trials
cE&
18

available. Therefore several HU trials were matched to the same HR trail. This could be seen in
the vertical line of data points in Figure 6 as well as Figure 7 & Figure 8.
Figure 6: Burst duration and peak burst activity of HR and HU trials with matched bursts. The slope of the
linear regression fit was 1.03 and 0.992 for panels A and B respectively indicating that the matched bursts had
similar durations and peaks.
Additionally, eye movement metrics were compared for the movements associated with
the matched bursts. Figure 5 shows temporal profiles of eye-in-head position (panels C & D) and
velocity (panels E & F) for matched bursts from two example neurons. A qualitative observation
suggests that the ocular saccade of HU gaze shifts (red) is smaller in amplitude and lower in peak
velocity compared to its matched HR trial (blue). Figure 7 provides a comparison between HR
gaze amplitude and HU gaze amplitude (panel A) as well as the amplitude of the saccadic eye
component during HU gaze shifts (panel B). Each symbol represents one matched pair, and data
from all neurons are included. Gaze amplitudes of HR and HU pairs were linearly correlated (r2
= 0.69, slope = 0.78). Gaze amplitude of HR trials was also linearly correlated to the eye
saccade amplitude of HU trials to gaze amplitude of HR trials (r2 = 0.65, slope = 0.55). The
slopes of both linear fits were significantly different than one (p-value < 0.001) Thus for a
matched pair, the HR gaze amplitude tended to be larger than the HU gaze and eye amplitude.
19

Figure 7: Panel A shows HR gaze amplitude compared to HU gaze amplitude of matched trials across all
cells. In addition Panel B compares HR gaze amplitude and HU eye amplitude across all cells. Dashed lines
represent the unity line.
A similar analysis was also performed on the peak velocities of the matched pair (Figure
8). The peak velocity of HR gaze shift was linearly related to both the gaze and eye velocity of
HU movements with slopes of 0.90 and 0.87 respectively. The linear fits represented by the solid
traces in Figure 8 had an r-squared value of 0.70 and 0.68 respectively. The slopes were slightly
lower than one thus indicating that the HR peak eye velocity was higher than HU peak gaze and
eye velocities (p-value <0.001). Thus for the same eye velocity command input to the ABD, the
eyes moved slower during a HU gaze shift than a HR gaze shift.
Figure 8: Panel A plots HR gaze velocity and HU gaze velocity. Panel B compares HR gaze velocity to
HU eye velocity. The solid line represents the linear regression fit with slopes for A and B equal to 0.896 and 0.869
respectively.
20
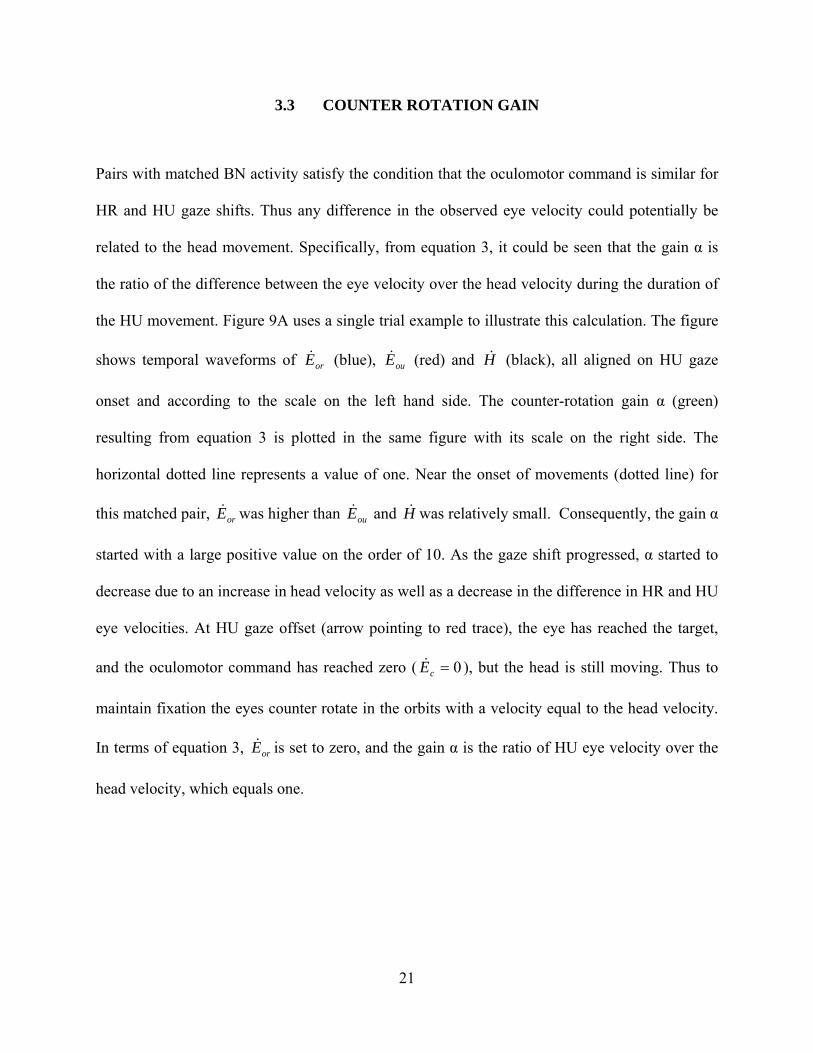
3.3 COUNTER ROTATION GAIN
Pairs with matched BN activity satisfy the condition that the oculomotor command is similar for
HR and HU gaze shifts. Thus any difference in the observed eye velocity could potentially be
related to the head movement. Specifically, from equation 3, it could be seen that the gain α is
the ratio of the difference between the eye velocity over the head velocity during the duration of
the HU movement. Figure 9A uses a single trial example to illustrate this calculation. The figure
shows temporal waveforms of (blue), (red) and orE& ouE& H& (black), all aligned on HU gaze
onset and according to the scale on the left hand side. The counter-rotation gain α (green)
resulting from equation 3 is plotted in the same figure with its scale on the right side. The
horizontal dotted line represents a value of one. Near the onset of movements (dotted line) for
this matched pair, was higher than and orE& ouE& H& was relatively small. Consequently, the gain α
started with a large positive value on the order of 10. As the gaze shift progressed, α started to
decrease due to an increase in head velocity as well as a decrease in the difference in HR and HU
eye velocities. At HU gaze offset (arrow pointing to red trace), the eye has reached the target,
and the oculomotor command has reached zero ( ), but the head is still moving. Thus to
maintain fixation the eyes counter rotate in the orbits with a velocity equal to the head velocity.
In terms of equation 3, is set to zero, and the gain α is the ratio of HU eye velocity over the
head velocity, which equals one.
0=cE&
orE&
21

Figure 9: An example of the calculation of the counter rotation gain α (green) using equation 3. Dashed
horizontal line indicates an α of value one. Panel A shows HR eye (blue), HU eye (red) and HU head (black)
velocities traces for a matched pair. Panel B displays α profiles aligned on gaze onset for similar HU gaze
amplitude. The decreasing trend is clear with high variability at the beginning and the dip around gaze offset. Panel
C is the same as Panel B but all profiles are aligned on gaze offset to better show the decreaseing trend and the dip
artifact. Panel D shows the velocity profiles with the HR eye velocity stretched such that the duration of HR and HU
are equal (indicated by the arrows). This was done to account for the dip artifact at gaze offset as shown in Panel E
and F.
This trend in α was consistently observed across matched pairs. Figure 9B plots counter-
rotation gain profiles aligned on gaze onset for a family of matched pairs while neural activity
was being recorded from a single burst neuron. The mean±sd gaze amplitude of the 12 HU trials
was 50.08±0.59 deg. Note that the gain α was highly variable around gaze/head onset, which
can be attributed to the fact that the head velocity is relatively low compared to the difference in
the eye velocities. Thus dividing by a low number (equation 3) amplified and exaggerated the
minor differences in the initial stages of the eye velocity profiles. However, as the head velocity
increased, the α profiles began to merge at a value greater than one. These traces then gradually
22

decreased and, in many instances, transiently crossed zero gain to negative values (discussed
below) before stabilizing at one as each gaze shift was completed. Figure 9C replots the same α
profiles aligned on gaze offset. This illustration shows a better alignment of the consistent
decrease in the gain following the initial variable response.
Another conspicuous feature of the alpha traces in Figure 9A-C is the transient decrease
to negative values just before gaze offset. This dip is attributed to the fact that the HR eye
velocity and HU eye velocity can end at different time points. For the trial shown in Figure 9A
the offset of these velocities, indicated by the arrows, were separated by 20 msec. This
misalignment is due to the burst matching algorithm which searched for the most optimal match
along the duration of the HU burst. The duration of matched HR burst is not required to match
the duration of the HU burst. It could be longer or shorter than the HU burst, although on
average the durations were correlated with a slope of one (see Figure 6B). A difference in burst
durations is not surprisingly reflected in the velocity duration, given the close linear relation
between the burst and gaze durations (see Fig. 4B). A consequence of different burst periods is a
misalignment of gaze offset for the matched pair. For matches with longer burst duration for the
HR trial, the firing rate was set to zero at HU gaze offset, and equation 3 was used to calculate α
profiles. If the duration of the HU burst was larger than HR there exists an epoch (in between
the arrows in Figure 9) during which and equal zero. In reality, however, has not
become zero because the HU gaze shift has not reached completion. Therefore, the section of α
profile during this short epoch, i.e. the transient dip just before gaze offset, is actually an artifact.
To avoid relaying an incorrect visualization, the HR eye velocity was interpolated and stretched
(see Methods) to match the duration of the HU eye velocity as shown by the arrows in Figure
9D. This step resolved the dip in the calculated gain. More importantly, all other features of the α
cE& orE& cE&
23

trace still resembled the original trace shown in Figure 9A. Figure 9E plots the α profiles for the
movements shown in panel B, but recomputed with the stretching algorithm. Again, the
transient dip towards the end of the gaze shift is no longer present. For these profiles, which are
aligned on the onset of gaze shifts, the large variability is present initially followed by a gradual
decrease toward a gain of one. Realigning these waveforms on gaze offset (Figure 9F) highlights
the consistency with which the counter-rotation gain approaches unity gain.
The decreasing counter rotation gain was prevalent across cells and HU gaze amplitudes.
This is illustrated in Figure 10 where each panel contains six α profiles grouped according to HU
gaze amplitude (30±5, 40±5 and 50±5 deg) across four representative cells. These profiles are
aligned on gaze offset and are the result of stretching the HR eye velocity. As discussed above,
the α profiles exhibit a highly variable gain at the onset of the movement but then display a
consistent decrease towards one throughout the gaze shift. At and after gaze shift offset, the
counter-rotation gain is equal to one.
Figure 10: Alpha profiles aligned on gaze offset and grouped according to HU gaze amplitude (30, 40 and
50 deg) for four example cells after stretching the HR eye velocity. Each panel contains 6 profiles. The dashed
horizontal line indicates alpha value equal to one. α is variable at the onset of the gaze shift, decreases throughout
the movement and stabilizes at one after gaze shift offset.
24

3.4 ADDITIONAL CONSIDERATIONS
The above analyses ignore two factors that could potentially confound interpretations of the data.
The first concern was raised due to the fact that the initial eye-in-head position (IEP) varied
between HR trials but was close to zero for all HU trials. If the oculomotor input varied as a
function of IEP, it could potentially confound interpretation of our data. This issue was addressed
by applying the burst matching algorithm among HR trials with similar gaze amplitudes but
variable initial eye positions. Eye movements with various IEP during HR trials were grouped
according to gaze amplitude. The BN activity of each trial was matched with another trial within
the group. Thus each matched pair of trials had the same gaze amplitude but different IEP. In
other words during HR movements, the ABD received the same oculomotor command for the
same amplitude movement but from different IEP. The results showed that matched HR trials
had similar velocity time profiles and peak velocities. Linear regression was performed between
the velocity profiles of matched BN activity and yielded a slope of 0.98±0.19 and an R-squared
value of 0.97±0.09. This is an indication that there was no difference in the time profile of these
matched trials. Furthermore there was no correlation between the difference in the peak
velocities of matched trials and the difference in the IEP (linear regression R-squared value =
0.0065. Thus, we do not believe that different IEP in HR and HU conditions contributed to our
observations.
The second concern involved the timing of the head movement relative to the eye
movement and its effect on the gain α. Since the input to the ABD from the VN is within the
vestibular feedback network, the head movement must have occurred before the signal reached
the ABD. Thus a proper computation of α from equation 3 requires shifting the head velocity
relative to the eye velocity. We recomputed all α profiles by advancing head velocity relative to
25

eye velocity in increments of 1 msec, up to 25 msec. This resulted in increasing the variability of
the gain α because the difference in velocity was divided by a small number which amplified the
gain. But, again, the variable profile was followed by a gradual decrease towards unity gain, just
like the illustrations in Figure 9 and Figure 10. Hence, the effect of not incorporating the neural
transduction time from the vestibular periphery to the extraocular motoneurons was negligible.
3.5 SIMULATION RESULTS
To further understand the sources of the head counter rotation gain α, a model was created to
account for the discharge profile of ABD. The firing rate of ABD was modeled as a weighted
sum of its oculomotor and vestibular inputs (Figure 3). The oculomotor input is from burst
neurons and the neural integrator pathway. The vestibular input stems from the ipsilateral and
contralateral PVP (iPVP and cPVP, respectively) neurons and from the contralateral EH (cEH)
cells. A connection from the ipsilateral EH neurons was omitted as physiological studies have
not identified such projections [3]. Our assumption is that by matching the BN burst during HR
and HU gaze shifts, we have effectively accounted for the oculomotor input (including that from
the neural integrator). It follows then that the difference in firing rate of ABD neurons between
matched HR and HU trials is related to the difference in the VN inputs. Previous studies have
described the firing rates of ABD, PVP and EH neurons in terms of the accompanying eye and/or
head movements [2, 26-29]. We used this description (equation 5) to predict the firing rates of
these neurons on HU and HR trials with matched BN activity. An example of the responses is
presented in the top row of Figure 11 (FR) where the firing rates during HR and HU movements
are plotted in blue and red, respectively. The vertical dashed line represents the onset of each
26

movement. The traces are comparable to previously published profiles [2, 26-29]. The firing rate
of ABD and EH cells have a burst tonic profile related to eye position and eye velocity.
Meanwhile cPVP neurons experience a tonic increase and decrease in firing rate during HR and
HU eye movement respectively. Finally iPVP neurons have a tonic firing rate related to eye
position but are turned off during HR movements. There are no models that simulate their
activity during the movement but for illustration purposes a tonic rate was calculated relative to
eye position during HR movements using data from an example cell in Roy et al. 2000. On the
other hand their firing rate was simulated and shown as a pause during HU movements.
The difference (HR-HU trials) in the firing rates was calculated for each neuron. This is
shown in the second row (deltaFR) of Figure 11. A multilinear regression, according to equation
5, was then performed to calculate the most optimal set of VN weights that describe the
difference in ABD activity. The calculation was only performed over the duration of the gaze
shift marked by the two vertical dashed lines of the bottom right panel of Figure 11. The
calculated weights were (mean±sd) 1.60±0.063, 1.016±0.036, -0.41±0.019, for cEH, cPVP, and
iPVP, respectively. The bias value was -14.3±2.58. A VAF criterion was used to compare the
output of the model (black) to the difference in ABD firing rate (grey) as shown in the panel. The
VAF was equal to 0.95 signifying a great fit. Having the largest weight, cEH cells had the
highest contribution which was expected due to the similarity between the EH and ABD burst
tonic firing rate. In addition iPVP input had a negative weight which reflects their inhibitory
projections to the ipsilateral ABD.
27

Figure 11: Top row shows the firing rates of VN inputs and the ABD during HR (blue) and HU (red)
movements for matched BN. The difference in the firing rate (blue-red) is shown in the middle row as they are used
in equation 6 to calculate the optimal weight for the physiologic model using linear regression. The weighted inputs
are summed (thick black dotted trace in bottom right panel) and compared to the difference in the ABD firing rate.
The calculations show that EH cells have the highest weight and role in accounting for the ABD difference.
28

4.0 DISCUSSION
Excitatory and inhibitory burst neurons of the PPRF form the major oculomotor input to the
abducens burst neurons [1] for generation of head-restrained and head-unrestrained gaze shifts in
the horizontal dimension. We matched the high-frequency burst profiles of each BN recorded
during both HR and HU gaze shifts and then examined characteristics of eye-head coordination
when an “identical” oculomotor command is delivered to the ABD motoneurons in the two
conditions. We found that the amplitude of the eye movement (equivalently, gaze shift) in the
HR condition was typically greater than both gaze (eye-in-space) and eye-in-head saccade
amplitudes observed during a coordinated eye-head movement (Figure 7). Similarly, the peak
velocity of the HR movement was greater than peak velocities of both gaze and eye components
of the HU movement (Figure 8).
The attenuation in gaze and eye parameters, which is correlated with the generation of a
head movement, was further evaluated by calculating a counter-rotation gain (α) defined as the
ratio of the difference in eye velocities (HR-HU conditions) and head velocity (equation 3).
Since all parameters of the equation are time-varying signals, this computation yielded
dynamical features of the counter-rotation gain. In general, α was highly variable near the onset
of the gaze shift and/or head movement, a property attributed to the small initial head velocity
value that constitutes the denominator term of equation 3. As the gaze shift progressed, α settled
at a large positive value (~10) and gradually decreased to one as the gaze shift approached
29

completion (Figure 9). Furthermore, it remained at one during the head movement that followed
the end of gaze shift. This general profile was observed across a range of gaze amplitudes for
BNs studied during both HR and HU movements (Figure 10).
4.1 NEURAL SUBSTRATES MEDIATING THE COUNTER-ROTATION GAIN
In addition to the oculomotor drive, the ABD nucleus also receives significant inputs
from the VN [1]. A small-scale simulation revealed that the difference in eye-in-head velocity
observed for HR and HU trials with matched BN bursts can be accounted for by the difference in
the firing rates of VN inputs in the two conditions (Figure 11). The primary vestibular inputs to
the ABD nucleus arise from type I PVP and type II EH neurons contralaterally and from type I
PVP cells ipsilaterally, as supported by previous studies [e.g., 3, 32]. The ipsilateral connection
from type II EH units were not included because these cells pause during ipsiversive gaze shifts.
Conceptually similar architectures have been utilized to model the firing rate of ABD neurons
during disjunctive saccades [33] and to estimate the distribution of synaptic inputs to the ABD
for the control of eye position [34]. For the model configuration that obtained the best fit
(VAF=0.95±0.01), the synaptic weight of the type II EH neurons (1.60) exceeded that of the
contralateral PVP cells (1.01) and that of the inhibitory drive from the ipsilateral PVP neurons
(0.41). These results suggest that for matched oculomotor inputs during the HR and HU
conditions, the firing rate of ABD neurons is reduced because of decreased excitation from the
contralateral type II EH and type I PVP inputs and an increased inhibition from the ipsilateral
type I PVP neurons. Moreover, the reduction in eye-in-head velocity resulting from the
30
attenuated ABD activity is multiple times greater than the increase in head velocity. Thus, the
counter-rotation gain values are greater than one.
Our model (Figure 3) shows the neural integrator pathway as an integral of the BN
discharge, which implies that it carries a tonic signal. However, many eye movement-related
neurons in the prepositus hypoglossi also exhibit a phasic burst during HR saccades [29, 35] and
presumably HU gaze shifts, although the later condition has not been tested yet. Incorporating a
phasic component to the tonic response is not expected to alter our model’s predictions because
if the BN activity is matched during HR and HU trials, then so is the response of these burst-
tonic (BT) neurons in the integrator pathway. Thus, the difference in the neural activity between
HR and HU trials will be zero for each of the two inputs. Nevertheless, it is possible that our
assumption is too precise and that the activity of BT neurons is different for matched BN
waveforms in the HR and HU conditions. Given that both gaze and eye velocities are attenuated
in the HU condition, it is expected that the discharge profile of the BT neurons is also reduced.
Thus, the difference in the total oculomotor command between HR and HU conditions will be
larger (numerator of equation 3), and the counter-rotation gain profiles will be amplified. In
terms of simulations, we still expect the distribution of the weights to highlight the importance of
the contralateral vestibular inputs.
Finally, it should be noted that the ABD nucleus may receive other inputs that are not
incorporated in the simulations. For example, spike-triggered averaging data support inputs from
vestibular neurons exhibiting various our discharge properties, but they appear to be
proportionately fewer in quantity [3] and, more importantly, their discharge patterns have not
been studied during HU gaze shifts. Also, the vestibular inputs are intended to convey sensory
information about the head movement. It is possible that inputs relaying motor commands
31

issued to the neck motoneurons may also reach the ABD. Evidence of collaterals of
reticulospinal neurons reaching the ABD have been shown in the cat [36]. We leave open the
possibility that instead of directly driving the extraocular motoneurons, such neurons may
modulate the efficacy of the oculomotor and/or vestibular inputs that do produce movement of
the eyes. Further studies are required to confirm the existence and functional significance of
such connections in monkey.
4.2 FUNCTIONAL SIGNIFICANCE OF COUNTER-ROTATION GAIN
Computing the counter-rotation of the eyes as a function of the head velocity bears many
resemblances to calculating the VOR gain during gaze shifts. Many studies have addressed the
VOR gain, and substantial controversy persists about its status.
From a neurophysiological perspective, the PVP neurons are believed to serve as the
neural correlate of VOR suppression [2, 26]. This hypothesis is based on the observation that a
subset of PVP cells that is quiescent at the onset of a large, ipsiversive HU gaze shift resumes
discharge as the movement progresses [also see 37], and the time course of the resumption is
correlated with existing notion of VOR gain from previous behavioral studies. However, another
study [38] has argued that such “partial-pause” neurons constitute a minority and, therefore, do
not likely participate in the three-neuron arc that mediates the reflex. Furthermore, the
traditional PVP group that pauses completely for the entire duration of ipsiversive HR and HU
gaze shifts cannot contribute to the firing rate of ABD neurons either [38]. The layout of our
model (Figure 3) does not require that the VN neurons be part of the three-neuron arc mediating
the VOR; all that matters it that there activity is modulated during HR and HU gaze shifts.
32

The results of our simulations emphasize the excitatory contributions of both EH and
PVP neurons. Both of these neurons have been considered as the most likely candidates to
mediate the VOR. While it has also been recognized that the EH cells serve to counter the
actions of the PVP neurons, its effects have been considered minor [39] because the EH neurons
are believed to mediate only ~20% of the direct VOR pathway [3]. However, the percentage of
neurons identified in the three-neuron arc is not necessarily indicative of the synaptic efficacy of
the projections and, in addition, EH neurons outside the three-neuron-arc can also participate in
mediating the VOR gain during HU gaze shifts. If true, then it is likely, as suggested by the
simulations, that the EH neurons not only offset the VOR suppression associated with PVP
activity but they actually enhance the counter-rotation gain to greater than one.
Studies using behavioral assays to quantify VOR gain during HU gaze shifts have
produced variable results. The earliest proposal hypothesized that VOR is fully intact and its
gain remains at one throughout the gaze shift [40-42]. While some evidence for this view exists
[43, 44], most studies have provided support for at least partial suppression of VOR gain during
gaze shifts [44-52]. The typical experimental approach for determining the VOR gain has been
to apply a (passive) perturbation to the head during various phases of gaze shifts and to compare
the eye-in-head response that follows within the open-loop period of the reflex. This approach
has produced highly variable gains, both within and between subjects [44, 45], and in some cases
the ocular response was normalized to bring the VOR gain between 0 and 1 [e.g., 45].
To reconcile the gross discrepancy between our counter-rotation gain profiles and those
of previous studies, one needs to consider the neural processing of a passive head perturbation on
an ongoing active head movement. Let us first consider vestibular-only (VO) neurons as there is
some preliminary data available for this class of neurons [53]. The response patterns of VO
33

neurons are modulated during passive head movements but significantly attenuated during active
head movements [54-56]. A logical prediction that follows is that, when a passive head
perturbation is added to an ongoing active head movement, these neurons will respond only to
the passive component. Preliminary data do not appear to support this prediction, as these
neurons encode “head velocity caused by both the passive perturbation and the active movement
during the perturbation interval” [53]. To our knowledge, a comparable investigation of the
eye-movement related vestibular neurons has not been performed, but we can extrapolate on
these findings. We focus on EH neurons and the “partial-pause” subset of PVP cells since their
roles during active head movements have been sufficiently characterized [2, 27, 37]. Their
sensitivities for passive head movements and active head movements during stable gaze are
similar. However, their activity is significantly attenuated during active head movements
associated with a rapid change in gaze [2, 27, 37], reminiscent of the reduction seen in VO
neurons. We predict that the EH and PVP neurons will behave like the VO cells during brief,
passive head perturbations added to active head movements associated with gaze shifts. In other
words, these neurons will encode the sum of the passive and active components of the head
movement during the perturbation epoch. If this is the case, then these perturbation experiments
do not reveal the state of the VOR gain during a gaze shift; the passive component is
contaminating the results. This problem may be further complicated if these neurons’ eye
velocity sensitivities are also rapidly altered by the perturbation.
We also do not believe that some idiosyncratic property of our technique of template
matching somehow produced the high gain values. To support our claim, we stimulated the BN
region of the PPRF with identical stimulation parameters in head-restrained and head-
unrestrained monkeys and used the same analytical approach motivated in this manuscript to
34

estimate the VOR gain [57]. We found that, following an initially high gain that was also
attributed to the small initial head velocity, the gain stabilized to values close to one for the
duration of stimulation. We interpreted the stimulation-evoked head movement as passive
without an underlying active component because the stimulation was evoked during fixation.
The estimate of VOR gain from the PPRF stimulation experiment is in agreement with values
obtained from mechanical head perturbations during fixation or prior to gaze onset reveal an
intact reflex with unity gain [e.g., 45]. These results collectively impress that it is the presence
of both active and passive head movements that appears to confound estimates of VOR gain.
Finally, the issue of VOR gain during gaze shifts (without a passive perturbation) has
been addressed recently by Freedman and Sparks [58]. These investigators noted that for a fixed
interval after the time of peak eye velocity, the decrease in eye velocity far exceeds that of head
velocity. A ratio of the changes in eye and head velocity would produce a gain much greater
than one. But since this result did not comply with the accepted notion that VOR gain must be
suppressed during gaze shifts, they attributed the multiplicative reduction in eye velocity to
attenuation induced by a head movement command on the eye burst generator [58]. The burst
neurons we report in this manuscript constitute the burst generator. Since the burst profiles are
matched in HU and HR conditions, the reduction in the eye velocity is not due to an influence of
the head movement command on these neurons (although it could occur elsewhere). Our
simulations instead support the notion that changes in the firing rate of vestibular neurons,
specifically type I PVP and type II EH cells, are sufficient to explain counter-rotation gains
greater than one.
35

BIBLIOGRAPHY
1. Langer, T., et al., Afferents to the abducens nucleus in the monkey and cat. J Comp Neurol, 1986. 245(3): p. 379-400.
2. Roy, J.E. and K.E. Cullen, Vestibuloocular reflex signal modulation during voluntary and passive head movements. J Neurophysiol, 2002. 87(5): p. 2337-2357.
3. Scudder, C.A. and A.F. Fuchs, Physiological and behavioral identification of vestibular nucleus neurons mediating the horizontal vestibuloocular reflex in trained rhesus monkeys. J Neurophysiol, 1992. 68(1): p. 244-64.
4. Gandhi, N.J., E.J. Barton, and D.L. Sparks, Coordination of eye and head components of movements evoked by stimulation of the paramedian pontine reticular formation. Exp Brain Res, 2008.
5. Bryant, C.L. and N.J. Gandhi, Real-time data acquisition and control system for the measurement of motor and neural data. Journal of Neuroscience Methods, 2005. 142(2): p. 193-200.
6. Gandhi, N.J. and D.K. Bonadonna, Temporal interactions of air-puff evoked blinks and saccadic eye movements: Insights into motor preparation. J Neurophysiol, 2005. 93(3): p. 1718-29.
7. Sylvestre, P.A. and K.E. Cullen, Premotor correlates of integrated feedback control for eye-head gaze shifts. J Neurosci, 2006. 26(18): p. 4922-9.
8. Cohen, B. and A. Komatsuzaki, Eye movements induced by stimulation of the pontine reticular formation: evidence for integration in oculomotor pathways. Exp Neurol, 1972. 36(1): p. 101-17.
36
9. Chen, L.L. and M.M. Walton, Head movement evoked by electrical stimulation in the supplementary eye field of the rhesus monkey. J Neurophysiol, 2005. 94(6): p. 4502-19.
10. Walton, M.M.G., B.P. Bechara, and N.J. Gandhi, The role of the primate superior colliculus in the control of head movements. Journal of Neurophysiology, 2007. 98(4): p. 2022-37.
11. Gandhi, N.J., Consequence of blinks on interactions between the eye and head components of gaze shifts. Society for Neurosciences Abstract, 2007. Program No. 178.2.
12. Goossens, H.H. and A.J. Van Opstal, Blink-perturbed saccades in monkey. II. Superior colliculus activity. J Neurophysiol, 2000. 83(6): p. 3430-52.
13. Keller, E.L., Participation of medial pontine reticular formation in eye movement generation in monkey. J Neurophysiol, 1974. 37(2): p. 316-32.
14. Scudder, C.A., A.F. Fuchs, and T.P. Langer, Characteristics and functional identification of saccadic inhibitory burst neurons in the alert monkey. J Neurophysiol, 1988. 59(5): p. 1430-54.
15. Yoshida, K., et al., Morphological and physiological characteristics of inhibitory burst neurons controlling horizontal rapid eye movements in the alert cat. J Neurophysiol, 1982. 48(3): p. 761-84.
16. Luschei, E.S. and A.F. Fuchs, Activity of brain stem neurons during eye movements of alert monkeys. J Neurophysiol, 1972. 35(4): p. 445-61.
17. Cohen, B. and V. Henn, Unit activity in the pontine reticular formation associated with eye movements. Brain Res, 1972. 46: p. 403-10.
18. Kaneko, C.R., C. Evinger, and A.F. Fuchs, Role of cat pontine burst neurons in generation of saccadic eye movements. J Neurophysiol, 1981. 46(3): p. 387-408.
19. Van Gisbergen, J.A., D.A. Robinson, and S. Gielen, A quantitative analysis of generation of saccadic eye movements by burst neurons. J Neurophysiol, 1981. 45(3): p. 417-42.
37
20. Cullen, K.E. and D. Guitton, Analysis of primate IBN spike trains using system identification techniques. III. Relationship To motor error during head-fixed saccades and head-free gaze shifts. J Neurophysiol, 1997. 78(6): p. 3307-22.
21. Sasaki, S. and H. Shimazu, Reticulovestibular organization participating in generation of horizontal fast eye movement. Ann N Y Acad Sci, 1981. 374: p. 130-43.
22. Strassman, A., S.M. Highstein, and R.A. McCrea, Anatomy and physiology of saccadic burst neurons in the alert squirrel monkey. II. Inhibitory burst neurons. J Comp Neurol, 1986. 249(3): p. 358-80.
23. Strassman, A., S.M. Highstein, and R.A. McCrea, Anatomy and physiology of saccadic burst neurons in the alert squirrel monkey. I. Excitatory burst neurons. J Comp Neurol, 1986. 249(3): p. 337-57.
24. Cullen, K.E., et al., The use of system identification techniques in the analysis of oculomotor burst neuron spike train dynamics. J Comput Neurosci, 1996. 3(4): p. 347-68.
25. McCrea, R.A., A. Strassman, and S.M. Highstein, Anatomical and physiological characteristics of vestibular neurons mediating the vertical vestibulo-ocular reflexes of the squirrel monkey. J Comp Neurol, 1987. 264(4): p. 571-94.
26. Roy, J.E. and K.E. Cullen, A neural correlate for vestibulo-ocular reflex suppression during voluntary eye-head gaze shifts. Nat Neurosci, 1998. 1(5): p. 404-410.
27. Roy, J.E. and K.E. Cullen, Brain stem pursuit pathways: dissociating visual, vestibular, and proprioceptive inputs during combined eye-head gaze tracking. J Neurophysiol, 2003. 90(1): p. 271-90.
28. Sylvestre, P.A. and K.E. Cullen, Quantitative analysis of abducens neuron discharge dynamics during saccadic and slow eye movements. J Neurophysiol, 1999. 82(5): p. 2612-32.
38

29. Sylvestre, P.A., J.T. Choi, and K.E. Cullen, Discharge dynamics of oculomotor neural integrator neurons during conjugate and disjunctive saccades and fixation. J Neurophysiol, 2003. 90(2): p. 739-54.
30. Cullen, K.E. and D. Guitton, Analysis of primate IBN spike trains using system identification techniques. I. Relationship to eye movement dynamics during head-fixed saccades. J Neurophysiol, 1997. 78(6): p. 3259-82.
31. Bergeron, A. and D. Guitton, Fixation neurons in the superior colliculus encode distance between current and desired gaze positions. Nat Neurosci, 2000. 3(9): p. 932-9.
32. Broussard, D.M. and S.G. Lisberger, Vestibular inputs to brain stem neurons that participate in motor learning in the primate vestibuloocular reflex. J Neurophysiol, 1992. 68(5): p. 1906-9.
33. Van Horn, M.R., P.A. Sylvestre, and K.E. Cullen, The brain stem saccadic burst generator encodes gaze in three-dimensional space. J Neurophysiol, 2008. 99(5): p. 2602-16.
34. Hazel, T.R., S.G. Sklavos, and P. Dean, Estimation of premotor synaptic drives to simulated abducens motoneurons for control of eye position. Exp Brain Res, 2002. 146(2): p. 184-96.
35. McFarland, J.L. and A.F. Fuchs, Discharge patterns in nucleus prepositus hypoglossi and adjacent medial vestibular nucleus during horizontal eye movement in behaving macaques. Journal of Neurophysiology, 1992. 68(1): p. 319-332.
36. Grantyn, A., V. Ong-Meang Jacques, and A. Berthoz, Reticulo-spinal neurons participating in the control of synergic eye and head movements during orienting in the cat. II. Morphological properties as revealed by intra-axonal injections of horseradish peroxidase. Exp Brain Res, 1987. 66(2): p. 355-77.
37. McCrea, R.A. and G.T. Gdowski, Firing behaviour of squirrel monkey eye movement-related vestibular nucleus neurons during gaze saccades. J Physiol, 2003. 546(Pt 1): p. 207-24.
39

38. Fuchs, A.F., L. Ling, and J.O. Phillips, Behavior of the position vestibular pause (PVP) interneurons of the vestibuloocular reflex during head-free gaze shifts in the monkey. J Neurophysiol, 2005. 94(6): p. 4481-90.
39. Cullen, K.E. and J.E. Roy, Signal processing in the vestibular system during active versus passive head movements. J Neurophysiol, 2004. 91(5): p. 1919-1933.
40. Bizzi, E., R.E. Kalil, and V. Tagliasco, Eye-head coordination in monkeys: Evidence for centrally patterned organization. Science, 1971. 173: p. 452-4.
41. Dichgans, J., et al., Mechanisms underlying recovery of eye-head coordination following bilateral labyrinthectomy in monkeys. Exp Brain Res, 1973. 18(5): p. 548-62.
42. Morasso, P., E. Bizzi, and J. Dichgans, Adjustment of saccade characteristics during head movements. Exp Brain Res, 1973. 16(5): p. 492-500.
43. Freedman, E.G., L. Ling, and A.F. Fuchs, Perturbing the head: re-assessing the gain of reflex interactions during orienting eye-head movements. Society for Neurosciences Abstract, 1998. 24: p. 557.18.
44. Guitton, D. and M. Volle, Gaze control in humans: eye-head coordination during orienting movements to targets within and beyond the oculomotor range. J Neurophysiol, 1987. 58(3): p. 427-59.
45. Cullen, K.E., et al., Time course of vestibuloocular reflex suppression during gaze shifts. J Neurophysiol, 2004. 92(6): p. 3408-22.
46. Laurutis, V.P. and D.A. Robinson, The vestibulo-ocular reflex during human saccadic eye movements. J Physiol (Lond), 1986. 373: p. 209-33.
47. Pélisson, D. and C. Prablanc, Vestibulo-ocular reflex (VOR) induced by passive head rotation and goal-directed saccadic eye movements do not simply add in man. Brain Res, 1986. 380(2): p. 397-400.
40

48. Pélisson, D., C. Prablanc, and C. Urquizar, Vestibuloocular reflex inhibition and gaze saccade control characteristics during eye-head orientation in humans. J Neurophysiol, 1988. 59(3): p. 997-1013.
49. Tomlinson, R.D. and P.S. Bahra, Combined eye-head gaze shifts in the primate. II. Interactions between saccades and the vestibuloocular reflex. J Neurophysiol, 1986. 56(6): p. 1558-70.
50. Tomlinson, R.D., Combined eye-head gaze shifts in the primate. III. Contributions to the accuracy of gaze saccades. J Neurophysiol, 1990. 64(6): p. 1873-91.
51. Tabak, S., J.B. Smeets, and H. Collewijn, Modulation of the human vestibuloocular reflex during saccades: probing by high-frequency oscillation and torque pulses of the head. J Neurophysiol, 1996. 76(5): p. 3249-63.
52. Lefèvre, P., I. Bottemanne, and A. Roucoux, Experimental study and modeling of vestibulo-ocular reflex modulation during large shifts of gaze in humans. Exp Brain Res, 1992. 91(3): p. 496-508.
53. Brooks, J. and K.E. Cullen, Cancellation of vestibular reafference during head-on-body versus combined head-body movements. Society for Neurosciences Abstract, 2006. 550.15.
54. McCrea, R.A., et al., Firing behavior of vestibular neurons during active and passive head movements: vestibulo-spinal and other non-eye-movement related neurons. J Neurophysiol, 1999. 82(1): p. 416-28.
55. Roy, J.E. and K.E. Cullen, Selective processing of vestibular reafference during self-generated head motion. J Neurosci, 2001. 21(6): p. 2131-42.
56. Roy, J.E. and K.E. Cullen, Dissociating self-generated from passively applied head motion: neural mechanisms in the vestibular nuclei. J. Neurosci., 2004. 24(9): p. 2102-2111.
57. Gandhi, N.J., E.J. Barton, and D.L. Sparks, Coordination of eye and head components of movements evoked by stimulation of the paramedian pontine reticular formation. Exp Brain Res, 2008. 189(1): p. 35-47.
41

42
58. Freedman, E.G. and D.L. Sparks, Coordination of the eyes and head: movement kinematics. Exp Brain Res, 2000. 131(1): p. 22-32.
Related Documents
![arXiv:1906.09740v2 [cs.GR] 13 May 2020 · 2020-05-14 · Gaze-Contingent Ocular Parallax Rendering for Virtual Reality 3 Fig. 2. Illustration of a schematic eye, including the front](https://static.cupdf.com/doc/110x72/5f829dbee3492d1c431199b6/arxiv190609740v2-csgr-13-may-2020-2020-05-14-gaze-contingent-ocular-parallax.jpg)

![Temporal Control In the EyeHarp Gaze-Controlled Musical Interface · 2012. 6. 19. · Glinsky in his book\Theremin: ether music and espionage" [1], \...mere shifts in the performer’](https://static.cupdf.com/doc/110x72/60dbcdd74e5a8f069a266278/temporal-control-in-the-eyeharp-gaze-controlled-musical-interface-2012-6-19.jpg)