TAKEN FOR GRANTED: WHY BRITAIN NEEDS A FAIR DEAL FOR THE SOUTH EAST Research Report by Local Government Futures Ltd. and Oxford Economics Ltd. MAIN REPORT SEPTEMBER 2007

Welcome message from author
This document is posted to help you gain knowledge. Please leave a comment to let me know what you think about it! Share it to your friends and learn new things together.
Transcript
TAKEN FOR GRANTED:W H Y B R I TA I N N E E D S A FA I R D E A L F O R T H E S O U T H E A S T
Research Report by Local Government Futures Ltd. and Oxford Economics Ltd.
M A I N R E P O R TS E P T E M B E R 2 0 0 7
3
Taken for Granted: Why Britain Needs a Fair Deal for the South East
Contents Page FOREWORD BY COUNCILLOR HENRY SMITH, CHAIRMAN,
SOUTH EAST COUNTY LEADERS 5
BACKGROUND TO THE PROJECT 7 EXECUTIVE SUMMARY 9 1. TAXATION VERSUS PUBLIC SPENDING 1.1 Introduction 21 1.2 Overall Approach 21 1.3 Measuring Public Spending by Region and County 22 1.4 Measuring Tax Revenues by Region and County 23 1.5 Regional Contributions 23 1.6 SECL Contributions 24 1.7 Trends in Contributions 26 1.8 Regional Price Levels 27 1.9 Contributions and Expenditure per Head 28 2. LOCAL GOVERNMENT SERVICES – FUNDING AND COST
PRESSURES
2.1 Introduction 33 2.2 Local Government Funding Formula 33 2.3 Specific Grants 39 2.4 Area Costs 40 2.5 Efficiency Savings 44 2.6 Older People’s Social Care (65 plus) 44 2.7 Adult Social Care (18-64) 46 2.8 Children’s Services 49 2.9 Waste Services 51 3. POLICE AUTHORITY FUNDING AND COST PRESSURES 3.1 Introduction 53 3.2 Funding Levels and Pressures 53 4. HEALTH FUNDING AND COST PRESSURES 4.1 Introduction 57 4.2 The Equity of PCT Funding 57 4.3 Distance from Target 58 4.4 Distribution of NHS Deficits 60 5. INFRASTRUCTURE COSTS 5.1 Introduction 65 5.2 Regional Costs and Pressures 65 5.3 Local Government Capital Allocations 65 6. CONCLUSIONS AND RECOMMENDATIONS 69

4
Tables and Charts Fig. 1 Regional contributions to UK public finances 2005/06 – table 24 Fig. 2 Regional contributions to UK public finances 2005/06 – chart 24 Fig. 3 Overall SECL contributions to UK public finances 2005/06 by
tax/spending area 25
Fig. 4 SECL contributions to UK public finances 2005/06 by county (residence basis)
26
Fig. 5 Combined South East and Eastern region contributions to UK public finances 2003/04-2006/07
27
Fig. 6 Average price in each region, relative to national average 2004 28 Fig. 7 SECL contributions per head to UK public finances compared to
public spending per head 2005/06 29
Fig. 8 UK identifiable expenditure on services per head 2001/02-2006/07 - table
30
Fig. 9 UK identifiable expenditure on services per head 2001/02-2006/07 - graph
30
Fig. 10 Damping block as a percentage of formula grant by region 2007/08 35 Fig. 11a Formula grant and council tax per head 2007/08 – table 36 Fig. 11b Formula grant and council tax per head 2007/08 - chart 36 Fig. 12 Percentage of net budget requirement met by council tax 2007/08 37 Fig. 13 Change in ACA values by region during formula change years 41 Fig. 14a Growth in older people (65 plus) population to 2011 45 Fig. 14b Growth in older people (65 plus) population to 2029 45 Fig. 15 SECL share of younger adults’ social services relative need measure
2002/03-2007/08 compared to share of population 47
Fig. 16 Comparison of younger adults’ expenditure 2005/06 and RNF 2006/07 48 Fig. 17 Police formula grant funding per head by region 2007/08 53 Fig. 18 Regional PCT funding per head 2006/07 57 Fig. 19 SECL PCTs distance from target 2007/08 59
Fig. 20 NHS Financial Outturn by SHA 2006/07 61 Fig. 21 SECL authority region health bodies financial outturn 2006/07 62 Fig. 22 Capital adjustments for SECL authorities in 2005/06 66 Appendices A Technical Note – Public Sector Finance Calculation 71 B Local Authority Funding B1 History of local government funding settlements and impact on SECL
authorities 85
B2 Impact of damping 88 B3 Growth in 65 plus population 89 B4 RNF and expenditure analysis for younger adults social services 90 B5 Police funding 92 C Health Funding C1 Funds Flow in the Health Sector 93 C2 South East England Health Bodies Financial Outturn 2006/07 95 D Glossary 99
5
FOREWORD The nine million people who live in the South East Counties paid £17.7 billion in taxes to the Exchequer in 2005/06, nearly twice those paid by the seven million people who live in London. As one of the most economically successful regions of the UK, this makes the vitality of the South East crucial to the success of the rest of the UK. London is important too, but policymakers in Westminster seem to have forgotten that many of those who make London the successful world city it is live in the South East Counties. The success of London is bound up with the success of the South East (and vice versa); but, this does not mean that London should be focused upon at the expense of the wider South East. Those living in the South East Counties paid, on average, nearly £9,400 a head in 2005/06 in taxes to the Exchequer. In the same year, overall public spending on services in the South East Counties averaged just £7,400 per person. On the other hand, the average UK resident benefits from at least an extra £1,000 of public spending compared to the average person living in the South East Counties. This report therefore identifies the extent to which residents in the South East Counties have been disadvantaged by successive Government funding decisions. Government statistics show prices in the South East were, on average, more than 5% higher than the national average in 2004. Whitehall formulae, that determine everything from the funding given to local government, to spending on health; from support to the police, to investment in infrastructure, do not just inadequately reflect this fact of economic life, but suggest the South East is being penalized for being successful. The less successful economic regions of the UK need our help and it is right that we support them. If the shift of resources away from the South East continues, it will not just impact on the quality and standard of public services in the South East, but will affect our ability to go on generating the tax revenues that have become so vital to the rest of the UK. Anyone who lives, works, or travels through the South East has first hand experience of our overcrowding and congestion. They worry about the impact of future development, especially when they see Whitehall trying to dodge commitments to proper and timely investment in infrastructure. They feel squeezed by a Government, happy to spend their taxes, but unwilling, or unable, to listen to their needs. We want to continue to be the UK’s economic powerhouse, but to do that, Whitehall needs to stop taking the South East for granted and acknowledge our unique position, by giving us back some of the billions of pounds we pay into Treasury coffers every year. A fairer deal for the South East would be good news for Britain. Councillor Henry Smith Chairman of the South East County Leaders Leader of West Sussex County Council September 2007

6

7
BACKGROUND TO THE PROJECT
The South East County Leaders (SECL) campaign on issues of joint concern for the 11 counties that surround London. Together, they provide services to nearly nine million people, who live in Bedfordshire; Buckinghamshire; East Sussex; Essex; Hampshire; Hertfordshire; the Isle of Wight, Kent; Oxfordshire; Surrey; and West Sussex. The South East is one of the most economically successful regions of the UK and is one of only three regions (with the East and London) that make a net contribution to the rest of the UK. The South East’s ability to maintain its economic performance is therefore vital to the wider UK; however, the region faces major challenges:
• In terms of local government funding, the South East currently receives the lowest level of formula grant per head. In addition, the South East level of funding per head for police authorities represented only 73% of the England average level in 2007/08.
• Strong cost pressures include the need to invest in the region’s congested transport infrastructure; a lack of affordable housing; higher wage costs; an increasing demand for older people’s social care; pressures on care services and budgets, with increasing numbers of children with complex needs living into adulthood; and increasing waste disposal costs.
• Analysis of the NHS 2006/07 financial outturn shows an overall pattern of deficits in the South East, with the South East Coast and East the only regions in England to report deficits. This raises questions about how the health formula allocates funding to the South East.
In May 2007, Local Government Futures Ltd. (working jointly with Oxford Economics Ltd.), were commissioned by SECL to undertake a review of public sector financing in the South East. The research aims to evaluate differences in funding levels, cost pressures, and demands between the South East and other regions of the UK for all public spending, with a particular focus on local authority and health funding. Specific themes include:
• A comparison of national and regional public expenditure and receipts for the South East and other regions, using Public Expenditure Statistical Analysis (PESA), disaggregated into South East and county components.
• An analysis of the way in which local authority and health funding formulae impact on the South East and the relationship between funding and cost pressures.
This Report sets out our findings and identifies priority areas for action, which SECL believes need to be addressed, if the South East is to continue to be the powerhouse of the UK economy.

8
9
EXECUTIVE SUMMARY The research has identified the following key issues for SECL authorities:
Taxation versus Public Spending
(i) Using the latest available actual spending data for 2005/06, from Public
Expenditure Statistical Analysis (PESA) figures, the South East region as a whole made the largest net positive contribution to the Exchequer on a residence basis, based upon the taxes paid by people who live in each region.
(ii) In the South East region, in 2005/06, £15.1 billion more was raised in
taxes than was accounted for by public spending in the region. A further net contribution of £5.1 billion was provided by the Eastern region in 2005/06.
(iii) This equates to the combined two regions contributing 25.2% of the
UK’s revenues, but receiving back only 19.5% of public spending in 2005/06.
(iv) This compares with London’s contribution of £9.2 billion in 2005/06 (on
a residence basis), the only other region to make a net positive contribution to the national economy.
(v) For the area covered by the 11 SECL authorities, the Exchequer
received a net contribution of £17.7 billion in 2005/06, nearly twice the contribution made by London.
(vi) Estimates for 2006/07, based upon public spending plans, show
contributions rising to £15.8 billion and £6.1 billion for the South East and Eastern regions respectively (£21.9 billion in total).
(vii) The South East’s contribution to the national economy has become
more important, as the overall UK fiscal position has begun to deteriorate, with the combined net contribution of the South East and Eastern regions rising from £18.9 billion in 2003/04 to £21.9 billion in 2006/07.
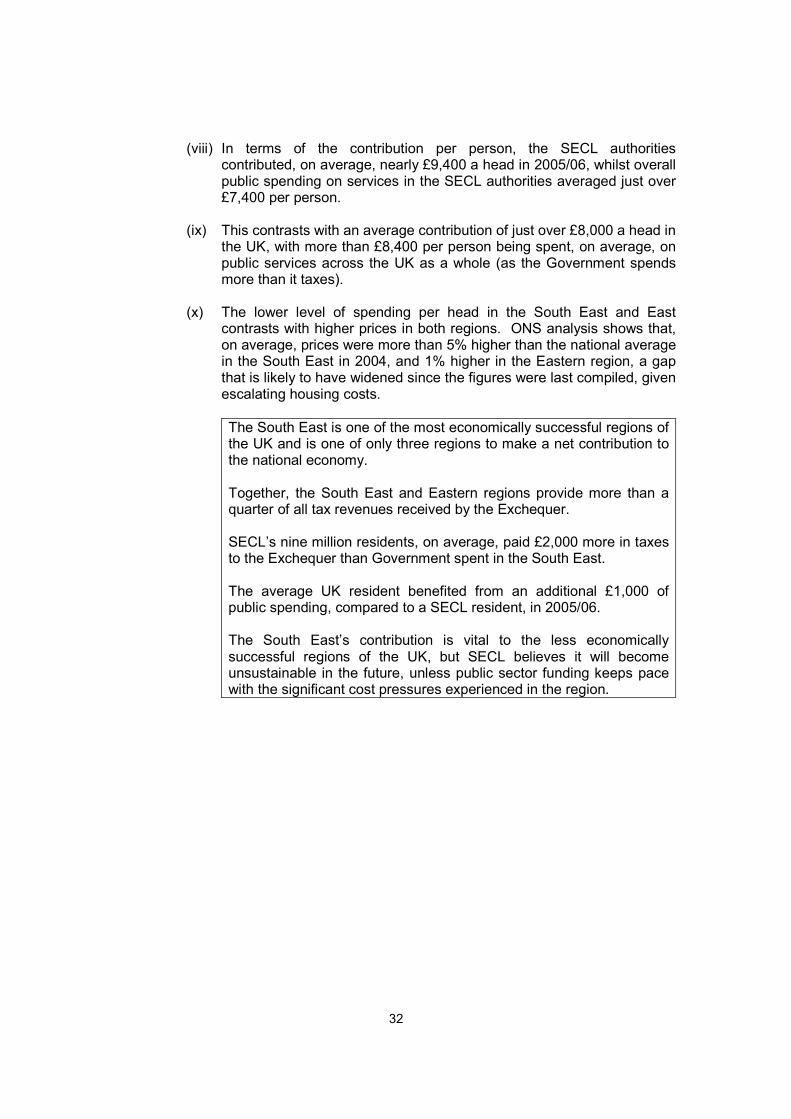
(viii) In terms of the contribution per person, the SECL authorities
contributed, on average, nearly £9,400 a head in 2005/06, whilst overall public spending on services in the SECL authorities averaged just over £7,400 per person.
(ix) This contrasts with an average contribution of just over £8,000 a head in
the UK, with more than £8,400 per person being spent, on average, on public services across the UK as a whole (as the Government spends more than it taxes).

10
(x) The lower level of spending per head in the South East and East contrasts with higher prices in both regions. ONS analysis shows that, on average, prices were more than 5% higher than the national average in the South East in 2004, and 1% higher in the Eastern region, a gap that is likely to have widened since the figures were last compiled, given escalating housing costs.
The South East is one of the most economically successful regions of the UK and is one of only three regions to make a net contribution to the national economy. Together, the South East and Eastern regions provide more than a quarter of all tax revenues received by the Exchequer. SECL’s nine million residents, on average, paid £2,000 more in taxes to the Exchequer than Government spent in the South East. The average UK resident benefited from an additional £1,000 of public spending, compared to a SECL resident, in 2005/06. The South East’s contribution is vital to the less economically successful regions of the UK, but SECL believes it will become unsustainable in the future, unless public sector funding keeps pace with the significant cost pressures experienced in the region.
Local Government Services
Funding Pressures
(i) The SECL authorities have been disadvantaged by successive local
government finance settlements, to the extent that 10 of the 11 counties are at the funding floor in 2007/08. Ten authorities therefore require a damping grant to bring them up to minimum levels of funding provided by the system. The current ‘four block’ funding model is also more reliant upon judgment, which leads to less transparency in terms of funding decisions.
(ii) Some SECL authorities have only seen minimum grant increases for
the last five years, and, due to Government pressure to ‘passport’ the great majority of any additional funding to schools, this has left little available for other key services.
(iii) Damping protection in 2007/08 accounted for a larger proportion of
formula grant for the South East region (4.8%) than any other region nationally. This compares to areas such as London, where damping comprised only 1.5% of formula grant.
(iv) Across SECL, the degree of protection provided by damping grant
amounted to £148 million for 2006/07 and £145 million in 2007/08. The gap between SECL and other authorities will also become wider for as long as SECL authorities remain on the funding floor.
11
(v) The recent formula grant review considered the possibility of reducing
the funding floor from the current level of 2.7% to 0%, which would potentially cost the SECL authorities £27m in 2007/08.
(vi) In 2007/08, formula grant per head is lowest in the South East (at £338)
compared to any other region nationally (the highest allocation is in London at £782 per head). The average formula grant per head across England is £506.
(vii) In terms of specific grant funding allocations, the South East region also
received a lower proportion of specific grants (10%) than its proportion of the population (16%) for 2006/07.
(viii) Transferring specific grants (most of which affect children and social care) into the main funding formula also has an adverse impact on SECL authorities, who, because they are at the floor, only receive the minimum grant level. Such transfers do not always adequately fund the full cost of new services.
(ix) The South East region incurs significantly higher costs in delivering services. These include, amongst other factors, the impact of higher wage rates. The Area Cost Adjustment (ACA) factor used in the funding formula to compensate for these higher costs is therefore vital to the SECL authorities, with the ACA comprising around £218 million (before grant damping) of SECL authorities’ funding in 2007/08.
(x) Changes to the ACA have steadily reduced its benefit to SECL authorities, whilst leaving the average London position (where wage costs are also higher), broadly unchanged. In addition, some areas of funding, such as specific grants for schools, do not include any Area Cost Adjustment factor at all.
(xi) If the previous 2002/03 ACA values were used in the 2007/08 settlement calculation, it is estimated that the SECL authorities would have received an additional Relative Needs Formula allocation of approximately £130 million, before damping.
(xii) ACA funding also appears to be unfair in parts of the South East, as illustrated by research commissioned by West and East Sussex from National Economic Research Associates (NERA) and Rita Hale & Associates respectively. For example, NERA have identified that using alternative Labour Force Survey data in the ACA would, approximately, estimate the relative wage pressures in the ‘Rest of the South East’ to be around 5% higher than the current ACA suggests.

12
(xiii) The South East is not wholly prosperous and there are areas where income levels compare with some of the least prosperous regions of the UK. Here deprivation is ‘hidden’ by the relative buoyancy of the region as a whole, which means it is often not recognised by funding formulae. The high cost of living in the South East also particularly affects those who are not part of the region’s economic success, and is often not taken into account by Government funding measures.
(xiv) Within the context of these funding formula and specific grant changes, the 11 SECL authorities have delivered £201m of cumulative efficiency gains over 2004/05-2005/06, with £153m of these gains being cashable.
(xv) With growing cost pressures, these levels of efficiencies are unlikely to be sustained in the longer term. The possibility that Government may top-slice assumed efficiency gains from grant funding, including the Dedicated Schools Grant, would put further pressure on SECL authorities’ funding.
SECL authorities have been disadvantaged by recent finance settlements. If formula grant per head in the South East matched the national average, the South East would have received an additional £1.3 billion in local government funding in 2007/08. Unless the Government makes changes to the funding system to redress this, the ‘gap’ is set to increase over time. The South East should receive an equitable allocation of specific grant funding, with existing grants continuing to be retained, in order that funding is not ‘lost’ by floor authorities, when grants are transferred into the general funding formula. The higher costs of delivering services in the South East should be fully and fairly recognised in the Area Cost Adjustment (ACA). The use of the Labour Force Survey should be considered as an alternative source of data for calculating the ACA. SECL authorities have delivered cumulative efficiency gains which are 71% above target overall and 160% above target in terms of cashable efficiencies. SECL authorities are keen to find additional efficiency gains through business transformation, but, if Government allocations, via the funding settlement and specific grants, were to decline further, these potential savings would be put at risk. Efficiency savings should continue to be made available to reinvest in essential services, rather than being top-sliced from grant funding, which would only exacerbate funding pressures. In the longer term, SECL would like Government to review the four-block funding model.

13
In the short term, SECL believes that the Comprehensive Spending Review and forthcoming local government finance settlement must address a funding system that the SECL feels is no longer fit for purpose and which does not provide adequate funding for essential services, by:
• Not allowing the funding floor to fall below the existing 2.7% level.
• Retaining damping grant to provide protection to authorities who fall below the floor.
• Ensuring that the local government funding formula is robust and transparent.
Older People’s Social Care (65 plus) (i) The 65 plus population in the SECL area is projected to grow by more
than the national average, with growth by 2011 predicted to be 11.5%, compared to the national average of 9.3%. By 2029, growth is projected to be 58.4%, compared to the national average of 53.8%. This is a particular trend in South East coastal areas.
(ii) The costs of providing adult social care are rising faster than inflation,
particularly for residential care, where high regional wage pressures and the cost of improving services, in accordance with Government requirements, are having an adverse financial impact.
The 65 plus population in the SECL area is currently growing faster, and will continue to grow faster, than the national average, which is increasing pressure on SECL authorities. The costs of providing social care are rising faster than inflation, particularly in residential care. SECL believes that the formula used to calculate funding for older people’s social care needs to reflect the ‘cost curve’ facing the South East, as demographic pressures mean that growing numbers of older people require more expensive services and increasing levels of care.
Adult Social Care (18-64) (i) SECL authorities, on average, currently receive less funding for their
share of relative need than they spend on adult social care for 18-64 year olds. In general, the lower level of funding provided to the South East is due to a very high allocation of relative need to authorities in the North and, to a lesser extent, the Midlands.

14
(ii) In 2007/08, the 11 counties received 12.6% of the Government’s Relative Needs Formula (RNF) for adult social care for 18-64 year olds, compared with their 17.6% share of the 18-64 year old population. The proportion of RNF received by SECL authorities has been below the proportion of the 18-64 year old population, in every year since 2002/03.
The SECL authorities believe the funding formula needs to reflect how the SECL authorities actually deliver social care and address the increasing demand for services from adults aged 18-64.
The increased incidence of learning disabilities; higher life expectancy; more intensive requirements; and the increased complexity of cases, all result in significantly higher costs and require authorities to direct resources towards preventative services, rather than address the choice agenda promoted by Government.
Children’s Services
(i) Children’s Services have seen considerable change in recent years. Increases in funding for education have, for many years, been significantly above the average increases for other local authority services. Pressure from Government to ‘passport’ schools’ funding increases has, however, placed financial constraints on other services.
(ii) In addition, the Dedicated Schools Grant may not fully reflect high area cost pressures and specific grants do not take higher operating costs into account.
(iii) The majority of funding for children’s social care is in formula funding,
which means SECL authorities only receive minimum increases to cope with a wide range of cost pressures within children’s social care, which are not fully funded.
SECL is concerned that the Comprehensive Spending Review could top-slice assumed efficiency gains from grant funding and believes that any change to Dedicated Schools Grant funding should explicitly consider the needs of authorities whose per pupil allocations will be at the funding floor. Funding for children’s social care should recognise the additional costs of delivering the Government’s agenda, with the overall funding floor being set at an appropriate level to enable these cost pressures to be addressed.
Waste Services
(i) The funding formula for waste services is part of the Environmental, Protective and Cultural Services block, which contains funding for a wide range of general local authority services. This means that the specific allocation for waste cannot be separately identified.

15
(ii) The SECL authorities face continuing extra costs, particularly in relation to rising disposal charges and household waste volumes, as local authorities develop alternatives to landfill. Whilst additional costs are unavoidable in the short term, in the long term, population growth will also increase the overall cost of waste services.
SECL believes that waste should become a separately identifiable block within the formula grant system, which takes its escalating costs into account. Demographic changes, climate change, and new house-building are already adding to cost pressures facing SECL authorities.
Police Authority Funding
(i) In 2007/08, average levels of total funding for police authorities (including specific grants) for the South East were £128.82 per head, representing only 73% of the England average of £176.22, despite the higher costs in the South East due to wage and other pressures.
(ii) Many police authorities in the region already have lower officer numbers than the national average. The region’s police authorities also receive a high proportion of their income from Government grant and, if Government grant increases are, as expected, below RPI in future, it will be difficult to maintain existing service levels and satisfy public expectations about improved policing.
SECL has fewer police officers than elsewhere: on average, 495 residents in the SECL area have their own police officer, while in the rest of England; each police officer looks after an average of 468 residents.
In 2007/08, average levels of total funding for police authorities for the South East were 73% of the England average, despite higher wage and other cost pressures.
Police authorities in the SECL area are concerned that the indicators used to determine police funding do not reflect the ‘urban’ related pressures faced by officers working across much of the South East. The formula does not, therefore, allocate sufficient funding to cover factors such as the region’s proximity to London, its gateway status as a point of entry into the UK, and the large numbers of visitors it attracts.

16
Health Funding
(i) Primary Care Trusts (PCTs) in the South of England receive less funding per head of population than those in other parts of the country, even though costs are identifiably higher in the South East. A simple comparison of per capita funding for 2006/07 shows that South of England PCTs receive £92 per head less than the national average level of funding.
(ii) Of the five PCTs with the lowest per capita funding in 2006/07, four
were in the South East: Wokingham (£989), North East Oxfordshire (£994), Maldon and South Chelmsford (£1,005) and Horsham and Chanctonbury (£1,005).
(iii) At the opposite end of the spectrum, four PCTs received over £1,700
per head of population: Islington (£1,838), Tower Hamlets (£1,715), Southwark (£1,701) and North Manchester (£1,701). These indicate the sheer scale of the funding differential with, on average, a Wokingham resident receiving less than 54% of the NHS funding available to an Islington resident in 2006/07.
(iv) Of the SECL authorities, five county areas remain 1.0% or more below
target funding. These counties do not, therefore, receive the full level of resources to which they are entitled under the national funding formula. The shortfall is significant; for example, the £37.6m by which the local NHS in Essex is funded below target would go a long way towards addressing the financial pressures it currently faces.
(v) Surrey (£62.7m), West Sussex (£23.2m) and East Sussex (£18.6m) are
deemed to receive funding significantly above target; which means that, over time, funding will be reduced. However, it seems very unlikely that the scale of spending reduction implied can be achieved without a significant and adverse impact upon local health provision, given that sizeable financial deficits are already prevalent across these counties.
(vi) Analysis of health deficits by region identifies that, in 2006/07, the South East Coast and East of England Strategic Health Authority areas were the only two regions in the country where deficits occurred (£152m for the East and £48m for the South East Coast). Of these totals, approximately £159m relates to the region covered by the 11 SECL authorities.

17
The South East is home to four of the five PCTs with the lowest per capita funding and home to the only two regions of the NHS in England to be in deficit. Funding levels of the worst funded PCTs in the South East are barely half that per person received by the best funded PCTs in London. The SECL authorities are concerned that NHS under funding in the South East has led to health deficits and reductions in services. There needs to be greater transparency and accountability in PCT funding and how it is distributed nationally to regions, with:
• A review of the NHS funding formula, to ensure that adequate recognition is given to age related demands, in the light of demographic trends showing that people are living longer.
• The ‘pace of change’ of movement towards target being capped for those PCTs currently above target, to manage their financial exposure, given existing deficit levels.
• The adoption of population calculation methodologies that more promptly acknowledge changes in population and reflect recent population inflows to fast-growing areas.
Infrastructure Costs and Pressures
(i) The latest research from the South East England Regional Planning Committee, in July 2007, estimated that £89 billion will need to be invested in infrastructure in the South East over the next 20 years to fund health services; schools; transport; flood defences; water resources; maintaining water quality; waste treatment; and building community facilities and more affordable homes.
(ii) Before April 2006, even authorities who only received the minimum
grant floor increase each year received extra grant to help pay for Government approved borrowing to fund capital projects. Since 2006/07, this extra support has been abolished and means that all except one of the SECL authorities have been awarded ‘supported’ borrowing allocations from Government to help fund capital programmes, but in practice, they have not received any extra Government funding.

18
Latest research estimates that £89 billion needs to be invested in the South East’s infrastructure, more than four times the £19 billion the Government says it is investing in infrastructure in both the South East and East of England.
In terms of local government revenue support for capital investment, SECL believe that this would best be provided through capital grants, rather than through formula grant. This will allow capital investment allocations to be fully taken up, otherwise, funding for capital investment will continue to be ‘lost’ within the local government finance system, preventing authorities from funding vital infrastructure to support growing communities.
Conclusion
Tax revenues are directly related to economic success and, as one of the most successful economies in the UK, the South East is providing increasing support to the less economically successful regions of the UK. In recent years, the combined South East and Eastern contribution, worth £21.9 billion in 2006/07, has become more significant and, together, the South East and East increased their contribution to the Exchequer by £3 billion from 2003/04 to 2006/07.
The contribution made by the 11 SECL authorities amounted to £17.7 billion in 2005/06 and was nearly twice that of London’s, on a residence basis. This equates to a contribution of £9,400 per head, compared to public spending of just £7,400 per head, despite the higher costs of service provision in the South East.
On average, across the UK, £8,400 per head is spent nationally on public services, which means that the nine million people living in the SECL authorities receive an average of £1,000 less in public spending per person, compared to the average UK resident.
Over recent years, the SECL authorities have been disadvantaged by successive local government finance settlements. Evidence also exists of funding problems in other public services, such as police and health. At the same time, public services in the South East are experiencing rising demands from both population growth and a rapidly ageing population, with funding not keeping pace with these changes:
• Funding levels are already the lowest per head relative to other regions.
• SECL authorities are currently heavily reliant upon £145 million of damping grant; with the ‘gap’ between SECL and other authorities set to increase if SECL continues to be at the minimum funding floor.
• For local authorities on the floor, only a minimum increase in grant is received (2% and 2.7% in the last two financial years). Real concerns exist that there is a possibility of grant even being frozen in the future, if the floor was to fall to 0%.

19
• Health services are also under financial strain and many PCTs in the SECL area are struggling with budget deficits. Reduced funding is expected to remove £62.7m from Surrey, £23.2m from West Sussex, and £18.6m from East Sussex health budgets over time.
The SECL authorities are among the best and most innovative authorities in the country, have produced cumulative efficiency savings of £201m over 2004/05-2005/06 and are committed to delivering more, as they continue to improve services.
SECL believes that a Government committed to delivering economic prosperity cannot continue to take the South East’s economic success for granted. Ministers have an obligation to provide a fairer deal to the South East, in order that the region can continue to support the less economically successful and poorer regions of the UK. Without a fairer deal that takes into account the increasing pressures and higher costs of delivering services in the South East, SECL authorities will find it increasingly difficult to continue providing high quality, value for money public services that nurture and support the powerhouse of the UK economy.

20
21
1. Taxation versus Public Spending 1.1 Introduction 1.1.1 Earlier this year, Oxford Economics analysed how government spending and
government revenues were distributed across the different regions of the UK, leading to very different net contributions to UK public finances.
1.1.2 The conclusion was that only the regions in the wider South East of England, i.e.
the Government Office Regions of London, the South East and Eastern, made a net positive contribution to UK public finances, with all other regions and countries of the UK having an implicit deficit in their public finances.
1.1.3 As part of this project for SECL, further analysis has been undertaken by Oxford
Economics, building upon this initial work. This analysis has covered, in particular:
• The extent of total public sector spending by UK region and for each of the SECL authorities for 2005/06, the latest year for which actual spend data is available.
• The contribution made from taxes and revenues by UK region and for each of the SECL authorities in 2005/06.
• The net contribution made by region and for each of the SECL authorities for 2005/06, identifying the contribution to the national economy made by the South East and Eastern regions.
• Trends in the net contributions made by the South East and Eastern regions from 2003/04 to 2006/07 (based upon spending plans for 2006/07).
• A comparison of total public sector spending per head for the SECL authorities, compared to the average across the UK as a whole, identifying the significant difference in spending per head for the SECL authorities.
1.2 Overall Approach
1.2.1 Our approach compares taxes raised from each region/county with the amount of
public spending attributable to each region/county, in order to assess the net impact on the overall position of UK public finances. It should be noted that this analysis is much wider than solely county finances themselves. On the revenue side, this covers all taxes, including income tax, VAT, corporation tax etc., as well as resources specifically attributable to counties (council tax, non-domestic rates). Appendix A provides a more detailed explanation of the approach used to calculate the SECL contribution to UK public finances.

22
1.2.2 Similarly, on the spending side, all public spending attributable to a county is covered, whether the spending is by county councils, districts or central government. Most of the detailed figures presented are for 2005/06, since this is the last financial year for which disaggregated data is available on spending, based on outturns, rather than plans. However, the extent to which contributions have been changing over the past few years has also been considered, including 2006/07 data, based on spending plans.
1.3 Measuring Public Spending by Region and County
1.3.1 Official data which analyses the bulk of public spending in regional terms is compiled by HM Treasury (HMT) and published in the 2007 Public Expenditure Statistical Analyses (PESA). Data is compiled primarily on the basis of spending ‘for’ each region, that is, on the basis of which region benefits from the spending, rather than on the basis of spending ‘in’ each region. Around 83% of Total Managed Expenditure (TME) is directly allocated across the regions in this way.
1.3.2 So, where a Government agency is based in one region, but acts on behalf of the
wider population, then the spending is not all attributable to the region where the agency is based. The same approach has been followed in our analysis, since looking at spending in terms of who benefits from the expenditure is appropriate for comparing this with who pays.
1.3.3 There are two significant areas where the spending analysis needs to be
extended beyond PESA in order to provide a more comprehensive picture of the geographical location of public spending. Firstly, around an eighth of public spending is not allocated across regions in the HMT analysis – termed ‘non-identifiable’ spending. Although there is less clear information on how this spending should be regarded as attributable to each region, we nevertheless feel it would be misleading to present public finance estimates excluding this significant element of spending, and therefore have used a variety of alternative approaches to attributing this non-identifiable spending to regions.
1.3.4 Secondly, PESA contains no analysis at sub-regional level that would allow robust estimates to be made of how much spending is attributable to each county within a region. We have therefore developed our own approach to estimating this expenditure. For identifiable expenditure, this is estimated by looking separately at spending by local authorities and spending by central government. For local authority spending, actual expenditure data can be used; assuming that each authority’s spending is primarily on behalf of its own area.
1.3.5 For the central government element, on the other hand, we have estimated how
much of the regional total of spending on each different expenditure function (for example, public order; employment policies; transport; health; etc.) is attributable to each county, using information of the relative scale of each county through an appropriate indicator.

23
1.3.6 Appendix A explains these assumptions in detail, but the principle is, for example, that the benefit from central government spending on general public services can be assumed to be proportional to each county’s population, or that the benefit of spending on employment policies can be assumed to be proportional to the number of non-employed people in each county.
1.4 Measuring Tax Revenues by Region and County
1.4.1 Unlike public spending, there is relatively little official information on taxes paid by region, and even less so by county. Income tax, council tax and non-domestic rates are the main revenue sources where regional information is available. However, there are reasonably robust indicators on which to base estimates of the breakdown of other taxes, for example, consumer spending for VAT, vehicle registrations for car tax etc.
1.4.2 For some taxes, there are significant differences between the amounts of tax
attributable to particular regions, depending on whether this is considered on a ‘workplace’ or ‘residence’ basis. For example, if people live in one region but work in another, the income tax they pay on their earnings could be regarded as attributable either to the region they work in, or to the one in which they live. At a regional level, we have estimated contributions on both bases for taxes where there is a meaningful distinction.
1.4.3 At a county level, the analysis of taxes paid very closely follows the methodology adopted at a regional level, with similar indicators being used, wherever possible, to attribute how much of a region’s contribution to a particular tax is attributable to each county within the region. We have only produced figures on a residence basis, since the tax paid by people who live in each county is most directly comparable with the spending undertaken on their behalf.
1.5 Regional Contributions
1.5.1 On a residence basis, in 2005/06, the South East region made the largest net positive contribution to the Exchequer, with £15.1 billion more being raised in taxes than was spent by the public sector in the region. A net contribution of £5.1 billion was provided by the Eastern region. Figure 1 and Figure 2 summarise these calculations.
24
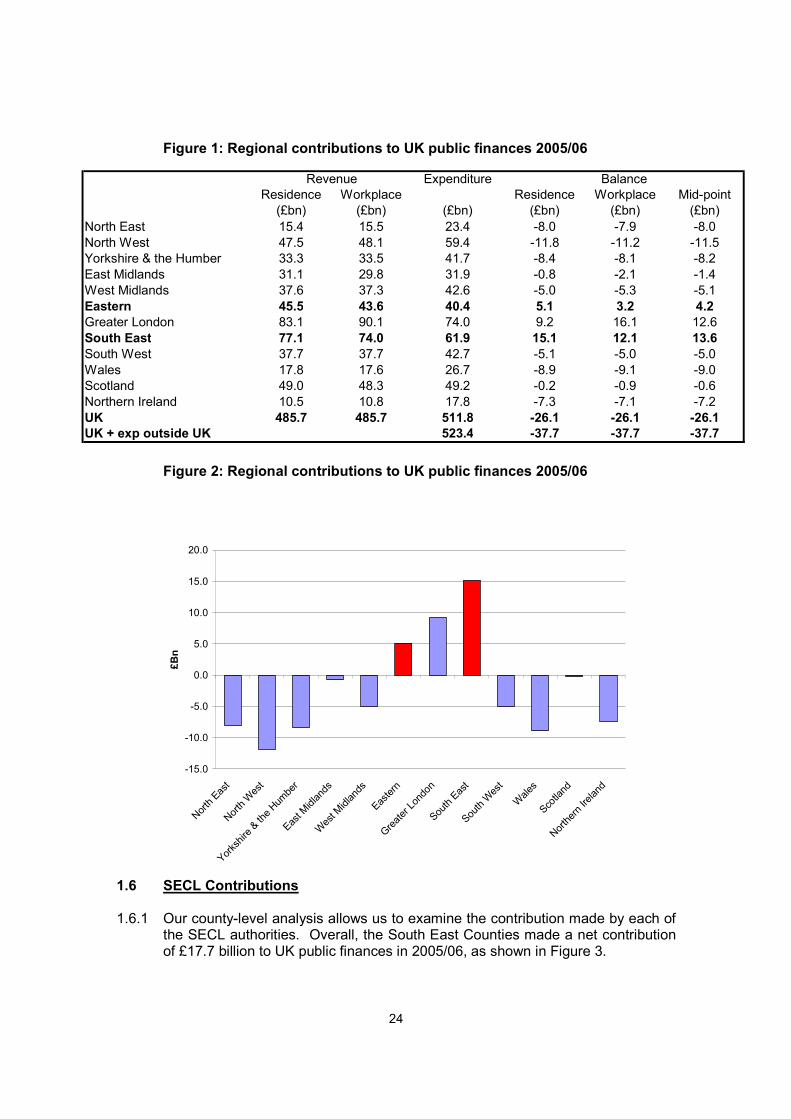
Figure 1: Regional contributions to UK public finances 2005/06
Figure 2: Regional contributions to UK public finances 2005/06
-15.0
-10.0
-5.0
0.0
5.0
10.0
15.0
20.0
North East
North West
Yorkshire & the Humber
East Midlands
West Midlands
Eastern
Greater London
South East
South West
Wales
Scotland
Northern Ireland
£Bn
1.6 SECL Contributions
1.6.1 Our county-level analysis allows us to examine the contribution made by each of the SECL authorities. Overall, the South East Counties made a net contribution of £17.7 billion to UK public finances in 2005/06, as shown in Figure 3.
Expenditure
Residence
(£bn)
Workplace
(£bn) (£bn)
Residence
(£bn)
Workplace
(£bn)
Mid-point
(£bn)
North East 15.4 15.5 23.4 -8.0 -7.9 -8.0
North West 47.5 48.1 59.4 -11.8 -11.2 -11.5
Yorkshire & the Humber 33.3 33.5 41.7 -8.4 -8.1 -8.2
East Midlands 31.1 29.8 31.9 -0.8 -2.1 -1.4
West Midlands 37.6 37.3 42.6 -5.0 -5.3 -5.1
Eastern 45.5 43.6 40.4 5.1 3.2 4.2
Greater London 83.1 90.1 74.0 9.2 16.1 12.6
South East 77.1 74.0 61.9 15.1 12.1 13.6
South West 37.7 37.7 42.7 -5.1 -5.0 -5.0
Wales 17.8 17.6 26.7 -8.9 -9.1 -9.0
Scotland 49.0 48.3 49.2 -0.2 -0.9 -0.6
Northern Ireland 10.5 10.8 17.8 -7.3 -7.1 -7.2
UK 485.7 485.7 511.8 -26.1 -26.1 -26.1
UK + exp outside UK 523.4 -37.7 -37.7 -37.7
Revenue Balance

25
Figure 3: Overall SECL contributions to UK public finances 2005/06 by tax/spending area
Tax/spending 2005/06
(£bn)
Income tax 27.1
NICs 14.6
VAT 10.8
Other taxes 31.9
All taxes 84.4
Local authority spending 17.7
Identified central govt spending 34.7
Unidentified central govt spending 14.3
Total spending 66.8
NET CONTRIBUTION 17.7
1.6.2 Almost all parts of the SECL area contribute towards the South East’s public finance surplus. Figure 4 shows the county position in 2005/06. Without SECL’s net contribution of £17.7 billion, the overall UK deficit (i.e. expenditure less revenue) of £37.7 billion, would have been much higher.
26
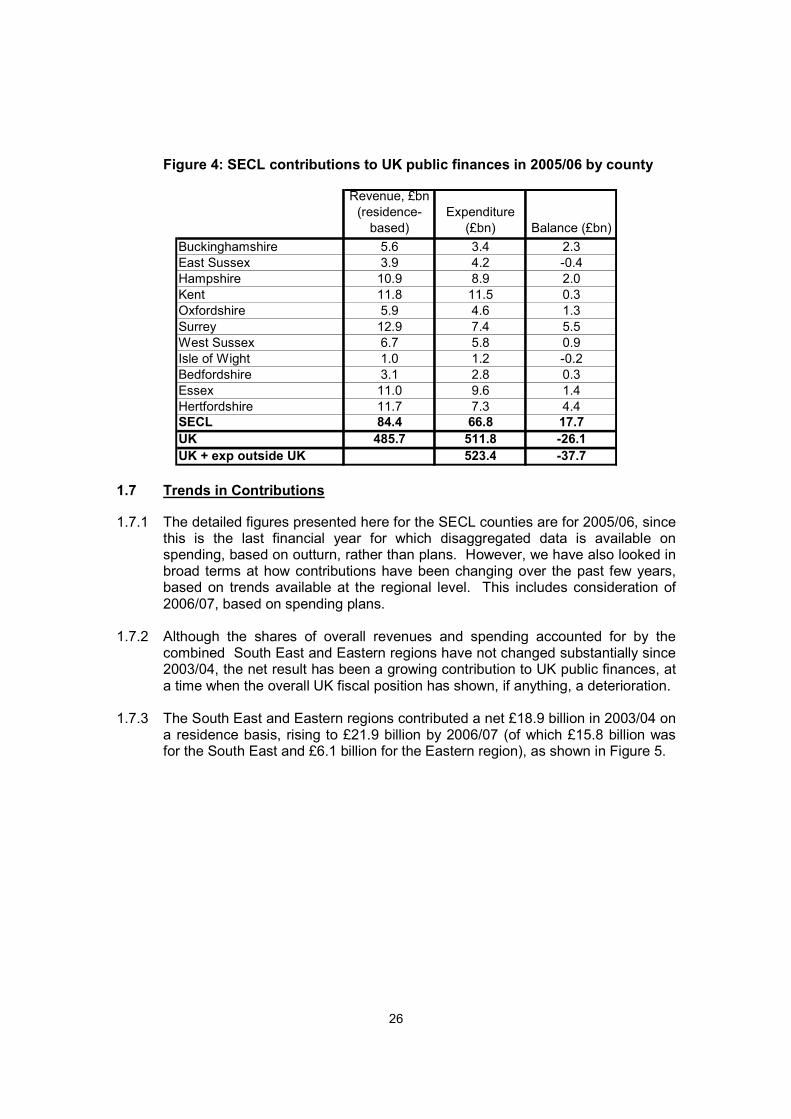
Figure 4: SECL contributions to UK public finances in 2005/06 by county
1.7 Trends in Contributions
1.7.1 The detailed figures presented here for the SECL counties are for 2005/06, since this is the last financial year for which disaggregated data is available on spending, based on outturn, rather than plans. However, we have also looked in broad terms at how contributions have been changing over the past few years, based on trends available at the regional level. This includes consideration of 2006/07, based on spending plans.
1.7.2 Although the shares of overall revenues and spending accounted for by the
combined South East and Eastern regions have not changed substantially since 2003/04, the net result has been a growing contribution to UK public finances, at a time when the overall UK fiscal position has shown, if anything, a deterioration.
1.7.3 The South East and Eastern regions contributed a net £18.9 billion in 2003/04 on
a residence basis, rising to £21.9 billion by 2006/07 (of which £15.8 billion was for the South East and £6.1 billion for the Eastern region), as shown in Figure 5.
Revenue, £bn
(residence-
based)
Expenditure
(£bn) Balance (£bn)
Buckinghamshire 5.6 3.4 2.3
East Sussex 3.9 4.2 -0.4
Hampshire 10.9 8.9 2.0
Kent 11.8 11.5 0.3
Oxfordshire 5.9 4.6 1.3
Surrey 12.9 7.4 5.5
West Sussex 6.7 5.8 0.9
Isle of Wight 1.0 1.2 -0.2
Bedfordshire 3.1 2.8 0.3
Essex 11.0 9.6 1.4
Hertfordshire 11.7 7.3 4.4
SECL 84.4 66.8 17.7
UK 485.7 511.8 -26.1
UK + exp outside UK 523.4 -37.7
27
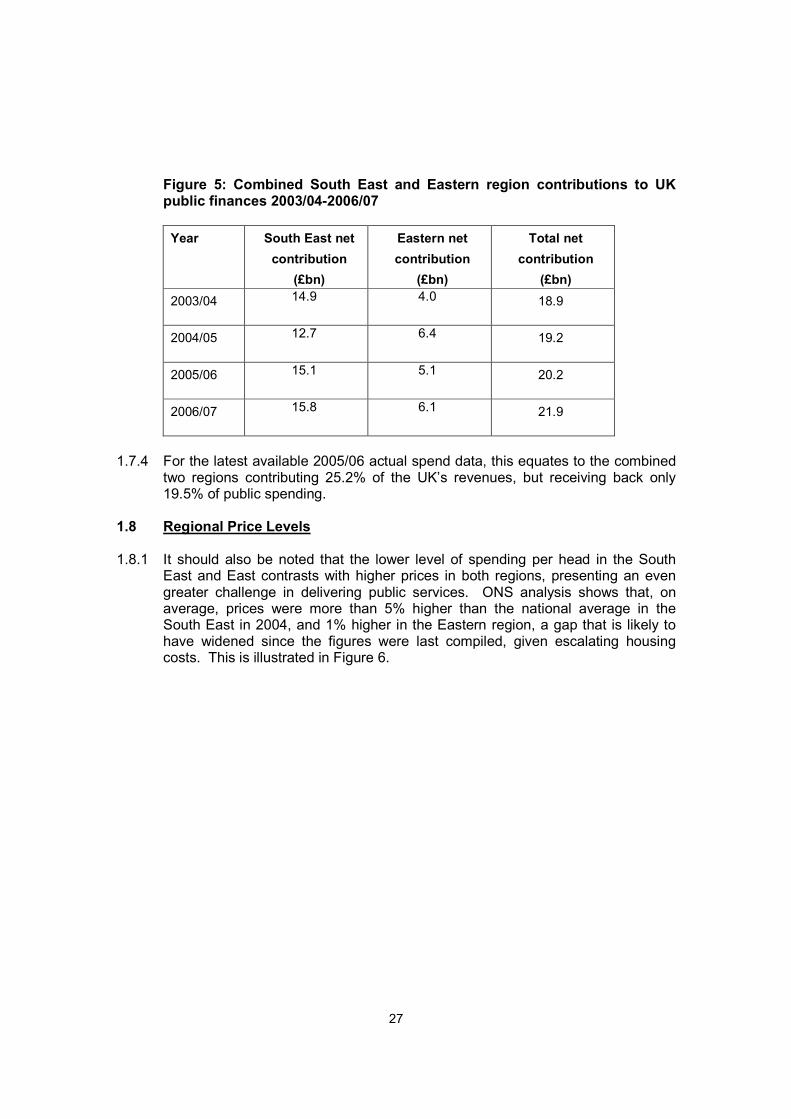
Figure 5: Combined South East and Eastern region contributions to UK public finances 2003/04-2006/07
Year South East net
contribution
(£bn)
Eastern net
contribution
(£bn)
Total net
contribution
(£bn)
2003/04 14.9 4.0 18.9
2004/05 12.7 6.4 19.2
2005/06 15.1 5.1 20.2
2006/07 15.8 6.1 21.9
1.7.4 For the latest available 2005/06 actual spend data, this equates to the combined
two regions contributing 25.2% of the UK’s revenues, but receiving back only 19.5% of public spending.
1.8 Regional Price Levels
1.8.1 It should also be noted that the lower level of spending per head in the South East and East contrasts with higher prices in both regions, presenting an even greater challenge in delivering public services. ONS analysis shows that, on average, prices were more than 5% higher than the national average in the South East in 2004, and 1% higher in the Eastern region, a gap that is likely to have widened since the figures were last compiled, given escalating housing costs. This is illustrated in Figure 6.

28
Figure 6: Average price in each region, relative to national average (2004, UK =100)
Region Relative price in
2004 (UK =100)
Wales 93.1
North East 94.2
Yorks & Humber 94.2
Scotland 94.5
North West 96.9
Northern Ireland 95.8
East Midlands 97.4
West Midlands 97.8
Eastern 101.1
South West 101.3
South East 105.3
London 109.7
Source: ‘Relative regional consumer price levels in 2004’, ONS Economic Trends February 2005 (figures based on national weights).
1.9 Contributions and Expenditure per Head 1.9.1 In 2005/06, the SECL authorities contributed, on average, nearly £9,378 a
head, with overall public spending in the SECL authorities averaging just £7,416 per person, a difference between the amount raised and spent in the SECL region of £1,962 per person. Figure 7 sets out the contribution made by each SECL authority, on a per capita basis, by calculating the revenues collected. This has been contrasted with the level of public spending per head for the SECL authorities.

29
Figure 7: SECL contributions per head to UK public finances compared to
public spending per head 2005/06
1.9.2 The SECL contribution of £9,378 per head compares to a UK average
contribution of £8,016 per head to the Exchequer. On average, £8,445 per person is spent on public services across the UK, while just £7,416 is spent on average in the SECL area. For 2005/06, therefore, UK residents as a whole benefited from, on average, an additional £1,029 of public spending compared to the average SECL resident.
1.9.3 The South East and Eastern regions have also consistently received the lowest
levels of public sector expenditure per head compared to other UK regions, over each of the last six years, as illustrated in Figures 8 and 9. These figures are drawn from PESA national statistics and relate to ‘UK identifiable expenditure’ on services i.e. the 83% of Total Managed Expenditure, referred to previously in 1.3.1, which is directly attributable to regions.
Revenue, £ per
person
(residence-
based)
Expenditure (£
per person)
Balance (£ per
person)
Buckinghamshire 11,665 6,978 4,687
East Sussex 7,742 8,502 -760
Hampshire 8,629 7,073 1,556
Kent 8,582 8,370 212
Oxfordshire 9,400 7,379 2,020
Surrey 11,969 6,867 5,101
West Sussex 8,717 7,564 1,153
Isle of Wight 7,178 8,840 -1,662
Bedfordshire 7,906 7,031 875
Essex 8,224 7,186 1,039
Hertfordshire 11,186 6,991 4,194
SECL 9,378 7,416 1,963
UK 8,016 8,445 -430
UK + exp outside UK 8,638 -623

30
Figure 8: UK identifiable expenditure on services per head 2001/02-2006/07
2001/02
£ per head
2002/03
£ per head
2003/04
£ per head
2004/05
£ per head
2005/06
£ per head
2006/07
£ per head
Average 2001-07
£ per head
Eastern 4,427 4,767 5,252 5,604 5,928 6,144 5,354
South East 4,450 4,749 5,243 5,711 5,960 6,304 5,403
East Midlands 4,817 5,025 5,484 5,938 6,205 6,491 5,660
South West 4,960 5,130 5,659 6,079 6,398 6,677 5,817
West Midlands 5,111 5,410 5,938 6,385 6,757 7,065 6,111
Yorkshire and Humberside
5,346 5,672 6,136 6,577 6,949 7,188 6,311
North West 5,716 6,085 6,635 7,087 7,481 7,798 6,800
North East 6,125 6,471 7,059 7,424 7,814 8,177 7,178
London 5,942 6,423 7,259 7,629 8,164 8,404 7,304
Figure 9: UK identifiable expenditure on services per head 2001/02-2006/07
Total regional spending per head 2001-2007
3,500
4,000
4,500
5,000
5,500
6,000
6,500
7,000
7,500
8,000
8,500
9,000
2001/02
2002/03
2003/04
2004/05
2005/06
2006/07
Year
Spending per head (£) Eastern
South East
East Midlands
South West
West Midlands
Yorkshire and
HumbersideNorth West
North East
London

31
1.9.4 Given the progressive nature of taxation, and because national spending is greater than revenues collected, it is to be expected that the more successful regions will contribute towards spending elsewhere in the UK. However, through highlighting the value of SECL’s contribution to UK public finances, the importance of nurturing and maintaining the South East’s economic success should be recognised.
1.9.5 Ultimately, if the tax burden on either individuals, or businesses, rises to the point
where the South East is no longer a preferred location for people to live, or for businesses to run their operations from, this will impact upon the region’s ability to continue to make the largest fiscal contribution to the Exchequer, which will quickly have an adverse financial impact on the UK as a whole.
Conclusion – Taxation versus Public Spending
(i) Using the latest available actual spending data for 2005/06, from Public Expenditure Statistical Analysis (PESA) figures, the South East region as a whole made the largest net positive contribution to the Exchequer on a residence basis, based upon the taxes paid by people who live in each region.
(ii) In the South East region, in 2005/06, £15.1 billion more was raised in
taxes than was accounted for by public spending in the region. A further net contribution of £5.1 billion was provided by the Eastern region in 2005/06.
(iii) This equates to the combined two regions contributing 25.2% of the
UK’s revenues, but receiving back only 19.5% of public spending in 2005/06.
(iv) This compares with London’s contribution of £9.2 billion in 2005/06 (on
a residence basis), the only other region to make a net positive contribution to the national economy.
(v) For the area covered by the 11 SECL authorities, the Exchequer
received a net contribution of £17.7 billion in 2005/06, nearly twice the contribution made by London.
(vi) Estimates for 2006/07, based upon public spending plans, show
contributions rising to £15.8 billion and £6.1 billion for the South East and Eastern regions respectively (£21.9 billion in total).
(vii) The South East’s contribution to the national economy has become
more important, as the overall UK fiscal position has begun to deteriorate, with the combined net contribution of the South East and Eastern regions rising from £18.9 billion in 2003/04 to £21.9 billion in 2006/07.
32
(viii) In terms of the contribution per person, the SECL authorities contributed, on average, nearly £9,400 a head in 2005/06, whilst overall public spending on services in the SECL authorities averaged just over £7,400 per person.
(ix) This contrasts with an average contribution of just over £8,000 a head in
the UK, with more than £8,400 per person being spent, on average, on public services across the UK as a whole (as the Government spends more than it taxes).
(x) The lower level of spending per head in the South East and East
contrasts with higher prices in both regions. ONS analysis shows that, on average, prices were more than 5% higher than the national average in the South East in 2004, and 1% higher in the Eastern region, a gap that is likely to have widened since the figures were last compiled, given escalating housing costs.
The South East is one of the most economically successful regions of the UK and is one of only three regions to make a net contribution to the national economy. Together, the South East and Eastern regions provide more than a quarter of all tax revenues received by the Exchequer. SECL’s nine million residents, on average, paid £2,000 more in taxes to the Exchequer than Government spent in the South East. The average UK resident benefited from an additional £1,000 of public spending, compared to a SECL resident, in 2005/06. The South East’s contribution is vital to the less economically successful regions of the UK, but SECL believes it will become unsustainable in the future, unless public sector funding keeps pace with the significant cost pressures experienced in the region.

33
2. Local Government Services – Funding and Cost Pressures 2.1 Introduction
2.1.1 Oxford Economics has identified how the significant net contributions made by the South East and Eastern regions fund the wider national public sector. In this section, Local Government Futures will examine the extent to which Government funding reflects the challenges faced by public sector service providers in the South East and East of England.
2.1.2 In particular, the following key areas have been explored:
• Overall allocations to SECL authorities through the local government funding formula and specific grants and the level at which the South East is funded compared to other UK regions.
• Wage and other regional cost pressures and the impact of the Area Cost Adjustment.
• The significant levels of efficiency savings delivered by the SECL authorities, within the context of levels of local government funding received.
• Cost pressures in the following local government service areas:
o Older people’s social care (aged 65 plus) o Adult social care (aged 18-64) o Children’s services o Waste services
2.2 Local Government Funding Formula
2.2.1 Recent changes to the way in which formula grant is allocated have had a detrimental impact on the SECL authorities. These changes are summarised below, with the detailed background to successive funding settlements described in more detail in Appendix B1.
2.2.2 In 2006/07, the SECL authorities were particularly disadvantaged when the new
‘four-block’ funding model was introduced; this changed the presentation of grant allocations, but essentially retained the key building blocks from previous systems. There is now less transparency within the funding system as a much greater reliance has been placed upon the use of ‘judgment’. In addition to the change in the presentation of the system, the 2006/07 settlement saw several very redistributive formula changes, as well as a further increase in resource equalisation (the way in which the formula grant distribution system takes account of councils’ relative ability to raise council tax).

34
2.2.3 Resource equalisation changes previously occurred in 2003/04 and generally result in a shift of grant from areas with a high taxbase to areas with a low taxbase. Such shifts are usually from the economically successful South East and East, but there are also authorities in other regions of the country, which have seen grant redistributed elsewhere. A nationally assumed level of council tax was not published by the Government as part of its settlement announcement in 2006/07, but the resource equalisation loss to be phased in for SECL authorities, amounted to £237 million in 2003/04.
2.2.4 The combined effect of these changes was a significant redistribution in the
allocation of resources away from the SECL authorities, restricted only by the extreme level of damping applied to the system. In 2006/07, SECL authorities were therefore amongst those most adversely affected by the changes described above, with 10 of the 11 counties being at the grant ‘floor’ (which was set at 2.0%) and remaining at the floor (of 2.7%) in 2007/08; only the Isle of Wight received an increase in grant above the floor level.
2.2.5 For example, East Sussex received the floor increase in grant of 2.7%, or £2.1 million, in 2007/08. As a floor authority, this was the largest annual increase in funding given to East Sussex County Council services (excluding schools) for the past six years. The worst year saw a reduction in funding, due to the council’s annual grant increase having to be ‘passported’ (passed directly) to schools, with funding therefore not being available to fund the cost pressures of all other services. These cost pressures included budgets for adult social care, children’s services and highways maintenance increasing by 5.8%, 4.2% and 6.6% respectively in 2007/08.
2.2.6 Across the SECL authorities as a whole, the degree of protection provided by the floor amounted to £148 million for 2006/07 and £145 million for 2007/08. Appendix B2 shows the degree of damping protection applied to individual SECL authorities.
2.2.7 SECL authorities rely on damping more than most other councils. Figure 10 compares the average position for each region. It should be noted that the regional averages relate to all types of authorities in each region, including shire districts and police authorities. Damping is less significant, at least in percentage terms, for some tiers of authority, which is why the SECL average is so much greater than the regional position.

35
Figure 10: Damping block as percentage of formula grant by region 2007/08
-5.0%
-2.5%
0.0%
2.5%
5.0%
7.5%
10.0%
12.5%
SECL average
South East
East
South West
East Midlands
West Midlands
North East
North West
Yorkshire and Humber
London
2.2.8 Damping protection accounts for 11.7% of formula grant for SECL authorities and, for the South East region as a whole, damping accounts for 4.8% of formula grant, the highest proportion nationally, compared to 1.5% in London and 1.3% in the North East.
2.2.9 Given the large degree to which damping protection contributes to formula grant allocations for SECL authorities, without significant reform of the local government finance system, SECL authorities will clearly be reliant upon the grant floor for many years to come, in order to prevent major losses in grant.
2.2.10 Of particular concern for SECL, is the way in which the current finance system works and the extreme volatility of some of these changes, resulting in SECL authorities not receiving sufficient grant to cover growing cost pressures. The level of formula grant received is illustrated in Figures 11a and 11b.
36
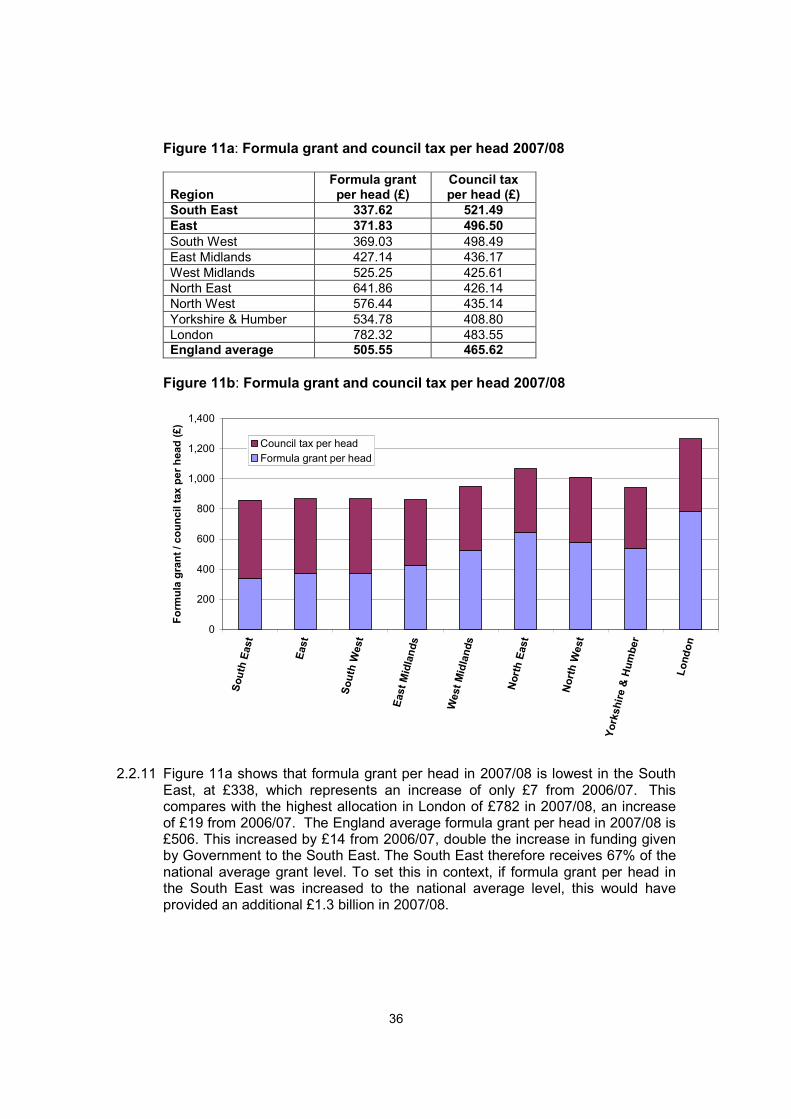
Figure 11a: Formula grant and council tax per head 2007/08
Region Formula grant per head (£)
Council tax per head (£)
South East 337.62 521.49
East 371.83 496.50
South West 369.03 498.49
East Midlands 427.14 436.17
West Midlands 525.25 425.61
North East 641.86 426.14
North West 576.44 435.14
Yorkshire & Humber 534.78 408.80
London 782.32 483.55 England average 505.55 465.62
Figure 11b: Formula grant and council tax per head 2007/08
0
200
400
600
800
1,000
1,200
1,400
South East
East
South West
East Midlands
West Midlands
North East
North West
Yorkshire & Humber
London
Formula grant / council tax per head (£)
Council tax per head
Formula grant per head
2.2.11 Figure 11a shows that formula grant per head in 2007/08 is lowest in the South East, at £338, which represents an increase of only £7 from 2006/07. This compares with the highest allocation in London of £782 in 2007/08, an increase of £19 from 2006/07. The England average formula grant per head in 2007/08 is £506. This increased by £14 from 2006/07, double the increase in funding given by Government to the South East. The South East therefore receives 67% of the national average grant level. To set this in context, if formula grant per head in the South East was increased to the national average level, this would have provided an additional £1.3 billion in 2007/08.
37
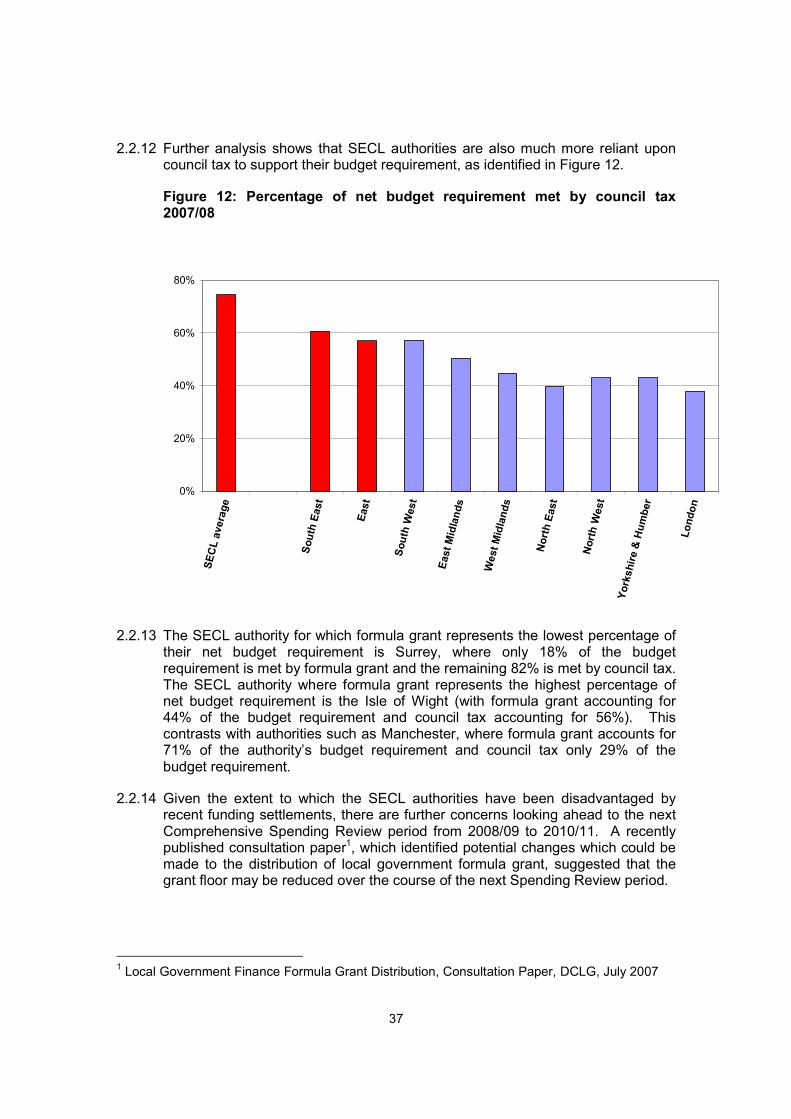
2.2.12 Further analysis shows that SECL authorities are also much more reliant upon council tax to support their budget requirement, as identified in Figure 12.
Figure 12: Percentage of net budget requirement met by council tax 2007/08
0%
20%
40%
60%
80%
SECL average
South East
East
South West
East Midlands
West Midlands
North East
North West
Yorkshire & Humber
London
2.2.13 The SECL authority for which formula grant represents the lowest percentage of their net budget requirement is Surrey, where only 18% of the budget requirement is met by formula grant and the remaining 82% is met by council tax. The SECL authority where formula grant represents the highest percentage of net budget requirement is the Isle of Wight (with formula grant accounting for 44% of the budget requirement and council tax accounting for 56%). This contrasts with authorities such as Manchester, where formula grant accounts for 71% of the authority’s budget requirement and council tax only 29% of the budget requirement.
2.2.14 Given the extent to which the SECL authorities have been disadvantaged by recent funding settlements, there are further concerns looking ahead to the next Comprehensive Spending Review period from 2008/09 to 2010/11. A recently published consultation paper1, which identified potential changes which could be made to the distribution of local government formula grant, suggested that the grant floor may be reduced over the course of the next Spending Review period.
1 Local Government Finance Formula Grant Distribution, Consultation Paper, DCLG, July 2007

38
2.2.15 In 2007/08, Government used a 2.7% floor to calculate grant, but the consultation paper included an exemplification setting the floor at 0%, which would cost SECL authorities £26.5m in lost grant.
2.2.16 Whilst not as far ranging as previous formula review years, changes being considered include Area Cost Adjustment calculations, changes to some parts of the social services calculations and a new highways maintenance formula. There are also potential changes to the levels at which needs and resource equalisation will be set.
2.2.17 Such proposals present an opportunity for changes to be made to the local government finance system which could redress earlier detrimental funding allocations given to SECL authorities. On the other hand, there is a risk that further changes could penalise the SECL authorities still further, which could affect the £17.7 billion that SECL contributed to the wider national economy in 2005/06.
Conclusion - Local Government Funding Formula
(i) The SECL authorities have been disadvantaged by successive local government finance settlements, to the extent that 10 of the 11 counties are at the funding floor in 2007/08. Ten authorities therefore require a damping grant to bring them up to minimum levels of funding provided by the system. The current ‘four-block’ funding model is also more reliant upon judgment, which leads to less transparency in terms of funding decisions.
(ii) Some SECL authorities have only seen minimum grant increases for
the last five years, and, due to Government pressure to ‘passport’ the great majority of any additional funding to schools, this has left little available for other key services.
(iii) Damping protection in 2007/08 accounted for a larger proportion of
formula grant for the South East region (4.8%) than any other region nationally. This compares to areas such as London, where damping comprised only 1.5% of formula grant.
(iv) Across SECL, the degree of protection provided by damping grant
amounted to £148 million for 2006/07 and £145 million in 2007/08. The gap between SECL and other authorities will also become wider for as long as SECL authorities remain on the funding floor.
(v) The recent formula grant review considered the possibility of reducing
the funding floor from the current level of 2.7% to 0%, which would potentially have cost the SECL authorities £27m in 2007/08.

39
(vi) In 2007/08, formula grant per head is lowest in the South East (at £338) compared to any other region nationally (the highest allocation is in London at £782 per head). The average formula grant per head across England is £506.
SECL authorities have been disadvantaged by recent finance settlements. If formula grant per head in the South East matched the national average, the South East would have received an additional £1.3 billion in local government funding in 2007/08. Unless the Government makes changes to the funding system to redress this, the ‘gap’ is set to increase over time. In the longer term, SECL would like Government to review the four-block funding model. In the short term, SECL believes that the Comprehensive Spending Review and forthcoming local government finance settlement must address a funding system that the SECL feels is no longer fit for purpose and which does not provide adequate funding for essential services, by:
• Not allowing the funding floor to fall below the existing 2.7% level.
• Retaining damping grant to provide protection to authorities who fall below the floor.
• Ensuring that the local government funding formula is robust and transparent.
2.3 Specific Grants
2.3.1 In addition to formula funding, as considered in 3.2 above, local authorities are also funded through specific grants. Specific grants may be in place for a number of reasons. For example, the Dedicated Schools Grant (the largest specific grant at £28 billion in 2007/08), was created to provide Ministers with more control over schools’ funding. Other, smaller grants, may be ring-fenced, with local authorities being required to spend the grant on particular areas, or targeted towards a sub-set of authorities facing a particular issue (for example, grants to support services for asylum seekers).
2.3.2 In aggregate, specific grants in 2007/08 exceeded £44 billion. The below average allocation of funding for SECL authorities similarly applies to specific grants, with the South East receiving only 10% of total specific grants in 2006/07, compared to 16% of its population.
2.3.3 The local government funding system and specific grants are also linked, in that, even where formulae changes are frozen, transfers of responsibility can still take place. If there is a new responsibility for local authorities to provide a service, funding is added into the overall quantum of funding for the service block in question, and removed if local authorities are no longer responsible for providing the service.
40
2.3.4 The SECL authorities are therefore concerned about the distributional impact of other grants, which are at risk of transfer into formula grant. This includes, for example, Waste Performance and Efficiency Grant; Waste Electrical and Electronic and Equipment Grant; Planning Grant; Young Persons Substance Misuse Partnership Grant and a whole range of Personal Social Services grants. The increasing trend to consolidate specific grants, most of which affect children and social care, into the main formula, means that floor authorities lose out, as they only receive the minimum grant level.
2.3.5 In addition, such transfers into the main formula do not always adequately ensure
that the full cost of new services or service levels is funded. Uncertainty over exactly which grants will transfer, and the extent to which changes reflect costs, inevitably results in winners and losers at individual authority level.
2.3.6 A further concern for SECL authorities is the potential for a cessation of specific
grants or, at least, the absence of confirmation that they will continue. For example, there has been a 14% reduction in this year’s Home Office allocation for the Stronger and Safer Communities Fund within Local Area Agreements.
Conclusion – Specific Grants (i) In terms of total allocations, the South East region received a lower
proportion of specific grant funding (10%) than its proportion of the population (16%) for 2006/07.
(ii) Transferring specific grants into the main funding formula has the potential to adversely impact upon SECL authorities who are at the floor, as they only receive the minimum grant level, with transfers not always adequately ensuring that the full cost of new services, or service, levels is funded.
The South East should receive an equitable allocation of specific grant funding, with existing grants continuing to be retained, in order that funding is not ‘lost’ by floor authorities, when grants are transferred into the general funding formula.
2.4 Area Costs
2.4.1 The Area Cost Adjustment (ACA) is the part of the Relative Needs Formulae designed to reflect the fact that authorities in certain parts of the country face higher costs in the delivery of services. Two types of costs are considered for this purpose - the most significant of these is labour costs, which, in addition to the obvious higher wages paid in some parts of the country, should also reflect an element of recruitment and training costs. The ACA also takes into account differences in rates costs around the country. The level of the ACA is vital for SECL, with ACA comprising around £218m (before grant damping) of SECL authorities’ funding in 2007/08.

41
2.4.2 The South East is not wholly prosperous and there are areas within the South East, such as areas of East Sussex, East Kent, and the Isle of Wight, where income levels compare with some of the least prosperous regions of the UK. Here, deprivation is ‘hidden’ by the relative buoyancy of the region as a whole, with the high cost of living in the South East particularly affecting those who are not part of the region’s economic success, and often not being taken into account by Government funding measures.
2.4.3 Before 2003/04, the ACA factor was limited to London and the South East (and the Isles of Scilly), but since then, ACA has been extended to all parts of the country. The 2003/04 settlement also included a fundamental change to the way in which wage pressures were calculated, with less significant changes to the ACA being made at the time of the next formula change in 2006/07; the main impact on authorities was the reduction in the weight applied to the rates cost adjustment. Changes to ACA factors are considered further in Figure 13.
Figure 13: Change in ACA values by region during formula change years
1.00
1.05
1.10
1.15
SECL average
South East
East
South West
East Midlands
West Midlands
North East
North West
Yorkshire & Humber
London
02/03 ACA
03/04 ACA
06/07 ACA
2.4.4 Overall, the ACA changes introduced have steadily decreased the level of the ACA applied to the SECL area, while leaving the average London position broadly unchanged. If the previous 2002/03 ACA values were used in the 2007/08 settlement calculation, it is estimated that the SECL authorities would have received an additional Relative Needs Formula allocation of approximately £130 million, before damping.

42
2.4.5 Further potential changes to the ACA are also being considered for the 2008/09 settlement. These include some relatively minor changes to the geography of the ACA, although the impact could be extreme for the individual authorities affected, such as Hampshire and the Isle of Wight in the South East. There are also proposals to change the relative weights of the labour cost element and rates cost element.
2.4.6 There are a number of reasons why current ACA values allocated to individual authorities might not reflect their actual underlying pressures. These include:
(i) Area wage pressures are measured using survey data, which is prone to error and inaccuracy.
(ii) This is particularly true where sample sizes are small. For this reason, authorities are often grouped together, but some of these groupings contain very different authorities.
(iii) Data can be affected by the dominance of a particular employer and is often not fully representative of the overall workforce of the area and, in particular, the workforce relevant to local authorities as employers.
(iv) For these authorities, the industries within which employees work may play an important role. Regression analysis is used to try to separately measure the impact of industry and area cost effects, but this may mean the results are not fully able to determine which factors are related to the location as opposed to the industry of an employee.
2.4.7 Many of these issues have been highlighted by National Economic Research Associates (NERA)2 and research commissioned by West Sussex to contribute to the formula review being undertaken at that time, concluded that:
(i) The Labour Force Survey (LFS) would be a better source of information to calculate area differences in wage levels.
(ii) An analysis using the LFS would, very approximately, estimate the relative wage pressures in the “Rest of the South East” to be around 5% higher than the Annual Survey of Hours and Earnings (ASHE), the data used to calculate the current ACA.
2.4.8 East Sussex similarly commissioned a report by Rita Hale & Associates3. Using N-Power cost of living data, which has been developed for teacher recruitment, the report demonstrated that pay pressures in East Sussex are much higher than for some areas outside of the South East, that receive significantly more ACA funding, and where local cost pressures are likely to be considerably less than those experienced in East Sussex.
2 Area Cost Adjustment: A Review, 30 May 2005
3 Briefing Paper on the Area Cost Adjustment for East Sussex County Council, Settlement Working Group, 20 June 2005

43
2.4.9 For example, a teacher living in Eastbourne (part of East Sussex), earning £25,000 per annum, would only have to earn £23,000 in Bristol or Chester, and £20,250 in Manchester, in order to achieve the same cost of living, despite all three of these authorities receiving a higher level of ACA funding than East Sussex. If East Sussex received the same level of ACA as Bristol, it would receive approximately £7m more in its Relative Needs Formula allocation (before damping). The same anomaly extends to many other ACA areas outside of the South East.
2.4.10 Given the importance of the ACA in providing a contribution towards funding
higher costs in their areas, SECL authorities are concerned that these trends in decreasing ACA values do not continue, particularly given that current ACA values are not seen by SECL to adequately reflect the higher costs that they have been experiencing and are likely to continue to experience in the future.
Conclusion – Area Costs
(i) The South East region incurs significantly higher costs in delivering
services. Higher wage rates are the most obvious, but not the only example. The Area Cost Adjustment (ACA) factor used in the funding formula is therefore vital for the SECL authorities, with the ACA comprising around £218m (before grant damping) of SECL authorities’ funding in 2007/08.
(ii) Recent ACA changes have steadily reduced the level of the ACA applied to the SECL area, while leaving the average London position broadly unchanged. Some funding streams, for example, specific grants for schools, do not include any Area Cost Adjustment factor at all.
(iii) ACA funding also appears to be particularly unfair in some parts of the South East, as illustrated by research commissioned by West and East Sussex from National Economic Research Associates (NERA) and Rita Hale & Associates respectively.
If the previous 2002/03 ACA values were used in the 2007/08 settlement calculation, it is estimated that the SECL authorities would have received an additional Relative Needs Formula allocation of approximately £130m before damping.
The higher costs of delivering services in the South East, from higher wage and other cost pressures, should be fully and fairly recognised in the Area Cost Adjustment. The use of the Labour Force Survey should be considered as an alternative source of data for calculating the ACA, with instances of local ACA funding unfairness, where identified, being fully reviewed and addressed.
44
2.5 Efficiency Savings
2.5.1 Despite recent funding pressures, SECL authorities are continuing to modernise and transform their public services. In total, the 11 SECL authorities delivered £201 million of cumulative efficiency gains from 2004/05 to 2005/06, with £153 million of these gains being cashable. With growing pressures, however, these efficiencies are unlikely to be sustainable in the longer term, particularly given that the most obvious areas for savings have already been targeted.
2.5.2 The retention of efficiency savings has been crucial for floor authorities in helping to address spending pressures and to continue providing reinvestment into frontline services. The SECL authorities are therefore particularly concerned about the possibility that Government may top-slice assumed efficiency gains from grant funding, as this would impact on their ability to meet the pressures they are under, given their already low grant level.
SECL authorities have delivered cumulative efficiency gains which are 71% above target overall and 160% above target in terms of cashable efficiencies. SECL authorities are keen to find additional efficiency gains through business transformation, but, if Government allocations, via the funding settlement and specific grants, were to decline further, these potential savings would be put at risk. Efficiency savings should continue to be made available to reinvest in essential services, rather than being top-sliced from grant funding, which will only exacerbate funding pressures.
2.6 Older People’s Social Care (65 plus)
2.6.1 The Office for National Statistics’ (ONS’) most recent population projections
provide figures up to 2029, with ONS projections split by age, and it therefore being possible to identify the projected growth in the older people population (65 plus). The results of these projections are shown in Figures 14a and 14b, with growth for individual SECL authorities set out in Appendix B3.

45
Figure 14a: Growth in older people (65 plus) population to 2011
0%
5%
10%
15%
SECL average
South East
East
South West
East Midlands
West Midlands
North East
North West
Yorkshire & Humber
London
Percentage growth to 2011
National average 9.3%
Figure 14b: Growth in older people (65 plus) population to 2029
0%
10%
20%
30%
40%
50%
60%
70%
SECL average
South East
East
South West
East Midlands
West Midlands
North East
North West
Yorkshire & Humber
London
Percentage growth to 2029
National average 53.8%
46
2.6.2 The 65 plus population in the SECL area is projected to grow above the national average rate. Growth by 2011 is predicted to be 11.5%, compared to a national average of 9.3%. Growth by 2029 is predicted to be 58.4%, compared to the national average of 53.8%. This increasingly elderly population is a particular trend in South East coastal areas.
2.6.3 Pressures on older people’s services and the consequent financial implications
are widely acknowledged to be one of the key issues facing local authorities over the next 10 to 20 years. Overall costs are rising faster than inflation for all adult social care, particularly residential care, where high regional wage pressures and the cost of improving services in accordance with Government requirements are having an adverse financial impact.
2.6.4 For example, in West Sussex, older people’s costs are projected to rise by £1.3 million above inflation, over the next three years, as a direct result of rising numbers of clients. Current annual increases of 1,400 are expected to rise even faster in future years.
2.6.5 Similarly, Buckinghamshire has also been experiencing rapid cost increases in older people’s services over recent years, with a real terms increase of £2.2 million in 2006/07. This represents around a £10 increase in council tax per annum for each Band D property.
2.6.6 In an effort to manage resources within tight budgets, there has been an increasing tendency to focus on critical cases, with fewer resources being made available for other forms of care. Authorities such as Surrey and Kent also compete with better funded London Boroughs when purchasing care, placing further strains on limited resources.
The 65 plus population in the SECL area is currently growing faster, and will continue to grow faster, than the national average, which is increasing pressure on SECL authorities. The costs of providing social care are rising faster than inflation, particularly in residential care. SECL believes that the formula used to calculate funding for older people’s social care needs to reflect the ‘cost curve’ facing the South East, as demographic pressures mean that growing numbers of older people require more expensive services and increasing levels of care.
2.7 Adult Social Care (18-64) 2.7.1 Government changes to the formulae used to measure the relative needs of
providing social services for adults aged 18-64, known as younger adults, have caused extreme turbulence. Figure 15 compares SECL’s share of the England aggregate needs total for younger adults, with SECL’s share of the England 18-64 population.
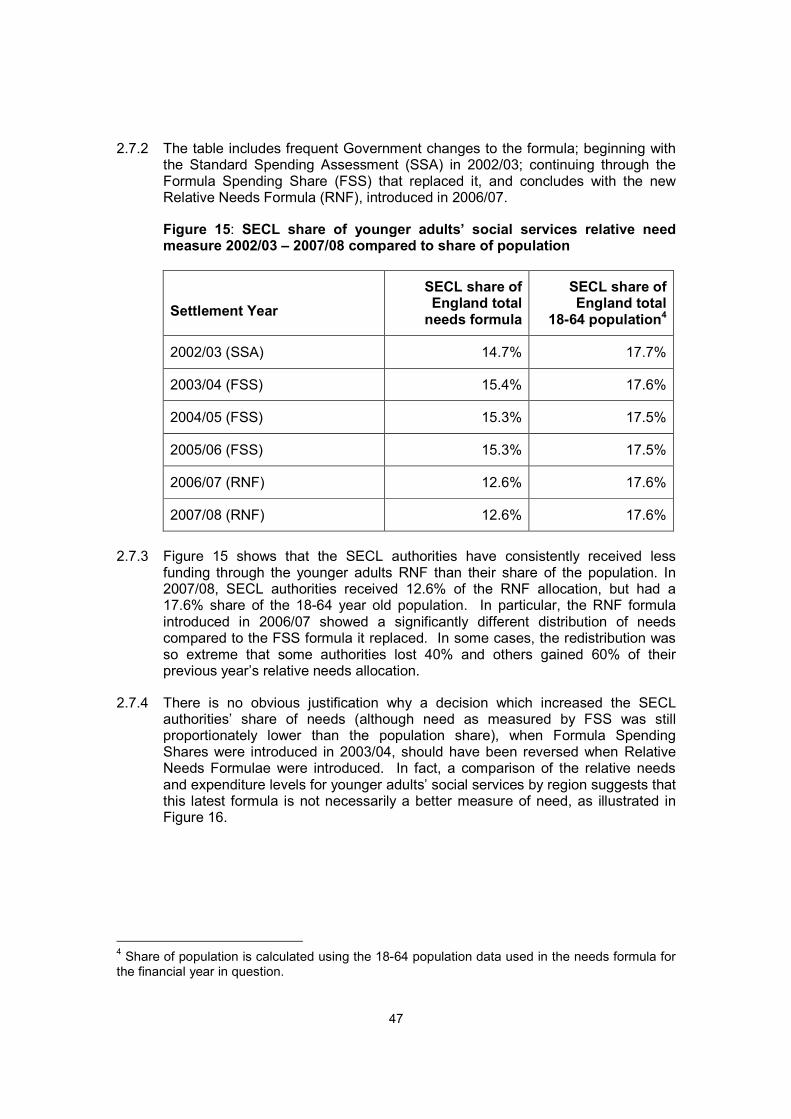
47
2.7.2 The table includes frequent Government changes to the formula; beginning with the Standard Spending Assessment (SSA) in 2002/03; continuing through the Formula Spending Share (FSS) that replaced it, and concludes with the new Relative Needs Formula (RNF), introduced in 2006/07.
Figure 15: SECL share of younger adults’ social services relative need measure 2002/03 – 2007/08 compared to share of population
Settlement Year
SECL share of England total needs formula
SECL share of England total
18-64 population4
2002/03 (SSA) 14.7% 17.7%
2003/04 (FSS) 15.4% 17.6%
2004/05 (FSS) 15.3% 17.5%
2005/06 (FSS) 15.3% 17.5%
2006/07 (RNF) 12.6% 17.6%
2007/08 (RNF) 12.6% 17.6%
2.7.3 Figure 15 shows that the SECL authorities have consistently received less
funding through the younger adults RNF than their share of the population. In 2007/08, SECL authorities received 12.6% of the RNF allocation, but had a 17.6% share of the 18-64 year old population. In particular, the RNF formula introduced in 2006/07 showed a significantly different distribution of needs compared to the FSS formula it replaced. In some cases, the redistribution was so extreme that some authorities lost 40% and others gained 60% of their previous year’s relative needs allocation.
2.7.4 There is no obvious justification why a decision which increased the SECL authorities’ share of needs (although need as measured by FSS was still proportionately lower than the population share), when Formula Spending Shares were introduced in 2003/04, should have been reversed when Relative Needs Formulae were introduced. In fact, a comparison of the relative needs and expenditure levels for younger adults’ social services by region suggests that this latest formula is not necessarily a better measure of need, as illustrated in Figure 16.
4 Share of population is calculated using the 18-64 population data used in the needs formula for the financial year in question.

48
Figure 16: Comparison of younger adults’ expenditure 2005/06 and RNF 2006/07
0
50
100
150
200SECL average
South East
East
South West
East Midlands
West Midlands
North East
North West
Yorkshire & Humber
London
Expenditure £ / head
0
5
10
15
20
25
30
RNF per head
Exp per head
RNF per head (before damping)
RNF per head (after damping)
2.7.5 Further details about how this comparison has been made are set out in Appendix B4, together with the position for individual SECL authorities. In summary, Figure 16 shows that SECL authorities (and more generally the South East and East of England) receive significantly less RNF than is spent, compared to other regions nationally. In general, the lower allocation of RNF to the South East is due to a very high allocation of relative need to authorities in the North and, to a lesser extent, the Midlands.
2.7.6 There are a number of issues in the development of the younger adults’ social services formula that have yet to be addressed. These include, for example, the extent to which the formula is weighted towards the Disability Living Allowance (DLA). There is clearly going to be a link between DLA and a range of social services; however, many services will be provided to individuals who are not eligible for DLA.
2.7.7 In addition, concerns have been expressed about potentially low take-up of the
benefit. Research published in 1998 as a follow up to the 1996/97 Family Resources Survey, for example, estimated that take-up rates for DLA could be as low as 30-50%.
49
2.7.8 This suggests that the level of younger adults’ social care provided by SECL authorities is not fully reflected in their calculated level of relative needs. For example, Essex has seen increasing numbers of children transferring from the children’s to the adults’ learning disability service, with unavoidable increases to previous years’ transition cases. Transition cases occur when a young person transferred to adult care during the previous year. Costs are less than the full year equivalent, because services were only required for part of the year, for example, during school or college holidays. Total costs for this service have increased by 110%, from £1.9 million in 2002/03 to £4.0 million in 2007/08.
2.7.9 In West Sussex, pressures from increasing life expectancy, coupled with a move
away from institutional care towards greater independence, are anticipated to increase the younger adults’ services budget by £2 million in 2008/09. In Surrey, the cost of looking after younger adults with physical, sensory and learning difficulties increased by £3.5 million in 2007/08 and is forecast to increase by a further £2 million in 2008/09.
SECL authorities currently receive less funding for their share of relative need than they spend on adult social care for 18-64 year olds.
The proportion of RNF funding received by SECL authorities has been less than their proportion of the population in every year since 2002/03.
The SECL authorities believe the funding formula needs to reflect how the SECL authorities actually deliver social care and address the increasing demand for services from adults aged 18-64.
The increased incidence of learning disabilities; higher life expectancy; more intensive requirements; and the increased complexity of cases, all result in significantly higher costs and require authorities to direct resources towards preventative services, rather than address the choice agenda promoted by Government.
2.8 Children’s Services
2.8.1 Children’s services have seen considerable change in recent years, both in terms of policy change and also in relation to funding. Year-on-year increases in funding for education have been significantly above the average increases for other local authority services. Up to 2005/06, the majority of schools’ funding formed part of formula grant, with the transfer of schools’ funding to Dedicated Schools Grant (DSG) taking place in 2006/07.
2.8.2 Pressure from Government to ‘passport’ schools’ funding increases, in other words, increase the level of the schools’ budget by at least the level at which schools’ formula funding increased, has placed financial constraints on other services.

50
2.8.3 DSG allocations have risen rapidly, but, there are many schools’ pressures that these funding increases need to cover. Workforce reform, as part of the ‘Every Child Matters’ agenda, is having a significant impact, which is exacerbated by wage pressures and accelerating pension costs.
2.8.4 The DSG is now no longer formula driven, although a large proportion of the funding is based on the previous Formula Spending Share allocations, with annual percentage increases per pupil. Although this included an element to reflect high cost areas (the Area Cost Adjustment, as considered previously), this does not always fully reflect financial pressures. In addition, other specific grants for schools do not include an Area Cost Adjustment factor at all.
2.8.5 In the 2005/06 settlement, the aggregate of SECL authorities’ school allocations was protected by damping of around £100 million, through a per pupil floor of 5.5%. The Department for Children, Schools and Families has recently announced that it intends to return to a formula based system to distribute schools funding from 2011/12. Although this will be a new formula, SECL authorities’ school allocations could again become reliant on damping protection.
2.8.6 The recent consultation on schools’ funding5 also highlights the possibility that Gershon efficiency savings may be applied directly to the DSG. This could have a detrimental impact on schools in the South East, where falling rolls in some schools and the need to build new schools elsewhere, to accommodate housing growth, will limit the scope for efficiency savings.
2.8.7 In terms of children’s social care, the majority of funding remains in formula grant. As such, most SECL authorities have recently only the minimum increase in funding.
2.8.8 Particular cost pressures identified by SECL authorities include extra costs associated with providing services to asylum seeking children, which are not currently fully reimbursed. Concerns have also been expressed about the funding implications of ‘Care Matters’ for Looked after Children (LAC), which proposes a pledge, setting out a minimum level of support for LAC, and builds on commitments set out in the Green Paper.
2.8.9 Some of these commitments will impact on the DSG, but the majority of the impact will be on services within the wider local authority budget, for example, paying Council Tax; extending the length of care beyond 16, funding savings accounts; supporting education & training until 21; funding out of school activity for 4 hours a week and so on.
5 Consultation on school, early years, and 14-16 funding: 2008-11, DfES, March 2007
51
SECL is concerned that the Comprehensive Spending Review could top-slice assumed efficiency gains from grant funding and believes that any change to Dedicated Schools Grant funding should explicitly consider the needs of authorities whose per pupil allocations will be at the funding floor. Funding for children’s social care should recognise the additional costs of delivering the Government’s agenda, with the overall funding floor being set at an appropriate level to enable these cost pressures to be addressed.
2.9 Waste Services
2.9.1 Formula funding for waste services is part of the Environmental, Protective and Cultural Services block, which contains funding for a wide range of general local authority services. This makes it impossible to identify the specific allocation for waste, which makes it more difficult for both Government and local government to address the climate change agenda.
2.9.2 SECL authorities face immediate budget pressure, following the increase from £3
to £8 per tonne in landfill tax, announced by the Chancellor in his last Budget. Increased gate fees for landfill are also adding to pressures and the increase in the escalator (under which the standard rate of tax is increased annually), will impact on subsequent years. As local authorities are in the process of developing alternatives to landfill, additional landfill taxes and other costs will therefore be unavoidable in the short-term.
2.9.3 For example, the most recent Budget increase in landfill tax is costing West
Sussex an extra £2 million a year. In Surrey, waste costs increased by £3.5m above inflation in 2007/08 and are set to increase by a further £3m in 2008/09.
SECL authorities face continuing and extra costs, particularly in relation to rising disposal charges and household waste volumes, as local authorities develop alternatives to landfill. Additional costs are unavoidable in the short term; whilst population growth and climate change will increase the overall cost of waste services in the longer term.
SECL believes that waste should become a separately identifiable block within the formula grant system, which takes into account its escalating costs. Demographic changes, climate change, and new house-building are already adding to cost pressures facing SECL authorities.

52

53
3. Police Authority Funding and Cost Pressures 3.1 Introduction 3.1.1 As identified in the previous chapter, recent local government formula grant
changes have disadvantaged the South East generally, compared to other regions of the UK. Police authorities, like other local authorities, also receive a large proportion of their funding from formula grant and this section considers the level of police authority funding provided to the South East, in comparison with other regions, together with associated cost pressures.
3.2 Funding Levels and Pressures 3.2.1 SECL authorities and police authorities in the South East are particularly
concerned about a pattern of police funding which provides relatively modest funding per head for police authorities covering more rural areas, while providing consistently higher levels of funding to more urban areas. The South East, with its proximity to London and role as an entry point into the UK, via its ports and airports, combines features of both rural and urban areas.
3.2.2 Figure 17 shows the distribution of funding within each region, with the maximum and minimum levels of funding per head illustrated, as well as the upper and lower quartile figures, represented by the box. The detailed figures contained in the chart, as well as the funding levels for the individual police authorities in the SECL area, are set out in Appendix B5. The average level of funding for police in the South East is £104.71 per head, which is 73% of the England average of £142.99.
Figure 17: Police formula grant funding per head by region 2007/08
0
50
100
150
200
250
South East
East
South West
East Midlands
West Midlands
North East
North West
Yorkshire and Humber
London
Formula grant £ / head

54
3.2.3 An answer to a recent Parliamentary Question (PQ)6 provides a comparison of South East and England average levels of total funding for police authorities, including specific grants in 2007/08. This indicates that the South East total per head funding level for police authorities is £128.82, or 73% of the England average of £176.22. These figures provide a slightly more comprehensive picture, in that they can help identify any regional differences in specific grants.
3.2.4 It should be noted that that these figures are not directly comparable with Figure 17, as the population data used to provide per head figures in the PQ are the 2005 mid-year population estimates, as opposed to the latest 2007 projections used in our analysis.
3.2.5 SECL also has fewer police officers per head than the English average. Each officer in the SECL area (Bedfordshire, Hampshire, Essex, Hertfordshire, Kent, Sussex, Surrey and the wider Thames Valley7 region) served 5.5% more people than the average officer in England, with 495 residents in the SECL area having their own police officer, while in the rest of England; each police officer looks after an average of 468 residents.
3.2.6 Documentation covering the development of the police formula, including potential changes that may be introduced from 2008/09, is not as readily available as it is for most of the other settlement formula research. The formula is driven to a large extent by regression analysis of crime levels, with different crimes being allocated different weights. This approach can create a perverse incentive by reducing funding to effective police authorities, which have been most successful at reducing crime.
3.2.7 Police authorities in the SECL area are concerned about the choice of indicators used in funding formula. The police funding formula is one of the most complex formulae used to distribute formula grant. One of the key concerns is that ‘urban’ related pressures faced by officers working across much of the South East are not fully reflected. These include the region’s proximity to London, its gateway status as a point of entry into the UK, and the large numbers of visitors it attracts. Furthermore, whilst anti-social behaviour is firmly at the top of the public agenda, SECL police authorities believe that it is not properly funded.
3.2.8 Police authorities are particularly affected by ‘high gearing’, in which Government grants provide the vast proportion of their income, which means that any increase in spending requires a proportionally greater amount to be raised from council tax. Council tax income nationally for police authorities represents only 28% of their net budget requirement for 2007/08; this puts police authorities under extreme pressure when grant increases are not sufficient to cover budget increases.
6 Question from Nicholas Soames (MP for Mid Sussex) asked on 23 July (reference 151782)
7 Berkshire, Buckinghamshire and Oxfordshire

55
3.2.9 An independent report by accountants Ernst and Young for Sussex Police last year confirmed that it is heading for a deficit of more than £9 million by 2009/10. The report states that, “Sussex Police, in common with other forces and authorities in the South East, is challenged by significant revenue budget pressures … at the same time the Force is facing requirements for additional investment in policing services.”
3.2.10 Government grant accounts for 70% of Sussex Police’s income. Whilst there is uncertainty over future settlements, the expectation, based upon the funding allocated to the Home Office, is for future grant rises of around 2.25%, well below inflation and other cost pressures experienced by the Force. Ernst and Young conclude that the scale of the deficit is such that it is unlikely to be achieved by, “delivering standard operational efficiency savings”, and requires, “significant organisational change”.
3.2.11 The Sussex Police Authority receives formula grant funding that is 4% below the shire average per head of population. Sussex also has the 4th lowest police precept in shire areas. This makes Sussex Police a comparatively low spending force. It would take an additional 313 police officers and extra spending of £7.5m a year for Sussex to reach the average levels in other non-metropolitan parts of the country (based on 2007/08 budget estimates).
SECL has fewer police officers than elsewhere: on average 495 residents in the SECL area have their own police officer, while in the rest of England, each police officer looks after an average of just 468 residents.
In 2007/08, average levels of total funding for police authorities for the South East were 73% of the England average, despite higher costs due to wage and other pressures.
Police authorities in the SECL area are concerned that the indicators used to determine police funding do not reflect the ‘urban’ related pressures faced by officers working across much of the South East. The formula does not, therefore, allocate sufficient funding to cover factors such as the region’s proximity to London, its gateway status as a point of entry into the UK, and the large numbers of visitors it attracts.

56

57
4. Health Funding and Cost Pressures
4.1 Introduction 4.1.1 There has been rapid growth in resources allocated to healthcare nationally, but,
in addition to the pressures on local authority funding described throughout this report, the South East faces particular, significant, and continuing pressure on its health budgets. NHS deficits throughout the region are also increasing pressure on social care services, where services overlap, as Primary Care Trusts (PCTs) divert funding from areas such as pooled budgets to address a shortfall, which further compounds funding pressures.
4.1.2 Following the reorganisation of the health economy in the South East, there is
now a good fit between local authority and PCT boundaries, which is encouraging greater cooperation and joint working. Unfortunately, such initiatives often have to overcome complex and contrasting funding arrangements.
4.1.3 This section considers issues of financial equity in relation to SECL health
funding. In particular, it examines the formula that determines PCT target funding and the distribution of NHS deficits throughout the region. A more detailed explanation of the way in which health funding is distributed is provided in Appendix C1.
4.2 The Equity of PCT Funding 4.2.1 PCTs in the South of England receive considerably less funding per head of
population than those in other parts of the country. A simple comparison of per capita funding for 2006/07 in Figure 18 shows that South of England PCTs receive £92 per head less than the national average level of funding, despite the increased costs of delivering services in the region.
Figure 18: Regional PCT funding per head 2006/07
Region Funding per head (£)
South8 1,189
Midlands 1,209
North 1,361
London 1,433
Average 1,281
(Source: Department of Health initial PCT revenue resource limits 2006-07 and unweighted population estimates: analysis by West Sussex CC)
8 The South in this context also includes the South West, as well as PCTs covered by SECL, but illustrates that there are marked regional differences.
58
4.2.2 An examination of individual PCT positions reveals dramatic variations in funding. Of the five PCTs with the lowest per capita funding in 2006/07, four were in the South East: Wokingham (£989), North East Oxfordshire (£994), Maldon and South Chelmsford (£1,005) and Horsham and Chanctonbury (£1,005).
4.2.3 At the opposite end of the spectrum, four PCTs received over £1,700 per head of
population: Islington (£1,838), Tower Hamlets (£1,715), Southwark (£1,701) and North Manchester (£1,701). These figures indicate the sheer scale of the funding differential, with, on average, a Wokingham resident receiving less than 54% of the NHS funding available to an Islington resident in 2006/07.
4.2.4 Although there is now a good fit between local authority and PCT boundaries in
the South East, the population bases for funding purposes remain significantly different. NHS weighted capitation funding is based on patients registered with GPs in the area, rather than the resident population. Moreover, there is a material time lag as 2007/08 PCT funding allocations are based on 2003 local authority population projections.
4.2.5 The population data on which PCT funding is calculated is therefore unlikely to
reflect recent population inflows to the fast-growing South East economy. The genuinely flexible nature of the region’s younger working population is also likely to result in greater numbers not being registered with local GPs than elsewhere in the country.
4.2.6 In addition to funding which is allocated through the weighted capitation formula,
a further £3bn is allocated nationally each year to fund medical and dental training, non-medical education and training, and research and development. This funding bypasses the usual NHS allocation and commissioning processes and is largely directed towards the London-based, teaching hospitals.
4.3 Distance from Target 4.3.1 The ‘distance from target’ represents the difference between the weighted
capitation target and the actual current allocation which PCTs receive. If the weighted capitation target is greater than the allocation, a PCT is ‘under target’, and is ‘over target’ if the weighted capitation target is less than the allocation. The ‘pace of change’ policy represents the rate at which PCTs are moved closer to their weighted capitation targets.
4.3.2 We have reviewed the actual distance from the Government’s target funding
level of PCTs within SECL boundaries, based upon information published by the Department of Health. Figure 19 summarises each County position. Negatives represent distances below target and positives reflect distances above target.
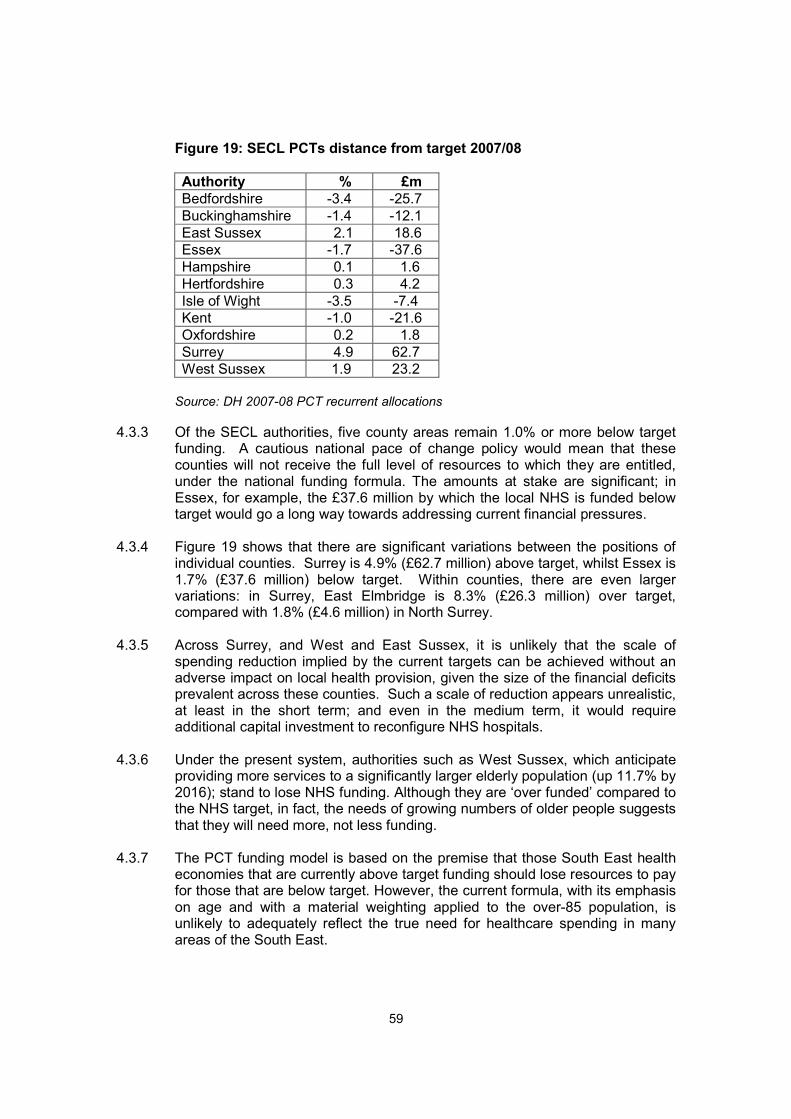
59
Figure 19: SECL PCTs distance from target 2007/08
Authority % £m
Bedfordshire -3.4 -25.7
Buckinghamshire -1.4 -12.1
East Sussex 2.1 18.6
Essex -1.7 -37.6
Hampshire 0.1 1.6
Hertfordshire 0.3 4.2
Isle of Wight -3.5 -7.4
Kent -1.0 -21.6
Oxfordshire 0.2 1.8
Surrey 4.9 62.7
West Sussex 1.9 23.2
Source: DH 2007-08 PCT recurrent allocations
4.3.3 Of the SECL authorities, five county areas remain 1.0% or more below target funding. A cautious national pace of change policy would mean that these counties will not receive the full level of resources to which they are entitled, under the national funding formula. The amounts at stake are significant; in Essex, for example, the £37.6 million by which the local NHS is funded below target would go a long way towards addressing current financial pressures.
4.3.4 Figure 19 shows that there are significant variations between the positions of
individual counties. Surrey is 4.9% (£62.7 million) above target, whilst Essex is 1.7% (£37.6 million) below target. Within counties, there are even larger variations: in Surrey, East Elmbridge is 8.3% (£26.3 million) over target, compared with 1.8% (£4.6 million) in North Surrey.
4.3.5 Across Surrey, and West and East Sussex, it is unlikely that the scale of
spending reduction implied by the current targets can be achieved without an adverse impact on local health provision, given the size of the financial deficits prevalent across these counties. Such a scale of reduction appears unrealistic, at least in the short term; and even in the medium term, it would require additional capital investment to reconfigure NHS hospitals.
4.3.6 Under the present system, authorities such as West Sussex, which anticipate
providing more services to a significantly larger elderly population (up 11.7% by 2016); stand to lose NHS funding. Although they are ‘over funded’ compared to the NHS target, in fact, the needs of growing numbers of older people suggests that they will need more, not less funding.
4.3.7 The PCT funding model is based on the premise that those South East health
economies that are currently above target funding should lose resources to pay for those that are below target. However, the current formula, with its emphasis on age and with a material weighting applied to the over-85 population, is unlikely to adequately reflect the true need for healthcare spending in many areas of the South East.

60
4.3.8 Rurality is not currently considered to be a legitimate cause of cost variations, other than for emergency ambulance services. Recent research by Professor Asthana of the University of Plymouth suggests that the current funding model overestimates the healthcare needs of younger deprived populations and underestimates the needs of older and more affluent populations, many of which are rural.
4.3.9 A review of the PCT funding formula and how it is determined should establish
the appropriate weighting to be given to age, in the light of demographic trends, which have identified that people are living longer. Capping the ‘pace of change’ of movement towards target would reduce the financial exposure of PCTs currently above target, as would the adoption of population calculation methodologies that more promptly acknowledge changes in population.
4.4 Distribution of NHS Deficits
4.4.1 Nationally, the incidence of NHS deficits has caused considerable concern. In
2005/06, the financial outturn for the NHS in England was a deficit of £547 million (0.8%), compared to budget. Pre-audit figures for 2006/07 suggest a dramatic recovery to a surplus of £510 million (0.7%). This came after an injection of £450 million from the Department of Health contingency fund. Although this is a significant financial recovery, it has only been achieved by considerably reducing access to clinical care.
4.4.2 A recent report9, by the Department of Health’s Chief Economist, Professor
McCormick, blames over-rapid expansion for causing many of the recent deficits, as the NHS workforce and its activity levels have been encouraged to expand at an unsustainable rate.
4.4.3 The report notes that deficits have been more prevalent in the South and East
of England, reinforcing the view that extra costs arising from national pay settlements were not the root cause of many of the deficits.
4.4.4 The report suggests that an accounting change, which prevents the transfer of
funds from capital to revenue in 2004/05, may have, at least partly, caused the pattern of deficits in the South and East of England. Such transfers amounted to £380 million nationally in 2003/04, and the South East had been particularly reliant upon on them.
4.4.5 It is also suggested that changes to the allocation formula have made it more
difficult for organisations to recover from patterns of deficit. This difficulty, which has affected a number of South East health economies, has been reinforced by the ‘double deficit’ effect of the resource accounting and budgeting system (RAB) until 2006/07. Under RAB, NHS trusts incurring a deficit had to, in effect, repay the deficit and incur a matching reduction in their funding the following year.
9 Explaining NHS Deficits 2003/04-2005/06, DH, February 2007
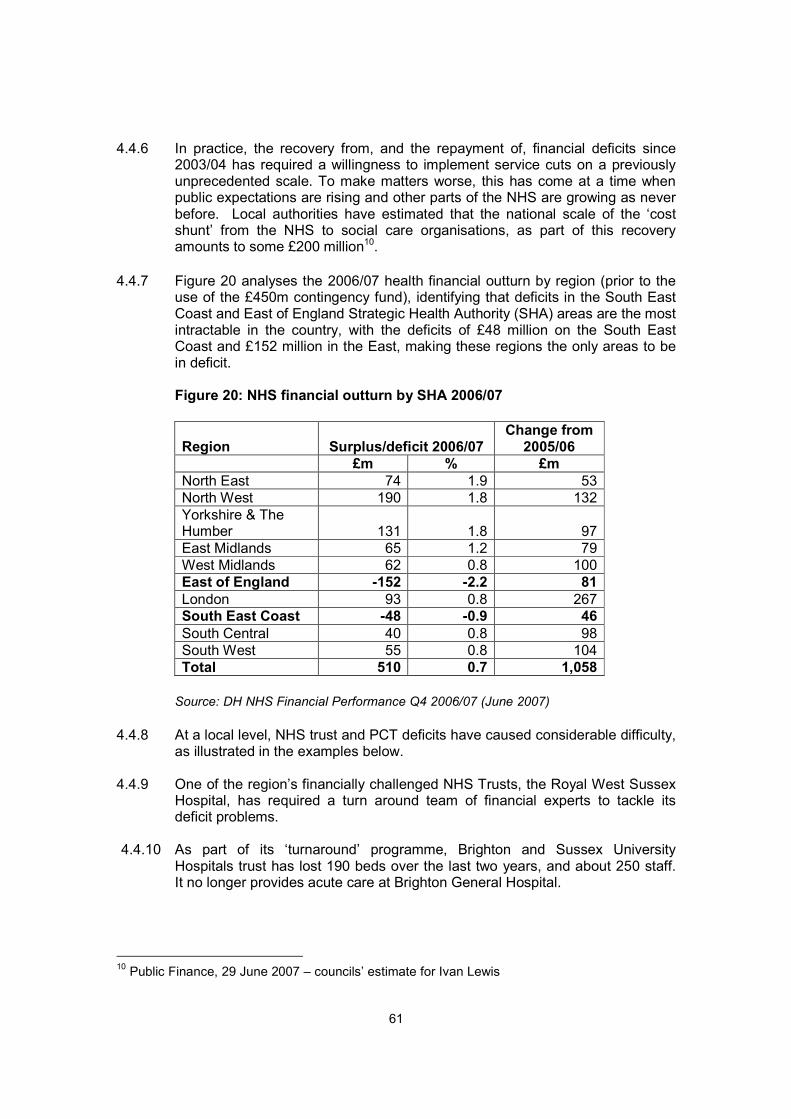
61
4.4.6 In practice, the recovery from, and the repayment of, financial deficits since 2003/04 has required a willingness to implement service cuts on a previously unprecedented scale. To make matters worse, this has come at a time when public expectations are rising and other parts of the NHS are growing as never before. Local authorities have estimated that the national scale of the ‘cost shunt’ from the NHS to social care organisations, as part of this recovery amounts to some £200 million10.
4.4.7 Figure 20 analyses the 2006/07 health financial outturn by region (prior to the
use of the £450m contingency fund), identifying that deficits in the South East Coast and East of England Strategic Health Authority (SHA) areas are the most intractable in the country, with the deficits of £48 million on the South East Coast and £152 million in the East, making these regions the only areas to be in deficit.
Figure 20: NHS financial outturn by SHA 2006/07
Region
Surplus/deficit 2006/07 Change from 2005/06
£m % £m
North East 74 1.9 53
North West 190 1.8 132
Yorkshire & The Humber 131 1.8 97
East Midlands 65 1.2 79
West Midlands 62 0.8 100
East of England -152 -2.2 81
London 93 0.8 267
South East Coast -48 -0.9 46
South Central 40 0.8 98
South West 55 0.8 104
Total 510 0.7 1,058
Source: DH NHS Financial Performance Q4 2006/07 (June 2007)
4.4.8 At a local level, NHS trust and PCT deficits have caused considerable difficulty,
as illustrated in the examples below. 4.4.9 One of the region’s financially challenged NHS Trusts, the Royal West Sussex
Hospital, has required a turn around team of financial experts to tackle its deficit problems.
4.4.10 As part of its ‘turnaround’ programme, Brighton and Sussex University
Hospitals trust has lost 190 beds over the last two years, and about 250 staff. It no longer provides acute care at Brighton General Hospital.
10 Public Finance, 29 June 2007 – councils’ estimate for Ivan Lewis

62
4.4.11 In West Sussex, the PCT is consulting on the closure of two accident and emergency departments; one in Haywards Heath and one in either Worthing or Chichester, leaving only one casualty department to serve its population of 760,000. In East Sussex, Hastings or Eastbourne appears likely to lose its consultant-led maternity services.
4.4.12 West Hertfordshire Hospitals Trust decided, as part of its financial turnaround
plan, to shut its outpatients’ department for one day a week, in order to save £150,000 on running costs.
4.4.13 Delayed transfers of care patients, in other words, ‘bed blocking’, reappeared
as an issue during 2006/07. Amongst the potential causes are rising numbers of people coming into accident and emergency departments, putting extra pressure on the whole NHS system; and reconfiguration plans that include fewer acute hospital beds. By the end of March 2007, Brighton and Sussex University Hospitals Trust reportedly had around 65 beds occupied by patients, who no longer needed acute care. This is costing the Trust £1.5 million a year.
4.4.14 The scale of these service reductions, during a period of substantial financial
growth, suggests that the current target funding levels for the South East region are inadequate. In addition, the examples cited are from health economies that, as they move towards target funding levels, will have to make further service reductions in order to stay in within budget. This prompts the question as to whether the national goal of equal access to health care for those at equal risk will be compromised in parts of the region.
4.4.15 An approximate surplus/deficit position for individual SECL authorities has
been calculated in Figure 21. This is an inexact science, as there is not a good fit between NHS Trust catchment areas and county boundaries; some expenditure is recorded at SHA level; and the Department of Health statistics, on which the calculations are based, exclude Foundation Trusts. However, it provides an indication of the level of deficits faced.
Figure 21: SECL authority region health bodies’ financial outturn 2006/07
Authority PCTs (£m)
Trusts (£m) Total (£m)
Bedfordshire -26.1 4.5 -21.6
Buckinghamshire -26.8 1.7 -25.1
East Sussex -15.1 -3.8 -18.9
Essex -12.0 13.9 1.9
Hampshire 23.3 5.1 28.4
Hertfordshire -50.3 -12.4 -62.7
Isle of Wight 1.4 0.0 1.4
Kent -10.4 -9.2 -19.6
Oxfordshire 5.4 -6.2 -0.8
Surrey -16.4 -12.6 -29.0
West Sussex -12.7 -0.4 -13.1
Total -139.7 -19.4 -159.1

63
4.4.16 In total, the level of deficit for the region stood at £159.1 million in 2006/07, with
a number of counties experiencing particularly high aggregate deficits. Bedfordshire had a deficit of more than £21 million; Surrey’s was £29 million; while Hertfordshire’s was the region’s highest at nearly £63 million. Elsewhere, East Sussex and Kent had deficits just short of £20 million each, while only three authority areas are in surplus. Analysis by individual health body within the SECL region is also shown in Appendix C2.
Conclusions – Health Funding
(i) Primary Care Trusts (PCTs) in the South of England receive less funding per head of population than those in other parts of the country, even though costs are identifiably higher in the South East. A simple comparison of per capita funding for 2006/07 shows that South of England PCTs receive £92 per head less than the national average level of funding.
(ii) Of the five PCTs with the lowest per capita funding in 2006/07, four
were in the South East: Wokingham (£989), North East Oxfordshire (£994), Maldon and South Chelmsford (£1,005) and Horsham and Chanctonbury (£1,005).
(iii) At the opposite end of the spectrum, four PCTs received over £1,700
per head of population: Islington (£1,838), Tower Hamlets (£1,715), Southwark (£1,701) and North Manchester (£1,701). This indicates the sheer scale of the funding differential with, on average, a Wokingham resident receiving less than 54% of the NHS funding available to an Islington resident in 2006/07.
(iv) Of the SECL authorities, five county areas remain 1.0% or more below
target funding. These counties do not, therefore, receive the full level of resources to which they are entitled under the national funding formula. The shortfall is significant; for example, the £37.6m by which the local NHS in Essex is funded below target would go a long way towards addressing the financial pressures it currently faces.
(v) Surrey (£62.7m), West Sussex (£23.2m) and East Sussex (£18.6m) are
deemed to receive funding significantly above target; which means that, over time, funding will be reduced. However, it seems very unlikely that the scale of spending reduction implied can be achieved without a significant and adverse impact upon local health provision, given that sizeable financial deficits are already prevalent across these counties.
64
(vi) Analysis of health deficits by region identifies that, in 2006/07, the South East Coast and East of England Strategic Health Authority areas were the only two regions in the country where deficits occurred (£152m for the East and £48m for the South East Coast). Of these totals, approximately £159m relates to the region covered by the 11 SECL authorities.
News reports highlighting the latest cuts in services, wholesale reviews of vital services, and ‘bed blocking’ point to the scale of the crisis facing the NHS in the South East. SECL believes these financial difficulties, like those facing each county in the region, are the direct result of Government under funding. PCTs in the South East receive £92 per head less than the national average elsewhere in England. Funding levels of the worst funded PCTs in the South East are barely half that per person received by the best funded PCTs in London, even though the NHS is intended to provide universal services to the population. The South East is home to four of the five PCTs with the lowest per capita funding and home to the only two regions of the NHS in England to be in deficit. SECL is concerned that NHS under funding in the South East has led to SHA deficits and reductions in services. There needs to be greater transparency and accountability in PCT funding and how it is distributed both regionally and locally, with:
• A review of the NHS funding formula, to ensure that adequate recognition is given to age related demands, in the light of demographic trends, showing that people are living longer.
• The ‘pace of change’ of movement towards target being capped for those PCTs currently above target, to manage their financial exposure, given existing deficit levels.
• The adoption of population calculation methodologies that more promptly acknowledge changes in population and reflect recent population inflows to fast-growing areas.
65
5. Infrastructure Costs and Pressures
5.1 Introduction 5.1.1 Despite the South East being one of the most successful economic regions of the
UK, SECL authorities, the region’s police forces, and health services are affected by cost pressures that are far higher in the South East than in many other regions of the UK, with costs in many areas of the South East being close to those in central London.
5.2 Regional Costs and Pressures 5.2.1 Businesses, families and individuals also face higher costs; these costs result
from the need to invest in the South East’s congested transport infrastructure; the lack of affordable housing; higher wage costs; the increasing demand for older people’s social care; pressures on care services and budgets, with increasing numbers of children with complex needs living into adulthood; and increasing waste disposal costs.
5.2.2 The South East is also under huge pressure to deliver record levels of new
housing. The Draft South East Plan, in which the SECL authorities have taken a lead, provides for a build rate of 28,900 new homes a year, or a total of 578,000 by 2026. The new homes will require major investment in infrastructure and additional services, which will place further strains on public services across the South East, which, as we have identified throughout this report, are already facing funding pressures.
5.2.3 ‘Delivering the South East Plan’, prepared by the South East England Regional
Assembly in October 2006, calculated that £47 billion will be required to invest in infrastructure, such as health services, schools and transport, if growth in the region is to be sustainable, over the next 20 years. In addition, the Environment Agency has estimated that a further £42 billion is required for vital investment in flood defences; water resources; maintaining water quality; waste treatment, and countryside protection.
5.3 Local Government Capital Allocations 5.3.1 For local government, the costs of repaying the principal, and interest, from
borrowing relating to Supported Capital Expenditure are largely funded through the Capital Financing Relative Needs Formula. This is allocated by the Government and, up until 2005/06, a capital adjustment was included, so that if an authority was below the floor, it could still see an increase in grant to take account of increases in supported capital borrowing.
5.3.2 This adjustment was not included in the 2006/07 and 2007/08 finance
settlements. This change has had an adverse impact on SECL, as the majority of SECL authorities are on the floor. This has meant that, once pressures from new responsibilities and growth in demand are taken into account, there are often insufficient resources to meet the revenue implications of capital investment, which is vital to a fast growing region, such as the South East, which needs to fund more affordable housing and transport infrastructure.

66
5.3.3 Figure 22 sets out the levels of capital adjustments made in the 2005/06
settlement for the SECL authorities. These figures represent the increase in the authorities’ baselines to reflect the cost of increasing supported capital allocations.
Figure 22: Capital adjustments for SECL authorities in 2005/06
Authority Adjustment
(£m)
Bedfordshire None
Buckinghamshire 0.75
East Sussex 0.32
Essex 0.52
Hampshire 0.49
Hertfordshire 0.63
Isle of Wight 0.22
Kent 2.07
Oxfordshire 0.97
Surrey 0.02
West Sussex 0.05
SECL total 6.04
5.3.4 Given that authorities are not necessarily receiving the full benefit of funding for
capital borrowing; current funding arrangements for local authority capital investment can depress, rather than stimulate, the investment which the Government would like to see.
5.3.5 For example, Hampshire is unlikely to take up £5.7 million of the nearly £20 million Supported Capital Expenditure allocated through the Local Transport Plan in 2007/08. In East Sussex, £4.7 million will not be taken up over the two years of the current finance settlement.
5.3.6 Surrey have also estimated that the revenue implications of taking up its entire £26 million approved Local Transport Plan borrowing would be around £2.3 million per annum, with a higher revenue impact in future years, if borrowing continues to be unsupported. The unsupported schools’ programme adds a further £1 million per annum and may not be continued once existing commitments have been honoured in 2007/08. To put this into context, Surrey's grant increase of £2.2 million is less than the financing cost of the 'supported' borrowing.

67
Based on SEERA’s October 2006 calculation and the Environment Agency’s additional assessment in July 2007, £89 billion will be needed to fund infrastructure investment to provide health services; schools and transport; flood protection and water resources; to maintain water quality and improve waste treatment; and to build community facilities, and affordable housing to support housing growth of 28,900 new homes a year
This is more than four times the £19 billion the Government says it is investing in infrastructure in both the South East and East of England. Before April 2006, even authorities who only received the minimum grant floor received extra grant to help pay for Government approved borrowing to fund capital projects. Since 2006/07, this extra support has been abolished, which means that most SECL authorities cannot afford to undertake ‘supported’ borrowing to fund investment in transport and other capital projects. SECL believes support for capital investment would be more effectively provided through capital grants, rather than through formula grant. This will allow capital investment allocations to be fully taken up, otherwise, funding for capital investment will continue to be ‘lost’ within the local government finance system, preventing authorities from funding vital infrastructure to support growing communities.

68
69
6. Conclusions and Recommendations 6.1 Tax revenues are directly related to economic success and, as one of the most
successful economic regions, the South East is providing increasing support to the less economically successful regions of the UK. In recent years, the combined South East and Eastern contribution, worth £21.9 billion in 2006/07, has become more significant. Together, the South East and East have increased their contribution to the Exchequer by £3 billion from 2003/04 to 2006/07.
6.2 The contribution made by the 11 SECL authorities amounted to £17.7 billion in
2005/06 and was nearly twice that of London’s, on a residence basis. This equates to a contribution of £9,400 per head, compared to public spending of just £7,400 per head.
6.3 On average, across the UK, £8,400 per head is spent nationally on public
services, which means that the nine million people living in the SECL authorities receive an average of £1,000 less in public spending per person, compared to the UK average. Given the higher costs of providing services in the South East, in practice, this differential is even higher.
6.4 Over recent years, the SECL authorities have been disadvantaged by successive
local government finance settlements. This report shows evidence of a similar pattern of low funding in relation to Police and Health bodies in SECL areas. At the same time, public services in the South East are experiencing rising demands from both population growth and a rapidly ageing population, with funding not keeping pace with these changes:
• Funding levels are already the lowest per head relative to other regions.
• SECL authorities are currently heavily reliant upon £145 million of damping grant; with the ‘gap’ between SECL and other authorities set to increase if SECL continues to be at the minimum funding floor.
• For local authorities on the floor, only a minimum increase in grant is received (2% and 2.7% in the last two financial years). Real concerns exist that there is a possibility of grant even being frozen in the future, if the floor was to fall to 0%.
• Health services are also under financial strain and many PCTs in the SECL area are struggling with budget deficits. Reduced funding is expected to remove £62.7m from Surrey, £23.2m from West Sussex, and £18.6m from East Sussex health budgets over time.
• Government support for infrastructure spending by local authorities has been reduced by the abolition of the capital adjustment, which has particularly impacted upon floor authorities, in terms of their ability to take up Government ‘supported’ capital allocations.
70
6.5 The SECL authorities are among the best and most innovative authorities in the country, have produced cumulative efficiency savings of £201m over 2004/05-2005/06 and are committed to delivering more, as they continue to improve services.
SECL believes that a Government committed to delivering economic prosperity cannot continue to take the South East’s economic success for granted. Ministers have an obligation to provide a fairer deal to the South East, in order that the region can continue to support the less economically successful and poorer regions of the UK. Without a fairer deal that takes into account the increasing pressures and higher costs of delivering services in the South East, SECL authorities will find it increasingly difficult to continue providing high quality, value for money public services that nurture and support the powerhouse of the UK economy.

Oxford Economics Ltd.Abbey House 121 St Aldates
Oxford OX1 1HB
Local Government Futures Ltd.Technology House
151 Silbury BoulevardMilton Keynes
Related Documents