unaudited October 27, 2011 Consolidated Second Quarter Earnings Report [Japan GAAP] For the Six Months Ended September 30,2011 Corporate Name: Hitachi Capital Corporation Stock Code: 8586 URL: http://www.hitachi-capital.co.jp Stock Listing: Tokyo Stock Exchange Representative Director: Kazuya Miura, President and CEO Inquiries: Keiji Momoi, Senior Corporate Officer Phone: +81-3-3503-2118 Scheduled date of submission of financial reports: November 11, 2011 Scheduled commencement of dividend payment: November 30, 2011 Preparation of supplementary material for quarterly financial results: Yes Holding of quarterly financial results meeting: Yes (All amounts rounded down) 1. Consolidated Financial Results for the Second Quarter Ended September 30,2011 (April 1, 2011 – September 30, 2011) (1) Consolidated Operating Results (Cumulative) (year-on-year change %) Revenues Operating income Ordinary income Net income Six Months Ended September 30, 2011 Six Months Ended September 30, 2010 ¥ million 46,890 46,394 % 1.1 △2.8 ¥ million 11,966 8,530 % 40.3 27.1 ¥ million 11,929 8,698 % 37.1 21.5 ¥ million 6,696 5,179 % 29.3 23.8 Note:Comprehensive income: Six Months Ended September 30, 2011: 4,437\million(△15.8%) ; Six Months Ended September 30, 2010: 5,267\million(-%) Net income per share Diluted net income per share Six Months Ended September 30, 2011 ¥ ¥ 57.29 - Six Months Ended September 30, 2010 44.31 - (Ref.) Volume of business: Six Months Ended September 30, 2011: 716,401\million ; Six Months Ended September 30, 2010:752,756 \million (2) Consolidated Financial Position Total assets Total stockholders' equity Stockholders' equity ratio As of September 30, 2011 As of March 31, 2010 ¥ million 1,560,544 1,562,410 ¥ million 257,249 254,797 % 16.4 16.2 (Ref.) Stockholders’ equity : As of September 30, 2011: 255,681\million As of March 31, 2011: 253,189\million 2. Dividends Divided per share 1st Quarter 2nd Quarter 3rd Quarter Year End For the Year Year Ended March 31, 2011 ¥ - ¥ 16.00 ¥ - ¥ 16.00 ¥ 32.00 Year Ended March 31, 2012 - 16.00 Year Ending March 31, 2012 (Forecast) - 16.00 32.00 Note:Changes from the latest released dividend forecasts:None 3. Forecast for the Fiscal Year Ending March 31, 2012 (April 1, 2011 – March 31, 2012) (% is year-on-year for the fiscal year or the interim period) Revenues Operating income Ordinary income Net income Net income per share ¥ million % ¥ million % ¥ million % ¥ million % Yen Fiscal year 96,000 4.3 21,600 23.7 21,600 22.5 12,600 102.1 107.80 Note:Changes from the latest released performance forecasts:Yes (Ref.) Volume of business : Fiscal year : 1,530,000 ¥million

Welcome message from author
This document is posted to help you gain knowledge. Please leave a comment to let me know what you think about it! Share it to your friends and learn new things together.
Transcript
unaudited
October 27, 2011
Consolidated Second Quarter Earnings Report [Japan GAAP] For the Six Months Ended September 30,2011
Corporate Name: Hitachi Capital Corporation Stock Code: 8586 URL: http://www.hitachi-capital.co.jp Stock Listing: Tokyo Stock Exchange Representative Director: Kazuya Miura, President and CEO Inquiries: Keiji Momoi, Senior Corporate Officer Phone: +81-3-3503-2118 Scheduled date of submission of financial reports: November 11, 2011 Scheduled commencement of dividend payment: November 30, 2011 Preparation of supplementary material for quarterly financial results: Yes Holding of quarterly financial results meeting: Yes
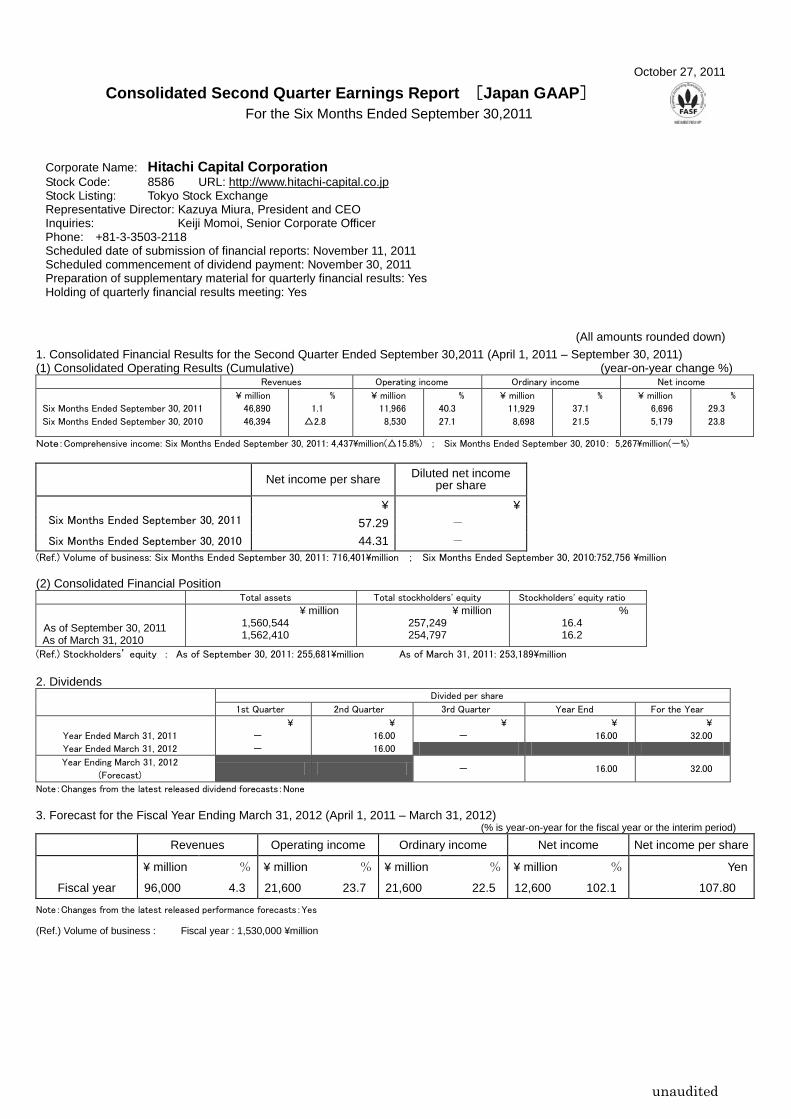
(All amounts rounded down) 1. Consolidated Financial Results for the Second Quarter Ended September 30,2011 (April 1, 2011 – September 30, 2011) (1) Consolidated Operating Results (Cumulative) (year-on-year change %)
Revenues Operating income Ordinary income Net income
Six Months Ended September 30, 2011
Six Months Ended September 30, 2010
¥ million
46,890
46,394
%
1.1
△2.8
¥ million
11,966
8,530
%
40.3
27.1
¥ million
11,929
8,698
%
37.1
21.5
¥ million
6,696
5,179
%
29.3
23.8
Note:Comprehensive income: Six Months Ended September 30, 2011: 4,437\million(△15.8%) ; Six Months Ended September 30, 2010: 5,267\million(-%)
Net income per share Diluted net income per share
Six Months Ended September 30, 2011
¥ ¥ 57.29 -
Six Months Ended September 30, 2010 44.31 - (Ref.) Volume of business: Six Months Ended September 30, 2011: 716,401\million ; Six Months Ended September 30, 2010:752,756 \million
(2) Consolidated Financial Position Total assets Total stockholders' equity Stockholders' equity ratio
As of September 30, 2011 As of March 31, 2010
¥ million 1,560,544 1,562,410
¥ million 257,249 254,797
% 16.4 16.2
(Ref.) Stockholders’ equity : As of September 30, 2011: 255,681\million As of March 31, 2011: 253,189\million
2. Dividends
Divided per share
1st Quarter 2nd Quarter 3rd Quarter Year End For the Year
Year Ended March 31, 2011
¥
-
¥
16.00
¥
-
¥
16.00
¥
32.00
Year Ended March 31, 2012 - 16.00
Year Ending March 31, 2012
(Forecast) - 16.00 32.00
Note:Changes from the latest released dividend forecasts:None
3. Forecast for the Fiscal Year Ending March 31, 2012 (April 1, 2011 – March 31, 2012) (% is year-on-year for the fiscal year or the interim period)
Revenues Operating income Ordinary income Net income Net income per share
¥ million % ¥ million % ¥ million % ¥ million % Yen
Fiscal year 96,000 4.3 21,600 23.7 21,600 22.5 12,600 102.1 107.80
Note:Changes from the latest released performance forecasts:Yes
(Ref.) Volume of business : Fiscal year : 1,530,000 ¥million

unaudited
4. Others (1) Major changes in among subsidiaries in the consolidated cumulative period of the period under review :Yes (Transfer of specific subsidiaries accompanying the change of scope of consolidation)
Non-consolidated Subsidiary:Hitachi Capital Securities Co., Ltd.
(2) Application of specified accounting treatment used in preparation of quarterly consolidated financial statements : Yes (3) Changes to accounting policies; changes to accounting estimates; restatements
(ⅰ)Changes to accounting policies due to revisions to accounting standards,etc. : None (ⅱ)Other changes to accounting policies : None (ⅲ)Changes to accounting estimates : None (ⅳ)Restatements : None
(4) Number of outstanding shares (common shares)
(ⅰ) Shares issued at end of term (including own shares) Six months ended September 30, 2011 : 124,826,552 shares Year ended March 31, 2011: 124,826,552 shares
(ⅱ)Own shares at end of term Six months ended September 30, 2011 : 7,938,803 shares Year ended March 31, 2011: 7,938,770 shares
(ⅲ) Weighted average number of shares outstanding Six months ended September 30, 2011 : 116,887,769 shares Six months ended September 30, 2011: 116,888,796 shares
Note: Information regarding the implementation of quarterly review procedures It is under the review procedure process based upon the Financial Instruments and Exchange Act at the time of disclosure of this report. Note: Explanation for proper use of the forecasts, etc. Consolidated forecasts stated herein have been prepared using information available on the date of release. Accordingly, forecasts may differ significantly from actual results due to a variety of reasons.
Quarterly Consolidated Financial Statements
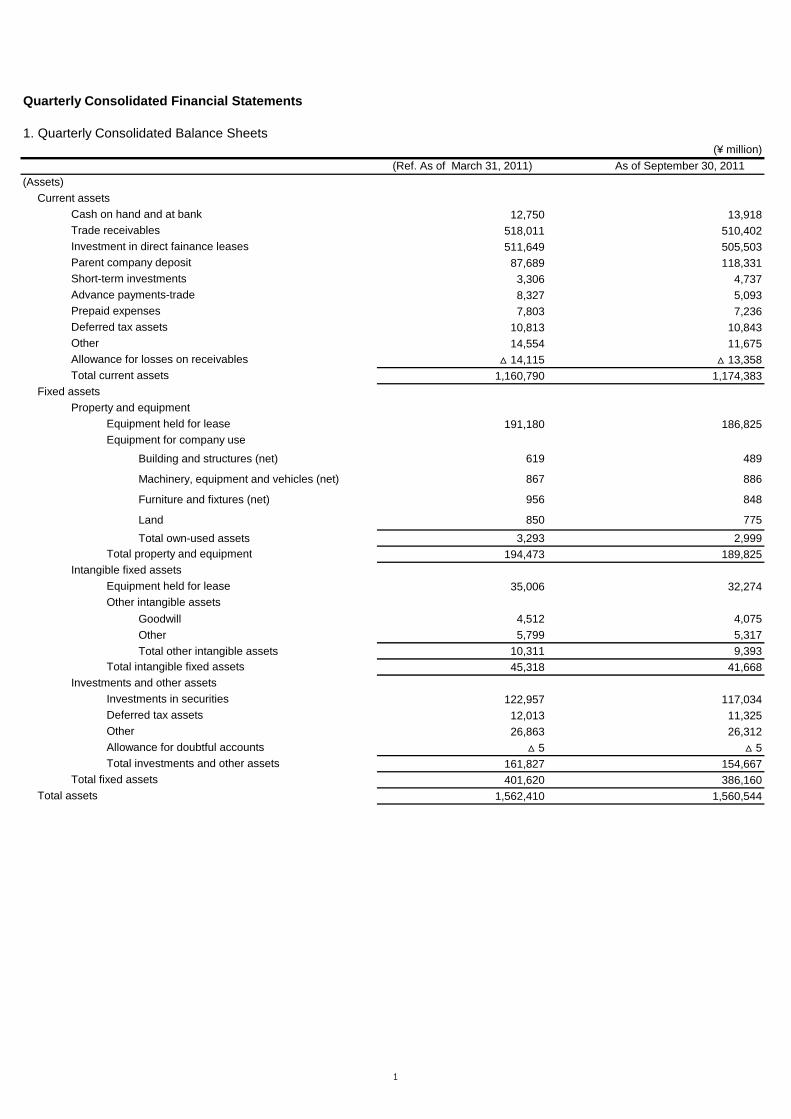
1. Quarterly Consolidated Balance Sheets(¥ million)
12,750 13,918518,011 510,402511,649 505,503
87,689 118,3313,306 4,7378,327 5,0937,803 7,236
10,813 10,84314,554 11,675
△ 14,115 △ 13,3581,160,790 1,174,383
191,180 186,825
Building and structures (net) 619 489
Machinery, equipment and vehicles (net) 867 886
Furniture and fixtures (net) 956 848
Land 850 775Total own-used assets 3,293 2,999
194,473 189,825
35,006 32,274
Goodwill 4,512 4,075Other 5,799 5,317Total other intangible assets 10,311 9,393
45,318 41,668
122,957 117,03412,013 11,32526,863 26,312
△ 5 △ 5161,827 154,667401,620 386,160
1,562,410 1,560,544
Deferred tax assetsOther
Total intangible fixed assets
Investments in securities
Total fixed assetsTotal assets
Investments and other assets
Total property and equipmentIntangible fixed assets
Equipment held for leaseOther intangible assets
Allowance for doubtful accountsTotal investments and other assets
Equipment for company use
Fixed assetsProperty and equipment
Equipment held for lease
Advance payments-trade
Allowance for losses on receivablesTotal current assets
Deferred tax assetsOther
Prepaid expenses
Trade receivablesInvestment in direct fainance leasesParent company depositShort-term investments
(Ref. As of March 31, 2011) As of September 30, 2011(Assets)
Current assetsCash on hand and at bank
1

(¥ million)
224,713 221,778203,143 218,87246,109 125,11861,768 49,493
18,561 62,439
83,964 52,59412,379 5,3351,148 9786,564 7,0071,311 1,311
146 47145,437 40,682
705,248 786,083
195,255 188,454276,630 259,107
74,492 14,342379 276
4,519 4,530280 251
6,461 6,2074,856 4,578
39,489 39,462602,364 517,211
1,307,612 1,303,295
9,983 9,98345,972 45,972
214,101 218,928△ 14,331 △ 14,331255,726 260,553
6,474 6,951△ 388 △ 887
△ 8,623 △ 10,936△ 2,536 △ 4,871
1,608 1,567254,797 257,249
1,562,410 1,560,544
(Ref. As of March 31, 2011) As of September 30, 2011
Short-term bank loans
(Liabilities)
Trade payablesCurrent liabilities
Current portion of bondsCurrent portion of long-term obligation for securitizedlease receivables
Total current liabilities
Accrued Payable
Asset retirement obligations
Income taxes payableDeferred tax liabilities
Provision for loss on disaster
Other
Allowance for losses on guarantees
Accumulated other comprehensive income
Treasury stock
(Net Assets)
Net unrealized holding gain on securities
Retained earnings
Total stockholders' equity
Common stockCapital surplus
OtherTotal fixed liabilities
BondsLong-term debt
Total liabilities and net assets
Foreign currency translation adjustmentsTotal accumulated other comprehensive income
Minority interests Total net assets
Net unrealized loss on hedge accounting
Fixed liabilities
Commercial paper
Total liabilities
Stockholders' equity
Long-term obligation for securitized lease receivables
Asset retirement obligations
Deferred tax liabilitiesRetirement and severance benefitsRetirement benefits for directorsReserve for insurance contract
2
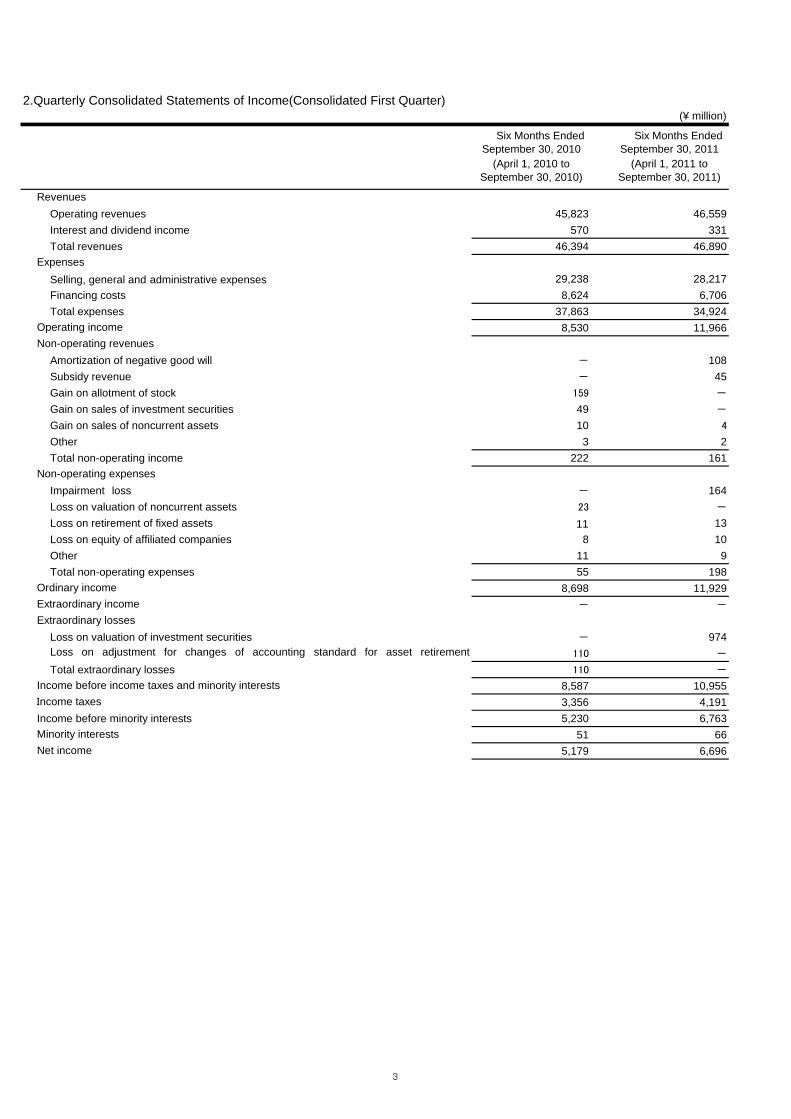
2.Quarterly Consolidated Statements of Income(Consolidated First Quarter)
Operating revenues 45,823 46,559Interest and dividend income 570 331Total revenues 46,394 46,890
Selling, general and administrative expenses 29,238 28,217Financing costs 8,624 6,706Total expenses 37,863 34,924
8,530 11,966
Amortization of negative good will - 108Subsidy revenue - 45Gain on allotment of stock 159 -
Gain on sales of investment securities 49 -
Gain on sales of noncurrent assets 10 4
Other 3 2Total non-operating income 222 161
Impairment loss - 164Loss on valuation of noncurrent assets 23 -
Loss on retirement of fixed assets 11 13Loss on equity of affiliated companies 8 10Other 11 9Total non-operating expenses 55 198
8,698 11,929- -
Loss on valuation of investment securities - 974Loss on adjustment for changes of accounting standard for asset retirement 110 -
Total extraordinary losses 110 -
8,587 10,9553,356 4,191
Income before minority interests 5,230 6,76351 66
5,179 6,696
Non-operating expenses
Income before income taxes and minority interests
Extraordinary losses
Operating incomeNon-operating revenues
Revenues
Expenses
Ordinary incomeExtraordinary income
(¥ million)
Net income
Six Months EndedSeptember 30, 2010
(April 1, 2010 toSeptember 30, 2010)
Six Months EndedSeptember 30, 2011
(April 1, 2011 toSeptember 30, 2011)
Income taxes
Minority interests
3

3.Quarterly Consolidated statements of Comprehensive Income(Consolidated First Quarter)
Income before minority interests 5,230 6,763
Valuation difference on available-for-sale securities 862 473Net deferred gains or losses on hedges 471 △ 498Foreign currency translation adjustments △ 1,296 △ 2,301Total other comprehensive income 36 △ 2,326
5,267 4,437(Comprehensive income attributable to)
Comprehensive income attributabule to shareholders of the parenrt 5,232 4,362Comprehensive income attributabule to minority interests 34 74
Other comprehensive income
Comprehensive income
(¥ million)
Six Months EndedSeptember 30, 2010
Six Months EndedSeptember 30, 2011
(April 1, 2010 toSeptember 30, 2010)
(April 1, 2011 toSeptember 30, 2011)
4

4.Quarterly Consolidated Cash Flows (¥ million)
Income before income taxes and minority interests 8,587 10,955Depreciation 39,112 38,684Loss on adjustment for changes of accounting standard for asset retirement obligations 110 -
Loss on valuation of investment securities(△ represents gain) 23 974
Depreciation of goodwill 452 362Amortization of negative good will - △ 108Interest and dividend income △ 311 △ 212Interest expense 8,050 5,641Increase (decrease) in trade receivables (△ represents increase) △ 10,321 △ 14,935Increase in investment in direct finance lease (△ represents increase) △ 20,600 △ 21,599Decrease (increase) in allowance for doubtful accounts(△ represents decrease) △ 412 △ 404Increase in allowance for losses on loan guarantees (△ represents decrease) 600 443Gain on disposal of equipment for leases (△ represents gain) △ 1,578 △ 706Gain on sale of equipment for lease 30,514 24,650Acquisition of equipment for lease △ 52,799 △ 41,528Increase (decrease) in trade payable (△ represents decrease) 17,996 3,898Decrease in trade payable of collection under fluidity receivables (△ represents decrease) △ 39,341 △ 30,311Increase (decrease) in retirement and severance benefits (△ represents decrease) 40 10Other △ 20,199 △ 3,369Subtotal △ 40,076 △ 27,555Income taxes paid △ 374 △ 10,989Net cash provided by operating activities △ 40,450 △ 38,545
Payments into time deposits △ 2,250 △ 1,666Proceeds from withdrawal of time deposits 2,300 1,900Purchase from sale of short-term investments △ 2,797 △ 4,749Proceeds from sales and repayment of securities 4,000 4,000Purchase of investments in securities △ 1,288 △ 806
Proceeds from sales and repayment of investment securities 187 -
Purchase of equipment for company use △ 210 △ 250Purchase of other intangible fixed assets △ 870 △ 754Revenues from sales of subsidiary stock with the change of scope of consolidation - 660Interest and dividends received 405 299Other 63 △ 40Net cash used in investing activities △ 460 △ 1,407
Cash flows from financing activitiesIncrease (decrease) in short-term loans(△represents decrease) △ 296 △ 2,273Increase (decrease) in commercial paper(△represents decrease) 39,538 80,616Proceeds from long-term borrowings 9,866 70,045Payment of long-term borrowings △ 11,142 △ 56,503Issuance of bonds 60,437 36,931Redemption of bonds △ 54,673 △ 48,812Interest paid △ 8,270 △ 5,877Dividends paid to stockholders △ 1,753 △ 1,870Other △ 7 △ 6Net cash used in financing activities 33,699 72,249
Effect of exchange rate changes on cash and cash equivalents 121 △ 236Net increase (decrease) in cash and cash equivalents(△represents decrease) △ 7,090 32,059Cash and cash equivalents at beginning of period 211,157 98,190Cash and cash equivalents at end of period 204,067 130,249
Six Months EndedSeptember 30, 2010
Six Months EndedSeptember 30, 2011
(April 1, 2011 toSeptember 30, 2011)
Cash flows from operating activities
(April 1, 2010 toSeptember 30, 2010)
Cash flows from investing activities
5
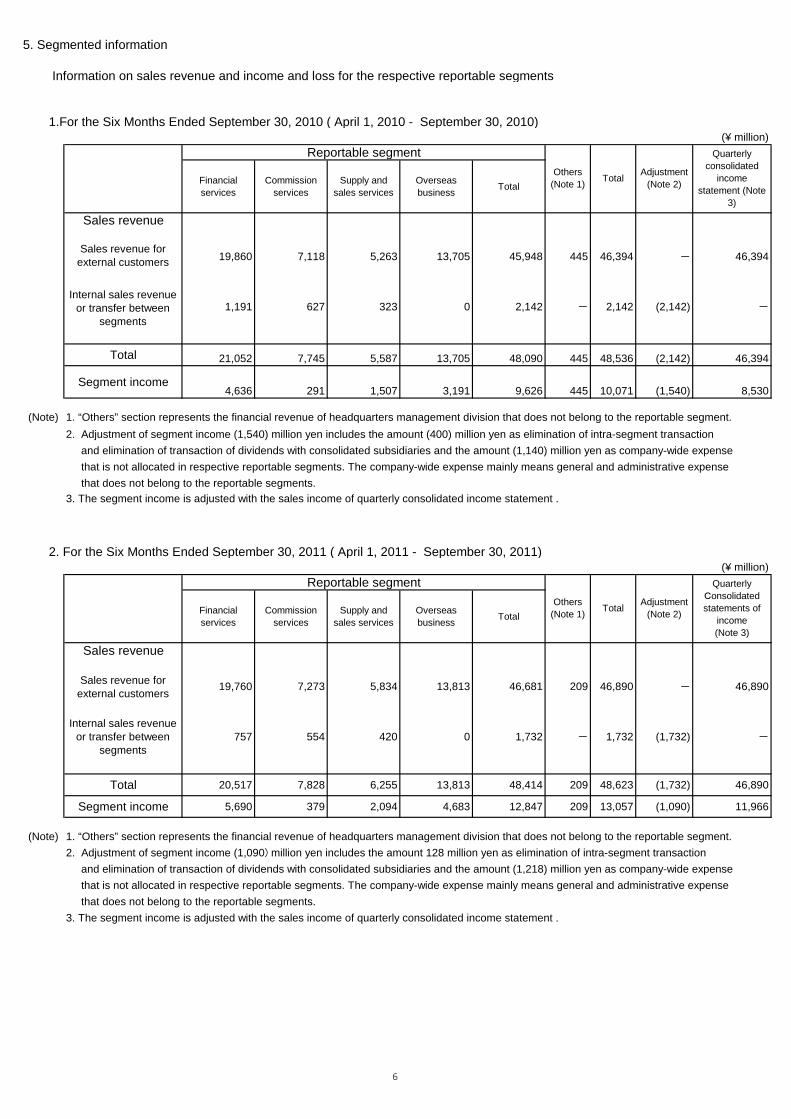
5. Segmented information
Information on sales revenue and income and loss for the respective reportable segments
1.For the Six Months Ended September 30, 2010 ( April 1, 2010 - September 30, 2010)(¥ million)
Reportable segment
Financialservices
Commissionservices
Supply andsales services
Overseasbusiness Total
Sales revenue
Sales revenue forexternal customers 19,860 7,118 5,263 13,705 45,948 445 46,394 - 46,394
Internal sales revenueor transfer between
segments1,191 627 323 0 2,142 - 2,142 (2,142) -
Total 21,052 7,745 5,587 13,705 48,090 445 48,536 (2,142) 46,394
Segment income4,636 291 1,507 3,191 9,626 445 10,071 (1,540) 8,530
(Note) 1. “Others” section represents the financial revenue of headquarters management division that does not belong to the reportable segment. 2. Adjustment of segment income (1,540) million yen includes the amount (400) million yen as elimination of intra-segment transaction and elimination of transaction of dividends with consolidated subsidiaries and the amount (1,140) million yen as company-wide expense that is not allocated in respective reportable segments. The company-wide expense mainly means general and administrative expense that does not belong to the reportable segments. 3. The segment income is adjusted with the sales income of quarterly consolidated income statement .
2. For the Six Months Ended September 30, 2011 ( April 1, 2011 - September 30, 2011)(¥ million)
Reportable segment
Financialservices
Commissionservices
Supply andsales services
Overseasbusiness Total
Sales revenue
Sales revenue forexternal customers 19,760 7,273 5,834 13,813 46,681 209 46,890 - 46,890
Internal sales revenueor transfer between
segments757 554 420 0 1,732 - 1,732 (1,732) -
Total 20,517 7,828 6,255 13,813 48,414 209 48,623 (1,732) 46,890
Segment income 5,690 379 2,094 4,683 12,847 209 13,057 (1,090) 11,966
(Note) 1. “Others” section represents the financial revenue of headquarters management division that does not belong to the reportable segment. 2. Adjustment of segment income (1,090) million yen includes the amount 128 million yen as elimination of intra-segment transaction and elimination of transaction of dividends with consolidated subsidiaries and the amount (1,218) million yen as company-wide expense that is not allocated in respective reportable segments. The company-wide expense mainly means general and administrative expense that does not belong to the reportable segments. 3. The segment income is adjusted with the sales income of quarterly consolidated income statement .
Others(Note 1) Total Adjustment
(Note 2)
Quarterlyconsolidated
incomestatement (Note
3)
Others(Note 1) Total Adjustment
(Note 2)
QuarterlyConsolidatedstatements of
income(Note 3)
6

<Supplementary Information >
1. Change in Quarterly Consolidated Performance
Consolidated Results for the Year Ending March 31, 2012 (¥ million)
Quarter 1st Quarter 2nd Quarter 3rd Quarter 4th Quarter Six MonthsCumulative
No. (April 1, 2011 - (July 1, 2011 - (October 1, 2011 - (January 1, 2012 - ( April 1, 2011 -
Item June 30, 2011) September 30, 2011) December 31, 2011) March 31, 2012) September 30, 2011)
1 23,506 23,384 46,890
Operating revenues 2 23,349 23,210 46,559
Interest and dividend income 3 157 174 331
4 17,994 16,929 34,924
Selling, general and administrative expenses 5 14,596 13,620 28,217
Financing costs 6 3,397 3,308 6,706
7 5,512 6,454 11,966
Non-operating revenues 8 29 131 161
Non-operating expenses 9 104 93 198
10 5,436 6,492 11,929
Extraordinary gains/losses 11 - △ 974 △ 974
12 5,436 5,518 10,955
Income taxes 13 2,104 2,087 4,191
Income before minority interests 14 3,332 3,430 6,763
Minority interests 15 54 12 66
16 3,278 3,418 6,696
Consolidated Results for the Year Ended March 31, 2011 (¥ million)
1st Quarter 2nd Quarter 3rd Quarter 4th Quarter Annual Cumulative
No. (April 1, 2010 - (July 1, 2010 - (October 1, 2010 - (January 1, 2011 - ( April 1, 2010 -
Item June 30, 2010) September 30, 2010) December 31, 2010) March 31, 2011) March 31, 2011)
1 23,872 22,521 22,232 23,391 92,018
Operating revenues 2 23,656 22,167 22,056 23,090 90,970
Interest and dividend income 3 216 354 175 301 1,047
4 19,868 17,994 17,744 18,949 74,558
Selling, general and administrative expenses 5 15,461 13,777 13,716 14,318 57,273
Financing costs 6 4,407 4,217 4,028 4,631 17,284
7 4,003 4,526 4,487 4,442 17,460
Non-operating revenues 8 216 5 2 3 228
Non-operating expenses 9 14 40 9 △ 6 58
10 4,205 4,492 4,480 4,452 17,630
Extraordinary gains/losses 11 △ 110 - - △ 7,864 △ 7,975
12 4,095 4,492 4,480 △ 3,411 9,655
Income taxes 13 1,790 1,566 1,761 △ 1,909 3,208
Income before minority interests 14 2,304 2,925 2,718 △ 1,502 6,446
Minority interests 15 28 22 94 65 211
16 2,275 2,903 2,624 △ 1,568 6,234
Income before income taxes and minority interests
Net income
Revenues
Expenses
Operating income
Ordinary income
Net income
Operating income
Revenues
Expenses
Ordinary income
Income before income taxes and minority interests
Quarter
7

2. Contract Segmented Information
(1) For the Six Months Ended September 30, 2011 ( April 1, 2011 - September 30, 2011)
Lease Guarantees Installmentsand others Lease Installments
and others
22,452 2,907 7,716 33,077 5,202 8,610 13,813 46,890(48) (6) (17) (71) (11) (18) (29) (100)
(3) (△17) (5) (1) (5) (△2) (1) (1)192,653 57,259 304,984 554,897 40,855 120,648 161,503 716,401
(27) (8) (42) (77) (6) (17) (23) (100)(△13) (△25) (△2) (△9) (24) (7) (11) (△5)
1,138,593 434,248 595,623 2,168,465 104,568 244,776 349,344 2,517,810
(45) (17) (24) (86) (4) (10) (14) (100)(△10) (△10) (△3) (△8) (9) (△1) (2) (△7)
(2) For the Six Months Ended September 30, 2010 ( April 1, 2010 - September 30, 2010)
Lease Guarantees Installmentsand others Lease Installments
and others
21,855 3,498 7,335 32,689 4,932 8,772 13,705 46,394(46) (8) (16) (70) (11) (19) (30) (100)(△2) (5) (△4) (△2) (△8) (△3) (△5) (△3)
221,167 76,248 309,716 607,132 32,847 112,777 145,624 752,756(30) (10) (41) (81) (4) (15) (19) (100)
(1) (△4) (14) (6) (17) (12) (13) (7)
1,262,827 480,921 612,113 2,355,862 95,727 246,210 341,937 2,697,799
(46) (18) (23) (87) (4) (9) (13) (100)(△11) (1) (△3) (△7) (△5) (△3) (△3) (△6)
Notes: 1. "Trade receivables, loan guarantees and leases" include off-balance sheet assets.
2. "Lease" includes lease rentals, auto leases and other items.3. "Guarantees" include loan sales through alliances and other items.4. "Installments and others" include installment sales, business loans (including home loans), card services and other items.5. "Guarantees" are not performed in overseas consolidated business.
3. Segmented Information by Region
(1) For the Six Months Ended September 30, 2011 ( April 1, 2011 - September 30, 2011)(¥ million, %)
No Japan Europe andNorth America Asia Consolidated
total1 33,077 10,714 3,098 46,890
2 7,270 3,516 1,179 11,966
(2) For the Six Months Ended September 30, 2010 ( April 1, 2010 - September 30, 2010)(¥ million, %)
No Japan Europe andNorth America Asia Consolidated
total1 32,689 11,071 2,633 46,394
2 5,323 2,323 884 8,530
Notes:1. The classification of country or region is based on similarities in economic activities.2. Principal countries and regions in each category are as follows.
(1) Europe and North America: Britain, Ireland, and United States(2) Asia: Singapore,China,Thailand
3. The above are the revenues and operating income from external customers.
Total ConsolidatedTotal
Domestic consolidated
Total
Volume of business(Composition %)
Revenues(Composition %)
Trade receivables,loan guarantees and leases
3(Composition %)
(Y toY Change %)
(Y toY Change %)
(Y toY Change %)
(¥ million, %)
(¥ million, %)
1
2
Total ConsolidatedTotal
Overseas consolidated
No
Overseas consolidated
No
3
Volume of business
Trade receivables,loan guarantees and leases
(Composition %)
(Y toY Change %)(Composition %)
(Y toY Change %)
Total
Domestic consolidated
(Y toY Change %)(Composition %) 1
Revenues
2
Revenues
Operating income
Revenues
Operating income
8
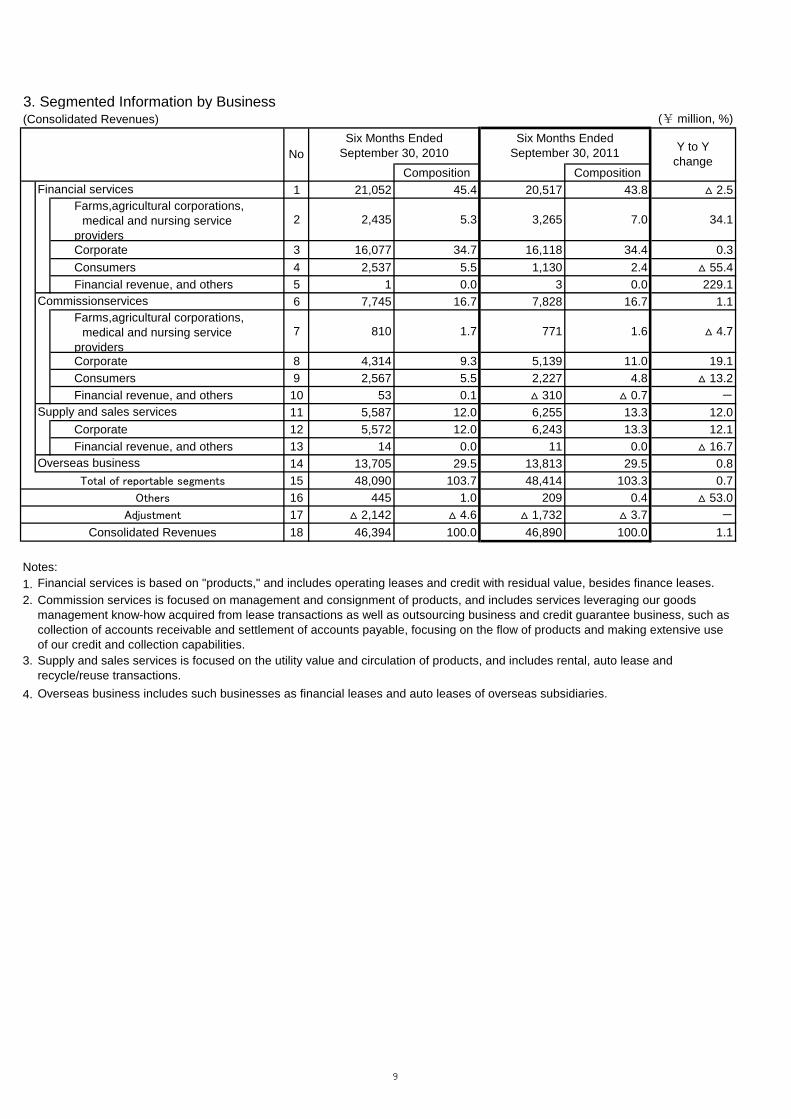
3. Segmented Information by Business(Consolidated Revenues)
Composition Composition1 21,052 45.4 20,517 43.8 △ 2.5
2 2,435 5.3 3,265 7.0 34.1
Corporate 3 16,077 34.7 16,118 34.4 0.3Consumers 4 2,537 5.5 1,130 2.4 △ 55.4Financial revenue, and others 5 1 0.0 3 0.0 229.1
6 7,745 16.7 7,828 16.7 1.1
7 810 1.7 771 1.6 △ 4.7
Corporate 8 4,314 9.3 5,139 11.0 19.1Consumers 9 2,567 5.5 2,227 4.8 △ 13.2Financial revenue, and others 10 53 0.1 △ 310 △ 0.7 -
11 5,587 12.0 6,255 13.3 12.0Corporate 12 5,572 12.0 6,243 13.3 12.1Financial revenue, and others 13 14 0.0 11 0.0 △ 16.7
14 13,705 29.5 13,813 29.5 0.8Total of reportable segments 15 48,090 103.7 48,414 103.3 0.7
Others 16 445 1.0 209 0.4 △ 53.0Adjustment 17 △ 2,142 △ 4.6 △ 1,732 △ 3.7 -
Consolidated Revenues 18 46,394 100.0 46,890 100.0 1.1
Notes: 1.2.
3.
4.
Supply and sales services is focused on the utility value and circulation of products, and includes rental, auto lease andrecycle/reuse transactions.
Six Months EndedSeptember 30, 2011
Farms,agricultural corporations, medical and nursing serviceproviders
CommissionservicesFarms,agricultural corporations, medical and nursing serviceproviders
Overseas business includes such businesses as financial leases and auto leases of overseas subsidiaries.
Financial services is based on "products," and includes operating leases and credit with residual value, besides finance leases.Commission services is focused on management and consignment of products, and includes services leveraging our goodsmanagement know-how acquired from lease transactions as well as outsourcing business and credit guarantee business, such ascollection of accounts receivable and settlement of accounts payable, focusing on the flow of products and making extensive useof our credit and collection capabilities.
(¥ million, %)
Y to YchangeNo
Financial services
Overseas business
Supply and sales services
Six Months EndedSeptember 30, 2010
9

(Consolidated Business Volume)
Composition Composition1 257,309 34.2 234,963 32.8 △ 8.7
Farms,aguricultural corporations 2 8,936 1.2 6,652 0.9 △ 25.6medical and nursing service providers 3 27,684 3.7 23,809 3.3 △ 14.0Corporate 4 211,523 28.1 201,677 28.2 △ 4.7
Information equipment related 5 105,004 14.0 75,984 10.6 △ 27.6Industrial machinery 6 24,433 3.2 26,894 3.8 10.1Construction machinery 7 2,216 0.3 3,377 0.5 52.4Others 8 79,868 10.6 95,420 13.3 19.5
Consumers 9 10,663 1.4 5,363 0.8 △ 49.7Elimination and others 10 △ 1,499 △ 0.2 △ 2,539 △ 0.4 -
11 320,923 42.6 290,794 40.6 △ 9.4Farms,aguricultural corporations 12 12,779 1.7 12,360 1.7 △ 3.3medical and nursing service providers 13 1,553 0.2 1,796 0.3 15.6Corporate 14 256,216 34.0 240,455 33.6 △ 6.2
Card business 15 21,797 2.9 23,040 3.2 5.7Non-life insurance business 16 1,655 0.2 1,499 0.2 △ 9.4Securitization business 17 74,985 10.0 49,020 6.8 △ 34.6Outsourcing business 18 147,590 19.6 157,969 22.1 7.0Information equipment related and others 19 10,186 1.3 8,925 1.3 △ 12.4
Consumers 20 59,829 8.0 44,495 6.2 △ 25.6Automobile business 21 44,364 5.9 29,365 4.1 △ 33.8
22 3,904 0.5 5,789 0.8 48.3
Home loans 23 11,559 1.6 9,341 1.3 △ 19.2Elimination and others 24 △ 9,454 △ 1.3 △ 8,313 △ 1.2 -
25 28,899 3.9 29,138 4.1 0.8Corporate 26 29,962 4.0 30,266 4.2 1.0
Information equipment related and others 27 2,898 0.4 2,906 0.4 0.3Automobile finance 28 23,496 3.1 23,694 3.3 0.8Outsourcing business 29 3,566 0.5 3,665 0.5 2.8
Elimination and others 30 △ 1,063 △ 0.1 △ 1,128 △ 0.1 -
Domestic consolidated business volume 31 607,132 80.7 554,897 77.5 △ 8.6Overseas consoidated business volume 32 145,624 19.3 161,503 22.5 10.9
Consolidated business volume 33 752,756 100.0 716,401 100.0 △ 4.8
Notes: 1.2.
3.
4.
(¥ million, %)
Y to Ychange
Financial services
Commissionservices
NoSix Months Ended
September 30, 2011Six Months Ended
September 30, 2010
Others shown under Corporate in Financial services includes commercial facilities, scientific instruments, maintenance services,and other items.
Supply and sales services is focused on the utility value and circulation of products, and includes rental, auto lease andrecycle/reuse transactions.
Financial services is based on "products," and includes operating leases and credit with residual value, besides finance leases.
Supply and sales services
Home appliances and home refurbishment
Commission services is focused on management and consignment of products, and includes services leveraging our goodsmanagement know-how acquired from lease transactions as well as outsourcing business and credit guarantee business, such ascollection of accounts receivable and settlement of accounts payable, focusing on the flow of products and making extensive useof our credit and collection capabilities.
10
Related Documents