Idaho National Engineering Laboratory INEL-95/0422 August 1995 OCT 2 0 1335 OSTI Idaho Chemical Processing Plant Failure Rate Database Ted G. Alter ft Christopher Hunt Steve P. Fogarty James ft Wilson '41 # > I C. ^[Lockheed Idaho Technologies Company DISTRIBUTION OF THIS DOCUMENT IS UNLIMITED ^ WW t

Welcome message from author
This document is posted to help you gain knowledge. Please leave a comment to let me know what you think about it! Share it to your friends and learn new things together.
Transcript

Idaho National
Engineering Laboratory
INEL-95/0422
August 1995
OCT 2 0 1335
O S T I
Idaho Chemical Processing Plant Failure Rate Database
Ted G. Alter ft Christopher Hunt Steve P. Fogarty James ft Wilson
'41 #
> I C .
^[Lockheed Idaho Technologies Company
DISTRIBUTION OF THIS DOCUMENT IS UNLIMITED ^
WW t

DISCLAIMER
Portions of this document may be illegible in electronic image products. Images are produced from the best available original document.

DISCLAIMER INEL-95/0422
This report was prepared as an account of work sponsored by an agency of the United States Government. Neither the United States Government nor any agency thereof, nor any of their employees, makes any warranty, express or implied, or assumes any legal liability or responsibility for the accuracy, completeness, or usefulness of any information, apparatus, product, or process disclosed, or represents that its use would not infringe privately owned rights. Reference herein to any specific commercial product, process, or service by trade name, trademark, manufacturer, or otherwise does not necessarily constitute or imply its endorsement, recommendation, or favoring by the United States Government or any agency thereof. The views and opinions of authors expressed herein do not necessarily state or reflect those of the United States Government or any agency thereof.
Idaho Chemical Processing Plant Failure Rate Database
Ted G. Alber R. Christopher Hunt
Steve P. Fogarty James R. Wilson
Published August 1995
Idaho National Engineering Laboratory Nuclear Engineering Department
Lockheed Idaho Technologies Company Idaho Falls, Idaho 83415
Prepared for the U.S. Department of Energy
Assist. Secretary for Environmental Management Under DOE Idaho Operations Office
Contract DE-AC07-94ID13223 MA:
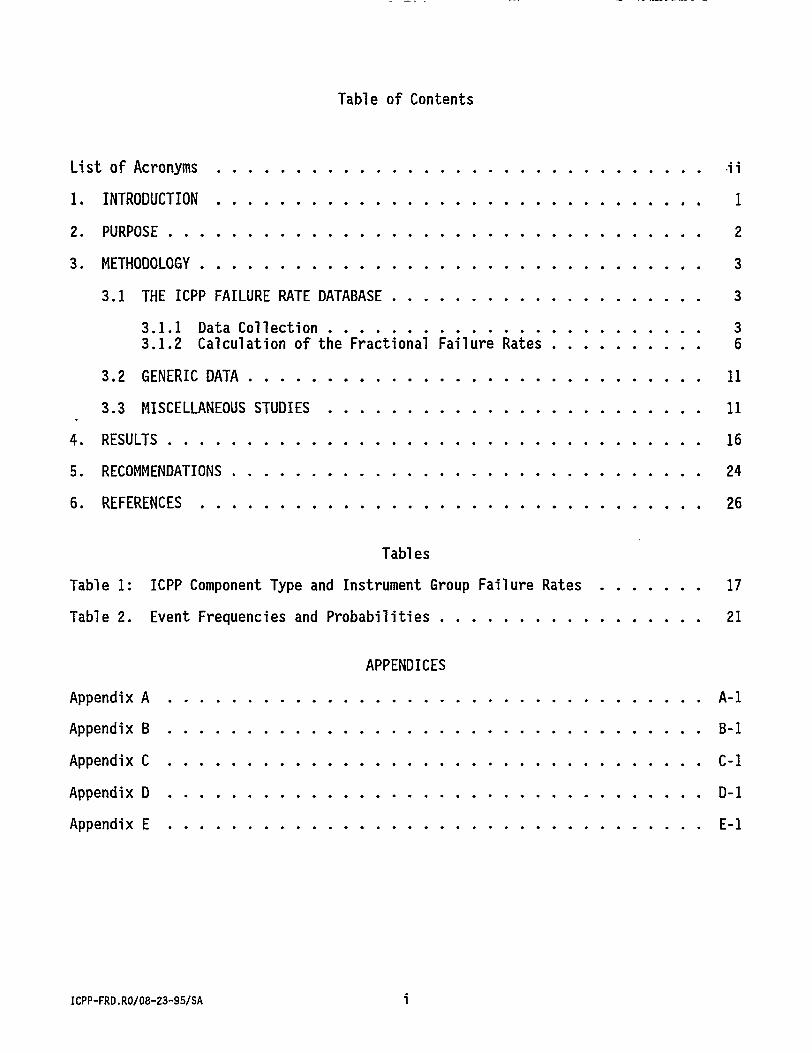
Table of Contents
List of Acronyms ii 1. INTRODUCTION 1 2. PURPOSE 2 3. METHODOLOGY 3
3.1 THE ICPP FAILURE RATE DATABASE 3 3.1.1 Data Collection 3 3.1.2 Calculation of the Fractional Failure Rates 6
3.2 GENERIC DATA 11 3.3 MISCELLANEOUS STUDIES 11
4. RESULTS 16 5. RECOMMENDATIONS 24 6. REFERENCES 26
Tables Table 1: ICPP Component Type and Instrument Group Failure Rates 17 Table 2. Event Frequencies and Probabilities 21
APPENDICES Appendix A A-l Appendix B B-l Appendix C C-l Appendix D D-l Appendix E E-l
ICPP-FRD.R0/08-23-95/SA i
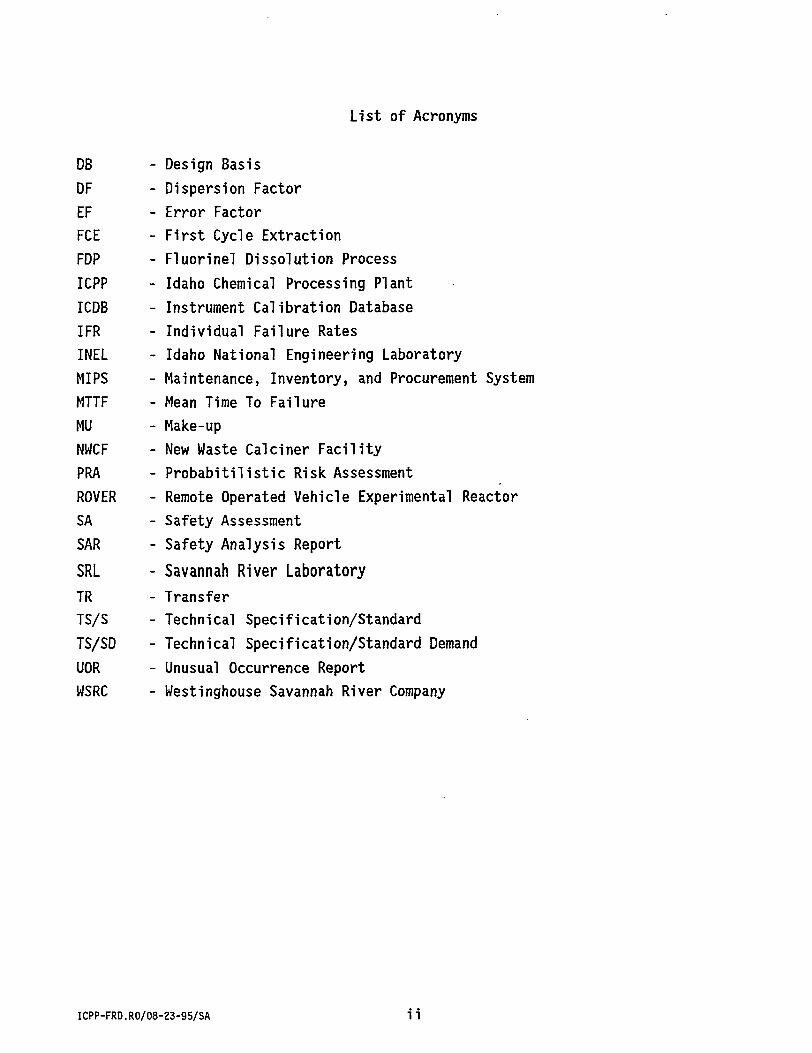
List of Acronyms
DB - Design Basis DF - Dispersion Factor EF - Error Factor FCE - First Cycle Extraction FDP - Fluorine! Dissolution Process ICPP - Idaho Chemical Processing Plant ICDB - Instrument Calibration Database IFR - Individual Failure Rates INEL - Idaho National Engineering Laboratory MIPS - Maintenance, Inventory, and Procurement System MTTF - Mean Time To Failure MU - Make-up NWCF - New Waste Calciner Facility PRA - Probabilistic Risk Assessment ROVER - Remote Operated Vehicle Experimental Reactor SA - Safety Assessment SAR - Safety Analysis Report SRL - Savannah River Laboratory TR - Transfer TS/S - Technical Specification/Standard TS/SD - Technical Specification/Standard Demand UOR - Unusual Occurrence Report WSRC - Westinghouse Savannah River Company
ICPP-FRD.R0/08-23-95/SA ii

1. INTRODUCTION
This report represents the first major upgrade to the Idaho Chemical Processing Plant (ICPP) Failure Rate Database.1 This upgrade incorporates additional site-specific and generic data while improving on the previous data reduction techniques. In addition, due to a change in mission at the ICPP, the status of certain equipment items has changed from operating to standby or off-line. A discussion of how this mission change influenced the relevance of failure data also has been included.
This report contains two data sources: the ICPP Failure Rate Database and a generic failure rate database. A discussion is presented on the approaches and assumptions used to develop the data in the ICPP Failure Rate Database. The generic database is included along with a short discussion of its application.
A brief discussion of future projects recommended to strengthen and lend credibility to the ICPP Failure Rate Database also is included.
ICPP-FRD.R0/08-23-95/SA 1
2. PURPOSE
Most failure rate and failure probability data published are derived from nuclear power plant failure data. When faced with no alternative, this data may be used in support of probabilistic risk assessments (PRAs), safety analysis reports (SARs) and safety assessments (SAs) at facilities quite different from a nuclear power plant. However, if site-specific failure data exists, then the development and use of site-specific failure rates and failure probabilities is preferred. This report presents failure rates for the ICPP.
The ICPP Failure Rate and generic databases were developed to ensure that the probabilities and failure rate data used in site-specific PRAs, SARs and SAs are technically justifiable and supported by adequate documentation.
ICPP-FRD.R0/08-23-95/SA 2
3. METHODOLOGY
This section discusses the methodologies used in developing the ICPP Failure Rate Database and criteria for selecting the generic database. Miscellaneous studies that augment the database development process are also discussed.
3.1 THE ICPP FAILURE RATE DATABASE
The following is a discussion of the approaches and assumptions used in estimating the site-specific failure rates, failure probabilities, and human-error probabilities for the ICPP Failure Rate Database. These include identifying equipment item failures, time frames of interest, number of component types of interest, and estimating mission times. Throughout this section, "equipment item" signifies an individual item (e.g. P-PM-101, AG-NCC-320) and "component type" indicates a group of equipment items (e.g., pumps, agitators).
3.1.1 Data Collection
The first step in developing the fractional failure rates for the failure rate database was to identify component types for which failure rates were needed. Fractional failure rates are defined as the fraction of the total population failing during a given time interval. Discussions with safety analysts identified the most common component types used in PRAs. A study of past. PRAs identified still more component types for which failure rates were desired.2
The second step involved identifying a time frame or "window" for review of the failure data. Care was taken to establish a correct time frame because an overly large window would incorporate failures of equipment and instruments that have since been upgraded to a more reliable form. Likewise, a window that is too small would reduce the number of failures observed and would introduce statistical uncertainty into the resulting failure rate due to sample size. The identification of the window for the review of data is closely related to estimating the
ICPP-FRD.R0/08-23-95/SA 3

equipment operational time. Both areas are addressed later in this report.
The third step involved screening the available data sources to identify failure events. Equipment item and instrument failures were identified through several sources:
1) Maintenance work order records 2) Instrument calibration data sheets 3) Unusual Occurrence Reports (UORs) 4) Critique reports 5) Discussions with maintenance and operations staff.
ICPP maintenance work orders were accessed electronically through the Maintenance, Inventory, and Procurement System (MIPS), which is a database, stored on a Hewlett-Packard (HP) 3000 computer, that is used for ICPP maintenance management. The MIPS database contains records of all ICPP maintenance activity from 1985 to the present. The failure reports generated from the MIPS database are carefully scrutinized to separate failed equipment items from equipment items requiring other maintenance attention such as a preventive maintenance inspections. These tasks yield the total number of equipment items failing during the chosen time period.
The instrument calibration data sheets are accessed through another database on the ICPP production server called the Instrument Calibration Database (ICDB). The ICDB contains records of all instrument drifts (out-of-tolerance) and failures from 1985 to the present for all Group I, II, and III instruments. Group I instruments perform a primary role in monitoring and controlling safety parameters to adhere to technical specifications/standards (TS/S). Group II instruments are those instruments whose failure or inaccuracy will not lead to violation of TS/S but are judged important for the protection of employees, the general public, or the physical plant. Group III instruments are those have little or no safety or economical significance but may affect the efficiency of operations.3 As with the maintenance work orders, instrument calibration data sheets from before 1985 can be viewed on
ICPP-FRD.R0/08-23-95/SA 4

microfilm. Only Group I instruments are investigated because failure or excessive drift of Group I instruments poses the greatest threat to the safety of any ICPP operation.
UORs, critique reports, and discussions with maintenance and operations staff are used to supplement or clarify the information obtained from the instrument and equipment databases.
In early studies, component type and instrument failures were identified for three major operating facilities: The Extraction Facility (CPP-601 and -602), the New Waste Calcining Facility (CPP-659), and the Fluorinel Dissolution Process and Fuel Storage Facility (CPP-666). Each of these facilities was reasoned to contain asufficiently different environment to warrant calculating separate failure rates for each facility. However, several years of study have indicated that the environments are not sufficiently different to warrant separate calculation of failure rates. Consequently, the failure rates reported are for all three facilities combined, calculated by combining raw data.
The fourth step in developing the fractional failure rate was to identify the total number of instruments or equipment items in existence in the facilities under study at the ICPP. Three databases, one for equipment, one for instruments, and one for valves, are maintained. The equipment and valve databases contain obsolete information, and require extensive review to separate the equipment items not in existence from those equipment items currently being used. The equipment items are grouped into categories related to the item's function. Once the equipment items have been categorized, the total number of equipment items are extracted from the equipment, instrument, and valve databases.
The last parameter to estimate is the individual equipment item mission time during which the failures were observed. Because equipment item failures are gathered for the three major facilities (CPP-601 and -602, CPP-659, and CPP-666), operating times for each of these facilities are of interest. Plant operation logs document the total time that the various facilities were operating. In the infancy of the database, estimates were obtained for the percentage of facility operating time
ICPP-FR0.R0/08-23-95/SA 5

that the equipment item was operated. This mission time estimate resulted in inaccurate estimates of the fractional failure rate because during plant operation many of the equipment items, although not running, are exposed to the same harsh conditions as if they were operating.
For this reason, the estimated time the equipment item was operated was changed to 100% of the time the facility was operated. This estimate failed to take into account sweep down and decontamination activities that occurred between operating periods. Consequently, the estimate for the mission time was changed to calendar time during which the failure data were collected.
The operational status of the plant during the prior calculations was always considered to contain significant amounts of operational activity. This activity subjected equipment items to operational or near operational conditions nearly all the time. Recently, portions of the ICPP have been placed in an off-line or stand-by status. This results in significant amounts of time during which equipment items are not subjected to operational conditions. Therefore, the mission time is selected to be the time between the first and last observed failure in a group of component types (e.g., agitators, airlifts, etc.).
3.1.2 Calculation of the Fractional Failure Rates
The following discussion covers the equations, assumptions, and approaches used to calculate the fractional failure rates reported in the ICPP Failure Rate Database (table 1). Appendix A provides the definitions of the variables used in the calculation of the fractional failure rates. Appendix B provides the facility operating times. All values and intermediate calculations involved in developing the fractional failure rates and error factors or dispersion factors are shown in appendix C. A sample of the calculational method used in the development of the failure rates is given in this report.
Once the failure data has been subgrouped to yield the failure events of interest, it is possible to estimate fractional failure rates and the uncertainty bounds. The analysis presented here is general and
ICPP-FRD.R0/08-23-95/SA 6

may be used for any subgroupings, even those that have no failures during the test period. The uncertainty bounds of those component types with no failures during the test period are calculated by using a Bayesian approach. In the following derivation, X refers to Model I, X refers to Model II, X is the adjusted value being reported and X is a true value.
When subdividing the failure data (e.g., environment, failure and mode), care must be used to avoid too small of a sample size. Excessive subdivision dilutes the data and may lead to large uncertainties. If the uncertainty is too large, it may dominate the fault tree or probabilistic analysis and yield useless results.
Examination of the failure data reveals that one or more equipment items usually failed more than once during the test period. After the failure, the equipment item is repaired in a relatively short time compared to the mean time to failure (MTTF). As soon as the equipment is repaired to a nearly new condition, it is placed back into service. Because the equipment can be repaired and placed back into service in a small amount of time, compared to the MTTF, the total number of equipment items in operation remains essentially a constant.
The technique discussed is for estimating the MTTF of component types that fit the real life scenario of failure, repair, and replacement with Type I censoring. Type I censoring is the observation of failures during a specified period of time sometimes called time interval data. The failures of equipment items are assumed to be independent and random. The assumption of a Poisson distribution, given in equation (1), is used to estimate the true fractional failure rate. An estimate can then be calculated because the failure rate (X) for the Poisson distribution is assumed to be constant.
P(x) = P* f"", x = 0, 1, 2, ... (1)
Using the Poisson distribution and \i = Xt, the only parameter required to be estimated is the mean fractional failure rate, X. Rather than estimate the fractional failure rate directly, an estimate for the
ICPP-FRD.R0/08-28-95/SA 7

fractional failure rate is calculated by estimating the MTTF. For Type I censoring with replacement, equation (2) provides an estimate for the MTTF and the fractional failure rate.
MTTF = ^ = 1 (2) n A
In equation (2) n is the number of failures observed during the test period (mission time), t and N is the total number of equipment items in service. The combination of N and t is considered to be the total exposure time or total equipment time, t. For a Poisson distributed random variable, X, the distribution mean (p.) and variance (CT 2) are the same, p, = o 2 = Xt. This point estimate can be used in probabilistic analyses as an estimate of the true fractional failure rate. At this point an examination of the accuracy of the estimated fractional failure rate must be conducted.
MODEL I The estimated standard deviation of the Poisson distributed random
variable is simply J£ t , and the estimated standard error (§) of the estimated mean fractional failure is given by equation (3). 5
g = v7* t = A/5 (3) t N t*
The standard error is an appraisal of the uncertainty of the estimated mean fractional failure rate. In probabilistic analyses, the potential exists for having equipment items that may originate from any segment of the population. Therefore, it is necessary to estimate the confidence intervals of the underlying distribution of failure rates for the equipment items.
Bain and Engelhardt6 provide a formula for the l00y% confidence interval of a Poisson distribution based on the %2 distribution.6
Studies at the ICPP traditionally use Y = 90%. Estimates for the upper and lower 90% confidence limits can be found using a Bayesian adjustment, calculated by equation (4) where (2n + 1) is the %2 degrees of freedom.
ICPP-FRD.RO/08-23-95/SA 8

%g.05(2i3 + 1) 2t
(4) Xo.95(2i3 + 1)
2t Equation (4) can be used to calculate the 90% confidence limits for
any number of observed failures including zero. For individual equipment items with no failures, the 50th percentile or median of the %z
distribution can be used as an estimate for the mean fractional failure rate.
? Xo.5o(D _ 0.455 _ 0.23 (x\
For equipment items with a large number of failures (n > 30), upper (p = .95), lower (p = .05), and median (p = .50) values of the %2
distribution can be estimated using equation (6). 7
Xl =1/2 U p + V2v - l ) 2 (6) where z is the corresponding percentile to the standard normal distribution and v = 2 n + 1, the %2 degrees of freedom.
This method was used to estimate the mean fractional failure rate and the confidence limits for each individual equipment item within a component types or instrument group. The data was then pooled and an estimate for the mean fractional failure rate and the confidence limits were calculated for the component type or instrument group. The confidence limits of the pooled data model the random variation in the number of observed failures assuming that there is no difference between equipment items in a component type or instrument group. A dispersion factor for this distribution can be calculated using equation (7). A dispersion factor is an alterative measure to the variance of a distribution and is only applicable to distributions exclusively containing nonnegative values.
ICPP-FRD.R0/08-23-95/SA 9

D F * = V 4* (7)
MODEL II Estimating the variation between equipment items in a component
type was accomplished by calculating the sample arithmetic mean (X) and variance (s2) of the individual equipment items' estimated mean fractional failure rates. Assuming that the failure rates are lognormally distributed and that X is the mean of the lognormal distribution, the calculated mean and variance can be transformed into their lognormal counterparts using equation (8). 8
C 2 = ln(l + • £ ) X2 (8)
n = InU) -V2C 2
Sufficient information is now available to obtain the measures of the variation between equipment items. Estimates for the upper and lower 90% confidence limits can be calculated using equation (9).
(9)
An error factor for the lognormal distribution modeling the variation between individual equipment item can be calculated using equation (10).
EF = e 1 - 6 4 5 z (10)
Neither model individually accounts for all the variations observed in the data. It is possible to combine the two models mathematically to account for the two types of variation modeled. This combination was accomplished by increasing the 90% confidence limits of the lognormal
ICPP-FRD.R0/08-23-95/SA 10

distribution obtained for the sample arithmetic mean and variance of the individual equipment items, and using equations (8), (9), and (10) to calculate the parameters (n, o 2, and EF) for an adjusted lognormal distribution. The error factor for the combined distribution is simply EF * DFf. The mean, variance, upper and lower limits, and error factor
derived using this method are presented in chapter 4. The upper and lower confidence limits are the end points of the 90% confidence interval, that is, the true value of the fractional failure rate falls between the upper and lower values with 90% confidence.
3.2 GENERIC DATA
In the development of most site-specific databases, the site-specific failure data will not yield all required failure rates and event probabilities. It becomes necessary to examine generic databases for many needed failure rates not supported by site-specific data.
The search for a generic database led to a Westinghouse Savannah River Company (WSRC) report9 that aggregates component type failure data from several sources into a recommended failure rate. However, this generic database cannot be considered a completely independent source of failure data because ICPP equipment failure data are included in the aggregate. The WSRC report examined several popular generic databases used by the nuclear industry to derive failure rates from component type failure data. The WSRC report presents "recommended" failure rates derived from several equipment failure databases because many of the equipment failure databases contain several different failure rates under the same component type heading. Data considered useful to the ICPP were extracted from the WSRC report and are shown in appendix D.
3.3 MISCELLANEOUS STUDIES
Approximately 90% of the data in the ICPP failure rate database are generated from studies performed at the ICPP. This translates into 14 of the 27 database references as shown in the event database. Two of these references concentrate efforts on developing failure rates for many of
ICPP-FRD.R0/08-23-95/SA 11

the component types and instrument groups at the ICPP. 1 0' 1 1 This section focuses on 11 of the remaining studies and provides a brief discussion of each study. A discussion of the statistical approach used in each report will not be presented because, in general, the approaches are straight forward and much less cumbersome than the approach previously discussed.
Technical Specification/Standard Violation Report.12 This study calculates the human error rates associated with Technical Specification/ Standard (TS/S) violation at the ICPP. TS/S define the safety envelope (operating limits, conditions, and requirements) in which the processes and facilities of the ICPP should be operated to ensure the health and safety of the public and operating personnel. TS/S violations were obtained for the period from 1981 to 1989 from UORs. To determine the human error rate associated with a TS/S violation, an estimate must be made for the number of demands on a TS/S. This estimate was obtained by interviewing 17 operators. Each operator was asked to estimate the number of times/day a TS/S task must be carried out. This number, when converted to the appropriate units and multiplied by the total operating hours of the facility, yields an estimate for the number of times that a TS/S task has been carried out. Dividing this number into the total number of TS/S violations yields the human error rate associated with a single TS/S violation. Three different error rates are obtained from this study: 1) The rate of a human error resulting in a TS/S violation
(1.0E-3 /demand) 2) The rate of a human error resulting in a TS/S violation given
that a second person is present to verify the actions of the first person (1.0E-4 /demand)
3) The rate of a TS/S violation leading to a significant criticality barrier violation (3.1E-5 /demand).
Power Outage Study.13 This study calculates the frequency of loss of off-site power to an ICPP facility for more than half an hour to be 1.4E-2/y. In addition, this study calculated the loss of an uninterruptible power source (UPS) to be 2E-2/y. This study was
ICPP-FRD.R0/08-23-95/SA 12

the planned followup to the "Power Outage Frequency for the ICPP" report14 cited in WIN 330. The number of off-site power losses during the period 1982-1990 were collected by reviewing UORs.
Report on Chemical Makeup Errors.15 Proper chemical makeup and adjustment helps protect against a criticality at the ICPP. Therefore, during January of 1987 a human factors study was performed to determine a probability for chemical makeup errors at the ICPP. This study concluded that an error rate of 2E-2 per chemical makeup should be used.
Maintenance Error Controversy.16 The scope of this study was to develop error rates for calibration and maintenance errors. This study focused on the perceived difference between the Department of Defense (DOD) and the Department of Energy (DOE). A study of DOD data led to a failure rate of 1E-1 for maintenance error as typical. The DOE used estimates for human failure rates of 1E-3. Because maintenance activities and calibration activities are often similar, the question arises as to the applicability of maintenance failure rates to calibration errors. The DOD value contained no credit for recovery (a person correcting his/her own error). Establishing this credit and accounting for different conditions at the ICPP, the following frequencies were derived:
Type of Error general maintenance work maintenance work recognized as consequential preventive maintenance and calibration of instruments maintenance work recognized as life threatening
* The mean value is calculated assuming a lognormal distribution.
CPP-601 Volume Measurement Error.17 This study calculates the error rate for a volume measurement error, with and without checking the measurement, at the CPP-601 facility. The CPP-601 facility extracts unused uranium from spent uranium fuel rods. The results of this study are important in accurately assessing the potential for a makeup with too little poison for a tank containing
ICPP-FRD.R0/08-23-95/SA 13
Mean* 2E-2 /d 2E-2 /d
Ranqe 6E-3 to 1E-1 3E-3 to 8E-2
2E-3 /d 1E-4 to 3E-2 3E-4 /d 1E-4 to 1E-3

U-235. This study reports an error rate of 2E-1 /transfer for a volume measurement error greater than 20% given a volume balance error. A volume balance error is defined as a failure to record the volume of a tank between transfers into or out of the tank. It also reports an error rate of 6.5E-2 /transfer for a volume measurement error greater than 20% given no volume balance error.
Data Analysis Study of Inadvertent Transfers.18 This study calculates the error rate for inadvertent transfer to be 1.5E-3 /transfer. The number of inadvertent transfers was compiled from UORs and critique reports between 1982 and 1986. An estimate was also obtained for the total number of transfers performed during this same time period. The error rate for an inadvertent transfer was calculated by dividing the number of inadvertent transfers by the number of total transfers made during the same time period. The study approaches the problem using both a classical approach (shown above) and a Bayesian approach.
Frequency of Plugging for Various Components.19 This study develops frequencies for the plugging of sample lines, airlifts, bubble probes, and jet lines. Incidents of plugging were obtained from plant personnel and MIPS. The following frequencies were calculated:
Plugging Component Frequency Airlifts 1.7E-0/y Probes 2.1E-l/y Jets 2.8E-3/y Sample lines 1.3E-l/y
Studies on Sampling/Analytical Errors.20 Proper sampling and analysis is a primary barrier against criticality at the ICPP. Therefore, sampling and analysis errors are a major concern. Currently, a error rate of 1E-2 /demand is assigned to a sampling/analytical error. This number is a general human error probability with no data proving that it is applicable to the sampling and analytical processes at the ICPP. Therefore, during January and February of 1987, two studies were performed to
ICPP-FRD.R0/08-23-95/SA 1 4

determine the error rate for a sampling or analytical error. Unfortunately, neither study resulted in a more applicable error rate than 1E-2 /demand. However, many points discussed in the studies provided new insights into properly identifying and quantifying sampling and analytical errors.
Study of the Effects of Crane Related Failures at the ICPP.21
This study was accomplished to determine the frequency of crane-related failures at the ICPP. This study determined the frequency of crane-related failure based on the failure cause and on failure results. The study also presented the failure rates of cranes based on the two categories of crane types: mobile and facility. The failure rates calculated are given below.
Category Failure Rate All cranes 1.1E-05 /yr Facility cranes 1.0E-05 /yr Mobile cranes 7.1E-05 /yr Load drops 3.2E-06 /yr Other equip./mat. damage 4.2E-06 /yr Damage to crane 4.6E-06 /yr
ICPP-FRD.R0/08-23-95/SA 15
4. RESULTS
This database is divided into two databases: a failure rate database and an event database. The failure rate database, shown in table 1, presents the fractional failure rates calculated for the ICPP.
In table 1, the first column identifies the component type or instrument group (i.e., agitators, pumps, level loop, etc.). The "Failure Mode" column identifies the cause of the component type or instrument group mode of failure. In most cases, the mean fractional failure rate (X) reported is for all modes of failure. However, when supported by the data collected, other failure modes are identified. The "X" column records the mean fractional failure rate of the equipment or instrument component. The fractional failure rates are reported in units of h - 1. The "Exposure" column, which has been used in some ICPP failure rate database report formats, from the WIN-330 report has been deleted.22 A review of the fractional failure rates reported in WIN-330 did not support the assumption that increased failure rates result from an equipment item being subjected to hostile environments such as acid or radiation. In the development of PRAs for the ICPP, the mean fractional failure rate and mission time are used to calculate a mean probability of the occurrence of the basic events. These probabilities are assumed to be lognormally distributed. As a measure of dispersion, an error factor is utilized to calculate a confidence interval for the failure rate. The "Error Factor," when multiplied and divided by the median value, yields the upper and lower bounds, respectively, of the 90% confidence interval.
The event database, shown in table 2, reports event frequencies relevant to the ICPP. The information provided in this table is similar to the information provided in table 1, except that a "Reference" column has been added. The "Reference" column identifies the study or report that generated the failure rate. Also, the "Failure Mode" column has not been included in table 2 because some of the sources of this data were generated outside the ICPP and do not contain such information.
ICPP-FRD.R0/08-23-95/SA 16

Table 1 : ICPP Component Type and Instrument Group Fa i l i j re Rates Page 1 of 4
Component Type/ Instrument Group
Fa i lu re Mode % *» £F
Std Er ror
Agi tators A l l 9.79E-06 5.14E--06 6.48 1.23E-05 A i r l i f t s A l l 1.17E-05 6.04E--06 6.63 1.49E-05 Casks A l l 8.17E-05 2.48E-05 12.66 3.48E-05
Cranes All 1.16E-04 6.54E-05 5.79 3.92E-05 Elec t r i ca l 2.05E-05 1.23E--05 9.15 1.65E-05 L i f t 2.05E-05 1.04E-05 6.82 1.65E-05 Brakes 1.79E-05 9.13E-06 6.73 1.54E-05 Bridge 1.10E-05 3.92E--06 10.66 1.21E-05 Other 5.62E-05 3.28E--05 5.53 2.73E-05
F i l t e r s A l l 7.65E-06 3.41E--06 8.08 1.02E-05 Plug 4.32E-06 2.89E--06 4.38 7.67E-06 Leak 4.40E-06 3.10E--06 3.97 7.75E-06 Other 7.09E-06 3.14E--06 8.15 9.83E-06
Glovebox A l l 5.64E-05 2.08E--05 10.19 2.82E-05 Gloves 4.21E-05 1.34E-05 12.02 2.44E-05 Leak 8.68E-06 2.98E--06 11.08 1.11E-05 Other 1.88E-05 8.20E-06 8.35 1.63E-05
Hoist A l l 1.05E-05 3.49E--06 11.48 1.22E-05 Block 6.93E-06 2.63E--06 9.85 9.92E-06 Cable 6.81E-06 2.75E--06 9.17 9.83E-06 Hook 6.76E-06 2.86E-•06 8.64 9.80E-06 Other 7.64E-06 2.92E--06 9.80 1.04E-05
Hood A l l 4.92E-05 1.13E-05 16.86 4.97E-05 Heat Exchangers and Condensors All 9.33E-06 4.10E-06 8.24 1.13E-05
Leak 6.36E-06 3.15E--06 7.04 9.35E-06 Other 7.24E-06 3.13E--06 8.43 9.97E-06
Jets A l l 5.40E-06 2.84E--06 6.45 8.66E-06 Leak 4.16E-06 3.13E-06 3.47 7.60E-06 Plug 4.67E-06 2.87E-06 5.07 8.06E-06 Other 5.07E-06 2.80E--06 6.01 8.39E-06
Manipulators A l l 1.05E-04 5.19E-•05 7.07 3.71E-05 Boot 8.39E-06 4.06E-•06 7.26 1.05E-05 Cable 8.65E-06 4.58E--06 6.40 1.06E-05 Grip 1.57E-05 6.40E--06 9.03 1.43E-05 Motion 1.71E-05 8.28E--06 7.27 1.50E-05 Fai l to Run 9.30E-06 4.05E--06 8.34 1.10E-05 Tong 6.42E-06 3.89E--06 5.19 9.17E-06 Wrist 8.62E-06 5.07E--06 5.45 1.06E-05 Other 5.42E-05 2.22E--05 9.02 2.66E-05
ICPP-FRD.R0/08-23-95/SA 17

Table 1: (Contd.) ICPP Component Type and Instrument Group Failure Rates Page 2 of 4
Component Type/ Instrument Group
Failure Mode % ^ £F
Std Error
Pumps A l l 2.39E-05 1.05E-05 8.24 1.78E-05 Charge 5.06E-06 2.03E-06 9.25 8.21E-06 Leak 5.95E-06 3.29E-06 6.00 8.89E-06 Oi le r 5.16E-06 2.26E-06 8.27 8.28E-06 Plug 4.84E-06 2.25E-06 7.68 8.02E-06 Fai l to Run 4.97E-06 2.28E-06 7.81 8.13E-06 Other 1.63E-05 7.48E-06 7.76 1.47E-05
Sampler Sys A l l 1.04E-05 4.80E-06 7.70 1.19E-05 Plug 5.42E-06 2.96E-06 6.10 8.59E-06 Needle 5.16E-06 2.87E-06 5.95 8.39E-06 Other 8.58E-06 4.15E-06 7.25 1.08E-05
Valves A l l 1.03E-06 5.60E-07 6.18 3.63E-06 Leak 2.52E-07 7.59E-08 12.80 1.79E-06 Plug 6.58E-08 8.38E-09 28.22 9.17E-07 Other 7.53E-07 3.65E-07 7.24 3.10E-06
Gate All 3.61E-06 2.69E-06 3.53 6.79E-06 Leak 3.22E-06 2.88E-06 2.19 6.42E-06 Plug 3.26E-06 2.91E-06 2.19 6;46E-06 Other 3.46E-06 2.73E-06 3.09 6.65E-06
Ball A l l 4.30E-06 2.77E-06 4.66 7.41E-06 Leak 3.43E-06 2.71E-06 3.08 6.61E-06 Plug 3.28E-06 2.89E-06 2.29 6.47E-06 Other 3.98E-06 2.67E-06 4.34 7.13E-06
Globe A l l 4.02E-06 2.49E-06 4.99 7.16E-06 Leak 3.48E-06 2.80E-06 2.95 6.67E-06 Plug 4.98E-06 2.93E-06 5.44 7.98E-06 Other 3.88E-06 2.54E-06 4.54 7.04E-06
Solenoid A l l 3.88E-06 2.90E-06 3.50 7.04E-06 Leak 2.62E-05 2.94E-06 31.26 1.83E-05 Plug 2.62E-05 2.94E-06 31.26 1.83E-05 Other 3.88E-06 2.90E-06 3.50 7.04E-06
Misc A l l 1.01E-05 7.10E-06 3.99 1.14E-05 Leak 5.23E-06 2.94E-06 5.84 8.17E-06 Plug 4.41E-06 2.58E-06 5.49 7.51E-06 Other 8.07E-06 5.41E-06 4.35 1.02E-05
Needle A l l 4.57E-06 2.61E-06 5.71 7.64E-06 Leak 4.08E-06 2.87E-06 3.99 7.22E-06 Plug 2.62E-05 2.94E-06 31.26 1.83E-05 Other 4.50E-06 2.45E-06 6.14 7.58E-06
ICPP-FRD.R0/08-23-95/SA 1 8

Table 1: (Contd.) ICPP Component Type and Instrument Group Failure Rates Page 3 of 4
Component type/ Instrument Fail tire , firoup Hode E¥
$td. Error
OV
Butterfly
Three-way
Ventilation
Vessels
Unit Heaters
Window, Cell
All 7.18E-06 3.53E-06 7.12 9.58E-06 Leak 4.91E-06 2.70E-06 6.04 7.92E-06 Plug 5.87E-06 2.91E-06 7.04 8.66E-06 Other 6.11E-06 3.04E-06 6.97 8.83E-06 Al l 8.10E-06 4.95E-06 5.11 1.02E-05 Leak 5.06E-06 3.15E-06 4.97 8.04E-06 Plug 2.62E-05 2.94E-06 31.26 1.83E-05 Other 6.74E-06 4.10E-06 5.16 9.28E-06 Al l 6.11E-06 3.42E-06 5.88 8.83E-06 Leak 2.62E-05 2.94E-06 31.26 1.83E-05 Plug 4.68E-06 2.87E-06 5.09 7.73E-06 Other 5.81E-06 3.21E-06 5.99 8.62E-06 All 2.42E-05 1.22E-05 6.92 1.80E-05 Belt 6.53E-06 2.94E-06 7.98 9.32E-06 Leak 5.24E-06 2.66E-06 6.78 8.35E-06 Rotor 5.94E-06 2.83E-06 7.42 8.88E-06 Fail to Run 6.24E-06 2.71E-06 8.36 9.11E-06 Other 1.57E-05 7.70E-06 7.15 1.45E-05 Al l 6.70E-06 2.23E-06 11.48 9.34E-06 Leak 3.81E-06 2.80E-06 3.63 7.04E-06 Plug 3.94E-06 2.58E-06 4.55 7.16E-06 Other 6.04E-06 2.13E-06 10.75 8.86E-06 Al l 1.09E-05 4.81E-06 8.25 1.19E-05 Leak 5.03E-06 2.75E-06 6.08 8.45E-06 Plug 5.23E-06 2.27E-06 8.38 8.61E-06 Other 9.38E-06 3.95E-06 8.71 1.15E-05 Al l 1.22E-05 5.30E-06 8.34 1.41E-05
ICPP-FRD.R0/08-23-95/SA 19

Table 1: (Contd.) ICPP Component Type and Instrument Group Failure Rates Page 4 of 4
Component Type/ Instrument Group
Fa i lu re Hode X ^ £F
Std I r r o r
Analysis Loop D r i f t 3.67E-05 2.35E-05 4.70 3.50E-06 Fail 1.47E-05 8.75E-06 5.33 2.22E-06
Density Loop D r i f t 2.81E-05 2.31E-05 2.78 2.47E-06 Fail 1.13E-05 7.83E-06 4.09 1.57E-06
D i f f Press D r i f t 1.75E-05 1.34E-05 3.32 3.19E-06 Fai l 1.41E-05 8.92E-06 4.85 2.86E-06
Flow, Gas D r i f t 4.04E-05 3.13E-05 3.24 6.29E-06 Fai l 2.73E-05 1.39E-05 6.77 5.17E-06
Flow, Liquid D r i f t 3.22E-05 1.64E-05 6.78 1.09E-05 Fail 3.26E-05 2.16E-05 4.44 1.10E-05
Level Loop D r i f t 5.05E-05 3.50E-05 4.09 4.75E-06 Fail 8.93E-06 5.73E-06 4.70 2.00E-06
Pressure D r i f t 2.28E-05 1.80E-05 3.10 6.79E-06 Fai l 1.71E-05 6.25E-06 10.33 5.88E-06
Pulse D r i f t 4.97E-05 2.58E-05 6.58 1.94E-05 Fail 3.58E-05 8.08E-06 17.08 5.96E-03
Radiat ion, C r i t i c a l i t y D r i f t 5.60E-05 4.69E-05 2.66 4.74E-06 Fail 2.26E-05 1.50E-05 4.45 3.01E-06
Radiation, General D r i f t 3.82E-05 2.32E-05 5.19 3.02E-06 Fail 3.80E-05 3.39E-05 2.19 3.01E-06
Temp Loop D r i f t 2.39E-05 1.73E-05 3.76 4.56E-06 Fail 2.24E-05 1.42E-05 4.77 4.41E-06
Vibrat ion Loop D r i f t 5.00E-05 3.37E-05 4.32 1.12E-05 Fail 3.11E-05 1.27E-05 9.07 8.83E-06
ICPP-FRD.R0/08-23-95/SA 20

3
CO i
CO en •»» in >>
ro
Table 2. Event Frequencies JMHmilMWH'IMIHlWWHimTW ™?^r^r
and Probabilities Page 1 of 2
, "i \%\^ ••
LI™ -fttmt , , k „ k . „ k u „ , , m „
>*\s Fi ftJre-'itetes * i\ ^ s Facte** N - 'itef^M Airlifts - Plug Chemical Makeup Errors (Conservative) Crane, Load Drop Earthquake (0.24g @ surface) Earthquake (0.18g @ surface) Earthquake (0.13g @ surface) Extreme Wind (70 mph) Extreme Wind (84 mph) Extreme Wind (95 mph) Fire Protection System (supervised, DB) Fire Protection System (unsupervised, DB) Flood (Elevation 4916.6 flood crest) Human Error-TS/S Violation3 (best two-man) Human Error (Error of Commission) Human Error-TS/S Violationb (best one-man) Human Error (Error of Omission) Human Error (Second man checker) Inadvertent Transfer (All types, historical) Inadvertent Transfer (Uranium bearing, current) Instrument Probe - Plug Instrument Calibration and Preventative Maintenance Error Jets - Plug
a Verification by second man required. b Verification by second man not required.
1.70E+00 /year 19 2.00E-O3 /MU 15 3.23E-06 /hour 1.4 21 1.00E-04 /year 5.0 23 5.00E-04 /year 2.0 23 1.70E-03 /year 3.0 23 1.25E-03 /year 26 3.30E-04 /year 26 3.30E-05 /year 26 2.00E-03 /demand 25 5.00E-02 /demand 25 1.00E-04 /year 26 1.00E-04 /demand 2.0 12 3.00E-03 /demand 31 1.00E-03 /demand 2.0 12 1.00E-02 /demand 31 1.00E-01 /demand 31 1.50E-03 /Tranfer 2.0 18 4.00E-05 /Tr 2.0 18 2.40E-05 /hour 19 2.00E-03 /demand 1.5 18 2.80E-03 /year 19

o "O -a i
§ Table 2. (Contd.) Event Frequencies and Probabilities § Page 2 of 2 o 00
£ V"' ' \ - '"- .. ' 'gVwit; ' - .-.. . : * V F^lUr^ifatw>" :- .'-' factor ^ J'- Ref- • m ~ ' ***~ Level/Density Probe, Process Vessel [H-Canyon, Savannah 4.30E-04 /hour 27
River Laboratory (SRL)] Loss of Normal Power l.OOE+00 /year 13 Loss of Stand-by Power 5.00E-01 /year 13 Loss of UPS Power 4.00E-02 /year 13 Maintenance, Life Threatening 3.00E-04 /demand 3.0 16 Maintenance, General 2.00E-02 /demand 5.0 16 Maintenance, Consequential 2.00E-02 /demand 4.0 16 Sample Line - Plug 1.30E-01 /year 19 Sample Error, Process Operations l.OOE-05 /Sample 28 Sample Error - CPP (conservative) 1.00E-02 /Sample 20 Significant Criticality Safety Violation 3.10E-05 /TS/SDC 12 Sump Monitor - Plug (SRL) 2.00E-04 /hour 29 Sump Monitor - Unavailability 2.00E-03 /hour 29 Tornado > 1.00E-06 /year 30 Volcano on Snake River Plain »1.00E-05 /year 24 Vol. Measurement Err >20% (With Vol . Bal . Err.) d 2.00E-01 /Tr 17 Vol. Measurement Err >20% (No Vol. Bal. 1 Err.) e 6.50E-02 /Tr 17
c Technical Specifications/Standards Demand d Volume measurement not taken between solutions being transferred either into or out of a tank. e Volume measurement taken between solutions being transferred either into or out of the tank.

The event database is a collection of data compiled from 21 sources. Fourteen of these 21 sources are the result of reports generated at the ICPP. These 14 reports make up more than 70% of the data in the event database. The remaining 30% of the data is gleaned from the seven studies generated outside the ICPP. Safety analysts familiar with the operation of the ICPP assisted in the selection of external reports with information applicable to the ICPP failure rate databases.
ICPP-FRD.R0/08-23-95/SA 23
5. RECOMMENDATIONS
The work to improve and validate this database needs to be continually updated. Many databases become stagnant because the information within the database is either outdated or unreliable. To prevent this from happening, several actions must be taken. One is to perform an annual or biannual review of new site-specific failure events. This review ensures that the database is maintained as a living document. Secondly, standard, past approaches or philosophies concerning data-gathering techniques and calculations cannot be accepted over the long-term. A periodic check should be made of assumptions used in performing past studies that contributed data to the database. New insights and better data collection techniques may be in existence.
Also, the database should be shared outside the ICPP with other sites that have chemical processing environments. This will increase the use of the database, and provide justification for administrative and financial support for future database developments.
The role of the ICPP failure rate database is to provide technically accurate and defendable data to be used in PRAs performed at the ICPP and similar facilities. With this in mind, the following projects are recommended as future activities.
Assumption Verification. Several assumptions are made in the derivation of the statistical model employed to develop the fractional failure rates. These assumptions should be investigated, especially the assumption that a component type will follow a lognormal failure distribution. The selection of the distribution used to model the upper and lower confidence can have a significant effect on the error factor or dispersion factor calculated.
Error Factors. The traditional assumption of a lognormal distribution has led most analysts to become accustomed to reporting failure rates with an associated error factor. The conventional definition of the error factor has limitations in its applicability to distributions other than the lognormal distribution.
ICPP-FRD.R0/08-28-95/SA 24

Drift Identification. In many PRA applications, the availability of an instrument is desired. Unfortunately, for most applications, the availability is calculated by assuming the instrument drifts out-of-tolerance at half the calibration interval and remains out-of-tolerance for the remainder of the calibration interval.
Mi sealibration. One of the most difficult parameters to estimate is the contribution of human error to the overall compromise of a system. Accurate estimation of the human error probability (HEP) is the basis for a study.
Analytical Errors. Sampling a process at critical points is often a primary barrier against accidents and releases in processing systems and nuclear facilities. Therefore, the failure to correctly sample is a key issue in any probabilistic analyses.
Most reports generated at the ICPP and used for information in the event database are becoming old and possibly outdated. Efforts should continue to review and update each of these studies.
As much as possible, the ICPP Failure Rate Database is intended to be a defendable source of reliable data. Although application of this data is primarily concentrated at the ICPP, use outside of the ICPP could be of benefit, especially to those facilities with environments similar to those found at the ICPP.
Also, the ICPP Failure Rate Database is intended to be a living database. New information will be added and old information will be discarded periodically. This will ensure that the failure rates and failure probabilities are representative of current technology and expertise.
ICPP-FRD.R0/08-23-95/SA 25

6. REFERENCES I. J. N. Wilkinson, et al., Idaho Chemical Processing Plant Failure Rate
Database, Idaho National Engineering Laboratory, WIN-330, October 1991.
2 G. J. Poulos, GJP-01-90, to J. R. Wilson, "ICPP Equipment Failures," dated July 27, 1990.
3 Westinghouse Idaho Nuclear Company, Inc., Standard Operating Procedure, WE-3, Calibration Program, July 18, 1994.
4. E. E. Lewis, Introduction to Reliability Engineering, John Wiley & Sons, New York, 1987.
5. M. E. Engelhardt, Events in Time: Basics Analysis of Poisson Data, EGG-RAAM-11088, September 1994.
6 Lee J. Bain and Max Engelhardt, Introduction to Probability and Mathematical Statistics. PWS-Kent, Boston, 1992.
7 B. W. Lindgren, Statistical Theory, MacMillian Company, New York, 1968.
8 Alfredo H-S. Ang and Wilson H. Tang, Probability Concepts in Engineering Planning and Design, Volume I-Basic Principles, John Wiley and Sons, New York, 1975.
9. C. H. Blanton and S. A. Eide, Savannah River Site Generic Data Base Development. WSRC-TR-93-262, June 1993.
10. P. P. Lowry, PPL-1-90, to J. R. Wilson, "Transmittal of Equipment Fractional Failure Rates Study III," dated April 25, 1990.
II. J. N. Wilkinson, JNW-4-89, to J. R. Wilson, "Annual Update of Fractional Failure Rates for Group I Instruments," dated April 25, 1990.
12. J. R. Wilson, JRW-2-91, to N. C. Olson, "Transmittal of TS/S Violation Report," dated March 5, 1991.
13. J. R. Wilson, JRW-5-93, to L. H. Frauenholz, "ICPP Power Outage Study," dated May 21, 1993.
14. J. R. Wilson, JRW-16-87,to R. D. Bradley, "Power Outage Frequency for the ICPP," dated April 1, 1987.
15 J. R. Wilson, JRW-2-87, to R. D. Bradley, "Transmittal of Report on Chemical Make-up Errors (R & D) Project," dated January 6, 1987.
16. J. R. Wilson, JRW-22-86, to R. D. Bradley, "State of Maintenance Error Controversy (R and D project)," dated December 31, 1986.
17. B. J. Harwood, BJH-01-88, to J. R. Wilson, "CPP-601 Volume Measurement Error (R and D project)," dated March 23, 1988.
ICPP-FRD.R0/08-23-95/SA 26

18. J. R. Wilson, JRW-23-85, to R. D. Bradley, "Transmittal of Data Analysis Study of Inadvertent Transfers (R and D Project)," dated December 31, 1986.
19. J. N. Wilkinson, JNW-3-89, to 0. R. Wilson, "Update of Frequency of Plugging Various Instrument and Equipment Items," dated June 8, 1989.
20. J. R. Wilson, JRW-9-87, to R. D. Bradley, "Transmittal of Human Factors Report on Sampling and Analytical Processes ( R & D Project)," dated February 10, 1987.
21 T. G. Alber, TGA-02-94, to J. R. Wilson, "Study of Crane Related Failures at the Idaho Chemical Processing Plant," dated September 20, 1994.
22 T. G. Alber, TGA-03-94, to J. R. Wilson, "Review of Environmental Effects on Equipment Fractional Failure Rates," dated December 1, 1994.
23 D. W. Coates and R. C. Murry, Natural Phenomena hazards Modeling Project: Extreme Seismic, Wind/Tornado Hazard Models for Department of Energy Sites. UCRL-53526, Revision 1, dated August 1985.
24 Assessment of Potential Volcanic Hazards for New Production Reactor Site at the Idaho National Engineering Laboratory. UCRL-ID-104722, Volcanism Working Group, Lawrence Livermore National Laboratory, dated October 1990.
25 M. J. Miller, "Reliability of Fire Protection Systems", Chemical Engineering Progress. Vol. 70, No. 4, dated April 1974.
26 Idaho Chemical Processing Plant Safety Analysis Report. INEL-94/022, Part I, Chapter 1, "Site Characteristics."
27. Systems Analysis-200 Area, Savannah River Plant, H-Canyon Operations, DPSTSY-200-1H, Savannah River Laboratory. Based on MTBF of 6 days for 160 probes. Evaporators No. 1 contributor, dissolvers/ion exchange next, and waste neutralization average.
28. W. C. Perkins, Freouencv Probability Evaluation of 200-Area Process Laboratory Errors, DPST-84-543, Savannah River Laboratory, dated October 16, 1984.
29. W. C. Perkins, et. al., Failure Rates for Liquid Level Detectors in F-Canvon Sumps. DPST-83-820, Savannah River Laboratory, dated September 8, 1983.
30 Natural Phenomena Hazards Design and Evaluation Criteria for Department of Energy Facilities, DOE-STD-1020-94, dated April 1994.
31. A. D. Swain, and H. E. Guttmann, Handbook of Human Reliability Analysis with Emphasis on Nuclear Power Plant Application. NUREG/CR-1278, USNRC, dated August 1983.
ICPP-FRD.R0/08-23-95/SA 27

APPENDIX A
ICPP-FRD.A/08-25-95/SA A-1
APPENDIX A DEFINITIONS
This appendix provides a brief description of the parameters and equations used to calculate the site-specific failure rates and error factors at the Idaho Chemical Processing Plant. The parameters in this appendix represent the minimum amount of raw data required before failure rates can be calculated using the procedures derived.
ICPP-FRD.A/08-25-95/SA A-2

APPENDIX A
DEFINITIONS
n = number of failures observed during the test period N = total number of equipment items (pop) operating during the test period t = mission time t = N t* = exposure time (x = the true distribution mean of a probability distribution a 2 = the true distribution variance p(x) = r ^ , x = 0, 1, 2, . . . = the Poisson prob. distribution function.
X = = the estimate for the true mean fractional failure rate.
g = & = Standard Error.
X . S c X n = Xp i 2 n * 1 } = 90% confidence limits for X. L u 2 t
DF%2 = x ^ ? = the dispersion factor of the x 2 distribution.
» = I i . = the sample mean fractional failure rate. N
s 2 = .2*—L_* L_ = the variance of the sample mean frational failure rate. N - 1
ICPP-FRD.A/08-25-95/SA A - 3
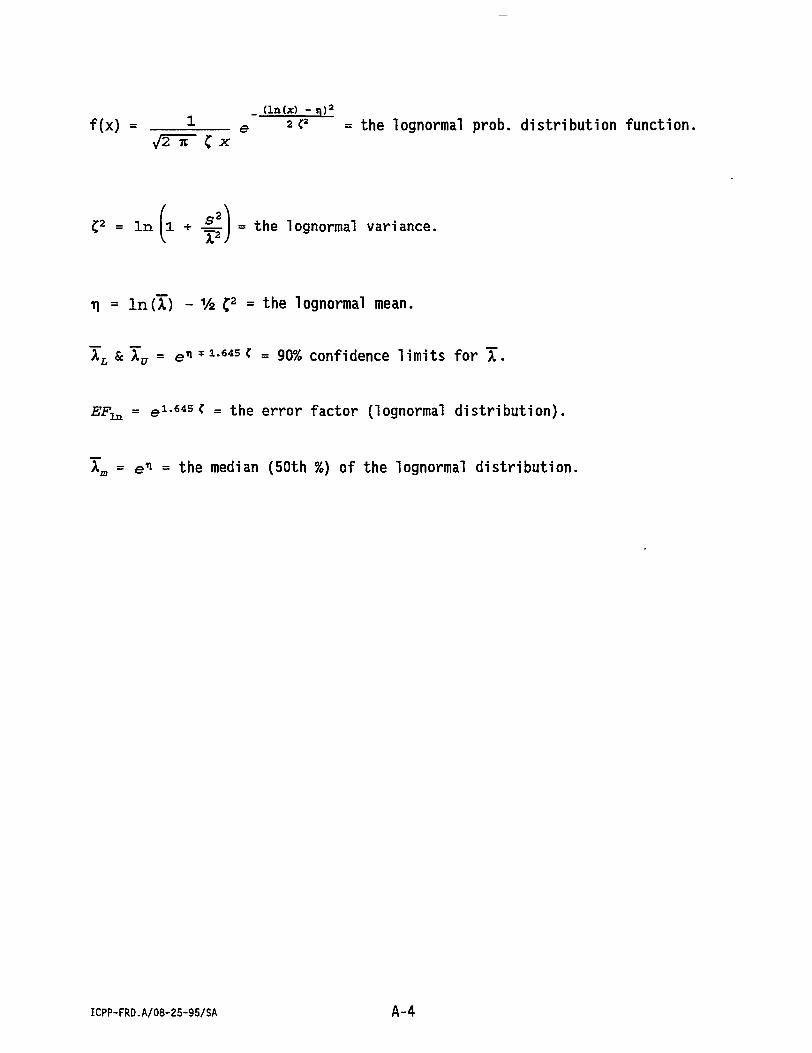
_ (lnU) -q) 2
f(x) = 1 e 2? 2 = the lognormal prob. distribution function.
C 2 = In ll + -l -j = the lognormal variance.
TI = ln(X) - V2 C 2 = t n e lognormal mean.
X r & X a = e^ * x- 6 4 5 c = 90% confidence limits for X .
EF-^ = ei.645 c = the error factor (lognormal distribution).
Xm = e n = the median (50th %) of the lognormal distribution.
ICPP-FRD.A/08-25-95/SA A-4

APPENDIX B
ICPP-FRD. B/08-25-95/SA B - 1

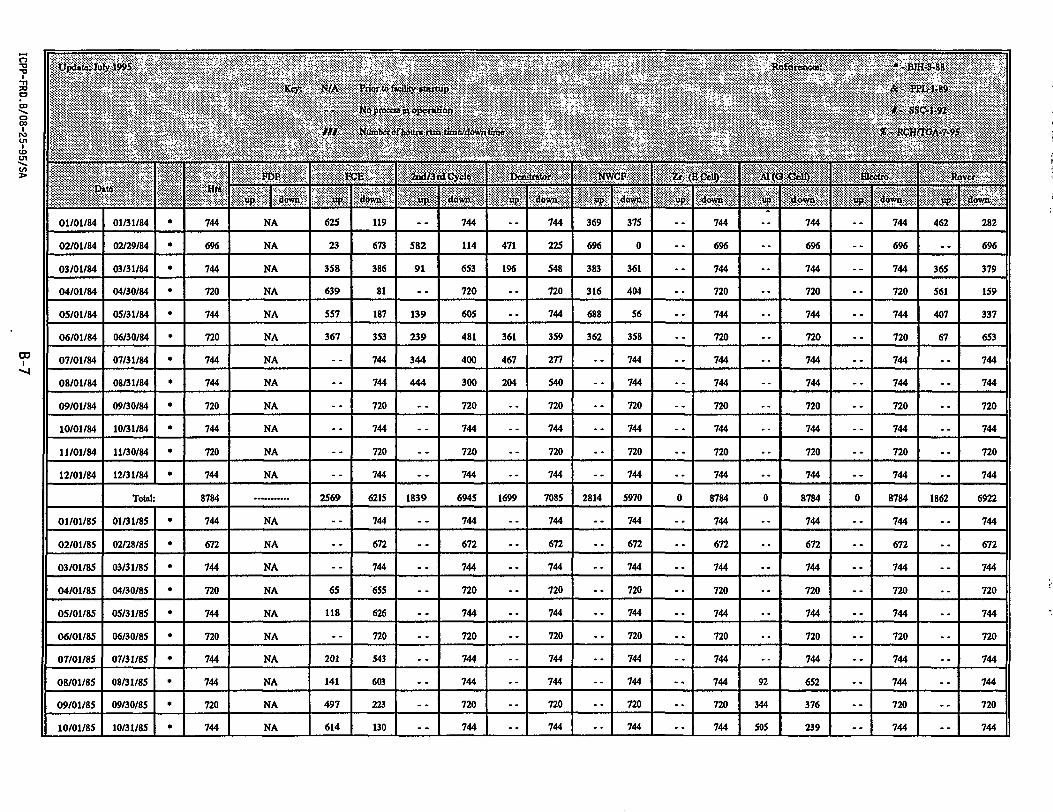
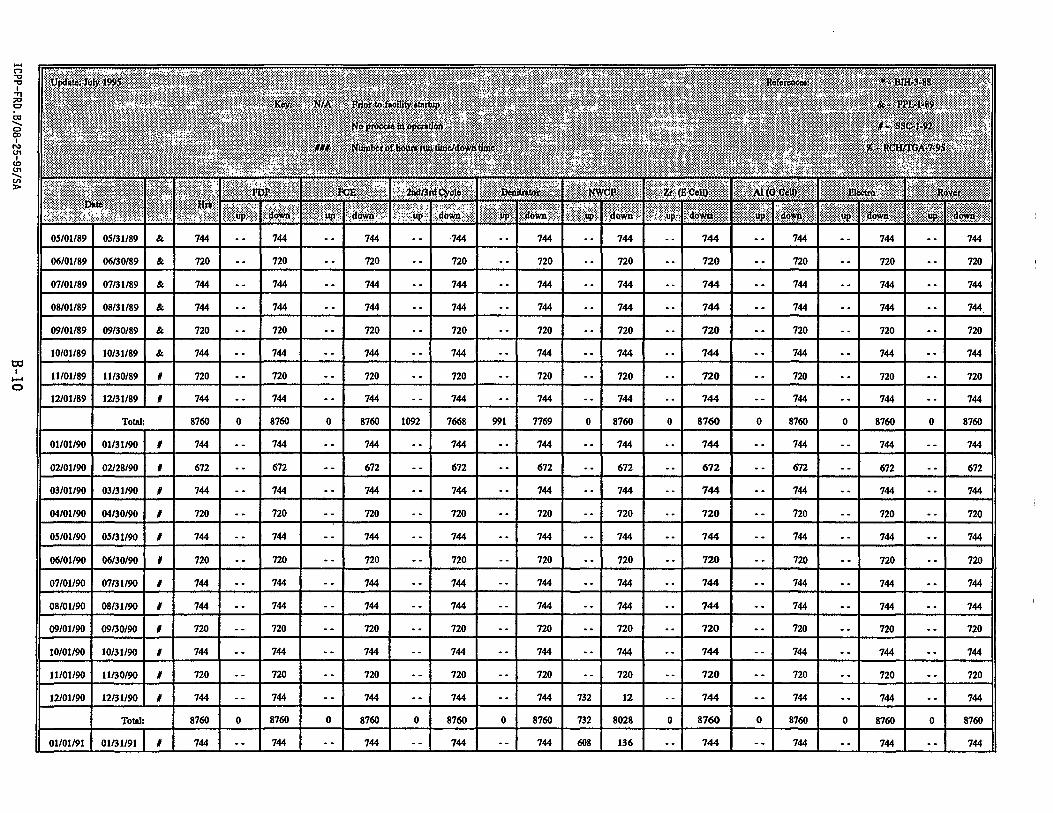
APPENDIX B PLANT OPERATION HISTORY
This appendix presents the operating times of the various facilities during which equipment failures were observed. Initially, failure rates were calculated separately. This is because the environments and operating conditions at each facility were considered sufficiently diverse to produce differing failure rates. However, a recent review of the facilities indicated that the environments are not sufficiently diverse to warrant separation of the failures. Therefore, the failures from each facility were combined. Also, in the past, the operating time of the facility was used as the estimate for the mission time (t ). However, this estimate failed to take into account sweep down and decontamination activities that occurred between operating periods. Therefore, the estimate for the mission time was changed to be the calendar time during which the failures were observed. This estimate assumes significant amounts of operational activity is occurring at the ICPP. Currently, substantial amounts of the Idaho Chemical Processing Plant have been placed in extended off-line or shutdown status. Therefore, the mission time is selected to be the between the first and last observed failures.
ICPP-FRD.B/08-25-95/SA B-2

*3 g <
i 1
*
$ w ' a
S '
St'
I
2 I:
$ I
8 I
9 I
? I
I 3
fr
S I
I 3
I 3
& s
5 8
3
s
3
$ a
2 3 es
5 3
$
* I
3 I
I ©
I 8 I
3 3
NO o M
O I O M I
I I
£ I £ I
I I
< z I
I < z
I I
I z
I I
I I
t $
g I
§ I
3 3
3 3
8 a
a s
o
'& ^
s 3
3 3
o 3 I
3 I
f a 9-
3 I
3 $ S
5 8 2
S a
S I I
I z
I I
I < z
I I
%
z £ I
I <: z
I z
g 3-
1 I S
5 NO
3
s
i s
s s
g I
3
S 3 S
3 i I
ICPP-FR
D.B/08-25T95/SA
B-3

VpiiMMyim Bfifciwww; *-BJH-3-8&
Ktyf WA Tmrtofaititytomp A - PPL-l-89
^(•fc^fooptfatfon * - SSQ5-1-9?
P*le • Hf» VbP 1PCE - 2dd/SrfCycl(> Dtriitator NWGi* h <sftig AUtiCtty •". Bted«> lfove*
P*le • Hf» up down up (town up dawn. «P down up down up down UJ> down tn> dow& W dowa
04/27/76 05/26/76 720 NA 280 440 -- 720 720 NA 720 • 720 430 290 720
05/27/76 06/26/76 744 NA 330 414 -- 744 744 NA 330 414 744 744 744
06/27/76 07/26/76 720 NA 0 720 -- 720 720 NA 0 720 720 720 720
07/27/76 08/26/76 744 NA 320 424 -- 744 744 NA 320 424 744 744 744
08/27/76 09/26/76 744 NA 160 584 -. 744 744 NA 70 674 744 744 744
09/27/76 10/26/76 720 NA 10 710 720 720 NA 0 720 720 720 720
10/27/76 11/26/76 744 NA 80 664 420 324 210 534 NA -- 744 744 744 744
Total: 7320 1380 5940 870 6450 580 6740 720 6600 0 7320 950 6370 0 7320 Total: 7320 1380 5940 870 6450 580 6740 720 6600 0 7320 950 6370 0 7320
03/01/77 03/26/77 624 NA 460 164 -- 624 624 NA 450 174 -- 624 624 -- 624
03/27/77 04/26/77 744 NA 740 4 -- 744 744 NA 740 4 700 44 744 -- 744
04/27/77 05/26/77 720 NA 710 10 -- 720 - - 720 NA 700 20 710 10 720 . . 720
05/27/77 06/12/77 408 NA 390 18 -- 408 408 NA 280 128 240 168 408 . . 408
08/12/77 08/26/77 360 NA 140 220 -- 360 360 NA 360 360 310 50 360
08/27/77 09/18/77 552 NA 230 322 -- 552 552 NA -- 552 552 470 82 552
10/22/77 10/26/77 120 NA 120 -- 120 120 NA -- 120 120 120 120
10/27/77 11/26/77 744 NA -- 744 .- 744 744 NA -- 744 744 744 - . 744
Total: 4272 2670 1602 0 4272 0 4272 2170 2102 1650 2622 780 3492 0 4272 Total: 4272 2670 1602 0 4272 0 4272 2170 2102 1650 2622 780 3492 0 4272
07/11/78 07/31/78 504 NA 370 134 -- 504 504 NA 470 34 -- 504 504 . . 504
08/01/78 08/31/78 744 NA 700 44 -- 744 744 NA 680 64 744 744 . - 744
09/01/78 09/30/78 720 NA 570 150 -- 720 720 NA 530 190 720 720 . . 720
10/01/78 10/17/78 408 NA 160 248 -- 408 408 NA 0 408 408 408 . . 408
Total: 2376 1800 576 0 2376 0 2376 1680 696 0 2376 0 2376 0 2376 Total: 2376 1800 576 0 2376 0 2376 1680 696 0 2376 0 2376 0 2376
03/17/79 04/23/79 • 912 NA 500 412 90 822 - - 912 NA 30 882 -- 912 - - 912 -- 912

f •«:
i
?, &
:
.-a *
t 3f
i
'St
:
* 2
3 *
3 3
I 3
I 3
I S
S*
3 3
3 S
3
t
3
3 I
3 3
e
St
st s
a 3
3 3
5 5
s 3
§* S
Z < z
I Z
Z z z
< z z z z z z z z z z z
I I
5 I
I 5
s
W
S 3
I s
3
<B
I 3
3
S
s •»
s
2 S
I 2 1 2
x 3
S 3
s
§> §
s s
o 3
8 3
ft I
I I
g z z z z z
< z z z z z z
< z z z
&
ft o 3
3 3
3 3
s
•3 E2
3 E2 00
a
s
1 1
! i
s i
s 1 I
z s s I I
3 Z I 3 Z 3
ICPP-FRD.B/08-25-95/SA B-5

K«yj MA YmrtofaWtom &~ PJ?»l.-89
Pate fert PbP 1PCE 'iaiiStiiCydb. btfiiutttof NWCP tt ifiixm Al(0Ctll) KtJctan SdV«
Pate fert »P OOWtf up down up down W down V down up dovra w down W down «jt down.
04/01/82 04/30/82 720 NA 720 110 610 720 NA 720 720 720 720
05/01/82 05/31/82 744 NA 744 -- 744 744 62 682 -- 744 . . 744 744 . . 744
06/01/82 06/30/82 720 NA 720 -- 720 720 388 332 720 720 720 . . 720
07/01/82 07/31/82 744 NA 744 -- 744 744 -- 744 -- 744 -. 744 744 . . 744
08/01/82 08/31/82 744 NA 744 -- 744 744 -- 744 -- 744 744 744 . . 744
09/01/82 09/30/82 720 NA 180 540 230 490 720 575 145 -- 720 250 470 720 . . 720
10/01/82 10/31/82 744 NA 400 344 -- 744 744 744 0 -- 744 390 354 744 . - 744
11/01/82 11/30/82 720 NA 570 150 -- 720 720 720 0 -- 720 500 220 720 . . 720
12/01/82 12/31/82 744 NA 30 714 340 404 400 344 744 0 -- 744 -- 744 744 . . 744
Total: 8760 1180 7580 1160 7600 730 8030 3233 2647 0 8760 1140 7620 0 8760 0 8760 Total: 8760 1180 7580 1160 7600 730 8030 3233 2647 0 8760 1140 7620 0 8760 0 8760
01/01/83 01/31/83 744 NA -- 744 -- 744 744 744 0 -- 744 - . 744 744 . . 744
02/01/8J 02/28/83 672 NA -- 672 -- 672 672 288 384 -- 672 -- 672 672 . . 672
03/01/83 03/31/83 744 NA 744 -- 744 744 -- 744 -- 744 744 744 744
04/01/83 04/30/83 720 NA 40 680 -- 720 720 720 0 -- 720 -- 720 720 190 530
05/01/83 05/31/83 744 NA 170 574 -- 744 744 744 0 744 -- 744 744 100 644
06/01/83 06/30/83 720 NA 340 380 -- 720 720 720 0 -- 720 -- 720 720 640 80
07/01/83 07/31/83 744 NA 90 654 -- 744 744 744 0 -- 744 -- 744 744 no 634
08/01/83 08/31/83 744 NA . - 744 140 604 744 744 0 -- 744 -- 744 744 . . 744
09/01/83 09/30/83 720 NA -- 720 260 460 180 540 720 0 -- 720 720 720 . . 720
10/01/83 10/31/83 744 NA 110 634 170 574 310 434 254 490 -- 744 -- 744 -- 744 . . 744
11/01/83 11/30/83 720 NA 190 530 -- 720 - . 720 -- 720 720 ... 720 720 300 420
12/01/83 12/31/83 744 NA 580 164 744 - . 744 -- 744 744 744 . - 744 560 184
Total: 8760 1520 7240 570 8190 490 8270 5678 3082 0 8760 0 8760 0 8760 1900 6860
UpdtttfJubr.1995 v , - ° - 5 , - " " \ s- ^> „,^ ,, , \ " - ,, - - , - ^ 'Rcfotwwae; ,% *-JBlH-3-8&", ;
; , KQS N/A - Prior to f«frf%»tMi»p - ^ •. A - S?Irt-89
NoJJtfKbaHoJJeittibA - ., \ 4~ SSQ.iWx\ - , " \ , „- - ^ ' ' . , \ :
; " " " - , " " tW >(Uto1>ti!(ifJi<«M»|itta,feitH<W^tijite , , " #~;RClflTGA-7-9S!
^ ° " •• ^ • - . ^ . . . % • . • ' \ % s
; • - Hrt
- - WM* - £CE ., , " 2od/3rf Cycle* tteaitrtrtor * NWCP • Zt {pCt)$ " At<ei.<3fcUr fifcdto " , Rovef ^N
; • - Hrt
Vp down ^ down, " 1 tip dawjx •«p dawn <n> down up, dowtt , up ' Vulovro «P •- dowa " -up down N
01/01/84 01/31/84 744 NA 625 119 744 744 369 375 744 -- 744 -- 744 462 282
02/01/84 02/29/84 696 NA 23 673 582 114 471 225 696 0 - - 696 696 - - 696 . . 696
03/01/84 03/31/84 744 NA 358 386 91 653 196 548 383 361 744 744 - - 744 365 379
04/01/84 04/30/84 720 NA 639 81 720 720 316 404 - - 720 720 - - 720 561 159
05/01/84 05/31/84 744 NA 557 187 139 605 - - 744 688 56 744 744 - - 744 407 337
06/01/84 06/30/84 720 NA 367 353 239 481 361 359 362 358 - - 720 720 720 67 653
07/01/84 07/31/84 744 NA - - 744 344 400 467 277 744 744 744 744 . . 744
08/01/84 08/31/84 744 NA - - 744 444 300 204 540 - - 744 - - 744 744 744 744
09/01/84 09/30/84 720 NA 720 720 720 - - 720 - - 720 720 720 . . 720
10/01/84 10/31/84 744 NA 744 744 744 - - 744 744 744 744 744
11/01/84 11/30/84 720 NA 720 720 . - 720 720 720 720 . . 720 720
12/01/84 12/31/84 744 NA - - 744 744 - - 744 - - 744 744 744 - - 744 . . 744
Total: 8784 2569 6215 1839 6945 1699 7085 2814 5970 0 8784 0 8784 0 8784 1862 6922 Total: 8784 2569 6215 1839 6945 1699 7085 2814 5970 0 8784 0 8784 0 8784 1862 6922
01/01/85 01/31/85 744 NA 744 744 - - 744 - - 744 - . 744 744 744 . . 744
02/01/85 02/28/85 672 NA 672 672 - - 672 672 672 672 672 672
03/01/85 03/31/85 744 NA - - 744 744 - - 744 - - 744 - - 744 744 - - 744 - - 744
04/01/85 04/30/85 720 NA 65 655 720 720 . - 720 720 720 - - 720 720
05/01/85 05/31/85 744 NA 118 626 744 - . 744 - - 744 - - 744 744 - - 744 . . 744
06/01/85 06/30/85 720 NA - - 720 720 - - 720 - - 720 - - 720 720 720 720
07/01/85 07/31/85 744 NA 201 543 744 744 • • 744 - . 744 . - 744 744 744
08/01/85 08/31/85 744 NA 141 603 744 744 .- 744 - . 744 92 652 . . 744 744
09/01/85 09/30/85 720 NA 497 223 720 - - 720 - - 720 - - 720 344 376 720 . . 720
10/01/85 10/31/85 744 NA 614 130 - - 744 - - 744 - - 744 - - 744 505 239 - - 744 - - 744

Kfejij N7A Prior to fojJjfytfsrWp A - «?»J-8J>
Nopil6<***&pp&atign <~ SS<?-l-?2
<T# HunjbtfpfJ^tfWtfrfc/dOWfttfa)* , #-R<aj/TGA-7-9$
Pate Hr* fbP FCE lodlMCyclt. tktjittimt NWCP it (&<m AHO&U) fflseta) ftawsf
Pate Hr* up down «* down up dawn. up dawn ^ down UP dow» »J» down. m> dowu *P rfowtt
11/01/85 11/30/85 720 NA 513 207 -- 720 -- 720 720 720 406 314 720 720
12/01/85 12/31/85 744 NA 550 194 -- 744 -- 744 744 744 431 313 744 744
Total: 8760 2699 6061 0 8760 0 8760 0 8760 0 8760 1778 6982 0 8760 0 8760 Total: 8760 2699 6061 0 8760 0 8760 0 8760 0 8760 1778 6982 0 8760 0 8760
01/01/86 01/31/86 744 NA 160 584 -- 744 -- 744 744 744 744 744 744
02/01/86 02/28/86 672 NA -- 672 -- 672 -- 672 672 672 -- 672 672 672
03/01/86 03/31/86 744 NA -- 744 -- 744 -• 744 744 -- 744 -- 744 744 744
04/01/86 04/30/86 720 NA 720 350 370 108 612 720 720 15 705 . . 720 720
05/01/86 05/31/86 744 NA -- 744 288 456 393 351 744 744 -- 744 744 744
06/01/86 06/30/86 720 NA -- 720 592 128 154 566 720 720 .- 720 720 720
07/01/86 07/31/86 744 NA -- 744 -- 744 87 657 744 744 -- 744 744 744
08/01/86 08/31/86 744 NA -- 744 -- 744 -- 744 744 744 • • 744 744 744
09/01/86 09/30/86 720 NA 77 643 -- 720 -- 720 720 -- 720 -- 720 720 720
10/01/86 10/31/86 744 NA 251 493 -- 744 -- 744 744 -- 744 -- 744 744 744
11/01/86 11/30/86 720 NA 145 575 -- 720 -- 720 720 720 -- 720 720 720
12/01/86 12/31/86 744 631 113 158 586 -- 744 -- 744 744 744 -- 744 744 744
Total: 8760 631 113 791 7969 1230 7530 742 8018 0 8760 0 8760 15 8745 0 8760 0 8760
01/01/87 01/31/87 744 514 230 148 596 -- 744 -- 744 744 -- 744 -- 744 -- 744 744
02/01/87 02/28/87 672 624 48 268 404 -- 672 -- 672 672 -- 672 -- 672 672 672
03/01/87 03/31/87 744 681 63 183 561 -- 744 -- 744 744 . . 744 -- 744 744 744
04/01/87 04/30/87 720 720 0 325 395 -- 720 -- 720 720 -- 720 -- 720 -- 720 720
05/01/87 05/31/87 744 744 0 252 492 -• 744 -- 744 744 -- 744 -- 744 . - 744 744
06/01/87 06/30/87 720 720 0 274 446 -- 720 -- 720 -- 720 -• 720 • - . 720 -- 720 720
07/01/87 07/31/87 744 736 8 210 534 -- 744 -- 744 -- 744 -- 744 -- 744 -- 744 -- 744

TJpJate; July Jt»5 \ - -- " ^ „ v . Rufcrcoccs: - ^ "-JB8M-S8. "
s^ 5 ... X*& " *WA" Prior to fcwlitytfutop " - - - A - PH<-l-85> , ;
P»to-. Hr* - v PbP - , *CB , 2ud/3ttiCy£i6 s "t>&ih*t&t WVdP 2t (8&1Q At(<JCdi> Btectoa •.. ftovtf ^
P»to-. Hr* »P B0W8 "P down.. •up down' up dawn «P down. up down *w down " " ,*p down- "'tip aowtt..
08/01/87 08/31/87 744 744 0 292 452 744 -- 744 744 744 744 -- 744 744
09/01/87 09/30/87 720 720 0 409 311 -- 720 -- 720 720 720 -- 720 . - 720 720
10/01/87 10/31/87 744 344 400 89 655 -- 744 744 744 744 - . 744 -- 744 744
11/01/87 11/30/87 720 720 -- 720 -- 720 720 720 720 -- 720 -- 720 720
12/01/87 12/31/87 744 432 312 157 587 744 744 744 744 744 -- 744 744
Total: 8760 6979 1781 2607 6153 0 8760 0 8760 O 8760 0 8760 0 8760 0 8760 0 8760
01/01/88 01/31/88 & 744 744 0 336 408 744 744 674 70 744 744 -- 744 744
02/01/88 02/29/88 & 696 696 0 317 379 696 696 529 167 696 . . 696 -- 696 696
03/01/88 03/31/88 & 744 282 462 134 610 744 744 263 481 744 744 744 744
04/01/88 04/30/88 & 720 720 0 289 431 -- 720 720 700 20 720 -- 720 -- 720 720
05/01/88 05/31/88 & 744 744 0 349 395 -- 744 744 313 431 744 .- 744 -- 744 744
06/01/88 06/30/88 & 720 720 0 293 427 -- 720 720 250 470 720 .- 720 -- 720 720
07/01/88 07/31/88 & 744 296 448 140 604 744 744 740 4 744 . . 744 . . 744 744
08/01/88 08/31/88 & 744 744 744 .- 744 744 744 0 744 - . 744 . . 744 744
09/01/88 09/30/88 & 720 720 720 720 720 720 0 720 . . 720 . . 720 720
10/01/88 10/31/88 & 744 744 744 45 699 744 144 600 744 -- 744 -- 744 744
11/01/88 11/30/88 & 720 720 -- 720 226 494 720 720 720 -- 720 . - 720 720
12/01/88 12/31/88 & 744 744 -- 744 80 664 744 744 744 -- 744 -- 744 744
Total: 8784 4202 4582 1858 6926 351 8433 0 8784 5077 3707 0 8784 0 8784 0 8784 0 8784
01/01/89 01/31/89 & 744 744 -- 744 112 632 -- 744 744 744 -- 744 -- 744 744
02/01/89 02/28/89 & 672 672 -- 672 186 486 247 425 672 672 -- 672 -- 672 672
03/01/89 03/31/89 & 744 744 744 538 206 510 234 744 744 744 744 744
04/01/89 04/30/89 & 720 -- 720 -- 720 256 464 234 486 -- 720 720 -- 720 -- • 720 720
VpitUnJtyiW
' Key; N/A
m
•prior to i»oi% atartup
Bofwroew; * « JWH-MJS
A - PPM-?*
#-Rq*OTftV7-9{l
Date Hrt «M> K3E lod/3ri Cycle bttuiakfc NWCJJ It (fiCtlD • M«JtJ*u> ffiedttt Koviif
Date Hrt up down «P down up down up down up down up dowtt up down up dowa H up dowfi
05/01/89 05/31/89 & 744 744 744 744 -- 744 744 744 744 744 744
06/01/89 06/30/89 & 720 720 -- 720 720 720 720 720 720 -- 720 720
07/01/89 07/31/89 & 744 744 744 744 744 744 744 . . 744 . . 744 744
08/01/89 08/31/89 & 744 744 744 744 744 744 744 . . 744 744 744.
09/01/89 09/30/89 & 720 720 720 720 720 720 720 - . 720 . . 720 720
10/01/89 10/31/89 & 744 744 -- 744 744 744 744 744 - . 744 -- 744 744
11/01/89 11/30/89 0 720 720 720 720 720 720 720 720 720 720
12/01/89 12/31/89 0 744 744 744 744 744 744 744 744 . . 744 744
Total: 8760 0 8760 0 8760 1092 7668 991 7769 0 8760 0 8760 0 8760 0 8760 0 8760
01/01/90 01/31/90 0 744 744 -- 744 744 744 744 744 -- 744 744 744
02/01/90 02/28/90 0 672 672 672 -- 672 672 672 672 672 672 672
03/01/90 03/31/90 0 744 744 -- 744 744 744 744 744 -- 744 .- 744 744
04/01/90 04/30/90 0 720 720 720 720 720 720 720 -- 720 . . 720 720
05/01/90 05/31/90 1 744 744 -- 744 -- 744 744 744 744 744 .- 744 744
06/01/90 06/30/90 0 720 720 720 . . 720 720 720 720 720 720 720
07/01/90 07/31/90 0 744 744 744 -- 744 744 744 744 744 . . 744 744
08/01/90 08/31/90 0 744 -- 744 -- 744 744 744 744 744 744 . . 744 744
09/01/90 09/30/90 0 720 720 -- 720 720 720 720 720 -- 720 . . 720 720
10/01/90 10/31/90 0 744 744 744 -- 744 744 744 744 -- 744 . . 744 . . 744
11/01/90 11/30/90 0 720 • - 720 -- 720 • - 720 720 -- 720 720 720 . . 720 . . 720
12/01/90 12/31/90 0 744 -- 744 -- 744 • - 744 744 732 12 744 -- 744 . . 744 . . 744
Total: 8760 0 8760 0 8760 0 8760 0 8760 732 8028 0 8760 0 8760 0 8760 0 8760
01/01/91 01/31/91 0 744 -- 744 -- 744 -- 744 -- 744 608 136 -- 744 -- 744 • - 744 -- 744

ink
* t
</
: ft!' , ^
f
' '
/ * i «
672 I
744
720
744
720
744
744
720
744 ||
720 J
744
8760
744
969
744
720
744
720
744
744
720 1
744
720 |
ink
* t
</
: ft!' , ^
f
' '
/ * i £
• • 1
t 1 1
J 1 1
1
1 * 1
* 1 1
©
I 1 '
1 1 t t
1 • 1 1
1 1
1 1 •
1
1
ink
* t
</
: ft!' , ^
f
' '
/ * i <»
672
744
720
744
OZi
744
tti
720
744
720
744
8760
744
696
744
720
744
720
744
744
720
744
720
ink
* t
</
: ft!' , ^
f
' '
/ * i *,
t • •
1 1
1 t •
I • 1
1 1 1 1
1 1 o
1 1 1
J « 1
I 1
• 1
1 1
1 1 •
ink
* t
</
: ft!' , ^
f
' '
/ * .1 3
I 672
744
720
744
720
744
744
720
744
OZi
744
8760
744
969
744
720
744
720
744
744
720
744
720
ink
* t
</
: ft!' , ^
f
' '
/ * .1 3 3*
• J
1 > 1
J 1
'• 1 1
1
• *
o |
1 1 1 t
1 I J
1
1 ;
1 1
1
ink
* t
</
: ft!' , ^
f
' '
/ *
4
Gil
744
720
744
720
744
744
720
744
720
744
8760
744
969
744
720
tti
720
744
744
g
744
720
ink
* t
</
: ft!' , ^
f
' '
/ *
* '
1 *
' *
' '
1 1
• 1
• •
' 1
1 '
' '
' '
1
ink
* t
</
: ft!' , ^
f
' '
/ * I T?
672 I x>
o o
744
744
720
744
720
387
5670
744
696
744
720
744
720
tti
744
720
744
720
ink
* t
</
: ft!' , ^
f
' '
/ * I $<
1
1 1
661
744
720
( I
1 1
I 357
3090
1 •
* •
1 1
' t
1 1
1
ink
* t
</
: ft!' , ^
f
' '
/ *
''J
672
744
720
744
8
630
744
OZi 744
720
tti
8478
744
696
744
720
744
720
744
tti
720
744
720
ink
* t
</
: ft!' , ^
f
' '
/ *
£ 1 1
1 1 1
• 1
168
114
1 •
1 •
1
282
1 1
• t
• 1
• t
1 1
t
ink
* t
</
: ft!' , ^
f
' '
/ * I - 1
672
744
433
604
720
744
744
720
712
387
744
7968
744
696
tti
720
744
OZi
744
744
720
744
720
ink
* t
</
: ft!' , ^
f
' '
/ * I §-
1
t
287
140
'• 1 1
1 •
333
1
792
1
ink
* t
</
: ft!' , ^
f
' '
/ * I n»
672
744
720
744
720
744
744
OZi 744
720
tti
8760
744
696
744
720
744
720
744
744
720
744
720
ink
* t
</
: ft!' , ^
f
' '
/ * I ft
( (
] '
1 •
• •
'• (
1 ©
1
• 1
• ;
' •
' •
• 1
ink
* t
</
: ft!' , ^
f
' '
/ *
:| <a
672
744
720
744
720
744
744
720
744
720
744
8760
744
696
744
720
744
720
744
744
720
744
720
ink
* t
</
: ft!' , ^
f
' '
/ *
:| <&
'
1 1 1
1 1
• •
1 •
1 1
1 •
• 1
1 1
1 •
1 •
1
ink
* t
</
: ft!' , ^
f
' '
/ *
1
. 672
744
720
744
720
744
744
720
744
720
744
8760
744
696
PPL
720
PPL
720
744
744
720
744
720
ink
* t
</
: ft!' , ^
f
' '
/ *
Total:
« *R
t£
* *
« IK
Jft
ink
* t
</
: ft!' , ^
f
' '
/ *
' f '
02/28/91
03/31/91
04/30/91
05/31/91
06/30/91
07/31/91
08/31/91
09/30/91
10/31/91
11/30/91
12/31/91
Total:
01/31/92
02/29/92
03/31/92
04/30/92
05/31/92
06/30/92 1 1
08/31/92
09/30/92
10/31/92
11/30/92
ink
* t
</
: ft!' , ^
f
' '
/ *
'f
02/01/91
03/01/91
04/01/91
05/01/91
06/01/91
07/01/91
08/01/91
09/01/91
10/01/91
11/01/91
12/01/91
01/01/92
02/01/92
03/01/92
04/01/92
05/01/92
06/01/92
07/01/92
08/01/92
1 09/01/92
10/01/92
11/01/92
ICPP-FR
D.B/08-25-95/SA
B
-ll

Upd.tai m 199$ R«fc<w«; *-JWH-3-8B
Kw N/A Prior to faille rtwtup & - PMW-89
P»te Hrt m? IPCfi •MlZtACyeh Dtaitrttor NWdP tt (BCeiqT. Al<(3Ctlf> fitscta) ftdVtt
P»te Hrt up dowu up down Up dawn up dawn up down. »P dOWtt vp down up down u$> dowa
12/01/92 12/31/92 % 744 744 744 -- 744 744 .- 744 . . 744 744 744 744
Total: 8784 0 8784 0 8784 0 8784 0 8784 0 8784 0 8784 0 8784 0 8784 0 8784
01/01/93 01/31/93 % 744 744 744 .- 744 -- 744 -- 744 744 . . 744 744 744
02/01/93 02/28/93 % 672 672 -- 672 -- 672 -- 672 -- 672 672 . . 672 . . 672 672
03/01/93 03/31/93 % 744 . . 744 744 -- 744 251 493 -- 744 744 744 . . 744 744
04/01/93 04/30/93 % 720 720 -- 720 -- 720 720 0 -- 720 720 720 . . 720 720
05/01/93 05/31/93 % 744 744 744 - . 744 744 0 -- 744 744 744 744 744
06/01/93 06/30/93 % 720 .- 720 720 720 717 3 -. 720 720 . . 720 720 720
07/01/93 07/31/93 % 744 744 744 -- 744 722 22 .- 744 744 . . 744 744 744
08/01/93 08/31/93 % 744 -- 744 744 -- 744 699 45 -- 744 744 -- 744 744 744
09/01/93 09/30/93 % 720 . . 720 720 720 720 0 -- 720 720 . . 720 720 720
10/01/93 10/31/93 % 744 744 -- 744 -- 744 664 80 • - 744 744 -- 744 -- 744 744
11/01/93 11/30/93 % 720 . . 720 -- 720 -- 720 -- 720 -- 720 720 . . 720 720 720
12/01/93 12/31/93 % 744 -- 744 744 -- 744 -- 744 -- 744 744 -- 744 .- 744 744
Total: 8760 0 8760 0 8760 0 8760 5238 3522 0 8760 0 8760 0 8760 0 8760 0 8760
01/01/94 01/31/94 % 744 -- 744 -- 744 -- 744 -- 744 -- 744 744 744 -. 744 744
02/01/94 02/28/94 % 672 . . 672 - . 672 -- 672 -- 672 -- 672 672 - . 672 . . 672 672
03/01/94 03/31/94 % 744 744 696 48 696 48 -- 744 -. 744 744 744 . . 744 744
04/01/94 04/30/94 % 720 . . 720 384 336 384 336 -- 720 -. 720 720 720 . . 720 720
05/01/94 05/31/94 % 744 -- 744 -- 744 -- 744 -- 744 -- 744 744 -- 744 744 744
06/01/94 06/30/94 % 720 720 -- 720 .-- 720 -- 720 • • 720 720 .- 720 720 720
07/01/94 07/31/94 % 744 -- 744 -- 744 -. 744 -- 744 -- 744 744 -- 744 744 744
08/01/94 08/31/94 % 744 -- 744 -- 744 -- 744 -- 744 •- 744 -- 744 -- 744 -- 744 -- 744

Update; July 1995 - " ^ - -Rofctwww; N * -£JK-3-SS. ;
— \ * \ > ^ " - JKtfs WA Prior to i«? i% startup s - &-2mi?*9
"-%° " " " - s-" }*6pr6(*«*ift operatic - i . - *f- S S C J - S ? - "
- s , - ^ " " \ ^ > ; v.". - - - . . s " - " * - -•;: .
- ?"* ,. to* PbP 5PCB 2ad/3rdCyBk tteoibatd? ; .-Dttyct* 2* (BCelfc ALttfCtu? - fifccta. ; "". Sovtt
- ?"* ,. to* up down up dowm " up down •up down «p <fowi up down *$> down - Vf dowa
. ' • » * * * down
09/01/94 09/30/94 % 720 720 . . 720 720 576 144 720 . . 720 . . 720 720 720
10/01/94 10/31/94 % 744 744 744 744 384 360 744 -• 744 -- 744 -- 744 744
11/01/94 11/30/94 % 720 720 -- 720 -- 720 720 720 -. 720 -. 720 720 720
12/01/94 12/31/94 % 744 744 -- 744 744 -- 744 744 . . 744 . . 744 - - 744 744
Total: 8760 0 8760 1080 7680 1080 7680 960 7800 O 8760 0 8760 0 8760 0 8760 0 8760
01/01/95 01/31/95 % 744 744 -- 744 • • 744 -- 744 744 -. 744 -- 744 744 744
02/01/95 02/28/95 % 672 672 -- 672 -- 672 672 672 . . 672 672 672 672
03/01/95 03/31/95 % 744 744 -- 744 744 744 744 -. 744 . . 744 744 744
04/01/95 04/30/95 % 720 720 720 720 720 720 720 -. 720 . . 720 720
05/01/95 05/31/95 % 744 744 744 • - - 744 -- 744 744 .- 744 -. 744 744 744
06/01/95 06/30/95 % 720 720 -- 720 720 720 720 . . 720 -. 720 . . 720 720
07/01/95 07/31/95 % 744 744 -- 744 -- 744 -- 744 744 .- 744 -- 744 - - 744 744
Total: 5088 0 5088 0 5088 0 5088 0 5088 O 5088 0 5088 0 5088 0 5088 0 5088
ToUl Operational Time: 157560 11812 44148 30388 127172 12584 144976 14942 142618 02624 95536 9070 148490 7933 149627 4996 152564 3762 153798

APPENDIX C
ICPP-FRD.C/08-25-95/SA C-1

APPENDIX C
Intermediate Values Calculated
This appendix provides a table of some of the important intermediate values calculated during the analysis of the Idaho Chemical Processing Plant failure data. The appropriate combination of the Model I and Model II values yield the report failure rates and error factors.
ICPP-FRD.C/08-25-95/SA C-2

Table C-l; Intermediate Values Calculated for ICPP failure Data
-Component Type/ Instrument 5 , •• C r o u p "
Failure Hade Reported Failure Rates
Y EF Standard/ Error
Basic Data
(faljs) fpopL t*
(mission time)
MODEL I
V O * 0 5 "'O.S*!? P&fS
o
Agitators All 9.79E-06 5.14E-06 6.48 1.23E-05 19 59 Airlifts All 1.17E-05 6.04E-06 6.63 1.49E-05 3 62 Casks All 8.17E-05 2.48E-05 12.66 3.48E-05 23 47 Cranes All 1.16E-04 6.54E-05 5.79 3.92E-05 252 31
Electrical 2.05E-05 1.23E-05 9.15 1.65E-05 56 31 Lift 2.05E-05 1.04E-05 6.82 1.65E-05 36 31 Brakes 1.79E-05 9.13E-06 6.73 1.54E-05 30 31 Bridge 1.10E-05 3.92E-06 10.66 1.21E-05 12 31 Other 5.62E-05 3.28E-05 5.53 2.73E-05 118. 31
Filters All 7.65E-06 3.41E-06 8.08 1.02E-05 130 421 Plug 4.32E-06 2.89E-06 4.38 7.67E-06 16 421 Leak 4.40E-06 3.10E-06 3.97 7.75E-06 3 421 Other 7.09E-06 3.14E-06 8.15 9.83E-06 78 421
Glovebox All 5.64E-05 2.08E-05 10.19 2.82E-05 100 30 Gloves 4.21E-05 1.34E-05 12.02 2.44E-05 70 30 Leak 8.68E-06 2.98E-06 11.08 1.11E-05 3 30 Other 1.88E-05 8.20E-06 8.35 1.63E-05 27 30
Hoist All 1.05E-05 3.49E-06 11.48 1.22E-05 26 71 Block 6.93E-06 2.63E-06 9.85 9.92E-06 5 71 Cable 6.81E-06 2.75E-06 9.17 9.83E-06 6 71 Hook 6.76E-06 2.86E-06 8.64 9.80E-06 3 71 Other 7.64E-06 2.92E-06 9.80 1.04E-05 12 71
Hood All 4.92E-05 1.13E-05 16.86 4.97E-05 9 24 Heat Exchangers\Condensors All 9.33E-06 4.10E-06 8.24 1.13E-05 55 140
Leak 6.36E-06 3.15E-06 7.04 9.35E-06 23 140 Other 7.24E-06 3.13E-06 8.43 9.97E-06 32 140
Jets All 5.40E-06 2.84E-06 6.45 8.66E-06 56 447 Leak 4.16E-06 3.13E-06 3.47 7.60E-06 7 447 Plug 4.67E-06 2.87E-06 5.07 8.06E-06 5 447 Other 5.07E-06 2.80E-06 6.01 8.39E-06 52 447
Manipulators All 1.05E-04 5.19E-05 7.07 3.71E-05 744 99 Boot 8.39E-06 4.06E-0B 7.26 1.05E-05 34 99 Cable 8.65E-06 4.58E-06 6.40 1.06E-05 38 99 Grip 1.57E-05 6.40E-06 9.03 1.43E-05 90 99 Motion 1.71E-05 8.28E-06 7.27 1.50E-05 104 99 Fall to Run 9.30E-06 4.05E-06 8.34 1.10E-05 41 99 Tong 6.42E-06 3.89E-06 5.19 9.17E-0B 22 99 Wrist 8.62E-06 5.07E-06 5.45 1.06E-05 40 99
64704 4.98E-06 3.37E-06 7.15E-06 1.46 52776 9.17E-07 3.31E-07 2.15E-06 2.55 67296 7.27E-06 5.10E-06 1.01E-05 1.41 75360 1.08E-04 9.71E-05 1.20E-04 1.11 75360 2.40E-05 1.91E-05 2.97E-05 1.25 75360 1.54E-05 1.16E-05 2.01E-05 1.32 75360 1.28E-05 9.43E-06 1.72E-05 1.35 75360 1.54E-05 3.13E-06 8.06E-06 1.61 75360 5.05E-05 4.33E-05 5.86E-05 1.16 73296 4.25E-06 3.67E-06 4.89E-06 1.15 73296 5.19E-07 3.38E-07 7.68E-07 1.51 73296 9.72E-08 3.51E-08 2.28E-07 2.55 73296 3.63E-06 3.10E-06 4.23E-06 1.17 70824 4.71E-05 3.98E-05 5.53E-05 1.18 70824 3.29E-05 2.70E-05 3.99E-05 1.22 70824 1.41E-06 5.10E-07 3.31E-06 2.55 70824 1.27E-05 9.17E-06 1.73E-05 1.37 70464 5.20E-06 3.73E-06 7.10E-06 1.38 70464 9.99E-07 4.57E-07 1.97E-06 2.07 70464 1.20E-06 5.89E-07 2.23E-06 1.95 70464 6.00E-07 2.17E-07 1.41E-06 2.55 70464 2.40E-06 1.46E-06 3.76E-06 1.61 19920 1.88E-05 1.06E-05 3.15E-05 1.73 72792 5.40E-06 4.30E-06 6.70E-06 1.25 72792 2.26E-06 1.58E-06 3.14E-06 1.41 72792 3.14E-06 2.33E-06 4.16E-06 1.34 72000 1.74E-06 1.39E-06 2.16E-06 1.25 72000 2.17E-07 1.13E-07 3.88E-07 1.86 72000 1.55E-07 7.11E-08 3.06E-07 2.07 72000 1.37E-06 1.06E-06 1.74E-06 1.28 76440 9.83E-05 9.00E-05 1.07E-04 1.09 76440 4.49E-06 3.36E-06 5.91E-06 1.33 76440 5.02E-06 3.82E-06 6.51E-06 1.31 76440 1.19E-05 9.97E-06 1.41E-05 1.19 76440 1.37E-05 1.17E-05 1.61E-05 1.17 76440 5.42E-06 4.16E-06 6.96E-06 1.29 76440 2.91E-06 2.02E-06 4.07E-06 1.42 76440 5.29E-06 '4.05E-06 6.81E-06 1.30

Table C-l: Intermediate Values Calculated f o r ICPP Failure Data
CO 0 1
O 1
4*
Component type/ Instrument Croup
Failure Mode 1 U
X
HOOEL 11
^O.SS EF Adjusted Lepormal Distribution
EF
Agitators An 7.75E-06 1.16E-06 2.28E-05 4.45 9.79E-06 7.93E-07 3.33E-05 6.48 Airlifts All 5.10E-06 2.32E-06 1.57E-05 2.60 1.17E-05 9.11E-07 4.00E-05 6.63 Casks All 1.02E-05 2.76E-06 2.23E-04 8.99 8.17E-05 2.76E-06 3.14E-04 12.66 Cranes All 1.08E-04 1.25E-05 3.41E-04 5.22 1.16E-04 1.13E-05 3.79E-04 5.79
Electrical Z.55E-05 1.67E-08 5.37E-05 5.18 2.05E-05 1.34E-06 1.12E-04 9.15 Lift 1.71E-05 2.00E-06 5.37E-05 5.18 2.05E-05 1.52E-06 7.06E-05 6.82 Brakes 1.47E-05 1.83E-06 4.55E-05 4.99 1.79E-05 1.36E-06 6.15E-05 6.73 Bridge 7.60E-06 5.90E-07 2.60E-05 6.64 1.10E-05 3.67E-07 4.18E-05 10.66 Other 5.13E-05 6.90E-06 1.56E-04 4.75 5.62E-05 5.93E-06 1.81E-04 5.53
Filters All 6.87E-06 4.88E-07 2.39E-05 7.00 7.65E-06 4.22E-07 2.76E-05 8.08 Plug 3.56E-06 9.93E-07 8.38E-06 2.90 4.32E-06 6.59E-07 1.26E-05 4.38 Leak 3.21E-06 1.99E-06 4.83E-06 1.56 4.40E-06 7.79E-07 1.23E-05 3.97 Other 6.31E-06 4.50E-07 2.19E-05 6.98 7.09E-06 3.86E-07 2.56E-05 8.15
Glovebox All 4.92E-05 2.41E-06 1.80E-04 8.65 5.64E-05 2.04E-06 2.12E-04 10.19 Gloves 3.54E-05 1.36E-06 1.33E-04 9.88 4.21E-05 1.12E-06 1.62E-04 12.02 Leak 4.44E-06 6.85E-07 1.30E-05 4,35 8.68E-06 2.69E-07 3.30E-05 11.08 Other 1.50E-05 1.35E-06 4.99E-05 6.09 1.88E-05 9.82E-07 6.85E-05 8.35
Hoist All 8.00E-06 4.19E-07 2.90E-O5 8.32 1.05E-05 3.04E-07 4.01E-05 11.48 Block 4.13E-06 5.54E-07 1.25E-05 4.75 6.93E-06 2.67E-07 2.60E-05 9.85 Cable 4.28E-06 5.83E-07 1.29E-05 4.71 6.81E-06 2.99E-07 2.52E-05 9.17 Hook 3.77E-06 8.44E-07 9.71E-06 3.39 6.76E-06 3.31E-07 2.47E-05 8.64 Other 5.34E-06 4.78E-07 1.78E-05 6.11 7.64E-06 2.98E-07 2.86E-05 9.80
Hood All 2.94E-05 1.15E-06 1.10E-04 9.77 4.92E-05 6.68E-07 1.90E-04 18.86 Heat Exchangers\Condensors All 7.92E-06 6.21E-07 2.71E-05 6.60 9.33E-06 4.98E-07 3.38E-05 8.24
Leak 5.08E-06 6.29E-07 1.57E-05 5.00 6.36E-06 4.47E-07 2.22E-05 7.04 Other 5.85E-06 4.96E-07 1.97E-05 6.30 7.24E-06 3.71E-07 2.63E-05 8.43
Jets All 4.68E-06 5.50E-07 1.47E-05 5.17 5.40E-06 4.41E-07 1.83E-05 6.45 Leak 3.36E-06 1.67E-06 5.85E-06 1.87 4.16E-06 9.00E-07 1.09E-05 3.47 Plug 3.33E-06 1.17E-06 7.02E-06 2.45 4.67E-06 5.66E-07 1.46E-05 5.07 Other 4.35E-06 5.97E-07 1.31E-05 4.69 5.07E-06 4.66E-07 1.68E-05 6.01
Manipulators All 9.91E-05 7.99E-06 3.37E-04 6.49 1.05E-04 7.34E-06 3.67E-04 7.07 Boot 6.92E-06 7.41E-07 2.22E-05 5.48 8.39E-06 5.59E-07 2.95E-05 7.26 Cable 7.30E-06 9.34E-07 2.24E-05 4.90 8.65E-06 7.15E-07 2.93E-05 6.40 Grip 1.37E-05 8.43E-07 4.86E-05 7.60 1.57E-05 7.09E-07 5.78E-05 9.03 Motion 1.53E-05 1.34E-06 5.12E-05 6.19 1.71E-05 1.14E-06 6.02E-05 7.27 Fail to Run 7.70E-06 6.27E-07 2.61E-05 6.45 9.30E-06 4.85E-07 3.38E-05 8.34 Tong 5.31E-06 1.06E-06 1.42E-05 3.65 6.42E-06 7.50E-07 2.02E-05 5.19 Wrist 7.41E-06 1.21E-06 2.13E-05 4.20 8.62E-06 9.30E-07 2.76E-05 5.45

Table C-l: Intermediate Values Calculated for ICPP failure Data
Component Type/ instrument Group.
Failure Hode Reported failure Rates
' « EF Standard
Error
Basic Data
( fal ls) N
(pop) t*
- (mission time)
MODEL !
"0,05 vt}.»5 W%> Manipulators (Contd.) Pumps
Sampler Sys
Valves
o i 01 Gate
Ball
Globe
Solenoid
Hlsc
Needle
Other All Charge Leak OHer Plug Fail to Run Other All Plug Needle Other All Leak Plug Other All Leak Plug Other All Leak Plug Other All Leak Plug Other All Leak Plug Other All Leak Plug Other All Leak
.42E-05
.39E-05 •06E-06 .95E-06 .16E-06 .84E-06 97E-Q6 63E-05 04E-05 42E-06 .16E-06 .58E-06 03E-06 •52E-07 58E-08 53E-07 .61E-06 22E-06 26E-06 .46E-06 30E-06 43E-06 28E-06 98E-06 02E-06 48E-06 98E-06 88E-06 88E-06 62E-05 62E-05 88E-06 01E-05 23E-06 41E-06 07E-0B 57E-06 08E-06
2.22E-05 1.05E-05 03E-06 29E-06 26E-06 25E-0B 28E-06 48E-06 80E-06 96E-06 87E-06 15E-06 60E-07 59E-08
8.38E-06 3.65E-07
69E-06 88E-06 91E-06 73E-06 77E-06 71E-06 89E-Q6 67E-06 49E-06 80E-06 93E-06 54E-06 90E-06 94E-06 94E-06 90E-06 10E-06 94E-06 58E-06 41E-06 61E-06
9.02 8.24 9.25 6.00 8.27 7.68 7.81 7.76 7.70 6.10 5.95 7.25 6.18
12.80 28.22
2. 2. 2. 2. 2. 2. 2. 2. 2. 2. 2. 2. 2. 2. 2. 2.90E-06 3.50 7.10E-06 3.99 2.94E-06 5.84 2.58E-06 5.49 5.41E-06 4.35 2.61E-06 5.71 2.87E-06 3.99
.24
.53
.19
.19
.09
.66
.08
.29 4.34 4.99 2.95 5.44 4.54 3.50
31.26 31.26
2.66E-05 1.78E-05 8.21E-06 8.89E-06 8.28E-06 8.02E-06 8.13E-06 1.47E-05 1.19E-05 8.59E-06 8.39E-06 1.08E-05 3.63E-06 1.79E-06 9.17E-07 3.10E-06 6.79E-06 6.42E-06 6.46E-06 6.65E-06 41E-06 61E-06 47E-06 13E-06 16E-06 67E-06 98E-06 04E-06
7.04E-06 1.83E-05 1.83E-05 7.04E-06 1.14E-05 8.17E-06 7.51E-06 1.02E-05 7.64E-06 7.22E-06
375 583 31 75 40 26 32 379 68 13 5 50
1020 233 51 736 249 61 11 177 330 71 21 238 99 16 1
82 4 0 0 4
173 41 12
120 20 7
99 380 380 380 380 380 380 380 142 142 142 142
13037 13037 13037 13037 5063 5063 5063 5063 3012 3012 3012 3012 1477 1477 1477 1477 575 575 575 575 273 273 273 273 269 269
76440 4.96E-05 4.55E-05 5.39E-05 1.09 75216 2.04E-05 1.85E-05 2.24E-05 1.10 75216 1.08E-06 8.00E-07 1.44E-06 1.34 75216 2.62E-06 2.16E-06 3.16E-06 1.21 75216 1.40E-06 1.07E-06 1.80E-06 1.30 75216 9.10E-07 6.52E-07 1.24E-06 1.38 75216 1.12E-06 8.30E-07 1.48E-06 1.34 75216 1.33E-05 1.22E-05 1.44E-05 1.09 73440 6.52E-06 5.32E-06 7.93E-06 1.22 73440 1.25E-06 7.74E-07 1.92E-06 1.58 73440 4.79E-07 2.19E-07 9.43E-07 2.07 73440 4.79E-06 3.78E-06 6.02E-06 1.26 78288 9.99E-07 9.49E-07 1.05E-06 1.05 78288 2.28E-07 2.05E-07 2.54E-07 1.11 78288 5.00E-08 3.93E-08 6.24E-08 1.26 78288 7.21E-07 6.78E-07 7.66E-07 1.06 78288 6.28E-07 5.65E-07 6.96E-07 1.11 78288 1.54E-07 1.24E-07 1.89E-07 1.23 78288 2.78E-08 1.65E-08 4.44E-08 1.64 78288 4.47E-07 3.94E-07 5.04E-07 1.13 78288 1.40E-06 1.28E-06 1.53E-06 1.09 78288 3.01E-07 2.47E-07 3.65E-07 1.22 78288 8.91E-08 6.14E-08 1.26E-07 1.43 78288 1.01E-06 9.06E-07 1.12E-06 1.11 78288 8.56E-07 7.24E-07 1.01E-06 1.18 78288 1.38E-07 9.02E-08 2.05E-07 1.51 78288 8.65E-09 1.52E-09 3.38E-08 4.71 78288 7.09E-07 5.89E-07 8.47E-07 1.20 78288 8.89E-08 3.69E-08 1.88E-07 2.26 78288 5.11E-09 4.37E-11 4.27E-08 31.26 78288 5.11E-09 4.37E-U 4.27E-08 31.26 78288 8.89E-08 3.69E-08 1.88E-07 2.26 78288 8.09E-06 7.13E-06 9.16E-06 1.13 78288 1.92E-06 1.47E-06 2.46E-06 1.29 78288 5.61E-07 3.42E-07 8.81E-07 1.61 78288 5.61E-06 4.82E-06 6.51E-06 1.16 78288 9.50E-07 6.49E-07 1.35E-06 1.44 78288 3.32E-07 1.72E-07 5.93E-07 1.86

o -o
09 I <o
Table C-l: Intermediate Values Calculated for ICPP Failure Data
Component Type/ Instrument Group
failure Mode MODEL U
"0,03 •'B.JUS EF
Adjusted Logttormal D i s tr ibut ion
" 0 , 0 5 . v0.*5 EF
Manipulators (Contd. Pumps
Sampler Sys
Valves
o 1
6ate
Ball
Globe
Solenoid
Hlso
Needle
Other All Charge Leak Oiler Plug Fall to Run Other All Plug Needle Other All Leak Plug Other All Leak Plug Other All Leak Plug Other All Leak Plug Other All Leak Plug Other All Leak Plug Other All Leak
5.06E-05 2.68E-06 2.22E-05 1.41E-06 4.04E-06 2.95E-07 5.28E-06 6.62E-07 4.26E-06 3.54E-07 3.87E-06 4.04E-07 4.05E-06 3.90E-07 1.53E-05 1.05E-06 8.99E-06 7.61E-07 4.16E-06 7.65E-07 3.52E-06 1.00E-06 7.31E-06 7.23E-07 9.99E-07 9.55E-08 2.28E-07 6.60E-09 5.00E-08 3.47E-10 7.21E-07 5.36E-08 3.44E-06 8.45E-07 3.06E-06 1.62E-06 2.96E-06 2.19E-06 3.29E-06 1.00E-06 4.09E-06 6.51E-07 3.18E-06 1.07E-06 3.01E-06 1.80E-06 3.76E-06 6.84E-07 3.66E-06 5.88E-07 3.05E-06 1.43E-0B 2.94E-06 2.54E-06 3.53E-06 6.72E-07 3.01E-06 1.87E-06 2.94E-06 2.94E-06 2.94E-06 2.94E-06 3.01E-06 1.87E-06 9.51E-06 2.01E-06 4.48E-06 6.52E-07 3.41E-06 7.55E-07 7.47E-06 1.45E-06 3.70E-06 6.61E-07 3.19E-06 1.33E-06
1.84E-04 8.28 5.42E-05 2.46E-06 2.00E-04 9.02 7.87E-05 7.48 2.39E-05 1.28E-06 8.66E-05 8.24 1.40E-05 6.88 5.06E-06 2.20E-07 1.88E-05 9.25 1.63E-05 4.96 5.95E-06 5.48E-07 1.97E-05 6.00 1.44E-0S 6.38 5.16E-06 2.73E-07 1.87E-05 8.27 1.25E-05 5.56 4.84E-06 2.93E-07 1.72E-05 7.68 1.33E-05 5.84 4.97E-06 2.91E-07 1.78E-05 7.81 5.33E-05 7.13 1.63E-05 9.64E-07 5.81E-05 7.76 3.03E-05 6.31 1.04E-05 6.23E-07 3.70E-05 7.70 1.15E-05 3.87 5.42E-06 4.85E-07 1.81E-05 6.10 8.23E-06 2.87 5.16E-06 4.82E-07 1.71E-05 5.95 2.39E-05 5.75 8.58E-06 5.73E-07 3.01E-05 7.25 3.29E-06 5.87 1.03E-06 9.07E-08 3.46E-06 6.18 8.72E-07 11.49 2.52E-07 5.93E-09 9.71E-07 12.80 1.88E-07 22.40 6.58E-08 2.97E-10 2.36E-07 28.22 2.49E-06 6.81 7.53E-07 5.05E-08 2.64E-06 7.24 8.55E-06 3.18 3.61E-06 7.61E-07 9.49E-06 3.53 5.11E-06 1.78 3.22E-06 1.31E-06 6.31E-06 2.19 3.89E-06 1.33 3.26E-06 1.33E-06 6.37E-06 2.19 7.46E-0B 2.73 3.46E-06 8.85E-07 8.44E-06 3.09 1.18E-05 4.26 4.30E-06 5.95E-07 1.29E-05 4.66 6.87E-06 2.54 3.43E-06 8.79E-07 8.35E-06 3.08 4.63E-06 1.60 3.28E-06 1.26E-06 6.62E-06 2.29 1.04E-05 3.91 3.98E-06 6.15E-07 1.16E-05 4.34 1.05E-05 4.23 4.02E-06 4.99E-07 1.24E-05 4.99 5.49E-06 1.96 3.48E-06 9.50E-07 8.28E-06 2.95 3.38E-06 1.15 4.98E-06 5.40E-07 1.59E-05 5.44 9.63E-06 3.79 3.88E-06 5.60E-07 1.15E-05 4.54 4.50E-06 1.55 3.88E-06 8.28E-07 1.02E-05 3.50 2.94E-06 1.00 2.62E-05 9.40E-08 9.18E-05 31.26 2.94E-06 1.00 2.62E-05 9.4OE-08 9.18E-05 31.26 4.50E-06 1.55 3.88E-06 8.28E-07 1.02E-05 3.50 2.50E-05 3.52 1.01E-05 1.78E-06 2.83E-05 3.99 1.33E-05 4.52 5.23E-06 5.04E-07 1.72E-05 5.84 8.83E-0B 3.42 4.41E-06 4.70E-07 1.42E-05 5.49 2.02E-05 3.74 8.07E-06 1.25E-06 2.35E-05 4.35 1.03E-05 3.95 4.57E-06 4.58E-07 1.49E-05 5.71 6.16E-06 2.15 4.08E-06 7.19E-07 1.14E-05 3.99
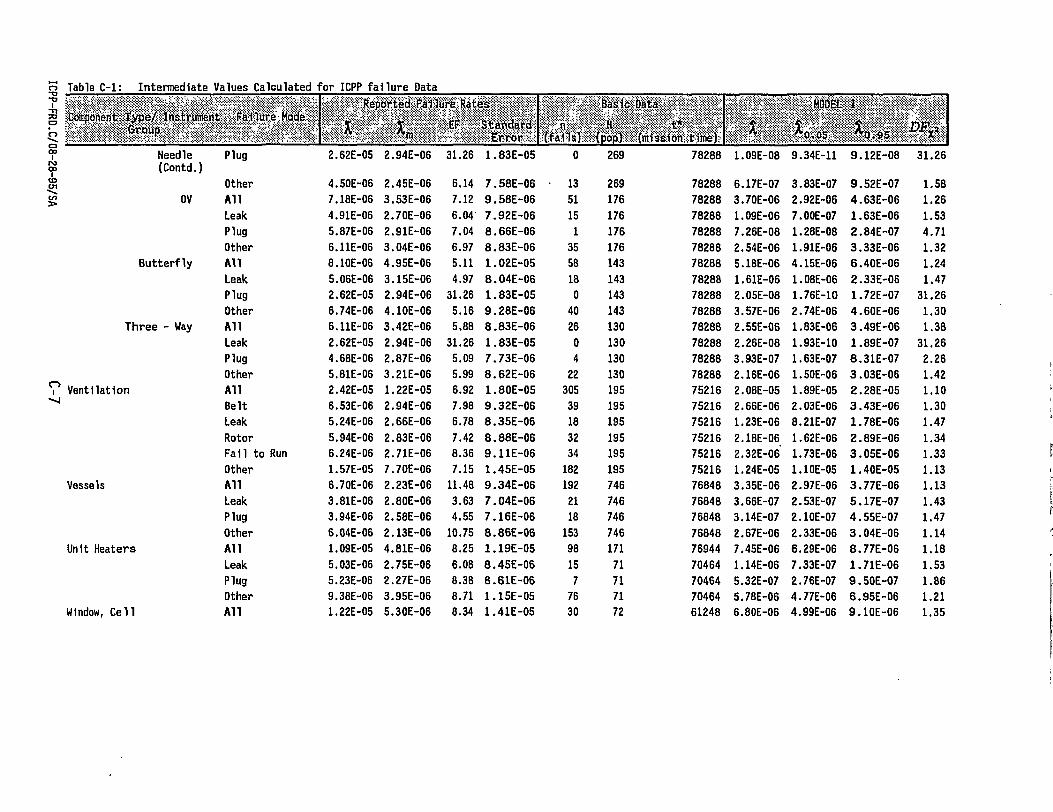
o Table C-l: Intermediate Values Calculated for ICPP failure Data
Component type/ instrument Group
Failure Mode Reported failure Rates
"m EF Standard
Error
. sBasic Data
(falls) (pop) t* %
(mission time)
- MODEL JU
* . « D**>
cn
o i
- « 4
Needle (Contd.)
Plug 2.62E-05 2.94E-06 31.26 1.83E-05 0 269 78288 1.09E-08 9.34E-11 9.12E-08 31.26
Other 4.50E-06 2.45E-06 6.14 7.58E-06 13 269 78288 6.17E-07 3.83E-07 9.52E-07 1.58 OV All 7.18E-06 3.53E-06 7.12 9.58E-06 51 176 78288 3.70E-06 2.92E-06 4.63E-06 1.26
Leak 4.91E-06 2.70E-06 6.04 7.92E-06 15 176 78288 1.09E-06 7.00E-07 1.63E-06 1.53 Plug 5.87E-06 2.91E-06 7.04 8.66E-06 1 176 78288 7.26E-08 1.28E-08 2.84E-07 4.71 Other 6.11E-06 3.04E-06 6.97 8.83E-06 35 176 78288 2.54E-06 1.91E-06 3.33E-06 1.32
Butterfly All 8.10E-06 4.95E-06 5.11 1.02E-05 58 143 78288 5.18E-06 4.15E-06 6.40E-06 1.24 Leak 5.06E-06 3.15E-06 4.97 8.04E-06 18 143 78288 1.61E-06 1.08E-06 2.33E-06 1.47 Plug 2.62E-05 2.94E-06 31.26 1.83E-05 0 143 78288 2.05E-08 1.76E-10 1.72E-07 31.26 Other 6.74E-06 4.10E-06 5.16 9.28E-06 40 143 78288 3.57E-06 2.74E-06 4.60E-06 1.30
Three - Way All 6.UE-06 3.42E-06 5.88 8.83E-06 26 130 78288 2.55E-06 1.83E-06 3.49E-06 1.38 Leak 2.62E-05 2.94E-06 31.26 1.83E-05 0 130 78288 2.26E-08 1.93E-10 1.89E-07 31.26 Plug 4.68E-06 2.87E-06 5.09 7.73E-06 4 130 78288 3.93E-07 1.63E-07 8.31E-07 2.26 Other 5.81E-06 3.21E-06 5.99 8.62E-06 22 130 78288 2.16E-06 1.50E-06 3.03E-06 1.42
Ventilation All 2.42E-05 1.22E-05 6.92 1.80E-05 305 195 75216 2.08E-05 1.89E-05 2.28E-05 1.10 Belt 6.53E-06 2.94E-06 7.98 9.32E-06 39 195 75216 2.66E-06 2.03E-06 3.43E-06 1.30 Leak 5.24E-06 2.66E-06 6.78 8.35E-06 18 195 75216 1.23E-06 8.21E-07 1.78E-06 1.47 Rotor 5.94E-06 2.83E-06 7.42 8.88E-06 32 195 75216 2.18E-06 1.62E-06 2.89E-06 1.34 Fail to Run 6.24E-06 2.71E-06 8.36 9.11E-06 34 195 75216 2.32E-06 1.73E-06 3.05E-06 1.33 Other 1.57E-05 7.70E-06 7.15 1.45E-05 182 195 75216 1.24E-05 1.10E-05 1.40E-05 1.13
Vessels All 6.70E-06 2.23E-06 11.48 9.34E-06 192 746 76848 3.35E-06 2.97E-06 3.77E-06 1.13 Leak 3.81E-06 2.80E-06 3.63 7.04E-06 21 746 76848 3.66E-07 2.53E-07 5.17E-07 1.43 Plug 3.94E-06 2.58E-06 4.55 7.16E-06 18 746 76848 3.14E-07 2.10E-07 4.55E-07 1.47 Other 6.04E-06 2.13E-06 10.75 8.86E-06 153 746 76848 2.67E-06 2.33E-06 3.04E-06 1.14
Unit Heaters All 1.09E-05 4.81E-06 8.25 1.19E-05 98 171 76944 7.45E-06 6.29E-06 8.77E-06 1.18 Leak 5.03E-06 2.75E-06 6.08 8.45E-06 15 71 70464 1.14E-06 7.33E-07 1.71E-06 1.53 Plug 5.23E-06 2.27E-06 8.38 8.61E-06 7 71 70464 5.32E-07 2.76E-07 9.50E-07 1.86 Other 9.38E-06 3.95E-06 8.71 1.15E-05 76 71 70464 5.78E-06 4.77E-06 6.95E-06 1.21
Window, Cell All 1.22E-05 5.30E-06 8.34 1.41E-05 30 72 61248 6.80E-06 4.99E-06 9.10E-06 1.35
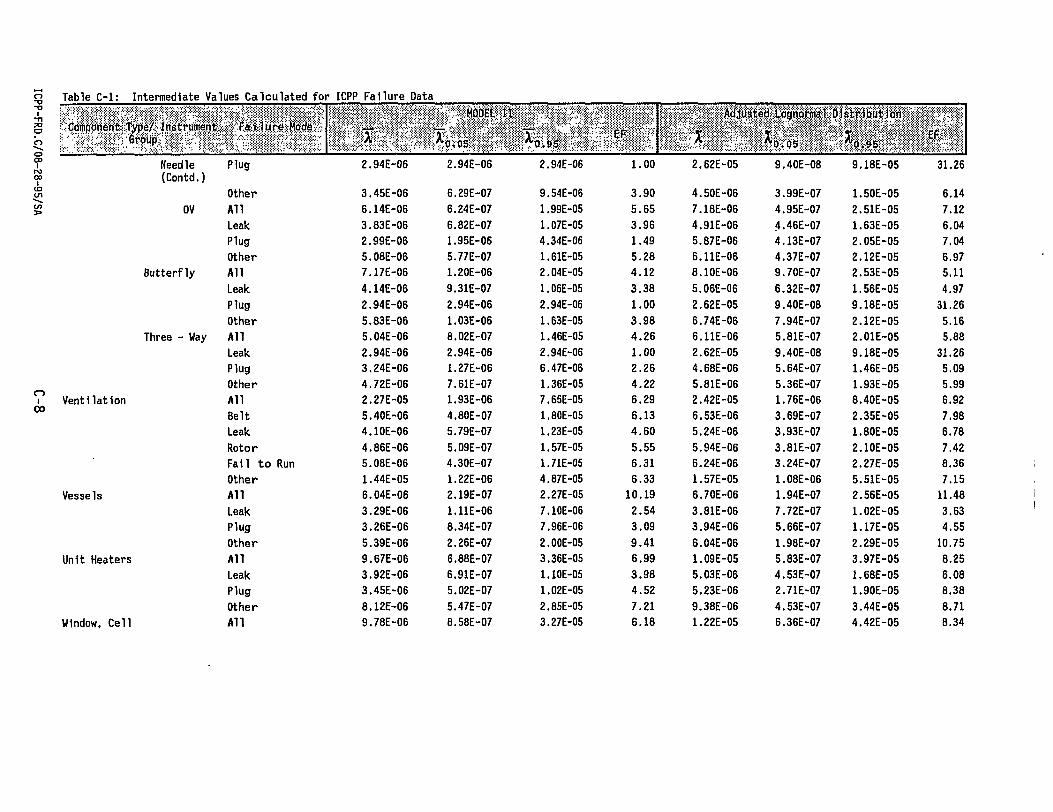
Table C-l: Intermediate Values Calculated for ICPP Failure Data
Component type/ Instrument Group
Fai lure Mode MODEL I t
V0,O5 ^.95 EF
Adjusted Lognorrnal BisfcHbutJofl
"0,05 ^.95 EF
00 I ro oo I to
O I 00 Ventilation
Vessels
Unit Heaters
Window, Cell
Needle Plug (Contd.)
2.94E-06 2.94E-06 2.94E-06 1.00 2.62E-05 9.40E-08 9.18E-05 31.26
Other 3.45E-06 6.29E-07 9.54E-06 3.90 4.50E-06 3.99E-07 1.50E-05 6.14 OV All 6.14E-06 6.24E-07 1.99E-05 5.65 7.18E-06 4.95E-07 2.51E-05 7.12
Leak 3.83E-06 6.82E-07 1.07E-05 3.96 4.91E-06 4.46E-07 1.63E-05 6.04 Plug 2.99E-06 1.95E-06 4.34E-06 1.49 5.87E-06 4.13E-07 2.05E-05 7.04 Other 5.08E-06 5.77E-07 1.61E-05 5.28 6.11E-06 4.37E-07 2.12E-05 6.97
ter f ly All 7.17E-06 1.20E-06 2.04E-05 4.12 8.10E-06 9.70E-07 2.53E-05 5.11 Leak 4.14E-06 9.31E-07 1.06E-05 3.38 5.06E-06 6.32E-07 1.56E-05 4.97 Plug 2.94E-06 2.94E-06 2.94E-06 1.00 2.62E-05 9.40E-08 9.18E-05 31.26 Other 5.83E-06 1.03E-06 1.63E-05 3.98 6.74E-06 7.94E-07 2.12E-05 5.16
ee - Way All 5.04E-06 8.02E-07 1.46E-05 4.26 6.11E-06 5.81E-07 2.01E-05 5.88 Leak 2.94E-06 2.94E-06 2.94E-06 1.00 2.62E-05 9.40E-08 9.18E-05 31.26 Plug 3.24E-06 1.27E-06 6.47E-06 2.26 4.68E-06 5.64E-07 1.46E-05 5.09 Other 4.72E-06 7.61E-07 1.36E-05 4.22 5.81E-06 5.36E-07 1.93E-05 5.99 All 2.27E-05 1.93E-06 7.65E-05 6.29 2.42E-05 1.76E-06 8.40E-05 6.92 Belt 5.40E-06 4.80E-07 1.80E-05 6.13 6.53E-06 3.69E-07 2.35E-05 7.98 Leak 4.10E-06 5.79E-07 1.23E-05 4.60 5.24E-06 3.93E-07 1.80E-05 6.78 Rotor 4.86E-06 5.09E-07 1.57E-05 5.55 5.94E-06 3.81E-07 2.10E-05 7.42 Fail to Run 5.08E-06 4.30E-07 1.71E-05 6.31 6.24E-06 3.24E-07 2.27E-05 8.36 Other 1.44E-05 1.22E-06 4.87E-05 6.33 1.57E-05 1.08E-06 5.51E-05 7.15 Al l 8.04E-06 2.19E-07 2.27E-05 10.19 6.70E-06 1.94E-07 2.56E-05 11.48 Leak 3.29E-06 1.11E-06 7.10E-06 2.54 3.81E-06 7.72E-07 1.02E-05 3.63 Plug 3.26E-0B 8.34E-07 7.96E-06 3.09 3.94E-06 5.66E-07 1.17E-05 4.55 Other 5.39E-06 2.26E-07 2.00E-05 9.41 6.04E-06 1.98E-07 2.29E-05 10.75 All 9.67E-06 6.88E-07 3.36E-05 6.99 1.09E-05 5.83E-07 3.97E-05 8.25 Leak 3.92E-06 6.91E-07 1.10E-05 3.98 5.03E-06 4.53E-07 1.68E-05 6.08 Plug 3.45E-06 5.02E-07 1.02E-05 4.52 5.23E-06 2.71E-07 1.90E-05 8.38 Other 8.12E-06 S.47E-07 2.8SE-05 7.21 9.38E-06 4.53E-07 3.44E-05 8.71 All 9.78E-06 8.58E-07 3.27E-05 6.18 1.22E-05 6.36E-07 4.42E-05 8.34

S Table C- l : Intermediate Values Calculated for ICPP fai lure Data PP-FRD.C/i
Component type/J Instrument ' Failure Hade Group - s "
^ - Reported -FaMure Rates * 1 T EF Standard A A n ^ . Error (fails)
« Basic- Data to t*
(pop) (mission time) * X \ MODEL 1
PPxs
08-: Analysis Loop Drift 3.67E-05 2.35E-05 4.70 3.50E-06 97 50 75366 3.25E-05 2.74E-05 3.83E-05 1.18 CO 1 Fall 1.47E-05 8.75E-06 5.33 2.22E-06 24 50 75366 8.04E-06 5.68E-06 1.11E-05 1.40 CO cn Density Loop Drift 2.81E-05 2.31E-05 2.78 2.47E-06 123 73 62917 2.68E-05 2.31E-05 3.10E-05 1.16 cn 3> Fall 1.13E-05 7.83E-06 4.09 1.57E-06 35 73 62917 7.63E-06 5.73E-06 9.99E-06 1.32
Dlff Press Drift 1.75E-05 1.34E-05 3.32 3.19E-06 26 24 65943 1.51E-05 1.08E-05 2.06E-05 1.38 Fall 1.41E-05 8.92E-06 4.85 2.86E-06 15 24 65943 8.69E-06 5.59E-06 1.30E-05 1.53
Flow, Gas Drift 4.04E-05 3.13E-05 3.24 6.29E-06 38 18 52931 3.72E-05 2.83E-05 4.82E-05 1.31 Fail 2.73E-05 1.39E-05 6.77 5.17E-06 21 18 52931 2.05E-05 1.42E-05 2.90E-05 1.43
Flow, Liquid Drift 3.22E-05 1.64E-05 6.78 1.09E-05 7 4 60057 2.59E-05 1.35E-05 4.63E-05 1.86 Fall 3.26E-05 2.16E-05 4.44 1.10E-05 6 4 60057 2.22E-05 1.09E-05 4.14E-05 1.95
Level Loop Drift 5.05E-05 3.50E-05 4.09 4.75E-06 100 43 53626 4.47E-05 3.78E-05 5.25E-05 1.18 Fall 8.93E-06 5.73E-06 4.70 2.00E-06 9 43 53626 4.02E-06 2.26E-06 6.73E-06 1.73
Pressure Drift 2.28E-05 1.80E-05 3.10 6.79E-06 9 11 45005 1.82E-05 1.02E-05 3.05E-05 1.73 Fall 1.71E-05 6.25E-06 10.33 5.88E-06 2 11 45005 4.05E-06 1.16E-06 1.12E-05 3.11
o 1
Pulse Drift 4.97E-05 2.58E-05 6.58 1.94E-05 4 3 44184 3.02E-05 1.25E-05 6.38E-05 2.26 o 1 Fall 3.58E-05 8.08E-06 17.08 5.96E-03 1 3 44184 7.54E-06 1.33E-06 2.95E-05 4.71 10 Radiation, Crltlcallty Drift 5.60E-05 4.69E-05 2.66 4.74E-06 141 52 44430 5.66E-05 4.92E-05 6.49E-05 1.15
Fall 2.26E-05 1.50E-05 4.45 3.01E-06 45 52 44430 1.81E-05 1.40E-05 2.29E-05 1.28 Radiation, General Drift 3.82E-05 2.32E-05 5.19 3.02E-06 143 86 52322 3.40E-05 2.96E-05 3.90E-05 1.15
Fall 3.80E-05 3.39E-05 2.19 3.01E-06 27 86 52322 6.43E-06 4.64E-06 8.73E-06 1.37 Temp Loop Drift 2.39E-05 1.73E-05 3.76 4.56E-06 24 17 66747 2.09E-05 1.48E-05 2.89E-05 1.40S
Fail 2.24E-05 1.42E-05 4.77 4.41E-06 18 17 66747 1.57E-05 1.05E-05 2.27E-05 1.47 Vibration Loop Drift 5.00E-05 3.37E-05 4.32 1.12E-05 16 6 65519 4.01E-05 2.61E-05 5.94E-05 1.51
Fall 3.11E-05 1.27E-05 9.07 8.83E-06 10 6 65519 2.50E-05 1.45E-05 4.09E-05 1.68

_ Table C-l: Intermediate Values Calculated for ICPP Failure Data CPP-FRD.C
Component type/ Instrument Croup
Failure Mode X MODEL 11
^Q.0S EF Adjusted. Lognormal Distribution
EF
80/ Analysis Loop Drift 3.35E-05 5.91E-06 9.37E-05 3.98 3.67E-05 5.O1E-06 1.11E-04 4.70
i ro 00 Fail 1.22E-05 2.29E-06 3.34E-05 3.81 1.47E-05 1.64E-06 4.66E-05 5.33 i Density Loop Drift 2.66E-05 9.65E-06 ' 5.55E-05 2.40 2.81E-05 8.32E-06 6.43E-05 2.78 </> Fail 9.92E-06 2.53E-06 2.43E-05 3.10 1.13E-05 1.92E-06 3.20E-05 4.09 S» Diff Press Drift 1.55E-05 5.58E-06 3.24E-05 2.41 1.75E-05 4.05E-06 4.47E-05 3.32
Fall 1.14E-05 2.81E-06 2.83E-05 3.17 1.41E-05 1.84E-06 4.32E-05 4.85 Flow, Gas Drift 3.65E-05 1.26E-05 7.77E-05 2.48 4.04E-05 9.69E-06 1.01E-04 3.24
Fail 2.17E-05 2.93E-06 6.57E-05 4.73 2.73E-05 2.05E-06 9.40E-05 6.77 Flow, Liquid Drift 2.23E-05 4.48E-06 5.98E-05 3.65 3.22E-05 2.41E-06 1.11E-04 6.78
Fall 2.45E-05 9.48E-06 4.93E-05 2.28 3.26E-05 4.86E-06 9.60E-05 4.44 Level Loop Drift 4.66E-05 1.01E-05 1.21E-04 3.47 5.05E-05 8.55E-06 1.43E-04 4.09
Fail 6.90E-06 2.10E-Q6 1.56E-05 2.73 8.93E-06 1.22E-06 2.70E-05 4.70 Pressure Drift 1.92E-05 1.00E-05 3.23E-05 1.79 2.28E-05 5.82E-06 5.58E-05 3.10
Fall 8.15E-06 1.88E-06 2.08E-0S 3.32 1.71E-05 6.05E-07 6.45E-05 10.33 Pulse Drift 3.19E-05 8.85E-06 7.53E-05 2.92 4.97E-05 3.92E-06 1.70E-04 6.58
o 1
Fail 1.10E-05 2.23E-06 2.93E-05 3.62 3.58E-05 4.73E-07 1.38E-04 17.08 t—> o Radiation, Critloality Drift 5.34E-05 2.03E-05 1.09E-04 2.32 5.60E-05 1.76E-05 1.25E-04 2.66
Fall 2.00E-05 4.31E-06 5.22E-05 3.48 2.26E-05 3.37E-06 6.67E-05 4.45 Radiation, General Drift 3.53E-05 5.11E-06 1.05E-04 4.53 3.82E-05 . 4.46E-06 1.20E-04 5.19
Fail 3.53E-05 2.13E-05 5.40E-05 1.59 3.80E-05 1.55E-05 7.41E-05 2.19 Temp Loop Drift 2.07E-05 6.42E-06 4.65E-05 2.69 2.39E-05 4.59E-06 6.50E-05 3.76
Fail 1.84E-05 4.04E-06 4.62E-05 3.24 2.24E-05 2.99E-06 6.80E-05 4.77 Vibration Loop Drift 4.14E-05 1.18E-05 9.65E-05 2.87 5.00E-05 7.80E-06 1.46E-04 4.32
Fail 2.15E-05 2.35E-06 6.85E-05 5.40 3.11E-05 1.40E-06 1.15E-04 9.07

APPENDIX D
ICPP-FRD.D/08-25-95/SA D-1
APPENDIX D GENERIC EQUIPMENT FAILURE DATABASE
Appendix D contains generic failure rates. These failure rates are for equipment items or failure modes not studied. The tables in Appendix D are taken from a Westinghouse Savannah River report, "Savannah River Site Generic Database Development."1
ICPP-FRD.D/08-25-95/SA D-2

Table D-1. Water System Recommended Generic Failure Rates
System/Component/Fatlure Hode Component
, Identifier
Recommended Failure Rate Distribution
{log-flormal}
System/Component/Fatlure Hode Component
, Identifier Kean* Error
Factor1* Water
Valve (Standby or Safety) Manual
Fails to open/close
XVM-CC-W or XVM-OO-W
3.0E-4/d 10
Plugs XVM-PG-W 5.0E-8/h 10 Leakage (internal) XVM-LI-W l.OE-6/h 10 Rupture (internal) XVM-RI-W 5.0E-8/h 30 Leakage (external) XVM-LE-W l.OE-8/h 10 Rupture (external) XVM-RE-W 5.0E-10/h 30
Check Fails to open
CKV-CC-W 5.0E-5/d 10
Fails to close CKV-OO-W l.OE-3/d 5 Plugs CKV-PG-W 5.0E-8/h 10
Leakage (internal) CKV-LI-W l.OE-6/h 10 Rupture (internal) CKV-RI-W 5.0E-8/h 30 Leakage (external) CKV-LE-W 1.0E-8/h 10 Rupture (external) CKV-RE-W 5.0E-10/h 30
Motor-Operated Fails to open/close
MOV-CC-W or M0V-00-W
3.0E-3/d 5
Spurious operation MOV-CO-W or MOV-OC-W
3.0E-7/h 5
Plugs MOV-PG-W 5.0E-8/h 10 Leakage (internal) MOV-LI-W 1.0E-6/h 10 Rupture (internal) MOV-RI-W 5.0E-8/h 30 Leakage (external) MOV-LE-W 1.0E-8/h 10 Rupture (external) MOV-RE-W 5.0E-10/h 30
Air-Operated Fails to open/close
AOV-CC-W or AOV-OO-W
1.0E-3/d 30
Spurious operation AOV-CO-W or AOV-OC-W .
l.OE-6/h 5
Plugs AOV-PG-W 5.0E-8/h 10
ICPP-FRD. D/08-25-95/SA D-3

Table D-1. (Contd.) Water System Recommended Generic Failure Rates
System/Component/Faflure Mode Component Identifier
Recommended Failtire Rate Distribution
(log-normal)
System/Component/Faflure Mode Component Identifier Hean*
Error Factor*
Water Valve (Standby or Safety)
Manual Fails to open/close
XVM-CC-W or XVM-OO-W
3.0E-4/d 10
Leakage (internal) AOV-LI-W l.OE-6/h 10 Rupture (internal) AOV-RI-W 5.0E-8/h 30 Leakage (external) AOV-LE-W 1.0E-8/h 10 Rupture (external) AOV-RE-W 5.0E-10/h 30
Solenoi d-Operated Fails to open/close
SOV-CC-W or S0V-00-W
l.OE-3/d 10
Spurious operation SOV-CO-W or SOV-OC-W
5.0E-7/h 10
Plugs SOV-PG-W 5.0E-8/h 10 Leakage (internal) SOV-LI-W l.OE-6/h 10 Rupture (internal) SOV-RI-W 5.0E-8/h 30 Leakage (external) SOV-LE-W 1.0E-8/h 10 Rupture (external) SOV-RE-W 5.0E-10/h 30
Safety/Relief Fails to open
SRV-CC-W 3.0E-3/d 3
Fails to reclose SRV-OO-W 3.0E-3/d 3 Leakage (internal) SRV-LI-W l.OE-6/h 10 Rupture (internal) SRV-RI-W 5.0E-8/h 30 Leakage (external) SRV-LE-W l.OE-8/h 10 Rupture (external) SRV-RE-W 5.0E-10/h 30
Vacuum-Breaker Fails to open
VBV-CC-W 1.0E-2/d 10
Fails to reclose VBV-OO-W l.OE-2/d 10 Leakage (internal) VBV-LI-W l.OE-6/h 10 Rupture (internal) VBV-RI-W 5.0E-8/h 30 Leakage (external) VBV-LE-W l.OE-8/h 10
ICPP-FRD.0/08-25-95/SA D-4
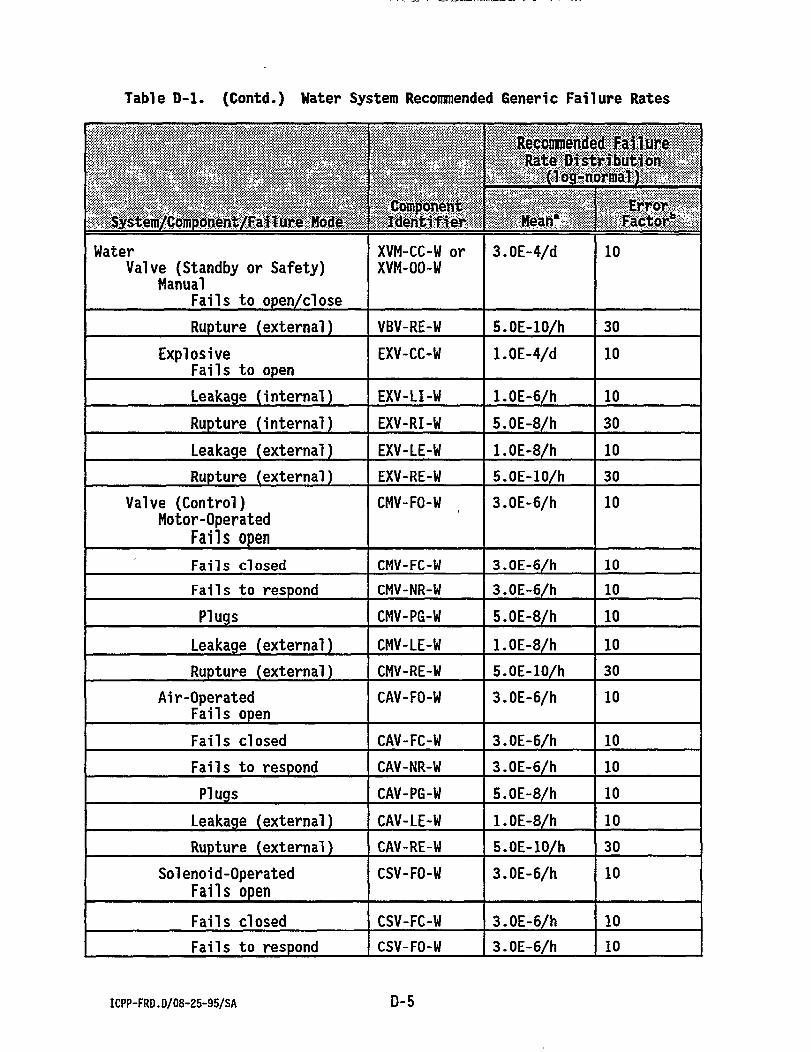
Table D-1. (Contd.) Hater System Recommended Generic Failure Rates
System/Component/Fallure Mode Component Identifier
Reconnuended Failure Rate Distribution
{log-normal}
System/Component/Fallure Mode Component Identifier dean*
Error, Factor*
Water Valve (Standby or Safety)
Manual Fails to open/close
XVM-CC-W or XVM-OO-W
3.0E-4/d 10
Rupture (external) VBV-RE-W 5.0E-10/h 30 Explosive
Fails to open EXV-CC-W l.OE-4/d 10
Leakage (internal) EXV-LI-W l.OE-6/h 10 Rupture (internal) EXV-RI-W 5.0E-8/h 30 Leakage (external) EXV-LE-W l.OE-8/h 10 Rupture (external) EXV-RE-W 5.0E-10/h 30
Valve (Control) Motor-Operated
Fails open CMV-FO-W 3.0E-6/h 10
Fails closed CMV-FC-W 3.0E-6/h 10 Fails to respond CMV-NR-W 3.0E-6/h 10 Plugs CMV-PG-W 5.0E-8/H 10
Leakage (external) CMV-LE-W l.OE-8/h 10 Rupture (external) CMV-RE-W 5.0E-10/h 30
Air-Operated Fails open
CAV-FO-W 3.0E-6/h 10
Fails closed CAV-FC-W 3.0E-6/h 10 Fails to respond CAV-NR-W 3.0E-6/h 10 Plugs CAV-PG-W 5.0E-8/h 10
Leakage (external) CAV-LE-W l.OE-8/h 10 Rupture (external) CAV-RE-W 5.0E-10/h 30
Solenoid-Operated Fails open
CSV-FO-W 3.0E-6/h 10
Fails closed CSV-FC-W 3.0E-6/h 10 Fails to respond CSV-FO-W 3.0E-6/h 10
ICPP-FRD.D/08-25-95/SA D-5

Table 0-1. (Contd.) Water System Recommended Generic Failure Rates
System/Component/Failure Hode Component Identifier
Recommended Failure Rate Distribution
(log-normal}
System/Component/Failure Hode Component Identifier Hean*
Error Factor*
Water Valve (Standby or Safety)
Manual Fails to open/close
XVM-CC-W or XVM-OO-W
3.0E-4/d 10
Plugs CSV-PG-W 5.0E-8/h 10 Leakage (external) CSV-LE-W l.OE-8/h 10 Rupture (external) CSV-RE-W 5.0E-10/h 30
Pump Motor-Driven
Fails to start MDP-FS-W 3.0E-3/d 5
Fails to run MDP-FR-W 3.0E-5/h 10 Overspeed MDP-OS-W 5.0E-6/H 10 Fails to stop MDP-NS-W 3.0E-3/d 5 Leakage (external) MDP-LE-W 3.0E-8/h 10 Rupture (external) MDP-RE-W l.OE-9/h 30
Turbine-Driven Fails to start
TDP-FS-W 3.0E-2/d 3
Fails to run TDP-FR-W l.OE-4/h 30 Overspeed TDP-OS-W 3.0E-5/h 10 Fails to stop TDP-NS-W 3.0E-2/d 3 Leakage (external) TDP-LE-W 3.0E-8/h 10 Rupture (external) TDP-RE-W l.OE-9/h 30
Diesel-Driven Fails to start
DDP-FS-W 1.0E-2/d 5
Fails to run DDP-FR-W 5.0E-3/h 5 Overspeed DDP-OS-W l.OE-3/h 5 Fails to stop DDP-NS-W l.OE-2/d 5 Leakage (external) DDP-LE-W 3.0E-8/h 10 Rupture (external) DDP-RE-W l.OE-9/h 30
ICPP-FRD.D/08-25-95/SA D-6

Table D-1. (Contd.) Hater System Recommended Generic Failure Rates
Systera/Component/FaOure fcode Component Identifier
Recommended Fail tire Rate Distribution
(log-normal)
Systera/Component/FaOure fcode Component Identifier Hean*
Error Factor*
Water Valve (Standby or Safety)
Manual Fails to open/close
XVM-CC-W or XVM-OO-W
3.0E-4/d 10
Pi pi ng/Hose/Jumper Piping
Leakage (external) PIP-LE-W 3.0E-9/h-ft 10
Rupture (external) PIP-RE-W l.OE-10/h-ft
30
Plugs PIP-PF-W 1.0E-10/h-ft
30
Hose Leakage (external)
HOS-LE-W l.OE-9/h-ft 10
Rupture (external) HOS-RE-W l.OE-8/h-ft 10 Plugs HOS-PG-W l.OE-8/h-ft 10
Jumper Leakage (external)
JPR-LE-W l.OE-6/h 10
Rupture (external) JPR-RE-W l.OE-8/h 30 Plugs JPR-PG-W 5.0E-8/h 10
Vessel Tank (Unpressurized)
Leakage (external) TKU-LE-W l.OE-8/h 10
Rupture (external) TKU-RE-W 5.0E-10/h . 30 Tank (Pressurized)
Leakage (external) TKP-LE-W l.OE-8/h 10
Rupture (external). TKP-RE-W 5.0E-10/h 30 Flange/Gasket
Leakage (external) FLG-LE-W l.OE-8/h 10
Rupture (external) FLG-RE-W l.OE-10/h 30 Heat Exchanger
Shell/Tube Fouling (tubes)
HTX-FL-W l.OE-7/h 10
Plugs (tubes) HTX-PG-W 3.0E-8/h 10
ICPP-FRD.D/08-25-95/SA D-7

Table D-l. (Contd.) Hater System Recommended Generic Failure Rates
Systera/Component/Faffure Mode Component Identifier
Recommended Failure -' Rate Distribution ,
(log-normal)
Systera/Component/Faffure Mode Component Identifier Hean* Error , -Factor*
Water Valve (Standby or Safety)
Manual Fails to open/close
XVM-CC-W or XVM-OO-W
3.0E-4/d 10
Leakage (tubes) HTX-LI-W l.OE-7/h 10 Rupture (tubes) HTX-RI-W 5.0E-9/h 30 Leakage (shell) HTX-LE-W l.OE-8/h 10 Rupture (shell) HTX-RE-W 5.0E-10/h 30
Heater (Electrical) Fails to heat
HTE-FH-W l.OE-6/h 10
Overheats HTE-OH-W 3.0E-7/h 10 Leakage (external) HTE-LE-W l.OE-7/h 10 Rupture (external) HTE-RE-W 5.0E-9/h 30
Strainer/Filter Plugs
FLT-PG-W 3.0E-6/h 10
Leakage (internal) FLT-LI-W 3.0E-6/h 10 Rupture (internal) FLT-RI-W 5.0E-7/h 10
Orifice Plugs
ORF-PG-W l.OE-6/h 3
Miscellaneous Travelling Screen
Plugs TRS-PG-W 5.0E-7/h 10
a. Modifications of the recommended mean for hourly failure rates may be appropriate for components subjected to hostile radioactive or chemical environments.
b. Error factor is the 95th percentile/50th percentile.
ICPP-FRD.D/08-25-95/SA D-8

Table D-2. Chemical Process System Recommended Generic Failure Rates
System/Compohent/Faflure Kode Component Identifier
Recommended Failure Rate Distribution
{log-normal}
System/Compohent/Faflure Kode Component Identifier Mean* Error
Factor* Chemical Process
Valve (Standby or Safety) Manual
Fails to open/close
XVM-CC-C or XVM-OO-C
3.0E-4/d 10
Plugs XVM-P6-C 5.0E-8/h 10 Leakage (internal) XVM-LI-C l.OE-6/h 10 Rupture (internal) XVM-RI-C 5.0E-8/h 30 Leakage (external) XVM-LE-C 5.0E-7/h 10 Rupture (external) XVM-RE-C 3.0E-8/h 30
Check Fails to open
CKV-CC-C 5.0E-5/d 10
Fails to close CKV-OO-C l.OE-3/d 10 Plugs CKV-PG-C 5.0E-8/h 10
Leakage (internal) CKV-LI-C l.OE-6/h 10 Rupture (internal) CKV-RI-C 5.0E-8/h 30 Leakage (external) CKV-LE-C 5.0E-7/h 10 Rupture (external) CKV-RE-C 3.0E-8/h 30
Motor-Operated Fails to open/close
MOV-CC-C or MOV-OO-C
3.0E-3/d 10
Spurious operation MOV-CO-C or
MOV-OC-C 3.0E-7/h 10
Plugs MOV-PG-C 5.0E-8/h 10 Leakage (internal) MOV-LI-C l.OE-6/h 10 Rupture (internal) MOV-RI-C 5.0E-8/h 10 Leakage (external) MOV-LE-C 5.0E-7/h 10 Rupture (external) MOV-RE-C 3.0E-8/h 30
Air-Operated Fails to open/close
AOV-CC-C or AOV-OO-C
l.OE-3/d 30
ICPP-FRD.0/08-25-95/SA D - 9

Table D-2. (Contd.) Chemical Process System Recommended Generic Failure Rates
Syst«m/Component/FaiIar€ Mode Component Identifier
Recommended Failure Hate Distribution
(log-norma?>
Syst«m/Component/FaiIar€ Mode Component Identifier Mean*
Error Factor
Chemical Process Valve (Standby or Safety)
Manual Fails to open/close
XVM-CC-C or XVM-00-C
3.0E-4/d 10
Spurious operation AOV-CO-C or
AOV-OC-C l.OE-6/h 10
Plugs AVO-CO-C or
AOV-OC-C 5.0E-8/h 10
Leakage (internal) AOV-LI-C l.OE-6/h 10 Rupture (internal) AOV-RI-C 5.0E-8/h 30 Leakage (external) AOV-LE-C 5.0E-7/h 10 Rupture (external) AOV-RE-C 3.0E-8/h 30
Solenoid-Operated Fails to open/close
SOV-CC-C or SOV-OO-C
l.OE-3/d 10
Spurious operation SOV-CO-C or SOV-OC-C
5.0E-7/h 10
Plugs SOV-PG-C 5.0E-8/h 10 Leakage (internal) SOV-LI-C l.OE-6/h 10 Rupture (internal) SOV-RI-C 5.0E-8/h 30 Leakage (external) SOV-LE-C 5.0E-7/h 10 Rupture (external) SOV-RE-C 3.0E-8/h 30
Safety/Relief Fails to open
SRV-CC-C 3.0E-3/d 10
Fails to reclose SRV-OO-C 3.0E-3/d 10 Leakage (internal) SRV-LI-C l.OE-6/h 10 Rupture (internal) SRV-RI-C 5.0E-8/h 30 Leakage (external) SRV-LE-C 5.0E-7/h 10 Rupture (external) SRV-RE-C . 3.0E-8/h 30
ICPP-FRD.D/08-25-95/SA D-10

Table D-2. (Contd.) Chemical Process System Recommended Generic Failure Rates
Sy5stera/Component/FalIure Mode Component Identifier
Recommended Failure Rate Distribution
(log-normal)
Sy5stera/Component/FalIure Mode Component Identifier Mean*
Error, . Factor1*
Chemical Process Valve (Standby or Safety)
Manual Fails to open/close
XVM-CC-C or XVM-OO-C
3.0E-4/d 10
Vacuum-Breaker Fails to open
VBV-CC-C l.OE-2/d 10
Fails to reclose VBV-OO-C l.OE-2/d 10 Leakage (internal) VBV-LI-C l.OE-6/h 10 Rupture (internal) VBV-RI-C 5.0E-8/h 30 Leakage (external) VBV-LE-C 5.0E-7/h 10 Rupture (external) VBV-RE-C 3.0E-8/h 30
Explosive Fails to open
EXV-CC-C l.OE-4/d 10
Leakage (internal) EXV-LI-C l.OE-6/h 10 Rupture (internal) EXV-RI-C 5.0E-8/h 10 Leakage (external) EXV-LE-C 5.0E-7/h 10 Rupture (external) EXV-RE-C 3.0E-8/h 30
Valve (Control) Motor-Operated
Fails open CMV-FO-C 3.0E-6/h 10
Fails closed CMV-FC-C 3.0E-6/h 10 Fails to respond CMV-NR-C 3.0E-6/h 10 Plugs CMV-PG-C 5.0E-8/h 10
Leakage (external) CMV-LE-C 5.0E-7/h 10 Rupture (external) CMV-RE-C 3.0E-8/h 30
Air-Operated Fails open
CAV-FO-C 3.0E-6/h 10
Fails closed CAV-FC-C 3.0E-6/h 10 Fails to respond CAV-NR-C 3.0E-6/h 10 Plugs CAV-PG-C 5.0E-8/h 10
ICPP-FRD.D/08-25-95/SA D-ll

Table D-2. (Contd.) Chemical Process System Recommended Generic Failure Rates
Systera/Component/Failure Mode Component Identifier
Recommended Failure Rate Distribution
{log-normal}
Systera/Component/Failure Mode Component Identifier Mean-
Error Factor
Chemical Process Valve (Standby or Safety)
Manual Fails to open/close
XVM-CC-C or XVM-OO-C
3.0E-4/d 10
Leakage (external) CAV-LE-C 5.0E-7/h 10 Rupture (external) CAV-RE-C 3.0E-8/h 30
Solenoid-Operated Fails open
CSV-FO-C 3.0E-6/h 10
Fails closed CSV-FC-C 3.0E-6/h 10 Fails to respond CSV-NR-C 3.0E-6/h 10 Plugs CSV-PG-C 5.0E-8/h 10
Leakage (external) CSV-LE-C 5.0E-7/h 10 Rupture (external) CSV-RE-C 3.0E-8/h 30
Pump Motor-Driven
Fails to start MDP-FS-C l.OE-2/d 10
Fails to run MDP-FR-C l.OE-4/h 10 Overspeed MDP-OS-C 3.0E-5/h 10 Fails to stop MDP-NS-C 1.0E-2/d 10 Leakage (external) MDP-LE-C l.OE-6/h 10 Rupture (external) MDP-RE-C 5.0E-8/H 30
Turbine-Driven Fails to start
TDP-FS-C 3.0E-2/d 10
Fails to run TDP-FR-C 1.0E-4/h 30 Overspeed TDP-OS-C 3.0E-5/h 10 Fails to stop TDP-NS-C 3.0E-2/d 10 Leakage (external) TDP-LE-C l.OE-6/h 10 Rupture (external) TDP-RE-C 5.0E-8/h 30
Diesel-Driven Fails to start
DDP-FS-C l.OE-2/d 10
ICPP-FRD.D/08-25-95/SA D-12

Table D-2. (Contd.) Chemical Process System Recommended Generic Failure Rates
Systera/Component/Failure Mode Component Identifier
Recommended Failure Rate Distribution
(log-normal)
Systera/Component/Failure Mode Component Identifier Mean*
Error Factor1*
Chemical Process Valve (Standby or Safety)
Manual Fails to open/close
XVM-CC-C or XVM-OO-C
3.0E-4/d 10
Fails to run DDP-FR-C 5.0E-3/h 10 Overspeed DDP-OS-C l.OE-3/h 10 Fails to stop DDP-NS-C l.OE-2/d 10 Leakage (external) DDP-LE-C l.OE-6/h 10 Rupture (external) DDP-RE-C 5.0E-8/h 30
Piping/Hose/Jumper Piping
Leakage (external) PIP-LE-C 3.0E-9/h-ft 10
Rupture (external) PIP-RE-C l.OE-10/h-ft
30
Plugs PIP-PG-C l.OE-10/h-ft
30
Hose Leakage (external)
HOS-LE-C 1.0E-9/h-ft 10
Rupture (external) HOS-RE-C 1.0E-8/h-ft 10 Plugs HOS-PG-C l.OE-8/h-ft 10
Jumper Leakage (external)
JPR-LE-C l.OE-6/h 10
Rupture (external) JPR-RE-C l.OE-8/h 30
Plugs JPR-PG-C 5.0E-8/h 10 Vessel
Tank (Unpressurized) Leakage (external)
TKU-LE-C l.OE-7/h 10
Rupture (external) TKU-RE-C 5.0E-9/h 30 Tank (Pressurized)
Leakage (external) TKP-LE-C l.OE-7/h 10
Rupture (external) TKP-RE-C 5.0E-9/h 30
ICPP-FRD.D/08-25-95/SA D-13

Table D-2. (Contd.) Chemical Process System Recommended Generic Failure Rates
Systera/Component/Fatlure Mode Component Identifier
RecQjjmended Failure Rate Distribution,
(log-normal)
Systera/Component/Fatlure Mode Component Identifier Mean*
Error, - Factor1*
Chemical Process Valve (Standby or Safety)
Manual Fails to open/close
XVM-CC-C or XVM-OO-C
3.0E-4/d 10
Flange/Gasket Leakage (external)
FLG-LE-C l.OE-7/h 10
Rupture (external) FLG-RE-C l.OE-9/h 10 Heat Exchanger
Shell/Tube Fouling (tubes)
HTX-FL-C l.OE-6/h 10
Plugs (tubes) HTX-PG-C 3.0E-7/h 10 Leakage (tubes) HTX-LI-C l.OE-6/h 10 Rupture (tubes) HTX-RI-C 5.0E-8/h 30 Leakage (shell) HTX-LE-C l.OE-7/h 10 Rupture (shell) HTX-RE-C 5.0E-9/h 30
Heater (Electrical) Fails to heat
HTE-FH-C l.OE-5/h 10
Overheats HTE-OH-C 3.0E-6/h 10 Leakage (external) HTE-LE-C l.OE-6/h 10 Rupture (external) HTE-RE-C 5.0E-8/h 30
Strainer/Filter Plugs
FLT-PG-C 3.0E-6/h 10
Leakage (internal) FLT-LI-C 3.0E-6/h 10 Rupture (internal) FLT-RI-C 5.0E-7/h 10
Orifice Plugs
ORF-PG-C l.OE-6/h 10
Miscellaneous Mixer/Blender
Failure MIX-FA-C 5.0E-6/h 10
Agitator Failure
AGI-FA-C 5.0E-6/h 10
ICPP-FRD.D/08-25-95/SA D-14

Table D-2. (Contd.) Chemical Process System Recommended Generic Failure Rates
Systera/Component/FaUure Mode Component Identifier
Recommended Failure Rate Distribution
(log-normal)
Systera/Component/FaUure Mode Component Identifier Mean*
Error Factor*
Chemical Process Valve (Standby or Safety)
Manual Fails to open/close
XVM-CC-C or XVM-OO-C
3.0E-4/d 10
Centrifuge Failure
CTF-FA-C 5.0E-6/h 10
a. Modifications of the recommended mean for hourly failure rates may be appropriate for components subjected to hostile radioactive or chemical environments.
b. Error factor is the 95th percentile/50th percentile.
ICPP-FRD.D/08-25-95/SA D-15

Table D-3. Compressed Sas System Recommended Generic Failure Rates
System/Component/Failure Hade Component Identifier
Recommended Failure Rate Distribution
(losr-norma?J
System/Component/Failure Hade Component Identifier Mean*
Error Factor1",
Compressed Gas Valve (Standby or Safety)
Manual Fails to open/close
XVM-CC-G or XVM-OO-G
l.OE-3/d 10
Plugs XVM-PG-G 5.0E-7/h 10 Leakage (internal) XVM-LI-G l.OE-5/h 10 Rupture (internal) XVM-RI-G 5.0E-7/h 30 Leakage (external) XVM-LE-G l.OE-7/h 10 Rupture (external) XVM-RE-G 5.0E-9/h 30
Check Fails to open
CKV-CC-G l.OE-4/d 10
Fails to close CKV-OO-G 3.0E-3/d 10 Plugs CKV-PG-G 5.0E-7/h 10
Leakage (internal) CKV-LI-G l.OE-5/h 10 Rupture (internal) CKV-RI-G 5.0E-7/h 30 Leakage (external) CKV-LE-G l.OE-7/h 10 Rupture (external) CKV-RE-G 5.0E-9/h 30
Motor-Operated Fails to open/close
MOV-CC-G or MOV-OO-G
l.OE-2/d 10
Spurious operation MOV-CO-G or MOV-OC-G
3.0E-7/h 10
Plugs MOV-PG-G 5.0E-7/h 10 Leakage (internal) MOV-LI-G l.OE-5/h 10 Rupture (internal) MOV-RI-G 5.0E-7/h 30 Leakage (external) MOV-LE-G l.OE-7/h 10 Rupture (external) MOV-RE-G 5.0E-9/h 30
Air-Operated Fails to open/close
AOV-CC-G or AOV-OO-G
3.0E-3/d 30
ICPP-FRD.D/08-25-95/SA D-16

Table D-3. (Contd.) Compressed Gas System Recommended Generic Failure Rates
System/Component/Fatture Mode, Component Identifier
Recommended failure Rate Distribution
(log-normal)
System/Component/Fatture Mode, Component Identifier Mean*
Error Factor1
Compressed Gas Valve (Standby or Safety)
Manual Fails to open/close
XVM-CC-G or XVM-OO-G
l.OE-3/d 10
Spurious operation AOV-CO-G or
AOV-OC-G l.OE-6/h 10
Plugs AOV-PG-G 5.0E-7/H 10 Leakage (internal) AOV-LI-G 1.0E-5/h 10 Rupture (internal) AOV-RI-G 5.0E-7/h 30 Leakage (external) AOV-LE-G 1.0E-7/h 10 Rupture (external) AOV-RE-G 5.0E-9/H 30
Solenoid-Operated Fails to open/close
SOV-CC-G or SOV-OO-G
3.0E-3/d 10
Spurious operation SOV-CO-G or SOV-OC-G
5.0E-7/h 10
Plugs SOV-PG-G 5.0E-7/h 10 Leakage (internal) SOV-LI-G 1.0E-5/h 10 Rupture (internal) SOV-RI-G 5.0E-7/h 30 Leakage (external) SOV-LE-G l.OE-7/h 10 Rupture (external) SOV-RE-G 5.0E-9/h 30
Safety/Relief Fails to open
SRV-CC-G 1.0E-2/d 10
Fails to reclose SRV-OO-G l.OE-2/d 10 Leakage (internal) SRV-LI-G l.OE-5/h 10 Rupture (internal) SRV-RI-G 5.0E-7/h 30 Leakage (external) SRV-LE-G l.OE-7/h 10 Rupture (external) SRV-RE-G 5.0E-9/h 30
Vacuum-Breaker Fails to open
VBV-CC-G 3.0E-2/d 10
ICPP-FRD.0/08-25-95/SA D-17

Table D-3. (Contd.) Compressed Gas System Recommended Generic Failure Rates
Systsm/Component/FafTure Mode Component Identifier
Recommended Failure Sate Distribution ';
(log-normal)
Systsm/Component/FafTure Mode Component Identifier Meat**
Error Factor*1
Compressed Gas Valve (Standby or Safety)
Manual Fails to open/close
XVM-CC-G or XVM-OO-G
l.OE-3/d 10
Fails to reclose VBV-OO-G 3.0E-2/d 10 Leakage (internal) VBV-LI-G l.OE-5/h 10 Rupture (internal) VBV-RI-G 5.0E-7/h 30 Leakage (external) VBV-LE-G l.OE-7/h 10 Rupture (external) VBV-RE-G 5.0E-9/h 30
Valve (Control) Motor-Operated
Fails open
CMV-FO-G 3.0E-6/h 10
Fails closed CMV-FC-G 3.0E-6/h 10 Fails to respond CMV-NR-G 3.0E-6/h 10 Plugs CMV-PG-G 5.0E-7/h 10 Leakage (external) CMV-LE-G l.OE-7/h 10 Rupture (external) CMV-RE-G 5.0E-9/h 30
Air-Operated Fails open
CAV-FO-G 3.0E-6/h 10
Fails closed CAV-FC-G 3.0E-6/h 10 Fails to respond CAV-NR-G 3.0E-6/h 10 Plugs CAV-PG-G 5.0E-7/h 10 Leakage (external) CAV-LE-G l.OE-7/h 10 Rupture (external) CAV-RE-G 5.0E-9/h 30
Solenoid-Operated Fails open
CSV-FO-G 3.0E-6/h 10
Fails closed CSV-FC-G 3.0E-6/h 10 Fails to respond CSV-NR-G 3.0E-6/h 10 Plugs CSV-PG-G 5.0E-7/h 10
ICPP-FRD.D/08-25-95/SA D-18

Table D-3. (Contd.) Compressed Gas System Recommended Generic Failure Rates
Systera/Component/Falfure Mode, Component Identifier ,
Recommended Failure Hate Distribution
{log-normal}
Systera/Component/Falfure Mode, Component Identifier , Mean*
Error Factor*
Compressed Gas Valve (Standby or Safety)
Manual Fails to open/close
XVM-CC-G or XVM-OO-G
l.OE-3/d 10
Leakage (external) CSV-LE-G l.OE-7/h 10
Rupture (external) CSV-RE-G 5.0E-9/h 30 Compressor
Motor-Driven Fails to start
MDC-FS-G 5.0E-3/d 5
Fails to run MDC-FR-G 5.0E-5/H 3 Overspeed MDC-OS-G l.OE-5/h 5 Fails to stop MDC-NS-G 5.0E-3/d 5 Leakage (external) MDC-LE-G 3.0E-7/h 10 Rupture (external) MDC-RE-G l.OE-8/h 30
Piping/Hose/Jumper/Tube Piping
Leakage (external) PIP-LE-G 3.0E-8/h-
ft 10
Rupture (external) PIP-RE-G l.OE-9/h-ft
30
Plugs PIP-PG-G l.OE-9/h-ft
30
Hose Leakage (external)
HOS-LE-G l.OE-8/h-ft
10
Rupture (external) HOS-RE-G l.OE-7/h-ft
10
Plugs HOS-PG-G l.OE-7/h-ft
10
Jumper Leakage (external)
JPR-LE-G l.OE-5/h 10
Rupture (external) JPR-RE-G l.OE-7/h 30 Plugs JPR-PG-G l.OE-7/h 30
ICPP-FRD.D/08-25-95/SA D-19

Table D-3. (Contd.) Compressed Gas System Recommended Generic Failure Rates
System/Component/FaSTJure Hode Component Identifier
Recommended Failure , Rate Distribution
{log-norma?}
System/Component/FaSTJure Hode Component Identifier - Mean*
Error „ Factor"
Compressed Gas Valve (Standby or Safety)
Manual Fails to open/close
XVM-CC-G or XVM-OO-G
l.OE-3/d 10
Tube Leakage (external)
TUB-LE-G 3.0E-7/h-ft
10
Rupture (external) TUB-RE-G l.OE-8/h-ft
30
Plugs TUB-PG-G l.OE-8/h-ft
30
Vessel Tank (Pressurized)
Leakage (external)
TKP-LE-G l.OE-7/h 10
Rupture (external) TKP-RE-G 5.0E-9/h 30 Cylinder (Pressurized)
Leakage (external) CYL-LE-G l.OE-7/h 10
Rupture (external) CYL-RE-G 5.0E-9/h 30 Flange/Gasket
Leakage (external) FLG-LE-G l.OE-7/h 10
Rupture (external) FLG-RE-G l.OE-9/h 10 Heat Exchanger
Shell/Tube Fouling (tubes)
HTX-FL-G l.OE-5/h 10
Plugs (tubes) HTX-PG-G 3.0E-6/h 10 Leakage (tubes) HTX-LI-G l.OE-5/h 10 Rupture (tubes) HTX-RI-G 5.0E-7/h 30 Leakage (shell) HTX-LE-G l.OE-6/h 10 Rupture (shell) HTX-RE-G 5.0E-8/h 30
Heater (Electrical) Fails to heat
HTE-FH-G l.OE-6/h 10
Overheats HTE-OH-G 3.0E-7/h 10 Leakage (external) HTE-LE-G l.OE-6/h 10
ICPP-FRD.D/08-25-95/SA D-20

Table D-3. (Contd.) Compressed Gas System Recommended Generic Failure Rates
Systera/Component/Failure Mode Component Identifier
Recommended failure Rate Distribution
(log-normal}
Systera/Component/Failure Mode Component Identifier Mean*
trror Factor
Compressed Gas Valve (Standby or Safety)
Manual Fails to open/close
XVM-CC-G or XVM-OO-G
l.OE-3/d 10
Rupture (external) HTE-RE-G 5.0E-8/h 30 Vaporizer
Failure VAP-FA-G l.OE-4/h 10
Air Dryer Failure
ADR-FA-G 5.0E-6/h 10
Filter Plugs
FLT-PG-G 3.0E-6/h 10
Leakage (internal) FLT-LI-G 3.0E-6/h 10 Rupture (internal) FLT-RI-G 5.0E-7/h 10
Orifice Plugs
ORF-PG-G l.OE-6/h 10
a. Modifications of the recommended mean for hourly failure rates may be appropriate for components subjected to hostile radioactive or chemical environments.
b. Error factor is the 95th percentile/50th percentile.
ICPP-FRD.D/08-25-95/SA D-21
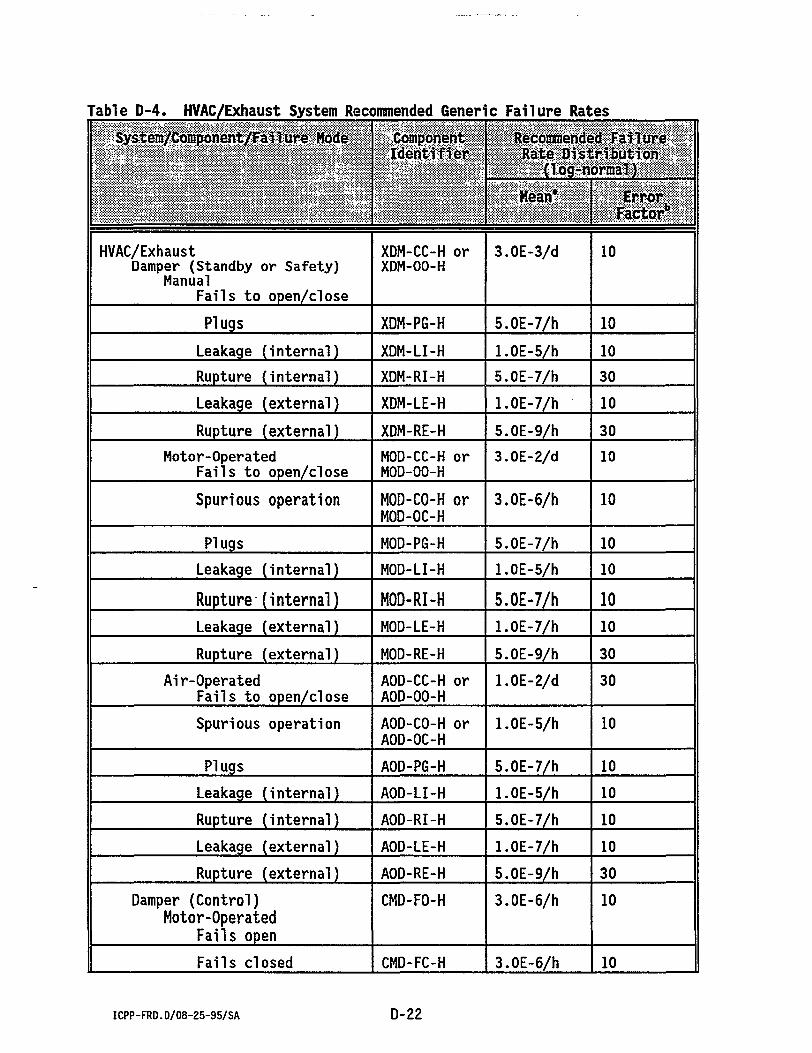
Table D-4. HVAC/Exhaust System Recommended Generi c Failure Rates Sy&tem/Coffiponent/Faflure Hode Component
Identifier Recommended Failure Rate Distribution
(log-normal} Sy&tem/Coffiponent/Faflure Hode Component
Identifier
Hean* Error Factor6
HVAC/Exhaust Damper (Standby or Safety)
Manual Fails to open/close
XDM-CC-H or XDM-OO-H
3.0E-3/d 10
Plugs XDM-PG-H 5.0E-7/h 10 Leakage (internal) XDM-LI-H l.OE-5/h 10 Rupture (internal) XDM-RI-H 5.0E-7/h 30 Leakage (external) XDM-LE-H l.OE-7/h 10 Rupture (external) XDM-RE-H 5.0E-9/h 30
Motor-Operated Fails to open/close
MOD-CC-H or M0D-00-H
3.0E-2/d 10
Spurious operation MOD-CO-H or MOD-OC-H
3.0E-6/h 10
Plugs MOD-PG-H 5.0E-7/h 10 Leakage (internal) MOD-LI-H l.OE-5/h 10 Rupture (internal) MOD-RI-H 5.0E-7/h 10 Leakage (external) MOD-LE-H l.OE-7/h 10 Rupture (external) MOD-RE-H 5.0E-9/h 30
Air-Operated Fails to open/close
AOD-CC-H or AOD-OO-H
l.OE-2/d 30
Spurious operation AOD-CO-H or AOD-OC-H
l.OE-5/h 10
Plugs AOD-PG-H 5.0E-7/H 10 Leakage (internal) AOD-LI-H l.OE-5/h 10 Rupture (internal) AOD-RI-H 5.0E-7/h 10 Leakage (external) AOD-LE-H l.OE-7/h 10 Rupture (external) AOD-RE-H 5.0E-9/h 30
Damper (Control) Motor-Operated
Fails open
CMD-FO-H 3.0E-6/h 10
Fails closed CMD-FC-H 3.0E-6/h 10
ICPP-FRD.D/08-25-95/SA D-22

Table D-4. (Contd.) HVAC/Exhaust System Recommended Generic Failure Rates
System/Coraponent/Failure Kode Component Identifier Recommended Failure Rate Distribution
(log-normal) System/Coraponent/Failure Kode Component Identifier
Hfian* Error Factor
HVAC/Exhaust Damper (Standby or Safety)
Manual Fails to open/close
XDM-CC-H or XDM-OO-H
3.0E-3/d 10
Fails to respond CMD-NR-H 3.0E-6/h 10 Plugs CMD-PG-H 5.0E-7/h 10
Leakage (external) CMD-LE-H 1.0E-7/h 10 Rupture (external) CMD-RE-H 5.0E-9/h 30
Air-Operated Fails open
CAD-FO-H 3.0E-6/h 10
Fails closed CAD-FC-H 3.0E-6/h 10 Fails to respond CAD-NR-H 3.0E-6/h 10 Plugs CAD-PG-H 5.0E-7/h 10
Leakage (external) CAD-LE-H l.OE-7/h 10 Rupture (external) CAD-RE-H 5.0E-9/h 30
Fan/Blower Motor-Driven
Fails to start MDF-FS-H 5.0E-3/d 5
Fails to run MDF-FR-H 3.0E-5/h 3 Overspeed MDF-OS-H 5.0E-6/h 10 Fails to stop MDF-NS-H 5.0E-3/d 10 Leakage (external) MDF-LE-H 3.0E-7/h 10 Rupture (external) MDF-RE-H 1.0E-8/h 30
Diesel-Driven Fails to start
DDF-FS-H l.OE-2/d 10
Fails to run DDF-FR-H 5.0E-3/h 10 Overspeed DDF-OS-H 1.0E-3/h 10 Fails to stop DDF-NS-H l.OE-2/d 10 Leakage (external) DDF-LE-H 3.0E-7/h 10
ICPP-FRD.D/08-25-95/SA D-23

Table D-4. (Contd.) HVAC/Exhaust System Recommended Generic Failure Rates
System/Component/Faiture Mode Component Identifier
Recommended Failure Sate Distribution
{log-normal:}
System/Component/Faiture Mode Component Identifier
Mean* Error Factor*
HVAC/Exhaust Damper (Standby or Safety)
Manual Fails to open/close
XDM-CC-H or XDM-OO-H
3.0E-3/d 10
Rupture (external) DDF-RE-H l.OE-8/h 10 Ducting
Leakage (external) DCT-LE-H 3.0E-7/h-
ft 10
Rupture (external) DCT-RE-H l.OE-8/h-ft
30
Plugs DCT-PG-H l.OE-8/h-ft
30
Heat Exchanger Air Conditioning Unit/ Chiller
Fails to start
ACU-FS-H l.OE-2/d 10
Fails to run ACU-FR-H 3.0E-5/H 10 Fan Cooler Unit
Fails to start FCU-FS-H l.OE-2/d 5
Fails to run FCU-FR-H l.OE-5/h 3 Heater (Electrical)
Fails to heat HTE-FH-H l.OE-6/h 3
Overheats HTE-OH-H 3.0E-7/h 10 Heater (Gas)
Fails to heat HTG-FH-H l.OE-3/h 10
Overheats HTG-OH-H 3.0E-4/h 10 Filter
Normal Plugs
FLT-PG-H 3.0E-6/h 10
Leakage (internal) FLT-LI-H 3.0E-6/h 10 Rupture (internal) FLT-RI-H 5.0E-7/h 10
Low-Efficiency Plugs
FLL-PG-H 3.0E-6/h 10
Leakage (internal) FLL-LI-H 3.0E-6/h 10
ICPP-FRD.D/08-25-95/SA D-24

Table D-4. (Contd.) HVAC/Exhaust System Recommended Generic Failure Rates
System/Component/Fail ure Mode Component Identi fler
Recommended Failure Rate ftfstrloutfon
(log-normal)
System/Component/Fail ure Mode Component Identi fler
Mean* Error Factor*
HVAC/Exhaust Damper (Standby or Safety)
Manual Fails to open/close
XDM-CC-H or XDM-OO-H
3.0E-3/d 10
Rupture (internal) FLL-RI-H 5.0E-7/h 10 HEPA
Plugs HPA-PG-H 3.0E-6/h 10
Leakage (internal) HPA-LI-H 3.0E-6/h 10 Rupture (internal) HPA-RI-H 5.0E-7/h 10
Sand Plugs
FLS-PG-H 3.0E-6/h 10
Leakage (internal) FLS-LI-H 3.0E-6/h 10 Rupture (internal) FLS-RI-H 5.0E-7/h 10
Baghouse Plugs
BAG-PG-H 3.0E-5/h 10
Leakage (internal) BAG-LI-H 3.0E-5/h 10 Rupture (internal) BAG-RI-H 5.0E-6/h 10
Miscellaneous Mist Eliminator
Failure MTE-FA-H l.OE-4/h 10
Scrubber Failure
SBR-FA-H l,0E-6/h 10
Precipitator Failure
PCP-FA-H 5.0E-5/h 10
a. Modifications of the recommended mean for hourly failure rates may be appropriate for components subjected to hostile radioactive or chemical environments.
b. Error factor is the 95th percenti1e/50th percentile.
ICPP-FRD.D/08-25-95/SA D-25
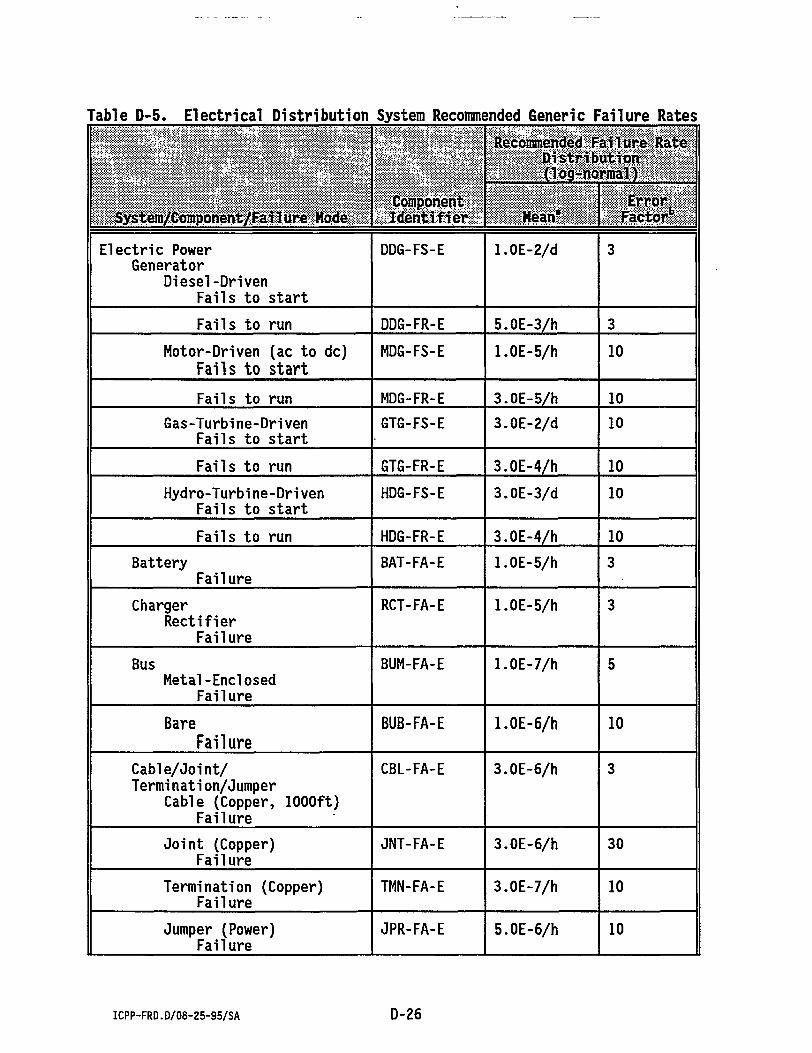
Table D-5. Electrical Distribution System Recommended Generic Failure Rates
System/Component/Failure Hode Component Identifier,
Recommended Failure Sate Distribution (log-normal)
System/Component/Failure Hode Component Identifier, Mean* Factor6,, ;
Electric Power Generator
Diesel-Driven Fails to start
DDG-FS-E 1.0E-2/d 3
Fails to run DDG-FR-E 5.0E-3/h 3 Motor-Driven (ac to dc)
Fails to start MDG-FS-E l.OE-5/h 10
Fails to run MDG-FR-E 3.0E-5/h 10 Gas-Turbine-Driven
Fails to start GTG-FS-E 3.0E-2/d 10
Fails to run GTG-FR-E 3.0E-4/h 10 Hydro-Turbi ne-Dri ven
Fails to start HDG-FS-E 3.0E-3/d 10
Fails to run HDG-FR-E 3.0E-4/h 10 Battery
Failure BAT-FA-E 1.0E-5/h 3
Charger Rectifier
Failure RCT-FA-E 1.0E-5/h 3
Bus Metal-Enclosed
Failure BUM-FA-E l.OE-7/h 5
Bare Failure
BUB-FA-E 1.0E-6/h 10
Cable/Joint/ Termi nati on/Jumper
Cable (Copper, 1000ft) Failure
CBL-FA-E 3.0E-6/h 3
Joint (Copper) Failure
JNT-FA-E 3.0E-6/h 30
Termination (Copper) Failure
TMN-FA-E 3.0E-7/h 10
Jumper (Power) Failure
JPR-FA-E 5.0E-6/h 10
ICPP-FRD.D/08-25-95/SA D-26
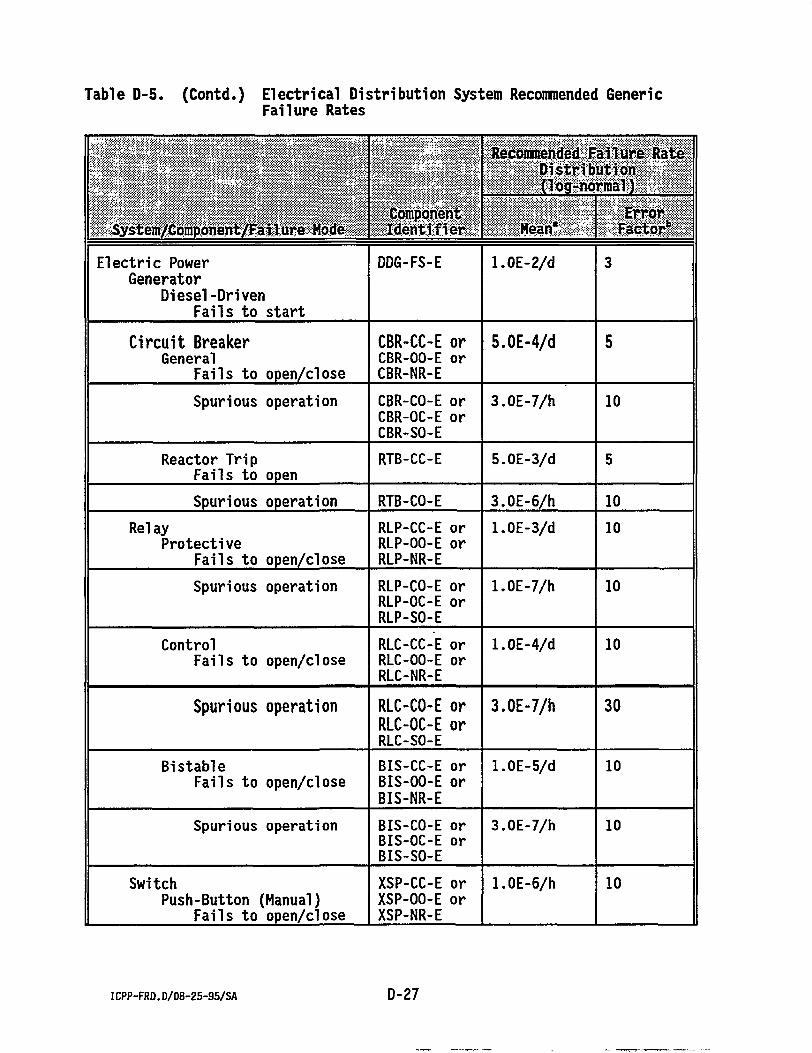
Table D-5. (Contd.) Electrical Distribution System Recommended Generic Failure Rates
Sy^tem/Component/Failure Mode Component Identifier
Recommended Failure Rate Distribution (log-normal)
Sy^tem/Component/Failure Mode Component Identifier Mean*
Error Factor*
Electric Power Generator
Diesel-Driven Fails to start
DDG-FS-E l.OE-2/d 3
Circuit Breaker General
Fails to open/close CBR-CC-E or CBR-OO-E or CBR-NR-E
5.0E-4/d 5
Spurious operation CBR-CO-E or CBR-OC-E or CBR-SO-E
3.0E-7/h 10
Reactor Trip Fails to open
RTB-CC-E 5.0E-3/d 5
Spurious operation RTB-CO-E 3.0E-6/h 10 Relay
Protective Fails to open/close
RLP-CC-E or RLP-OO-E or RLP-NR-E
l.OE-3/d 10
Spurious operation RLP-CO-E or RLP-OC-E or RLP-SO-E
l.OE-7/h 10
Control Fails to open/close
RLC-CC-E or RLC-OO-E or RLC-NR-E
l.OE-4/d 10
Spurious operation RLC-CO-E or RLC-OC-E or RLC-SO-E
3.0E-7/h 30
Bistable Fails to open/close
BIS-CC-E or BIS-OO-E or BIS-NR-E
l.OE-5/d 10
Spurious operation BIS-CO-E or BIS-OC-E or BIS-SO-E
3.0E-7/h 10
Switch Push-Button (Manual)
Fails to open/close XSP-CC-E or XSP-OO-E or XSP-NR-E
l.OE-6/h 10
ICPP-FRD.D/08-25-95/SA D -27

Table D-5. (Contd.) Electrical Distribution System Recommended Generic Failure Rates
System/Component/Failure Mode . Component Identifier
Recommended Failure Rate Distribution Clog-normal)
System/Component/Failure Mode . Component Identifier Bean*
Error Factor*
Electric Power Generator
Diesel-Driven Fails to start
DDG-FS-E l.OE-2/d 3
Spurious operation XSP-CO-E or XSP-OC-E or XSP-SO-E
l.OE-6/h 10
Rotary (Manual) Fails to open/close
XSR-CC-E or XSR-OO-E or XSR-NR-E
5.0E-8/h 10
Spurious operation XSR-CO-E or XSR-OC-E or XSR-SO-E
5.0E-7/h 10
Key-Operated (Manual) Fails to open/close
XSK-CC-E or XSK-OO-E or XSK-NR-E
3.0E-7/h 10
Spurious operation XSK-CO-E or XSK-OC-E or XSK-SO-E
l.OE-6/h 10
Automati c-Transfer Fails to open/close
ATS-CC-E or ATS-OO-E or ATS-NR-E
l.OE-6/h 10
Spurious operation ATS-CO-E or ATS-OC-E or ATS-SO-E
l.OE-6/h 10
Limit Fails to open/close
LMS-CC-E or LMS-OO-E or LMS-NR-E
l.OE-6/h 10
Spurious operation LMS-CO-E or LMS-OC-E or LMS-SO-E
l.OE-6/h 5
Fuse Fail to open
FUS-CC-E l.OE-7/h 10
Premature opening FUS-SO-E l.OE-8/h 10 Inverter
Failure INV-FA-E l.OE-5/h 3
ICPP-FRD.D/08-25-95/SA D-28

Table D-5. (Contd.) Electrical Distribution System Recommended Generic Failure Rates
System/Component/Failure Mode Component Identifier
Recommended Failure: Rate. Distribution (log-nomial}
System/Component/Failure Mode Component Identifier Hean*
Error Factor*
Electric Power Generator
Diesel-Driven Fails to start
DDG-FS-E l.OE-2/d 3
Motor AC
Fails to start MRA-FS-E 3.0E-4/d 3
Fails to run MRA-FR-E 5.0E-6/h 3 DC
Fails to start MRD-FS-E 3.0E-4/d 3
Fails to run MRD-FR-E l.OE-5/h 3 Synchro
Failure SYN-FA-E l.OE-5/h 10
Transformer Power Failure
TFP-FA-E l.OE-6/h 10
Instrumentati on/Control Failure
TFI-FA-E l.OE-6/h 10
a. Modifications of the recommended mean for hourly failure rates may be appropriate for components subjected to hostile radioactive or chemical environments.
b. Error factor is the 95th percentile/50th percentile.
ICPP-FRD.D/08-25-95/SA D-29

Table D-6. Instrumentation and Control System Recommended Generic Failure Rates
Sy^era/Component/Failure Mode Component "" Identifier
Recommended Failure Rate Distribution (log-normal) Sy^era/Component/Failure Mode
Component "" Identifier
Mean* Errort
Factor*
Instrumentation and Control Alarm/Annunci ator
Fails to alarm ALR-NR-I 3.0E-5/h 10
Spurious operation ALR-SO-I 5.0E-6/h 10 Sensor/Transmi tter/ Transducer/Process Switch
Temperature Failure
TST-FA-I l.OE-6/h 3
Pressure Failure
PST-FA-I l.OE-6/h 3
Differential Pressure Failure
DPS-FA-I 3.0E-6/h 10
Flow Failure
FST-FA-I 3.0E-6/h 3
Level Failure
LST-FA-I 5.0E-7/h 3
Humidity Failure
UST-FA-I l.OE-5/h 10
pH Failure
HST-FA-I 5.0E-7/h 5
Oxygen Concentration Failure
OXC-FA-I l.OE-5/h 10
C0 2 Concentration Failure
COC-FA-I l.OE-4/h 10
Hydrogen Concentration Failure
HYC-FA-I l.OE-5/h 3
Nitrogen Concentration Failure
NIC-FA-I l.OE-5/h 3
Hydrocarbon Concentration Failure
HCC-FA-I l.OE-5/h 3
Helium Concentration Failure
HEC-FA-I l.OE-5/h 3
Speed Failure
SST-FA-I l.OE-6/h 10
ICPP-FRD.D/08-25-95/SA D-30

Table D-6. (Contd.) Instrumentation and Control System Recommended Generic Failure Rates
Systera/Component/FafTuro Mode Component s Identifier
Recommended Failure Sate Distribution (log-normal) Systera/Component/FafTuro Mode
Component s Identifier
Mean* Error Factor6
Instrumentation and Control Alarm/Annunci ator
Fails to alarm ALR-NR-I 3.0E-5/h 10
Seismic Failure
SET-FA-I l.OE-6/h 5
Radiation Failure
RST-FA-I 5.0E-6/H 5
Indicator Failure
IND-FA-I l.OE-5/h 10
Amplifier Failure
AMP-FA-I 5.0E-6/h 10
Modifier/Signal Conditioner Failure
SCR-FA-I 3.0E-7/h 3
Logic Module Failure
LOG-FA-I 3.0E-6/h 5
Recorder Failure
REC-FA-I 3.0E-5/h 30
Sampler Failure
SAM-FA-I l.OE-5/h 10
Analyzer Failure
ANA-FA-I 5.0E-6/h 10
Timer Failure
TMR-FA-I 5.0E-6/h 10
Gas Chromatograph Failure
GCR-FA-I 5.0E-5/H 10 Voltage Regulator
Failure VRG-FA-I 3.0E-6/h 10
Transmitter Failure
TRM-FA-I 3.0E-6/H 10
ICPP-FRD.D/08-25-95/SA D-31

Table D-6. (Contd.) Instrumentation and Control System Recommended Generic Failure Rates
Systero/Component/Failure Mode Component Identifier
Recommended Failure Rate Distribution (log-normal) Systero/Component/Failure Mode
Component Identifier
Heau* Error Factor
Instrumentation and Control Alarm/Annunci ator
Fails to alarm ALR-NR-I 3.0E-5/h 10
Transducer Failure
TRD-FA-I l.OE-6/h 10
Programmable Logic Controller Failure PLC-FA-I 3.0E-5/h 10
a. Modifications of the recommended mean for hourly failure rates may be appropriate for components subjected to hostile radioactive or chemical environments.
b. Error factor is the 95th percentile/50th percentile. 1. Savannah River Laboratory, "Savannah River Site Generic Database
Development," WSRC-TC-93-262.
ICPP-FRD.D/08-25-95/SA D-32

APPENDIX E
ICPP-FRD.E/08-25-95/SA E-1

Appendix E
Example Calculation
This appendix provides a quick overview and walkthrough of the type of calculation developed and used in the Idaho Chemical Processing Plant (ICPP) database. The sample calculation contains fabricated data, therefore, the values generated have no true meaning and are not found within the ICPP failure rate database.
ICPP-FRD.E/08-25-95/SA E-2

Appendix E
Example Calculation
Overview; This appendix is designed to quickly instruct the reader on the method used in calculating the As, 5th percentiles, 95th percentiles, and the standard error reported within the ICPP database. The example will walk the reader through the calculation, step-by-step. The example contains sample data and does not calculate an actual X reported.
To perform the calculation, the following pieces of information are required:
1) Specific listing of all equipment items in use 2) Listing of every failure for all equipment items 3) Mission time for each equipment item 4) Failure mode for each failure (if possible).
Steps 1 through 5: Manipulation of the raw data (MODEL #1) Step #1 - Calculate X for each equipment item,
where X = — — , N=l for individual equipment items. Nt*
Step #2 - Calculate the %2 distribution XL (5th percentile), using a Bayesian adjustment for each equipment item,
• _ Xo.os (2fl+l) A i 2t
Step #3 - Calculate %2 distribution Xv (95th percentile) using a Bayesian adjustment for each equipment item,
* X0.95 ( 2 n + l )
ICPP-FRD.E/08-25-95/SA E-3

Step #4 - Calculate the Dispersion Factor (DF) for each equipment item,
D F * 2 = \ Is
Step #5 - Repeat steps 1-4 for the total group (total number of failures, and the mission time = N t * ) .
Note: If N is very large, difficulties arise in generating the %2
distribution values, and, thus, the following approximation was used:
^_ U p-*V2v^T) 2
XP 2 Where: xp=equivalent normal distribution percentile
i.e. x 0 - 9 5=1.645, x 0 > 0 5 = -1.645 v =2i2 + l (i2=# of failures)
Steps 6 through 10: Loqnormal Distribution of the Individual Failure Rates (MODEL #2)
Step #6 - Calculate X, based from the individual Xs; N X,
N i - V " .1=1
Step #7 - Calculate the variance (s2) and standard deviation (s) of the individual Xs.
S2=l=l
N _ 2 Ui-XV
2 2 - 1
S=T/S*
ICPP-FRD.E/08-25-95/SA E-4

Step #8 - Using X & s 2 , calculate C2 & *l (lognormal variance and lognormal mean), using the following equations:
C2 = l n ( l + -l£) X2
ti = ln(X)--|c 2
Step #9 - Generate the lognormal TL, TM, Tn: : X L = eH-1.645C
Step #10 - Calculate the ldgnormal Error Factor (EF).
Steps 11 through 17: Ad/justed Loonormal Distribution Calculation (ADJUSTMENT)
Step #11 - Calculate the adjusted lognormal EF: adj EF=DF*EF
Step #12 - Calculate the adjusted lognormal mean, f[, by: fj=ln(Xtf)
Step #13 - Calculate the adjusted standard deviation (£ ) : -r _ In (adj EF)
1.645
Step #14 - Calculate the adjusted A (X) ,
l = e 2
ICPP-FRD.E/08-25-95/SA E-5

Step #15 - Generate the adjusted 90% confidence limits: X, X - L
K L DF
X^X^DF
Step #16 - Calculate the adjusted variance and the adjusted stand ard dev i at i on:
a2 = X2
e o = Jo
Step #17 - Calculate the standard error (S)
t*
ICPP-FRD.E/08-25-95/SA E-6

o d e
vy
Step#1 . . . . r h Failure Rate For Mission iime-i- Individual Step #2
h Equipment Items
X=n/Nt* X2 Lower Limit (5%)
X2o.o5(2n+1)/(2t) Number of Failures (n) h Equipment Items
X=n/Nt* X2 Lower Limit (5%)
X2o.o5(2n+1)/(2t)
I I I V " Basic Data T
Equipment ID # # of Fails time(h) f a. hat X 2LL X 2UL DF ' CRN-FR-903 46 75360 6.10E-04 4.76E-04 7.73E-04 1.27
CRN-FS-901 21 75360 2.79E-04 1.92E-04 3.93E-04 1.43 CRN-FT-911 3 75360 3.98E-05 1.44E-05 9.33E-05 2.55
CRN-NCC-901 2 75360 2.65E-05 7.60E-06 7.35E-05 3.11 CRN-NCD-300 0 75360 3.05E-06 2.61 E-08 2.55E-05 31.26 CRN-NCD-901 15 75360 1.99E-04 1.28E-04 2.98E-04 1.53 CRN-PM-145 1 75360 1.33E-05 2.33E-06 5.18E-05 4.71 CRN-PM-901 4 75360 5.31 E-05 2.21 E-05 1.12E-04 2.26 CRN-PM-902 0 75360 3.05E-06 2.61 E-08 2.55E-05 31.26
Total 92 678240 1.36E-04 1.14E-04 1.61 E-04 1.19
Step #3 X2 Upper Limit (95%)
X*o.ss(2n+1)/(2t)
1 Step #4
Dispersion Factor
Step #5 Repeat Steps #(1-4)
for Total Group •"(Please See Note
in Write-up)*"
A / l \ o d e I
#
d i u s t
m e n
Step #7 Calc. Variance and Standard Deviation
VAR=s2 STD DEV=s
Step #8 Calculate C?& t\, using X
bar and the variance £2=ln(1+((>.bar)2)/VAR)
T!=ln(Xbar)-J^2
Step #11 Calculate Adjusted EF
Adj EFgEF'DFTOTAL
Step #12 Calculate Adj -n Adj n = In(XM)
JZ.
Step #13 Calculate Adj C,
Adjt; = ln(adjEF)/1.645
ad j^ 2 =(ad jg 2 |
Adjusted Lognormal Distribution Adj X (X~)
Adj Variance Adj Std Dev AdiC^CS AdjC(C~) Adj IT fry)
Adj 5% (XL~) Adj 50% (XM~) Adj 95% (XQ~)
Adj EF Std Error (s hat)
1.53E-04 7.69E-09 8.77E-05 1.4007 1.1835 -9.4829
1.09E-05 7.61 E-05 5.33E-04
7.01 1.50E-05
Adj 50% = Lognormal 50%
Step #9 Lognormal Distribution of Individual Failure Rates
Calculate 5%. 50%, & 95% of the lognormal distribution Xu=exp(7,-1.645g (5%) W=expfa) (50%) X^expfo+Lo^Sg (95%)
Xbar 1.36E-04
•M 1
Calculate 5%. 50%, & 95% of the lognormal distribution Xu=exp(7,-1.645g (5%) W=expfa) (50%) X^expfo+Lo^Sg (95%)
Variance 4.10E-08
•M 1
Calculate 5%. 50%, & 95% of the lognormal distribution Xu=exp(7,-1.645g (5%) W=expfa) (50%) X^expfo+Lo^Sg (95%) Std Dev 2.02E-04
•M 1
Calculate 5%. 50%, & 95% of the lognormal distribution Xu=exp(7,-1.645g (5%) W=expfa) (50%) X^expfo+Lo^Sg (95%)
? 1.1649 •M 1
Calculate 5%. 50%, & 95% of the lognormal distribution Xu=exp(7,-1.645g (5%) W=expfa) (50%) X^expfo+Lo^Sg (95%)
? 1.1649 •M 1 C 1.0793 •M 1 k-Vrc2)l
Tl -9.4829 1--11J 5% 1.29E-05 Step #10
Generate the Log Normal Error Factor
EF=exp(1.645Q
5% 1.29E-05 Step #10 Generate the Log
Normal Error Factor EF=exp(1.645Q
50% 7.61 E-05 Step #10
Generate the Log Normal Error Factor
EF=exp(1.645Q
50% 7.61 E-05 Step #10
Generate the Log Normal Error Factor
EF=exp(1.645Q 95% 4.49E-04
Step #10 Generate the Log
Normal Error Factor EF=exp(1.645Q
95% 4.49E-04 • ^
Step #10 Generate the Log
Normal Error Factor EF=exp(1.645Q EF 5.90 • ^
Step #10 Generate the Log
Normal Error Factor EF=exp(1.645Q
Step #17 Finally, calculate the Standard Error
e hat = V(adj X * time) / time
Step #14 Calculate the adjusted
failure rate x~ adj X = exp(T|+'54£2)
Step #15 Generate the adjusted 90%
confidence limits adj Xu = lognormal XJDF adj XL = lognormal XJDF
Step #16 Calculate the adjusted variance
and standard deviation Adjs2=X2/(e' :2-1) Adj s=V(adj s2)
ICPP-FRD.E/08-25-95/SA E-7
Related Documents