WORCESTER POLYTECHNIC INSTITUTE Ocean Wave Energy Harvesting Off-Shore Overtopping Design Steven Como, Passe Meas, Kelsey Stergiou, and Jessica Williams With the Assistance of Jan Keleher 4/30/2015 This report represents the work of WPI undergraduate students submitted to the faculty as evidence of completion of a degree requirement. WPI routinely publishes these reports on its website without editorial or peer review. For more information about the projects program at WPI, please see http://www.wpi.edu/academics/ugradstudies/project-learning.html

Welcome message from author
This document is posted to help you gain knowledge. Please leave a comment to let me know what you think about it! Share it to your friends and learn new things together.
Transcript

WORCESTER POLYTECHNIC INSTITUTE
Ocean Wave Energy Harvesting
Off-Shore Overtopping Design
Steven Como, Passe Meas, Kelsey Stergiou, and Jessica Williams
With the Assistance of Jan Keleher
4/30/2015
This report represents the work of WPI undergraduate students submitted to the faculty as
evidence of completion of a degree requirement. WPI routinely publishes these reports on its
website without editorial or peer review. For more information about the projects program at
WPI, please see http://www.wpi.edu/academics/ugradstudies/project-learning.html

i
Abstract
Renewable energy is a constantly discussed topic in the scientific world, for many of the
energy sources used daily are in short supply. As the ocean makes up 70% of the Earth, wave
energy is an option that could potentially produce a large amount of power. Various wave-
capturing mechanisms were researched and analyzed. A new device was designed and
manufactured, while a wave tank was constructed to test the power output of the device. By
simulating deep water waves, it was found that the power produced by the prototype yielded
approximately 0.010W. Using Froude scaling ratios, a scaled up model would produce about 254
W/ft of wave front. This power production compares to similar devices at about 133 W/ft;
however the overall size of the new device is much smaller than the massive scale of competing
products. The proposed design defines a space-efficient model for producing sustainable energy
from wave power.

ii
Table of Contents Abstract ............................................................................................................................................ i
Table of Figures ............................................................................................................................. iii
Table of Tables .............................................................................................................................. iv
Chapter 1 – Introduction ................................................................................................................. 1
Chapter 2 – Background ................................................................................................................. 2
2.1 Why Renewable Ocean Energy? ........................................................................................... 2
2.2 Why Waves? ......................................................................................................................... 2
2.3 Types of Wave Energy Harvesting ....................................................................................... 6
2.4 Overtopping Design Combination ........................................................................................ 8
Chapter 3 - Methodology .............................................................................................................. 11
3.1 Existing Designs .................................................................................................................. 11
3.2 Scaling Factors .................................................................................................................... 11
3.2.1. Assumptions ................................................................................................................ 12
3.2.2. Froude Scaling Factor .................................................................................................. 13
3.2.3. Power Calculations ...................................................................................................... 16
3.3 Development of Wave Generation System ......................................................................... 18
3.3.1. Wave Height Calculations ........................................................................................... 19
3.3.2. Geometry of Four Bar Mechanism .............................................................................. 22
3.3.3. Power Requirements & Motor Preparation ................................................................. 23
3.3.4. Stresses Exerted at the Joints ....................................................................................... 30
3.3.5. Other Considerations ................................................................................................... 32
3.4 Design of Overtopping Device ............................................................................................ 33
3.5 Construction of Test Tank and Device ................................................................................ 36
3.5.1. Test Tank Construction ............................................................................................... 36
3.5.2. Device Construction .................................................................................................... 37
3.5.3. Assembly of Testing Unit ............................................................................................ 38
Chapter 4 – Testing & Data Collection......................................................................................... 42
Chapter 5 – Results & Analysis .................................................................................................... 45
Chapter 6 – Conclusions & Future Improvements ....................................................................... 51
References ..................................................................................................................................... 52
Appendix A ................................................................................................................................... 54

iii
Table of Figures
Figure 1: Map of Wave Power Potential throughout the World ..................................................... 2
Figure 2: Schematic Deriving Potential Energy and Power of a Wave .......................................... 5
Figure 3: Point Absorber Device .................................................................................................... 6
Figure 4: Wave Attenuator Device ................................................................................................. 7
Figure 5: Oscillating Water Column ............................................................................................... 8
Figure 6: Overtopping Device ........................................................................................................ 8
Figure 7: Schematic of Device ...................................................................................................... 16
Figure 8: Wave Capture Schematic .............................................................................................. 17
Figure 9: Wave Generation Mechanism ....................................................................................... 19
Figure 10: Diagram for Wave Height Determination ................................................................... 21
Figure 11: Wave Generator Geometry .......................................................................................... 23
Figure 12: FBD of Board .............................................................................................................. 24
Figure 13: FBD of Rod ................................................................................................................. 25
Figure 14: FBD of Cam ................................................................................................................ 26
Figure 15: Variety of Duty Cycle Outputs Generated by PWM ................................................... 27
Figure 16: Circuit Diagram of Pulse Width Modulator ................................................................ 28
Figure 17: Motor Cam .................................................................................................................. 29
Figure 18: Cam Attached to Motor ............................................................................................... 29
Figure 19: Hinges Connecting Board to Test Tank ...................................................................... 30
Figure 20: Pin Connecting Rod to Board ...................................................................................... 31
Figure 21: Pin Connecting Cam to Rod ........................................................................................ 32
Figure 22: Overtopping Prototype ................................................................................................ 33
Figure 23: Ramp Design ............................................................................................................... 34
Figure 24: Tier Section Design ..................................................................................................... 35
Figure 25: Tier Drain System ....................................................................................................... 35
Figure 26: SolidWorks Drawing and Model of Wave Tank ......................................................... 36
Figure 27: Exploded View and Final Construction of the Wave Tank......................................... 36
Figure 28: Biscuit Joint Exploded View ....................................................................................... 37
Figure 29: Clamped Tier 1 to Allow Proper Setting Of Biscuit Joints ......................................... 37
Figure 30: Cross-Section of the Sideboards.................................................................................. 38
Figure 31: SolidWorks Drawing of the Backboard ...................................................................... 38
Figure 32: Drawing of Expansion Adapter for Water Collection ................................................. 39
Figure 33: Inner Tube Design for Testing Different Tiers ........................................................... 39
Figure 34: Finalized Inner Tube Design with O-Rings ................................................................ 40
Figure 35: Final Assembly Wave Generator ................................................................................ 41
Figure 36: Final Assembly Wave Converter ................................................................................ 41
Figure 37: Characteristic Waves ................................................................................................... 42
Figure 38: Low-Head Kaplan Turbine Characteristics ................................................................. 49

iv
Table of Tables
Table 1: Froude Scaling Ratio for Model and Prototype Similarities .......................................... 14
Table 2: Froude Scaling Ratios for Model Scaling ....................................................................... 15
Table 4: Volume Collection Data ................................................................................................. 43
Table 5: Drain Time and Volumetric Flowrate............................................................................. 44
Table 6: Prototype Scale Power Output ........................................................................................ 46
Table 7: Froude Scaling Ratio Calculations ................................................................................. 47
Table 8: Full-Size Model Scale Power Output ............................................................................. 47
Table 9: Low-Head Kaplan Hydro Turbine Specifications ......................................................... 47
Table 10: Low-Head Kaplan Turbine Calculations ...................................................................... 48
Table 11: Optimized Number of Kaplan Turbines ....................................................................... 50
Table 12: Actual Power Output of the Full-Scale System ............................................................ 50
Table 13: Proposed Design vs. Existing Market ........................................................................... 50

1
Chapter 1 – Introduction
The population is well aware of the energy crisis and the need for clean, renewable
energy sources. Due to the high potential of ocean power available in waves, wave energy
harvesting is an industry with a constant flux of emerging start-up companies innovating ideas to
capture this energy. Waves are a natural, renewable, free source of energy, providing an ideal
alternative to other detrimental sources because the collection and redistribution of waves allows
for endless energy harvesting. Through many approaches in converting wave energy into
electricity, cost efficiency, safety, and reliability have been defining features of success. There
are four main types of energy converter mechanisms, but overtopping devices will be the focus
for this project.
Overtopping devices collect ocean waves in an above-water reservoir and then discharge
the water into the ocean by means of turbines. The Wave Dragon is an example of an
overtopping device that gathers waves by using two long arms that direct water into a central
reservoir. The Wave Dragon then releases the water back into the ocean once it has gone through
the turbines. The Seawave Slot-cone Generator utilizes tiered reservoirs to amass more of the
wave without using arms to reroute it. Within this project, a three-tiered overtopping device was
developed to collect waves of differing heights within a motorized wave tank that would
simulate deep-water waves. The deep-water aspect of the device appeals to the aesthetic
dimension, for a coastal collection overtopping device impedes the view from beaches and
coastlines. It can also upset fishing locations and habitats of a variety of sea creatures. This new
overtopping device was a combination of many ideal characteristics of other researched wave
harvesting devices, including the tiers and turbines to collect the waves and produce power.
Many calculations were performed to discover the ideal scaling factors, proper cam dimensions,
and necessary motor parameters. The purpose of this project was to develop a new overtopping
device that could produce just as much power, if not more, than products currently on the
market.

2
Chapter 2 – Background
2.1 Why Renewable Ocean Energy?
The need for additional energy to sustain the growing population of the world calls for
better and more innovative technologies. Many current technologies include nuclear power or
biofuels, which have been linked to environmental concerns. Ocean energy harvesting devices
became popular in 2008 with an array of designs, including floating wind turbines, as well as
tidal, wave, and thermal energy converters (Esteban, 2012). Clean, renewable energy harvesting
is preferred over nuclear or biofuel-powered plants, but many renewable sources are unable to be
operated on a large-scale. In order to find a way to implement large-scale operation, different
designs are continuously being researched and developed.
2.2 Why Waves?
The advantages of wave energy harvesters outnumber the advantages of other ocean
energy harvesting methods such as tidal power, ocean thermal energy conversion (OTEC), and
saline mechanisms. Waves are abundant in all areas throughout the ocean, making them more
useful in energy harvesting than tides. Although tides have the potential to generate large
amounts of power (approximately 3,000 GW worldwide) less than 3% of areas are suitable to
actually harness tidal power (Esteban, 2012). Tides are predictable and consistent; however, due
to the limited abundance of locations, tidal power is difficult to incorporate on a large scale.
Alternatively, waves are not as easy to predict, but they are found in many more locations
throughout the world, as can be seen in Figure 1.
Figure 1: Map of Wave Power Potential throughout the World (Alamian, 2014)

3
The map shows that there is high wave power potential in widespread areas, especially
those further from the equator. Wave energy has been estimated to have the potential to produce
1,000-10,000 GW of power, which is close to the world electrical energy consumption (Esteban,
2012). From this information, it can be argued that wave energy harvesting is more accessible
than tidal energy harvesting.
Although wave energy converters provide a method for clean energy harvesting, there are
some disadvantages in using this technology. A primary concern of implementing any
mechanical device into the marine environment is the potential of polluting the water. This
pollution may be in the form of debris, oil, or other lubricants from the device. To ensure the
cleanliness of the proposed design, the electrical generator is located onshore and underwater
power lines will allow associated components to be located on land. Furthermore, imposing on
natural habitats is an environmental hazard presented by construction of any systems. Since the
device floats on the water in the open ocean, no habitats will be disturbed and any harm to
animals would be very unlikely. Lastly, invasive products introduced into the environment are
aesthetically deterring to tourists and natives of the region. Wave energy converters are massive
and can take away from the natural beauty of the marine atmosphere. The proposed system
addresses this issue by the utilization of open ocean waves and locating the device out of sight
and therefore out of mind. In conclusion, the disadvantages that generally result from such
devices were accounted for in the design to best suit the environment.
Another form of ocean energy harvesting is by OTEC mechanisms. OTEC utilizes the
ocean’s natural absorption of solar energy to produce power. As the heat of the sun warms the
surface of the water a temperature gradient is created. The temperature of the surface water will
vaporize a fluid with a low-boiling point, which will then expand into gas and spin a turbine.
This turbine is connected to a generator, which produces electricity. Cooler seawater is brought
in by a pump that cools the vapor back into a liquid so it can be continuously reused in the cycle.
The larger the temperature differential, the higher the efficiency of the cycle; therefore, ideal
locations for this technology include waters around the Equator (Esteban, 2012). The limitation
of efficiency and location provides evidence why waves are a more accessible and favorable
option in the field of ocean energy harvesting.
Prototype saline mechanisms harvest energy from bodies of water where both fresh and
salt water are present, such as estuaries. The mechanism divides the water types by means of a

4
semipermeable membrane. The osmosis that occurs as the fresh water moves across the gradient
of higher salinity to dilute the solution increases pressure. Once the system reaches a certain
pressure, achieving a high enough head, it will spin a turbine and generate power (Lockwood,
2013). The complexity of this mechanism, along with the limitations in location, makes saline
energy converters less feasible than wave energy converters.
Although a number of renewable energy sources are undergoing research, wave energy
harvesting provides advantages over other competitive methods. One major advantage is the
wide span of locations in which waves can be captured. Devices can be incorporated in the open
ocean where high energy waves are present or along the coastline to minimize construction and
maintenance costs. Unlike solar energy, waves can be continuously collected at all hours of the
day and night. In addition to the versatility in location and collection times, waves are produced
year round and are a source of free energy. A major benefit of wave converter devices is their
minimal use of land when compared to wind farms, power plants, and other power production
sites such as the Alaskan pipeline. There are numerous advantages to using different forms of
alternative energy; however, wave power is a compelling source for energy production.
In order to understand how to extract power from waves, it is essential to first understand
the mechanism of how waves work. Waves are created by the force of wind on open water. As
the force of the wind reaches the surface of the water, waves are produced. These waves then
travel, containing high amounts of energy, until they reach an area of shallow depth, usually a
beach. At this point, waves begin to lose energy due to frictional losses at the seabed surface.
The wavelengths shorten, speeds are reduced, and the wave profile steepens; resulting in the
“breaking” of the wave (Tester, 2012). Due to this loss of energy, waves in open water have
much higher energies than waves that are found along coastal regions.
All waves have potential energy that can be transformed to power through use of wave
energy converters. Waves that are far offshore exhibit higher potential energy than waves that
are found near the shoreline by about 10% (Thurman, 2001). The potential energy of a wave can
be calculated by the following equation:
∆𝑃𝐸 =1
16𝜌𝜆𝑔ℎ2
In this equation, the potential energy only accounts for two dimensions, meaning that this is the
potential energy per unit width of the wave. The variables in the above equation represent:

5
𝜌 = 𝑑𝑒𝑛𝑠𝑖𝑡𝑦 𝑜𝑓 𝑡ℎ𝑒 𝑤𝑎𝑡𝑒𝑟 (1025𝑘𝑔
𝑚3 𝑓𝑜𝑟 𝑠𝑒𝑎𝑤𝑎𝑡𝑒𝑟)
𝑔 = 𝑎𝑐𝑐𝑒𝑙𝑒𝑟𝑎𝑡𝑖𝑜𝑛 𝑜𝑓 𝑔𝑟𝑎𝑣𝑖𝑡𝑦 (9.81𝑚
𝑠2)
ℎ = 𝑐𝑟𝑒𝑠𝑡 − 𝑡𝑜 − 𝑡𝑟𝑜𝑢𝑔ℎ 𝑤𝑎𝑣𝑒 ℎ𝑒𝑖𝑔ℎ𝑡 (𝑎𝑏𝑜𝑢𝑡 2𝑚)
𝜆 = 𝑤𝑎𝑣𝑒𝑙𝑒𝑛𝑔𝑡ℎ
The wavelength can be described as:
𝜆 =𝑔𝑇2
2𝜋
Where:
𝑇 = 𝑤𝑎𝑣𝑒 𝑝𝑒𝑟𝑖𝑜𝑑 (𝑎𝑝𝑝𝑟𝑜𝑥𝑖𝑚𝑎𝑡𝑒𝑙𝑦 5 − 10𝑠)
The potential energy of the wave can then be converted to power by dividing the potential energy
by the time period. This results in the following equation for power:
𝑃 =1
32𝜋𝜌𝑔2ℎ2𝑇
Substituting the density of seawater (1025 kg/m3) and acceleration due to gravity (9.81 m/s2) into
the equation, it can be reduced to:
𝑃 = 0.98ℎ2𝑇
The units for this power equation are kW/m, meaning that the result gives the power output per
unit width. For comparison, the Wave Dragon produces a range of .4 kW/m for the smallest
model and about 48kW/m in its largest design. A schematic of a wave is shown in Figure 2.
Figure 2: Schematic Deriving Potential Energy and Power of a Wave (Tester, 2012)

6
This schematic includes variables that are used to derive the potential energy and power
equations for a wave. From this, one can better understand the mechanics of a wave and
therefore predict the power output for a wave energy converter.
2.3 Types of Wave Energy Harvesting
There are numerous devices that have been established in the wave energy industry that
attempt to most efficiently convert the potential energy of waves into power. The four primary
categories of wave energy converters (WECs) are: point absorbers, attenuators, oscillating water
columns, and overtopping devices. Each of these WECs has different attributes, all with varying
advantages and disadvantages.
Point absorbers, seen in Figure 3, are the simplest WECs. These devices float on the
surface of the water and generate energy through the periodic passing of waves, causing the
device to bob up and down. Point absorbers depend on an internal hydraulic system that pumps
air to power a generator as the cylinder is compressed and released by wave energy. They rely on
the frequency of waves to generate electricity and can attain maximum energy absorption by
matching the optimal frequency and wave height (Voorhis, 2012). The disadvantages of point
absorbers are their inability to adapt to the varying height and frequency of waves, which
prevents optimization through consistency. Additionally, large waves produced by storms
significantly reduce the efficiency of these devices and can even damage them if they are too
forceful.
Figure 3: Point Absorber Device (Voorhis, 2012)

7
Attenuators are long, cylindrical, segmented structures that float on the surface of the
water, operating in parallel with the roll of the waves, much like the motion of a ship. The
segmented regions allow for these cylinders to bob in the water due to passing waves which
drive the hydraulics of the device similar to that of point absorbers. The difference between
attenuators and point absorbers rests primarily in the relative size of the structures. The
mechanics of the two systems operate on similar basic principles of hydraulics driven by periodic
wave frequencies; however, the attenuators are able to capture a wider range of waves due to
their large size. Additionally, attenuators are more rugged, as can be seen in Figure 4 below, and
can survive harsh storms that generate greater waves.
Figure 4: Wave Attenuator Device (Pelamis, 2012)
Oscillating water columns operate based on a pressure differential created between air
and the ocean water within a structure that is partially submerged. These columns are constructed
along the shoreline to capture waves crashing on the coast, utilizing the wave pressure to push air
through a hollow cavity that is attached to a turbine. The rapid decrease in water pressure then
pulls air back through the bi-directional turbine, generating electricity through air flow in both
directions. This structure provides a simple, sturdy design that is able to convert wave energy at
low maintenance costs due to the lack of complex internal machines. Although costs are saved
by building the structure into the shoreline, many marine habitats are located along the coast.
Consequently, implementing devices on the shoreline has larger environmental implications than
open ocean devices. An example of an oscillating water column can be seen in Figure 5 below.

8
Figure 5: Oscillating Water Column (Emay, 2010)
Lastly, overtopping devices function based on a pressure differential created between an
artificial reservoir and the surrounding ocean water. The basic design of overtopping devices
involves a ramp leading up to a reservoir with a retaining wall. Potential energy is then converted
into power through turbines that are located in the bottom of the reservoir as shown in Figure 6.
The water level rises within the reservoir as waves crash over the ramp, creating a pressure
gradient. As a result, the generated head forces water out through the turbines within the
structure. Compared to oscillating water columns, this straightforward, robust design provides a
means for capturing a large volume of waves and generating electricity without the use of
internal mechanisms, therefore minimizing the cost of maintenance and repair.
Figure 6: Overtopping Device (Bedard, 2005)
2.4 Overtopping Design Combination
By researching various methods in wave energy conversion, a new device that combines
the advantages of overtopping with a multi-tiered system was conceptualized. With a rapidly
expanding market for WECs, numerous innovations exist; however, there is great potential to

9
create more efficient designs to produce free energy. By combining ideas from two pre-existing
designs, the Seawave Slot-cone Generator and Wave Dragon, a new overtopping system was
created.
The Seawave Slot-cone Generator (SSG) is an overtopping device that was created by
WAVEenergy in Norway. The SSG utilizes multiple tiers that store the energy of collected
waves until it can be converted into electricity through a multi-stage turbine. Compared to
similar water collection devices, the SSG has added effectiveness due to its multiple reservoirs,
higher cost-efficiency due to incorporation into pre-existing structures, water recirculation, and
easy installation/maintenance due to the fact that no cables or moorings need to be mounted
underwater. A disadvantage of the SSG falls within its location. Since it is used along the coast,
the size of the waves that it encounters is smaller due to shoreline frictional effects, and therefore
less powerful than those of systems that are installed offshore. In terms of economic and
technical dilemmas, there have been some questions related to the protection of harbors if the
SSG is assimilated into pre-existing structures (Vicinanza, 2012).
Erik Friis-Madsen and Wave Dragon Ltd. invented and developed the Wave Dragon.
This overtopping device floats on top of the water and collects waves by means of two large
arms, known as wave reflectors. These reflectors direct waves towards a ramp where they crash
into a reservoir. The water is then briefly stored before leaving the reservoir through Kaplan
turbines located at the bottom. Kaplan turbines are usually used in hydropower plants as they
produce electricity from hydraulic head. The water is returned to the ocean after it runs through
the turbines and this constant cycle creates a clean source of energy that can be reused
indefinitely. “Wave Dragon is currently the largest device – by rated power and physical
dimensions – under development” (Wave Dragon, 2006). In 2003, the first power-collecting
prototype of Wave Dragon was set up at Nissum Bredning, which is off the coast of Denmark.
The energy production of this device is constant, with an annual energy output of about 619
MWh. The system has a capacity factor of approximately 20%, and can be downsized to collect
the energy from smaller waves as well. Wave Dragon is unable to produce electricity from waves
with heights of less than 1 m, as well as in cases with overly large waves, such as a tropical
storm or a tsunami. The device is designed to handle “energetic wave climates”, which is defined
as areas where the wave power density is 50 kW/m or higher (Wave Dragon, 2006).

10
Combining the onshore, multi-tiered, SSG with the popular Wave Dragon provides a
wide range of benefits to improve the power output of the design. A primary advantage of
utilizing the open ocean versus a shoreline device is the difference in energy capacity for the
characteristic waves. Open ocean waves contain approximately 10% more power than shoreline
waves due to the frictional losses of the ocean floor. These losses act on waves shallower than
one half of the wavelength deep, which is the case for the majority of waves crashing on shore.
The effective depth of the wave is equal to about one half of the wavelength; therefore, in
shallow waters, the ocean floor actually opposes wave movement, reducing the overall energy of
the wave (Vicinanza, 2012).
A major downfall of the Wave Dragon design can be attributed to the limited capture of
waves at specific heights dependent on the ramp of the device. The Wave Dragon limits
collection based on a set height for the ramp, reservoir, and external walls, whereas the multi-
tiered on-shore device captures waves at varying heights. Potential energy relies on the height at
which the wave is captured and is maximized at the highest point of the wave. By capturing the
wave at its tallest height, the maximum potential energy of the wave may be collected by the
system. Since the system can also accept waves shorter than the maximum height, the conceptual
combined design optimizes the heights and volumes of capture for improved reservoir
efficiencies.
Furthermore, the reservoir draining of the Wave Dragon produces additional
inefficiencies by starting and stopping the turbines in the system as each cycle of water empties
out. By using a multi-tiered system, there is a higher possibility of maintaining a larger volume
of water in the reservoirs to establish constant flow through the turbines. This achievement will
significantly improve the efficiency of the system by drastically reducing frictional losses in the
turbines. This reduction in losses results from preventing the stopping and starting inefficiencies
of the turbines from occurring at each wave cycle and keeping the turbines in constant motion.
Since the multi-tiered system captures waves at different levels and fills multiple reservoirs, the
water takes longer to drain through the system, thus providing constant head to keep the turbines
spinning.

11
Chapter 3 - Methodology
The goal of this project was to test and compare the power output produced by combining
two overtopping designs, Wave Dragon and SSG, into one wave energy harvesting device. To
achieve this goal, the following objectives were completed:
1. Conducted research on Wave Dragon and Seawave Slot-cone Generator to determine
which characteristics were most favorable at producing high wave energy efficiencies.
2. Used proper scaling factors to determine reasonable testing conditions.
3. Researched, developed, and designed a wave generation system that produced the
necessary testing environment.
4. Designed a model utilizing SolidWorks software of the intended overtopping device.
5. Constructed the test tank and wave energy converter.
6. Performed testing and gathered data on the power output of the new device.
7. Analyzed the power produced by the device.
This chapter contains descriptions of objectives 1-5 and methods used throughout the
process that enabled the completion of the overall goal: comparing the power output of two
overtopping designs.
3.1 Existing Designs
In order to develop a new overtopping device, existing designs were first explored. Two
designs that exhibited high potential in the field of wave energy harvesting included Wave
Dragon and SSG as discussed in Chapter 2. By combining the multiple reservoirs of SSG with
the offshore aspect of Wave Dragon, the concept of a superior wave power generation device
was fashioned.
3.2 Scaling Factors
In order to create a functional scale model of the wave energy converter, it was important
to evaluate the feasibility of the presented design. Assumptions needed to be made regarding
inefficiencies and losses that would be encountered during testing. These assumptions included
the percentage of wave volume captured, efficiency of the turbines, and the efficiency of the
generator. Considering the different inefficiencies and assumptions of the wave converter
system, preliminary calculations gave more tangible parameters for the device as well as an
estimate of the potential power output.

12
3.2.1. Assumptions
There are a number of assumptions to be considered when analyzing any power system.
A full scale model of this overtopping device would consist of turbines and generators that
would exhibit losses due to friction and inefficiencies. To simplify the prototype, a turbine and
generator were omitted; however, the efficiency of these devices were considered when
calculating the overall power output of the system. Researching current technology, revealed
most hydraulic turbines and generators yield efficiencies ranging from 85% to 95%.
Additionally, Froude scaling factors were calculated in order to relate the prototype to the full
sized device. The basis for these scaling calculations was derived from the estimated wave height
produced by the wave generation system. The combination of all of these assumptions provides a
baseline for preliminary power calculations that the designed system can expect to produce.
Furthermore, when waves travel up the ramp into the reservoirs, the entirety of the wave
will not be captured. For purposes of simplification, it was assumed that 75% of any given wave
volume would be captured by the device based on wave geometry. Realistically, this value would
change for each wave dependent on the wave height and other wave characteristics. In relation to
wave volume captured, the “felt” wave height is important since waves do not solely act above
the water. Research shows that the “felt” wave height extends approximately half of the
wavelength below the surface of the water (Thurman, 2012). Considering this assumption was
vital to the design of the system to assure that the test tank was deep enough to enable free
movement of the effective depth of the wave. Assuming deep waves as opposed to shallow
waves more accurately depicted the system on the open ocean because it neglected frictional
losses of the ocean floor. Removing these frictional losses provides an advantage over a
shoreline system.
The wave height was estimated under the assumption that the “felt” height extends half of
the wavelength beneath the surface of the water. The wavelength was assumed to be seven times
the chosen wave height as is the average characteristic of a general wave system (Thurman,
2012). Based on the wave height and wavelength assumptions the maximum “deep ocean” wave
height was modeled using the following function:
ℎ𝑤𝑎𝑣𝑒 =2
7∗ ℎ𝑤𝑎𝑡𝑒𝑟

13
Where hwave is wave height and hwater is the water height. Using the above equation prevents
frictional losses from the bottom of the test tank, enabling open ocean waves to be simulated.
Therefore the maximum potential wave height within our testing conditions is:
ℎ𝑤𝑎𝑣𝑒 =2
7∗ 12 𝑖𝑛𝑐ℎ𝑒𝑠 = 3.43 𝑖𝑛𝑐ℎ𝑒𝑠 = 8.71 𝑐𝑚
3.2.2. Froude Scaling Factor
Froude scaling factors are important dimensionless numbers to be considered when
designing a system that involves wave production. Froude scaling is beneficial since the
Reynolds number is a more difficult factor to scale. “If Re is … kept constant, the value of U
(velocity) at model scale has to be… that of the full-scale value. The obvious way to overcome
these conflicting requirements would to be increase g and/or decrease v (viscosity)” (Payne, 6).
In order to achieve these conditions, a centrifuge or vacuum chamber would be required for
testing. Both options were unfeasible within an undergraduate project constraint, so Froude
scaling factors were used.
Froude scaling is more practical than Reynolds scaling. The Froude scaling factor can be
derived from the similarity of Froude numbers for the system shown by:
𝐹𝑀 =𝑉𝑀
(𝑔𝑀𝐿𝑀)12
=𝑉𝑝
(𝑔𝑝𝐿𝑝)12
= 𝐹𝑝
Where F represents the Froude numbers for the model and prototype, V is the velocity, g defines
the gravitational constant, and L resembles the characteristic length. Additionally, 𝑔𝑀 = 𝑔𝑝 = 𝑔
and 𝐿𝑝 = 𝜆𝐿𝑀, where 𝜆 represents the wavelength. Substituting the gravity constant and
geometrically similar factors this equation yields:
𝐹𝑀 =𝑉𝑀
(𝑔𝐿𝑀)12
=𝑉𝑝
(𝑔𝜆𝐿𝑀)12
= 𝐹𝑝
Which then reduces to:
𝑉𝑃 = 𝜆1/2𝑉𝑀
From this derivation, it can be seen that the scale ratio required to upscale Froude model
velocities is 𝜆1/2. Additional derivations can be completed in a similar manner to calculate the
Froude scaling factors for other variables shownTable 1 in Table 1.

14
Table 1: Froude Scaling Ratio for Model and Prototype Similarities
The various scaling factors account for the wave conditions that vary based on geometric,
kinematic, and dynamic similarities. The similarities between the prototype and the full-scale
model allow for the proper extrapolation of data from experimental testing. Table 1 can be used
to determine a wave period and frequency based on the wave height derived for the system.
Additionally, the mass of the waves captured and the power potential of the waves can be
estimated by using these scaling factors.
Given the wave height of 3.43 inches (8.71 cm), the wave period can be scaled
appropriately by the Froude scaling factor of λ0.5, where λ is equal to the wave height. Therefore,
the scaling factor for the period associated with the given wave height is:
λ𝑀 = λ𝑝0.5 =. 08710.5 = 0.295
Where λM is the Froude scaling factor for the wave period given a wave height of 3.43
inches. Multiplying this scale factor by an average period of ground swell waves, which
characterize the waves acting in deep ocean water, yields:
𝑇 = λ𝑀 ∗ 9𝑠 = 0.295 ∗ 9𝑠 = 2.66 𝑠
Where T is the scaled period of the waves given a 3.43 inch wave height and 9 seconds as
the average period for ground swell waves for a full-scale system. Therefore a reasonable scale
for the wave period based on a 9 second ground swell period is approximately 2.66 seconds.

15
Using a similar method, the mass and power potential for each wave can be estimated
based on the various Froude scaling factors that are derived from the table above. The mass of
each wave captured by the wave converter can be estimated by:
λ𝑀 = λ𝑝3 =. 08713 = 6.61 𝑥 10−4
Where λM is the Froude scaling factor for the mass of each wave for the full-scale system
in relation to a 3.43 inch wave height produced. To find the actual mass captured by each wave,
the scaling factor can be multiplied by the estimated mass for a full scale system.
Finally, the same method can be utilized substituting λ3 with λ3.5 to estimate the power of
the scaled system based on the full size system. The power scaling coefficient will then be
calculated by:
λ𝑀 = λ3.5 =. 08713.5 = 1.95 𝑥 10−4
Where λM is the Froude scaling factor for the power potential of each wave of the full-
scale model compared to that for the 3.43 inch wave height. Again, the actual power potential for
each wave for the scaled system can be achieved by multiplying this scaling factor by the
estimated power in a life sized system. The results for each scaled variable are calculated in a
similar manner and the important kinematic and dynamic similarities are displayed in Error!
Reference source not found. below.
Table 2: Froude Scaling Ratios for Model Scaling
Parameter Dimension Froude Scaling
Ratio
Time [T] 0.295
Velocity [LT-1] 0.295
Acceleration [LT-2] 1
Mass [M] 0.000661
Force [MLT-2] 0.000661
Pressure and
Stress [ML-1T-2] 0.0871
Energy and
Work [ML2T-2] 0.0000576
Power [ML2T-3] 0.000195
Froude scaling factors can be used for a variety of assumptions by simply defining a
wave height. In using these scaling factors, the accuracy of the power calculations can be
16
determined. These values can be further compared to experimental data to estimate losses for the
designed system.
3.2.3. Power Calculations
In order to ensure the feasibility of the device, it was necessary to complete some of the
background theoretical power calculations. These calculations involved the scaling factors
derived above, the specific design of the wave capture device, and the volume and potential
energy of water in the reservoirs.
The new design uses three separate tiers to capture water. The collection of water at its
peak height stores the highest potential energy of the wave. Due to the shape of each wave (the
wavelength being approximately 7 times the height of the wave), the first tier is designed to
capture as much water as possible from the lower part of the wave. The second and third tiers are
designed to optimize wave collection at the wave’s maximum height. All the reservoirs and tiers
are lipped so that any excess water from the higher tiers will simply flow down to the tier below
it.
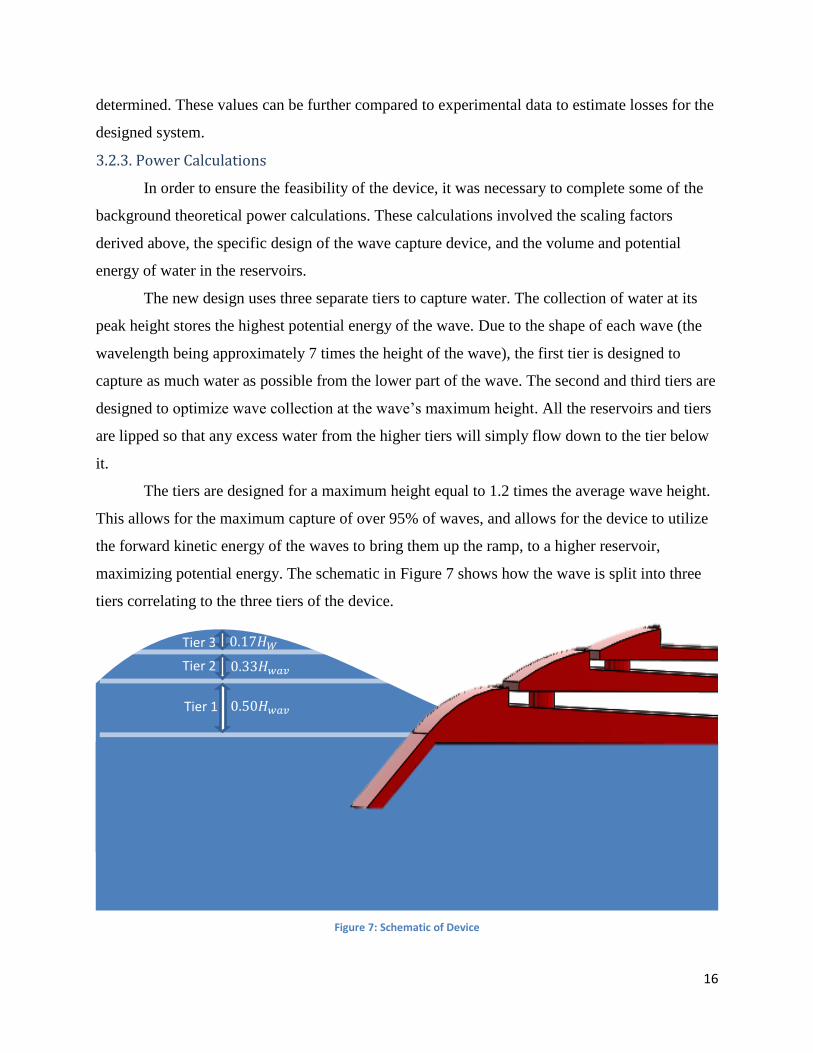
The tiers are designed for a maximum height equal to 1.2 times the average wave height.
This allows for the maximum capture of over 95% of waves, and allows for the device to utilize
the forward kinetic energy of the waves to bring them up the ramp, to a higher reservoir,
maximizing potential energy. The schematic in Figure 7 shows how the wave is split into three
tiers correlating to the three tiers of the device.
Figure 7: Schematic of Device
Tier 3
Tier 2
Tier 1 0.50𝐻𝑤𝑎𝑣𝑒
0.33𝐻𝑤𝑎𝑣𝑒
0.17𝐻𝑊

17
It was previously determined that the simulation tank, containing a water depth of 12
inches (or 0.305 meters), is able to produce 3.43 inch waves. Using 3.43 inch simulated waves,
estimation of the wave collection capacity and the power output of the testing device was
determined. Deep ocean waves generally have the following relation between wavelength and
wave height:
𝑊𝑎𝑣𝑒𝑙𝑒𝑛𝑔𝑡ℎ 𝑜𝑓 𝑊𝑎𝑣𝑒 = 𝜆 = 7ℎ
As such, borrowing the relation for the area of a wave given in Figure 2 also provides the
following equation for the Area of a wave.
𝐴𝑟𝑒𝑎 𝑜𝑓 𝑎 𝑊𝑎𝑣𝑒 = ℎ
𝜋∗
𝜆
2=
ℎ
𝜋∗
7ℎ
2=
𝟕𝒉𝟐
𝟐𝝅
From this relation it is possible to divide the total area of the wave into sections that
would enter the three tiers separately, optimizing the potential energy.
Figure 8: Wave Capture Schematic
It is possible to determine the area of each tier separately by using the equation for the
area of the wave. The area of tier 3 represents a sixth (0.17) of the total wave area, therefore the
height must be also be divided by 6. The sum of tiers 2 and 3 represent half of the total wave
height and to find the area of tier 2, the area of tier 3 is subtracted. Finally, to find the area of tier
1, a similar approach is taken. The area of tiers 2 and 3 are subtracted from the total area of the
wave to find the area of tier 1.
𝐴𝑟𝑒𝑎 𝑜𝑓 𝑇𝑖𝑒𝑟 3 = 𝑇3 =ℎ 𝜆
2𝜋=
7ℎ2
2𝜋=
𝟕𝒉𝟔
𝟐
𝟐𝝅= 𝟐. 𝟏𝟖 𝒊𝒏𝟐
𝐴𝑟𝑒𝑎 𝑜𝑓 𝑇𝑖𝑒𝑟 2 = 𝑇2 =ℎ 𝜆
2𝜋− 𝑇3 =
7ℎ2
2𝜋− 𝑇3 =
𝟕𝒉𝟐
𝟐
𝟐𝝅− 𝑻𝟑 = 𝟒. 𝟑𝟕 𝒊𝒏𝟐
𝐴𝑟𝑒𝑎 𝑜𝑓 𝑇𝑖𝑒𝑟 1 = 𝑇1 =ℎ 𝜆
2𝜋− 𝑇2 − 𝑇3 =
7ℎ2
2𝜋− 𝑇2 − 𝑇3 =
𝟕(𝒉𝟐)
𝟐𝝅(𝟎. 𝟕𝟓) − 𝑻𝟐 − 𝑻𝟑 = 𝟔. 𝟓𝟔 𝒊𝒏𝟐

18
Calculations of volume, energy and power values are “per inch” for the width of the
device. Instead of considering the volume of each wave, the area of each wave (or volume per
inch) will be considered. In addition, most of the calculations will remain as per wave values.
The total captured volume (per inch), is a summation of the volume captured in each tier.
𝑇𝑜𝑡𝑎𝑙 𝑉𝑜𝑙𝑢𝑚𝑒
𝑖𝑛𝑐ℎ𝑜𝑓𝐴𝑙𝑙 𝑇𝑖𝑒𝑟𝑠 = 𝑇𝑇 = 13.1 𝑖𝑛2
From the volume captured in each reservoir height, the potential energy stored in each
reservoir was extracted. Simply put:
𝑃𝐸 = 𝑚𝑔ℎ = 𝑉𝜌𝑔ℎ
𝑃𝐸𝑇𝑜𝑡𝑎𝑙 = 𝜌𝑔(𝑉1ℎ1 + 𝑉2ℎ2 + 𝑉3ℎ3) = 1.52 𝐽𝑜𝑢𝑙𝑒𝑠
This is per wave per inch of device structure, therefore the power output can be estimated
under the assumption that the volumetric flowrate in is equal to the volumetric flowrate out. It
was assumed that the flowrate is constant, meaning that the reservoirs are replenished every
wave period of 3 seconds. As such:
𝑃𝑜𝑤𝑒𝑟 =𝑃𝐸𝑇𝑜𝑡𝑎𝑙
𝑇=
1.52
3= 0.51 𝑊𝑎𝑡𝑡𝑠
Using the scaling factor derived from the Froude Number of λ3.5, this gives us a real
world output of about 2.6 kW per wave per meter of the device. This power output was
calculated using 3.43 inch waves and tier heights based off this value. Therefore the wave
capture efficiency was maximized for these ideal conditions.
3.3 Development of Wave Generation System
Once the appropriate scale for the prototype and waves was determined, a wave
generation system was developed in order to test the prototype. This design utilized a crank-
rocker four-bar mechanism. In this mechanism, a 24-inch plywood board was hinged to the
bottom of a test tank to act as a rocker. At the top of the board, a rod was attached by a pin. The
rod can be modeled as a two-force member, with only the force of the board and the force of the
other linkage acting on it. The end of the rod opposite the board is pinned to a cam that is press-
fitted on a motor shaft, which acts as the crank. A picture of the four bar mechanism can be seen
in Figure 9.

19
Figure 9: Wave Generation Mechanism
In order for a four bar linkage to have a link that can complete a full revolution,
Grashof’s condition must be satisfied. Grashof’s condition states that the sum of the lengths of
the shortest and longest links must be less than the sum of the lengths of the two intermediate-
sized links (Natesan, 1994). In a traditional four bar linkage, there are additional limitations to
the lengths of the bars to avoid locking of the mechanism, but these limits can be ignored since
the crank and rocker are on two completely different planes. In this system, the concern is not
centered about locking out the mechanism, but rather ensuring that the links are long enough for
all ranges of movement.
As the board rocks back and forth, the water is displaced and waves are created. The
height of the waves and the frequency of wave production can be adjusted by changing the
geometry of each of the links, the mass of the board, and the power of the motor. Additionally,
changing the position of the rocker relative to the crank alters the board angle, which generates
waves of different heights. To ensure that the wave generation system produced the necessary
testing environment, several aspects were considered: the water displacement and wave height,
the geometry of the linkages, the power requirements and motor selection, and the stresses
exerted at the joints. Other considerations were made to determine the proper features of the test
tank, including material selection and placement of electronic equipment.
3.3.1. Wave Height Calculations
The first step to create the proper testing conditions was to calculate the wave heights that
could be produced by this system. Since the movement of the board produces waves, the volume

20
of water that the board displaces should be equal to the volume of the wave. Making the
mathematical assumption that the cross-sectional area of ocean waves can be modeled as two-
dimensional sine waves, a sine function was generated. Knowing that the wave period is one
wave every three seconds and that there is no horizontal or vertical shift, the amplitude, which in
this case equals wave height (hwave), is left as the only unknown.
ℎ𝑤𝑎𝑣𝑒 ∗ sin (2𝜋
3𝑡)
Integrating this equation over the time interval of one wave results in the cross-sectional
area of the wave. Taking this area and multiplying it by the width of the test tank gives the
volume of the wave. Since the volume of displaced water is equal to the volume of the wave, the
wave height can be easily calculated. To calculate this unknown, the cross sectional area of
displaced water was divided by the integral of the wave during half of its time interval. This
resulted in the following equation:
ℎ𝑤𝑎𝑣𝑒 = 𝐴𝑟𝑒𝑎
∫ sin (2𝜋3 𝑡) 𝑖𝑛 𝑑𝑡
1.5
0
In this equation “Area” corresponds to the cross-sectional area of the displaced water,
while the integral represents the wave. Dividing the area of the displaced water by the wave, the
height of the wave can be obtained. Since one wave should occur every three seconds in order to
model real ocean waves, the wave will reach its maximum height at 1.5 seconds.
Unfortunately, this equation proves to be inaccurate due to velocity differences between
the board and the water. As the board moves forward, the water travels away from the board at a
faster velocity, meaning that some of the water volume is lost in the process. To achieve the most
accurate measurement, iterative calculations were performed in a variable experiment study to
determine when the board velocity approached the wave velocity. For the variable experiment
study, the board height, diameter of the cam, initial angle of the board, and height of the water
were all considered. By changing these input parameters, the board velocity, wave velocity, and
area of displaced water were determined for each scenario. A diagram relating the water height,
board height, initial and final board angles can be seen below.

21
Figure 10: Diagram for Wave Height Determination
In this visual representation hw, hb, θ1, θ2, x1, x2 represent the height of the water, height
of the board, initial angle of the board, final angle of the board, initial x direction distance, and
final x direction distance, respectively. Of these values, the height of the water, height of the
board, and initial angle are all input variables. θ2 is a calculated value that comes directly from
the cam diameter (d) and board height. Since hb, hw, cam diameter (d), and θ1 are all dependent
variables, θ2 can be calculated by:
𝑎2 = 𝑏2 + 𝑐2 − 2𝑏𝑐 ∗ 𝑐𝑜𝑠𝐴
𝑑2 = ℎ𝑏2 + ℎ𝑏
2 − 2ℎ𝑏2 ∗ cos(𝜃2)
cos(𝜃2) =(2ℎ𝑏
2 − 𝑑2)
2ℎ𝑏2
(𝜃2) = cos−1(2ℎ𝑏
2 − 𝑑2)
2ℎ𝑏2
Additionally, x1 and x2 can be determined by:
𝑥1 = ℎ𝑤 tan(𝜃1)
𝑥2 = ℎ𝑤 tan(𝜃2)
Knowing, x1, x2, hw, θ1, and θ2, the area of the displaced water can be calculated:
𝐴𝑟𝑒𝑎 =1
2∗ ℎ𝑤
2 (tan(𝜃1 + 𝜃2) − tan(𝜃1))
Additional parameters that were established through this study included the board velocity and
wave velocity. Board velocity was determined by dividing the throw distance, which is the entire
distance the board travels in the positive x direction, by half of the time period (1.5 seconds).
Wave velocity was calculated by using the formula:
22
𝑣𝑤𝑎𝑣𝑒 = √2𝑔(𝑡ℎ𝑟𝑜𝑤 𝑑𝑖𝑠𝑡𝑎𝑛𝑐𝑒)
2𝜋
Varying one input at a time while keeping the others constant allowed for finding the
specifications that resulted in the smallest difference in wave versus board velocity. This analysis
showed that in order to keep the velocity difference small, a larger board height, smaller cam
diameter, lower initial board angle, and lower water height were essential. Although a lower
water height kept the velocity difference small, a water height of at least 12 inches was needed in
order to neglect frictional forces from the bottom of the tank. Ultimately, a board height of 24
inches, cam diameter of 2 inches, initial board angle of 0 degrees, and a water height of 12
inches was found to give the smallest difference in velocities. Although the velocity difference
was minimal, the board and wave velocity were not equal, meaning that some of the displaced
water volume was lost in the process. To account for this loss in volume, an assumption was
made that 25% of the displaced water would be transmitted to the wave volume. This assumption
was made based off of a velocity difference of approximately 10.4 inches/sec. From this
assumption, it was calculated that the wave height would be approximately 2.5 inches.
3.3.2. Geometry of Four Bar Mechanism
After some of the parameters were set to achieve the desired wave height, the appropriate
geometry of the four bar mechanism was developed. Measurements needed to be specified, such
as where the crank should be placed relative to the rocker and how long the connecting rod
should extend. These geometric specifications were resolved using data from the variable
experiment study as well as Linkages software by Norton.
In order to establish the appropriate geometry it was essential to understand the
necessary constraints. From the wave height calculations, the board height, cam diameter, water
height, and initial start angle must be 24 inches, 2 inches, 12 inches, and 0 degrees, respectively.
From these input parameters, it was also found that the board would rotate approximately 5
degrees (θ2) in order to achieve the desired wave height. Using these dimensions, a model of the
four bar linkage was developed in Linkages.
Iterative attempts were completed to find which rod lengths and crank versus rocker
dimensions resulted in the correct initial and final board angles. To complete this analysis, the
board and cam lengths remained constant, while the x and y distances of the rocker in
comparison to the crank were adjusted. As those distances were changed, the rod length needed
23
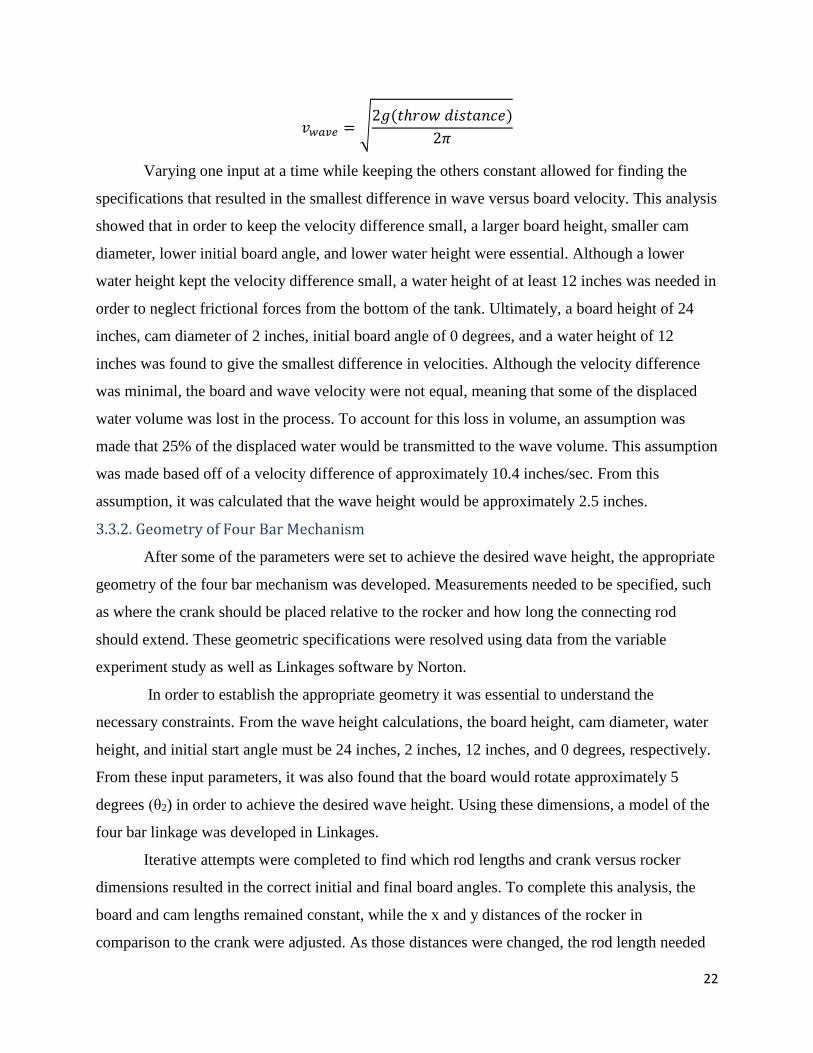
to be adjusted accordingly. It was essential to begin the board at a 90-degree angle with respect
to the bottom of the tank and finish its forward movement at an angle of approximately 85
degrees. After several attempts were completed, results showed that the rod must be 19.5 inches,
and the center of the cam and bottom of the board must be located 18 inches apart in the x
direction and 28 inches apart in the y direction to achieve an approximate 5 degree pivot angle
with a board of 24 inches. A sketch with these measurements can be seen below:
Figure 11: Wave Generator Geometry
Using this software, the wave generation mechanism was set up according to this geometry.
3.3.3. Power Requirements & Motor Preparation
In addition to the proper geometry for setup and the estimated wave heights, the power
requirements for the system also needed to be calculated. To generate the required waves, a
motor that could push the water at the desired speed was needed. Power can be calculated by
multiplying torque by angular velocity. The angular velocity was previously found to be 20 RPM
based off the knowledge that one wave should occur every three seconds; therefore, torque
acting on the motor was the only variable that needed to be defined. To find this value, the
kinematics of the wave generation system were analyzed by starting with the forces exerted on
the board and then continuing upwards through the entire wave generating mechanism.
The board was the first piece to be evaluated because of its direct interaction with the
water. Looking at a free-body diagram of the board (Figure 12), the forces that act on it include
the force of the rod in the x direction as well as the force of the water and weight of the board.

24
Figure 12: FBD of Board
The force of the rod in the x direction was determined by understanding that the rod
creates torque equal and opposite the board and water about the hinge. To define the torque, and
thereby the force that the rod exerted, calculations for the torque from the board weight and
water were completed. The torque of the board was calculated by the following steps in which
“r” is half the length of the board (12 inches), “ϴ” is the angle that the board rotates (5 degrees),
“t” is half of the time interval (1.5 seconds), and “mb” is the mass of the board (4 kg). From these
calculations it can be seen that the torque from the board is approximately 0.014J.
Torque from Board
𝑣𝑒𝑙𝑖𝑏 = 0𝑖𝑛
𝑠
𝑣𝑒𝑙𝑓𝑏 =𝑟𝜃
𝑡= 0.67
𝑖𝑛
𝑠
𝑎𝑏 =(𝑣𝑒𝑙𝑓𝑏 − 𝑣𝑒𝑙𝑖𝑏)
𝑡= 0.45
𝑖𝑛
𝑠2
𝐹𝑏 = 𝑚𝑏𝑎𝑏 = 0.045 𝑁
𝜏𝑏 = 𝐹𝑏𝑟 = 0.014 𝐽
Calculating the torque from the water was more complex for multiple reasons; there was
water on both sides of the board and the torque of the water varies with different distances from
the hinge. To account for the water being on both sides of the board, the force of the water was
doubled, and to account for the varying torque, an integral was computed over the varying water

25
heights (0-12 in). The mass of the water was determined by multiplying the density times the
volume of water that was displaced. The steps for those calculations can be seen below. In the
calculations ρ, dAb, h, ϴ, t, and wtank, represent water density, changing cross-sectional area,
water height, board angle, time elapsed, and width of the tank, respectively.
Torque from Water
𝑑𝐹 = 2 ∗ 𝜌 ∗ 𝐴𝑏 ∗ℎ2 ∗ 𝜃2
𝑡2
𝜏𝐻2𝑂 = ∫ ℎ 𝑑𝐹12
0
𝜏𝐻2𝑂 = ∫ (2𝜌ℎ3𝜃2
𝑡2𝑤𝑡𝑎𝑛𝑘) 𝑑ℎ = 0.012 𝐽
12𝑖𝑛
0𝑖𝑛
Knowing the torque of the water and board was equal and opposite the torque of the rod,
the force that the rod exerts in the x direction was calculated by adding together the torque from
the water and board and then dividing by the distance of the rod to the hinge (24 inches). From
that calculation, the rod exerts a force of 0.043N in the x direction, as can be seen below.
𝐹𝑅𝑜𝑛𝐵𝑥 =𝜏𝑏 + 𝜏𝐻2𝑂
24 𝑖𝑛= 0.043𝑁
The next step was to find the force that the rod exerts on the cam. Since the rod is pinned
at both ends and carries no other loads, it was simplified into a two-force member. The two
forces acting on the rod were the force of the board and the force of the cam. When modeling a
two-force member, the forces are equal and opposite when they act along the centerline of the
member. Knowing the force that the rod exerts on the board in the x direction, the force that the
board exerts through the centerline of the rod was calculated by finding the angle that the rod
makes in relationship to the horizontal. A free body diagram of the rod is shown in Figure 13.
Figure 13: FBD of Rod
The angle of the rod was computed using the length of the rod, as well as the angle of the
cam when the board was upright. The length of the rod was 19.5 inches, forming the hypotenuse

26
of the triangle, while the distance in the x direction was 18 inches plus the extra x direction
distance due to the 18-degree angle of the 1 inch cam. From these dimensions, the angle formed
by the rod was 14 degrees. Knowing the angle that the rod forms, the force exerted on the rod
along its centerline was resolved.
Forces on the Two Force Member (Rod)
𝐿𝑟𝑜𝑑 = 19.5 𝑖𝑛
𝑑𝑥 = 18 𝑖𝑛 + cos(18) ∗ 1 𝑖𝑛 = 19 𝑖𝑛
𝛼 = acos (𝑑𝑥
𝐿𝑟𝑜𝑑) = 14 𝑑𝑒𝑔
𝐹𝐵𝑜𝑛𝑅 =𝐹𝐵𝑜𝑛𝑅𝑥
cos(𝛼)= −0.044𝑁
𝐹𝐶𝑜𝑛𝑅 = 𝐹𝐵𝑜𝑛𝑅 = 0.044𝑁
This concluded that the force of the cam along the centerline of the rod was 0.044N.
By analyzing the cam further, the force that it exerts perpendicular to its moment arm was
calculated. A free body diagram of the cam is seen in Figure 14.
Figure 14: FBD of Cam
By setting the angle, β, and then multiplying sin (β) by the force of the cam along the centerline
of the rod, the force of the cam was determined. These calculations are seen below.
𝛽 = 18 − 𝛼 = 4.4 𝑑𝑒𝑔
𝐹𝑐𝑎𝑚 = sin(𝛽) ∗ 𝐹𝐶𝑜𝑛𝑅 = 3.2 × 10⁻³𝑁
Multiplying this force by its moment arm resulted in the torque produced by the cam. Since the
moment arm in this case is the radius of the cam (1 inch), the torque was found to be 8.0X10⁻⁵ J.
In order to find the power required from the motor, the torque of the cam was multiplied
by the angular velocity of the motor to give a power requirement of 1.7 X10⁻⁴ W. This means that

27
in order to produce 2.5 inch waves in the small scale system about 0.17 mW of power was
required.
After completing calculations for the power requirements, the next step was finding an
acceptable motor for this system. A 226 Series Gearhead Motor from AM Equipment was
acquired and found to produce as much as 71 W of mechanical power, enough for the wave
generation system. The specification sheet for this particular motor can be found in Appendix A.
Although this motor was capable of producing the required power, the torque exerted on the
shaft from the water and board was not significantly high, which caused the motor to operate too
fast. In order to alleviate this problem, a pulse width modulator was created in order to slow
down the speed of the motor.
To slow the motor to 20 RPM to account for wave scaling factors and a wave frequency
of 20 waves per minute, different options were explored. While gears or other mechanical
devices were considered, it was decided to minimize power losses and as such use an electronic
circuit. The specific circuit chosen falls in the category of a Pulse Width Modulator (PWM). The
function of a PWM is to essentially act as a controllable timed on and off switch with a high
frequency that turns a constant DC Voltage (such as that delivered from a car battery) into
something resembling a Square Wave. Ideally a PWM can control both the frequency of the
output function as well as the duty cycle, which is defined as the ratio of on and off time, or the
width of the square wave. Figure 15 illustrates the variety of output functions that a PWM can
produce as well as a variety of functions with differing duty cycles. The percentage values are
equivalent to the duty cycle of each wave.
Figure 15: Variety of Duty Cycle Outputs Generated by PWM
28
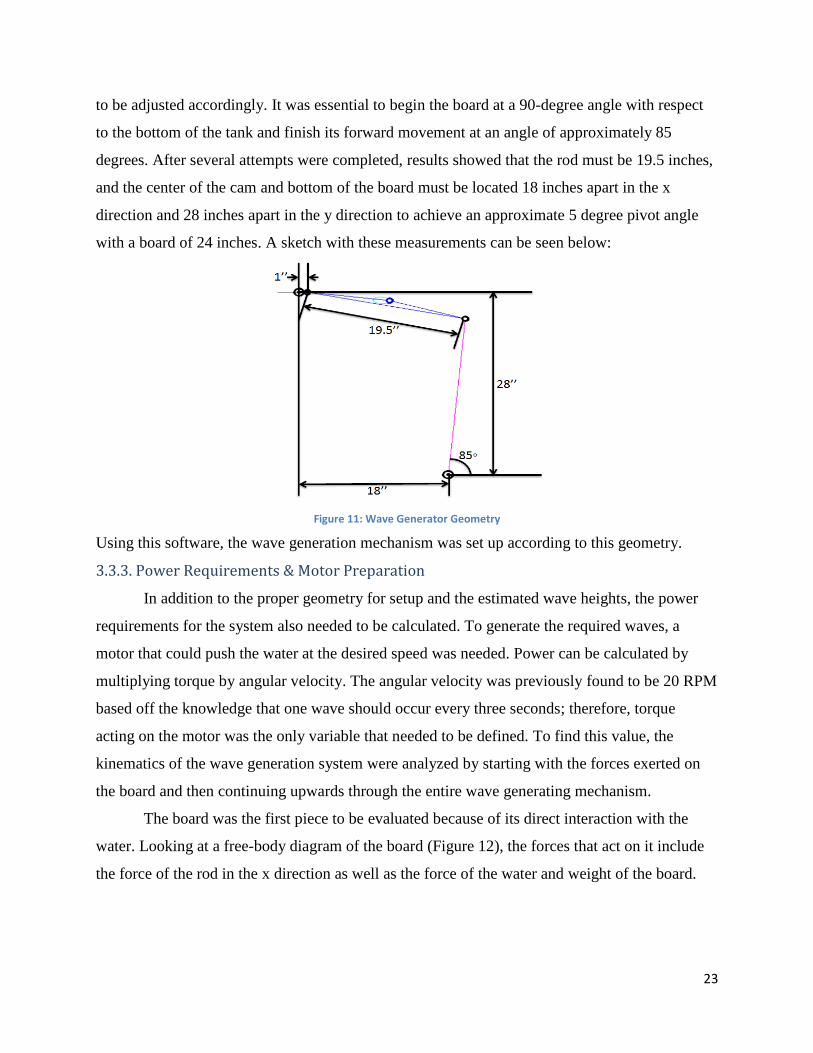
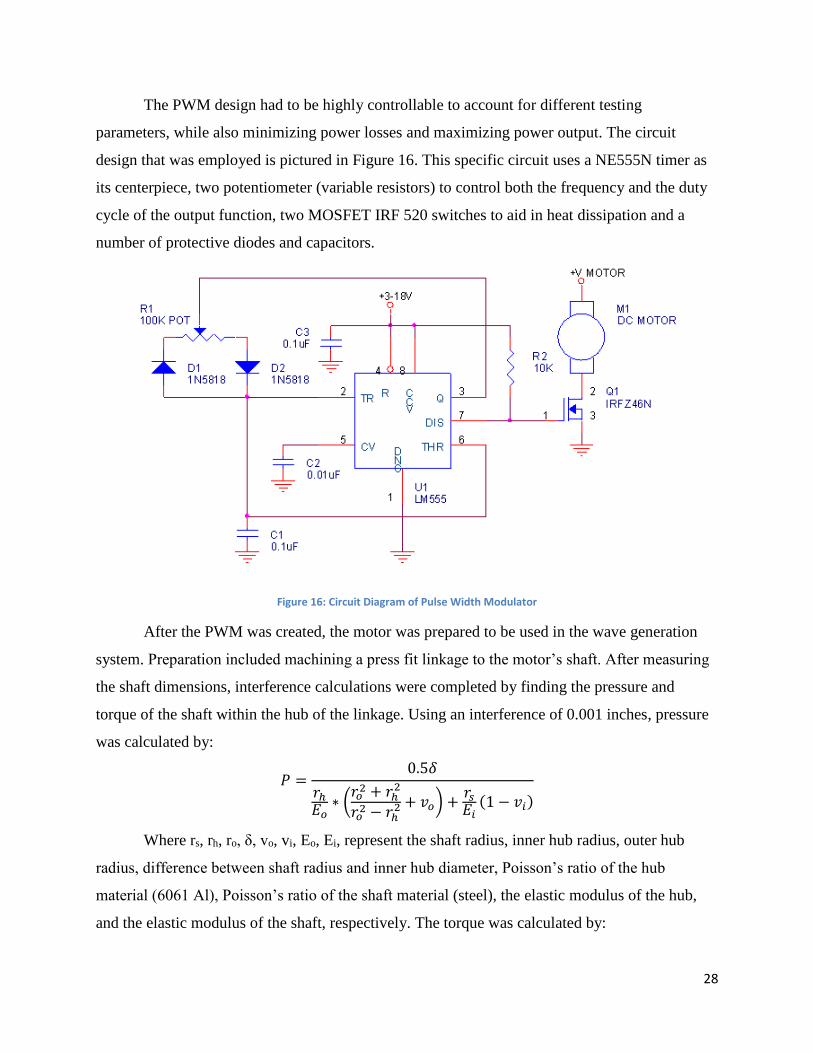
The PWM design had to be highly controllable to account for different testing
parameters, while also minimizing power losses and maximizing power output. The circuit
design that was employed is pictured in Figure 16. This specific circuit uses a NE555N timer as
its centerpiece, two potentiometer (variable resistors) to control both the frequency and the duty
cycle of the output function, two MOSFET IRF 520 switches to aid in heat dissipation and a
number of protective diodes and capacitors.
Figure 16: Circuit Diagram of Pulse Width Modulator
After the PWM was created, the motor was prepared to be used in the wave generation
system. Preparation included machining a press fit linkage to the motor’s shaft. After measuring
the shaft dimensions, interference calculations were completed by finding the pressure and
torque of the shaft within the hub of the linkage. Using an interference of 0.001 inches, pressure
was calculated by:
𝑃 =0.5𝛿
𝑟ℎ
𝐸𝑜∗ (
𝑟𝑜2 + 𝑟ℎ
2
𝑟𝑜2 − 𝑟ℎ
2 + 𝑣𝑜) +𝑟𝑠
𝐸𝑖(1 − 𝑣𝑖)
Where rs, rh, ro, δ, vo, vi, Eo, Ei, represent the shaft radius, inner hub radius, outer hub
radius, difference between shaft radius and inner hub diameter, Poisson’s ratio of the hub
material (6061 Al), Poisson’s ratio of the shaft material (steel), the elastic modulus of the hub,
and the elastic modulus of the shaft, respectively. The torque was calculated by:

29
𝑇 = 2𝜋𝑟𝑠2𝜇𝑃𝑙
μ represents the coefficient of friction between the shaft and hub and 𝑙 represents the
length of contact between the two interfaces. From the pressure and torque calculations, an
interference of 0.001 inches was sufficient to create a proper press fit. A model of the linkage,
seen in Figure 17 below, was designed while taking the necessary interference into account.
Figure 17: Motor Cam
Once the model was designed, it was then manufactured using 6061 aluminum at the
machine shops in Washburn. The stock metal was first shaved down to the proper dimensions in
the lathe and then the mill was used to perform the drilling operations. The linkage was then
press fit to the motor shaft by heating up the metal and then applying force. Once cooled, the
linkage was securely fastened to the motor shaft as seen in Error! Reference source not found.,
which completed the motor preparation.
Figure 18: Cam Attached to Motor
30
3.3.4. Stresses Exerted at the Joints
Along with finding the power requirements of the system, another important factor to
consider was the stress exerted at various joints. In the wave generation system there are four
major areas of stress concentration; the two hinges connecting the board to the test tank, the pin
connecting the rod to the board, and the pin connecting the rod to the cam. Each of these stress
concentrators was analyzed to ensure that they would be capable of handling the necessary
loading conditions. The first area that was dissected included the hinges connecting the board to
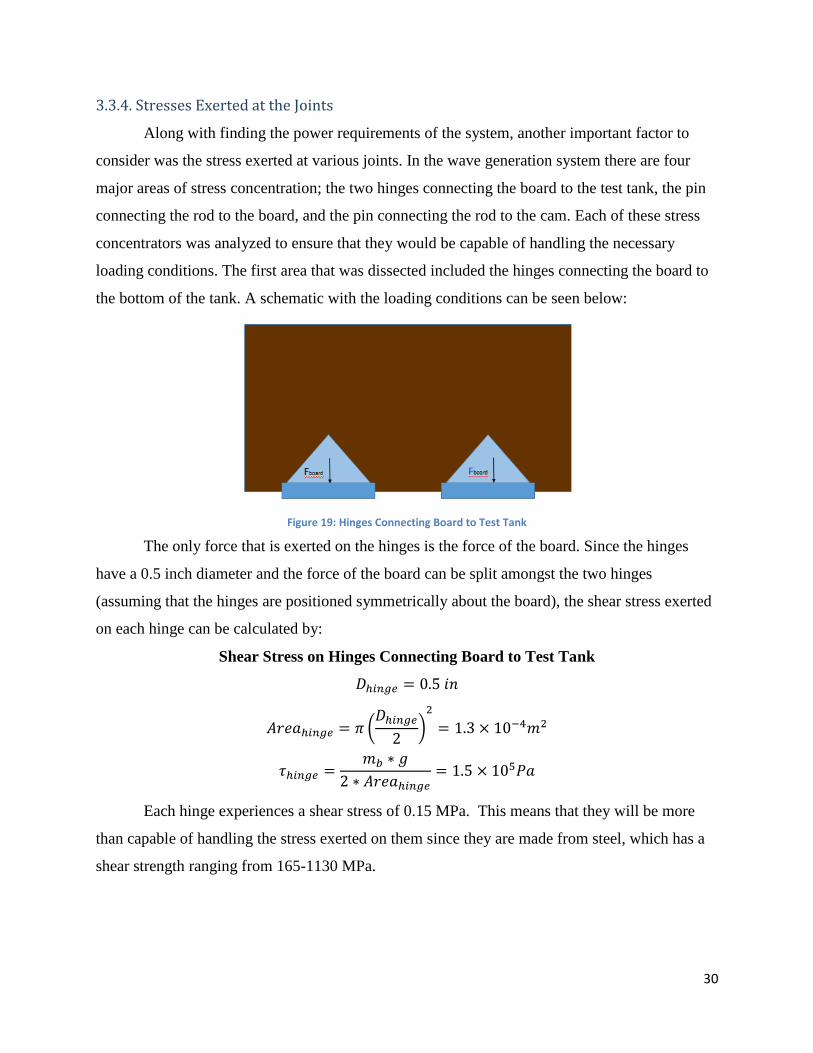
the bottom of the tank. A schematic with the loading conditions can be seen below:
Figure 19: Hinges Connecting Board to Test Tank
The only force that is exerted on the hinges is the force of the board. Since the hinges
have a 0.5 inch diameter and the force of the board can be split amongst the two hinges
(assuming that the hinges are positioned symmetrically about the board), the shear stress exerted
on each hinge can be calculated by:
Shear Stress on Hinges Connecting Board to Test Tank
𝐷ℎ𝑖𝑛𝑔𝑒 = 0.5 𝑖𝑛
𝐴𝑟𝑒𝑎ℎ𝑖𝑛𝑔𝑒 = 𝜋 (𝐷ℎ𝑖𝑛𝑔𝑒
2)
2
= 1.3 × 10⁻⁴𝑚2
𝜏ℎ𝑖𝑛𝑔𝑒 =𝑚𝑏 ∗ 𝑔
2 ∗ 𝐴𝑟𝑒𝑎ℎ𝑖𝑛𝑔𝑒= 1.5 × 10⁵𝑃𝑎
Each hinge experiences a shear stress of 0.15 MPa. This means that they will be more
than capable of handling the stress exerted on them since they are made from steel, which has a
shear strength ranging from 165-1130 MPa.

31
The next joint that was taken into consideration included the pin connecting the rod to the
board. The forces exerted on this pin included the force of the board as well as the force of the
rod. Figure 20 shows a free body diagram of this pin joint.
Figure 20: Pin Connecting Rod to Board
Since the board is connected in two different locations, the pin experiences double shear,
meaning that the stress is cut in half. Calculations for the shear stress exerted on this pin can be
seen below:
Shear Stress on Pin Connecting Board and Rod
𝐷𝑝𝑖𝑛2 = 0.5 𝑖𝑛
𝐴𝑟𝑒𝑎𝑝𝑖𝑛2 = 𝜋 (𝐷𝑝𝑖𝑛2
2)
2
= 1.3 × 10⁻⁴𝑚2
𝜏𝑝𝑖𝑛2 =−𝐹𝐵𝑜𝑛𝑅
2 ∗ 𝐴𝑟𝑒𝑎𝑝𝑖𝑛2= 163 𝑃𝑎
The shear stress at pin 2 is only 163 Pa. Since pin 2 is also made from steel, there is no
concern about the pin experiencing failure in this environment.
The final joint that was analyzed was the pin connecting the cam to the rod. As seen in
Figure 21, the forces that act on this pin include the force of the cam and the force of the rod,
which were previously determined to be equal and opposite.

32
Figure 21: Pin Connecting Cam to Rod
To determine the shear stress acting on pin 1, the force exerted on the pin was divided by
the cross-sectional area of the pin. The pin used in the system is approximately 0.190 inches in
diameter. The calculations for the shear stress can be seen below:
Shear Stress on Pin Connecting Cam and Rod
𝐷𝑝𝑖𝑛1 = 0.190 𝑖𝑛
𝐴𝑟𝑒𝑎𝑝𝑖𝑛1 = 𝜋 (𝐷𝑝𝑖𝑛1
2)
2
= 1.8 × 10⁻⁵𝑚2
𝜏𝑝𝑖𝑛1 =𝐹𝐶𝑜𝑛𝑅
𝐴𝑟𝑒𝑎𝑝𝑖𝑛1= 2.3 × 10³ 𝑃𝑎
The shear stress acting on pin 1 is 2.3 kPa. Since this pin is also made out of steel, it will
be able to handle the testing environment. This shows how all areas of stress concentration will
remain intact.
3.3.5. Other Considerations
Other important components of the wave generation system included its overall features.
The system was placed in a large wooden test tank. The test tank was 8 feet long, 3 feet wide,
and 2 feet deep. In order to keep the tank waterproof, it was coated with a water resistant layer
and then sprayed with a rubber sealant along all the edges. Additionally, the tank was made with
no legs so there would be no concentrated areas of stress. Wooden supports were placed
underneath and along the edges of the tank for extra stability and security.

33
It was essential to ensure that the electrical components did not interact with the water.
To do this, the motor was mounted four inches above the top of the test tank by means of a
slotted L-bar. A U-clamp tightly secured the motor to the L-bar. Additionally, a 12-volt car
battery was placed on the ground behind the motor. The battery was covered and shielded by a
plastic tarp. The pulse width modulator was placed on a flat surface next to test tank, ensuring
that it would not fall into the filled tank. The necessary precautions were taken in order to keep
the team safe as well as keep the equipment from being damaged.
3.4 Design of Overtopping Device
By combining the desirable aspects of Wave Dragon and SSG as discussed in Chapter 2,
a new overtopping device was designed as shown below in Figure 22. The device consists of
three tiers of reservoirs that empty into each other. In the actual device a multi-stage turbine
would connect each tier, converting the stored potential energy into power, however, due to the
small-scale nature of this prototype, the turbine was omitted. The device was attached to the test
tank to mimic anchoring and avoid movement during wave simulations and testing. The device
was designed to continuously operate, as waves will constantly be entering at least one of these
three tiers due to the slight bottleneck design. Consistent operation allowed the overtopping
device to reach higher efficiencies than other systems.
Figure 22: Overtopping Prototype
An actual full-scale design would incorporate wave reflectors on each side in order to
maximize the amount of waves that are captured. For the purpose of this project, the wave
reflectors were omitted due to size limitations of the test tank.
This particular prototype can be broken into three main design categories that are crucial
to its functionality: tier design, ramp design, and tier drain system.

34
The prototype was designed so that the tiers optimally function under 2.5 inch waves. As
mentioned previously in chapter 3.2.: tier one has a relative height of 0.6 times the wave height,
tier two has a relative height of 1.0 times the wave height, and tier three has a relative height of
1.2 times the wave height. Each tier is tapered so that the water is forced to flow towards the
back of the device where it is outputted to the draining system. The bottom of the prototype is
shelled out so that the device is able to float above the water. Not only does this allow the device
to float, but it also allows water flow out of tier 1. Without a pocket of air there would be no
potential energy, restricting any volume of water from flowing out of tier 1.
Another important part of the device design is the ramp. A wave is felt up to half its
wavelength under water, therefore the bottom ramp, leading to tier 1, is designed to account for
the felt wave height. Since the wave will break on the prototype, there will not be any
disturbances under the device. The ramps leading to the higher tiers are overlapped such that if
the wave does not make it all the way up the ramp, it will fall back down into the previous tier.
This is shown in the image below:
Figure 23: Ramp Design
Producing a turbine for this prototype was not possible due to budget and size constraints,
so to simulate the actual output of a turbine, the theoretical power output was calculated by
measuring the volume of water that was captured. A hole was drilled through all 3 tiers of the
device to drain water entering the system. The tiers were designed to fill at the same rate as they
were draining in order to maintain a constant head. By maintaining constant head, the prototype
can fulfill both the minimum head requirement and constant operation for the turbines.
A piping system was developed, enabling water to be captured from one tier while
closing off the other two. To do this, a pipe fitting was inserted in the hole that extends through
all three tiers. At each tier level, a hole was cut in the pipe fitting allowing water to flow out of
35
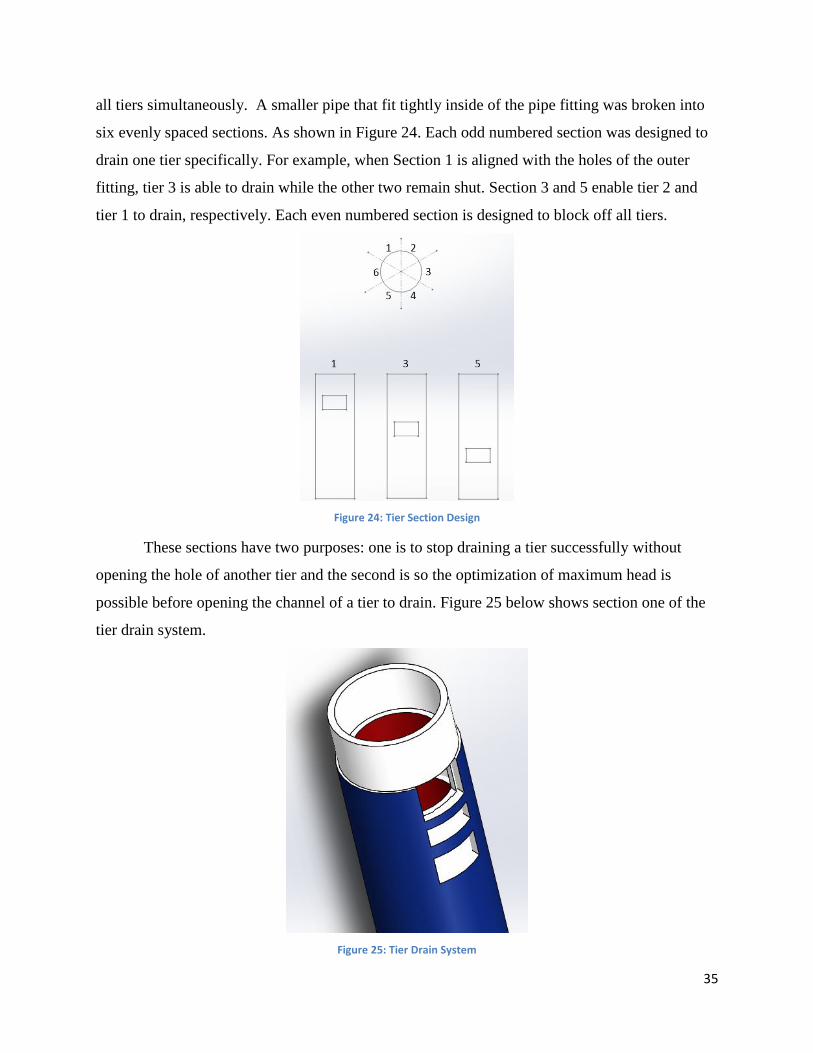
all tiers simultaneously. A smaller pipe that fit tightly inside of the pipe fitting was broken into
six evenly spaced sections. As shown in Figure 24. Each odd numbered section was designed to
drain one tier specifically. For example, when Section 1 is aligned with the holes of the outer
fitting, tier 3 is able to drain while the other two remain shut. Section 3 and 5 enable tier 2 and
tier 1 to drain, respectively. Each even numbered section is designed to block off all tiers.
Figure 24: Tier Section Design
These sections have two purposes: one is to stop draining a tier successfully without
opening the hole of another tier and the second is so the optimization of maximum head is
possible before opening the channel of a tier to drain. Figure 25 below shows section one of the
tier drain system.
Figure 25: Tier Drain System

36
3.5 Construction of Test Tank and Device
3.5.1. Test Tank Construction
The wave tank was constructed to test the wave energy converter while simulating deep-
water waves. The wave tank was constructed from 2x6’s and ¾” plywood. The tank is illustrated
in the SolidWorks drawing and model below.
Figure 26: SolidWorks Drawing and Model of Wave Tank
Construction began by cutting all pieces to the proper dimensions: two 8’x2’ side pieces,
two 3’x2’ pieces for the front and back, and one 3’x8’ bottom piece. Once all pieces were cut,
the frame was built by attaching the 2x6’s with supporting joints at the corners for added
strength. The plywood was then added to this frame for enclosure of the tank. Additionally,
supports were added at the center of the tank to prevent collapsing under a heavy load of water.
In order to ensure the waterproof interior, latex was coated along the inside with rubber spray
lining the seams of the tank. The exploded view below illustrates the assembly process of the
wave tank.
Figure 27: Exploded View and Final Construction of the Wave Tank

37
3.5.2. Device Construction
In order to utilize the resources available for manufacturing, each tier was broken into
3.5” wide segments that could be easily machined. To achieve the desired slope across the entire
device, a continuous slope was cut across each segment to form a continuously flowing piece.
The sloped tiers were created by machining grooves in a small metal block at the correct slope
and resting each board on the block to be machined. Due to the 3’ length of the board, the
milling tool experienced a great deal of chatter during the cutting operation. To ensure a smooth
surface finish, a metal rod was taped to the underside of the board to add mass and minimize
chatter. This same process was utilized to create all three tiers of the device.
Once all of the slopes were machined, the tiers required assembly of the 3.5” wide
segments using a technique called biscuit jointing. Biscuit jointing involves a process of cutting
small slots in the material and inserting wooden biscuits that hold the pieces together.
Figure 28: Biscuit Joint Exploded View (Biscuit, n.d.)
Biscuit jointing was used on each of the three tiers consisting of five, four, and three
segments for tiers one, two, and three respectively. The tiers were glued with PVC cement and
clamped together to allow for proper setting and drying of the tiers.
Figure 29: Clamped Tier 1 to Allow Proper Setting Of Biscuit Joints

38
Following the assembly of the tiers, the sideboards and backboards were constructed to
support the system. The cuts were easily achieved by creating dxf files exported to the CNC
mills, which quickly cut the tier cross-section into the sideboards.
Figure 30: Cross-Section of the Sideboards
The tier slots were cut 0.375” deep into the PVC trim to provide as much support as
possible for each reservoir without compromising the integrity of the sideboards. The two
sideboards were created as mirror images so as to hold the tiers in their respective slots.
Finally, the backboard was created to close off each reservoir and provide extra structural
support for each tier. The backboard was created in a similar fashion to the sideboards, using
CNC milling which was established by the SolidWorks image illustrated below.
Figure 31: SolidWorks Drawing of the Backboard
The simplistic design for the backboard allows the back to sit on the bottom tier to
maximize support from this level and provides slots for the remaining top two tiers cut at the
same depth as the sideboards at 0.375”. Concluding the machining of the tiers, sideboards, and
backboard, the pieces were all assembled using PVC cement and clamped in place for proper
setting.
3.5.3. Assembly of Testing Unit
Upon completion of machining the wave energy converter, additional assembly was
required to account for the testing procedure. To provide a means of capturing and measuring
volume, an expansion adapter tube was inserted into the device. A hole of diameter 2.81” was
machined in the back center of each tier to produce a continuous hole throughout the device. To

39
accommodate the flow of water through each tier, CNC milling was used to create openings for
each level of the expansion adapter as shown below.
Figure 32: Drawing of Expansion Adapter for Water Collection
Each opening lines up with the three tiers and provides a tight seal using PVC cement to
waterproof and lock the expansion adapter in place. Furthermore, the inner tube of the expansion
adapter was altered to close off flow to all but a single tier at a time. In doing so, the volume can
be measured from each tier to determine efficiency of the multiple levels. By removing the inner
tube altogether, the entire device can be tested at once in terms of flow and volume capture. The
design of the inner tube relies on sealing off two tiers at any given time and therefore, the
openings occur at 120° apart from one another as is demonstrated below.
Figure 33: Inner Tube Design for Testing Different Tiers
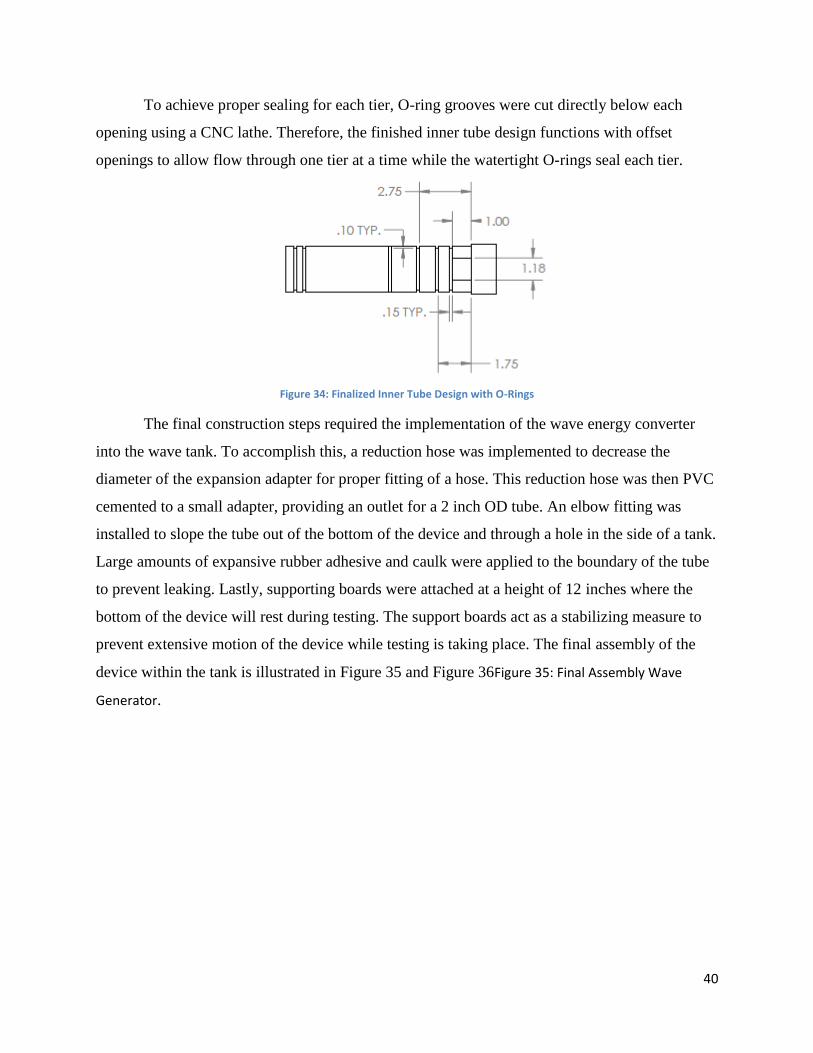
40
To achieve proper sealing for each tier, O-ring grooves were cut directly below each
opening using a CNC lathe. Therefore, the finished inner tube design functions with offset
openings to allow flow through one tier at a time while the watertight O-rings seal each tier.
Figure 34: Finalized Inner Tube Design with O-Rings
The final construction steps required the implementation of the wave energy converter
into the wave tank. To accomplish this, a reduction hose was implemented to decrease the
diameter of the expansion adapter for proper fitting of a hose. This reduction hose was then PVC
cemented to a small adapter, providing an outlet for a 2 inch OD tube. An elbow fitting was
installed to slope the tube out of the bottom of the device and through a hole in the side of a tank.
Large amounts of expansive rubber adhesive and caulk were applied to the boundary of the tube
to prevent leaking. Lastly, supporting boards were attached at a height of 12 inches where the
bottom of the device will rest during testing. The support boards act as a stabilizing measure to
prevent extensive motion of the device while testing is taking place. The final assembly of the
device within the tank is illustrated in Figure 35 and Figure 36Figure 35: Final Assembly Wave
Generator.

41
Figure 35: Final Assembly Wave Generator
Figure 36: Final Assembly Wave Converter

42
Chapter 4 – Testing & Data Collection
Testing of the wave capture device required various data collection to accurately
calculate the power output because turbines and generators were not used in the prototype. For
this reason, it was important to measure the volume of water captured per wave for each tier as
well as the drain time. Additional observations proved the ability of the device to maintain
constant head, retain the collected water, and successfully produce flow that would act to spin
turbines in a real world model. Tests were completed to define the success of scaling up the
prototype to be used in marketable applications.
The first test for the wave capture device was to measure the amount of volume captured
per wave during operation. Results were achieved through a series of steps. First, the tank was
run without collecting any water until the waves reached a steady state condition. The
characteristic waves needed to be attained before collection to perform repeatable tests. The
characteristic wave created during the test can be illustrated in Figure 37.
Figure 37: Characteristic Waves

43
As can be seen in Figure 37, the wave amplitude was about 2.5 inches. As explained in
the previous calculations, the actual wave height is equal to half of the amplitude. Therefore, the
waves were about half of the desired height of 2.5 inches at about 1.25 inches for testing. .
The next step was for the device to collect water for a series of 60 waves. The number of
waves was counted once more to maintain a repeatable test that would theoretically sustain equal
volumes of water collected for each trial. The water drained from the device through a piping
system into a container for water collection. The container was weighed both before and after
collection using an eye-level beam scale to determine the mass of water collected. Using the
mass and density of collected water, the volume could then be calculated knowing that:
𝑉 =𝑚
𝜌
Initially, all tiers were left open and the entire volume collected from the device was
measured. Afterwards, different tiers were blocked off to analyze the contribution from each tier
individually. To do so, an inner tube was used in the wave capture device to block off all but one
tier during testing. First, the top two tiers were blocked off and the bottom tier was tested for
water collection. Next, the top and bottom tiers were blocked off and the middle tier was tested
for volume capture. Seeing as the water was unsuccessful at reaching the top tier, testing for this
tier was omitted. Two trials were completed to ensure repeatability and accuracy, which proved
to be consistent between tests. The table below displays the results yielded from each of the tests.
Table 3: Volume Collection Data
Trial # Bucket
Weight (lb)
All
Levels
(lb)
Volume
(GPM)
2nd
Tier
(lb)
Volume
(GPM)
Bottom
Tier
(lb)
Volume
(GPM)
Trial 1 1 29 209 6 43 26 187
Trial 2 1 28 201 5 36 22 158
Avg.
Weight 28.5 53 5.5 10 24 45
Avg.
Weight
without
bucket
27.5 198 4.5 32 23 165
Further tests were completed to determine the flowrate of the collected water out of each
tier. The test was performed by blocking off a single tier and filling it with water. Once the tier
was full, the inner tube was removed to drain the tier. The tier draining time was measured to

44
calculate the flowrate of water out of the device. Two trials were completed to demonstrate
repeatable results. The recorded times and calculated flowrates are shown in the table below.
Table 4: Drain Time and Volumetric Flowrate
Emptying Time Bottom Tier
(s)
Volumetric
Flowrate
(GPM)
Middle
Tier
(s)
Volumetric
Flowrate
(GPM)
Trial 1 86 1.16 73 0.67
Trial 2 78 1.28 70 0.70
Average 82 1.22 71.5 0.69
Further observation of the device during testing revealed that the device did not leak.
Additionally, the device successfully maintained constant head throughout each test. The data
compiled from this testing was interpreted into power outputs that could be yielded from a life-
size model.

45
Chapter 5 – Results & Analysis
Testing of the wave energy converter device returned promising results. A fundamental
outcome achieved was the ability of the device to maintain constant head throughout testing.
This means that the device was able to sustain a steady water level in the reservoirs of both the
bottom and middle tiers even as water drained from the device and was collected. The lack of
constant head in many current systems prevents the turbines from consistently operating. The
purpose of constructing a device that is capable of keeping a constant head is to reduce
inefficiencies. The energy required to overcome static friction to begin turning a turbine is higher
than that required to retain motion of an already spinning blade. With a constant water level, the
turbines will not stop as long as waves are being generated. This will minimize the frictional
losses due to the starting and stopping of the turbine. On the other hand, if the tier is draining
slower than it is filling, it will become saturated and the volume capture efficiency will decrease.
Therefore, it is important to optimize the number of turbines in the system to drain the device at
the same rate that it is being filled.
Further analysis demonstrates the success of the design to capture and hold a large
volume of water without creating high stress concentrations causing any damage to the device.
Observations show the water’s ability to travel up the device, collect in each reservoir, and
withstand the forces produced by the waves. Although this observation appears trivial, there is a
direct correlation between the structural integrity and implementation costs. Although the design
was successful in providing a ramp to capture water in the first two tiers, the third tier was
unsuccessful in collecting water at all. This suggests that either the waves produced were simply
not large enough in regards to the prototype scale or the scaled device dimensions should be
shifted to account for this currently extraneous component.
To quantify the success of the system in wave volume captured, the efficiency can be
calculated using the theoretical wave volume compared to the actual volume collected. The
volume of the wave can be estimated by the integral of a sine curve with a peak at 1.25 inches
multiplied by a width of 36 inches. The theoretical volume of the wave is then represented by:
𝑉 = ∫ 1.25𝑠𝑖𝑛𝑡𝜋
0
𝑑𝑡 ∗ 36
𝑉 = 36 ∗ 1.25[(− cos(𝜋)) − (− cos(0))] = 90𝑖𝑛3

46
The collected volume represents the water captured for a total of 60 waves and therefore
the theoretical volume should be extrapolated to 60 waves by:
𝑇𝑜𝑡𝑎𝑙 𝑇ℎ𝑒𝑜𝑟𝑒𝑡𝑖𝑐𝑎𝑙 𝑉𝑜𝑙𝑢𝑚𝑒 = 𝑉 ∗ 60 = 5,400𝑖𝑛3
The actual collected volume can then be obtained from the data in the previous section.
Using the average volume of water collected from the three tiers gives a value of 762𝑖𝑛3.
The efficiency of wave collection can then be calculated comparing the theoretical
collection value to the experimental collection value as:
𝐶𝑜𝑙𝑙𝑒𝑐𝑡𝑖𝑜𝑛 𝐸𝑓𝑓𝑖𝑐𝑖𝑒𝑛𝑐𝑦 = 1 −5,400 − 762
5,400𝑥100% = 14.1%
Although the collection efficiency seems low, this is the efficiency before optimization of
turbines. In the tested system, the first tier filled early in the test and remained saturated for the
entirety due to a slower drain rate compared to collection rate. Therefore, the reservoirs were
filled and unable to take on any of the extra water. Through optimization of turbines, the
collection efficiency approaches 100%, which will be discussed later.
The power output of the system can be determined by using the measured volumetric
flow and head, the density of water, the gravity constant, as well as the conversion factors
needed to convert the units into watts. Using these parameters, the calculated power output for
the prototype can be calculated by:
𝑃 = 𝜌𝑞𝑔ℎ ∗ 𝑒𝑓𝑓
Where ρ is the density of water, q is the volumetric flow, g is the gravity constant, h is the
head, and eff is the turbine efficiency. The head was measured by the CNC machine used to
manufacture the device and the flowrate was calculated based on the mass of water collected
from the system. This calculated power output for the prototype scale is illustrated in the table
below.
Table 5: Prototype Scale Power Output
Tier
Prototype Scale
Head
(ft)
Volume Flow
(GPM)
Calculated Power
(W)
Calculated Power (W)/ft of
Wavefront
Top 0.021 0.000 0.000 0.000
Middle 0.042 0.686 0.003 0.001
Bottom 0.063 1.221 0.007 0.002
Total 0.010 0.003

47
The Froude scaling factor was used to scale the prototype to a full-size model of the
device. Froude scaling was based on the wave height (λ) for the system and the dimensions of
each parameter. For a 1.25 inch wave height, the Froude scaling ratio is defined for the following
parameters:
Table 6: Froude Scaling Ratio Calculations
Parameter Dimension Froude Definition Froude Scaling Ratio
Head [L] Λ 0.0318
Volumetric Flow [L3T] λ5/2 0.00018
Applying these Froude scaling ratios to the prototype scale then yields full-size results as:
Table 7: Full-Size Model Scale Power Output
Tier Full-Size Model Scale
Head(ft) Volume Flow
(GPM)
Calculated Power
(W)
Calculated Power (W)/ft of Wavefront
Top 0.7 0.0 0.0 0.0
Middle 1.3 3802.6 469.6 5.0
Bottom 2.0 6769.7 1254.1 13.3
Total 1723.8 18.3
Because the system needs to operate under low head conditions, Kaplan turbines were
utilized. These hydro turbines require a minimum head of only 1ft, which best suits this system.
The specifications for low-head Kaplan turbine operability are displayed in the table below.
Table 8: Low-Head Kaplan Hydro Turbine Specifications (1000W Low Head Kaplan Turbine, 2015)
Head[Feet] Flowrate[GPM] Approximate Production
[Watts]
Minimum Pipe
Size
1 320 25 8”
2 450 70 8”
3 550 150 10”
4 635 250 10”
5 710 350 10”
6 775 465 12”
7 840 585 12”
8 895 715 12”
9 950 850 12”
10 1000 1000 12”

48
The specifications of the low-head Kaplan hydro turbine can be used to determine the
efficiency of the system. Without considering the turbine efficiency, the power output would be
inaccurate since it would represent an unloaded, ideal system. To determine the turbine
efficiency for the system, the power can be calculated based on the head and flow values given
for the turbines’ approximated power output compared to the theoretical output. The table below
indicates the efficiency for the low-head Kaplan turbines with varying heads.
𝑒𝑓𝑓 =𝐴𝑝𝑝𝑟𝑜𝑥. 𝑃𝑜𝑤𝑒𝑟
𝜌𝑞𝑔ℎ
In this equation, “Approx. Power” is given in the turbine specifications, 𝜌 is the density
of water, q is the volumetric flow, g is the gravity constant, and h is the specified head. Thus, the
efficiency calculations are displayed in the table below.
Table 9: Low-Head Kaplan Turbine Calculations
Turbine Efficiency
Head
(ft) Flow (GPM) Power (W) Approx. Power (W) Eff
1 320 60.4 25 0.414
2 450 170 70 0.412
3 550 311 150 0.482
4 635 479 250 0.522
5 710 670 350 0.523
6 775 877 465 0.530
7 840 1110 585 0.527
8 895 1350 715 0.529
9 950 1610 850 0.527
10 1000 1890 1000 0.530
Most large hydro turbines operate at an efficiency of at least 90%. Turbines with very
small head values generally function at a much lower efficiency, which explains the significantly
lower efficiency calculated. The efficiency of the system for the determined head of the scaled
up model can be estimated at about 40% for the low-level head, characterized by the system at
about 1ft, correlating with the calculated efficiencies above. This efficiency is used in the power
calculation to determine the power output of both the prototype model and full-scale operating
system.
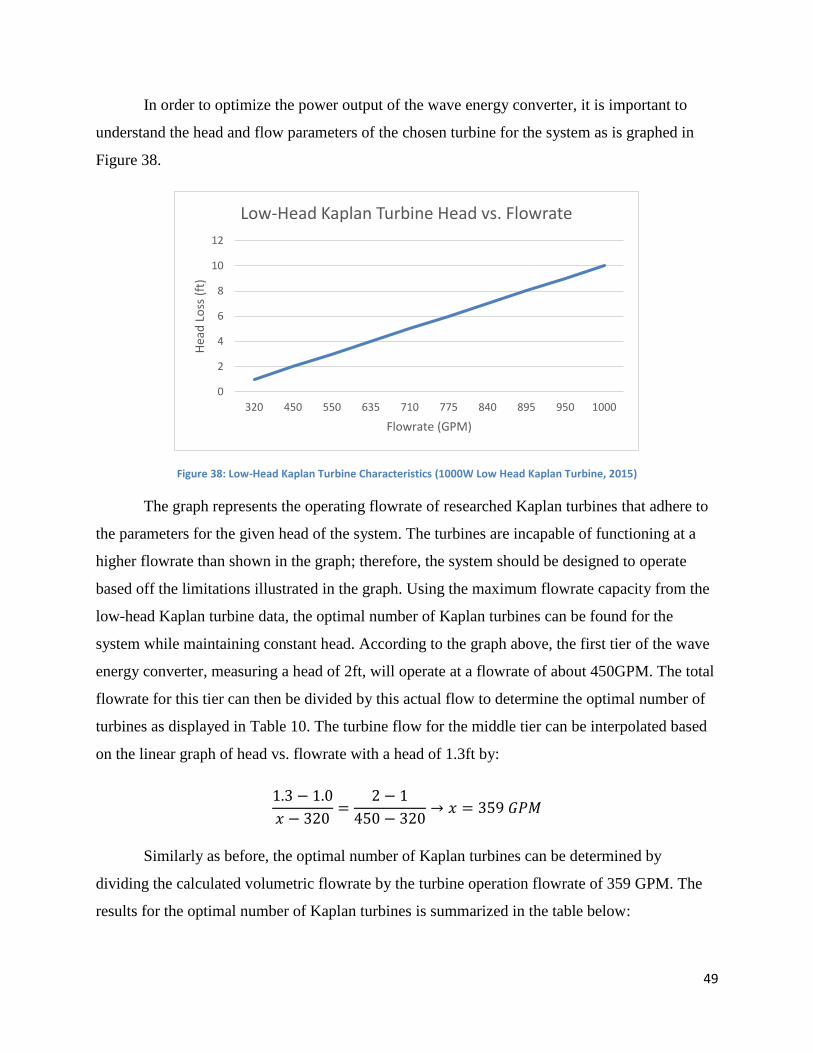
49
In order to optimize the power output of the wave energy converter, it is important to
understand the head and flow parameters of the chosen turbine for the system as is graphed in
Figure 38.
Figure 38: Low-Head Kaplan Turbine Characteristics (1000W Low Head Kaplan Turbine, 2015)
The graph represents the operating flowrate of researched Kaplan turbines that adhere to
the parameters for the given head of the system. The turbines are incapable of functioning at a
higher flowrate than shown in the graph; therefore, the system should be designed to operate
based off the limitations illustrated in the graph. Using the maximum flowrate capacity from the
low-head Kaplan turbine data, the optimal number of Kaplan turbines can be found for the
system while maintaining constant head. According to the graph above, the first tier of the wave
energy converter, measuring a head of 2ft, will operate at a flowrate of about 450GPM. The total
flowrate for this tier can then be divided by this actual flow to determine the optimal number of
turbines as displayed in Table 10. The turbine flow for the middle tier can be interpolated based
on the linear graph of head vs. flowrate with a head of 1.3ft by:
1.3 − 1.0
𝑥 − 320=
2 − 1
450 − 320→ 𝑥 = 359 𝐺𝑃𝑀
Similarly as before, the optimal number of Kaplan turbines can be determined by
dividing the calculated volumetric flowrate by the turbine operation flowrate of 359 GPM. The
results for the optimal number of Kaplan turbines is summarized in the table below:
0
2
4
6
8
10
12
320 450 550 635 710 775 840 895 950 1000
Hea
d L
oss
(ft
)
Flowrate (GPM)
Low-Head Kaplan Turbine Head vs. Flowrate

50
Table 10: Optimized Number of Kaplan Turbines
Tier Full-Size Model Scale
Head(ft) Volumetric Flow
(GPM)
Kaplan Turbine Flow (GPM) Number of Kaplan
Turbines
Top 0.7 0.0 0.0 0.0
Middle 1.3 3802.6 359.0 11
Bottom 2.0 6769.7 450.0 15
Therefore the actual power output of the system will be the total calculated power
multiplied by the number of turbines used:
Table 11: Actual Power Output of the Full-Scale System
Tier Full-Size Model Scale
Calculated Power
(W)/ft of Wavefront
# of Kaplan
Turbines
Actual Calculated Power
(W)/ft of Wavefront
Top 0.0 0 0.0
Middle 5.0 11 54.8
Bottom 13.3 15 199.4
Total 18.3 26 254.2
The overall calculated power increases due to the optimization of flow rate through the
system. The low head Kaplan turbines used have a maximum operating flowrate and will be
saturated at any higher speeds. Therefore, to increase the power, Table 11 displays the number of
turbines that should be used and the actual power per foot of wavefront based on the optimized
values. The power output is then maximized by ensuring that the flowrate through each turbine
never exceeds the highest operating speed to conserve energy for the best performance.
The overall design of the proposed combined device can be compared to that of the Wave
Dragon which is currently one of the top competing overtopping wave energy converters on the
market. The results compare significantly in favor of the combined design to enhance efficiency
while taking up much less space in the ocean.
Table 12: Proposed Design vs. Existing Market
Parameters Sea
Slot
Wave
Dragon
Power Output (W)/ft of
Wavefront 250 133.3
# of Kaplan Turbines 26 7
Area (ft2) 1085 17226
Height (ft) 3.9 10.8
# of Reservoirs 3 1

51
Chapter 6 – Conclusions & Future Improvements
From the results presented in the last chapter, it was concluded that the combined
overtopping wave energy converter proves to be a desirable product to use in the field of
renewable energy. Combining the offshore location of the Wave Dragon with the multi-tiered
component of the SSG, an overtopping device with superior power production capabilities was
created. When compared to similar devices, the combined prototype produces more power and
takes up less overall area. Placing an overtopping device in the open ocean presents some
environmental concerns, but due to the location of many marine habitats on the shoreline, the
environmental impact will be minimal. Since overtopping devices float on the surface of the
water, there will be little interference with sea creatures’ natural habitat. When scaled up to a full
sized model, the combined overtopping device shows great promise in the field of wave energy
harvesting.
Although this device shows successful results, there are several recommendations to
improve this product further, including:
Variation of flow diameter to optimize flowrate based on projected head loss
Variation of wave conditions for best year-round performance
Optimization of turbine characteristics for low-head and flowrate requirements
Optimization of tier height and number of tiers for best collection efficiency
Inclusion of wave reflectors to capture more wave volume and direct waves to entrance
point
In addition to the design and testing tasks that should be completed in further research, an in-
depth cost analysis would determine the feasibility of implementing the proposed system. There
are a number of fundamental aspects that can contribute to cost efficiency including material
optimization, maintenance, and power production parameters. Taking these values into
consideration will then produce a cost per unit energy that can be weighed for feasibility. Due to
time constraints, materials and maintenance costs were not researched in depth with a primary
focus on power production. Completing further research in various aspects would establish a
firmer conclusion to define the cost efficiency of the proposed system. Future developments
focusing in these areas will ultimately lead to an even more efficient overtopping device,
innovating the field of renewable energy.

52
References
1000W Low-Head Kaplan Hydro Turbine. (n.d.). Retrieved April 17, 2015, from
https://www.aurorapower.net/products/categoryid/4/list/1/level/a/productid/234.aspx
Alamian, R., Shafaghat, R., Miri, S.J., Yazdanshenas, N., Shakeri, M. (2014). Evaluation of
Technologies for Harvesting Wave Energy in Caspian Sea. Renewable and Sustainable
Energy Reviews, 32, 468-476.
Bedard, Roger. "Offshore Wave Power Feasibility Demonstration Project." 2005.
Biscuit Joint. (n.d.). Retrieved March 1, 2015, from http://www.builderbill-diy-help.com/biscuit-
joint.html
Emay, L. "Energy and the Environment-A Coastal Perspective." 22 May 2010. unc.edu. 16
October 2014 <http://coastalenergyandenvironment.web.unc.edu/ocean-energy-
generating-technologies/wave-energy/oscillating-water-column/>.
Esteban, M., Leary, D. (2012). Current Developments & Future Prospects of Offshore Wind and
Ocean Energy. Applied Energy, 90, 128-136.
Lockwood, Deirdre. “Harvesting Power When Freshwater Meets Salty." CEN RSS. 26 Nov.
2013. Web.
Natesan, A. (1994). Kinematic analysis and synthesis of four-bar mechanisms for straight line
couple curves. Thesis: Rochester Institute of Technology
Payne, Gregory. Guidance for the experimental tank testing of wave energy converters. United
Kingdom: The University of Edinburgh, 2008.
Pelamis Wave Power. 5 June 2014. 16 October 2014 <http://www.pelamiswave.com/our-
projects/project/1/P2-Demonstration-at-EMEC-Orkney>.
Tester, J.W., Drake, E.M., Driscoll, M.J., Golay M.W., Peters, W.A., “Chapter 14: Ocean Wave,
Tide, Current, and Thermal Energy Conversion.” Sustainable Energy. 2nd edition, 2012,
MIT Press.
Thurman, Harold. Essentials of Oceanography. 1992.
Vicinanza, Diego, Lucia Margheritini, Jens Peter Kofoed, and Mariano Buccino. "The SSG
Wave Energy Converter: Performance, Status and Recent Developments." Energies 5.2
(2012): 193-226.

53
Voorhis, R. Point Absorbers: The Technology and Innovations. 25 July 2012. 16 October 2014
<http://coastalenergyandenvironment.web.unc.edu/ocean-energy-generating-
technologies/wave-energy/point-absorbers/>.

54
Appendix A
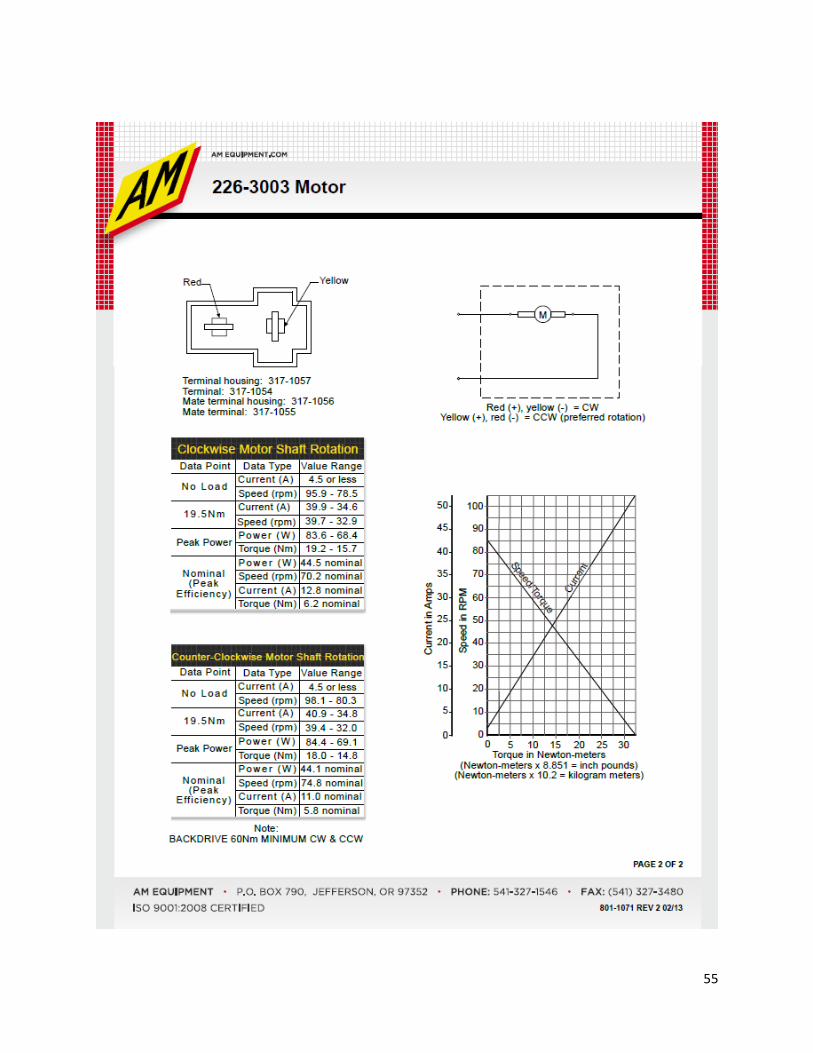
55
Related Documents