Ocean Remote Sensing from Satellites Ted Strub, Burt 406 [email protected] http://cioss.coas.oregonstate.edu/CIOSS/ • General Background • Examples, Measuring – Surface Temperature – Ocean Color/Optics – Sea Surface Height & Currents – Surface Wind Stress • New technology

Welcome message from author
This document is posted to help you gain knowledge. Please leave a comment to let me know what you think about it! Share it to your friends and learn new things together.
Transcript

Ocean Remote Sensing from Satellites Ted Strub, Burt 406
[email protected] http://cioss.coas.oregonstate.edu/CIOSS/
• General Background• Examples, Measuring
– Surface Temperature– Ocean Color/Optics– Sea Surface Height
& Currents– Surface Wind Stress
• New technology
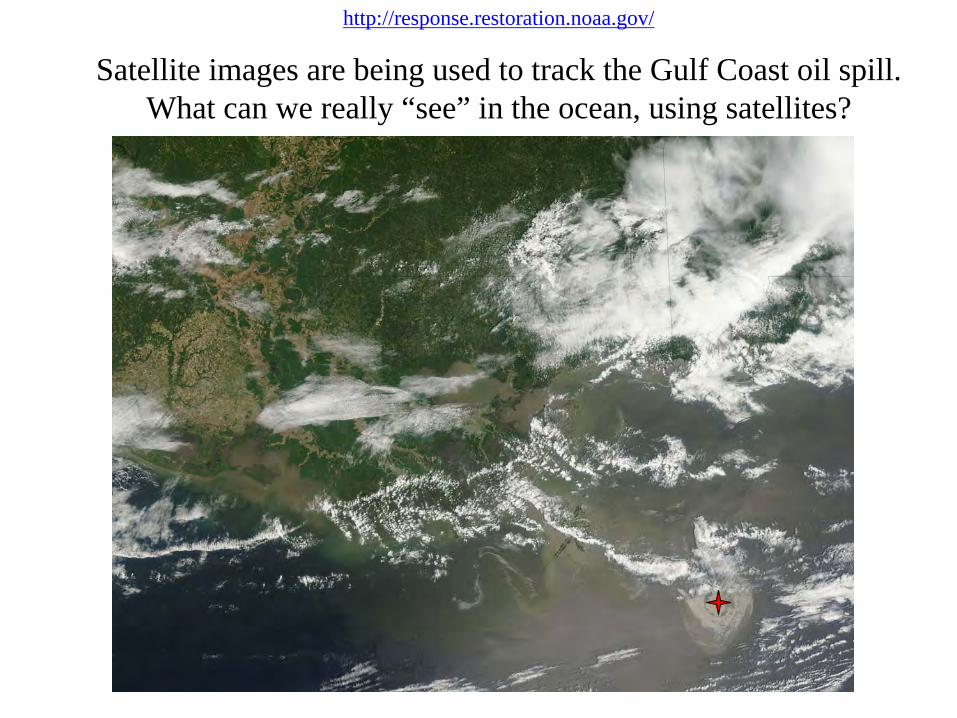
http://response.restoration.noaa.gov/
Satellite images are being used to track the Gulf Coast oil spill. What can we really “see” in the ocean, using satellites?

http://response.restoration.noaa.gov/
Several NOAA, Navy and University (research) models are being initialized with satellite image “interpretations”, augmented by aircraft overflights
For the future, the U.S. is developing an “Integrated Ocean Observing System” that will combine satellite data, in- water data and computer models of the circulation and water properties (similar to the computer weather forecast models).
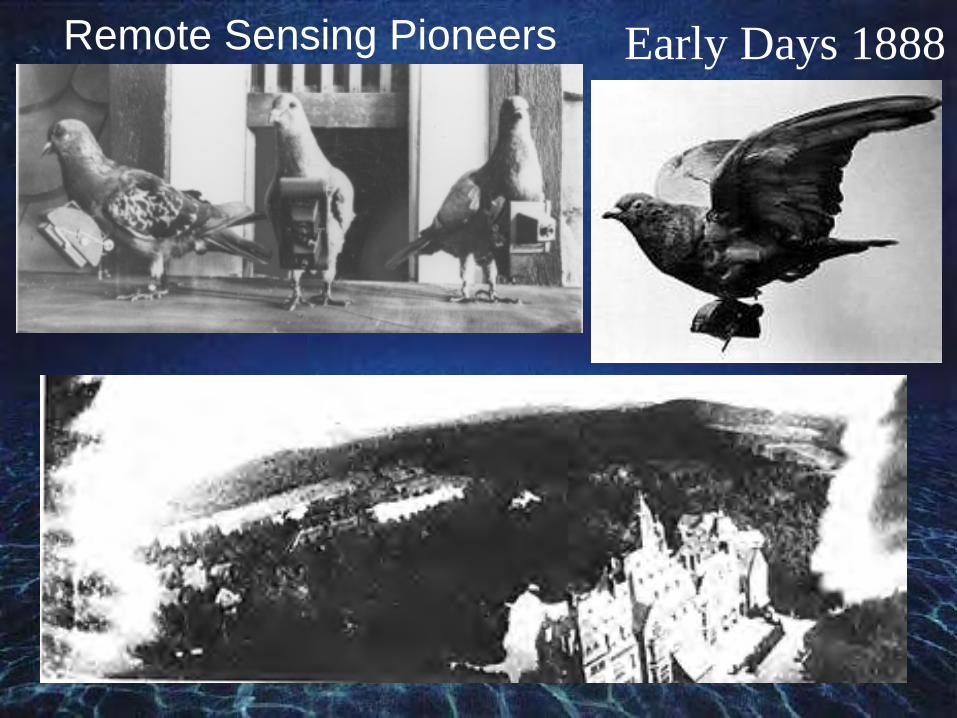
Early Days 1888Remote Sensing Pioneers

Why Satellites?• Oceans are vast, sparsely occupied – satellites provide uniform
sampling, daily-to-monthly fields.• Harsh environment for acquiring measurements• Ship time is expensive• Satellites can acquire measurements quickly over large areas
BUT…• Cost – Satellites are also expensive, but “global” (international)• Risk – If satellites fail, service calls are even more expensive • Must measure through intervening atmosphere• Can’t acquire sub-surface measurements• Can only measure a half-dozen variables, at the “surface” –
• But: We can measure wind forcing and response

Ships take time to “map out” an area.The blue ship tracks take ~ 1-2 weeks in the case below. Patterns of cold water (whiter shades) and currents change in 4 days between images.
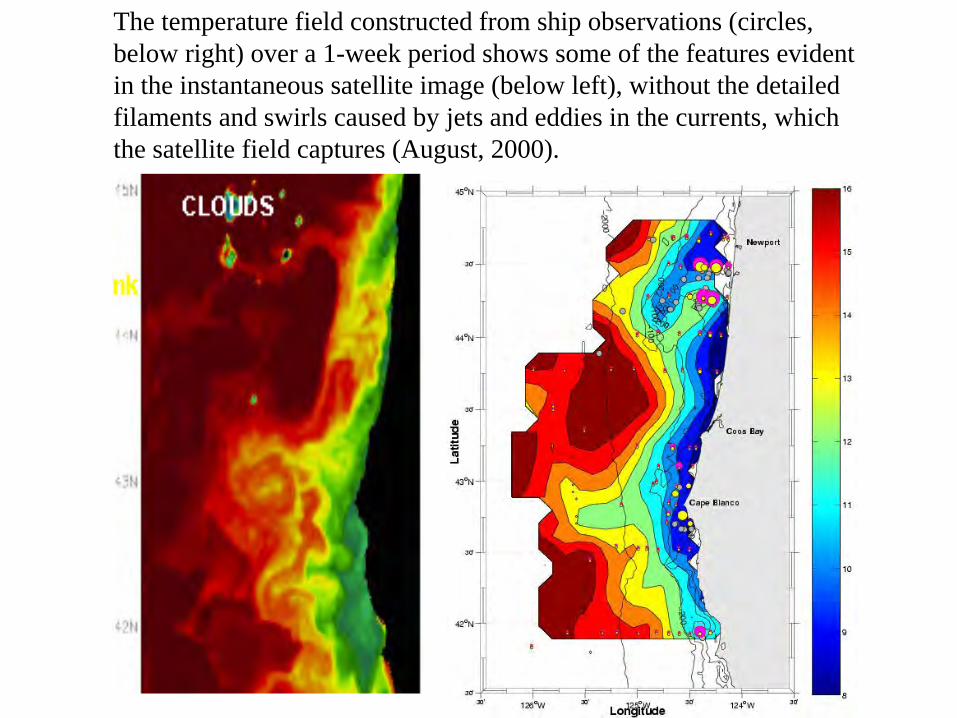
The temperature field constructed from ship observations (circles, below right) over a 1-week period shows some of the features evident in the instantaneous satellite image (below left), without the detailed filaments and swirls caused by jets and eddies in the currents, which the satellite field captures (August, 2000).


Components of a passive
“SST”
remote sensing system Using IR or Microwave Wavelengths
signalraw data
processing / disseminationcalibration/
validation
sensor
IR or μ-wave Emission
Two types of remote sensing:
Passive

Components of an active
radar “altimeter”
system For sea level: Transmit at nadir (directly beneath satellite)
source and sensor
signalraw data
processing / disseminationcalibration/
validation
Two types of remote sensing:
Active
μ-wave radar Reflection

Geostationary Orbit -
GEO36,000km altitude (wide view)Stays over same locationCan document evolving systemsHigh temporal resolutionLower spatial resolution?
Not necessarily – can “stare” for longer exposures.No polar coverage
“Polar”
Orbit (Low Earth Orbit LEO)850-1000 km altitudeTravels nearly over polesSees almost whole globe Lower temporal resolutionHigher spatial resolution?
Not necessarily – limited time over each point.
Orbits Determine Sampling

Examples of several types of orbits.The Earth’s center of mass must be in the orbital plane – so Geostationary orbits must be in the Equatorial plane. Low Earth Orbits are inclined from the equatorial plane. Specialized orbits are used for different purposes.
• Sun-synchronous orbits cross the equator at the same time each solar day.
• Low inclination orbits are used to look more closely at tropical processes.
• Exact-repeat orbits fill in a grid of orbit tracks over X days, then repeat exactly.
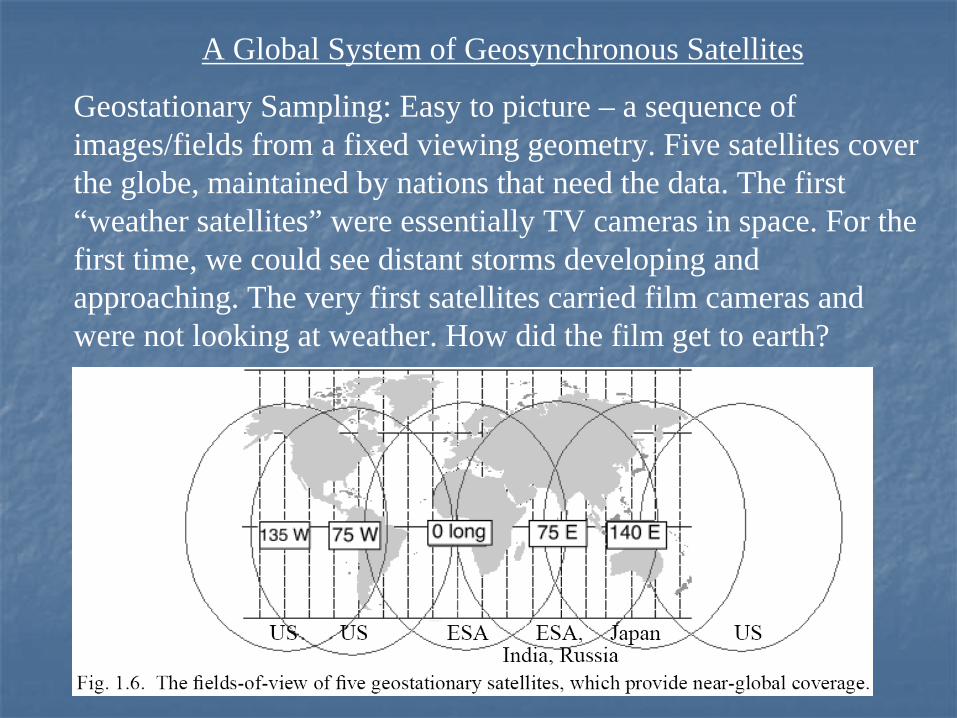
A Global System of Geosynchronous Satellites
Geostationary Sampling: Easy to picture – a sequence of images/fields from a fixed viewing geometry. Five satellites cover the globe, maintained by nations that need the data. The first “weather satellites” were essentially TV cameras in space. For the first time, we could see distant storms developing and approaching. The very first satellites carried film cameras and were not looking at weather. How did the film get to earth?

Low Earth Orbits (“Polar Orbiting”): The orbital plane of the satellite remains fairly constant while the earth rotates toward the east. Subsurface tracks migrate to the west.

Orbit Animations?

What What SeaWiFSSeaWiFS
(visible) sees in one day: (visible) sees in one day: Swaths leave gaps at low latitudes:Swaths leave gaps at low latitudes:
Clouds cover >50% of the ocean and obscure Clouds cover >50% of the ocean and obscure visible and IR radiation.visible and IR radiation.

Specific ExamplesSpecific Examples Sea Surface Temperature (SST)Sea Surface Temperature (SST)
Perhaps the most Perhaps the most ‘‘standardstandard’’ measurement from satellitesmeasurement from satellitesPassive Passive meaurementmeaurement. Traditionally used infrared (IR) emission. Traditionally used infrared (IR) emission
-- strong signal, obscured by cloudsstrong signal, obscured by cloudsMore recently using MicrowaveMore recently using Microwave
-- can see through clouds, but the signal is weakcan see through clouds, but the signal is weak-- microwave also provides other data such as wind speed, microwave also provides other data such as wind speed, water vapor, rain, icewater vapor, rain, ice
Temperature is important because of its relationship to the heatTemperature is important because of its relationship to the heat budget (global warming) and because itbudget (global warming) and because it’’s diagnostic of s diagnostic of currents, upwelling etccurrents, upwelling etc……

Components of a passive “SST”
remote sensing system Using IR or Microwave Wavelengths
IR or μ-wave Emission
signalraw data
processing / disseminationcalibration/
validation
sensor

Planck’s Function in log-log plot for Spectral Radiance as a function of Wavelength
1.0 μ 10.0 μ 1 mm 1 cm 10 cm
1 cm
1 GHz10 GHz
All objects emit E-M radiation (you are emitting radio waves right now) – how much and the peak wavelength depends on the temperature.
Energy
Wavelength


Why Use Microwave?
Clouds!
Two-days of Infrared
Two-days of Microwave

IR SST: 26 Sept. 1998 Bathymetry
Surface Temperature: 1 km

Ocean color (chlorophyll)Ocean color (chlorophyll)Passive measurementPassive measurementMeasures light scattered and transmitted upward through the Measures light scattered and transmitted upward through the
ocean surface ocean surface -- its its ‘‘colorcolor’’ (careful to distinguish between (careful to distinguish between ‘‘transmissiontransmission’’ and and ‘‘reflectionreflection’’))
PROBLEM: PROBLEM: Most of the signal (>90%) at the satellite is NOT Most of the signal (>90%) at the satellite is NOT ocean color ocean color –– It is atmospheric interference: sunlight that has It is atmospheric interference: sunlight that has been scattered or reflected by molecules or aerosols in the been scattered or reflected by molecules or aerosols in the atmosphere back into the satelliteatmosphere back into the satellite’’s fields field--ofof--view.view.

Components of a passive “ocean color”
remote sensing system Using Visible wavelengths
source
signalraw data
processing / disseminationcalibration/
validation
sensor
Absorption and scattering of visible light –
depends
on pigments in the water
The “color”
is the wavelength that is not absorbed!

Sea-viewing Wide Field-of-view Sensor: SeaWiFS 8-channels, 1km pixel
R = log10Rs(490nm)
Rs(555nm)
Chl =10(0.2733−2.3534 R +1.1416R 2−0.2972R 3 ) − 0.0788Et
Lw
Main signals: Atmosphere, reflection and ocean color
Absorption
Wavelength

SST: 26 Sept. 1998 Bathymetry Chl-a Pigment: 26-27 Sept. 1998
Surface Temperature and Chlorophyll: 1 km

Sea Surface Height (SSH)Sea Surface Height (SSH)Active measurement using microwave radarActive measurement using microwave radarPulse sent from satellite to earth, measure return timePulse sent from satellite to earth, measure return timeWith appropriate processing and averaging, it is possible With appropriate processing and averaging, it is possible
to calculate:to calculate:Ocean currents, eddies (scales > 60Ocean currents, eddies (scales > 60--100 km) 100 km) Deviations in ocean surface due to bathymetryDeviations in ocean surface due to bathymetryGradual sea level rise due to global warmingGradual sea level rise due to global warmingDeviations in ocean surface due to internal physical Deviations in ocean surface due to internal physical
variability (heat, salinity)variability (heat, salinity)

Components of an active radar “altimeter”
system For sea level: Transmit at nadir (directly beneath satellite)
source and sensor
signalraw data
processing / dissemination
calibration/ validation

Active Radar –
Altimeter: Measures SSH ?what is that?
=SSHd
SSH=

SST: 26 Sept. 1998Chl-a Pigment: 26-27 Sept. 1998
Surface Height, Temperature and Chlorophyll: 1 kmSSH: 2 Altimeters
Sept. 1998

Global Map of Seafloor Topography Based on Altimetry
http://ibis.grdl.noaa.gov/cgi-bin/bathy/bathD.pl


Wind Stress (Wind Stress (““tautau””
--
ττ))
Active measurement, using microwave radar to get Active measurement, using microwave radar to get ““vector vector windswinds”” –– speed and direction.speed and direction.Pulse sent from satellite to ocean surface, then scattered Pulse sent from satellite to ocean surface, then scattered depending on surface roughnessdepending on surface roughnessSurface roughness (capillary waves) depends on wind Surface roughness (capillary waves) depends on wind stressstressStrength of return to satellite gives wind stress and Strength of return to satellite gives wind stress and directiondirection

Components of an active radar “scatterometer”
system For wind: Transmit at an angle
source and sensor
signalraw data
processing / disseminationcalibration/
validation


Altimeter and Scatterometer


Future Technologies“Next generation” satellite sensors are being developed by NASA and NOAA. • “Swath altimeters” will provide higher resolution SSH fields, closer to the
coast.• “Interferometer” scatterometers will provide higher resolution wind fields,
closer to the coast.• “Hyper-spectral” ocean color sensors will sample the full visible radiation
spectrum, allowing the identification of different types of phytoplankton, including those responsible for “harmful algal blooms” that close regions to the harvest of shellfish. These will also have higher resolution to retrieve data farther up into rivers and estuaries.
• SST sensors will combine the IR and Microwave channels to provide all- weather SST fields with higher resolution.
• These satellite data and in-water data from subsurface “observatories” will be “assimilated” into 3-D models of the ocean’s circulation to provide predictions of currents, temperatures, oxygen (to warn of “dead zones”).
Need more skilled people to analyze data from these systems!!

SummaryOceanography has traditionally faced a sampling limitation.Satellites allow us to observe large areas quickly, but:
Only see the ocean surface;Careful data calibration required for long term data sets.
Parameters include: SST, Surface Height, Winds, Ice, Chlorophyll, Fluorescence (Productivity).
In the Atmosphere: Profiles: Temperature, Water Vapor, Rain, Ozone, CO2 .Recent Advances: Salinity (this year), Wind and Height data closer to the
coast and higher resolution; All-Weather SST; Hyperspectral dataNew technologies collect subsurface data in the water – gliders, AUV.Smaller and more power efficient sensors, more chemistry, more biology.Computer models use all of these to predict accurate currents and
temperaturesNeed skilled people to analyze data and advance the science!!

Web Sites
OSU/COAS: Cooperative Institute for Oceanographic Satellite Studies http://cioss.coas.oregonstate.edu/CIOSS/
OSU/COAS/Ocean Optics/Color:http://picasso.coas.oregonstate.edu/ORSOO/
U. Wisconsin Madison: Coop. Institute for Meteorological Satellite Studieshttp://cimss.ssec.wisc.edu/
Jet Propulsion Laboratory (JPL/NASA) Physical Oceanography Data Centerhttp://podaac.jpl.nasa.gov/
NOAA Satellite Research & West Coast Satellite Data: “CoastWatch”http://www.star.nesdis.noaa.gov/star/ & http://coastwatch.pfel.noaa.gov/NASA Goddard Science Center – Satellite Data and Info & Ocean Color
http://disc.sci.gsfc.nasa.gov/ & http://oceancolor.gsfc.nasa.gov/NASA “Remote Sensing Tutorial:
http://rst.gsfc.nasa.gov/Front/overview.html
EXTRA SLIDES
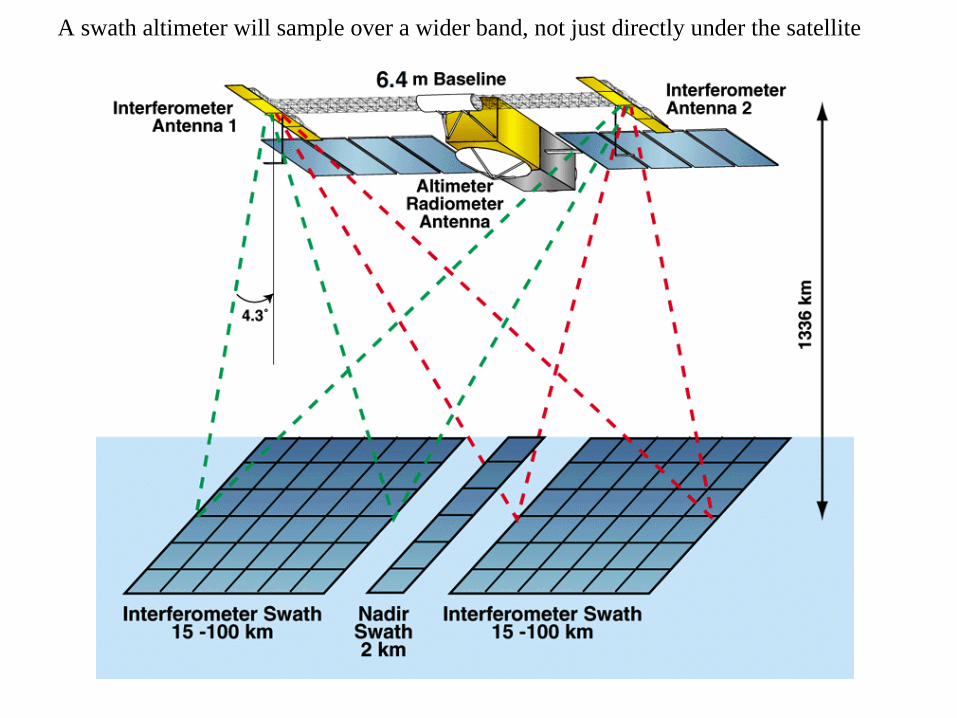
A swath altimeter will sample over a wider band, not just directly under the satellite

Simulated estimated heights by a single “Wide Swath” altimeter.
Coverage by a single “Wide Swath” altimeter.

25 April 2001
Standard Scatterometer Coverage of Winds off S. Cal

25 April 2001
Enhanced Scatterometer Coverage of Winds off S. Cal (Experimental)

Next Generation Scatterometer Coverage of Winds off S. Cal?

Other ‘remote’
sensing Moorings, gliders, floats and AUVs
Critical problem in oceanography of undersamplingLarge ships are expensive (~$12-20K per day)Ocean is vast – may take weeks to get on-siteExtremely difficult to sample even small areas
Satellites help, but only sample the surfaceNeed more automated subsurface sampling to complement the satellites!! Then we need ocean forecast models.Challenges: Power, cost and hostile environment
(salt water, fouling)Could potentially make huge advances in global coverage

Ocean observing technology: Old school

Ocean observing technology: New school –
“Floats”

Awesome global coverage!
Imagine these floats with bio/chem
sensors

New technology: Autonomous underwater vehicles, Powered and Unpowered

Gliders

Future cabled observatories and glider paths off Oregon- Washington combine moorings, gliders, satellites and computer models

8‐day composites of GOES SST (right) and MODIS chlorophyll (left) over radar
surface velocities during the period leading up to the forecast.
(Middle) 2‐day
forecast SST and surface velocity (without data assimilation).
Computer Models of 3-D Currents and Temperature: Fishermen at Coos Bay use these fields to direct cruises

57
Computer Models of 3-D Currents and TemperatureAlongtrack altimeter SSH data (dots) are used to “correct” the
model. GOES satellite SST is used to verify the improvement of the model SST fields.
prior (free‐run) model
SSTmodel SST after SSH
assimilationGOES daily SST (7/20/08),
independent of model.

EXTRA Extra
SLIDES

Advanced Very High Resolution Radiometer (AVHRR)
• Passive measurement• Obscured by clouds• Requires averaging to
get good spatial coverage
• Image at right is 8 days, Jul 2006

Microwave SST: Sees through clouds, but obscured by rain
Use of passive microwave is increasing as we develop the technology to make use of these very weak signals.


Measuring chlorophyll from space
The instrument The satellite
The Sea-viewing Wide Field of view Sensor: SeaWiFS


Ocean observing technology: New school –
“Floats”
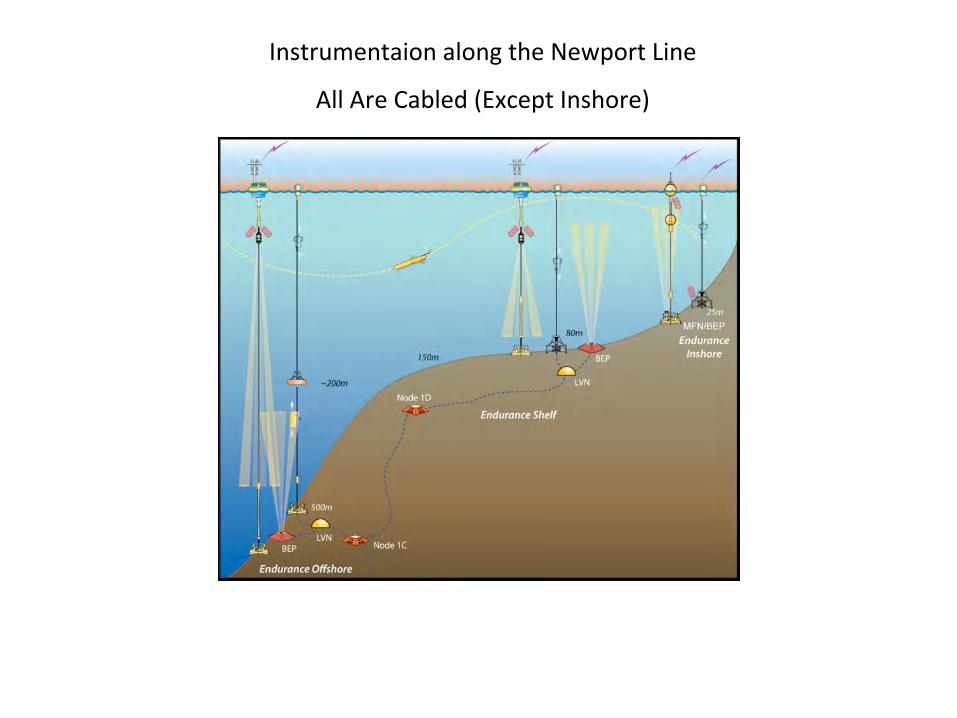
Instrumentaion
along the Newport Line
All Are Cabled (Except Inshore)
Related Documents