Ocean Altimetry Data: Operational Users and Applications Margaret Srinivasan Altimeter Applications Lead Jet Propulsion Laboratory California Institute of Technology Robert Leben Associate Research Professor Colorado Center for Astrodynamics Research University of Colorado Ocean Surface Topography Science Team Meeting 12 March 2007 Hobart, Australia

Ocean Altimetry Data: Operational Users and Applications
Dec 31, 2015
Ocean Altimetry Data: Operational Users and Applications. Margaret Srinivasan Altimeter Applications Lead Jet Propulsion Laboratory California Institute of Technology Robert Leben Associate Research Professor Colorado Center for Astrodynamics Research University of Colorado. - PowerPoint PPT Presentation
Welcome message from author
This document is posted to help you gain knowledge. Please leave a comment to let me know what you think about it! Share it to your friends and learn new things together.
Transcript

Ocean Altimetry Data: Operational Users and Applications
Margaret SrinivasanAltimeter Applications LeadJet Propulsion LaboratoryCalifornia Institute of Technology
Robert LebenAssociate Research ProfessorColorado Center for Astrodynamics ResearchUniversity of Colorado
Ocean Surface Topography Science Team Meeting12 March 2007Hobart, Australia

OSTST Meeting, 12 March 2007, M. Srinivasan
Acknowledgements
Dr. Robert Leben, University of Colorado CCAR
Vinca Rosmorduc, CLS
Annie Richardson, JPL
Jason, Project Management
Ocean Surface Topography Science Team members

OSTST Meeting, 12 March 2007, M. Srinivasan
Web sites; JPL Societal benefits, AVISOCCAR Applications, NRT NOAA’s TCHPNRL
Getting the word
out…

OSTST Meeting, 12 March 2007, M. Srinivasan
Conferences…SWT meetingsAGU Oceans
Getting the word
out…
“Operational Applications of Ocean Satellite Observations”

OSTST Meeting, 12 March 2007, M. Srinivasan
University of Colorado CCAR Partnership
Partnership: 12 years, NASA/JPL TP/Jason project funding
Products: Near real-time, historical, Google Earth overlays (devel.)
Data Sources: Jason, Envisat, GFO, TOPEX/Poseidon & ERS
(historical), also SST & ocean color
Distribution: http://argo.colorado.edu/~realtime/welcome/
Users: Researchers, recreational boaters, offshore O&G,
OSTST Meeting, 12 March 2007, M. Srinivasan
CCAR - Google Earth
Keyhole Markup Language (KML) Files generated on CCAR NRT web page http://argo.colorado.edu/~realtime/welcome/.
Using Google Earth as a data browser
OSTST Meeting, 12 March 2007, M. Srinivasan
CCAR - Google Earth
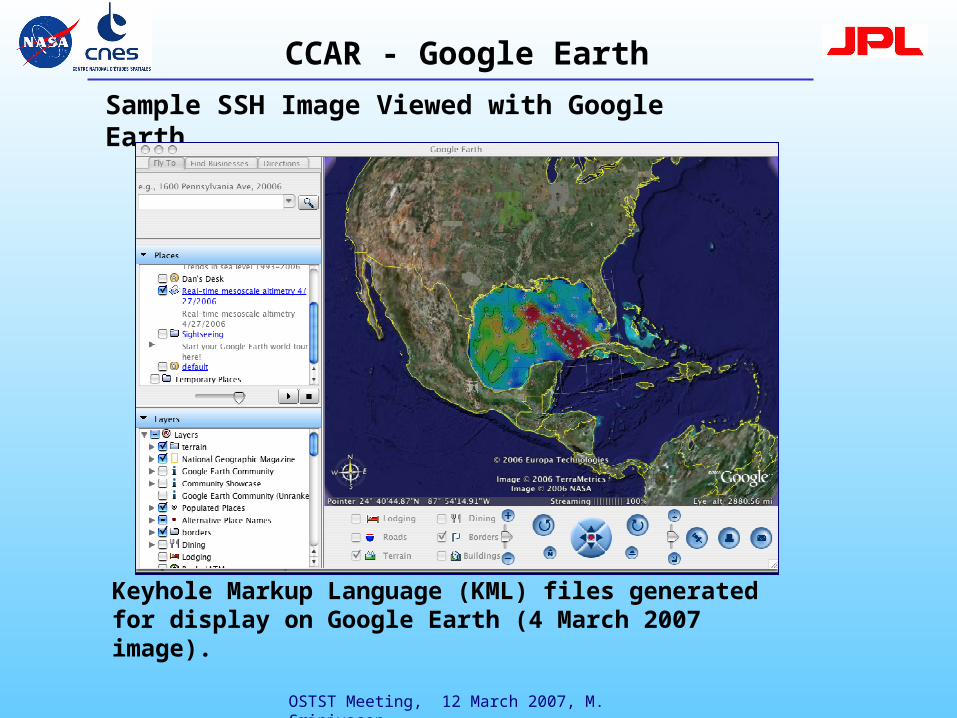
Keyhole Markup Language (KML) files generated for display on Google Earth (4 March 2007 image).
Sample SSH Image Viewed with Google Earth
OSTST Meeting, 12 March 2007, M. Srinivasan
CCAR - Google Earth
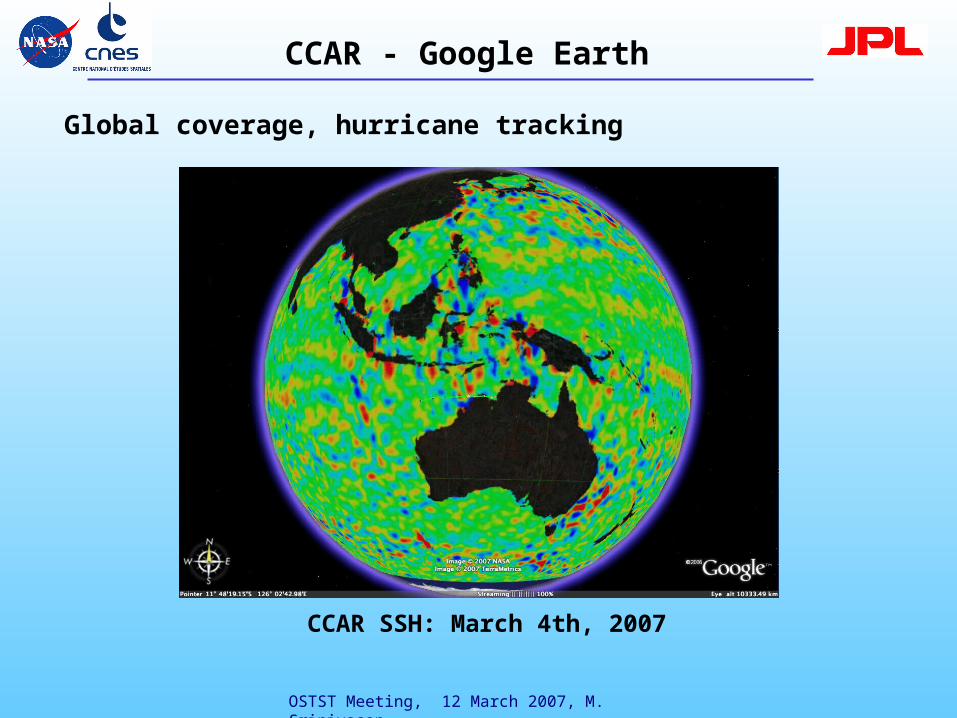
Global coverage, hurricane tracking
CCAR SSH: March 4th, 2007
OSTST Meeting, 12 March 2007, M. Srinivasan
CCAR - Google Earth
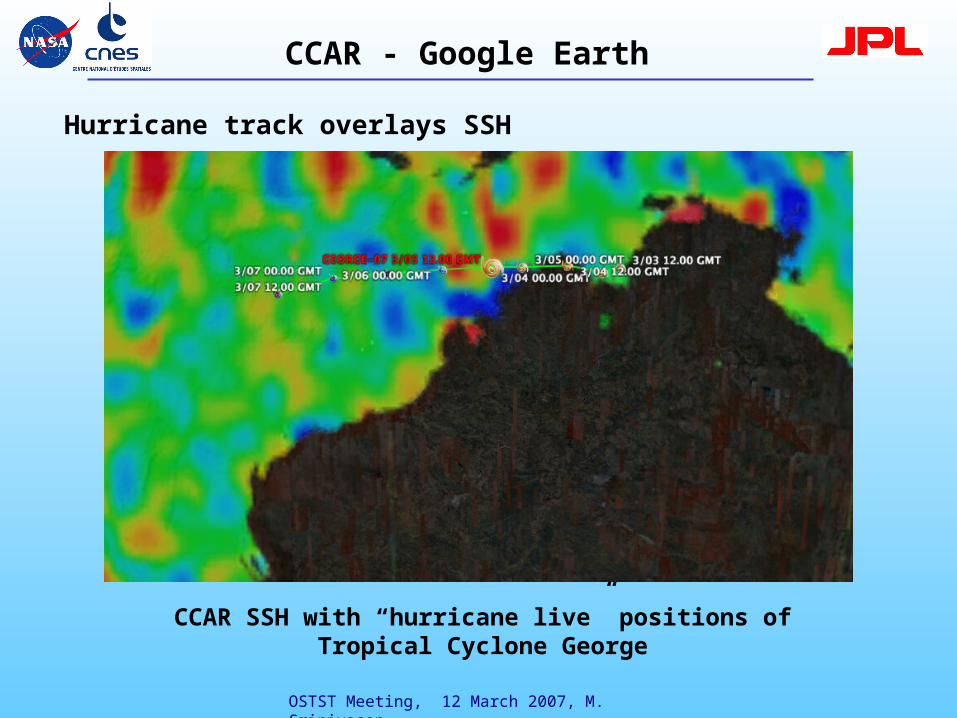
Hurricane track overlays SSH
CCAR SSH with “hurricane live” positions of Tropical Cyclone George

OSTST Meeting, 12 March 2007, M. Srinivasan
GHRSST zoom
CCAR - Google Earth

OSTST Meeting, 12 March 2007, M. Srinivasan
MODIS Ocean Color: 8-day composite zoom
CCAR - Google Earth

OSTST Meeting, 12 March 2007, M. Srinivasan
Intra-Americas Sea Trials
SSH forecast for 21 Jan 2007 from the ROMS modeling system, run in real-time on board the Royal Caribbean International vessel Explorer of the Seas. The black line shows the vessel’s cruise path.
• University of California, Santa Cruz researchers assimilating CCAR SSH into a Regional Ocean Modeling System (ROMS) for data assimilation and ocean prediction in the IAS, emphasizing the Caribbean Sea.• Partners: University of Miami, NOAA, NSF, Royal Caribbean Cruise Line• Cruise ship, Explorer of the Seas, equipped with oceanic and atmospheric sensors, for continuous observation along two cruise tracks that circumnavigate the Caribbean Sea once every two weeks.• Sea trials on board the Explorer during January and February 2007.•http://marine.rutgers.edu/po/ias

OSTST Meeting, 12 March 2007, M. Srinivasan
Hilton’s Realtime Navigator
CCAR SSH and ocean color overlay hosted by the Realtime-Navigator website.
• Private company provides fishing charts and atlas
• Large game fish (marlin, tuna)
• Offshore Gulf of Mexico
• Altimeter and ocean color data maps provided via CCAR
• CCAR produces daily sea surface height and chlorophyll concentration maps (MODIS) for 10 regions in the Gulf and along the Atlantic Coast.

OSTST Meeting, 12 March 2007, M. Srinivasan
Ocean color & SSH view ocean eddies
A. Fong, U. Hawaii
Hindcast SSH contours on chlorophyll concentration (MODIS). Note anticyclonic eddy with high chlorophyll concentration.
• U. Hawaii at Manoa researcher studies the spatial and temporal abundances of nitrogen-fixing bacteria
• May play an important role in open-ocean biogeochemical cycling
• SSH + MODIS data (from CCAR) in region of enhanced chlorophyll north of Oahu
• The feature was coincident with the decay of an anti-cyclonic eddy.
• NRT and hind-cast data allowed tracking and sampling of the feature for both biogeochemical and biological parameters.
• Progression of this and similar feature was tracked, providing compelling evidence for increased productivity due to these mesoscale features.

OSTST Meeting, 12 March 2007, M. Srinivasan
November 2006 El Niño
Global climate events
February 2007 La Niña
Extended time series monitoring El Niño and La Niña Media use images to explain weather and climate to the public

OSTST Meeting, 12 March 2007, M. Srinivasan
Ocean Racers & Ocean Researchers
Volvo Ocean Race - Geostrophic currents and drift trajectories, G.Goni, NOAA
Sydney to Hobart Yacht race, D. Griffin, CSIRO
•Data distributed to the racing teams for information on (un)favorable currents or winds to
optimize routes and navigate safely.
OSTST Meeting, 12 March 2007, M. Srinivasan
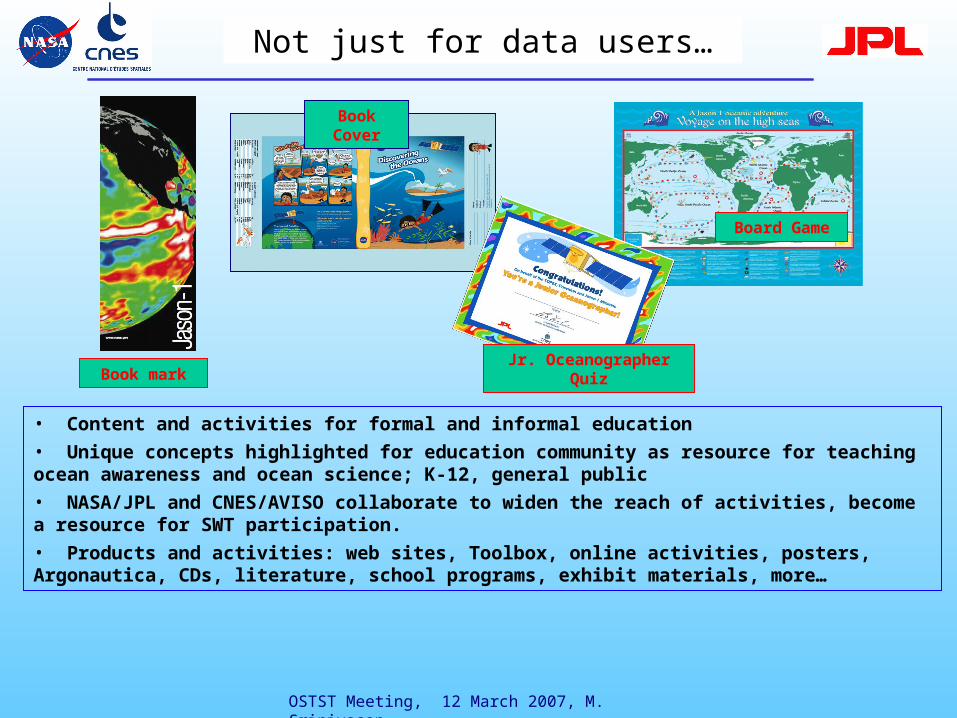
Not just for data users…
• Content and activities for formal and informal education
• Unique concepts highlighted for education community as resource for teaching ocean awareness and ocean science; K-12, general public
• NASA/JPL and CNES/AVISO collaborate to widen the reach of activities, become a resource for SWT participation.
• Products and activities: web sites, Toolbox, online activities, posters, Argonautica, CDs, literature, school programs, exhibit materials, more…
Book Cover
Board Game
Jr. Oceanographer QuizBook mark

OSTST Meeting, 12 March 2007, M. Srinivasan
•NASA/JPL Ocean Surface Topography from Space - Societal Benefits http://sealevel.jpl.nasa.gov/science/soc-benefits.html
Web resources
•AVISO Yellow Pages page - http://www.aviso.oceanobs.com/yp/
Monthly Features, Literature Database,…
Yellow Pages, Image of the Month,…

OSTST Meeting, 12 March 2007, M. Srinivasan
• Consider potential and operational applications of your research
• Estimate the economic/practical effects/benefits
• Get your story out into the public domain
Spread the word

OSTST Meeting, 12 March 2007, M. Srinivasan
• Consider potential and operational applications of your research
• Estimate the economic/practical effects/benefits
• Get your story out into the public domain
Spread the word
Thank you.
Related Documents