OCCUPATIONAL HEALTH HAZARDS ASSOCIATED WITH GARI PRODUCTION AND THE POSSIBLE ENVIRONMENTAL EFFECTS OF THE RESULTANT EFFLUENT BY ADABIE, DEREK FIIFI (10272513) THIS THESIS IS SUBMITTED TO THE UNIVERSITY OF GHANA, LEGON IN PARTIAL FULFILLMENT OF THE REQUIREMENTS FOR THE AWARD OF MASTER OF PHILOSOPHY IN CROP SCIENCE (POSTHARVEST TECHNOLOGY) COLLEGE OF BASIC AND APPLIED SCIENCE DEPARTMENT OF CROP SCIENCE SCHOOL OF AGRICULTURE UNIVERSITY OF GHANA, LEGON JULY, 2015 University of Ghana http://ugspace.ug.edu.gh

Welcome message from author
This document is posted to help you gain knowledge. Please leave a comment to let me know what you think about it! Share it to your friends and learn new things together.
Transcript
OCCUPATIONAL HEALTH HAZARDS ASSOCIATED WITH GARI
PRODUCTION AND THE POSSIBLE ENVIRONMENTAL EFFECTS OF THE
RESULTANT EFFLUENT
BY
ADABIE, DEREK FIIFI
(10272513)
THIS THESIS IS SUBMITTED TO THE UNIVERSITY OF GHANA, LEGON IN
PARTIAL FULFILLMENT OF THE REQUIREMENTS FOR THE AWARD OF
MASTER OF PHILOSOPHY IN CROP SCIENCE (POSTHARVEST
TECHNOLOGY)
COLLEGE OF BASIC AND APPLIED SCIENCE
DEPARTMENT OF CROP SCIENCE
SCHOOL OF AGRICULTURE
UNIVERSITY OF GHANA, LEGON
JULY, 2015
University of Ghana http://ugspace.ug.edu.gh
i
DECLARATION
I hereby declare that, with the exception of specific references which have been duly
acknowledged, this study is as a result of my own research and it has not been submitted
either in part or whole for any other degree elsewhere.
Signature: ……………………… ………………………….
Derek Fiifi Adabie Date
(Student)
Signature: ……………………… ………………………….
Prof. Paa Nii T. Johnson Date
(Principal Supervisor)
Signature: ……………………… ………………………….
Dr. (Mrs.) Benedicta Fosu-Mensah Date
(Co-Supervisor)
University of Ghana http://ugspace.ug.edu.gh
ii
ABSTRACT
Cassava (Manihot esculenta, Crantz) is primarily grown for its starch containing tuberous
roots, which are a major source of dietary energy in the tropics. It is highly perishable and
begins to degenerate shortly after harvest. Cassava in the fresh form contains cyanide,
which is extremely toxic to humans and animals. These factors make the processing of
cassava into a dry form a necessity. Processing is essential for the removal of cyanides
from cassava roots. This post-harvest necessity via gari production is coupled with
several disturbing occupationally-related hazards. Exposure to volatile cyanide and
smoke makes the frying stage of gari making the most dangerous. Effluent derived from
gari production is noted to have a devastating effect on vegetation, as vegetation is hardly
observed in areas where effluents are discharged. It also causes the eutrophication of
surface water. This research aimed at determining processors’ awareness of occupational
health hazards relating to their line of work, and their awareness of the environmental
hazards associated with the discharge of untreated cassava effluent. The study further
sought to determine the quality of cassava wastewater, and the possible generation of
ethanol from the liquid waste using Saccharomyces cerevisiae in varying amounts.
Processors from three gari producing districts in Ghana served as respondents. These
gari-producing districts were; Awutu Senya, Central Tongu and Ayensuano Districts.
Cluster sampling of each district was used in selecting the respondents. Ninety (90) gari
producers served as respondents. Processors acknowledged health related hazards
associated with their line of work, coupled with a low usage of protective clothing.
Processors indicated several undesired effects the discharge of the effluent had on their
immediate environment. Effluents obtained from these districts were assessed for
University of Ghana http://ugspace.ug.edu.gh
iii
wastewater quality, which showed values far outside EPA accepted limits; with the
exception of PO4-P (0.125 mg/L) and NO3-N (0.070 mg/L), which were within
acceptable limits. Mean values of the other quality parameters measured were; pH (4.02),
Conductivity (12223.3 µS/cm), TSS (2078.3 mg/L), TDS (41597 mg/L), COD (60335
mg/L) and BOD (23493 mg/L). These very high wastewater quality parameters indicate
that cassava effluent has a strong potential of being deleterious to vegetation and aquatic
life. Optimum ethanol concentration (3.25%w/v) was obtained in baker’s yeast at
0.6%w/v. Optimum ethanol concentrations for the different yeast amounts used were
obtained at 48 hours. Significant differences were observed (P<0.05) in the different
amounts of baker’s yeast used. Appropriate stakeholder institutions should invest
resources into educating gari producers on occupational safety and health. The EPA and
WRI should develop guidelines relating to the treatment and discharge of the cassava
effluent. Optimized fermentation approaches should be exploited in enhancing ethanol
production from the cassava effluent.
University of Ghana http://ugspace.ug.edu.gh

iv
DEDICATION
This work is dedicated to my wonderful parents, Mr. Joseph Adabie and Mrs. Doris A.
Adabie.
University of Ghana http://ugspace.ug.edu.gh

v
ACKNOWLEDGEMENTS
I owe great gratitude to my supervisor, Prof. P.N.T. Johnson, for his patience, guidance,
encouragement and financial aid during the period of this study; which has led to the
completion of the work. My gratitude also goes to my co-supervisor, Dr. (Mrs.)
Benedicta Fosu-Mensah, for her patience and responsiveness. I am grateful to my parents
Mr. and Mrs. Adabie for their financial support and encouragement.
I am highly indebted to Mr. Jawula A. Tahiru and Mr. Samuel S. Yeboah, both of MoFA
Awutu Senya and Ayensuano Agencies respectively, and Ms. Victoria Agbeko of Mafe
Kpedzeglo D/A School for their immense help during the questionnaire administering
and data collection in the respective districts. My gratitude also goes to Mr. Ansah of the
Ecolab, University of Ghana, for his technical support.
Special thanks to Dr. K.A. Asante and Mr. Adu Ofori, both of WRI, for their assistance
and generosity towards carrying out the laboratory tests. I am also thankful to Messrs.
Martin Aggrey and Kwaku Acquah of Soil Science and the Biotech Centre (University of
Ghana) respectively, for their assistance in the set-up of the lab experiment. Special
thanks to my dear friends, Anna Safoa Ofori, Hanif Lutuf, Derick Adu Taylor, Obeng
Nketiah Ofori and Amoako Ofori for their insights and contributions.
Praise be to the Almighty Lord for His mercies, and for bringing such beautiful people
into my life.
University of Ghana http://ugspace.ug.edu.gh

vi
TABLE OF CONTENTS
DECLARATION ................................................................................................................. i
ABSTRACT ........................................................................................................................ ii
DEDICATION ................................................................................................................... iv
ACKNOWLEDGEMENTS ................................................................................................ v
TABLE OF CONTENTS ................................................................................................... vi
LIST OF TABLES ........................................................................................................... xiii
LIST OF PLATES AND FIGURES ................................................................................. xv
LIST OF ABBREVIATIONS .......................................................................................... xvi
CHAPTER ONE ................................................................................................................. 1
1.0 INTRODUCTION ................................................................................................... 1
1.1 Background .......................................................................................................... 1
1.2 Problem Statement ............................................................................................... 2
1.3 Justification .......................................................................................................... 4
1.4 Objectives ............................................................................................................. 4
CHAPTER TWO ................................................................................................................ 6
2.0 LITERATURE REVIEW ........................................................................................ 6
2.1 Cassava ................................................................................................................. 6
2.1.1 Crop Origin, Culture and Ecology .................................................................... 6
2.1.2 Constituents of the Tuber and its Utilization .................................................... 8
University of Ghana http://ugspace.ug.edu.gh
vii
2.1.3 Postharvest Issues of Cassava......................................................................... 10
2.2 Cassava Processing to Gari ................................................................................ 15
2.2.1 Why Process Cassava? ................................................................................... 15
2.2.2 Contribution of Gari to the Ghanaian Economy and Its Profitability
to the Producer .............................................................................................................. 15
2.2.3 Gari Production and Occupational Health Hazards ........................................ 17
2.3 Cassava-Mill Effluent ........................................................................................ 20
2.3.1 Cassava Milling and Effluent Generation ...................................................... 20
2.3.2 Effects on the Environment ............................................................................ 21
2.4 Ghana Environmental Protection Agency (EPA) ............................................... 23
CHAPTER THREE .......................................................................................................... 25
3.0 MATERIALS AND METHODS ........................................................................... 25
3.1 Perception of Gari Producers on Occupational Health Hazards, and on
Environmental Effects of the Effluent .......................................................................... 25
3.2 Quality Parameters of the Cassava Effluent ....................................................... 25
3.2.1 Effluent Collection and Laboratory Analysis ................................................. 25
3.2.2 Quality Parameters of the Effluent Studied .................................................... 26
3.2.2.1 pH ................................................................................................................ 26
3.2.2.2 Electrical Conductivity (EC)....................................................................... 26
3.2.2.3 Biochemical Oxygen Demand (BOD) (Winkler Azide Modification) ....... 27
University of Ghana http://ugspace.ug.edu.gh

viii
3.2.2.4 Chemical Oxygen Demand (COD) (Closed Tube Reflux Method) ............ 28
3.2.2.5 Total Suspended Solids (TSS) (Gravimetric Method) ................................ 29
3.2.2.6 Total Dissolved Solids (TDS) (Gravimetric Method) ................................ 30
3.2.2.7 Calcium (EDTA Titrimetric Method) ......................................................... 30
3.2.2.8 Magnesium (Calculation Method) .............................................................. 31
3.2.2.9 Nitrate (Hydrazine Reduction Method) ...................................................... 33
3.2.2.10 Phosphate (Stannous Chloride Method) ..................................................... 33
3.2.2.11 Potassium (Flame Photometric Method) .................................................... 34
3.3 Fermentation of Effluent with Yeast .................................................................. 34
3.3.1 Sample Hydrolysis .......................................................................................... 34
3.3.2 Fermentation Process ...................................................................................... 34
3.3.2.1 Experimental Design and Treatments Used ................................................ 35
3.3.3 Ethanol Determination .................................................................................... 35
3.3.3.1 Background ................................................................................................. 35
3.3.3.2 Setup ........................................................................................................... 36
3.3.3.3 Titration Procedure ..................................................................................... 36
3.3.3.4 Calculation for Ethanol Concentration ....................................................... 37
3.4 Data Analysis ..................................................................................................... 37
3.4.1 Survey Analysis .............................................................................................. 37
3.4.2 Statistical Analysis of Effluent Quality Parameters ....................................... 37
University of Ghana http://ugspace.ug.edu.gh

ix
3.4.3 Data Analysis on Ethanol Yield ..................................................................... 37
CHAPTER FOUR ............................................................................................................. 38
4.0 RESULTS .............................................................................................................. 38
4.1 Perception of Gari Producers on Occupational Health Hazards, and on
Environmental Effects of the Effluent .......................................................................... 38
4.1.1 Demographic Information of Gari Producers ................................................. 38
4.1.1.1 Distribution of Male and Female Processors among Age Groups .............. 39
4.1.1.2 Respondents Participation in Gari Production ............................................ 39
4.1.2 Occupational Health Hazards Associated with Gari Production .................... 40
4.1.2.1 Producers’ Perception of Gari Production to be Hazardous ....................... 40
4.1.2.2 Training on Occupational Health Hazards .................................................. 41
4.1.2.3 Measures Employed in Preventing/Minimizing Occupational
Health Hazards .............................................................................................................. 42
4.1.2.3.1 Preventing or Minimizing Cuts and Bruises ............................................... 42
4.1.2.3.2 Preventing or Minimizing Skin Irritations .................................................. 42
4.1.2.3.3 Preventing or Minimizing Inhalation of Smoke ......................................... 43
4.1.2.3.4 Preventing or Minimizing Burns ................................................................ 45
4.1.2.4 Awareness and Usage of Protective Clothing in Gari Production .............. 46
4.1.2.4.1 Awareness of Protective Clothing .............................................................. 46
4.1.2.4.2 Factors Influencing Processors’ Awareness of Protective Clothing ........... 46
University of Ghana http://ugspace.ug.edu.gh
x
4.1.2.4.3 Usage of Protective Clothing ...................................................................... 48
4.1.2.4.4 Factors Influencing the Wearing of Protective Clothing ............................ 49
4.1.2.4.5 Visit to Health Facility for Health Condition Sustained During
Gari Production ............................................................................................................. 51
4.1.3 Environmental Hazards Posed by Effluent ..................................................... 52
4.1.3.1 Fate of Effluent ........................................................................................... 52
4.1.3.2 Observed Effects of the Effluent................................................................. 53
4.1.3.2.1 Observed Effects on the Environment ........................................................ 53
4.1.4 Mitigation Options for the Generated Effluent ............................................... 54
4.1.4.1 Treatment Options for the Effluent ............................................................. 54
4.1.4.2 Value Addition Alternatives for the Effluent.............................................. 55
4.1.4.2.1 Gari Producers Who Keep the Effluent ...................................................... 55
4.1.4.2.2 Gari Producers Who Always Discharge the Effluent ................................. 55
4.1.4.2.3 Factors Influencing Processors’ Decision to Keep the Effluent
for Later Use.................................................................................................................. 56
4.2 Quality of the Cassava Effluent ......................................................................... 58
4.2.1 Relationship among Parameters ..................................................................... 61
4.3 Fermentation of Effluent with Saccharomyces cerevisiae ................................. 61
4.3.1 Ethanol Yield .................................................................................................. 61
CHAPTER FIVE .............................................................................................................. 63
University of Ghana http://ugspace.ug.edu.gh
xi
5.0 DISCUSSION ........................................................................................................ 63
5.1 Perception of Gari Producers on Occupational Health Hazards, and on
Environmental Effects of the Effluent .......................................................................... 63
5.1.1 Demographic Information of Gari Producers ................................................. 63
5.1.2 Gari Production and Occupational Health Hazards ........................................ 64
5.1.2.1 Training on Occupational Health Hazards .................................................. 64
5.1.2.2 Measures Adopted by Gari Producers against Occupational
Health Hazards .............................................................................................................. 65
5.1.2.3 Awareness of Protective Clothing in Gari Production ................................ 65
5.1.2.4 Factors Influencing Processors’ Awareness of Protective Clothing ........... 66
5.1.2.5 Usage of Protective Clothing in Gari Production ....................................... 66
5.1.2.6 Visit to Health Facility for Health Condition Sustained During
Gari Production ............................................................................................................. 67
5.1.3 Respondents Perception about the Effects of the Effluent on the
Environment .................................................................................................................. 67
5.1.4 Mitigation Options for the Cassava-Mill Effluent .......................................... 68
5.1.4.1 Factors Influencing Processors’ Decision to Keep Effluent
for Later Use.................................................................................................................. 69
5.2 Quality of the Cassava Effluent ......................................................................... 70
5.2.1 Biochemical Oxygen Demand and Chemical Oxygen Demand .................... 70
5.2.2 pH of Effluent ................................................................................................. 71
University of Ghana http://ugspace.ug.edu.gh
xii
5.2.3 Electrical Conductivity (EC) .......................................................................... 72
5.2.4 Total Dissolved Solids (TDS)......................................................................... 73
5.2.5 Total Suspended Solids (TSS) ........................................................................ 73
5.2.6 Phosphorus...................................................................................................... 74
5.2.7 Nitrate ............................................................................................................. 74
5.2.8 Calcium and Magnesium ................................................................................ 75
5.3 Fermentation of Effluent with Saccharomyces cerevisiae ................................. 75
CHAPTER SIX ................................................................................................................. 77
6.0 CONCLUSION AND RECOMMENDATION ..................................................... 77
6.1 CONCLUSION .................................................................................................. 77
6.1.1 Perception of Gari Producers on Occupational Health Hazards, and on
Environmental Effects of the Effluent .......................................................................... 77
6.1.2 Quality of the Cassava Effluent ...................................................................... 77
6.1.3 Fermentation of Effluent with Saccharomyces cerevisiae ............................. 79
6.2 RECOMMENDATIONS ................................................................................... 79
REFERENCES ................................................................................................................. 80
APPENDIX ....................................................................................................................... 86
University of Ghana http://ugspace.ug.edu.gh
xiii
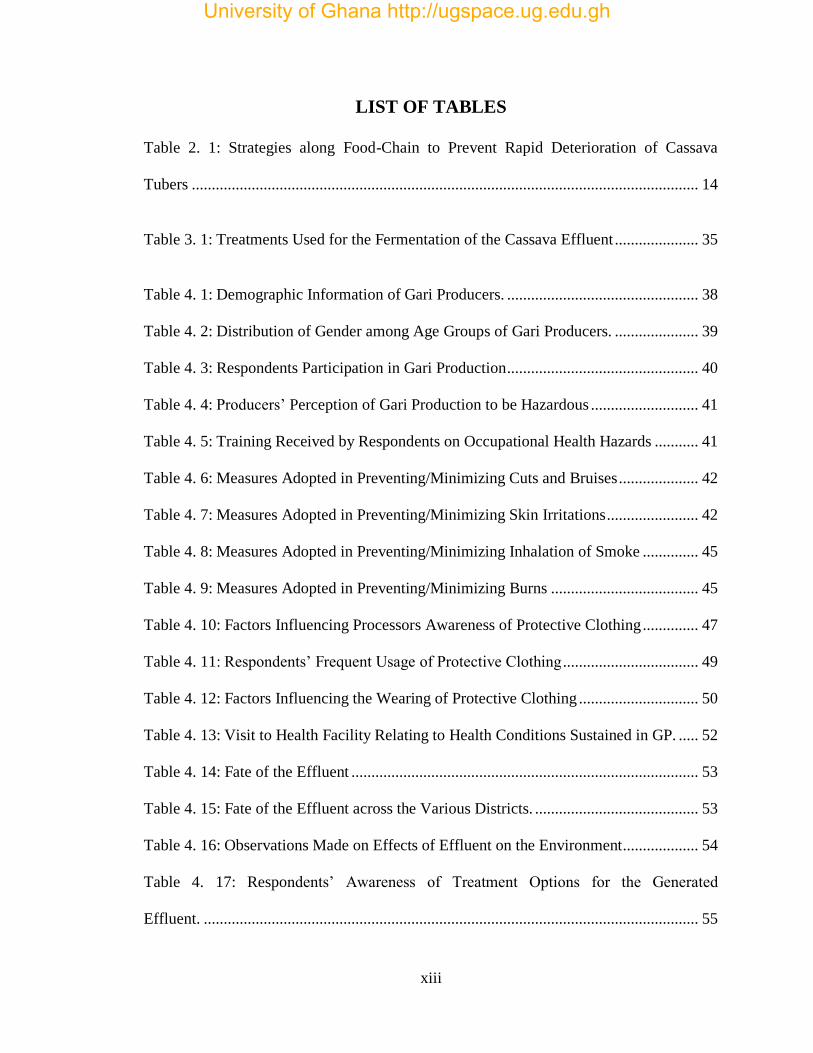
LIST OF TABLES
Table 2. 1: Strategies along Food-Chain to Prevent Rapid Deterioration of Cassava
Tubers ............................................................................................................................... 14
Table 3. 1: Treatments Used for the Fermentation of the Cassava Effluent ..................... 35
Table 4. 1: Demographic Information of Gari Producers. ................................................ 38
Table 4. 2: Distribution of Gender among Age Groups of Gari Producers. ..................... 39
Table 4. 3: Respondents Participation in Gari Production ................................................ 40
Table 4. 4: Producers’ Perception of Gari Production to be Hazardous ........................... 41
Table 4. 5: Training Received by Respondents on Occupational Health Hazards ........... 41
Table 4. 6: Measures Adopted in Preventing/Minimizing Cuts and Bruises .................... 42
Table 4. 7: Measures Adopted in Preventing/Minimizing Skin Irritations ....................... 42
Table 4. 8: Measures Adopted in Preventing/Minimizing Inhalation of Smoke .............. 45
Table 4. 9: Measures Adopted in Preventing/Minimizing Burns ..................................... 45
Table 4. 10: Factors Influencing Processors Awareness of Protective Clothing .............. 47
Table 4. 11: Respondents’ Frequent Usage of Protective Clothing .................................. 49
Table 4. 12: Factors Influencing the Wearing of Protective Clothing .............................. 50
Table 4. 13: Visit to Health Facility Relating to Health Conditions Sustained in GP. ..... 52
Table 4. 14: Fate of the Effluent ....................................................................................... 53
Table 4. 15: Fate of the Effluent across the Various Districts. ......................................... 53
Table 4. 16: Observations Made on Effects of Effluent on the Environment ................... 54
Table 4. 17: Respondents’ Awareness of Treatment Options for the Generated
Effluent. ............................................................................................................................ 55
University of Ghana http://ugspace.ug.edu.gh
xiv
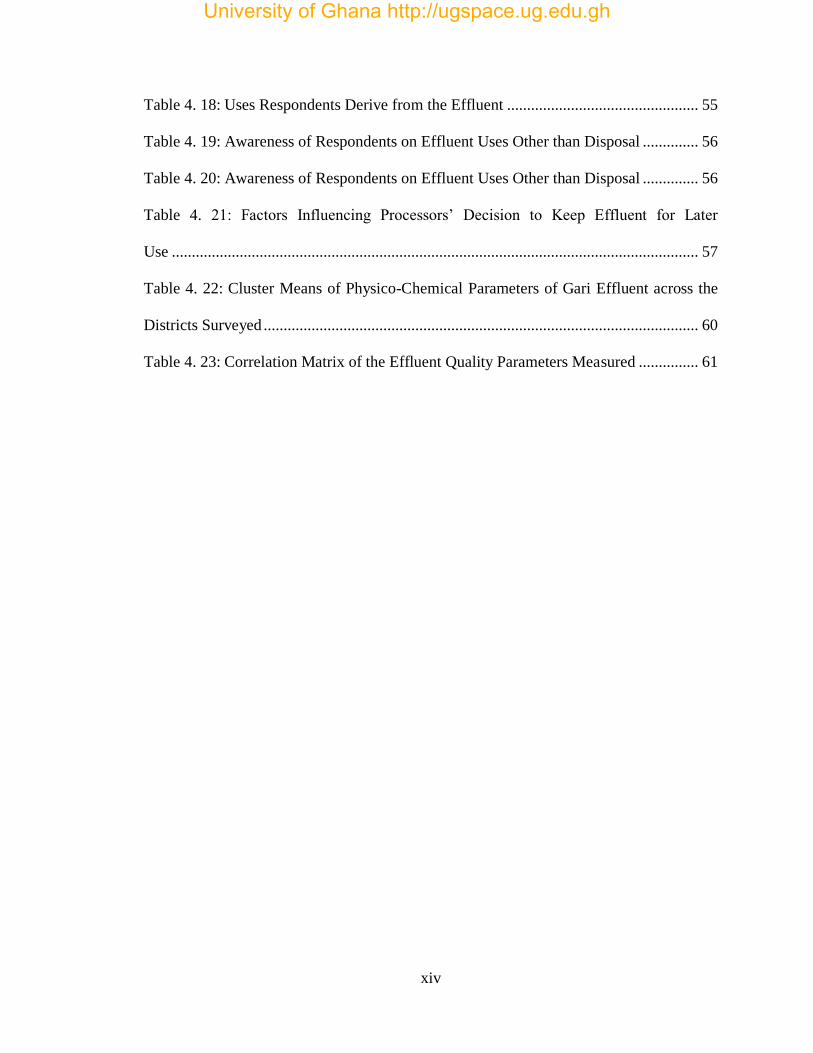
Table 4. 18: Uses Respondents Derive from the Effluent ................................................ 55
Table 4. 19: Awareness of Respondents on Effluent Uses Other than Disposal .............. 56
Table 4. 20: Awareness of Respondents on Effluent Uses Other than Disposal .............. 56
Table 4. 21: Factors Influencing Processors’ Decision to Keep Effluent for Later
Use .................................................................................................................................... 57
Table 4. 22: Cluster Means of Physico-Chemical Parameters of Gari Effluent across the
Districts Surveyed ............................................................................................................. 60
Table 4. 23: Correlation Matrix of the Effluent Quality Parameters Measured ............... 61
University of Ghana http://ugspace.ug.edu.gh
xv
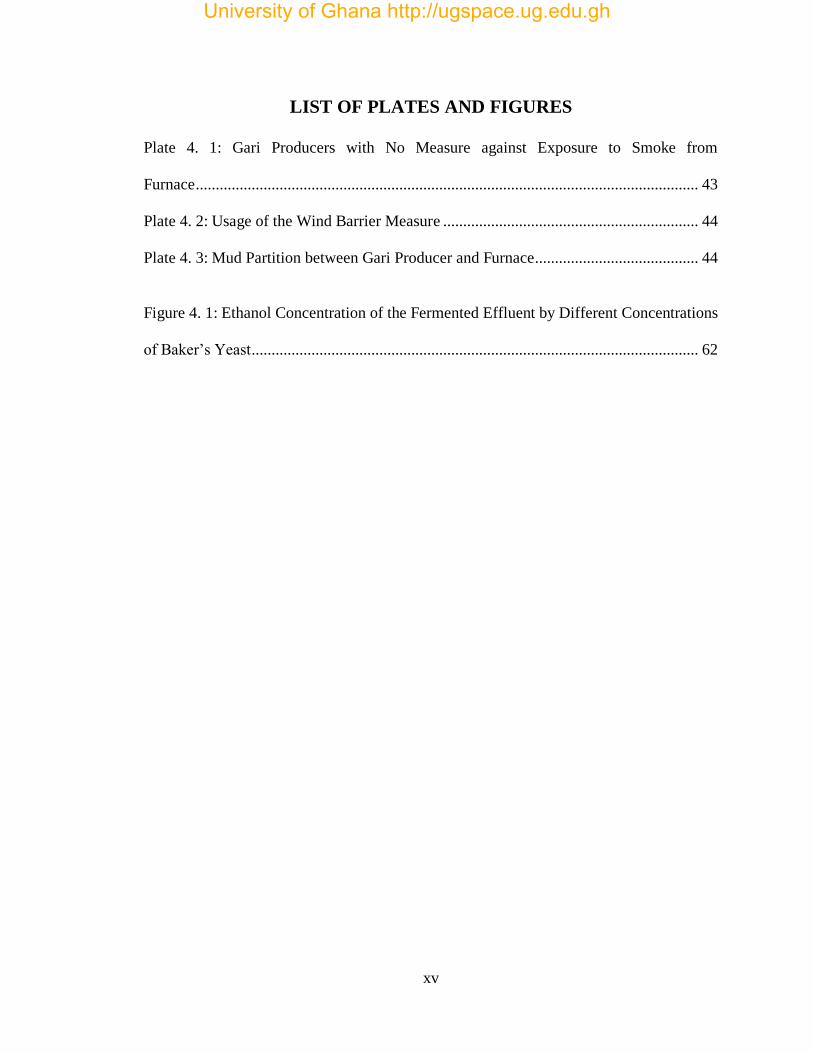
LIST OF PLATES AND FIGURES
Plate 4. 1: Gari Producers with No Measure against Exposure to Smoke from
Furnace .............................................................................................................................. 43
Plate 4. 2: Usage of the Wind Barrier Measure ................................................................ 44
Plate 4. 3: Mud Partition between Gari Producer and Furnace......................................... 44
Figure 4. 1: Ethanol Concentration of the Fermented Effluent by Different Concentrations
of Baker’s Yeast ................................................................................................................ 62
University of Ghana http://ugspace.ug.edu.gh
xvi
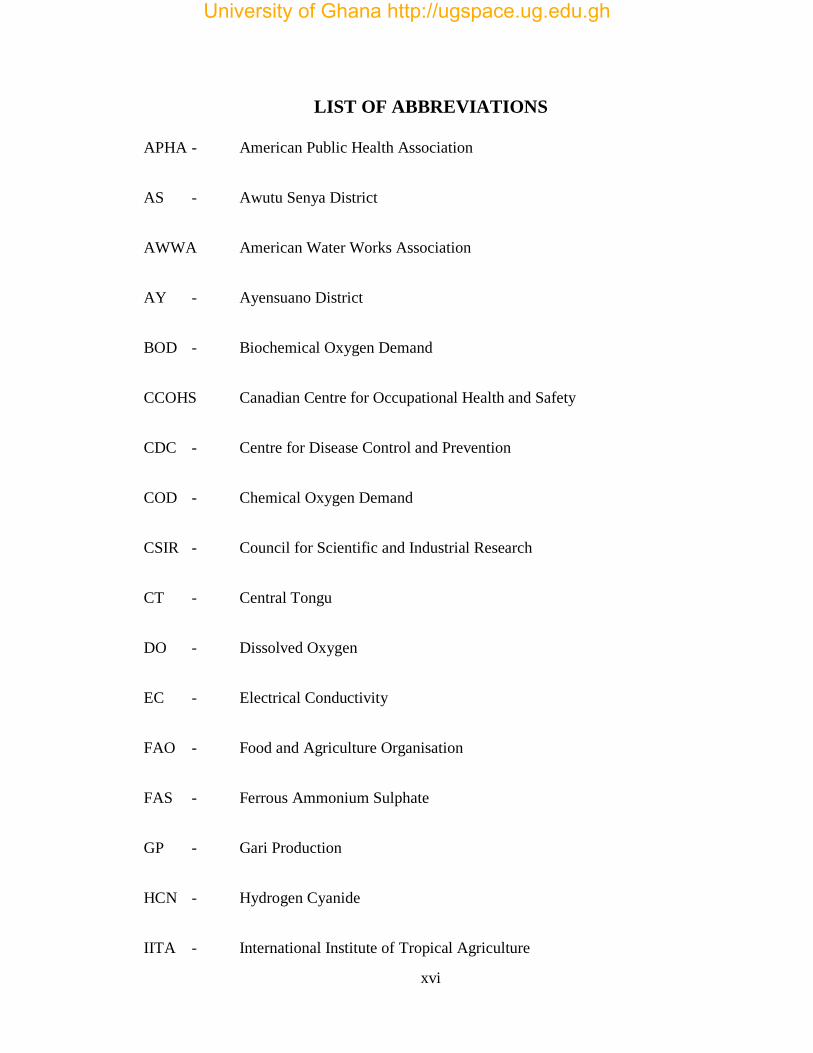
LIST OF ABBREVIATIONS
APHA - American Public Health Association
AS - Awutu Senya District
AWWA American Water Works Association
AY - Ayensuano District
BOD - Biochemical Oxygen Demand
CCOHS Canadian Centre for Occupational Health and Safety
CDC - Centre for Disease Control and Prevention
COD - Chemical Oxygen Demand
CSIR - Council for Scientific and Industrial Research
CT - Central Tongu
DO - Dissolved Oxygen
EC - Electrical Conductivity
FAO - Food and Agriculture Organisation
FAS - Ferrous Ammonium Sulphate
GP - Gari Production
HCN - Hydrogen Cyanide
IITA - International Institute of Tropical Agriculture
University of Ghana http://ugspace.ug.edu.gh
xvii
ISSER Institute of Statistical, Social and Economic Research
MoFA - Ministry of Food and Agriculture
MSU - Mississippi State University
NYSDOH New York State Department of Health
OSH - Occupational Safety and Health
RTIP- Root and Tuber Improvement Programme
TDS - Total Dissolved Solids
TSS - Total Suspended Solids
USGS - United States Geological Survey
WAAPP West African Agricultural Productivity Programme
WEF - Water Environment Federation
WRI - Water Research Institute
WSDOE Washington State Department of Ecology
University of Ghana http://ugspace.ug.edu.gh
1
CHAPTER ONE
1.0 INTRODUCTION
1.1 Background
Cassava (Manihot esculenta, Crantz) is primarily grown for its starch containing tuberous
roots, which is a major source of calories for roughly two out of every five Africans
(Nweke, 2003). Cassava is a dietary staple in much of tropical Africa (IITA, 2009). It is
highly perishable (explained by its high moisture content) and begins to degenerate
shortly (2 – 3 days) after harvest. The bulky roots contain much moisture (about 70%),
making their transportation from rural areas difficult and expensive (Bani, 2008).
Cassava in the fresh form contains cyanide, which is extremely toxic to humans and
animals. These factors make the processing of cassava a necessity. Processing the tubers
into a dry form reduces the moisture content and converts it into a more durable and
stable product with less volume, which makes it more transportable (IITA, 1990).
Cardoso et al. (2005) noted that, processing is essential for the removal of cyanides from
cassava tubers.
In Ghana, majority of cassava tubers are processed into ‘gari’, cassava dough (agbelima),
cassava flour and starch. The tubers are also prepared into readily eaten foods such as
‘fufu’, ‘kokonte’ and ‘attieke’ (also spelt ‘acheke’). Gari is one of the most shelf-stable
cassava-processed foods, with a moisture content of 8 – 10% (IITA, 1990). It is prepared
to be used over a very long period of time; unlike some other derived foods, which are to
be utilized immediately or within a relatively short period after being processed. Gari has
a long shelf life, a year or more as long as it is not exposed to moisture (Nweke, 2003).
University of Ghana http://ugspace.ug.edu.gh
2
This study would focus on gari, a toasted granule derived from cassava. Gari is a grated,
fermented and roasted cassava food product. Cassava processing into gari involves
several unit operations which include peeling, washing, grating, pressing and fermenting,
sieving and frying.
The activities and conditions present in small-scale gari production leaves processors
exposed to several occupational-related hazards. As with most, if not all occupations and
trades, gari production (especially on the small-scale traditional level) has its inherent
occupational related hazards (Adenugba and John, 2014). These health hazards include
inhalation of cyanide and smoke (Howeler et al., 2000; Adenugba and John, 2014).
Adenugba and John (2014) reported that gari producers identified several occupational
hazards (associated with their work) such as; ‘knife cuts’, ‘ergonomic hazards’, eye
irritations, and exposure to intense heat and smoke.
One by-product of cassava processing into gari (as with all forms of cassava processing)
is the generation of liquid waste, derived from the dewatering stage. Despite it being a
waste (usually not utilized), its indiscriminate and continuous disposal could have dire
consequences on the environment (Bengtsson and Triet, 1994; Howeler et al., 2000,
Arimoro et al., 2008).
1.2 Problem Statement
Conditions under which processors operate and activities carried out during gari
production tend to predispose processors to health risks (Adenugba and John, 2014).
Processors (mainly women and children) producing gari in ill-ventilated sheds, are often
exposed to high levels of hydrogen cyanide (HCN) liberated during frying (Howeler et
University of Ghana http://ugspace.ug.edu.gh
3
al., 2000). Skin irritation (itchiness) has been reported among gari producers, and this
was reported to be caused by the cyanide present in the cassava, when it comes into direct
contact with the skin (Adenugba and John, 2014). Exposure to cyanide could prevent
human cells from using up oxygen, leading to the eventual death of these cells (CDC,
2013). Smoke from the furnace could be irritating to the eyes, nose and throat
(NYSDOH, 2013) of the processor; and cause a likely shortness in breath (WebMD,
2014). Inhaling carbon monoxide (present in smoke) could decrease the body’s oxygen
supply (NYSDOH, 2013). Also, the heat being emanated (alongside the smoke) from the
furnace could lead to increased irritability and loss in concentration and ability to do
mental tasks (CCOHS, 2014).
Several environmental problems could arise with the indiscriminate discharge of the
effluent as, sufficient volume of cassava wastewater discharge can cause eutrophication
of slow moving water systems (Howeler et al., 2000), leading to oxygen depletion and
death of aquatic life. Arimoro et al. (2008) reported the decline and total elimination of
some benthic macroinvertebrates, as they were intolerant to the effects of the cassava-
mill effluents. Bengtsson and Triet (1994) indicated possible harmful effects of the
wastewater on the young stage of cultivated rice and vegetables. Olorunfemi et al. (2008)
observed cassava effluent to be inhibitory to seed germination and seedling growth of
Zea mays, Sorghum bicolor and Pennisetum americanum. Continuous application of the
effluent resulted in the withering of the plants (Olorunfemi et al., 2008). Ogundola and
Liasu (2007) also noted that vegetation was hardly observed in areas where effluents
were discharged.
University of Ghana http://ugspace.ug.edu.gh
4
1.3 Justification
Health and safety hazards encountered by processors need to be identified, as little
information is available on the health predicaments faced by processors present in the
gari value chain in Ghana. In so doing, expedient measures could be put in place to
resolve the distressing and disturbing issues of occupational safety and health. Toxicity of
the cassava-mill effluent resulting from this postharvest necessity (gari processing) would
have to be investigated, and subsequently, appropriate mitigation measures developed.
Making use of the effluent for something other than discharging into the environment
would be beneficial. The possibility and the use of cassava-mill effluent for the
production of alcohol could provide additional income generation for the processors. This
would further enhance livelihood diversification options available to the rural settlers,
through which they could contribute more to the economic capital of their households
and improve their standards of living. With the use of unsophisticated methods and
technologies, the processors and rural folks should easily relate to this value addition
option, hence, a likely high adoption rate. The findings of this study will inform decisions
with regards to the handling and usage of the generated effluent.
1.4 Objectives
This study aimed at assessing the potential effect of the effluent from gari production,
and the provisions made by gari producers in minimizing occupational-health related
issues.
The specific objectives were to;
University of Ghana http://ugspace.ug.edu.gh
5
Assess processors’ level of awareness of occupational health hazards associated
with cassava processing into gari, and environmental hazards of the generated
effluent.
Determine quality of the generated (untreated) cassava-mill effluent, and identify
the possible effects of the effluent on soil and water quality.
Determine ethanol concentration that could possibly be derived from the cassava-
mill effluent via fermentation with Saccharomyces cerevisiae.
University of Ghana http://ugspace.ug.edu.gh
6
CHAPTER TWO
2.0 LITERATURE REVIEW
2.1 Cassava
2.1.1 Crop Origin, Culture and Ecology
Cassava (Manihot esculenta Crantz) is a perennial woody shrub with an edible root,
which grows in tropical and subtropical areas of the world. It belongs to the family
Euphorbiaceae (spurge family). Though it is a perennial crop, it is grown as an annual
crop. Cassava originated from tropical America and was first introduced into Africa in
the Congo basin by the Portuguese around 1558 (IITA, 2009). O’Hair (1995) states that,
cassava specifically originated from Brazil and Paraguay. Presently, it is a dietary staple
in much of tropical Africa (IITA, 2009). Today it has been given the status of a cultigen
with no wild forms of this species being known (O’Hair, 1995). Cassava cultivation is
done in the tropical and subtropical regions of the world.
It is extensively cultivated for its edible starchy tuberous root. It is rich in carbohydrates,
calcium, vitamins B and C, and essential minerals (IITA, 2009). However, nutrient
composition differs according to variety and age of the harvested crop, and soil
conditions, climate, and other environmental factors during cultivation (IITA, 2009).
Though the roots are very starchy, the young leaves are a good source of protein
(Bradbury and Holloway, 1988).
Cassava is propagated from stem cuttings. Roots can be harvested between 6 months to 3
years after planting (IITA, 2009). This is usually based on the variety, growing conditions
and what the crop is to be used for. For human consumption, harvesting usually takes
University of Ghana http://ugspace.ug.edu.gh
7
place at about 8 to 10 months; for industrial uses, a longer growing period generally
produces a higher root and starch yield (FAO, 2013). It takes 18 or more months to
produce a crop under adverse conditions such as cool or dry weather (O’Hair, 1995). In
the tropics, plants can remain unharvested for more than one growing season, allowing
the storage roots to enlarge further (O’Hair, 1995). However, as the roots age, the central
portion becomes woody and inedible (O’Hair, 1995). Its wide harvesting window allows
it to be used as a famine reserve, harvested on a meal to meal basis (Nweke, 2003).
Cassava is easy to grow, yields well in good conditions and even in poor soils (IITA,
2009). Formerly regarded as a resource-poor farmer’s crop and as a food security crop,
cassava was generally neglected by researchers (Plucknett et al., 2000). Cassava was
often relegated to marginal lands due to competition with higher-value crops (Plucknett et
al., 2000). Cassava is of increasing importance particularly in arid and semi-arid areas
because of its hardy, drought-resistant nature, that can give acceptable yields even in low-
fertility soils and in low rainfall conditions (FAO, 2013) and with limited labour
requirements (IITA, 2009). The ability of cassava to produce reasonable yields on poor
soils, in areas with low rainfall, and under low management levels makes it a suitable and
attractive crop for poorly resourced farmers in the tropics (FAO, 2013). It tolerates a wide
range of soil pH 4.0 to 8.0 and it is most productive under high light intensity (O’Hair,
1995). The crop has long been used as a famine reserve and food security crop (Plucknett
et al., 2000) The importance of cassava is embodied in the Ewe (a language spoken in
Ghana, Togo and Benin) name for the plant, ‘agbeli’ meaning ‘there is life’.
In sub-Saharan Africa cassava is mainly a subsistence crop, grown for food by small-
scale farmers who sell the surplus (IITA, 2009). Ghana has an estimated 790,000 Ha of
University of Ghana http://ugspace.ug.edu.gh
8
land under cassava cultivation, which produces an output of 9.6 million metric tons of
cassava per annum (Dziedzoave, 2008).
2.1.2 Constituents of the Tuber and its Utilization
Roots of the cassava plant form large starchy tubers, somewhat similar to sweet potato,
with a dark brown fibrous covering and white flesh. It has been reported that raw cassava
tubers consist of up to 70% water (Plevin and Donelly, 2004). The cassava tuber is an
energy-dense food, with a high carbohydrate content ranging from 32 - 35% on a fresh
weight basis, and 80 – 90% on a dry matter basis (Montagnac et al., 2009). Cassava
tubers are rich in calories but low in protein, fat, and some minerals and vitamins
(Montagnac et al., 2009). Cassava tubers have a crude protein content of about 1.5%
(Montagnac et al., 2009). IITA, (2009) noted that the tubers are also high in calcium and
vitamin C. The nutritional value of the tuber is, however, lower than those of cereals,
legumes, and some other root and tuber crops (Montagnac et al., 2009).
Cassava tubers also contain linamarin and lotaustralin (two cyanogenic glycosides),
which are formed from amino acids. The cyanogenic glucosides are hydrolysed to
cyanide in the presence of linamarase (an enzyme present in the cassava) (O’Hair, 1995).
Formerly, cassava was categorized as either sweet or bitter, signifying the absence or
presence of toxic levels of cyanogenic glucosides (O’Hair, 1995). Sweet and bitter
cultivars were related with low and high cyanogen levels, respectively. Sweet cultivars
can produce as little as 20 mg of hydrogen cyanide (HCN) per kg of fresh roots, while
bitter ones may produce more than 50 times as much (O’Hair, 1995). The bitterness is
identified through taste and smell, but this is not a totally valid system, since sweetness is
not absolutely correlated with HCN producing ability (O’Hair, 1995). A more appropriate
University of Ghana http://ugspace.ug.edu.gh
9
and useful guide based on total root cyanide content was used by Bourdoux et al. (1982):
innocuous <50ppm, moderately poisonous 50 – 100ppm and dangerously poisonous
>100ppm. The unsafe nature of very high cyanide varieties is emphasized by the name of
one variety in Nigeria, referred to as ‘chop and die’ (Cardoso et al., 2005). Intake of
cyanide aggravates goitre and cretinism in iodine deficient areas (Delange et al., 1994).
Apart from being a food staple, the cassava tuber is a very versatile commodity; its
derivatives and starch are applicable in many types of products and industries such as
foods and confectionery, sweeteners, glues and adhesives, plywood, textiles, paper-
making, biodegradable products, monosodium glutamate, pharmaceutical drugs, high
fructose syrup and alcohol brewery ( O’Hair, 1995; IITA, 2009).
Dried tubers can be milled into flour; maize may be added during the milling process to
provide protein to the flour. Cassava flour may be used as partial substitute for wheat
flour in making bread (O’Hair, 1995). Bread made wholly from cassava has been
marketed in the U.S.A. to meet the needs of people with allergies to wheat flour (O’Hair,
1995). In the culinary arts, fresh roots can be sliced thinly and deep fried to make a
product similar to potato chips (O’Hair, 1995). They can be cut into larger spear-like
pieces and processed into a product similar to French fries (O’Hair, 1995). Cassava is
now a preferred material for making biofuels, and also used for laundry starch, which is
used in clothing and laundry industries. IITA (2009) also notes that cassava chips and
pellets are used in animal feed. Unpeeled roots can be grated and dried for use as animal
feed (O’Hair, 1995).
University of Ghana http://ugspace.ug.edu.gh
10
2.1.3 Postharvest Issues of Cassava
Though, cassava cultivation requires less labour and resources, its post-harvest phase
calls for considerable amounts of post-harvest labour (IITA, 2009). This is because the
cassava tubers are highly perishable and must be processed into storable form within a
day or two after harvest. This was confirmed by over two-thirds of local (Ghanaian)
cassava farmers in a survey, where they credited post-harvest loss as a major risk factor
in the production of cassava (NRI, 1992). The rapid post-harvest deterioration of cassava
restricts the storage potential of the fresh root to a few days (Wenham, 1995). In addition
to direct physical loss of the crop, postharvest deterioration causes a reduction in root
quality, which leads to price discounts and contributes to economic losses (Wenham,
1995).
Cassava is much more perishable than the other major root and tuber crops (Wenham,
1995). This is attributed to the fact that the tuber (being the storage organ) has no
dormancy (Wenham, 1995). Primary (or physiological) deterioration of the tuber is the
initial and major cause of the qualitative and quantitative post-harvest loss, while
secondary deterioration can become more important later (Wenham, 1995). Physiological
deterioration in cassava roots appears to share many of the common characteristics of
plant wound responses (Wenham, 1995). Physical damage which is an inevitable
consequence of harvesting cassava roots, initiates the chain of events leading to
physiological deterioration, which usually precedes the opportunistic invasion by
microorganisms (Wenham, 1995). Cassava tubers are highly susceptible to physical
injury (Bani and Josiah, 2008). Fresh tubers can suffer serious physiological deterioration
within 24 hours after harvest (Bani and Josiah, 2008). Physiological deterioration, in
University of Ghana http://ugspace.ug.edu.gh
11
most cases, develops from sites of tissue damage and is initially observed as blue-black
discoloration of the vascular tissue, referred to as vascular streaking.
Secondary deterioration occurs when pathogens penetrate through wounds and bruises
inflicted during the harvesting and handling of the tuber (Wenham, 1995). Microbial
activity is the most common cause of secondary deterioration, although fermentation or
root tissue softening can also occur (Wenham, 1995). In some situations, secondary
deterioration may be the initial cause of loss; and in these instances, symptoms of
vascular streaking frequently occur ahead of the rots (Wenham, 1995). Storage at high
humidity encourages fungal rotting, but high humidity is also necessary for effective
wound healing (Wenham, 1995). The use of a microbial protectant is therefore often
required with preservation methods that are favourable for root curing (Wenham, 1995).
Avoidance of rapid post-harvest deterioration and reduction of cyanide levels are
traditionally the main reasons for processing cassava into different food products
(Wenham, 1995). Effective processing removes naturally-occurring toxins in the roots,
reduces the product’s weight for transport, decreases post-harvest losses, and extends
shelf life (IITA, 1990; Wenham, 1995; Bani, 2008).
One common practice of avoiding loss, employed by most farmers, is to store or leave the
roots in the soil, past the period of optimal root development, until they can be
immediately consumed, processed or marketed (Wenham, 1995). The setbacks with this
practice are that: land is occupied and thus unavailable for further agricultural production
(opportunity cost of land), roots lose some of their starch content, and palatability
declines as roots become more fibrous (Rickard and Coursey, 1981).
University of Ghana http://ugspace.ug.edu.gh
12
A number of other cultural practices could come in handy in reducing the rate of
deterioration. Harvesting and handling of cassava roots should be done with care (Bani
and Josiah, 2008). Minimize damage at harvest by harvesting while the soil is wet, an
ideal situation would be after a rainfall. Retain only roots that show no or little signs of
injury, since curing will not be effective on tubers with extensive damage (Wenham,
1995). O’Hair (1995) notes that, removal of the leaves two weeks before harvest
lengthens the shelf life to two weeks. Dipping the roots in paraffin or a wax, or storing
them in plastic bags reduces the incidence of vascular streaking and extends the shelf life
to three or four weeks (O’Hair, 1995). To reduce impact and compression damage, the
tuber could be harvested with 2 – 3 cm of stem attached (Bani and Josiah, 2008). Some
traditional methods include packing the roots in moist mulch to extend shelf life (O’Hair,
1995). Storage of cassava roots under moist conditions, as encountered in soil reburial
methods, can promote the healing of wounds in roots damaged at harvest (Wenham,
1995). Curing of cassava tubers at high humidity levels also improves potential storage
life (Bani and Josiah, 2008). Conditions favourable for wound healing/curing are 30°C to
40°C, and 90% to 95% relative humidity for 2 to 5 days (Bani and Josiah, 2008).
Cassava tubers store fairly well under refrigeration (Bani and Josiah, 2008). Cassava is
the only root that tolerates low temperatures, and can be stored at 0 – 2°C for up to 6
months (Bani and Josiah, 2008). In storage, the tubers could last for 1 – 2 weeks at 5.5 –
7oC, and 85 – 90% relative humidity (Bani and Josiah, 2008). Refrigerated storage slows
down the physiological and pathological processes that lead to deterioration (Bani and
Josiah, 2008). Precooling of the tuber by hydrocooling or forced air is recommended for
refrigerated long-term storage (Bani and Josiah, 2008). Cassava is not susceptible to
University of Ghana http://ugspace.ug.edu.gh
13
chilling injury, as are other tropical root crops if held at too low temperatures (Bani and
Josiah, 2008).
Cassava traders usually arrange purchase and sale of their produce in advance to
minimize their risk. Assemblers will sometimes buy standing crops in order to increase
flexibility in timing the fresh tuber deliveries to urban markets (Wenham, 1995).
Furthermore, the quantities handled by cassava traders are usually low, since retailers buy
and sell limited volumes in order to assure a rapid turnover of the produce (Wenham,
1995).
To demonstrate the freshness of the tuber, retailers often take extreme measures
(Wenham, 1995). Freshness is demonstrated by cutting the roots to show its non-
deteriorated internal tissue and traders also deliberately wound certain parts of the roots
to cause latex exudation, which is produced only by fresh cassava (Wenham, 1995).
University of Ghana http://ugspace.ug.edu.gh
14
Table 2. 1: Strategies along Food-Chain to Prevent Rapid Deterioration of Cassava
Tubers
Channel Member Strategy
Farmers Delayed harvest
Traditional storage
Processing of roots into storable products
Processing of old unused root
Traders Low quantities traded
High margins to compensate for risk
Purchase of standing crops
Highly integrated markets
Storage technique (including traditional techniques and transferred
technology
Processing of old unsold roots
Processors Production and processing are in close proximity
Small-scale processing in rural areas
Processing into broad range of products (for human consumption,
industrial use and animal feed)
Production for new export markets
Consumers Substitute fresh cassava with processed foods and cereals, unless
cheap fresh roots are available
Improved storage techniques, such as refrigeration
Source: (Wenham, 1995).
University of Ghana http://ugspace.ug.edu.gh
15
2.2 Cassava Processing to Gari
2.2.1 Why Process Cassava?
Cassava is well known for the presence of free and bound linamarin and lotaustralin, and
are converted to HCN in the presence of linamarase (O’Hair, 1995). The tuber has to be
processed to eliminate the naturally occurring toxicant, cyanide (Cardoso et al., 2005).
The roots are thus rendered edible through processing. Avoiding rapid post-harvest
deterioration is the other major reason for processing cassava into different storable food
forms. Effective processing removes naturally-occurring toxins in the roots, improves
palatability, reduces the tubers' weight for transport, minimizes post-harvest losses, and
extends shelf life (IITA, 1990; Wenham, 1995; Cardoso et al., 2005; Bani, 2008).
Urbanization has also led to an increase in the consumption of already-processed foods,
thereby, reducing demand for perishable commodities (Wenham, 1995).
2.2.2 Contribution of Gari to the Ghanaian Economy and Its Profitability to the
Producer
The largest market for cassava in Ghana is ‘cassava being used as food’, while industrial
utilization is still limited but with potential for expansion (WAAPP, 2009). Gari is the
most commercialized of all cassava products in Ghana (WAAPP, 2009). Since 1997 to
2008, price/kg of gari generally increased at a faster rate annually than that of maize (a
major staple in Ghana), and in 2008, price of gari increased by 8.5 times, while that of
maize increased by about 7.3 times. WAAPP (2009) suggested that the increased gari
prices during this period could be attributed to increased urban demand and increased
export market potential of the commodity.
University of Ghana http://ugspace.ug.edu.gh
16
Export price of gari in 2008 was US$ 443 per tonne, and that same year Ghana was able
to export 3404 tonnes of gari. In 2008, Ghana earned an amount of US$1,679,719 from
the export of gari (WAAPP, 2009).
Ghana was able to export 4,197 tonnes of gari in 1997. This dropped to 1266 tonnes the
following year, but since then the quantity exported has been increasing (WAAPP, 2009).
The value per tonne of gari (for the export market) has been highly volatile, inconsistent
and unreliable. For example, after a steady increase from 2005 – 2007, the export price of
gari dropped by more than 30% from US$ 746 per tonne in 2007 to US$ 493 per tonne in
2008 (WAAPP, 2009). Commenting on the volatility of prices of Ghana’s non-traditional
export commodities, ISSER (2007) noted that ‘volatility in price of gari’ does not make
for good policy planning, and that Ghana appears to be mainly a price-taker in the global
market for non-traditional export commodities. However, Ghana’s potential to enter into
world market is limited by high domestic prices of raw materials, inability to supply large
orders and lack of grades and standards for Ghana cassava products (WAAPP, 2009).
Quaye et al. (2009) found that, benefit-cost ratios for gari production at the small scale
level in the Suhum-Kraboa-Coaltar, Awutu-Efutu-Senya and Ho Districts were 1.10, 0.95
and 1.06, respectively. WAAPP (2009) reported that gari-cassava price ratio ranged from
2.9 – 3.9. Yidana et al. (2013) also noted that the average net profit per month for gari
processors in the Central Gonja District was about 50% of the total monthly revenue; and
concluded that cassava processing (into gari and cassava dough) was profitable and
contributed to the standard of living of the cassava processors in Central Gonja.
University of Ghana http://ugspace.ug.edu.gh
17
2.2.3 Gari Production and Occupational Health Hazards
Small and medium-scale gari processing in Ghana can hardly be differentiated from the
homes and living quarters of processors. Such processing is mostly carried out by
household units or co-operative groups. Due to lack of financial and technological
resources, gari producers cannot maximize their efforts into producing and sustaining
large scale production (Yidana et al., 2013).
Gari is a grated, fermented and dehydrated cassava food product, obtained in a dry crispy
granular form (IITA, 1990). Processing cassava into gari, known as garification, involves
several unit operations such as peeling, washing, grating, pressing and fermenting,
sieving and frying. In gari making, fresh roots are peeled, washed and grated (IITA,
1990; Bani, 2008). The grated pulp is put in sacks, and placed under heavy stones or
pressed with a hydraulic jack between wooden platforms (Bani, 2008). The grated pulp is
pressed for about 3 – 4 days to express moisture present in the pulp (Bani, 2008). During
the dewatering stage, fermentation of the pulp takes place (Bani, 2008). It is this
fermentation process that is responsible for the taste and aroma of gari (Odunfa, 1985).
The dewatered and fermented lumps of pulp are crumbled by hand and some fibrous
materials picked out (Bani, 2008). The pulp is then sieved and roasted in an iron pan over
fire (Bani, 2008). Palm oil is sometimes added during roasting in order to prevent burning
of the pulp (Bani, 2008). The palm oil also imparts a light yellow colour to the final
product (Bani, 2008). Palm oil contains a substantial quantity of vitamin A, thus making
‘yellow gari’ more nutritious (Bani, 2008). The garification process is complete when dry
crisp granules are obtained (IITA, 1990).
University of Ghana http://ugspace.ug.edu.gh
18
Gari should preferably have a moisture content of 8 – 10% (IITA, 1990). The conversion
rate of fresh cassava roots to gari ranges from 14 – 26% (Bani, 2008). This value varies
with variety, time of harvest, age of plant and other environmental factors (Bani, 2008).
Processors work on large numbers of tubers at a time, resulting in long sitting sessions.
Washing of the tuber is done with bare hands, and in some cases with the feet to march
the peeled tubers against each other (Adenugba and John, 2014). The gari worker bends
for long periods to do the washing by hand. The frying stage is characterized by long
seated sessions, with processors seated close to the fire place.
As with all trades and professions, gari production also comes with its occupational
health issues. The various stages involved in cassava processing expose the processor to
various occupational health hazards and conditions of ergonomic importance (Adenugba
and John, 2014). Aches, cuts and bruises, and fatigue are usually sustained during the
execution of manual operations (Adenugba and John, 2014). Peeling of cassava is done
manually with the use of clean and sharp knives, and less care could result in cuts
(Adenugba and John, 2014). Skin irritation (itchiness) has been reported among gari
producers, and this is reported to be caused by the cyanide present in the cassava, when it
comes into direct contact with the skin (Adenugba and John, 2014).
Conditions of ergonomic importance include; backache from standing and bending,
prolonged bending of the vertebral column and uncomfortable sitting posture during
manual operations (Kolawole et al., 2011). The skeletal and muscle systems are the most
threatened parts of the human body during cassava processing (Adenugba and John,
2014). Sitting in a particular position over a long period of time (which occurs in the
University of Ghana http://ugspace.ug.edu.gh
19
peeling and frying stages of gari production) results in aches in the back, lower back and
the waist (Adenugba and John, 2014).
The occupational hazards also include eye irritation, exposure to smoke from frying the
gari, and exposure to gaseous or volatile cyanide (Howeler et al., 2000; Adenugba and
John, 2014). The processing of cassava leads to discharge of HCN into the atmosphere
(Howeler et al., 2000). Processors (mainly women and children) producing gari in ill-
ventilated sheds, are often exposed to high levels of hydrogen cyanide (HCN) liberated
during frying (Howeler et al., 2000). Workers involved in such industries are under
constant exposure to HCN via inhalation, skin contact and possibly oral intake. Cyanide
is a toxic asphyxiant, and its presence in cells affects mitochondrial functioning (Ghosh,
2010). Exposure to cyanide could prevent human cells from using up oxygen, leading to
the eventual death of these cells (CDC, 2013). Cyanide exposure can be treated initially
with 100% oxygen therapy (Ghosh, 2010). Definitive therapy would have to do with
inhalation of amyl nitrite or intravenous sodium nitrite (Ghosh, 2010).
During the frying stage, the processor sits next to the oven or traditional stove to stir, and
this becomes unbearable for the worker after some time due to the heat and smoke from
the oven (Adenugba and John, 2014). Occupational heat exposure not only threatens the
health of the worker when heat illness occurs, but also undermines productivity (Lucas et
al., 2014). The heat generated could lead to increased irritability and loss in concentration
and ability to do mental tasks (CCOHS, 2014). Smoke from the furnace could be
irritating to the eyes, nose and throat (NYSDOH, 2013) of the processor; and causes
shortness in breath (WebMD, 2014). Inhaling carbon monoxide (present in smoke) could
University of Ghana http://ugspace.ug.edu.gh
20
decrease the body’s oxygen supply (NYSDOH, 2013). Adenugba and John (2014) noted
the frying stage to be the most dangerous in the entire gari production exercise.
Better ventilation of processing areas would help safeguard the processors from cyanide
inhalation (Howeler et al., 2000). Likewise, wearing protective clothing, such as the
overall coat and nose mask, will go a long way in reducing the level of exposure of
workers to cyanide at the various cassava processing stages (Adenugba and John, 2014).
However, occupational contexts that involve hot and humid climatic conditions, heavy
physical workloads and/or protective clothing create a strenuous and potentially
dangerous thermal load for the worker (Lucas et al., 2014). Thermal comfort is a key
issue in the use of protective clothing (Bishop et al., 2013). The design of most protective
industrial clothing reduces the rate of heat dissipation (Bishop et al., 2013). Protective
clothing can create a serious heat stress problem, as it can have no or low moisture
permeability and high insulating properties (Lucas et al., 2014). Thus, protective clothing
can compromise performance and comfort (Bishop et al., 2013), making its use an
impractical approach in addressing some occupational health hazards inherent in gari
production.
2.3 Cassava-Mill Effluent
2.3.1 Cassava Milling and Effluent Generation
Effluent is generated from the various cassava processing methods, ranging from
processing into starch, flour, notwithstanding that of gari. The process of washing, and
dewatering by pressing, results in the production of liquid residues. Liquid residue
derived from washing is of little impact to the environment (Howeler et al., 2000).
Whereas the press water (obtained from draining out the moisture present in the cassava
University of Ghana http://ugspace.ug.edu.gh
21
mash), though produced in relatively low volumes, causes much harm to the environment
(Howeler et al., 2000). Reportedly the press water contains a high contaminating load of
biochemical oxygen demand (BOD) (Howeler et al., 2000).
2.3.2 Effects on the Environment
Cassava mill effluents have low pH (Plevin and Donelly, 2004; Olorunfemi and Lolodi,
2011), and when discharged into soils or surface water could lead to lowering of soil pH
and water pH. When soil becomes acidic, there is low availability of elements such as
calcium, magnesium and phosphorus; and increased solubility of aluminium (Al), iron
(Fe) and boron (B) (Kennelly et al., 2012). High levels of these nutrients (Al, Fe and B)
can induce toxicity symptoms in plants (Kennelly et al., 2012). Solubility (amount that
can be dissolved in water) and biological availability (amount that can be utilized by
aquatic life) of heavy metals in water bodies is determined by pH (WSDOE, 1994). In
surface water with high acidity, heavy metals become soluble, thus they become available
but deleterious to aquatic life (WSDOE, 1994).
Sufficient volume of cassava wastewater discharge could lead to eutrophication of slow
moving water systems (Howeler et al., 2000). Oxygen present in the water body would
be utilized in the decomposition of the organic content of the cassava wastewater,
resulting in oxygen depletion (Howeler et al., 2000). This would render the surface water
incapable of supporting aquatic life, leading to detrimental effects on aquatic life forms in
the water body (Howeler et al., 2000).
Onyedineke et al, (2010) reported LD50 values of 0.4786%, 0.311% and 0.2818% of
cassava effluent concentrations for 24, 48 and 96 hours respectively, in Strandesia prava
University of Ghana http://ugspace.ug.edu.gh
22
(a crustacean ostracod). The LT50 values recorded were 169.82, 346.74, 446.68, 562.34
and 2754.23 minutes for 25%, 12.5%, 6.25%, 3.125% and 1.5625% of effluent
concentration respectively.
Olorunfemi et al. (2008) observed cassava effluent to be inhibitory to seed germination
and seedling growth of Zea mays, Sorghum bicolor and Pennisetum americanum.
Continuous application of the effluent resulted in the withering of the plants (Olorunfemi
et al., 2008).
Olorunfemi and Lolodi (2011) studied the physiologial and biochemical response of
onion bulbs to cassava-processing effluents and concluded that the effluents induced root
malformations. Effluents concentrations at 0%, 0.2%, 0.4%, 0.8% 1%, 2%, 3%, 4% and
5% induced slow growth of roots (Olorunfemi and Lolodi, 2011). Strong growth
retardation was observed in onion roots growing at high concentrations, while total
inhibition in root growth was observed at 20% effluent concentration (Olorunfemi and
Lolodi, 2011). At higher concentrations of 1% and 10%, the types of root malformations
included root tips bent upwards resembling hooks (crochet hooks), c-tumors
(abnormalities appearing as swellings of the root tips) and twists (Olorunfemi and Lolodi,
2011). The roots were pale at these concentrations. At 20% effluent concentration, the
roots were dark brown or black in colour (Olorunfemi and Lolodi, 2011). Olorunfemi and
Lolodi (2011) further indicated that the toxic compounds in the cassava wastes can be
reduced by water dilution.
Adeyemo (2005) reported 20% mortality after 96 hours in Clarias gariepinus injected
with 5 mL of cassava wastewater and 50% mortality in those injected with 10 mL
University of Ghana http://ugspace.ug.edu.gh
23
cassava effluent. There was 100% mortality after 96 hours in those injected with 15 mL
of cassava effluent. Haemotological changes observed by Adeyemo (2005) in the catfish
included anaemia, and a significantly higher white blood cell (WBC) count. Reduced
swimming by the catfish was also observed. C. gariepinus injected with higher dose (10
mL) of effluent showed severe necrosis, hypertrophy and vacuolation of hepatocytes
(Adeyemo, 2005).
Adekunle et al. (2007) noted that acute exposure of Clarias gariepinus and Oreochromis
niloticus to cassava effluent after 96 hours yielded LC50 values of 0.45% and 0.25%
respectively. Chronic exposure to the cassava effluent caused reduced growth and poor
blood quality. Fish body weights decreased by 3.1–6.7% for C. gariepinus and 2.6–8.9%
for O. niloticus, with increasing cassava effluent concentration (Adekunle et al., 2007).
Arimoro et al. (2008) stated that cassava effluents permitted the dominance of
oligochaetes and dipterans (both being non-sensitive species) at impact sites of the
effluent, but the effluents resulted in a decline and total elimination of other benthic
macroinvertebrates, which were intolerant to the effects of effluents. They however
concluded that macroinvertebrates have a great capacity to recover from the cassava
effluent impact in terms of taxonomic diversity.
2.4 Ghana Environmental Protection Agency (EPA)
The Environmental Protection Agency is the leading public body for protecting and
improving the environment in Ghana. It was established June 1974, with the name
Environmental Protection Council, and later changed to its present name (EPA, 2014).
The Environmental Protection Agency Act, 1994 (Act 490) transformed the
University of Ghana http://ugspace.ug.edu.gh
24
Environmental Protection Council into an Agency having, inter alia, regulatory and
enforcement roles (EPA, 2014). The mission of the EPA is to co-manage, protect and
enhance the country's environment, as well as seek common solutions to global
environmental problems (EPA, 2014).
EPA provides guideline values to determine the quality of wastewater generated and
discharged into water bodies (streams, dams, rivers and lakes). These are limits allowed
by EPA for the discharge of wastewater into water bodies. Quality of wastewater to be
assessed in this study would be determined using the EPA guidelines.
University of Ghana http://ugspace.ug.edu.gh
25
CHAPTER THREE
3.0 MATERIALS AND METHODS
3.1 Perception of Gari Producers on Occupational Health Hazards, and on
Environmental Effects of the Effluent
A survey was conducted in three cassava producing districts in Ghana; namely, the
Awutu-Senya, Central Tongu and Ayensuano Districts; located in the Central, Volta and
Eastern Regions of Ghana, respectively. These districts were selected based on their
levels of cassava production and processing. Each district was segmented into three
clusters, from which respondents were identified, and effluent samples collected. Ninety
(90) small/medium-scale gari producers served as respondents, ten (10) respondents were
randomly selected from each cluster.
The survey sought to investigate the level of processors’ awareness to occupational health
hazards, as well as to identify measures instituted by processors to mitigate occupational-
related hazards. The survey further investigated the knowledge of the processors on the
hazards posed to the environment by the disposal of the (untreated) cassava-mill effluent.
Methods employed by the processors in treating and/or adding value to the effluent were
also sought for.
3.2 Quality Parameters of the Cassava Effluent
3.2.1 Effluent Collection and Laboratory Analysis
Effluent obtained at the dewatering stage of gari production were collected, two samples
of cassava wastewater were taken randomly from each cluster. Sampling of the effluents
was done once. Effluent samples were stored in an ice chest and kept below 4oC using ice
University of Ghana http://ugspace.ug.edu.gh
26
blocks, and were transported to the laboratory for analysis. Effluent samples were
analyzed at the Water Research Institute (WRI) of the Council of Scientific and Industrial
Research (CSIR). Parameters analyzed were pH, electrical conductivity (EC), chemical
oxygen demand (COD), biochemical oxygen demand (BOD), total dissolved solids
(TDS), total suspended solids (TSS), nitrate (NO3-N), phosphate (PO4-P), potassium,
calcium and magnesium. These parameters were all measured using standard methods by
APHA-AWWA-WEF (1998), as discussed below.
3.2.2 Quality Parameters of the Effluent Studied
3.2.2.1 pH
pH was measured using a pH meter and a combination electrode (a set of glass electrode
and reference electrode). The electrode was first calibrated using pH buffer 4 and 7. The
electrode was withdrawn and rinsed with deionised water. The electrode was immersed in
the sample, stirred and reading allowed to stabilize (APHA-AWWA-WEF, 1998).
3.2.2.2 Electrical Conductivity (EC)
The determination of the electrical conductivity provides a rapid and convenient way of
estimating the concentration of the electrolytes in solution. The Cyberscan PC510
conductivity meter was used. The conductivity cell and the beaker to be used were rinsed
with the portion of the sample to be examined. The beaker was filled completely and the
cell of the conductivity meter was inserted into the beaker. When the wastewater sample
and the equipment reached the same temperature, the value indicated on the conductivity
meter was recorded (APHA-AWWA-WEF, 1998).
University of Ghana http://ugspace.ug.edu.gh
27
3.2.2.3 Biochemical Oxygen Demand (BOD) (Winkler Azide Modification)
Effluent samples collected were diluted with aerated distilled water and incubated at 20oC
for 5 days. Dissolved oxygen (DO) concentration was measured before and after
incubation. The BOD was calculated from the difference between the initial and final
dissolved oxygen.
An amount of 2 mL MnSO4, followed by 2 mL Alkali-Iodide-Azide solution was added
to the day one (DO) sample in BOD bottle. The bottle was corked carefully to exclude air
bubbles and shaken thoroughly by inverting several times. Precipitate was allowed to
settle. After precipitate had settled, 2 mL concentrated H2SO4 was added. The bottle was
corked again and inverted several times to dissolve the precipitate, which gave an intense
yellow colour. A hundred (100) mL of solution was titrated with Na2S2O3 to a pale
yellow colour. One (1) mL of starch was added as indicator. The titration was continued
to the first disappearance of the blue colour (APHA-AWWA-WEF, 1998).
Calculation:
Where;
D1 = DO of sample immediately after preparation
D2 = DO of sample after 5 day incubation at 200C
P = Decimal volumetric fraction of sample used.
University of Ghana http://ugspace.ug.edu.gh
28
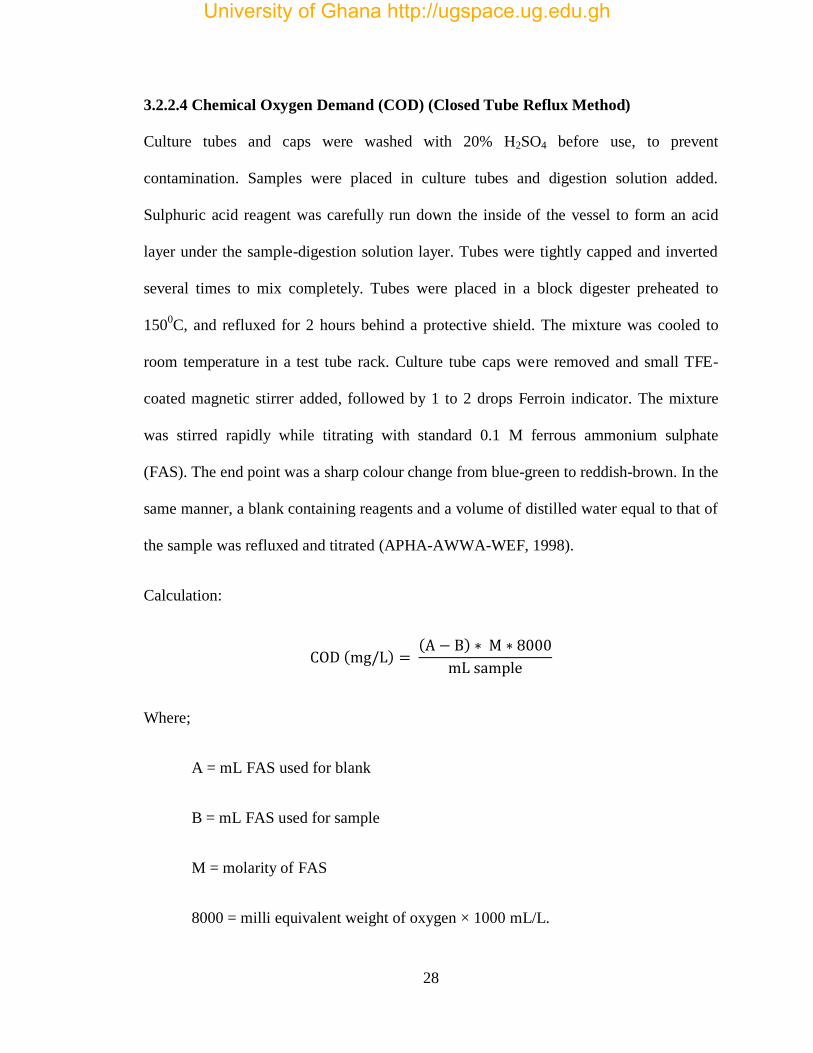
3.2.2.4 Chemical Oxygen Demand (COD) (Closed Tube Reflux Method)
Culture tubes and caps were washed with 20% H2SO4 before use, to prevent
contamination. Samples were placed in culture tubes and digestion solution added.
Sulphuric acid reagent was carefully run down the inside of the vessel to form an acid
layer under the sample-digestion solution layer. Tubes were tightly capped and inverted
several times to mix completely. Tubes were placed in a block digester preheated to
1500C, and refluxed for 2 hours behind a protective shield. The mixture was cooled to
room temperature in a test tube rack. Culture tube caps were removed and small TFE-
coated magnetic stirrer added, followed by 1 to 2 drops Ferroin indicator. The mixture
was stirred rapidly while titrating with standard 0.1 M ferrous ammonium sulphate
(FAS). The end point was a sharp colour change from blue-green to reddish-brown. In the
same manner, a blank containing reagents and a volume of distilled water equal to that of
the sample was refluxed and titrated (APHA-AWWA-WEF, 1998).
Calculation:
Where;
A = mL FAS used for blank
B = mL FAS used for sample
M = molarity of FAS
8000 = milli equivalent weight of oxygen × 1000 mL/L.
University of Ghana http://ugspace.ug.edu.gh
29
3.2.2.5 Total Suspended Solids (TSS) (Gravimetric Method)
Suspended solids are solids retained by a glass fibre filter 0.45 µm (or smaller) pore size
under specific conditions. It works with the principle that a well-mixed sample is filtered
through a weighed standard glass-filter. The residue that is retained on the filter is dried
to a constant weight at 105oC. The increase in weight of the filter represents the total
suspended solids (TSS).
The filtration apparatus were assembled. The filter was moistened with 10 mL of
deionised water to seat it on the funnel. The sample bottle was vigorously shaken and
100 mL volume was transferred to the funnel. The filter was washed with three
successive 10 mL volume of distilled water allowing drainage between washings and
suction to continue for about three minutes after filtration. The filter was carefully
removed from the holder and transferred into a petri dish (already weighed). The dish
and the filter were dried for one hour at 105 in an oven. The filter was cooled in a
desiccator and weighed. The drying cycle was repeated until a constant weight was
obtained (APHA-AWWA-WEF, 1998).
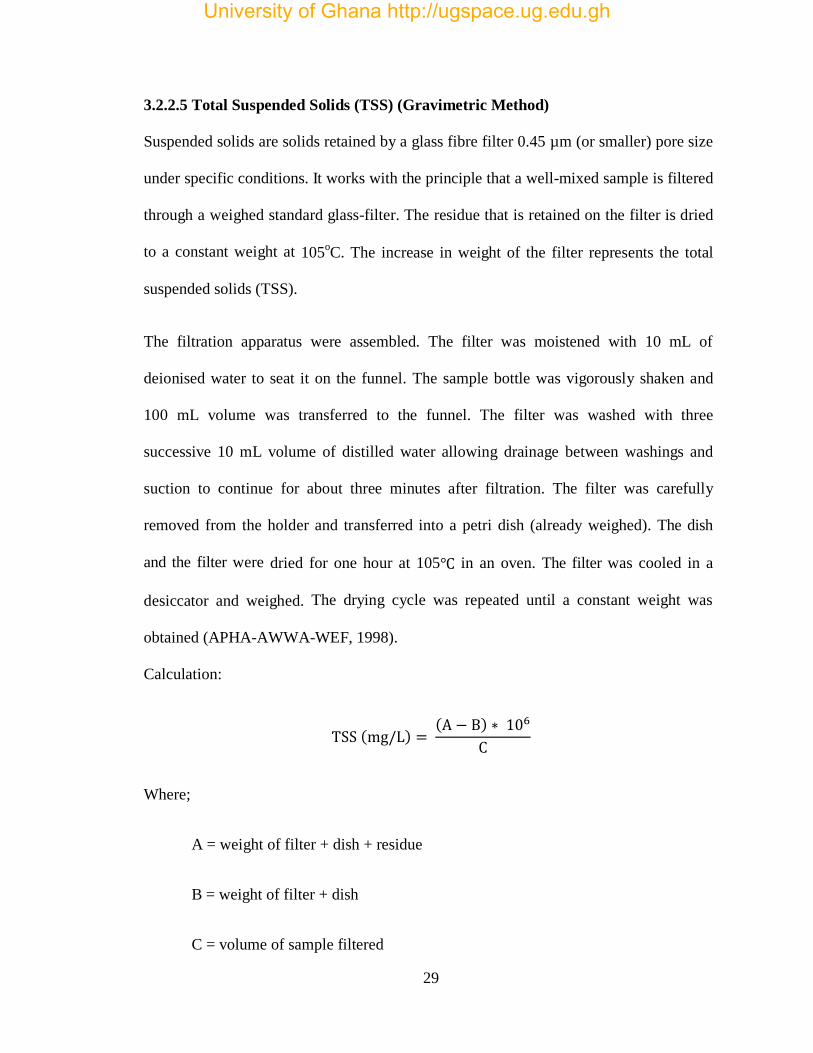
Calculation:
Where;
A = weight of filter + dish + residue
B = weight of filter + dish
C = volume of sample filtered
University of Ghana http://ugspace.ug.edu.gh
30
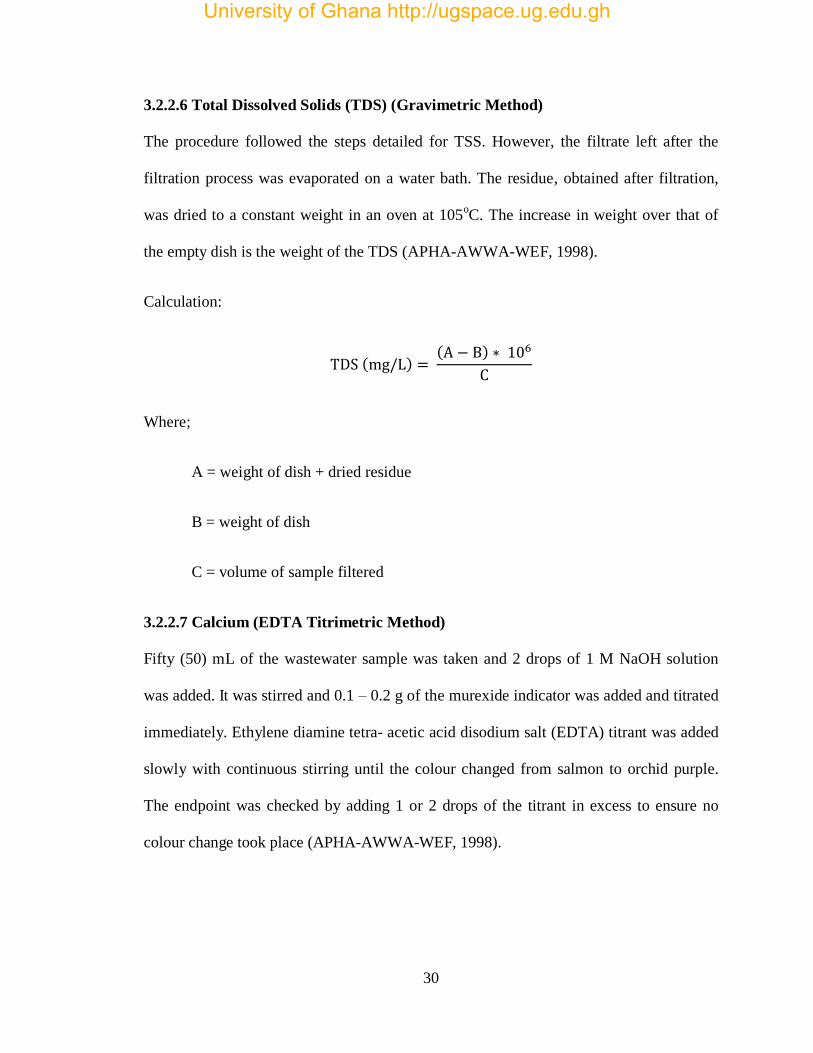
3.2.2.6 Total Dissolved Solids (TDS) (Gravimetric Method)
The procedure followed the steps detailed for TSS. However, the filtrate left after the
filtration process was evaporated on a water bath. The residue, obtained after filtration,
was dried to a constant weight in an oven at 105oC. The increase in weight over that of
the empty dish is the weight of the TDS (APHA-AWWA-WEF, 1998).
Calculation:
Where;
A = weight of dish + dried residue
B = weight of dish
C = volume of sample filtered
3.2.2.7 Calcium (EDTA Titrimetric Method)
Fifty (50) mL of the wastewater sample was taken and 2 drops of 1 M NaOH solution
was added. It was stirred and 0.1 – 0.2 g of the murexide indicator was added and titrated
immediately. Ethylene diamine tetra- acetic acid disodium salt (EDTA) titrant was added
slowly with continuous stirring until the colour changed from salmon to orchid purple.
The endpoint was checked by adding 1 or 2 drops of the titrant in excess to ensure no
colour change took place (APHA-AWWA-WEF, 1998).
University of Ghana http://ugspace.ug.edu.gh
31
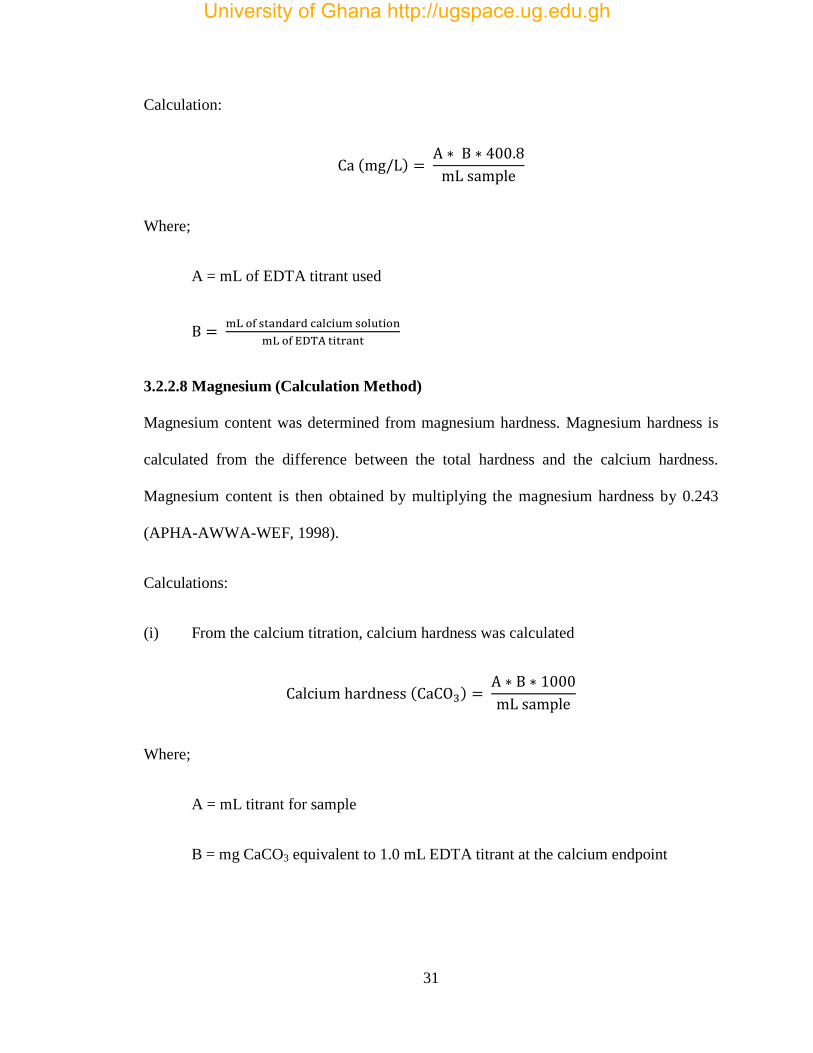
Calculation:
Where;
A = mL of EDTA titrant used
3.2.2.8 Magnesium (Calculation Method)
Magnesium content was determined from magnesium hardness. Magnesium hardness is
calculated from the difference between the total hardness and the calcium hardness.
Magnesium content is then obtained by multiplying the magnesium hardness by 0.243
(APHA-AWWA-WEF, 1998).
Calculations:
(i) From the calcium titration, calcium hardness was calculated
Where;
A = mL titrant for sample
B = mg CaCO3 equivalent to 1.0 mL EDTA titrant at the calcium endpoint
University of Ghana http://ugspace.ug.edu.gh
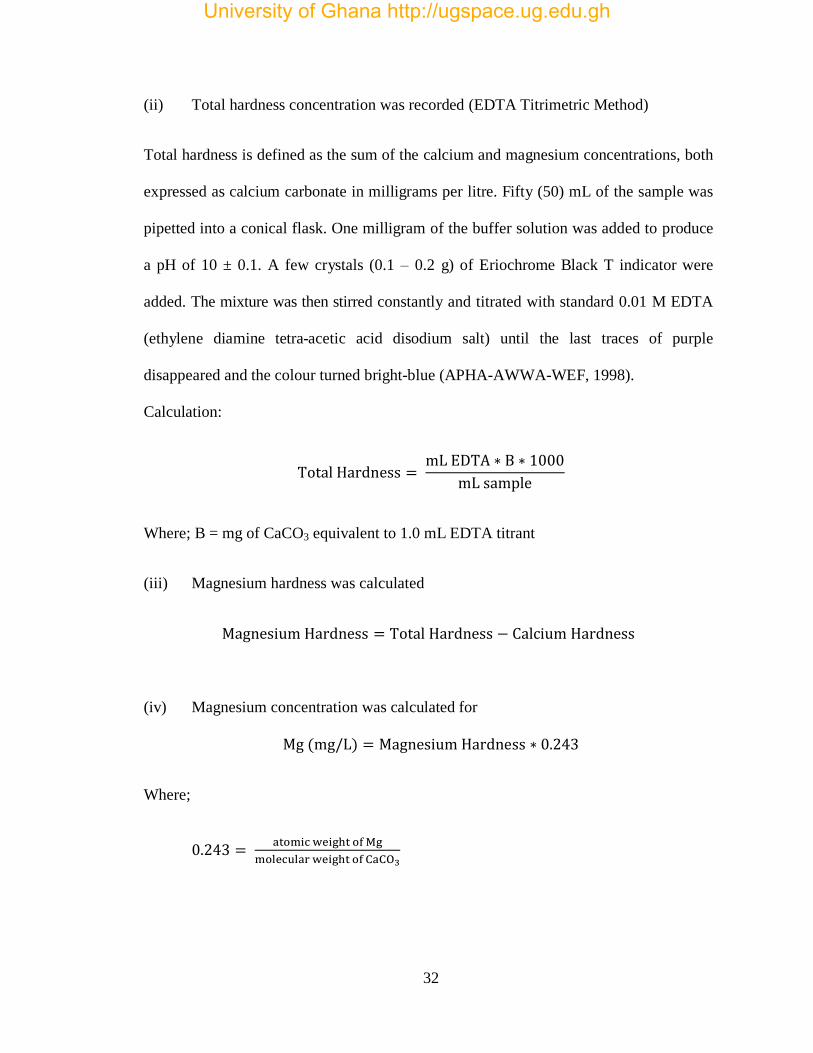
32
(ii) Total hardness concentration was recorded (EDTA Titrimetric Method)
Total hardness is defined as the sum of the calcium and magnesium concentrations, both
expressed as calcium carbonate in milligrams per litre. Fifty (50) mL of the sample was
pipetted into a conical flask. One milligram of the buffer solution was added to produce
a pH of 10 ± 0.1. A few crystals (0.1 – 0.2 g) of Eriochrome Black T indicator were
added. The mixture was then stirred constantly and titrated with standard 0.01 M EDTA
(ethylene diamine tetra-acetic acid disodium salt) until the last traces of purple
disappeared and the colour turned bright-blue (APHA-AWWA-WEF, 1998).
Calculation:
Where; B = mg of CaCO3 equivalent to 1.0 mL EDTA titrant
(iii) Magnesium hardness was calculated
(iv) Magnesium concentration was calculated for
Where;
University of Ghana http://ugspace.ug.edu.gh
33
3.2.2.9 Nitrate (Hydrazine Reduction Method)
Ten (10) ml of the sample was pipetted into a test tube, and 1.0 mL of 0.3 M NaOH was
added and mixed gently. One (1) mL of reducing mixture (prepared by adding 20 mL
copper sulphate (CuS04) working solution and 16 mL hydrazine sulphate to 20 ml of
0.3M NaOH) was added and mixed gently. The mixture was heated at 60oC for 10
minutes in a water bath and then cooled to room temperature, after which 1.0 ml of colour
developing reagent was added. It was shaken to mix, and the absorbance was read at
520nm with the T60 UV/VIS spectrophotometer by PG Instruments. Absorbance read
were used for a calibration curve. The calibration curve was used to determine the
concentration of nitrate (APHA-AWWA-WEF, 1998).
3.2.2.10 Phosphate (Stannous Chloride Method)
One hundred (100) ml of sample free from colour and turbidity was taken and 0.05 mL (1
drop) phenolphthalein indicator was added. Strong acid was added to decolourise the
sample and diluted to 100 mL with distilled water, and phenolphthalein indicator was
added and discharged. Four (4.0) mL of molybdate reagent I and 0.5 mL (10 drops)
stannous chloride reagent I (prepared from dissolving 2.5 g of fresh SnCl2.H2O in 100
mL glycerol) was added with thorough mixing after each addition. The absorbance was
measured at a wavelength of 690 nm on the T60 UV/VIS spectrophotometer by PG
Instruments after 10 minutes but before 12 minutes. The spectrophotometer was zeroed
with a blank solution (prepared with 100 mL of distilled water). Absorbance read on the
spectrophotometer were used for a calibration curve. The calibration curve was used to
determine the concentration of (PO4-P) in the samples (APHA-AWWA-WEF, 1998).
University of Ghana http://ugspace.ug.edu.gh
34
3.2.2.11 Potassium (Flame Photometric Method)
A digital flame analyser (Gallenkamp FGA-350-1) was used. It was calibrated with five
(5) freshly prepared potassium (K) standards in the range of 1 – 10 mg/L to produce a
straight line curve. It was operated using the wavelength of 768 µm. The sample was
sprayed into the gas flame and excitation was carried out under careful, controlled and
reproducible conditions. The desired spectral line was isolated by the use of interference
filter. A phototube potentiometer then measured the intensity of light. The intensity of
light at 768 µm is approximately proportional to the concentration of potassium in the
sample. This method read the optical density, and the actual concentration in mg/L was
read from a calibration curve (APHA-AWWA-WEF, 1998).
3.3 Fermentation of Effluent with Yeast
3.3.1 Sample Hydrolysis
Composite sample of effluent was sterilized in an autoclave for 15 minutes at 121oC, and
allowed to cool to room temperature. The effluent was hydrolysed using α-amylase (with
concentration of 75g/L). One (1) mL α-amylase was added per 100 mL of sterilized
effluent. The sample was heated and kept at 60 (in an incubator) for one (1) hour to
facilitate enzyme catalysis.
3.3.2 Fermentation Process
The fermentation procedure was carried out at the Biotechnology lab of the Crop Science
Department of the University of Ghana. Two hundred (200) mL of hydrolysate were
dispensed into 500mL Erlenmeyer flask. The hydrolysates were then inoculated with
baker’s yeast at different amounts. These were incubated at 30 ± 2oC for 72 hours.
University of Ghana http://ugspace.ug.edu.gh
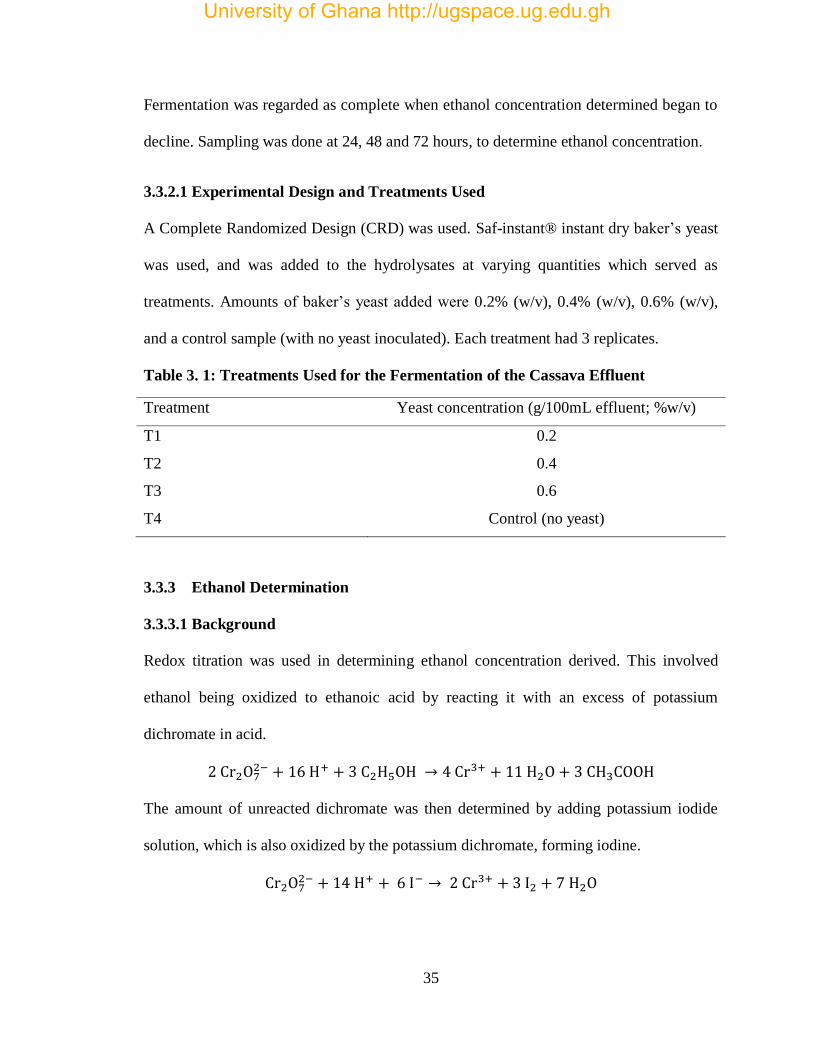
35
Fermentation was regarded as complete when ethanol concentration determined began to
decline. Sampling was done at 24, 48 and 72 hours, to determine ethanol concentration.
3.3.2.1 Experimental Design and Treatments Used
A Complete Randomized Design (CRD) was used. Saf-instant® instant dry baker’s yeast
was used, and was added to the hydrolysates at varying quantities which served as
treatments. Amounts of baker’s yeast added were 0.2% (w/v), 0.4% (w/v), 0.6% (w/v),
and a control sample (with no yeast inoculated). Each treatment had 3 replicates.
Table 3. 1: Treatments Used for the Fermentation of the Cassava Effluent
Treatment Yeast concentration (g/100mL effluent; %w/v)
T1 0.2
T2 0.4
T3 0.6
T4 Control (no yeast)
3.3.3 Ethanol Determination
3.3.3.1 Background
Redox titration was used in determining ethanol concentration derived. This involved
ethanol being oxidized to ethanoic acid by reacting it with an excess of potassium
dichromate in acid.
The amount of unreacted dichromate was then determined by adding potassium iodide
solution, which is also oxidized by the potassium dichromate, forming iodine.
University of Ghana http://ugspace.ug.edu.gh
36
The iodine is then titrated with a standard solution of sodium thiosulphate and the
titration results used to calculate ethanol content.
3.3.3.2 Setup
Acid dichromate solution (0.01 mol/L potassium dichromate in 5.0 mol/L sulphuric acid)
was placed in flasks and the fermented samples suspended in a small holder (vial) above
it and held in place with a cork (stopper). Blank preparations were made in same fashion,
but with no samples suspended above the acid dichromate solution. The ethanol slowly
evaporates and comes in contact with the dichromate; it first dissolves and then oxidized.
Since this transfer is slow, it is necessary to leave the flask with the suspended sample in
a warm place overnight. Flasks were kept in an incubator (at 30oC). The next morning the
flasks were brought to room temperature, the stoppers loosened and sample holders
discarded.
3.3.3.3 Titration Procedure
The redox titration was carried out at the Soil Science lab of the Soil Science Department
of the University of Ghana. The flask was rinsed with distilled water, and 100mL of
distilled water added, and 1mL of potassium iodide solution (1.2mol ) was added and
swirled to mix. Each flask was titrated with sodium thiosulphate (0.03mol ) till the
brown iodine colour faded to yellow. One (1) mL of starch solution (1.0% solution) was
then added (which turned to dark blue). Titration continued till the blue colour
disappeared and became clear.
University of Ghana http://ugspace.ug.edu.gh
37
3.3.3.4 Calculation for Ethanol Concentration
Volume of the sodium thiosulphate solution used for the sample titration was subtracted
from the volume used for the blank titration. This volume of sodium thiosulphate was
then used to determine the ethanol concentration. The number of moles of sodium
thiosulphate in this volume (per litre) was calculated. Moles of ethanol were calculated
from that of thiosulphate as; 1 mol of sodium thiosulphate is equivalent to 0.25 mol of
ethanol. Moles per litre were then converted to percentage (g/100mL).
3.4 Data Analysis
3.4.1 Survey Analysis
The data obtained from the survey was subjected to descriptive analysis using the
Statistical Package for Social scientists (SPSS®) version 17. Probit regression and
Poisson regression were carried out on possible determining factors of some variables
using Stata® version 13. Statistically significant relationships with the dependent
variable were determined at (p<0.01) and (p<0.05).
3.4.2 Statistical Analysis of Effluent Quality Parameters
The relationships between the parameters were determined using correlation analysis.
Analysis for all data points were carried out using Microsoft Excel 2010® and the nature
of correlations between parameters were determined using the correlation coefficient (r).
3.4.3 Data Analysis on Ethanol Yield
Ethanol yield obtained were statistically analysed with Analysis of Variance (ANOVA),
using Genstat® 12th
edition software.. Differences between treatment means were
determined using Least Significant Difference (LSD) at p<0.05.
University of Ghana http://ugspace.ug.edu.gh
38
CHAPTER FOUR
4.0 RESULTS
4.1 Perception of Gari Producers on Occupational Health Hazards, and on
Environmental Effects of the Effluent
4.1.1 Demographic Information of Gari Producers
Out of the respondents interviewed, 78.9% were females and 21.1% were males (Table
4.1). Results show that the majority (37.8%) of respondents were 40 – 49 years old. A
sum of 60% of respondents fell within ages 30 – 49; whereas, 2.2% of respondents were
70 years and above. The education characteristic indicated that the majority (31.1%) of
the respondents had no formal education. Only 7.8% and 2.2% of respondents had SHS
and tertiary education respectively.
Table 4 1: Demographic Information of Gari Producers.
Variable Frequency Percent
Gender Male 19 21.1
Female 71 78.9
Age 20 – 29 12 13.3
30 – 39 20 22.2
40 – 49 34 37.8
50 – 59 16 17.8
60 – 69 6 6.7
≥ 70
2 2.2
Formal Education None 28 31.1
Primary School 26 28.9
Middle School/ JHS 27 30.0
SHS 7 7.8
Tertiary 2 2.2
University of Ghana http://ugspace.ug.edu.gh
39
4.1.1.1 Distribution of Male and Female Processors among Age Groups
Majority of male processors fall within the 40 – 49 age range (Table 4.2). This makes up
10.0% of the entire population, and 47.4% of males interviewed. Majority of the female
processors also fell within the same age group of 40 – 49. They constitute 27.8% of the
entire target population, and 35.2% of the female participants.
Table 4 2: Distribution of Gender among Age Groups of Gari Producers.
Gender Age Total
20 – 29 30 – 39 40 – 49 50 – 59 60 – 69 ≥ 70
Male %Male 15.8 15.8 47.4 15.8 5.3 0.0 100%
%Total 3.3 3.3 10.0 3.3 1.1 0.0 21.1%
Female %Female 12.7 23.9 35.2 18.3 7.0 2.8 100%
%Total 10.0 18.9 27.8 14.4 5.6 2.2 78.9%
4.1.1.2 Respondents Participation in Gari Production
All respondents (100%) produced gari for commercial purposes (Table 4.3). A minority
(8.9%) of participants interviewed had gari production as their sole occupation (Table
4.3), while 91.1% were involved in other economic activities besides gari production.
Most of the respondents (44.5%) had been engaged in gari production for 6 – 15 years
(Table 4.3). Some respondents (33.3%) processed an average of 2 – 5 bags of cassava
mash per week (Table 4.3). Furthermore, 31.1% processed 6 – 9 bags per week, and
25.6% worked on 10 – 13 bags in a week.
University of Ghana http://ugspace.ug.edu.gh
40
Table 4 3: Respondents Participation in Gari Production
Variable Frequency Percent
GP for commercial
purposes
Yes 90 100
No
0 0.0
GP as sole occupation
Yes 8 8.9
No
82 91.1
Years of GP ≤ 5 14 15.6
6 – 15 40 44.5
16 – 25 15 16.7
26 – 35 15 16.7
≥ 36
6 6.7
Average bags* of cassava
mash processed in a week
< 2 2 2.2
2 – 5 30 33.3
6 – 9 28 31.1
10 – 13 23 25.6
14 – 17 4 4.4
18 – 21
3 3.3
GP = Gari Production; *1 bag = 50 kg woven polythene sacks
4.1.2 Occupational Health Hazards Associated with Gari Production
4.1.2.1 Producers’ Perception of Gari Production to be Hazardous
An overwhelming majority of 97.8% perceived gari production to be hazardous to
processors’ health (Table 4.4). Hazards mentioned by the processors included inhalation
of smoke, intense heat from the furnace and boulder accident.
University of Ghana http://ugspace.ug.edu.gh
41
Table 4 4: Producers’ Perception of Gari Production to be Hazardous
Response Frequency Percent
Yes 88 97.8
No 2 2.2
Total 90 100
4.1.2.2 Training on Occupational Health Hazards
Results indicate that only 5.6% of respondents had ever received some training on ways
to mitigate occupational health hazards associated with gari production (Table 4.5).
Respondents indicated that issues addressed during such trainings included; how to
construct improved stoves, and putting up a good workplace and ideal working
conditions. Only 2.2% of respondents received training on how to construct improved
stoves.
Table 4 5: Training Received by Respondents on Occupational Health Hazards
Variable Frequency Percent
Training on occupational
hazards on GP
Yes 5 5.6
No 85 94.4
Total
90 100
Frequency % Cases % Total
Training received
[multiple choice]
(n = 5)
Good workplace and
conditions
1 20 1.1
Constructing improved
stoves
2 40 2.2
Minimizing exposure to
burns, heat and smoke
4 80 4.4
GP = Gari Production
University of Ghana http://ugspace.ug.edu.gh
42
4.1.2.3 Measures Employed in Preventing/Minimizing Occupational Health Hazards
4.1.2.3.1 Preventing or Minimizing Cuts and Bruises
Majority of respondents (60.0%) exercised caution and attentiveness in preventing or
minimizing the incidence of cuts and bruises (Table 4.6). Only 5.6% of respondents used
strong and secured ropes (in dewatering the cassava mash) as a means of preventing cuts
and bruises. These responses came from only the Central Tongu District. Some
respondents (12.2%) used less sharp knives while peeling the tubers.
Table 4 6: Measures Adopted in Preventing/Minimizing Cuts and Bruises
(n = 90) [multiple choice] Response Frequency Percent
No measure 34 37.8
Caution and attentiveness 54 60.0
Strong and secured rope 5 5.6
Less sharp knives 11 12.2
4.1.2.3.2 Preventing or Minimizing Skin Irritations
The majority of respondents (68.9%) did not employ any measures in avoiding skin
irritations (Table 4.7). Some 16.7% of respondents wore clothing that covered arms and
legs as a means to prevent or minimizing skin irritations.
Table 4 7: Measures Adopted in Preventing/Minimizing Skin Irritations
(n = 90) [multiple choice] Response Frequency Percent
No measure 62 68.9
Caution 17 18.9
Clothes that cover arms and legs 15 16.7
University of Ghana http://ugspace.ug.edu.gh
43
4.1.2.3.3 Preventing or Minimizing Inhalation of Smoke
Majority of respondents (58.9%) employed no measure to prevent or minimize the
inhalation of smoke from the furnace, while frying the gari (Plate 4.1; Table 4.8). Some
of the respondents (10%) took time off in the course of the frying activity as a measure of
preventing or minimizing the inhalation of smoke. A few respondents (7.8%) sat behind
either tarpaulins or aluminium roofing sheets to prevent or minimize the inhalation of
smoke during frying (Plate 4.2). Another 8.9% of respondents continually reposition their
seats as a means of preventing or minimizing smoke inhalation. Some 17.8% of
respondents fry gari behind a high mud wall partitioning the gari worker from the furnace
(Plate 4.3), in order to prevent or minimize smoke inhalation.
Plate 4. 1: Gari Producers with No Measure against Exposure to Smoke from
Furnace
University of Ghana http://ugspace.ug.edu.gh
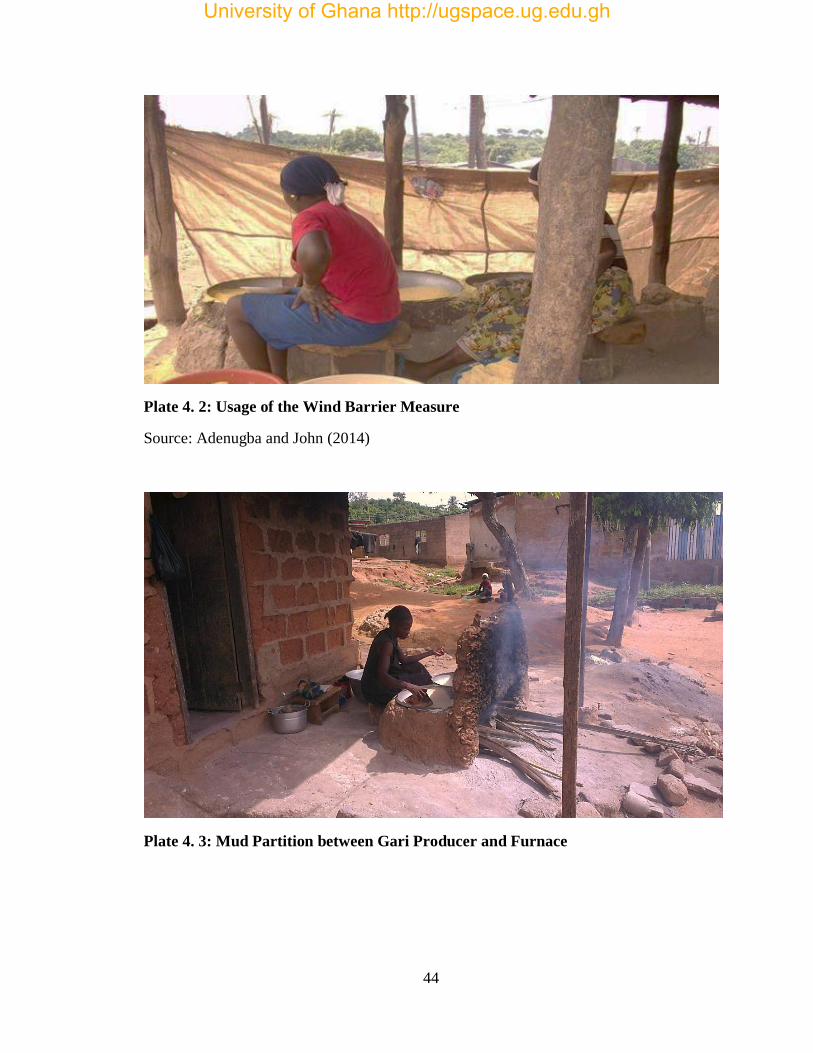
44
Plate 4. 2: Usage of the Wind Barrier Measure
Source: Adenugba and John (2014)
Plate 4. 3: Mud Partition between Gari Producer and Furnace
University of Ghana http://ugspace.ug.edu.gh
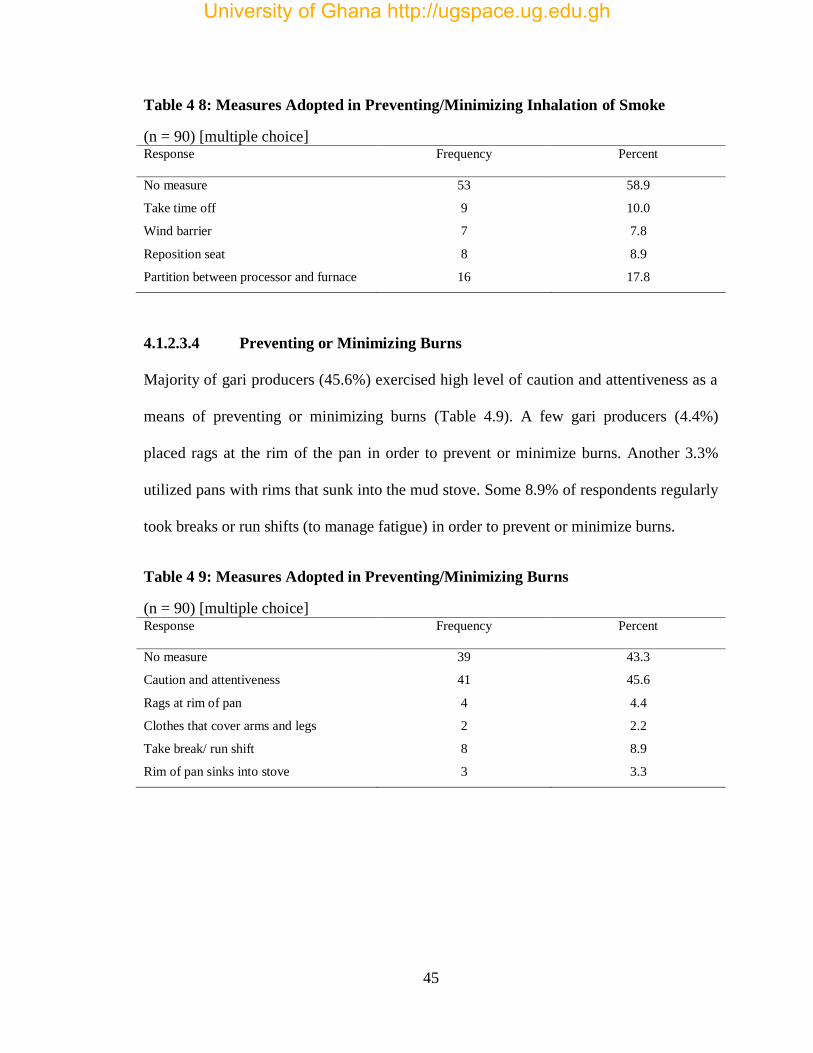
45
Table 4 8: Measures Adopted in Preventing/Minimizing Inhalation of Smoke
(n = 90) [multiple choice] Response Frequency Percent
No measure 53 58.9
Take time off 9 10.0
Wind barrier 7 7.8
Reposition seat 8 8.9
Partition between processor and furnace 16 17.8
4.1.2.3.4 Preventing or Minimizing Burns
Majority of gari producers (45.6%) exercised high level of caution and attentiveness as a
means of preventing or minimizing burns (Table 4.9). A few gari producers (4.4%)
placed rags at the rim of the pan in order to prevent or minimize burns. Another 3.3%
utilized pans with rims that sunk into the mud stove. Some 8.9% of respondents regularly
took breaks or run shifts (to manage fatigue) in order to prevent or minimize burns.
Table 4 9: Measures Adopted in Preventing/Minimizing Burns
(n = 90) [multiple choice] Response Frequency Percent
No measure 39 43.3
Caution and attentiveness 41 45.6
Rags at rim of pan 4 4.4
Clothes that cover arms and legs 2 2.2
Take break/ run shift 8 8.9
Rim of pan sinks into stove 3 3.3
University of Ghana http://ugspace.ug.edu.gh
46
4.1.2.4 Awareness and Usage of Protective Clothing in Gari Production
4.1.2.4.1 Awareness of Protective Clothing
Majority of the respondents (68.9%) had no awareness on protective clothing as
applicable to their line of work, whereas, 31.1% had such awareness.
4.1.2.4.2 Factors Influencing Processors’ Awareness of Protective Clothing
Table 4.10 presents results of probit regression to determine factors that influence
processors’ awareness of protective clothing.
University of Ghana http://ugspace.ug.edu.gh
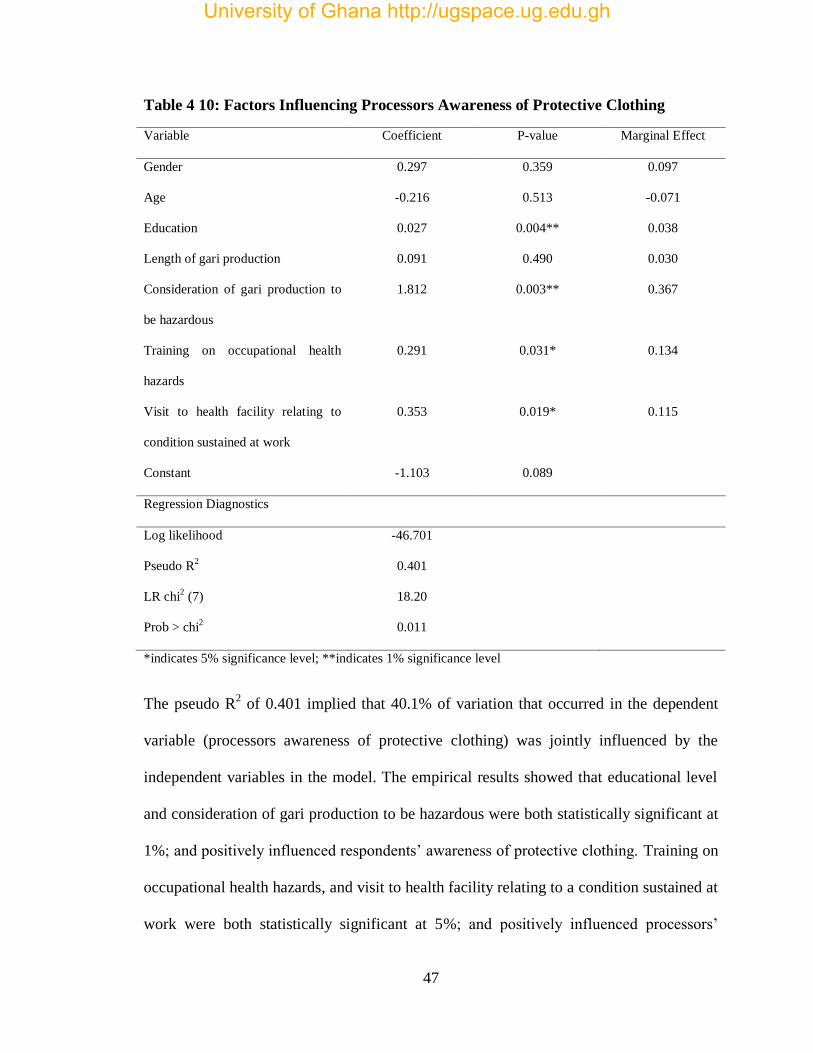
47
Table 4 10: Factors Influencing Processors Awareness of Protective Clothing
Variable Coefficient P-value Marginal Effect
Gender 0.297 0.359 0.097
Age -0.216 0.513 -0.071
Education 0.027 0.004** 0.038
Length of gari production 0.091 0.490 0.030
Consideration of gari production to
be hazardous
1.812 0.003** 0.367
Training on occupational health
hazards
0.291 0.031* 0.134
Visit to health facility relating to
condition sustained at work
0.353 0.019* 0.115
Constant -1.103 0.089
Regression Diagnostics
Log likelihood -46.701
Pseudo R2 0.401
LR chi2 (7) 18.20
Prob > chi2 0.011
*indicates 5% significance level; **indicates 1% significance level
The pseudo R2 of 0.401 implied that 40.1% of variation that occurred in the dependent
variable (processors awareness of protective clothing) was jointly influenced by the
independent variables in the model. The empirical results showed that educational level
and consideration of gari production to be hazardous were both statistically significant at
1%; and positively influenced respondents’ awareness of protective clothing. Training on
occupational health hazards, and visit to health facility relating to a condition sustained at
work were both statistically significant at 5%; and positively influenced processors’
University of Ghana http://ugspace.ug.edu.gh
48
awareness of protective clothing. Gender, age and length of gari production had no
significant relationship with processors’ awareness of protective clothing.
For each additional educational level, individuals were 3.8% more likely to be aware of
protective clothing. Individuals who considered gari production to be hazardous were
36.7% more likely to be aware of protective clothing. Individuals who had had training
(in one form or the other) on occupational health hazards associated with gari production
were 13.4% more likely to be aware of protective clothing (than those who had never
received such training). Respondents who had ever visited a health facility in relation to a
health condition sustained at work were 11.5% more likely to be aware of protective
clothing.
4.1.2.4.3 Usage of Protective Clothing
Only 3.3% of respondents utilized footwear (covering entire foot); and this was on a ‘less
often’ basis (Table 4.11). None of the respondents made use of overall coats, but some
17.8% utilized an improvised means (long sleeve shirts with or without trousers). These
respondents also utilized this improvised means on a ‘less often’ basis. None of the
respondents used hand gloves and nose masks, neither in the actual form nor in an
improvised way.
University of Ghana http://ugspace.ug.edu.gh
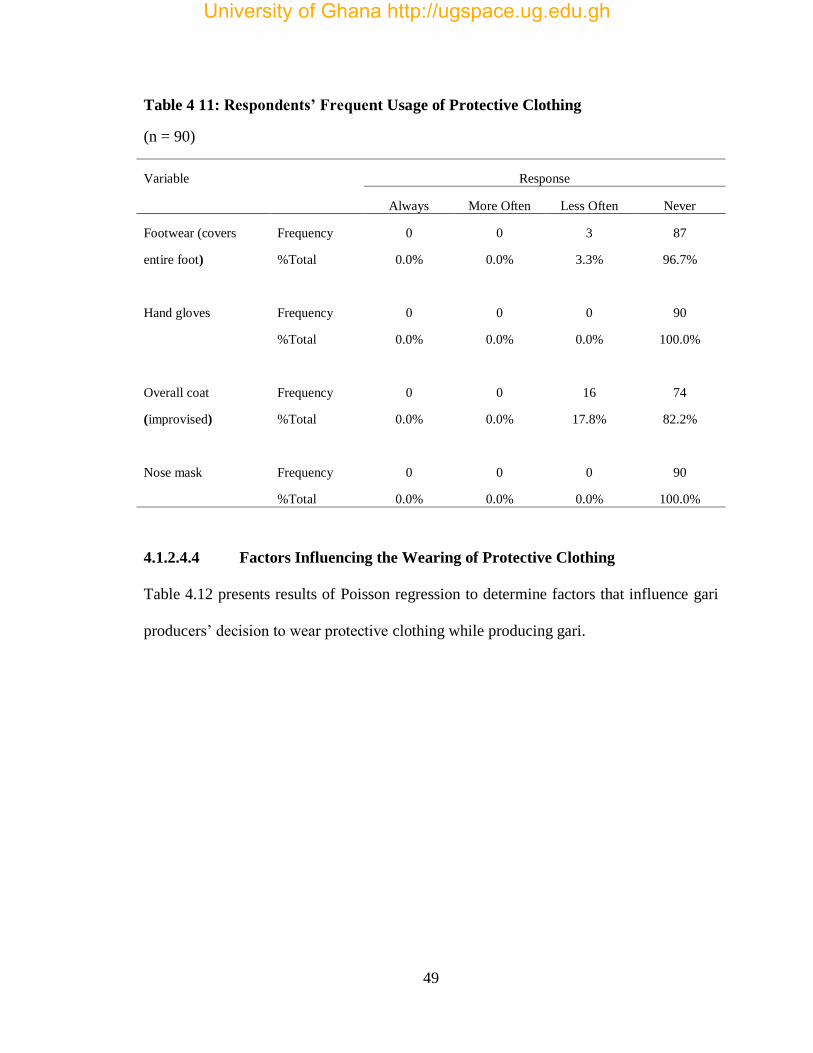
49
Table 4 11: Respondents’ Frequent Usage of Protective Clothing
(n = 90)
Variable Response
Always More Often Less Often Never
Footwear (covers
entire foot)
Frequency 0 0 3 87
%Total 0.0% 0.0% 3.3% 96.7%
Hand gloves Frequency 0 0 0 90
%Total 0.0% 0.0% 0.0% 100.0%
Overall coat
(improvised)
Frequency 0 0 16 74
%Total 0.0% 0.0% 17.8% 82.2%
Nose mask Frequency 0 0 0 90
%Total 0.0% 0.0% 0.0% 100.0%
4.1.2.4.4 Factors Influencing the Wearing of Protective Clothing
Table 4.12 presents results of Poisson regression to determine factors that influence gari
producers’ decision to wear protective clothing while producing gari.
University of Ghana http://ugspace.ug.edu.gh
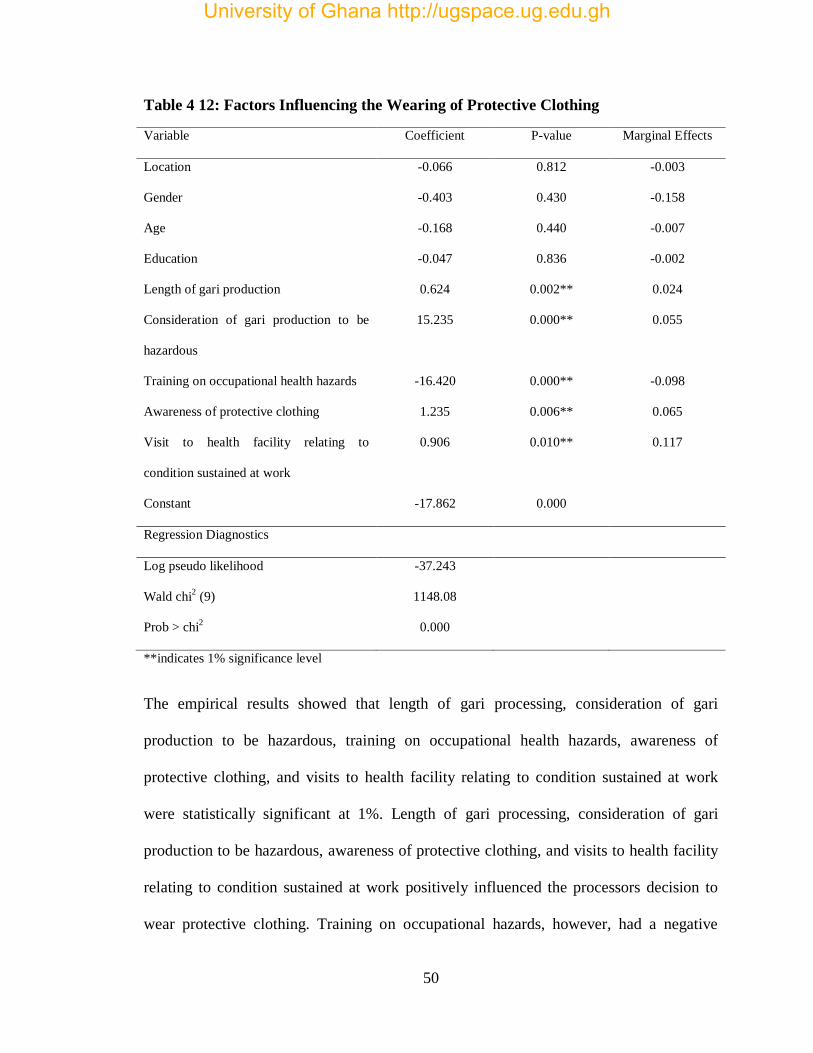
50
Table 4 12: Factors Influencing the Wearing of Protective Clothing
Variable Coefficient P-value Marginal Effects
Location -0.066 0.812 -0.003
Gender -0.403 0.430 -0.158
Age -0.168 0.440 -0.007
Education -0.047 0.836 -0.002
Length of gari production 0.624 0.002** 0.024
Consideration of gari production to be
hazardous
15.235 0.000** 0.055
Training on occupational health hazards -16.420 0.000** -0.098
Awareness of protective clothing 1.235 0.006** 0.065
Visit to health facility relating to
condition sustained at work
0.906 0.010** 0.117
Constant -17.862 0.000
Regression Diagnostics
Log pseudo likelihood -37.243
Wald chi2 (9) 1148.08
Prob > chi2 0.000
**indicates 1% significance level
The empirical results showed that length of gari processing, consideration of gari
production to be hazardous, training on occupational health hazards, awareness of
protective clothing, and visits to health facility relating to condition sustained at work
were statistically significant at 1%. Length of gari processing, consideration of gari
production to be hazardous, awareness of protective clothing, and visits to health facility
relating to condition sustained at work positively influenced the processors decision to
wear protective clothing. Training on occupational hazards, however, had a negative
University of Ghana http://ugspace.ug.edu.gh
51
influence on the processors decision to wear protective clothing. Gender, age and
education of the processors had no significant relationship with processors’ decision to
wear protective clothing.
For each increase in length of gari production, producers were 2.4% more likely to wear
protective clothes. Respondents who considered gari production to be hazardous were
5.5% more likely to use protective clothing. Individuals with an awareness of protective
clothing were 6.5% more likely to put on protective clothes. Respondents who had ever
visited a health facility in relation to a health condition sustained at work were 11.7%
more likely to wear protective clothes. However, individuals who had training on
occupational health hazards associated with gari production were 9.8% less likely to
make use of protective clothing.
4.1.2.4.5 Visit to Health Facility for Health Condition Sustained During Gari
Production
Some respondents (43.3%) had visited a health facility at a point in time in relation to a
health condition sustained at work (Table 4.13). These conditions included boulder
accident, dizziness and induced fever.
University of Ghana http://ugspace.ug.edu.gh
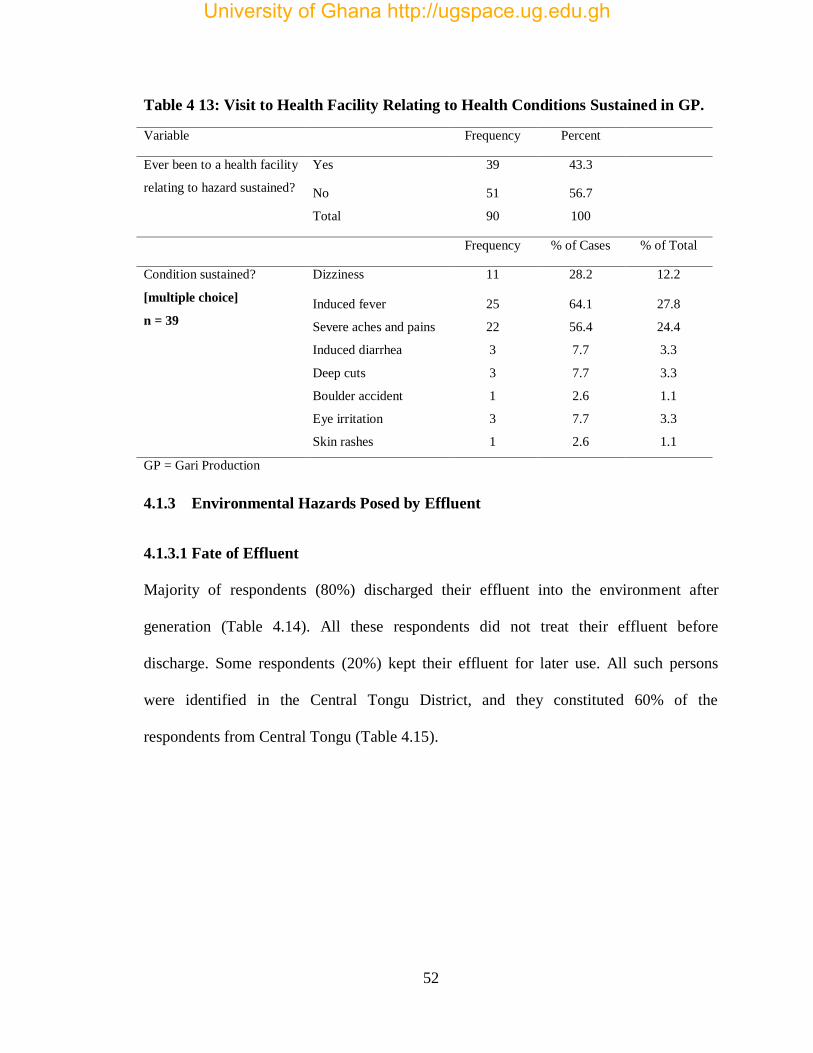
52
Table 4 13: Visit to Health Facility Relating to Health Conditions Sustained in GP.
Variable Frequency Percent
Ever been to a health facility
relating to hazard sustained?
Yes 39 43.3
No 51 56.7
Total 90 100
Frequency % of Cases % of Total
Condition sustained?
[multiple choice]
n = 39
Dizziness 11 28.2 12.2
Induced fever 25 64.1 27.8
Severe aches and pains 22 56.4 24.4
Induced diarrhea 3 7.7 3.3
Deep cuts 3 7.7 3.3
Boulder accident 1 2.6 1.1
Eye irritation 3 7.7 3.3
Skin rashes 1 2.6 1.1
GP = Gari Production
4.1.3 Environmental Hazards Posed by Effluent
4.1.3.1 Fate of Effluent
Majority of respondents (80%) discharged their effluent into the environment after
generation (Table 4.14). All these respondents did not treat their effluent before
discharge. Some respondents (20%) kept their effluent for later use. All such persons
were identified in the Central Tongu District, and they constituted 60% of the
respondents from Central Tongu (Table 4.15).
University of Ghana http://ugspace.ug.edu.gh
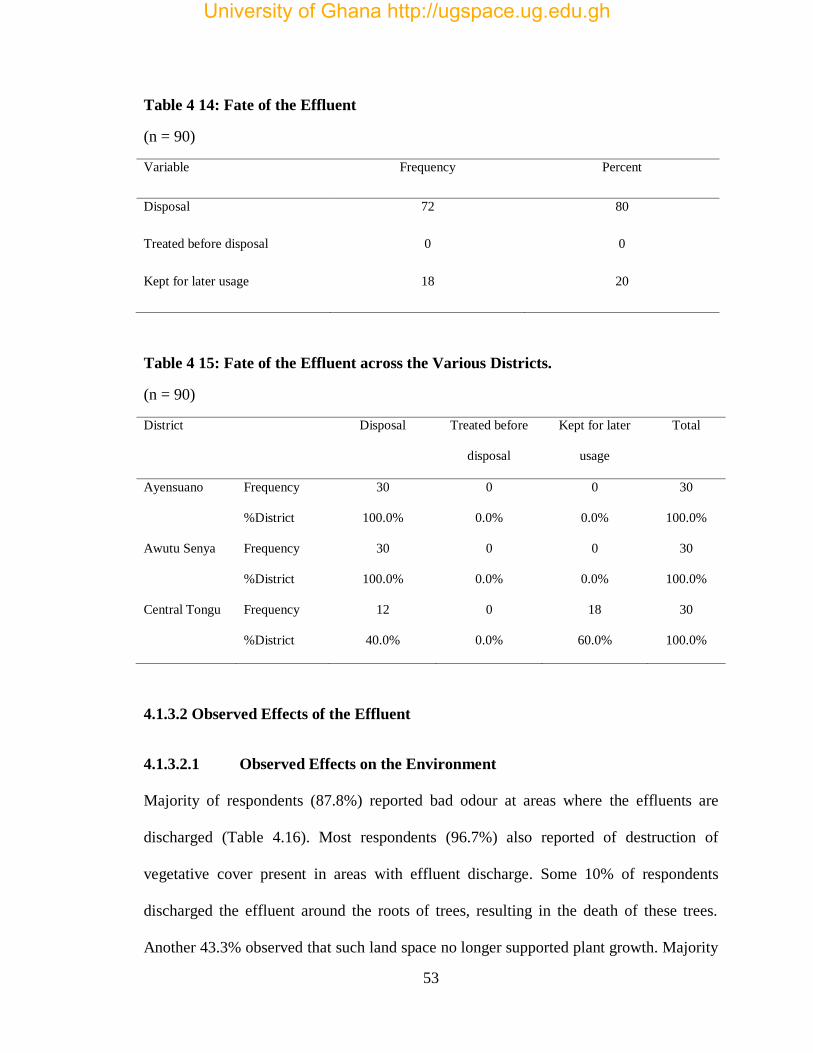
53
Table 4 14: Fate of the Effluent
(n = 90)
Variable Frequency Percent
Disposal 72 80
Treated before disposal 0 0
Kept for later usage 18 20
Table 4 15: Fate of the Effluent across the Various Districts.
(n = 90)
District Disposal Treated before
disposal
Kept for later
usage
Total
Ayensuano Frequency 30 0 0 30
%District 100.0% 0.0% 0.0% 100.0%
Awutu Senya Frequency 30 0 0 30
%District 100.0% 0.0% 0.0% 100.0%
Central Tongu Frequency 12 0 18 30
%District 40.0% 0.0% 60.0% 100.0%
4.1.3.2 Observed Effects of the Effluent
4.1.3.2.1 Observed Effects on the Environment
Majority of respondents (87.8%) reported bad odour at areas where the effluents are
discharged (Table 4.16). Most respondents (96.7%) also reported of destruction of
vegetative cover present in areas with effluent discharge. Some 10% of respondents
discharged the effluent around the roots of trees, resulting in the death of these trees.
Another 43.3% observed that such land space no longer supported plant growth. Majority
University of Ghana http://ugspace.ug.edu.gh
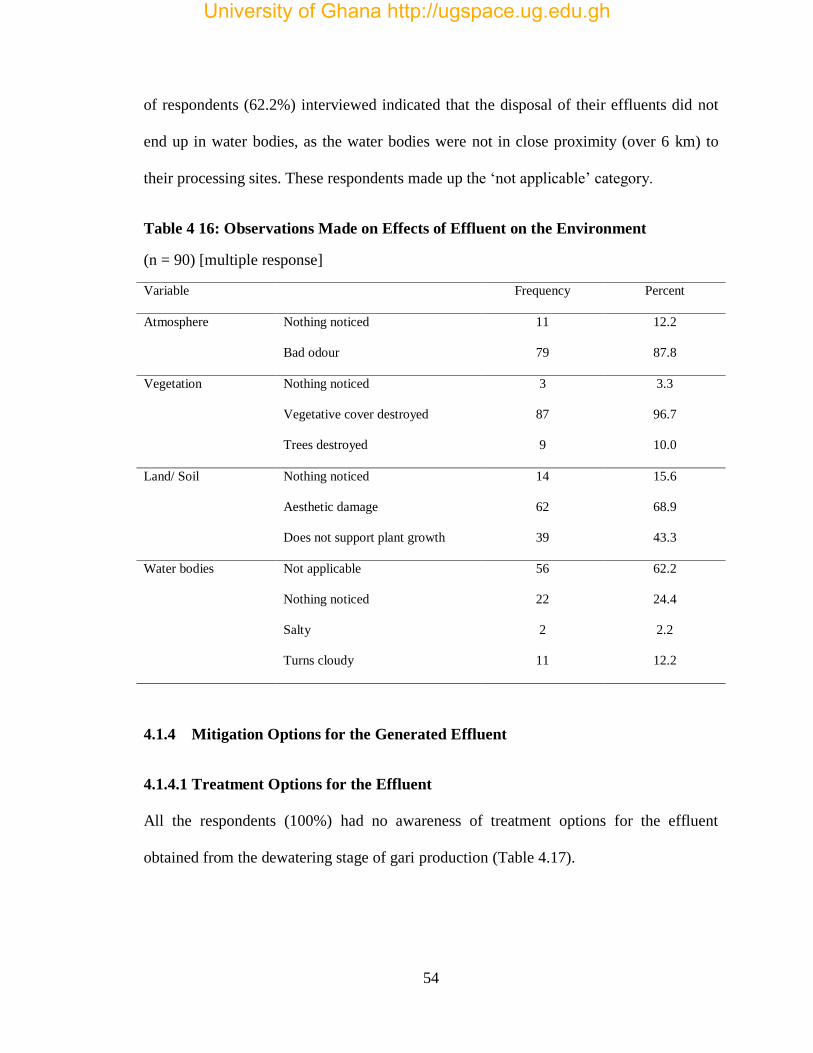
54
of respondents (62.2%) interviewed indicated that the disposal of their effluents did not
end up in water bodies, as the water bodies were not in close proximity (over 6 km) to
their processing sites. These respondents made up the ‘not applicable’ category.
Table 4 16: Observations Made on Effects of Effluent on the Environment
(n = 90) [multiple response]
Variable Frequency Percent
Atmosphere Nothing noticed 11 12.2
Bad odour 79 87.8
Vegetation Nothing noticed 3 3.3
Vegetative cover destroyed 87 96.7
Trees destroyed 9 10.0
Land/ Soil Nothing noticed 14 15.6
Aesthetic damage 62 68.9
Does not support plant growth 39 43.3
Water bodies Not applicable 56 62.2
Nothing noticed 22 24.4
Salty 2 2.2
Turns cloudy 11 12.2
4.1.4 Mitigation Options for the Generated Effluent
4.1.4.1 Treatment Options for the Effluent
All the respondents (100%) had no awareness of treatment options for the effluent
obtained from the dewatering stage of gari production (Table 4.17).
University of Ghana http://ugspace.ug.edu.gh
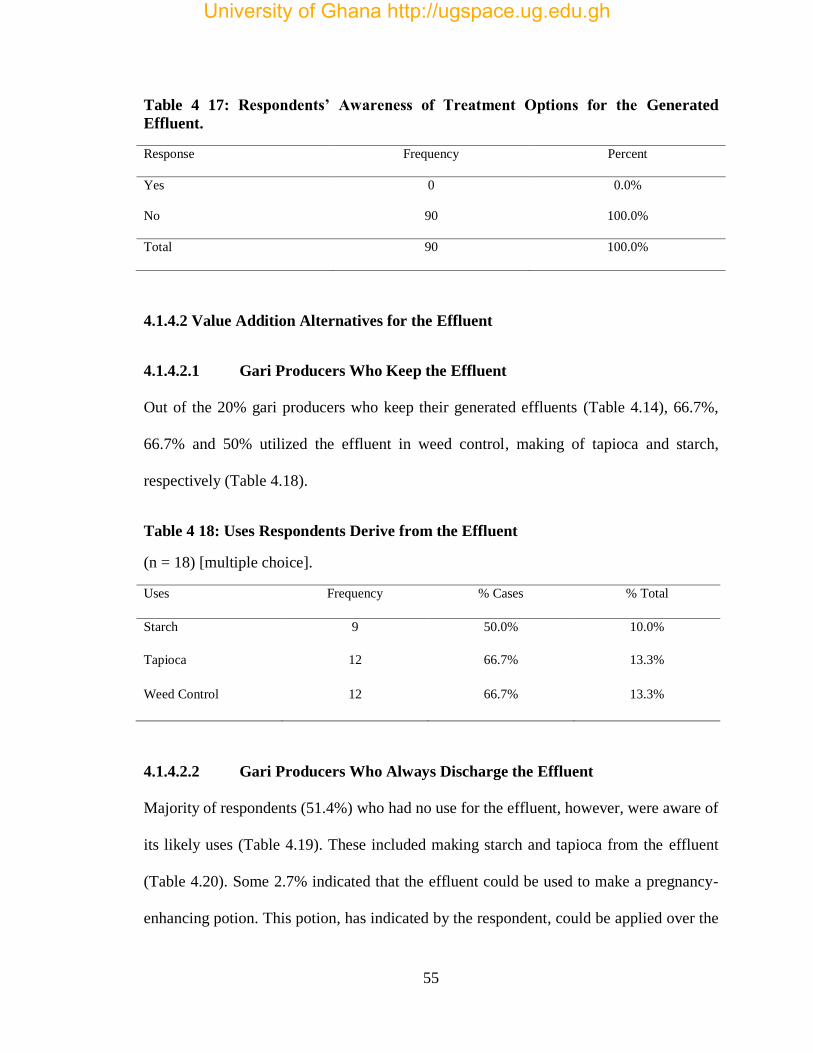
55
Table 4 17: Respondents’ Awareness of Treatment Options for the Generated
Effluent.
Response Frequency Percent
Yes 0 0.0%
No 90 100.0%
Total 90 100.0%
4.1.4.2 Value Addition Alternatives for the Effluent
4.1.4.2.1 Gari Producers Who Keep the Effluent
Out of the 20% gari producers who keep their generated effluents (Table 4.14), 66.7%,
66.7% and 50% utilized the effluent in weed control, making of tapioca and starch,
respectively (Table 4.18).
Table 4 18: Uses Respondents Derive from the Effluent
(n = 18) [multiple choice].
Uses Frequency % Cases % Total
Starch 9 50.0% 10.0%
Tapioca 12 66.7% 13.3%
Weed Control 12 66.7% 13.3%
4.1.4.2.2 Gari Producers Who Always Discharge the Effluent
Majority of respondents (51.4%) who had no use for the effluent, however, were aware of
its likely uses (Table 4.19). These included making starch and tapioca from the effluent
(Table 4.20). Some 2.7% indicated that the effluent could be used to make a pregnancy-
enhancing potion. This potion, has indicated by the respondent, could be applied over the
University of Ghana http://ugspace.ug.edu.gh
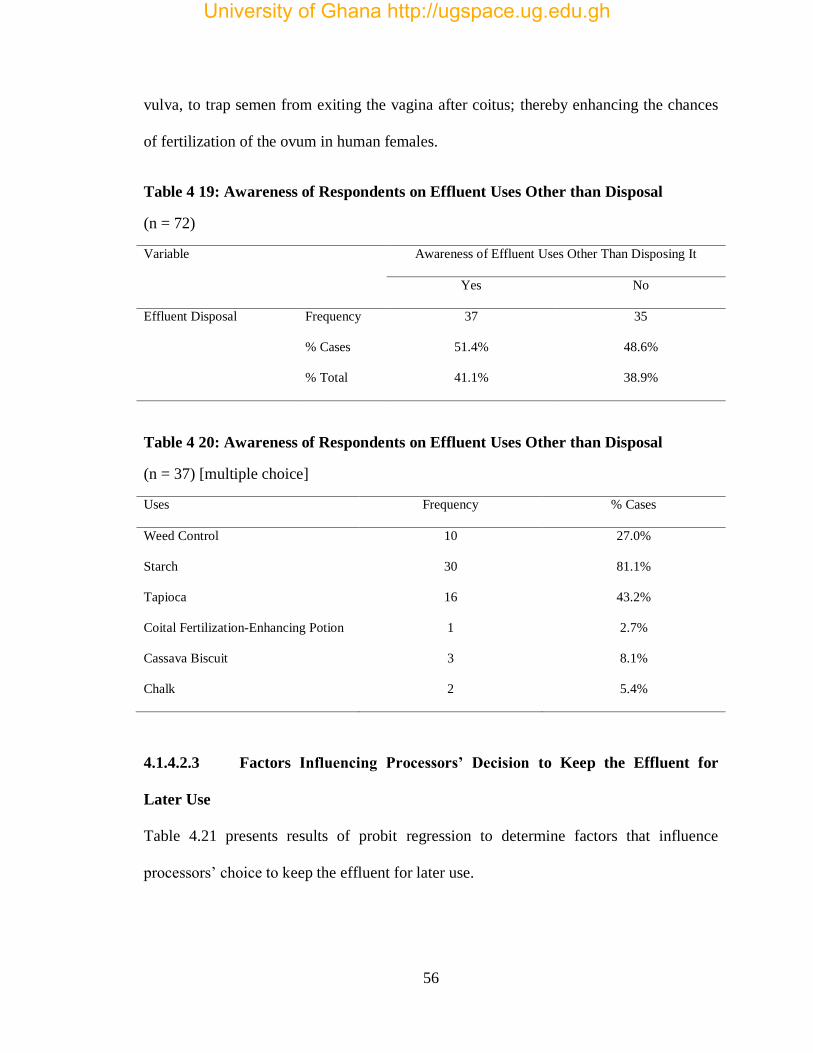
56
vulva, to trap semen from exiting the vagina after coitus; thereby enhancing the chances
of fertilization of the ovum in human females.
Table 4 19: Awareness of Respondents on Effluent Uses Other than Disposal
(n = 72)
Variable Awareness of Effluent Uses Other Than Disposing It
Yes No
Effluent Disposal Frequency 37 35
% Cases 51.4% 48.6%
% Total 41.1% 38.9%
Table 4 20: Awareness of Respondents on Effluent Uses Other than Disposal
(n = 37) [multiple choice]
Uses Frequency % Cases
Weed Control 10 27.0%
Starch 30 81.1%
Tapioca 16 43.2%
Coital Fertilization-Enhancing Potion 1 2.7%
Cassava Biscuit 3 8.1%
Chalk 2 5.4%
4.1.4.2.3 Factors Influencing Processors’ Decision to Keep the Effluent for
Later Use
Table 4.21 presents results of probit regression to determine factors that influence
processors’ choice to keep the effluent for later use.
University of Ghana http://ugspace.ug.edu.gh
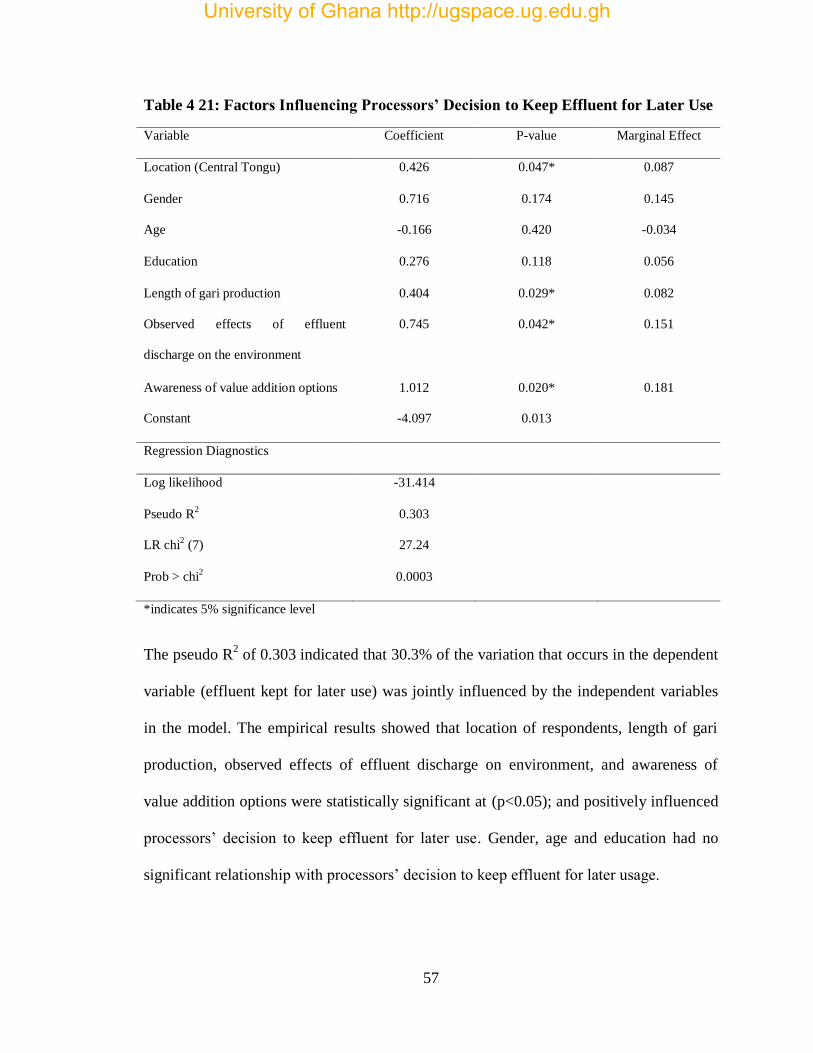
57
Table 4 21: Factors Influencing Processors’ Decision to Keep Effluent for Later Use
Variable Coefficient P-value Marginal Effect
Location (Central Tongu) 0.426 0.047* 0.087
Gender 0.716 0.174 0.145
Age -0.166 0.420 -0.034
Education 0.276 0.118 0.056
Length of gari production 0.404 0.029* 0.082
Observed effects of effluent
discharge on the environment
0.745 0.042* 0.151
Awareness of value addition options 1.012 0.020* 0.181
Constant -4.097 0.013
Regression Diagnostics
Log likelihood -31.414
Pseudo R2 0.303
LR chi2 (7) 27.24
Prob > chi2 0.0003
*indicates 5% significance level
The pseudo R2 of 0.303 indicated that 30.3% of the variation that occurs in the dependent
variable (effluent kept for later use) was jointly influenced by the independent variables
in the model. The empirical results showed that location of respondents, length of gari
production, observed effects of effluent discharge on environment, and awareness of
value addition options were statistically significant at (p<0.05); and positively influenced
processors’ decision to keep effluent for later use. Gender, age and education had no
significant relationship with processors’ decision to keep effluent for later usage.
University of Ghana http://ugspace.ug.edu.gh
58
Respondents located in Central Tongu were 8.7% more likely to keep the cassava effluent
for later use than respondents from other locations. With an increase in length of gari
production, processors were 8.2% more likely to keep the effluent for later use.
Respondents who had observed environmental effects of the untreated effluent were
15.1% more likely to keep the effluent for later use. Individuals with an awareness of
value added options for the effluent were 18.1% more likely to keep the effluent for later
use (than those who were unaware of the effluent’s use).
4.2 Quality of the Cassava Effluent
The physico-chemical parameters used to assess the quality of the effluents generated
were pH, conductivity, total solids, total suspended solids, biochemical oxygen demand,
and chemical oxygen demand, nitrate, phosphate, potassium, calcium and magnesium.
The summary of the wastewater quality results are shown in Table 4.22.
The cassava-mill effluents were acidic, with pH values ranging from 3.79 – 4.25 (Table
4.21), and that from the Ayensuano District recording relatively low figures (3.79 – 3.95).
The pH values obtained across the various districts were below the limits or standards of
the Ghana Environmental Protection Authority (EPA), which puts it at a range of 6 – 9
(EPA, 2000). Electrical conductivity of the effluents also ranged from 8830 – 14680
µS/cm, which are extremely high compared to the maximum limit of 1500 µS/cm set by
the EPA (EPA, 2000). Total suspended solids (TSS) contained in the effluent ranged
from 1700 – 2470 mg/L, with Ayensuano District recording 2020 – 2310 mg/L. The TSS
figures recorded were all higher than the EPA maximum limits (EPA, 2000). BOD for the
effluent from Awutu Senya ranged from 24480 – 24240 mg/L, whereas, that from Central
Tongu ranged from 21680 – 25080 mg/L, and Ayensuano had BOD values of 19920 –
University of Ghana http://ugspace.ug.edu.gh
59
26080 mg/L. For phosphate, all samples from Ayensuano met EPA accepted limit,
likewise for nitrate. Means of the entire samples for phosphate and nitrate (which are
0.125 mg/L and 0.070 mg/L respectively) were within EPA accepted limits.
University of Ghana http://ugspace.ug.edu.gh
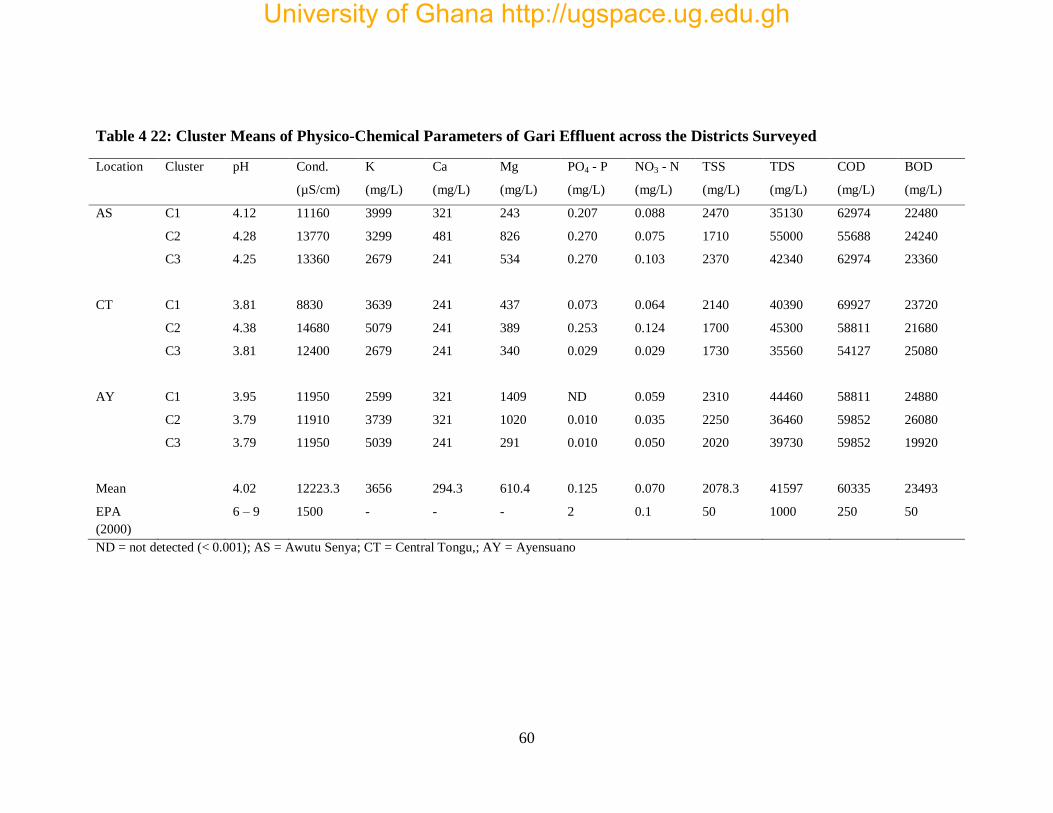
60
Table 4 22: Cluster Means of Physico-Chemical Parameters of Gari Effluent across the Districts Surveyed
Location Cluster pH Cond.
(µS/cm)
K
(mg/L)
Ca
(mg/L)
Mg
(mg/L)
PO4 - P
(mg/L)
NO3 - N
(mg/L)
TSS
(mg/L)
TDS
(mg/L)
COD
(mg/L)
BOD
(mg/L)
AS C1 4.12 11160 3999 321 243 0.207 0.088 2470 35130 62974 22480
C2 4.28 13770 3299 481 826 0.270 0.075 1710 55000 55688 24240
C3 4.25 13360 2679 241 534 0.270 0.103 2370 42340 62974 23360
CT C1 3.81 8830 3639 241 437 0.073 0.064 2140 40390 69927 23720
C2 4.38 14680 5079 241 389 0.253 0.124 1700 45300 58811 21680
C3 3.81 12400 2679 241 340 0.029 0.029 1730 35560 54127 25080
AY C1 3.95 11950 2599 321 1409 ND 0.059 2310 44460 58811 24880
C2 3.79 11910 3739 321 1020 0.010 0.035 2250 36460 59852 26080
C3 3.79 11950 5039 241 291 0.010 0.050 2020 39730 59852 19920
Mean 4.02 12223.3 3656 294.3 610.4 0.125 0.070 2078.3 41597 60335 23493
EPA
(2000)
6 – 9 1500 - - - 2 0.1 50 1000 250 50
ND = not detected (< 0.001); AS = Awutu Senya; CT = Central Tongu,; AY = Ayensuano
University of Ghana http://ugspace.ug.edu.gh
61
4.2.1 Relationship among Parameters
The correlation matrix among the various effluent quality parameters are shown in
Table 4.23. There was a strong direct correlation between pH and EC (r = 0.704), pH
and TDS (r = 0.608), and COD and TSS (r = 0.576). However, COD and EC showed
a strong inverse relationship (r = -0.702). COD and pH showed a very weak inverse
relationship (r = -0.143). There also existed no relationship between BOD and TDS (r
= -0.028)
Table 4 23: Correlation Matrix of the Effluent Quality Parameters Measured
TDS TSS BOD COD pH EC
TDS
TSS -0.447
BOD -0.028 0.089
COD -0.252 0.576 -0.186
pH 0.608 -0.186 -0.231 -0.143
EC 0.499 -0.481 -0.120 -0.702 0.704
4.3 Fermentation of Effluent with Saccharomyces cerevisiae
4.3.1 Ethanol Yield
Amount of ethanol produced (in the three yeast quantities used) increased
progressively as fermentation duration increased to 48 hours (Figure 4.1). Optimum
ethanol concentrations for the different yeast concentrations used were obtained at 48
hours. Afterwards, a gradual reduction was observed, with yeast at 0.4%w/v
plateauing, indicating inability for further generation of ethanol. Optimum ethanol
concentration obtained in yeast concentrations of 0.2%w/v, 0.4%w/v and 0.6%w/v
were 2.77%w/v, 2.85%w/v and 3.25%w/v respectively. The amounts of ethanol
produced in yeast (at 0.6%w/v and 0.4%w/v) at all given periods were higher than
University of Ghana http://ugspace.ug.edu.gh
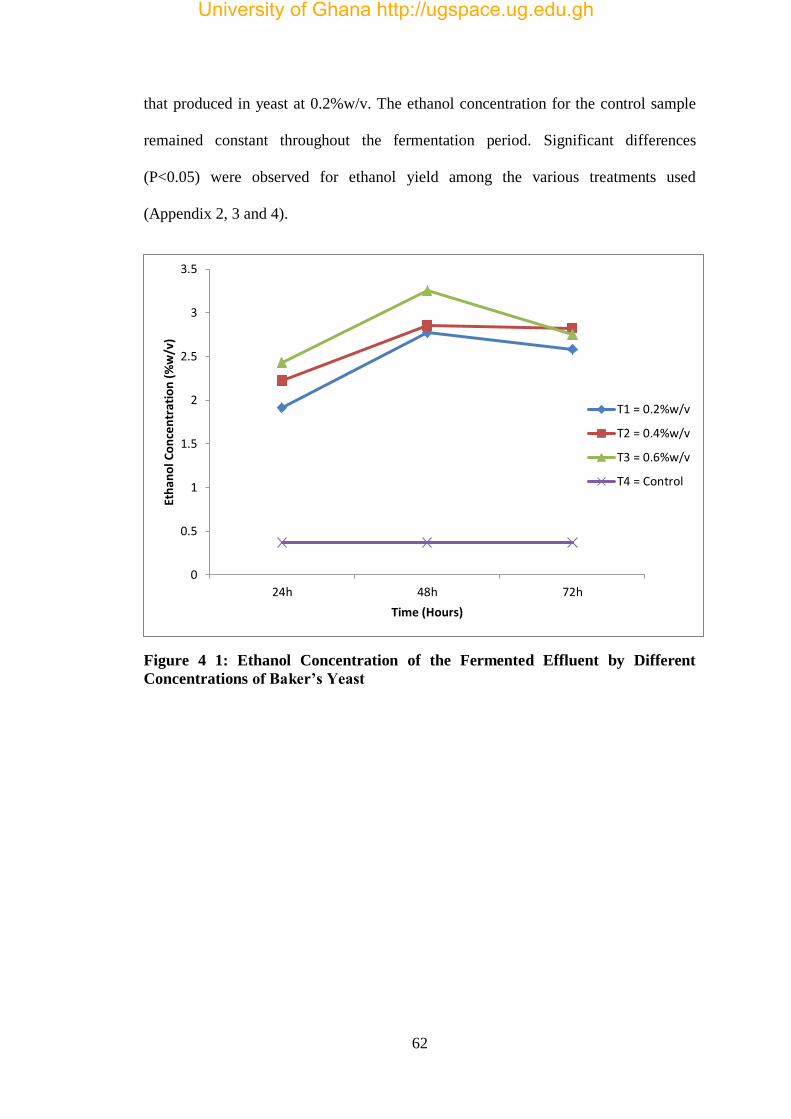
62
that produced in yeast at 0.2%w/v. The ethanol concentration for the control sample
remained constant throughout the fermentation period. Significant differences
(P<0.05) were observed for ethanol yield among the various treatments used
(Appendix 2, 3 and 4).
Figure 4 1: Ethanol Concentration of the Fermented Effluent by Different
Concentrations of Baker’s Yeast
0
0.5
1
1.5
2
2.5
3
3.5
24h 48h 72h
Eth
ano
l Co
nce
ntr
atio
n (
%w
/v)
Time (Hours)
T1 = 0.2%w/v
T2 = 0.4%w/v
T3 = 0.6%w/v
T4 = Control
University of Ghana http://ugspace.ug.edu.gh
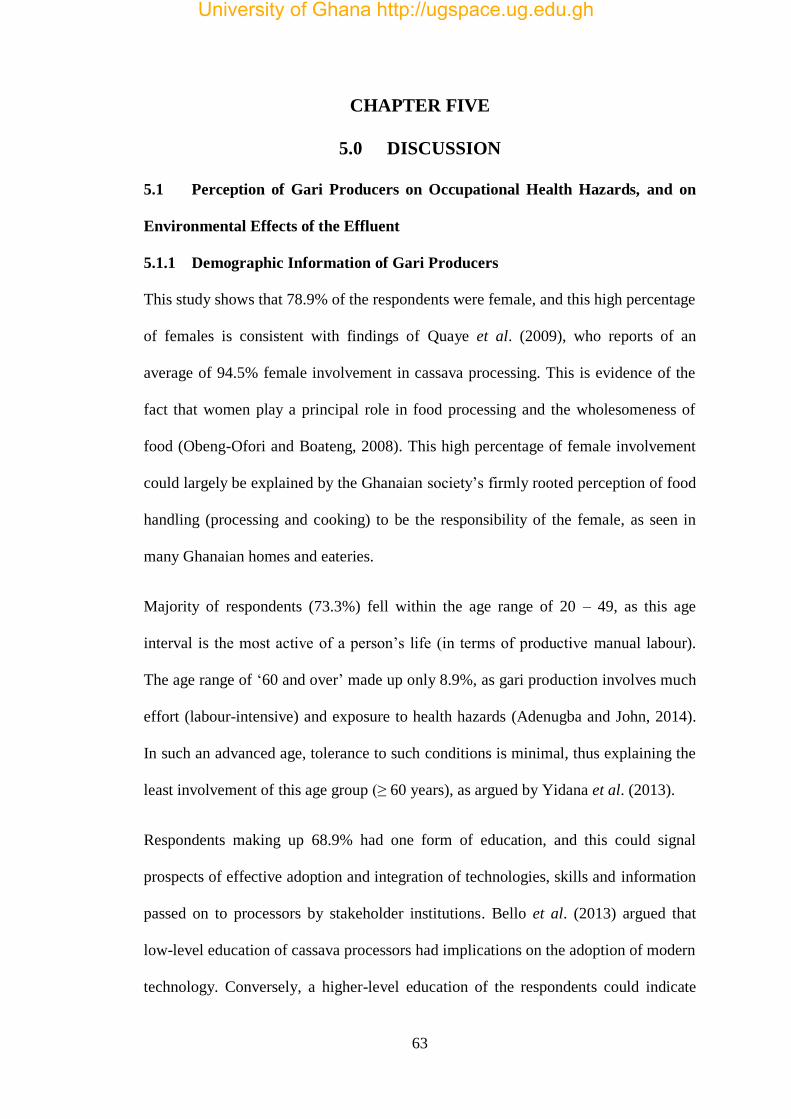
63
CHAPTER FIVE
5.0 DISCUSSION
5.1 Perception of Gari Producers on Occupational Health Hazards, and on
Environmental Effects of the Effluent
5.1.1 Demographic Information of Gari Producers
This study shows that 78.9% of the respondents were female, and this high percentage
of females is consistent with findings of Quaye et al. (2009), who reports of an
average of 94.5% female involvement in cassava processing. This is evidence of the
fact that women play a principal role in food processing and the wholesomeness of
food (Obeng-Ofori and Boateng, 2008). This high percentage of female involvement
could largely be explained by the Ghanaian society’s firmly rooted perception of food
handling (processing and cooking) to be the responsibility of the female, as seen in
many Ghanaian homes and eateries.
Majority of respondents (73.3%) fell within the age range of 20 – 49, as this age
interval is the most active of a person’s life (in terms of productive manual labour).
The age range of ‘60 and over’ made up only 8.9%, as gari production involves much
effort (labour-intensive) and exposure to health hazards (Adenugba and John, 2014).
In such an advanced age, tolerance to such conditions is minimal, thus explaining the
least involvement of this age group (≥ 60 years), as argued by Yidana et al. (2013).
Respondents making up 68.9% had one form of education, and this could signal
prospects of effective adoption and integration of technologies, skills and information
passed on to processors by stakeholder institutions. Bello et al. (2013) argued that
low-level education of cassava processors had implications on the adoption of modern
technology. Conversely, a higher-level education of the respondents could indicate
University of Ghana http://ugspace.ug.edu.gh
64
likely ease of understanding information laden with much technicality; as 10% of
respondents had senior high and tertiary education. Though, not high a percentage
(10%), this ‘high-level’ educated group could serve as focal points in the
dissemination of information to individuals of the lesser educational levels.
The gari producers make use of livelihood diversification options which ensure that
they are able to generate multiple streams of income to sustain themselves and
contribute much better to the economic capital of the household, as 91.1% of
respondents have other occupations other than gari production. From the interview
session with the processors, several of them were involved in two or more economic
activities other than gari production.
5.1.2 Gari Production and Occupational Health Hazards
5.1.2.1 Training on Occupational Health Hazards
Only 5.6% had ever received training relating to managing occupation health hazards.
This small percentage is very unfortunate considering the effects gari production can
have on the health of processors. This indicates that the stakeholder institutions have
not given much attention or effort towards addressing issues of Occupational Safety
and Health (OSH), through which processors would be equipped to safeguard against
health hazards. Comparatively, much effort has been geared towards equipping
farmers and processors with improved cassava varieties so as to maximize their
outputs and profits (as with the Root and Tuber Improvement Programme [RTIP])
(Quaye et al., 2009), while issues of Occupational Safety and Health seem
marginalized.
University of Ghana http://ugspace.ug.edu.gh
65
5.1.2.2 Measures Adopted by Gari Producers against Occupational Health
Hazards
The diverse responses given by the processors concerning measures they employ to
prevent or minimize the occurrence of health hazards points to the fact that, gari
producers are aware of some dangers they are exposed to. The high percentages of
respondents with ‘no measures’ in minimizing the health hazards is indicative of the
view that, little has been done by stakeholder institutions in disseminating appropriate
information aimed at mitigating the health hazards. The efforts of the processors
aimed at addressing such hazardous conditions cannot go without recognition. The
processors in their own small ways have been pragmatic, and made attempts at
managing some of these occupational health hazards (such as burns, cuts and
inhalation of smoke). They attested to these measures as being effective in at least
minimizing the intensity of the hazards they (the measures) were meant for. The
response of a considerable number of respondents interviewed identified ‘caution and
attentiveness’ as a popular measure in preventing or minimizing the health hazards,
and this is consistent with the findings of Adenugba and John (2014). Adenugba and
John (2014) reports that, gari producers attributed some hazards (such as cuts) to
‘faulty’ attitude to work; and further concluded that; careful attitude to work (gari
production) was the best known way for reducing hazards that were inherent in the
work design.
5.1.2.3 Awareness of Protective Clothing in Gari Production
Majority of respondents (68.9%) were not aware of protective clothing, and this goes
to support the argument that little attention has been given to issues of Occupational
Safety and Health by stakeholders.
University of Ghana http://ugspace.ug.edu.gh
66
5.1.2.4 Factors Influencing Processors’ Awareness of Protective Clothing
Formal education had a positive significant effect (p<0.01) on processors’ awareness
of protective clothing. This may be attributed to the fact that, the educated processors
are likely to have a wider knowledge base, and are better placed towards acquiring
new information.
Consideration of gari production to be hazardous, and visit to a health facility in
relation to a condition sustained at work also had a positive significant relationship
(p<0.01) with processors awareness of protective clothing. This may be due to the fact
that processors who find themselves in such situations would become aware of
protective clothing (in an attempt to mitigate their predicaments).
Training received by processors on occupational health hazards had a positive
significant relationship (p<0.01) with processors awareness of protective clothing.
This could be due to the fact that such training programmes have a high likelihood to
make mention of protective clothing that may be utilized in mitigating some health
hazards.
5.1.2.5 Usage of Protective Clothing in Gari Production
Respondents attributed the ‘less often’ usage of the long sleeve shirts to considerable
discomfort. Issues of high atmospheric temperature coupled with intense heat
emanating from furnace, hindered the frequent usage of this improvised measure
(same for the overall coat proper). Usage of the long sleeve shirts is an attempt to
mitigate the skin irritations that some processors experience when cyanide-laden
cassava mash comes in contact with the skin, and also against burns on the forearms
that could occur during the frying stage. However, the excuse for its infrequent usage
cannot be disregarded. Ghana, being in the Tropics, experiences high intensity of
sunlight, hot weather with a high degree of humidity. Lucas et al. (2014) reported that
University of Ghana http://ugspace.ug.edu.gh
67
occupational contexts that involve hot and humid climatic conditions, heavy physical
workloads and/or protective clothing create a strenuous and potentially dangerous
thermal load for the worker. Hot and humid climatic conditions create a thermal heat
extreme as heat loss from the body to the environment becomes increasingly difficult
(Lucas et al., 2014). As noted by Bishop et al. (2013), thermal comfort is a key issue
in the use of protective clothing. This conceivably explains the low usage of
protective clothing recorded in the various districts.
5.1.2.6 Visit to Health Facility for Health Condition Sustained During Gari
Production
A considerable percentage (43.3%) of respondents had visited a health facility at a
point in time in relation to a health condition sustained at work, with most of these
conditions being severe. This considerable percentage and the nature of their
predicaments further confirm the hazardous nature of gari production, already pointed
out by the processors themselves.
5.1.3 Respondents Perception about the Effects of the Effluent on the
Environment
The various effects and changes to the environment as reported by the respondents
(concerning the discharge of the untreated effluent) points to the fact that the
generated effluent is harmful to the environment, and also, the gari producers are
aware of some dangers posed to the environment. Some effects reported by
respondents were supported by quality parameters measured in the effluent. Foul
odour was explained by the high values of BOD, COD and TSS in the effluent.
‘Destruction of vegetation’ and ‘inability of receiving soil to support plant growth’
were also explained by the low pH and high values of TDS recorded in the effluent.
University of Ghana http://ugspace.ug.edu.gh
68
5.1.4 Mitigation Options for the Cassava-Mill Effluent
All respondents (100%) were not aware of treatment options for the wastewater. This,
coupled with the fact that majority of respondents (80%) discharge the (untreated)
effluent into the environment, makes the situation a disturbing one, considering the
numerous gari or cassava processing activities all over Ghana and the consequential
environmental effects. The 20% of respondents who made use of the effluent were all
located in the Central Tongu District, and this gives an indication that usage of the
generated effluent may not be widespread in the Ghanaian cassava processing
industry. Several of the processors were engaged in farming, and have been able to
harness the vegetation-destructive potential of the effluent to their advantage. They
employed it in weed control on their farm lands. The effluent is mixed in its raw form
with commercially-sold inorganic weedicides, and applied on the farm lands. This
practice was only reported, and is considerably widespread in the Central Tongu
District, with 40% of the Central Tongu respondents making use of this technology.
The use of this mixture ensures quicker destruction of weeds and lengthier periods for
re-emergence. A total of 60.1% of respondents were aware of value added products
that could be derived from the effluent. This statistic consists of respondents that keep
the effluent for later usage and those that always discharge their effluent (but are
aware of its likely uses). This is indicative of a majority of processors being
knowledgeable of value added options that could be derived from the cassava
effluent. The ‘low-level’ or ‘low-intensity’ execution of the known value addition
alternatives by the respondents could either be; a lack of drive to invest money and
effort, or an oblivion of the extent of possible income that could be derived from
bringing value to the waste. The value-added products mentioned by the respondents
(Table 4.18; Table 4.20) do not require machinery or sophisticated technology in
University of Ghana http://ugspace.ug.edu.gh
69
producing them, thus this possibility (sophisticated technology) is ruled out as a likely
reason for the ‘low-intensity’ execution (of adding value to the effluent) by
respondents.
5.1.4.1 Factors Influencing Processors’ Decision to Keep Effluent for Later Use
The study showed that location of respondents had a positive statistically significant
relationship (p<0.05) with processors decision to keep effluent for later use. This was
the case, as respondents from only Central Tongu were identified to make use of the
cassava effluent.
Length (in years) of gari production also showed a positive significant effect (p<0.05)
on decision to make use of the effluent. With lengthier years in a trade, one gets to
develop a deep knowledge and understanding of various issues related to his/her
profession, and as such, processors with long years of gari production are much likely
to be aware of possible uses for the effluent, which is likely to influence their decision
to keep the generated effluent for later usage.
Observance of environmental effects of the untreated effluent, and the awareness of
value addition options for the effluent both showed positive significant effects
(p<0.05) on the decision to keep effluent for later use. With the observance of
environmental hazards associated with the discharge of the untreated effluent,
processors may likely make attempts to mitigate such hazards. One important way of
doing this, is to avoid the discharge of the untreated effluent. By so doing, processors
may have identified ways of adding value to the effluent. With knowledge of possible
uses for the effluent, processors are very much likely to exploit such knowledge,
hence the positive significant relationship (p<0.05) between awareness of value
addition options for the effluent and processors’ decision to make use of the effluent.
University of Ghana http://ugspace.ug.edu.gh
70
5.2 Quality of the Cassava Effluent
Several physico-chemical parameters measured in the effluent samples were outside
permissible limits set by the EPA (EPA, 2000). The pH values, which were very
acidic, were lower or outside what had been prescribed (6 – 9) by EPA. The very high
wastewater quality parameters indicate that cassava wastewater has a strong potential
of being deleterious to vegetation and aquatic life.
5.2.1 Biochemical Oxygen Demand and Chemical Oxygen Demand
BOD and COD are important parameters used in examining waste water quality (as
they indicate the organic load present in the liquid waste). Reynolds et al. (2002)
defines BOD as the level of organic content in wastewater measured by the demand
for oxygen that can be utilized by living organisms present in the wastewater, and
Spellman (2003) explains that COD measures the amount of oxidizable matter present
in wastewater. The degradation of such constituents (oxidizable matter) utilizes
dissolved oxygen in the effluent causing its (dissolved oxygen) depletion, and the
generation of foul odour (Monney et al., 2013). Such foul odour was confirmed by
respondents during the survey.
The very high levels COD and BOD found in the cassava waste water could be due to
the high composition of organic substances present in the wastewater. BOD values
obtained are similar to that reported by Arguedas and Cooke, (1982). They recorded
BOD values of 25000 – 50000 mg/L in farinha (de mandioca) wastewater. Farinha de
mandioca is a cassava product derived from processes same as gari (but with a shorter
fermentation time); with arguments that freed slaves from Brazil, with their
knowledge in farinha making, introduced African folks to gari production (Wenham,
1995). Plevin and Donelly (2004) also recorded very high BOD value of 16000 mg/L,
but slightly lower than that recorded in this study. Howeler et al. (2000) and Plevin
University of Ghana http://ugspace.ug.edu.gh
71
and Donelly (2004) also reported high COD values of 15000 – 30000 mg/L and
32000 mg/L, respectively, in cassava waste water; but these COD values were slightly
lower than that obtained in the study. The very high levels of BOD and COD (of the
effluent) when introduced into receiving water bodies could have dire effects on life
present in there. BOD present in the receiving water would increase (Arimoro et al.,
2008) and oxygen present in the water body would be depleted, and life forms present
may die. Large amounts of oxygen would be needed to degrade the high content of
organic compounds present, which would result in the oxygen depletion.
5.2.2 pH of Effluent
The pH of wastewater is also important in determining water quality, as it affects
chemical reactions that possibly occur. The pH values of all samples were acidic, with
a mean value of 4.02. The pH values obtained in this study are consistent with the
findings of Plevin and Donelly (2004), Olorunfemi et al. (2008), and Olorunfemi and
Lolodi (2011); who recorded low pH values of 3.8 – 4.2, 4.6, and 4.0 – 4.6,
respectively for cassava effluents.
The low effluent pH recorded in this study could alter or increase the acidity of
receiving soils, and of receiving water bodies (Arimoro et al., 2008). Though plants
vary in their response and tolerance to soil acidity, acidic soils restrict root growth and
facilitate stunting in plants, which leads to decrease in growth and yields (MSU,
2014). With low pH in soils, there is low availability of elements such as calcium,
magnesium and phosphorus; and increased solubility of aluminum (Al), iron (Fe) and
boron (B) (Kennelly et al., 2012). High levels of these nutrients (Al, Fe and B) in low
pH soils can induce toxicity symptoms in plants (Kennelly et al., 2012). Effluent pH
could thus explain the destruction of vegetation, as indicated by respondents.
University of Ghana http://ugspace.ug.edu.gh
72
The pH of water bodies determines solubility and biological availability of heavy
metals (such as lead and copper) (WSDOE, 1994). Acidity of receiving surface water
may possibly be increased with the discharge of this acidic effluent. Heavy metals
tend to be more soluble (become toxic) at lower pH (WSDOE, 1994) and this could
be deleterious to aquatic life.
Hydrogen cyanide (HCN) is widely speculated to be responsible for such low pH in
gari wastewater, but that may not be the case. Hydrogen cyanide is known to be
highly volatile (Howeler et al., 2000; Ogundola and Liasu, 2007), and evaporates
around room temperature of 25.6oC. It is also a weak acid, with pka of 9.2. With the
high volatility and weak acidity of HCN, HCN may not be deserving of the scare
associated with its presence in cassava wastewater. Though, cyanide is highly toxic
and present in cassava tubers, it cannot possibly be responsible for low pH recorded in
the wastewater.
During the fermentation process in the cassava mash (for gari making), activities of
the bacterium Corynebacteria manihot results in the production of organic acids
(lactic and formic acids) and the lowering of substrate pH (Nweke and Ezumah,
1988). The acidic condition present stimulates the growth of Geotrichum candida,
which causes further acidification (Nweke and Ezumah, 1988). Okafor (1998) also
reported the cassava effluent to contain a large amount of lactic acid. Low pH present
may largely be as a result of these microbial activities (during the fermentation of the
cassava mash) and not HCN.
5.2.3 Electrical Conductivity (EC)
Electrical conductivity shows the ability of water to conduct electric current, and it
relates to the amount of dissolved minerals or ions in the water. The high conductivity
recorded in the effluent samples may be associated with high concentrations of
University of Ghana http://ugspace.ug.edu.gh
73
dissolved ions (Agyemang et al., 2013). This is further confirmed by the high values
of TDS recorded in the samples. This has the potential of altering the electrical
conductivity of receiving surface water, which may lead to salinity problems and
eutrophication (GWA, 2009).
The EC values recorded for this study, however, are in contrast to that reported by
Bengtsson and Triet (1994); as Bengtsson and Triet (1994) recorded low EC values of
1150 – 1410 µS/cm for cassava wastewater.
5.2.4 Total Dissolved Solids (TDS)
TDS is a measure of organic matter, inorganic salts and other dissolved materials in
water. TDS directly relates to purity of water, since it accounts for anything present in
water other than water molecules (H2O) and suspended solids. The high TDS values
recorded could be due to high levels of dissolved organic and inorganic molecules and
ions present in the effluent (Sarkodie et al., 2014). Rauscher (2015) notes that
dissolved minerals cannot be removed by traditional filtration, but by reverse osmosis
or distillation. Treatment of the high TDS values recorded would be cumbersome and
expensive. In receiving soils, plant roots would have difficulty taking up nutrients
(Rauscher, 2015), because of the very high concentrations of dissolved solids. This
explains (in part) the vegetation-destructive nature of the effluent as reported by the
gari producers.
Plevin and Donelly (2004) also reported very high TDS value of 14,500 mg/L (in
cassava wastewater), but relatively lower than the values recorded in this study.
5.2.5 Total Suspended Solids (TSS)
The TSS values recorded were very high and could have undesired effects on aquatic
ecosystem of the receiving water body. The discharge of waste water with high
University of Ghana http://ugspace.ug.edu.gh
74
amounts of TSS can cause sludge deposition and anaerobic conditions in receiving
water bodies (Hodgson, 2000). Weiner et al. (2003) indicates that the decomposition
of the organic composition of TSS results in depletion of dissolved oxygen and
unpleasant odour, as this was confirmed by respondents of the survey. The high
organic content of the cassava wastewater if introduced into surface water has a high
tendency of inducing eutrophication.
Though TSS values recorded in this study were above EPA permissible limits, this
study’s TSS values are in large contrast to that reported by Plevin & Donelly (2004).
Plevin & Donelly (2004) reported TSS value of 15000 mg/L in cassava wastewater,
and this value is relatively higher than that recorded in this study.
5.2.6 Phosphorus
Though phosphorus is a nutrient of great importance to plants, Spellman (2003) and
Metcalf and Eddy (2003) indicate that phosphorus in surface water acts as a fertilizer,
promoting the undesirable growth of algae populations. With the decomposition of
phosphorus in receiving surface water, dissolved oxygen levels would decrease
leading to a deleterious effect on fishes and other aquatic life species (Monney et al.,
2013). Since phosphorus measured (across all clusters and districts) were below the
EPA maximum limit of 2 mg/L, this could explain why the above mentioned issue of
‘algae growth on surface water’ was not reported by respondents.
5.2.7 Nitrate
In excess quantities, nitrate leads to eutrophication in freshwaters (Horne, 1995), and
excessive nitrate, just like phosphorus, stimulates growth in algae. But from the
nitrate figures obtained in this study, and unlike the other eutrophication-inducing
parameters talked about earlier, nitrate concentrations were very low. Mean nitrate
University of Ghana http://ugspace.ug.edu.gh
75
concentration of 0.07 mg/L recorded, was lower than EPA maximum limits. This low
nitrate concentration in the effluent could be dependent on the low crude protein
content (with a fraction being stored as nitrate) of the cassava tuber (Montagnac et al.,
2009).
5.2.8 Calcium and Magnesium
Calcium and magnesium are the two elements responsible for hardness in water
(USGS, 2015). These two elements are naturally present in water. Olorunfemi et al.
(2008) and Olorunfemi and Lolodi (2011) reported calcium values of 62.25 mg/L and
94.30 mg/L, respectively in cassava effluent, but these values are relatively lower than
that recorded in the study. Olorunfemi et al. (2008) and Olorunfemi and Lolodi
(2011) further reported magnesium values of 25.50 mg/L and 110.90 mg/L,
respectively, but both values were also relatively lower than magnesium values
recorded in the study.
Mean values of 294.3 mg/L and 610.4 mg/L for calcium and magnesium respectively
were recorded. These figures are relatively high, and discharge of the wastewater into
surface water may alter the water quality (in regards to hardness). As a result, such
water may become unsuitable for domestic use. Calcium and magnesium (particularly
calcium) form nearly insoluble salts with detergent and soap, thereby inhibiting their
cleansing ability. There are no EPA limits for calcium and magnesium, possibly
because toxicity induced by magnesium and calcium has not been recorded.
5.3 Fermentation of Effluent with Saccharomyces cerevisiae
The fermentation procedure was designed to keep all steps involved simplistic, so that
with its success, gari producers and other rural folks (who could easily come by the
effluent) can find ease with its adoption. All yeast treatments used achieved maximum
University of Ghana http://ugspace.ug.edu.gh
76
ethanol concentrations at 48 hours, after which a gradual reduction was observed.
These preliminary data suggest that baker’s yeast has the potential for ethanol
production from cassava-mill (gari) effluent. The success of Saccharomyces
cerevisiae, and subsequent rise in ethanol can be accredited to the ability of the yeast
to utilize simple sugars, though they can metabolize various carbon substrates
(Bekatorou et al., 2006), in the presence of favourable broth conditions, and in the
absence of other microbes. The relatively low concentration of ethanol obtained is
possibly due to the non-optimized approach used for the fermentation. Optimization
techniques would have to be developed to increase production of ethanol from the
cassava effluent. Since the effluents are readily available and in large quantities,
cassava wastewater could possibly be a cheap source of generating ethanol.
The 0.37%w/v ethanol observed in the control sample may likely have been generated
during the fermentation and dewatering of the cassava mash. Sterilization of the
control samples resulted in no additional ethanol being produced. This was because
the control became void of microbes (after sterilization in an autoclave for 15 minutes
at 121oC).
University of Ghana http://ugspace.ug.edu.gh
77
CHAPTER SIX
6.0 CONCLUSION AND RECOMMENDATION
6.1 CONCLUSION
Based on the study carried out the following conclusions have been made:
6.1.1 Perception of Gari Producers on Occupational Health Hazards, and on
Environmental Effects of the Effluent
The gari production industry in Ghana is highly dominated by women. Due to the
labour-intensive nature and exposure to distressing occupational hazards, involvement
of elderly folks (above 60 years) is low. Traditional gari production is hazardous to
the health of the processors, and the processors are much aware of this. Extent of
training and education on occupational safety and health is very low Efforts by
stakeholders in addressing these work-related predicaments are apparently absent.
Usage of protective clothing by processors in safeguarding against these hazards is
very low.
The gari producers are aware of various effects that the generated cassava-mill
effluent has on their immediate environment. Unfortunately, processors are unaware
of treatment (detoxification) options for the generated effluent. Though processors
may be aware of various uses for the effluent, making use of this waste water, or
adding value to it is not widespread in the Ghanaian gari production industry.
Processors have managed to harness the vegetation-destructive potential of the liquid
waste, by employing it on their farm lands for the control of weeds.
6.1.2 Quality of the Cassava Effluent
Some effects of the effluent on the environment (as reported by the gari producers)
were confirmed by the very high levels of some quality parameters measured in the
University of Ghana http://ugspace.ug.edu.gh
78
effluent, such as TDS, BOD and COD. Foul odour perceived by respondents was
explained by the very high levels of BOD, COD and TSS. Destruction of vegetation
observed by the respondents was also explained by the low pH and high TDS values
recorded in the effluent. Effluents generated from gari production, according to EPA
standards are not safe for discharge into the environment. The cassava wastewater,
from the quality parameters determined, is toxic to the environment, and requires
appropriate treatment before discharge.
High BOD and COD figures recorded for the effluent samples are likely factors
responsible for the foul odour (emanating from the effluent) perceived by
respondents. BOD and COD in receiving water may increase, leading to depletion of
oxygen present in the water body and the likely death of life forms present. Low pH
of the effluent may increase acidity of receiving soils, and this could possibly be
responsible for the destruction of vegetation as reported by respondents, as soil
nutrients become unavailable for plant uptake at low pH. Possible increase in pH of
receiving surface water may lead to toxicity by heavy metals, and this is deleterious to
aquatic life. High EC recorded for the effluent samples could also lead to
eutrophication and salinity problems in receiving surface water. In receiving soils,
plant roots may have difficulty taking up nutrients, due to a possible increase in TDS.
High TDS value of the effluent is a likely contributor to the vegetation-destruction
ability of the effluent. Decomposition of the organic components of the high TSS
(recorded for the effluents) could be partly responsible for the foul odour of the
effluents, as noted by respondents. The cassava effluents, with their high TSS, also
have a tendency to induce eutrophication in receiving water.
University of Ghana http://ugspace.ug.edu.gh
79
6.1.3 Fermentation of Effluent with Saccharomyces cerevisiae
Saccharomyces cerevisiae exhibited the potential to metabolize the effluent to
generate ethanol. With the use of a non-optimized fermentation procedure, ethanol
concentration produced was relatively low. Significant differences (p<0.05) were
observed among the amounts of baker’s yeast used for the fermentation, with the
highest concentration of yeast (0.6%w/v) generating the highest ethanol concentration
(3.25%w/v) at 48 hours.
6.2 RECOMMENDATIONS
Appropriate stakeholder institutions should invest efforts and resources into educating
and training gari producers on Occupational Safety and Health (OSH).
Gari producers need to move from makeshift sheds, under which they usually work,
to large working bays with good aeration. Gari producers should take advantage of
improved facilities such as stoves that make use of chimneys, and long insulated
spatulas (to keep the processor at a distance from the pan). Appropriate workspace
structure and safe conditions for work cannot be overemphasized.
Research should be conducted on the synergistic impact that cassava-mill wastewater
has with commercially available inorganic weedicides, in weed control.
The Water Research Institute (WRI) of the CSIR alongside the Ghana Environmental
Protection Authority (EPA) should develop guidelines relating to the treatment and
discharge of the cassava wastewater.
Optimized fermentation approaches need to be exploited in enhancing ethanol
production from the cassava effluent.
University of Ghana http://ugspace.ug.edu.gh
80
REFERENCES
Adekunle, I. M., Arowolo, T. A., Omoniyi, I. T., & Olubambi, O. T. (2007). Risk
Assessment in Nile Tilapia (Oreochromis niloticus) and African Mud Catfish
(Clarias gariepinus) Exposed to Cassava Effluent. Chemistry and Ecology, 23(5),
383–392.
Adenugba, A. A., & John, P. (2014). Hazardous Conditions Of Women In Gari
Processing Industry In Ibadan , South West , Nigeria. Journal of Educational
and Social Research, 4(3), 511–521. doi:10.5901/jesr.2014.v4n3p511
Adeyemo, O. K. (2005). Haematological and Histopathological Effects of Cassava
Mill Effluent in Clarias gariepinus. African Journal of Biomedical Research, 8,
179–183.
Agyemang, E. O., Awuah, E., Darkwah, L., Arthur, R., & Osei, G. (2013). Water
Quality Assessment of a Wastewater Treatment Plant in a Ghanaian Beverage
Industry. International Journal of Water Resources and Environmental
Engineering, 5(5), 272–279.
APHA-AWWA-WEF. (1998). Standard Methods for the Examination of Water and
Wastewater (20th ed.). New York, USA: American Public Health Association.
Arguedas, P., & Cooke, R. D. (1982). Residual Cyanide Concentration During the
Extraction of Cassava Starch. Food Technology, 17, 251–261.
Arimoro, F. O., Iwegbue, C. M. A., & Enemudo, B. O. (2008). Effects of Cassava
Effluent on Benthic Macroinvertebrate Assemblages in a Tropical Stream in
Southern Nigeria. Acta Zoologica Lituanica, 18(2), 147–156.
doi:10.2478/v10043-008-0021-0
Bani, R. J. (2008). Processing and Preservation of Agricultural Commodities. In E.
W. Cornelius & D. Obeng-Ofori (Eds.), Postharvest Science and Technology
(pp. 322–373). Accra: Smartline Publishing Limited.
Bani, R. J., & Josiah, M. N. (2008). Harvesting, Handling, Transportation and Storage
of Agricultural Produce. In E. W. Cornelius & D. Obeng-Ofori (Eds.),
Postharvest Science and Technology (pp. 257–321). Accra: Smartline Publishing
Limited.
Bekatorou, A., Psarianos, C., & Koutinas, A. A. (2006). Production of Food Grade
Yeasts. Food Technology and Biotechnology, 44(3), 407–415.
Bello, M., Ejembi, E. P., Allu, E., & Anzaku, T. A. K. (2013). Rural Women
Processing Cassava in Doma Local Government Area of Central Nigeria Deserve
Technical Assistance. Research on Humanities and Social Sciences, 3(10), 105–
112.
University of Ghana http://ugspace.ug.edu.gh
81
Bengtsson, B.-E., & Triet, T. (1994). Tapioca-Starch Wastewater Toxicity
Characterized by Microtox and Duckweed Tests. Ambio, 23(8), 473–477.
Retrieved from http://www.jstor.org/stable/4314263
Bishop, P. A., Balilonis, G., Davis, J. K., & Zhang, Y. (2013). Ergonomics and
Comfort in Protective and Sport Clothing: A Brief Review. J Ergonomics.
doi:10.4172/2165-7556.S2-005
Bourdoux, P., Seghers, P., Mafuta, M., Vanderpas, J., Vanderpas-Rivera, M.,
Delange, F., & Ermans, A. M. (1982). Cassava Products: HCN Content and
Detoxification Process. In F. Delange, F. B. Iteke, & A. M. Ermans (Eds.),
Nutritional Factors Involved in the Goitrogenic Action of Cassava (pp. 51–58).
Ottawa, Canada: IDRC.
Bradbury, J. H., & Holloway, W. D. (1988). Chemistry of Tropical Root Crops:
Significance for Nutrition and Agriculture in the Pacific. Canberra: Australian
Centre fot International Agricultural Research.
Cardoso, A. P., Mirione, E., Ernesto, M., Massaza, F., Cliff, J., Rezaul Haque, M., &
Bradbury, J. H. (2005). Processing of cassava roots to remove cyanogens.
Journal of Food Composition and Analysis, 18(5), 451–460.
doi:10.1016/j.jfca.2004.04.002
CCOHS (Canadian Centre for Occupational Health and Safety). (2014). OSH
Answers Fact Sheets. Hot Environments - Health Effects and First Aid.
Retrieved July 9, 2015, from
http://www.ccohs.ca/oshanswers/phys_agents/heat_health.html
CDC (Centre for Disease Control and Prevention). (2013). Emergency Response and
Preparedness. Facts About Cyanide. Retrieved July 10, 2015, from
http://www.bt.cdc.gov/agent/cyanide/basics/facts.asp
Delange, F., Ekpechi, L. O., & Rosling, H. (1994). Cassava Cyanogenesis and Iodine
Deficiency Disorders. Acta Horticulturae, 375, 289–293.
Dziedzoave, N. (2008). Recent Developments in Cassava Processing, Utilisation and
Marketing in Ghana and Lessons Learned. In Expert Consultation Meeting.
University of Greenwich, UK.
EPA (Environmental Protection Agency). (2000). General Environmental Quality
Standards (Ghana). Regulations 2000.
EPA (Environmental Protection Agency). (2014). Functions of EPA. Retrieved July
25, 2015, from http://www.epa.gov.gh/web/index.php/about-us/functions-of-epa
FAO (Food and Agriculture Organization). (2013). Save and Grow: Cassava. A Guide
to Sustainable Production Intensification. Rome: Food and Agriculture
Organisation.
Ghosh, A. (2010). Mayo Clinic Internal Medicine Board Review. OUP USA.
University of Ghana http://ugspace.ug.edu.gh
82
GWA (Government of Western Australia). (2009). Surface Water Sampling Methods
and Analysis — Technical Appendices. Western Australia.
Hodgson, I. O. A. (2000). Treatment of Domestic Sewage at Akuse (Ghana). Water
SA, 26(3).
Horne, A. J. (1995). Nitrogen Removal from Waste Treatment Pond or Activated
Sludge Plant Effluents with Free Surface Wetlands. Water Science and
Technology, 31(12), 341–351.
Howeler, R. H., Oates, C. G., & Allem, A. C. (2000). Strategic Environmental
Assessment. An Assessment of the Impact of Cassava Production and Processing
on the Environment and Biodiversity. In C. Hershey (Ed.), Proceedings Of The
Validation Forum On The Global Cassava Development Strategy. Rome: Food
and Agriculture Organization and International Fund for Agricultural
Development.
IITA (International Institute of Tropical Agriculture). (1990). Cassava in Tropical
Africa. A Reference Manual. Ibadan, Nigeria: International Institute of Tropical
Agriculture.
IITA (International Institute of Tropical Agriculture). (2009). Cassava. Retrieved July
24, 2015, from http://www.iita.org/cassava
ISSER (Institute of Statistical, Social and Economic Research). (2007). The State of
the Ghanaian Economy in 2006. Accra. Cited by WAAPP (2009). West African
Agricultural Productivity Programme, Ghana. Baseline Survey Report.
Kennelly, M., O’Mara, J., Rivard, C., Miller, G. L., & Smith, D. (2012). Introduction
to Abiotic Disorders in Plants. doi:10.1094/PHI-I-2012-10-29-01
Kolawole, O. P., Agbetoye, L. A. S., & Ogunlowo, A. S. (2011). Evaluation of
Cassava Mash Dewatering Methods. Journal of Bioinformatics and Sequence
Analysis, 3(2), 23–30.
Lucas, R. A. I., Epstein, Y., & Kjellstrom, T. (2014). Excessive Occupational Heat
Exposure: A Significant Ergonomic Challenge and Health Risk for Current and
Future Workers. Extreme Physiology and Medicine, 3(14), 1–8.
Metcalf, E., & Eddy, H. (2003). Wastewater Engineering: Treatment and Reuse. (G.
Techobanoglous, F. L. Burton, & H. D. Stensel, Eds.)Wastewater Engineering,
Treatment, Disposal and Reuse. (4th ed.). New Delhi, India: Tata McGraw-Hill
Publishing Company Limited. Retrieved from
http://www.lavoisier.fr/notice/fr097556.html
Monney, I., Odai, S. N., Buamah, R., Awuah, E., & Nyenje, P. M. (2013).
Environmental Impacts of Wastewater from Urban Slums : Case Study - Old
Fadama , Accra. International Journal of Development and Sustainability, 2(2),
711–728.
University of Ghana http://ugspace.ug.edu.gh
83
Montagnac, J. A., Davis, C. R., & Tanumihardjo, S. A. (2009). Nutritional Value of
Cassava for Use as a Staple Food and Recent Advances for Improvement.
Comprehensive Reviews in Food Science and Food Safety, 8, 181–194.
doi:10.1111/j.1541-4337.2009.00077.x
MSU (Mississippi State University Extension Service). (2014). Corn in Mississippi.
Retrieved April 6, 2016, from http://msucares.com/crops/corn/corn_stunted.html
NRI (Natural Resource Institute). (1992). COSCA Phase 1 Processing Component
(No. 7). Ibadan, Nigeria.
Nweke, F. (2003). New Challenges in the Cassava Transformation in Nigeria and
Ghana. In Successes in African Agriculture. Pretoria.
Nweke, F. I., & Ezumah, H. C. (1988). Cassava in African Farming and Food
Systems: Implications for Use in Livestock Feeds. In S. K. Hahn, L. Reynolds, &
G. N. Egbunike (Eds.), Proceedings of the IITA/ILCA/University of Ibadan
Workshop on the Potential Utilization of Cassava as Livestock Feed in Africa.
Ibadan, Nigeria: International Institute of Tropical Agriculture.
NYSDOH (New York State Department of Health). (2013). Exposure to Smoke from
Fires. Retrieved July 6, 2015, from
https://www.health.ny.gov/environmental/outdoors/air/smoke_from_fire.htm
O’Hair, S. K. (1995). Cassava. Retrieved July 24, 2015, from
http://www.hort.purdue.edu/newcrop/cropfactsheets/cassava.html
Obeng-Ofori, D., & Boateng, B. A. (2008). Global Population Growth, Crop Losses
and Postharvest Technology. In E. W. Cornelius & D. Obeng-Ofori (Eds.),
Postharvest Science and Technology (pp. 1–46). Accra: Smartline Publishing
Limited.
Odunfa, S. A. (1985). African Fermented Foods. In B. J. B. Wood (Ed.),
Microbiology of Fermented Foods (2nd ed., pp. 155– 161). Amsterdam: Elsevier
Applied Science Publisher.
Ogundola, A. F., & Liasu, M. O. (2007). Herbicidal Effects of Effluent from
Processed Cassava on Growth Performances of Chromolaena odorata Weeds
Population. African Journal of Biotechnology, 6(6), 685–690.
Okafor, N. (1998). An Integrated Bio-system for the Disposal of Cassava Wastes. In
Internet Conference on Integrated Biosystems. Retrieved from
http://www.globetree.org/jackyfoo/icibs/okafor/paper.htm
Olorunfemi, D. I., Emoefe, E. O., & Okieimen, F. E. (2008). Effects of Cassava
Processing Effluent on Seedling Height, Biomass and Chlorophyll Content of
Some Cereals. Research Journal of Environmental Sciences, 2(3), 221–227.
Olorunfemi, D. I., & Lolodi, O. (2011). Effect of Cassava Processing Effluents on
Antioxidant Enzyme Activities in Allium Cepa L . Biokemistri, 23(2), 49–61.
University of Ghana http://ugspace.ug.edu.gh
84
Onyedineke, N. E., Odukoya, A. O., & Ofoegbu, P. U. (2010). Acute Toxicity Tests
of Cassava and Rubber Effluents on the Ostracoda Strandesia prava klie
(Crustacea, Ostracoda). Research Journal of Environmental Science, 4, 166–172.
Plevin, R., & Donelly, D. (2004). Converting Waste to Energy and Profit. Tapioca
Starch Power in Thailand. Renewable Energy World, (September-October), 74–
81.
Plucknett, D. L., Phillips, T. P., & Kagbo, R. B. (2000). A Global Development
Strategy for Cassava: Transforming a Traditional Tropical Root Crop.
Quaye, W., Yawson, I., Gayin, J., & Plahar, W. A. (2009). Economic Comparison of
Cassava Processing Methods in Some Selected Districts of Ghana , Africa.
Journal of Root Crops, 35(2), 211–218.
Rauscher, F. (2015). How pH & TDS Levels Affect Water Quality. Retrieved July 24,
2015, from http://maximumyield.com/how-ph-tds-levels-affect-water-quality/
Reynolds, J. P., Jeris, J. S., & Theodore, L. (2002). Handbook of Chemical and
Environmental Engineering Calculations. New York, USA: John Wiley and
Sons, Inc.
Rickard, J. E., & Coursey, D. G. (1981). Cassava Storage, Part 1: Storage of Fresh
Cassava Roots. Tropical Science, 23, 1–32.
Sarkodie, P. A., Agyapong, D., Larbi, G. O., & Owusu-Ansah, E. (2014). A
Comparative Study of the Quality of Wastewater from Tema Oil Refinery (TOR)
Against EPA Standards and its Effect on the Environment. Civil and
Environmental Research, 6(6), 85–92.
Spellman, R. F. (2003). Handbook of Water and Wastewater Treatment Plant
Operations. Florida, USA: Lewis Publishers, CRC Press Company.
USGS (United States Geological Survey). (2015). Water Hardness. Retrieved April 7,
2016, from http://water.usgs.gov/edu/hardness.html
WAAPP (West African Agricultural Productivity Programme). (2009). West African
Agricuktural Productivity Programme, Ghana. Baseline Survey Report.
WebMD. (2014). Smoke Inhalation. Retrieved July 6, 2015, from
http://www.webmd.com/lung/smoke_inhalation_treatment_firstaid.htm?print=tru
e
Weiner, R. F., Mathews, R., Pierce, J. J., & Vesilind, P. A. (2003). Environmental
Engineering. New York, USA: Butterworth Heinemann Publications.
Wenham, J. E. (1995). Post-Harvest Deterioration of Cassava: A Biotechnology
Perspective (No. 130). Rome.
University of Ghana http://ugspace.ug.edu.gh
85
WSDOE (Washington State Department of Ecology). (1994). A Citizen’s Guide to
Understanding and Monitoring Lakes and Streams. Retrieved July 23, 2015,
from
http://www.ecy.wa.gov/programs/wq/plants/management/joysmanual/ph.html
Yidana, J. A., Osei-Kwarteng, M., & Amadu, Y. (2013). The Impact of Cassava
Processing on the Livelihoods of Women Processors in Central Gonja District of
the Northern Region of Ghana. International Journal of Cassava and Potatoes
Research, 1(2), 10–13.
University of Ghana http://ugspace.ug.edu.gh
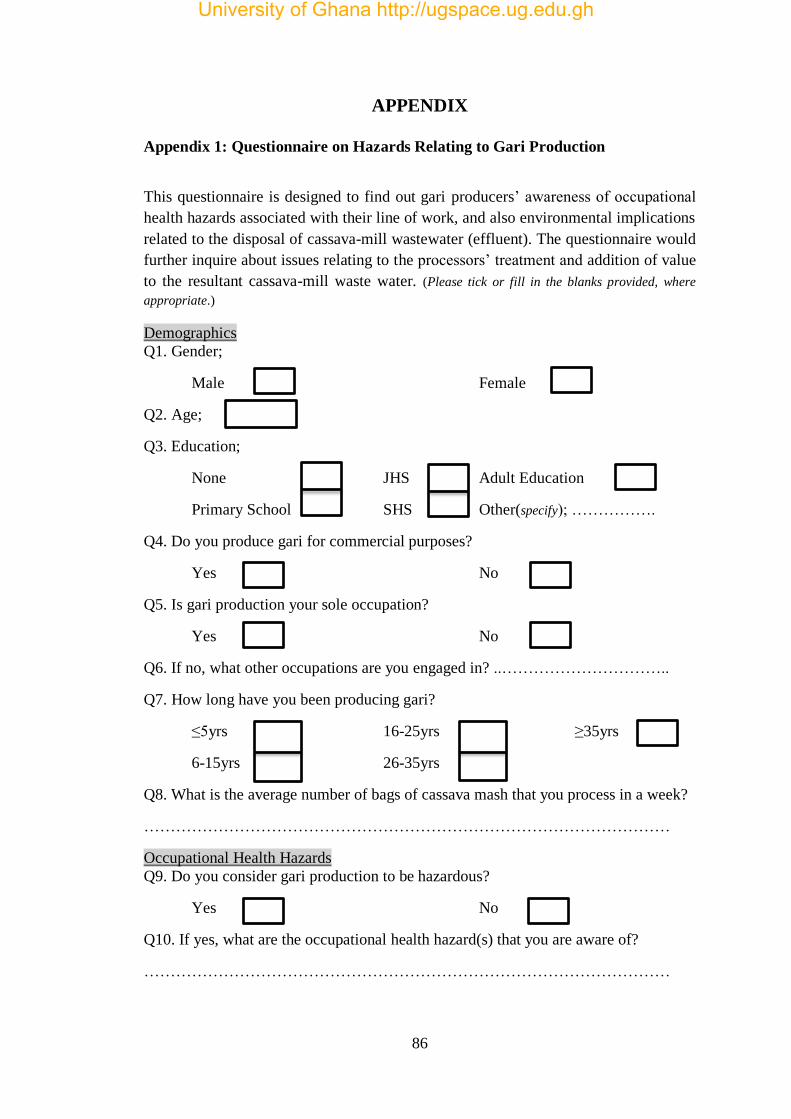
86
APPENDIX
Appendix 1: Questionnaire on Hazards Relating to Gari Production
This questionnaire is designed to find out gari producers’ awareness of occupational
health hazards associated with their line of work, and also environmental implications
related to the disposal of cassava-mill wastewater (effluent). The questionnaire would
further inquire about issues relating to the processors’ treatment and addition of value
to the resultant cassava-mill waste water. (Please tick or fill in the blanks provided, where
appropriate.)
Demographics
Q1. Gender;
Male Female
Q2. Age;
Q3. Education;
None JHS Adult Education
Primary School SHS Other(specify); …………….
Q4. Do you produce gari for commercial purposes?
Yes No
Q5. Is gari production your sole occupation?
Yes No
Q6. If no, what other occupations are you engaged in? ..…………………………..
Q7. How long have you been producing gari?
≤5yrs 16-25yrs ≥35yrs
6-15yrs 26-35yrs
Q8. What is the average number of bags of cassava mash that you process in a week?
………………………………………………………………………………………
Occupational Health Hazards
Q9. Do you consider gari production to be hazardous?
Yes No
Q10. If yes, what are the occupational health hazard(s) that you are aware of?
………………………………………………………………………………………
University of Ghana http://ugspace.ug.edu.gh
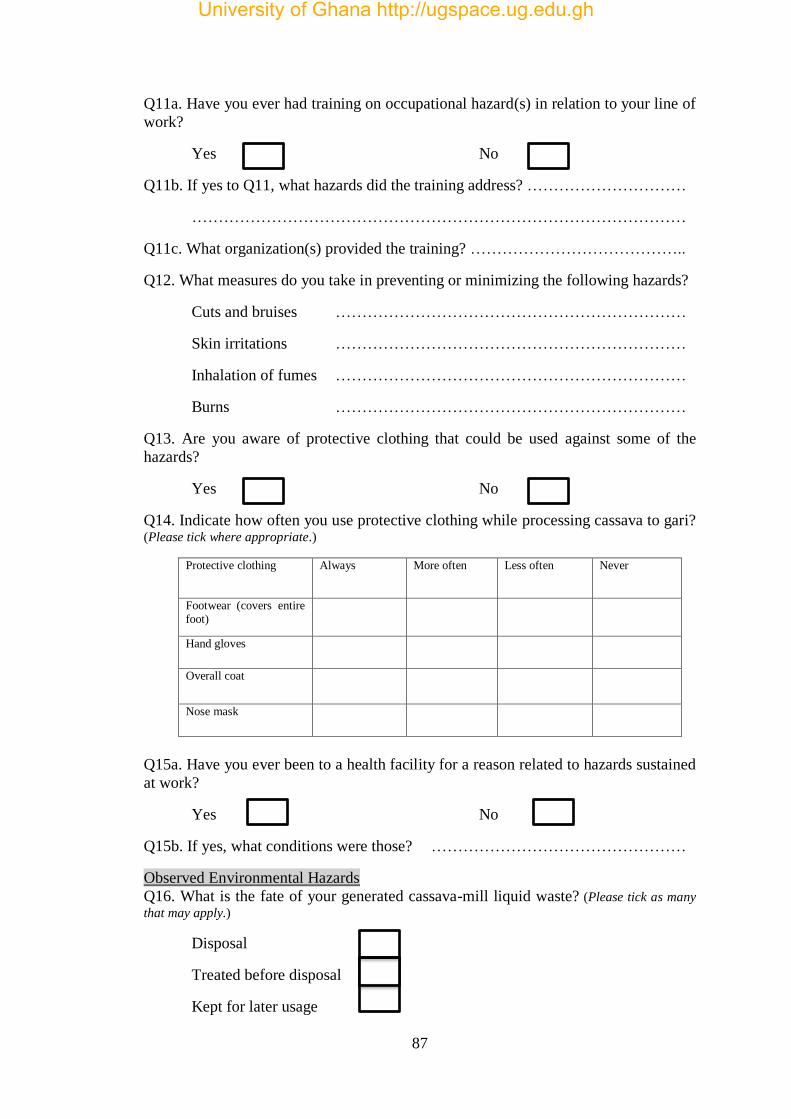
87
Q11a. Have you ever had training on occupational hazard(s) in relation to your line of
work?
Yes No
Q11b. If yes to Q11, what hazards did the training address? …………………………
…………………………………………………………………………………
Q11c. What organization(s) provided the training? …………………………………..
Q12. What measures do you take in preventing or minimizing the following hazards?
Cuts and bruises …………………………………………………………
Skin irritations …………………………………………………………
Inhalation of fumes …………………………………………………………
Burns …………………………………………………………
Q13. Are you aware of protective clothing that could be used against some of the
hazards?
Yes No
Q14. Indicate how often you use protective clothing while processing cassava to gari? (Please tick where appropriate.)
Protective clothing Always More often Less often Never
Footwear (covers entire foot)
Hand gloves
Overall coat
Nose mask
Q15a. Have you ever been to a health facility for a reason related to hazards sustained
at work?
Yes No
Q15b. If yes, what conditions were those? …………………………………………
Observed Environmental Hazards
Q16. What is the fate of your generated cassava-mill liquid waste? (Please tick as many
that may apply.)
Disposal
Treated before disposal
Kept for later usage
University of Ghana http://ugspace.ug.edu.gh
88
Q17. If you ticked ‘Disposal’ or ‘Treated before disposal’ in Q16, where do you
dispose off the waste water?
…………………………………………………………………………………
…………………………………………………………………………………
Q18. How long have you been disposing effluent in this particular place?
…………………………………………………………………………………
Q19. What are the changes and effects noticed with the disposal of the liquid waste in
such a place?
Atmosphere …………………………………………………………………
Vegetation …………………………………………………………………
Land/ Soil …………………………………………………………………
Water bodies …………………………………………………………………
Treatment and Value-Addition Options for the Effluent
Q20. Are you aware of treatment option(s) for the liquid waste generated?
Yes No
Q21. If yes, what are these waste water treatment option(s)? …………………
…………………………………………………………………………………
…………………………………………………………………………………
Q22. If you chose ‘Treated before disposal’ in Q16, how do you treat the waste
water? …………………………………………………………………………………
…………………………………………………………………………………
Q23. If you chose ‘Kept for later usage’ in Q16, what do you use it for?
…………………………………………………………………………………
…………………………………………………………………………………
Q24a. If you did not tick ‘Kept for later usage’ in Q16, do you know of anything that
could be made of the waste water apart from disposing it?
Yes No
Q24b. If yes, what are they? …………………………………………………………
University of Ghana http://ugspace.ug.edu.gh
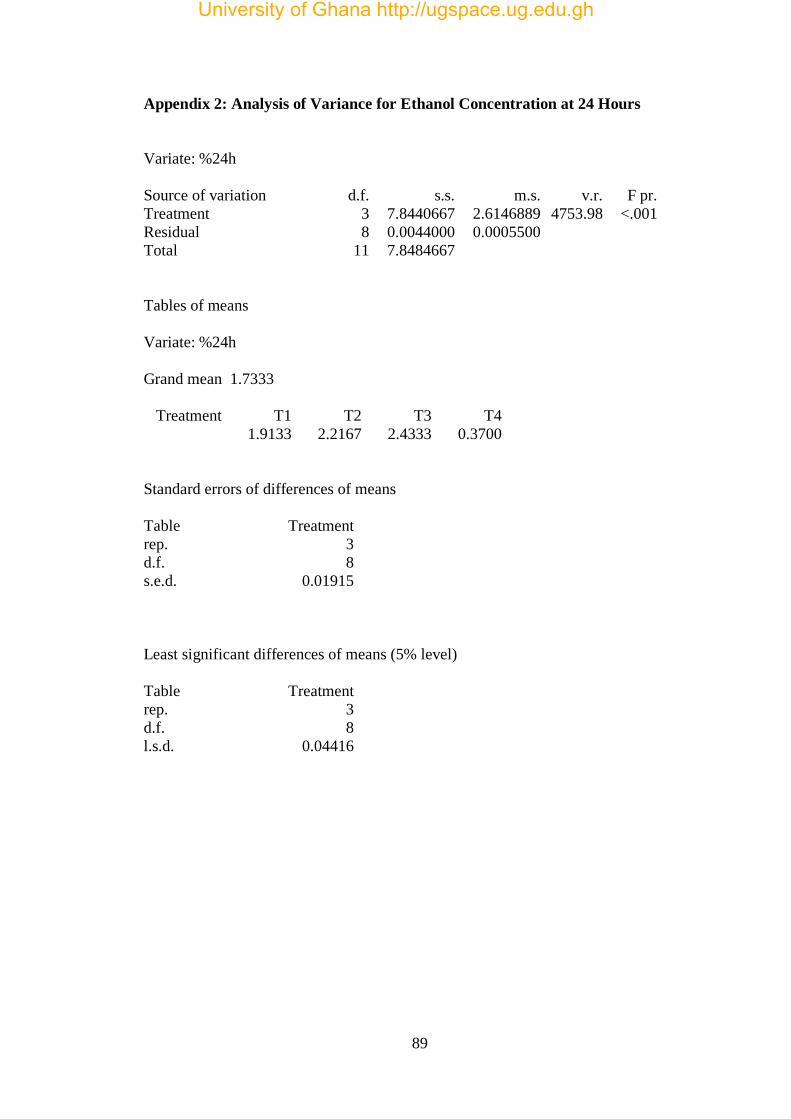
89
Appendix 2: Analysis of Variance for Ethanol Concentration at 24 Hours
Variate: %24h
Source of variation d.f. s.s. m.s. v.r. F pr.
Treatment 3 7.8440667 2.6146889 4753.98 <.001
Residual 8 0.0044000 0.0005500
Total 11 7.8484667
Tables of means
Variate: %24h
Grand mean 1.7333
Treatment T1 T2 T3 T4
1.9133 2.2167 2.4333 0.3700
Standard errors of differences of means
Table Treatment
rep. 3
d.f. 8
s.e.d. 0.01915
Least significant differences of means (5% level)
Table Treatment
rep. 3
d.f. 8
l.s.d. 0.04416
University of Ghana http://ugspace.ug.edu.gh

90
Appendix 3: Analysis of Variance for Ethanol Concentration at 48 Hours
Variate: %48h
Source of variation d.f. s.s. m.s. v.r. F pr.
Treatment 3 15.4620250 5.1540083 6376.09 <.001
Residual 8 0.0064667 0.0008083
Total 11 15.4684917
Tables of means
Variate: %48h
Grand mean 2.3108
Treatment T1 T2 T3 T4
2.7700 2.8533 3.2500 0.3700
Standard errors of differences of means
Table Treatment
rep. 3
d.f. 8
s.e.d. 0.02321
Least significant differences of means (5% level)
Table Treatment
rep. 3
d.f. 8
l.s.d. 0.05353
University of Ghana http://ugspace.ug.edu.gh
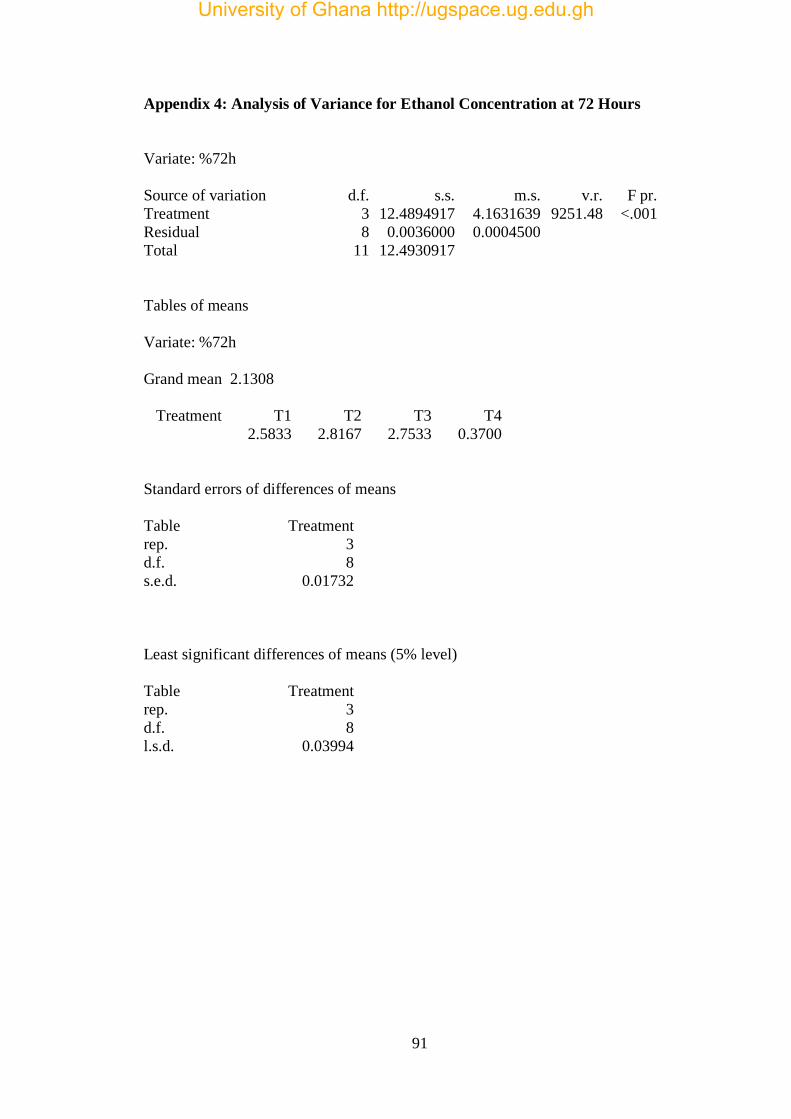
91
Appendix 4: Analysis of Variance for Ethanol Concentration at 72 Hours
Variate: %72h
Source of variation d.f. s.s. m.s. v.r. F pr.
Treatment 3 12.4894917 4.1631639 9251.48 <.001
Residual 8 0.0036000 0.0004500
Total 11 12.4930917
Tables of means
Variate: %72h
Grand mean 2.1308
Treatment T1 T2 T3 T4
2.5833 2.8167 2.7533 0.3700
Standard errors of differences of means
Table Treatment
rep. 3
d.f. 8
s.e.d. 0.01732
Least significant differences of means (5% level)
Table Treatment
rep. 3
d.f. 8
l.s.d. 0.03994
University of Ghana http://ugspace.ug.edu.gh
Related Documents


