ANALYTICAL BIOCHEMISTRY Analytical Biochemistry 349 (2006) 229–241 www.elsevier.com/locate/yabio 0003-2697/$ - see front matter 2005 Elsevier Inc. All rights reserved. doi:10.1016/j.ab.2005.11.015 Obtaining high sequence coverage in matrix-assisted laser desorption time-of-Xight mass spectrometry for studies of protein modiWcation: Analysis of human serum albumin as a model Chunling Wa, Ron Cerny, David S. Hage ¤ Department of Chemistry, University of Nebraska–Lincoln, Lincoln, NE 68588, USA Received 13 September 2005 Available online 28 November 2005 Abstract Several approaches were explored for obtaining high sequence coverage in protein modiWcation studies performed by matrix-assisted laser desorption/ionization time-of-Xight mass spectrometry (MALDI-TOF MS). Human serum albumin (HSA, 66.5 kDa) was used as a model protein for this work. Experimental factors considered in this study included the type of matrix used for MALDI-TOF MS, the protein digestion method, and the use of fractionation for peptide digests prior to MALDI-TOF MS analysis. A mixture of -cyano-4- hydroxycinnamic acid and 2,5-dihydroxybenzoic acid was employed as the Wnal matrix for HSA. When used with a tryptic digest, this gave unique information on only half of the peptides in the primary structure of HSA. However, the combined use of three enzyme digests based on trypsin, endoproteinase Lys-C, and endoproteinase Glu-C increased this sequence coverage to 72.8%. The use of a ZipTip col- umn to fractionate peptides in these digests prior to analysis increased the sequence coverage to 97.4%. These conditions made it possible to examine unique peptides from nearly all of the structure of HSA and to identify speciWc modiWcations to this protein (e.g., glycation sites). For instance, Lys199 was conWrmed as a glycation site on normal HSA, whereas Lys536 and Lys389 were identiWed as additional modiWcation sites on minimally glycated HSA. 2005 Elsevier Inc. All rights reserved. Keywords: Human serum albumin; Sequence coverage; Matrix-assisted laser desorption/ionization time-of-Xight mass spectrometry; Multienzyme digests; Glycation Posttranslational modiWcation has signiWcant eVects on protein folding, conformation, stability, and function [1]. As a result, characterization of the structures and locations of such modiWcations is important in understanding the role of these alterations on a protein. Many methods have been developed to study protein modiWcation. Examples include radiolabeling, thin-layer chromatography, high-performance liquid chromatography, and Edman deg- radation [2–4]. Matrix-assisted laser desorption/ionization time-of-Xight mass spectrometry (MALDI-TOF MS) 1 has also become of great interest as a tool for this area due to its good sensitivity, high resolution, wide mass range, and tolerance of many biological buVers and salts [5]. When using MALDI-TOF MS for this type of work, a preparation of the protein of interest is usually digested by a proteolytic enzyme, giving characteristic peptides that are then analyzed. However, complete mapping of modiWcation sites by MALDI-TOF MS remains a challenge for most proteins due to the limited sequence coverage that is obtained. This limited coverage often results from ion * Corresponding author. Fax: +1 402 472 9402. E-mail address: [email protected] (D.S. Hage). 1 Abbreviations used: MALDI-TOF MS, matrix-assisted laser desorption/ionization time-of-Xight mass spectrometry; HSA, human serum albumin; Lys-C, endoproteinase Lys-C; Glu-C, endoproteinase Glu-C; DTT, D/L-dithiothreitol; CHCA, -cyano-4-hydroxycinnamic acid; DHB, 2,5-dihydroxyben- zoic acid; TFA, triXuoroacetic acid; FL, fructosyl-lysine; CML, N -carboxymethyl-lysine.

Welcome message from author
This document is posted to help you gain knowledge. Please leave a comment to let me know what you think about it! Share it to your friends and learn new things together.
Transcript
ANALYTICALBIOCHEMISTRY
Analytical Biochemistry 349 (2006) 229–241
www.elsevier.com/locate/yabio
Obtaining high sequence coverage in matrix-assisted laser desorption time-of-Xight mass spectrometry for studies of protein modiWcation:
Analysis of human serum albumin as a model
Chunling Wa, Ron Cerny, David S. Hage ¤
Department of Chemistry, University of Nebraska–Lincoln, Lincoln, NE 68588, USA
Received 13 September 2005Available online 28 November 2005
Abstract
Several approaches were explored for obtaining high sequence coverage in protein modiWcation studies performed by matrix-assistedlaser desorption/ionization time-of-Xight mass spectrometry (MALDI-TOF MS). Human serum albumin (HSA, 66.5 kDa) was used as amodel protein for this work. Experimental factors considered in this study included the type of matrix used for MALDI-TOF MS, theprotein digestion method, and the use of fractionation for peptide digests prior to MALDI-TOF MS analysis. A mixture of �-cyano-4-hydroxycinnamic acid and 2,5-dihydroxybenzoic acid was employed as the Wnal matrix for HSA. When used with a tryptic digest, thisgave unique information on only half of the peptides in the primary structure of HSA. However, the combined use of three enzyme digestsbased on trypsin, endoproteinase Lys-C, and endoproteinase Glu-C increased this sequence coverage to 72.8%. The use of a ZipTip col-umn to fractionate peptides in these digests prior to analysis increased the sequence coverage to 97.4%. These conditions made it possibleto examine unique peptides from nearly all of the structure of HSA and to identify speciWc modiWcations to this protein (e.g., glycationsites). For instance, Lys199 was conWrmed as a glycation site on normal HSA, whereas Lys536 and Lys389 were identiWed as additionalmodiWcation sites on minimally glycated HSA. 2005 Elsevier Inc. All rights reserved.
Keywords: Human serum albumin; Sequence coverage; Matrix-assisted laser desorption/ionization time-of-Xight mass spectrometry; Multienzymedigests; Glycation
Posttranslational modiWcation has signiWcant eVects on also become of great interest as a tool for this area due to
protein folding, conformation, stability, and function [1].As a result, characterization of the structures and locationsof such modiWcations is important in understanding therole of these alterations on a protein. Many methods havebeen developed to study protein modiWcation. Examplesinclude radiolabeling, thin-layer chromatography,high-performance liquid chromatography, and Edman deg-radation [2–4]. Matrix-assisted laser desorption/ionizationtime-of-Xight mass spectrometry (MALDI-TOF MS)1 has0003-2697/$ - see front matter 2005 Elsevier Inc. All rights reserved.doi:10.1016/j.ab.2005.11.015
* Corresponding author. Fax: +1 402 472 9402.E-mail address: [email protected] (D.S. Hage).
1 Abbreviations used: MALDI-TOF MS, matrix-assisted laser desorption/Lys-C, endoproteinase Lys-C; Glu-C, endoproteinase Glu-C; DTT, D/L-dithiozoic acid; TFA, triXuoroacetic acid; FL, fructosyl-lysine; CML, N�-carboxym
its good sensitivity, high resolution, wide mass range, andtolerance of many biological buVers and salts [5].
When using MALDI-TOF MS for this type of work, apreparation of the protein of interest is usually digested bya proteolytic enzyme, giving characteristic peptides that arethen analyzed. However, complete mapping of modiWcationsites by MALDI-TOF MS remains a challenge for mostproteins due to the limited sequence coverage that isobtained. This limited coverage often results from ion
ionization time-of-Xight mass spectrometry; HSA, human serum albumin;threitol; CHCA, �-cyano-4-hydroxycinnamic acid; DHB, 2,5-dihydroxyben-ethyl-lysine.

230 Obtaining high sequence coverage in MALDI-TOF MS / C. Wa et al. / Anal. Biochem. 349 (2006) 229–241
suppression and/or the diVerent ionization eYciencies forindividual peptides [6]. In addition, a large number of pep-tides at low masses (i.e., <500 Da) cannot be identiWed byMALDI-TOF MS due to overlapping signals from thematrix [7]. This decreases the sequence coverage by lower-ing the probability of Wnding peptides that can be assignedto a given region of the target protein.
Several strategies have been developed in the past toaddress the problem of low sequence coverage for proteinsin MALDI-TOF MS. As an example, citroconic anhydridehas been used to modify lysine residues and make themresistant to cleavage by trypsin, giving higher mass peptidesin the resulting digest [8]. Unfortunately, not all lysine resi-dues are modiWed in this process, making it more diYcult tointerpret the mass spectrum [9]. The conversion of lysine tohomoarginine has also been found to improve the sequencecoverage for proteins because the ionization eYciency forarginine-containing peptides is higher than that for lysine-containing peptides. However, this method has limitedeVectiveness; for example, the sequence coverage of bovineserum albumin increases from 50% to only 70% when usingthis approach [10].
A second option is to alter the matrix used for MALDI-TOF MS or to use a mixed matrix to increase sequence cov-erage. This has been demonstrated in work with gluteninsubunits using �-cyano-4-hydroxycinnamic acid, sinapinicacid, and 2,5-dihydroxybenzoic acid as matrices [11]. A dis-advantage of this method is that it is most suitable for pro-teins that have only a few lysines and arginines, providingrelatively high mass peptides for use with sinapinic acid[11]. Another approach for increasing sequence coverage isto use multiple enzymes for protein digestion, as shown forapohemoglobin variants, tissue plasminogen activator, andhuman plasma proteins [12,13]. One limitation of this lastmethod is the increased complexity of the peptide mixturethat can lead to severe ion suppression.
The current study examines the combined use of a mixedmatrix, multiple enzymes, and peptide fractionation toovercome these current limitations and increase thesequence coverage of a protein in MALDI-TOF MS. Mul-tiple enzyme digestions and peptide fractionation have beenused in previous work with MALDI-TOF MS [12–15], butthere are no known reports that have considered the com-bined use of these methods to increase sequence coverage.As shown later in this study, the complementary nature ofthese techniques can lead to a signiWcant increase insequence coverage when using MALDI-TOF MS, makingit easier to detect and examine modiWcation sites on a givenprotein.
The current work is performed using human serum albu-min (HSA) as a model protein. HSA has a molecular mass of66.5kDa and is composed of 585 amino acids arranged in asingle peptide chain [16]. It is the major protein in humanplasma and has a heterogeneous amino acid composition,making it a good example of a protein without a repeatingamino acid sequence. In addition, HSA can undergo varioustypes of modiWcations such as nonenzymatic glycation in the
presence of glucose [17–19]. Items considered in this study foroptimizing the sequence coverage of HSA in MALDI-TOFMS include the use of (i) various sample matrices, (ii) multi-ple enzymes for digestion, and (iii) fractionation of digestedpeptides prior to their analysis. The Wnal optimized method isthen used to examine peptides from nearly the entire struc-ture of HSA. Applications of the Wnal method are demon-strated in the detection of glycation sites on normal andminimally glycated HSA.
Materials and methods
Materials
The HSA (»99% pure, fatty acid free, essentially globulinfree), minimally glycated HSA (»95% pure, glycated in vitrogiving 1–5 mol hexose/mol albumin), trypsin (sequencinggrade), endoproteinase Lys-C (Lys-C, sequencing grade), andendoproteinase Glu-C (Glu-C, sequencing grade) were pur-chased from Sigma–Aldrich (St. Louis, MO, USA). Guani-dine hydrochloride (>99% pure), D/L-dithiothreitol (DTT,>99% pure), iodoacetamide (99% pure), iodoacetic acid (99%pure), �-cyano-4-hydroxycinnamic acid (CHCA, >99%pure), 2,5-dihydroxybenzoic acid (DHB, 98% pure), des-Arg-bradykinin (99% pure), angiotensin I (97% pure, acetate salt),Glu-Wbrinopeptide B (97% pure), acetonitrile (>99.93% pure,HPLC grade), and formic acid (96% pure) were also pur-chased from Sigma–Aldrich. TriXuoroacetic acid (TFA,>99% pure) was purchased from Aldrich (Milwaukee, WI,USA). Methanol was obtained from Mallinckrodt Baker(Phillipsburg, NJ, USA). Slide-A-Lyzer dialysis cassettes(7 kDa MW cutoV, 0.5–3ml capacity) were obtained fromPierce (Rockford, IL, USA). All aqueous solutions were pre-pared using water from a Nanopure water system (Barn-stead, Dubuque, IA, USA) and Wltered using 0.22-�m nylonWlters from Fisher ScientiWc (Pittsburgh, PA, USA).
Apparatus
ZipTip�-C18 pipette tips (5.0 �g capacity) were obtainedfrom Millipore (Billerica, MA, USA). Small-volume sam-ples and solutions were measured and applied using a 0.5-to 10-�l digital pipette from Fisher ScientiWc. The overheadtransparency Wlm for sample/matrix mixing was obtainedfrom C-Line Products (Des Plaines, IL, USA). TheMALDI-TOF MS experiments were carried out with anVoyager 6184 system (Applied Biosystems, Foster City,CA, USA) operated in a positive-ion delayed extractionreXectron mode. The instrument settings for this analysiswere as follows: accelerating voltage, 20 kV; grid voltage,76% of accelerating voltage; guide wire voltage, 0.008% ofaccelerating voltage; delay time, 100 ns.
Sample pretreatment and digestion
Prior to digestion, 3 mg HSA was dissolved in 1 ml ofdenaturing buVer that consisted of 6 M guanidine

Obtaining high sequence coverage in MALDI-TOF MS / C. Wa et al. / Anal. Biochem. 349 (2006) 229–241 231
hydrochloride in 100 mM ammonium bicarbonate buVer(pH 8.5). This solution was shaken for 1 min to denature theHSA, followed by the addition of 15 �l of 1.0 M DTT dis-solved in 100 mM ammonium bicarbonate buVer (pH 8.2).This new mixture was incubated at 37 °C for 30 min tobreak the disulWde bonds in HSA. Then a 36-�l portion of1.0 M iodoacetic acid or iodoacetamide in 1.0 M sodiumhydroxide was added to alkylate the free cysteine groupsgenerated in HSA. This solution was incubated in the darkfor 30 min at room temperature. A 150-�l portion of the1.0 M DTT reagent was added to remove any remainingiodoacetic acid or iodoacetamide.
A 400-�l portion of the pretreated HSA solution (i.e.,»1 mg HSA) was placed into a 0.1- to 0.5-ml dialysis cas-sette to remove excess chemicals before digestion with tryp-sin. This sample was dialyzed twice for 4 h at roomtemperature against two 500-ml portions of water, followedby dialysis against 500 ml of 100 mM ammonium bicarbon-ate buVer (pH 7.8) for an additional 4 h at room tempera-ture. A 1 �g/�l solution of trypsin was prepared in 100 mMammonium bicarbonate buVer (pH 7.8). A 50-�l aliquot ofthe dialyzed sample (containing »75 �g HSA) was com-bined with 2.5 �l of the trypsin solution (giving a substrate/enzyme ratio of 30:1), with this mixture being incubated at37 °C for 18 h.
Another 400 �l of the pretreated HSA solution for diges-tion with Glu-C was placed into a 0.1- to 0.5-ml dialysiscassette. The sample was then dialyzed twice against freshportions of 500 ml water for 4 h at room temperature, fol-lowed by dialysis against 500 ml of 100 mM ammoniumbicarbonate buVer (pH 7.8) for another 4 h. A 1-�g/�l solu-tion of Glu-C was prepared in 100 mM ammonium bicar-bonate buVer (pH 7.8). A 50-�l aliquot of the dialyzedsample (containing »75 �g HSA) was combined with 7.5 �lof the Glu-C solution (giving a substrate/enzyme ratio of10:1) and incubated at 37 °C for 8 h. An additional 3.8 �l ofthe Glu-C solution (new substrate/enzyme ratio of 20:1)was later added and incubated for another 18 h at 37 °C.
HSA samples for digestion with Lys-C were prepared bytaking approximately 400 �l (»1 mg) of the pretreated HSAand placing this into a 0.1- to 0.5-ml dialysis cassette, whichwas then dialyzed twice against fresh portions of 500 mlwater for 4 h at room temperature, followed by dialysisagainst 500 ml of 100 mM Tris–HCl buVer (pH 9.0) foranother 4 h. The Lys-C was prepared as a 1-�g/�l solutionin 100 mM Tris–HCl buVer (pH 9.0). A 50-�l aliquot of thedialyzed HSA (containing »75 �g HSA) was combinedwith 2.5 �l of the Lys-C solution (giving a substrate/enzymeratio of 30:1) and incubated at 37 °C for 18 h.
After digestion with trypsin, Glu-C, or Lys-C, 50 �l ofthe enzymatic digest was combined with 5 �l of concen-trated formic acid or 5 �l of 1% TFA to adjust the pH to avalue less than 4.0. Each of these samples was then dividedinto 10-�l aliquots and stored at ¡20 °C prior to furtheruse.
The ZipTip�-C18 pipette tips were wetted with 10 �l of a50% (v/v) solution of acetonitrile and water, followed by a
wash with 10 �l of 0.1% TFA. A 10-�l aliquot of the desiredHSA digest was then loaded onto the ZipTip�-C18 by per-forming 15–20 aspirate–dispense cycles with this aliquot.Salts in the HSA sample were washed away by twice apply-ing 10 �l of 5% (v/v) methanol in water containing 0.1%TFA. The retained peptides were eluted with a series of 1-�lwashes with solvents containing 0.1% TFA in water plus 5,10, 20, 30, or 50% (v/v) acetonitrile. During the studies ofglycation, the samples of glycated HSA were digested andfractionated in the same manner as described for normalHSA.
Sample and matrix preparation
Three types of sample matrices were tested for theMALDI–TOF MS analysis of HSA. In the Wnal optimizedmethod, the matrix was a mixture of CHCA and DHB.(This same matrix has been used previously with other pro-teins [20].) This was obtained by Wrst preparing a 20-�g/�lsolution of CHCA in a 70:30 (v/v) mixture of acetonitrileand 5% formic acid; a DHB solution was prepared in a sim-ilar manner but was instead placed into a 70:30 (v/v) mix-ture of acetonitrile and 0.1% TFA. These CHCA and DHBsolutions were next combined in a 1:1 (v/v) ratio. A 0.5-�laliquot of this matrix and 0.5�l of a digested HSA sample(»15 pmol) were placed on a transparency Wlm and mixedtogether with a pipette tip. The Wnal mixture was then aspi-rated and applied by the pipette onto a spot located on aMALDI plate.
Early work in this study used CHCA as the MALDImatrix. This was originally prepared at a concentration of10 mg/ml in a 50:50 (v/v) mixture of acetonitrile and 0.1%TFA. A 0.5-�l aliquot of an HSA digest sample was appliedwith a pipette onto a spot on a MALDI plate. A 0.5-�l por-tion of the CHCA solution was next placed on top of thissample. An alternative strategy was also explored, similarto a previously reported two-layer method [21–23]. In thisalternative method, 15 mg CHCA was mixed with 400�l ofa 2:1 (v/v) mixture of acetonitrile and water. A 5-�l aliquotof the soluble phase from this matrix solution was appliedslowly and continuously with a pipette over a row of spotson a MALDI plate. This matrix was allowed to dry, leavinga thin layer on the spots and plate. The sample was pre-pared in another matrix; this second matrix was preparedby mixing 10 mg CHCA in a 1-ml solution consisting of50�l formic acid plus 600 �l methanol and 350 �l water. A0.5-�l portion of the HSA digest was dried and dissolved in0.5�l of this matrix. This solution was then applied in spotson top of the thin Wlm of matrix that had already beenplaced on the MALDI plate.
Mass spectrometric analysis
A stock solution of several standard peptides was pre-pared by combining 18.4 �l of 1�g/�l des-Arg-bradykinin,33.6 �l of 1 �g/�l angiotensin I, and 408 �l of 0.1�g/�l Glu-Wbrinopeptide B with 7540�l of a 50:50 (v/v) mixture of

232 Obtaining high sequence coverage in MALDI-TOF MS / C. Wa et al. / Anal. Biochem. 349 (2006) 229–241
acetonitrile and water. This stock solution was divided intoaliquots and frozen at ¡80 °C for future use. A 4-�l portionof this stock solution was mixed with 96�l of the desiredMALDI matrix, giving a Wnal concentration for each stan-dard peptide equal to 1.0–1.3 pmol/�l. A 1-�l portion of thisstandard mixture was spotted on each well of every otherrow on the MALDI plates that were used in this study.
The spotted MALDI plate was allowed to air-dry for 15–20min before analysis. The instrument was calibrated usingdata obtained with the standard peptide mixture. Each sam-ple spot was then analyzed, with the Wnal mass spectrum rep-
resenting the sum of 250 laser shots over a mass range of500–3500 Da. After data acquisition, internal calibration wasperformed to align the m/z axis for all spectra. This internalcalibration was conducted by using three peptides in theHSA digest that had signiWcant signals in each spectrum toachieve better mass accuracy. After calibration, peaks with asingle charge and having a signal/noise ratio greater than 5:1were selected for further analysis.
The sequence for HSA is summarized in Fig. 1 [24].The masses of peptide peaks detected in the HSA digestswere compared with those predicted by PeptideMass [25].
Fig. 1. Primary sequence of HSA. Trypsin cleaves after lysine (K) and arginine (R), which are shown in bold and underlined forms, respectively. Lys-Ccleaves only after lysine. Glu-C cleaves after glutamic acid (E), which is shown in bold and italics. Residue 1 in HSA is indicated by an asterisk.
Fig. 2. Typical MALDI-TOF mass spectrum for a tryptic digest of HSA using a mixture of CHCA and DHB as the matrix.
499.0 1099.2 1699.4 2299.6 2899.8 3500.000
10
20
30
40
50
60
70
80
90
1001911.9067
1624.7796
1467.83212046.0923
927.4904
2652.2507960.5629
1914.91071639.9216 2261.02301311.7384572.2855 1715.7726 2087.8345 2780.35052491.3000940.4501 1743.8851 2090.7953
tens
ity
Mass (m/z)

Obtaining high sequence coverage in MALDI-TOF MS / C. Wa et al. / Anal. Biochem. 349 (2006) 229–241 233
The following parameters were used in this program forpredicting the theoretical masses for the peptides: (i) allcysteines were assumed to be treated with iodoacetamideor iodoacetic acid, (ii) the oxidation of methionines wasallowed, (iii) monoisotopic masses were used for allamino acid residues, and (iv) the maximum number ofmissed cleavage sites allowed was two. All detected pep-tides that could be matched with a mass accuracy within50 ppm of that for a predicted peptide in the HSA digestwere selected for further consideration. This level of massaccuracy was found to be suYcient in this study for iden-tifying both nonglycated and glycated peptides fromHSA, in agreement with observations made with otherproteins in previous studies [26,27]. The sequence cover-age was calculated by using the fraction of all aminoacids in HSA that occurred in detected peptides thatcould be identiWed as arising from speciWc portions ofthis protein’s primary sequence.
Results and discussion
Initial digestion and analysis of HSA
The relatively high molecular weight of HSA makes itchallenging to achieve high sequence coverage for this pro-tein when using MALDI-TOF MS. Part of the reason forthis is the severe ion suppression that can occur for a com-plex mixture of peptides. In addition, there is the diYcultyof identifying a suYcient number of unique peptides in asingle enzymatic digest to allow a high level of sequencecoverage for such a protein. This problem is illustrated inFig. 2 for the analysis of tryptic digests from HSA using aMALDI matrix that was a mixture of CHCA and DHB.This analysis gave rise to 26 unique peptides that could bedetermined from their masses to come from speciWc regionsof HSA (Table 1). When these peptides were compared withthe known primary sequence of HSA, it was determined
Table 1Peptides detected by MALDI-TOF MS for tryptic digests of HSA
a When using only CHCA as the matrix, the cysteines on HSA were modiWed using iodoacetic acid instead of iodoacetamide.
CHCA/DHB matrix CHCA matrix on samplea CHCA matrix on plate and in samplea Residues in HSA
Observed mass Theoretical mass Observed mass Theoretical mass Observed mass Theoretical mass
645.3460 645.3571 182–186673.3812 673.3785 673.3703 673.3785 213–218
695.3210 695.3364 318–323698.3451 698.3585 5–10707.3215 707.3398 200–205773.3972 773.4231 175–181
927.4904 927.4939 927.4861 927.4939 927.4895 927.4939 138–144933.5247 933.5191 934.5309 934.5031 934.5028 934.5031 74–81940.4501 940.4488 940.4543 940.4488 940.4332 940.4488 107–114960.5629 960.5630 960.5582 960.5630 960.5549 960.5630 403–410
1055.5436 1055.5889 137–1441074.5583 1074.5431 1074.5172 1074.5431 182–190
1076.4821 1076.4835 99–1061140.4684 1140.4665 1140.4573 1140.4665 476–484
1149.6115 1149.6155 42–511311.7384 1311.7424 1311.7419 1311.7424 1311.7231 1311.7424 338–3481342.6380 1342.6352 546–5571467.8321 1467.8435 1467.8357 1467.8435 1467.8330 1467.8435 337–3481511.8358 1511.8433 1511.8375 1511.8433 415–4281623.7793 1623.7881 1623.8060 1623.7881 1623.8009 1623.7881 324–3361639.9216 1639.9382 1639.9390 1639.9382 1639.9628 1639.9382 414–4281657.7543 1657.7531 390–4021714.7862 1714.7971 94–1061742.8819 1742.8946 1742.8776 1742.8946 146–1591898.9623 1898.9957 1898.9648 1898.9957 145–159 or 146–1601910.9046 1910.9322 1911.9265 1911.9162 1911.9050 1911.9162 485–500
1933.0358 1933.0216 65–812045.0920 2045.0958 2045.1033 2045.0958 373–3892086.8431 2086.8380 2089.7964 2089.7900 2089.8719 2089.7900 241–2572260.0319 2260.0232 501–5192490.3129 2490.2854 2491.3136 2491.2695 21–412518.2840 2518.2143 2520.1026 2520.1824 446–466
2546.1082 2546.1509 501–5212588.0458 2588.0702 241–262
2650.2601 2650.2645 2651.2026 2651.2485 115–1362674.2911 2674.3155 2676.2509 2676.2835 445–4662778.3418 2778.3594 2779.3423 2779.3434 115–1372974.4154 2974.3449 287–313

234 Obtaining high sequence coverage in MALDI-TOF MS / C. Wa et al. / Anal. Biochem. 349 (2006) 229–241
that 51.6% of the sequence for HSA was represented bythese peptides (Fig. 3).
As shown in the left section of Table 1, 23 of these pep-tides matched uniquely to those predicted for a trypticdigest of HSA with a mass tolerance of 50 ppm. One of theremaining three peptides had a peak at m/z D 673.3812; thisgave a Wt with either residues 213–218 or residues 520–534at 50 ppm but was matched at a mass tolerance of 25 ppmto residues 213–218 in HSA. Another peptide at m/z D 1149.6115 Wt with either residues 42–51 or residues 1–10but could be matched at a mass tolerance of 10 ppm to resi-dues 42–51. The third remaining peptide (m/z D 1898.9623)gave a match with both residues 145–159 and 146–160,which arise from the same region of HSA and diVer only inthe position of a single arginine residue at the beginning orend of the peptide.
Selection of a MALDI matrix and sample preparation
An ideal MALDI matrix should be soluble in the samesolvent as the analyte, have strong absorption at the wave-length emitted by the laser in the MALDI system, be chem-ically inert toward the analyte, and have low sublimationrates when introduced into a vacuum. Even when these cri-teria are met, the process of matrix selection and optimiza-tion is still a largely empirical one. After the initial use ofnicotinic acid as a MALDI matrix [28], a large collection ofother matrices have been examined for use in the analysisof peptides and proteins. Among these, the most widelyused matrices are CHCA [29], DHB [30], and sinapinic acid
[31]. However, sinapinic acid is generally used for proteinsand peptides larger than 10 kDa [31], and DHB can lead tosurface nonhomogeneity that often leads to time-consum-ing spectrum acquisition and poor reproducibility[20,30,32]. Based on these previous observations, CHCAwas the primary matrix evaluated for the analysis of HSAin the current study.
Work with CHCA was Wrst performed by applying thismatrix to the top of a sample that had been spotted on aMALDI plate. An alternative approach considered was atwo-layer method in which CHCA was applied to theMALDI plate before applying a mixture of the sample andCHCA on top of this matrix [21–23]. A third method con-sidered was one in which a mixture of CHCA and DHBwas used as the MALDI matrix [20].
Table 1 lists the peptides identiWed when using each ofthese methods. As stated earlier, 26 peptides from knownlocations in HSA were found when using CHCA/DHB asthe matrix. A total of 20 peptides from unique locations inHSA were identiWed using CHCA spotted on top of thesample, whereas 24 peptides were identiWed when usingCHCA both on the plate and in the sample. All but two ofthese peptides were found to have unambiguous locationsin the sequence of HSA and matched predicted masses witha mass tolerance of 50 ppm. The two exceptions were againthe peptides at m/z D 673.3703 and m/z D 1898.9648, whichcould be matched by other means with residues 213–218 ofHSA and residues 145–149 or 146–150.
It is interesting to note that the peptides identiWed whenusing CHCA both on the MALDI plate and in the sample
Fig. 3. Sequences detected in a tryptic digest of HSA using CHCA applied on top of the dried sample (�), CHCA on the plate and in the sample (�), andCHCA plus DHB (�) as the MALDI matrix. Details on each of these methods can be found in the text.
Residue No.
CHCA+ DHB CHCA on sample CHCA on sample & plate
Obtaining high sequence coverage in MALDI-TOF MS / C. Wa et al. / Anal. Biochem. 349 (2006) 229–241 235
tended to cover a lower mass range than those found whenusing CHCA in the sample alone. For instance, at massesless than 1 kDa, 10 peptides were conclusively identiWedusing CHCA both on the plate and in the sample, whereasfour peptides were identiWed when using CHCA only in thesample. At masses greater than 2 kDa, only three peptideswere conclusively identiWed when using CHCA both on theplate and in the sample compared with seven peptides whenemploying CHCA in the sample alone. One result was thatthe sequence coverages obtained by these two methodswere comparable, even though the use of CHCA both onthe plate and in the sample gave more identiWed peptides.This is illustrated in Fig. 2, where the sequence coveragewas 37.3% when using CHCA only in the sample and 37.4%when using CHCA both on the MALDI plate and in thesample.
Among the three methods that were explored for theMALDI matrix, the combined use of CHCA and DHB gavethe best results in terms of sequence coverage. This is illus-trated in Fig. 2, where the sequence coverage obtained usingCHCA alone was 37.3–37.4%, whereas the sequence coveragewhen using CHCA plus DHB was 51.6%. One reason for thiswas that CHCA plus DHB gave a greater number of uniquedetectable peptides (26 versus 20–24 when using CHCAalone). In addition, using CHCA plus DHB gave a lower levelof chemical noise than when using CHCA by itself, especiallyin the high mass range of the mass spectra. This explains whymore ions were observed by this combined matrix at highmasses; for example, nine peptides were identiWed between 2and 3kDa when using CHCA plus DHB compared with 3 or7 when using CHCA alone. This probably occurred becausethe combination of these two matrices gave better homogene-ity during sample preparation [20]. Based on these results, thecombination of CHCA and DHB as a MALDI matrix wasused in all further work with HSA in this study.
Analysis of HSA using multienzyme digests
Another means explored for improving the sequencecoverage of HSA was to use several enzymes for the diges-tion of this protein. This was done to increase the numberof unique peptides generated, thereby allowing more sec-tions of HSA to be monitored. There are several criteriathat should be observed when selecting enzymes to beused in such an approach. First, these enzymes should bycommercially available and have a low or moderate cost.Second, each enzyme should have a relatively high speci-Wcity, allowing it to generate reproducible and predictablepeptides for a given protein. Third, the peptides that aregenerated should have a moderate mass. This is neededbecause peptides with masses less than 500 Da can beobscured by background noise from the matrix, whereaspeptides with high masses may be diYcult to analyze formodiWcations if they contain multiple residues that mightbe involved in the modiWcation.
Based on these criteria, the proteolytic enzymeschosen for use in this study were trypsin, Lys-C, and Glu-C.
Trypsin is known to cleave proteins at the carboxyl side ofarginine and lysine residues except those that have a prolineat their C-terminal end. Lys-C cleaves after lysine residues(except those that have a proline at their C terminus), giv-ing Lys-C a tendency to produce larger peptides than tryp-sin in protein digests. Glu-C cleaves glutamyl bonds inammonium bicarbonate buVer except when a proline is atthe C-terminal end of a glutamic acid residue or when theglutamic acid residue is C terminal to the proline [33]. Thisgives Glu-C a diVerent speciWcity than trypsin or Lys-C andtends to result in larger peptides than those seen in trypticdigests.
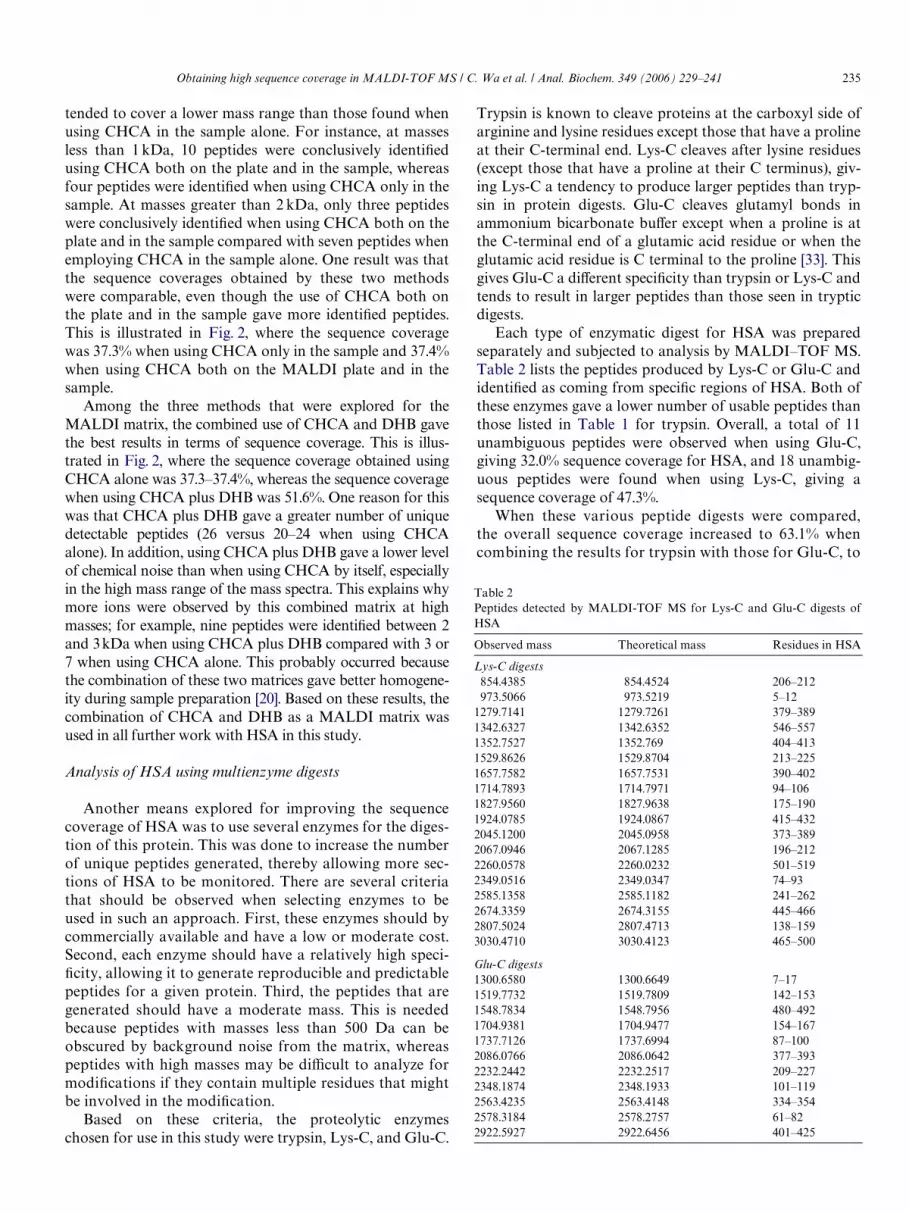
Each type of enzymatic digest for HSA was preparedseparately and subjected to analysis by MALDI–TOF MS.Table 2 lists the peptides produced by Lys-C or Glu-C andidentiWed as coming from speciWc regions of HSA. Both ofthese enzymes gave a lower number of usable peptides thanthose listed in Table 1 for trypsin. Overall, a total of 11unambiguous peptides were observed when using Glu-C,giving 32.0% sequence coverage for HSA, and 18 unambig-uous peptides were found when using Lys-C, giving asequence coverage of 47.3%.
When these various peptide digests were compared,the overall sequence coverage increased to 63.1% whencombining the results for trypsin with those for Glu-C, to
Table 2Peptides detected by MALDI-TOF MS for Lys-C and Glu-C digests ofHSA
Observed mass Theoretical mass Residues in HSA
Lys-C digests854.4385 854.4524 206–212973.5066 973.5219 5–12
1279.7141 1279.7261 379–3891342.6327 1342.6352 546–5571352.7527 1352.769 404–4131529.8626 1529.8704 213–2251657.7582 1657.7531 390–4021714.7893 1714.7971 94–1061827.9560 1827.9638 175–1901924.0785 1924.0867 415–4322045.1200 2045.0958 373–3892067.0946 2067.1285 196–2122260.0578 2260.0232 501–5192349.0516 2349.0347 74–932585.1358 2585.1182 241–2622674.3359 2674.3155 445–4662807.5024 2807.4713 138–1593030.4710 3030.4123 465–500
Glu-C digests1300.6580 1300.6649 7–171519.7732 1519.7809 142–1531548.7834 1548.7956 480–4921704.9381 1704.9477 154–1671737.7126 1737.6994 87–1002086.0766 2086.0642 377–3932232.2442 2232.2517 209–2272348.1874 2348.1933 101–1192563.4235 2563.4148 334–3542578.3184 2578.2757 61–822922.5927 2922.6456 401–425
236 Obtaining high sequence coverage in MALDI-TOF MS / C. Wa et al. / Anal. Biochem. 349 (2006) 229–241
Table 3Peptides identiWed in various ZipTip fractions for tryptic digests of HSA
Observed mass for collected peptides at given percentage acetonitrile in water Theoretical mass Residues in HSA
5% 10% 20% 30% 50%
645.3671 645.3571 182–186658.3285 658.3160 94–98673.3849 673.3831 673.3785 213–218695.3589 695.3364 318–323772.4190 772.4391 175–181789.4658 789.4721 234–240875.4989 875.5103 219–225
88s0.4416 880.4416 226–233927.4861 927.4861 927.4864 927.4939 138–144933.5211 933.5130 933.5191 74–81940.4499 940.4488 107–114951.4301 951.4464 13–20960.5560 960.5538 960.5528 960.5630 403–410984.4723 984.4889 352–359
1000.5876 1000.6042 526–5341017.5292 1017.5172 1017.5369 65–731055.5827 1055.5746 1055.5889 137–1441074.5477 1074.5431 182–190
1075.4916 1075.4994 99–1061128.7110 1128.6992 525–5341138.5142 1138.4985 476–4841149.6103 1149.5971 1149.6108 1149.6155 42–511226.5929 1226.5810 1226.6057 11–201305.6090 1305.6182 277–2861311.7353 1311.7355 1311.7424 1311.7424 338–348
1342.6301 1342.6225 1342.6287 1342.6352 546–5571371.5684 1371.5323 1371.5673 163–1741400.6496 1400.6340 1400.6778 434–4441434.5313 1434.5454 1434.5339 82–931443.6288 1443.5963 1443.6425 263–2741467.8357 1467.8120 1467.8356 1467.8357 1467.8581 1467.8435 337–3481511.8580 1511.8256 1511.8355 1511.8433 415–4281546.7791 1546.7972 275–2861552.5922 1552.5982 360–3721623.7790 1623.7466 1623.7704 1623.8038 1623.7881 324–3361627.7267 1627.7273 561–574
1639.7986 1639.7830 324–336(Met–ox)
1639.9304 1639.8956 1639.9339 1639.9382 414–4281657.7310 1657.7210 1657.7358 1657.7478 1657.7531 390–4021714.7809 1714.7486 1714.7971 94–106
1742.8965 1742.8686 1742.8946 146–1591898.9602 1899.0180 1898.9957 145–159
or 146–1601910.8589 1910.9129 1910.9096 1910.9322 485–500
1932.0038 1932.0362 1932.0376 65–812045.0882 2045.0880 2045.0958 373–389
2086.8234 2086.7795 2086.8557 2086.8380 241–2572288.9632 2289.0717 542–560
2260.0200 2260.0154 2260.0232 501–5192490.2665 2490.2854 21–41
2518.1409 2518.1986 2518.2143 446–4662545.2125 2545.1669 501–521
2599.2791 2599.2978 390–4102650.2459 2650.2416 2650.2645 115–136
2674.3034 2674.2800 2674.3155 445–4662778.3510 2778.3000 2778.3594 115–137
2974.4148 2974.2493 2974.3449 287–313

Obtaining high sequence coverage in MALDI-TOF MS / C. Wa et al. / Anal. Biochem. 349 (2006) 229–241 237
67.0% for trypsin plus Lys-C, and to 58.1% for Glu-Cplus Lys-C. When the results for all three digests werecombined, the sequence coverage was 72.8%. However,for the complete identiWcation of modiWcation sites onHSA, a higher degree of sequence coverage is desirable.As a result, further improvements in this analysis weresought.
Use of peptide fractionation for HSA digests
The next item considered to increase HSA sequencecoverage was the use of fractionation to separate the pep-tides in each digest. This was examined because a reduc-tion in the complexity of a peptide mixture can decreasethe ion suppression that occurs for such a mixture [14,15].Peptide fractionation using a ZipTip containing a C18 sta-tionary phase was used for this purpose because thisneeded only a small amount of sample, was easy to per-form, and allowed the direct depositing of a fractionatedsample on a MALDI plate. To do this, each enzymaticdigest was applied separately to a ZipTip support andeluted with solvents containing 0.1% TFA and variouslevels of acetonitrile in water. Each fraction was then col-lected, mixed with CHBA/DHB, and subjected toMALDI-TOF MS analysis.
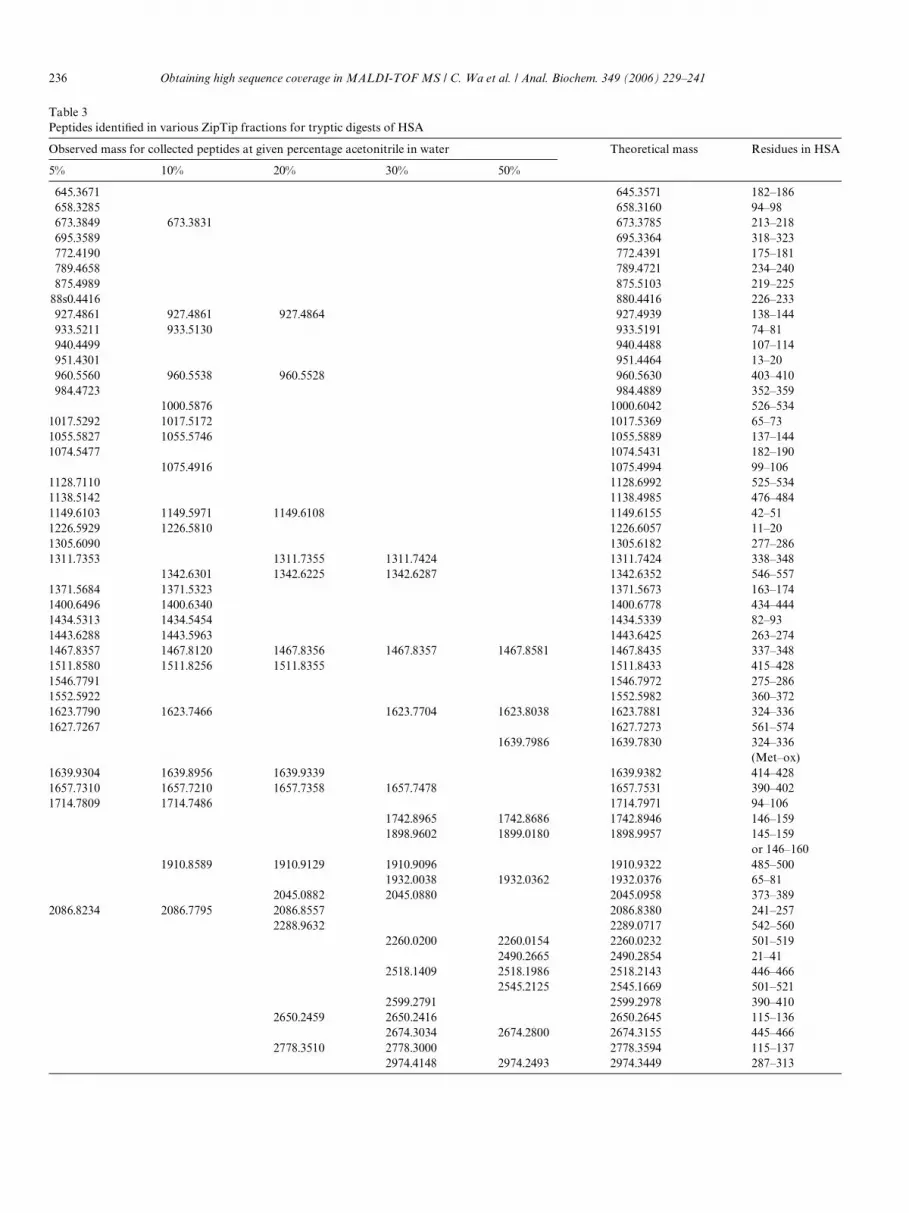
Table 3 shows the peptides identiWed in the various col-lected fractions for tryptic digests of HSA. From this infor-mation, it can be seen that diVerent clusters of peptideseluted with the various mobile phases. When the ratio ofacetonitrile to water was increased in the mobile phase,there was a tendency for larger peptides to elute from the
extraction column. Similar results were obtained for digestsprepared using Lys-C and Glu-C. The numbers of peptidesidentiWed during the various fractionation steps were as fol-lows: 37 at 5%, 23 at 10%, 15 at 20%, 17 at 30%, and 12 at50% acetonitrile in water. The total number of peptidesidentiWed was 56 compared with 26 for a nonfractionatedsample. For Lys-C and Glu-C, the total numbers of pep-tides identiWed with a prefractionation step increased to 41and 28 versus 18 and 11, respectively, without a prefrac-tionation step.
When using this type of fractionation, the sequence cov-erage of HSA increased to 82.9% for the tryptic digests. Forthe Glu-C and Lys-C digests, the sequence coverage ofHSA increased to 64.6 and 77.6%, respectively (Fig. 4).Thus, for each type of digest, there was signiWcant improve-ment in the degree to which the overall structure of HSAcould be monitored by MALDI-TOF MS.
Multienzyme digestion plus peptide fractionation for HSA
The Wnal item considered in the optimization of HSAanalysis by MALDI-TOF MS was the combined use ofmultienzyme digestion and peptide fractionation. WhenHSA was examined using trypsin, Lys-C, and Glu-C withfractionation of peptides on a ZipTip column, the overallsequence coverage reached 97.4% (Fig. 4). Overall, only15 of 585 amino acid residues of HSA could not beassigned to unique peptide. These remaining residues cor-responded to residues 1–4 (DAHK, 469.2357 Da), 314–317 (DVCK, 520.2388 Da), and 535–541 (HKPKATK,808.4992 Da) of HSA. These peptides were also not
Fig. 4. Sequences detected in various digests of HSA when using ZipTip fractionation. The Wrst three rows are the peptide sequence detected when usingtrypsin (�), Lys-C (�), or Glu-C (�) alone for digestion. The last row shows the overall sequence coverage when using all three enzymes for digestion (�).
238 Obtaining high sequence coverage in MALDI-TOF MS / C. Wa et al. / Anal. Biochem. 349 (2006) 229–241
detected when no peptide fractionation was used. No fur-ther peptides were eluted and detected when 80% acetoni-trile in water was used for the ZipTip fractionation. Thismeant that the most likely reason why these particularresidues were not detected is they were obscured or sup-pressed by other peptide peaks in the low mass region ofthe mass spectra.
It can be seen from Fig. 4 that the peptides generatedfrom HSA by Glu-C and Lys-C were the sets most com-plementary in their sequence coverage. Although Glu-Cby itself gave sequence coverage of only 32.0% withoutfractionation compared with 51.6% for trypsin, the com-bined use of Glu-C plus Lys-C with fractionationincreased this coverage to 94.4%. This was slightly largerthan the coverage of 93.3% obtained for trypsin plusLys-C and that of 93.8% for trypsin plus Glu-C whenusing peptide fractionation. From this, it was concludedthat if only two enzymes are to be employed with HSA,Glu-C and Lys-C would give the largest sequence cover-age. In this study, all three enzymes were used in furtherwork because this combination raised the overallsequence coverage to 97.4%.
Detection of modiWed residues on HSA
Once conditions had been optimized for the study ofnormal HSA, the extension of these conditions to modiWedforms of this protein was also examined. The particularexample considered was the glycation of HSA. In the circu-lation, HSA undergoes a nonenzymatic reaction with glu-cose to form a reversible SchiV base. Over time, some of thisSchiV base can undergo an Amadori rearrangement to givea stable fructosamine residue and a glycated form of HSA[34]. Further reactions involving slow oxidation, degrada-tion, and rearrangement can later lead to a mixture of otherrelated products [35–37]. In normal individuals, 5–8% ofHSA is glycated, and this level increases to 13–30% or morein individuals with diabetes [38–40].
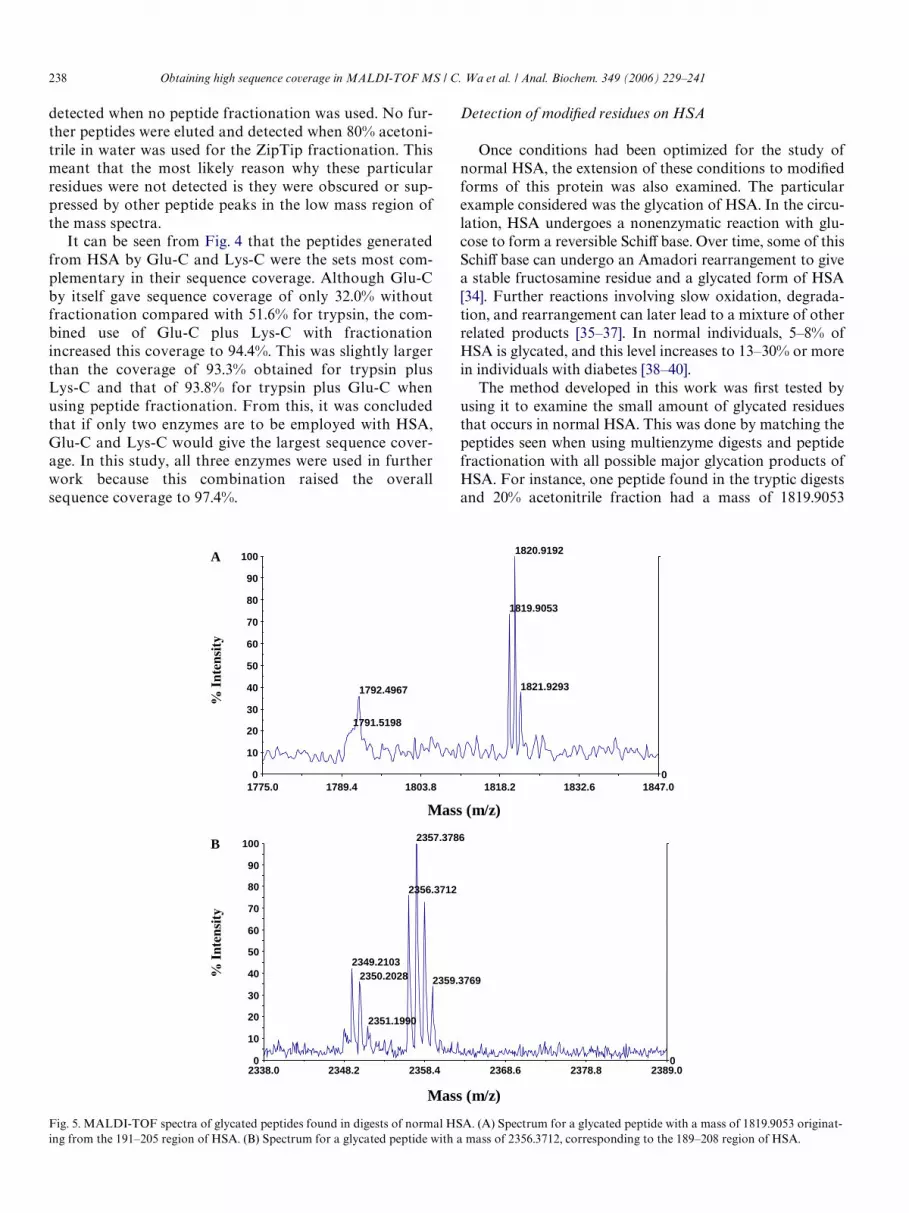
The method developed in this work was Wrst tested byusing it to examine the small amount of glycated residuesthat occurs in normal HSA. This was done by matching thepeptides seen when using multienzyme digests and peptidefractionation with all possible major glycation products ofHSA. For instance, one peptide found in the tryptic digestsand 20% acetonitrile fraction had a mass of 1819.9053
Fig. 5. MALDI-TOF spectra of glycated peptides found in digests of normal HSA. (A) Spectrum for a glycated peptide with a mass of 1819.9053 originat-
2338.0 2348.2 2358.4 2368.6 2378.8 2389.000
10
20
30
40
50
60
70
80
90
1002357.3786
2356.3712
2349.21032350.2028 2359.3769
2351.1990
1775.0 1789.4 1803.8 1818.2 1832.6 1847.000
10
20
30
40
50
60
70
80
90
1001820.9192
1819.9053
1821.92931792.4967
1791.5198
Mass (m/z)
Mass (m/z)
A
B
ing from the 191–205 region of HSA. (B) Spectrum for a glycated peptide with a mass of 2356.3712, corresponding to the 189–208 region of HSA.

Obtaining high sequence coverage in MALDI-TOF MS / C. Wa et al. / Anal. Biochem. 349 (2006) 229–241 239
(Fig. 5A) and was found to originate from the 191–205 sec-tion of HSA. This peptide had a mass increase of 144.0423from its counterpart in unmodiWed HSA that was due tothe addition of glucose to either Lys195 or Lys199 and thesubsequent loss of water. Another modiWed peptide fromthe same general region of HSA was identiWed in the Glu-Cdigests both before and after ZipTip fractionation. Thispeptide is shown in Fig. 5B and had a mass of 2356.3712.This corresponded to the 189–208 section of HSA and rep-resents the addition of one molecule of glucose to Lys190,Lys195, or Lys199. Because Lys199 is thought to have alower pKa value than other lysines in HSA [41,42], this resi-due is the most likely site for glycation in peptides 191–205and 189–208. This agrees with earlier studies using radiola-beling in which the in vitro incubation of HSA with glucosewas found to lead to the incorporation of glucose at Lys199[17].
Depending on the reaction conditions, the extent ofHSA glycation in vitro by glucose can be small (1–2 molmodiWcation/mol protein) or high (up to 30–40 mol/molprotein), with the former being closer to what occurs underphysiological conditions [43,44]. For instance, previouswork with HSA that was modiWed at low glucose concen-trations has identiWed the presence of mainly fructosyl-lysine (FL) and N�-carboxymethyl-lysine (CML) residuesplus a minor amount of other advanced glycation endproducts [45]. The average concentrations of these FL andCML modiWcations were measured in this same study to be
1.21 and 1.42 mol/mol protein, respectively, but the loca-tions of these modiWcations were not determined [45].
To identify these sites, glycated HSA was examined inthe current study using the MALDI-TOF MS conditionsthat had been optimized for normal HSA. Those peptidesappearing only in the mass spectra for glycated HSAdigests were then selected and matched to all possible pre-dicted FL and CML modiWcations for HSA. One modiWedpeptide found in the tryptic digests and 5% acetonitrilefraction of glycated HSA had a mass of 971.5025 (cf. Figs.6A and B). This peptide was found to originate from the535–541 section of HSA and represented an FL modiWca-tion of Lys536, giving a mass increase of 162.0528 versusthe same peptide in unmodiWed HSA. Another modiWedpeptide was detected in the Glu-C digests and the 10% ace-tonitrile fraction of glycated HSA (Figs. 6C and D). Thispeptide had a mass of 1130.5608 and was from the 286–294section of HSA. It was found that this second peptide rep-resented a CML modiWcation to Lys286, as indicated by anincrease in mass of 58.0055 versus the same peptide inunmodiWed HSA.
Conclusions
In this work, several strategies for increasing thesequence coverage of HSA by MALDI-TOF MS wereexplored. It was found that the combined use of CHCA andDHB as a sample matrix gave higher sequence coverage
Fig. 6. MALDI-TOF spectra of modiWed peptides found in digests of glycated HSA but absent in digests of normal HSA. (A) Mass spectrum for a gly-cated peptide with a mass of 971.5025 originating from the 535–541 region of HSA. (C) Mass spectrum for a glycated peptide with a mass of 1130.5608,corresponding to the 286–294 region of HSA. (B and D) Mass spectra showing the absence of these modiWed peptides in the digests of normal HSA.
969 973 977 981 985 98900
10
20
30
40
50
60
70
80
90
100
969 973 977 981 985 98900
10
20
30
40
50
60
70
80
90
100
Mass (m/z)
Mass (m/z)
1126.0 1138.4 1150.8 1163.2 1175.6 1188.000
10
20
30
40
50
60
70
80
90
100
1126.0 1138.4 1150.8 1163.2 1175.6 1188.000
10
20
30
40
50
60
70
80
90
100
Mass (m/z)
Mass (m/z)
A C
DB

240 Obtaining high sequence coverage in MALDI-TOF MS / C. Wa et al. / Anal. Biochem. 349 (2006) 229–241
than did the use of CHCA alone. It was also noted thatmore peptides in the low mass range could be identiWedwhen using a thin Wlm of CHCA on a MALDI plate thanwhen using CHCA applied on top of a sample. Other tech-niques considered were multienzyme digestion and peptidefractionation. When these two techniques were used sepa-rately, multienzyme digestion of HSA by trypsin, Lys-C,and Glu-C increased the sequence coverage from 51.6 to72.8%, whereas peptide fractionation of tryptic digest ofHSA increased it to 82.9%. Further combination of thesetwo strategies increased the sequence coverage to 97.4%.This result is much higher than the previous maximum cov-erage of 70 to 84% obtained by MALDI-TOF MS forbovine serum albumin [8,10], a protein with amino acidcomposition and structure similar to those of HSA [16].
This approach required only a small amount of protein(pmol-to-fmol quantities) and was relatively easy to use.These features, along with the high sequence coveragethat was obtained, make this attractive for use in examin-ing modiWed sites on proteins such as HSA. For instance,it was demonstrated that this approach could be used todetect a known region of glycation in normal HSA(Lys199) and two additional modiWcation sites on mini-mally glycated HSA (Lys536 and Lys286). Future workwill examine the extension of this method to work withother advanced glycation end products on HSA [18,19,45]or other modiWcations on HSA [16]. Although it might benecessary to reoptimize the exact matrix and fraction-ation conditions needed for alternative protein digests,the general strategy described here should be applicable inmaximizing the sequence coverage for other proteins inMALDI-TOF MS.
Acknowledgment
This work was supported in part by the National Insti-tutes of Health under grant R01 GM044931 and by a grant-in-aid from the University of Nebraska Research Council.The MALDI-TOF MS instrument used in this work waslocated in the Nebraska Center for Mass Spectrometry. Wealso thank Kurt Wulser for his assistance during this project.
References
[1] B. Alberts, A. Johnson, J. Lewis, M. RaV, K. Roberts, P. Walter,Molecular Biology of the Cell, fourth ed., Garland, New York, 2002.
[2] F.A. Baumeister, V. Herzog, Sulfation of thyroglobulin: a ubiquitousmodiWcation in vertebrates, Cell Tissue Res. 252 (1988) 349–358.
[3] W.A. Maltese, R.A. Erdman, Characterization of isoprenoid involvedin the post-translational modiWcation of mammalian cell proteins, J.Biol. Chem. 264 (1989) 18168–18172.
[4] V. Dincbas-Renqvist, A. Engstrom, L. Mora, V. Heurgue-Hamard, R.Buckingham, M. Ehrenberg, A post-translational modiWcation in theGGQ motif of RF2 from Escherichia coli stimulates termination oftranslation, EMBO J. 19 (2000) 6900–6907.
[5] S.M. Stevens Jr., W.R. Kem, L. Prokai, Investigation of cytolysin vari-ants by peptide mapping: enhanced protein characterization usingcomplementary ionization and mass spectrometric techniques, RapidCommun. Mass Spectrom. 16 (2002) 2094–2101.
[6] E. Krause, H. Wenschuh, P.R. Jungblut, The dominance of arginine-containing peptides in MALDI-derived tryptic mass Wngerprints ofproteins, Anal. Chem. 71 (1999) 4160–4165.
[7] K. Dreisewerd, S. Berkenkamp, A. Leisner, A. RohlWng, C. Menzel,Fundamentals of matrix-assisted laser desorption/ionization massspectrometry with pulsed infrared lasers, Int. J. Mass Spectrom. 226(2003) 189–209.
[8] V. Kadlcik, M. Strohalm, M. Kodicek, Citraconylation: a simplemethod for high protein sequence coverage in MALDI-TOF massspectrometry, Biochem. Biophys. Res. Commun. 305 (2003) 1091–1093.
[9] S. Julka, F.E. Regnier, Benzoyl derivatization as a method to improveretention of hydrophilic peptides in tryptic peptide mapping, Anal.Chem. 76 (2004) 5799–5806.
[10] J.E. Hale, J.P. Butler, M.D. Knierman, G.W. Becker, Increased sensi-tivity of tryptic peptide detection by MALDI-TOF mass spectrome-try is achieved by conversion of lysine to homoarginine, Anal.Biochem. 287 (2000) 110–117.
[11] R. Cozzolino, S. Di Giorgi, S. Fisichella, D. Garozzo, D. LaWandra, A.Palermo, Matrix-assisted laser desorption/ionization mass spectro-metric peptide mapping of high molecular weight glutenin subunits1Bx7 and 1Dy10 in Cheyenne cultivar, Rapid Commun. Mass Spec-trom. 15 (2001) 778–787.
[12] C.L. Gatlin, J.K. Eng, S.T. Cross, J.C. Detter, J.R. Yates III, Auto-mated identiWcation of amino acid sequence variations in proteins byHPLC/microspray tandem mass spectrometry, Anal. Chem. 72 (2000)757–763.
[13] G. Choudhary, S.L. Wu, P. Shieh, W.S. Hancock, Multiple enzymaticdigestion for enhanced sequence coverage of proteins in complex pro-teomic mixtures using capillary LC with ion trap MS/MS, J. Prote-ome Res. 2 (2003) 59–67.
[14] F. Rusconi, J.-M. Schmitter, J. Rossier, M. Maire, Chromatographicseparation and sample preparation in one step for MALDI massspectrometric analysis of subpicomole amounts of heterogeneousprotein samples, Anal. Chem. 70 (1998) 3046–3052.
[15] T. Baczek, Fractionation of peptides in proteomics with the use of pI-based approach and ZipTip pipette tips, J. Pharm. Biomed. Anal. 34(2004) 851–860.
[16] T. Peters Jr., All about Albumin: Biochemistry, Genetics, and MedicalApplications, Academic Press, San Diego, 1996.
[17] J.F. Day, S.R. Thorpe, J.W. Baynes, Nonenzymically glucosylatedalbumin: in vitro preparation and isolation from normal humanserum, J. Biol. Chem. 254 (1979) 595–597.
[18] R.L. Garlick, J.S. Mazer, The principal site of nonenzymic glycosylationof human serum albumin in vivo, J. Biol. Chem. 258 (1983) 6142–6146.
[19] N. Iberg, R. Flueckiger, Nonenzymic glycosylation of albuminin vivo: identiWcation of multiple glycosylated sites, J. Biol. Chem. 261(1986) 13542–13545.
[20] S. Laugesen, P. RoepstorV, Combination of two matrices results inimproved performance of MALDI MS for peptide mass mapping andprotein analysis, J. Am. Soc. Mass Spectrom. 14 (2003) 992–1002.
[21] Y. Dai, R.M. Whittal, L. Li, Confocal Xuorescence microscopic imag-ing for investigating the analyte distribution in MALDI matrixes,Anal. Chem. 68 (1996) 2494–2500.
[22] A. Westman, C.L. Nilsson, R. Ekman, Matrix-assisted laser desorp-tion/ionization time-of-Xight mass spectrometry analysis of proteinsin human cerebrospinal Xuid, Rapid Commun. Mass Spectrom. 12(1998) 1092–1098.
[23] P. Onnerfjord, S. Ekstrom, J. Bergquist, J. Nilsson, T. Laurell, G.Marko-Varga, Homogeneous sample preparation for automated highthroughput analysis with matrix-assisted laser desorption/ionisationtime-of-Xight mass spectrometry, Rapid Commun. Mass Spectrom. 13(1999) 315–322.
[24] B. Meloun, L. Moravek, V. Kostka, Complete amino acid sequence ofhuman serum albumin, FEBS Lett. 58 (1975) 134–137.
[25] M.R. Wilkins, I. Lindskog, E. Gasteiger, A. Bairoch, J.C. Sanchez,D.F. Hochstrasser, R.D. Appel, Detailed peptide characterizationusing peptide mass: a world wide web-accessible tool, Electrophoresis18 (1997) 403–408.

Obtaining high sequence coverage in MALDI-TOF MS / C. Wa et al. / Anal. Biochem. 349 (2006) 229–241 241
[26] O.N. Jensen, A. Podtelejnikov, M. Mann, Delayed extractionimproves speciWcity in database searches by matrix-assisted laserdesorption/ionization peptide maps, Rapid Commun. Mass Spec-trom. 10 (1996) 1371–1378.
[27] E. NordhoV, V. Egelhofer, P. Giavalisco, H. EickhoV, M. Horn, T.Przewieslik, D. Theiss, U. Schneider, H. Lehrach, J. Gobom, Large-geltwo-dimensional electrophoresis–matrix assisted laser desorption/ioniza-tion-time of Xight-mass spectrometry: an analytical challenge for study-ing complex protein mixtures, Electrophoresis 22 (2001) 2844–2855.
[28] M. Karas, D. Bachmann, U. Bahr, F. Hillenkamp, Matrix-assistedultraviolet laser desorption of non-volatile compounds, Int. J. MassSpectrom. 78 (1987) 53–68.
[29] R.C. Beavis, T. Chaudhary, B.T. Chait, �-Cyano-4-hydroxycinnamicacid as a matrix for matrix-assisted laser desorption mass spectrome-try, Org. Mass Spectrom. 27 (1992) 156–158.
[30] K. Strupat, M. Karas, F. Hillenkamp, 2,5-Dihydroxybenzoic acid: anew matrix for laser desorption-ionization mass spectrometry, Int. J.Mass Spectrom. 111 (1991) 89–102.
[31] R.C. Beavis, B.T. Chait, Cinnamic acid derivatives as matrices forultraviolet laser desorption mass spectrometry of proteins, RapidCommun. Mass Spectrom. 3 (1989) 432–435.
[32] A.I. Gusev, W.R. Wilkinson, A. Proctor, D.M. Hercules, Improvementof signal reproducibility and matrix/comatrix eVects in MALDI anal-ysis, Anal. Chem. 67 (1995) 1034–1041.
[33] P.J. Sweeney, J.M. Walker, Proteolytic enzymes for peptide produc-tion, Methods Mol. Biol. 16 (1984) 277–303.
[34] L.C. Maillard, Action of amino acids on sugars: formation of mela-noidins in a methodical way, C.R. Acad. Sci. III 154 (1912) 66–68.
[35] F. Ledl, J. Beck, M. Sengl, H. Osiander, S. Estendorfer, T. Severin, B.Huber, Chemical pathways of the Maillard reaction, Prog. Clin. Biol.Res. 304 (1989) 23–42.
[36] B. Huber, F. Ledl, Formation of 1-amino-1,4-dideoxy-2,3-hexodiu-loses and 2-aminoacetylfurans in the Maillard reaction, Carbohydr.Res. 204 (1990) 215–220.
[37] P.J. Thornalley, A. Langborg, H.S. Minhas, Formation of glyoxal,methylglyoxal, and 3-deoxyglucosone in the glycation of proteins byglucose, Biochem. J. 344 (1999) 109–116.
[38] T. Kouzuma, T. Usami, M. Yamakoshi, M. Takahashi, S. Imamura,An enzymatic method for the measurement of glycated albumin inbiological samples, Clin. Chim. Acta 324 (2002) 61–71.
[39] K. Ikeda, Y. Sakamoto, Y. Kawasaki, T. Miyake, K. Tanaka, T.Urata, Y. Katayama, S. Ueda, S. Horiuchi, Determination of glycatedalbumin by enzyme-linked boronate immunoassay (ELBIA), Clin.Chem. 44 (1998) 256–263.
[40] K. Yasukawa, High-performance aYnity chromatography system for therapid, eYcient assay of glycated albumin, J. Chromatogr. 597 (1992) 271–275.
[41] G.E. Means, M.L. Bender, Acetylation of human serum albumin by p-nitrophenyl acetate, Biochemistry 14 (1975) 4989–4994.
[42] J.T. Gerig, K.E. Katz, J.D. Reinheimer, Reactions of 2,6-dinitro-4-tri-Xuoro-methylbenzenesulfonate with human serum albumin, Biochim.Biophys. Acta 534 (1978) 196–209.
[43] M.E. Westwood, P.J. Thornalley, Molecular characteristics of methyl-glyoxal-modiWed bovine and human serum albumins: comparisonwith glucose-derived advanced glycation endproduct-modiWed serumalbumins, J. Protein Chem. 14 (1995) 359–372.
[44] P.J. Thornalley, M. Argirova, N. Ahmed, V.M. Mann, O. Argirov, A.Dawnay, Mass spectrometric monitoring of albumin in uremia, Kid-ney Int. 58 (2000) 2228–2234.
[45] N. Ahmed, P.J. Thornalley, Chromatographic assay of glycationadducts in human serum albumin glycated in vitro by derivatizationwith 6-aminoquinolyl-N-hydroxysuccinimidyl-carbamate and intrin-sic Xuorescence, Biochem. J. 364 (2002) 15–24.
Related Documents