Archaeometry 48, 3 (2006) 533–547. Printed in Singapore *Received 4 March 2005; accepted 9 December 2005. †Author email: [email protected] © University of Oxford, 2006 Blackwell Publishing Ltd Oxford, UK ARCH Archaeometry 0003-813X © University of Oxford, 2006 XXX 2006 48 3 ORIGINAL ARTICLE SIMS-SS, a new obsidian hydration dating method I. Liritzis SIMS-SS, A NEW OBSIDIAN HYDRATION DATING METHOD: ANALYSIS AND THEORETICAL PRINCIPLES* I. LIRITZIS† University of the Aegean, Department of Mediterranean Studies, Laboratory of Archaeometry, 1 Demokratias Avenue, Rhodes 85100, Greece The water diffusion mechanism in obsidian has been revisited with the advent of a new dating approach employing secondary ion mass spectrometry (SIMS). The water diffusion SIMS(+) profile and the concept of a surface saturation (SS) layer in obsidians both provide a sound basis for the new diffusion age equation (SIMS-SS) and are supported by dated world examples (Liritzis et al. 2004). Here, we present the basic physical–chemical analysis of the mass transport phenomenon on which the new dating method is based. The crucial age parameter of the SIMS-SS dating approach for archaeological obsidians—that is, the surface saturation (SS) layer—is supported by both theoretical and experimental data. KEYWORDS: DIFFUSION, SIMS, OBSIDIAN, SATURATION, ARCHAEOLOGICAL, CONCENTRATION, DATING, FICK, TRANSPORT *Received 4 March 2005; accepted 9 December 2005. † Author email: [email protected] © University of Oxford, 2006 INTRODUCTION Obsidian is a dense volcanic glass that occurs as a component of eruptions having a rhyolitic composition. Although obsidian is an amorphous natural glass, it may have vesicular and crystalline phases in small proportions. It has a typical major chemical composition of 70 – 75% SiO 2 , 10 –15% Al 2 O 3 , 3–5% Na 2 O, 2–5% K 2 O and 1–5% total Fe 2 O 3 + FeO (see articles in Shackley 1998). Obsidian was widely used for its sharp cutting edge in prehistoric times in Africa, the Mediterranean and the circum-Pacific regions. Each obsidian artefact will have a chemical composition that reflects its geological source. The potential to identify distribution patterns, and importantly to date the manufacture of an obsidian artefact by hydration dating, has made it a particularly attractive material for archaeological research. Obsidian hydration dating (OHD) was first introduced by Irving Friedman and Robert Smith (1960). They suggested that x 2 = kt, (1) where x is the thickness of the obsidian hydration rim in µ m, k is the hydration rate in µ m 2 per 1000 years and t is the age in years. Riciputi et al. (2002) proposed an alternative obsidian hydration dating system based upon the analysis of SIMS profiles. They used ‘characteristic points’ on the hydrogen profile (half-fall depth and inflection point depth) incorporated into evaluated simple hydration rate equations plotted against time constraints provided by associated 14 C dates. They demonstrated that neither the traditional OHD equation for depth (x) as a function of t 1/2 nor as t 1 fits the data. Using the t n (n ∼ 0.75) function, equation (1) provides a satisfactory fit between calibrated

Welcome message from author
This document is posted to help you gain knowledge. Please leave a comment to let me know what you think about it! Share it to your friends and learn new things together.
Transcript
Archaeometry
48
, 3 (2006) 533–547. Printed in Singapore
*Received 4 March 2005; accepted 9 December 2005.†Author email: [email protected]© University of Oxford, 2006
Blackwell Publishing LtdOxford, UKARCHArchaeometry0003-813X© University of Oxford, 2006XXX 2006483
ORIGINAL ARTICLE
SIMS-SS, a new obsidian hydration dating method
I. Liritzis
SIMS-SS, A NEW OBSIDIAN HYDRATION DATING METHOD: ANALYSIS AND THEORETICAL PRINCIPLES*
I. LIRITZIS†
University of the Aegean, Department of Mediterranean Studies, Laboratory of Archaeometry, 1 Demokratias Avenue, Rhodes 85100, Greece
The water diffusion mechanism in obsidian has been revisited with the advent of a newdating approach employing secondary ion mass spectrometry (SIMS). The water diffusionSIMS(
+
) profile and the concept of a surface saturation (SS) layer in obsidians both providea sound basis for the new diffusion age equation (SIMS-SS) and are supported by datedworld examples (Liritzis
et al.
2004). Here, we present the basic physical–chemical analysisof the mass transport phenomenon on which the new dating method is based. The crucialage parameter of the SIMS-SS dating approach for archaeological obsidians—that is, thesurface saturation (SS) layer—is supported by both theoretical and experimental data.
KEYWORDS:
DIFFUSION, SIMS, OBSIDIAN, SATURATION, ARCHAEOLOGICAL, CONCENTRATION, DATING, FICK, TRANSPORT
*Received 4 March 2005; accepted 9 December 2005.† Author email: [email protected]© University of Oxford, 2006
INTRODUCTION
Obsidian is a dense volcanic glass that occurs as a component of eruptions having a rhyoliticcomposition. Although obsidian is an amorphous natural glass, it may have vesicular andcrystalline phases in small proportions. It has a typical major chemical composition of 70–75% SiO
2
, 10–15% Al
2
O
3
, 3–5% Na
2
O, 2–5% K
2
O and 1–5% total Fe
2
O
3
+
FeO (see articlesin Shackley 1998).
Obsidian was widely used for its sharp cutting edge in prehistoric times in Africa, theMediterranean and the circum-Pacific regions. Each obsidian artefact will have a chemicalcomposition that reflects its geological source. The potential to identify distribution patterns,and importantly to date the manufacture of an obsidian artefact by hydration dating, has madeit a particularly attractive material for archaeological research.
Obsidian hydration dating (OHD) was first introduced by Irving Friedman and RobertSmith (1960). They suggested that
x
2
=
kt
, (1)
where
x
is the thickness of the obsidian hydration rim in
µ
m,
k
is the hydration rate in
µ
m
2
per1000 years and
t
is the age in years.Riciputi
et al.
(2002) proposed an alternative obsidian hydration dating system based uponthe analysis of SIMS profiles. They used ‘characteristic points’ on the hydrogen profile(half-fall depth and inflection point depth) incorporated into evaluated simple hydration rateequations plotted against time constraints provided by associated
14
C dates. They demonstratedthat neither the traditional OHD equation for depth (
x
) as a function of
t
1/2
nor as
t
1
fits thedata. Using the
t
n
(
n
∼
0.75) function, equation (1) provides a satisfactory fit between calibrated
534
I. Liritzis
© University of Oxford, 2006,
Archaeometry
48
, 3 (2006) 533–547
14
C dates and characteristic points that meet the constraint that, at time equal to zero, the depthof the hydration profile must also be zero. However, this may be an average coefficient for theavailable age range and particular obsidians may vary for other conditions (time range, environ-mental and structural). They also applied a general and an implicit finite difference (FD)model—one of several numerical approaches to solving diffusion curves (Crank 1975)—andreproduced the detailed shape of the hydrogen concentration versus depth profiles measuredin real obsidians. The FD uses numerical calculation to model the formation of the entirediffusion profile as a function of time and is fitted to the profiles as a whole (excluding thenear-surface region). Again, here the solution involves a number of assumptions, includingboundary conditions and the nature of the actual diffusion process, so that only appropriatediffusion equations could be selected. Moreover, the diffusion coefficient
D
(m
2
s
−
1
) wasempirically determined (Anovitz
et al.
1999), but for some combinations of
D
, time step
∆
t
and depth step
∆
x
, an explicit solution became numerically unstable.In general, the FD equations are based on a number of assumptions about the behaviour of
water as it diffuses into the glass. Therefore, in their report several assumptions and calibrationrequirements were made, based upon characteristic points of the SIMS H
+
diffusion profile.At the same time and later, Liritzis and Diakostamatiou (2002) promoted a different concept
of obsidian surface saturation with diffused water and introduced the new dating method,SIMS-SS (Diakostamatiou 2003; Brodkey and Liritzis 2004; Liritzis
et al.
2004, 2006;Liritzis and Ganetsos 2006). There, the hydrogen profile was best fitted by a third-order poly-nomial,
D
was taken as the inverse of the first derivative of the S-shape, and varied with anexponential dependence of the concentration (
C
), and based on Fick’s Second Law and Boltz-mann’s transformation involving auxiliary variables and boundary conditions (see below), thediffusion time (
t
) that corresponds to the entire profile was found in relation to
D
and
C
at thesurface saturation (SS) layer.
In our earlier papers, we have presented this new concept and dealt with the entire profilein terms of a concentration-dependent diffusion coefficient, without the detailed description ofthe SS layer.
Here, we provide a more detailed clarification of the assumptions and concept of the newSIMS-SS approach, emphasizing particularly the surface saturation layer (SS); for example, itsthickness, its rate of formation, its dependence on obsidian structure and its phenomenologicaldefinition. This was deemed necessary following a recent publication (Anovitz
et al.
2004),but also from recommendations made by colleagues at the most recent Obsidian Summit inTokyo (1–7 September 2004, organized by Professor Masao Suzuki).
The arguments structuring the paper refer to: (a) the diffusion phenomenon, supported byexperimentally derived hydrogen profiles in obsidians from various parts of the world; (b) thephysical meaning of surface saturation by water molecules; and (c) the analytical approach tothe shape of the H
+
profile. Although the diffusion phenomenon can be found in textbooks, abrief account is given to aid non-specialists.
THE NEW DATING METHOD (SIMS-SS): DIFFUSION PROFILES
It is common sense to formulate a general rate equation as
(rate)
=
(driving force)/(resistance). (2)
This equation states that as the driving force increases, the rate (
N
A
) increases too, while thelarger the resistance, the smaller is the rate. Let the molar flux be (
N
A
/
A
)
x
, where the mass (in
SIMS-SS, a new obsidian hydration dating method
535
© University of Oxford, 2006,
Archaeometry
48
, 3 (2006) 533–547
moles) of species A is being transferred per unit area per unit time. Experimental observationverifies that the mass flux, at steady state, is proportional to the difference in concentration andinversely proportional to the distance of diffusion. This is the concentration gradient
∂
C
A
/
∂
x
.If
N
A
is the rate and
∂
C
A
is the driving force, and if the resistance is
∂
x
/(
DA
) (where
D
is theproportionality constant, called the diffusion coefficient, and
A
is the mass of species A), then,according to the descriptive equation (2), Fick in 1855 introduced this parallel empirical pro-cess and suggested the following experimental observation at steady state (a state reached inwhich, after a time, the concentration remains constant at all points of the diffusion medium):
(
N
A
/
A
)
x
=
−
D
(
∂
C
A
/
∂
x
). (3)
The subscript
x
denotes mass transfer in the
x
-direction only. Equation (3) is one of threeanalogous forms—for heat transfer, mass transfer and momentum transfer. The three equationsare quite similar; each involves a flux term, a proportionality constant and a gradient of somemeasurable parameter. For mass transfer in solids (obsidian), which is the transfer of interestin this study, the analysis is almost identical to that of heat transfer (Brodkey and Liritzis2004). We must not fail to recognize that each of the transfer operations is totally different; themechanisms are
not
the same. It is only the mathematics of the simplified equations that is thecommon factor in the three forms of the proportionality constant.
At non-steady state (where
D
depends on
C
, and
C
no longer depends linearly on distancethrough the medium) the equation that defines the mass flux, and corresponds to equation (3),is Fick’s Second Law. This law could be derived by the general property balance or conserva-tion law, which is given as follows (Brodkey and Liritzis 2004):
input
+
generation
=
output
+
accumulation. (4)
Indeed, in a generalized mathematical notion (non-steady state and incompressible), thebalance equation is as follows:
∂
C
A
/
∂
t
=
∂
[
D
∂
CA/∂x]/∂x = (∂D/∂x)(∂CA/∂x) + D ∂ 2CA/∂x2, (5)
while for no flow or generation and variable D, it becomes
∂CA/∂t = (∂D∂CA/∂x2). (6)
The SIMS-SS dating method was based and formulated on the solution of the equation thatexpresses Fick’s Second Law (equation (6)). It is generally accepted that this law mainlyapplies to the description of the diffusion phenomenon, and for non-steady state conditions(Liritzis and Diakostamatiou 2002; Diakostamatiou 2003; Liritzis et al. 2004).
Solution of this leads to another equation, which relates the parameters that describe diffu-sion; that is, concentration C, time t and the diffusion depth x. Essentially, Fick’s Law assumesthe direction of flow during the diffusion phenomenon towards the lower concentration of thediffusing material. Equation (6) is a second-order differential equation and its solutiondemands the setting of initial and boundary conditions (Crank 1975; Brodkey and Hershey1988; Liritzis and Diakostamatiou 2002).
It should be noted that mixing due to the mass transport phenomenon of the liquid phaseinto the solid (diffusion) is spontaneous. Water diffusion phenomenon takes place in any naturalsurrounding in which obsidian comes in contact with water vapour (Smith and Van Hess 1987).
The spontaneous nature of this phenomenon is a result of the system’s progress for anequilibrium with its surrounding (the spontaneous nature is a result of a reaction producing acondition with a lower energy content). The amount of water spontaneously diffusing into
536 I. Liritzis
© University of Oxford, 2006, Archaeometry 48, 3 (2006) 533–547
obsidian is limited even if the contact is continuous. An equilibrium, between the solid–liquiddiffusing system and the surrounding medium, determines the limit for the amount of waterpermitted in the obsidian through spontaneous mixing (Perry and Green 1984; Smith and VanHess 1987).
This amount of water mass spontaneously diffused into the surface of an obsidian artefactis specific to the physical–chemical properties of the obsidian and the properties of a particulararchaeological site; that is, the properties of its surroundings. The diffusion of this specificamount of water mass into the external thin layers of the obsidian and the spontaneous mixingwill cease after a short time, and the data processed so far indicate that this time is less than afew years. That is, any more added water, diffused through the obsidian surface, will accumu-late but will not diffuse spontaneously within the obsidian external layers.
At any rate, it should be noted that the spontaneous diffusion of more water in the SS layerof obsidian will not occur, because it conflicts with the existing equilibrium. In fact, as thediffusion proceeds as a dynamic process in which transport occurs, equilibrium is not set.Once an initial thin SS layer is formed within a short time, the water concentration throughoutthe SS layer remains constant, despite the fact that the diffusion front proceeds as the waterdiffuses further into the obsidian mass. That is, the SS is in a steady state. Since at the SS layerdC/dx = 0, the flux must be zero. There can be no mass transfer (diffusion) across the SS layer.Thus, it is in equilibrium. Irreversible thermodynamics tries to address this by looking at con-ditions just a small distance from equilibrium.
Initially, the water from the external surroundings diffuses through the surface of the obsid-ian. The mass transport from the surrounding medium into obsidian is achieved through twomechanisms:• The first mechanism is through the external surface of the obsidian, which is in direct con-tact with its surroundings. This mechanism is defined as the initial mass transport between alayer of resistance on the surface, from the surroundings to the external surface.• The second mechanism is the transport of the water into the obsidian mass, in other words,the diffusion of water in obsidian.It should be stated that the first mechanism is the mass transport through a film on thesurface. The mass transport in this surface film is much faster than the mass transport in thesolid body. This phenomenon is due to the fact that, in the first case, the humidity transportfrom the surrounding is made through the air layer that exists between the surroundings andthe obsidian. This air layer exerts a much smaller resistance to water diffusion than the solidobsidian.
The mass transport essentially takes place once the molecules of the diffusing material aretransported into the mass structure of the material. The ability for this transport—that is, theexisting resistance to the diffusion—depends upon the intermolecular distance of this materialcompared to the size of the molecules of the diffusing material. Since the diffusing compoundis the same, the rate for the transport of the diffusing material differs considerably for thetransport within the solid, compared with that within the liquid or gas medium. Therefore, thetransport rates are much faster within the air medium than the liquid, and much more than inthe solid (Brodkey and Hershey 1988). The size-dependent mechanism may work as follows.
In the case of hydration dating, the reaction of water with silicates has been suggested(Ladram et al. 1997; Doremus 1999). Here the diffusion of water in these oxides influencesproperties such as viscosity, strength, chemical durability and optical absorption. The motionof network hydrogen and oxygen ions is often proposed as the mechanism of diffusion, whilethe suggested diffusion of dissociated water versus molecular water versus hydronium has also
SIMS-SS, a new obsidian hydration dating method 537
© University of Oxford, 2006, Archaeometry 48, 3 (2006) 533–547
been put forward for years (Doremus 1982; see also the review of references in the discussionsection of Anovitz et al. 2004).
The size-dependent mechanism relevant to our model assumes that water molecules ofradius rw (= 0.15 nm) occupy the interstitial sites of the obsidian and pass through ‘doorways’of radius rD, jumping from one ‘doorway’ to another. In terms of the activation energy E ofdiffusion for molecules in a glass, equation (7) has been proposed (see Doremus 1994):
E = 8πGrD(r − rD)2, (7)
where E for water in rhyolitic glass is 84 kJ mol−1 (at well below the glass transition temper-ature of 600°C); however, ageing hydration experiments on Melos obsidians at 60–90°C for103 days and 100% humidity have shown E values of 78 kJ mol−1 instead of the ∼85 kJ mol−1
found in earlier experiments conducted at 150–180°C and on other obsidians with an equivalentwater content of around 0.10% (Stevenson et al. 2003). G, the elastic shear modulus for rhy-olitic glass, is 30.1 GPa, so that the doorway radius is about 0.10 nm. Actually E is the elasticenergy to dilate a spherical cavity from radius rD to r (Frenkel 1946). Surely, more spectros-copy data regarding the bonding of the various species involved (e.g., OH−, H+, H2O, O–Si–Oor SiOH) is required to confirm either model.
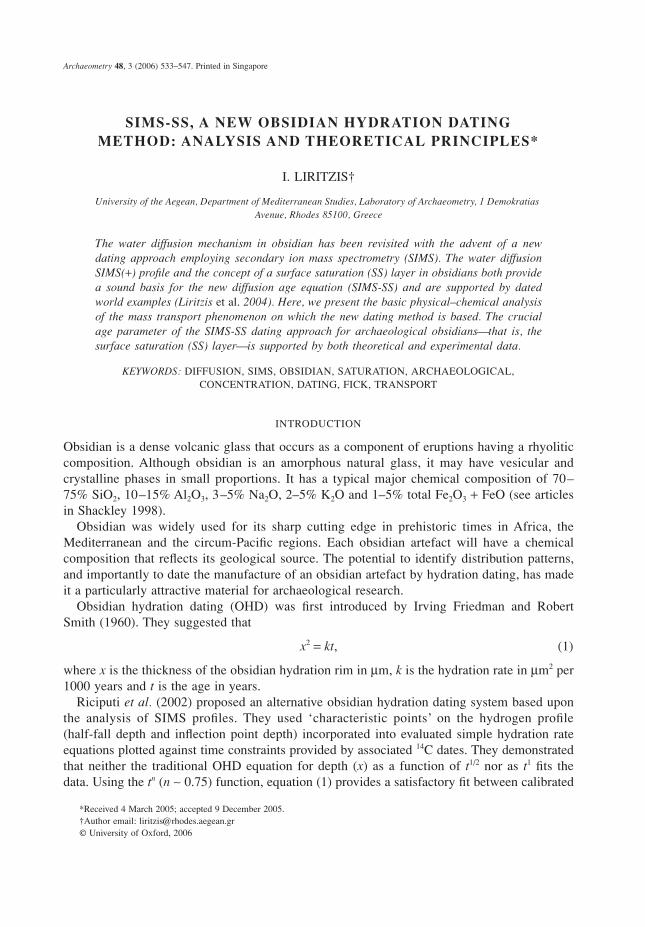
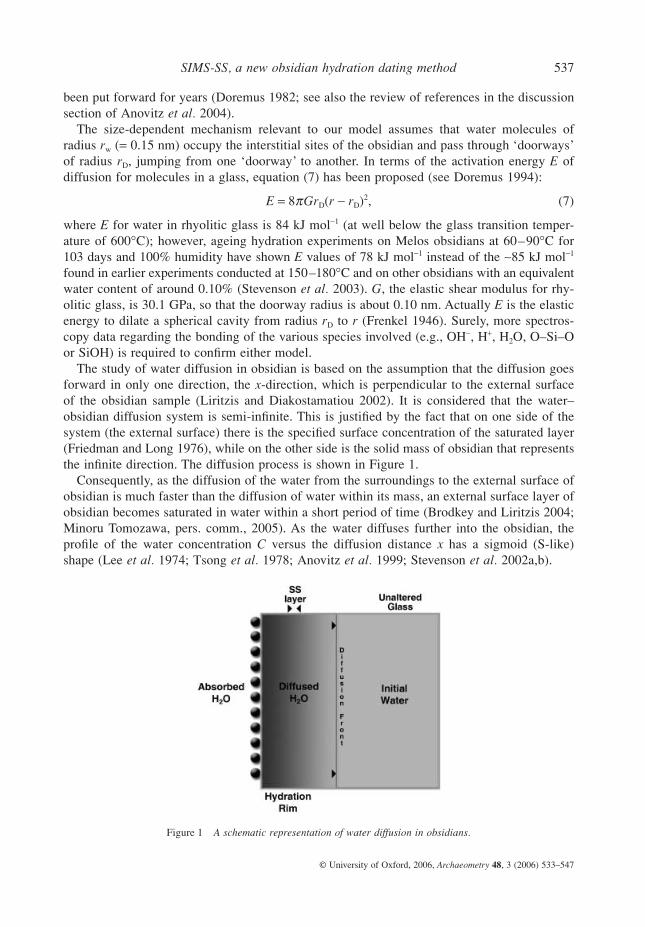
The study of water diffusion in obsidian is based on the assumption that the diffusion goesforward in only one direction, the x-direction, which is perpendicular to the external surfaceof the obsidian sample (Liritzis and Diakostamatiou 2002). It is considered that the water–obsidian diffusion system is semi-infinite. This is justified by the fact that on one side of thesystem (the external surface) there is the specified surface concentration of the saturated layer(Friedman and Long 1976), while on the other side is the solid mass of obsidian that representsthe infinite direction. The diffusion process is shown in Figure 1.
Consequently, as the diffusion of the water from the surroundings to the external surface ofobsidian is much faster than the diffusion of water within its mass, an external surface layer ofobsidian becomes saturated in water within a short period of time (Brodkey and Liritzis 2004;Minoru Tomozawa, pers. comm., 2005). As the water diffuses further into the obsidian, theprofile of the water concentration C versus the diffusion distance x has a sigmoid (S-like)shape (Lee et al. 1974; Tsong et al. 1978; Anovitz et al. 1999; Stevenson et al. 2002a,b).
Figure 1 A schematic representation of water diffusion in obsidians.
538 I. Liritzis
© University of Oxford, 2006, Archaeometry 48, 3 (2006) 533–547
The combined factors of the faster diffusion rate of water in the obsidian surface, together withthe kinetics of the diffusion mechanism for the water molecules and the specific stereochemicalstructure of obsidian, as well as the external conditions for the diffusion (temperature, relativehumidity and pressure; Smith and Van Hess 1987), all result in the formation of an approxi-mately constant boundary concentration value in the external surface layers. This is the surfacesaturated layer (the SS layer).
The saturation layer on the surface forms up to a certain depth, depending on the above-mentioned parameters. Within a short time of the start of the diffusion process, a narrowelementary layer is formed, saturated with water. The time required for this formation is con-sidered to be equal to t = 0. This assumption can be made as this time is very short comparedto the total diffusion time and can therefore be ignored. This means that it could be assumedto be the elementary saturated layer that has existed since the beginning of the diffusion pro-cess. The saturated layer front progresses over time to greater depth. The saturation conditionson the surface are the average conditions of the physical surroundings for the diffusion systemduring all the elapsed time in the particular archaeological region.
The following initial and boundary conditions are recommended for the diffusion of waterin obsidian:• Initial condition: C = C0, where C0 is the assumed homogeneous initial concentration; that
is, the concentration of the intrinsic water in obsidian for x > 0 (where x is the depth in themass structure of the obsidian sample) if the diffusion time t = 0.
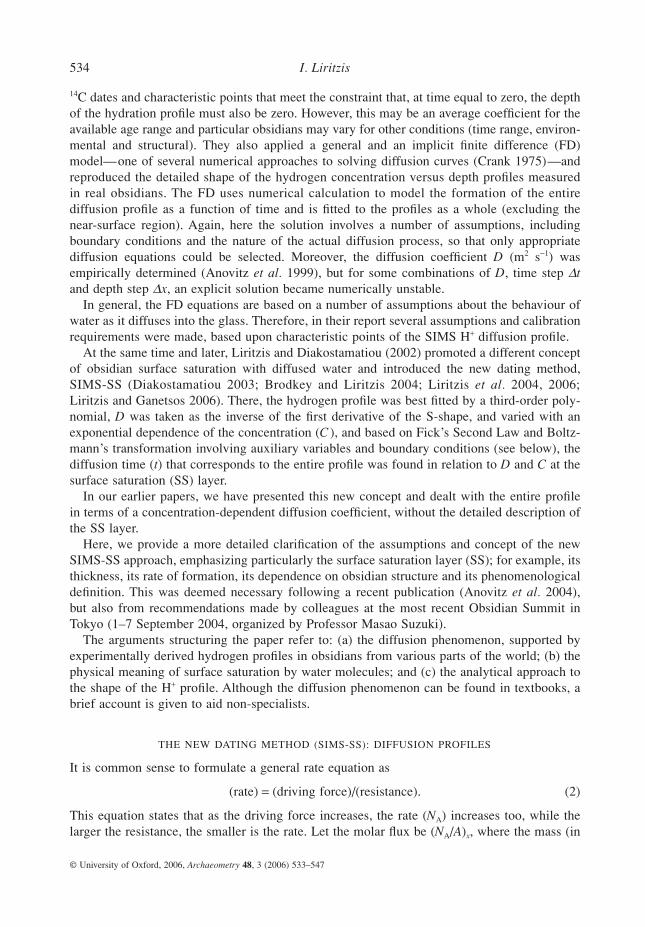
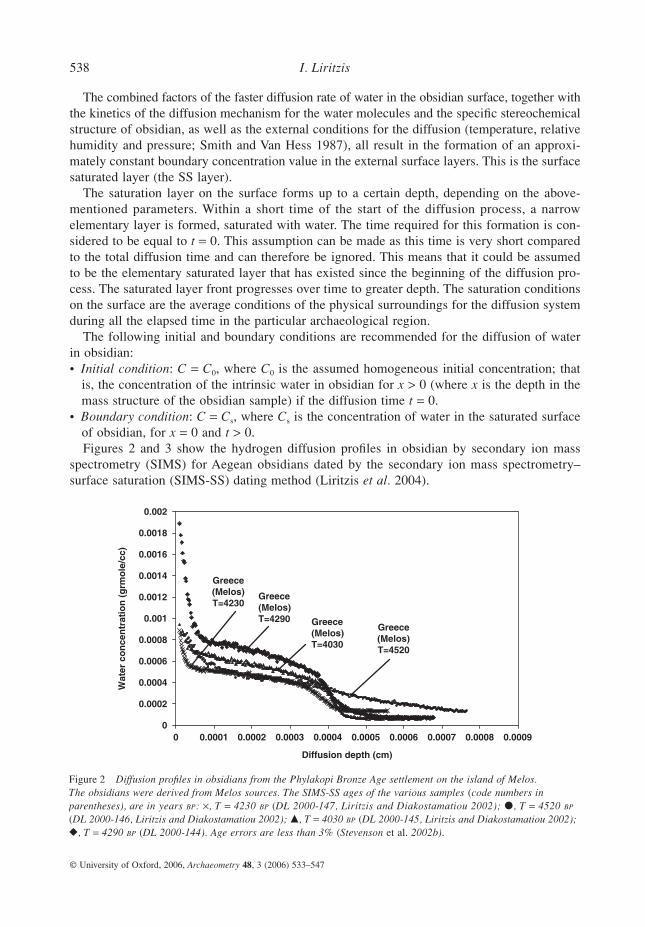
• Boundary condition: C = Cs, where Cs is the concentration of water in the saturated surfaceof obsidian, for x = 0 and t > 0.Figures 2 and 3 show the hydrogen diffusion profiles in obsidian by secondary ion mass
spectrometry (SIMS) for Aegean obsidians dated by the secondary ion mass spectrometry–surface saturation (SIMS-SS) dating method (Liritzis et al. 2004).
Figure 2 Diffusion profiles in obsidians from the Phylakopi Bronze Age settlement on the island of Melos. The obsidians were derived from Melos sources. The SIMS-SS ages of the various samples (code numbers in parentheses), are in years BP: ×, T = 4230 BP (DL 2000-147, Liritzis and Diakostamatiou 2002); �, T = 4520 BP (DL 2000-146, Liritzis and Diakostamatiou 2002); �, T = 4030 BP (DL 2000-145, Liritzis and Diakostamatiou 2002); �, T = 4290 BP (DL 2000-144). Age errors are less than 3% (Stevenson et al. 2002b).
SIMS-SS, a new obsidian hydration dating method 539
© University of Oxford, 2006, Archaeometry 48, 3 (2006) 533–547
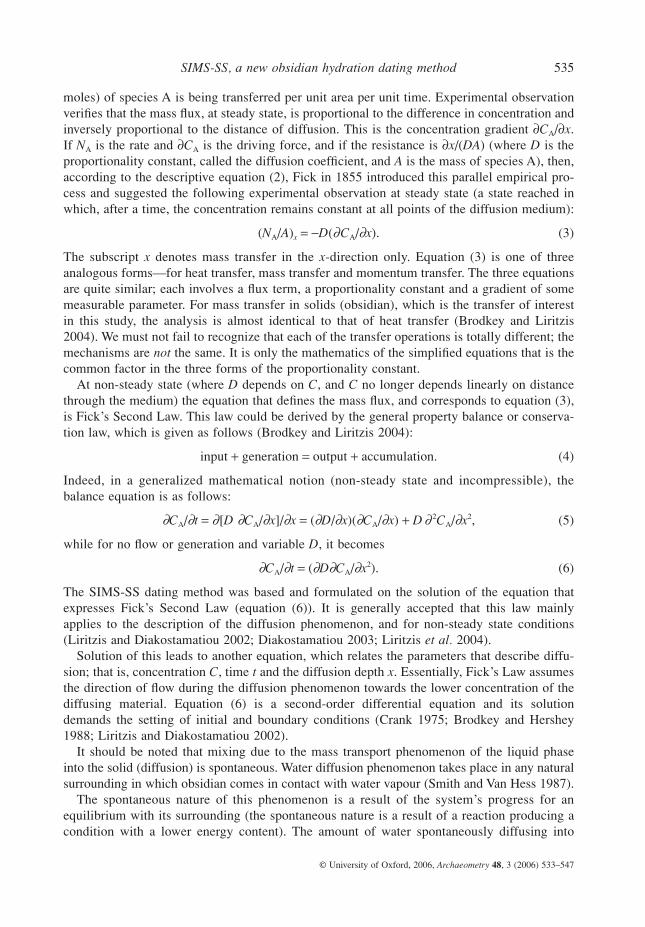
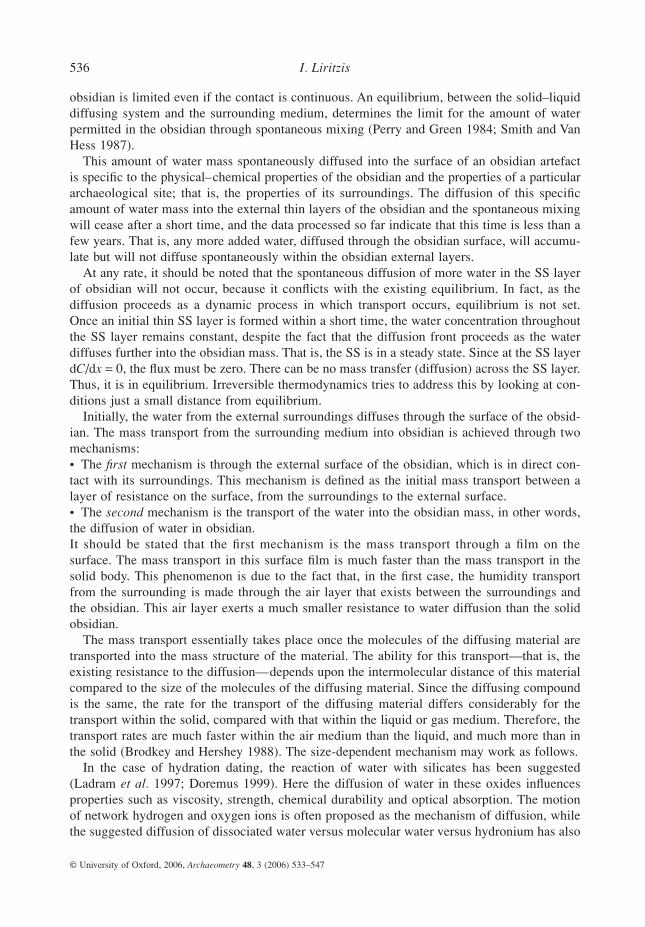
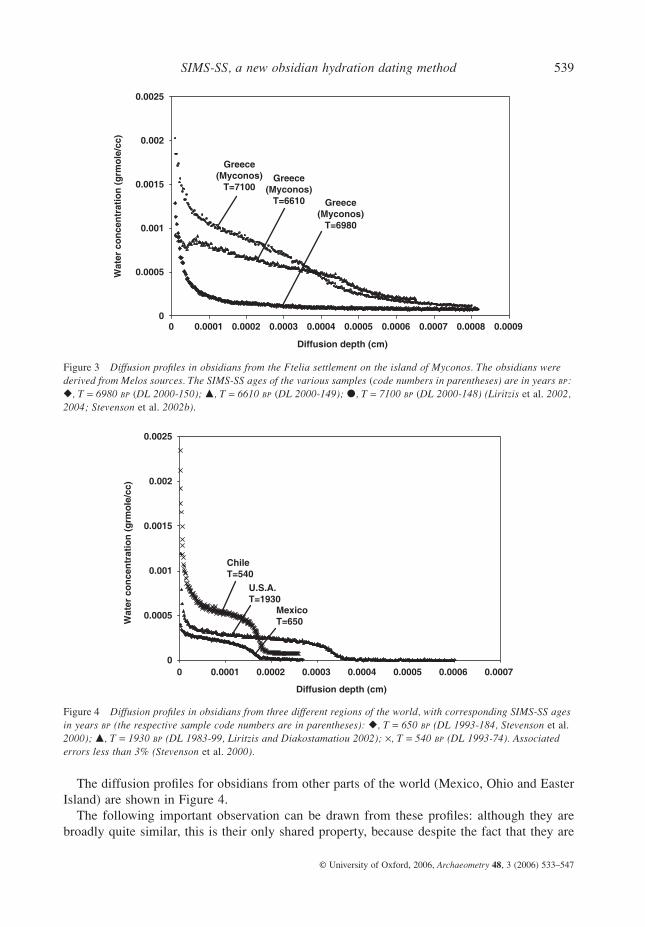
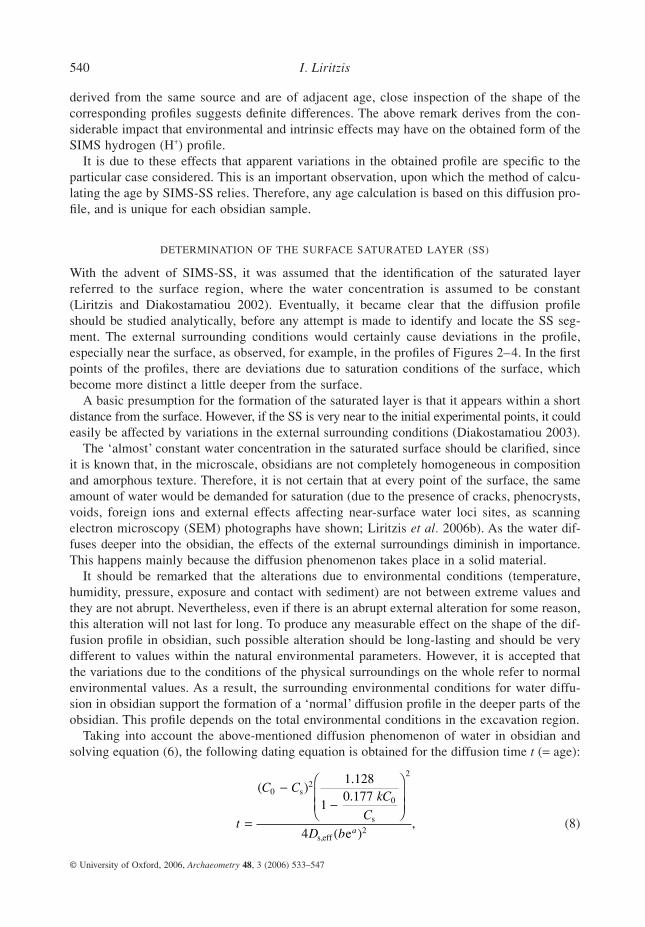
The diffusion profiles for obsidians from other parts of the world (Mexico, Ohio and EasterIsland) are shown in Figure 4.
The following important observation can be drawn from these profiles: although they arebroadly quite similar, this is their only shared property, because despite the fact that they are
Figure 3 Diffusion profiles in obsidians from the Ftelia settlement on the island of Myconos. The obsidians were derived from Melos sources. The SIMS-SS ages of the various samples (code numbers in parentheses) are in years BP: �, T = 6980 BP (DL 2000-150); �, T = 6610 BP (DL 2000-149); �, T = 7100 BP (DL 2000-148) (Liritzis et al. 2002, 2004; Stevenson et al. 2002b).
Figure 4 Diffusion profiles in obsidians from three different regions of the world, with corresponding SIMS-SS ages in years BP (the respective sample code numbers are in parentheses): �, T = 650 BP (DL 1993-184, Stevenson et al. 2000); �, T = 1930 BP (DL 1983-99, Liritzis and Diakostamatiou 2002); ×, T = 540 BP (DL 1993-74). Associated errors less than 3% (Stevenson et al. 2000).
540 I. Liritzis
© University of Oxford, 2006, Archaeometry 48, 3 (2006) 533–547
derived from the same source and are of adjacent age, close inspection of the shape of thecorresponding profiles suggests definite differences. The above remark derives from the con-siderable impact that environmental and intrinsic effects may have on the obtained form of theSIMS hydrogen (H+) profile.
It is due to these effects that apparent variations in the obtained profile are specific to theparticular case considered. This is an important observation, upon which the method of calcu-lating the age by SIMS-SS relies. Therefore, any age calculation is based on this diffusion pro-file, and is unique for each obsidian sample.
DETERMINATION OF THE SURFACE SATURATED LAYER (SS)
With the advent of SIMS-SS, it was assumed that the identification of the saturated layerreferred to the surface region, where the water concentration is assumed to be constant(Liritzis and Diakostamatiou 2002). Eventually, it became clear that the diffusion profileshould be studied analytically, before any attempt is made to identify and locate the SS seg-ment. The external surrounding conditions would certainly cause deviations in the profile,especially near the surface, as observed, for example, in the profiles of Figures 2–4. In the firstpoints of the profiles, there are deviations due to saturation conditions of the surface, whichbecome more distinct a little deeper from the surface.
A basic presumption for the formation of the saturated layer is that it appears within a shortdistance from the surface. However, if the SS is very near to the initial experimental points, it couldeasily be affected by variations in the external surrounding conditions (Diakostamatiou 2003).
The ‘almost’ constant water concentration in the saturated surface should be clarified, sinceit is known that, in the microscale, obsidians are not completely homogeneous in compositionand amorphous texture. Therefore, it is not certain that at every point of the surface, the sameamount of water would be demanded for saturation (due to the presence of cracks, phenocrysts,voids, foreign ions and external effects affecting near-surface water loci sites, as scanningelectron microscopy (SEM) photographs have shown; Liritzis et al. 2006b). As the water dif-fuses deeper into the obsidian, the effects of the external surroundings diminish in importance.This happens mainly because the diffusion phenomenon takes place in a solid material.
It should be remarked that the alterations due to environmental conditions (temperature,humidity, pressure, exposure and contact with sediment) are not between extreme values andthey are not abrupt. Nevertheless, even if there is an abrupt external alteration for some reason,this alteration will not last for long. To produce any measurable effect on the shape of the dif-fusion profile in obsidian, such possible alteration should be long-lasting and should be verydifferent to values within the natural environmental parameters. However, it is accepted thatthe variations due to the conditions of the physical surroundings on the whole refer to normalenvironmental values. As a result, the surrounding environmental conditions for water diffu-sion in obsidian support the formation of a ‘normal’ diffusion profile in the deeper parts of theobsidian. This profile depends on the total environmental conditions in the excavation region.
Taking into account the above-mentioned diffusion phenomenon of water in obsidian andsolving equation (6), the following dating equation is obtained for the diffusion time t (= age):
(8)t
C CkC
C
D b a
( ).
.
( ),=
−−
02
0
2
2
1 128
10 177
4
s
s
s,eff e
SIMS-SS, a new obsidian hydration dating method 541
© University of Oxford, 2006, Archaeometry 48, 3 (2006) 533–547
where C0 is the initial concentration of the intrinsic water in obsidian; Cs is the constantsurface concentration of water in the saturated layer; k is the constant factor that correspondsto the non-dimensional X/Xs versus C/Cs curve that characterizes the particular diffusion profile,according to Crank (1975), where k-values, presented as ek, are derived from a family ofcurves of ek versus X/Xs for certain C/Cs; and
D = Ds exp(kC/Cs). (9)
Ds,eff is the active (effective) diffusion coefficient of water in the saturated surface layer; and aand b are the coefficients of the fitting curve for the diffusion profile. Xs is used in the calcu-lations of the gradient dC/dx of the C versus X profile. For C = Cs and X = Xs, we set diffusioncoefficient D = Ds. According to Fick’s First Law, Ds is the inverse of gradient; thus it is
(∂C/∂x)x=0 = b exp(a) (10)
and
Ds = (flux/gradient) × 10−11 years. (11)
In the calculation of D, the multiplication by 10−11 has been performed in order to convert theunits of D from the calculated µm2 per 1000 years to cm2 per year, which are the units used inSIMS-SS. For X = Xs, Ds is computed from equation (11).
However, with Ds the age is far from right. It is well known that the diffusion coefficient isa diffusion constant, which could be derived mostly from the experimental data (Brodkey andHershey 1988). Therefore, a relationship should be devised relating the coefficient Ds to aneffective coefficient Ds,eff; that is, Ds/Ds,eff versus Ds × 10−11.
The empirical Ds,eff is determined for obsidians with a well-known archaeological age (t).Then, the obtained relationship, using the TableCurve 2D statistical package (Version 4 forWindows 95, NT and 3.1), is of the type y−1 = a + b/x2; it is constructed from 26 different datedsamples and becomes
Ds,eff = aDs + b/(1022 × Ds), (12)
where a = 8.051 × 10⁻⁶ and b = 0.999 (r2 = 0.999).The derivation of equation (8) is given elsewhere (Liritzis et al. 2004). Equation (8) gives
the diffusion time, which includes the time required for the formation of the saturated layer,the depth Χs and the concentration Cs. Needless to say, the SS layer formed with the highestconcentration and with a progressing front during the diffusion time is defined by Cs and Xs.
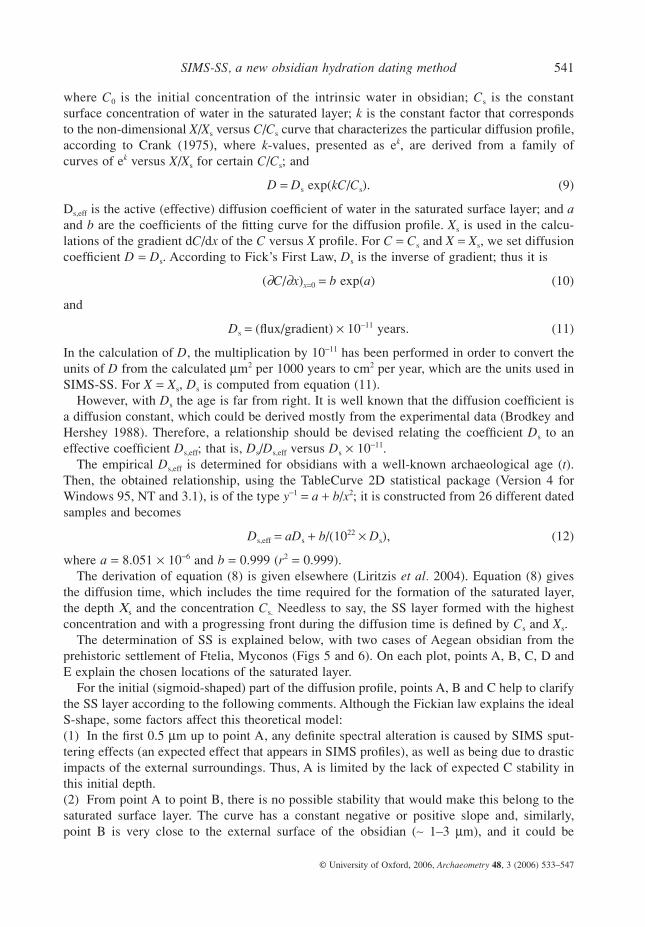
The determination of SS is explained below, with two cases of Aegean obsidian from theprehistoric settlement of Ftelia, Myconos (Figs 5 and 6). On each plot, points A, B, C, D andE explain the chosen locations of the saturated layer.
For the initial (sigmoid-shaped) part of the diffusion profile, points A, B and C help to clarifythe SS layer according to the following comments. Although the Fickian law explains the idealS-shape, some factors affect this theoretical model:(1) In the first 0.5 µm up to point Α, any definite spectral alteration is caused by SIMS sput-tering effects (an expected effect that appears in SIMS profiles), as well as being due to drasticimpacts of the external surroundings. Thus, A is limited by the lack of expected C stability inthis initial depth.(2) From point Α to point Β, there is no possible stability that would make this belong to thesaturated surface layer. The curve has a constant negative or positive slope and, similarly,point B is very close to the external surface of the obsidian (∼ 1–3 µm), and it could be
542 I. Liritzis
© University of Oxford, 2006, Archaeometry 48, 3 (2006) 533–547
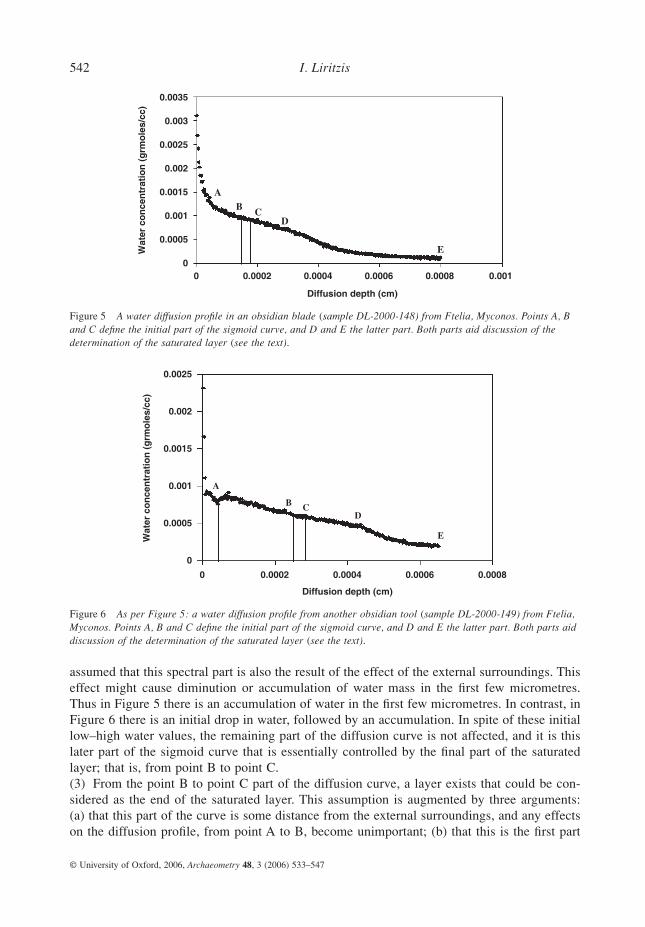
assumed that this spectral part is also the result of the effect of the external surroundings. Thiseffect might cause diminution or accumulation of water mass in the first few micrometres.Thus in Figure 5 there is an accumulation of water in the first few micrometres. In contrast, inFigure 6 there is an initial drop in water, followed by an accumulation. In spite of these initiallow–high water values, the remaining part of the diffusion curve is not affected, and it is thislater part of the sigmoid curve that is essentially controlled by the final part of the saturatedlayer; that is, from point B to point C.(3) From the point Β to point C part of the diffusion curve, a layer exists that could be con-sidered as the end of the saturated layer. This assumption is augmented by three arguments:(a) that this part of the curve is some distance from the external surroundings, and any effectson the diffusion profile, from point A to B, become unimportant; (b) that this is the first part
Figure 5 A water diffusion profile in an obsidian blade (sample DL-2000-148) from Ftelia, Myconos. Points A, B and C define the initial part of the sigmoid curve, and D and E the latter part. Both parts aid discussion of the determination of the saturated layer (see the text).
Figure 6 As per Figure 5: a water diffusion profile from another obsidian tool (sample DL-2000-149) from Ftelia, Myconos. Points A, B and C define the initial part of the sigmoid curve, and D and E the latter part. Both parts aid discussion of the determination of the saturated layer (see the text).
SIMS-SS, a new obsidian hydration dating method 543
© University of Oxford, 2006, Archaeometry 48, 3 (2006) 533–547
of the curve on which the assumption of constant concentration is valid, and therefore it is thispart of the curve that satisfies the necessary condition for the constant concentration of the sat-urated layer; and (c) that this particular sigmoid shape of the total diffusion profile is also aresult of the stereochemical structure of each particular obsidian sample. This means that thediffusion curve starts with the saturated layer and shifts to deeper layers with the rest of thediffusion profile.
The SS layer is a phenomenological convenience: thus, at present it is not possible to defineit in terms of the basic structure of obsidian. With a possible full numerical approach, we maylearn more about it. However, at present we may say that it consists of packed water moleculesfilling in interstitial sites in the Si network. Its thickness varies depending on the particularobsidian structure, and from the data obtained so far it lies between 0.15 and 0.30 µm. Therate of formation depends on structure and bulk composition; that is, on cracks, porosity, den-sity, crystallization and so on.
The latter claim can be supported by the following facts: it has been shown (Stevenson et al.1996; Ambrose and Stevenson 2004) that the density in 31 obsidians is correlated (r2) withseveral chemical elements of major oxides such as Al2O3 (0.11), SiO2 (−0.84), FeO (0.75),TiO2 (0.76), Cl (0.73), CaO (0.39), K2O (−0.29) and Na2O (0.64), with confidence levelsbetween 11% and 84%. Apart from silica, which correlates inversely with density, the othermajor elements with significant correlations are additive in increasing obsidian density. Therelationship of connate water (intrinsic to the lattice since formation from magma) with silicaand iron provides a two-phase correlation, with a major change around 76%, while FeO showsthe same effect in reverse at around 1.5%, which indicates that density has a generally linearrelationship. In the case of silica and iron, the relationship between these elements and wateris more complex; that is, in their major influence on density, these elements also influence theconnate water accommodation in obsidians. The additive effect of Ca, Na and Ti reinforces thedensity figure but, overall, silica maintains its strong correlation with the final density value.From this, it appears that a more open structure of the obsidian aluminosilicate glass canaccommodate an increasing volume of water with an increasing silicate content above ∼76%SiO2.
The relationship between density and water content shows a two-component curve, with aninflection at a density of about 2.35 and a water content of around 0.15% (Stevenson et al.1996; Ambrose and Stevenson 2004). The ‘dry’ obsidians that are denser than 2.35 have avery low water to density ratio, while those less dense than 2.35 have a high water to densityratio and can be typified as ‘wet’. The relationship between water content and density appearsin other reports, where it is generally seen as an accommodation of the silicate structure to thedepolymerizing effect of hydroxyl in silicate glasses (Heatherington and Jack 1962, 131).
Furthermore, we have correlated the density with more than one chemical oxide of the same31 obsidian data above and found that density correlates (a) with Fe and Ti at a 91.4% level,(b) with Al, Fe and water at a 96.8% level, (c) with Fe, Cl, Si and Ti at a 95.6% level and (d)with Fe, water and Ti at a 92.8% level. As with the simple systems, the diffusion coefficientdepends on the material’s composition and on the physical nature of the material (e.g., poresetc.); here also, the obsidian structure reflected in the density depends on the bulk compositionand the connate water content, and the water diffusivity depends on these factors.
The SS layer is visualized as the divider between the two regions A–B and D–E. Therefore,we have a first region, the first part of the profile A–B, which does not look like moisture-driven diffusion through glass. Here, a thin-film concept may work better than the use of aFickian law. In this case, a concentration difference, ∆C = C1 − C2, and a transfer coefficient, kt,
544 I. Liritzis
© University of Oxford, 2006, Archaeometry 48, 3 (2006) 533–547
are used to replace the more fundamental transport equations such as Fick’s Law. This needsfurther consideration. Then, the dividing region of no mass transfer (the SS layer) correspondsto B–C, and following that lies the Fickian diffusion region (D–E) (Figs 5 and 6).
For these reasons, the boundary condition that is used for the solution of equation (6) inorder to derive equation (8) is justified. The inner part of the diffusion profile is defined at thestart of this saturated layer since, according to equation (5), the mass transport is a result ofthe differential difference in the concentration between neighbouring points. It is specified thatthe diffusion coefficient in the obsidian–water diffusion system depends upon the water con-centration at each profile point (Diakostamatiou 2003).
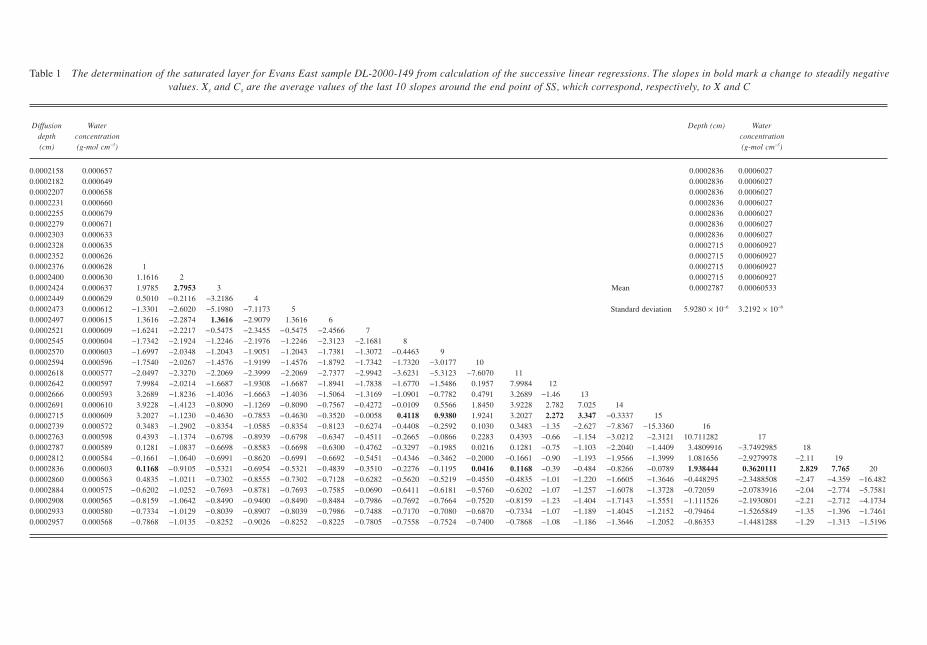
On the whole, the spectral deviations in the first experimental points of the profile do nothave any effect on the rest of the diffusion profile. It is a reasonable assumption that the satu-rated layer has certainly started to emerge right from the first point of the profile; it progressesincreasingly and within a short time reaches the SS layer at point C, thereafter moving deeperinto the obsidian, following the diffused water front. The almost constant concentration valuefor the interval B–C—and therefore the location of C—can be computed from the slopes ofthe regression lines (the method of successive linear regressions; Liritzis et al. 2004) connect-ing the points from A up to the inflection part of the S-curve (Table 1), and by applying aleast-squares test on successively increasing segments the respective slopes were evaluated.Some of these straight lines have a slope value near zero. This implies that they are almostparallel to the x-axes, and that the C values are constant. Alternatively, the SS is defined fromthree derivatives of the best third-order polynomial fit (or on the raw data) of the profile notnecessarily coupled with successive linear regressions (Liritzis et al. 2005).
The above-mentioned remarks make clear the importance and clarify the meaning of thesaturated layer of water in obsidian. The meaning of the saturated layer is one of the basicprinciples upon which the SIMS-SS obsidian hydration dating method relies.
The above analysis explains some specific terminology for the non-specialist, and at thesame time elucidates misunderstanding (e.g., by Anovitz et al. 2004) of our earlier papersabout SIMS-SS and the basic scientific background. Anovitz et al. have had a misconceptionregarding the surface saturation layer, indicating prolonged increase of C over time. Contraryto their conclusion, their data profiles for Pachuca obsidian samples experimentally hydratedat 75°C instead support the short time interval of the occurrence of saturation. Likewise, thenatural Chalco samples (their fig. 7), within the large errors involved, imply that the chosenBoltzmann–Matano model is not applicable. On the other hand, referenced comparisons withother experiments are incompatible due to essential differences in all conditions (pressure,temperature and environmental surroundings).
CONCLUSIONS
The new SIMS-SS obsidian dating method is based on Fick’s Law of Diffusion, and a solutionof the concentration to hydration distance curves. It is based upon the surface saturation layerand the analytical mathematical solution describes the diffusion time. The diffusion coefficientis assumed to vary exponentially and derives from the first derivative of the diffusion profile.The approach is phenomenological, but is founded on solid physico-chemical principles ofdiffusion.
The most representative equation to describe the variation of concentration of the materialthat diffuses, as a function of time and distance, is equation (6) for the mass transport in onedirection, which is applied to diffusion phenomena at a non-steady state. Equation (6) derives
SIMS-SS, a new
obsidian hydration dating method
545
© U
niversity of Oxford, 2006, A
rchaeometry 48, 3 (2006) 533–547
Table 1 The determination of the saturated layer for Evans East sample DL-2000-149 from calculation of the successive linear regressions. The slopes in bold mark a change to steadily negativevalues. Xs and Cs are the average values of the last 10 slopes around the end point of SS, which correspond, respectively, to X and C
Diffusion depth (cm)
Water concentration (g-mol cm−3)
Depth (cm) Water concentration (g-mol cm−3)
0.0002158 0.000657 0.0002836 0.00060270.0002182 0.000649 0.0002836 0.00060270.0002207 0.000658 0.0002836 0.00060270.0002231 0.000660 0.0002836 0.00060270.0002255 0.000679 0.0002836 0.00060270.0002279 0.000671 0.0002836 0.00060270.0002303 0.000633 0.0002836 0.00060270.0002328 0.000635 0.0002715 0.000609270.0002352 0.000626 0.0002715 0.000609270.0002376 0.000628 1 0.0002715 0.000609270.0002400 0.000630 1.1616 2 0.0002715 0.000609270.0002424 0.000637 1.9785 2.7953 3 Mean 0.0002787 0.000605330.0002449 0.000629 0.5010 −0.2116 −3.2186 40.0002473 0.000612 −1.3301 −2.6020 −5.1980 −7.1173 5 Standard deviation 5.9280 × 10⁻⁶ 3.2192 × 10⁻⁶
0.0002497 0.000615 1.3616 −2.2874 1.3616 −2.9079 1.3616 60.0002521 0.000609 −1.6241 −2.2217 −0.5475 −2.3455 −0.5475 −2.4566 70.0002545 0.000604 −1.7342 −2.1924 −1.2246 −2.1976 −1.2246 −2.3123 −2.1681 80.0002570 0.000603 −1.6997 −2.0348 −1.2043 −1.9051 −1.2043 −1.7381 −1.3072 −0.4463 90.0002594 0.000596 −1.7540 −2.0267 −1.4576 −1.9199 −1.4576 −1.8792 −1.7342 −1.7320 −3.0177 100.0002618 0.000577 −2.0497 −2.3270 −2.2069 −2.3999 −2.2069 −2.7377 −2.9942 −3.6231 −5.3123 −7.6070 110.0002642 0.000597 7.9984 −2.0214 −1.6687 −1.9308 −1.6687 −1.8941 −1.7838 −1.6770 −1.5486 0.1957 7.9984 120.0002666 0.000593 3.2689 −1.8236 −1.4036 −1.6663 −1.4036 −1.5064 −1.3169 −1.0901 −0.7782 0.4791 3.2689 −1.46 130.0002691 0.000610 3.9228 −1.4123 −0.8090 −1.1269 −0.8090 −0.7567 −0.4272 −0.0109 0.5566 1.8450 3.9228 2.782 7.025 140.0002715 0.000609 3.2027 −1.1230 −0.4630 −0.7853 −0.4630 −0.3520 −0.0058 0.4118 0.9380 1.9241 3.2027 2.272 3.347 −0.3337 150.0002739 0.000572 0.3483 −1.2902 −0.8354 −1.0585 −0.8354 −0.8123 −0.6274 −0.4408 −0.2592 0.1030 0.3483 −1.35 −2.627 −7.8367 −15.3360 160.0002763 0.000598 0.4393 −1.1374 −0.6798 −0.8939 −0.6798 −0.6347 −0.4511 −0.2665 −0.0866 0.2283 0.4393 −0.66 −1.154 −3.0212 −2.3121 10.711282 170.0002787 0.000589 0.1281 −1.0837 −0.6698 −0.8583 −0.6698 −0.6300 −0.4762 −0.3297 −0.1985 0.0216 0.1281 −0.75 −1.103 −2.2040 −1.4409 3.4809916 −3.7492985 180.0002812 0.000584 −0.1661 −1.0640 −0.6991 −0.8620 −0.6991 −0.6692 −0.5451 −0.4346 −0.3462 −0.2000 −0.1661 −0.90 −1.193 −1.9566 −1.3999 1.081656 −2.9279978 −2.11 190.0002836 0.000603 0.1168 −0.9105 −0.5321 −0.6954 −0.5321 −0.4839 −0.3510 −0.2276 −0.1195 0.0416 0.1168 −0.39 −0.484 −0.8266 −0.0789 1.938444 0.3620111 2.829 7.765 200.0002860 0.000563 0.4835 −1.0211 −0.7302 −0.8555 −0.7302 −0.7128 −0.6282 −0.5620 −0.5219 −0.4550 −0.4835 −1.01 −1.220 −1.6605 −1.3646 −0.448295 −2.3488508 −2.47 −4.359 −16.4820.0002884 0.000575 −0.6202 −1.0252 −0.7693 −0.8781 −0.7693 −0.7585 −0.0690 −0.6411 −0.6181 −0.5760 −0.6202 −1.07 −1.257 −1.6078 −1.3728 −0.72059 −2.0783916 −2.04 −2.774 −5.75810.0002908 0.000565 −0.8159 −1.0642 −0.8490 −0.9400 −0.8490 −0.8484 −0.7986 −0.7692 −0.7664 −0.7520 −0.8159 −1.23 −1.404 −1.7143 −1.5551 −1.111526 −2.1930801 −2.21 −2.712 −4.17340.0002933 0.000580 −0.7334 −1.0129 −0.8039 −0.8907 −0.8039 −0.7986 −0.7488 −0.7170 −0.7080 −0.6870 −0.7334 −1.07 −1.189 −1.4045 −1.2152 −0.79464 −1.5265849 −1.35 −1.396 −1.74610.0002957 0.000568 −0.7868 −1.0135 −0.8252 −0.9026 −0.8252 −0.8225 −0.7805 −0.7558 −0.7524 −0.7400 −0.7868 −1.08 −1.186 −1.3646 −1.2052 −0.86353 −1.4481288 −1.29 −1.313 −1.5196
546 I. Liritzis
© University of Oxford, 2006, Archaeometry 48, 3 (2006) 533–547
from the principle of mass conservation in the diffusing system. This principle is valid in thespecific diffusion phenomenon, since it takes place in the natural surrounding conditions, andthere is no chemical reaction or production of mass. The boundary condition used for the solu-tion of equation (6) is the result of local equilibrium conditions on the obsidian surface.
The SS layer is formed within a short period of time and there is no true time-dependenceof the ‘surface concentration’, as wrongly stated by Anovitz et al. (2004).
The excellent agreement between SIMS-SS ages and well-known archaeological age obsidiansfrom other parts of the world (Diakostamatiou 2003; Liritzis et al. 2004, 2005, 2006a) rein-forces the validity of the method.
ACKNOWLEDGEMENTS
I thank Dr Wal Ambrose for editing and helpful comments, Professor M. Tomozawa (RensselaerPolytechnic Institute) and Professor R. Brodkey (Ohio State University) for critical comments,useful discussions and helpful correspondence, Dr Chris Stevenson (Virginia Department ofHistorical Resources) for useful evaluation and Dr M. Diakostamatiou for providing the SIMSplots from her thesis.
REFERENCES
Ambrose, W. B., and Stevenson, C. M., 2004, Obsidian density, connate water and hydration dating, MediterraneanArchaeology and Archaeometry, 4(2), 5–16.
Anovitz, L. M., Elam, J. M., Riciputi, L. R., and Cole, D. R., 1999, The failure of obsidian hydration dating: sources,implications, and new directions, Journal of Archaeological Science, 26, 735–52.
Anovitz, L. M., Elam, J. M., Riciputi, L. R., and Cole, D. R., 2004, Isothermal time-series determination of the rateof diffusion of water in Pachuca obsidian, Archaeometry, 46, 301–26.
Brodkey, S. R., and Hershey, C. H., 1988, Transport phenomena: a unified approach, McGraw-Hill., Singapore.Brodkey, S. R., and Liritzis, I., 2004, The dating of obsidian: a possible application for transport phenomena (a
tutorial), Mediterranean Archaeology and Archaeometry, 4(2), 67–82.Crank, J., 1975, The mathematics of diffusion, 2nd edn, Oxford University Press, New York.Diakostamatiou, M., 2003, Dating of hydrated obsidian artifacts from Mediterranean archaeological sites, Ph.D.
thesis, University of the Aegean, Department of Mediterranean Studies, Laboratory of Archaeometry, Rhodes,Greece (in Greek).
Doremus, R. H., 1999, Diffusion of water in crystalline and glassy oxides: diffusion-reaction model, Journal ofMaterials Research, 14(9), 3754–8.
Doremus, R. H., 1982, Interdiffusion of alkali and hydronium ions in glass: partial ionization, Journal of Non-Crystalline Solids, 48, 431–6.
Doremus, R. H., 1994, Glass science, 145, John Wiley, New York.Frenkel, J., 1946, Kinetic theory of liquids, 10, Oxford University Press, London.Friedman, I., and Smith, R., 1960, A new dating method using obsidian: part 1, the development of the method,
American Antiquity, 25, 476–522.Friedman, I., and Long, W., 1976, Hydration rate of obsidian, Science, 191, 347–52.Heatherington, G., and Jack, K. J., 1962, Water in vitreous silica, part I. Influence of ‘water’ content on the properties
of vitreous silica, Physics and Chemistry of Glasses, 3(4), 129–33.Ladram, A., Montagne, J.-J., Nicolas, P., Bulant, M., Borover, G. Y., Bartle, K. D., Taylor, N., Burchill, P., Youxue,
Z., Jenkins, J., and Zhengjiu, X., 1997, Kinetics of the reaction H2O + O = 2OH in rhyolitic glasses upon cooling:geospeedometry and composition with glass transition, Geochimica et Cosmochimica Acta, 61(11), 2167–73.
Lee, R. R., Leich, D. A., Tombrello, T. A., Ericson, J. E., and Friedman, I., 1974, Obsidian hydration profile measure-ments using a nuclear reaction technique, Nature, 250, 44–7.
Liritzis, I., and Diakostamatiou, M., 2002, Towards a new method of obsidian hydration dating with secondary ionmass spectrometry via a surface saturation layer approach, Mediterranean Archaeology and Archaeometry, 2(1),3–20.
SIMS-SS, a new obsidian hydration dating method 547
© University of Oxford, 2006, Archaeometry 48, 3 (2006) 533–547
Liritzis, I., and Ganetsos, T., 2006, Obsidian hydration dating from SIMS H+ profiling based on saturated surface(SS) layer using new software, in SIMS XV, Manchester 2005, Abstract book, 62 (Applied Surface Science, inpress).
Liritzis, I., Ganetsos, T., and Laskaris, N., 2005, Review and software assessment of the recent SIMS-SS obsidianhydration dating method, Mediterranean Archaeology and Archaeometry, 5(2), 75–91.
Liritzis, I., Diakostamatiou, M., Stevenson, C. M., Novak, S., and Abdelrehim, I., 2004, Dating of hydrated obsidiansurfaces by SIMS-SS, Journal of Radioanalytical Nuclear Chemistry, 261(1), 51–60.
Liritzis, I., Stevenson, C.M., Novak, S.W., Abdelrehim, I., Perdikatsis, V., and Bonini, M., 2006b, New prospects inobsidian dating: an integrated approach, BAR Intern. Series (in press).
Liritzis, I., Suzuki, M., Yamashina, A., Otake, N., and Watanabe, K., 2006a, SIMS(+) profiling of Japanese obsidians,in Proceedings of Obsidian Summit, Kyoto University, 2–5 September 2003 (eds M. Suzuki and W. Ambrose), inpress.
Perry, R. H., and Green, D., 1984, Perry’s chemical engineers’ handbook, 6th edn, McGraw-Hill, London.Riciputi, L., Elam, J. M., Anovitz, L. M., and Cole, D. R., 2002, Obsidian diffusion dating by secondary ion mass
spectrometry: a test using results from mount 65, Chalco, Mexico, Journal of Archaeological Science, 29(10),1055–75.
Shackley, M. S. (ed.), 1998, Archaeological obsidian studies: method and theory, Plenum Press, New York.Smith, J. M., and Van Hess, H. C., 1987, Introduction to chemical engineering thermodynamics, 4th edn, McGraw-Hill,
New York.Stevenson, C. M., Sheppard, P. J., Sutton, D. G., and Ambrose, W., 1996, Advances in the hydration dating of New
Zealand obsidian, Journal of Archaeological Science, 23(2), 233–42.Stevenson, M. C., Abdelrehim, I. M., and Novak, S. W., 2000, Infrared photoacoustic and secondary ion mass
spectrometry measurements of obsidian hydration rims, Journal of Archaeological Science, 28, 109–15.Stevenson, M. C., Liritzis, I., and Diakostamatiou, M., 2002a, A preliminary report of the hydration dating of Melos,
Yiali and Antiparos obsidian, in Hyalos–Vitrum–Glass. History, technology and conservation of glass and vitreousmaterials in the Hellenic world, first international conference, Rhodes, Greece, 1–4 April 2001 (ed. G. Kordas),Athens.
Stevenson, M. C., Liritzis, I., Diakostamatiou, M., and Novak, S. W., 2002b, Investigations towards the hydrationdating of Aegean obsidian, Mediterranean Archaeology and Archaeometry, 2(1), 93–109.
Stevenson, C., Liritzis, I., Diakostamatiou, M., Novak, S. W., and Abdelrehim, I., 2003, The dating of hydrated obsidiansurfaces by SIMS-SS: an evaluation with data from Aegean and Easter islands, Mexico and USA, in Recentadvances in obsidian dating and characterization, 2–5 July 2003, Melos Island, Greece, Abstract book, 14–15,Laboratory of Archaeometry, Department of Mediterranean Studies, University of the Aegean, Rhodes, Greece.
Tsong, I. S. T., Houser, C. A., Yusef, N. A., Messier, R. F., White, W. B., and Michels, J. W., 1978, Obsidian hydrationprofiles measured by sputter-induced optical emission, Science, 201, 339–41.
Related Documents