arXiv:astro-ph/9707125v2 22 Jul 1997 OBSERVATIONS OF ACCRETING PULSARS Lars Bildsten 1 , Deepto Chakrabarty 2 , John Chiu 3 , Mark H. Finger 4,5 , Danny T. Koh 3 , Robert W. Nelson 3,6 , Thomas A. Prince 3 , Bradley C. Rubin 4,7 , D. Matthew Scott 4,5 , Mark Stollberg 4,8 , Brian A. Vaughan 3 , Colleen A. Wilson 4 , and Robert B. Wilson 4 To Appear In Astrophysical Journal Supplements 1997, 113, #2 We summarize five years of continuous monitoring of accretion-powered pulsars with the Burst and Transient Source Experiment (BATSE) on the Compton Gamma Ray Observatory. Our 20–70 keV observa- tions have determined or refined the orbital parameters of 13 binaries, discovered 5 new transient accreting pulsars, measured the pulsed flux history during outbursts of 12 transients (GRO J1744–28, 4U 0115+634, GRO J1750–27, GS 0834–430, 2S 1417–624, GRO J1948+32, EXO 2030+375, GRO J1008–57, A 0535+26, GRO J2058+42, 4U 1145–619 and A 1118–616), and also measured the accretion torque history of during outbursts of 6 of those transients whose orbital parameters were also known. We have also continuously measured the pulsed flux and spin frequency for eight persistently accreting pulsars (Her X-1, Cen X-3, Vela X-1, OAO 1657–415, GX 301–2, 4U 1626–67, 4U 1538–52, and GX 1+4). Because of their continuity and uniformity over a long baseline, BATSE observations have provided new insights into the long-term behavior of accreting magnetic stars. We have found that all accreting pulsars show stochastic variations in their spin frequencies and luminosities, including those displaying secular spin-up or spin-down on long time scales, blurring the conventional distinction between disk-fed and wind-fed binaries. Pulsed flux and accretion torque are strongly correlated in outbursts of transient accreting pulsars, but uncorrelated, or even anticorrelated, in persistent sources. We describe daily folded pulse profiles, frequency, and flux measure- ments that are available through the Compton Observatory Science Support Center at NASA-Goddard Space Flight Center. Subject headings: Accretion, Accretion Disks — Stars: Binaries: General — Stars: Pulsars: General — X-Rays: Stars — Stars: Neutron 1 Department of Physics and Department of Astronomy, University of California, Berkeley, CA 94720; bildsten@fire.berkeley.edu 2 Center for Space Research, Massachusetts Institute of Technology, Cambridge MA 02139; [email protected] 3 Space Radiation Laboratory, California Institute of Technology, Pasadena, CA 91125; [email protected], [email protected], [email protected], [email protected], [email protected] 4 Space Science Laboratory, NASA/Marshall Space Flight Center, ES84, Huntsville, AL 35812; fi[email protected], [email protected], [email protected], [email protected], [email protected], [email protected] 5 Universities Space Research Association 6 Theoretical Astrophysics 130-33, California Institute of Technology, Pasadena, CA 91125 7 Current address: Cosmic Radiation Laboratory, Institute for Physical and Chemical Research (RIKEN), Wako-shi, Saitama 351-01, Japan 8 Department of Physics, University of Alabama, Hunstville, AL 35899

Welcome message from author
This document is posted to help you gain knowledge. Please leave a comment to let me know what you think about it! Share it to your friends and learn new things together.
Transcript
arX
iv:a
stro
-ph/
9707
125v
2 2
2 Ju
l 199
7
OBSERVATIONS OF ACCRETING PULSARS
Lars Bildsten1, Deepto Chakrabarty2, John Chiu3, Mark H. Finger4,5, Danny T. Koh3,
Robert W. Nelson3,6, Thomas A. Prince3, Bradley C. Rubin4,7, D. Matthew Scott4,5,
Mark Stollberg4,8, Brian A. Vaughan3, Colleen A. Wilson4, and Robert B. Wilson4
To Appear In Astrophysical Journal Supplements 1997, 113, #2
We summarize five years of continuous monitoring of accretion-powered pulsars with the Burst and
Transient Source Experiment (BATSE) on the Compton Gamma Ray Observatory. Our 20–70 keV observa-
tions have determined or refined the orbital parameters of 13 binaries, discovered 5 new transient accreting
pulsars, measured the pulsed flux history during outbursts of 12 transients (GRO J1744–28, 4U 0115+634,
GRO J1750–27, GS 0834–430, 2S 1417–624, GRO J1948+32, EXO 2030+375, GRO J1008–57, A 0535+26,
GRO J2058+42, 4U 1145–619 and A 1118–616), and also measured the accretion torque history of during
outbursts of 6 of those transients whose orbital parameters were also known. We have also continuously
measured the pulsed flux and spin frequency for eight persistently accreting pulsars (Her X-1, Cen X-3,
Vela X-1, OAO 1657–415, GX 301–2, 4U 1626–67, 4U 1538–52, and GX 1+4). Because of their continuity
and uniformity over a long baseline, BATSE observations have provided new insights into the long-term
behavior of accreting magnetic stars. We have found that all accreting pulsars show stochastic variations
in their spin frequencies and luminosities, including those displaying secular spin-up or spin-down on long
time scales, blurring the conventional distinction between disk-fed and wind-fed binaries. Pulsed flux and
accretion torque are strongly correlated in outbursts of transient accreting pulsars, but uncorrelated, or even
anticorrelated, in persistent sources. We describe daily folded pulse profiles, frequency, and flux measure-
ments that are available through the Compton Observatory Science Support Center at NASA-Goddard Space
Flight Center.
Subject headings: Accretion, Accretion Disks — Stars: Binaries: General — Stars: Pulsars:
General — X-Rays: Stars — Stars: Neutron
1Department of Physics and Department of Astronomy, University of California, Berkeley, CA 94720;
2Center for Space Research, Massachusetts Institute of Technology, Cambridge MA 02139; [email protected]
3Space Radiation Laboratory, California Institute of Technology, Pasadena, CA 91125; [email protected],
[email protected], [email protected], [email protected], [email protected]
4Space Science Laboratory, NASA/Marshall Space Flight Center, ES84, Huntsville,
AL 35812; [email protected], [email protected], [email protected], [email protected],
[email protected], [email protected]
5Universities Space Research Association
6Theoretical Astrophysics 130-33, California Institute of Technology, Pasadena, CA 91125
7Current address: Cosmic Radiation Laboratory, Institute for Physical and Chemical Research (RIKEN), Wako-shi, Saitama
351-01, Japan
8Department of Physics, University of Alabama, Hunstville, AL 35899
2
Contents
1 INTRODUCTION 4
2 PULSAR DETECTION AND STUDY WITH BATSE 7
3 OVERVIEW OF ACCRETION-POWERED PULSARS 12
4 BATSE OBSERVATIONS OF INDIVIDUAL SOURCES 24
4.1 Low-Mass Systems . . . . . . . . . . . . . . . . . . . . . . . . . . . . . . . . . . . . . . . . . . 27
4.2 High-Mass Supergiant Systems . . . . . . . . . . . . . . . . . . . . . . . . . . . . . . . . . . . 31
4.3 High-Mass Transient Systems . . . . . . . . . . . . . . . . . . . . . . . . . . . . . . . . . . . . 36
5 DISCUSSION 49
5.1 The Long Term Spin Evolution of Disk-Fed Pulsars . . . . . . . . . . . . . . . . . . . . . . . . 50
5.2 Torque and Luminosity of Transient Pulsars . . . . . . . . . . . . . . . . . . . . . . . . . . . . 53
5.3 Accretion Torques in Transient and Wind-Fed Pulsars . . . . . . . . . . . . . . . . . . . . . . 56
5.4 Power Spectra of Torque Fluctuations . . . . . . . . . . . . . . . . . . . . . . . . . . . . . . . 56
5.5 Transients Outbursts in Be Systems . . . . . . . . . . . . . . . . . . . . . . . . . . . . . . . . 61
5.6 The Population of Be Transients . . . . . . . . . . . . . . . . . . . . . . . . . . . . . . . . . . 62
5.7 Be/X-ray Pulsar Orbits . . . . . . . . . . . . . . . . . . . . . . . . . . . . . . . . . . . . . . . 65
6 SUMMARY 68
APPENDICES 70
A PULSED OBSERVATIONS WITH BATSE 70
A.1 Background Subtraction . . . . . . . . . . . . . . . . . . . . . . . . . . . . . . . . . . . . . . . 71
A.2 Optimal Combination of Detectors . . . . . . . . . . . . . . . . . . . . . . . . . . . . . . . . . 72
B BATSE DATA ANALYSIS 78
B.1 Frequency Estimation . . . . . . . . . . . . . . . . . . . . . . . . . . . . . . . . . . . . . . . . 78
B.1.1 Frequency Estimation using Power Spectra . . . . . . . . . . . . . . . . . . . . . . . . 78
B.1.2 Frequency Estimation using Epoch Folding . . . . . . . . . . . . . . . . . . . . . . . . 80
B.1.3 Frequency Estimation from Fits to Pulse-Phase Measurements . . . . . . . . . . . . . 81
3
B.2 Pulsed Flux Estimation . . . . . . . . . . . . . . . . . . . . . . . . . . . . . . . . . . . . . . . 81
B.2.1 What is Pulsed Flux and Pulsed Fraction? . . . . . . . . . . . . . . . . . . . . . . . . 81
B.2.2 Peak-to-Peak Pulsed Spectra and Flux . . . . . . . . . . . . . . . . . . . . . . . . . . . 81
B.2.3 Daily RMS Flux . . . . . . . . . . . . . . . . . . . . . . . . . . . . . . . . . . . . . . . 82
REFERENCES 84

4
1. INTRODUCTION
Accreting X-ray pulsars were discovered over 25 years ago (Giacconi et al.1971), and a qualitative
description of both the accretion process and the origin of the pulsed emission was understood almost
immediately (Pringle & Rees 1972; Davidson & Ostriker 1973; Lamb, Pethick & Pines 1973). X-ray pulsars
are rotating and strongly magnetized (B ∼> 1011 G) neutron stars which accrete gas from a stellar companion.
As the accreting material approaches the neutron star, the plasma is channeled to the magnetic polar caps,
where it releases its gravitational energy as X and γ-radiation; these rotating hotspots are the sources of
the pulsed emission. Despite more than two decades of study, however, many details of this scenario remain
poorly understood.
The accreting pulsars are also important evolutionary links to other binary systems containing neutron
stars. Some young neutron stars with high mass companions may begin their lives as rotation-powered radio
pulsars (Johnston et al. 1992, Kaspi et al. 1994) and become X-ray sources only during episodes of significant
mass transfer later in life. On the other hand, there is some evidence that extended episodes of accretion onto
neutron stars with low mass companions can cause their magnetic fields to decay (Bhattacharya & Srinivasan
1995). If the inner accretion disk can then extend nearly down to the stellar surface, these neutron stars
should spin up to millisecond rotation periods (Alpar et al.1982); there is mounting evidence that the low
mass X-ray binaries contain rapidly rotating neutron stars (see for example Strohmayer et. al. 1996) and are
the birthplace of the millisecond radio pulsars. Perhaps most importantly, the qualitative picture developed
in the early 1970s to explain the behavior of X-ray pulsars has become the paradigm for accretion onto other
types of magnetic stars, such as magnetic CVs and T Tauri stars (Warner 1990, Konigl 1991). It is thus
becoming increasingly important that the standard picture of X-ray pulsars developed more than 20 years
ago be tested critically.
Much of our understanding of accretion-powered pulsars originates from accurate timing of the pulsed
emission. Just as in binary radio pulsars, the orbital motion causes a modulation in the observed pulse
frequency, which allows the determination of the binary orbital parameters. The small moment of inertia
of a neutron star makes it possible to measure directly the intrinsic changes in the pulsar spin frequency
caused by angular momentum gained (or lost) during the accretion process on ∼days timescales. This can
potentially reveal the nature of the accretion flow – a persistent trend in the spin frequency indicates the
presence of an accretion disk, while short term changes with no persistent trend are usually indicative of a
wind-fed system. As of this writing, there are 44 known accreting pulsars in our Galaxy and the Magellanic
Clouds, with spin periods ranging from 0.069 s through 1413 s. Approximately half of these objects are
observed only during episodes of transient accretion.
The physics and astronomy of accretion-powered pulsars have been reviewed previously. White, Nagase
& Parmar (1995) reviewed accreting X-ray binaries in general. Nagase (1989) reviewed observations of ac-
creting pulsars. Hayakawa (1985) provided a theoretical overview of accretion physics and spectral formation
in strong magnetic fields. Joss & Rappaport (1984) reviewed neutron stars in binaries. White, Swank &
Holt (1983) presented energy spectra and pulse profiles. Rappaport & Joss (1977a,b) reviewed the “standard
model” for accretion torques and pulse profiles.
In this paper we summarize over five years of observations of accreting binary pulsars with the all-sky
BATSE instrument on the Compton Gamma Ray Observatory. BATSE’s principal advantage over previous
instruments for studying accreting pulsars is its continuous monitoring capability. The timing data we
present here represent a ∼100-fold increase in the time resolution of spin frequency histories of persistent
pulsars, and the first long-term, spatially-uniform monitoring program for the detection of new pulsars and

5
recurrent transients. We have thus detected and studied nearly half of the known accreting pulsars and
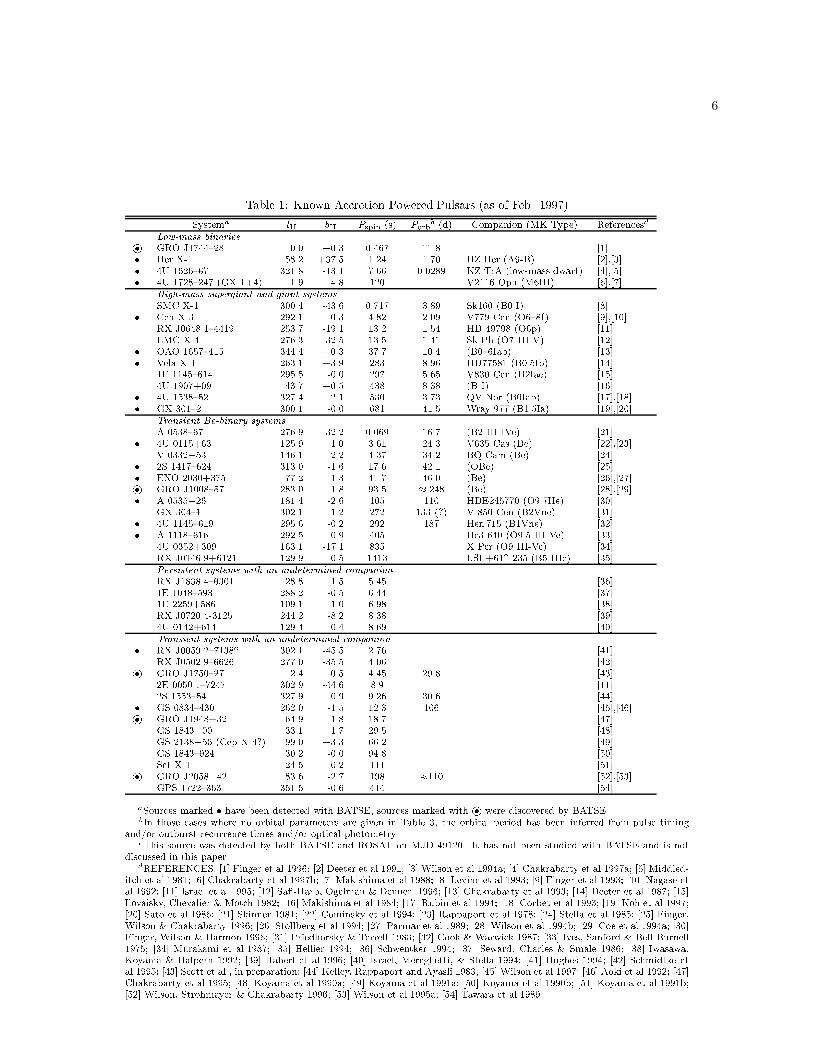
determined accurate orbital parameters for 13 of these systems. Table 1 lists all known accreting pulsars
along with their positions in galactic coordinates, spin and orbital periods, and companion type (where
known).
BATSE’s continuous timing of X-ray pulsars gives the neutron star spin period history over timescales
of days to years and is ideally suited for detailed studies of the accretion torque. Our observations give
a qualitatively different picture of the spin behavior of disk-fed pulsars on long timescales (∼ years) than
understood from pre-BATSE measurements (see Nagase 1989 and references therein). Moreover, BATSE
has been able to test theories of accretion torque on short timescales (∼ days). This has led to several
unexpected discoveries in disk-fed pulsars: (1) the transition between spin-up and spin-down in 4U 1626–67
(Chakrabarty et al. 1997a) and Cen X-3, (2) anticorrelated behavior of torque and luminosity in GX 1+4
(Chakrabarty et al. 1997b) and (3) evidence that transient accretion disks sometimes form in GX 301–2 (Koh
et al. 1997). By monitoring these changes along with variations in the pulsed luminosity, we may be able to
learn about the complex interaction between the magnetosphere and the accretion flow – physics which is
at work in a broad variety of accreting systems but can only be measured dynamically in accretion-powered
pulsars.
Five of the 13 transient systems detected by BATSE are new binaries. Combining these discoveries with
the “recovery” of previously known transients yields new information on the population and typical distance
of these sources. In addition to the recent discovery that the bursting transient GRO J1744–28 is a 2 Hz
pulsar (Finger et al. 1996), the discovery of quasi-periodic oscillations in the accreting transient A 0536+26
(Finger, Wilson, & Harmon 1996) gave us the best evidence yet for periodic phenomena originating from
the magnetospheric radius.
Section 2 outlines how we take maximum advantage of the BATSE instrument by actively processing
the standard data sets (DISCLA and CONT). We also summarize our data analysis methods and give our
typical flux sensitivity as a function of spin period. Appendices A and B contain additional details about
our data analysis technique. A summary and brief review of the science that can be done by pulse timing
of accreting pulsars is provided in §3. Section 4 presents a synopsis of BATSE observations with frequency
and flux histories for each accreting pulsar we detected. We also provide pointers to the literature where
more details can be found. Section 5 is a discussion of how the BATSE observations have changed our
understanding of the long-term spin evolution of accreting pulsars and the nature of transient sources. We
conclude in §6 with a brief summary of our primary discoveries.
6
Table 1: Known Accretion-Powered Pulsars (as of Feb. 1997)Systema lII bII Pspin (s) Porbb (d) Companion (MK Type) ReferencesdLow-mass binaries GRO J174428 0.0 +0.3 0.467 11.8 [1] Her X-1 58.2 +37.5 1.24 1.70 HZ Her (A9-B) [2],[3] 4U 162667 321.8 -13.1 7.66 0.0289 KZ TrA (low-mass dwarf) [4],[5] 4U 1728247 (GX 1+4) 1.9 +4.8 120 V2116 Oph (M6III) [6],[7]High-mass supergiant and giant systemsSMC X-1 300.4 -43.6 0.717 3.89 Sk160 (B0 I) [8] Cen X-3 292.1 +0.3 4.82 2.09 V779 Cen (O68f) [9],[10]RX J0648.14419 253.7 -19.1 13.2 1.54 HD 49798 (O6p) [11]LMC X-4 276.3 -32.5 13.5 1.41 Sk-Ph (O7 III-V) [12] OAO 1657415 344.4 +0.3 37.7 10.4 (B06Iab) [13] Vela X-1 263.1 +3.9 283 8.96 HD77581 (B0.5Ib) [14]1E 1145614 295.5 -0.0 297 5.65 V830 Cen (B2Iae) [15]4U 1907+09 43.7 +0.5 438 8.38 (B I) [16] 4U 153852 327.4 +2.1 530 3.73 QV Nor (B0Iab) [17],[18] GX 3012 300.1 -0.0 681 41.5 Wray 977 (B1.5Ia) [19],[20]Transient Be-binary systemsA 053867 276.9 -32.2 0.069 16.7 (B2 III-IVe) [21] 4U 0115+63 125.9 +1.0 3.61 24.3 V635 Cas (Be) [22],[23]V 0332+53 146.1 -2.2 4.37 34.2 BQ Cam (Be) [24] 2S 1417624 313.0 -1.6 17.6 42.1 (OBe) [25] EXO 2030+375 77.2 -1.3 41.7 46.0 (Be) [26],[27] GRO J100857 283.0 -1.8 93.5 248 (Be) [28],[29] A 0535+26 181.4 -2.6 105 110 HDE245770 (O9.7IIe) [30]GX 3041 302.1 +1.2 272 133 (?) V 850 Cen (B2Vne) [31] 4U 1145619 295.6 -0.2 292 187 Hen 715 (B1Vne) [32] A 1118616 292.5 -0.9 405 He3-640 (O9.5 III-Ve) [33]4U 0352+309 163.1 -17.1 835 X Per (O9 III-Ve) [34]RX J0146.9+6121 129.9 -0.5 1413 LSI +61 235 (B5 IIIe) [35]Persistent systems with an undetermined companionRX J1838.40301 28.8 +1.5 5.45 [36]1E 1048593 288.2 -0.5 6.44 [37]1E 2259+586 109.1 -1.0 6.98 [38]RX J0720.4-3125 244.2 -8.2 8.38 [39]4U 0142+614 129.4 -0.4 8.69 [40]Transient systems with an undetermined companion RX J0059.27138c 302.1 -45.5 2.76 [41]RX J0502.96626 277.0 -35.5 4.06 [42] GRO J175027 2.4 +0.5 4.45 29.8 [43]2E 0050.17247 302.9 -44.6 8.9 [11]2S 155354 327.9 -0.9 9.26 30.6 [44] GS 0834430 262.0 -1.5 12.3 106 [45],[46] GRO J1948+32 64.9 1.8 18.7 [47]GS 1843+00 33.1 +1.7 29.5 [48]GS 2138+56 (Cep X-4?) 99.0 +3.3 66.2 [49]GS 1843024 30.2 -0.0 94.8 [50]Sct X-1 24.5 -0.2 111 [51] GRO J2058+42 83.6 -2.7 198 110 [52],[53]GPS 1722363 351.5 -0.6 414 [54]aSources marked have been detected with BATSE, sources marked with were discovered by BATSE.bIn those cases where no orbital parameters are given in Table 3, the orbital period has been inferred from pulse timingand/or outburst recurrence times and/or optical photometry.cThis source was detected by both BATSE and ROSAT on MJD 49120. It has not been studied with BATSE and is notdiscussed in this paper.dREFERENCES: [1] Finger et al.1996; [2] Deeter et al.1991; [3] Wilson et al.1994a; [4] Chakrabarty et al.1997a; [5] Middled-itch et al.1981; [6] Chakrabarty et al.1997b; [7] Makishima et al.1988; [8] Levine et al.1993; [9] Finger et al.1993; [10] Nagase etal.1992; [11] Israel et al.1995; [12] Sa-Harb, Ogelman & Dennerl 1996; [13] Chakrabarty et al.1993; [14] Deeter et al.1987; [15]Ilovaisky, Chevalier & Motch 1982; [16] Makishima et al.1984; [17] Rubin et al.1994; [18] Corbet et al.1993; [19] Koh et al.1997;[20] Sato et al.1986; [21] Skinner 1981; [22] Cominsky et al.1994; [23] Rappaport et al.1978; [24] Stella et al.1985; [25] Finger,Wilson & Chakrabarty 1996; [26] Stollberg et al.1994; [27] Parmar et al.1989; [28] Wilson et al.1994b; [29] Coe et al.1994a; [30]Finger, Wilson & Harmon 1996; [31] Priedhorsky & Terrell 1983; [32] Cook & Warwick 1987; [33] Ives, Sanford & Bell-Burnell1975; [34] Murakami et al.1987; [35] Hellier 1994; [36] Schwentker 1994; [37] Seward, Charles & Smale 1986; [38] Iwasawa,Koyama & Halpern 1992; [39] Haberl et al.1996; [40] Israel, Mereghetti, & Stella 1994; [41] Hughes 1994; [42] Schmidtke etal.1995; [43] Scott et al., in preparation; [44] Kelley, Rappaport and Ayasli 1983; [45] Wilson et al.1997; [46] Aoki et al.1992; [47]Chakrabarty et al.1995; [48] Koyama et al.1990a; [49] Koyama et al.1991a; [50] Koyama et al.1990b; [51] Koyama et al.1991b;[52] Wilson, Strohmayer & Chakrabarty 1996; [53] Wilson et al.1995a; [54] Tawara et al.1989.

7
2. PULSAR DETECTION AND STUDY WITH BATSE
The BATSE detectors have provided unprecedented continuous all-sky monitoring for both pulsed and
unpulsed sources above 20 keV since 1991. This section briefly summarizes our methods and describes the
resulting flux sensitivity as a function of pulse frequency. This is the most crucial quantity for determining
the detection sensitivity for new sources and shapes our discussion in §5 of what BATSE has learned about
the populations of X-ray transients.
Fig. 1.— DISCLA data from a single BATSE detector for a full spacecraft orbit. The rates are from the
20-50 keV channel of Large Area Detector 2, on August 21 1996 when Vela X-1 was in a high state. Shown
are 8.2 second average rates, with errors < 16 c s−1. The 800 c s−1 modulation is due to the difference
between the cosmic diffuse background and the diffuse background from the Earth’s atmosphere. The lowest
rates are when the detector mainly sees the Earth, while at the highest rates it sees the sky. The data gaps
are due to a loss of telemetry. Vela X-1 rises above the horizon at 71566 s and sets at 75517 s, as noted by
the arrows.

8
BATSE consists of eight detector modules facing outward from the corners of the CGRO spacecraft.
Each module contains a large area detector (LAD) (with geometric area of 2025 cm2 and an energy range
of 20–1800keV) and a smaller spectroscopy detector. The LADs are non-imaging NaI(Tl) scintillators with
2π steradian fields of view. Our pulsar studies primarily use the background data from these detectors,
which are folded on-board or available continuously at 1.024 second time resolution with 4 energy channels
(DISCLA data) and at 2.048 second time resolution with 16 energy channels (CONT data). The large field
of view allows for multiple contributions to the background, which varies by factors of two during each ≈93
min satellite orbit. Figure 1 shows a selected orbit of DISCLA data from a single BATSE LAD detector.
The large pulses every 141.5 seconds are from the bright accreting pulsar Vela X-1 [Pspin = 283.2185(18)
s on this day] which has a double peaked pulse profile. Very few sources are persistently bright enough to
observe directly in this ≈ 2000 c s−1 background.
Accreting pulsars are typically detected in the lowest DISCLA channel, covering 20–50keV, and in
CONT channels 1–4, typically covering 20–70keV, with detections sometimes extending to energies as high
as 160 keV. In this sense, BATSE is only measuring the high energy spectral tails of accreting pulsars. Often
most of the flux from these objects is at lower energies, so that our flux measurements are subject to a large
(and often unknown) bolometric correction. The pulsed flux histories we provide thus reflect the history
of the bolometric luminosity only when the overall spectral shape, and the pulsed fraction in the BATSE
energy band are independent of time.
The signal CS (in c s−1) in the BATSE detectors from most accreting pulsars is 102–103 times smaller
than the background count rate CB, so that a Fourier or epoch-folding analysis proves to be the best way to
detect them. For pulse periods shorter than a few minutes the signal-to-noise for an observation of length t is
just governed by the Poisson variations of the background, S/N ∝ CSt/(CBt)1/2. The background variations
on timescales longer than a few minutes are mostly due to the satellite orbit and other effects (see Appendix
A) and hence exceed the Poisson variations. Our sensitivity for detecting long period pulsars would be
substantially degraded if nothing was done to remedy this. Our solution (presented in Appendix A) is to fit
a phenomenological model to these background variations and subtract it prior to scientific analysis. Though
this does not bring the sensitivity down to the Poisson level at all frequencies (see Figure 41 in Appendix
A) it is a great improvement relative to the raw count rates.
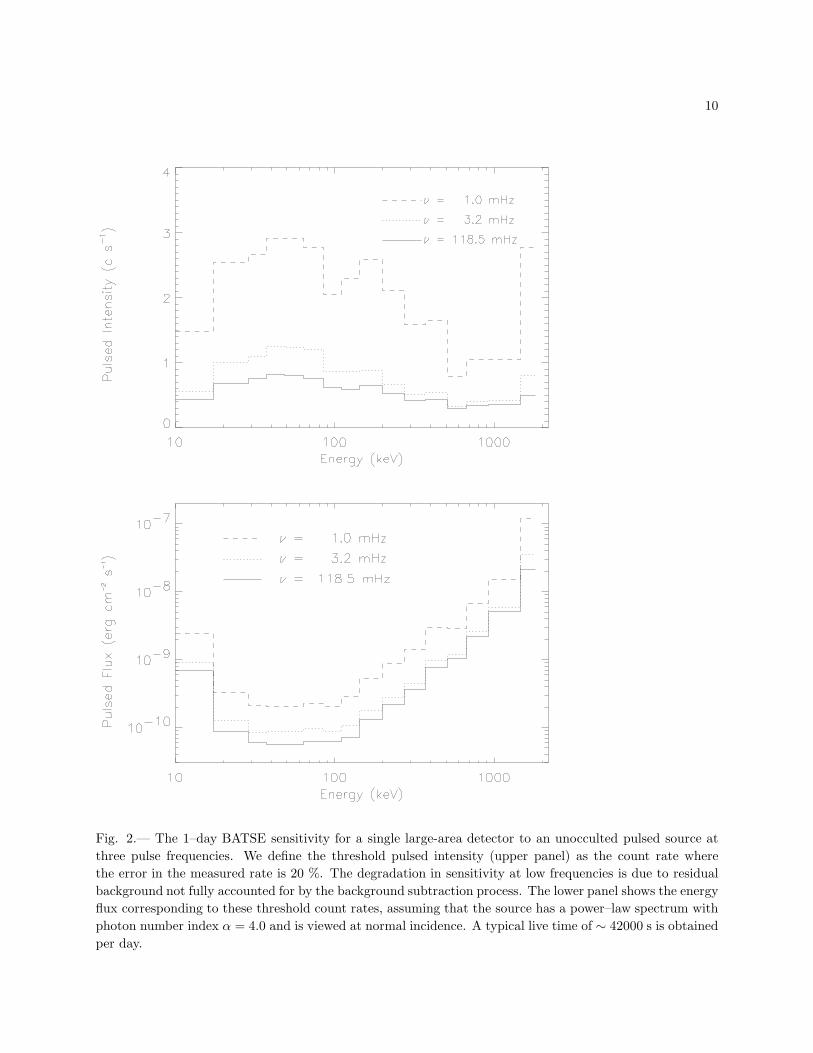
The resulting 1–day pulsed-intensity sensitivities of the CONT data as a function of energy are shown in
Figure 2 for three representative pulse frequencies. The upper panel shows the minimum count rate needed
so that the count rate of the pulse is found to within 20% accuracy. This is a more stringent criterion than
that for detecting the pulse in a narrow frequency range. As is evident from the figure, the excess noise at low
frequencies strongly reduces our sensitivity to long period pulsars. The lower panel is the resulting pulsed
flux assuming that the pulsar has a power law energy spectrum with index α = 4 (see the figure caption).
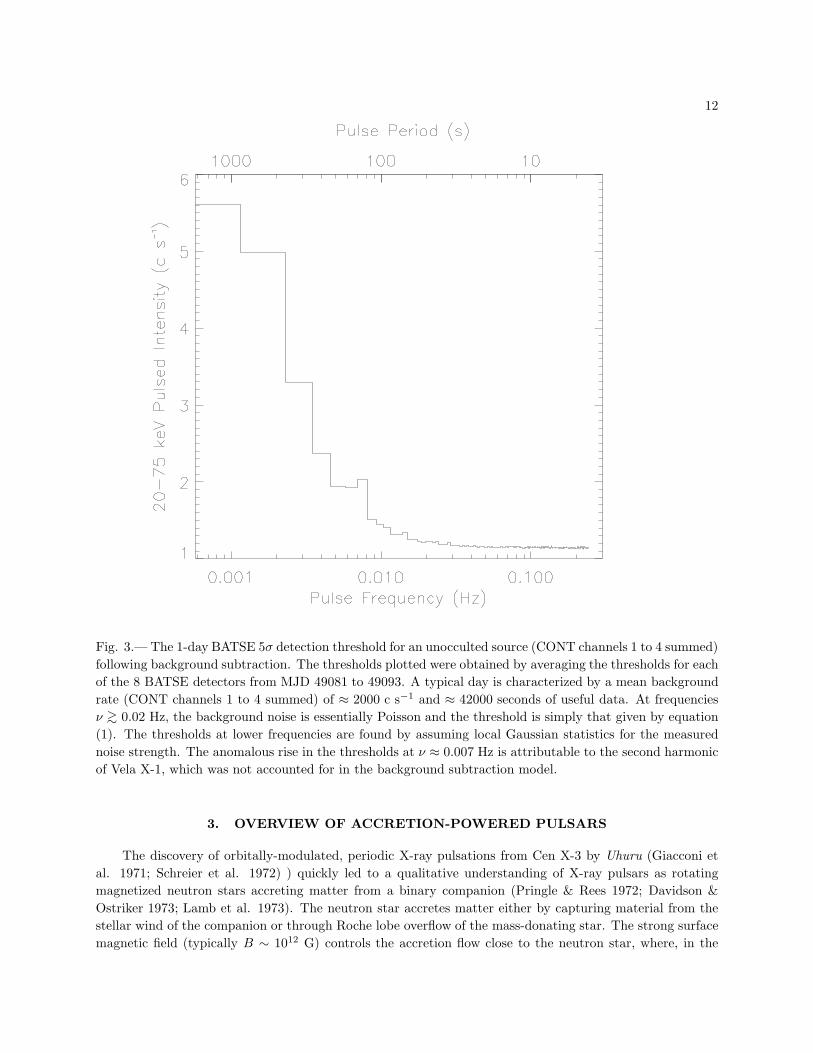
Most of our searches are carried out with combinations of various channels. Figure 3 shows the one-day
sensitivity in a single detector for the sum of CONT channels 1-4. When Poisson-limited, the resulting
sensitivity to a pulsed source of high frequencies is
CS ≈ 1.1 c s−1
(
CB
2000 c s−1
)1/2(42000 s
t
)1/2
. (1)
Depending on how steep the spectrum is (see Table 2 for the conversion from BATSE LAD c s−1 to flux
units) this is a flux of ≈ 10−10erg cm−2 s−1 in the 20-60 keV band. The corresponding luminosity at the
Galactic center (8.5 kpc) is L(20−60 keV) ≈ 8×1035 erg s−1, allowing detection of the majority of the known
accretion pulsars. For the purposes of comparison, the one day sensitivity for detection using occultation
9
steps is about 10 c s−1 (Harmon et al. 1992), a factor of ten worse than the pulsed sensitivity. This is
basically due to the difference in effective exposure time in one day for both methods.
We have performed a uniform, standard analysis on all pulsars viewable with BATSE that have spin
periods longer than about 4 seconds, the Nyquist frequency of the CONT data. Power spectra are computed
using the fast Fourier transform for a daily estimate of the spin frequency ν of each system, followed by epoch
folding at ν for a daily pulse profile. The profiles are then used to determine the pulsed count rate in each
CONT energy channel, which are then fit with standard models to determine the spectral shape and pulsed
flux (see Appendix B). These folded profiles form the basis of detailed timing studies. Frequency, pulsed
flux and folded pulse profile histories generated by this analysis are available from the BATSE pulsed source
database at the Compton Observatory Science Support Center. This database forms the basis of many of
the figures displayed in this paper. For systems with spin periods comparable to or shorter than 4 seconds
[GRO J1744–28 (0.467 s), Her X-1 (1.24 s), 4U0115+63 (3.6 s), GRO J1750–27 (4.4 s), and Cen X-3 (4.8 s)]
we utilize a combination of DISCLA and folded-on-board data, also described in Appendix B.
10
Fig. 2.— The 1–day BATSE sensitivity for a single large-area detector to an unocculted pulsed source at
three pulse frequencies. We define the threshold pulsed intensity (upper panel) as the count rate where
the error in the measured rate is 20 %. The degradation in sensitivity at low frequencies is due to residual
background not fully accounted for by the background subtraction process. The lower panel shows the energy
flux corresponding to these threshold count rates, assuming that the source has a power–law spectrum with
photon number index α = 4.0 and is viewed at normal incidence. A typical live time of ∼ 42000 s is obtained
per day.

11
Table 2. Conversion to Pulsed Flux from Counts
Power Law
αa DISCLAb CONTc % Errord
2.0 0.84 0.79 5
3.0 0.94 0.87 10
4.0 1.05 0.95 15
5.0 1.17 1.02 20
OTTB
kT (keV)e DISCLAb CONT c % Errord
10 1.18 1.03 15
25 0.94 0.88 8
40 0.89 0.84 6
55 0.87 0.82 5
Note. — These conversions are for normal inci-
dence. For other incident photon angles, see Ap-
pendix A and Figure 42
aSpectral model used is dN/dE ∝ E−α
bEnergy flux in units of 10−10 ergs cm−2 s−1 cor-
responding to a pulsed intensity of 1 c s−1 in DIS-
CLA Channel 1 (20–50 keV).
cEnergy flux in units of 10−10 ergs cm−2 s−1 cor-
responding to a pulsed intensity of 1 c s−1 in CONT
Channels 1–4 (20–70 keV) summed .
dPercentage error in energy flux due to variations
in energy edges for different detectors.
eSpectral model used is
dN/dE ∝ (1/E) exp(−E/kT )gff(E, kT )
12
Fig. 3.— The 1-day BATSE 5σ detection threshold for an unocculted source (CONT channels 1 to 4 summed)
following background subtraction. The thresholds plotted were obtained by averaging the thresholds for each
of the 8 BATSE detectors from MJD 49081 to 49093. A typical day is characterized by a mean background
rate (CONT channels 1 to 4 summed) of ≈ 2000 c s−1 and ≈ 42000 seconds of useful data. At frequencies
ν ∼> 0.02 Hz, the background noise is essentially Poisson and the threshold is simply that given by equation
(1). The thresholds at lower frequencies are found by assuming local Gaussian statistics for the measured
noise strength. The anomalous rise in the thresholds at ν ≈ 0.007 Hz is attributable to the second harmonic
of Vela X-1, which was not accounted for in the background subtraction model.
3. OVERVIEW OF ACCRETION-POWERED PULSARS
The discovery of orbitally-modulated, periodic X-ray pulsations from Cen X-3 by Uhuru (Giacconi et
al. 1971; Schreier et al. 1972) ) quickly led to a qualitative understanding of X-ray pulsars as rotating
magnetized neutron stars accreting matter from a binary companion (Pringle & Rees 1972; Davidson &
Ostriker 1973; Lamb et al. 1973). The neutron star accretes matter either by capturing material from the
stellar wind of the companion or through Roche lobe overflow of the mass-donating star. The strong surface
magnetic field (typically B ∼ 1012 G) controls the accretion flow close to the neutron star, where, in the

13
simplest picture, the ionized matter follows the field lines onto the magnetic poles. The resulting accretion
luminosity from the polar regions is
Lacc =GMxM
Rx
≃ 1.2 × 1036erg s−1
(
M
10−10M⊙ yr−1
)
(
Mx
1.4M⊙
)(
10 km
Rx
)
(2)
where M is the instantaneous mass accretion rate, and Mx and Rx are the neutron star mass and radius.
Both the misalignment of the rotation axis with the dipolar field and asymmetric emission from the accreting
polar cap leads to pulsed emission at the neutron star spin period. Many of these accreting pulsars were
known and studied prior to the launch of the BATSE instrument and this section is mostly an overview of
the “standard” picture of these objects developed with pre-BATSE observations. We discuss, in §5, how our
understanding of accreting pulsars has been re-shaped by BATSE observations.
The simple blackbody temperature estimate (i.e. Lacc = AcapσSBT 4eff , where Acap ∼ km2 is the typical
polar cap area) gives kTeff ∼ 3 keV, comparable to where the peak in νFν usually appears in the X-
ray spectrum. The observed 2–100 keV X-ray spectra are much harder than a blackbody and have been
represented by a variety of models, most commonly a power law with an exponential cutoff or a broken
power law (e.g., White et al. 1983; Mihara 1995). The exponential cutoff energy falls in the 5–25 keV range,
while the power-law photon index is typically α ∼< 1.5 below the cutoff energy. It is the hard power-law tail
that we typically detect with the BATSE instrument. The pulse profiles of accreting pulsars are relatively
smooth and simple (i.e. single or double peaked) above 20 keV. The pulsed fraction (see appendix B.2) is
typically greater than 50% and normally increases with photon energy (see Figure 7 for examples of pulse
profiles in the BATSE energy range). The pulse profiles at lower energies are generally more complex (see
White et al. 1983 for examples).
Table 1 shows the presently known accreting pulsars, which are generally classified according to the
mass of the donor star as either low-mass (Mc ∼< 2.5 M⊙) or high-mass (Mc ∼> 6 M⊙) systems (Shore,
Livio, & van den Heuvel 1994). Systems which have been detected by BATSE are marked with a bullet
and those discovered by BATSE are marked with a circled bullet. Table 3 shows the presently known
orbital parameters, with BATSE measurements and discoveries marked as in Table 1. There are only four
known low-mass binaries with accreting pulsars: Her X-1, 4U 1626-67, GX 1+4, and GRO J1744–28. The
overwhelming majority of low-mass X-ray binaries are not pulsars and thus evidently have fields too weak
to strongly affect the accretion flow (B ∼< 109 G). The high mass binaries may be divided into those with
main sequence Be star companions and those with evolved OB supergiant companions. The Be systems,
which account for more than half of the known accreting pulsars, are generally observed during transient
outbursts. The mass donor in these systems is an O or B star still on the main sequence and lying well inside
its Roche surface. The episodic outbursts are often correlated with periastron passage of the neutron star
in its eccentric orbit. These systems are thought to undergo a “propeller” phase during X-ray quiescence
(Stella, White, & Rosner 1986).
The supergiant binaries may be further subdivided into two groups according to the dominant mode
of mass transfer: Roche-lobe overflow or capture from the stellar wind. In some systems, both types of
mass transfer may be taking place (Blondin, Stevens, & Kallman 1991). Most OB supergiants have stellar
winds driven by the radiation pressure from resonance lines of highly-ionized atoms, with mass loss rates of
M ∼ 10−6M⊙ yr−1 being quite typical. Although capture from a high velocity wind is inefficient, the large
mass loss rate in the wind can result in an appreciable mass accretion rate onto the neutron star. Vela X-1
is the best known example of a wind-fed supergiant pulsar binary.
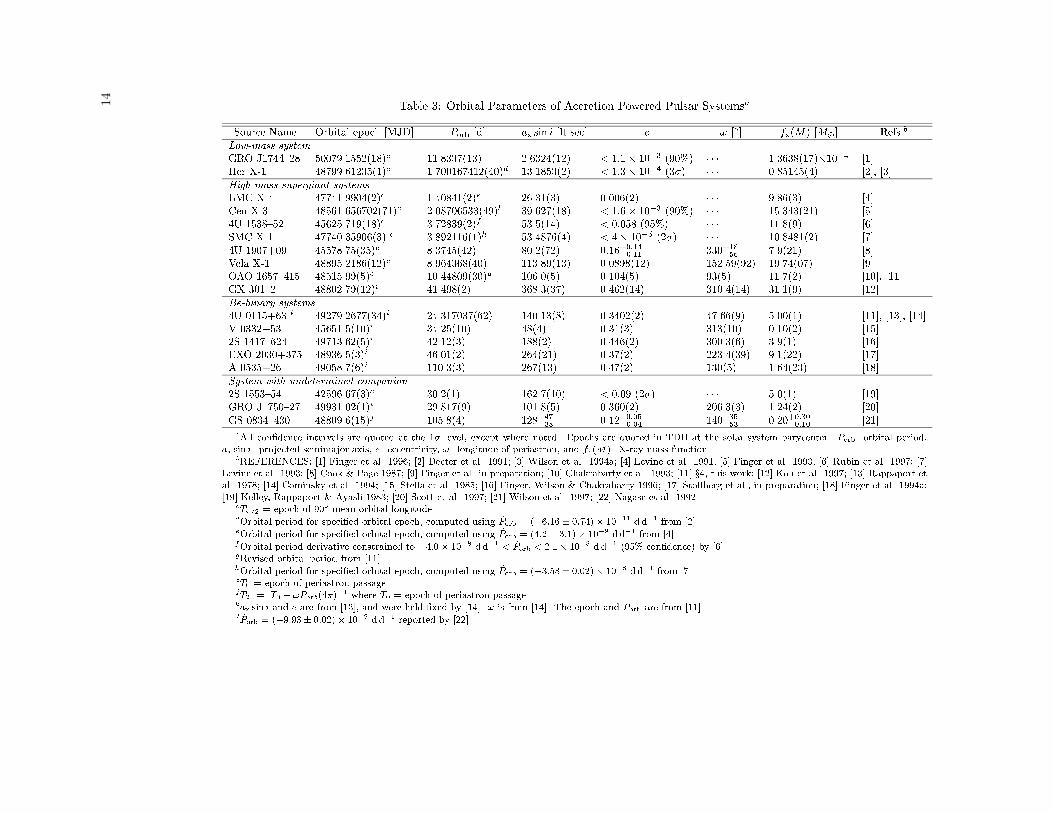
14 Table 3: Orbital Parameters of Accretion-Powered Pulsar SystemsaSource Name Orbital epoch [MJD] Porb [d] ax sin i [lt-sec] e ! [] fx(M) [M] Refs.bLow-mass systemGRO J174428 50079.1552(18)c 11.8337(13) 2.6324(12) < 1:1 103 (90%) 1.3638(17)104 [1]Her X-1 48799.61235(1)c 1.700167412(40)d 13.1853(2) < 1:3 104 (3) 0.85145(4) [2], [3]High-mass supergiant systemsLMC X-4 47741.9904(2)c 1.40841(2)e 26.31(3) 0.006(2) 9.86(3) [4]Cen X-3 48561.656702(71)c 2.08706533(49)l 39.627(18) < 1:6 103 (90%) 15.343(21) [5]4U 153852 45625.719(18)c 3.72839(2)f 53.5(14) < 0:058 (95%) 11.8(9) [6]SMC X-1 47740.35906(3) c 3.892116(1)h 53.4876(4) < 4 105 (2) 10.8481(2) [7]4U 1907+09 45578.75(35)c 8.3745(42) 80.2(72) 0:16+0:140:11 330+1856 7.9(21) [8]Vela X-1 48895.2186(12)c 8.964368(40) 113.89(13) 0.0898(12) 152.59(92) 19.74(07) [9]OAO 1657415 48515.99(5)c 10.44809(30)g 106.0(5) 0.104(5) 93(5) 11.7(2) [10], [11]GX 3012 48802.79(12)i 41.498(2) 368.3(37) 0.462(14) 310.4(14) 31.1(9) [12]Be-binary systems4U 0115+63 k 49279.2677(34)i 24.317037(62) 140.13(8) 0.3402(2) 47.66(9) 5.00(1) [11], [13], [14]V 0332+53 45651.5(10)i 34.25(10) 48(4) 0.31(3) 313(10) 0.10(2) [15]2S 1417624 49713.62(5)i 42.12(3) 188(2) 0.446(2) 300.3(6) 3.9(1) [16]EXO 2030+375 48936.5(3)i 46.01(2) 264(21) 0.37(2) 223.4(39) 9.1(22) [17]A 0535+26 49058.7(6)i 110.3(3) 267(13) 0.47(2) 130(5) 1.64(23) [18]System with undetermined companion2S 155354 42596.67(3)c 30.2(1) 162.7(10) < 0:09 (2) 5.0(1) [19]GRO J175027 49931.02(1)i 29.817(9) 101.8(5) 0.360(2) 206.3(3) 1.24(2) [20]GS 0834430 48809.6(15)j 105.8(4) 128+4738 0.12+0:050:04 140+3553 0.20+0:300:10 [21]aAll condence intervals are quoted at the 1 level, except where noted. Epochs are quoted in TDB at the solar system barycenter. Porb=orbital period,ax sin i=projected semimajor axis, e=eccentricity, !=longitude of periastron, and fx(M)=X-ray mass function.bREFERENCES: [1] Finger et al. 1996; [2] Deeter et al. 1991; [3] Wilson et al. 1994a; [4] Levine et al. 1991; [5] Finger et al. 1993; [6] Rubin et al. 1997; [7]Levine et al. 1993; [8] Cook & Page 1987; [9] Finger et al. in preparation; [10] Chakrabarty et al. 1993; [11] x4, this work; [12] Koh et al. 1997; [13] Rappaport etal. 1978; [14] Cominsky et al. 1994; [15] Stella et al. 1985; [16] Finger, Wilson & Chakrabarty 1996; [17] Stollberg et al., in preparation; [18] Finger et al. 1994a;[19] Kelley, Rappaport & Ayasli 1983; [20] Scott et al. 1997; [21] Wilson et al. 1997; [22] Nagase et al. 1992.cT=2 = epoch of 90 mean orbital longitude.dOrbital period for specied orbital epoch, computed using _Porb = (6:16 0:74) 1011 d d1 from [2].eOrbital period for specied orbital epoch, computed using _Porb = (4:2 3:1) 109 d d1 from [4].fOrbital period derivative constrained to 4:0 108 d d1 < _Porb < 2:1 108 d d1 (95% condence) by [6].gRevised orbital period from [11].hOrbital period for specied orbital epoch, computed using _Porb = (3:58 0:02) 108 d d1 from [7].iT0 = epoch of periastron passage.jT2 = T0 !Porb(4)1 where T0 = epoch of periastron passage.kax sin i and e are from [13], and were held xed by [14]. ! is from [14]. The epoch and Porb are from [11].l _Porb = (9:93 0:02) 109 d d1 reported by [22].
15
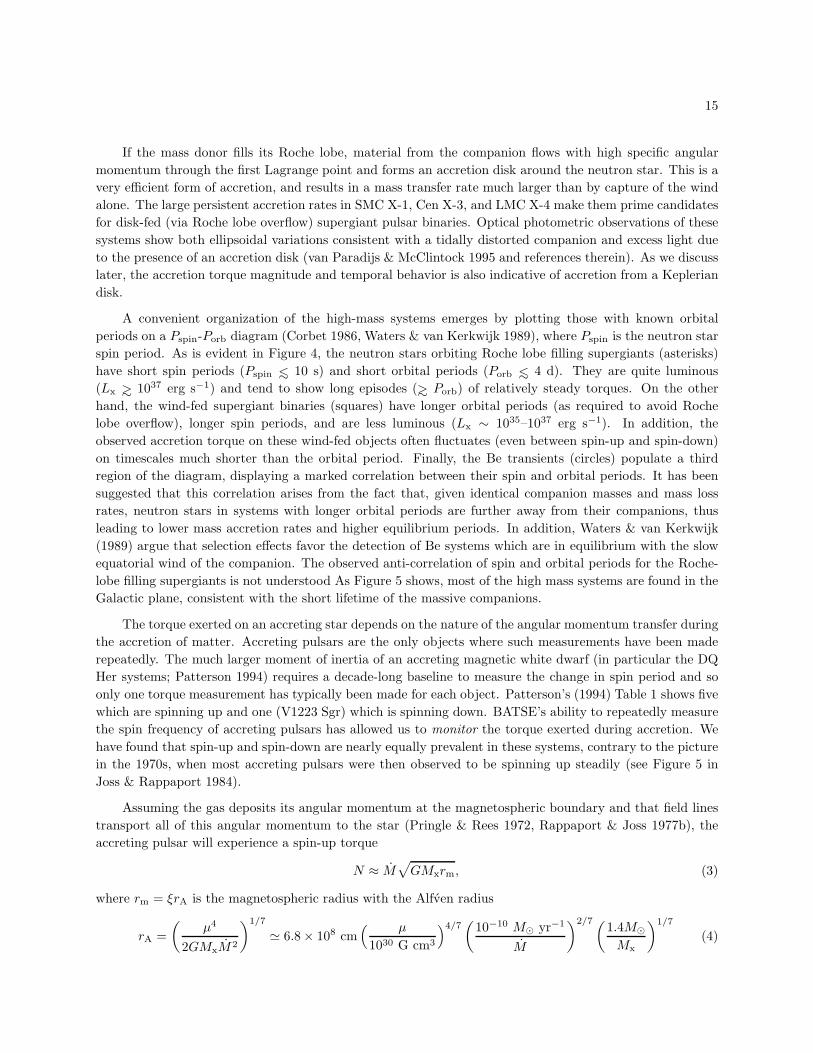
If the mass donor fills its Roche lobe, material from the companion flows with high specific angular
momentum through the first Lagrange point and forms an accretion disk around the neutron star. This is a
very efficient form of accretion, and results in a mass transfer rate much larger than by capture of the wind
alone. The large persistent accretion rates in SMC X-1, Cen X-3, and LMC X-4 make them prime candidates
for disk-fed (via Roche lobe overflow) supergiant pulsar binaries. Optical photometric observations of these
systems show both ellipsoidal variations consistent with a tidally distorted companion and excess light due
to the presence of an accretion disk (van Paradijs & McClintock 1995 and references therein). As we discuss
later, the accretion torque magnitude and temporal behavior is also indicative of accretion from a Keplerian
disk.
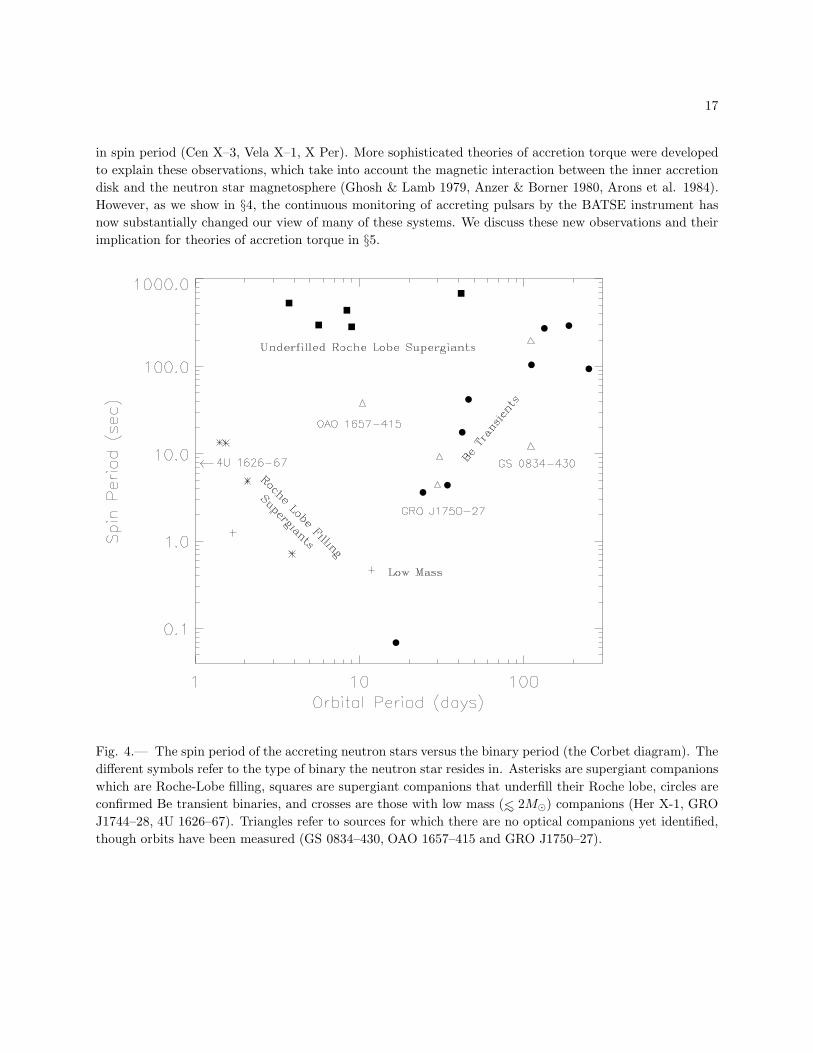
A convenient organization of the high-mass systems emerges by plotting those with known orbital
periods on a Pspin-Porb diagram (Corbet 1986, Waters & van Kerkwijk 1989), where Pspin is the neutron star
spin period. As is evident in Figure 4, the neutron stars orbiting Roche lobe filling supergiants (asterisks)
have short spin periods (Pspin ∼< 10 s) and short orbital periods (Porb ∼< 4 d). They are quite luminous
(Lx ∼> 1037 erg s−1) and tend to show long episodes (∼> Porb) of relatively steady torques. On the other
hand, the wind-fed supergiant binaries (squares) have longer orbital periods (as required to avoid Roche
lobe overflow), longer spin periods, and are less luminous (Lx ∼ 1035–1037 erg s−1). In addition, the
observed accretion torque on these wind-fed objects often fluctuates (even between spin-up and spin-down)
on timescales much shorter than the orbital period. Finally, the Be transients (circles) populate a third
region of the diagram, displaying a marked correlation between their spin and orbital periods. It has been
suggested that this correlation arises from the fact that, given identical companion masses and mass loss
rates, neutron stars in systems with longer orbital periods are further away from their companions, thus
leading to lower mass accretion rates and higher equilibrium periods. In addition, Waters & van Kerkwijk
(1989) argue that selection effects favor the detection of Be systems which are in equilibrium with the slow
equatorial wind of the companion. The observed anti-correlation of spin and orbital periods for the Roche-
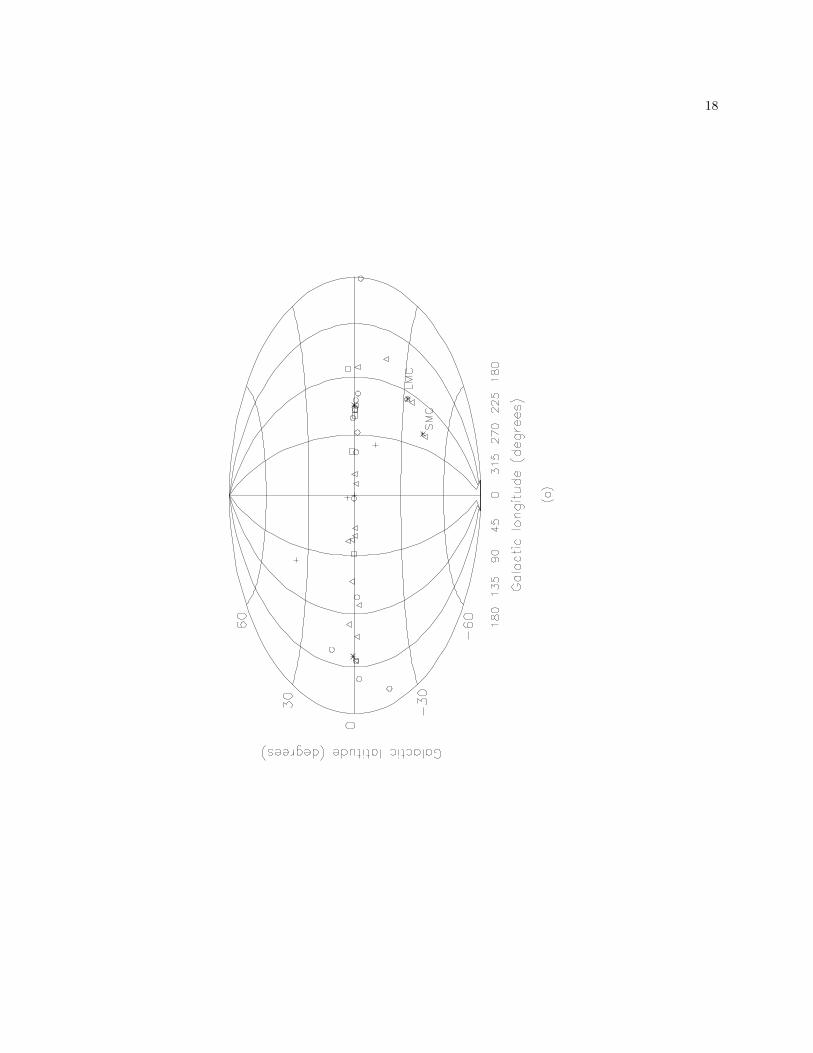
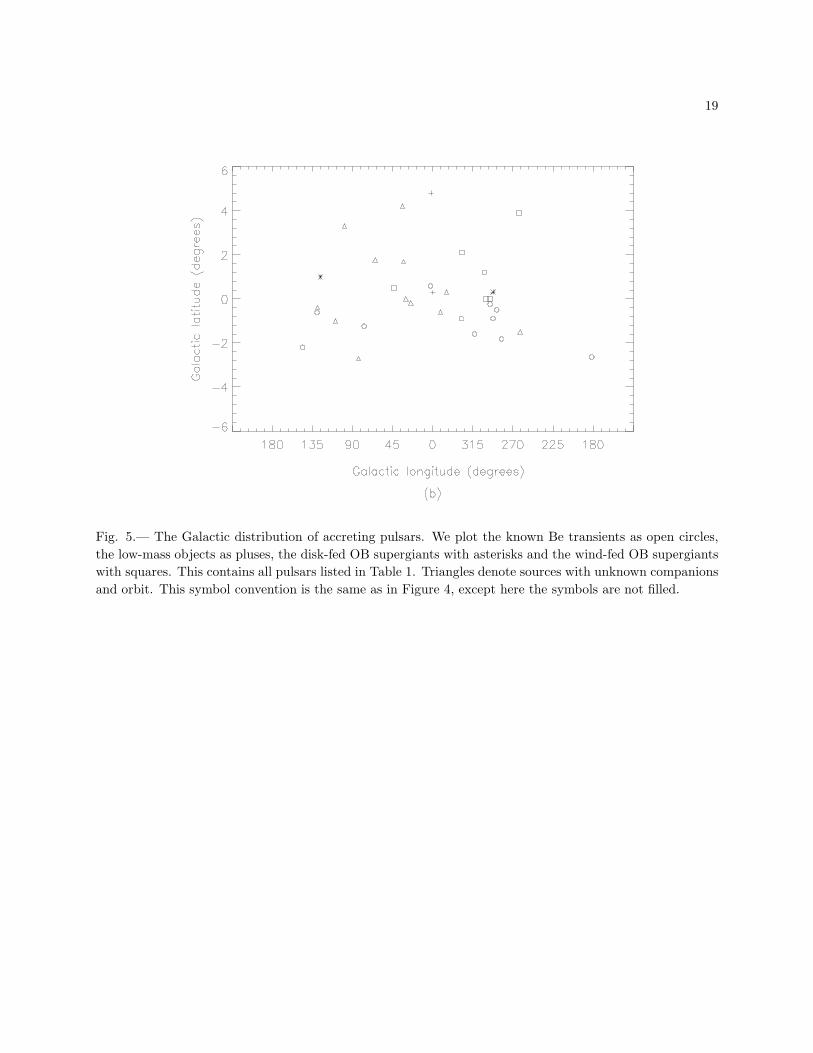
lobe filling supergiants is not understood As Figure 5 shows, most of the high mass systems are found in the
Galactic plane, consistent with the short lifetime of the massive companions.
The torque exerted on an accreting star depends on the nature of the angular momentum transfer during
the accretion of matter. Accreting pulsars are the only objects where such measurements have been made
repeatedly. The much larger moment of inertia of an accreting magnetic white dwarf (in particular the DQ
Her systems; Patterson 1994) requires a decade-long baseline to measure the change in spin period and so
only one torque measurement has typically been made for each object. Patterson’s (1994) Table 1 shows five
which are spinning up and one (V1223 Sgr) which is spinning down. BATSE’s ability to repeatedly measure
the spin frequency of accreting pulsars has allowed us to monitor the torque exerted during accretion. We
have found that spin-up and spin-down are nearly equally prevalent in these systems, contrary to the picture
in the 1970s, when most accreting pulsars were then observed to be spinning up steadily (see Figure 5 in
Joss & Rappaport 1984).
Assuming the gas deposits its angular momentum at the magnetospheric boundary and that field lines
transport all of this angular momentum to the star (Pringle & Rees 1972, Rappaport & Joss 1977b), the
accreting pulsar will experience a spin-up torque
N ≈ M√
GMxrm, (3)
where rm = ξrA is the magnetospheric radius with the Alfven radius
rA =
(
µ4
2GMxM2
)1/7
≃ 6.8 × 108 cm( µ
1030 G cm3
)4/7(
10−10 M⊙ yr−1
M
)2/7(1.4M⊙
Mx
)1/7
(4)

16
being a characteristic length found by equating magnetic and fluid stresses for a neutron star with magnetic
moment µ. Estimates for the model dependent dimensionless number ξ range from 0.52 (Ghosh & Lamb
1979) to ≈ 1 (Arons 1993; Ostriker & Shu 1995; Wang 1996) for the case at hand, where rm ∼ 108 cm. The
detailed physics by which material at this magnetospheric boundary loses its orbital angular momentum,
becomes entrained on the magnetic field lines, and makes its way to the magnetic polar caps is thought to
involve magnetohydrodynamical versions of Rayleigh-Taylor and Kelvin-Helmholtz instabilities (Lamb et al.
1973; Arons & Lea 1976, 1980; Elsner & Lamb 1977).
Accretion will be inhibited by a centrifugal barrier if the pulsar magnetosphere rotates faster than the
Kepler frequency at the inner disk boundary. For accretion to occur, the magnetospheric radius should thus
lie inside the corotation radius
rco =
(
GMxP2spin
4π2
)1/3
≃ 1.7 × 108 cm
(
Pspin
1 s
)2/3(Mx
1.4M⊙
)1/3
. (5)
For the case that rm < rco while accreting, there is a characteristic torque,
N0 ≡ M√
GMxrco, (6)
which is a convenient fiducial as it only depends on the observable spin period of the pulsar and the inferred
accretion rate. The fiducial torque sets a scale, and the actual torque may by significantly smaller. A pulsar
subject to the torque in (3) will spin up at a rate
ν =N
2πI≃ 1.6 × 10⁻¹³s−2
(
M
10−10M⊙ yr−1
)
(
Pspin
s
)1/3(rm
rco
)1/2
(7)
where I ≃ 0.4MxR2x is the neutron star’s moment of inertia (Ravenhall & Pethick 1994). The timescale for
spinning up the neutron star is then
tspinup ≡ ν
ν≃ 2 × 10⁵ yr
(
10−10M⊙ yr−1
M
)(
1 s
Pspin
)4/3(rco
rm
)1/2
, (8)
much shorter than the ages of most X-ray binaries (Elsner, Ghosh and Lamb 1980). Hence, in this simple
picture, the neutron star spins up until the spin frequency matches the Kepler frequency at the magnetosphere
(or where rm ≈ rco)
Pspin,eq ≈ 8 s
(
10−10M⊙ yr−1
〈M〉
)3/7( µ
1030 G cm3
)6/7
. (9)
Here 〈M〉 is an appropriately averaged mass accretion rate. Presumably, neutron stars with shorter periods
than Pspin,eq cannot accrete easily, and may experience a strong spin-down torque — the so-called “propeller
effect” (Illarionov and Sunyaev 1975). If the observed accreting pulsars are near their equilibrium spin
periods, then one infers magnetic field strengths from eq. (9) in the range 1011 − 1014 G. The instantaneous
accretion rates and observed torques can be much different than their long-term averages, however, so one
only obtains a rough measure of the pulsar magnetic field in this way.
A more complex picture of accretion torques emerged as more systems were discovered and spin histories
were extended. Her X-1 and LMC X-4 were found to be spinning up on a much longer timescale than predicted
by equation (8). Some pulsars show secular spin-down behavior while continuing to accrete ( 4U 1626-67,
GX 1+4, 1E 1048.1–5937, 1E 2259+586, E1145.1–614, 4U 1538–52), while others show more erratic variations
17
in spin period (Cen X–3, Vela X–1, X Per). More sophisticated theories of accretion torque were developed
to explain these observations, which take into account the magnetic interaction between the inner accretion
disk and the neutron star magnetosphere (Ghosh & Lamb 1979, Anzer & Borner 1980, Arons et al. 1984).
However, as we show in §4, the continuous monitoring of accreting pulsars by the BATSE instrument has
now substantially changed our view of many of these systems. We discuss these new observations and their
implication for theories of accretion torque in §5.
Fig. 4.— The spin period of the accreting neutron stars versus the binary period (the Corbet diagram). The
different symbols refer to the type of binary the neutron star resides in. Asterisks are supergiant companions
which are Roche-Lobe filling, squares are supergiant companions that underfill their Roche lobe, circles are
confirmed Be transient binaries, and crosses are those with low mass (∼< 2M⊙) companions (Her X-1, GRO
J1744–28, 4U 1626–67). Triangles refer to sources for which there are no optical companions yet identified,
though orbits have been measured (GS 0834–430, OAO 1657–415 and GRO J1750–27).
18
19
Fig. 5.— The Galactic distribution of accreting pulsars. We plot the known Be transients as open circles,
the low-mass objects as pluses, the disk-fed OB supergiants with asterisks and the wind-fed OB supergiants
with squares. This contains all pulsars listed in Table 1. Triangles denote sources with unknown companions
and orbit. This symbol convention is the same as in Figure 4, except here the symbols are not filled.

20
21
22
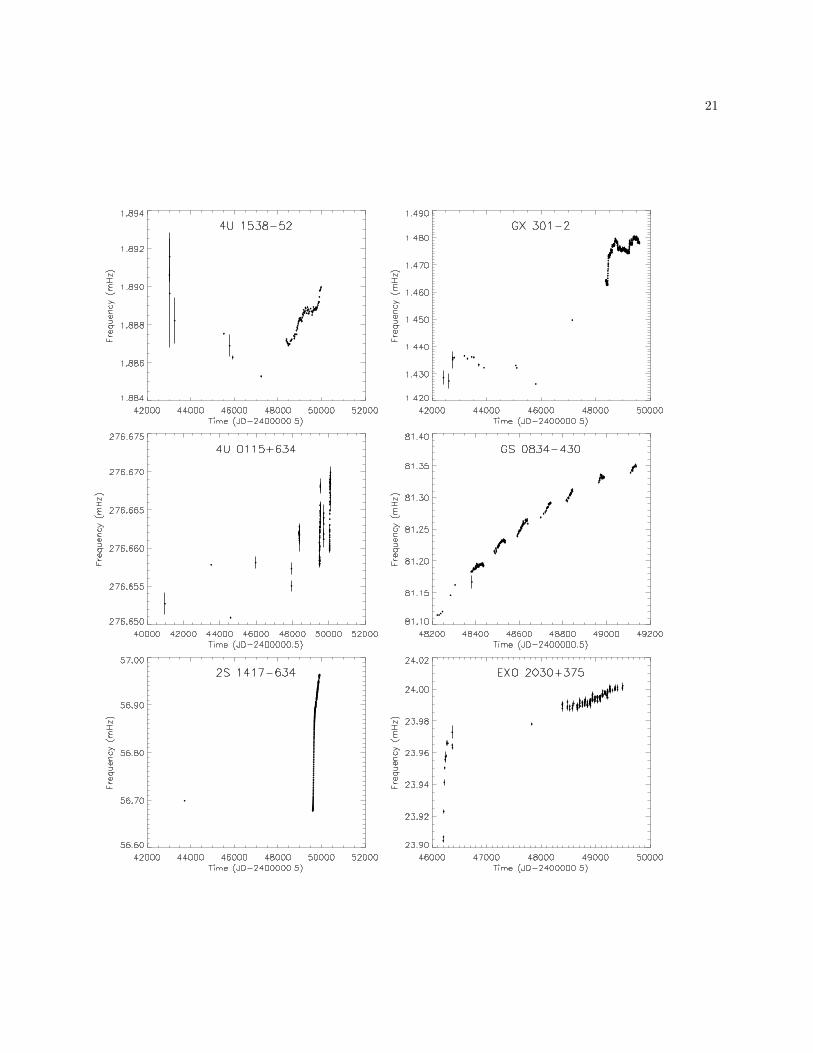
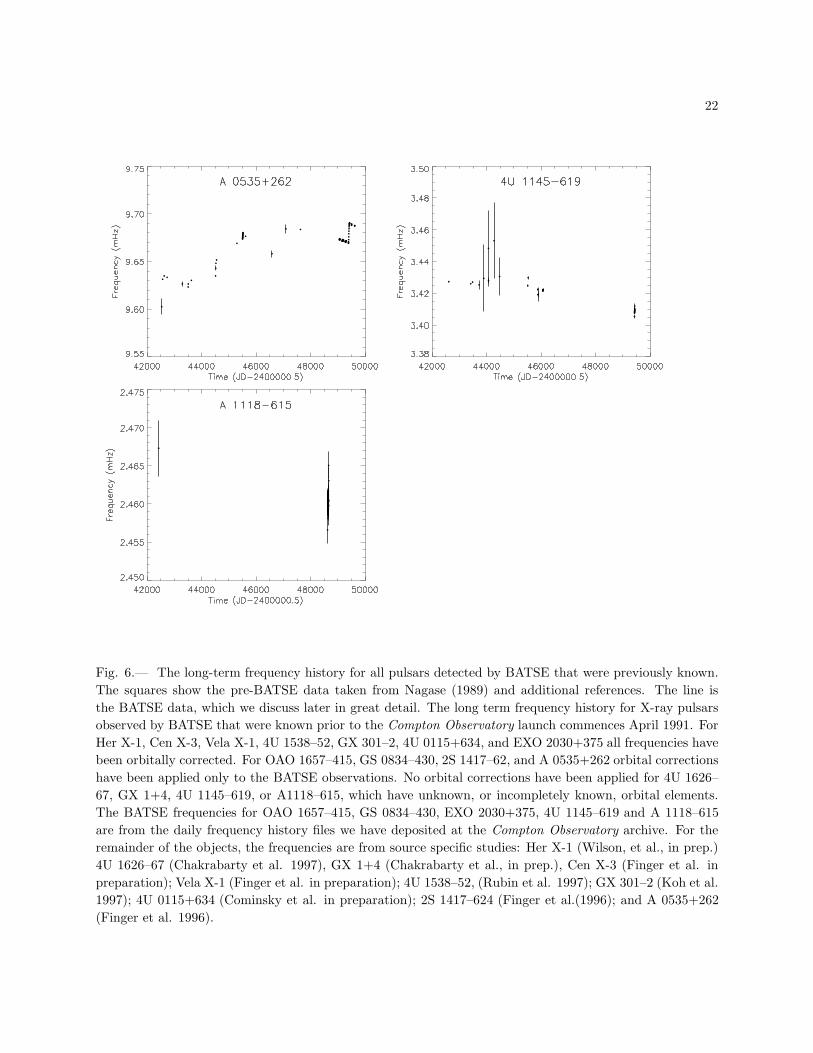
Fig. 6.— The long-term frequency history for all pulsars detected by BATSE that were previously known.
The squares show the pre-BATSE data taken from Nagase (1989) and additional references. The line is
the BATSE data, which we discuss later in great detail. The long term frequency history for X-ray pulsars
observed by BATSE that were known prior to the Compton Observatory launch commences April 1991. For
Her X-1, Cen X-3, Vela X-1, 4U 1538–52, GX 301–2, 4U 0115+634, and EXO 2030+375 all frequencies have
been orbitally corrected. For OAO 1657–415, GS 0834–430, 2S 1417–62, and A 0535+262 orbital corrections
have been applied only to the BATSE observations. No orbital corrections have been applied for 4U 1626–
67, GX 1+4, 4U 1145–619, or A1118–615, which have unknown, or incompletely known, orbital elements.
The BATSE frequencies for OAO 1657–415, GS 0834–430, EXO 2030+375, 4U 1145–619 and A 1118–615
are from the daily frequency history files we have deposited at the Compton Observatory archive. For the
remainder of the objects, the frequencies are from source specific studies: Her X-1 (Wilson, et al., in prep.)
4U 1626–67 (Chakrabarty et al. 1997), GX 1+4 (Chakrabarty et al., in prep.), Cen X-3 (Finger et al. in
preparation); Vela X-1 (Finger et al. in preparation); 4U 1538–52, (Rubin et al. 1997); GX 301–2 (Koh et al.
1997); 4U 0115+634 (Cominsky et al. in preparation); 2S 1417–624 (Finger et al.(1996); and A 0535+262
(Finger et al. 1996).

23
Table 4: Spectral Parameters measured with BATSESource Name Start End C30a b C30c kT d Energy Pulsed[MJD] [MJD] (PL) (PL) (EXP) (EXP) Rangee FluxfLow-mass systemsHer X-1g 48376 50114 62199 3.55.8 61-201 7.719 25165 7.4254U 162667 48450 48715 17.6(6) 4.66(17) 17.7(6) 10.8(6) 2676 2.2GX 1+4 48450 48715 57.3(6) 2.95(2) 49.6(5) 28.4(3) 26126 6.2High-mass supergiant and giant systemsOAO 1657415 48450 48715 45.6(6) 3.12(3) 40.7(6) 24.7(4) 26125 5.1Vela X-1 48450 48715 249(1) 4.05(1) 254(1) 13.56(3) 2497 30.8GX 3012 48450 48715 127(1) 4.26(2) 130(1) 12.1(1) 2574 15.8Transient Be-binary systemsGRO J175027 49960 49967 22(4) 5(1) 23(4) 10(3) 2672 2.9(7)2S 1417624 49623 49698 37.8(7) 2.92(3) 33.9(6) 28.1(6) 26124 4.3EXO 2030+375 49170 49360 54.8(17) 3.60(8) 46.6(15) 23.0(1) 2371 12.1GRO J100857 49182 49215 103(1) 3.11(2) 99(1) 22.1(3) 2596 12.2A0535+26 49379 49430 451(1) 2.99(1) 392(1) 26.3(1) 27100 49.24U 1145619 49428 49439 219(1) 3.48(1) 205(1) 19.3(2) 26123 25.1A 1118616 48621 48633 114(1) 3.66(4) 113(2) 16.2(3) 2476 13.7Transient systems with an undetermined companionGRO J1948+32 49448 49482 25.8(10) 2.88(8) 25.5(8) 22.9(11) 2476 3.2GRO J2058+42 49987 49993 113(8) 4.35(16) 87(6) 15.3(9) 35100 10.5aNormalization: 105 ph cm2 s1 keV1 at 30 keV, photon power-law (PL) model C30(E=30 keV)bPhoton index, PL modelcNormalization: 105 ph cm2 s1 keV1 at 30 keV, exponential (EXP) model C30(30 keV=E) exp[(E 30 keV)=kT]dTemperature (keV), EXP modeleEnergy range used in tting (keV)f1010 erg cm2 s1, 2050 keV, from EXP model. Highly variable for most sources.gFitted during Main Highs. Spectral shape varies. Table gives range of observed values.
24
4. BATSE OBSERVATIONS OF INDIVIDUAL SOURCES
BATSE continuously monitors the spin frequency and pulsed flux of 3 low-mass systems (Her X-1,
4U 1626–67, and GX 1+4) and 5 high-mass systems (Cen X-3, OAO 1657–415, Vela X-1, 4U 1538–52, and
GX 301–2). BATSE has also observed one or more outbursts from 7 known transient systems (4U 0115+63,
GS 0834–430, 2S 1417–624, EXO 2030+375, A 0535+26, 4U 1145–619, and A 1118–616). In addition, it
has discovered 5 new transients (GRO J1744–28, GRO J1750–27, GRO J1948+32, GRO J1008–57, and
GRO J2058+42). In Figure 6 we display long-term frequency histories of all sources seen with BATSE that
were known prior to BATSE, including archival data.
In this section, intrinsic spin frequency and flux histories for the persistently accreting binaries are
presented for the first four years of BATSE monitoring, 1993 April 23–1995 Feb 11 (MJD 48370–49760). We
also show frequency and flux histories of the outbursts for the transient sources. For those transients where
we have yet to measure the orbital parameters, we display the observed frequencies, whereas we display the
intrinsic spin frequencies for neutron stars with measured orbital parameters. Up-to-date results on these
sources are being made available through the public archive at the Compton Observatory Science Support
Center (http://cossc.gsfc.nasa.gov/cossc/COSSC HOME.html).
In the following subsections, we categorize the accreting pulsars by the type of star they are accreting
from: low mass stars (M ∼< 2M⊙), OB supergiants, and main sequence Be stars. We then briefly summarize
the BATSE observations of each individual binary, focusing on those results obtained from continuous timing
and pulsed flux monitoring.
Spectral fits to the pulsed flux are tabulated in Table 4 for most sources. These are typical spectra.
Exposure varies from source to source. The interval used for spectral fitting is not always the brightest the
source displayed. For some sources, spectra could not be determined because the spin frequency was too
high, the pulse profile varied with energy and/or luminosity, or the source was too weak.
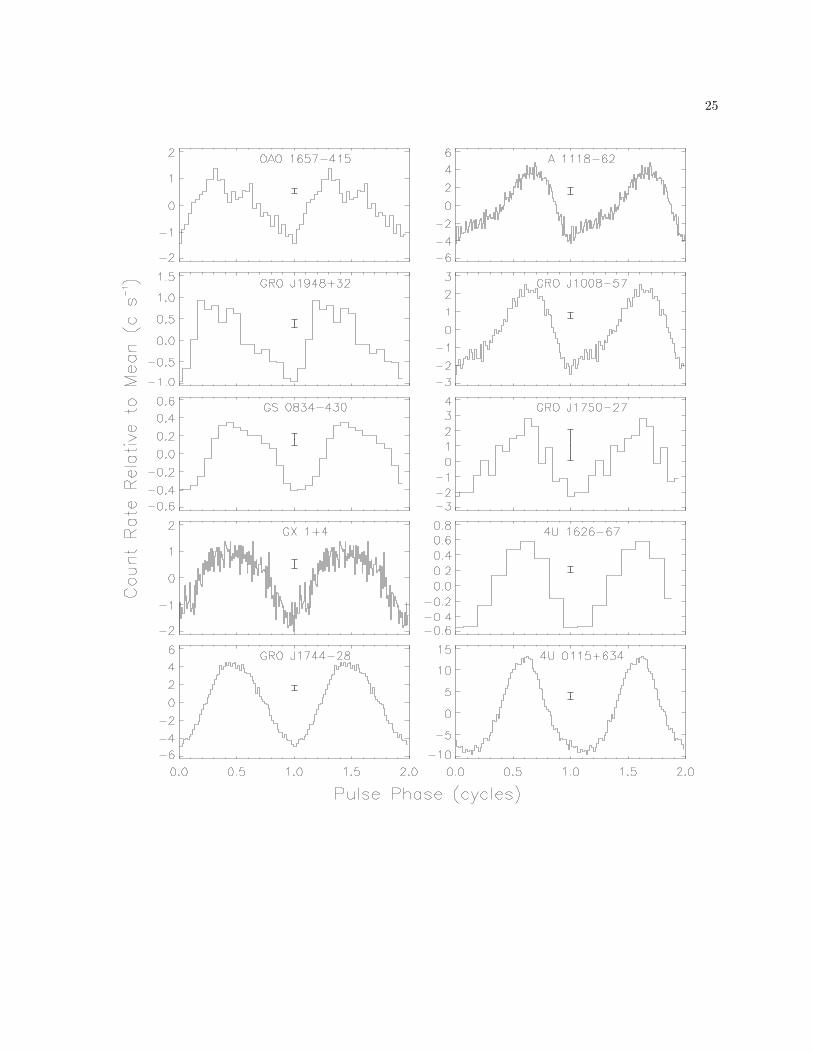
Pulse profiles for all sources seen with BATSE are displayed in Figure 7. High energy pulse profiles in
accretion-powered pulsars are generally simpler and smoother than those ∼<10keV, as they are less affected by
circumstellar scattering and absorption. Thus, they may be more indicative of the instrinsic radiation pattern
from the neutron star. The profiles in Figure 7 can be classified broadly as single or double peaked. Aside
from 4U 1145–619 and Her X-1 the profiles are essentially featureless, although they are visibly asymmetic,
as can be seen clearly in OAO 1657–415 and Vela X-1. Cases where the pulse shape changes dramatically
with energy or flux are discussed individually. Fluxes measured with BATSE have been found using both
power-law and simple exponential models.
25
26
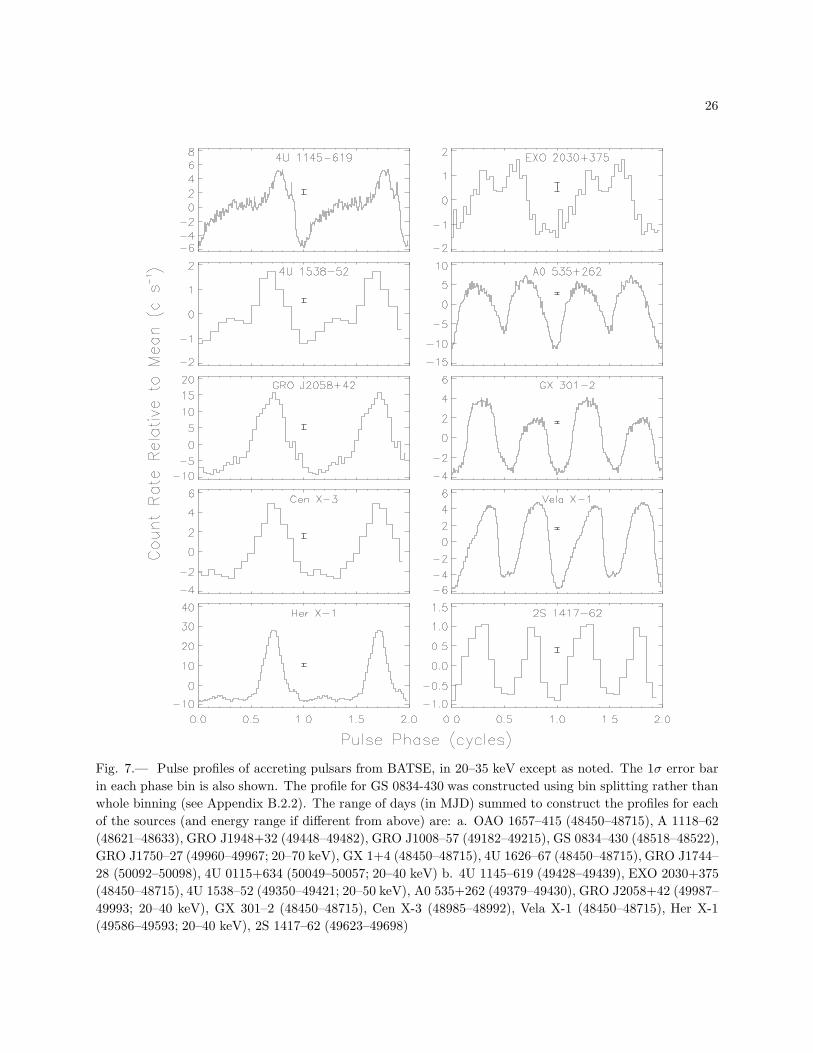
Fig. 7.— Pulse profiles of accreting pulsars from BATSE, in 20–35 keV except as noted. The 1σ error bar
in each phase bin is also shown. The profile for GS 0834-430 was constructed using bin splitting rather than
whole binning (see Appendix B.2.2). The range of days (in MJD) summed to construct the profiles for each
of the sources (and energy range if different from above) are: a. OAO 1657–415 (48450–48715), A 1118–62
(48621–48633), GRO J1948+32 (49448–49482), GRO J1008–57 (49182–49215), GS 0834–430 (48518–48522),
GRO J1750–27 (49960–49967; 20–70 keV), GX 1+4 (48450–48715), 4U 1626–67 (48450–48715), GRO J1744–
28 (50092–50098), 4U 0115+634 (50049–50057; 20–40 keV) b. 4U 1145–619 (49428–49439), EXO 2030+375
(48450–48715), 4U 1538–52 (49350–49421; 20–50 keV), A0 535+262 (49379–49430), GRO J2058+42 (49987–
49993; 20–40 keV), GX 301–2 (48450–48715), Cen X-3 (48985–48992), Vela X-1 (48450–48715), Her X-1
(49586–49593; 20–40 keV), 2S 1417–62 (49623–49698)

27
4.1. Low-Mass Systems
Only four accreting pulsars are definitely known to be orbiting low mass (M ∼< 2M⊙) stars: Her X-1 and
GRO J1744–28 on the basis of timing-based measurements of their companions’ mass functions (Tananbaum
et al. 1972, Finger et al. 1996), 4U 1626–67 from optical photometry (Middleditch et al. 1981, Chakrabarty
1997), and GX 1+4 from spectroscopy (Davidsen, Malina, & Bowyer 1977, Chakrabarty & Roche 1997).
This is a very heterogeneous class of objects: the mass donors are a main sequence A star (Her X-1), a
< 0.1M⊙ helium or carbon-oxygen degenerate dwarf (4U 1626–67), and two red giants (GX 1+4, GRO
J1744–28). The absence of an observable companion in very deep optical and IR searches and the lack of
orbital detections also suggest low mass companions for 4U 0142+61, 1E 1048.1–5937, RX J1838.4–0301 and
1E 2259+589 (see Mereghetti & Stella 1995 and references therein). We now discuss the BATSE observations
of Her X-1, 4U 1626–67, GX 1+4, and GRO J1744–28.
Fig. 8.— Her X-1 frequency and pulsed flux measurements from BATSE. A mean frequency has been
determined for each Main High state for which adequate scheduled folded-on-board data was available. The
frequencies, which have been orbitally corrected using parameters from Wilson et al.(1994a), were obtained
using linear fits to pulse phases of 20–70 keV data (see Appendix B.1.3). Pulsed fluxes are the pulse phase-
averaged flux obtained during one orbital period (averaged from eclipse egress to eclipse ingress) during the
brightest portion of each available Main High state. An exponential model, with the e–folding energy allowed
to vary, was used to obtain the fluxes (see Appendix B.2.3).
Hercules X-1. — Uhuru discovered 1.2 s pulsations from Her X-1 (4U1656+354) in 1971 (Tananbaum
et al. 1972) and the pulsar was subsequently found to be in an eclipsing, circular, 1.7 d orbit (Deeter,
Boynton, & Pravdo 1981) around the low–mass companion HZ Her (Doxsey et al. 1973, Gottwald et al.
1991). This disk-fed system exhibits “super-cycles” of intensity modulated with a period of ≈35 d (Giacconi
28
et al. 1973, Soong et al. 1990). At energies of 1-10 keV, the source is observed during both a “Main High”
and “Short High” interval of the 35 day cycle. Detailed discussion of BATSE observations have appeared
elsewhere (Wilson et al. 1994d, Wilson et al. 1994c).
BATSE detects pulsations for 5–10 days during each Main High interval. We report an average frequency
for each Main High interval since reliable measurements of ν within a Main High are hampered by the low
signal-to-noise ratio of the BATSE data as well as pulse shape variations. Analyses of 20 Her X-1 Main
High Observations through July 1993 found that the pulsed 20–70 keV luminosity varied by a factor of
∼4, and that the pulsar was spinning down during 35d cycles when the immediately preceding Main High
interval luminosity (averaged over the peak days of the interval), and presumably the mass accretion rate,
was low (Wilson et al. 1994d). Subsequent observations do not universally show a significant correlation
of luminosity and ν, with some episodes of spindown following intervals with high flux levels. The neutron
star is usually spinning up with ν between zero and a maximum of 5 × 10⁻¹³ Hz s−1 between 32 of the 48
observed intervals. As is evident in Figure 8, the maximum spindown rates are larger in magnitude, reaching
7 × 10⁻¹³ Hz s−1.
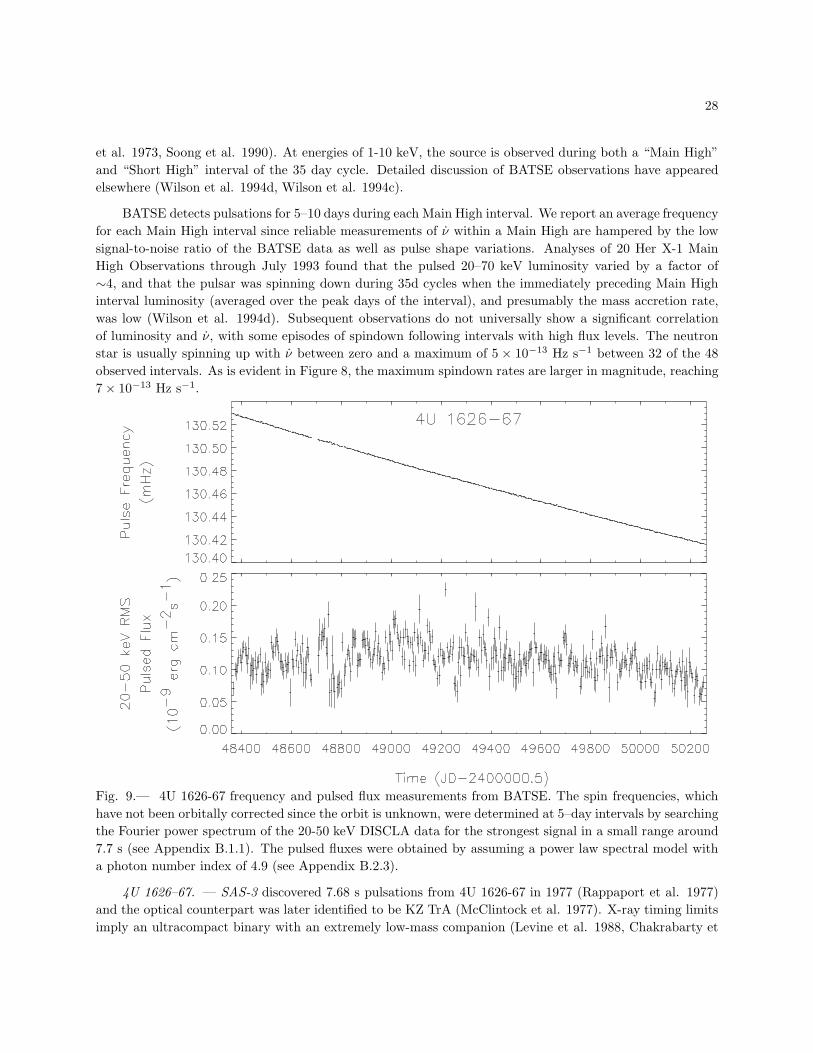
Fig. 9.— 4U 1626-67 frequency and pulsed flux measurements from BATSE. The spin frequencies, which
have not been orbitally corrected since the orbit is unknown, were determined at 5–day intervals by searching
the Fourier power spectrum of the 20-50 keV DISCLA data for the strongest signal in a small range around
7.7 s (see Appendix B.1.1). The pulsed fluxes were obtained by assuming a power law spectral model with
a photon number index of 4.9 (see Appendix B.2.3).
4U 1626–67. — SAS-3 discovered 7.68 s pulsations from 4U 1626-67 in 1977 (Rappaport et al. 1977)
and the optical counterpart was later identified to be KZ TrA (McClintock et al. 1977). X-ray timing limits
imply an ultracompact binary with an extremely low-mass companion (Levine et al. 1988, Chakrabarty et
29
al. 1997a). There is optical photometric evidence for a 42-min orbital period (Middleditch et al. 1981,
Chakrabarty 1997), suggesting a mass of < 0.1M⊙ for the mass donor.
Detailed discussion of BATSE observations have appeared elsewhere (Bildsten et al. 1994, Chakrabarty
et al. 1997a). The neutron star was observed to spin up steadily during 1977-1991 and made a transition
to steady spin-down at nearly the same rate of |ν/ν| ≈ 5000yr by the start of BATSE observations in 1991.
Despite this torque reversal, there is no evidence for a large change in the bolometric flux from the source.
The torque exerted on the neutron star is quiet, in the sense that the torque-fluctuation power measured
by BATSE is the lowest measured for any X-ray pulsar and is comparable to the timing noise observed in
young rotation-powered radio pulsars.
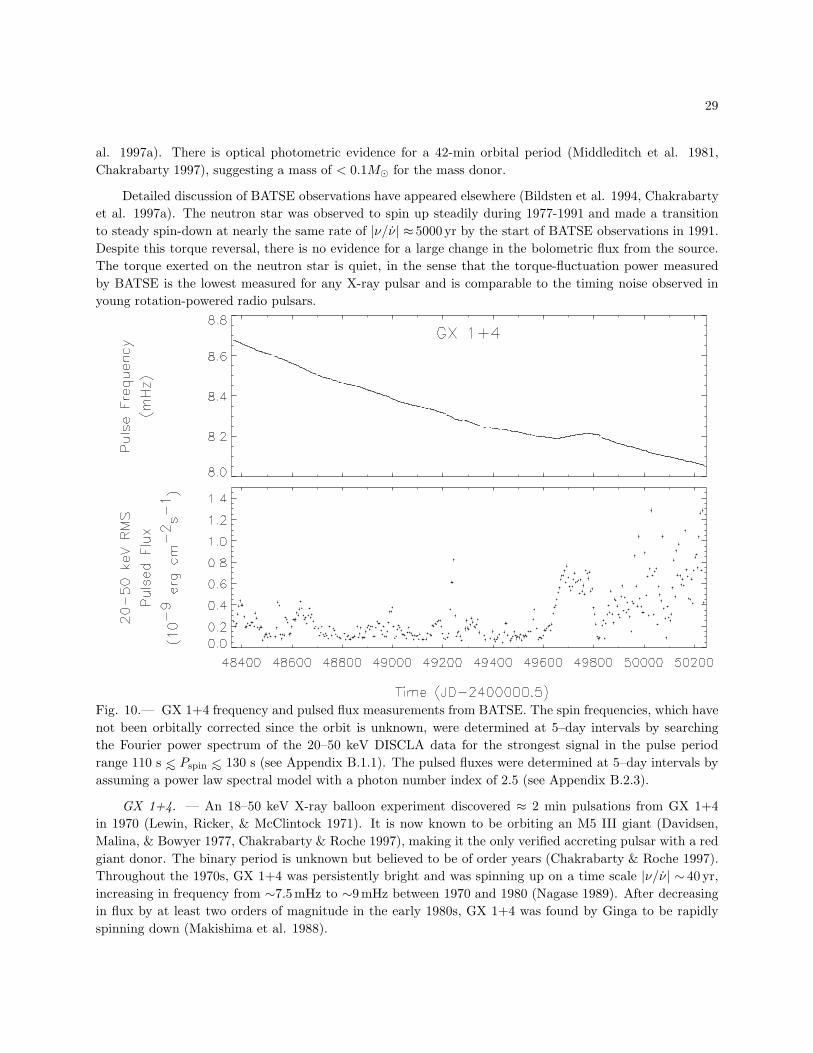
Fig. 10.— GX 1+4 frequency and pulsed flux measurements from BATSE. The spin frequencies, which have
not been orbitally corrected since the orbit is unknown, were determined at 5–day intervals by searching
the Fourier power spectrum of the 20–50 keV DISCLA data for the strongest signal in the pulse period
range 110 s ∼< Pspin ∼< 130 s (see Appendix B.1.1). The pulsed fluxes were determined at 5–day intervals by
assuming a power law spectral model with a photon number index of 2.5 (see Appendix B.2.3).
GX 1+4. — An 18–50 keV X-ray balloon experiment discovered ≈ 2 min pulsations from GX 1+4
in 1970 (Lewin, Ricker, & McClintock 1971). It is now known to be orbiting an M5 III giant (Davidsen,
Malina, & Bowyer 1977, Chakrabarty & Roche 1997), making it the only verified accreting pulsar with a red
giant donor. The binary period is unknown but believed to be of order years (Chakrabarty & Roche 1997).
Throughout the 1970s, GX 1+4 was persistently bright and was spinning up on a time scale |ν/ν| ∼ 40 yr,
increasing in frequency from ∼7.5mHz to ∼9mHz between 1970 and 1980 (Nagase 1989). After decreasing
in flux by at least two orders of magnitude in the early 1980s, GX 1+4 was found by Ginga to be rapidly
spinning down (Makishima et al. 1988).
30
Detailed discussions of the BATSE observations of GX 1+4 have appeared elsewhere (Chakrabarty et
al. 1994a, Chakrabarty et al. 1997b) These observations found GX 1+4 to have the hardest spectrum of
any accretion-powered pulsar, with pulsations clearly detected up to energies of 160 keV (Chakrabarty et
al. 1997b). GX 1+4 is spinning down on average, on a time scale |ν/ν| ≈ 40 yr. During 1991–1994, BATSE
observed a number of bright flares in the hard X-ray (20–100 keV) band which were accompanied by episodes
of enhanced spin-down. A smooth torque reversal to spin-up accompanied an extended bright state during
late 1994 and early 1995 (Chakrabarty et al. 1994b), followed by a return to spin-down and a lower average
hard X-ray flux (Chakrabarty et al. 1995b). During spin-down, the torque fluctuations exhibit a 1/f power
density spectrum, similar to that seen in Cen X-3.
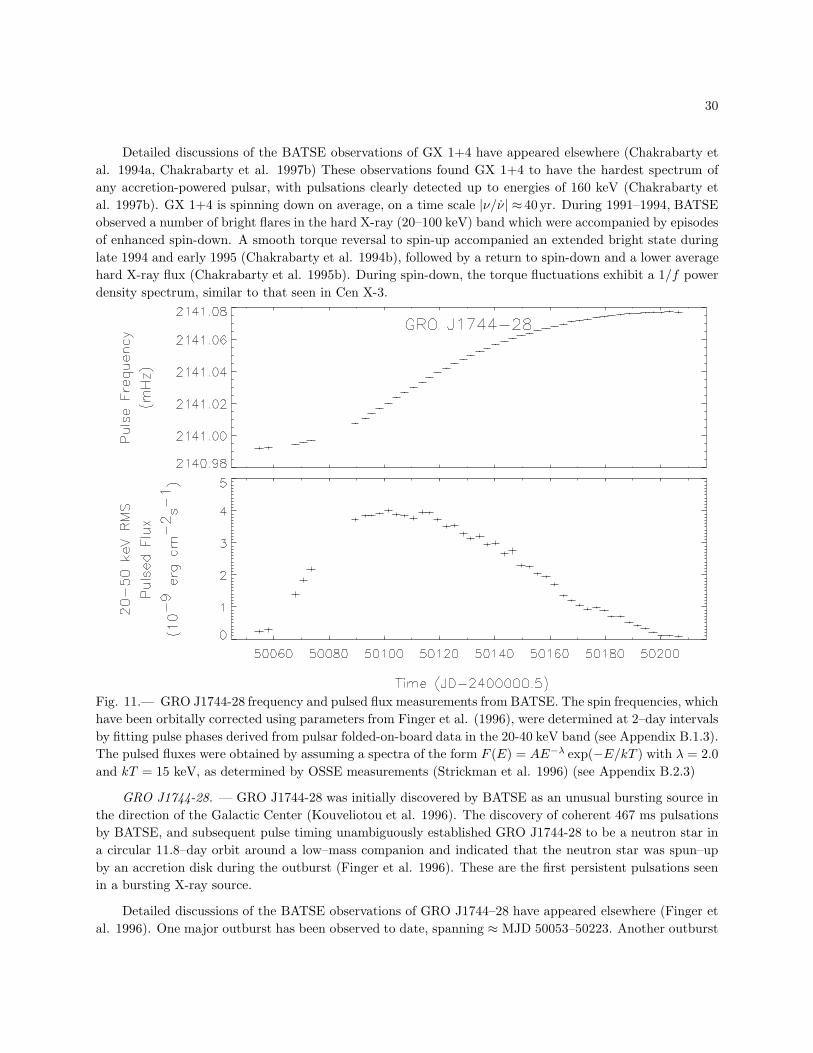
Fig. 11.— GRO J1744-28 frequency and pulsed flux measurements from BATSE. The spin frequencies, which
have been orbitally corrected using parameters from Finger et al. (1996), were determined at 2–day intervals
by fitting pulse phases derived from pulsar folded-on-board data in the 20-40 keV band (see Appendix B.1.3).
The pulsed fluxes were obtained by assuming a spectra of the form F (E) = AE−λ exp(−E/kT ) with λ = 2.0
and kT = 15 keV, as determined by OSSE measurements (Strickman et al. 1996) (see Appendix B.2.3)
GRO J1744-28. — GRO J1744-28 was initially discovered by BATSE as an unusual bursting source in
the direction of the Galactic Center (Kouveliotou et al. 1996). The discovery of coherent 467 ms pulsations
by BATSE, and subsequent pulse timing unambiguously established GRO J1744-28 to be a neutron star in
a circular 11.8–day orbit around a low–mass companion and indicated that the neutron star was spun–up
by an accretion disk during the outburst (Finger et al. 1996). These are the first persistent pulsations seen
in a bursting X-ray source.
Detailed discussions of the BATSE observations of GRO J1744–28 have appeared elsewhere (Finger et
al. 1996). One major outburst has been observed to date, spanning ≈ MJD 50053–50223. Another outburst
31
which began on ≈ MJD 50253 lasted for only ≈ 1 week. The initial outburst showed enough dynamic
range that the relation between accretion torque and pulsed flux could be tested directly (see §5.2). The
20–40 keV pulse profile is nearly sinusoidal, in stark contrast to the more complicated pulse shapes seen in
other accretion powered pulsars (see Figure 7). Simultaneous 20–40 keV pulsed and Earth occultation DC
flux measurements on 10–16 January 1996 (MJD 50092–50098) yielded a peak-to-peak pulsed fraction of ≈25% (Finger et al. 1996).
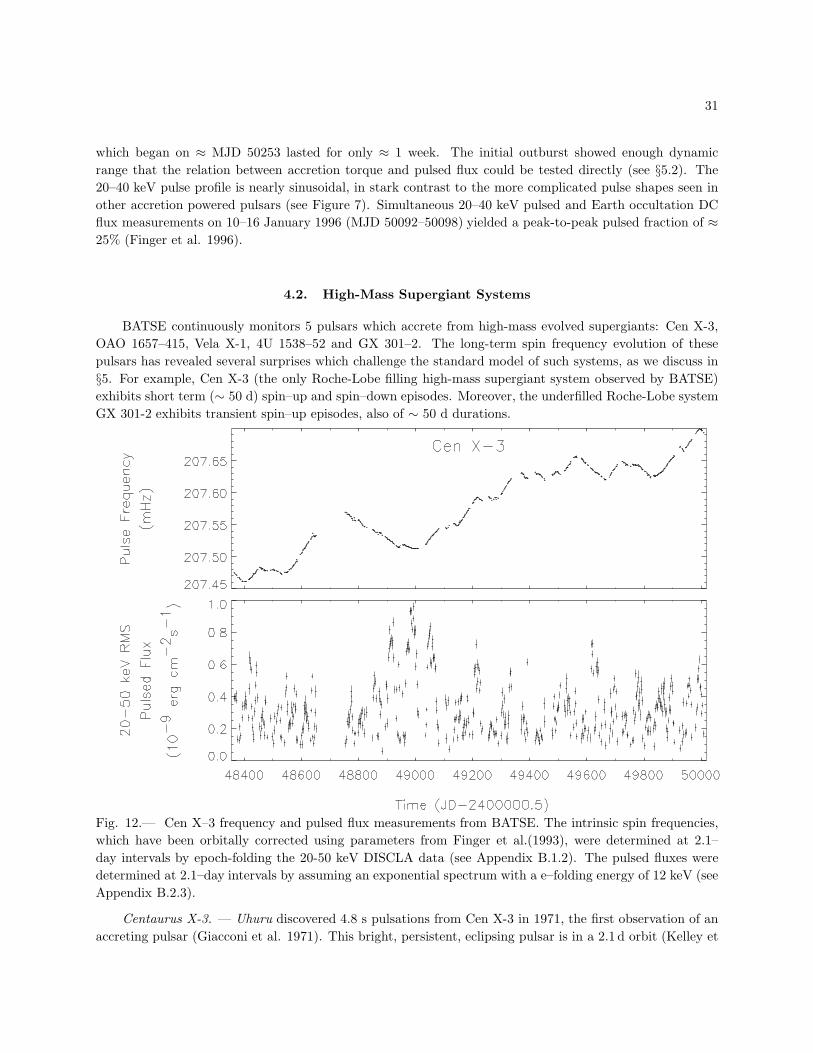
4.2. High-Mass Supergiant Systems
BATSE continuously monitors 5 pulsars which accrete from high-mass evolved supergiants: Cen X-3,
OAO 1657–415, Vela X-1, 4U 1538–52 and GX 301–2. The long-term spin frequency evolution of these
pulsars has revealed several surprises which challenge the standard model of such systems, as we discuss in
§5. For example, Cen X-3 (the only Roche-Lobe filling high-mass supergiant system observed by BATSE)
exhibits short term (∼ 50 d) spin–up and spin–down episodes. Moreover, the underfilled Roche-Lobe system
GX 301-2 exhibits transient spin–up episodes, also of ∼ 50 d durations.
Fig. 12.— Cen X–3 frequency and pulsed flux measurements from BATSE. The intrinsic spin frequencies,
which have been orbitally corrected using parameters from Finger et al.(1993), were determined at 2.1–
day intervals by epoch-folding the 20-50 keV DISCLA data (see Appendix B.1.2). The pulsed fluxes were
determined at 2.1–day intervals by assuming an exponential spectrum with a e–folding energy of 12 keV (see
Appendix B.2.3).
Centaurus X-3. — Uhuru discovered 4.8 s pulsations from Cen X-3 in 1971, the first observation of an
accreting pulsar (Giacconi et al. 1971). This bright, persistent, eclipsing pulsar is in a 2.1 d orbit (Kelley et

32
al. 1983) around the O6–8 supergiant V779 Cen (Krzeminski 1974, Rickard 1974, Hutchings et al. 1979).
An accretion disk is apparent from the optical lightcurve (Tjemkes, Zuiderwijk, & van Paradijs 1986). Pre-
BATSE observations by numerous pointed instruments found the neutron star to be gradually spinning up,
although episodes of spin-down have been observed (Nagase 1989).
Detailed discussions of the BATSE observations of Cen X-3 have appeared elsewhere (Finger et al.
1992, Finger, Wilson, & Fishman 1994). These continuous observations found that the long term (∼years)
spin-up trend is actually the average effect of alternating 10∼100d intervals of spin-up and spin-down at a
constant rate (Finger, Wilson, & Fishman 1994). Large excursions in the X-ray intensity occur on timescales
of days to weeks, including bright flares lasting 10–40 days. A comparison of the orbital measurements made
over the last 20 years reveals that the orbital period is decreasing (Kelley et al. 1983, Nagase et al. 1992).
BATSE confirms this orbital decay (Finger et al. 1993), which is thought to be due to the tidal interaction
of the neutron star with its companion.
Fig. 13.— OAO 1657–415 frequency and pulsed-flux measurements from BATSE. The intrinsic spin fre-
quencies, which have been orbitally corrected using parameters from Chakrabarty et al.(1993) and a refined
orbital period of Porb = 10.44809(30)d (see text below for details), were measured at 1–day intervals from
the power spectra of the 15–55 keV CONT data (see Appendix B.1.1). The pulsed fluxes were measured at
1–day intervals by assuming an exponential spectrum with a e–folding energy of 20 keV (see Appendix B.2.3).
OAO 1657–415. — HEAO 1 discovered 38.22 s pulsations from OAO 1657-415 in 1978 (White & Pravdo
1979). BATSE observations revealed a 10.4 d binary orbit with a 1.7 d eclipse by the stellar companion
(Chakrabarty et al. 1993), making it the seventh eclipsing X-ray pulsar discovered. The intrinsic spin
frequency history reveals strong, stochastic variability and alternating episodes of steady spin-up and spin-
33
down lasting 10–200d, similar to what is seen in Cen X-3. Although the companion remains unidentified, it
is inferred to be an OB supergiant from the neutron-star orbit (Table 3) and eclipse duration (Chakrabarty
et al. 1993).
Chakrabarty et al. (1993) measured the binary orbital parameters using BATSE data spanning 1991
April 24 to 1992 July 23 (MJD 48370–48460). For the spin frequency history presented here, which extends
far beyond the data used in the original orbital analysis, it was necessary to refine the orbital period. For
this purpose the pulse frequencies obtained between 1991 April 24 and 1994 September 20 (MJD 48370–
49615) were fitted using the Chakrabarty et al. (1993) orbital elements, with Porb as a free parameter.
The contribution to the uncertainty in Porb from stochastic variations in accretion torque was estimated by
assuming that ν performed a random walk with a strength of 2.5 × 10⁻¹⁷ Hz2 s−1, as estimated from the
power spectrum of the frequency derivative measured at Porb (see Figure 34). The revised orbital period is
Porb = 10.44809(30)d, consistent with the value measured by Chakrabarty et al. (1993), but of improved
accuracy.
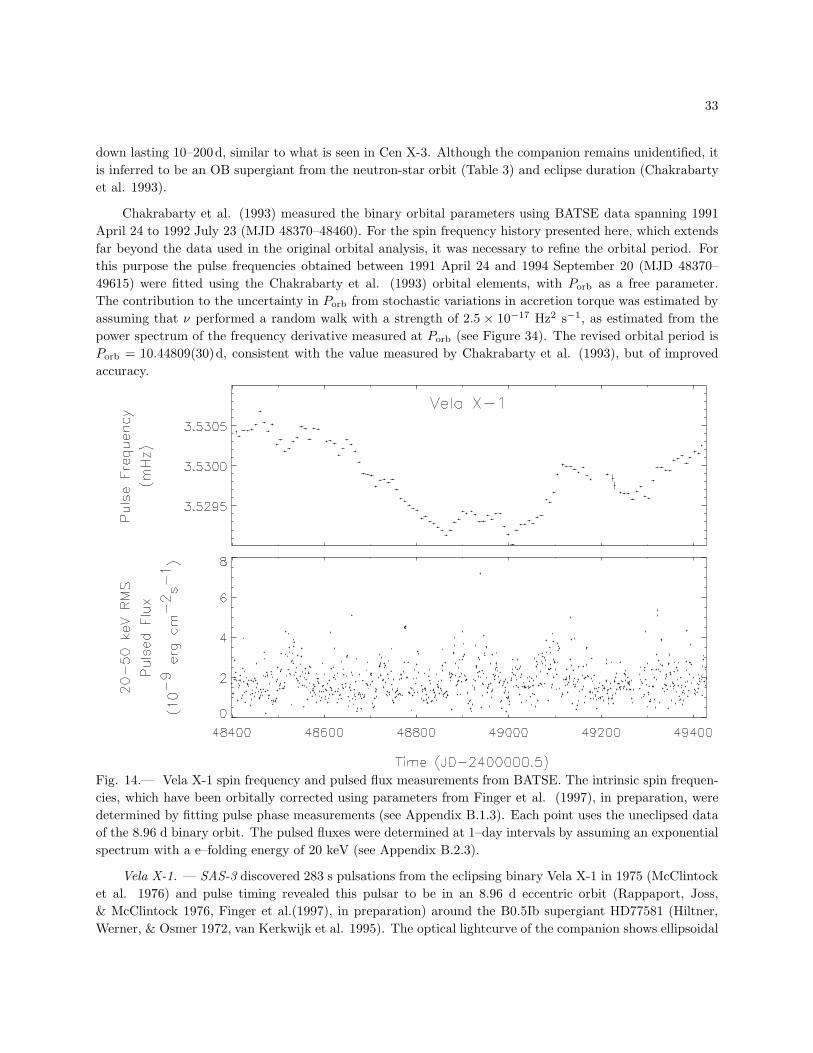
Fig. 14.— Vela X-1 spin frequency and pulsed flux measurements from BATSE. The intrinsic spin frequen-
cies, which have been orbitally corrected using parameters from Finger et al. (1997), in preparation, were
determined by fitting pulse phase measurements (see Appendix B.1.3). Each point uses the uneclipsed data
of the 8.96 d binary orbit. The pulsed fluxes were determined at 1–day intervals by assuming an exponential
spectrum with a e–folding energy of 20 keV (see Appendix B.2.3).
Vela X-1. — SAS-3 discovered 283 s pulsations from the eclipsing binary Vela X-1 in 1975 (McClintock
et al. 1976) and pulse timing revealed this pulsar to be in an 8.96 d eccentric orbit (Rappaport, Joss,
& McClintock 1976, Finger et al.(1997), in preparation) around the B0.5Ib supergiant HD77581 (Hiltner,
Werner, & Osmer 1972, van Kerkwijk et al. 1995). The optical lightcurve of the companion shows ellipsoidal
34
variations, indicating that the star is substantially distorted by the tidal field from the neutron star (Tjemkes,
Zuiderwijk, & van Paradijs 1986).
Vela X-1 is the brightest persistent accretion-powered pulsar in the 20–50 keV energy band. Individual
pulses are often visible in the raw data (Figure 1). BATSE observations showed Vela X-1 alternating between
spin-up and spin-down, with no long-term trend in spin frequency, consistent with pre-BATSE observations
of a random-walk in spin frequency (Deeter et al. 1989). Pulse profiles in the BATSE energy range are
double peaked and vary slightly with both energy and time, with some evidence for a correlation between
luminosity and pulse shape. At lower energies the pulse profiles are more complex, showing dramatic changes
with energy (Raubenheimer 1990).
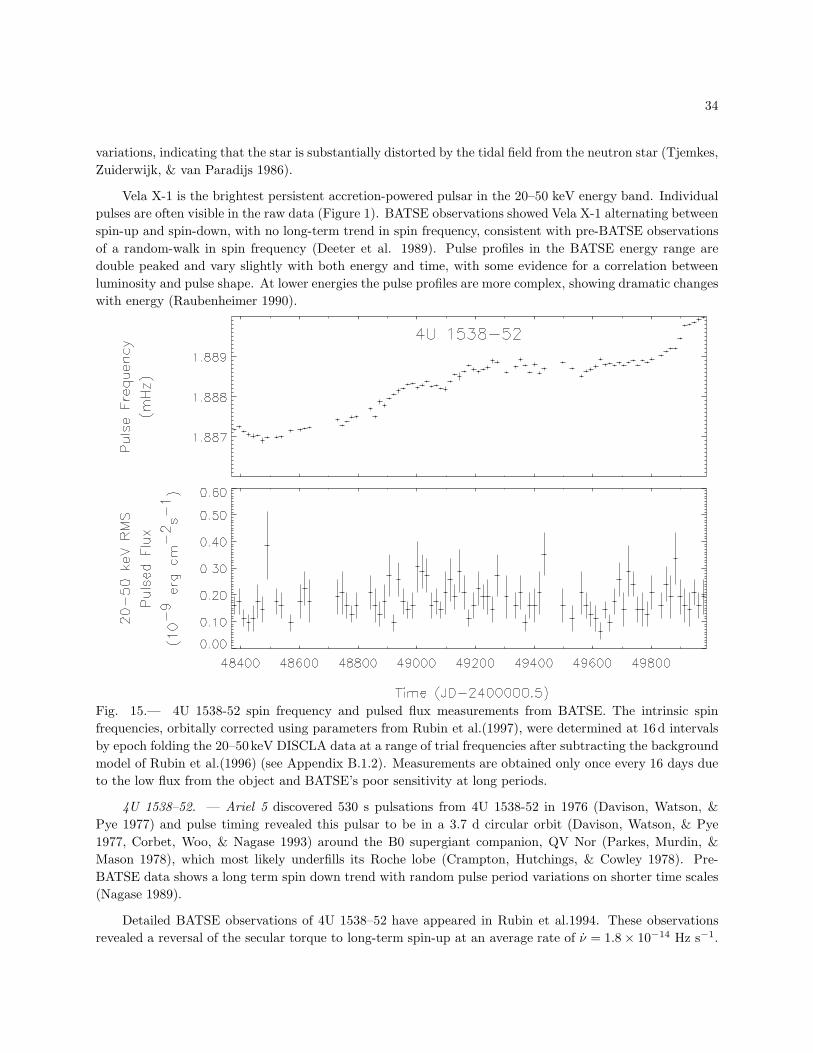
Fig. 15.— 4U 1538-52 spin frequency and pulsed flux measurements from BATSE. The intrinsic spin
frequencies, orbitally corrected using parameters from Rubin et al.(1997), were determined at 16d intervals
by epoch folding the 20–50keV DISCLA data at a range of trial frequencies after subtracting the background
model of Rubin et al.(1996) (see Appendix B.1.2). Measurements are obtained only once every 16 days due
to the low flux from the object and BATSE’s poor sensitivity at long periods.
4U 1538–52. — Ariel 5 discovered 530 s pulsations from 4U 1538-52 in 1976 (Davison, Watson, &
Pye 1977) and pulse timing revealed this pulsar to be in a 3.7 d circular orbit (Davison, Watson, & Pye
1977, Corbet, Woo, & Nagase 1993) around the B0 supergiant companion, QV Nor (Parkes, Murdin, &
Mason 1978), which most likely underfills its Roche lobe (Crampton, Hutchings, & Cowley 1978). Pre-
BATSE data shows a long term spin down trend with random pulse period variations on shorter time scales
(Nagase 1989).
Detailed BATSE observations of 4U 1538–52 have appeared in Rubin et al.1994. These observations
revealed a reversal of the secular torque to long-term spin-up at an average rate of ν = 1.8 × 10⁻¹⁴ Hz s−1.

35
However, the change in ν is comparable in magnitude to what one would predict from the observed torque-
noise strength of ∼ 10−20 Hz2 s−2 Hz−1 (Figure 34), and is thus consistent with being the result of a random
walk in frequency. Combining orbital epochs measured with BATSE with those determined from previous
experiments has led to an improved value for the orbital period (see footnote to Table 3) and a 95% confidence
limit on the rate of change of Porb of −3.9 × 10⁻⁶ < Porb/Porb < 2.1 × 10⁻⁶ yr−1 (Rubin et al. 1997).
Fig. 16.— GX301–2 frequency and pulsed flux measurements from BATSE. The intrinsic spin frequencies,
which have been orbitally corrected using parameters from Koh et al.(1997), were measured at 2–day intervals
by searching the Fourier power spectrum of the 15–55 keV CONT data for the strongest signal in a range
around the previously observed pulse frequency (see Appendix B.1.1). The pulsed fluxes were measured at
2–day intervals by assuming an exponential spectrum with a e–folding energy of 10 keV (see Appendix B.2.3).
GX 301–2. — Ariel 5 discovered 700 s pulsations from GX 301-2 (4U 1223-62) (White et al. 1976) and
subsequent observations revealed the neutron star to be in a 41.5 day eccentric (e = 0.47) orbit (Sato et al.
1986) around the supergiant Wray 977 (Parkes et al. 1980, Kaper et al. 1995). Between 1975 and 1985,
the neutron star was, on average, neither spinning up nor down, indicative of wind accretion. However, a
prolonged period of spin–up at ν ≈ 2 × 10⁻¹³ began in 1985 (Nagase 1989).
Detailed discussion of BATSE observations have appeared elsewhere (Koh et al. 1997). BATSE observed
two rapid spin-up episodes with ν ≈ (3–5) ×10−12 Hz s−1, each lasting ∼30 days, probably indicating the
formation of a transient accretion disk. Except for these spin-up episodes, there are virtually no net changes
in ν on long time scales, suggesting that the long-term spin-up trend observed since 1985 may be due
entirely to brief (≈ 30 d) spin-up episodes similar to those we have discovered. In addition to confirming
the previously known flare which occurs ≈ 1.4 d before periastron, BATSE occultation and pulsed-flux

36
measurements folded at the orbital period reveal a smaller flare near apastron (Pravdo et al. 1995, Koh
et al. 1997). Orbital parameters measured with BATSE are consistent with previous measurements, with
improved accuracy in the orbital epoch (Koh et al. 1997, Table 3). Simultaneous pulsed and occultation
fluxes measured near periastron yield a 20–55 keV peak-to-peak pulsed fraction of ≈ 0.5 (Koh et al. 1997).
4.3. High-Mass Transient Systems
BATSE has discovered four new high-mass, transient accreting pulsars (GRO J1008–57, GRO J1948+32,
GRO J2058+42, and GRO J1750–27), two of which (GRO J2058+42 and GRO J1008–57) have repeated.
In addition, BATSE has observed multiple outbursts of the previously known transient accreting pulsars
4U 0115+63, GS 0834–43, 2S 1417–62, A 0535+26, 4U 1145-619 and EXO 2030+375, and a single outburst
from A 1118–615. Outburst times and durations are shown in Figure 17.
Fig. 17.— Outburst times for all transient accreting pulsars observed by BATSE.
BATSE has observed a series of regularly-spaced outbursts from several transient pulsars. This was the
case for GRO J1008–57 (5 outbursts), GRO J2058+42 (5 outbursts), A 0535+26 (6 outbursts), 4U 0115–634
(4 outbursts), 2S 1417–62 (8 outbursts), EXO 2030+375 (17 outbursts), 4U 1145–619 (7 outbursts) and
GS 0834–430 (7 outbursts). In some cases one or more outbursts were missing from the sequence. In the
case of GS 0834–43 the spacing of the final two outbursts was irregular.

37
Fig. 18.— 4U 0115+634 frequency and flux measurements from BATSE. The intrinsic spin frequencies, which
have been orbitally corrected using the orbital parameters discussed in the text, were determined at 1–day
intervals by epoch folding the 20–50 keV DISCLA data at a range of trial frequencies (see Appendix B.1.2).
The pulsed fluxes were determined at 1–day intervals by assuming an exponential spectrum with an e–folding
energy of 15 keV (see Appendix B.2.3). The gaps in Figure 18 are extended intervals when the source was
undetectable with BATSE.
4U 0115+634. — SAS-3 discovered 3.6 s pulsations from 4U 0115+634 in 1978 (Cominsky et al. 1978)
and subsequent pulse-timing revealed the pulsar to be in a 24 d eccentric orbit (Rappaport et al. 1978)
around the heavily reddened Be Star, V635 Cas (Johns et al. 1978). To date, BATSE has observed 5
outbursts from 4U 0115+634. A 48 day outburst from 1994 May 7 – June 24 (MJD 49480–49528) (Scott et
al. 1994, Wilson, Finger, & Scott 1994) showed a sudden rise in pulsed flux at the middle of the outburst,
shortly following periastron passage (MJD 49498.1). A 36 day outburst from 1995 November 17 –December
27 (MJD 50039–50075) (Finger et al. 1995) was also seen by Granat/Watch (Sazonov & Sunyaev 1995).
This was immediately followed in 1996 January by a short weak outburst. Not shown in Figure 18 is a 10
day outburst in August 1996 (Scott et al. 1996).
We estimated the epoch of periastron for the outbursts in 1991 April, 1994 May–June, and 1995
November–December by fitting the phase measurements for each data set with a polynomial in pulse emis-
sion time using the orbital elements from Rappaport et al.(1978), but allowing the epoch of periastron to
vary. This resulted in periastron epochs of MJD 48355.44(7), 49498.1232(15) and 50057.4015(32), which
are plotted in Figure 19 along with previous determinations. The Ginga result (Tamura et al. 1992)
deviates from the trend of the other points. This may be due to an incorrect phase connection in that
poorly sampled data set. Discarding this point, we find a best fit linear ephemeris of the periastron epoch

38
Tp =MJD49279.2677(34)+n×24.317037(62). The frequencies in Figure 18 are orbitally corrected using this
ephemeris in combination with the remaining Rappaport et al. (1978) elements.
Fig. 19.— Measurements of the 4U 0115+63 periastron epoch. The plot shows the periastron epochs minus
the linear ephemeris MJD49279.2677+24.317037∗n where n is an integral number of orbits. This ephemeris
is discussed in the text. The epoch measurements have been determined from Uhuru (Kelley et al. 1981),
SAS-3 (Rappaport et al. 1978), Ariel 6 (Rickets et al. 1981), Ginga (Tamura et al. 1992) and this work.
Excluding the Ginga measurement, the observations are consistent with a constant orbital period.

39
Fig. 20.— GRO J1750-27 spin frequency and pulsed flux measurements from BATSE. The intrinsic spin
frequencies, which have been orbitally corrected using parameters from Scott et al.(1997), were determined
at 1–day intervals from fits of phase measurements of the 20–50 keV DISCLA data (see Appendix B.1.3).
The pulsed fluxes were determined at 1–day intervals by assuming an exponential spectrum with an e–folding
energy of 20 keV (see Appendix B.2.3).
GRO J1750-27. — BATSE discovered and observed a single 60 d outburst from the 4.4 s accreting
pulsar GRO J1750-27 from 1995 July 7 to September 18 (MJD 49915–49978) (Wilson et al. 1995b, Scott
et al. 1997). Pulse timing revealed an eccentric 29.82 d orbit. A 0.5 deg localization with BATSE (Koh et
al. 1995) motivated an ASCA TOO which successfully localized the object to ≈ 2′ (Dotani et al. 1995).
Although no optical counterpart has been reported, the orbital period and pulse period of GRO J1750-27
place it squarely in the Be transient region of the Corbet Diagram (Figure 4). Steady spin–up with a peak
value of 3.8× 10⁻¹¹ Hz s−1 coupled with a correlation between the spin–up rate and the pulsed flux strongly
suggests accretion from a disk (Scott et al. 1997).
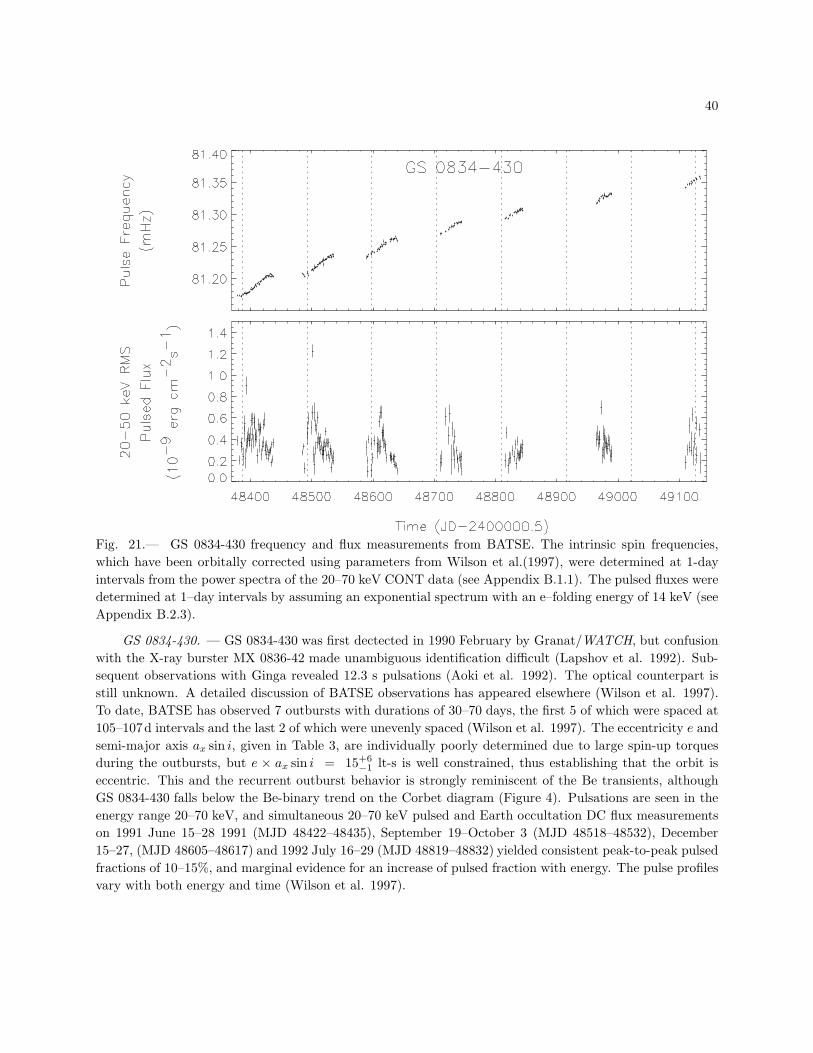
40
Fig. 21.— GS 0834-430 frequency and flux measurements from BATSE. The intrinsic spin frequencies,
which have been orbitally corrected using parameters from Wilson et al.(1997), were determined at 1-day
intervals from the power spectra of the 20–70 keV CONT data (see Appendix B.1.1). The pulsed fluxes were
determined at 1–day intervals by assuming an exponential spectrum with an e–folding energy of 14 keV (see
Appendix B.2.3).
GS 0834-430. — GS 0834-430 was first dectected in 1990 February by Granat/WATCH, but confusion
with the X-ray burster MX 0836-42 made unambiguous identification difficult (Lapshov et al. 1992). Sub-
sequent observations with Ginga revealed 12.3 s pulsations (Aoki et al. 1992). The optical counterpart is
still unknown. A detailed discussion of BATSE observations has appeared elsewhere (Wilson et al. 1997).
To date, BATSE has observed 7 outbursts with durations of 30–70 days, the first 5 of which were spaced at
105–107d intervals and the last 2 of which were unevenly spaced (Wilson et al. 1997). The eccentricity e and
semi-major axis ax sin i, given in Table 3, are individually poorly determined due to large spin-up torques
during the outbursts, but e × ax sin i = 15+6−1 lt-s is well constrained, thus establishing that the orbit is
eccentric. This and the recurrent outburst behavior is strongly reminiscent of the Be transients, although
GS 0834-430 falls below the Be-binary trend on the Corbet diagram (Figure 4). Pulsations are seen in the
energy range 20–70 keV, and simultaneous 20–70 keV pulsed and Earth occultation DC flux measurements
on 1991 June 15–28 1991 (MJD 48422–48435), September 19–October 3 (MJD 48518–48532), December
15–27, (MJD 48605–48617) and 1992 July 16–29 (MJD 48819–48832) yielded consistent peak-to-peak pulsed
fractions of 10–15%, and marginal evidence for an increase of pulsed fraction with energy. The pulse profiles
vary with both energy and time (Wilson et al. 1997).

41
Fig. 22.— 2S 1417–624 frequency and pulsed flux measurements from BATSE. The intrinsic spin frequencies,
which have been orbitally corrected using parameters from Finger, Wilson & Chakrabarty (1996) , were
determined at 1–day intervals by epoch-folding the 20-50 keV DISCLA data (see Appendix B.1.2). The
pulsed fluxes were determined at 1–day intervals by assuming a Comptonized spectrum model of the form
F (E) = AEλ exp(−E/kT ), with λ = 1.6 and kT = 11.9 keV (Finger, Wilson, & Chakrabarty 1996) (see
Appendix B.2.3). The orbit was determined assuming a correlation between pulsed flux and accretion
torque, which could potentially introduce modulations in the apparent rate of spin-up during the sequence
of outbursts following the main outburst.
2S 1417–624. — SAS-3 discovered 17.6 s pulsations from 2S 1417–624 in 1978 (Kelley et al. 1981a) and
the companion was later identified to be a 17th magnitude OB star (Grindlay, Petro, & McClintock 1984).
Detailed discussion of BATSE observations have appeared elsewhere (Finger, Wilson & Chakrabarty 1996).
BATSE observed a large outburst of 2S 1417–624 from 1994 August 29 – December 11 (MJD 49593–49697),
followed by a sequence of five smaller outbursts of diminishing amplitudes occuring every ∼40 days (Finger,
Wilson, & Chakrabarty 1996), and two later outbursts (not shown). At the peak of the initial outburst,
pulsations were detected up to 100 keV. The pulse profile is double-peaked and the ratio of the flux in the
two peaks changed systematically during the initial outburst. The binary orbit was measured by a pulse
timing analysis, assuming that the accretion torque was correlated with the measured pulsed flux. During
the large outburst the spin-up rate reached ν ≃ 4 × 10⁻¹¹Hz s−1.
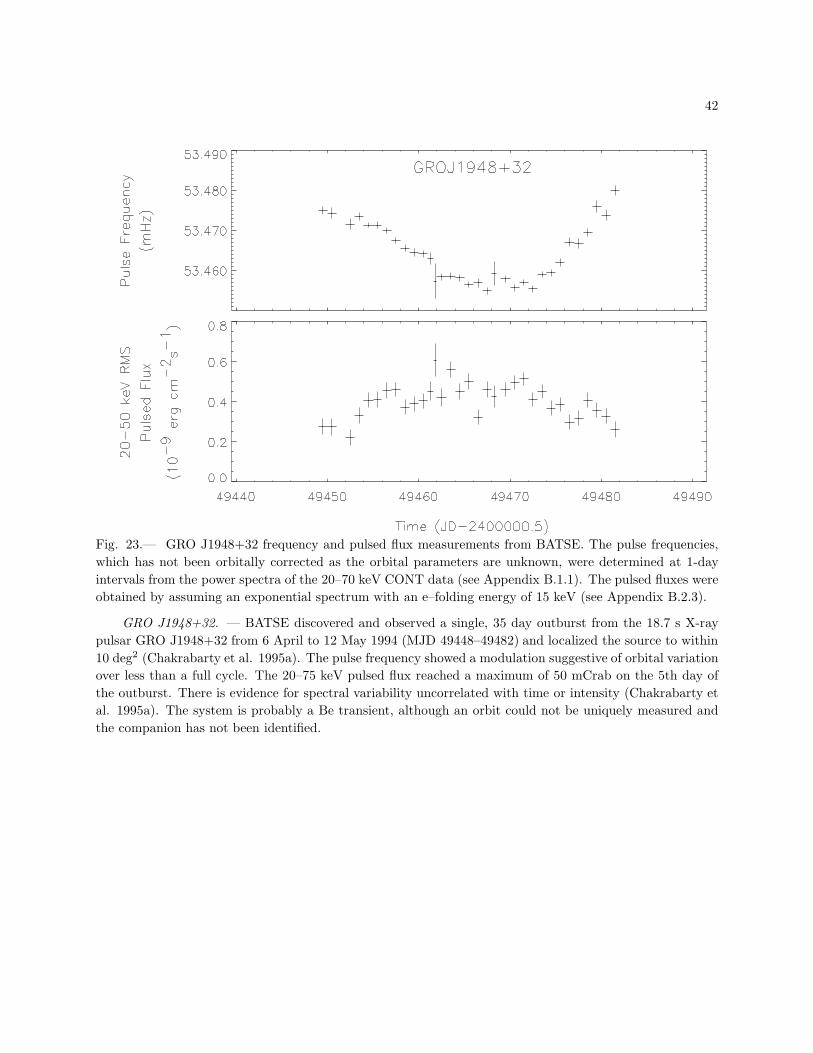
42
Fig. 23.— GRO J1948+32 frequency and pulsed flux measurements from BATSE. The pulse frequencies,
which has not been orbitally corrected as the orbital parameters are unknown, were determined at 1-day
intervals from the power spectra of the 20–70 keV CONT data (see Appendix B.1.1). The pulsed fluxes were
obtained by assuming an exponential spectrum with an e–folding energy of 15 keV (see Appendix B.2.3).
GRO J1948+32. — BATSE discovered and observed a single, 35 day outburst from the 18.7 s X-ray
pulsar GRO J1948+32 from 6 April to 12 May 1994 (MJD 49448–49482) and localized the source to within
10 deg2 (Chakrabarty et al. 1995a). The pulse frequency showed a modulation suggestive of orbital variation
over less than a full cycle. The 20–75 keV pulsed flux reached a maximum of 50 mCrab on the 5th day of
the outburst. There is evidence for spectral variability uncorrelated with time or intensity (Chakrabarty et
al. 1995a). The system is probably a Be transient, although an orbit could not be uniquely measured and
the companion has not been identified.
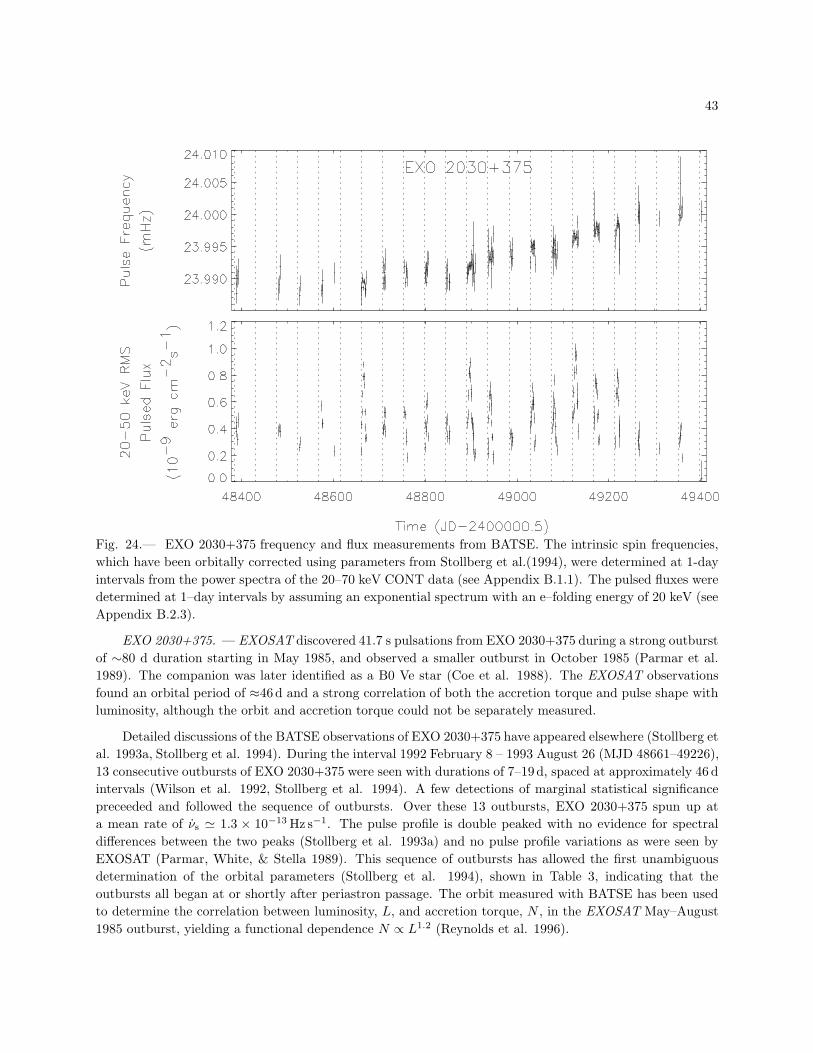
43
Fig. 24.— EXO 2030+375 frequency and flux measurements from BATSE. The intrinsic spin frequencies,
which have been orbitally corrected using parameters from Stollberg et al.(1994), were determined at 1-day
intervals from the power spectra of the 20–70 keV CONT data (see Appendix B.1.1). The pulsed fluxes were
determined at 1–day intervals by assuming an exponential spectrum with an e–folding energy of 20 keV (see
Appendix B.2.3).
EXO 2030+375. — EXOSAT discovered 41.7 s pulsations from EXO 2030+375 during a strong outburst
of ∼80 d duration starting in May 1985, and observed a smaller outburst in October 1985 (Parmar et al.
1989). The companion was later identified as a B0 Ve star (Coe et al. 1988). The EXOSAT observations
found an orbital period of ≈46d and a strong correlation of both the accretion torque and pulse shape with
luminosity, although the orbit and accretion torque could not be separately measured.
Detailed discussions of the BATSE observations of EXO 2030+375 have appeared elsewhere (Stollberg et
al. 1993a, Stollberg et al. 1994). During the interval 1992 February 8 – 1993 August 26 (MJD 48661–49226),
13 consecutive outbursts of EXO 2030+375 were seen with durations of 7–19d, spaced at approximately 46 d
intervals (Wilson et al. 1992, Stollberg et al. 1994). A few detections of marginal statistical significance
preceeded and followed the sequence of outbursts. Over these 13 outbursts, EXO 2030+375 spun up at
a mean rate of νs ≃ 1.3 × 10⁻¹³ Hz s−1. The pulse profile is double peaked with no evidence for spectral
differences between the two peaks (Stollberg et al. 1993a) and no pulse profile variations as were seen by
EXOSAT (Parmar, White, & Stella 1989). This sequence of outbursts has allowed the first unambiguous
determination of the orbital parameters (Stollberg et al. 1994), shown in Table 3, indicating that the
outbursts all began at or shortly after periastron passage. The orbit measured with BATSE has been used
to determine the correlation between luminosity, L, and accretion torque, N , in the EXOSAT May–August
1985 outburst, yielding a functional dependence N ∝ L1.2 (Reynolds et al. 1996).
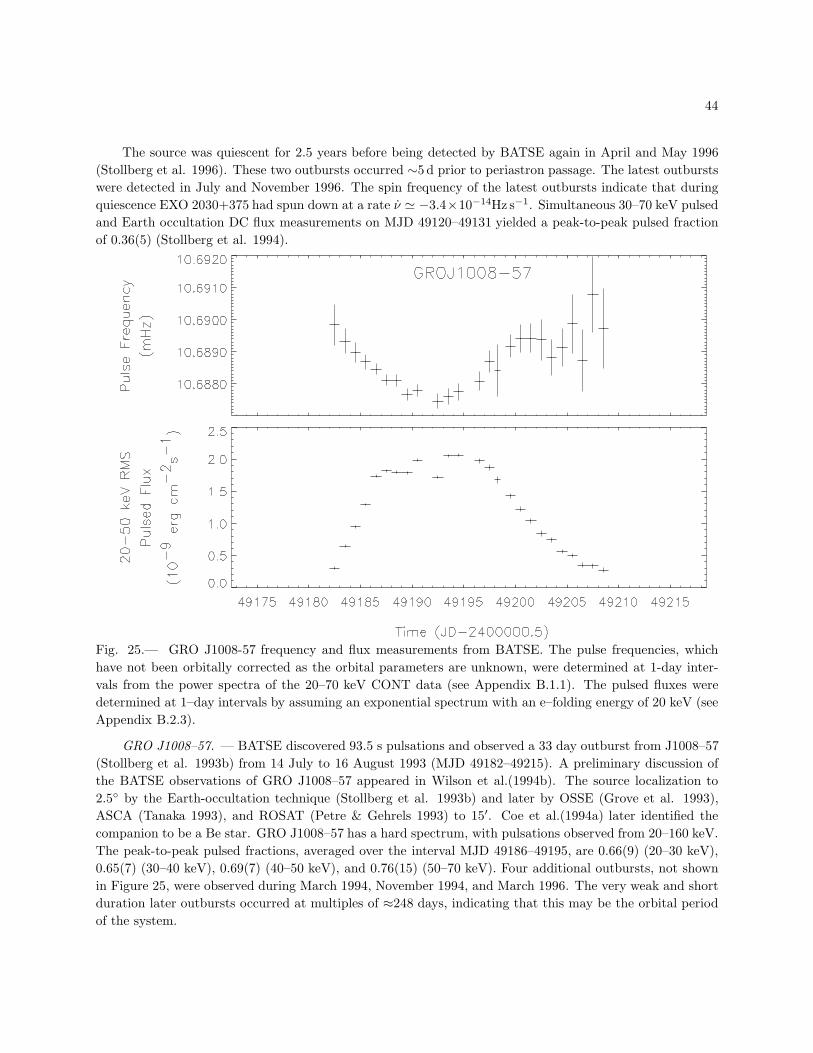
44
The source was quiescent for 2.5 years before being detected by BATSE again in April and May 1996
(Stollberg et al. 1996). These two outbursts occurred ∼5 d prior to periastron passage. The latest outbursts
were detected in July and November 1996. The spin frequency of the latest outbursts indicate that during
quiescence EXO 2030+375 had spun down at a rate ν ≃ −3.4×10⁻¹⁴Hz s−1. Simultaneous 30–70 keV pulsed
and Earth occultation DC flux measurements on MJD 49120–49131 yielded a peak-to-peak pulsed fraction
of 0.36(5) (Stollberg et al. 1994).
Fig. 25.— GRO J1008-57 frequency and flux measurements from BATSE. The pulse frequencies, which
have not been orbitally corrected as the orbital parameters are unknown, were determined at 1-day inter-
vals from the power spectra of the 20–70 keV CONT data (see Appendix B.1.1). The pulsed fluxes were
determined at 1–day intervals by assuming an exponential spectrum with an e–folding energy of 20 keV (see
Appendix B.2.3).
GRO J1008–57. — BATSE discovered 93.5 s pulsations and observed a 33 day outburst from J1008–57
(Stollberg et al. 1993b) from 14 July to 16 August 1993 (MJD 49182–49215). A preliminary discussion of
the BATSE observations of GRO J1008–57 appeared in Wilson et al.(1994b). The source localization to
2.5 by the Earth-occultation technique (Stollberg et al. 1993b) and later by OSSE (Grove et al. 1993),
ASCA (Tanaka 1993), and ROSAT (Petre & Gehrels 1993) to 15′. Coe et al.(1994a) later identified the
companion to be a Be star. GRO J1008–57 has a hard spectrum, with pulsations observed from 20–160 keV.
The peak-to-peak pulsed fractions, averaged over the interval MJD 49186–49195, are 0.66(9) (20–30 keV),
0.65(7) (30–40 keV), 0.69(7) (40–50 keV), and 0.76(15) (50–70 keV). Four additional outbursts, not shown
in Figure 25, were observed during March 1994, November 1994, and March 1996. The very weak and short
duration later outbursts occurred at multiples of ≈248 days, indicating that this may be the orbital period
of the system.

45
Fig. 26.— A0535+262 frequency and pulsed flux measurements from BATSE. The frequencies, which have
been orbitally corrected using orbital parameters from Finger et al. 1994, were determined at 3–day intervals
from fits to phase measurements made using the 20–50 keV DISCLA data (see Appendix B.1.3). The pulsed
fluxes were measured at 1–day intervals by assuming an exponential spectrum with an e–folding energy of
20 keV (see Appendix B.2.3).
A 0535+26. — Ariel 5 discovered 103 s pulsations from A 0535+26 in 1975 (Rosenberg et al. 1975, Coe
et al. 1975) and its companion is the Be star HDE 245770 (Stier & Liller 1976, Hutchings et al. 1978).
The 111 d orbital period of A 0535+26 was first inferred from the spacing of X-ray outbursts (Nagase et al.
1982). The binary undergoes frequent outbursts with a wide range of intensities, the brightest reaching 3
Crab in the 2–10 keV band (Giovannelli & Graziati 1992).
Detailed discussions of BATSE observations of A 0535+26 have appeared elsewhere (Finger et al. 1994,
Finger, Wilson, & Harmon 1996). BATSE has observed 6 outbursts spaced roughly at the orbital period, the
4th of which is a “giant” outburst that occurred from 28 January 1994–20 March 1994 (MJD 49380–49430)
and reached a peak flux of 8 Crab in the BATSE energy band. There was little or no spin-up during the
normal outbursts, spin-down between outbursts, but rapid spin-up during the giant outburst, suggesting
accretion from a disk. The giant outburst showed enough dynamic range that the relation between accretion
torque and pulsed flux could be tested directly (see §5.2).
BATSE has provided the first measurement of the binary orbit, and detection of Quasi-Periodic Oscil-
lations (QPO) during the giant outburst (Finger et al. 1994, Finger, Wilson, & Harmon 1996). A cyclotron
absorbsion line at 110 keV was reported by OSSE (Grove et al. 1995), which is also evident in the BATSE
pulsed flux spectrum. The pulse shape is complex and highly variable with both energy and intensity as
shown in Figure 27. Fluxes could be measured with the occultation method only during the giant outburst,
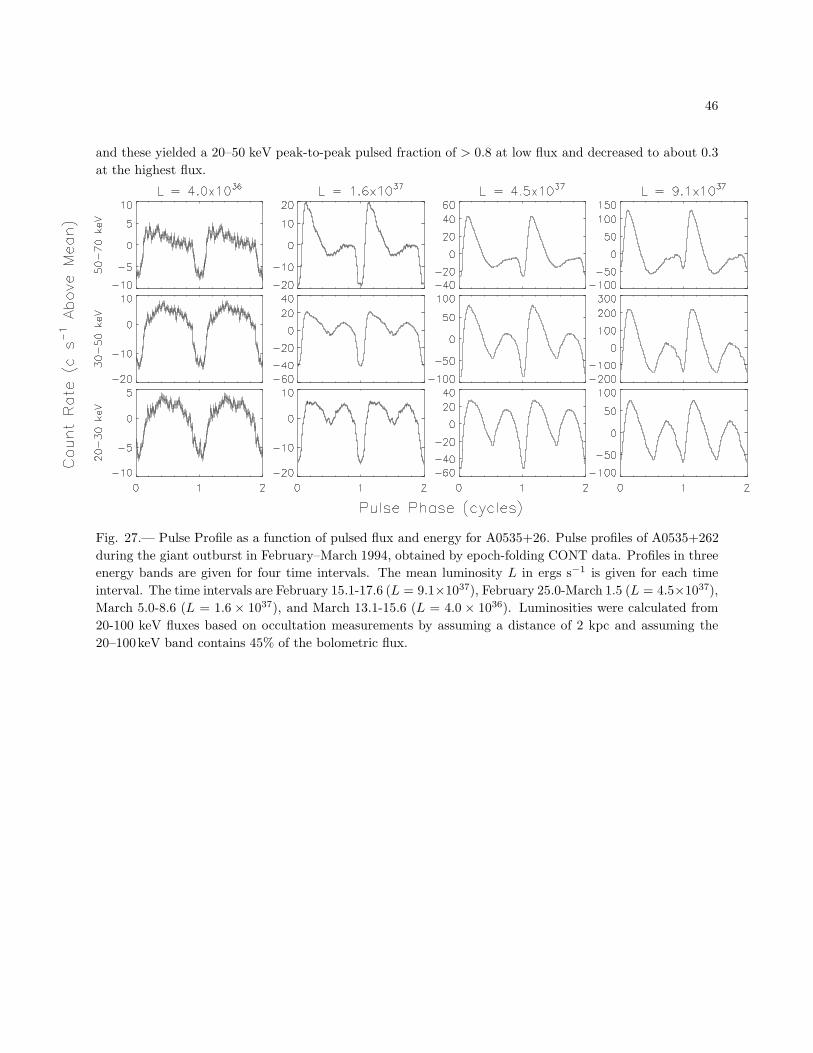
46
and these yielded a 20–50 keV peak-to-peak pulsed fraction of > 0.8 at low flux and decreased to about 0.3
at the highest flux.
Fig. 27.— Pulse Profile as a function of pulsed flux and energy for A0535+26. Pulse profiles of A0535+262
during the giant outburst in February–March 1994, obtained by epoch-folding CONT data. Profiles in three
energy bands are given for four time intervals. The mean luminosity L in ergs s−1 is given for each time
interval. The time intervals are February 15.1-17.6 (L = 9.1×1037), February 25.0-March 1.5 (L = 4.5×1037),
March 5.0-8.6 (L = 1.6 × 1037), and March 13.1-15.6 (L = 4.0 × 1036). Luminosities were calculated from
20-100 keV fluxes based on occultation measurements by assuming a distance of 2 kpc and assuming the
20–100keV band contains 45% of the bolometric flux.
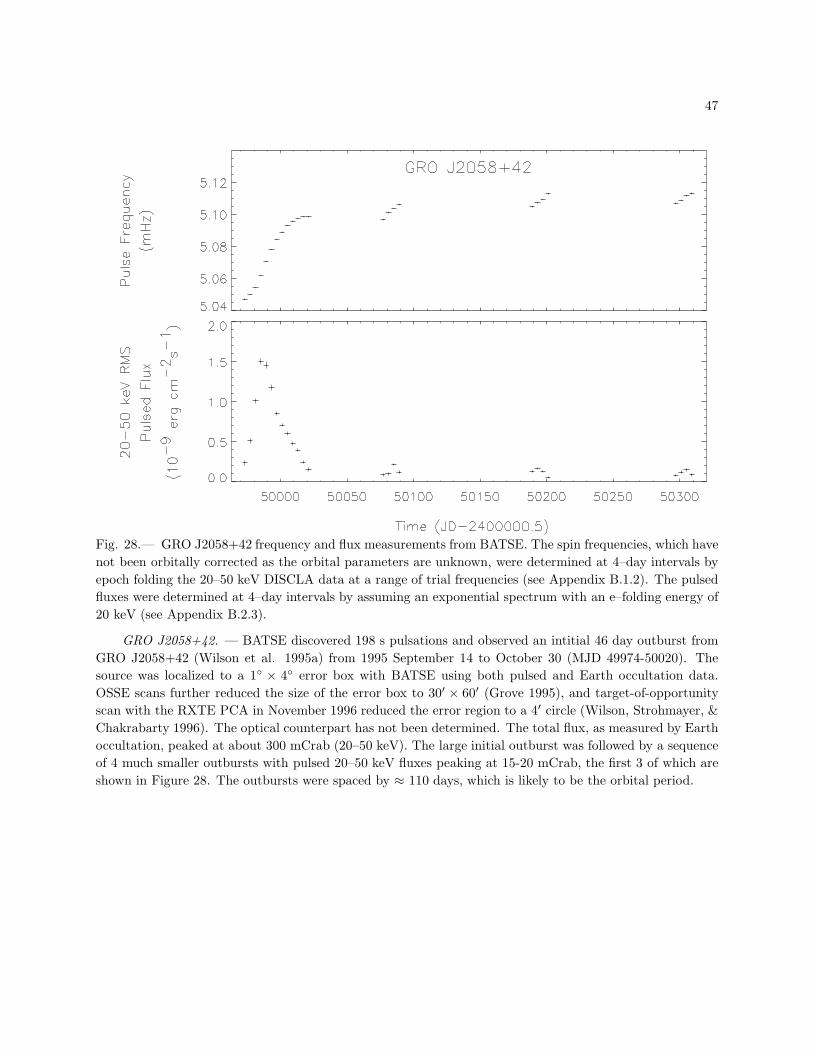
47
Fig. 28.— GRO J2058+42 frequency and flux measurements from BATSE. The spin frequencies, which have
not been orbitally corrected as the orbital parameters are unknown, were determined at 4–day intervals by
epoch folding the 20–50 keV DISCLA data at a range of trial frequencies (see Appendix B.1.2). The pulsed
fluxes were determined at 4–day intervals by assuming an exponential spectrum with an e–folding energy of
20 keV (see Appendix B.2.3).
GRO J2058+42. — BATSE discovered 198 s pulsations and observed an intitial 46 day outburst from
GRO J2058+42 (Wilson et al. 1995a) from 1995 September 14 to October 30 (MJD 49974-50020). The
source was localized to a 1 × 4 error box with BATSE using both pulsed and Earth occultation data.
OSSE scans further reduced the size of the error box to 30′ × 60′ (Grove 1995), and target-of-opportunity
scan with the RXTE PCA in November 1996 reduced the error region to a 4′ circle (Wilson, Strohmayer, &
Chakrabarty 1996). The optical counterpart has not been determined. The total flux, as measured by Earth
occultation, peaked at about 300 mCrab (20–50 keV). The large initial outburst was followed by a sequence
of 4 much smaller outbursts with pulsed 20–50 keV fluxes peaking at 15-20 mCrab, the first 3 of which are
shown in Figure 28. The outbursts were spaced by ≈ 110 days, which is likely to be the orbital period.
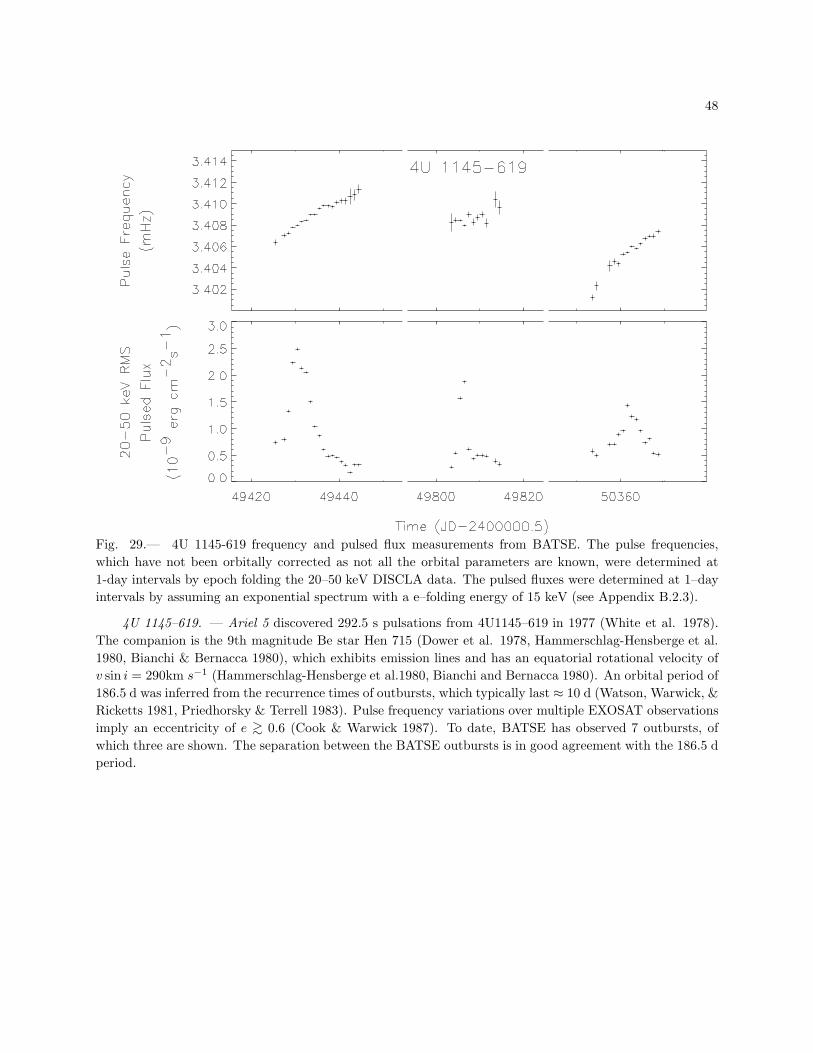
48
Fig. 29.— 4U 1145-619 frequency and pulsed flux measurements from BATSE. The pulse frequencies,
which have not been orbitally corrected as not all the orbital parameters are known, were determined at
1-day intervals by epoch folding the 20–50 keV DISCLA data. The pulsed fluxes were determined at 1–day
intervals by assuming an exponential spectrum with a e–folding energy of 15 keV (see Appendix B.2.3).
4U 1145–619. — Ariel 5 discovered 292.5 s pulsations from 4U1145–619 in 1977 (White et al. 1978).
The companion is the 9th magnitude Be star Hen 715 (Dower et al. 1978, Hammerschlag-Hensberge et al.
1980, Bianchi & Bernacca 1980), which exhibits emission lines and has an equatorial rotational velocity of
v sin i = 290km s−1 (Hammerschlag-Hensberge et al.1980, Bianchi and Bernacca 1980). An orbital period of
186.5 d was inferred from the recurrence times of outbursts, which typically last ≈ 10 d (Watson, Warwick, &
Ricketts 1981, Priedhorsky & Terrell 1983). Pulse frequency variations over multiple EXOSAT observations
imply an eccentricity of e ∼> 0.6 (Cook & Warwick 1987). To date, BATSE has observed 7 outbursts, of
which three are shown. The separation between the BATSE outbursts is in good agreement with the 186.5 d
period.
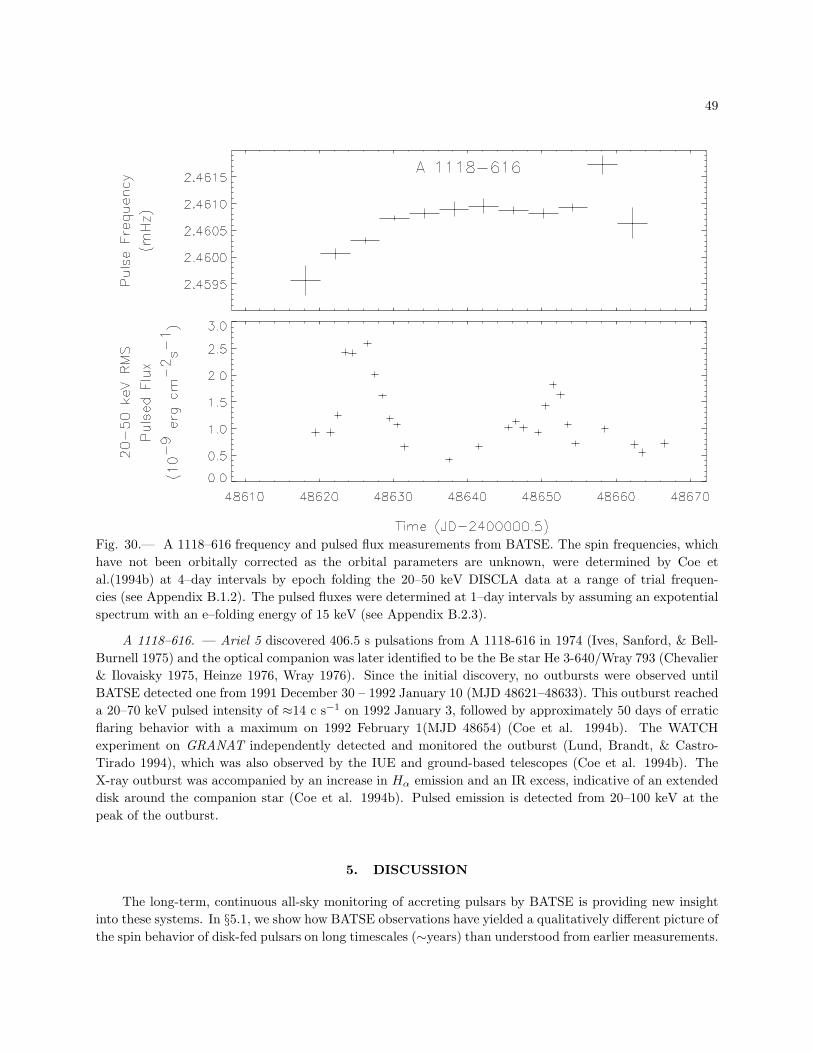
49
Fig. 30.— A 1118–616 frequency and pulsed flux measurements from BATSE. The spin frequencies, which
have not been orbitally corrected as the orbital parameters are unknown, were determined by Coe et
al.(1994b) at 4–day intervals by epoch folding the 20–50 keV DISCLA data at a range of trial frequen-
cies (see Appendix B.1.2). The pulsed fluxes were determined at 1–day intervals by assuming an expotential
spectrum with an e–folding energy of 15 keV (see Appendix B.2.3).
A 1118–616. — Ariel 5 discovered 406.5 s pulsations from A 1118-616 in 1974 (Ives, Sanford, & Bell-
Burnell 1975) and the optical companion was later identified to be the Be star He 3-640/Wray 793 (Chevalier
& Ilovaisky 1975, Heinze 1976, Wray 1976). Since the initial discovery, no outbursts were observed until
BATSE detected one from 1991 December 30 – 1992 January 10 (MJD 48621–48633). This outburst reached
a 20–70 keV pulsed intensity of ≈14 c s−1 on 1992 January 3, followed by approximately 50 days of erratic
flaring behavior with a maximum on 1992 February 1(MJD 48654) (Coe et al. 1994b). The WATCH
experiment on GRANAT independently detected and monitored the outburst (Lund, Brandt, & Castro-
Tirado 1994), which was also observed by the IUE and ground-based telescopes (Coe et al. 1994b). The
X-ray outburst was accompanied by an increase in Hα emission and an IR excess, indicative of an extended
disk around the companion star (Coe et al. 1994b). Pulsed emission is detected from 20–100 keV at the
peak of the outburst.
5. DISCUSSION
The long-term, continuous all-sky monitoring of accreting pulsars by BATSE is providing new insight
into these systems. In §5.1, we show how BATSE observations have yielded a qualitatively different picture of
the spin behavior of disk-fed pulsars on long timescales (∼years) than understood from earlier measurements.
50
BATSE has also been able to test theories of accretion torque on short timescales (∼days) in transient pulsars
(§5.2). BATSE observations of accretion torques in transient and wind-fed systems show evidence of spin
down during quiescence and of disk formation in a predominantly wind-fed binary (§5.3). Continuous mon-
itoring of persistent systems makes it possible to quantify the variability of accretion torques on timescales
of months to years using power spectra (§5.4). BATSE’s continuous monitoring capability has also provided
new insights into the properties of binaries containing pulsars which undergo transient outbursts (§ 5.5), the
population of Be transient pulsars (§ 5.6), and the evolution of B-star binaries into Be-transient accreting
binary pulsars (§ 5.7).
5.1. The Long Term Spin Evolution of Disk-Fed Pulsars
The picture of long-term pulsar spin evolution developed in the mid-1970s was based on sparse mea-
surements provided by pointed observations of ∼10 objects (Rappaport & Joss 1977a, Ghosh & Lamb 1979).
In particular, the spin behavior of Cen X-3 and Her X-1 at that time suggested that the simple spin-up
torque estimate in equation (3) was sometimes inadequate: these pulsars were apparently spinning up on a
timescale much longer than predicted by equation (8). Moreover, both sources also underwent short episodes
of spin-down, indicating that angular momentum was actually being lost by the pulsar while it continued
to accrete. The continuous pulse monitoring by BATSE, however, reveals that these early observations
sometimes gave a false impression of the strength and continuity of the accretion torque.
The frequency history of the 4.8 s pulsar Cen X-3, shown in Figure 31, is an example where BATSE
observations reveal a strikingly different picture of pulsar spin behavior than previously hypothesized. Prior
to 1991, the long-term frequency evolution (Figure 31a) had been described as secular spin-up at ν ≃8 × 10⁻¹³ Hz s−1 (a factor of ∼5 slower than predicted by equation (3)), superposed with fluctuations and
short episodes of spin-down. In contrast, the more frequently sampled BATSE data (Figure 31b) show that
Cen X-3 exhibits 10−100d intervals of steady spin-up and spin-down at a much larger rate, consistent with
equation 3. Figure 32 is a histogram of torques observed in Cen X-3 showing a roughly bimodal distribution
of torque states, with the average spin-up torque (∼ +7×10⁻¹² Hz s−1) larger in magnitude than the average
spin-down torque (∼ −3 × 10⁻¹² Hz s−1). Transitions between spin up and spin down occur on a timescale
more rapid than BATSE can resolve (∼<10 d). The long-term spin-up rate inferred from the pre-BATSE data
is not representative of the instantaneous torque; its small value is a consequence of the frequent transitions
between spin up and spin down.
Interestingly, this switching behavior is very common. At least 4 out of the 8 persistent pulsars observed
by BATSE show torque reversals between steady spin-up and steady spin-down. The 7.6 s pulsar 4U 1626–67
underwent a reversal to smooth spin down at a rate ν ≃ −7 × 10⁻¹³ Hz s−1 in 1991 after two decades of
smooth spin up with ν ≃ +8.5×10⁻¹³ Hz s−1 (Chakrabarty et al. 1997a). Most surprisingly, the final torque
is nearly equal in magnitude but opposite in sign. A similar transition to spin down was observed in the
120 s pulsar GX 1+4 in 1988 (Makishima et al. 1988) after more than a decade of steady spin up (Figure
6). Again, the spin down rate (∼ 3.7 × 10⁻¹² Hz s−1) is close in magnitude to the spin up rate. In the 38 s
pulsar OAO 1657–415, both the duration and strength of torque episodes are very close to those seen in Cen
X-3 (Chakrabarty et al. 1993). Of the remaining four systems, Her X-1 is sampled infrequently at 35 day
intervals so that we cannot measure its torque on short timescales, while the other three (4U 1538–52, GX
301–2, Vela X-1) are wind-fed pulsars.

51
Fig. 31.— Frequency histories of Cen X-3 . Upper panel: The long-term frequency history of Cen X-3.
Lower panel: High resolution BATSE measurement of the intrinsic spin frequencies of Cen X-3.
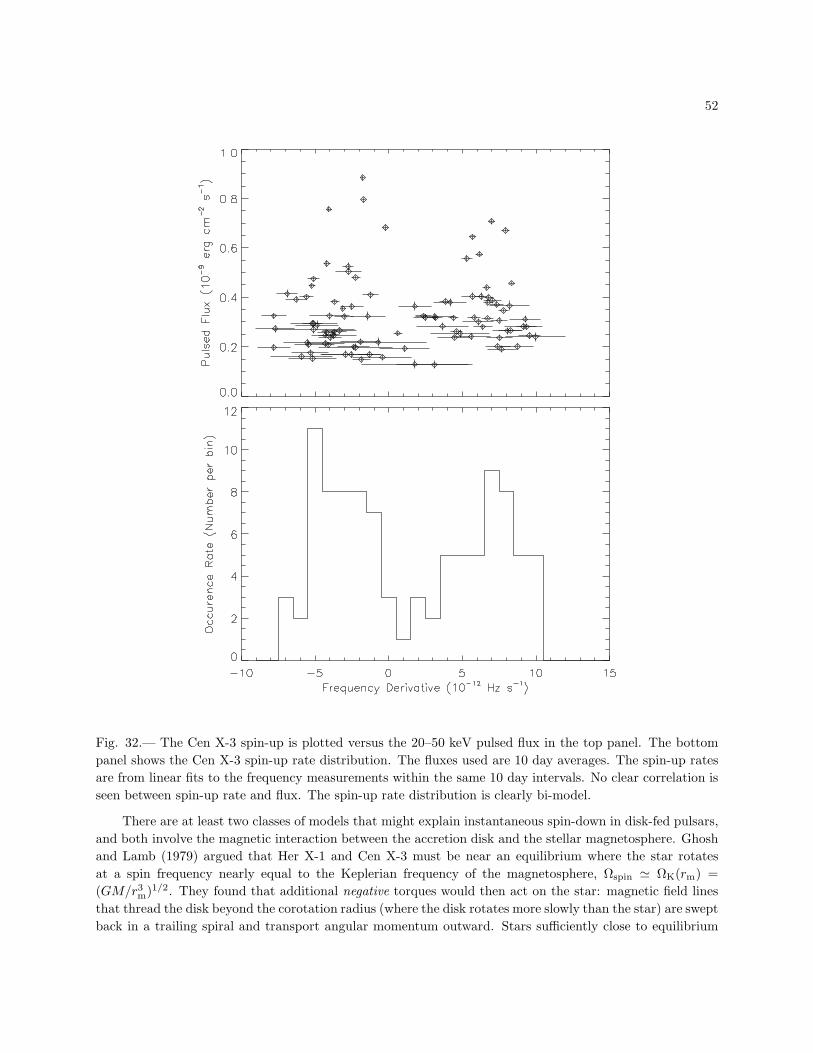
52
Fig. 32.— The Cen X-3 spin-up is plotted versus the 20–50 keV pulsed flux in the top panel. The bottom
panel shows the Cen X-3 spin-up rate distribution. The fluxes used are 10 day averages. The spin-up rates
are from linear fits to the frequency measurements within the same 10 day intervals. No clear correlation is
seen between spin-up rate and flux. The spin-up rate distribution is clearly bi-model.
There are at least two classes of models that might explain instantaneous spin-down in disk-fed pulsars,
and both involve the magnetic interaction between the accretion disk and the stellar magnetosphere. Ghosh
and Lamb (1979) argued that Her X-1 and Cen X-3 must be near an equilibrium where the star rotates
at a spin frequency nearly equal to the Keplerian frequency of the magnetosphere, Ωspin ≃ ΩK(rm) =
(GM/r3m)1/2. They found that additional negative torques would then act on the star: magnetic field lines
that thread the disk beyond the corotation radius (where the disk rotates more slowly than the star) are swept
back in a trailing spiral and transport angular momentum outward. Stars sufficiently close to equilibrium
53
can spin down while continuing to accrete. Other models attempt to explain spin-down via the loss of
angular momentum in a magnetohydrodynamic outflow (Anzer & Borner 1980, Arons et al. 1984, Lovelace,
Romanova, & Bisnovatyi-Kogan 1995). Outflowing material moves along rigid magnetic field lines like beads
on a wire, gaining angular momentum from the star as it is forced to corotate. This results in a stellar
spin-down torque N ∼ Mw
√GMrα, where Mw is the loss rate in the wind and rα is the Alfven radius in
the flow beyond which the magnetic field is dynamically unimportant.
The BATSE observations pose a number of difficulties for these models. To produce the bimodal torque
behavior we observe, most if not all near-equilibrium models apparently require step-function-like changes in
the mass accretion rate — finely tuned just so that the two torques states have comparable magnitude, but
opposite sign. The many transitions in Cen X-3, for example, always alternate between torques of opposite
sign: How does the companion star know just how to change its mass transfer rate so that transitions
between two torques of the same sign never occur? It seems especially implausible in a system like 4U 1626–
67, where the average mass accretion rate is likely determined by the loss of orbital angular momentum via
gravitational radiation, that the companion would switch to such a finely-tuned mass transfer rate that the
spin-down torque would have nearly the same magnitude as the previous spin-up torque (Chakrabarty et
al. 1997a). Since the timescale for angular-momentum loss via gravitational radiation is much longer than
the timescale of BATSE observations, changes in mass accretion rate must be due to physical changes in the
star or accretion disk.
Our observations suggest that disk-accreting pulsars are subject to instantaneous torques of magnitude
≈ N0 ≡ M(GMrco)1/2 (see equation 6) and only differentiate themselves by the timescale for reversals of
sign. We see some (e.g. Cen X-3) that switch within ∼ 10 − 100 days, whereas others (e.g. 4U 1626–67
and GX 1+4) switch once in 10–20 years. The primary theoretical issues are then identifying the physics
that sets this timescale and understanding why the magnitudes of the spin-up and spin-down torques are so
similar.
It is intriguing to apply our picture of the long-term evolution of disk-fed pulsars to those we cannot
observe with BATSE. First, it makes it more plausible that one of the class of pulsars which are spinning
down (1E 2259+586, 1E 1048.1–5937, 4U 0142+61, see Mereghetti & Stella 1995) might eventually switch
to spin-up. The pulsar 1E 1048.1–5937 has the shortest spin-down time amongst these (tsd ≃ 104 yr) and
might be the most likely one to undergo a torque reversal. There is already some evidence for a brief torque
reversal in 1E 2259+586 (Baykal & Swank 1996). The long-term torque inferred for LMC X-4 is nearly a
factor of 100 lower than N0, suggesting that this pulsar may be undergoing rapid switching like Cen X-3.
5.2. Torque and Luminosity of Transient Pulsars
Short-term instantaneous torque measurements — not long-term averages — are necessary to test
accretion torque theory. All such theories predict that the magnetospheric radius should decrease as M
increases, and the simplest version (equation 4) predicts rm ∝ M−2/7 for rm < rco. This implies that a pulsar
should spin-up at a rate ν ∝ M6/7. In principle, we can test this prediction by measuring the correlation
between torque and bolometric luminosity. Luminous outbursts in GRO J1744–28 and A 0535+262 seen
with BATSE showed enough dynamic range that the relation between torque and observed flux could be
tested directly (Finger et al. 1996, Finger, Wilson, & Chakrabarty 1996). In addition, the orbital parameters
of EXO 2030+375 measured with BATSE made it possible to compute the accretion torque from a luminous
1985 outburst seen by EXOSAT (Reynolds et al. 1996). Figure 33 shows the spin-up rate of A 0535+26
54
versus 20–100keV flux (upper panel), and the spin-up rate of GRO J1744–28 versus 20–50keV RMS pulsed
flux (lower panel). Also plotted are the power laws ν ∝ F γobs with γ = 6/7 (dotted line) and the best-fit
power laws (dashed line). The best fit index for A0535+262 is 0.951(26) and that for GRO J1744-28 is
0.957(26). A similar fit to the 1985 outburst of EXO 2030+375 gave γ ≃ 1.2 (Reynolds et al. 1996).
All three systems suggest a larger γ than the naive prediction of γ = 6/7. In particular, the system
with γ > 1, indicates an increase in rm with M , if it is proportional to the measured flux. However, one
must remember that BATSE does not measure bolometric flux, but only the 20–50keV pulsed flux. In
addition, the large changes in beaming fraction implied by the changing pulse profiles need to be modeled
and accounted for. The observed flux may thus be related nonlinearly to the mass accretion rate and thus
contaminate the measurement of γ. EXOSAT measured the 1–10 keV flux from EXO 2030+375; since this
should be a good tracer of the bolometric flux, only changing beaming could have affected their measured γ.
The difficulties in determining the mass accretion rate from the observed flux point out the necessity
for testing the scaling rm ∝ M−2/7 in a way that does not depend on the uncertain bolometric corrections.
An indirect test was possible during a giant outburst in A 0535+26, when a simultaneous quasi-periodic
oscillation (QPO) was detected (Finger, Wilson, & Harmon 1996). The centroid frequency of the QPO was
strongly correlated with the observed spin-up torque and luminosity, varying in the range νQPO = 30–70
mHz. Interpreting the QPO frequency as the Kepler frequency at the inner disk boundary (Alpar & Shaham
1985, Lamb et al. 1985), we expect νK = (GM/4π2r3m)1/2 ∝ M3/7. Consequently, with this interpretation
for the QPO one expects ν = M√
GMrm ∝ ν2QPO. This predicted relationship agrees with the observed
trend in the data (Finger, Wilson, & Harmon 1996). An alternative interpretation of the QPO as the beat
frequency between the inner disk and the rotating magnetosphere, νQPO = νK − ν, gives an equally good fit.
This correlation between the torque and QPO frequency is the strongest evidence to date supporting the
simple spin-up accretion torque model described in §3.
To summarize, the observational evidence supporting the simplest picture of accretion torques described
in §3 is mixed. In all cases of persistent disk-fed pulsars, the magnitude of the accretion torque is consistent
with the large lever-arm of an extended magnetosphere. The observed correlation between torque and flux,
however, does not confirm the expected scaling ν ∝ M6/7. It is presently unclear if this disagreement can be
due to bolometric and/or beaming corrections. On the other hand, if one presumes that the observed QPO
in the outburst of A 0535+26 scales with the Keplerian frequency at the magnetosphere, then the data are
consistent with the expected magnetosphere relationship, rm ∝ M−2/7. Further progress on these important
issues requires simultaneous torque, bolometric flux, and pulse profile measurements. Since BATSE contin-
uously monitors the torque, a series of well-timed observations with a broad-band X-ray telescope for many
of these objects is needed.

55
Fig. 33.— Observed relationships between flux and pulsar spin-up rate ν. The upper panel shows the spin-
up rate of A0535+262 during the 1994 giant outburst versus the measured total 20-100 keV flux, determined
from Earth occultation measurements. The bottem panel shows the spin-up rate of GRO J1744-28 during the
December 1995-March 1996 outburst versus the 20-50 keV R.M.S. pulsed flux. For both sources the square
symbols are from the outburst rise, and the diamond symbols are from the outburst decline. The dotted
curves are power-laws with the expected index of 6/7, while the dashed curves are best fit powers-laws. The
best fit index for A0535+262 is 0.951(26) and that for GRO J1744-28 is 0.957(26).
56
5.3. Accretion Torques in Transient and Wind-Fed Pulsars
Before BATSE, it was already known that the spin frequency in some transients decreases between
outbursts. We have unambiguously seen spin-down between outbursts in A 0535+26 at a rate ν = −2.2(6)×10−13 Hz s−1 (Finger et al. 1994). This may be due to the propeller effect (Illarionov & Sunyaev 1975),
when M becomes small enough so that the magnetospheric radius exceeds the corotation radius. Accretion
is then centrifugally inhibited and material may become attached to magnetic field lines and flung away,
removing angular momentum and causing the star to spin down. Unfortunately, we can only make these
measurements in those binaries where the orbit is known, which among the Be transients are still few.
In 1984, after a decade of erratic spin behavior, the persistently accreting pulsar GX 301–2 appeared
to be spinning up steadily at ν ≃ 2 × 10⁻¹³ Hz s−1. This trend was based on only three measurements,
however. Continuous BATSE observations found that GX 301–2 was generally undergoing the stochastic
torque fluctuations expected from a wind accretor. However, two dramatic episodes of spin up of ∼20 d
duration at ≈ 5 × 10⁻¹² Hz s−1, comparable to the spin-up rates in the disk-fed systems Cen X-3 and
GX 1+4, occurred accompanied by enhanced luminosity (Koh et al. 1997). Moreover, these two spin up
events produced a net change in spin frequency consistent with the long-term trend previously reported.
These observations strongly suggest that GX 301–2 is primarily a wind fed pulsar and that the secular trend
is due to a few short but large spin-up episodes, possibly caused by the creation of transient accretion disks.
This result blurs the common distinction between disk-fed and wind-fed pulsars.
5.4. Power Spectra of Torque Fluctuations
The power density spectrum of torque fluctuations in accreting pulsars can potentially provide a probe
of both the accretion flow and the internal structure of neutron stars (Lamb, Pines, & Shaham 1978). The
most crucial requirement for this type of study is a lengthy time baseline of precise timing observations, with
sampling over a wide range of timescales. Pre-BATSE estimates have been made of the power spectrum of
the spin frequency derivative, ν, of Vela X-1 (Deeter et al. 1989), a wind accretor, and of Her X-1 (Deeter
1981), a low-mass disk-fed system. Both showed the power spectrum of ν, Pν(f), to be flat, indicating
white torque noise with the neutron star responding as a solid body in the range of accessable analysis
frequencies, f . To avoid confusion with the spin frequency, ν, we use the term ‘analysis frequency’ for the
argument of the power spectrum. The power spectral density Pν(f) gives the contribution to the variance of
ν per unit analysis frequency at analysis frequency f . White torque noise is expected in wind-fed systems,
where simulations show that transient accretion disks with alternating rotational sense form and dissipate
on ∼hours timescales (Taam, Fryxell, & Brown 1988, Fryxell & Taam 1988).
Studies of torque noise have also been made using time domain analyses, which are equivalent to
estimating simple power spectral models. A study was made by Baykal and Ogelman (1993) applying a
time domain model of the frequency noise, a first order Markov process, to the published frequency histories
of a wide range of accretion-powered pulsars. This model has two parameters, the noise strength and
the correlation time. For a correlation time of zero the model represents white noise in spin frequency or
equivalently blue noise (Pν ∝ f2 ) in ν. For an infinite correlation time the model represents a random
walk in spin-frequency, or equivalently white noise in ν. For the systems Her X-1, Cen X-3, and Vela X-1
they concluded that the ν noise was white. Applying this assumption to the other sources, they found the
noise strength correlated with source luminosity and long-term spin-up rate. De Kool and Anzer (1993)
studied how the size of frequency changes in accretion pulsars depended on the time between measurements.

57
They concluded the frequency behavior of Vela X-1 was consistent with a random walk in spin frequency, or
equivalently that the power spectrum of frequency fluctuations was Pν(f) ∝ f−2. They found the frequency
behavior Her X-1, and Cen X-3 consistent with random walks plus long-term linear trends.
For each of the 8 persistent sources monitored by BATSE we have estimated the power spectrum of the
spin frequency derivative by applying the Deeter polynomial estimator method (Deeter 1984) to our frequency
measurements. These power spectra are shown in Figure 34. We plot Pν(f), the contribution per Hertz to the
variance in ν as a function of analysis frequency, f . Pν(f) is normalized such that∫∞
0Pν(f)df =
⟨
(ν − ¯ν)2⟩
.
The power due to measurement noise has been subtracted from the estimates and is shown independently
by the square symbols.
The square root of the integrated power over a range in analysis frequency gives the root-mean-square
(RMS) amplitude of variations in ν in that frequency range. This is shown in Table 5, where the integration
range [f1, f2] in analysis frequency is chosen as the range where measurement errors do not dominate.
Each estimate is made by dividing the spin frequency measurements into intervals of duration T and
fitting the frequencies with a quadratic polynomial in time. The square of the second order term is divided
by the value it would have for unit strength white noise in ν, defined as Pν(f) = 1. The average over
intervals is the power estimate. The procedure is repeated for different durations T to obtain a power
spectrum. This polynomial estimation techique is essentially equivalent to using a polynomial instead of a
sinusoid to estimate the power at each timescale T . While correctly addressing the difficulties cause by non-
uniformly sampled data and red-noise power spectral components, this technique produces power spectra of
low resolution.
The frequency response of this estimate of Pν(f) peaks near an analysis frequency f ∼ 1/T . We plot
Pν(f) at the logarithmic mean analysis frequency of the estimator response.
These quadratic estimators are by design independent of linear trends in frequency. Chakrabarty et al.
(1997) found a quadratic trend in the frequency of 4U 1626-67 which was too large to be due to the measured
torque noise. For 4U 1626-67 we have therefore instead used cubic estimators, making the power spectral
estimates independent of quadratic trends in the frequency.
For Vela X-1 and Her X-1 we find Pν consistent with white torque noise in agreement with previous
results (Deeter et al. 1989, Deeter 1981). The power spectra of 4U 1538–52 (Rubin et al. 1997) and GX
301–2 are also consistent with white torque noise. In contrast the power spectra of Cen X-3 (Finger, Wilson,
& Fishman 1994), OAO 1657–415, and GX 1+4 (Chakrabarty et al. 1997b) show red torque noise with Pν
varying approximately as f−1. These red power spectra imply long-term correlations in the torque, which are
evident in the BATSE frequency histories. Due to the low noise level in 4U 1626–67 only limited conclusions
can be reached about the shape of its power spectrum Chakrabarty et al. 1997a. Because Her X-1 is
sampled only once per 35 d cycle, we can only measure Pν for f ∼< 2 × 10⁻⁷ Hz. These power spectra have
poor frequency resolution, and unresolved narrow features may be present, affecting the continuum shape.
The measured red torque noise in Cen X-3 contradicts the conclusions based on time-domain analyses
of published frequencies. In retrospect it is clear that the model used by Baykal and Ogelman (1993) cannot
represent a red ν spectrum, and therefore cannot discriminate between white and red torque noise. The
de Kool and Anzer (1993) result may just be due to the poor sampling in the published frequency history.
Since many of the power spectra we have measured have red torque noise, the meaning of the noise strengths
determined by Baykal and Ogelman (1993), which assumed a random walk in ν, is now unclear. The sampling
in the frequency histories of the pulsars they examined differs from source to source, and hence Pν is being

58
address in a different range of analysis frequencies for each source. The results for sources can thus only be
intercompared if the power spectra are all white. For red power spectra, correlations between luminosity
and sampling density could lead to correlations between luminosity and estimated noise strength.
As a probe of the nature of the accretion flow, the low-resolution power spectra presented here are a
mixed success. The sources known to be wind accretors (Vela X-1, 4U 1538–52, GX 301–2) have power
spectra consistent with white torque noise with strengths in the range 10−20 − 10−18 Hz2 s−2 Hz−1. For
disk-fed pulsars with low-mass companions (Her X-1, 4U 1626–67) the power spectra are consistent with
white ν noise with strengths in the range 10−21 − 10−18 Hz2 s−2 Hz−1. However, we cannot rule out red
noise in either system. The low power in 4U 1626–67 precludes our determining the slope of Pν . In the
case of Her X-1, the power spectrum does not span as large a range in analysis frequency as in the other
sources. The one known disk-fed pulsar with a supergiant companion, Cen X-3, has a red ν power spectrum,
reaching powers of 10−16 − 10−18 Hz2 s−2 Hz−1 at low frequencies. For GX 1+4 and OAO 1657-415 there is
no evidence independent of their frequency histories that reveal the presence or absence of accretion disks.

59
Fig. 34.— Power Density Spectra of torque fluctuations in persistent pulsars, computed using methods
described in Deeter et al.(1987). The errors bars on power indicate the 68% confidence region. The error
bars on analysis frequency give the RMS log frequency width of the estimator response. Open squares
indicating power from apparent torque variations introduced by counting noise, which have been subtracted
from all measured values. The integrated RMS torque variation for these measurements are provided in
Table 5.
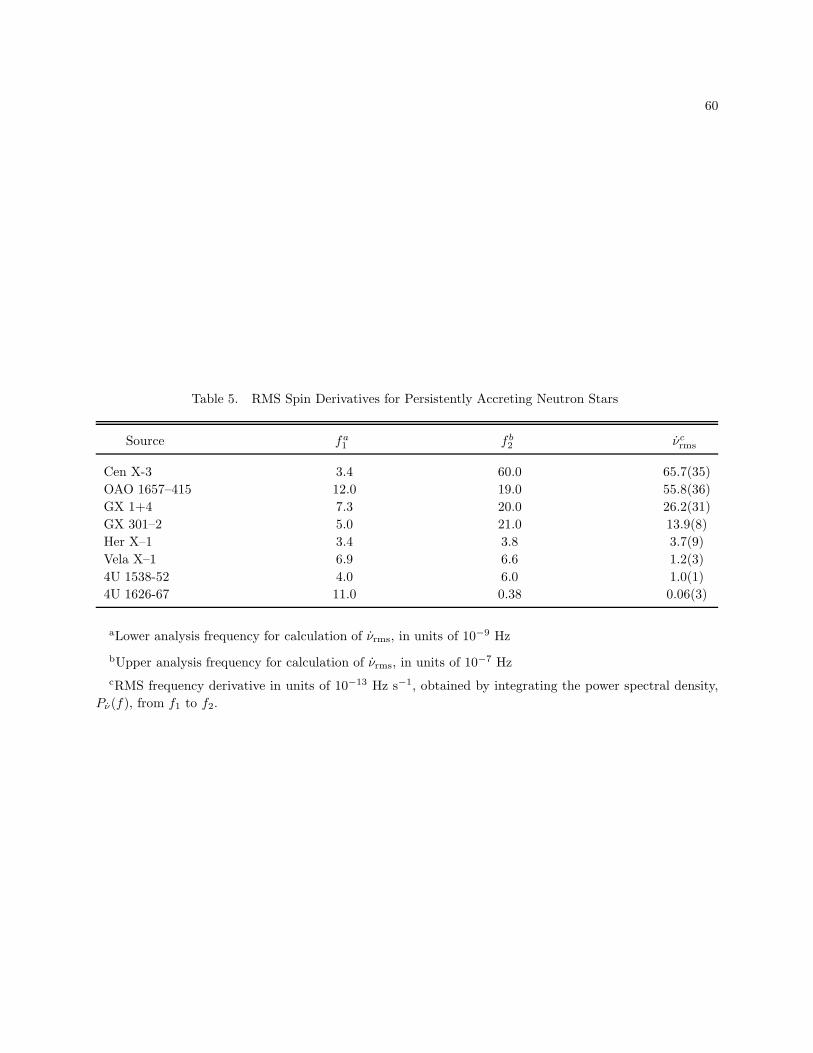
60
Table 5. RMS Spin Derivatives for Persistently Accreting Neutron Stars
Source fa1 f b
2 νcrms
Cen X-3 3.4 60.0 65.7(35)
OAO 1657–415 12.0 19.0 55.8(36)
GX 1+4 7.3 20.0 26.2(31)
GX 301–2 5.0 21.0 13.9(8)
Her X–1 3.4 3.8 3.7(9)
Vela X–1 6.9 6.6 1.2(3)
4U 1538-52 4.0 6.0 1.0(1)
4U 1626-67 11.0 0.38 0.06(3)
aLower analysis frequency for calculation of νrms, in units of 10−9 Hz
bUpper analysis frequency for calculation of νrms, in units of 10−7 Hz
cRMS frequency derivative in units of 10−13 Hz s−1, obtained by integrating the power spectral density,
Pν(f), from f1 to f2.
61
5.5. Transients Outbursts in Be Systems
More than 50 outbursts from 12 transient pulsars were detected with BATSE in the first five years of
observations, the times of which are shown in Figure 17. One of these transient sources, GRO J1744–28,
has a low mass companion. Seven of the remaining pulsars have known Be star companions. No optical
counterparts have been identified for four of the other sources; however their temporal behavior suggests
that the companions are Be stars. Accreting neutron stars in Be systems typically have long periods and
eccentric orbits. The source of accreting material is the slow, dense, stellar wind which is thought to be
confined to the equatorial plane of the rapidly rotating Be star. Evidence for this equatorial disk in Be stars
comes from observations of hydrogen and helium emission lines, and an IR continuum excess. For a review
of these Be/X-ray binary systems, see van den Heuvel & Rappaport (1987) or Apparao (1994).
A striking feature of the long-term light-curves of these pulsars is the frequent occurrence of a series
of outbursts. An example is the long series of outbursts from EXO 2030+375 shown in Figure 24, each
outburst beginning soon after periastron (shown by dotted lines). Other examples are A 0535+262 (shown
in Figure 26), GRO J2058+42 (Figure 28), 2S 1417–624 (Figure 22), and the series of outbursts of GS 0834–
430 (Figure 21) which begin with orbital spacing, but don’t end with it. Another feature of the lightcurves
are the occasional “giant” outbursts. An example is the giant outburst of A 0535+262 (Figure 26) which
occurred in 1994 February/March. Other examples are the first outburst observed from 2S 1417–624 (Figure
22) and the first outburst observed from GRO J2058+42. As well as being bright, these giant outbursts
have high spin-up rates, longer durations, and while often beginning at the same orbital phase as the smaller
outburst, tend to peak at a later phase.
These two types of outbursts have been noticed previously. Stella, White & Rosner (1986) contrasted
the 1973 outburst of V 0332+53 (which lasted over three binary orbits) with a series of three smaller
outbursts detected in 1983–1984. They defined two classes of outburst activity: class I was periodically
occurring outbursts associated with periastron passage; and class II was irregular transient activity, with
higher luminosity and outbursts peaking at arbitrary orbital phases. Motch et al. (1991) classified outbursts
of A 0535+262 as giant, normal, or missing (i.e. no detection at the expected X-ray maxima). The more
luminous giant outbursts peak at a phase delayed relative to the mean normal outburst X-ray maximum by
up to 0.3 orbital cycles, and were associated with large pulse period changes. Prior to BATSE no association
had been observed between giant and normal outbursts. BATSE has found that many of the giant outbursts
are in the middle of, or followed by, a series of normal outbursts. A sequence of normal outbursts from
4U 0115+634 has now been seen by both BATSE and RXTE. Prior to these observations only isolated giant
outbursts had been seen.
Several authors have suggested that transient accretion disks are formed during the giant or class
II outbursts (Kriss et al. 1983, Stella, White, & Rosner 1986, Motch et al. 1991). This helps explain
the large and steady spin-up rates seen during the giant outbursts, which are difficult to explain with
direct wind accretion. BATSE has observed peak spin-up rates of 4.3 × 10⁻¹¹ Hz s−1 (2S 1417–624), 3.8 ×10⁻¹¹ Hz s−1 (GRO J1750–27), 1.2 × 10⁻¹¹ Hz s−1 (A 0535+26), and 8 × 10⁻¹² Hz s−1 (4U 0115+634). The
discovery outburst of EXO 2030+375 found it spinning up at a rate of 2.2 × 10⁻¹¹ Hz s−1 (Reynolds et al.
1996). Additional evidence for disk accretion occurring during giant outbursts is provided by the BATSE
observations of beat or Keplerian frequency QPO during a giant outburst of A 0535+262 (Finger, Wilson,
& Harmon 1996). Optical observations have so far been unable to provide evidence of accretion disks during
the giant outbursts.
Given that an accretion disk seems to be present, it is natural to ask about its fate. Is it completely

62
consumed at the end of a giant outburst, or is some portion of it left? Accretion may be centrifugally
inhibited at the end of the outburst, when the magnetosphere lies outside of the corotation radius. It is
unclear how efficient this mechanism is when the magnetosphere is still close to the corotation radius (Spruit
& Taam 1993). If the ejected material does not acquire escape velocity it might not leave the system, but
may continue to circulate around the neutron star.
If a disk can be sustained between giant outbursts, then it is plausible that one is present during
normal outbursts. In this case the repeating normal outbursts might be explained by the large tidal torques
experienced by the disk during periastron passage. The angular momentum of material flowing into a disk
must eventually be removed by tidal torques from the companion, and these torques increase rapidly with
decreasing pulsar-companion separation (Papaloizou & Pringle 1977). The enhanced torque in the outer disk
shrinks the disk and increases the mass accretion rate there. This results in a wave of new material that will
reach the inner disk on a global viscous timescale (∼weeks for typical binary parameters). This could explain
the series of normal outburst that were observed following the giant outburst in 2S 1417–624 (all of which
peaked near apastron) as well as the sequence of outbursts in GRO J2058+42. It may also explain series of
normal outbursts that are not preceded by a giant outburst, such as those seen from EXO 2030+375.
What causes the giant outbursts? Possibilities that have been investigated are episodes of enhanced Be
disk density, or reduced Be disk expansion velocity. However, these should result in consistent correlations
between optical and hard X-ray activity, which is typically not seen. For example, UBVRIJHK band pho-
tometry of the HD2457700/A 0535+262 system over the past decade (Clark et al., in preparation) reveals no
correlation between the photometric lightcurves and hard X-ray outbursts. Recently it has been proposed
that the thermal disk instablity thought to cause dwarf nova outbursts also is at work in soft x-ray transients
(van Paradijs 1996; King, Kolb & Burderi 1996). This instablity should also affect accretion disks around
Be/X-ray pulsars, and could be the cause of the giant outbursts. For an accretion disk to be vulnerable to
this instability, the outer portion of the disk must be below the hydrogen ionization temperature (TH ≈ 6500
K) while the disk accumulates. For A 0535+262 we find that for a steady accretion rate of 3×10⁻¹⁰ M⊙ yr−1,
corresponding to the average luminosity during the 600 day interval during which outbursts were observed
by BATSE, the portion of the (X-ray heated) disk beyond 1011 cm would still be neutral. The disk would
extend to approximate 90% of the Roche lobe at periastron, or 2× 1012 cm, and would therefore be subject
to this instability once a critical amount of matter has accumulated.
5.6. The Population of Be Transients
The Galactic population of Be–transients has been estimated before by Rappaport & van den Heuvel
(1982) and Meurs & van den Heuvel (1989), who both arrived at a number of several thousand. However, the
sparse and non–uniform coverage of pre–BATSE intruments resulted in several non–quantifiable ambiguities
in their analysis. The continuous, uniform and all–sky coverage provide by BATSE alleviated some of these
problems and enables us to check previous estimates of the Galactic Be–transient population.
BATSE has detected 11 transients with high mass companions (mostly Be stars) between 1991 April
and 1997 January (MJD 48370–50464). This is a complete sample at 20–50 keV of transient sources with
pulsed fluxes in excess of Fmin ≈ 2×10⁻¹⁰ erg cm−2 s−1. They have a mean Galactic latitude of 1.3, a mean
absolute Galactic longitude, |ℓ|, of 81.3, and are concentrated at galactic longitudes 60 ∼< |ℓ| ∼< 90. This
may be due to clustering in nearby spiral arms. Of these 11, 7 have exhibited giant outbursts as described
in the previous section and their galactic locations are plotted in Figure 35. Of these 7, giant outbursts in
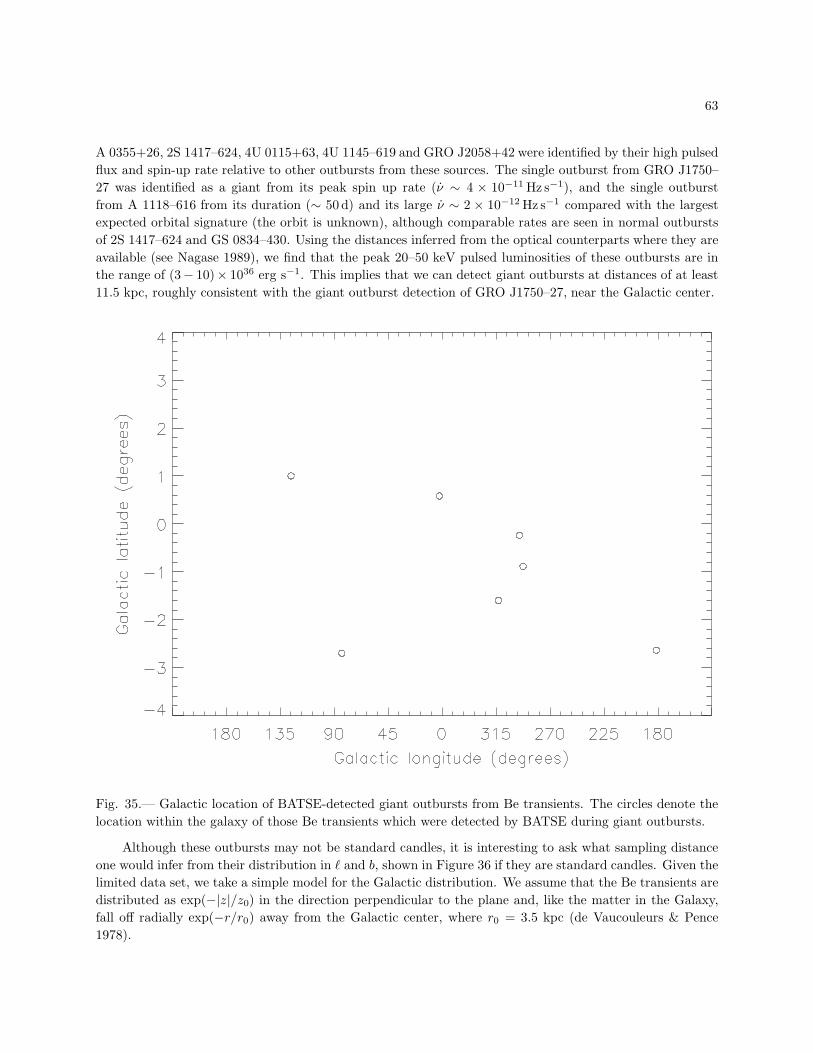
63
A 0355+26, 2S 1417–624, 4U 0115+63, 4U 1145–619 and GRO J2058+42 were identified by their high pulsed
flux and spin-up rate relative to other outbursts from these sources. The single outburst from GRO J1750–
27 was identified as a giant from its peak spin up rate (ν ∼ 4 × 10⁻¹¹ Hz s−1), and the single outburst
from A 1118–616 from its duration (∼ 50 d) and its large ν ∼ 2 × 10⁻¹² Hz s−1 compared with the largest
expected orbital signature (the orbit is unknown), although comparable rates are seen in normal outbursts
of 2S 1417–624 and GS 0834–430. Using the distances inferred from the optical counterparts where they are
available (see Nagase 1989), we find that the peak 20–50 keV pulsed luminosities of these outbursts are in
the range of (3− 10)× 1036 erg s−1. This implies that we can detect giant outbursts at distances of at least
11.5 kpc, roughly consistent with the giant outburst detection of GRO J1750–27, near the Galactic center.
Fig. 35.— Galactic location of BATSE-detected giant outbursts from Be transients. The circles denote the
location within the galaxy of those Be transients which were detected by BATSE during giant outbursts.
Although these outbursts may not be standard candles, it is interesting to ask what sampling distance
one would infer from their distribution in ℓ and b, shown in Figure 36 if they are standard candles. Given the
limited data set, we take a simple model for the Galactic distribution. We assume that the Be transients are
distributed as exp(−|z|/z0) in the direction perpendicular to the plane and, like the matter in the Galaxy,
fall off radially exp(−r/r0) away from the Galactic center, where r0 = 3.5 kpc (de Vaucouleurs & Pence
1978).
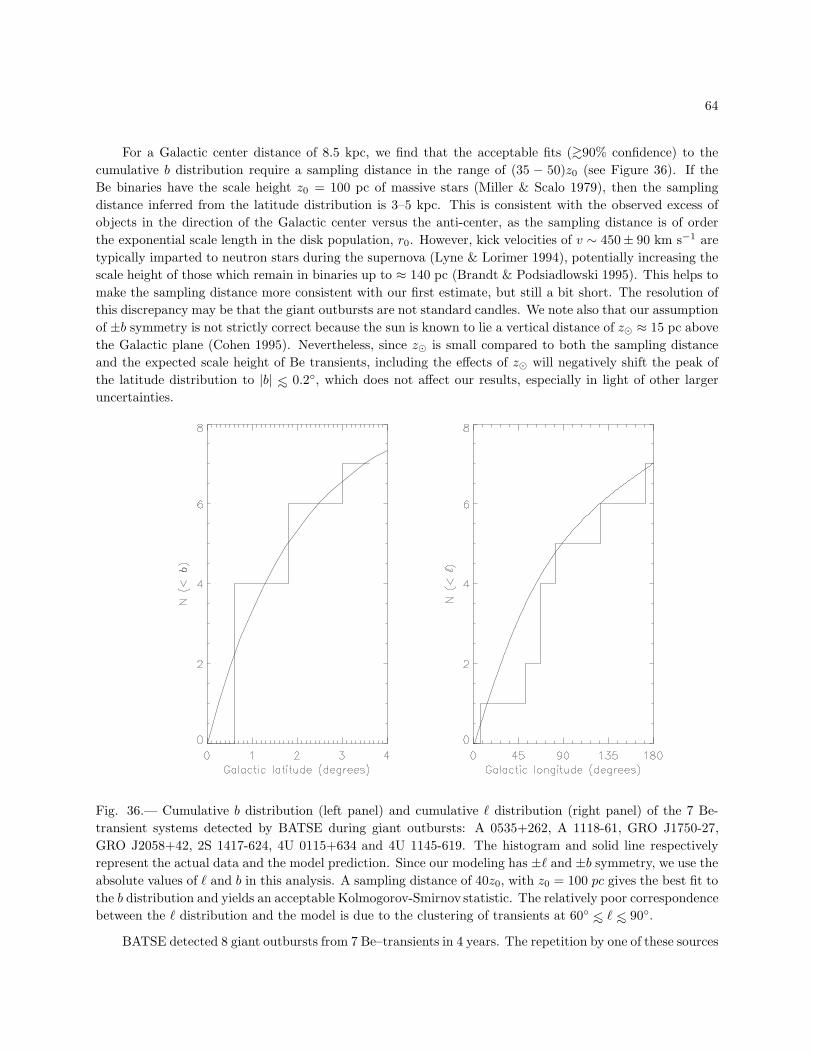
64
For a Galactic center distance of 8.5 kpc, we find that the acceptable fits (∼>90% confidence) to the
cumulative b distribution require a sampling distance in the range of (35 − 50)z0 (see Figure 36). If the
Be binaries have the scale height z0 = 100 pc of massive stars (Miller & Scalo 1979), then the sampling
distance inferred from the latitude distribution is 3–5 kpc. This is consistent with the observed excess of
objects in the direction of the Galactic center versus the anti-center, as the sampling distance is of order
the exponential scale length in the disk population, r0. However, kick velocities of v ∼ 450± 90 km s−1 are
typically imparted to neutron stars during the supernova (Lyne & Lorimer 1994), potentially increasing the
scale height of those which remain in binaries up to ≈ 140 pc (Brandt & Podsiadlowski 1995). This helps to
make the sampling distance more consistent with our first estimate, but still a bit short. The resolution of
this discrepancy may be that the giant outbursts are not standard candles. We note also that our assumption
of ±b symmetry is not strictly correct because the sun is known to lie a vertical distance of z⊙ ≈ 15 pc above
the Galactic plane (Cohen 1995). Nevertheless, since z⊙ is small compared to both the sampling distance
and the expected scale height of Be transients, including the effects of z⊙ will negatively shift the peak of
the latitude distribution to |b| ∼< 0.2, which does not affect our results, especially in light of other larger
uncertainties.
Fig. 36.— Cumulative b distribution (left panel) and cumulative ℓ distribution (right panel) of the 7 Be-
transient systems detected by BATSE during giant outbursts: A 0535+262, A 1118-61, GRO J1750-27,
GRO J2058+42, 2S 1417-624, 4U 0115+634 and 4U 1145-619. The histogram and solid line respectively
represent the actual data and the model prediction. Since our modeling has ±ℓ and ±b symmetry, we use the
absolute values of ℓ and b in this analysis. A sampling distance of 40z0, with z0 = 100 pc gives the best fit to
the b distribution and yields an acceptable Kolmogorov-Smirnov statistic. The relatively poor correspondence
between the ℓ distribution and the model is due to the clustering of transients at 60 ∼< ℓ ∼< 90.
BATSE detected 8 giant outbursts from 7 Be–transients in 4 years. The repetition by one of these sources

65
enables us to estimate the recurrence time scale of giant outbursts. Define Nloc to be the total number of
transients which exist within a distance Rloc of Earth, and assume that all the 7 systems from which BATSE
had detected giant outbursts are within distance Rloc of Earth. By modelling the frequency of giant outbursts
as a Poisson process, we inferred that the most probable recurrence time scale of giant outbursts in each
transient ≈ 12.5 years, which imply that Nloc ≈ 25. This allows us to compute the proportionality constant
in the density distribution of Be–transients which, when integrated over the Galactic disk, yields an estimate
of the total number of Be transients in the Galaxy, Ntot. As shown in Figure 36, Rloc = 40z0 provides the best
fit to the observed cumulative b distribution. For z0 = 100 pc, Rm = 4 kpc, and we obtain Ntot ≈ 1300 while
for z0 = 200 pc, Rm = 8 kpc, we obtain Ntot ≈ 250. If BATSE could indeed sample out to Rloc = 11.5 kpc,
the estimated distance to GRO J1750–27, Ntot ≈ 130 for for z0 = 100 pc. Since our estimate of the recurrence
time scale hinges upon a single transient which exhibited more than one outburst, these estimates should be
considered crude. However, they are consistent with estimates from evolutionary models of the total number
of Be/neutron-star binaries, ∼ 104, most of which are quiescent (Meurs & van den Heuvel 1989).
5.7. Be/X-ray Pulsar Orbits
BATSE has more then doubled the number of orbits that have been determined for Be/X-ray binaries,
increasing the number from 4 to 8. See table 3. We include in this classification GRO J1750–27, 2S 1553-54
and GS 0834–430, which we suspect have Be star companions. With this size sample we can begin to make
comparisons between the observed distribution of orbital elements and our expectations.
A main sequence B star has a mass in the range of 4–16 M⊙. The measured X-ray mass functions
fx(M) for the Be/X-ray pulsars should be consistent with masses in this range. If we assume a common
neutron-star mass of 1.4M⊙, we can use the mass function, fx(M), to determine lower limits to the masses
of the companions. If we further assume that the systems we see have randomly distributed orientations
relative to our line of sight, we can use the distribution of mass functions to determine the distribution
of companion masses. In Figure 37 we compare the cumulative mass-function distribution, N [< fx(M)]
with the distribution we would get assuming a constant companion mass, Mc, a constant neutron star mass,
Mx = 1.4M⊙, and random orientation. With the observed distribution is plotted the theoretical distributions
for 4M⊙, 6M⊙ and 10M⊙ companions. None of these curves can be said to fit the data, however masses
in the 6–12 M⊙ range are clearly called for. To explore the width of the companion mass distribution a
maximum likelihood fit was made to the observed mass functions, using a companion mass distribution that
was uniform in log between two limiting masses. The best model had masses in the range of 6.7–13.1 M⊙,
however due to the limited statistics the distribution width was poorly constrained, with the 50%-confidence
region containing lower mass limits from 2–8 M⊙ and upper mass limits from 12.2–21 M⊙.
Be/X-ray binaries are thought to be the result from the evolution of a binary system of two B stars
(van den Heuvel & Rappaport 1987). The progenitor of the neutron star is initially more massive. First it
transfers mass to its companion by Roche-lobe overflow due to hydrogen-shell burning, resulting in a helium
star orbiting a rapidly rotating Be star. Then the helium star transfers mass due to helium-shell burning.
Finally the helium star undergoes a supernova explosion. The velocity kick and the mass loss experienced
in the supernova explosion can result in a wide eccentric orbit (or a disrupted system). Since the orbits
are wide, orbital changes are slow compared to the evolutionary timescale of the Be star. The observed
Be/X-ray system orbits are therefore fossils of supernovae in Be/helium binaries.

66
Fig. 37.— Cumulative distribution of the mass functions of the Be transient pulsars. The measurements are
given by the stair-step curve. The remaining curves give the expected distribution for random orientation
and a constant companion mass of 4M⊙ (dotted), 6M⊙ (dashed), and 10M⊙ (dot-dashed).
The widest resulting orbits (and therefore those of longest period) should be the most eccentric, and we
therefore expect eccentricity to be correlated with orbital period. In Figure 38 we plot the orbital periods and
eccentricities of the Be systems for which these have been determined. Only a weak correlation is present.
The possible range of the orbital period Pinit of the pre-supernova system, assuming a initial circular orbit
and an asymmetric supernova explosion, is Porb(1 − e)3/2β1/2 < Pinit < Porb(1 + e)3/2β1/2 where β is the
ratio of the current system mass to the pre-supernova system mass. This is shown in figure 38 for each source,
assuming β = 0.9. The initial period distribution could have been much narrower than the distribution of
Porb, but must still have significant width. This may explain the weakness of the correlation.

67
Fig. 38.— The eccentricities of Be/X-ray pulsars systems plotted against the orbital period. The dotted
lines give the possible range of the orbital period for each system prior to the supernova that formed the
neutron star, assuming an initially circular orbit and an asymmetric supernova explosion.
The kick velocities are likely to be larger than the orbital velocities in the pre-supernova systems (≈100
km s−1). Lyne and Lorimer (1994) found from a study of radio pulsar proper motions a mean kick velocity of
450 ± 90km s−1. The majority of systems are therefore disrupted. Kalogera (1996) gives analytic expressions
for the distribution of orbital parameters of the undisrupted systems, assuming an initially circular orbit
and a Gaussian kick velocity distribution. The form of the eccentricity distribution in the limit of large kick
velocity relative to orbital velocity is found to be independent of all other parameters. In Figure 39 the
cumulative distribution of the observed eccentricities is compared to the predicted cumulative distribution,
which has been normalized to a mean of eight sources with e < 0.5.
The observations and predicted distribution agree reasonably for e < 0.5, but poorly above. No sources
with e > 0.5 are observed, but 30 are expected. We think it unlikely that this is due to an error in our
assumptions about the kick distribution. More likely this is evidence for strong selection effects against
high eccentricities. High-eccentricity orbits will typically undergo outbursts only near periastron, and may
only be observed in isolated outbursts, making orbit determination difficult or impossible. If this is the
explanation, then nearly all of the Be/X-ray pulsar for which no orbit has been determined (20 sources)
must have high eccentricity (e > 0.5). It is also intriguing to note that the eccentricities are high (e = 0.8698
in PSR B1259-63 Johnston et al. 1992 and e = 0.8080 in PSR J0045-7319 Kaspi et al. 1994) in the two
known Be/radio pulsar binaries.
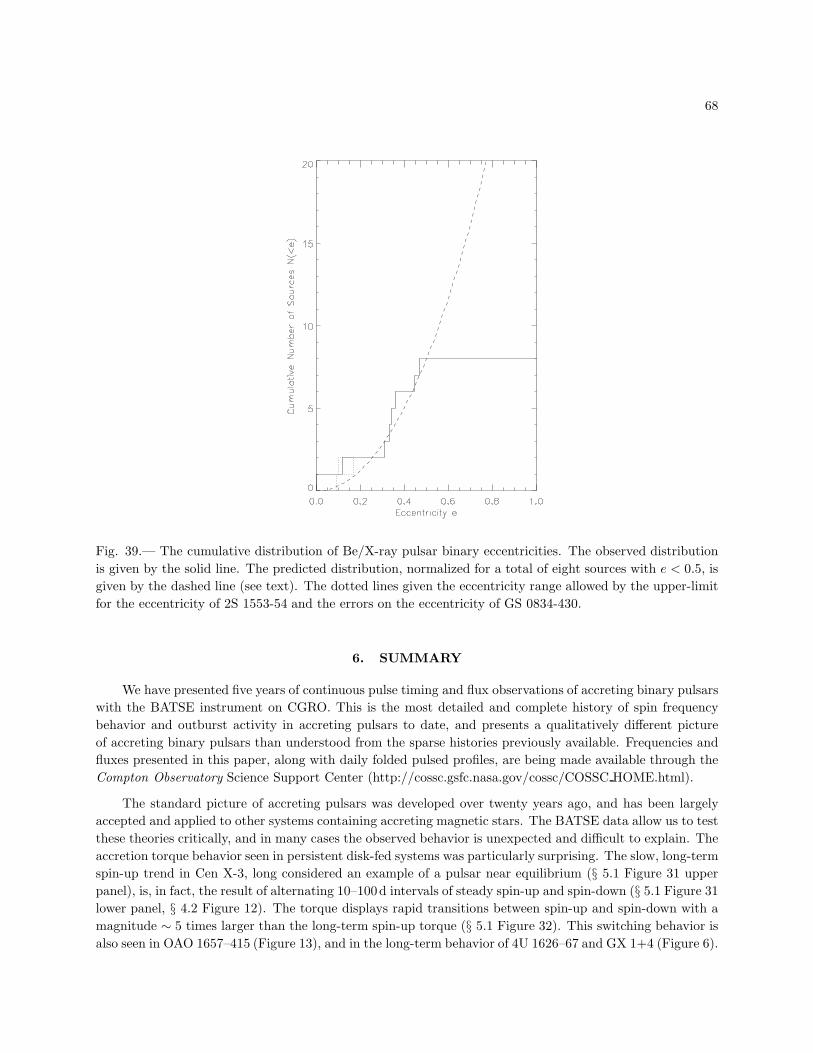
68
Fig. 39.— The cumulative distribution of Be/X-ray pulsar binary eccentricities. The observed distribution
is given by the solid line. The predicted distribution, normalized for a total of eight sources with e < 0.5, is
given by the dashed line (see text). The dotted lines given the eccentricity range allowed by the upper-limit
for the eccentricity of 2S 1553-54 and the errors on the eccentricity of GS 0834-430.
6. SUMMARY
We have presented five years of continuous pulse timing and flux observations of accreting binary pulsars
with the BATSE instrument on CGRO. This is the most detailed and complete history of spin frequency
behavior and outburst activity in accreting pulsars to date, and presents a qualitatively different picture
of accreting binary pulsars than understood from the sparse histories previously available. Frequencies and
fluxes presented in this paper, along with daily folded pulsed profiles, are being made available through the
Compton Observatory Science Support Center (http://cossc.gsfc.nasa.gov/cossc/COSSC HOME.html).
The standard picture of accreting pulsars was developed over twenty years ago, and has been largely
accepted and applied to other systems containing accreting magnetic stars. The BATSE data allow us to test
these theories critically, and in many cases the observed behavior is unexpected and difficult to explain. The
accretion torque behavior seen in persistent disk-fed systems was particularly surprising. The slow, long-term
spin-up trend in Cen X-3, long considered an example of a pulsar near equilibrium (§ 5.1 Figure 31 upper
panel), is, in fact, the result of alternating 10–100d intervals of steady spin-up and spin-down (§ 5.1 Figure 31
lower panel, § 4.2 Figure 12). The torque displays rapid transitions between spin-up and spin-down with a
magnitude ∼ 5 times larger than the long-term spin-up torque (§ 5.1 Figure 32). This switching behavior is
also seen in OAO 1657–415 (Figure 13), and in the long-term behavior of 4U 1626–67 and GX 1+4 (Figure 6).
69
We propose that this behavior is common in disk-fed pulsars (§ 5.1).
Observing the predicted correlation between spin-up rate and bolometric luminosity, ν ∝ L6/7, has long
been considered a critical test of accretion torque theory (§ 3). We have observed ν and 20–50keV pulsed
flux, Fpulsed, in outbursts of two transients, A 0535+26 (Figure 26) and GRO J1744–28 (Figure 11). We
find ν ∝ F γpulsed with γ = 0.951(26) for A 0535+26 and γ = 0.957(26) for GRO J1744–28 (Figure 33, § 5.2).
EXOSAT observations of EXO 2030+375, using the orbit measured with BATSE, yielded γ ≃ 1.2 (Reynolds
et al. 1996). This disagrees with the predicted scaling of magnetospheric radius with mass accretion rate,
rm ∝ M−2/7. However, the apparent contradiction may be that Fpulsed is not a good indicator of bolometric
luminosity or M . In fact, an indirect test of the rm–M relation is provided by the observed correlation
between the frequency of quasi-periodic oscillations seen with BATSE in A 0535+26 and ν, and is consistent
with the predicted scaling (§5.2, Finger, Wilson, & Harmon 1996).
Power density spectra of torque fluctuations in the 8 persistently bright pulsars monitored with BATSE
(Figure 34) show that pulsars known to wind-fed (Vela X-1, GX 301–2, 4U 1538–52) are flat. Their spin-
frequency behavior can be described as a random sequence of independent torque fluctuations. In contrast,
the disk-fed pulsar Cen X-3 has an approximately 1/f power spectrum of torque fluctuations, as do GX 1+4
and OAO 1657–415, indicating the presence of correlations between accretion torques on long time scales
(§ 5.4). It is unclear if such correlations are a signature of disk accretion however, as both 4U 1626–67 and
Her X-1 show flat power spectra, and the accretion mechanism in GX 1+4 and OAO 1657–415 is unknown.
Furthermore, two dramatic spin-up episodes in GX 301–2 of ∼20d duration (Figure 16) suggest that transient
accretion disks sometimes form in primarily wind-fed pulsars (§ 5.3). The 1/f power spectrum of Cen X-3 is
in conflict with previous measurements, and calls for a reexamination of the relation of noise strength with
luminosity and spin-up rate observed prior to BATSE.
Most of the Be transient pulsars observed with BATSE show a sequence of “normal” outbursts spaced
at the orbital period (Figure 17, § 4.3). Also observed are occasional “giant” outbursts, characterized by
high spin up rates, strongly correlated with flux and of of longer duration (e.g. Figures 26, 22, 28), which
suggests accretion from a transient disk (§ 5.5). The repeating normal outbursts might be explained by the
large tidal torques experienced by the disk during periastron passage (§ 5.5).
We have estimated the total number of Be/X-ray transients in the Galaxy, and find there are ∼100
–1000 such systems, depending upon their assumed Galactic scale height and the BATSE sampling radius
(§ 5.6). BATSE observations have doubled the number of measured Be/X-ray pulsar binary orbits, from
4 to 8 (Table 3). The distribution of orbital eccentricities (Figure 39) agrees well with predictions from
radio-pulsar proper motions for e < 0.5, and suggests that nearly all of the Be/X-ray pulsars for which no
orbit has been determined must have high eccentricity (§ 5.7).
There are several important topics, not touched upon here, which will eventually benefit from BATSE
observations. These include the time evolution of orbital parameters (e.g., orbital decay, apsidal motion),
a more complete analysis of the population of Be transients, and searches for rapidly rotating pulsars from
analysis of higher time resolution data.
We acknowledge John Grunsfeld for important contributions to the early stage of this project, and Ed
Brown Saul Rappaport for helpful comments and for carefully reading the manuscript. This work was funded
in part by NASA grants NAG 5-1458, NAG 5-3293, and NAGW-4517. D.C. was supported at Caltech by a
NASA GSRP Graduate Fellowship under grant NGT-51184. The NASA Compton Postdoctoral Fellowship
program supported D.C. (NAG 5-3109), L.B. (NAG 5-2666), and R.W.N. (NAG 5-3119). L.B. was also

70
supported by Caltech’s Lee A. DuBridge Fellowship, funded by the Weingart Foundation; and by the Alfred
P. Sloan Foundation.
APPENDIX A
PULSED OBSERVATIONS WITH BATSE
The Compton Gamma-Ray Observatory was launched on 1991 April 5 into a 400 km orbit inclined 28.5
with respect to the Earth’s equator that precesses about the Earth’s polar axis with a period of ≈53 days.
BATSE consists of eight identical uncollimated detector modules arranged on the corners of the Compton
spacecraft (Fishman et al. 1989; Horack 1991). Each detector module contains a large-area detector (LAD)
and a smaller spectroscopy detector. Our pulsar studies deal entirely with data from the LADs, each of
which contains a NaI(Tl) scintillation crystal 1.27 cm thick and 50.8 cm in diameter, viewed in a light
collection housing by three 12.7 cm diameter photomultiplier tubes. The LADs are shielded in front by a 1
mm aluminum window and a plastic scintillator for charged particle detection, and have an effective energy
range of 20 keV–1.8 MeV and an energy resolution of about 35% at 100 keV. Below 30 keV, the sensitivity
is severely attenuated by the aluminum and plastic shielding.
Scintillation pulses from the LADs are processed in two parallel paths: a fast, four-channel discriminator
circuit and a slower multi-channel pulse height analyzer. Calibration is maintained during flight by an
automatic correction scheme which adjusts the detector gain so as to keep the 511 keV line from the gamma-
ray background in the same channel. There are many different BATSE data products available. The three
which we use for pulsar investigations are:
• DISCLA data: Count rate samples for each detector from the discriminator circuit in 4 energy
channels at a time resolution of 1.024 s.
• CONT data: Count rate samples for each detector from the pulse-height analyzer in 16 energy channels
at a time resolution of 2.048 s.
• PSR data: Count rate samples for a programmable combination of detectors folded into 64 phase
bins with a programmable folding period in 16 energy channels and a programmable collection times,
typically 8–16 s.
The CONT and DISCLA data types are available continuously and are used for slowly rotating pulsars.
We use the PSR data for pulsars with spin periods less than or comparable to the DISCLA and CONT
sampling rates (e.g., Her X-1 and GRO J1744–28). Approximate energy channel boundaries for the DISCLA
and CONT data and the typical count rates (for background-dominated observations) are given in Table 6.
Figure 40 shows the variation of the energy channel boundaries over the various LADs for CONT channels
0–7.
Most of our accreting pulsar studies are carried out below 100 keV, so we principally use DISCLA
channel 1 (20–60keV) and CONT channels 1–6 (25–125keV). Pendleton et al. (1995) have determined the
response of the LADs to monochromatic photons of various energies. The effective area at normal incidence
for full energy deposition peaks near 1500 cm2 around 100keV. The effective area drops below 100 keV due to
the absorption of low energy photons in the aluminum window and the charged-particle detector and above
100 keV due to the increased transparency of the LAD detector. Each of the LADs has slightly different
energy channels (see Figure 40) which we take into account when constructing the response matrices.

71
Prior to scientific analysis, the BATSE data undergo four stages of processing. Each step except the
first must be performed separately for each source. 1. Background subtraction: The detector background
is removed using a phenomenological model. In addition, quality flags are applied at this stage, and spikes
removed. 2. Detector weighting: Detectors with significant projected area to the source are weighted and
summed to optimize the signal-to-noise ratio for timing analysis. 3. Barycenter correction: Photon arrival
times are corrected for spacecraft orbital motion to Barycentric Dynamical Time (TDB) using the Jet
Propulsion Laboratory DE-200 solar-system ephemeris (Standish et al. 1992) The orbit of the pulsar is
also removed for systems where it is known. 4. Earth occultation windowing: Intervals where the source is
occulted by the Earth are removed. Steps 1 and 2 are particular to the BATSE data, so we describe them
in detail here.
Background subtraction is not performed on PSR data, and the selected detectors are uniformly
weighted. Barycentric corrections are applied once per collection (8–16 s) using the midpoint time, with
the times of phase bin edges computed relative to the midpoint time.
A.1. Background Subtraction
Because the LADs are uncollimated and non-imaging, the background count rate includes contributions
from the diffuse Galactic and cosmic background, atmospheric gamma rays, a prompt local background
caused by interactions of primary cosmic rays with detector materials, activation of radionuclides in the
detectors by particles during passages through the South Atlantic magnetic anomaly (SAA) that results
in a delayed internal background, and discrete source contributions. A detailed review of the gamma-ray
background for low-Earth orbit instruments in general is given by Dean, Lei, & Knight (1991), while a
discussion of the background for BATSE in particular is given by Rubin et al. (1996).
The diffuse cosmic gamma-ray background is the strongest component below 300keV. It is isotropic,
and varies for each detector depending on the fraction of the field of view that is occulted by the Earth. The
atmospheric and prompt backgrounds depend upon the position of the spacecraft in the Earth’s magnetic field
and vary with the local geomagnetic cutoff rigidity. Primary cosmic ray protons below the local cutoff energy
do not penetrate the Earth’s field at a given geomagnetic latitude. Bombardment by cosmic rays and trapped
protons in the SAA produce radionuclides that decay with various lifetimes, notably 128I (τ1/2 = 25min),
creating a delayed internal background. Sharp changes in the count rate also occur when bright, discrete
sources cross the limb of the Earth. In addition, there are data gaps due to brief telemetry outages or errors,
and from turning off the detector high voltage during SAA passages.
These background variations introduce power at a wide range of Fourier frequencies and reduce the
sensitivity to pulsed signals relative to the Poisson counting limit. Strong quasi-sinusoidal variations with
≈ 93 min period are mainly due to orbital modulation of sky area visible to the detectors. In addition, the
spikes (mainly due to charged-particle-induced phosphorescence in the NaI) and gaps in the data introduce
variability at all analysis frequencies, and are one of the major sources of noise power. Data quality flags set
by the BATSE operation team are initially used to reject data containing gamma-ray bursts, phosphorescence
events and other rapid background variations. Additional quality control that identifies spikes and gaps is
a crucial step in our analysis of BATSE data. Three separate background-subtraction techniques have been
developed, each of which involves modeling the background variations.
The most sophisticated technique is the use of a phenomenological model that includes each of the
known contributions (Rubin et al. 1996). The atmospheric and prompt components of the background
72
depend upon the geomagnetic rigidity. The cosmic, atmospheric, and prompt components all vary with the
direction of the detector relative to the Earth. The delayed component can be modeled as an exponential
decay following each SAA passage. Finally, discrete sources contribute a component that we approximate as
the product of the effective area to the source and a step function that is zero when the source is occulted
by the Earth and unity when it is not. The resulting explicit form of the function used to fit the background
independently for each LAD is
M(ti) =
3∑
j=0
(aj + bjL)Pj(cos θi) + fk exp
[−(ti − tSAA)
τk
]
+
nocc∑
l=1
glTli (A1)
where i labels the time bin corresponding to ti, L is the McIlwain L-shell parameter (a measure of the
location in the Earth’s magnetosphere; see, e.g., Rossi & Olbert 1970), Pj is the Legendre polynomial of
order j, tSAA is the end time of the most recent SAA passage, τk is the decay time of 128I, and Tli is the
atmospheric transmission function of source l at the mean energy of bin i. The coefficients aj, bj, fk and gl
are determined by a linear least-squares fit to the raw data. We obtain acceptable fits for segments of length
0.125day and then subtract the best-fit model from the raw data. This technique assumes the presence
of periodic behavior at harmonics of the orbital period, so some attenuation of low frequency signals is
inevitable in the fitting process.
Figure 41 shows the power spectrum of the CONT channel 1 data before and after this background
subtraction. Following background subtraction, the noise power is consistent with the Poisson level on time
scales ∼< 80 s. This background model performs somewhat better than the other techniques at longer time
scales and allows us to probe deeper at lower pulse frequencies than would otherwise be possible. Histories of
OAO 1657–415, Vela X-1, 4U 1538–52, GX 301–2, GS 0834–430, GRO J1948+32, EXO 2030+375, 4U 1145–
619 and GRO J1008–57 in § 4 were constucted using this background-subtraction technique, as were data
sets at the COSSC.
A more ad hoc model for the background can be produced by applying a simple frequency-domain
digital filter to the data (Chakrabarty et al. 1993, Chakrabarty 1996). To construct the background model,
we first remove impulsive spikes and interpolate over gaps in the raw data and then perform smoothing in
the frequency domain by multiplying the Fourier transform of the interpolated time series by a low-pass filter
defined as R(ν < ν0) = [1+cos(πν/ν0)]/2 for ν < ν0 and R(ν > ν0) = 0 for ν > ν0, with ν0 = 1.6×10⁻³ Hz.
The inverse transform of this product is a good approximation to the orbital background variation, which is
then subtracted from the raw data after reintroducing the original gap structure. Histories of 4U 1626–67
and GX 1+4 in § 4 were constucted using this background subtraction technique.
Finally, an empirical background model is often used in analysis of the DISCLA data. This is a spline
function with quadratics in time, in segments normally of 300 s length, connected with continuity in value
and slope at segment boundaries within contiguous sets of data. This model is fit simultaneously with a
Fourier representation of the pulsed signal, described further in Appendix B.1.2. Histories of GRO J1744–28,
Cen X-3, 4U 0115+63, 2S 1417–624, A 0535+26, 4U 1145–619 and A 1118–616 in § 4 were constructed using
this technique.
A.2. Optimal Combination of Detectors
The octahedral arrangement of the BATSE detector planes makes a pulsar visible to four BATSE
detectors during any given spacecraft pointing (which typically changes every two weeks). The sensitivity
73
to a given pulsar then depends on the angular response of the detectors. A discussion of techniques for
extracting signals from multiple BATSE detectors appears in Chakrabarty (1996). We summarize that
discussion here, then present an optimal scheme for weighting detectors when the energy spectrum of the
source is known.
The dominant effect is the projected detector area along the line of sight to the source, which varies as
cos θ (where θ is the viewing angle between the detector normal and the source). The response to 100 keV
photons is approximately cos θ, but diverges from this for energies both above and below 100 keV for different
reasons. At higher energies, the photon attenuation length in NaI becomes comparable to the thickness of the
crystal, so that not all incident photons are captured. Hence, the decrease in projected geometric area with
increasing θ is partially offset by the increase in path length through the detector, both of which have a cos θ
dependence. This results in a relatively flat angular response for θ ∼> 50 at high energies. At low energies,
the attenuation length in NaI is very short, making the detector thickness irrelevant. However, the path
length through the shielding in this case increases with θ, and the resulting attenuation, exp(−τ(E)/ cos θ)
where τ(E) is the optical thickness of the shield at energy E, of flux incident on the LAD causes the response
to fall more steeply than cos θ.
A consequence of the variation of angular response with energy is that the response to a pulsar depends
upon its energy spectrum. Typical accreting pulsar spectra can be represented as dN/dE ∝ E−α, where
2 < α < 5 in the 20–100 keV range. Figure 42 shows the angular response to a 20–75 keV photon power law
spectrum for α = 2 and α = 5. For comparison, cos θ and cos2 θ are also plotted. The response falls off more
quickly than cos θ since the large number of low-energy photons dominate despite the attenuation by the
shield. As expected, this effect is more pronounced for the steeper power-law index, where the proportion
of incident lower energy photons is even higher. In general, the integrated response varies ≈ cos θ for small
angles (θ ∼< 25), independent of photon index. At larger angles, cos2 θ is a more conservative general
assumption when the source spectrum is unknown.
Our timing analysis uses a weighted sum of the count rates from the four detectors exposed to the source.
If we consider a background-limited observation and make the approximation that the background rate is
the same in all detectors, isotropic, and governed by Poisson statistics, then the resulting signal-to-noise
ratio (SNR) is
SNR =CST
∑
wi(θi) ri(θi)√
CBT∑
w2i (θi)
, (A2)
where CS is the source count rate in a single detector at normal incidence, CB is the background count
rate in each detector, T is the exposure time θi is the source viewing angle for the ith detector, ri(θi) is
the angular response function of the ith detector, and wi(θi) is the detector weighting function that we are
optimizing.
BATSE is more sensitive to some areas of the sky than others. The highest sensitivity at low energies
is at the eight points in the sky that lie on the BATSE detector normals (i.e., the direction vector for
normal incidence), while the lowest sensitivity is at six points in the sky that lie equidistant from the eight
detector normals. The weighting function for summing detectors that maximizes the signal-to-noise ratio as
parametrized in Equation (A2) depends upon where in the sky the source is relative to the detector normals.
Because the angular response, r(θ), depends upon the intrinsic energy spectrum of the source and is different
for each detector, determining the optimal weighting coefficients requires the full response matrix of each
exposed detector and an assumed incident energy spectrum. For DISCLA data, where we utilize a single
energy channel, we use an optimal detector weighting given by

74
wi = ri(Ef )
∑
j
r2j (Ef )
−1
. (A3)
Here ri(Ef ) is the predicted count rate in DISCLA channel 1 for detector i assuming that the source has a
photon spectrum F (E) = (A/E) exp(−E/Ef ). This weighting scheme takes into account differences between
detectors (see figure 40), unlike the weighting scheme described below which assumes identical detectors and
cos2 θ response. The e-folding energies Ef were selected based on published spectra.
We also use a weighting scheme that is independent of the source spectrum by approximating the angular
response function as r(θ) = cos2 θ and calculating sensitivity as a function of sky position for weighting
functions of the form w(θ) = cosn θ, with n = 0, 1, 2, 3, 4. The best overall sensitivity is achieved by
choosing the detector weighting adaptively (i.e., selecting whichever cosine power law optimizes sensitivity
for a given source location with respect to the detectors, rather than using a single form of w(θ) for all
source locations). However, w(θ) = cos2 θ weighting provides both reasonable average sensitivity and spatial
uniformity, is ∼15% more sensitive on average than an unweighted sum of exposed detectors, and is at worst
∼5% poorer than adaptive weighting. We use w(θ) = cos2 θ weighting for most frequency measurements
with CONT data.

75
Fig. 40.— The energies of the Large Area Detector (LAD) channel boundaries for the CONT data. We
display the lower and upper boundaries of CONT channels 1–6 for all detectors. The gain is stabilized
onboard using the 511 keV background feature. These bin energies apply to two different intervals, MJD
48406.11 – 49400.69 and MJD 49419.69 – 50062.82, which together comprise most of the CGRO mission.
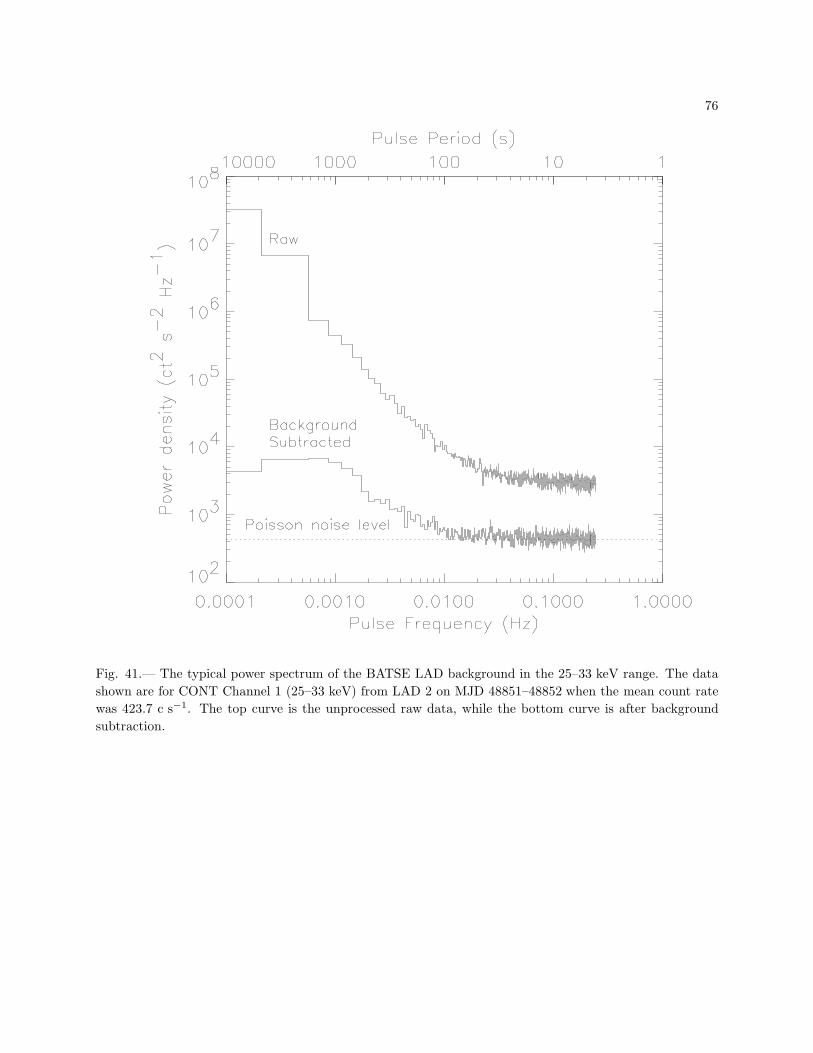
76
Fig. 41.— The typical power spectrum of the BATSE LAD background in the 25–33 keV range. The data
shown are for CONT Channel 1 (25–33 keV) from LAD 2 on MJD 48851–48852 when the mean count rate
was 423.7 c s−1. The top curve is the unprocessed raw data, while the bottom curve is after background
subtraction.
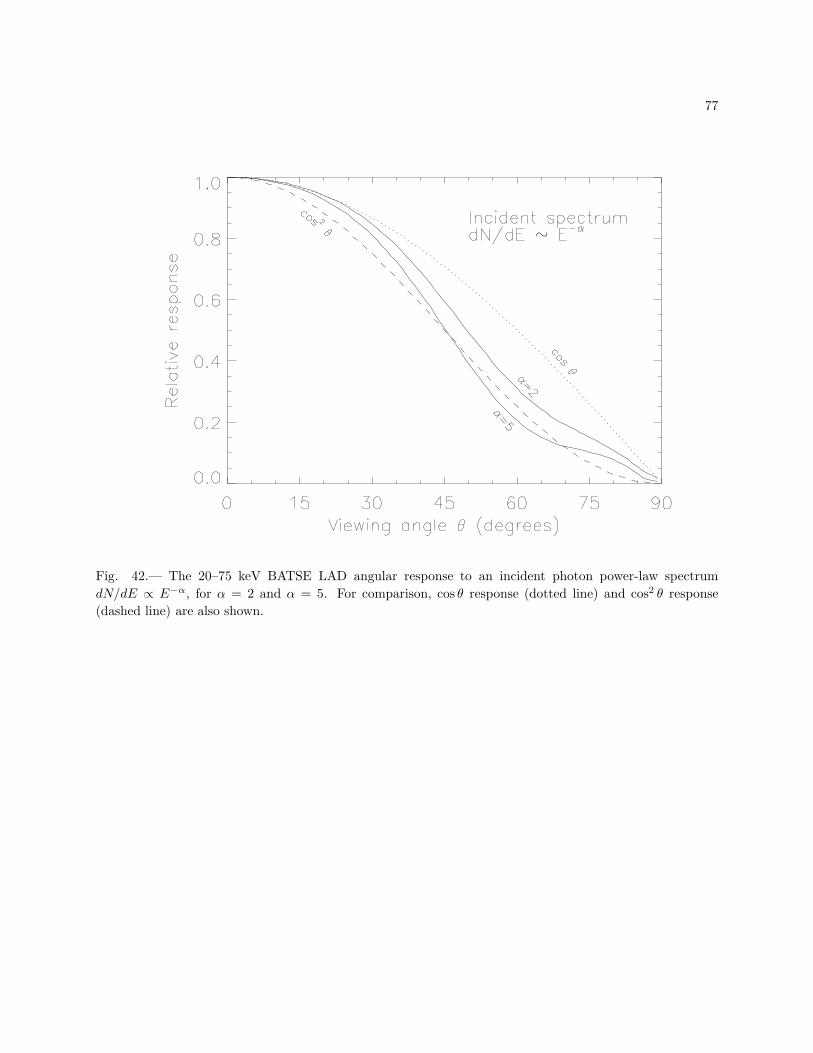
77
Fig. 42.— The 20–75 keV BATSE LAD angular response to an incident photon power-law spectrum
dN/dE ∝ E−α, for α = 2 and α = 5. For comparison, cos θ response (dotted line) and cos2 θ response
(dashed line) are also shown.

78
APPENDIX B
BATSE DATA ANALYSIS
In this appendix we discuss how frequency and flux are computed following the preprocessing described
in appendix A. Frequency estimation is covered first, followed by pulsed flux.
B.1. Frequency Estimation
B.1.1. Frequency Estimation using Power Spectra
Power spectra were used to compute the frequency histories of 4U 1626–67, GX 1+4, OAO 1657–
415, GX 301–2, GS 0834–430, GRO J1948+32, EXO 2030+375 and GRO J1008–52 displayed in § 4, as
well as in data files at the COSSC. Power spectra are computed using the Fast Fourier Transform (FFT).
Given a contiguous dataset of duration T seconds in N uniform bins of duration T/N , the FFT returns
N/2 + 1 statistically-independent estimates, aj , of the amplitude and phase of the variability at frequencies
νj = j/T , where 0 ≤ j ≤ N/2. The normalized power at νj is Pj ≡ |aj|2/P (νj), where P (ν) is the average
power, 〈|aj |2〉, in the vicinity of νj (excluding frequencies immediately adjacent to νj). This normalization
is important because the background power is strongly frequency dependent (see Figure 41). Thus defined,
〈Pj〉 = 1. Data collected by BATSE are in uniform bins of duration 2.048 s (CONT data), 1.024 s (DISCLA
data) or shorter (PSR data). However, corrections of spacecraft times to the solar system barycenter causes
the bins to become nonuniform. We therefore define a new array with bins equispaced in arrival time at the
solar-system barycenter (or in the frame of the neutron star if the orbit is known). An individual time-series
bin from the spacecraft will generally overlap two such bins. We can either treat each bin as a delta function
at the bin center and add all counts to the appropriate bin in the new array (whole binning) or split counts
between overlapping bins in proportion to the degree of overlap (bin splitting). We choose bin splitting
because it performs significantly better than whole binning when ν ∼> N/2T while introducing negligible
corrections to the power spectrum.
The response, R2(ν), of the power spectrum to a sinusoid of frequency ν decreases with increasing
frequency and also depends upon the separation, ∆ν, between ν and the nearest Fourier frequency, falling
off as
R2(ν) = sinc2(πν/2νNyq)sinc2(π∆νT ) (B1)
where sinc(x) = sin(x)/x and νNyq = N/2T is the Nyquist frequency. Attenuation at high frequency is
intrinsic to binned data and constrains us to use DISCLA and/or PSR data for fast pulsars, but attenuation
with ∆ν can be circumvented by computing the power at a denser set of frequencies. By appending an array
of zeroes of length (m−1)N to the array of data and computing the FFT, we obtain an overresolved Fourier
transform with m times finer frequency spacing, but with frequency bins that are no longer statistically
independent. The signature of a sinusoid is no longer in one or two bins, but distributed over ∼ m bins. To
preserve the definition νj = j/T , we allow j to take on m(N/2) + 1 values in increments of ǫ ≡ 1/m. If the
highest power occurs in frequency bin j, then Middleditch (1976) has shown that the best estimate of the
signal frequency is given by
ν = νj +3
4π2ǫT
(
Pj+ǫ − Pj−ǫ
Pj
)
. (B2)

79
Table 6. Energy Channels in BATSE DISCLA and CONT Data
Energy Range Background Rate
Channel (keV) (c s−1)
DISCLA 1 20–60 1500
DISCLA 2 60–110 1200
DISCLA 3 110–320 1000
DISCLA 4 >320 700
CONT 0 20–24 250
CONT 1 24–33 450
CONT 2 33–42 500
CONT 3 42–55 500
CONT 4 55–74 500
CONT 5 74–99 450
CONT 6 99–124 300
CONT 7 124–165 300
CONT 8 165–232 300
CONT 9 232–318 200
CONT 10 318–426 130
CONT 11 426–590 130
CONT 12 590–745 50
CONT 13 745–1103 80
CONT 14 1103–1828 80
CONT 15 >1828 200
NOTE: These channel boundaries are approxi-
mate, and are averaged over the eight detectors.
Each detector has slightly different edges, as shown
in Figure 40. The CONT edges are programmable;
the displayed values are typical, and are computed
using the calibration discussed in Preece et al. 1997.
We have made use of CONT data through channel
7 in our analyses.
80
The uncertainty in the frequency (Middleditch 1976, Middleditch & Nelson 1976) is given by
σν ≃ 1
2πT
√
6
Pj, (B3)
In all cases we use the dominant harmonic for frequency estimation. For double-peaked pulsars (see figure
7), the second harmonic usually dominates.
It is worth noting that σν ∝ T−3/2 (since P ∝ T ), and hence Nd-day power spectra are N3/2
d times more
precise than 1-day estimates. However, transform length cannot be increased indefinitely because variations
in ν will eventually cause a loss of coherence when T 2 ∼> 〈ν〉. We call this the decoherence time scale (see
Appendix A of Chakrabarty et al. 1997a).
The frequency histories in this paper for OAO 1657–415, GS 0834–430, GRO J1948+32, EXO 2030+375,
GRO J1008–52, and 4U 1145–619 were made from daily power spectra of CONT data. These histories and
others made from daily power spectra are available in the datasets at the COSSC via:
http://cossc.gsfc.nasa.gov/cossc/COSSC HOME.html
For the sources 4U 1626–67, GX 1+4 and GX 301–2, multi-day power spectra were used.
B.1.2. Frequency Estimation using Epoch Folding
Spin frequencies were also estimated by epoch folding data at a range of trial frequencies. We use the
term “epoch folding” to describe any technique where a pulse phase is assigned to each time bin based upon a
model of the spin frequency. In some cases we impliment epoch folding as a fitting procedure. This technique
was used with DISCLA data for the histories of Cen X-3, 4U 1538-52, 4U 0115+634, GRO J1750-27, 2S
1417-624, GRO J2058+42, 4U 1145–619 and A1118-616 shown in § 4. Detection and determination of the
pulse frequency are based on the Z2m test, which measures the significance of the first m Fourier amplitudes
of the epoch-folded pulse profile.
Rather then rebining the data into uniform phase bins and then epoch folding them, we fit the data
using a background model and a low order Fourier expansion in the pulse phase model. Fitting does not
require rebinning, and hence avoids the loss of phase resolution inherent to rebinning techniques, which is
important when the low time resolution is ∼> Pspin (Deeter & Boynton 1986). The data are divided into
1 ∼ 10 d intervals, and each interval fit with a model C(t) of the form
C(t) = M(t) +n∑
k=1
[Ak cos 2πkφ(t) + Bk sin 2πkφ(t)] . (B4)
where M(t) is a model of the background rate, the harmonic sum is a Fourier representation of the pulse
profile, and φ(t) is the pulse phase, where we generally assume a constant frequency for each interval and
use n = 3. The background is modeled as a quadratic spline, with segments every 300 s and with value and
slope continuous across segment boundaries (but not across gaps). This background modeling procedure is
approximately equivalent to applying a high-pass filter with ν6 roll off and a roll-off frequency of ∼0.002Hz
(500 s). The Z23 statistic is determined for each trial frequency for the best set of fit parameters, Ak, Bk,
and values of Z23 near the peak value fit to determine the frequency. In the case of 4U 1538–52, because of
81
its low frequency, we use the phenomenological background model described in Appendix A.1 rather than a
quadratic spline.
B.1.3. Frequency Estimation from Fits to Pulse-Phase Measurements
The frequencies histories of GRO J1744-28, Her X-1, Vela X-1, GRO J1750-27 and A 0535+26 shown in
§ 4 were determined from fits to pulse phase measurements. Phases were determined (for orbital analyses)
by epoch folding data over short intervals (∼ 0.5days) and correlating the resulting pulse profiles with pulse
templates to determine phase offsets from the epoch folding phase model. The total phases were then divided
into several day intervals and a linear fit in emission time made to the total phases (model plus offset) in
each interval to obtain frequencies.
B.2. Pulsed Flux Estimation
B.2.1. What is Pulsed Flux and Pulsed Fraction?
Pulsed flux is the periodically varying part of the flux from a source. Unlike average flux, pulsed flux is
not uniquely defined, and we employ two separate definitions for different purposes and for different sources.
Let F (φ) be the flux of a pulse profile at phase φ, 0 ≤ φ ≤ 1, let F =∫ 1
0F (φ)dφ be the average flux, and let
Fmin = min[F (φ)] be the minimum flux. We define peak-to-peak pulsed flux as Fpulsed =∫ 1
0(F (φ)−Fmin)dφ,
and root-mean-square (RMS) flux as FRMS =[
∫ 1
0(F (φ) − F )2dφ
]1/2
. Their relative values depend upon
pulse shape. For a square wave they are equal. For a sinusoid, which is a good approximation to most
accreting pulsars, Fpulsed =√
2FRMS. Peak-to-peak pulsed flux has intuitive appeal, but it is more difficult
to measure since Fmin is harder to determine than F . We generally use peak-to-peak pulsed flux for average
spectra of many days (see Table 4), where S/N is large, and RMS flux for daily estimates, as displayed in
§ 4. Pulsed fraction is the ratio of the pulsed flux to the mean flux (pulsed + unpulsed). It is in general
energy dependent.
B.2.2. Peak-to-Peak Pulsed Spectra and Flux
Average energy spectrum and flux using CONT data
To estimate the energy spectrum of the pulsed emission we first compute the pulse count rate in each
energy channel by epoch folding ∼ 1 d of data at a time into N ∼< Pspin/τ phase bins, where τ = 2.048 s
(CONT data) or 1.024 s (DISCLA data) and Pspin is determined from overresolved power spectra or from
folding, as discussed in B.1. A running average pulse profile is constructed by aligning each day’s profile with
and adding it to the existing running sum, weighted by its exposure (area times exposure time). Alignment
is performed by maximizing the cross correlation between the daily profile and the running sum or using
the cross spectrum (see Koh et al. 1997). The end result is an average profile in each energy channel (for
DISCLA we use only channel 1). Channels with a significant detection are used for spectral fitting. Prior to
fitting the profiles are Fourier transformed and all harmonics higher than nH ∼ 6 set to zero to reduce the
counting noise (see Deeter & Boynton 1986), then inverse transformed. The rate in the minimum phase bin
is subtracted from each bin and the resulting rates averaged to obtain the pulsed count rate in each energy

82
channel.
In the following discussion we denote the intrinsic strength of the pulsar signal as s, and the amplitude
we measure as a. If the signal-to-noise is low, then the measured amplitude, a, of the pulsar signal, s, is
significantly biased by the measurement noise, n, such that 〈a〉 > s. To account for this bias and rigor-
ously estimate the measurement uncertainty we use the probability distribution of the measured amplitude
(Thomas 1969, Goodman 1985)
p(a|s, n) =2a
n2exp
[−(a2 + s2)
n2
]
I0
(
2as
n2
)
(a > 0), (B5)
where I0 is the zeroth order Bessel function of the first kind. This can be inverted to yield the probability
distribution of s (Chakrabarty 1996):
p(s|a, n) =2
n
√
1
πexp
[−(a2 + 2s2)
2n2
]
I0
(
2asn2
)
I0
(
a2
2n2
) (s > 0). (B6)
If a ≫ n, the probability distribution approaches a Gaussian with variance σ2 = n2/2. Because the noise
varies with time and energy, we determine n separately for each energy channel by averaging the power in
frequencies in the vicinity of the dominant harmonic in each of the daily power spectra of all days used to
construct the average profile.
We determine the incident spectrum by folding standard models through the detector response matrix
and varying the model parameters to fit the pulsed count rate in each energy channel. Pendleton et al.(1995)
have computed BATSE detector response matrices as a function of viewing angle, θ. The energy edges of
the CONT channels are independent of θ but vary with detector (see Figure A.1). Because a single average
profile may contain data from multiple spacecraft orientations (a typical viewing period lasts 1–2 weeks), we
compute an average response matrix and average channel edges for the spectral fitting. A photon power-
law model, dN/dE = C30(E/30 keV)−α, and an exponential (EXP) model dN/dE = C0/E exp(−E/Ef ),
provide reasonable fits to the data. In most cases the EXP model is superior.
An alternative to aligning and averaging daily profiles is to perform a long coherent fold. This is only
possible for consistently bright, non-eclipsing systems where gaps in the data are short compared with the
decoherence time scale, or where the torque history is smooth. Spectra have been constructed for 4U 1626–67
and GX 1+4 in such a way (Chakrabarty et al. 1997a, Chakrabarty et al. 1997b),
On-Peak Minus Off-Peak Pulsed Spectra and Flux
In another approach to pulsed flux estimation, 5–10d of CONT data are folded using a phase model
determined by fitting pulse phases measured using epoch-folded DISCLA data. An “on-pulse” and “off-
pulse” phase interval are chosen by eye and the average rate in the off-pulse interval subtracted from each
phase bin, yielding a rate differences in each energy channel for each phase bin.
B.2.3. Daily RMS Flux
Unlike profiles constructed from 10–200 days, daily profiles have low S/N for most sources most of the
time. Rather than attempting to fit a spectral model, we generally assume a spectral shape and determine
the normalization. Although we use an exponential model in some cases and a power law in others, daily
flux histories are not particularly sensitive to the choice of model.
83
Daily RMS flux from CONT and DISCLA data
For most sources, an RMS flux, FRMS, is estimated daily by constructing pulse profiles in flux units.
First, the average rate is subtracted from the folded profile from each detector and energy channel. Next,
each phase bin, φ, of each daily pulse profile for each exposed detector and energy channel is modeled as a
phase-dependent exponential spectrum
F (E, φ) = F0(φ)(E0/E) exp(−(E − E0)/Ef ), (B7)
where F0(φ) is the flux at E0, which depends upon phase, and where Ef is assumed independent of phase.
The e–folding energy is not adjusted in the daily fits but rather taken from longer term analysis. The flux
as a function of phase is parameterized in terms of a small number m (3–6) of Fourier amplitudes;
F0(φ) = F avg0 +
m∑
k=1
[Ak cos(2πkφ) + Bk sin(2πkφ)], (B8)
with the Fourier coefficients Ak and Bk determined in the fit. Finally, the RMS flux FRMS is determined as
FRMS =
(
0.5
m∑
k=1
[A2k + B2
k]
)1/2
. (B9)
This procedure assumes that the pulse shape is independent of energy, which is not in general true. Fluxes
in the datasets at the COSSC are determined using this procedure.
DISCLA flux using power spectra
Flux histories have been determined for 4U 1626–67 and GX 1+4 by computing 1–5d power spectra of
the x-ray light curves in DISCLA channel 1 and using the amplitude of the dominant harmonic, in both cases
the fundamental, to estimate the pulsed amplitude. The flux is determined by convolving either a power-law
or exponential model with the detector response matrix, assuming a power-law index or e–folding energy.
This technique assumes a constant spectral shape and pulse profile, and can be used with non-sinusoidal
profiles by computing a correction factor between the amplitude of the dominant harmonic and the pulsed
flux.
Frequencies and Fluxes from PSR data
PSR data were used in the analysis of GRO J1744–28 because of its short 0.467 s pulse period. As well
as data collected explicitly for GRO J1744-28, all applicable PSR data that was collected in a single-sweep
mode (with no folding on board) were used. On the ground the 20-40 keV rates from these data were divided
into intervals of ∼ 200 s. For each interval an empirical background model quadratic in time was fit to the
rates and subtracted. Then the rates in each interval were fit with at 6th order Fourier pulse model. These
(harmonically represented) profiles were then combined over ∼ 0.5 d intervals using a phase model, obtained
by bootstraping. The frequencies shown in section 4 were obtained by fitting pulse phase measurements
based on these profiles. To obtain fluxes, a conversion factor from pulsed count rate to pulsed flux was
calculated with the detector response matrices by assuming a spectral form dN/dE = AE−2 exp(−E/Efold
with Efold = 15 keV.
m
84
REFERENCES
Alpar, M. A., Ruderman, M. A., Cheng, A. F., & Shaham, J. 1982, Nature, 300, 728
Alpar, M. A. & Shaham, J. 1985, Nature, 316, 239
Anzer, U. & Borner, G. 1980, A&A, 83, 133
Aoki, T. et al. 1992, PASJ, 44, 641
Apparao, K. M. V. 1994, Space Sci.Rev., 69, 255
Arons, J. 1993, ApJ, 408, 160
Arons, J., Burnard, D., Klein, R. I., McKee, C. F., Pudritz, R. E., & Lea, S. M. 1984, in High Energy Transients in
Astrophysics, ed. S. E. Woosley, (New York: AIP), 215
Arons, J. & Lea, S. M. 1976, ApJ, 207, 914
Arons, J. & Lea, S. M. 1980, ApJ, 235, 1016
Baykal, A. & Ogelman, H. 1993, A&A, 267, 119
Baykal, A. & Swank, J. 1996, ApJ, 460, 470
Bhattacharya, D. & Srinivasan, G. 1995, in X–Ray Binaries, ed. W. H. G. Lewin, J. Van Paradijs, & E. P. J. van den
Heuvel, (Cambridge: Cambridge Univ. Press), 495
Bianchi, L. & Bernacca, P. L. 1980, A&A, 89, 214
Bildsten, L., Chakrabarty, D., Chiu, J., Finger, M. H., Grunsfeld, J. M., Koh, T., Prince, T. A., & Wilson, R. B.
1994, in Second Compton Symposium, ed. N. Gehrels C. E. Fichtel & J. P. Norris, (New York:AIP Press), 290
Blondin, J. M., Stevens, I. R., & Kallman, T. R. 1991, ApJ, 371, 684
Brandt, N. & Podsiadlowski, P. 1995, A&A, 274, 461
Chakrabarty, D. 1996. PhD thesis, California Institute of Technology
Chakrabarty, D. 1997, ApJ, submitted
Chakrabarty, D. et al. 1993, ApJ, 403, L33
Chakrabarty, D. et al. 1997a, ApJ, 474, 414
Chakrabarty, D. et al. 1997b, ApJ, 481, L101
Chakrabarty, D., Bildsten, L., Chiu, J., Grunsfeld, J. M., Koh, T., Prince, T. A., Finger, M. H., & Wilson, R. B.
1994a, in Second Compton Symposium, ed. C. E. Fichtel, N. Gehrels, & J. P. Norris, (New York: AIP), 285
Chakrabarty, D., Koh, T., Bildsten, L., Prince, T. A., Finger, M. H., Wilson, R. B., Pendleton, G. N., & Rubin,
B. C. 1995a, ApJ, 446, 826
Chakrabarty, D., Koh, T., Prince, T. A., Vaughan, B., Finger, M. H., Scatt, M., & Wilson, R. B. 1995b, IAU Circ.,
No. 6153
Chakrabarty, D., Prince, T. A., Finger, M. H., & Wilson, R. B. 1994b, IAU Circ., No. 6105
Chakrabarty, D. & Roche, P. 1997, ApJ, submitted
Chevalier, C. & Ilovaisky, S. A. 1975, IAU Circ., No. 2778
Coe, M. J. et al. 1994a, MNRAS, 270, L57
Coe, M. J. et al. 1994b, A&A, 289, 784
Coe, M. J., Carpenter, G. F., Engel, A. R., & Quenby, J. J. 1975, Nature, 256, 630
Coe, M. J., Longmore, A., Payne, B. J., & Hanson, C. G. 1988, MNRAS, 232, 865
Cohen, M. 1995, ApJ, 444, 874
Cominsky, L., Clark, G. W., Li, F., Mayer, W., & Rappaport, S. 1978, Nature, 273, 367
Cominsky, L., Roberts, M., & Finger, M. 1994, in Second Compton Symposium, ed. C. E. Fichtel, N. Gehrels, &
J. P. Norris, (New York: AIP), 294
Cook, M. C. & Page, C. G. 1987, MNRAS, 225, 381
Cook, M. C. & Warwick, R. S. 1987, MNRAS, 225, 369
85
Corbet, R. H. D. 1986, MNRAS, 220, 1047
Corbet, R. H. D., Woo, J. W., & Nagase, F. 1993, A&A, 276, 52
Crampton, D., Hutchings, J. B., & Cowley, A. P. 1978, ApJ, 225, L63
Davidsen, A., Malina, R., & Bowyer, S. 1977, ApJ, 211, 866
Davidson, K. & Ostriker, J. P. 1973, ApJ, 179, 585
Davison, P. J. N., Watson, M. G., & Pye, J. P. 1977, MNRAS, 181, 73P
de Kool, M. & Anzer, U. 1993, MNRAS, 262, 726
de Vaucouleurs, G. & Pence, W. D. 1978, AJ, 83, 1163
Dean, A. J., Lei, F., & Knight, P. J. 1991, Space Sci.Rev., 57, 109
Deeter, J. E. 1981. PhD thesis, University of Washington
Deeter, J. E. 1984, ApJ, 281, 482
Deeter, J. E. & Boynton, P. E. 1986, in Proceedings Inuyama Workshop on the Timing Studies of X-Ray Sources,
ed. S. Hayakawa & F. Nagase, (Nagoya: Nagoya University), 29
Deeter, J. E., Boynton, P. E., Lamb, F. K., & Zylstra, G. 1989, ApJ, 336, 376
Deeter, J. E., Boynton, P. E., Miyamoto, S., Kitamoto, S., Nagase, F., & Kawai, N. 1991, ApJ, 383, 324
Deeter, J. E., Boynton, P. E., & Pravdo, S. H. 1981, ApJ, 247, 1003
Deeter, J. E., Boynton, P. E., Shibazaki, N., Hayakawa, S., Nagase, F., & Sato, N. 1987, AJ, 93, 887
Dotani, T., Fujimoto, R., Nagase, F., & Inoue, H. 1995, IAU Circ., 6241
Dower, R. G., Apparao, K. M. V., Bradt, H. V., Doxsey, R. E., Jernigan, J. G., & Kulik, J. 1978, Nature, 273, 364
Doxsey, R., Bradt, H. V., Levine, A., Murthy, G. T., Rappaport, S., & Spada, G. 1973, ApJ, 182, L25
Elsner, R. F., Ghosh, P., & Lamb, F. K. 1980, ApJ, 241, L155
Elsner, R. F. & Lamb, F. K. 1977, ApJ, 215, 897
Finger, M. H. et al. 1995, IAU Circ., No. 6266
Finger, M. H., Cominsky, L. R., Wilson, R. B., Harmon, B. A., & Fishman, G. J. 1994, in The Evolution of X-ray
Binaries, ed. S. S. Holt & C. S. Day, (New York:AIP Press), 459
Finger, M. H., Koh, D. T., Nelson, R. W., Prince, T. A., Vaughan, B. A., & Wilson, R. B. 1996, Nature, 381, 291
Finger, M. H., Wilson, R. B., & Chakrabarty, D. 1996, A&AS, 120, C209
Finger, M. H., Wilson, R. B., & Fishman, G. J. 1994, in Second Compton Symposium, ed. C. E. Fichtel, N. Gehrels,
& J. P. Norris, (New York:AIP Press), 304
Finger, M. H., Wilson, R. B., & Harmon, B. A. 1996, ApJ, 459, 288
Finger, M. H., Wilson, R. B., Harmon, B. A., Fishman, G. J., Meegan, C. A., & Paciesas, W. S. 1993, in Compton
Gamma Ray Observatory, ed. M. Friedlander, N. Gehrels, & D. J. Macomb, (New York: AIP Press), 386
Finger, M. H., Wilson, R. B., Meegan, C. A., Paciesas, W. S., & Fishman, G. J. 1992, in Compton Observatory
Science Workshop, ed. C. R. Shrader, N. Gehrels, & B. Dennis, (Washington: NASA CP–3137), 185
Fishman, G. J. et al. 1989, in Proc. of the GRO Science Workshop, ed. W. N. Johnson, (Greenbelt: NASA/GSFC),
2–39
Fryxell, B. A. & Taam, R. E. 1988, ApJ, 335, 862
Ghosh, P. & Lamb, F. K. 1979, ApJ, 234, 296
Giacconi, R., Gursky, H., Kellogg, E., Levinson, R., Schreier, E., & Tananbaum, H. 1973, ApJ, 184, 227
Giacconi, R., Gursky, H., Kellogg, E., Schreier, E., & Tananbaum, H. 1971, ApJ, 167, L67
Giovannelli, F. & Graziati, L. S. 1992, Space Sci.Rev., 59, 1
Goodman, J. W. 1985, Statistical Optics, (New York: Wiley)
Gottwald, M., Steinle, H., Graser, U., & Pietsch, W. 1991, A&AS, 89, 367
Grindlay, J. E., Petro, L. D., & McClintock, J. E. 1984, ApJ, 276, 621

86
Grove, J. E. 1995, IAU Circ., No. 6239
Grove, J. E. et al. 1993, IAU Circ., No. 5838
Grove, J. E. et al. 1995, ApJ, 438, L25
Haberl, F., Pietsch, W., Motch, C., & Buckley, D. A. H. 1996, IAU Circ., 6445
Hammerschlag-Hensberge, G. et al. 1980, A&A, 85, 119
Harmon, B. A. et al. 1992, in Compton Observatory Science Workshop, ed. C. R. Shrader, N. Gehrels, & B. Dennis,
(Washington: NASA CP–3137), 69
Hayakawa, S. 1985, Physics Reports, 121, 317
Heinze, K. G. 1976, ApJS, 30, 491
Hellier, C. 1994, IAU Circ., No. 5994
Hiltner, W. A., Werner, J., & Osmer, P. 1972, ApJ, 175, L19
Horack, J. M. 1991, Development of the Burst and Transient Source Experiment (BATSE), (Washington: NASA Ref.
Pub. 1268)
Hughes, J. P. 1994, ApJ, 427, L25
Hutchings, J. B., Bernard, J. E., Crampton, D., & Cowley, A. P. 1978, ApJ, 223, 530
Hutchings, J. B., Cowley, A. P., Crampton, D., van Paradijs, J., & White, N. E. 1979, ApJ, 229, 1079
Illarionov, A. F. & Sunyaev, R. A. 1975, A&A, 39, 185
Ilovaisky, S. A., Chevalier, C., & Motch, C. 1982, A&A, 114, L7
Israel, G. L., Mereghetti, S., & Stella, L. 1994, ApJ, 433, L25
Israel, G. L., Stella, L., Angelini, L., White, N. E., & Giommi, P. 1995, IAU Circ., No. 6277
Ives, J. C., Sanford, P. W., & Bell-Burnell, S. J. 1975, Nature, 254, 578
Iwasawa, K., Koyama, K., & Halpern, J. P. 1992, PASJ, 44, 9
Johns, M., Koski, A., Canizares, C., & McClintock, J. 1978, IAU Circ., No. 3171
Johnston, S. et al. 1992, ApJ, 387, L37
Joss, P. C. & Rappaport, S. A. 1984, ARA&A, 22, 537
Kalogera, V. 1996, ApJ, 471, 352
Kaper, L., Lamers, H. J. G. L. M., Ruymaekers, E., van den Heuvel, E. P. J., & Zuiderwijk, E. J. 1995, A&A, 300,
446
Kaspi, V. M., Johnston, S., Bell, J. F., Manchester, R. N., Bailes, M., Bessell, M., Lyne, A. G., & D’Amico, N. 1994,
ApJ, 423, L43
Kelley, R. L., Apparao, K. M. V., Doxsey, R. E., Jernigan, J. G., Naranan, S., & Rappaport, S. 1981a, ApJ, 243, 251
Kelley, R. L., Rappaport, S., & Ayasli, S. 1983, ApJ, 274, 765
Kelley, R. L., Rappaport, S., Brodheim, M. J., Cominsky, L., & Strothers, R. 1981b, ApJ, 251, 630
Kelley, R. L., Rappaport, S., Clark, G. W., & Petro, L. D. 1983, ApJ, 268, 790
King, A. R., Kolb, U., & Burderi, L. 1996, ApJ, 464, L127
Koh, D. T. et al. 1997, ApJ, 479, 933
Koh, T., Chakrabarty, D., Prince, T. A., Vaughan, B. A., Zhang, S. N., Scott, M., Finger, M. H., & Wilson, R. B.
1995, IAU Circ., 6222
Konigl, A. 1991, ApJ, 370, L39
Kouveliotou, C., van Paradijs, J., Fishman, G. J., Briggs, M. S., Kommers, J., Harmon, B. A., Meegan, C. A., &
Lewin, W. H. G. 1996, Nature, 379, 799
Koyama, K. et al. 1991a, ApJ, 366, L19
Koyama, K., Kawada, M., Takeuchi, Y., Tawara, Y., Ushimaru, N., Dotani, T., & Takizawa, M. 1990a, ApJ, 356,
L47

87
Koyama, K., Kunieda, H., Takeuchi, Y., & Tawara, Y. 1990b, PASJ, 42, L59
Koyama, K., Kunieda, H., Takeuchi, Y., & Tawara, Y. 1991b, ApJ, 370, L77
Kriss, G. A., Cominsky, L. R., Remillard, R. A., Williams, G., & Thorstensen, J. R. 1983, ApJ, 266, 806
Krzeminski, W. 1974, ApJ, 192, L135
Lamb, F. K., Pethick, C. J., & Pines, D. 1973, ApJ, 184, 271
Lamb, F. K., Pines, D., & Shaham, J. 1978, ApJ, 224, 969
Lamb, F. K., Shibazaki, N., Alpar, M. A., & Shaham, J. 1985, Nature, 317, 681
Lapshov, I. Y., Drenim, V. V., Sunyaev, R. A., Brandt, S., & Lund, N. 1992, Soviet Ast. Lett., 18, 12
Levine, A., Ma, C. P., McClintock, J., Rappaport, S., van der Klis, M., & Verbunt, F. 1988, ApJ, 327, 732
Levine, A., Rappaport, S., Deeter, J. E., Boynton, P. E., & Nagase, F. 1993, ApJ, 410, 328
Levine, A., Rappaport, S., Putney, A., Corbet, R., & Nagase, F. 1991, ApJ, 381, 101
Lewin, W. H. G., Ricker, G. R., & McClintock, J. E. 1971, ApJ, 169, L17
Lovelace, R. V. E., Romanova, M. M., & Bisnovatyi-Kogan, G. S. 1995, MNRAS, 275, 244
Lund, N., Brandt, S., & Castro-Tirado, A. J. 1994, IAU Circ., No. 5448
Lyne, A. G. & Lorimer, D. R. 1994, Nature, 369, 127
Makishima, K. et al. 1988, Nature, 333, 746
Makishima, K., Kawai, N., Koyama, K., Shibazaki, N., Nagase, F., & Nakagawa, M. 1984, PASJ, 36, 679
Makishima, K., Koyama, K., Hayakawa, S., & Nagase, F. 1987, ApJ, 314, 619
McClintock, J. E. et al. 1976, ApJ, 206, L99
McClintock, J. E., Canizares, C. R., Bradt, H. V., Doxsey, R. E., Jernigan, J. G., & Hiltner, W. A. 1977, Nature,
270, 320
Mereghetti, S. & Stella, L. 1995, ApJ, 442, L17
Meurs, E. J. A. & van den Heuvel, E. P. J. 1989, A&A, 226, 88
Middleditch, J. 1976. PhD thesis, University of California, Berkeley
Middleditch, J., Mason, K. O., Nelson, J. E., & White, N. E. 1981, ApJ, 244, 1001
Middleditch, J. & Nelson, J. 1976, ApJ, 208
Mihara, T. 1995. PhD thesis, Univerisity of Tokyo
Miller, G. E. & Scalo, J. M. 1979, ApJS, 41, 513
Motch, C., Stella, L., Janot-Pacheco, E., & Mouchet, M. 1991, ApJ, 369, 490
Murakami, T., Ikegami, T., Inoue, H., & Makishima, K. 1987, PASJ, 39, 253
Nagase, F. 1989, PASJ, 41, 1
Nagase, F. et al. 1982, ApJ, 263, 814
Nagase, F., Corbet, R. H. D., Day, C. S. R., Inoue, H., Takeshima, T., Yoshida, K., & Mihara, T. 1992, ApJ, 396,
147
Ostriker, E. C. & Shu, F. H. 1995, ApJ, 447, 813
Papaloizou, J. & Pringle, J. E. 1977, MNRAS, 181, 441
Parkes, G. E., Mason, K. O., Murdin, P. G., & Culhane, J. L. 1980, MNRAS, 191, 547
Parkes, G. E., Murdin, P. G., & Mason, K. O. 1978, MNRAS, 184, 73P
Parmar, A. N., White, N. E., & Stella, L. 1989, ApJ, 338, 373
Parmar, A. N., White, N. E., Stella, L., Izzo, C., & Ferri, P. 1989, ApJ, 338, 359
Patterson, J. 1994, PASP, 106, 209
Pendleton, G. N. et al. 1995, Nucl. Instr. Methods A, 364, 567
Petre, R. & Gehrels, N. 1993, IAU Circ., No. 5877
Pravdo, S. H., Day, C. S. R., Angelini, L., Harmon, B. A., Yoshida, A., & Saraswat, P. 1995, ApJ, 454, 872
88
Preece, R. D., Pendleton, G. N., Briggs, M. S., Mallozzi, R. S., Paciesas, W. S., Band, D. L., Matteson, J. L., &
Meegan, C. A. 1997, ApJ, submitted
Priedhorsky, W. C. & Terrell, J. 1983, ApJ, 273, 709
Pringle, J. E. & Rees, M. J. 1972, A&A, 21, 1
Rappaport, S., Clark, G. W., Cominsky, L., Joss, P. C., & Li, F. 1978, ApJ, 224, L1
Rappaport, S. & Joss, P. 1977a, Nature, 266, 123
Rappaport, S. & Joss, P. 1977b, Nature, 266, 683
Rappaport, S., Joss, P. C., & McClintock, J. E. 1976, ApJ, 206, L103
Rappaport, S., Markert, T., Li, F. K., Clark, G. W., Jernigan, J. G., & McClintock, J. E. 1977, ApJ, 217, L29
Raubenheimer, B. C. 1990, A&A, 234, 172
Ravenhall, D. G. & Pethick, C. J. 1994, ApJ, 424, 846
Reynolds, A. P., Parmar, A. N., Stollberg, M. T., Verbunt, F., Roche, P., Wilson, R. B., & Finger, M. H. 1996, A&A,
312, 872
Rickard, J. 1974, ApJ, 189, L113
Rickets, M. J., Hall, R., Page, C. G., & Pounds, K. A. 1981, Space Sci.Rev., 30, 399
Rosenberg, F. D., Eyles, C. J., Skinner, G. K., & Willmore, A. P. 1975, Nature, 256, 628
Rossi, B. & Olbert, S. 1970, Introduction to the Physics of Space, (New York: McGraw-Hill)
Rubin, B. C. et al. 1994, in Evolution of X-ray Binaries, ed. S. S. Holt & C. S. Day, (New York: AIP), 455
Rubin, B. C. et al. 1996, A&AS, 120(4), C687
Rubin, B. C., Finger, M. H., Scott, D. M., & Wilson, R. B. 1997, ApJ, in press
Safi-Harb, S., Ogelman, H., & Dennerl, K. 1996, ApJ, 456, L37
Sato, N., Nagase, F., Kawai, N., Kelley, R. L., Rappaport, S., & White, N. W. 1986, ApJ, 304, 241
Sazonov, S. & Sunyaev, R. 1995, IAU Circ., No. 6272
Schmidtke, P. C., Cowley, A. P., McGrath, T. K., & Anderson, A. L. 1995, PASP, 107, 450
Schreier, E., Levinson, R., Gursky, H., Kellogg, E., Tananbaum, H., & Giacconi, R. 1972, ApJ, 172, L79
Schwentker, O. 1994, A&A, 286, L47
Scott, D. M., Finger, M. H., Wilson, R. B., Koh, D. T., Prince, T. A., Vaughan, B. A., & Chakrabarty, D. 1997,
ApJ, submitted
Scott, D. M., Finger, M. H., Wilson, R. B., & Prince, T. A. 1994, IAU Circ., No. 5990
Scott, D. M., Finger, M. H., Wilson, R. B., Prince, T. A., & Vaughan, B. 1996, IAU Circ., No. 6450
Seward, F. D., Charles, P. A., & Smale, A. P. 1986, ApJ, 305, 814
Shore, S. N., Livio, M., & van den Heuvel, E. 1994, in Interacting Binaries, ed. H. Nussbaumer & A. Orr., (Berlin:
Springer-Verlag)
Skinner, G. K. 1981, Space Sci.Rev., 30, 441
Smak, J. 1983, ApJ, 272, 234
Soong, Y., Gruber, D. E., Peterson, L. E., & Rothschild, R. E. 1990, ApJ, 348, 634
Spruit, H. C. & Taam, R. E. 1993, ApJ, 402, 593
Standish, E. M., Newhall, X. X., Williams, J. G., & Yeomans, D. K. 1992, in Explanatory Supplement to the
Astronomical Almanac, ed. P. K. Seidelmann, (Mill Valley: University Science), 279
Stella, L., White, N. E., Davelaar, J., Parmar, A. N., Blissett, R. J., & van der Klis, M. 1985, ApJ, 288, L45
Stella, L., White, N. E., & Rosner, R. 1986, ApJ, 308, 669
Stier, M. & Liller, W. 1976, ApJ, 206, 257
Stollberg, M. T. et al. 1993a, in Compton Gamma-Ray Observatory, ed. M. Friedlander, N. Gehrels, & D. J. Macomb,
(New York:AIP Press), 371

89
Stollberg, M. T., Finger, M. H., Wilson, R. B., Harmon, B. A., Rubin, B. C., Zhang, N. S., & Fishman, G. J. 1993b,
IAU Circ., No. 5836
Stollberg, M. T., Paciesas, W. S., Finger, M. H., Fishman, G. J., Wilson, R. B., Harmon, B. A., & Wilson, C. A.
1994, in The Evolution of X-ray Binaries, ed. S.S. Holt & C.S. Day, (New York; AIP Press), 255
Stollberg, M. T., Wilson, R. B., Finger, M. H., & Prince, T. A. 1996, IAU Circ., No. 6413
Strickman, M. S. et al. 1996, ApJ, 464, L131
Strohmayer, T. E. et al. 1996, ApJ, 469, L9
Taam, R. E., Fryxell, B. A., & Brown, D. A. 1988, ApJ, 331, L117
Tamura, K., Tsunemi, H., Kitamoto, S., Hayashida, K., & Nagase, F. 1992, ApJ, 389, 676
Tanaka, Y. 1993, IAU Circ., No. 5851
Tananbaum, H., Gursky, H., Kellogg, E. M., Levinson, R., Schreier, E., & Giacconi, R. 1972, ApJ, 174, L143
Tawara, Y., Yamauchi, S., Awaki, H., Kii, T., Koyama, K., & Nagase, F. 1989, PASJ, 41, 473
Thomas, J. B. 1969, Introduction to Statistical Communication Theory, (New York: Wiley)
Tjemkes, S. A., Zuiderwijk, E. J., & van Paradijs, J. 1986, A&A, 154, 77
van den Heuvel, E. P. J. & Rappaport, S. 1987a, in Physics of Be Stars, ed. A. Slettebak & T. P. Snow, (Reidel:
Dordrecht), 291
van den Heuvel, E. P. J. & Rappaport, S. 1987b, in Physics of Be Stars, (Cambridge: Cambridge Univ. Press), 291
van Kerkwijk, M. H., van Paradijs, J., Zuiderwijk, E. J., Hammerschlag-Hensberge, G., Kaper, L., & Sterken, C.
1995, A&A, 303, 483
van Paradijs, J. 1996, ApJ, 464, L139
van Paradijs, J. & McClintock, J. E. 1995, in X–Ray Binaries, ed. W. H. G. Lewin, J. Van Paradijs, & E. P. J.
van den Heuvel, (Cambridge: Cambridge Univ. Press), 58
Wang, Y. M. 1996, ApJ, 465, L111
Warner, B. 1990, Ap&SS, 164, 79
Waters, L. B. F. M. & van Kerkwijk, M. H. 1989, A & A, 223, 196
Watson, M. G., Warwick, R. S., & Ricketts, M. J. 1981, MNRAS, 195, 197
White, N. E., Mason, K. O., Huckle, H. E., Charles, P. A., & Sanford, P. W. 1976, ApJ, 209, L119
White, N. E., Nagase, F., & Parmar, A. N. 1995, in X–Ray Binaries, ed. W. H. G. Lewin, J. Van Paradijs, & E. P. J.
van den Heuvel, (Cambridge: Cambridge Univ. Press), 1
White, N. E., Parkes, G. E., Sanford, P. W., Mason, K. O., & Murdin, P. G. 1978, Nature, 274, 664
White, N. E. & Pravdo, S. H. 1979, ApJ, 233, L121
White, N. E., Swank, J. H., & Holt, S. S. 1983, ApJ, 270, 711
Wilson, C. A. et al. 1995a, IAU Circ., No. 6238
Wilson, C. A., Finger, M. H., Harmon, B. A., Scott, D. M., Wilson, R. B., Bildsten, L., Chakrabarty, D., & Prince,
T. A. 1997, ApJ, 479, 388
Wilson, C. A., Strohmayer, T., & Chakrabarty, D. 1996, IAU Circ., No. 6514
Wilson, R. B. et al. 1992, IAU Circ., No. 5454
Wilson, R. B. et al. 1994a, in Second Compton Symposium, ed. C. E. Fichtel, N. Gehrels, & J. P. Norris, (New York:
AIP), 390
Wilson, R. B. et al. 1994b, in Evolution of X-ray Binaries, ed. S. S. Holt & C. S. Day, (New York: AIP), 451
Wilson, R. B., Finger, M. H., Pendleton, G. N., Briggs, M., & Bildsten, L. 1994c, in Evolution of X-ray Binaries, ed.
S. S. Holt & C. S. Day, (New York: AIP), 475
Wilson, R. B., Finger, M. H., Pendleton, G. N., Briggs, M., & Bildsten, L. 1994d, in Second Compton Symposium,
ed. C. E. Fichtel, N. Gehrels, & J. P. Norris, (New York: AIP), 235
Wilson, R. B., Finger, M. H., & Scott, D. M. 1994, IAU Circ., No. 5999

90
Wilson, R. B., Zhang, S. N., Scott, M., Harmon, B. A., Koh, T., Chakrabarty, D., Vaughan, B., & Prince, T. A.
1995b, IAU Circ., No. 6207
Wray, J. D. 1976. PhD thesis, Northwestern University
This preprint was prepared with the AAS LATEX macros v4.0.
Related Documents


