Observation of ion waves in two-dimensional particle simulation of field-assisted plasma expansion Kartik Patel a) MDRS Laboratory, B-204-A Modular Labs, Laser and Plasma Technology Division, Bhabha Atomic Research Centre, Trombay, 400-085 Bombay, India ~Received 28 December 1995; accepted for publication 27 January 1997! We report the results of two-dimensional particle simulations ~computer experiments! of finite plasma expansion between biased plane parallel electrodes. We show that the simulation produces results consistent with the existing one-dimensional analytical model. While the plasma expansion on the low-potential side is space-charge limited, on the opposite side it is due to ambipolar diffusion. The time-dependent simulated ion current to the electrode exhibits a modulation which has not been experimentally observed. This is identified to be a consequence of the oscillation in sheath front ion density which occurs because of the ion acoustic waves generated during the expansion. This modulation, which is greater at lower ion temperatures and nonuniform with respect to the electrode surface, can be used to estimate the transient number density in the plasma. Modifications to conventional experimental detection circuits which could help in the detection of these waves are presented. © 1997 American Institute of Physics. @S0021-8979~97!05009-3# I. INTRODUCTION It is known that ion-acoustic waves are excited in a plasma by the sudden application of an external electric field. 1 One may argue, on heuristic grounds, that a similar excitation should be seen in a plasma which is suddenly created between biased electrodes. By ‘‘sudden’’ is meant that the creation time of the plasma is comparable to the period of a typical process such as electron plasma oscilla- tions. The sudden creation of a plasma in an external elec- trostatic field is common in spectroscopy experiments, where laser pulses of the order of a few nanoseconds are used to ionize the substance being probed, which is usually in the form of a particle beam. Signals are detected on biased elec- trodes placed nearby. One of the main factors which deter- mines the nature of the signal is the collective behavior of the created plasma. If ion acoustic excitations are generated, the detection circuit should record modulations in the current seen by the electrodes. Such modulations, however, have not been reported in the literature. Using the method of particle-in-cell ~PIC! plasma simulation 2,3 we have reported 4 on the evolution of a Barium plasma. It was found that the electron current flowing to the high potential electrode has two peaks. The coulomb cou- pling between the two charged species results, through am- bipolar diffusion, in a drift of the plasma towards the high potential electrode as it expands. The ion current pulse shows an oscillation during the time in which it is space- charge limited, and even later. This was linked to the exis- tence of ion-acoustic waves in the plasma and its period used to estimate the charge density at that point of time. Except for the oscillation in the ion current to the electrodes, all the other features of the behavior of the plasma in a system of this kind have been experimentally observed and cited in that paper. In one-dimensional simulations, the distribution of ions on the electrodes is not obtained. This distribution, which is of importance in plasma source ion implantation and other ion coating applications, is governed by the directional de- pendence of the current leaving the plasma. We showed by plotting particle trajectories that ions which initially move in opposite directions could actually end up at the same point on the electrode. In this article we extend the above work and study the characteristics of ion waves in an expanding plasma. We show that there is good agreement between the simulation and the existing one-dimensional analytical model. We find that cooling the ions increases the amplitude of the modula- tion in the ion current. A consequence of the expansion in two-dimensions is that the modulations have a higher signal- to-noise ratio in the central region of the electrode, a fact that can be made use of in an experiment to detect them. A one-dimensional analytical model of a semi-infinite plasma expanding in vacuum has been developed by Allen and Andrews, 5 and extended by Chen, 6 Okano, 7 and Mu- rakami and Nishihara. 8 In this model, although ion-acoustic rarefaction waves are considered in the plasma expansion, no predictions of modulations in the current to the electrodes have been made. Ogura, Kaburaki, and Shibata 9 have re- ported a hybrid two-dimensional simulation of plasma ex- pansion in gadolinium, in which some of the simulated cur- rents show a modulation, but no attempt was made to explain the reason for this occurrence. In one dimension, however, PIC simulations of the expansion of a semi-infinite plasma in vacuum, 10 and of a ion acoustic rarefaction wave in a plasma slab, 11 have been reported by Denavit. Ion acoustic traveling waves have also been reported by Friedman et al. 12 in one- dimensional PIC simulations using cold ions. In Sec. II we describe the existing analytical model. Sec- tion III describes the computational geometry, and the char- acteristics of the simulation plasma. The results are presented in Sec. IV, and discussed in Sec. V. In Sec. VI we discuss experimental matters relating to the possibility of observing a! Electronic mail: [email protected] 6622 J. Appl. Phys. 81 (10), 15 May 1997 0021-8979/97/81(10)/6622/13/$10.00 © 1997 American Institute of Physics Downloaded¬19¬Dec¬2003¬to¬203.197.42.2.¬Redistribution¬subject¬to¬AIP¬license¬or¬copyright,¬see¬http://ojps.aip.org/japo/japcr.jsp

Welcome message from author
This document is posted to help you gain knowledge. Please leave a comment to let me know what you think about it! Share it to your friends and learn new things together.
Transcript
Observation of ion waves in two-dimensional particle simulationof field-assisted plasma expansion
Kartik Patela)MDRS Laboratory, B-204-A Modular Labs, Laser and Plasma Technology Division, Bhabha AtomicResearch Centre, Trombay, 400-085 Bombay, India
~Received 28 December 1995; accepted for publication 27 January 1997!
We report the results of two-dimensional particle simulations~computer experiments! of finiteplasma expansion between biased plane parallel electrodes. We show that the simulation producesresults consistent with the existing one-dimensional analytical model. While the plasma expansionon the low-potential side is space-charge limited, on the opposite side it is due to ambipolardiffusion. The time-dependent simulated ion current to the electrode exhibits a modulation whichhas not been experimentally observed. This is identified to be a consequence of the oscillation insheath front ion density which occurs because of the ion acoustic waves generated during theexpansion. This modulation, which is greater at lower ion temperatures and nonuniform with respectto the electrode surface, can be used to estimate the transient number density in the plasma.Modifications to conventional experimental detection circuits which could help in the detection ofthese waves are presented. ©1997 American Institute of Physics.@S0021-8979~97!05009-3#
atrilanathillleedthleteoteen
thoahlseisseh
th
nsis
here-by
inoint
heWetionndula-in
nal-hat
tellen
c, noes
x-ur-lainver,ina
ing
ec-ar-ntedssing
I. INTRODUCTION
It is known that ion-acoustic waves are excited inplasma by the sudden application of an external elecfield.1 One may argue, on heuristic grounds, that a simexcitation should be seen in a plasma which is suddecreated between biased electrodes. By ‘‘sudden’’ is methat the creation time of the plasma is comparable toperiod of a typical process such as electron plasma osctions. The sudden creation of a plasma in an external etrostatic field is common in spectroscopy experiments, whlaser pulses of the order of a few nanoseconds are useionize the substance being probed, which is usually inform of a particle beam. Signals are detected on biased etrodes placed nearby. One of the main factors which demines the nature of the signal is the collective behaviorthe created plasma. If ion acoustic excitations are generathe detection circuit should record modulations in the currseen by the electrodes. Such modulations, however, havebeen reported in the literature.
Using the method of particle-in-cell~PIC! plasmasimulation2,3 we have reported4 on the evolution of a Bariumplasma. It was found that the electron current flowing tohigh potential electrode has two peaks. The coulomb cpling between the two charged species results, throughbipolar diffusion, in a drift of the plasma towards the higpotential electrode as it expands. The ion current pushows an oscillation during the time in which it is spaccharge limited, and even later. This was linked to the extence of ion-acoustic waves in the plasma and its period uto estimate the charge density at that point of time. Excfor the oscillation in the ion current to the electrodes, all tother features of the behavior of the plasma in a systemthis kind have been experimentally observed and cited inpaper.
a!Electronic mail: [email protected]
6622 J. Appl. Phys. 81 (10), 15 May 1997 0021-8979/97/8
Downloaded¬19¬Dec¬2003¬to¬203.197.42.2.¬Redistribution¬subject¬
icrlyntea-c-retoec-r-fd,tnot
eu-m-
e--edpteofat
In one-dimensional simulations, the distribution of ioon the electrodes is not obtained. This distribution, whichof importance in plasma source ion implantation and otion coating applications, is governed by the directional dpendence of the current leaving the plasma. We showedplotting particle trajectories that ions which initially moveopposite directions could actually end up at the same pon the electrode.
In this article we extend the above work and study tcharacteristics of ion waves in an expanding plasma.show that there is good agreement between the simulaand the existing one-dimensional analytical model. We fithat cooling the ions increases the amplitude of the modtion in the ion current. A consequence of the expansiontwo-dimensions is that the modulations have a higher sigto-noise ratio in the central region of the electrode, a fact tcan be made use of in an experiment to detect them.
A one-dimensional analytical model of a semi-infiniplasma expanding in vacuum has been developed by Aand Andrews,5 and extended by Chen,6 Okano,7 and Mu-rakami and Nishihara.8 In this model, although ion-acoustirarefaction waves are considered in the plasma expansionpredictions of modulations in the current to the electrodhave been made. Ogura, Kaburaki, and Shibata9 have re-ported a hybrid two-dimensional simulation of plasma epansion in gadolinium, in which some of the simulated crents show a modulation, but no attempt was made to expthe reason for this occurrence. In one dimension, howePIC simulations of the expansion of a semi-infinite plasmavacuum,10 and of a ion acoustic rarefaction wave in a plasmslab,11 have been reported by Denavit. Ion acoustic travelwaves have also been reported by Friedmanet al.12 in one-dimensional PIC simulations using cold ions.
In Sec. II we describe the existing analytical model. Stion III describes the computational geometry, and the chacteristics of the simulation plasma. The results are presein Sec. IV, and discussed in Sec. V. In Sec. VI we discuexperimental matters relating to the possibility of observ
1(10)/6622/13/$10.00 © 1997 American Institute of Physics
to¬AIP¬license¬or¬copyright,¬see¬http://ojps.aip.org/japo/japcr.jsp
on
a
av
eledithtatmstefoteulio
mcute
eesthd
emowowrgaa
aue
heth
etht
te
a
heire
he
inan
iffer-
ion-acoustic waves in the kind of plasma under investigatiWe summarize and conclude in Sec. VII.
II. ANALYTICAL MODEL
The free expansion of a semi infinite plasma intovacuum was investigated by Allen and Andrews.5 The solu-tion reveals the existence of an ion-acoustic rarefaction wpropagating back into the plasma. Widneret al.1 verified thepresence of this wave in a steady state plasma near antrode to which a high voltage pulse was suddenly appliThe behavior of a plasma between, but not in contact wbiased electrodes, was studied by Chen,6 who assumed thathe density within the plasma remained constant, and thwas always in a quasi-steady state. Since the ion sheathtion was restricted to the supersonic regime, no acouwaves were encountered in the model. While listing thefects neglected in the analysis, it was mentioned that, bethe quasi-steady state is achieved, the plasma is in a staturmoil. At the plasma boundary, the electron density woexceed the ion density for a momentary unspecified perwith the potential ‘‘[flopping] around, perhaps generatingacoustic shocks and solitons,’’ 6 until the ion distribution hassettled to form a sheath. Okano’s7 emphasis was to find howthe time required to remove all the ions from the plasdepended on parameters such as plasma density and vagap. Consequently, the sheath motion was not investigaThis was done by Murakami and Nishihara,8 who treatedseparately the supersonic and subsonic regimes of shmotion. When the sheath front moves subsonically, the dsity perturbation moves ahead of it into the plasma ararefaction wave. Though only one wave was treated inanalysis, it was noted that successive perturbations ofcreasing amplitude follow the first rarefaction wave.
No attempt was made to find the influence of the genated acoustic wave on the current flowing out of the plasThe study was restricted to the sheath which faced the lpotential electrode, towards which the ions tended to flnaturally. The Child–Langmuir expression for space-chalimited current, valid for a steady state, was assumed toply at all times during the evolution of the plasma. This wso because the sheath formation time~of the order ofvpi
21,the ion-plasma period! and the time taken for the plasmpotential to attain a steady state was assumed to be msmaller than the time required for all the ions to be removwhich, as we shall see later, is not entirely correct.
A finite plasma has two boundaries. There is anotsheath facing the high-potential electrode, towards whichelectrons flow. The phenomenon of plasma expansionqualitatively different on the two sides. The analytical moddoes not treat this sheath at all. The only recognition thatplasma is of finite extent comes from using its thicknesscalculate the time required for the sheath front to complespan the plasma and remove all the ions.
A. Semi-infinite plasma in vacuum
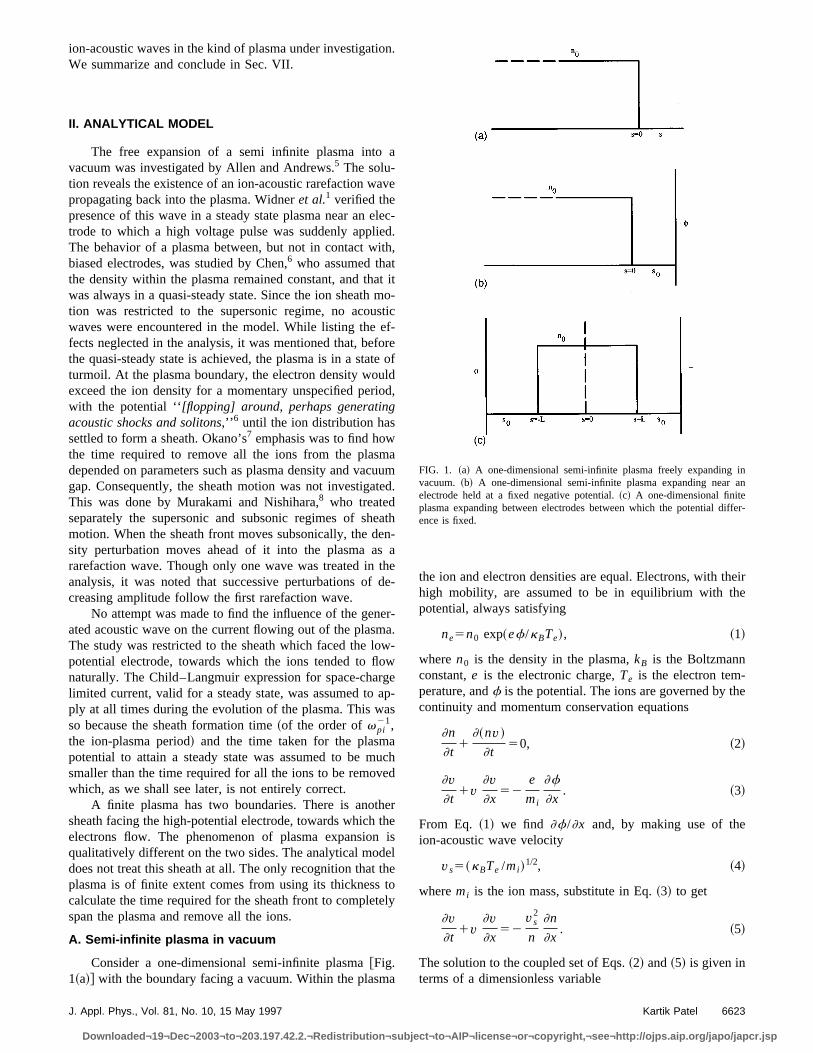
Consider a one-dimensional semi-infinite [email protected]~a!# with the boundary facing a vacuum. Within the plasm
J. Appl. Phys., Vol. 81, No. 10, 15 May 1997
Downloaded¬19¬Dec¬2003¬to¬203.197.42.2.¬Redistribution¬subject¬
.
e
ec-.,
ito-icf-reofdd,
aumd.
athn-aee-
r-a.-
ep-s
chd
reisleoly
the ion and electron densities are equal. Electrons, with thigh mobility, are assumed to be in equilibrium with thpotential, always satisfying
ne5n0 exp~ef/kBTe!, ~1!
wheren0 is the density in the plasma,kB is the Boltzmannconstant,e is the electronic charge,Te is the electron tem-perature, andf is the potential. The ions are governed by tcontinuity and momentum conservation equations
]n
]t1
]~nv !
]t50, ~2!
]v]t
1v]v]x
52e
mi
]f
]x. ~3!
From Eq. ~1! we find ]f/]x and, by making use of theion-acoustic wave velocity
vs5~kBTe /mi !1/2, ~4!
wheremi is the ion mass, substitute in Eq.~3! to get
]v]t
1v]v]x
52vs2
n
]n
]x. ~5!
The solution to the coupled set of Eqs.~2! and~5! is given interms of a dimensionless variable
FIG. 1. ~a! A one-dimensional semi-infinite plasma freely expandingvacuum. ~b! A one-dimensional semi-infinite plasma expanding nearelectrode held at a fixed negative potential.~c! A one-dimensional finiteplasma expanding between electrodes between which the potential dence is fixed.
6623Kartik Patel
to¬AIP¬license¬or¬copyright,¬see¬http://ojps.aip.org/japo/japcr.jsp
ry
teo
iseat fl
ge,dtheled
ux
y
cethetheof
thetheselfif-
t
ath-
y
-oni-ead
na
oues
tEqio
j5s
vst. ~6!
Heres is the position coordinate from the plasma boundawheres 5 0. The ion density is
n5n0 exp~12j! ~7!
and the ion velocityv is
v/vs5~12j!. ~8!
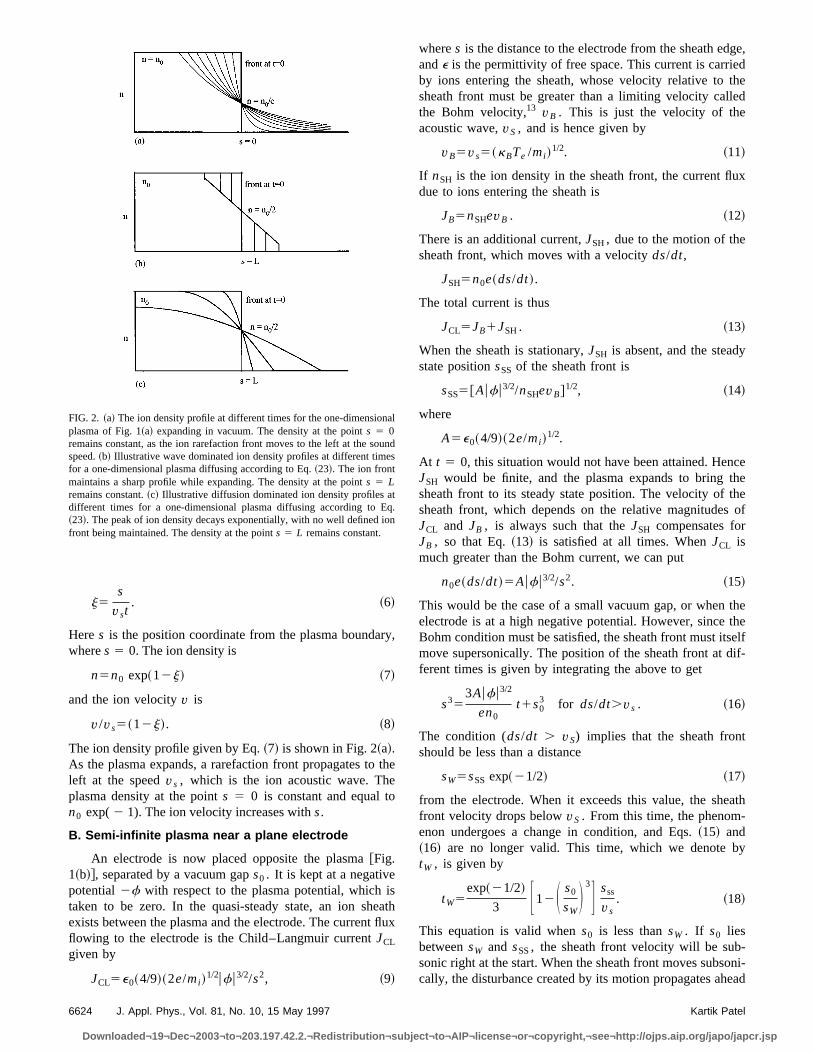
The ion density profile given by Eq.~7! is shown in Fig. 2~a!.As the plasma expands, a rarefaction front propagates toleft at the speedvs , which is the ion acoustic wave. Thplasma density at the points 5 0 is constant and equal tn0 exp(2 1). The ion velocity increases withs.
B. Semi-infinite plasma near a plane electrode
An electrode is now placed opposite the [email protected]~b!#, separated by a vacuum gaps0 . It is kept at a negativepotential2f with respect to the plasma potential, whichtaken to be zero. In the quasi-steady state, an ion shexists between the plasma and the electrode. The currenflowing to the electrode is the Child–Langmuir currentJCLgiven by
JCL5e0~4/9!~2e/mi !1/2ufu3/2/s2, ~9!
FIG. 2. ~a! The ion density profile at different times for the one-dimensioplasma of Fig. 1~a! expanding in vacuum. The density at the points 5 0remains constant, as the ion rarefaction front moves to the left at the sspeed.~b! Illustrative wave dominated ion density profiles at different timfor a one-dimensional plasma diffusing according to Eq.~23!. The ion frontmaintains a sharp profile while expanding. The density at the points 5 Lremains constant.~c! Illustrative diffusion dominated ion density profiles adifferent times for a one-dimensional plasma diffusing according to~23!. The peak of ion density decays exponentially, with no well definedfront being maintained. The density at the points 5 L remains constant.
6624 J. Appl. Phys., Vol. 81, No. 10, 15 May 1997
Downloaded¬19¬Dec¬2003¬to¬203.197.42.2.¬Redistribution¬subject¬
,
he
thux
wheres is the distance to the electrode from the sheath edande is the permittivity of free space. This current is carrieby ions entering the sheath, whose velocity relative tosheath front must be greater than a limiting velocity calthe Bohm velocity,13 vB . This is just the velocity of theacoustic wave,vS , and is hence given by
vB5vs5~kBTe /mi !1/2. ~11!
If nSH is the ion density in the sheath front, the current fldue to ions entering the sheath is
JB5nSHevB . ~12!
There is an additional current,JSH, due to the motion of thesheath front, which moves with a velocityds/dt,
JSH5n0e~ds/dt!.
The total current is thus
JCL5JB1JSH. ~13!
When the sheath is stationary,JSH is absent, and the steadstate positionsSS of the sheath front is
sSS5@Aufu3/2/nSHevB#1/2, ~14!
where
A5e0~4/9!~2e/mi !1/2.
At t 5 0, this situation would not have been attained. HenJSH would be finite, and the plasma expands to bringsheath front to its steady state position. The velocity ofsheath front, which depends on the relative magnitudesJCL and JB , is always such that theJSH compensates forJB , so that Eq.~13! is satisfied at all times. WhenJCL ismuch greater than the Bohm current, we can put
n0e~ds/dt!5Aufu3/2/s2. ~15!
This would be the case of a small vacuum gap, or whenelectrode is at a high negative potential. However, sinceBohm condition must be satisfied, the sheath front must itmove supersonically. The position of the sheath front at dferent times is given by integrating the above to get
s353Aufu3/2
en0t1s0
3 for ds/dt.vs . ~16!
The condition (ds/dt . vS) implies that the sheath fronshould be less than a distance
sW5sSS exp~21/2! ~17!
from the electrode. When it exceeds this value, the shefront velocity drops belowvS . From this time, the phenomenon undergoes a change in condition, and Eqs.~15! and~16! are no longer valid. This time, which we denote btW , is given by
tW5exp~21/2!
3 F12S s0sWD 3G sssvs . ~18!
This equation is valid whens0 is less thansW . If s0 liesbetweensW and sSS, the sheath front velocity will be subsonic right at the start. When the sheath front moves subscally, the disturbance created by its motion propagates ah
l
nd
.n
Kartik Patel
to¬AIP¬license¬or¬copyright,¬see¬http://ojps.aip.org/japo/japcr.jsp
o
ap-
a
atl-
h
rg
than
re
isnesmh
a-
te
er-
th
aThbe
ponmo
hattheheumer at-
nd-defi-theof
e, a
Inintoen is
lar
d
e-unc-n
of it into the plasma as an acoustic wave. The solutionAllen and Andrews from Sec. II A@Eqs.~7! and~8!# can bethus be used to calculate the current, which is
JCL5n0e@exp~12j!#@~ds/dt!2vs~12j!#. ~19!
j now reflects the time and position at which the wavepears. Equation~19! is a sum of the current fluxes represented by the motion of the sheath front (ds/dt) and therarefaction wave, with the density represented by Eq.~7!.This expression can be used to get the dependence ofs ont for later times, thus
s5~Aufu3/2!21/2$n0e@exp~12j!#@~ds/dt!
2vs~12j!#%21/2. ~20!
The sheath front itself continues to move, but with decreing velocity until it reaches the value given by Eq.~14!, atwhich point it stops moving, having reached the steady stEquations~16! and ~20! predict that the sheath front wilmove in opposite directions att 5 0, depending on the relative values ofs0 and sSS. For s0 less thansSS, the sheathfront moves away from the electrode, and vice versa. Tbehavior follows the assumption thatn0 is constant. In afinite plasma the ion density starts reducing as the chaare collected by the electrode. Due to the reduction inn0 andconsequentlynSH, the steady state position of the sheafront sSS continues to increase along with the plasma expsion.
For a finite thickness plasma, the time required tomove all the ions is given by integratingJCL over a timetC , which represents complete removal of all the ions. Theffectively, is the time of travel of the sheath front from oend of the plasma to the other, assuming that the pladensity remains constant while the sheath moves, whicnot the case for a real situation. This time is given by
E0
tcJCLdt5n0eL ~21!
and depends onn0 /ufu3/2, as well as the electron temperture, because of the presence ofvS in Eq. ~19!. A plasmawith a higher electron temperature will decay faster.When the sheath front becomes stationary, the steady staattained. The rarefaction wave launched at timetW penetratesfurther into the plasma, and the ion density everywhequalizes at the value ofn0 exp(2 1). The current that continues to flow into the electrode is given byJB .
C. Finite plasma between plane electrodes
A second electrode is placed on the other side ofplasma@Fig. 1~c!#, which is of thickness 2L, with equalvacuum gapss0 on both sides. A potential differencef ex-ists between the electrodes. The electrode on the left ishigher potential, and this side is called the potential side.opposite electrode, which is at a lower potential, willcalled the ground side.
The plasma reacts to the external field by raising itstential to a value slightly higher than that of the high potetial electrode. The potential drop appears on the plasboundary which faces the ground side. The electric field
J. Appl. Phys., Vol. 81, No. 10, 15 May 1997
Downloaded¬19¬Dec¬2003¬to¬203.197.42.2.¬Redistribution¬subject¬
f
-
s-
e.
is
es
-
-
,
ais
is
e
e
t ae
--an
the potential side is reduced to a low value. Assuming tthe plasma evolves independently on the two sides,boundary facing the ground side will be governed by tequations described in the last section. We shall also assthat the system is in a quasi-steady state, and focus outention on the plasma motion on the potential side.
The low potential difference between the plasma bouary on the potential side and the high potential electroallows energetic electrons to travel to the electrode. Thenite electron density between the plasma boundary andelectrode would lower the potential here in the absenceions. Since it remains constant there must be, thereforconstant flow of ions into this region.
The ion current is sustained by the small electric field.the quasi-steady state, it results in a diffusion of chargesan ~almost! field free region from the boundary of thplasma. The equation which describes this phenomenothat of a decaying wave with superimposed diffusion14,15
¹2n51
vs2
]2n
]t21
1
DA
]n
]t, ~22!
whereDA is the ambipolar diffusion coefficient, andn theion density. The solution to Eq.~22! is given in terms ofmodified Bessel functions for the case of a rectanguplasma slab of thickness 2L @illustrative curves are given inFigs. 2~b! and 2~c!#. The densityn(s,t) is expressed by
n~s,t !50, for s2vst.L, ~23a!
n~s,t !5n0 , for 0<s<L,s1vst<L, ~23b!
n~s,t !5 12n0@ I 0~2Ac1c2!12J1~c1 ,c2!#
3exp~2u2t/2DA! for L<s1vst,2L<s2vst,
~23c!
n~s,t !5 12n0@ I 0~2Ac1c2!2I 0~2Ac18c28!
12J1~c1 ,c2!22J1~c18 ,c28!#exp~2u2t/2DA!
for s2vst,2L, ~23d!
whereI 0 is the modified Bessel function of the first kind anorder zero and
c15u
2DA~L2s1vst !,
c25u
2DA~s2L1vst !,
~24!
c185u
2DA~vst2L2s!,
c285u
2DA~vst1L1s!,
J1~a,b!5exp~a!E0
s
exp~2h!I 0@2~bh!1/2#dh.
The solution is a product of an exponentially varying timdependent part, and a space dependent part which is a ftion of I 0 and J1 . The solution is expressed differently i
6625Kartik Patel
to¬AIP¬license¬or¬copyright,¬see¬http://ojps.aip.org/japo/japcr.jsp
a
osthis
oth-enc
an
2e
ni
ntheishhn
ioeo
heolonhexnktsm
rldhrole
eldthe
ichtheim-lveatedionsfu-heheed.iont in
tosedtionne-ode
on1hich0 Vhecm
tthe.
itial
rodeand
rodes are
different regions. At any timet, the distance covered bydisturbance traveling with the speedvs is vst. A point whichlies beyond this distance as measured from the initial ption of the plasma boundary has not yet been effected bydisturbance. At this point, the ion density is zero if itoutside the plasma@Eq. ~23a!#, and is equal ton0 if it isinside the plasma@Eq. ~23b!#. If the point is within the dis-tancevst of L, then the density is given by Eq.~23c! if it iswithin the initial plasma region, and by Eq.~23d! if outside.The variation of density with time and position dependsthe relative magnitudes of the first and second terms onright hand side of Eq.~22!, which are governed by a dimensionless parametervsL/DA . When this is less than unity, thexpansion is ‘‘wave-dominated’’; otherwise it is ‘‘diffusiodominated.’’ The evolution of the density profile for specifibut arbitrary times in each case is illustrated in Figs. 2~b! and2~c!, respectively. These figures are not exact solutionshave been adapted from Shimony and Cahn,14 where numeri-cally evaluated solutions have been presented. In Fig.~b!the initial rectangular profile maintains its shape. The wdefined ion front moves with the velocityvs . In Fig. 2~c!, onthe other hand, the profile loses its initial shape. There issharp ion front, but only a central peak which reducesmagnitude with time. There is a definite position,s 5 L,where the density is constant and equal ton0/2, n0 being theinitial density.
D. Integrated picture
The discussions above can be combined to give an igrated picture of the evolution of the plasma. Initially, tcharges react to screen out the external field, and establquasi-steady state. On the ground side the ion sheatformed and the space-charge limited current flows. Tsheath front here moves according to the equations presein Sec. II B. Ifs0 is greater thansw at t 5 0, then the rarefac-tion wave is generated right at the start itself, otherwiseacoustic waves are generated when the velocity of the shfront, initially supersonic, becomes subsonic. A specific psition exists where the sheath comes to a standstill.
The evolution on the potential side is different. Here, texpansion expresses itself in terms of a field-free ambipdiffusion of both electrons and ions. There is no ion frontthe potential side if diffusion dominates, otherwise tplasma maintains its initial profile as it expands. If the epansion is wave-dominated, there is a well defined ion frowhich moves with a velocityvs . In both cases the peadensity decays exponentially. The ion current depends onelectron temperature on both the sides, and the plashould decay faster at higher electron temperatures.
E. Effects neglected by the analytical model
During the initial period leading to the quasi-steady theexists, as noted by Chen,6 a state of turmoil. The modeneglects this period and assumes that the field is createt 5 0, whereas in fact it takes some time to be built up. Tpotential between the plasma and the high potential electoscillates. Due to this, after the primary response of the e
6626 J. Appl. Phys., Vol. 81, No. 10, 15 May 1997
Downloaded¬19¬Dec¬2003¬to¬203.197.42.2.¬Redistribution¬subject¬
i-is
ne
d
ll
on
e-
h aiseted
nath-
ar
-t,
hea
e
atedec-
trons, the ions on the potential side momentarily see a fiwhich pulls them out of the plasma even as the ions onground side move out.
It is assumed that the ion density remains constant whis never the case. Due to the reduction in ion density,sheath front never truly stops moving. It is assumed, to splify the analysis, that the two sides of the plasma evoindependently. However, when the acoustic wave generon the ground side reaches the potential side, the conditof expansion there should be affected. Similarly, the difsion of ions results in a drift of the plasma away from tground side. This drift leads to a gradual reduction in tvalue of the Child–Langmuir current, and is not consider
The reduction in ion density is also due to the expansin the orthogonal direction, an aspect which does not existhe one dimensional model at all.
III. SIMULATION
A fully kinetic, two-dimensional PIC code was usedsimulate a finite, transient plasma placed between biaplane parallel electrodes. The electrostatic approximawas used throughout. Interparticle binary collisions wereglected and no external magnetic field was applied. The cused in the simulation has been described elsewhere.16
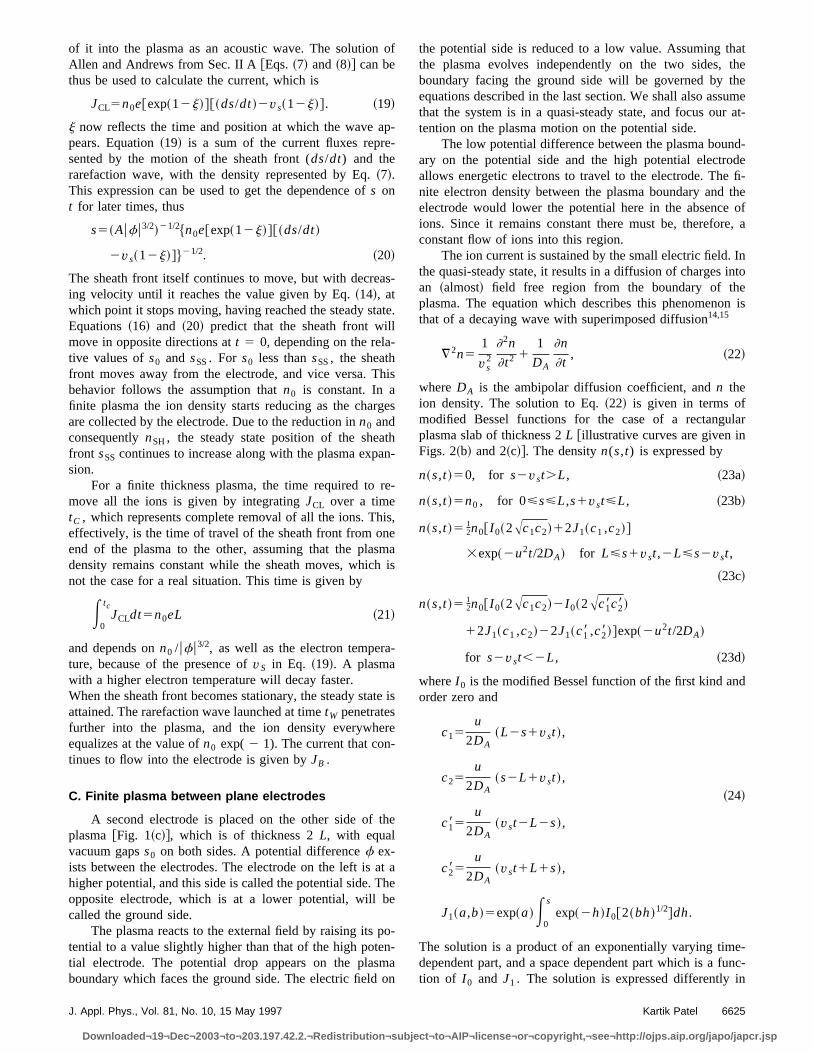
Figure 3 shows the computational box, of dimensi4 cm310 cm, used in the simulation. The mesh size ismm. Lines near the boundaries represent electrodes on wthe potentials are applied. The left electrode is held at 30~1 statvolt!, and the opposite electrode is kept at 0 V. Tboundaries are kept at 0 V. The square plasma of side 1is created in the center. It is seeded with 13 105 positiveparticles, and an equal number of negative particles. At5 0 the particles are assigned random positions withinplasma, with the distribution being approximately uniform
FIG. 3. The computational box, showing the electrodes and the inplasma position. The dimensions are 4 cm~horizontal, labeledX! and 10 cm~vertical, labeledY!. The left electrode is held at 300 V~1 statvolt!, and theright electrode as well as the boundaries are kept at 0 V. The electseparation is 3.8 cm. The plasma is initially square with side 1 cmpositioned in the center. The line A-A8 marks the region along which theplasma parameters are monitored during the simulation. The right electis divided into five zones, named as indicated, where the partial currentrecorded.
Kartik Patel
to¬AIP¬license¬or¬copyright,¬see¬http://ojps.aip.org/japo/japcr.jsp
isnteescleld
thhitelsTthsr
esinpeioruab
aaeinits
anf
n
hisns
ortresos-de
ingesen
desers,apa-spe-
n
thein-heria-n-
e00
t
The positive and negative particles have identical initial dtributions. This does not mimic the distribution of ions geerated by a laser beam, which typically has a greater insity in its center than in the periphery, but it enablcomparison with the model presented above. The partiare assigned a random velocity distribution which closapproximates a Gaussian by using a simple techniquescribed in Hammersley and Handscomb.17 The line markedA-A 8 passes through the center of the initial position ofplasma. During the run the potential distribution along tline is sampled and stored. Physical variables such as potial and ion and electron densities within the box are asampled at regular time intervals and stored separately.electrodes are divided into five zones, as indicated infigure. The program tracks particles landing within thezones and stores this data. All data are processed afteprogram terminates.
Table I lists the plasma and simulation parameters usEach computer experiment consists of a program run uone set of parameters represented by ion mass, ion temture, electron temperature, and charge density. A smallmass was used in order to reduce the duration of eachThis enabled many runs to be completed within a reasontime. Though we have used several sets of ion masses~equalto that of 1, 10, 100, and 1000 electrons!, charge densities~initial charge densities used were 13 109, 2 3 109, 33 109, 43 109, 53 109, and63 109 cm23!andelectronandion temperatures, the sheer size of the data generated mit impractical to include the results obtained for all the prameter sets. We have, therefore, chosen a representativfairly complete subset, consisting of results obtained usan ion mass of 100 and 1000 times the electron mass, incharge density of 63 109 cm23; and electron temperatureof 1.1 and 11 eV~13 086 and 130 860 K, respectively!. Thereason for the seemingly odd values ofTe andTi is givenbelow. The results presented are not a special case.
For the case of ion mass equal to 100 electronselectron temperature kept at 1.1 eV, we present resultstwo different ion temperatures, namely,Ti 5 Te/4 ~case A!,Ti 5 Te ~case B!. In these runs the ions were assigned ide
TABLE I. Program input parameters.
Charge density 6.03109 cm23
Ion mass 100 and 1000 times electron massPlasma size Square of side 1 cmElectrode separation 3.8 cmElectrode potential difference 300 V~1 esu!Magnetic field 0 GNumber of particles 13 105 particles of each signTimestep(5 0.2/vpe) 4.58310211 sElectron and ion temperatures used in different runs for ion mass 100:Case A Te5 1.1 eVandTi 5 Te/4Case B Te5 1.1 eVandTi 5 TeCase C Te 5 11 eV andTi is same ion tem-
perature as case ACase D Te5 0.36 eVandTi(y) 5 Te/4,Ti(x)
5Ti(y)/25Electron and ion temperatures for ion mass 1000:Case E Te5 0.39 eVandTi(y) 5 Te/4,Ti(x)
5Ti(y)/25
J. Appl. Phys., Vol. 81, No. 10, 15 May 1997
Downloaded¬19¬Dec¬2003¬to¬203.197.42.2.¬Redistribution¬subject¬
--n-
esye-
esn-oheeethe
d.gra-nn.le
kes-butgial
dor
-
tical velocity distributions in both theX and Y directions.For the case of electron temperature equal to 11 eV~case C!,the ion temperature was kept the same as for case A. Tenables a comparison between two otherwise identical ruat different electron temperatures.
For reasons discussed in detail later in Sec. V, we repa run with a plasma having electron and ion temperatucorresponding to what is produced in a typical laser spectrcopy experiment.Te is assigned a much lower value andifferent velocity distributions are assigned to the ions in thX andY directions~case D!. With Te kept at 0.36 eV~4250K!, Ti(y) was set toTe/4 andTi(x) to Ti(y)/25.
The temperature of the species was varied by changthe velocity distribution of the particles. The temperaturwere determined by generating the distribution first, and thfitting the Gaussian
f ~v !5S m
2pkBTD 3/2 exp~2v2/v th
2 ! ~25!
to the data. In the abovev th is the thermal velocity given by(2kBT/m)
1/2, andm andT represent the species mass antemperature, respectively. Since the distribution of velocitiis dependent upon the generation of pseudorandom numbit is impossible to create a distribution corresponding toprespecified, exact value of temperature. From the fittedrameters we have calculated the temperatures of eachcies. This is the reason why the values ofTe andTi in elec-tron volts are not exact integers.
We report an additional run of plasma expansion with aion mass equal to 1000 electrons~case E!, and the otherparameters the same as in case D. This is to verify thatresults do not change qualitatively when the mass iscreased. There is a slight, but insignificant, difference in telectron and ion temperatures for case E. This is due to vations in the velocity distribution generated using pseudoradom numbers.
IV. RESULTS
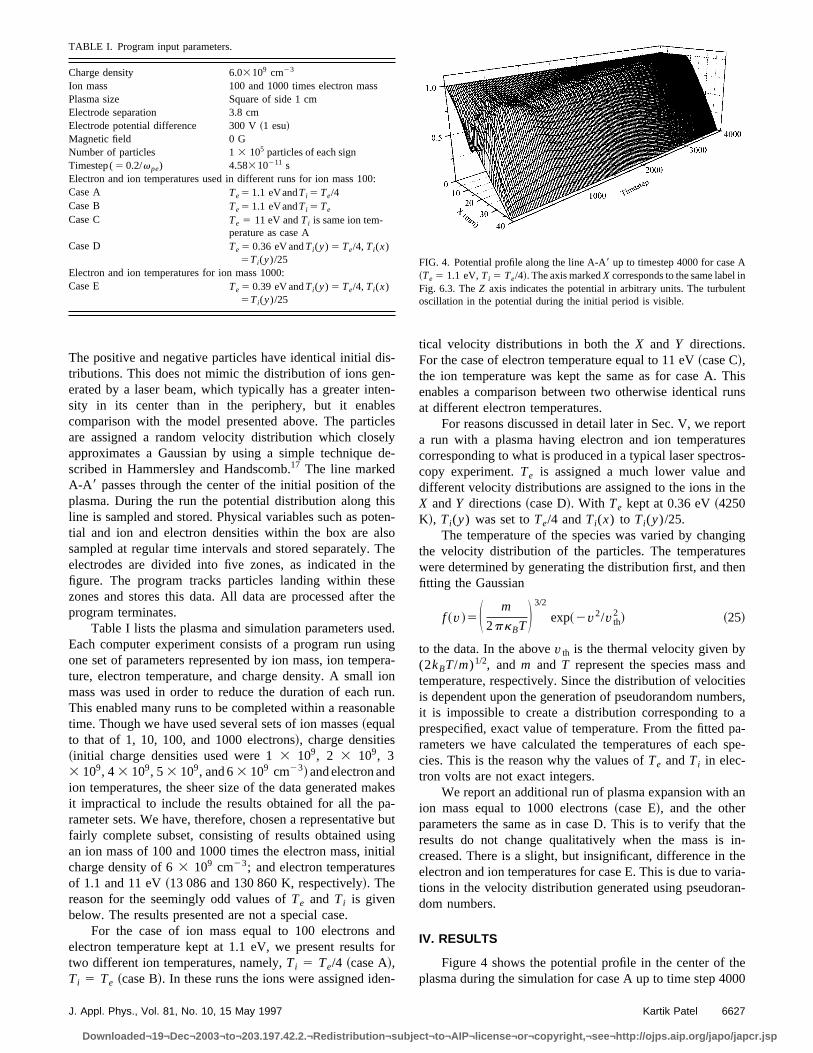
Figure 4 shows the potential profile in the center of thplasma during the simulation for case A up to time step 40
FIG. 4. Potential profile along the line A-A8 up to timestep 4000 for case A~Te 5 1.1 eV,Ti 5 Te/4!. The axismarkedX corresponds to the same label inFig. 6.3. TheZ axis indicates the potential in arbitrary units. The turbulenoscillation in the potential during the initial period is visible.
6627Kartik Patel
to¬AIP¬license¬or¬copyright,¬see¬http://ojps.aip.org/japo/japcr.jsp
Ihte3
-
58
-
r
or
onom
o
(1.83 1027 s). The behavior for the other cases is similar.depicts the variation in the interelectrode potential in tinitial stages, before the space-charge electric field is creaThe axis markedX corresponds to the same label in Fig.The other horizontal axis is in time steps. TheZ axis showsthe potential.
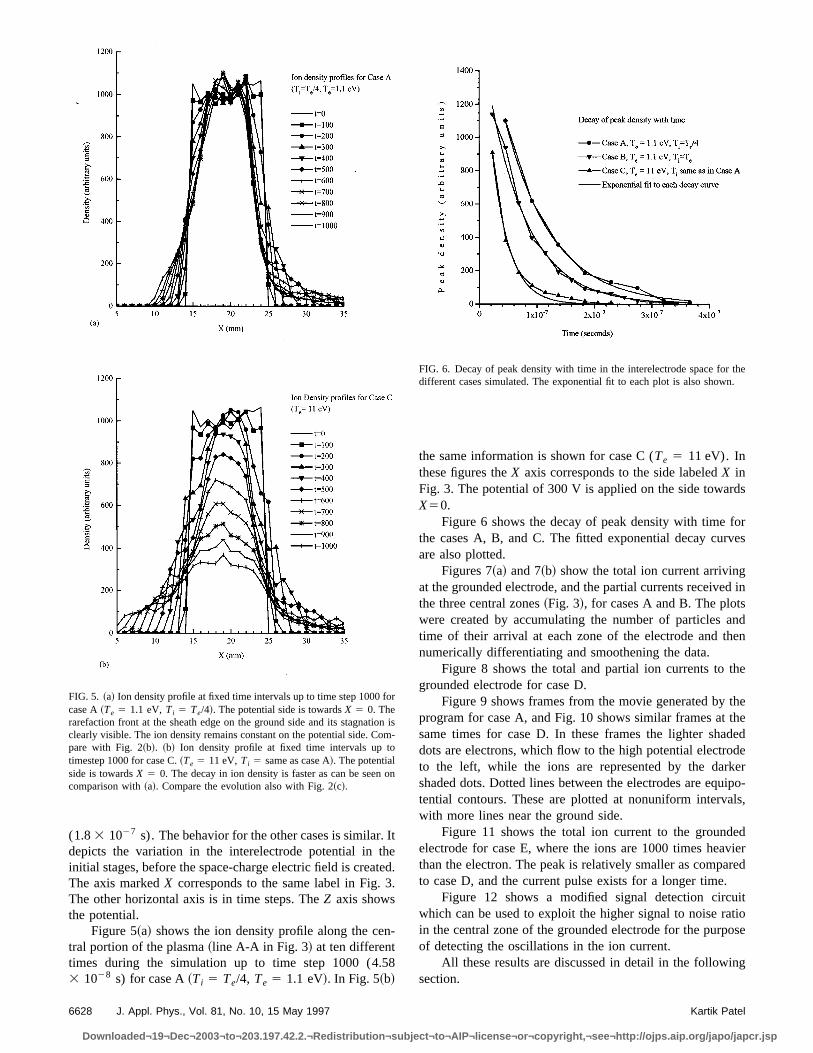
Figure 5~a! shows the ion density profile along the central portion of the plasma~line A-A in Fig. 3! at ten differenttimes during the simulation up to time step 1000 (4.3 1028 s) for case A~Ti 5 Te/4, Te 5 1.1 eV!. In Fig. 5~b!
FIG. 5. ~a! Ion density profile at fixed time intervals up to time step 1000 fcase A~Te 5 1.1 eV,Ti 5 Te/4!. The potential side is towardsX 5 0. Therarefaction front at the sheath edge on the ground side and its stagnaticlearly visible. The ion density remains constant on the potential side. Cpare with Fig. 2~b!. ~b! Ion density profile at fixed time intervals up totimestep 1000 for case C.~Te 5 11 eV,Ti 5 same as case A!. The potentialside is towardsX 5 0. The decay in ion density is faster as can be seencomparison with~a!. Compare the evolution also with Fig. 2~c!.
6628 J. Appl. Phys., Vol. 81, No. 10, 15 May 1997
Downloaded¬19¬Dec¬2003¬to¬203.197.42.2.¬Redistribution¬subject¬
ted..
the same information is shown for case C (Te 5 11 eV). Inthese figures theX axis corresponds to the side labeledX inFig. 3. The potential of 300 V is applied on the side towardsX50.
Figure 6 shows the decay of peak density with time forthe cases A, B, and C. The fitted exponential decay curvesare also plotted.
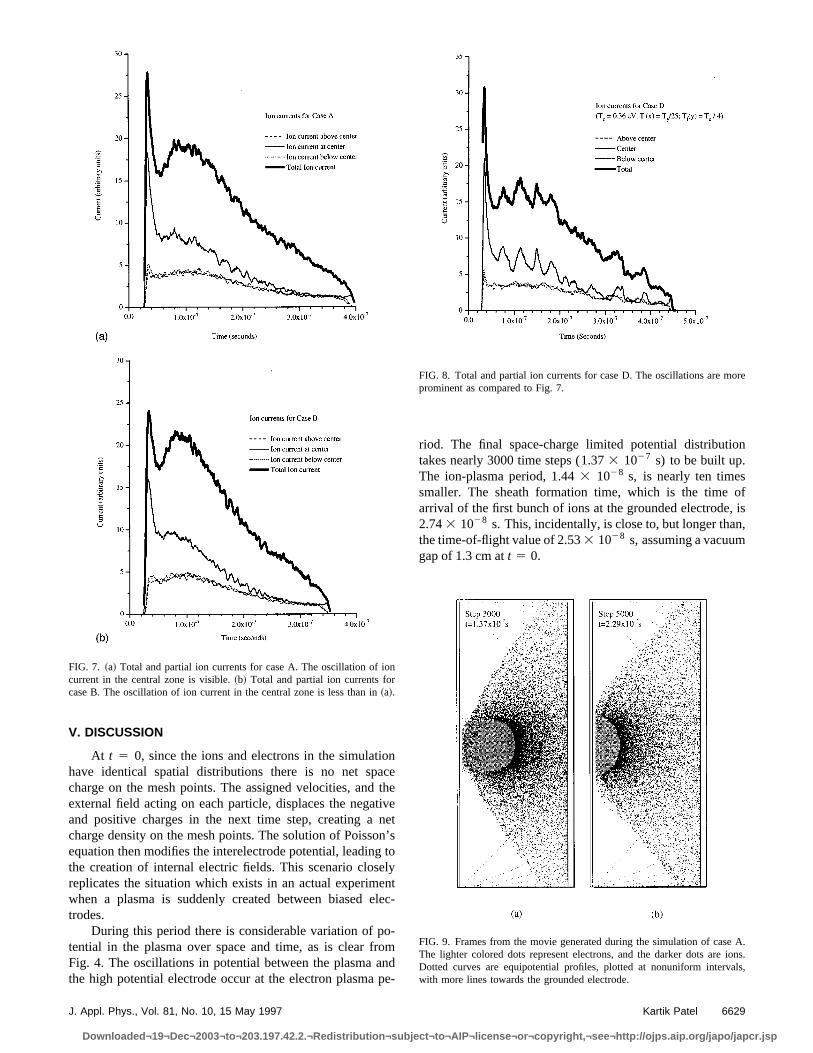
Figures 7~a! and 7~b! show the total ion current arrivingat the grounded electrode, and the partial currents received inthe three central zones~Fig. 3!, for cases A and B. The plotswere created by accumulating the number of particles andtime of their arrival at each zone of the electrode and thennumerically differentiating and smoothening the data.
Figure 8 shows the total and partial ion currents to thegrounded electrode for case D.
Figure 9 shows frames from the movie generated by theprogram for case A, and Fig. 10 shows similar frames at thesame times for case D. In these frames the lighter shadeddots are electrons, which flow to the high potential electrodeto the left, while the ions are represented by the darkershaded dots. Dotted lines between the electrodes are equipotential contours. These are plotted at nonuniform intervals,with more lines near the ground side.
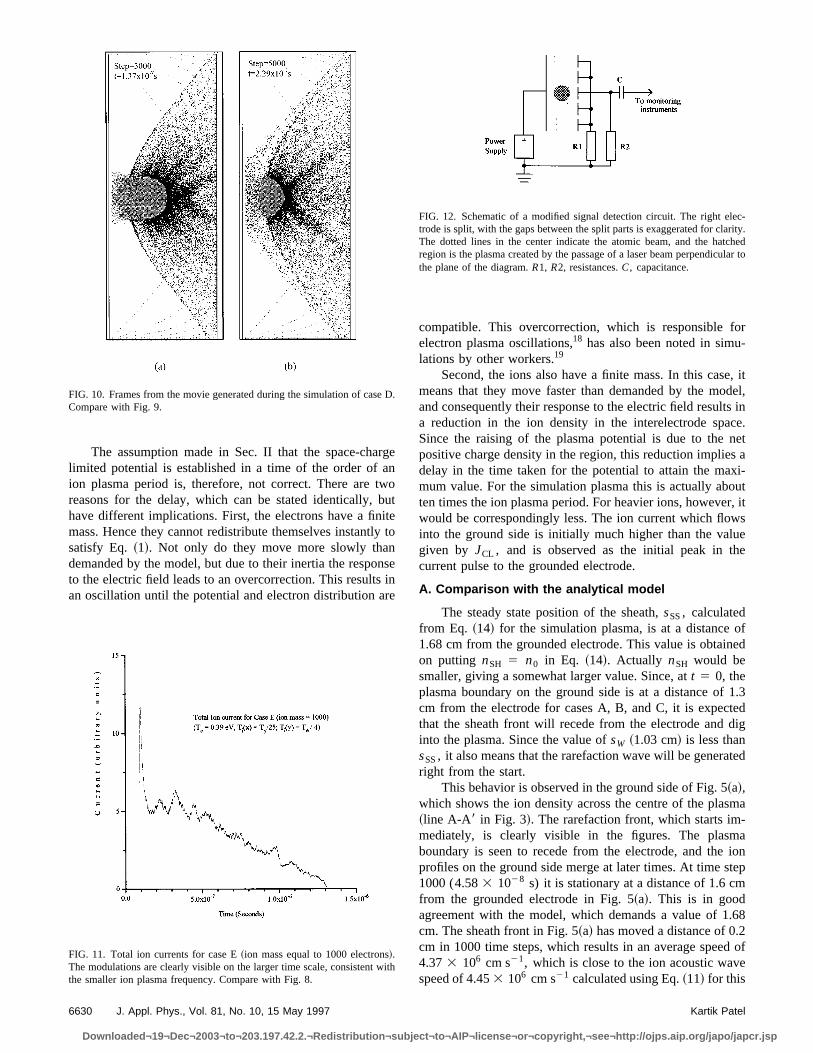
Figure 11 shows the total ion current to the groundedelectrode for case E, where the ions are 1000 times heaviethan the electron. The peak is relatively smaller as comparedto case D, and the current pulse exists for a longer time.
Figure 12 shows a modified signal detection circuitwhich can be used to exploit the higher signal to noise ratioin the central zone of the grounded electrode for the purposeof detecting the oscillations in the ion current.
All these results are discussed in detail in the followingsection.
is-
n
FIG. 6. Decay of peak density with time in the interelectrode space for thedifferent cases simulated. The exponential fit to each plot is also shown.
Kartik Patel
to¬AIP¬license¬or¬copyright,¬see¬http://ojps.aip.org/japo/japcr.jsp
onacttinongeleele
oroanp
n
fis,
on
re
A.ons.ls,
V. DISCUSSION
At t 5 0, since the ions and electrons in the simulatihave identical spatial distributions there is no net spcharge on the mesh points. The assigned velocities, andexternal field acting on each particle, displaces the negaand positive charges in the next time step, creating acharge density on the mesh points. The solution of Poissequation then modifies the interelectrode potential, leadinthe creation of internal electric fields. This scenario closreplicates the situation which exists in an actual experimwhen a plasma is suddenly created between biasedtrodes.
During this period there is considerable variation of ptential in the plasma over space and time, as is clear fFig. 4. The oscillations in potential between the plasmathe high potential electrode occur at the electron plasma
FIG. 7. ~a! Total and partial ion currents for case A. The oscillation of icurrent in the central zone is visible.~b! Total and partial ion currents forcase B. The oscillation of ion current in the central zone is less than in~a!.
J. Appl. Phys., Vol. 81, No. 10, 15 May 1997
Downloaded¬19¬Dec¬2003¬to¬203.197.42.2.¬Redistribution¬subject¬
eheveet’stoyntc-
-mde-
riod. The final space-charge limited potential distributiotakes nearly 3000 time steps (1.373 1027 s) to be built up.The ion-plasma period, 1.443 1028 s, is nearly ten timessmaller. The sheath formation time, which is the time oarrival of the first bunch of ions at the grounded electrode,2.743 1028 s. This, incidentally, is close to, but longer thanthe time-of-flight value of 2.533 1028 s, assuming a vacuumgap of 1.3 cm att 5 0.
FIG. 8. Total and partial ion currents for case D. The oscillations are moprominent as compared to Fig. 7.
FIG. 9. Frames from the movie generated during the simulation of caseThe lighter colored dots represent electrons, and the darker dots are iDotted curves are equipotential profiles, plotted at nonuniform intervawith more lines towards the grounded electrode.
6629Kartik Patel
to¬AIP¬license¬or¬copyright,¬see¬http://ojps.aip.org/japo/japcr.jsp
rantwbitlynnire
for-
e, itdel,ts ince.nets axi-outr, itwsuee
ofned
1.3teddig
ted
sma-aiontepm
.682d ofe
e
wi
ec-rity.chedular to
The assumption made in Sec. II that the space-chalimited potential is established in a time of the order ofion plasma period is, therefore, not correct. There arereasons for the delay, which can be stated identically,have different implications. First, the electrons have a finmass. Hence they cannot redistribute themselves instantsatisfy Eq.~1!. Not only do they move more slowly thademanded by the model, but due to their inertia the respoto the electric field leads to an overcorrection. This resultsan oscillation until the potential and electron distribution a
FIG. 10. Frames from the movie generated during the simulation of casCompare with Fig. 9.
FIG. 11. Total ion currents for case E~ion mass equal to 1000 electrons!.The modulations are clearly visible on the larger time scale, consistentthe smaller ion plasma frequency. Compare with Fig. 8.
6630 J. Appl. Phys., Vol. 81, No. 10, 15 May 1997
Downloaded¬19¬Dec¬2003¬to¬203.197.42.2.¬Redistribution¬subject¬
ge
outeto
sen
compatible. This overcorrection, which is responsibleelectron plasma oscillations,18 has also been noted in simulations by other workers.19
Second, the ions also have a finite mass. In this casmeans that they move faster than demanded by the moand consequently their response to the electric field resula reduction in the ion density in the interelectrode spaSince the raising of the plasma potential is due to thepositive charge density in the region, this reduction impliedelay in the time taken for the potential to attain the mamum value. For the simulation plasma this is actually abten times the ion plasma period. For heavier ions, howevewould be correspondingly less. The ion current which flointo the ground side is initially much higher than the valgiven by JCL , and is observed as the initial peak in thcurrent pulse to the grounded electrode.
A. Comparison with the analytical model
The steady state position of the sheath,sSS, calculatedfrom Eq. ~14! for the simulation plasma, is at a distance1.68 cm from the grounded electrode. This value is obtaion putting nSH 5 n0 in Eq. ~14!. Actually nSH would besmaller, giving a somewhat larger value. Since, att 5 0, theplasma boundary on the ground side is at a distance ofcm from the electrode for cases A, B, and C, it is expecthat the sheath front will recede from the electrode andinto the plasma. Since the value ofsW ~1.03 cm! is less thansSS, it also means that the rarefaction wave will be generaright from the start.
This behavior is observed in the ground side of Fig. 5~a!,which shows the ion density across the centre of the pla~line A-A8 in Fig. 3!. The rarefaction front, which starts immediately, is clearly visible in the figures. The plasmboundary is seen to recede from the electrode, and theprofiles on the ground side merge at later times. At time s1000 (4.583 1028 s) it is stationary at a distance of 1.6 cfrom the grounded electrode in Fig. 5~a!. This is in goodagreement with the model, which demands a value of 1cm. The sheath front in Fig. 5~a! has moved a distance of 0.cm in 1000 time steps, which results in an average spee4.373 106 cm s21, which is close to the ion acoustic wavspeed of 4.453 106 cm s21 calculated using Eq.~11! for this
D.
th
FIG. 12. Schematic of a modified signal detection circuit. The right eltrode is split, with the gaps between the split parts is exaggerated for claThe dotted lines in the center indicate the atomic beam, and the hatregion is the plasma created by the passage of a laser beam perpendicthe plane of the diagram.R1, R2, resistances.C, capacitance.
Kartik Patel
to¬AIP¬license¬or¬copyright,¬see¬http://ojps.aip.org/japo/japcr.jsp
th-
inth
heffiithethTonlasnteedrindidear
al
che
re
-ishastonenobShehhi
eonutpa-theere
ath
os-invis-
u-. Iflots
ex-rar-eathave.asthethinmthelso
odealhilen
dere-curofmaionex-
wegetssity, the
invedItisa-opyris
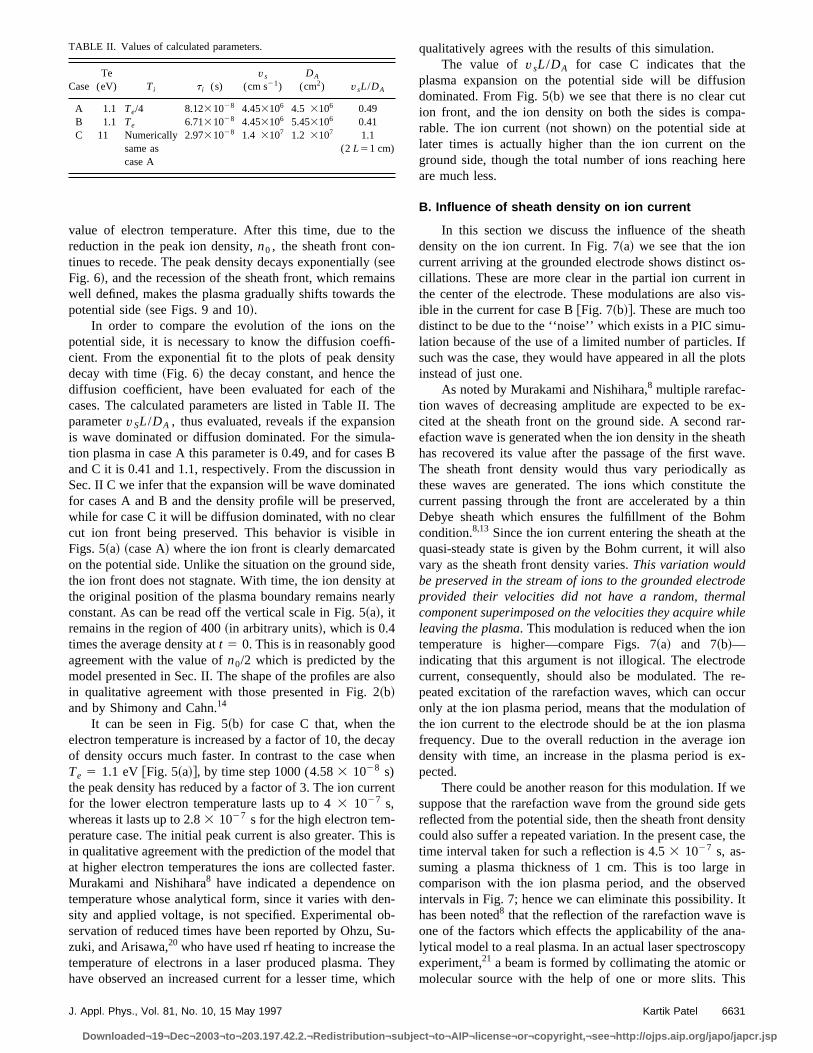
value of electron temperature. After this time, due toreduction in the peak ion density,n0 , the sheath front continues to recede. The peak density decays exponentially~seeFig. 6!, and the recession of the sheath front, which remawell defined, makes the plasma gradually shifts towardspotential side~see Figs. 9 and 10!.
In order to compare the evolution of the ions on tpotential side, it is necessary to know the diffusion coecient. From the exponential fit to the plots of peak densdecay with time~Fig. 6! the decay constant, and hence tdiffusion coefficient, have been evaluated for each ofcases. The calculated parameters are listed in Table II.parametervSL/DA , thus evaluated, reveals if the expansiis wave dominated or diffusion dominated. For the simution plasma in case A this parameter is 0.49, and for caseand C it is 0.41 and 1.1, respectively. From the discussioSec. II C we infer that the expansion will be wave dominafor cases A and B and the density profile will be preservwhile for case C it will be diffusion dominated, with no cleacut ion front being preserved. This behavior is visibleFigs. 5~a! ~case A! where the ion front is clearly demarcateon the potential side. Unlike the situation on the ground sthe ion front does not stagnate. With time, the ion densitythe original position of the plasma boundary remains neaconstant. As can be read off the vertical scale in Fig. 5~a!, itremains in the region of 400~in arbitrary units!, which is 0.4times the average density att 5 0. This is in reasonably goodagreement with the value ofn0/2 which is predicted by themodel presented in Sec. II. The shape of the profiles arein qualitative agreement with those presented in Fig. 2~b!and by Shimony and Cahn.14
It can be seen in Fig. 5~b! for case C that, when theelectron temperature is increased by a factor of 10, the deof density occurs much faster. In contrast to the case wTe 5 1.1 eV@Fig. 5~a!#, by time step 1000 (4.583 1028 s)the peak density has reduced by a factor of 3. The ion curfor the lower electron temperature lasts up to 43 1027 s,whereas it lasts up to 2.83 1027 s for the high electron temperature case. The initial peak current is also greater. Thin qualitative agreement with the prediction of the model tat higher electron temperatures the ions are collected faMurakami and Nishihara8 have indicated a dependencetemperature whose analytical form, since it varies with dsity and applied voltage, is not specified. Experimentalservation of reduced times have been reported by Ohzu,zuki, and Arisawa,20 who have used rf heating to increase ttemperature of electrons in a laser produced plasma. Thave observed an increased current for a lesser time, w
TABLE II. Values of calculated parameters.
CaseTe(eV) Ti t i (s)
vs(cm s21)
DA
(cm2) vsL/DA
A 1.1 Te/4 8.1231028 4.453106 4.5 3106 0.49B 1.1 Te 6.7131028 4.453106 5.453106 0.41C 11 Numerically
same ascase A
2.9731028 1.4 3107 1.2 3107 1.1(2 L51 cm)
J. Appl. Phys., Vol. 81, No. 10, 15 May 1997
Downloaded¬19¬Dec¬2003¬to¬203.197.42.2.¬Redistribution¬subject¬
e
se
-y
ehe
-Bind,
,tly
so
ayn
nt
ister.
--u-
eych
qualitatively agrees with the results of this simulation.The value of vsL/DA for case C indicates that th
plasma expansion on the potential side will be diffusidominated. From Fig. 5~b! we see that there is no clear cion front, and the ion density on both the sides is comrable. The ion current~not shown! on the potential side alater times is actually higher than the ion current on tground side, though the total number of ions reaching hare much less.
B. Influence of sheath density on ion current
In this section we discuss the influence of the shedensity on the ion current. In Fig. 7~a! we see that the ioncurrent arriving at the grounded electrode shows distinctcillations. These are more clear in the partial ion currentthe center of the electrode. These modulations are alsoible in the current for case B@Fig. 7~b!#. These are much toodistinct to be due to the ‘‘noise’’ which exists in a PIC simlation because of the use of a limited number of particlessuch was the case, they would have appeared in all the pinstead of just one.
As noted by Murakami and Nishihara,8 multiple rarefac-tion waves of decreasing amplitude are expected to becited at the sheath front on the ground side. A secondefaction wave is generated when the ion density in the shhas recovered its value after the passage of the first wThe sheath front density would thus vary periodicallythese waves are generated. The ions which constitutecurrent passing through the front are accelerated by aDebye sheath which ensures the fulfillment of the Bohcondition.8,13 Since the ion current entering the sheath atquasi-steady state is given by the Bohm current, it will avary as the sheath front density varies.This variation wouldbe preserved in the stream of ions to the grounded electrprovided their velocities did not have a random, thermcomponent superimposed on the velocities they acquire wleaving the plasma. This modulation is reduced when the iotemperature is higher—compare Figs. 7~a! and 7~b!—indicating that this argument is not illogical. The electrocurrent, consequently, should also be modulated. Thepeated excitation of the rarefaction waves, which can oconly at the ion plasma period, means that the modulationthe ion current to the electrode should be at the ion plasfrequency. Due to the overall reduction in the averagedensity with time, an increase in the plasma period ispected.
There could be another reason for this modulation. Ifsuppose that the rarefaction wave from the ground sidereflected from the potential side, then the sheath front dencould also suffer a repeated variation. In the present casetime interval taken for such a reflection is 4.53 1027 s, as-suming a plasma thickness of 1 cm. This is too largecomparison with the ion plasma period, and the obserintervals in Fig. 7; hence we can eliminate this possibility.has been noted8 that the reflection of the rarefaction waveone of the factors which effects the applicability of the anlytical model to a real plasma. In an actual laser spectroscexperiment,21 a beam is formed by collimating the atomic omolecular source with the help of one or more slits. Th
6631Kartik Patel
to¬AIP¬license¬or¬copyright,¬see¬http://ojps.aip.org/japo/japcr.jsp
enathtuoanethtshetrrer
aththcn
rpta
agca
a
s
ie
thTmten
u.9nc
t iref t
in
nF. Fthelide
, theueerass,caseaseedereely,asfre-ula-ofenbil-s athe
m-atae-ex-hed iser
t isactricierbehat
n-m-eentn-ce,cita-is
ncyea-andm-in
singe,sshehishus
directs a well defined stream of particles into the experimtal area. The subsequent ionization of a portion of this beby one or more laser pulses results in the creation ofplasma. In the process of collimation, the beam temperais reduced in the direction transverse to the beam flow. Climation factors of 100 and above are common. This methat in the direction parallel to the beam, the atoms havtemperature which is greater than, and different from,temperature perpendicular to the beam. This represencooling of the atoms in the direction perpendicular to tbeam flow. This cooling occurs because of the geomeselection of atoms by the slits used for collimation, andsults in an atom velocity distribution which is different fotheX andY directions.
All the electrons have identical initial energies, usuallyfraction of an electron volt, being the difference betweenenergy of the laser photons and the ionization energy ofatoms. If the laser radiation is plane polarized, their veloties are directed initially parallel to the plane of polarizatiobut this very quickly becomes isotropic.
In order to simulate a system closer to what is expementally created, as described in the preceding paragrawe have reduced the electron temperature to 0.36 eV, tha4250 K. This is case D in Table I. The ion temperature hbeen given different distributions in theX andY directions.In theY direction it corresponds toTe/4 as in case A. In thiscase it corresponds to 1042 K, which is of the order of mnitude of the temperature of an atomic source in typiexperiments.21 The velocity distribution in theX direction issuch that it corresponds to a cooling of about 25 timescompared to the temperature in theY direction, which is alsotypical. In a real system, the plasma drifts upwards withspeed equal to the speed of the atoms in the beam. This isame as the thermal velocity in theY direction. This drift,included in the simulation of a barium plasma in our earlwork,4 has not been included here.
Figure 8 shows the total and partial ion currents togrounded electrodes for a plasma with these parameters.modulations in the total current are more distinct as copared to cases A and B, and is seen to be due wholly toions flowing into the central region. The interval betwethese modulations varies from 3.63 1028 s to is 4.23 1028 s. If they were due to the repeated traversal of acotic waves, they would occur at intervals of about 73 1027 s, more than one order of magnitude greater, sithe ion acoustic wave speed now is 2.543 106 cm s21.
We conclude, therefore, that the modulation in currendue to the oscillation of the sheath front density at theduced plasma period, and hence they are a measure oparameter. In the present case, taking the average timeriod, it indicates a plasma density of 7.753 108 cm s23, adecrease of almost an order of magnitude from the beginnof the expansion.
In Figs. 9 and 10, we show frames from the movie geerated by the program for cases A and D, respectively.comparison, frames at the same times have been showncase A we clearly see that there is no bunching of ions ininterelectrode space as they move towards the groundedtrode. Such a bunching is present for case D. This prov
6632 J. Appl. Phys., Vol. 81, No. 10, 15 May 1997
Downloaded¬19¬Dec¬2003¬to¬203.197.42.2.¬Redistribution¬subject¬
-merel-saea
ic-
eei-,
i-hs,is,s
-l
s
athe
r
ehe-he
s-
e
s-hispe-
g
-ororeec-s
visible evidence that, as the ions stream to the electrodemodulation in ion density in the sheath front is preserved dto the low temperature of the ions in this direction. In ordto see the dependence of the modulations at higher ion mthe simulation was done with the same parameters as forD, but with ion mass increased by a factor of 10. This is cE and Fig. 11 shows the total ion current to the groundelectrode for this simulation. Qualitatively, we see that this no difference between case D and case E. Quantitativthe modulations in the current occur at larger intervalscompared to case D, indicating the reduced ion plasmaquency at higher mass. The interval between these modtions is 1.13 1027 s, and corresponds to a plasma density1.3 3 109 cm23. The decrease in density is smaller whcompared to case D. It is consistent with the reduced moity expected at higher ion mass, since the plasma takelonger time to diffuse through the sheath boundary togrounded electrode.
VI. ISSUES RELATED TO EXPERIMENTALOBSERVATION
In computer simulations the attempt to preserve the coplexity of a physical process leads to generation of more dthan needed, much of which is difficult to interpret. Somtimes the data is not observable experimentally as, forample, the potential profile in Fig. 5. The ion current to telectrode, however, is an easily observable quantity, analways monitored in most, if not all, experiments in lasspectroscopy.
Since a low ion mass was used the simulated currencomplicated because the ions are light enough to requickly to spatial and temporal variations in internal electfields. In an actual experiment where ion would be heavby many orders, it is expected that fluctuations wouldproportionately slower, and less in magnitude. This is wwas seen in our simulations using barium,4 and on Gado-linium by Ogura, Kaburaki and Shibata.9 The depth of themodulations in the ion current was very much reduced.
The monitoring of low level signals in a laboratory evironment is always a tough task and detection of small teporal changes is still more difficult. However, it should bpossible to detect the modulation in the electrode currexperimentally. In a typical detection circuit the current etering the electrode is made to flow through a resistanpotential changes across which are monitored after capatively isolating it from the rest of the instrumentation. Thkind of circuit has a time constant (RC) which should below enough so that the circuit can respond at the frequeof the ion waves. In many experiments the focus is on msurement of the total charge collected by the electrode,therefore a charge sensitive amplifier is used. This copletely eliminates any chance of observing modulationsthe current.
Several workers have reported measurements by uFaraday cups placed behind apertures in the electrod22
which detect the small quantities of charge which pathrough. In order to prevent distortion in the electric field tapertures are kept small, or covered with a wire mesh. Treduces the number of ions which pass through them, t
Kartik Patel
to¬AIP¬license¬or¬copyright,¬see¬http://ojps.aip.org/japo/japcr.jsp
vrgth
ha
iv-
evepeicntth
od
taecdulaolttint
plthoalng
trisnaha
thdioththonctancioianoliztoonnsfen
. Ingedob-
thehasyobebeeryate.heBytor,ifi-ex-
as-silyla-b-vesen-, asthebe-the
heyeslec-thisden-u-rale ahetheple
.is-
-
attenuating an already low signal. Moreover, they hamainly been used in conjunction with integrators or chasensitive amplifiers, whose output does not preservewaveform of the current, which is what is required here.
From the discussion in the last section, we can infer tthe modulations are more easily observable when
~a! the ions are cold, and~b! the signal detection circuit monitors the current arr
ing only at the central part of the electrode.
So far as the first point is concerned, the ion temperaturplasmas is not generally a controllable parameter. Howeas discussed above in Sec. V B, in most spectroscopy exments a beam is created with the help of collimators, whdirects them towards the experimental area. It is essethat the degree of collimation be high enough to reducethermal velocity of the atoms in theX direction to a valueless than the ion acoustic wave speed; otherwise the mlation will be wiped out.
With respect to the second point, it would be advangeous to electrically isolate the central portion of the eltrode on which signals are detected. As seen in Figs. 7 anthe partial current in the central region has a higher modtion as compared to the total current arriving over the whelectrode. The currents in the regions above and belowcenter merely raise the baseline of the signal by contribua constant background. By eliminating them the signalnoise ratio is effectively enhanced. This can be done by sting the electrode, as shown in Fig. 12, and mountingcentral part with the help of insulating spacers. The flowcharge across resistanceR2 generates the required signfrom the central portion, while the signal from the remainiportions flows along a separate path throughR1. The loss intotal signal strength due to the measurement of the cencurrent alone is offset by the increase in the signal-to-noratio, thus making experimental detection easier. This sigis taken through capacitanceC and could be coupled totransient digitizer capable of sampling at rates greater tthe ion plasma frequency. The time constant (R2 3 C)should be smaller than the ion plasma period.
The gaps between the electrodes should be smallerthe interelectrode spacing, to ensure that the field is nottorted and that they are not visible to the ions. The sizeeach of the split portions should not be much larger thaninitial plasma size, which is the same as the width oflaser beam. A smaller size will see a lesser number of iwhich carry the modulation, while a larger size will colleions which are unmodulated. Two different resistancesused because of the following reason. If only one resistaR2, was employed then the potential of the central portwould rise as the current flows through it. A higher potentwould effect the motion of the charges, though the magtude of this would depend on the ion mass, the applied vage, as well as geometrical factors such as the relative sof the split portions and interelectrode spacing. These facwould become clear only when an actual experiment is cducted. However, if the potential of the remaining portioof the electrode is also raised to the same level, this efcan be eliminated. The current flowing through the seco
J. Appl. Phys., Vol. 81, No. 10, 15 May 1997
Downloaded¬19¬Dec¬2003¬to¬203.197.42.2.¬Redistribution¬subject¬
eee
t
inr,ri-hiale
u-
--8,-ehegoit-ef
aleal
n
ans-fees
ree,nli-t-esrs-
ctd
resistance from the other portions serves this purposefact,R1 should be variable so that its value can be chanduring the experiment so as to maximize the modulationserved acrossR2.
A method which detects the fluorescence of ions inplasma after being irradiated with a second probe laserbeen used by several workers21,22 to measure the ion densitafter the ionizing laser has passed. In this method the prlaser needs to be tunable so that its wavelength canchanged for different plasmas. These methods are velaborate, expensive, difficult to set up and costly to operSignificant savings in time and money would result if tmodulation in the ion current itself could be detected.using a portion of the electrode itself as the signal detecloss in signal strength is avoided. The simple circuit modcation suggested above will considerably help in aidingperimental detection of the modulations.
VII. CONCLUSION
The behavior of transient, finite-size laser created plmas, whose analytical treatment is difficult, can be eainvestigated by using two-dimensional PIC plasma simution, which is a relatively straightforward and well estalished technique. We have shown that PIC simulation giresults which are in agreement with the existing one dimsional model of plasma expansion between electrodeswell as with experiments. We have seen in simulationsexistence of rarefaction waves in a plasma expandingtween plane parallel electrodes. The charges which leaveplasma carry information about these waves provided thave a sufficiently narrow velocity distribution. These wavare seen as a modulation in the current flowing to the etrodes which are used to apply the field. Measurement ofmodulation can be used to estimate the transient plasmasity during the period of existence of the waves. The simlation reveals that the current which flows into the centportion of the electrode has a higher modulation, henchigher signal to noise ratio, than the current flowing into touter regions. This fact can be utilized to aid detection ofsignal in an experimental setup, for which purpose a simmodification to the conventional circuit is suggested.
ACKNOWLEDGMENTS
The author is thankful to Shri U. K. Chatterjee, Dr. V. KMago, and Shri A. Mazumdar for useful and stimulating dcussions during the course of this work.
1M. Widner, I. Alexeff, W. D. Jones, and K. E. Lonngren, Phys. Fluids13,2532 ~1970!.
2C. K. Birdsall and A. B. Langdon,Plasma Physics via Computer Simulation ~McGraw-Hill, New York, 1985!.
3R. W. Hockney and J. W. Eastwood,Computer Simulation using Particles~McGraw-Hill, New York, 1981!.
4Kartik Patel and V. K. Mago, J. Appl. Phys.78, 4371~1995!.5J. E. Allen and J. G. Andrews, J. Plasma Phys.4, 187 ~1970!.6F. F. Chen, Phys. Fluids25, 2385~1982!.7K. Okano, J. Nucl. Sci. Technol.29, 601 ~1992!.8M. Murakami and K. Nishihara, Phys. Fluids B5, 3441~1993!.9K. Ogura, H. Kaburaki, and T. Shibata, J. Nucl. Sci. Technol.30, 1218~1993!.
6633Kartik Patel
to¬AIP¬license¬or¬copyright,¬see¬http://ojps.aip.org/japo/japcr.jsp
hy
ic
No
tic
ts
nol.
10J. Denavit, Phys. Fluids22, 1384~1979!.11J. Denavit, J. Comput. Phys.42, 337 ~1981!.12A. Friedman, A. B. Langdon, and B. I. Cohen, Comments Plasma PControl. Fusion6, 225 ~1981!.
13D. Bohm, The Characteristics of Electrical Discharges in MagnetFields, edited by A. Guthrie and R. K. Wakering~McGraw-Hill, NewYork, 1949!, Chap. 3.
14K. Shimony and J. H. Cahn, Phys. Fluids8, 1704~1965!.15J. Hyman and W. S. Williamson, Ion Extraction System Study, ReportUCRL-13737 Hughes Research Labs, Malibu, CA, May 1977.
16K. Patel, ‘‘Particle Simulation of a Two-dimensional electrostaplasma,’’ Report No. BARC-1489~1989!.
6634 J. Appl. Phys., Vol. 81, No. 10, 15 May 1997
Downloaded¬19¬Dec¬2003¬to¬203.197.42.2.¬Redistribution¬subject¬
s.
.
17J. M. Hammersley and D. C. Handscomb,Monte Carlo Methods~Meth-uen, London, 1964!.
18F. F. Chen,Introduction to Plasma Physics~Plenum, New York, 1974!.19A. C. Calder, G. W. Hulbert, and J. G. Laframboise, Phys. Fluids B5, 674
~1993!.20A. Ohzu, Y. Suzuki, and T. Arisawa,IEEE Conference Record—Abstracof the 1993 IEEE International Conference on Plasma Science, CatalogNo. 93 CH 3334-0~IEEE, New York, 1995!, p. 84.
21K. Yamada, H. Okada, T. Tetsuka, and K. Oshioka, J. Nucl. Sci. Tech30, 143 ~1993!.
22K. Yamada, T. Tetsuka, and Y. Deguchi, J. Appl. Phys.67, 6734~1990!.
Kartik Patel
to¬AIP¬license¬or¬copyright,¬see¬http://ojps.aip.org/japo/japcr.jsp
Related Documents