Obligatory averaging in mean size perception Jüri Allik a,b,⇑ , Mai Toom a , Aire Raidvee a,c , Kristiina Averin a , Kairi Kreegipuu a a Department of Psychology, University of Tartu, Estonia b Estonian Academy of Sciences, Tallinn, Estonia c Laboratory of Psychophysics, Brain Mind Institute, Ecole Polytechnique Fédérale de Lausanne (EPFL), Lausanne, Switzerland article info Article history: Received 30 November 2013 Received in revised form 2 May 2014 Available online 22 May 2014 Keywords: Ensemble characteristics Perception of the mean size Focused attention Obligatory averaging Perceptual awareness abstract The perception of ensemble characteristics is often regarded as an antidote to an established bottleneck in focused attention and working memory, both of which appear to be limited in capacity to a few objects only. In order to test the associative law of summation, observers were asked to estimate the mean size of four circles relative to a reference circle. When there was no time to scrutinize each individual circle, observers discriminated the mean size difference identically, irrespective of whether the same summary size increment or decrement was added to or subtracted from the size of only one, two, or all four circles. Since observers judged the size of individual circles, the position of which was indicated after they were displayed, considerably less accurately than the mean size of the four circles, it is very unlikely that explicit knowledge of the size of the individual elements is the basis of mean size judgments. The sizes of individual elements were pooled together in an obligatory manner before size information had reached awareness. The processing of size information seems to be largely constrained to only one measure at a time, with a preference for mean size rather than the individual measures from which it is assembled. Ó 2014 Elsevier Ltd. All rights reserved. 1. Introduction Ensemble characteristics are any abstract property of an incom- ing visual image which is computed from multiple individual mea- sures and may not have representation in any explicit visual attribute (Alvarez, 2011). For example, two circles with diameters 100 and 200 pixels shown on a display screen have a mean size equal to 150 pixels, which is not embodied in any visually identi- fiable attribute. Nevertheless, it is widely believed that these ensemble characteristics, also called ‘global features’ or ‘statistical summaries’, can be effectively computed, perceived, and stored by the human perceptual system (Alvarez, 2011; Ariely, 2001; Chong & Treisman, 2003, 2005; Fouriezos, Rubenfeld, & Capstick, 2008; Spencer, 1961, 1963). The perception of ensemble characteristics is often regarded as an antidote to an established bottleneck in focused attention and working memory, both of which appear to be limited to a few objects only (Cowan, 2001; Zhang & Luck, 2008). These capacity limitations are believed to be compensated by massively parallel and automatic preattentive processes which are usually thought to compute these ensemble characteristics (Alvarez, 2011; Chong & Treisman, 2003; Chong et al., 2008; Oriet & Brand, 2013). However, these claims about the perception of ensemble characteristics must be treated with caution because it was shown that relatively modest performance in mean size per- ception, one of the most intensively studied ensemble characteris- tics, can be explained through various focused-attention strategies without appealing to a new mechanism able to bypass attention and working memory bottlenecks (Allik et al., 2013; Myczek & Simons, 2008; Simons & Myczek, 2008). On the other hand, one obvious shortcoming in previous studies of ensemble characteristics is the failure to test the fundamental properties of operations that are required for the computation of ensemble characteristics. Researchers were mainly concerned with how important yet facultative properties, such as how concentra- tion of attention (Alvarez & Oliva, 2008; Ariely, 2001), different visual cues (Chong & Treisman, 2005), item heterogeneity (Marchant, Simons, & de Fockert, 2013), rapid temporal presenta- tion (Joo et al., 2009), external noise (Im & Halberda, 2012; Solomon, Morgan, & Chubb, 2011), resistance to object substitution masking (Jacoby, Kamke, & Mattingley, 2012), previous adaptation (Corbett et al., 2012), exposure time (Whiting & Oriet, 2011) or crowding (Banno & Saiki, 2012) affect the ability to estimate mean size. Surprisingly little attention has been paid to the defining properties of the statistical averaging process itself. For example, it is well known that the order in which addends are summed does not change the end result. Similarly, the grouping of added http://dx.doi.org/10.1016/j.visres.2014.05.003 0042-6989/Ó 2014 Elsevier Ltd. All rights reserved. ⇑ Corresponding author at: Department of Psychology, University of Tartu, Näituse 2, Tartu 50409, Estonia. Fax: +372 7376152. E-mail address: [email protected] (J. Allik). Vision Research 101 (2014) 34–40 Contents lists available at ScienceDirect Vision Research journal homepage: www.elsevier.com/locate/visres

Welcome message from author
This document is posted to help you gain knowledge. Please leave a comment to let me know what you think about it! Share it to your friends and learn new things together.
Transcript
Vision Research 101 (2014) 34–40
Contents lists available at ScienceDirect
Vision Research
journal homepage: www.elsevier .com/locate /v isres
Obligatory averaging in mean size perception
http://dx.doi.org/10.1016/j.visres.2014.05.0030042-6989/� 2014 Elsevier Ltd. All rights reserved.
⇑ Corresponding author at: Department of Psychology, University of Tartu,Näituse 2, Tartu 50409, Estonia. Fax: +372 7376152.
E-mail address: [email protected] (J. Allik).
Jüri Allik a,b,⇑, Mai Toom a, Aire Raidvee a,c, Kristiina Averin a, Kairi Kreegipuu a
a Department of Psychology, University of Tartu, Estoniab Estonian Academy of Sciences, Tallinn, Estoniac Laboratory of Psychophysics, Brain Mind Institute, Ecole Polytechnique Fédérale de Lausanne (EPFL), Lausanne, Switzerland
a r t i c l e i n f o a b s t r a c t
Article history:Received 30 November 2013Received in revised form 2 May 2014Available online 22 May 2014
Keywords:Ensemble characteristicsPerception of the mean sizeFocused attentionObligatory averagingPerceptual awareness
The perception of ensemble characteristics is often regarded as an antidote to an established bottleneckin focused attention and working memory, both of which appear to be limited in capacity to a few objectsonly. In order to test the associative law of summation, observers were asked to estimate the mean size offour circles relative to a reference circle. When there was no time to scrutinize each individual circle,observers discriminated the mean size difference identically, irrespective of whether the same summarysize increment or decrement was added to or subtracted from the size of only one, two, or all four circles.Since observers judged the size of individual circles, the position of which was indicated after they weredisplayed, considerably less accurately than the mean size of the four circles, it is very unlikely thatexplicit knowledge of the size of the individual elements is the basis of mean size judgments. The sizesof individual elements were pooled together in an obligatory manner before size information had reachedawareness. The processing of size information seems to be largely constrained to only one measure at atime, with a preference for mean size rather than the individual measures from which it is assembled.
� 2014 Elsevier Ltd. All rights reserved.
1. Introduction
Ensemble characteristics are any abstract property of an incom-ing visual image which is computed from multiple individual mea-sures and may not have representation in any explicit visualattribute (Alvarez, 2011). For example, two circles with diameters100 and 200 pixels shown on a display screen have a mean sizeequal to 150 pixels, which is not embodied in any visually identi-fiable attribute. Nevertheless, it is widely believed that theseensemble characteristics, also called ‘global features’ or ‘statisticalsummaries’, can be effectively computed, perceived, and stored bythe human perceptual system (Alvarez, 2011; Ariely, 2001; Chong& Treisman, 2003, 2005; Fouriezos, Rubenfeld, & Capstick, 2008;Spencer, 1961, 1963). The perception of ensemble characteristicsis often regarded as an antidote to an established bottleneck infocused attention and working memory, both of which appear tobe limited to a few objects only (Cowan, 2001; Zhang & Luck,2008). These capacity limitations are believed to be compensatedby massively parallel and automatic preattentive processes whichare usually thought to compute these ensemble characteristics(Alvarez, 2011; Chong & Treisman, 2003; Chong et al., 2008;
Oriet & Brand, 2013). However, these claims about the perceptionof ensemble characteristics must be treated with caution becauseit was shown that relatively modest performance in mean size per-ception, one of the most intensively studied ensemble characteris-tics, can be explained through various focused-attention strategieswithout appealing to a new mechanism able to bypass attentionand working memory bottlenecks (Allik et al., 2013; Myczek &Simons, 2008; Simons & Myczek, 2008).
On the other hand, one obvious shortcoming in previous studiesof ensemble characteristics is the failure to test the fundamentalproperties of operations that are required for the computation ofensemble characteristics. Researchers were mainly concerned withhow important yet facultative properties, such as how concentra-tion of attention (Alvarez & Oliva, 2008; Ariely, 2001), differentvisual cues (Chong & Treisman, 2005), item heterogeneity(Marchant, Simons, & de Fockert, 2013), rapid temporal presenta-tion (Joo et al., 2009), external noise (Im & Halberda, 2012;Solomon, Morgan, & Chubb, 2011), resistance to object substitutionmasking (Jacoby, Kamke, & Mattingley, 2012), previous adaptation(Corbett et al., 2012), exposure time (Whiting & Oriet, 2011) orcrowding (Banno & Saiki, 2012) affect the ability to estimate meansize. Surprisingly little attention has been paid to the definingproperties of the statistical averaging process itself. For example,it is well known that the order in which addends are summed doesnot change the end result. Similarly, the grouping of added
J. Allik et al. / Vision Research 101 (2014) 34–40 35
numbers does not affect the sum (the associative law). If the obser-ver’s task, for example, is to discriminate the mean size of four cir-cles in comparison to a reference, then it does not matter whetherwe add four size units to the diameter of only one of them or onesize unit to diameters of all four circles. Intuitively, it is more likelythat the human observer can more easily notice an outlier which isfour size units larger than the reference, rather than four smallincrements of one size unit added to each of four circles. Albeitcounterintuitive, any theory insisting that the perceptual systemis capable of computing mean size must confront the challengeof showing that the two cases result in an identical perceptualoutcome.
In our previous paper (Allik et al., 2013, Studies 3 and 4), wedemonstrated that grouping these size increments and decrementsinto different packages does not affect the perception of the meansize. However, in these two studies, we did not test the associativelaw of addition in the most demanding situation, where only afraction of elements was identical in size to the reference andtherefore carried no useful information about size differences.The most important novelty compared to our previous study is thatwe were not previously completely able to eliminate the possibil-ity that our participants had, in fact, knowledge about the sizes ofall individual elements or that they simply followed instructionsand ignored the individual sizes which were, in any case, clearlyabove their individual discrimination threshold. In addition tothe mean size task, in the present study, we asked our participantsabout the sizes of individual elements immediately after theirexposure by presenting a marker indicating one of their locations.We believe that this is a straightforward test for whether or not theobserver is able to have full cognitive access to the attributes ofindividual elements that are presented in the mean size judgmenttask.
2. Methods
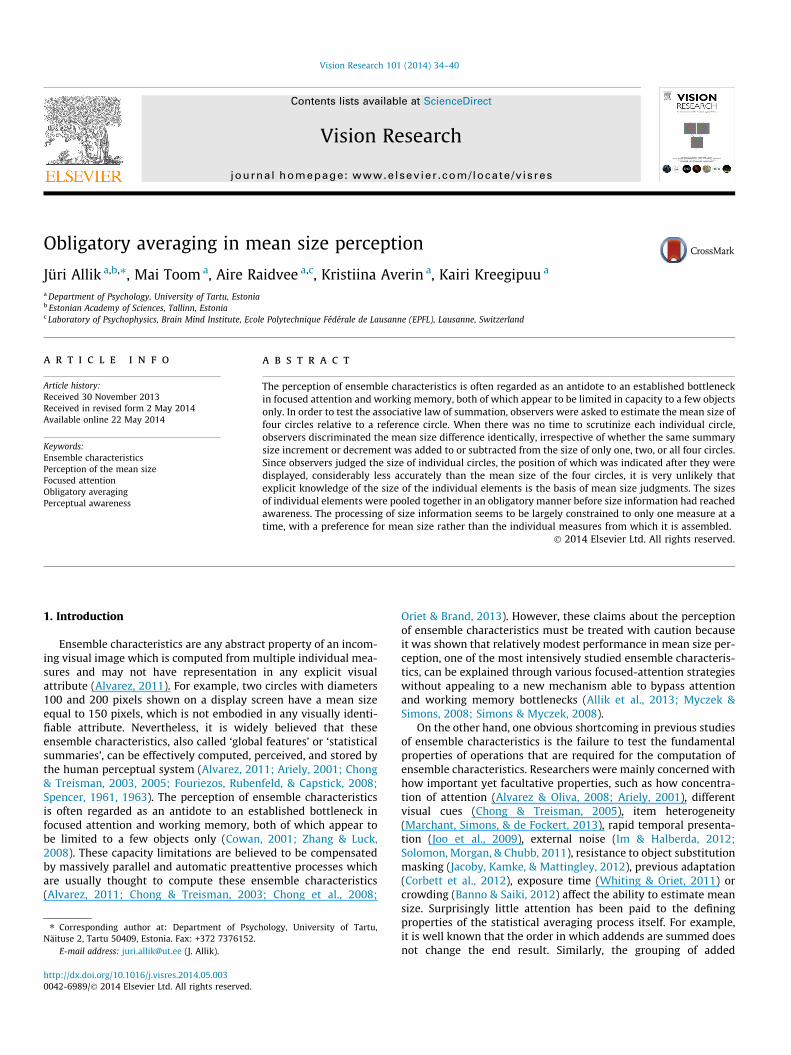
Stimuli were presented on a flat LCD monitor at a viewing dis-tance of about 70 cm (about 2 min of visual angle per pixel). All thestimuli were generated using MATLAB (The MathWorks, Inc.). Eachtrial started with a reference circle (150 pixels in diameter) whichwas presented at the center of the screen for 0.5 s. When thecentral reference circle was switched off, four test circles werepresented after a 0.5 s pause, for a short 200 or a longer 1000 msperiod. The test circles were presented in 4 fixed positions, as sche-matically depicted in Fig. 1. Unlike the schematic figure, all circleswere rendered in white on a dark background with maximal con-trast. The distance of the centers of the test circles from the center
Fig. 1. A schematic view of four circles presented for 200 or 1000 ms after the referencincreased 4 units relative to the reference and the remaining three circles (4, 0, 0, 0). In thfour circles (1, 1, 1, 1).
of the screen was 375 pixels and from each other was 530 pixels. Ineach trial, a constant number of pixels was added or subtractedfrom the diameters of the four test circles, which initially had thesame size as the reference. In one-third of all trials, 4, 12, 20, 28,or 36 pixels were added to or subtracted from only one circle,which was randomly selected from the four (4, 0, 0, 0). In anotherthird of the trials, the size of two randomly selected circles wasequally modified by adding or subtracting 2, 6, 10, 14, or 18 pixels(2, 2, 0, 0). In the remaining one-third of trials, the total incrementor decrement was divided into four equal quantities (1, 3, 5, 7, or 9pixels) and added or subtracted from the size of all four test circles(1, 1, 1, 1). All combinations of increments and decrements for thethree test conditions and the positions of the modified test circleswere randomized within a block. If the associative law of summa-tion is valid for the perception of mean size, then these three differ-ent grouping schemes should lead to identical discriminationcurves. Such a prediction, however, seems very unlikely since thesize of one circle is conspicuously different from the referenceand the remaining three circles (Fig. 1, left panel). This appearsmuch easier to notice than when the total size difference is equallydistributed between all four elements (Fig. 1, right panel). Theobservers were instructed to indicate, by pressing the respectivekeys on the keyboard, whether the mean size of the four test circleswas larger than the reference circle previously seen.
We also did an additional experiment using exactly the sameset of stimuli, presented for a short T = 200 ms period. The onlyprocedural difference from the previous experiment was a smallgreen arrow which appeared 200 ms after exposure to the four testcircles. This arrow indicated one of four possible test circle posi-tions which were determined randomly before each trial. Observ-ers were instructed to judge whether the mean size of the circleindicated was larger than the previously seen reference circle bypressing the respective keys on the keyboard. They were alsoinstructed to ignore the size of the remaining three circles notindicated by the arrow.
Seven observers (five women and two men aged 20–63 years)with normal or corrected to normal vision took part in the exper-iments. Four were experienced (S1, S3, S4, and S5) and three wererelatively inexperienced (S2, S6, and S7) observers who wereignorant of the details of this experimental design.
2.1. Statistical analyses
A nonlinear mixed effects regression was applied in order toascertain whether estimation of the random effects for the slopeparameter (and thus, description of the data by three psychometric
e circle (dotted) was switched off. In the left panel, the size of only one circle wase right panel, the same total amount of change was equally distributed between all
36 J. Allik et al. / Vision Research 101 (2014) 34–40
functions, separately for each condition, i.e., the full model) wouldgive a statistically significant benefit over description of all threeconditions by a single common psychometric function (i.e., theconstrained model). The best fits were determined by maximumlikelihood estimation. The final model selection between the fulland constrained models was based on statistical significance ofthe log likelihood ratio (separately for each subject). Parameterconfidence intervals were estimated by bootstrapping (n = 1000).
3. Results
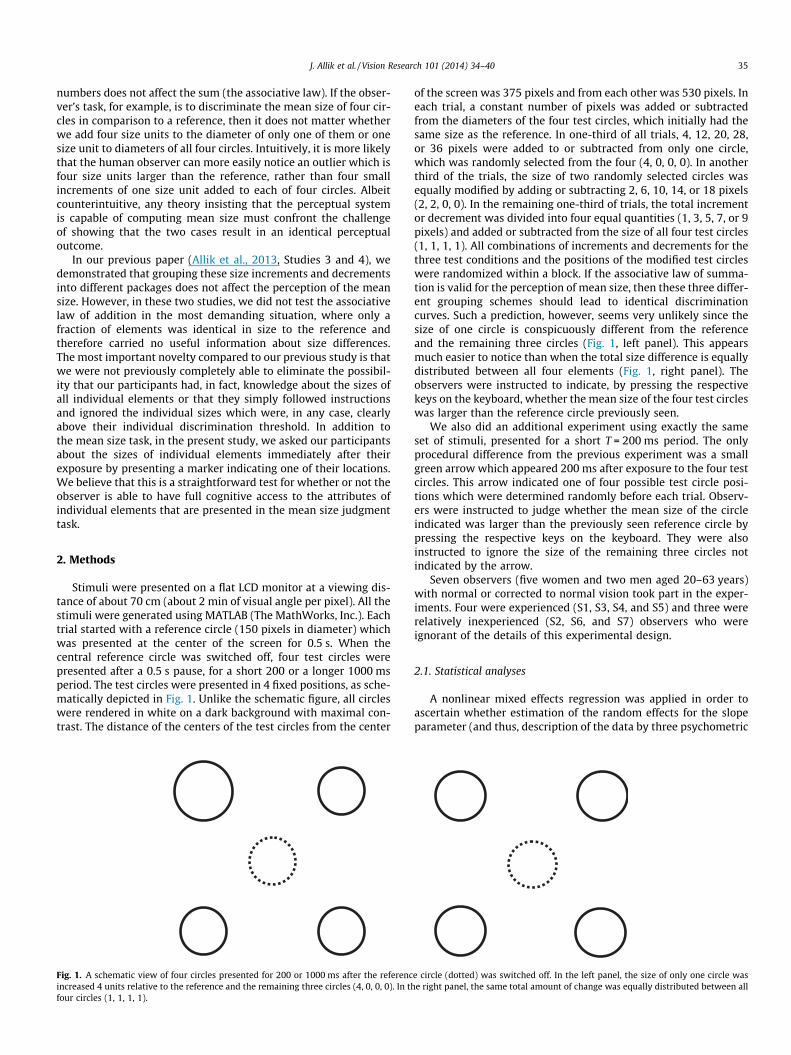
As in our previous study (Allik et al., 2013), when the expositiontime was 200 ms, the three conditions led to almost identicalcurves of mean size discrimination for the seven observers.Fig. 2B–H demonstrates individual results for the seven observersand their summary results (Fig. 2A) with their choice probabilities(‘‘The mean size was larger than that of the reference’’) plottedagainst the mean size difference from the reference. The differentsymbols in Fig. 2A–H indicate the three different conditions inwhich one, two, or all four sizes were changed. Each data point cor-responds to at least 80 replications.
Based on the log likelihood ratios of the full (separate psycho-metric functions for each condition) vs. the constrained model(common psychometric curve for all three conditions), all observ-ers behaved as if the distribution of the size differences was irrel-evant, and the only stimulus attribute which mattered was themean size of all four circles. In some cases, the ability to identifyequally distributed size increments or decrements (1, 1, 1, 1) waseven slightly better than identification of the same total size differ-ence added to only one outlier (4, 0, 0, 0).
In all seven observers, it was sufficient to have only one psycho-metric function fitted to all three stimulus conditions. Dottedcurves represent theoretical cumulative normal distributions,which gave the best fit to all three sets of data points. The correla-tion between observed and predicted values was generally high(on average, data r2 = 97.4%), indicating that only a relatively smallamount of variance remained unexplained. The only remarkabledeviance was observer S6 (Fig. 2G) who was, for some reason, verypoor in the perception of one circle which was considerably
−9 −7 −5 −3 −1 1 3 5 7 90
0.2
0.4
0.6
0.8
1
δ (pixels)
Cho
ice
prob
abilit
y
A: Alln = 18888
124Theoretical
−9 −7 −5 −3 −1 1 3 5 7 90
0.2
0.4
0.6
0.8
1
δ (pixels)
Cho
ice
prob
abilit
y
B: S1n = 2700
124Theoretical
−9 −7 −5 −3 −1 1 3 5 7 90
0.2
0.4
0.6
0.8
1
δ (pixels)
Cho
ice
prob
abilit
y
E: S4n = 2430
124Theoretical
−9 −7 −5 −3 −1 1 3 5 7 90
0.2
0.4
0.6
0.8
1
δ (pixels)
Cho
ice
prob
abilit
y
F: S5n = 2430
124Theoretical
Fig. 2. Mean size discrimination probabilities when the size of one (4, 0, 0, 0), two (2, 2, 0separately for each (B–H) are presented. Display time was T = 200 ms.
smaller than the remaining three. The average percentage ofexplained variance with observer S6 excluded was 98.2%.
The parameters of the best fitting functions are listed in Table 1.The slope of the function corresponds to the standard deviation (r),which is a measure of how precisely the mean size of the four cir-cles is discriminated from the reference. The results demonstratedthat, in 84.1% of the cases, the observers were able to correctlyindicate in which direction (smaller or larger) the mean size ofthe four circles was different from the reference, with averageresults being 6.09 (All), ranging from 3.87 (S5) to 7.66 (S7) pixels.This precision is quite noteworthy, since from a viewing distance of70 cm, for instance, 4 pixels subtended about 6 min of the arc atthe eye. There was indeed a small advantage in the noticing of asingle deviant element over a total size difference equally distrib-uted between all four elements. However, this advantage was tiny,being equal to about one-quarter of the pixel size.
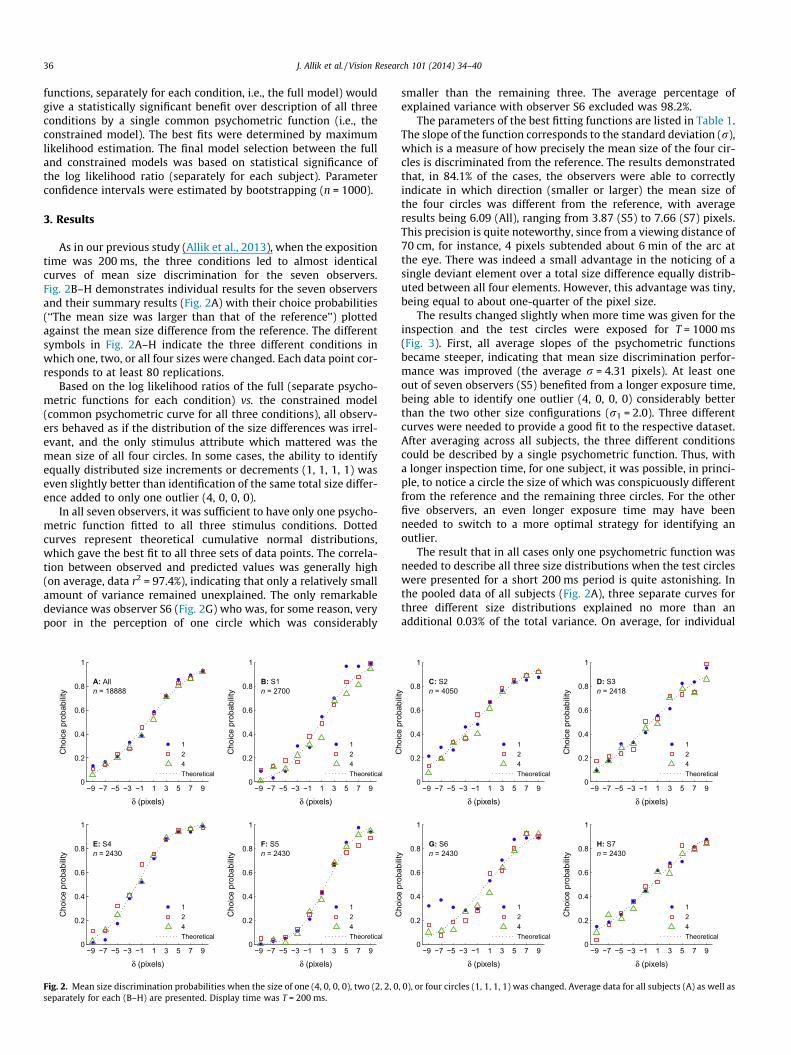
The results changed slightly when more time was given for theinspection and the test circles were exposed for T = 1000 ms(Fig. 3). First, all average slopes of the psychometric functionsbecame steeper, indicating that mean size discrimination perfor-mance was improved (the average r = 4.31 pixels). At least oneout of seven observers (S5) benefited from a longer exposure time,being able to identify one outlier (4, 0, 0, 0) considerably betterthan the two other size configurations (r1 = 2.0). Three differentcurves were needed to provide a good fit to the respective dataset.After averaging across all subjects, the three different conditionscould be described by a single psychometric function. Thus, witha longer inspection time, for one subject, it was possible, in princi-ple, to notice a circle the size of which was conspicuously differentfrom the reference and the remaining three circles. For the otherfive observers, an even longer exposure time may have beenneeded to switch to a more optimal strategy for identifying anoutlier.
The result that in all cases only one psychometric function wasneeded to describe all three size distributions when the test circleswere presented for a short 200 ms period is quite astonishing. Inthe pooled data of all subjects (Fig. 2A), three separate curves forthree different size distributions explained no more than anadditional 0.03% of the total variance. On average, for individual
−9 −7 −5 −3 −1 1 3 5 7 90
0.2
0.4
0.6
0.8
1
δ (pixels)
Cho
ice
prob
abilit
y
C: S2n = 4050
124Theoretical
−9 −7 −5 −3 −1 1 3 5 7 90
0.2
0.4
0.6
0.8
1
δ (pixels)
Cho
ice
prob
abilit
y
D: S3n = 2418
124Theoretical
−9 −7 −5 −3 −1 1 3 5 7 90
0.2
0.4
0.6
0.8
1
δ (pixels)
Cho
ice
prob
abilit
y
G: S6n = 2430
124Theoretical
−9 −7 −5 −3 −1 1 3 5 7 90
0.2
0.4
0.6
0.8
1
δ (pixels)
Cho
ice
prob
abilit
y
H: S7n = 2430
124Theoretical
, 0), or four circles (1, 1, 1, 1) was changed. Average data for all subjects (A) as well as
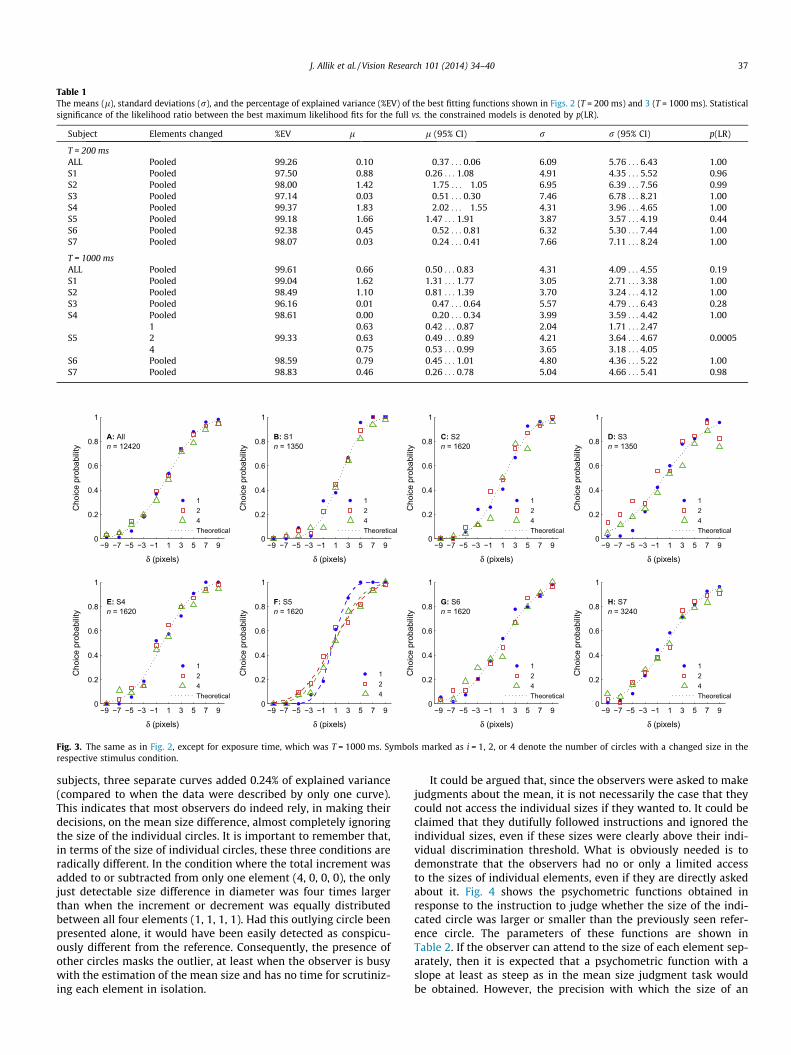
Table 1The means (l), standard deviations (r), and the percentage of explained variance (%EV) of the best fitting functions shown in Figs. 2 (T = 200 ms) and 3 (T = 1000 ms). Statisticalsignificance of the likelihood ratio between the best maximum likelihood fits for the full vs. the constrained models is denoted by p(LR).
Subject Elements changed %EV l l (95% CI) r r (95% CI) p(LR)
T = 200 msALL Pooled 99.26 �0.10 �0.37 . . . 0.06 6.09 5.76 . . . 6.43 1.00S1 Pooled 97.50 0.88 0.26 . . . 1.08 4.91 4.35 . . . 5.52 0.96S2 Pooled 98.00 �1.42 �1.75 . . . �1.05 6.95 6.39 . . . 7.56 0.99S3 Pooled 97.14 �0.03 �0.51 . . . 0.30 7.46 6.78 . . . 8.21 1.00S4 Pooled 99.37 �1.83 �2.02 . . . �1.55 4.31 3.96 . . . 4.65 1.00S5 Pooled 99.18 1.66 1.47 . . . 1.91 3.87 3.57 . . . 4.19 0.44S6 Pooled 92.38 0.45 �0.52 . . . 0.81 6.32 5.30 . . . 7.44 1.00S7 Pooled 98.07 0.03 �0.24 . . . 0.41 7.66 7.11 . . . 8.24 1.00
T = 1000 msALL Pooled 99.61 0.66 0.50 . . . 0.83 4.31 4.09 . . . 4.55 0.19S1 Pooled 99.04 1.62 1.31 . . . 1.77 3.05 2.71 . . . 3.38 1.00S2 Pooled 98.49 1.10 0.81 . . . 1.39 3.70 3.24 . . . 4.12 1.00S3 Pooled 96.16 0.01 �0.47 . . . 0.64 5.57 4.79 . . . 6.43 0.28S4 Pooled 98.61 0.00 �0.20 . . . 0.34 3.99 3.59 . . . 4.42 1.00
1 0.63 0.42 . . . 0.87 2.04 1.71 . . . 2.47S5 2 99.33 0.63 0.49 . . . 0.89 4.21 3.64 . . . 4.67 0.0005
4 0.75 0.53 . . . 0.99 3.65 3.18 . . . 4.05S6 Pooled 98.59 0.79 0.45 . . . 1.01 4.80 4.36 . . . 5.22 1.00S7 Pooled 98.83 0.46 0.26 . . . 0.78 5.04 4.66 . . . 5.41 0.98
−9 −7 −5 −3 −1 1 3 5 7 90
0.2
0.4
0.6
0.8
1
δ (pixels)
Cho
ice
prob
abilit
y
A: Alln = 12420
124Theoretical
−9 −7 −5 −3 −1 1 3 5 7 90
0.2
0.4
0.6
0.8
1
δ (pixels)
Cho
ice
prob
abilit
y
B: S1n = 1350
124Theoretical
−9 −7 −5 −3 −1 1 3 5 7 90
0.2
0.4
0.6
0.8
1
δ (pixels)
Cho
ice
prob
abilit
y
C: S2n = 1620
124Theoretical
−9 −7 −5 −3 −1 1 3 5 7 90
0.2
0.4
0.6
0.8
1
δ (pixels)
Cho
ice
prob
abilit
y
D: S3n = 1350
124Theoretical
−9 −7 −5 −3 −1 1 3 5 7 90
0.2
0.4
0.6
0.8
1
δ (pixels)
Cho
ice
prob
abilit
y
E: S4n = 1620
124Theoretical
−9 −7 −5 −3 −1 1 3 5 7 90
0.2
0.4
0.6
0.8
1
δ (pixels)
Cho
ice
prob
abilit
y
F: S5n = 1620
124
−9 −7 −5 −3 −1 1 3 5 7 90
0.2
0.4
0.6
0.8
1
δ (pixels)
Cho
ice
prob
abilit
y
G: S6n = 1620
124Theoretical
−9 −7 −5 −3 −1 1 3 5 7 90
0.2
0.4
0.6
0.8
1
δ (pixels)
Cho
ice
prob
abilit
y
H: S7n = 3240
124Theoretical
Fig. 3. The same as in Fig. 2, except for exposure time, which was T = 1000 ms. Symbols marked as i = 1, 2, or 4 denote the number of circles with a changed size in therespective stimulus condition.
J. Allik et al. / Vision Research 101 (2014) 34–40 37
subjects, three separate curves added 0.24% of explained variance(compared to when the data were described by only one curve).This indicates that most observers do indeed rely, in making theirdecisions, on the mean size difference, almost completely ignoringthe size of the individual circles. It is important to remember that,in terms of the size of individual circles, these three conditions areradically different. In the condition where the total increment wasadded to or subtracted from only one element (4, 0, 0, 0), the onlyjust detectable size difference in diameter was four times largerthan when the increment or decrement was equally distributedbetween all four elements (1, 1, 1, 1). Had this outlying circle beenpresented alone, it would have been easily detected as conspicu-ously different from the reference. Consequently, the presence ofother circles masks the outlier, at least when the observer is busywith the estimation of the mean size and has no time for scrutiniz-ing each element in isolation.
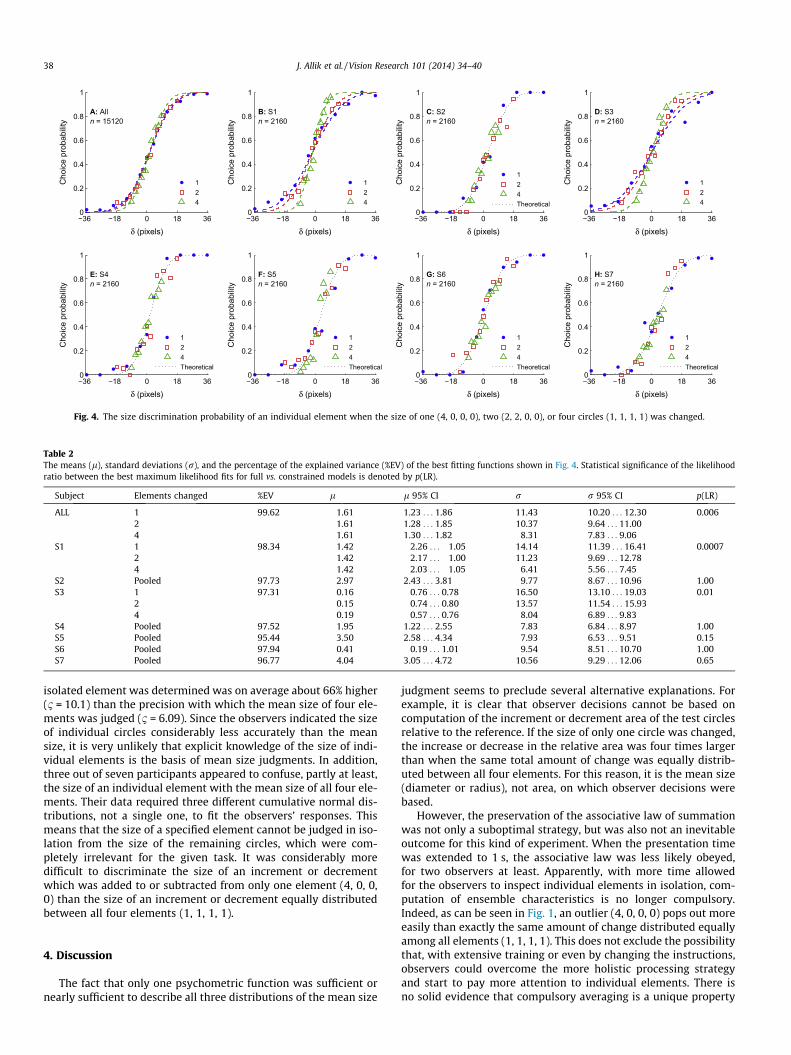
It could be argued that, since the observers were asked to makejudgments about the mean, it is not necessarily the case that theycould not access the individual sizes if they wanted to. It could beclaimed that they dutifully followed instructions and ignored theindividual sizes, even if these sizes were clearly above their indi-vidual discrimination threshold. What is obviously needed is todemonstrate that the observers had no or only a limited accessto the sizes of individual elements, even if they are directly askedabout it. Fig. 4 shows the psychometric functions obtained inresponse to the instruction to judge whether the size of the indi-cated circle was larger or smaller than the previously seen refer-ence circle. The parameters of these functions are shown inTable 2. If the observer can attend to the size of each element sep-arately, then it is expected that a psychometric function with aslope at least as steep as in the mean size judgment task wouldbe obtained. However, the precision with which the size of an
−36 −18 0 18 360
0.2
0.4
0.6
0.8
1
δ (pixels)
Cho
ice
prob
abilit
y
A: Alln = 15120
124
−36 −18 0 18 360
0.2
0.4
0.6
0.8
1
δ (pixels)C
hoic
e pr
obab
ility
B: S1n = 2160
124
−36 −18 0 18 360
0.2
0.4
0.6
0.8
1
δ (pixels)
Cho
ice
prob
abilit
y
C: S2n = 2160
124Theoretical
−36 −18 0 18 360
0.2
0.4
0.6
0.8
1
δ (pixels)
Cho
ice
prob
abilit
y
D: S3n = 2160
124
−36 −18 0 18 360
0.2
0.4
0.6
0.8
1
δ (pixels)
Cho
ice
prob
abilit
y
E: S4n = 2160
124Theoretical
−36 −18 0 18 360
0.2
0.4
0.6
0.8
1
δ (pixels)
Cho
ice
prob
abilit
y
F: S5n = 2160
124Theoretical
−36 −18 0 18 360
0.2
0.4
0.6
0.8
1
δ (pixels)C
hoic
e pr
obab
ility
G: S6n = 2160
124Theoretical
−36 −18 0 18 360
0.2
0.4
0.6
0.8
1
δ (pixels)
Cho
ice
prob
abilit
y
H: S7n = 2160
124Theoretical
Fig. 4. The size discrimination probability of an individual element when the size of one (4, 0, 0, 0), two (2, 2, 0, 0), or four circles (1, 1, 1, 1) was changed.
Table 2The means (l), standard deviations (r), and the percentage of the explained variance (%EV) of the best fitting functions shown in Fig. 4. Statistical significance of the likelihoodratio between the best maximum likelihood fits for full vs. constrained models is denoted by p(LR).
Subject Elements changed %EV l l 95% CI r r 95% CI p(LR)
ALL 1 99.62 1.61 1.23 . . . 1.86 11.43 10.20 . . . 12.30 0.0062 1.61 1.28 . . . 1.85 10.37 9.64 . . . 11.004 1.61 1.30 . . . 1.82 8.31 7.83 . . . 9.06
S1 1 98.34 �1.42 �2.26 . . . �1.05 14.14 11.39 . . . 16.41 0.00072 �1.42 �2.17 . . . �1.00 11.23 9.69 . . . 12.784 �1.42 �2.03 . . . �1.05 6.41 5.56 . . . 7.45
S2 Pooled 97.73 2.97 2.43 . . . 3.81 9.77 8.67 . . . 10.96 1.00S3 1 97.31 0.16 �0.76 . . . 0.78 16.50 13.10 . . . 19.03 0.01
2 0.15 �0.74 . . . 0.80 13.57 11.54 . . . 15.934 0.19 �0.57 . . . 0.76 8.04 6.89 . . . 9.83
S4 Pooled 97.52 1.95 1.22 . . . 2.55 7.83 6.84 . . . 8.97 1.00S5 Pooled 95.44 3.50 2.58 . . . 4.34 7.93 6.53 . . . 9.51 0.15S6 Pooled 97.94 0.41 �0.19 . . . 1.01 9.54 8.51 . . . 10.70 1.00S7 Pooled 96.77 4.04 3.05 . . . 4.72 10.56 9.29 . . . 12.06 0.65
38 J. Allik et al. / Vision Research 101 (2014) 34–40
isolated element was determined was on average about 66% higher(1 = 10.1) than the precision with which the mean size of four ele-ments was judged (1 = 6.09). Since the observers indicated the sizeof individual circles considerably less accurately than the meansize, it is very unlikely that explicit knowledge of the size of indi-vidual elements is the basis of mean size judgments. In addition,three out of seven participants appeared to confuse, partly at least,the size of an individual element with the mean size of all four ele-ments. Their data required three different cumulative normal dis-tributions, not a single one, to fit the observers’ responses. Thismeans that the size of a specified element cannot be judged in iso-lation from the size of the remaining circles, which were com-pletely irrelevant for the given task. It was considerably moredifficult to discriminate the size of an increment or decrementwhich was added to or subtracted from only one element (4, 0, 0,0) than the size of an increment or decrement equally distributedbetween all four elements (1, 1, 1, 1).
4. Discussion
The fact that only one psychometric function was sufficient ornearly sufficient to describe all three distributions of the mean size
judgment seems to preclude several alternative explanations. Forexample, it is clear that observer decisions cannot be based oncomputation of the increment or decrement area of the test circlesrelative to the reference. If the size of only one circle was changed,the increase or decrease in the relative area was four times largerthan when the same total amount of change was equally distrib-uted between all four elements. For this reason, it is the mean size(diameter or radius), not area, on which observer decisions werebased.
However, the preservation of the associative law of summationwas not only a suboptimal strategy, but was also not an inevitableoutcome for this kind of experiment. When the presentation timewas extended to 1 s, the associative law was less likely obeyed,for two observers at least. Apparently, with more time allowedfor the observers to inspect individual elements in isolation, com-putation of ensemble characteristics is no longer compulsory.Indeed, as can be seen in Fig. 1, an outlier (4, 0, 0, 0) pops out moreeasily than exactly the same amount of change distributed equallyamong all elements (1, 1, 1, 1). This does not exclude the possibilitythat, with extensive training or even by changing the instructions,observers could overcome the more holistic processing strategyand start to pay more attention to individual elements. There isno solid evidence that compulsory averaging is a unique property
J. Allik et al. / Vision Research 101 (2014) 34–40 39
of thinking fast or System 1 (Kahneman, 2011), but it is more likelythat a deliberate and slow system (System 2) can overrule the firstsystem if there is enough time, opportunity, and training for itsoperation.
The fact that the size of individual elements was determinedless accurately than the mean size of all four elements suggeststhat mean size judgments cannot be based on the knowledge thatparticipants had about the size of individual elements. This seems,again, to suggest that the observer may have only partial knowl-edge about the size of individual elements (Allik et al., 2013). Thisresult is in agreement with previous studies which have alsoshown that a fairly good discrimination of the mean size can beachieved even when observers cannot exactly recall the size ofindividual elements (Ariely, 2001; Chong & Treisman, 2003;Corbett & Oriet, 2011). Only when the summary size differencereached a critical level did observers reliably discriminate themean difference from the reference size. Awareness of the size ofindividual elements seems to be partially blocked by the presenceof other elements, at least when presentation time is short or theobserver has no prior knowledge about which of the four elementsis selected for judgment. The other side of the same coin is obliga-tory averaging (Oriet & Brand, 2013). The presence of otherelements does not lead to loss of information, as it seems to behappening as part of another perceptual phenomenon known asvisual crowding (Banno & Saiki, 2012; Levi, 2008; Pelli,Palomares, & Majaj, 2004). In the judgment of mean size, we areobviously dealing with compulsory averaging, where individualsize information is not lost but rather combined into a perceptionof an ensemble characteristic (Allik et al., 2013; Oriet & Brand,2013).
A comparison between the tasks to judge individual and meansizes reveals powerful constraints imposed on visual processingwhich arise when observers are instructed to carry out a task towhich the visual system is not adapted (Morgan, Hole, &Glennerster, 1990). It is remarkable that the visual system seemsto be well adapted to estimate the mean size of elements, but lar-gely constrained when observers are instructed to judge the sizeone of these elements. The processing of size information seemsto be constrained to only one measure at a time, with a preferencefor mean size rather than the individual measures from which it isassembled. It cannot be excluded that there are evolutionaryadvantages for the preference for mean size representation overany individual representation as a more useful and reliable sourceof information.
One likely consequence for these representation constraints isobligatory averaging, a not unknown concept in the explanationof visual perception (Allik et al., 2013; Oriet & Brand, 2013). Forexample, it was previously reported that, despite their inabilityto report the orientation of an individual patch, observers can reli-ably estimate average orientation, demonstrating that orientationinformation is pooled, even though components may not be indi-vidually identifiable (Parkes et al., 2001). There is also evidencethat compulsory pooling operates, for example, in selecting loca-tion for saccade landing (Van der Stigchel, Heeman, & Nijboer,2012) and motion direction in random-dot patterns (Allik &Dzhafarov, 1984), but a direct proof of compulsory pooling in theperception of mean size was reported only recently (Allik et al.,2013; Oriet & Brand, 2013). Since mean size discrimination perfor-mance depends critically on total size difference, not on how thistotal difference is distributed among individual elements, it is alsopossible to conclude that compulsory pooling of size informationhappens before information about size reaches awareness. Also,it may not have escaped the reader’s attention that, by testingthe associative law of summation, this study provided rigorousproof for the perception of ensemble characteristics, which has,
thus far, more often been presumed than meticulously demon-strated (Allik et al., 2013).
One relatively surprising discovery is that the perception ofensemble characteristics happens during focused attention. Usu-ally the computation of ensemble characteristics is perceived as atool for surpassing the capacity limitations of focused attention.In this and previous (Allik et al., 2013) studies, however, the oblig-atory averaging of information is fully operational when the num-ber of processed elements does not exceed the capacity ofinformation processing. Four elements are clearly within the limitsof both focused attention and short-term memory (Allik et al.,2013; Cowan, 2001; Miller, 1956). This seems to suggest thatresearchers who have advocated for the perception of ensemblecharacteristics were partly wrong in assuming, tacitly at least, thatthe existence of this ability automatically implies an effortless andmassively parallel processing capability which can surpass afocused attention bottleneck (Alvarez, 2011; Ariely, 2001). Amongthe general public and some researchers, it has become fashionableto argue that intuitive and automatic methods of cognition aresuperior to more deliberate and analytic methods (cf. Chabris &Simons, 2010; Kahneman, 2011). However, just as inconsistentare those researchers who may have thought that the focusedattention strategy is incompatible with the perception of ensemblecharacteristics (Allik et al., 2013; Myczek & Simons, 2008; Simons& Myczek, 2008). Perhaps the most pertinent result of this report isthe observation that focused attention and the perception ofensemble characteristics do not exclude each other. The observercan concentrate on a small number of elements but neverthelessperceive them in a holistic manner by extracting attributes whichbelong to a group of elements, not to any of them in isolation.
Acknowledgments
This research was supported by a grant from the EstonianMinistry of Science and Education (IUT2-13). We are grateful toDelaney Skerrett for helpful suggestions and two anonymousreviewers for valuable comments.
References
Allik, J., & Dzhafarov, E. N. (1984). Motion direction identification in randomcinematograms: A general-model. Journal of Experimental Psychology – HumanPerception and Performance, 10(3), 378–393. http://dx.doi.org/10.1037//0096-1523.10.3.378.
Allik, J., Toom, M., Raidvee, A., Averin, K., & Kreegipuu, K. (2013). An almost generaltheory of mean size perception. Vision Research, 83, 25–39. http://dx.doi.org/10.1016/j.visres.2013.02.018.
Alvarez, G. A. (2011). Representing multiple objects as an ensemble enhances visualcognition. Trends in Cognitive Sciences, 15(3), 122–131. http://dx.doi.org/10.1016/j.tics.2011.01.003.
Alvarez, G. A., & Oliva, A. (2008). The representation of simple ensemble visualfeatures outside the focus of attention. Psychological Science, 19(4), 392–398.http://dx.doi.org/10.1111/j.1467-9280.2008.02098.x.
Ariely, D. (2001). Seeing sets: Representation by statistical properties. PsychologicalScience, 12(2), 157–162. http://dx.doi.org/10.1111/1467-9280.00327.
Banno, H., & Saiki, J. (2012). Calculation of the mean circle size does not circumventthe bottleneck of crowding. Journal of Vision, 12(11). http://dx.doi.org/10.1167/12.11.13.
Chabris, C. F., & Simons, D. J. (2010). The invisible gorilla: And other ways our intuitionsdeceive us. New York: Crown.
Chong, S. C., Joo, S. J., Emmanouil, T. A., & Treisman, A. (2008). Statistical processing:Not so implausible after all. Perception and Psychophysics, 70(7), 1327–1334.http://dx.doi.org/10.3758/pp.70.7.1327.
Chong, S. C., & Treisman, A. (2003). Representation of statistical properties. VisionResearch, 43(4), 393–404. http://dx.doi.org/10.1016/S0042-6989(02)00596-5.
Chong, S. C., & Treisman, A. (2005). Attentional spread in the statistical processing ofvisual displays. Perception and Psychophysics, 67(1), 1–13. http://dx.doi.org/10.3758/BF03195009.
Corbett, J. E., & Oriet, C. (2011). The whole is indeed more than the sum of its parts:Perceptual averaging in the absence of individual item representation. ActaPsychologica, 138(2), 289–301. http://dx.doi.org/10.1016/j.actpsy.2011.08.002.
40 J. Allik et al. / Vision Research 101 (2014) 34–40
Corbett, J. E., Wurnitsch, N., Schwartz, A., & Whitney, D. (2012). An aftereffect ofadaptation to mean size. Visual Cognition, 20(2), 211–231. http://dx.doi.org/10.1080/13506285.2012.657261.
Cowan, N. (2001). The magical number 4 in short-term memory: A reconsiderationof mental storage capacity. Behavioral and Brain Sciences, 24(1), 87–114. http://dx.doi.org/10.1017/S0140525X01003922.
Fouriezos, G., Rubenfeld, S., & Capstick, G. (2008). Visual statistical decisions.Perception and Psychophysics, 70(3), 456–464. http://dx.doi.org/10.3738/pp.70.3.456.
Im, H. Y., & Halberda, J. (2012). The effects of sampling and internal noise on therepresentation of ensemble average size. Attention, Perception, andPsychophysics, 1–9. http://dx.doi.org/10.3758/s13414-012-0399-4.
Jacoby, O., Kamke, M. R., & Mattingley, J. B. (2012). Is the whole really more than thesum of its parts? Estimates of average size and orientation are susceptible toobject substitution masking. Journal of Experimental Psychology: HumanPerception and Performance. http://dx.doi.org/10.1037/a0028762.
Joo, S. J., Shin, K., Chong, S. C., & Blake, R. (2009). On the nature of the stimulusinformation necessary for estimating mean size of visual arrays. Journal ofVision, 9(9). http://dx.doi.org/710.1167/9.9.7.
Kahneman, D. (2011). Thinking fast and slow. New York: Farrar, Straus and Giroux.Levi, D. M. (2008). Crowding – An essential bottleneck for object recognition: A
mini-review. Vision Research, 48(5), 635–654. http://dx.doi.org/10.1016/j.visres.2007.12.009.
Marchant, A. P., Simons, D. J., & de Fockert, J. W. (2013). Ensemble representations:Effects of set size and item heterogeneity on average size perception. ActaPsychologica, 142(2), 245–250. http://dx.doi.org/10.1016/j.actpsy.2012.11.002.
Miller, G. A. (1956). The magical number seven, plus or minus two: Some limits onour capacity for processing information. Psychological Review, 63, 81–97.
Morgan, M. J., Hole, G. J., & Glennerster, A. (1990). Biases and sensitivities ingeometrical illusions. Vision Research, 30(11), 1793–1810. http://dx.doi.org/10.1016/0042-6989(90)90160-m.
Myczek, K., & Simons, D. J. (2008). Better than average: Alternatives to statisticalsummary representations for rapid judgments of average size. Perception andPsychophysics, 70(5), 772–788. http://dx.doi.org/10.3758/pp.70.5.772.
Oriet, C., & Brand, J. (2013). Size averaging of irrelevant stimuli cannot be prevented.Vision Research, 79, 8–16. http://dx.doi.org/10.1016/j.visres.2012.12.004.
Parkes, L., Lund, J., Angelucci, A., Solomon, J. A., & Morgan, M. (2001). Compulsoryaveraging of crowded orientation signals in human vision. Nature Neuroscience,4(7), 739–744. http://dx.doi.org/10.1038/89532.
Pelli, D. G., Palomares, M., & Majaj, N. J. (2004). Crowding is unlike ordinarymasking: Distinguishing feature integration from detection. Journal of Vision,4(12), 1136–1169. http://dx.doi.org/10.1167/4.12.12.
Simons, D. J., & Myczek, K. (2008). Average size perception and the allure of a newmechanism. Perception and Psychophysics, 70(7), 1335–1336. http://dx.doi.org/10.3758/pp.70.7.1335.
Solomon, J. A., Morgan, M., & Chubb, C. (2011). Efficiencies for the statistics of sizediscrimination. Journal of Vision, 11(12), 13. http://dx.doi.org/10.1167/11.12.13.11–11.
Spencer, J. (1961). Estimating averages. Ergonomics, 4, 317–328.Spencer, J. (1963). A further study of estimating averages. Ergonomics, 6, 255–265.Van der Stigchel, S., Heeman, J., & Nijboer, T. C. W. (2012). Averaging is not
everything: The saccade global effect weakens with increasing stimulus size.Vision Research, 62, 108–115. http://dx.doi.org/10.1016/j.visres.2012.04.003.
Whiting, B. F., & Oriet, C. (2011). Rapid averaging? Not so fast! Psychonomic Bulletinand Review, 18(3), 484–489. http://dx.doi.org/10.3758/s13423-011-0071-3.
Zhang, W. W., & Luck, S. J. (2008). Discrete fixed-resolution representations in visualworking memory. Nature, 453(7192). http://dx.doi.org/10.1038/nature06860.233-U213.
Related Documents