Welcome message from author
This document is posted to help you gain knowledge. Please leave a comment to let me know what you think about it! Share it to your friends and learn new things together.
Transcript

International Doctoral School
Joana Filipa Correia de Almeida
OBESIT Y AND BRAIN CA NCER:
U NVEILING MOLEC U LAR MECHANISMS OF
INF LAMMATORY AND ANG IOGENIC PATHWAYS IN G LIOMA
Supervised by:
Maria Cristina Prudêncio Pereira Soares, PhD, MD
Rúben Miguel Pereira Fernandes, PhD
2019

International Doctoral School
Joana Filipa Correia de Almeida
OBESIT Y AND BRAIN CA NCER:
U NVEILING MOLEC U LAR MECHANISMS OF
INF LAMMATORY AND ANG IOGENIC PATHWAYS IN G LIOMA
Supervised by:
Maria Cristina Prudêncio Pereira Soares, PhD, MD
Rúben Miguel Pereira Fernandes, PhD
2019

International Doctoral School
Cristina Prudêncio y Rúben Fernandes,
DECLARES that the present work, entitled “Obesity and brain cancer: unveiling
molecular mechanisms of inflammatory and angiogenic pathways in glioma”,
submitted by Joana Filipa Correia de Almeida to obtain the title of Doctor, was carried
out under their supervision in the PhD programme “Biotecnoloxía Avanzada”. This is a
joint PhD programme integrating the University of Vigo and Escola Superior de Saúde
– Politécnico do Porto.
Vigo, 12 de Julio de 2019
The supervisors,
Dr. Cristina Prudêncio Dr. Rúben Fernandes


“Nothing in life is to be feared, it is only to be understood.
Now is the time to understand more, so that we can fear less.”
Marie Curie

1
TABLE OF CONTENTS
Table of contents ...........................................................................................................................1
Acknowledgements ........................................................................................................................5
Abbreviations .................................................................................................................................7
Abstract ....................................................................................................................................... 11
Chapter One ................................................................................................................................ 13
Brain tumors .................................................................................................................................. 14
Adipose tissue as an endocrine organ ......................................................................................... 17
An epidemic called obesity, inflammasome and adipocytokines .................................................. 23
Sphingolipids in obesity: ceramide and sphingosine-1-phosphate ............................................... 26
Aims of the study ......................................................................................................................... 33
Framework .................................................................................................................................... 34
Chapter Two ................................................................................................................................ 35
2.1. Material and Methods......................................................................................................... 37
Cell culture and in vitro treatment .......................................................................................... 37
Adipocyte cell culture and conditioning ................................................................................. 37
2
Proteomics analysis by 2D-PAGE and MS-MALDI-TOF Spectrometry ................................ 38
Chemicals .............................................................................................................................. 38
Sample preparation for 2D-PAGE ......................................................................................... 39
In-Gel Protein Digestion ........................................................................................................ 40
MALDI-TOF-MS analysis ....................................................................................................... 41
Data analysis and database searching ................................................................................. 42
Proteome Profiler™ Array Assay .......................................................................................... 42
Statistical analysis ................................................................................................................. 43
2.2. Results ........................................................................................................................... 44
Differentially Expressed Proteins .......................................................................................... 44
Expression proteomic profile of GL261 conditioned medium ................................................ 45
2.3. Discussion ...................................................................................................................... 49
Chapter Three .............................................................................................................................. 53
3.1. Material and Methods ..................................................................................................... 54
Cell culture ............................................................................................................................. 54
Syngeneic mouse model of glioma ....................................................................................... 54
Protein microarrays ............................................................................................................... 55
Immunohistochemistry on FFPE tissue sections for IL1β, IL6, Ob, PDGFA and TNFα ........ 56
Statistical analysis ................................................................................................................. 56
3
3.2. Results ........................................................................................................................... 57
Proteomic alterations in glioma exposed to adipocyte secretome ........................................ 57
3.3. Discussion ...................................................................................................................... 61
Inflammatory and angiogenic pathways in glioma: a cellular and an animal model ............. 61
Expression proteomic profile of GL261 conditioned medium ................................................ 61
Morphologic analysis ............................................................................................................. 62
Immunohistochemical evaluation of IL1β, IL6, Ob, PDGFA and TNFα on adipose and tumoral
tissue of syngeneic C57Bl/6J mice ........................................................................................ 63
Chapter Four................................................................................................................................ 67
4.1. Material and Methods ..................................................................................................... 68
Tandem Mass Spectrometry for Ceramide and S1P ............................................................ 68
Extraction of sphingolipids from mice plasma ....................................................................... 69
Quantification of sphingolipids by UPLC-MS / MS of mouse plasma.................................... 69
Clinical biochemical markers ................................................................................................. 70
Histochemistry of hepatic tissue: Haematoxylin-Eosin and Sirius Red ................................. 70
Statistical analysis ................................................................................................................. 70
4.2. Results ........................................................................................................................... 71
Sphingolipids alterations in obese mice ................................................................................ 71
4.3. Discussion ...................................................................................................................... 76
4
High-fat diet decreases sphingosine-1-phosphate ................................................................ 76
Hepatic enzymes and lipoproteins levels increase with obesity............................................ 79
Morphologic analysis ............................................................................................................. 81
Chapter Five ................................................................................................................................ 83
Bibliographic references ............................................................................................................... 89
Appendixes ................................................................................................................................ 117
I. Summary ...................................................................................................................................i
II. Resumen ................................................................................................................................ vii
III. Publication I ....................................................................................................................... xiii
IV. Publication II .................................................................................................................... xlvii
V. Awards ........................................................................................................................... lxxxv
5
ACKNOWLEDGEMENTS
I am thankful to Professora Doutora Cristina Prudêncio for the tutoring and careful review, the sharing
of knowledge, enlightenment in the most stalling moments, for always having a cheerful word and
patience through all these years.
I would like to thank Professor Doutor Rúben Fernandes for the tutoring and careful review, the
sharing of knowledge, enlightenment in the most stalling moments, for always having a new idea to
pursue and patience through all these years.
I am thankful to Professor Doutor Pedro Coelho, a friend and a mentor, for all the teaching and
companionship through all these years, for all of the personal time spent on the laboratory helping
with this project and many others in the meanwhile.
Thank you, Professor Doutora Raquel Soares, for always being available to give new insights and
advice. I am also thankful for always having supported all my studies at Department of Biochemistry
and at the Animal Facilities of Faculty of Medicine of University of Porto.
To all my colleagues in Escola Superior de Saúde and Faculty of Medicine, thank you for the
companionship and support through the most insane of laboratory and lecturing times, and all the
scientific support and after-hours company on the laboratory.

6
I am thankful to Professora Doutora Carmen Sieiro and Diana Valverde of University of Vigo for the
scientific and pedagogic guidance through this doctorate.
To all my friends, here and abroad, thank you for all the great moments, understanding and
acceptance of all the denied time. I am also thankful for all scientific and mental help by my
everlasting friends and PhD partners Luísa Marinho e Raquel Pinho.
Most of all, I will always be thankful to my family for all the unconditional support through, not all
these years, but all my life. I am most thankful to my mother for all the enlightenment in the darkest
moments. It would not have been possible any other way.

7
ABBREVIATIONS
AKT Protein Kinase B
ANXA-2 Annexin A2
AT Adipose Tissue
BAT Brown Adipose Tissue
CGl Conditioned medium from Glioma
CHOL Cholesterol
DNA Deoxyribonucleic Acid
DTT di-dithiothreitol
ECM Endothelial Cell Matrix
EGF Endothelial Growth Factor
ERK Extracellular signal-Regulated Kinase
FFA Free-Fatty Acids
FGF Fibroblast Growth Factor
GWAS Genome-Wide Association Studies
HDL High Density Lipoprotein
HFD High-Fat Diet
HGF Hepatocyte Growth Factor
8
HIF-1α Hypoxia-Induced Factor one alpha
hnRNP L Heterogeneous nuclear ribonucleoprotein L
IAA Iodoacetamide
IARC International Agency for Research on Cancer
IGF Insulin Growth Factor
IL Interleukin
KIF5C Kinesin Family Member 5C
LDL Low Density Lipoprotein
LIF Leukocyte Inhibitor Factor
MALDI-TOF-MS
Matrix Assisted Laser Desorption/Ionization – Time Of Flight – Mass
Spectrometry
MMP Matrix Metalloproteinase
n.s. Non-significant
NAFLD Non-alcoholic fatty liver disease
NASH Non-alcoholic steatohepatitis
NCGl Non-Conditioned medium from Glioma
ND Normal Diet
NF-Kβ Necrosis Factor kappa beta
N-RAP Nebulin-related-anchoring protein (NRAP)
9
PAGE Poly-Acrylamide Gel Electrophoresis
PAI-1 Plasminogen Activator Inhibitor one
PDGF Platelet-Derived Growth Factor
PGK1 Phosphoglycerate Kinase 1 (PGK1)
PMF Peptide Mass Fingerprint
RACK1 Guanine nucleotide-binding protein subunit beta-2-like 1
RANTES Regulated on Activation, Normal T Cell Expressed and Secreted
RBP-4 Retinol Binding Protein 4
RFC1 Replication factor C subunit
ROS Reactive Oxidative Species
S1P Sphingosine-1-Phosphate
S1PR Sphingosine-1-Phosphate Receptor
SAT Subcutaneous Adipose Tissue
SGPP Sphingosine-1-Phosphate Phosphatase
SpK Sphingosine Kinase
ST1 Stress-induced phosphoprotein 1
TCA Tri-Carboxylic Acid
TGA Triglycerides
TIMP-1 Tissue Inhibitor Metalloproteinases
10
TNFα Tumor Necrosis Factor alpha
VAT Visceral Adipose Tissue
VEGF Vascular Endothelial Growth Factor
VLDL Very-Low Density Lipoprotein
WAT White Adipose Tissue
WHO World Health Organization

11
ABSTRACT
Gliomas represent the most common primary malignant brain tumors in adults, with an extremely
poor prognosis. Despite its high morbidity, the etiology of glioma remains largely unknown. Obesity,
favoured by the modern lifestyle, acquired epidemic proportions nowadays, and has been associated
with various major causes of death and morbidity including malignant neoplasms. So, there might be
a relationship between the increased incidence of gliomas and dysfunction of adipose tissue. The
present study begins with 3T3-L1 adipocytes in culture, and its conditioned medium (adipokines-
enriched medium), then it is disclosed adipocyte-released factors related with glioma growth,
hormones, metabolic and angiogenic behavior by MALDI-TOF-MS and proteomic array analysis.
Formerly, it is studied some modified cytokines on adipose tissue from diet-induced obese C57Bl/6J
mice. To conclude, it is analysed the sphingolipid profile, namely ceramides and sphingosine-1-
phosphate levels on normal and obese diet-induced mice serum, as well as liver function, lipid profile
and uric acid and glucose. Adipocyte cells overexpressed several pro-inflammatory and angiogenic
factors, such as IL6, IL11, LIF, TNFα, endocan, HGF, IGF1 and VEGF. Nevertheless, they
underexpressed TIMP-1, SerpinE1, coagulation factor III, endostatin, PDGFA and ADAMTS1. On
adipose tissue, IL6, Ob (Y-20) and TNFα were overexpressed in HFD group, while IL1β and PDGFA
were underexpressed. On tumoral tissue, IL6 did not present significant variation, though IL1β and
Ob tended to be overexpressed while TNFα and PDGFA disposed to be underexpressed.

12
Sphingolipid analysis, as well as liver function, reinforces the premise that excessive dietary intake
worsens metabolic syndrome in general and, more precisely, chronic low-grade inflammation.
Relationship between obesity and cancer is paradoxical, however it is strengthened the idea on
obesity protecting against glioma only at initiation and proliferation phases.
Keywords: brain cancer, C57Bl/6J, obesity, obesomics.

13
CHAPTER ONE
State of the art
14
Brain tumors
Gliomas, the most common primary malignant brain tumors in adults, represent 30% of all brain
tumors and 80% of all malignant brain tumors [1]. Prognosis is extremely poor, with a median survival
time of approximately 12 to 15 months and is almost invariably fatal, and its aftermath on cognitive
function and life quality is increasingly degrading over time [2,3]. Gliomas increase in frequency with
age, and affect preferentially men [2,4,5]. Genetic factors in glioma etiology are poorly understood;
less than 5% of glioma cases are familial in origin, with only a few described by rare genetic
syndromes [6]. Gliomas are heterogeneous and are typically classified according to World Health
Organization (WHO) tumor grade, and also classified on the basis of cellular lineage: astrocytic,
oligodendroglial, and mixed tumors [7]. Histologically, gliomas are tumors of the central nervous
system, classified by WHO in four groups, according to progressively increasing degree of
aggressiveness, anaplasia and undifferentiation. WHO grade I (pilocytic astrocytoma, subependymal
giant cell astrocytoma, angiocentric glioma) and grade II (diffuse astrocytoma, oligodendrogliomas
and oligoastrocytomas) tumors represent the more differentiated neoplasms with better prognosis,
when diagnosed in a precocial moment, without which, unvaryingly progress to a higher grade
overtime; WHO grade III tumors (anaplastic variants of astrocytoma, oligodendroglioma and
oligoastrocytoma), and the most aggressive of all, WHO grade IV tumors (diffuse midline glioma and
glioblastoma and its variants) [8,9].
15
Malignant gliomas represent a complex process of cumulative genetic alterations due to intrinsic and
environmental factors. However, genome-wide association studies (GWAS) reveal that a myriad of
genes is only scarcely related to glioma development, reflecting molecular heterogeneity. Regarding
classic glioblastoma, the most studied malignant glioma, there are some chromosome mutations,
namely in EGFR, NF-κβ, PDGFRA, among many others. Glioma behavioral and biological
processes are complex and poorly understood. Its microenvironment and interactions with adjacent
cells and tissue proteins (inflammatory, immunological and others) has recently began to be closely
studied. Even though, due to its high heterogeneity, available therapies only benefit a small subgroup
of tumors [1,3,10,11].
In 2001, different studies from the International Agency for Research into Cancer (IARC) and the
World Cancer Research Fund (WCRF) have reported a relationship and established a link between
obesity and cancer risk [12,13]. Excess adiposity is related to an increased the incidence and/or
death rates from a wide variety of human cancers, being the most common colon, rectum,
esophagus, kidney, pancreas, gallbladder, ovary, cervix, liver, prostate and certain hematopoietic
cancers [14,15]. Overweight and obesity are important risk factors for developing cancer and also
for cancer related mortality [16,17]. It is important to understand the pathophysiological mechanisms
involved in the link between obesity and cancer, in order to target future preventive and therapeutic
strategies for cancer in obese people [16].
16
Despite its high morbidity, the etiology of glioma remains largely unknown. Among several risk
factors, lifestyle was also recently identified as a major risk factor for the development of primary
glioma [18]. Consequently, there might be a relationship between its increasing and adipose tissue
dysfunction. Obesity, favored by the modern lifestyle, acquired epidemic proportions nowadays,
being associated and recognized as determinant in the development of different tumors. Concerning
central nervous system (CNS) tumors there has been an increasing association between obesity and
its contribution for their development, however glioma data has been inconsistent [19]. There is even
a disparity regarding diabetes as some studies found a protective status of diabetes against glioma.
Metabolic variations derived from obesity and its relationship with glioma development may be
complex and heterogeneous. It has been suggested that it may include insulin-growth-factor (IGF),
chronic inflammation and adipokines signaling [20]. Some studies analysed body weight in relation
to survival in glioma demonstrating higher death rates in patients with an excessive body weight [21].
Obesity, and in particular visceral obesity, plays a major role in the pathogenesis of several metabolic
disorders [22]. Genes that influence obesity are highly expressed in the brain and could also mediate
glioma susceptibility [18,23].
At present, the median patient survival in glioma cases are diminished (less than two years), even
with adequate care and safe resection following radio-chemotherapy with Temozolomide, an
alkylating agent approved. As previously mentioned, prognosis and treatments depend on the glioma
grade. Therefore, low-grade gliomas have better prognosis, being more sensitive to therapy (radio
17
and/or chemo) directed by molecular type, and after resection. On the other hand, most of the high-
grade gliomas are recognized by its resistance to therapy, namely additional therapies commonly
used against biological hallmarks of cancer [1,3].
Adipose tissue as an endocrine organ
Adipose tissue is now considered a dynamic endocrine organ, secreting fatty acids, hormones,
proteins, peptides, complement factors, and many bioactive substances referred as adipokines -
cytokines, chemokines and tissue products of enzyme activity - which act in an autocrine, paracrine
and/or endocrine mode [24]. The white adipose tissue (WAT) is constituted of approximately 50%
adipocytes, 10% macrophages, and 40% of preadipocytes, fibroblasts and endothelial and epithelial
cells [25]. All these cell types are responsible for adipokines’ secretion. All these factors are involved
in important physiological processes, particularly in the appetite regulation, energetic metabolism,
lipid and glucose metabolism, adipocyte differentiation, blood flow regulation and vascular and
lymphatic immune function. In case of fat increment due to a fatty diet, or metabolic dysfunction,
adipocytes can trigger an inflammatory reaction leading to lymphatic drainage failure by primary
capillaries. Thus, there are neutrophils, macrophages and other inflammatory mediators’
accumulation, as well as unregulated synthesis of adipokines (in particular pro-inflammatory) in the
tissue, which enhance inflammatory reactions and increasing of interstitial vessels. Macrophage
infiltration in obesity is directly related to the size of adipocytes, suggesting a modification of a non-
inflammatory phenotype to foam cells. In addition to secretion of inflammatory mediators such as
18
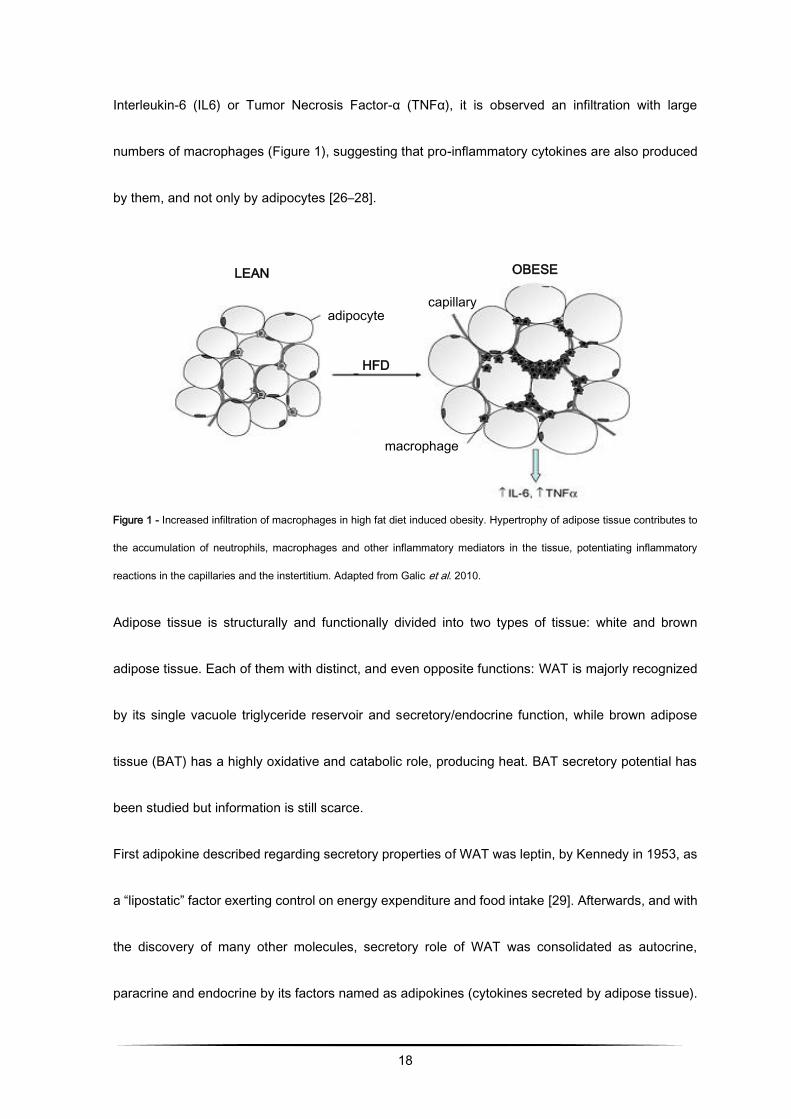
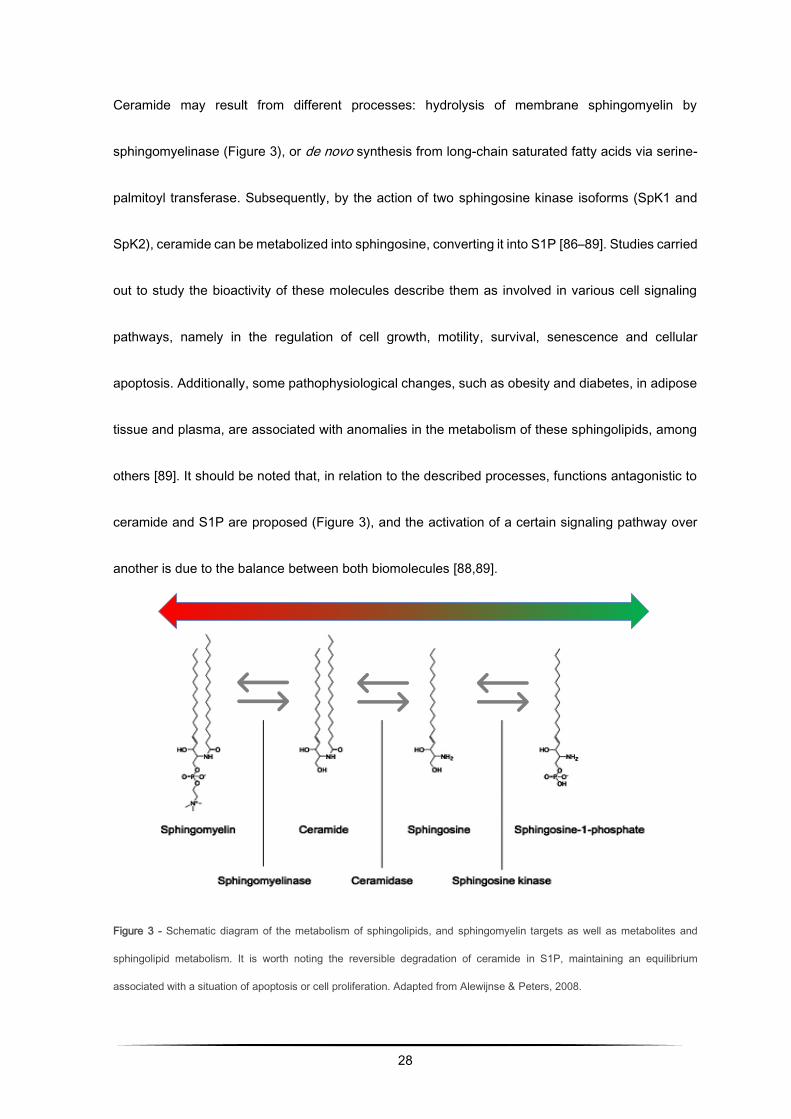
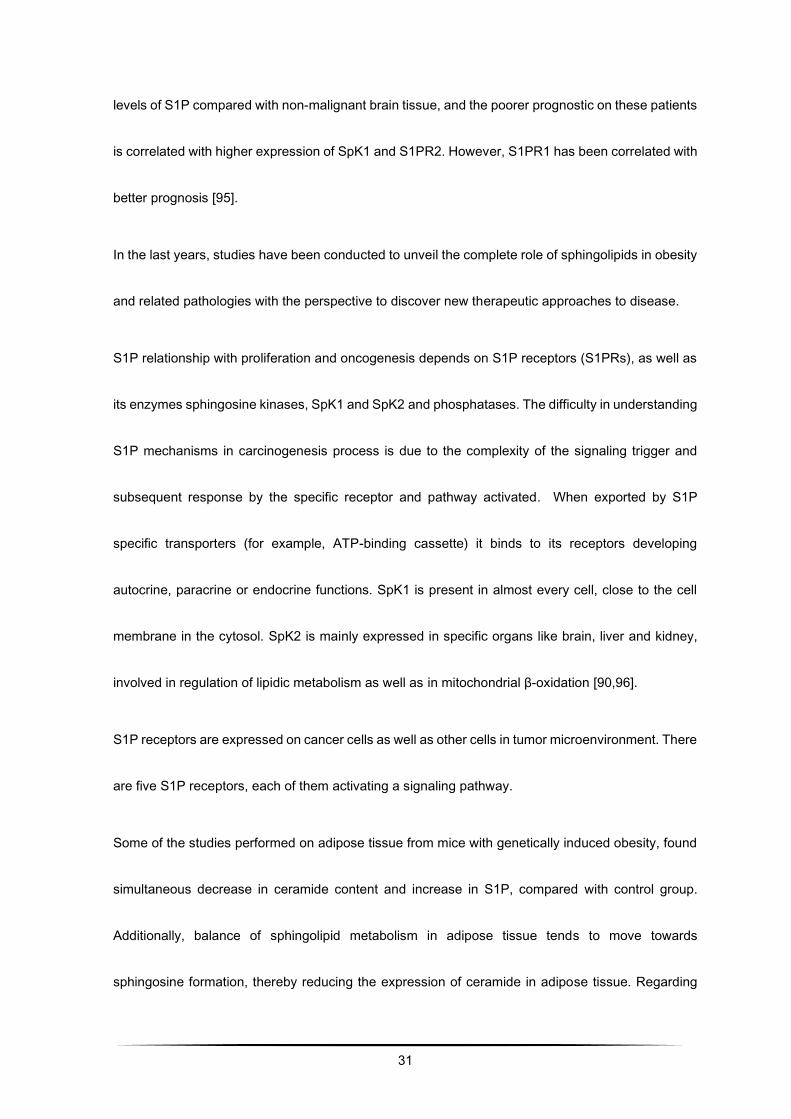
Interleukin-6 (IL6) or Tumor Necrosis Factor-α (TNFα), it is observed an infiltration with large
numbers of macrophages (Figure 1), suggesting that pro-inflammatory cytokines are also produced
by them, and not only by adipocytes [26–28].
Adipose tissue is structurally and functionally divided into two types of tissue: white and brown
adipose tissue. Each of them with distinct, and even opposite functions: WAT is majorly recognized
by its single vacuole triglyceride reservoir and secretory/endocrine function, while brown adipose
tissue (BAT) has a highly oxidative and catabolic role, producing heat. BAT secretory potential has
been studied but information is still scarce.
First adipokine described regarding secretory properties of WAT was leptin, by Kennedy in 1953, as
a “lipostatic” factor exerting control on energy expenditure and food intake [29]. Afterwards, and with
the discovery of many other molecules, secretory role of WAT was consolidated as autocrine,
paracrine and endocrine by its factors named as adipokines (cytokines secreted by adipose tissue).
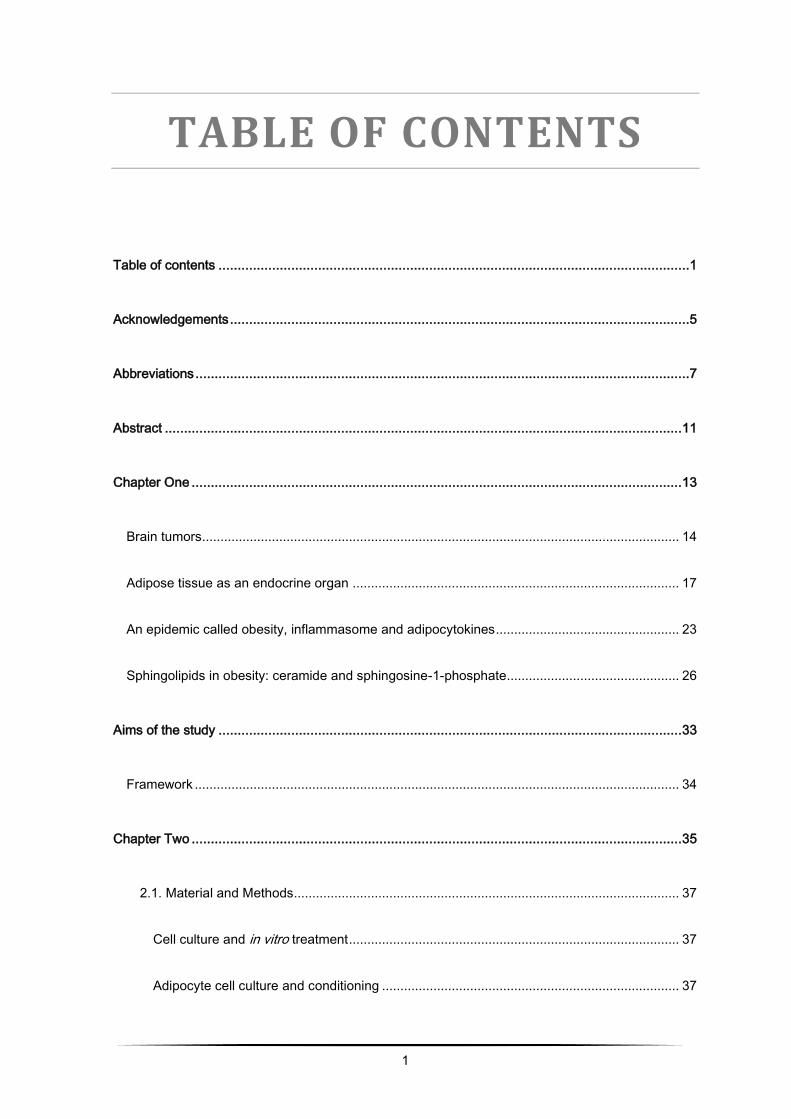
macrophage
HFD
adipocyte capillary
LEAN OBESE
Figure 1 - Increased infiltration of macrophages in high fat diet induced obesity. Hypertrophy of adipose tissue contributes to
the accumulation of neutrophils, macrophages and other inflammatory mediators in the tissue, potentiating inflammatory
reactions in the capillaries and the instertitium. Adapted from Galic et al. 2010.
19
Even if the term adipokine respects to molecules secreted by adipocytes, nowadays this term is used
not only for factors secreted by adipocytes, but also by macrophages and adipose stromal cells
(ASC).
Besides to adiponectin, an anti-inflammatory adipokine, WAT releases a myriad of molecules with
anti and pro-inflammatory effects. These molecules are often involved in insulin resistance and,
almost consequently, obesity and lipodystrophy through activation or inhibition of inflammation in
adipose tissue. Regarding this inflammatory state proportioned by obesity there are some
established adipokines of reference, namely hepatocyte growth factor (HGF), IGF, IL6, IL10, MCP1,
plasminogen activator inhibitor (PAI-1), RANTES, TGF-β, TNF-α, among many others with
predominant relevance in angiogenesis, such as leptin, vascular endothelial growth factor (VEGF),
fibroblast growth factor (FGF), IL1β, PlGF, visfatin, resistin, neuropeptide Y, leptin and angiopoietins,
as well as anti-angiogenic factors thrombospondin-1, or adiponectin. Some of the pro-inflammatory
factors act not only as insulin-resistance inducers, but also as endothelial enhancers of inflammation,
remodeling and proliferation of endothelial cells through inflammatory cell extravasation and
interaction with immune cells [30,31].
Regarding this inflammatory process, it is suggest by some authors that the number of dead
adipocytes and macrophages in adipose tissue increases with the increment in fat mass, being
related to inflammation due to obesity, since this is considered a low-grade inflammatory chronic
condition [26,32,33]. So, it is observed increasing in pro-inflammatory plasmatic cytokines in
20
response to adipocyte death and hypoxic areas of adipose tissue. Along with this increase, it is
possible that blood supply is compromised, making it insufficient. Thus, there are areas of adipocyte
hypoxia and subsequent inflammatory response that stimulates angiogenesis, in order to ensure the
maintenance of tissue fluid homeostasis. The cellular response to hypoxia is the production of the
transcription factor hypoxia-inducing factor-1 (HIF-1), which regulates several genes whose
expression is stimulated by cytokines such as TNFα and IL6. Some of target genes for HIF-1 are
VEGF-A, VEGF-C and VEGF-D, which play essential roles in the formation of new blood and lymph
vessels. Additionally, there is a strong association between the adipose tissue increase observed in
obesity, adipocyte hypoxia and stimulation of angiogenesis [34–36]. However, this topic will be
closely approached later on this chapter.
Concerning WAT anatomic distribution, it is classified in visceral adipose tissue (VAT) and
subcutaneous adipose tissue (SAT). Referring to healthy individuals, approximately 80% of the total
adipose tissue is located in subcutaneous depots, whereas VAT is accounted for 5-20%, depending
on gender (men are accountable for higher percentages of VAT when compared to women). More
than gender differences, this distribution also varies depending in age, race, genetics and disease
status [29]. Undeniably, the risk for metabolic dysfunction relies much more on its location than on
the total amount of fat. This is straightforward related to morphologic and functional differences
between the both. Regarding metabolic profile, and particularly adipokine expression, it was noted
that the patterns of secretion differ from VAT to SAT. This is, VAT is responsible for an increased
secretion of pro-inflammatory cytokines such as VEGF and IL6. This secretory differential expresses
21
the harmful potential of VAT on different organs/tissues, which is higher than the effects caused by
SAT [25,37]. The differences in adipokine metabolites expression contribute to changes in flow
systems, which may cause structural changes observed in different pathological cases. Out of these,
we highlight lipid disorders, diabetes, hypertension, atherosclerosis and hepatic disorders, which are
highly correlated with VAT increasing. Even hepatic disturbances are directly related to free fatty
acids (FFA) and pro-inflammatory adipokines released by this specific type of tissue [29,38].
Studies in mice have revealed a high correlation between increased adiposity and expression of a
significant number of genes typically expressed by macrophages. In these cases, both adipocyte
size and total body weight proved to be predictive about the number of macrophages found in
adipose tissue (ATM), which is bigger in comparison to that for VAT/SAT. It has also been established
an association between mice weight gain and infiltration of adipocytes by macrophages, and
subsequent production of pro-inflammatory factors by the AT. These inflammatory changes were
more visible in VAT, which is associated with a higher metabolic risk [39–41]. On the other hand,
according to these studies, it was suggested that SAT is associated with less physical stress and
pressure variations so that the inflammatory response in subcutaneous obesity state is smaller when
compared with a state visceral obesity [37,40]. It should be noted that the relationship between
visceral adipose tissue and the low-grade inflammation was also observed in humans.
Obesity is also associated with substantial modulation of adipose tissue structure, involving
adipogenesis, angiogenesis, and extracellular matrix remodeling [42]. Thus, AT can trigger blood
vessel formation, and in turn AT endothelial cells promote pre-adipocyte differentiation. Under
22
physiological circumstances, angiogenesis is important and natural to wound healing and
cellular/tissue growth. However, tumors depend on angiogenic processes to proliferate from benign
to malignant status [43–46]. Anti-angiogenic therapy has been a widely used strategy to fight tumor
growth, and has also been recently acknowledged as a potential therapeutic intervention for obesity
[11,32,47–49].
Furthermore, and concerning lipid diet content, evidence demonstrates that lipid metabolism is
dysregulated in obesity and there might be a common pathway between increased metabolic risk
and excessive nutritional intake and inflammation [50]. Increase in lipolysis in AT leads to higher
levels of FFA in plasma and contribute to fat deposition in liver and skeletal muscle, which may
promote systemic insulin resistance through several mechanisms, such as induction of oxidative
stress through incomplete oxidation and inflammatory responses [51]. AT is also recognized by its
endocrine function as producer of biological mediators. Enlargement of adipose tissue due to obesity
is characterized by a boosted inflammation and secretion of a myriad of adipokines and cytokines,
rising the search for potential biomarkers. It has been reported that high-fat diet induced obesity in
humans induce epigenetic modifications, which has a repercussion on protein expression and
cellular/tissue response [16,17,50]. There are several cytokines regarding cell proliferation,
angiogenesis, cytoskeletal rearrangement and survival. Some receptors and signaling pathways
have revealed to stimulate growth and invasiveness capacity of glioma cells, whereas others have
been correlated to blockage of glioma cell proliferation [12,16]. The mechanisms underlying the
associations between energy balance and cancer risk should be clarified.
23
The pathways involved in cell death and proliferation, angiogenic process in obesity and lipid profile
involve multiple transcription factors, receptors and signaling mediators. Accordingly, the approaches
for the study of lipid metabolism should be varied and complementary.
An epidemic called obesity, inflammasome and adipocytokines
Obesity has tripled since 1975 being already considered an epidemic of our days. According to WHO,
in 2016, more than 1,6 billion adults (18 and older) were overweight and more than 650 million were
obese; over 340 million children and adolescents were overweight or obese, as well as 41 million
children under 5 years old. Prevalence is continuously increasing, which has a great impact on global
health mainly through metabolic complications. Even further than these metabolic alterations, it is a
major cause for dyslipidemia due to increasing circulating lipids, as triglycerides and free fatty acids,
released from liver and adipose tissue and subsequent accumulation in non-fatty depots, leading to
a lipotoxicity owing to the exceeding capacity of oxidative and storage in these depots. This process
carries to major concerns regarding metabolic and increased risk of heart disease [20,52].
As previously described, both WAT and BAT reveal secretory function and potential, releasing
numerous angiogenic modulators, whose expression balance will determine the triggering or halting
of the angiogenic switch [53–56]. In addition to adipocytes, adipose tissue contains diverse cells
types including ASC and ATM that also contribute to angiogenesis. ASC also produce a myriad of
angiogenic factors, VEGF, HGF, GM-CSF, FGF-2, and TGF while macrophages also produce VEGF
24
and the angiogenic cytokines TNF-α, FGF-2, IL1β, IL6, and IL-8. Adipose tissue produces several
matrix matalloproteinases (MMPs) including MMP-2 and -9, which could potentially affect
preadipocyte differentiation and microvessel maturation by modulating ECM. Moreover, MMPs
release the matrix-bound VEGF and indirectly induces angiogenesis [57].
Adipose tissue expansion due to adipocytes’ accentuated hypertrophy disrupts tissue oxygenation
because vascular network do not effectively accompany this progress [58]. Therefore, in the obese
status hypoxia is responsible for triggering inflammatory process and subsequent angiogenesis, in
order to equilibrate adipose tissue expansion [58–62]. In this hypoxic state, adipocytes express a
varied number of factors, HIFs, a family of well characterized heterodimeric factors that establish the
main hypoxia-responsive cellular sensors and molecular mediators [63]. Under a normal O2
interstitial pressure HIF-α subunit is quickly degraded but then, under low O2 pressures HIF-α is
stabilized. In this situation, HIF-α is translocated to the nucleus, dimerizes with the constitutively
expressed HIF-β promoting expression of angiogenic and pro-inflammatory factors [64].
HIF-1α is a major pro-angiogenic factor, accountable for vasculature homeostasis (together with
many other factors) not only in disorders involving physiological processes, but also in
carcinogenesis [46,65]. Due to HIF1-α increased levels in adipose tissue, it has been presumed a
relevant role in adipocyte differentiation and function [61,66,67]. Moreover, studies have
demonstrated that silencing HIF expression resulted in diet-induced obese mice regulation of insulin
sensitivity, dyslipidemia and resistance to weight gain, as well as reduced immune cell tissue
25
infiltration [68–71]. These data made drug-induced inhibition of HIF-1α an appealing approach to
adipose metabolic dysfunction [72]. However, other studies have reported that HIF-1α expression
has benefits on metabolism by protecting from high fat diet-induced obesity, insulin resistance, as
well as by increasing energy expenditure through mitochondrial biogenesis and thermogenesis [73].
Unexpectedly, a deeper analysis of HIF-1α role in adipose tissue secretion did not determine
categorically the modified (over)expression of proangiogenic factors, such as VEGF family
[58,69,74,75]. Actually, HIF-1α is upregulated and overexpressed by adipogenesis and
hyperinsulinemia, not by adipose tissue hypoxic status, which may be due to independent pathways
in tissue angiogenesis by VEGF regulation, and hypoxia-induced inflammassome [76,77]. Studies
involving human adipose tissue presented high levels of pro-angiogenic factors, such as VEGF-A,
VEGF-C and many others, but no suitable vascular response to increasing in HIF-1α expression.
Additionally, even though adipocyte hypertrophy due to diet-induced obesity logically lead us to
believe in hypoxic-state increment, in humans, adipose tissue expansion is slower, so demanding of
O2 from adipocytes is lower than in an animal model, and vasculature reorganization may happen,
even if partially adequate [78–80]. Nevertheless, in a mouse model the expected hypoxia-triggered
angiogenesis is conceivable and adipose tissue secretory response to obese state should not be
neglectable, and its complex process must be pursued, as we intended to.
Thus, adipose tissue and obesity is much more than hypertrophic adipocyte. There is a myriad
angiogenic factors such as growth inducers, HGF, PDGFB and FGF-2 by dependent or independent
26
pathways of VEGFR. There are many different growth factors and pathways linked to endothelium
and involved in adipose tissue expansion, even more in carcinogenesis, which contribute to
molecular heterogeneity of which much is still unknown [81,82]. In this context, when considering the
adipose tissue and the inflammatory state described in obesity, many more unknowns and
controversial issues arise for discussion.
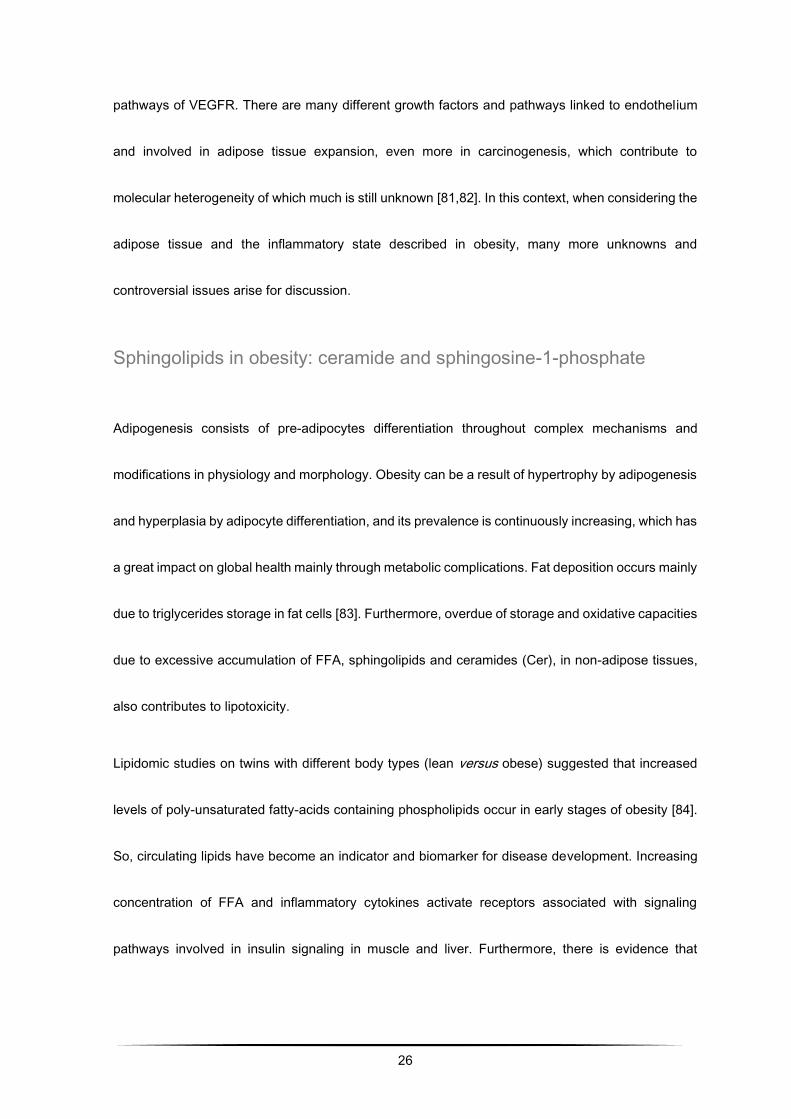
Sphingolipids in obesity: ceramide and sphingosine-1-phosphate
Adipogenesis consists of pre-adipocytes differentiation throughout complex mechanisms and
modifications in physiology and morphology. Obesity can be a result of hypertrophy by adipogenesis
and hyperplasia by adipocyte differentiation, and its prevalence is continuously increasing, which has
a great impact on global health mainly through metabolic complications. Fat deposition occurs mainly
due to triglycerides storage in fat cells [83]. Furthermore, overdue of storage and oxidative capacities
due to excessive accumulation of FFA, sphingolipids and ceramides (Cer), in non-adipose tissues,
also contributes to lipotoxicity.
Lipidomic studies on twins with different body types (lean versus obese) suggested that increased
levels of poly-unsaturated fatty-acids containing phospholipids occur in early stages of obesity [84].
So, circulating lipids have become an indicator and biomarker for disease development. Increasing
concentration of FFA and inflammatory cytokines activate receptors associated with signaling
pathways involved in insulin signaling in muscle and liver. Furthermore, there is evidence that
28
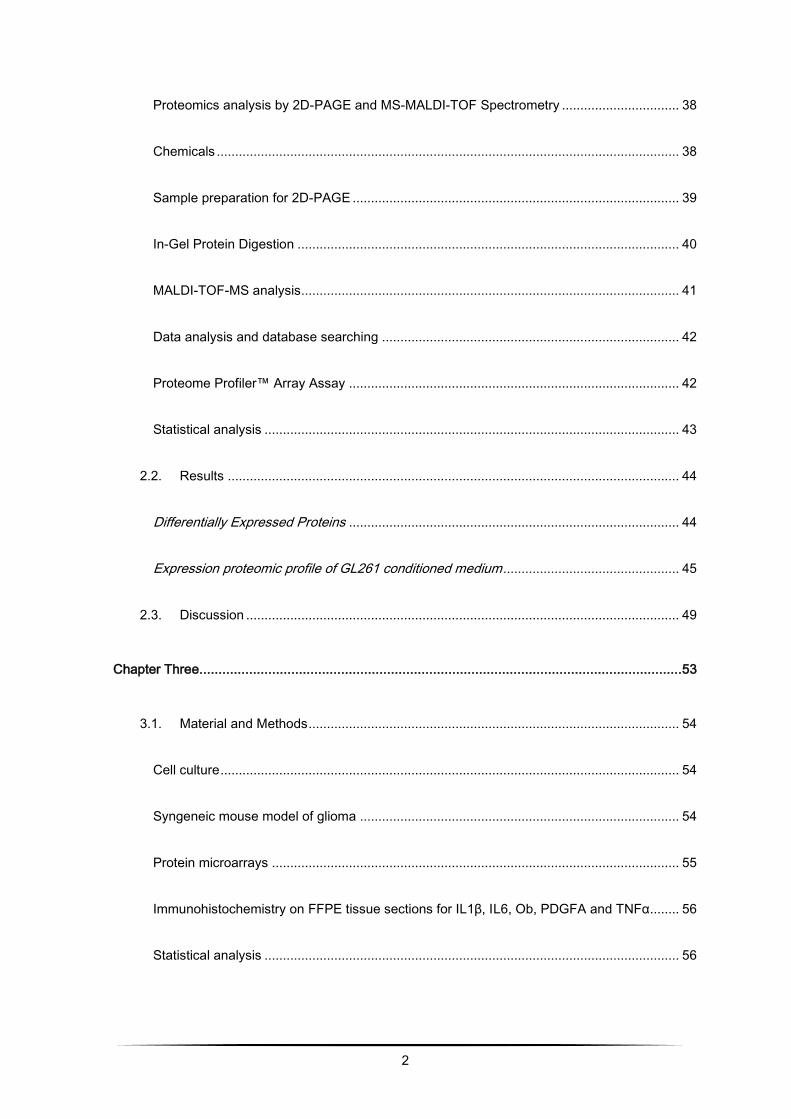
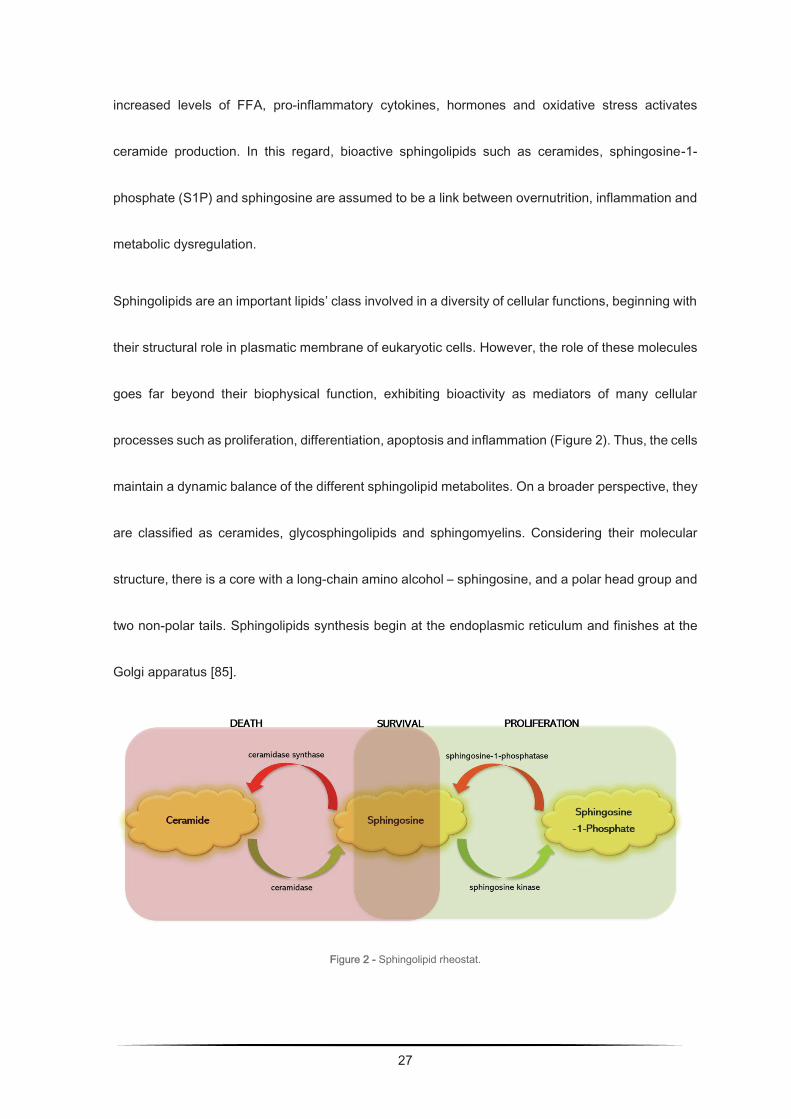
Ceramide may result from different processes: hydrolysis of membrane sphingomyelin by
sphingomyelinase (Figure 3), or de novo synthesis from long-chain saturated fatty acids via serine-
palmitoyl transferase. Subsequently, by the action of two sphingosine kinase isoforms (SpK1 and
SpK2), ceramide can be metabolized into sphingosine, converting it into S1P [86–89]. Studies carried
out to study the bioactivity of these molecules describe them as involved in various cell signaling
pathways, namely in the regulation of cell growth, motility, survival, senescence and cellular
apoptosis. Additionally, some pathophysiological changes, such as obesity and diabetes, in adipose
tissue and plasma, are associated with anomalies in the metabolism of these sphingolipids, among
others [89]. It should be noted that, in relation to the described processes, functions antagonistic to
ceramide and S1P are proposed (Figure 3), and the activation of a certain signaling pathway over
another is due to the balance between both biomolecules [88,89].
Figure 3 - Schematic diagram of the metabolism of sphingolipids, and sphingomyelin targets as well as metabolites and
sphingolipid metabolism. It is worth noting the reversible degradation of ceramide in S1P, maintaining an equilibrium
associated with a situation of apoptosis or cell proliferation. Adapted from Alewijnse & Peters, 2008.
29
Ceramide and sphingosine are precursors of S1P, being part of apoptosis, cell death and anti-
inflammatory signaling pathways. Ceramide is considered the building block to all sphingolipids,
namely sphingolipid and sphingomyelin biosynthesis, as well as acting as signaling molecule in
signal transduction, cellular differentiation, proliferation and degeneration. Ceramide involvement in
apoptotic pathways occurs via different targets as protein kinase C, protein kinase suppressor of
Ras, Rac, c-Jun N-terminal kinase, ceramide-activated protein phosphatase and inducible NO
synthase. ROS intracellular increasing is associated with mitochondrial dysfunction and releasing of
cytochrome C, inducing apoptosis. Ceramide varied, and even contradictory, cell functions and
responses may be related with different levels, targets and cell-specific localization [90,91]. These
intracellular levels may arise from a variety of extracellular stimuli, such as oxidative stress, nitric
oxide, pro-inflammatory cytokines (such as TNF-α, IL1), low-density lipoproteins, high levels of FFA
and/ or endotoxins, conditions that characterize adipose tissue in obesity. Short-chain ceramides (2
to 6 carbons) have been related with cell senescence, cytotoxicity, insulin resistance, inflammation
and apoptosis, while long-chain ceramides (16 to 24 carbons) are associated with cell growth,
proliferation and differentiation, and subsequently with motility and adhesion. They have been
associated with complications such as diabetes and insulin resistance, inflammation, atherosclerosis
and neurodegenerative disorders. Some studies already prove that ceramide is relevant in the
initiation and activation of inflammasome in obesity and some other pathological alterations, through
defective autophagy and excessive ROS. Moreover, in the context of obesity, metabolic tissues as

30
adipose tissue, liver as skeletal muscle, reveal altered sphingolipid metabolism with increasing
ceramide levels, inflammatory adipocytokines and inflammation [92–94].
Sphingosine-1-phosphate is uniquely produced by ceramidases and is the major lipid present in
mammalians. Once it is produced by ceramidase, sphingosine can follow two different pathways: the
“salvage” pathway in which is reacylated to renew ceramide, or being phosphorylated by sphingosine
kinase to produce S1P. Another less frequent substrate to sphingosine kinases is sphinganine
through de novo pathway or by the action of enzymes that act on sphinganine-containing substrates.
It is a bioactive sphingolipid involved in a myriad of pathophysiological processes. S1P regulates a
large number of cellular processes including inflammation, development of microvascular structures
essential to oncogenesis, metastasis and proliferation. Besides, it can regulate intracellularly on gene
expression and cell function regulation, as it can be secreted and extracellularly act as an
autocrine/paracrine mediator [85]. Its regulation as a secondary messenger is mediated by catabolic
and anabolic enzymes, namely sphingosine-1-phosphate phosphatase (SGPP) one and two, and
SpK1 and SpK2, respectively. S1P cell functions are dependent on its receptors S1PR1 to S1PR5,
belonging to G-protein family. These receptors are involved in cell growth, apoptosis, proliferation,
angiogenesis, chemoresistance, or vascular stability. Moreover, it is a chemotactic factor for immune
cell trafficking as well as a regulator of microenvironmental cancer development and proliferation. As
an oncogenic factor it has already been reported to be involved in breast, lung, melanoma, kidney,
colorectal and glioblastoma multiform cancers [95]. Glioblastoma Multiforme has revealed higher
31
levels of S1P compared with non-malignant brain tissue, and the poorer prognostic on these patients
is correlated with higher expression of SpK1 and S1PR2. However, S1PR1 has been correlated with
better prognosis [95].
In the last years, studies have been conducted to unveil the complete role of sphingolipids in obesity
and related pathologies with the perspective to discover new therapeutic approaches to disease.
S1P relationship with proliferation and oncogenesis depends on S1P receptors (S1PRs), as well as
its enzymes sphingosine kinases, SpK1 and SpK2 and phosphatases. The difficulty in understanding
S1P mechanisms in carcinogenesis process is due to the complexity of the signaling trigger and
subsequent response by the specific receptor and pathway activated. When exported by S1P
specific transporters (for example, ATP-binding cassette) it binds to its receptors developing
autocrine, paracrine or endocrine functions. SpK1 is present in almost every cell, close to the cell
membrane in the cytosol. SpK2 is mainly expressed in specific organs like brain, liver and kidney,
involved in regulation of lipidic metabolism as well as in mitochondrial β-oxidation [90,96].
S1P receptors are expressed on cancer cells as well as other cells in tumor microenvironment. There
are five S1P receptors, each of them activating a signaling pathway.
Some of the studies performed on adipose tissue from mice with genetically induced obesity, found
simultaneous decrease in ceramide content and increase in S1P, compared with control group.
Additionally, balance of sphingolipid metabolism in adipose tissue tends to move towards
sphingosine formation, thereby reducing the expression of ceramide in adipose tissue. Regarding
32
angiogenesis, some authors observed in vitro migration and formation of capillary structures in
HUVEC cultures by stimulation of migration and differentiation of endothelial cells via the signaling
pathway S1P1 / Gi / PLC / Ca2 +. S1P induced cell migration observed in vitro was superior to that
induced by VEGF-C, and it was more closely observed in in vivo studies. These studies also revealed
increased plasma levels of S1P in pathological conditions. However, S1P levels on different tissues,
specifically on adipose tissue, remain unknown [96,97].
33
AIMS OF THE STUDY
Research conducted in the last decades provided scarce insights into the pathways involved in
gliomagenesis. However, the exact mechanisms involved in glioma development and progression
are unclear. In this thesis it is hypothesized that adipose tissue dysregulation could be a relevant
event in disease progression. Therefore, a better understanding of the molecular mechanisms
leading to abnormalities in adipose tissue, metabolic dysfunction and cancer development and
progression could open novel avenues for early therapeutic intervention and the development of
biomarkers for early disease diagnostics.
In this context, the major aims of this study were to:
o develop an in vitro rodent model for the study of the influence of obesity role in glioma, based
on 3T3-L1 pre-adipocytes differentiation and subsequent exposition to GL261 glioma cell
culture from mouse in order to also study obesity influence on carcinogenesis by proteomic
analysis of inflammatory adipokines and cytokines expressed by glioma cells to the 3T3-L1
medium;
o study cytokines relationship within inflammation and angiogenesis by analysis of the cellular
model of brain cancer GL261 previously inoculated on C57Bl/6J mice, as well as
immunohistochemical expression on adipose and tumoral tissue;
34
o approach sphingolipid rheostat on diet-induced obesity, through ceramide and S1P analysis
on the C57Bl/6J model serum and correlate with tissue response.
Framework
This thesis is organized in five chapters in order to present the reader with the purpose of the work/
state of the art on the subject followed by a segmented presentation of the methodology used to fulfill
each of the objectives, as well as the results obtained and due discussion.
The first experimental chapter consist of already published work. Then, the following two chapters
present results submitted and under revision. Lastly, and in order to properly complete and close this
thesis, there is a final chapter with a general discussion and concluding remarks.
35
CHAPTER TWO
Adipocyte proteome and secretome influence
inflammatory and hormone pathways in glioma
establishment of 3T3-L1 conditioned medium
36
In this chapter it is approached the development of the in vitro cell model for the study of rodent
obesity. This model is based on 3T3-L1 pre-adipocytes differentiation and subsequent exposition to
B16 melanoma cell line from mouse. This melanoma model was developed in order to also study
obesity influence on carcinogenesis and its results helped to enlighten the progress on glioma and
obesity in vitro model. Also, it is loomed the influence of obesity role in glioma by proteomic analysis
of inflammatory adipokines and cytokines expressed by glioma cells to the 3T3-L1 medium.
3T3-L1 preadipocytes are a commercially available cell line for studying adipogenesis [28,98]. Their
differentiation, in culture, into mature adipocytes is well widespread and can be achieved by
established protocols. It was used conditioned medium from fully differentiated 3T3-L1 cells to
explore the potential effects of adipocytes secretome over glioma GL261 cells proliferation and
apoptosis.
Presented data have already been published in two papers, as it follows:
P. Coelho, J. Almeida, C. Prudêncio, R. Fernandes, R. Soares, Effect of Adipocyte Secretome in
Melanoma Progression and Vasculogenic Mimicry, J. Cell. Biochem. 117 (2016) 1697–1706.
doi:10.1002/jcb.25463.
V. Cea, P. Coelho, C. Sala, J. Costa, M.S. Diniz, C. Prudêncio, R. Fernandes, J.P. Noronha, M.
Galesio, J. Almeida, R. Soares, Adipocyte proteome and secretome influence inflammatory and
hormone pathways in glioma, Metab. Brain Dis. 34 (2018) 141–152. doi:10.1007/s11011-018-0327-
y.
37
2.1. Material and Methods
Cell culture and in vitro treatment
GL-261 (gently given by Prof. Pedroso Lima, CNC, Coimbra, Portugal) mouse cell lines were used.
3T3-L1 and GL-261 cells were cultured in DMEM (Dulbecco´s Modified Eagle´s Medium with 4.5g/L
Glucose & L-Glutamine, without Sodium Pyruvate. Santa Cruz Biotechnology, Inc.), supplemented
with 10% FBS, and 1000 units/mL gentamycin solution, maintained in T-25 tissue culture flasks in
5% CO2/95% air at 37oC in a humidified incubator.
Adipocyte cell culture and conditioning
3T3-L1 pre-adipocytes were propagated and allowed to reach confluence. After 2 days (day 0), the
differentiation was initiated by addition of a hormonal mixture composed of 2 μM insulin, 1 μM
dexamethasone and 0.25 mM isobutylmethylxanthine. Three days after (day 3), the induction
medium was replaced by complete medium supplemented with insulin only. At day 6 cultures were
washed twice in phosphate buffered saline and incubated in serum-free medium. After 24h (day 7),
medium was harvested from the adipocyte’s cultures, spun for 3000 g for 5 minutes and the
supernatant (mature adipocytes conditioned medium) was stored at -80ºC for the subsequent
treatments. This conditioned medium was rich in adipokines which are globally referred as
secretome.
38
Afterwards, glioma cells were divided in two distinct groups. On one hand, glioma cells GL-261 were
grown under the influence of the mature adipocytes secretome were designated conditioned glioma
cells (CGl). On the other hand, the control group consisted in the glioma cells cultured in the absence
of 3T3-L1 conditioned medium and was designated as non-conditioned glioma cells (NCGl).
Proteomics analysis by 2D-PAGE and MS-MALDI-TOF Spectrometry
The protein expression was accessed by means of bidimensional polyacrylamide gel electrophoresis
under denatured conditions (2D-PAGE) followed by mass spectrometry analysis of the interest spot.
The spots were analysed by matrix assisted laser desorption ionization time-of-flight/mass
spectrometry (MALDI-TOF-MS). The non-conditioned glioma cells served as the control group for
the conditioned glioma cells. We have used the mature adipocytes secreted adipokines (secretome)
and enriched the GL261 medium, followed by analysis of the proteins on GL261 on a 2-dimensional
proteomic gel approach, so different spots could be studied by means of mass spectroscopy. Also It
was analysed by microarrays-based proteomics.
Chemicals
The reagents acetonitrile, iodoacetamide (IAA), dl-dithiothreitol (DTT) (99% w/w) and trypsin from
porcine pancreas (proteomics grade) were purchased from Sigma (Steinheim, Germany). Formic
acid puriss for mass spectrometry (≥98%), ammonium bicarbonate (>99.5% w/w) and the matrix
assisted laser desorption ionization MALDI matrix α-Cyano-4-hydroxycinnamic acid (α-CHCA) puriss
for MALDI-MS were from Fluka (Buchs, Switzerland). Trifluoroacetic acid (TFA, 99% v/v) was from
39
Riedel-de-Haën (Seelze, Germany). ProteoMass Peptide MALDI-MS Calibration Kit (MSCAL2) from
Sigma was used as mass calibration standard for MALDI-TOF-MS.
Sample preparation for 2D-PAGE
Sample preparation for 2D-PAGE was performed according to published procedures with minor
modifications [99]. The cells were manual detached from the flask and were mechanically lysed at
4oC in lysis solution [CHAPS 4%, 5 mM Tris, pH 8.8, 0.05% protease inhibitor cocktail (Sigma)] using
a glass potter, and the samples were centrifuged at 2000 g for 15 minutes at 4oC in order to eliminate
aggregates. The protein concentrations in each sample were measured by means of a DC Bio-Rad
assay. A total of 900 mg of protein from each sample was precipitated with cold acetone and
resuspended in thiourea buffer (7M urea, 2M thiourea 2% CHAPS, 2% ASB14, 5% glycerol, 40 mM
DTT, 4 mM TCEP, 1% 3–10 IPG buffer, Amersham), and the samples were mixed overnight at 4oC
in the dark and clarified by centrifugation at 16000 g for 15 minutes at 4oC. The supernatant was first
separated by isoelectric focusing over a pH range of 3–10 using precast first-dimension drystrip 3–
10 NL 11 cm (Bio-Rad) following a multi-step protocol for 90,000 Vht (Protean IEF cell, Biorad). The
first dimension strip was equilibrated in 50 mM Tris, pH 8.8, 6 M urea, 30% glycerol, 2% SDS plus
16 mM DTT for 20 minutes, and then plus 25 mM iodioacetamide for 15 minutes, and loaded on a
midi format (11 cm) 9–16% acrylamide gel to separate the proteins by molecular weight. Second-
dimension runs were performed using Biorad midi cells at 30 V 1 h, 300 V 4 h at a constant
temperature of 18oC. Protein spots were revealed using home-made blue Coomassie staining, and

40
the gel images were acquired by means of an Image scanner at 300 DPI resolution and analysed
using Image2D Master Platinum software (both from Amersham).
At least three gels per condition were included in the analysis. Normalized spot volume values were
studied using SPSS software version 13.0 for statistical analysis (SPSS Inc.). In brief, the data for
each spot match set were analysed using a box-plot test in order to eliminate outliers, a K-S test to
check normal distribution, an F test to analyze the variance, and finally Student’s T test to compare
the mean values, which were considered significant for a P-value cut off of 0.01.
In-Gel Protein Digestion
In-gel digestion of the excised proteins with trypsin was performed according to published procedures
with minor modifications [100–102]. Protein spots were destained for 10 min with a solution of
acetonitrile 50% (v/v) in 25nM NH4HCO3 and mixed vigorously using a vortex. After removal of the
destaining solution, gel pieces were washed with water for 10 min using vigorous vortexing. This step
was repeated twice. Afterwards, the gel pieces were dehydrated in acetonitrile for 10 min, which was
then removed, and the gel pieces were placed to dry in a vacuum centrifuge. Reduction of protein
disulfide bonds was performed with a solution 10mM of dithiotreitol (DTT) in 25mM NH4HCO3, for 15
min at 60 ºC. After cooling to room temperature for about 15 min, the DTT solution was replaced with
a solution 110mM of iodoacetamide (IAA) in 25mM NH4HCO3. Incubation with the alkylation agent
was performed for 35 min at room temperature in the dark. After reduction and alkylation steps, the
gel pieces were submitted once more to the washing and dehydration procedure with water and
41
acetonitrile, in the same way as described above. Subsequently, the gel pieces were completely
dried in a vacuum centrifuge. The dried protein spots were incubated with a solution of trypsin 25
ng/µL in 12.5 mM NH4HCO3 in an ice bath for 30 min to rehydrate the gel and to allow enzyme
penetration into it. In-gel protein digestion was performed at 37ºC overnight. After collecting the
supernatant to clean vials, further peptide extraction was performed by addiction of a solution of
trifluoroacetic acid 0.1% (v/v) in acetonitrile 50% (v/v) to the gel pieces and incubation at room
temperature with shaking for 10 min. This step was repeated twice. All extracts were pooled and
evaporated to dryness. The samples were re-suspended with 10 µL of trifluoroacetic acid 0.1% (v/v).
MALDI-TOF-MS analysis
Prior to MALDI analysis, the sample was mixed with an equal volume of the MALDI matrix solution,
10 mg/ml α–CHCA in trifluoroacetic acid 0.1% (v/v) and acetonitrile 50% (v/v). An aliquot of the
sample/matrix solution (0.5 µL) was hand-spotted onto the MALDI sample plate and the sample was
allowed to dry. The mass spectrometric analyses were performed using the Applied Biosystems
MALDI-TOF-MS system model Voyager-DE PRO Biospectrometry Workstation equipped with a
nitrogen laser radiating at 337 nm (Applied Biosystems, Foster City, USA) and the laser intensity was
set just above the threshold for ion production. MALDI mass spectra were acquired in positive ion
reflectron mode, with an accelerating voltage of 20 kV, a grid voltage of 15 kV, 0.4 V of guide wire
and an ion extraction delay of 100 ns. The MS spectra for each sample were based on the average
42
of 700 laser shots per spot with an acquisition rate of 2 ns. MS acquisition data was calibrated
externally using the ProteoMass Peptide MALDI-MS Calibration Kit.
Data analysis and database searching
All data was processed using DataExplorer 4.5 software from Applied Biosystems. Peptide Mass
Fingerprint (PMF) data was used to search for candidate proteins using the MASCOT database
search (http://www.matrixscience.com) engine. SwissProt database was selected by default for all
Mascot searches. NCBInr database was used each time no significant identification was obtained
with SwissProt. Database searches were, by default, performed with no taxonomy restriction and
allowing up to a maximum peptide mass tolerance of 100 ppm. The number of allowed missed
cleavages for trypsin was set to one. Carbamidomethylation of cysteine and methionine oxidation
were selected as fixed and variable modifications, respectively. In order to provide accurate results,
protein identification was considered positive for MASCOT protein scores higher than 77 (p<0.01)
that present a minimum of 4 peptides matching.
Proteome Profiler™ Array Assay
Determination of relative levels of pre-selected mouse adipokines in conditioned and non-conditioned
GL261 cell cultures was performed by using Mouse Adipokine Array Kit (R&D Systems Europe, UK).
Cells were rinsed with PBS before Lysis Buffer solubilization at, approximately, 1 x 10⁷ cells/mL.
Then, they were ressuspended and rocked at 4°C for 30 minutes, following a microcentrifugation at
14,000 x g for 5 minutes. After supernatant transfer into a clean test tube, proteins were quantified a

43
total protein assay. Array Procedure was performed according to manufacture instructions
(Catalogue Number ARY024). Data analysis was based on pixel densities on developed X-ray film
collected and analysed using Gel-Doc XR (Bio-Rad© Laboratories), acquired by Image Lab Software
5.2.1 (Bio-Rad© Laboratories) then quantified by ImageJ 1.49 (NIH, USA).
Statistical analysis
The differences in expression of proteins between glioma medium and CGl by Proteome Profile
Microarray were analysed by 2-way ANOVA for multiple comparisons with Prism Graphpad. P-values
of <0.05 were considered statistically significant. MALDI-TOF-MS was conducted by T-test at P-
value cut off of 0.1 using default parameters with Prism Graphpad.
44
2.2. Results
In order to understand which adipocyte secreted proteins potentially influenced glioma tumor
behavior, it was analysed the protein expression of glioma cells conditioned medium retrieved from
adipocytes cultures, by means of bidimensional polyacrylamide gel electrophoresis under denatured
conditions (2D-PAGE) followed by mass spectrometry analysis of the selected spots. These spots
were analysed by matrix assisted laser desorption ionization time-of-flight/mass spectrometry
(MALDI-TOF-MS). The non-conditioned glioma cells (NCGl) were used as the control group for the
conditioned glioma cells (CGl).
Differentially Expressed Proteins
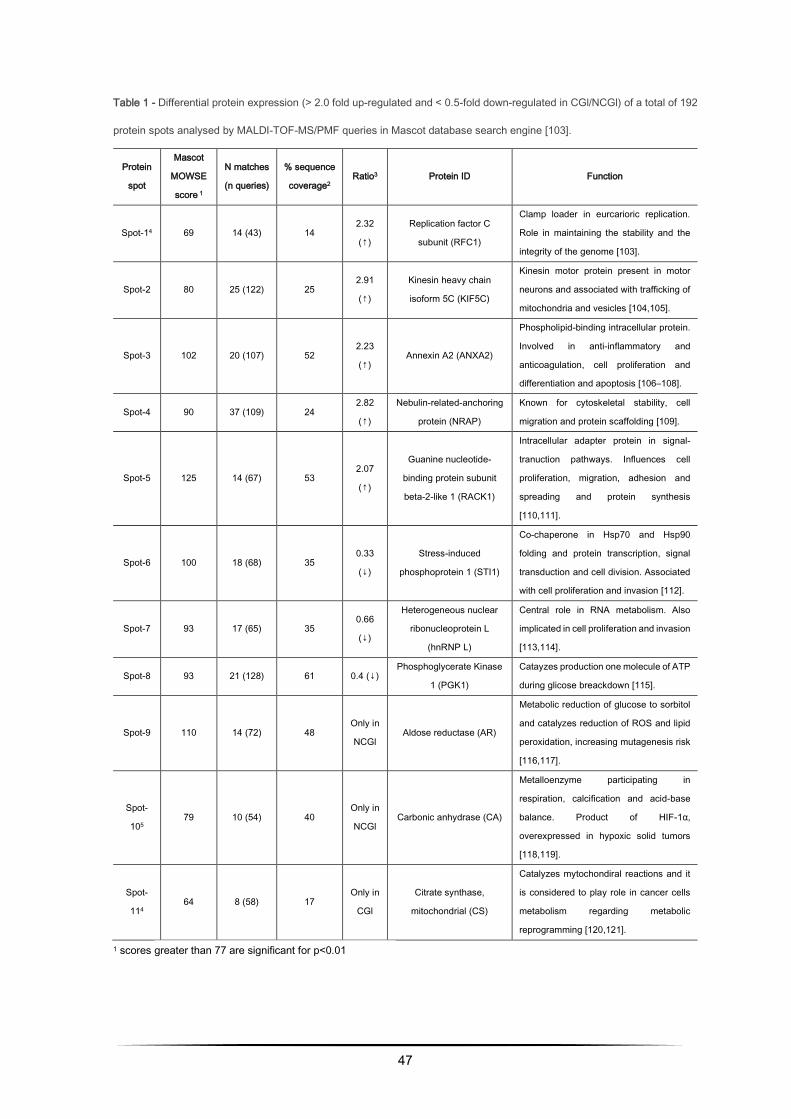
The proteomic analysis has allowed the identification of eleven well differentiated proteins (among
the 1192 matched protein spots) that are secreted by 3T3-L1 adipocytes with a potential role in
cancer biology. So, as it can be seen in table 1, there are over, under and partially (only in one
condition) expressed proteins.
The 5 over-expressed proteins found on the CG1 cells. RFC1 corresponds to spot-1 with 9.38
isoelectric point, 126705 relative molecular mass and presenting a 2.32 ratio. KIF5C corresponds to
spot-2, with 5.86 isoelectric point, 109777 relative molecular mass and 2.91 ratio. ANXA2
corresponds to a spot-3 protein spot, with 7.55 isoelectric point, 38937 relative molecular mass and
2.23 ratio. NRAP, corresponds to spot-4, with 9.34 isoelectric point, 196716 relative molecular mass
45
and 2.82 ratio. RACK 1, corresponds to spot-5, with 7.60 isoelectric point, 35511 relative molecular
mass and 2.07 ratio (Table 1). The 3 spots significantly under-expressed in CGl corresponding to 3
proteins identified as follows: STI1, corresponds to spot-6 and it presents a 6.4 isoelectric point,
63170 relative molecular mass and 0.33 ratio; hnRNP L, corresponds to spot-7 spot, with 8.33
isoelectric point, 64550 relative molecular mass and 0.66 ratio; PGK1, corresponding to spot-8, with
8.02 isoelectric point, 44921 relative molecular mass and 0.4 ratio.
Only 2 spots were present in NCGl control group were aldose reductase, corresponds to spot-9, with
6.71 isoelectric point, 36052 relative molecular mass, and carbonic anhydrase, corresponds to spot-
10, with 6.45 isoelectric point, 30124 relative molecular mass.
The only spot present in the CGl was Citrate Synthase that corresponds to spot-11, with 8.72
isoelectric point and 51988 of relative molecular mass.
Expression proteomic profile of GL261 conditioned medium
Intending to further elucidate the involvement of adipose secretome in glioma, we evaluated the
profile of GL261 under conditioned medium (CGL). The medium proteome is a desirable sample due
to their accessibility and representability due, in part, to the wide dynamic range of protein
concentrations, which lead to the discovery of new protein markers (Figure 1). As illustrated in Figure
1 different secretion patterns of numerous growth-factors, adipokines, cytokines and angiogenesis-
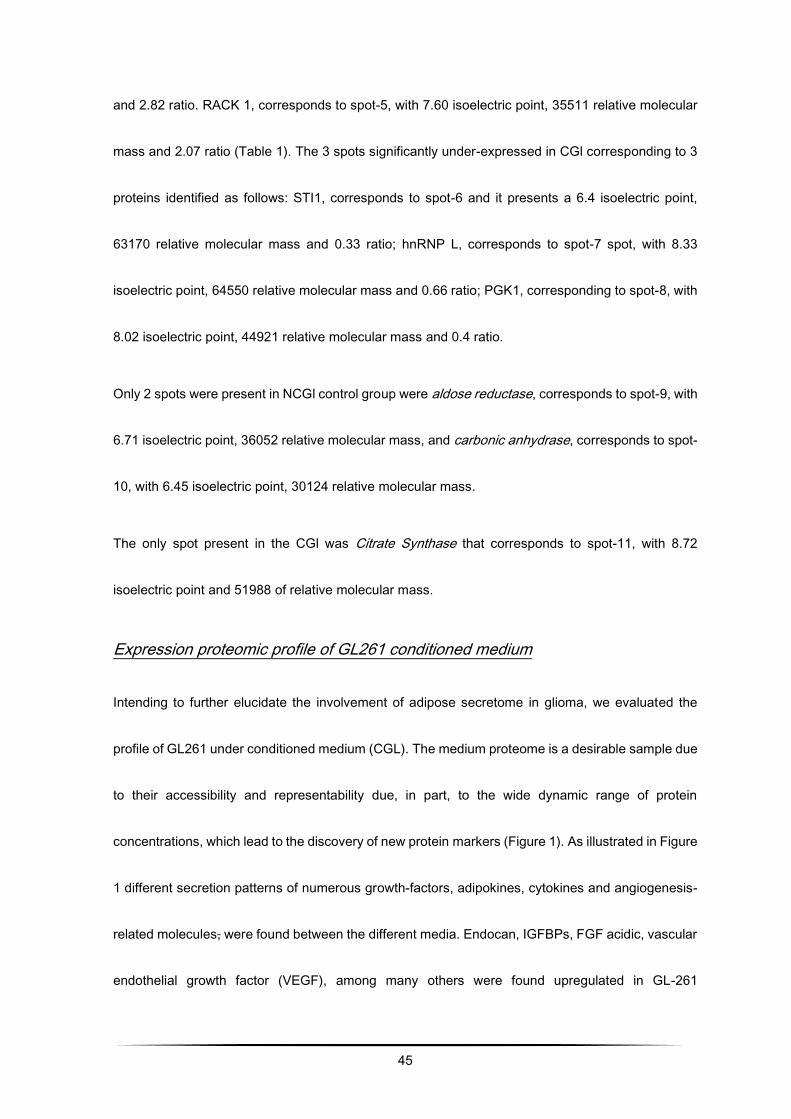
related molecules, were found between the different media. Endocan, IGFBPs, FGF acidic, vascular
endothelial growth factor (VEGF), among many others were found upregulated in GL-261
46
conditioned medium. Nevertheless, a significant reduction in adiponectin, serpin E1 and TIMP-1
levels were observed in CGl (p≤ 0.01).
Figure 4 - Expression proteomic profile of GL261 with and without the effect of the secretome of 3T3-L1 mature
adipocyte cells [160].
47
Table 1 - Differential protein expression (> 2.0 fold up-regulated and < 0.5-fold down-regulated in CGl/NCGl) of a total of 192
protein spots analysed by MALDI-TOF-MS/PMF queries in Mascot database search engine [103].
Protein
spot
Mascot
MOWSE
score 1
N matches
(n queries)
% sequence
coverage2 Ratio3 Protein ID Function
Spot-14 69 14 (43) 14 2.32
(↑)
Replication factor C
subunit (RFC1)
Clamp loader in eurcarioric replication.
Role in maintaining the stability and the
integrity of the genome [103].
Spot-2 80 25 (122) 25 2.91
(↑)
Kinesin heavy chain
isoform 5C (KIF5C)
Kinesin motor protein present in motor
neurons and associated with trafficking of
mitochondria and vesicles [104,105].
Spot-3 102 20 (107) 52 2.23
(↑) Annexin A2 (ANXA2)
Phospholipid-binding intracellular protein.
Involved in anti-inflammatory and
anticoagulation, cell proliferation and
differentiation and apoptosis [106–108].
Spot-4 90 37 (109) 24 2.82
(↑)
Nebulin-related-anchoring
protein (NRAP)
Known for cytoskeletal stability, cell
migration and protein scaffolding [109].
Spot-5 125 14 (67) 53 2.07
(↑)
Guanine nucleotide-
binding protein subunit
beta-2-like 1 (RACK1)
Intracellular adapter protein in signal-
tranuction pathways. Influences cell
proliferation, migration, adhesion and
spreading and protein synthesis
[110,111].
Spot-6 100 18 (68) 35 0.33
(↓)
Stress-induced
phosphoprotein 1 (STI1)
Co-chaperone in Hsp70 and Hsp90
folding and protein transcription, signal
transduction and cell division. Associated
with cell proliferation and invasion [112].
Spot-7 93 17 (65) 35 0.66
(↓)
Heterogeneous nuclear
ribonucleoprotein L
(hnRNP L)
Central role in RNA metabolism. Also
implicated in cell proliferation and invasion
[113,114].
Spot-8 93 21 (128) 61 0.4 (↓) Phosphoglycerate Kinase
1 (PGK1)
Catayzes production one molecule of ATP
during glicose breackdown [115].
Spot-9 110 14 (72) 48 Only in
NCGl Aldose reductase (AR)
Metabolic reduction of glucose to sorbitol
and catalyzes reduction of ROS and lipid
peroxidation, increasing mutagenesis risk
[116,117].
Spot-
105 79 10 (54) 40
Only in
NCGl Carbonic anhydrase (CA)
Metalloenzyme participating in
respiration, calcification and acid-base
balance. Product of HIF-1α,
overexpressed in hypoxic solid tumors
[118,119].
Spot-
114 64 8 (58) 17
Only in
CGl
Citrate synthase,
mitochondrial (CS)
Catalyzes mytochondiral reactions and it
is considered to play role in cancer cells
metabolism regarding metabolic
reprogramming [120,121].
1 scores greater than 77 are significant for p<0.01

48
2 represents the percentage of the protein's sequence represented by the peptides identified in the MS run
3 Ratio = CGl/NCGl (CGl – conditioned medium from glioma, NCGl – non-conditioned medium from glioma)
4 results obtained by limiting the research to entries from Mus musculus. In this case, scores greater than 62 are significant
for p<0.01.
5 result obtained allowing up to 2 missed cleavages.
49
2.3. Discussion
In order to understand which adipocyte secreted proteins potentially influenced glioma tumor
behavior, it was analysed the protein expression of glioma cells conditioned medium obtained from
adipocytes cultures, by means of bidimensional polyacrylamide gel electrophoresis under denatured
conditions (2D-PAGE) followed by mass spectrometry analysis of the selected spots. These spots
were analysed by matrix assisted laser desorption ionization time-of-flight/mass spectrometry
(MALDI-TOF-MS). The non-conditioned glioma cells (NCGl) were used as the control. Findings
revealed lower expression of STI1, hnRNP L and PGK1 when glioma cells were exposed to mature
adipocytes conditioned medium. Regarding multiple effects of STI1, hnRNPs and PGK1 this under
expression might reflect that the adipokines secreted by mature adipocytes might be able to stop
some important pathways in carcinogenesis, complemented with remodeling the oxidative
metabolism toward the utilization of fatty acids substrates instead of glucose. This interpretation may
be further supported by the increased expression of mitochondrial citrate synthase. Also, proteome
array profiling reveals under expression of TIMP-1, an inhibitor of ECM degradation, Serpin E1 and
adiponectin significant downregulation in conditioned medium, supporting adipokine results of
carcinogenesis development by adipocytes.
Additionally, data revealed that aldose reductase and carbonic anhydrase were present only in
glioma cells and that their expression was completely blocked when glioma cells were exposed to
mature adipocytes conditioned medium. These results suggested that this blockage may reflect a
50
total inhibition of aldose reductase and carbonic anhydrase, possibly associated to oxidative stress
response prevention, inhibition of inflammation and cancer proliferation, angiogenesis and
carcinogenesis, which may suggest some sort of protective mechanism related to obesity.
Considering overexpressed proteins in conditioned medium, RFC1, KIF5C, ANXA2, NRAP, RACK1
results were supported by overexpression of almost all the proteins profiled by arrays, comprising
angiogenesis, growth, metabolic and hormonal functions. This analysis revealed that ANXA2
expression (2.23 fold) was more pronounced when glioma cells were exposed to CGl. This finding is
in agreement with previous studies that also revealed that ANXA2 is elevated in glioma, in which it
plays a central role in cell motility, migration, invasion and angiogenesis [106–108].
Moreover, and considering proteome array profiling, endocan, which is a proteoglycan secreted by
endothelial cells and upregulated by proangiogenic factors, appears to be overexpressed in tumour
vessels [122,123]. Considering its overexpression in CGl, it may explain the involvement of adipose
tissues in tumor aggressiveness. In addition, adipose tissue contains diverse cells types including
adipose stromal cells, which produce a myriad of angiogenic factors, VEGF, HGF, FGF-2, and TGF,
contributing to the increment of released angiogenic and growth factor cytokines.
Thru microarray analysis it were further identified factors released by adipocyte cells, and revealed
that several pro-inflammatory factors (IL6, IL11, LIF, PAI-1, TNF-α), metabolic markers (FGF-21,
IGFBPs), angiogenic growth factors (endocan, HGF, VEGF IGF-I), and hormones (leptin, resistin,
RBP-4) were secreted to the medium into a high extent, whereas TIMP-1, an inhibitor of ECM
51
degradation, SerpinE1, wich encodes Plasminogen Activator Inhibitor 1 (PAI-1), were
underexpressed on CGl. Adiponectin, as it was expectable, was significantly downregulated in CGl
medium when compared with NCGl. Adiponectin modulates inflammatory responses, energy
expenditure in the CNS and periphery, glucose regulation and fatty acid catabolism. Its circulating
levels inversely correlate with insulin resistance, metabolic syndrome, obesity and cardiovascular
diseases. Curiously, different hormones related with insulin resistance and obesity, including TNF-α
and IL6, downregulate adiponectin expression and secretion in fat cells in vitro [48,124]. Our results
on TNF-α (adipocytokine implicated in inflammation, apoptosis and cell survival), IL6 (related to
proliferation in human glioblastoma cases, leading to poor prognosis) and IL11, corroborate these
inverse relationship with adiponectin [125].
Endocan, as well as FGF-21, are extensively present along with pro-inflammatory and proangiogenic
molecules. It is associated with a vast number of pathological conditions where endothelium gets
highly vascularized cancers, making it a likely marker of the vascular growth and angiogenesis during
cancer evolution [126,127]. These data support our findings in which endocan is overexpressed in
CGl. Moreover, and regarding other growth factors, FGF-21, HGF and IGFBPs, they all were
overexpressed in CGl. Hepatocyte Growth Factor (HGF), a multifunctional trophic factor activates a
tyrosine kinase signaling cascade, is elevated in obese adults and adolescents. In vitro, HGF
secretion from adipocytes of obese compared to lean individuals is greater [48,128].
52
Development and basic functions of organs and tissues relay on angiogenesis, and angiogenesis
role in adipose tissue development and obesity is crucial. Additionally, a great number of studies
point that an insufficiency in adipose tissue angiogenesis contributes to metabolic disease in obesity
[56,129]. These data from the literature reinforce our findings concerning the effect of conditioned
medium from adipose tissue in augmenting GL261 cell proliferation, migration, ability to invade and
decreasing apoptosis.
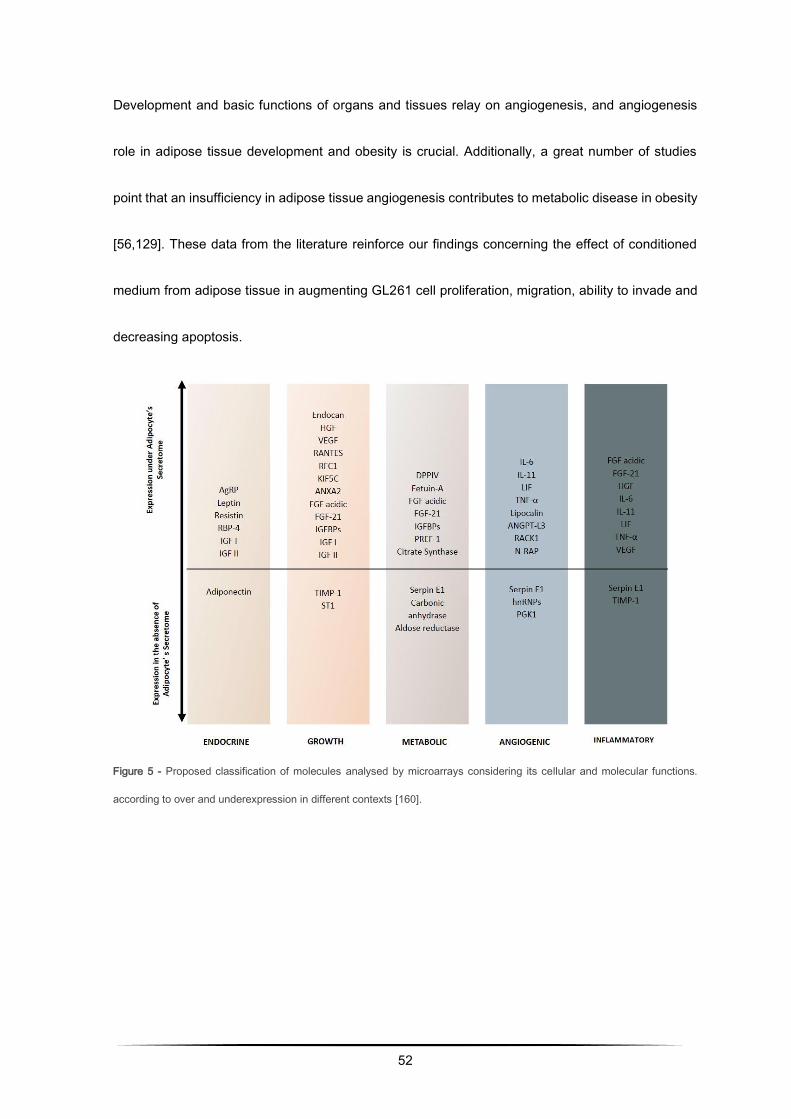
Figure 5 - Proposed classification of molecules analysed by microarrays considering its cellular and molecular functions.
according to over and underexpression in different contexts [160].
53
CHAPTER THREE
Role of inflammation and angiogenesis in
gliomagenesis in obesity:
a proteomic and immunhistochemical approach
54
Adipose tissue is defined as a lipid store depot, inflammatory and endocrine organ. Obesity chronic
low-grade inflammation is potentiated by the presence of multiple cytokines and hormones. Then, in
this chapter is presented proteomic analysis of angiogenic cytokines expressed by in vitro model
followed by immunohistochemical analysis on the expression of some relevant (and available)
angiogenic proteins on the in vivo C57Bl/6J diet-induced obesity adipose and tumoral tissue.
Presented data have already been submitted and is under revision as it follows:
J. Almeida, P. Coelho, R. Soares, C. Prudêncio, R. Fernandes, Proteomic alterations in xenografted
mice with GL261 tumor cells reveal obesity-associated inflammation in gliomagenesis.
3.1. Material and Methods
Cell culture
3T3-L1 pre-adipocytes were propagated and allowed to reach confluence. After differentiation, the
conditioned medium rich in adipokines which are globally referred as secretome. Afterwards, glioma
cells were divided in two distinct groups: conditioned glioma cells (CGl) and non-conditioned glioma
cells (NCGl).
Syngeneic mouse model of glioma
GL261 cells were harvested after trypsinization, washed in DMEM without FBS and implanted in
male C57Bl/6J (Jackson Laboratories, Bar Harbor, ME, USA). The experiment consisted of four
groups of a total amount of 32 male mice, organized in controls and glioma induced for ND and HFD,
55
equally distributed. The ND group, which consisted of wild-type male C57BL/6J mice fed a
standardized low-fat diet (4% by weight, D12450B-I, Research Diets, New Brunswick, NJ, USA) from
age 3 weeks onward; HFD group, which consisted of wild-type male C57BL/6J mice fed a
standardized high-fat diet (35% fat by weight, D12451-i, Research Diets) from age 3 weeks onward.
Mice were grown in rooms with controlled temperature and humidity under a 12-hour light-dark cycle,
with water and food ad libitum, and weighed daily to ensure that all the animals were gaining weight
in an equivalent manner. Animals received a subcutaneous cell injection, approximately 107 per
animal, in dorsal region and 14 days after that, they were euthanized at the whole timepoint of 182
weeks. This study was approved by the Portuguese National Authority for Animal Health.
Protein microarrays
Determination of relative levels of pre-selected mouse adipokines in conditioned and non-conditioned
GL261 cell cultures was performed by using Mouse Adipokine Array Kit (R&D Systems Europe, UK).
Cells were rinsed with PBS before Lysis Buffer solubilization at, approximately, 1 x 10⁷ cells/mL.
Then, they were ressuspended and rocked at 4°C for 30 minutes, following a microcentrifugation at
14,000 x g for 5 minutes. After supernatant transfer into a clean test tube, proteins were quantified a
total protein assay. Array Procedure was performed according to manufacture instructions
(Catalogue Number ARY024). Data analysis was based on pixel densities on developed X-ray film
collected and analysed using Gel-Doc XR (Bio-Rad© Laboratories), acquired by Image Lab Software
5.2.1 (Bio-Rad© Laboratories) then quantified by ImageJ 1.49 (NIH, USA).
56
Immunohistochemistry on FFPE tissue sections for IL1β, IL6, Ob, PDGFA and TNFα
Immunohistochemistry of inflammatory citokines previously identified on microarray profiling we
selected IL1β, IL6, Ob, PDGFA and TNFα. Immunohistochemistry was performed with TNFα: ab6671
rabbit anti-mouse polyclonal antibody (Abcam plc, Cambridge, UK) and IL6: ab6672 rabbit anti-
mouse polyclonal antibody. IL1β (sc-52012), Ob (sc-842) and PDGFA (sc-7958) rabbit anti-mouse
polyclonal antibody (Santa Cruz Biotechnology, Inc., EUA). They were incubated with biotinylated
goat anti-rabbit secondary antibody IgG-B: sc-2040 (Santa Cruz Biotechnology, Inc., EUA).
VECTASTAIN Elite ABC Kit (Vector Laboratories, Inc., EUA) and 3,3′-diaminobenzidine (Abcam plc,
UK) were used for signal amplification. Quantification was performed through pixel density evaluation
of 7–10 randomly selected tissue sections per mouse, acquired using Nikon Microscope.
Statistical analysis
The differences in expression of proteins between glioma medium and CGl by Proteome Profile
Microarray and IHC data was analysed by 2-way ANOVA for multiple comparisons with Prism
Graphpad. P-values of <0.05 were considered statistically significant.
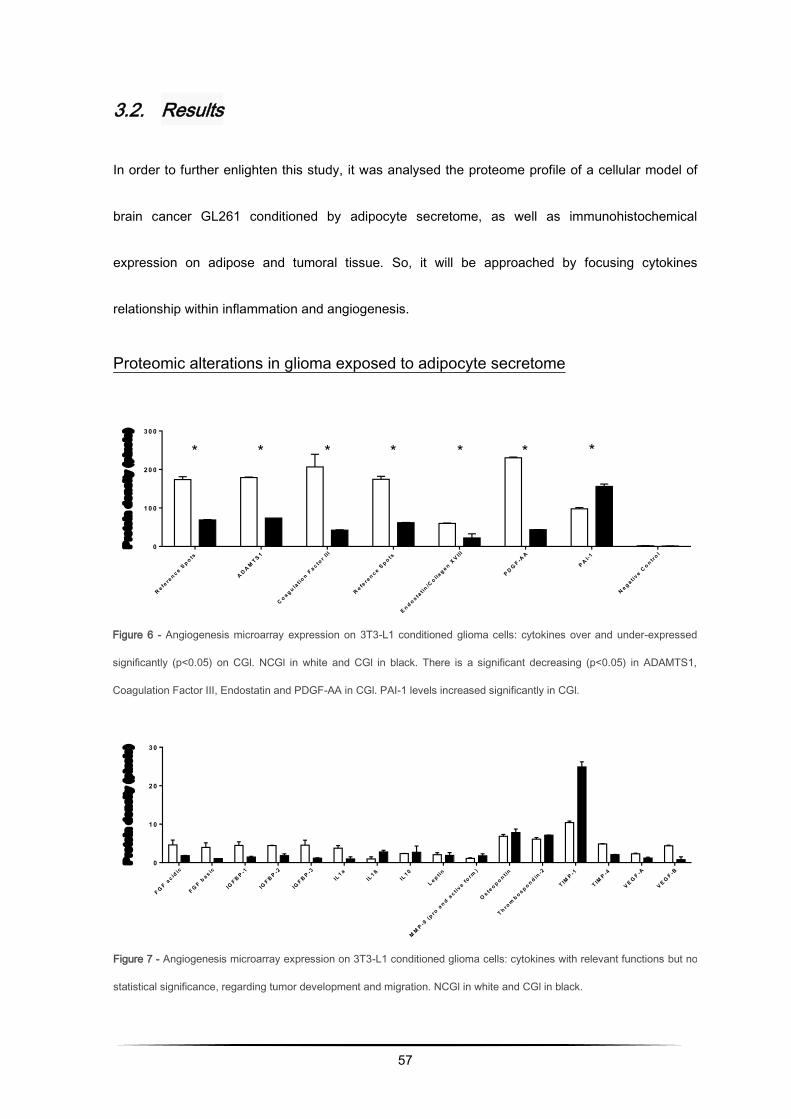
57
3.2. Results
In order to further enlighten this study, it was analysed the proteome profile of a cellular model of
brain cancer GL261 conditioned by adipocyte secretome, as well as immunohistochemical
expression on adipose and tumoral tissue. So, it will be approached by focusing cytokines
relationship within inflammation and angiogenesis.
Proteomic alterations in glioma exposed to adipocyte secretome
Figure 7 - Angiogenesis microarray expression on 3T3-L1 conditioned glioma cells: cytokines with relevant functions but no
statistical significance, regarding tumor development and migration. NCGl in white and CGl in black.
* * * * * * *
R e fere
n c e Sp o ts
A D A MT S 1
C o a g u lat io
n Fa c to
r II I
R e fere
n c e Sp o ts
E n d o s tat in
/Co lla
g e n XV III
P D GF -A
A
P A I-1
N e g a t ive C
o n trol
0
1 0 0
2 0 0
3 0 0
Pro
tein
de
ns
ity
(p
ixe
ls)
Figure 6 - Angiogenesis microarray expression on 3T3-L1 conditioned glioma cells: cytokines over and under-expressed
significantly (p<0.05) on CGl. NCGl in white and CGl in black. There is a significant decreasing (p<0.05) in ADAMTS1,
Coagulation Factor III, Endostatin and PDGF-AA in CGl. PAI-1 levels increased significantly in CGl.
F GF a
c idic
F GF b
a s ic
IGF B P -1
IGF B P -2
IGF B P -3
IL1 a
IL1 ß
IL1 0
L e p t in
MM
P -9 (p
ro a
n d ac t iv
e form
)
Os te
o p o n tin
T h rom
b o s p o n d in-2
T IMP -1
T IMP -4
V E GF -A
V E GF -B
0
1 0
2 0
3 0
Pro
tein
de
ns
ity
(p
ixe
ls)
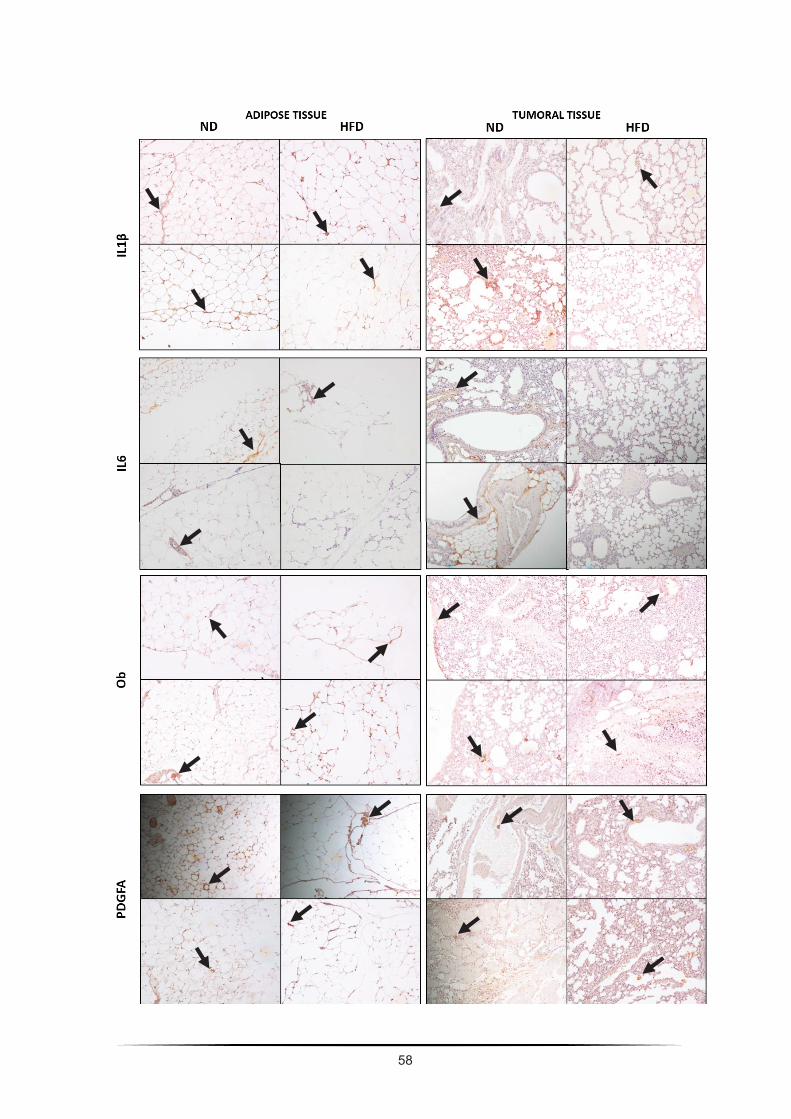
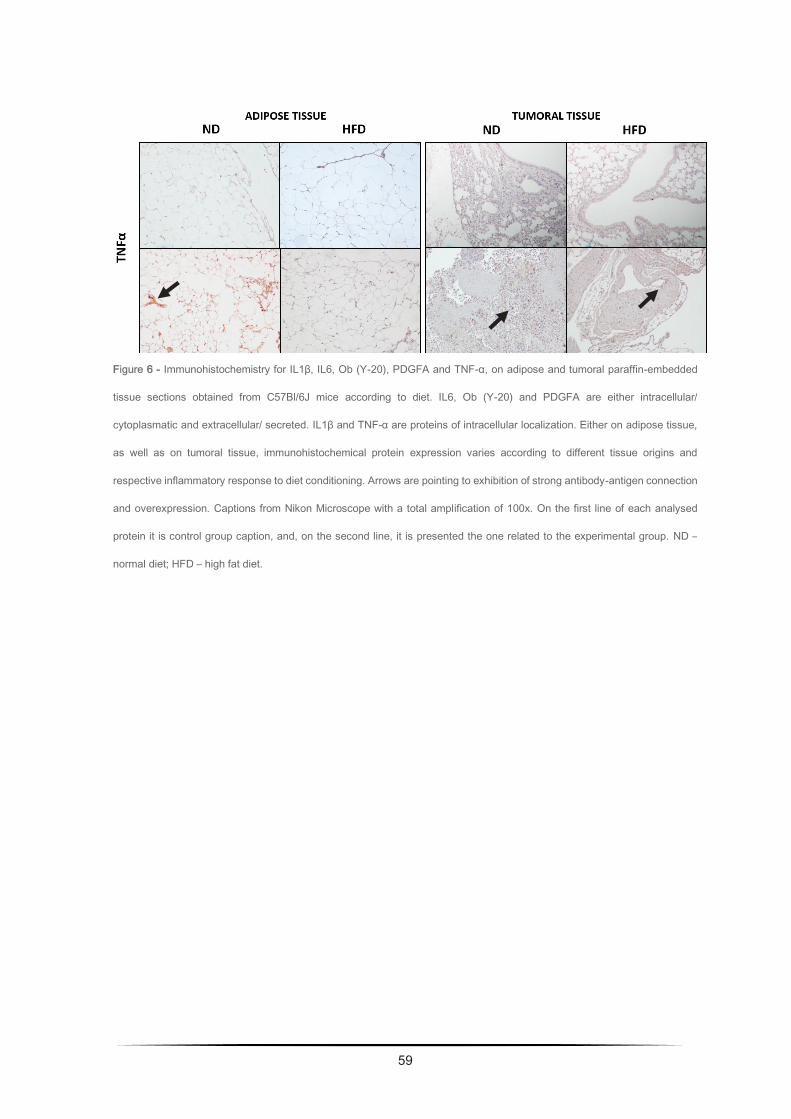
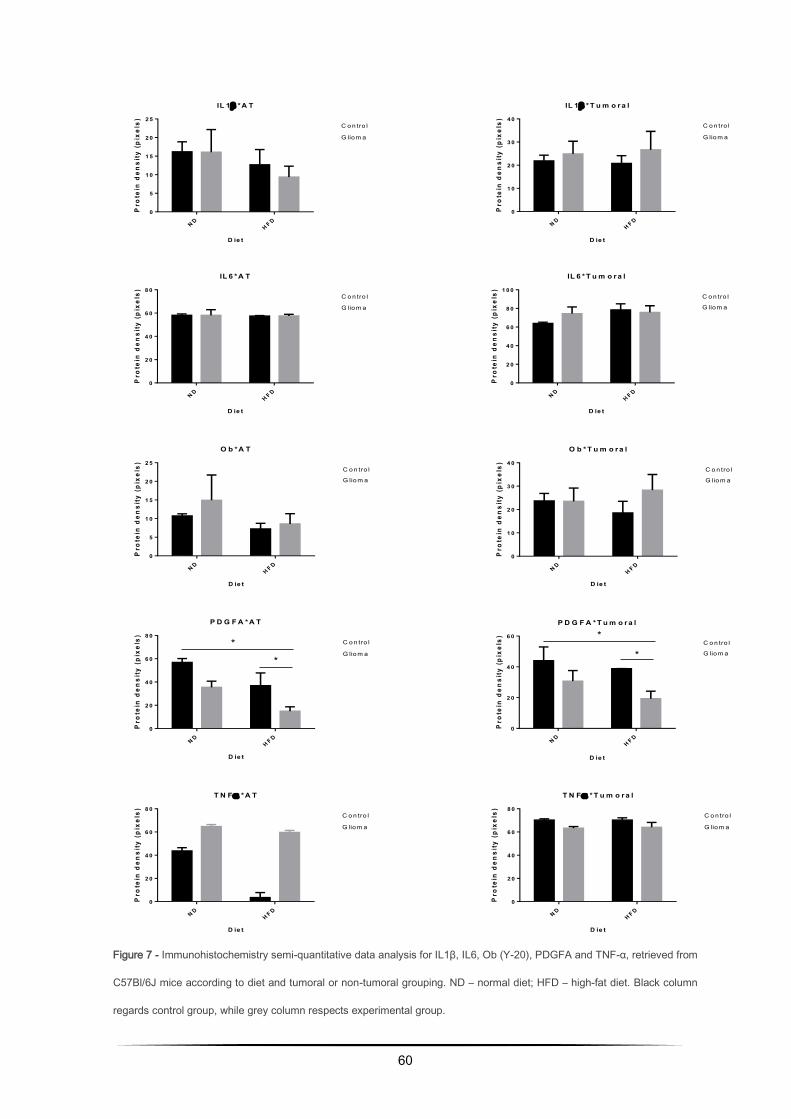
60
IL 1 *A T
D ie t
Pro
tein
den
sity
(p
ixel
s)
N DH F D
0
5
1 0
1 5
2 0
2 5C o n tro l
G liom a
IL 1 * T u m o r a l
D ie t
Pro
tein
den
sity
(p
ixel
s)
N DH F D
0
1 0
2 0
3 0
4 0C o n tro l
G liom a
IL 6 * T u m o r a l
D ie t
Pro
tein
den
sity
(p
ixel
s)
N DH F D
0
2 0
4 0
6 0
8 0
1 0 0C o n tro l
G liom a
IL 6 *A T
D ie t
Pro
tein
den
sity
(p
ixel
s)
N DH F D
0
2 0
4 0
6 0
8 0C o n tro l
G liom a
P D G F A *A T
D ie t
Pro
tein
den
sity
(p
ixel
s)
N DH F D
0
2 0
4 0
6 0
8 0C o n tro l
G liom a*
*
O b * T u m o r a l
D ie t
Pro
tein
den
sity
(p
ixel
s)
N DH F D
0
1 0
2 0
3 0
4 0C o n tro l
G liom a
O b *A T
D ie t
Pro
tein
den
sity
(p
ixel
s)
N DH F D
0
5
1 0
1 5
2 0
2 5C o n tro l
G liom a
P D G F A * T u m o r a l
D ie t
Pro
tein
den
sity
(p
ixel
s)
N DH F D
0
2 0
4 0
6 0C o n tro l
G liom a
*
*
T N F * T u m o r a l
D ie t
Pro
tein
den
sity
(p
ixel
s)
N DH F D
0
2 0
4 0
6 0
8 0C o n tro l
G liom a
T N F *A T
D ie t
Pro
tein
den
sity
(p
ixel
s)
N DH F D
0
2 0
4 0
6 0
8 0C o n tro l
G liom a
Figure 7 - Immunohistochemistry semi-quantitative data analysis for IL1β, IL6, Ob (Y-20), PDGFA and TNF-α, retrieved from
C57Bl/6J mice according to diet and tumoral or non-tumoral grouping. ND – normal diet; HFD – high-fat diet. Black column
regards control group, while grey column respects experimental group.
61
3.3. Discussion
Inflammatory and angiogenic pathways in glioma: a cellular and an animal model
Adipose tissue is defined as a lipid store depot, inflammatory and endocrine organ [130]. Thus, it
provides a chronic low-grade inflammatory condition potentiated by the presence of multiple
cytokines and hormones, sometimes associated with disease. Most part of these factors are known
to play a role in cell proliferation, apoptosis, migration and invasiveness, as well as adhesion
capacity, becoming expected to be overexpressed in conditioned medium. Recent findings point that
inflammatory, angiogenic and metabolic factors, significantly influence tumor behavior [131,132].
This study analysed the proteome profile of a cellular model of brain cancer GL261 under the
presence of adipocyte secretome, as well as immunohistochemical expression on adipose and
tumoral tissue. This will be approached by focusing cytokines relationship within inflammation and
angiogenesis.
Expression proteomic profile of GL261 conditioned medium
Intending to further elucidate the involvement of angiogenic secretome in glioma, it was evaluated
the profile of GL261 under conditioned medium (CGl). The medium proteome is a desirable sample
due to their accessibility and representability due, in part, to the wide dynamic range of protein
concentrations, which lead to the discovery of new protein markers (Figure 6).
62
As illustrated, numerous proteins with many distinct roles presented different secretion patterns in
the two media. Plasminogen Activator Inhibitor 1 (PAI-1) was found upregulated (p<0,05) in GL-261
conditioned medium, supporting the pro-inflammatory status in HFD condition. Nevertheless, a
significant reduction in coagulation factor III, endostatin, an anti-angiogenic adipokine, PDGFA,
biomarker for glioblastoma multiforme and metastazation, as well as ADAMTS1, inflammatory in
CNS and anti-angiogenic adipokine, were observed in CGl (p≤ 0,05).
It was also observed non-significant underexpression of CYR61, a pro-inflammatory and cell
adhesion involved molecule, as well as CXCL16, an angiogenic adipokine. However, it was also
observed non-significant overexpression on CGl of TIMP-1 and thrombospondin-2, both anti-
angiogenic adipokines. These data suggest a leaning for an angiogenesis inhibition in GL-261
conditioned medium, at least in an early stage.
Morphologic analysis
On adipose tissue, it can be observed bigger adipocytes on HFD tissue sections when compared to
ND samples. On tumoral tissue, it can be observed a more inflammatory cellular response when
comparing with adipose tissue, with fibrotic cellular compounds, as well as a necrotic response.
Furthermore, glioma tumoral tissue reveals a morphologic structure that mimics lung tissue, which
can be explained by the shared embryonic origin. This phenomenon has already been described in
melanoma cells under adipocytes influence [133].
63
Immunohistochemical evaluation of IL1β, IL6, Ob, PDGFA and TNFα on adipose
and tumoral tissue of syngeneic C57Bl/6J mice
In immunohistochemistry evaluation it was studied previously evaluated and significantly upregulated
proteins with angiogenic and metabolic relevance- IL1β, IL6, Ob (Y-20), PDGFA and TNFα, in
adipose and tumoral tissue (Figure 7 and 8). On adipose tissue, it was observed overexpression of
IL6 (non-significant), Ob (n.s.) and TNFα (p<0,05) in glioma HFD when compared with glioma ND.
The opposite was observed regarding IL1β (n. s.) and PDGFA (p<0,05).
However, on tumoral tissue results were quite different. It was not observed a significant variation in
glioma group in IL6, however it was perceived a tendency to underexpression of TNFα in glioma
HFD, and a significant underexpression of PDGFA. Contrariwise, IL1β and Ob (Y-20) tend to be
overexpressed in glioma HFD.
IL1β is underexpressed in glioma HFD adipose tissue but overexpressed in glioma HFD tumoral
tissue. The same behaviour was observed in IL6 analysis, though almost imperceptibly. In the
cellular assay it was also observed both proteins overexpressed in CGl conditioned medium. The
first finding may be related with the similar result regarding IL6, as far as it is known that IL1β is
secreted by microglial cells post Il6 secretion contributing for tumour development [10,134]. So, as
far as it can be seen, IL1β behaviour could be related to IL6 one. Nonetheless, on tumoral tissue it
may be observed non-significant overexpression of IL1β in glioma HFD group, which may be related
with tumoral capacity for proliferation and invasion. Even though IL1β role in glioblastoma is
64
controversial, its overexpression was reported to upregulate MMP-9 overexpression and subsequent
enhancement of glioblastoma cell lines invasiveness [10].
Regarding Ob (Y-20), it was expected an overexpression on both tissue depots as far as it contributes
to glioma development by enhancing cell growth and survival through activation of anti-apoptotic and
migration pathways [135]. Furthermore, Ob receptor is associated with tumour malignancy degree.
PDGFA, involved in proliferation and metastasisation, as well as being a VEGF regulator, was
significantly underexpressed in CGl and both tissue depots, in HFD glioma group, corroborating
cellular array assay data. This data suggests that it may be underexpressed in some initial phase,
supporting the theory of delayed tumour proliferation due to potential hypoxia and pro-inflammatory
response. Regarding VEGFs, in CGl a slightly underexpression of VEGF-A and VEGF-B was
observed, data colluding with PDGFA levels [81,136].
Concerning TNFα, its underexpression in the tissue under HFD may be an unexpected result looking
at the literature. Thus, there is published data reporting different adipokines patterns according to
adipose depots in humans versus rodents [47,137]. In this study it was analysed subcutaneous and
visceral adipose tissue were analysed as a whole, because C57Bl6/J are mice with a reduced body
volume when compared with other rodents, and the main source of adipose tissue in HFD group is
visceral. This observation leads us to the first hypothesis for these results: in diet-induced obesity it
may be observed a cell response in the first place, however hypertrophy and hypoxia may condition
pro-inflammatory state. Supporting this idea, it is seen PAI and IL6 overexpression in CGl, both
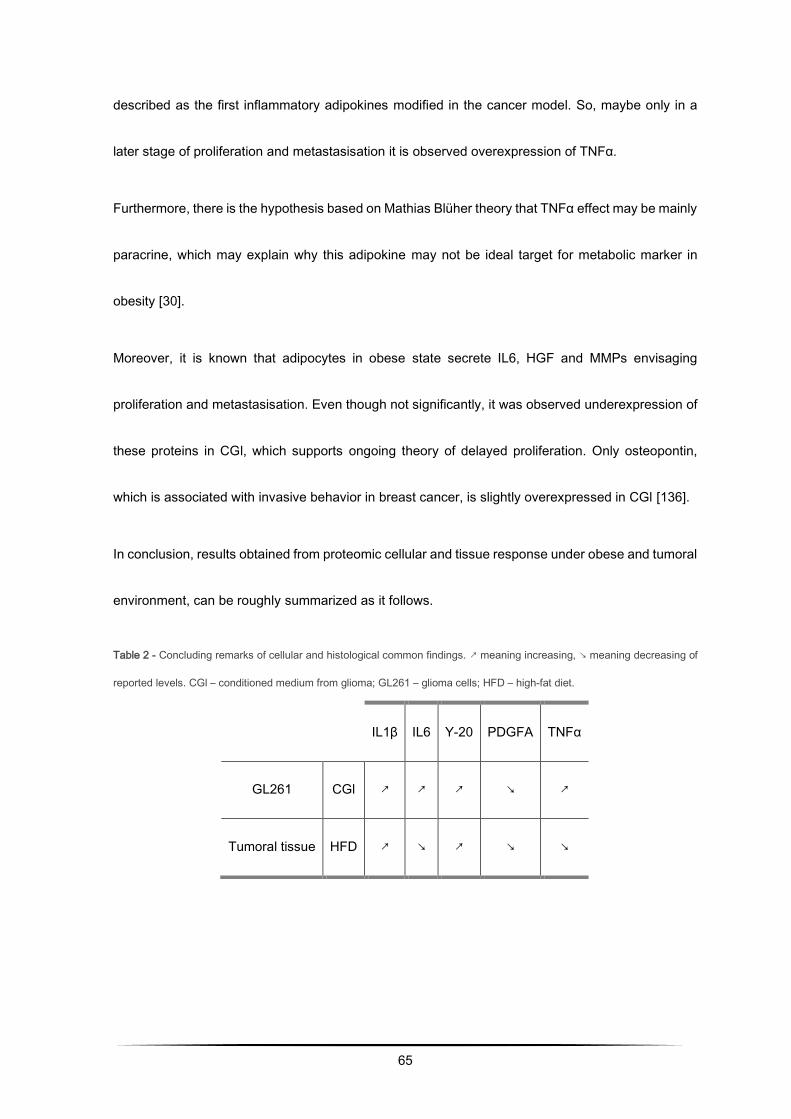
65
described as the first inflammatory adipokines modified in the cancer model. So, maybe only in a
later stage of proliferation and metastasisation it is observed overexpression of TNFα.
Furthermore, there is the hypothesis based on Mathias Blüher theory that TNFα effect may be mainly
paracrine, which may explain why this adipokine may not be ideal target for metabolic marker in
obesity [30].
Moreover, it is known that adipocytes in obese state secrete IL6, HGF and MMPs envisaging
proliferation and metastasisation. Even though not significantly, it was observed underexpression of
these proteins in CGl, which supports ongoing theory of delayed proliferation. Only osteopontin,
which is associated with invasive behavior in breast cancer, is slightly overexpressed in CGl [136].
In conclusion, results obtained from proteomic cellular and tissue response under obese and tumoral
environment, can be roughly summarized as it follows.
Table 2 - Concluding remarks of cellular and histological common findings. ↗ meaning increasing, ↘ meaning decreasing of
reported levels. CGl – conditioned medium from glioma; GL261 – glioma cells; HFD – high-fat diet.
IL1β IL6 Y-20 PDGFA TNFα
GL261 CGl ↗ ↗ ↗ ↘ ↗
Tumoral tissue HFD ↗ ↘ ↗ ↘ ↘

66

67
CHAPTER FOUR
Sphingolipid rheostat dysfunction:
a biochemistry and sphingolipidomic approach
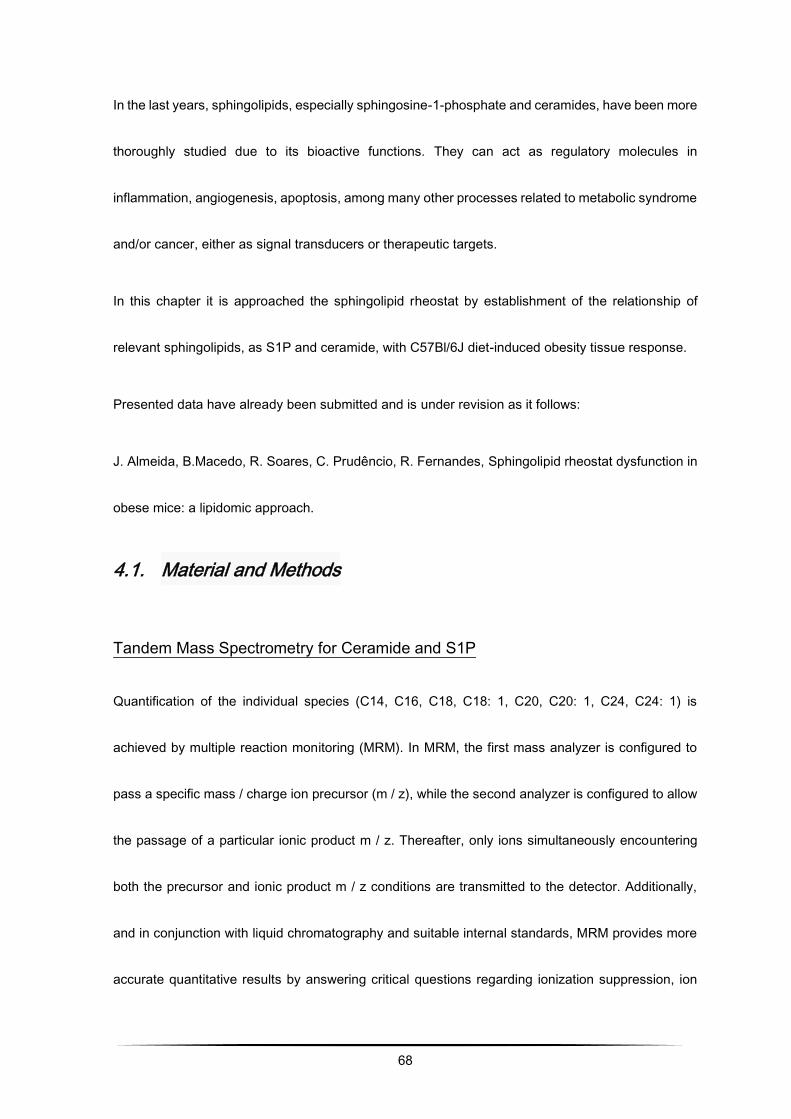
68
In the last years, sphingolipids, especially sphingosine-1-phosphate and ceramides, have been more
thoroughly studied due to its bioactive functions. They can act as regulatory molecules in
inflammation, angiogenesis, apoptosis, among many other processes related to metabolic syndrome
and/or cancer, either as signal transducers or therapeutic targets.
In this chapter it is approached the sphingolipid rheostat by establishment of the relationship of
relevant sphingolipids, as S1P and ceramide, with C57Bl/6J diet-induced obesity tissue response.
Presented data have already been submitted and is under revision as it follows:
J. Almeida, B.Macedo, R. Soares, C. Prudêncio, R. Fernandes, Sphingolipid rheostat dysfunction in
obese mice: a lipidomic approach.
4.1. Material and Methods
Tandem Mass Spectrometry for Ceramide and S1P
Quantification of the individual species (C14, C16, C18, C18: 1, C20, C20: 1, C24, C24: 1) is
achieved by multiple reaction monitoring (MRM). In MRM, the first mass analyzer is configured to
pass a specific mass / charge ion precursor (m / z), while the second analyzer is configured to allow
the passage of a particular ionic product m / z. Thereafter, only ions simultaneously encountering
both the precursor and ionic product m / z conditions are transmitted to the detector. Additionally,
and in conjunction with liquid chromatography and suitable internal standards, MRM provides more
accurate quantitative results by answering critical questions regarding ionization suppression, ion
69
dissociation kinetics and sensitivity. Calibration curves are created by adding varying amounts of
sphingolipid patterns and a constant amount of internal sphingolipid standard to the lipid matrix
control extracts, which were then transported throughout the isolation and purification procedure.
The sphingolipid response rate to the internal standard is calculated, and the sphingolipid
concentration is determined by comparison with the calibration curve. The areas under quantification
peaks are determined by the ion chromatograms obtained.
Extraction of sphingolipids from mice plasma
The plasma homogenate was fortified with 50 μL of standard internal solution, and the supernatant
corresponding to the lipid organic fraction was evaporated to dryness using nitrogen gas.
Subsequently, the residue was resuspended in 150 μL of Mobile Phase A and transferred to the
UPLC auto-sampler vial.
Quantification of sphingolipids by UPLC-MS / MS of mouse plasma
Separations were obtained with the ACQUITY UPLC BEH C18 1.7 micrometer 2.1 x 150 mm column.
All analysis were performed using the Waters ACQUITY UPLC ™ System with a Quattro Premier ™
XE Triple Quadrupole (Waters Corporation, Milford, MA) equipped with Electrospray Ionization (ESI)
probe. Succinctly, 10 μL of the resuspended extracts were injected onto a reverse phase C18 column
and eluted at 0.250 mL per minute using a linear gradient of 30% methanol solution (70% H2O) at
100% methanol for 3 minutes.
70
Clinical biochemical markers
Data related to uric acid, glucose, lipoproteins (triglycerides, total cholesterol, HDL, VLDL, LDL) and
hepatic enzymes (AST, ALT and ALP) on C57Bl/6J serum was analysed by means of
spectrophotometric assay using CORMAY Liquick Cor Kits (PZ CORMAY S. A., Polska). Uric acid,
glucose, total cholesterol, HDL, VLDL and LDL levels were accessed by sequential enzymatic
reactions with development of a colored product, which intensity is proportional to serum
concentration. Hepatic enzymes activity (AST, ALT and ALP) were measured by the rate of
absorvance at a reference wavelength, which is directly proportional to enzymatic activity.
Histochemistry of hepatic tissue: Haematoxylin-Eosin and Sirius Red
Liver samples were embedded in paraffin after standard processing and cross-sectioned into 3 μm-
thick sections. Afterwards, they were stained for routine Haematoxylin-Eosin and Sirius Red staining.
Sirius Red was performed with Sirius Red solution dissolved in acqueous saturated picric acid.
Photos were acquired with Nikon Microscope.
Statistical analysis
Data was analysed for Spearman correlation test by SPSS and t-test. Spearman correlation test rank
variables between -1 and 1, considering it a negative or positive correlation, respectively, and with 0
as reference point. P-values p<0.05 or p<0,01 were considered statistically significant.
71
4.2. Results
Sphingolipids alterations in obese mice
Regarding adipose tissue buildup, due to a fat diet or metabolic dysfunction, adipocytes can trigger
an inflammatory reaction. In addition to adipokines’ expression, it is of great interest to study the type
of circulating lipids, being obesity a suitable model for this effect. Sphingolipids constitute an
important class of bioactive compounds. Lipids such as ceramides, sphingosines and sphingosines-
1-phosphate (S1P) are important in molecular signaling and therefore play a key role in the regulation
of various cellular events, such as cell growth, differentiation, stress responses and apoptosis.
Therefore, it was proposed to study the involvement of the Cer / S1P signaling pathway in obesity.
Figure 8 - C57Bl/6J serum ratio levels of ceramide (stripes) and sphingosine-1-phosphate (points) depending on diet: normal
diet (ND) and high-fat diet, on 3 timepoints: 12, 16 and 20 weeks old. * significant for p<0,05.
0,0
0,5
1,0
1,5
2,0
2,5
3,0
12 wk 16 wk 20 wk
HF
D / N
D (
x fo
ld)
*
*
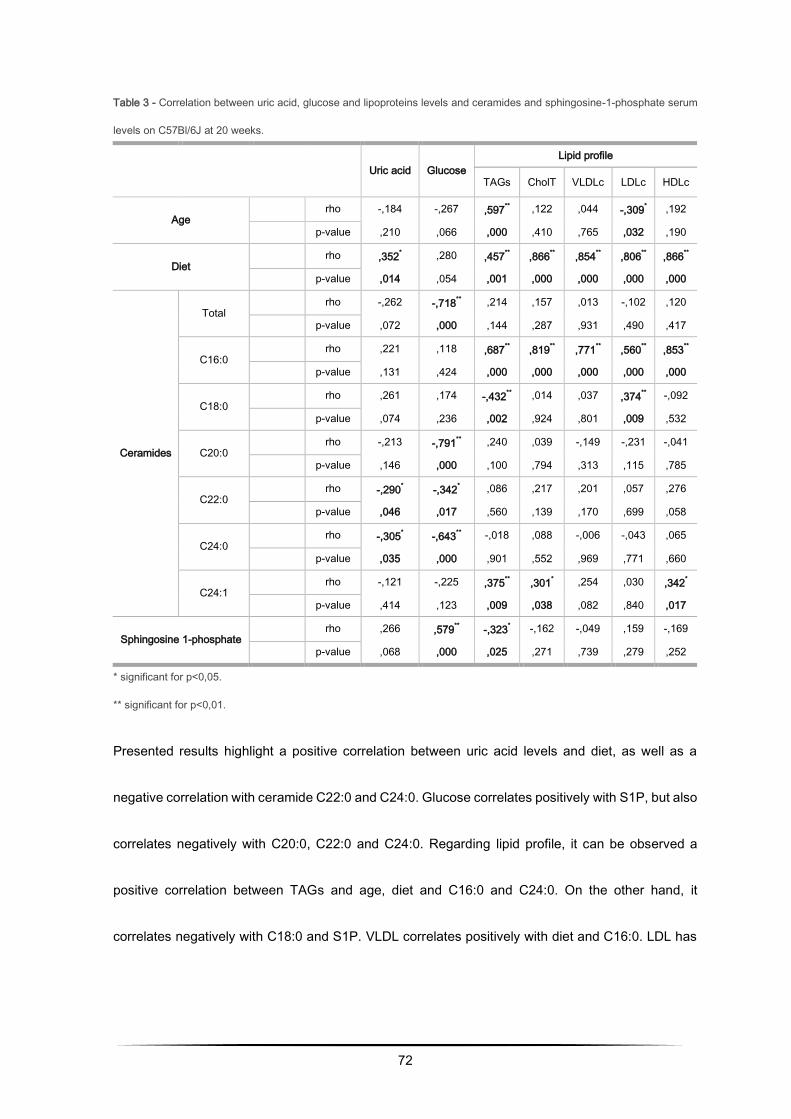
72
Table 3 - Correlation between uric acid, glucose and lipoproteins levels and ceramides and sphingosine-1-phosphate serum
levels on C57Bl/6J at 20 weeks.
* significant for p<0,05.
** significant for p<0,01.
Presented results highlight a positive correlation between uric acid levels and diet, as well as a
negative correlation with ceramide C22:0 and C24:0. Glucose correlates positively with S1P, but also
correlates negatively with C20:0, C22:0 and C24:0. Regarding lipid profile, it can be observed a
positive correlation between TAGs and age, diet and C16:0 and C24:0. On the other hand, it
correlates negatively with C18:0 and S1P. VLDL correlates positively with diet and C16:0. LDL has
Uric acid Glucose
Lipid profile
TAGs CholT VLDLc LDLc HDLc
Age rho -,184 -,267 ,597
** ,122 ,044 -,309
* ,192
p-value ,210 ,066 ,000 ,410 ,765 ,032 ,190
Diet
rho ,352* ,280 ,457
** ,866
** ,854
** ,806
** ,866
**
p-value ,014 ,054 ,001 ,000 ,000 ,000 ,000
Ceramides
Total
rho -,262 -,718** ,214 ,157 ,013 -,102 ,120
p-value ,072 ,000 ,144 ,287 ,931 ,490 ,417
C16:0 rho ,221 ,118 ,687
** ,819
** ,771
** ,560
** ,853
**
p-value ,131 ,424 ,000 ,000 ,000 ,000 ,000
C18:0 rho ,261 ,174 -,432
** ,014 ,037 ,374
** -,092
p-value ,074 ,236 ,002 ,924 ,801 ,009 ,532
C20:0 rho -,213 -,791
** ,240 ,039 -,149 -,231 -,041
p-value ,146 ,000 ,100 ,794 ,313 ,115 ,785
C22:0 rho -,290
* -,342
* ,086 ,217 ,201 ,057 ,276
p-value ,046 ,017 ,560 ,139 ,170 ,699 ,058
C24:0 rho -,305
* -,643
** -,018 ,088 -,006 -,043 ,065
p-value ,035 ,000 ,901 ,552 ,969 ,771 ,660
C24:1 rho -,121 -,225 ,375
** ,301
* ,254 ,030 ,342
*
p-value ,414 ,123 ,009 ,038 ,082 ,840 ,017
Sphingosine 1-phosphate rho ,266 ,579
** -,323
* -,162 -,049 ,159 -,169
p-value ,068 ,000 ,025 ,271 ,739 ,279 ,252
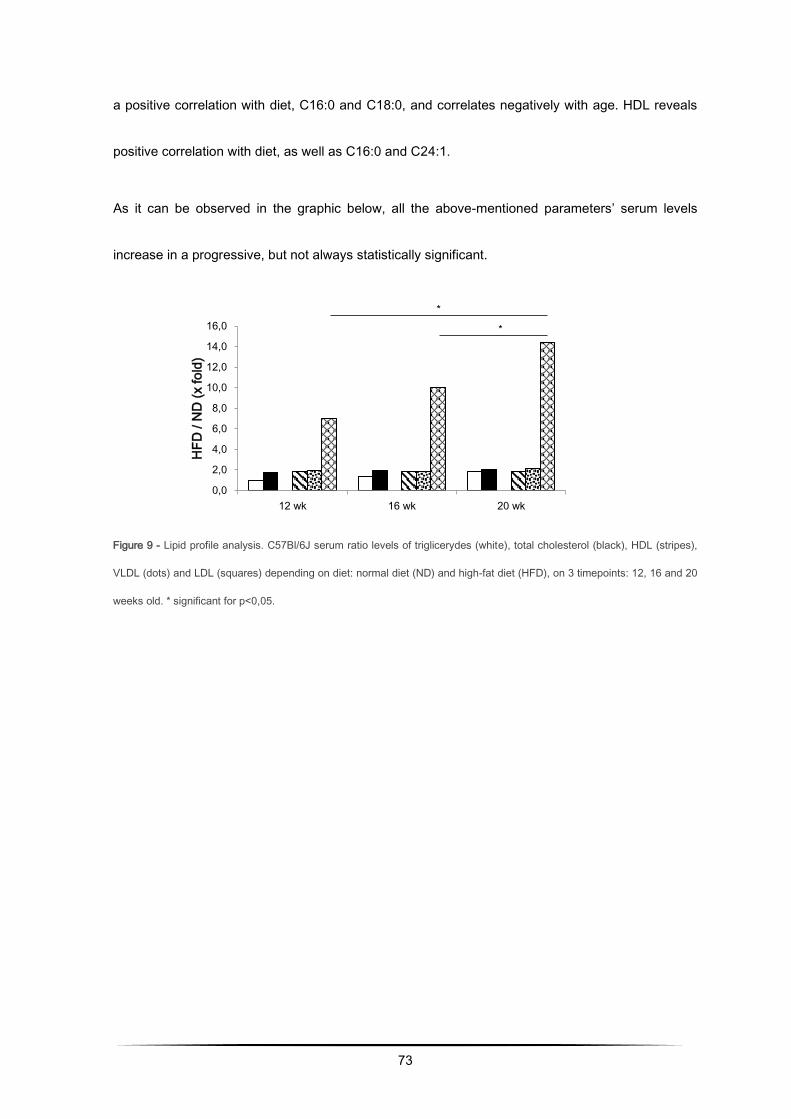
73
a positive correlation with diet, C16:0 and C18:0, and correlates negatively with age. HDL reveals
positive correlation with diet, as well as C16:0 and C24:1.
As it can be observed in the graphic below, all the above-mentioned parameters’ serum levels
increase in a progressive, but not always statistically significant.
Figure 9 - Lipid profile analysis. C57Bl/6J serum ratio levels of triglicerydes (white), total cholesterol (black), HDL (stripes),
VLDL (dots) and LDL (squares) depending on diet: normal diet (ND) and high-fat diet (HFD), on 3 timepoints: 12, 16 and 20
weeks old. * significant for p<0,05.
0,0
2,0
4,0
6,0
8,0
10,0
12,0
14,0
16,0
12 wk 16 wk 20 wk
HF
D / N
D (
x fo
ld)
*
*
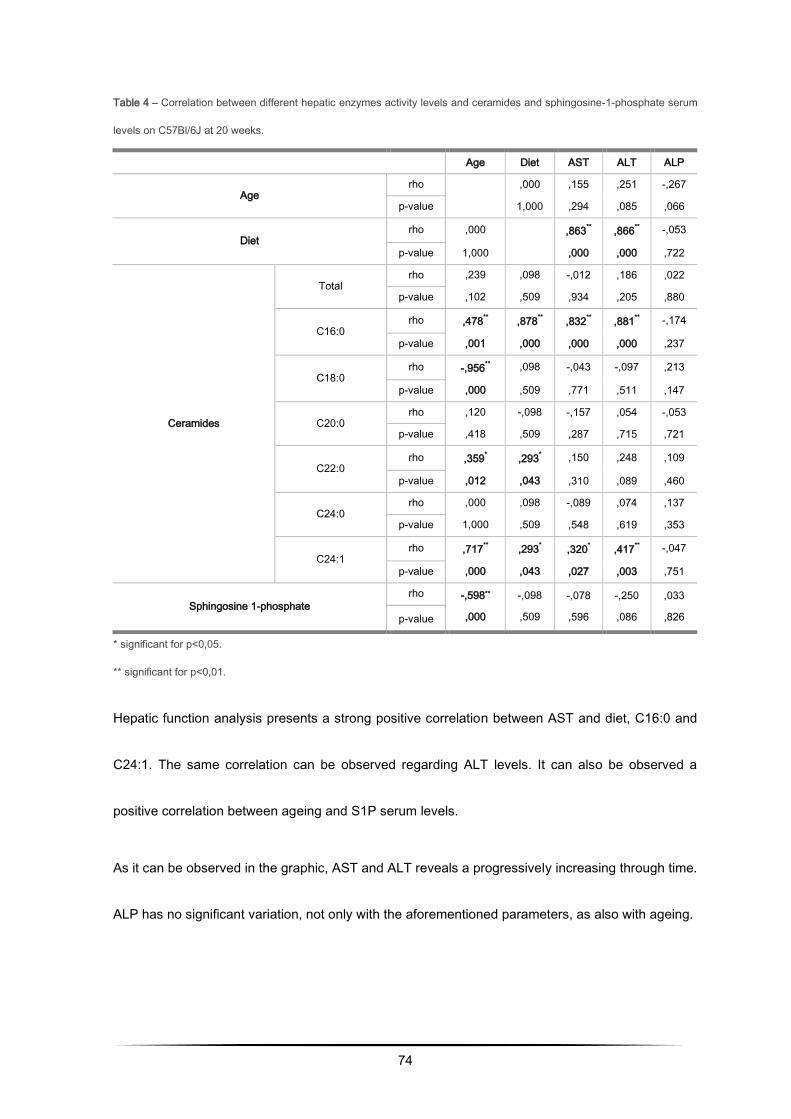
74
Table 4 – Correlation between different hepatic enzymes activity levels and ceramides and sphingosine-1-phosphate serum
levels on C57Bl/6J at 20 weeks.
* significant for p<0,05.
** significant for p<0,01.
Hepatic function analysis presents a strong positive correlation between AST and diet, C16:0 and
C24:1. The same correlation can be observed regarding ALT levels. It can also be observed a
positive correlation between ageing and S1P serum levels.
As it can be observed in the graphic, AST and ALT reveals a progressively increasing through time.
ALP has no significant variation, not only with the aforementioned parameters, as also with ageing.
Age Diet AST ALT ALP
Age rho
,000 ,155 ,251 -,267
p-value 1,000 ,294 ,085 ,066
Diet rho ,000
,863
** ,866
** -,053
p-value 1,000 ,000 ,000 ,722
Ceramides
Total rho ,239 ,098 -,012 ,186 ,022
p-value ,102 ,509 ,934 ,205 ,880
C16:0 rho ,478
** ,878
** ,832
** ,881
** -,174
p-value ,001 ,000 ,000 ,000 ,237
C18:0 rho -,956
** ,098 -,043 -,097 ,213
p-value ,000 ,509 ,771 ,511 ,147
C20:0 rho ,120 -,098 -,157 ,054 -,053
p-value ,418 ,509 ,287 ,715 ,721
C22:0 rho ,359
* ,293
* ,150 ,248 ,109
p-value ,012 ,043 ,310 ,089 ,460
C24:0 rho ,000 ,098 -,089 ,074 ,137
p-value 1,000 ,509 ,548 ,619 ,353
C24:1 rho ,717
** ,293
* ,320
* ,417
** -,047
p-value ,000 ,043 ,027 ,003 ,751
Sphingosine 1-phosphate
rho -,598**
,000
-,098
,509
-,078
,596
-,250
,086
,033
,826 p-value
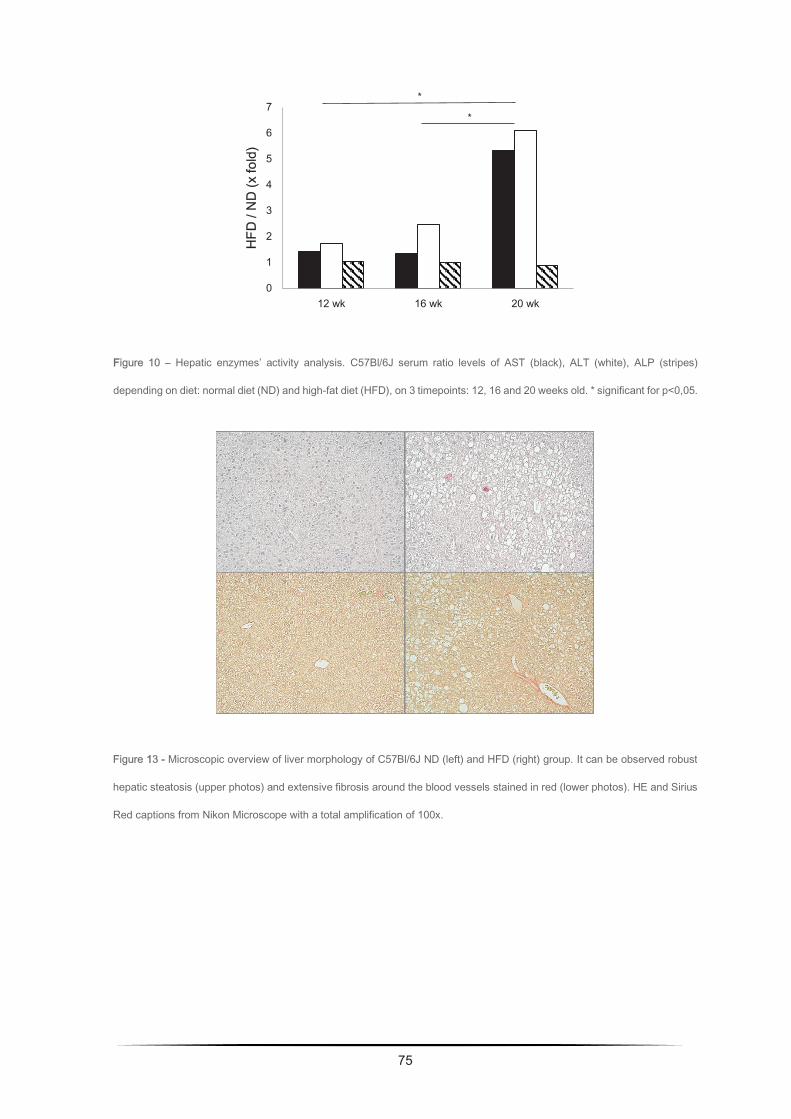
76
4.3. Discussion
High-fat diet decreases sphingosine-1-phosphate
Metabolism of sphingolipids can be activated in different situations, such as by pro-inflammatory
cytokines, growth factors and oxidative stress, which characterize the environment in which the
adipose tissue is found in obesity. Lipidomic studies of ceramide and S1P sphingolipids in C57Bl/6J
mice plasma, displayed agreement with some other of the analysed parameters.
Ceramide is characterized by being a biomolecule which, in certain intracellular levels, presents anti-
proliferative and pro-apoptotic power. Its pro-apoptotic function is related to the activation of signaling
cascades involving activation of caspase by cytochrome C [87,88]. According to presented data,
ceramide serum levels ratio increased progressively over time. Giving existing information on this
sphingolipid, the secretion of pro-inflammatory cytokines and the increase of fatty acids in obesity
may justify the increase of the ceramide levels observed up to 20 weeks. That is, the inflammatory
state observed at this stage triggered anti-proliferative and anti-apoptotic effects by increasing the
levels of plasma ceramide. Moreover, HFD promotes an increase of body weight and a myriad of
systemic cytokines levels, as well as an almost completely suppression of ASMase activities on
adipose tissue. In this sequence, ASMase inhibition reduces insulin receptor sensitivity, which
constitutes plausible evidence of ceramide biosynthesis playing an important role in metabolic
syndrome, as well as in obesity development. Furthermore, clinical studies reveal that reduction of
77
ceramide levels correlate with weight loss, insulin sensitivity improvement as well as decreasing of
TNF-α concentration [138,139]. This data correlates not only with results obtained from serum
ceramide, but also with increased expression of TNF-α in adipose tissue from adipose tissue of
glioma induced mice. Other studies involving mice also reported an increase, although not very high,
in total serum and tissue ceramide levels. They also observed that the consistently elevated
concentration of TNF-α in obesity increases the biosynthesis of ceramide, which contributes to
several distinctive changes of the metabolic syndrome [140]. Contributing to these contradictory
results, it has been described an increase in pro-inflammatory cytokines, such as TNF-α and IL6, by
induction of S1P and not by ceramide [89]. Although not significantly, it was observed a minor
decreasing in TNF-α tumoral tissue expression, supporting the theory of these cytokines being
induced by S1P and not ceramide, as well as that sphingolipids produced at different locations may
have different functions. This may be a plausible explanation for the observed differences between
adipose tissue and blood plasma results [141].
S1P reveals a slight decrease in serum levels over time, and correlates negatively with age (table
3), which may be due to the advanced inflammatory state and subsequent hypoxia, in which the
proliferative and angiogenic capacity of the adipocytes tries to overlap the pro-apoptotic effect of
ceramide. S1P is involved in cell proliferation and survival, angiogenesis and vascular maturation,
tumorigenesis and inhibition of apoptosis induced by ceramide, TNF-α and others toxic agents
[87,97,142,143]. Its relationship with proliferation also explains the strong negative correlation with

78
age. S1P is secreted by a myriad of cells, some of them present in adipose tissue stroma. Cellular
proliferation promoted by S1P occurs through effectors such as phospholipase C, adenylate cyclase,
extracellular signal regulation kinase (ERK), among others [88]. However, some studies performed
with cells transfected with S1P phosphatase revealed increased cell death simultaneously with
increased levels of ceramide and sphingosine [143]. So, data here presented, in which mice
undergoing ND have higher S1P levels than HFD mice may be related to the advanced hypoxic state
previously mentioned, not allowing proliferative and anti-apoptotic purposes of S1P. Thus, perhaps
in a later evaluation, the inflammatory process could already have been triggered, promoting the
angiogenic process and, consequently, increasing S1P levels in a low-grade inflammatory state that
is obesity. Regarding the regulation of cell migration, the S1P2 receptor is a powerful inhibitor of
S1P-induced cell migration, as well as tyrosine kinase receptors, such as IGF-1 and PDGF. Analysis
unveiled on this thesis until this point revealed underexpression in PDGF-α in adipose and tumoral
tissues, adding to decreasing in S1P serum levels. These may suggest activation of different
receptors in obesity and would also require further studies for clarification.
The observed inverse tendency of both ceramide and S1P is in line with previously and widely
described information on the antagonistic functions of these sphingolipids. Moreover, obtained data
manifestly supports the concept that clinical animal model of obesity should be older than 20 weeks
years old for undoubtful observation of relevant clinical features.
79
Hepatic enzymes and lipoproteins levels increase with obesity
The lipid profile and hepatic function analysis displayed a predictable behavior of these factors
according to obesity low-grade inflammatory state and metabolic syndrome in general.
On a broader analysis, and regarding uric acid, glucose and lipoproteins (Figure 11) – triglycerides
and cholesterol -, it is noticeable a continuously increment in its levels throughout time, except for
HDL, which suffers a decrease characteristic from the negative impact of obesity progression. As it
has been already described, obesity and possible development of obesity related problems regarding
the liver, namely non-alcoholic steatohepatitis (NASH) and non-alcoholic fatty liver disease (NAFLD)
promote an increase in FFA circulating levels, either in children/ adolescents and adults [144,145].
These FFA stimulate β-oxidation and mitochondrial excessive ROS production. These sequence of
events not only contributes to hepatic accumulation of TAGs, as well as LDL and VLDL vascular
deposition. Concerning uric acid, it is a product from cell death resulting from nuclear degradation or
cellular destruction, and a final product of purine metabolism, exerting pro-inflammatory and pro-
oxidant effects on adipose tissue. Furthermore, cumulative levels of FFA in the liver contributes to
de novo synthesis of purines, which increases its serum levels, as well as activity of hepatic enzymes,
namely AST, ALT. On the opposite, ALP expresses a slightly, but not significant, decrease on the
last timepoint (Figure 12). These enzymes, among many others, are related with metabolic
syndrome, type 2 diabetes, insulin resistance and cardiovascular diseases, acting as metabolic
syndrome predictive factors. Despite AST not being a specific marker for liver function it is present
80
on other relevant tissues under the metabolic and cardiovascular point of view, such as
musculoskeletal tissue [146,147].
On a closer analysis, it can be observed a positive correlation between uric acid and diet, and a
negative correlation with C22:0 and C24:0. Also glucose presents a positive correlation with S1P,
but negatively with C20:0, C22:0 and C24:0. Taken together, these data reinforces the previously
mentioned relationship between excessive lipids’ intake and FFA circulating levels, which contribute
not only to mitochondrial dysfunction, but also act as a signal that tumoral tissue (and surrounding
cells) consume high levels of glucose (as its main fuel), decreasing its serum levels (table 2).
Moreover, and regarding ageing and lipid profile, TAG, VLDL and LDL levels correlate positively with
diet and C16:0 as these parameters relate directly with dietary excessive intake of lipids.
Furthermore, hepatic function analysis presents a strong positive correlation between AST and ALT
(in a lesser extent) and diet, C16:0 and C24:1, which emphasizes the idea of hepatic activity overload
due to excessive dietary intake. Taken together, and considering published results, these data
discloses a potential for C16:0 and C24:1 to be used as early clinical biomarkers for low-grade
chronic inflammation [148]. Last, but not least, ageing and S1P serum levels correlation supports the
fact that proliferation and cellular activity in general decreases along time.
Data retrieved from sphingolipid analysis, as well as hepatic function supports the idea of worsening
state of general metabolic condition along with the progression of obese low-grade inflammatory
state. This response is more visible and immediate than tissue response, which may be related to
81
the fact that serum levels increase almost directly in response to FFA from a diet rich in saturated
fats, largely exceeding adipocytes storage capacity and accumulating in hepatic and other
metabolically active tissues.
Morphologic analysis
On hepatic tissue (Figure 13) from ND group, it can be observed regular hepatocytes morphology,
as well as absent fibrosis. On the contrary, on hepatic tissue from HFD group it is observed extensive
fat necrosis, also designated as hepatic steatosis, which is compatible with our enzymatic (increased
ALT and AST serum levels) and lipid profile (increased TAGs and VLDL, among others).
Furthermore, it is visible fibrosis around blood vessels, which is expected according with increased
FGF expression observed in proteomic assays.

82

83
CHAPTER FIVE
General discussion and Future perspectives
84
Expansion and elementary purposes of organs and tissues relay on angiogenesis, and angiogenesis
role in adipose tissue development and obesity is crucial. Besides, a great number of studies point
that an insufficiency in adipose tissue angiogenesis contributes to metabolic disease in obesity.
Understanding and defining the mechanisms involved in glioma development and progression, even
more in obesity epidemics, may enable the identification of novel therapeutics targets for an earlier
intervention, as long as modifications are likely to take place at the gene, and then, at the protein
level. The results presented in this thesis provide further insights into this matter, but also unclutter
intriguing questions worth to be explored in the future.
In a first approach, to understand which adipocyte secreted proteins influence glioma tumor behavior,
conditioned medium of glioma cells was analysed by bidimensional polyacrylamide gel
electrophoresis under denatured conditions (2D-PAGE) followed by matrix assisted laser desorption
ionization time-of-flight/mass spectrometry (MALDI-TOF-MS). MALDI-TOF and proteomic array
results suggest that, on an initial phase, obesity contributes for diminishing the tumor power to initiate
its development. Even though, as time goes by, studied growth factors positively influenced
proliferation and restrict tumorigenic growth. However, decreased levels of growth and hypoxic
factors, and different metalloproteases, suggest that previous tumor proliferation due to obesity is
restricted and confined, not metastizing. Thus, presented data reinforce the idea on obesity
protecting against glioma initiation and metastization. Moreover, it is defended the hypothesis that
85
under an obesity environment, glioma cells may reshuffle their metabolic patterns towards increased
lipid consumption for aerobic ATP production over glucose and other simple sugars.
Then, microarray analysis allowed identification of several factors released by adipocytes with
characteristic functions, such as pro-inflammatory, metabolic, angiogenic growth factors and
hormones, which are secreted to the medium into a higher or lesser extent. Whereas PAI-1 was
overexpressed on CGl, ADAMTS1, Coagulation Factor and PDGFA were underexpressed on CGl.
In situ evaluation by immunohistochemistry reveals some controversial results as it was observed
Il1β and IL6 underexpression in glioma HFD adipose tissue but overexpression in glioma HFD
tumoral tissue; PDGFA significant underexpression in CGl and both tissue depots, in HFD glioma
group; TNFα underexpression in the tissue under HFD, and Ob (Y-20) overexpression on both tissue
depots, this one, an expected result. So, data from the literature reinforce these findings on the effect
of conditioned medium from adipose tissue in GL261, as long as it was observed an early impediment
to cell proliferation and migration, due to a delayed pro-inflammatory response. Similar behavior was
observed on adipose tissue (in vivo), suggesting that initial hypertrophy delays the angiogenic and
inflammatory major response. Nevertheless, tumoral tissue had a slightly opposite behavior,
displaying an augmentation on inflammatory response and cell proliferation, suggesting a more
efficient local angiogenic response to hypoxia and evasion to apoptosis.
Moreover, lipidomic studies in the obesity mice model allowed to detect some significant differences
in the Cer and S1P serum levels, within agreement with some other of the analysed parameters.
86
According to these results, ceramide serum levels in normal diet mice decreased progressively over
time, whereas that HFD mice increased through time. These data, along with lipidic and enzymatic
activity profile and pro-inflammatory cytokines secretion may justify the increase of the ceramide
levels observed up to 20 weeks. That is, the inflammatory state observed at this stage triggered anti-
proliferative and anti-apoptotic effects by increasing the concentration of plasma ceramide. Literature
have already described a correlation between weight loss, insulin sensibility and TNF-α decreasing
levels, which relate not only with evaluated serum ceramide levels, but also with elevated expression
of TNF-α in adipose tissue from adipose tissue of glioma induced mice. Additionally, S1P analysis
reveals a slight decrease in serum levels over time, which may be due to the advanced inflammatory
state and subsequent hypoxia, in which the proliferative and angiogenic power of adipocytes tries to
overlap with the pro-apoptotic effect of ceramide. Regarding different serum levels and tissue
expression considering its localizations, it would be of utmost interest and pertinence to
simultaneously evaluate the expression of sphingolipids in plasma serum and target tissues, thus
enabling an understanding of sphingolipid behavior in obesity and its contribution to gliomagenesis.
So, the analysis of ceramide and S1P levels sustain the concept of a prevailing inflammatory process
in the obese mice contributing for a hypoxic state, albeit at a very early stage, delaying the apoptotic
process conducted by ceramides and other pro-inflammatory adipokines.
This study presents a paradoxical relationship between obesity and cancer, with results reinforcing
the idea on obesity protecting against glioma initiation and proliferation, and undoubtedly requires
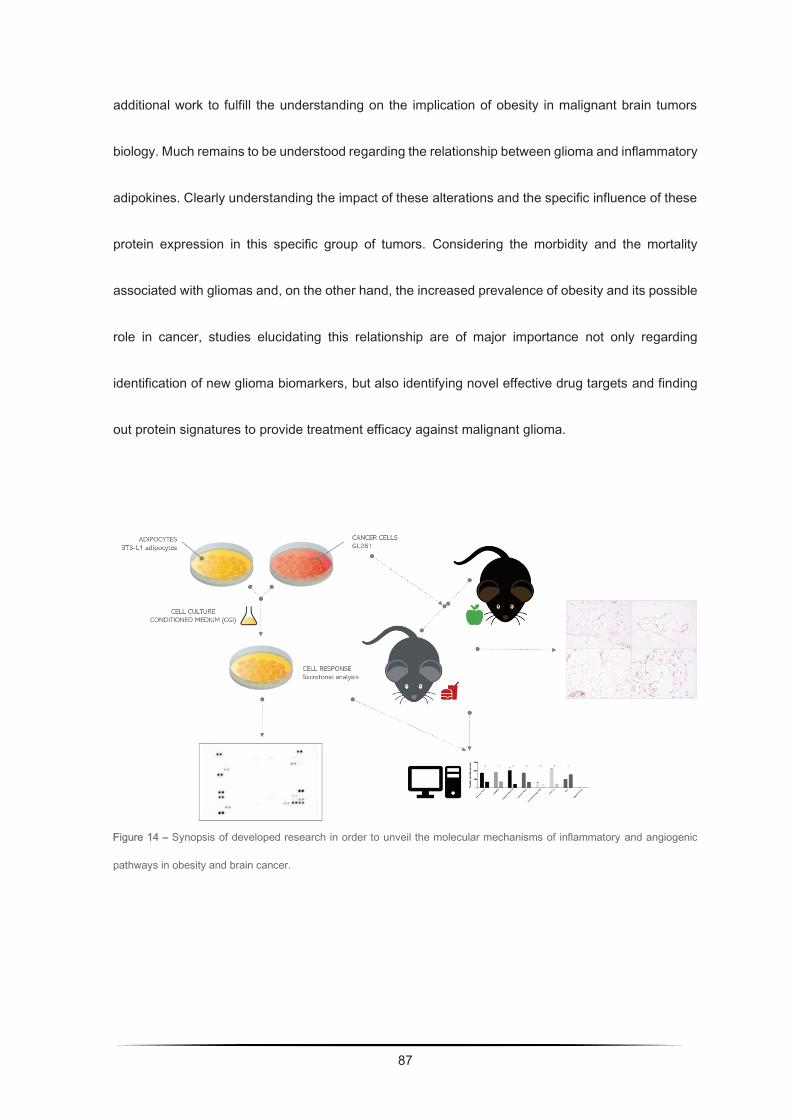
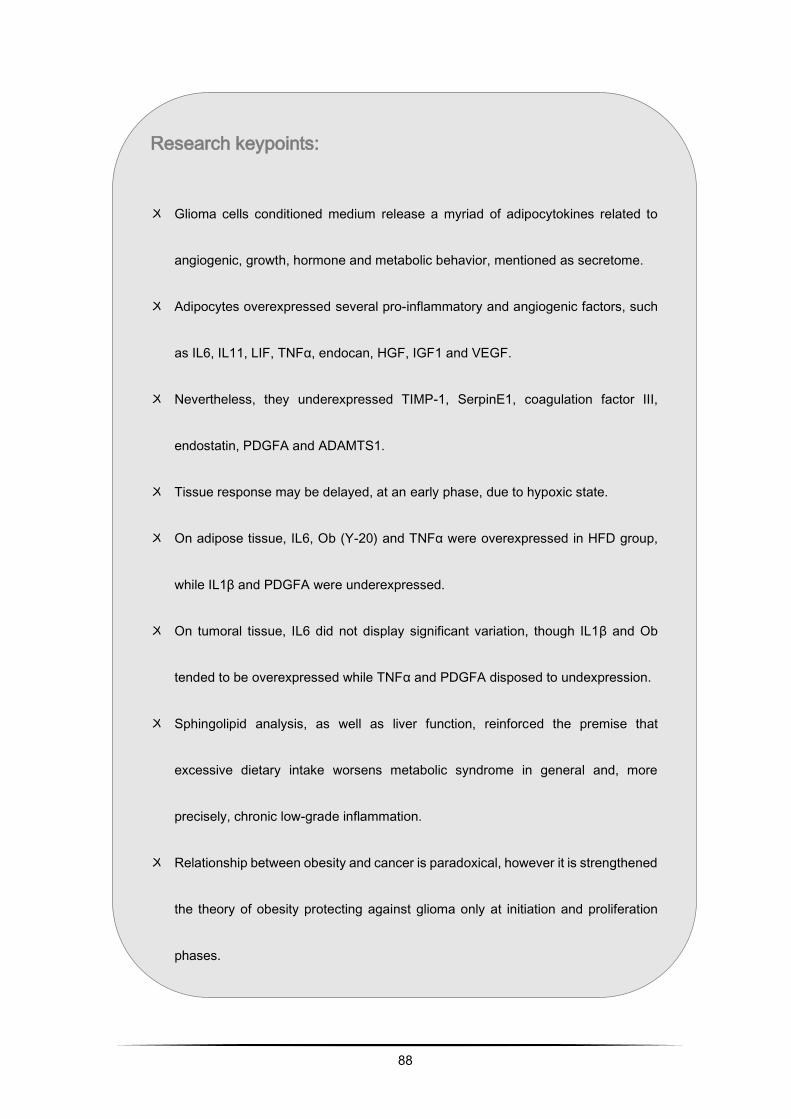
88
Research keypoints:
〤 Glioma cells conditioned medium release a myriad of adipocytokines related to
angiogenic, growth, hormone and metabolic behavior, mentioned as secretome.
〤 Adipocytes overexpressed several pro-inflammatory and angiogenic factors, such
as IL6, IL11, LIF, TNFα, endocan, HGF, IGF1 and VEGF.
〤 Nevertheless, they underexpressed TIMP-1, SerpinE1, coagulation factor III,
endostatin, PDGFA and ADAMTS1.
〤 Tissue response may be delayed, at an early phase, due to hypoxic state.
〤 On adipose tissue, IL6, Ob (Y-20) and TNFα were overexpressed in HFD group,
while IL1β and PDGFA were underexpressed.
〤 On tumoral tissue, IL6 did not display significant variation, though IL1β and Ob
tended to be overexpressed while TNFα and PDGFA disposed to undexpression.
〤 Sphingolipid analysis, as well as liver function, reinforced the premise that
excessive dietary intake worsens metabolic syndrome in general and, more
precisely, chronic low-grade inflammation.
〤 Relationship between obesity and cancer is paradoxical, however it is strengthened
the theory of obesity protecting against glioma only at initiation and proliferation
phases.
89
BIBLIOGRAPHIC REFERENCES
[1] O. Gusyatiner, M.E. Hegi, Glioma epigenetics: From subclassification to novel treatment
options, Semin. Cancer Biol. 51 (2018) 50–58. doi:10.1016/j.semcancer.2017.11.010.
[2] W. Patrick, S. Kesari, Malignant Gliomas in Adults, N. Engl. J. Med. 359 (2008) 492–507.
doi:10.1056/NEJMc086380.
[3] A. Omuro, L.M. DeAngelis, Glioblastoma and Other Malignant Gliomas, JAMA. 310 (2013)
1842. doi:10.1001/jama.2013.280319.
[4] J.T. Huse, E. Holland, L.M. DeAngelis, Glioblastoma: Molecular Analysis and Clinical
Implications., Annu. Rev. Med. 64 (2013) 59–70. doi:10.1146/annurev-med-100711-143028.
[5] J. Chen, R.M.M. McKay, L.F.F. Parada, Malignant Glioma: Lessons from Genomics, Mouse
Models, and Stem Cells, Cell. 149 (2012) 36–47. doi:10.1016/j.cell.2012.03.009.
[6] M.N. Bainbridge, G.N. Armstrong, M.M. Gramatges, a. a. Bertuch, S.N. Jhangiani, H.
Doddapaneni, L. Lewis, J. Tombrello, S. Tsavachidis, Y. Liu, a. Jalali, S.E. Plon, C.C. Lau,
D.W. Parsons, E.B. Claus, J. Barnholtz-Sloan, D. Il’yasova, J. Schildkraut, F. Ali-Osman, S.
Sadetzki, C. Johansen, R.S. Houlston, R.B. Jenkins, D. Lachance, S.H. Olson, J.L. Bernstein,
R.T. Merrell, M.R. Wrensch, K.M. Walsh, F.G. Davis, R. Lai, S. Shete, K. Aldape, C.I. Amos,
90
P. a. Thompson, D.M. Muzny, R. a. Gibbs, B.S. Melin, M.L. Bondy, Germline Mutations in
Shelterin Complex Genes Are Associated With Familial Glioma, JNCI J. Natl. Cancer Inst.
107 (2014) dju384–dju384. doi:10.1093/jnci/dju384.
[7] A. Luisa, D. Stefano, V. Enciso-mora, Y. Marie, V. Desestret, B. Boisselier, K. Mokhtari, A.
Idbaih, K. Hoang-xuan, J. Delattre, R.S. Houlston, M. Sanson, Association between glioma
susceptibility molecular etiologies, (2012) 1–6.
[8] C. Villa, C. Miquel, D. Mosses, M. Bernier, A.L. Di Stefano, The 2016 World Health
Organization classification of tumours of the central nervous system, Presse Med. 47 (2018)
e187–e200. doi:10.1016/J.LPM.2018.04.015.
[9] A. Perry, P. Wesseling, Histologic classification of gliomas, Handb. Clin. Neurol. 134 (2016)
71–95. doi:10.1016/B978-0-12-802997-8.00005-0.
[10] M.B. Nijaguna, C. Schröder, V. Patil, S.D. Shwetha, A.S. Hegde, B.A. Chandramouli, A.
Arivazhagan, V. Santosh, J.D. Hoheisel, K. Somasundaram, Definition of a serum marker
panel for glioblastoma discrimination and identification of Interleukin 1β in the microglial
secretome as a novel mediator of endothelial cell survival induced by C-reactive protein, J.
Proteomics. 128 (2015) 251–261. doi:10.1016/J.JPROT.2015.07.026.
[11] D.H. Gutmann, Microglia in the tumor microenvironment: taking their TOLL on glioma biology,
(n.d.). doi:10.1093/neuonc/nou346.
91
[12] D.L. Roberts, C. Dive, A.G. Renehan, Biological mechanisms linking obesity and cancer risk:
new perspectives, Annu. Rev. Med. 61 (2010) 301–316.
doi:10.1146/annurev.med.080708.082713.
[13] M.J. Khandekar, P. Cohen, B.M. Spiegelman, Molecular mechanisms of cancer development
in obesity, Nat. Rev. Cancer. 11 (2011) 886–895. doi:10.1038/nrc3174.
[14] P.L. Prieto-Hontoria, P. Pérez-Matute, M. Fernández-Galilea, M. Bustos, J.A. Martínez, M.J.
Moreno-Aliaga, Role of obesity-associated dysfunctional adipose tissue in cancer: a
molecular nutrition approach., Biochim. Biophys. Acta. 1807 (2011) 664–678.
doi:10.1016/j.bbabio.2010.11.004.
[15] E.E. Calle, M.J. Thun, Obesity and Cancer, Oncogene. 23 (2004) 6365–6378.
doi:10.1038/sj.onc.1207751.
[16] R.C.M. van Kruijsdijk, E. van der Wall, F.L.J. Visseren, Obesity and Cancer: The role of
dysfunctional adipose tissue, Cancer Epidemiol. Biomarkers Prev. 18 (2009) 2569–2578.
doi:10.1158/1055-9965.EPI-09-0372.
[17] K.Y. Wolin, K. Carson, G. a Colditz, Obesity and Cancer, Oncologist. 15 (2010) 556–565.
doi:10.1634/theoncologist.2009-0285.
[18] V.S. Benson, K. Pirie, J. Green, D. Casabonne, V. Beral, Lifestyle factors and primary glioma
and meningioma tumours in the Million Women Study cohort., Br. J. Cancer. 99 (2008) 185–
92
90. doi:10.1038/sj.bjc.6604445.
[19] L. Disney-Hogg, A. Sud, P.J. Law, A.J. Cornish, B. Kinnersley, Q.T. Ostrom, K. Labreche,
J.E. Eckel-Passow, G.N. Armstrong, E.B. Claus, D. Il ’yasova, J. Schildkraut, J.S. Barnholtz-
Sloan, S.H. Olson, J.L. Bernstein, R.K. Lai, A.J. Swerdlow, M. Simon, M.L. Bondy, R.S.
Houlston, Influence of obesity-related risk factors in the aetiology of glioma, Br. J. Cancer.
118 (2018) 1020–1027. doi:10.1038/s41416-018-0009-x.
[20] J. Font-Burgada, B. Sun, M. Karin, Cell Metabolism Obesity and Cancer: The Oil that Feeds
the Flame, (2016). doi:10.1016/j.cmet.2015.12.015.
[21] E.M. Siegel, L.B. Nabors, R.C. Thompson, J.J. Olson, J.E. Browning, M.H. Madden, G. Han,
K.M. Egan, Prediagnostic body weight and survival in high grade glioma., J. Neurooncol.
(2013). doi:10.1007/s11060-013-1150-2.
[22] E.E. Calle, M.J. Thun, J.M. Petrelli, C. Rodriguez, C.W. Heath, Body-mass index and mortality
in a prospective cohort of U.S. adults., N. Engl. J. Med. 341 (1999) 1097–105.
doi:10.1056/NEJM199910073411501.
[23] S.C. Moore, P. Rajaraman, R. Dubrow, A.S. Darefsky, C. Koebnick, A. Hollenbeck, A.
Schatzkin, M.F. Leitzmann, Height, Body Mass Index, and Physical Activity in Relation to
Glioma Risk, Cancer Res. 69 (2009) 8349–8355. doi:10.1158/0008-5472.CAN-09-1669.
[24] M. Coelho, T. Oliveira, R. Fernandes, Biochemistry of adipose tissue: an endocrine organ,
93
Arch. Med. Sci. 9 (2013) 1–10. doi:10.5114/aoms.2013.33181.
[25] K. Karastergiou, V. Mohamed-Ali, The autocrine and paracrine roles of adipokines., Mol. Cell.
Endocrinol. 318 (2010) 69–78. doi:10.1016/j.mce.2009.11.011.
[26] S. Galic, J.S. Oakhill, G.R. Steinberg, Adipose tissue as an endocrine organ., Mol. Cell.
Endocrinol. 316 (2010) 129–39. doi:10.1016/j.mce.2009.08.018.
[27] N. Maenhaut, J. Van de Voorde, Regulation of vascular tone by adipocytes., BMC Med. 9
(2011) 25. doi:10.1186/1741-7015-9-25.
[28] S.P. Poulos, D.B. Hausman, G.J. Hausman, The development and endocrine functions of
adipose tissue., Mol. Cell. Endocrinol. 323 (2010) 20–34. doi:10.1016/j.mce.2009.12.011.
[29] M. Giralt, R. Cereijo, F. Villarroya, Adipokines and the Endocrine Role of Adipose Tissues, in:
Springer, Cham, 2015: pp. 265–282. doi:10.1007/164_2015_6.
[30] M. Fasshauer, M. Blüher, Adipokines in health and disease., Trends Pharmacol. Sci. 36
(2015) 461–470. doi:10.1016/j.tips.2015.04.014.
[31] M. Blüher, Adipokines – removing road blocks to obesity and diabetes therapy, Mol. Metab.
3 (2014) 230–240. doi:10.1016/j.molmet.2014.01.005.
[32] C. Costa, J. Incio, R. Soares, Angiogenesis and chronic inflammation: cause or
consequence?, Angiogenesis. 10 (2007) 149–66. doi:10.1007/s10456-007-9074-0.
[33] M. West, Dead adipocytes and metabolic dysfunction: recent progress., Curr. Opin.
94
Endocrinol. Diabetes. Obes. 16 (2009) 178–82.
http://www.ncbi.nlm.nih.gov/pubmed/19306530 (accessed June 13, 2011).
[34] A. Schäffler, J. Schölmerich, C. Büchler, Mechanisms of disease: adipocytokines and visceral
adipose tissue--emerging role in intestinal and mesenteric diseases., Nat. Clin. Pract.
Gastroenterol. Hepatol. 2 (2005) 103–11. doi:10.1038/ncpgasthep0090.
[35] K.E. Wellen, G.S. Hotamisligil, Obesity-induced inflammatory changes in adipose tissue., J.
Clin. Invest. 112 (2003) 1785–8. doi:10.1172/JCI20514.
[36] P.-Y. von der Weid, K.J. Rainey, Review article: lymphatic system and associated adipose
tissue in the development of inflammatory bowel disease., Aliment. Pharmacol. Ther. 32
(2010) 697–711. doi:10.1111/j.1365-2036.2010.04407.x.
[37] Y. Deng, P.E. Scherer, Adipokines as novel biomarkers and regulators of the metabolic
syndrome., Ann. N. Y. Acad. Sci. 1212 (2010) E1–E19. doi:10.1111/j.1749-
6632.2010.05875.x.
[38] M. Esteve Ràfols, Tejido adiposo: heterogeneidad celular y diversidad funcional, Endocrinol.
y Nutr. 61 (2014) 100–112. doi:10.1016/J.ENDONU.2013.03.011.
[39] R.T. de Jongh, R.G. Ijzerman, E.H. Serné, J.J. Voordouw, J.S. Yudkin, H.A.D. de Waal,
C.D.A. Stehouwer, M.M. van Weissenbruch, Visceral and truncal subcutaneous adipose
tissue are associated with impaired capillary recruitment in healthy individuals., J. Clin.
95
Endocrinol. Metab. 91 (2006) 5100–6. doi:10.1210/jc.2006-1103.
[40] A. Kotronen, T. Seppänen-laakso, J. Westerbacka, T. Kiviluoto, J. Arola, A. Ruskeepää, H.
Yki-järvinen, M. Orešič, Comparison of Lipid and Fatty acid Composition of the Liver ,
Subcutaneous and Intra-abdominal adipose Tissue , and Serum, Obesity. 18 (2009) 937–
944. doi:10.1038/oby.2009.326.
[41] B.E. Wisse, The inflammatory syndrome: the role of adipose tissue cytokines in metabolic
disorders linked to obesity., J. Am. Soc. Nephrol. 15 (2004) 2792–800.
doi:10.1097/01.ASN.0000141966.69934.21.
[42] H.R. Lijnen, Angiogenesis and obesity., Cardiovasc. Res. 78 (2008) 286–93.
doi:10.1093/cvr/cvm007.
[43] J. Dong, D. Saunders, R. Silasi-Mansat, L. Yu, H. Zhu, F. Lupu, R. Towner, Y. Dong, H. Chen,
Therapeutic efficacy of a synthetic epsin mimetic peptide in glioma tumor model: uncovering
multiple mechanisms beyond the VEGF-associated tumor angiogenesis, J. Neurooncol.
(2018) 1–11. doi:10.1007/s11060-018-2766-z.
[44] N. Osterberg, N. Ferrara, J. Vacher, S. Gaedicke, G. Niedermann, A. Weyerbrock, S.
Doostkam, H.-E. Schaefer, K.H. Plate, M.R. Machein, Decrease of VEGF-A in myeloid cells
attenuates glioma progression and prolongs survival in an experimental glioma model, Neuro.
Oncol. 18 (2016) 939–949. doi:10.1093/neuonc/now005.
96
[45] C. Costa, R. Soares, F. Schmitt, Angiogenesis: now and then., APMIS. 112 (n.d.) 402–12.
doi:10.1111/j.1600-0463.2004.apm11207-0802.x.
[46] P. Carmeliet, Angiogenesis in health and disease., Nat. Med. 9 (2003) 653–60.
doi:10.1038/nm0603-653.
[47] S. Karaman, M. Hollmén, M.R. Robciuc, A. Alitalo, H. Nurmi, B. Morf, D. Buschle, H.F. Alkan,
A.M. Ochsenbein, K. Alitalo, C. Wolfrum, M. Detmar, Blockade of VEGF-C and VEGF-D
modulates adipose tissue inflammation and improves metabolic parameters under high-fat
diet, Mol. Metab. (2015). doi:10.1016/j.molmet.2014.11.006.
[48] Y. Cao, Angiogenesis and Vascular Functions in Modulation of Obesity, Adipose Metabolism,
and Insulin Sensitivity, Cell Metab. 18 (2013) 478–489. doi:10.1016/j.cmet.2013.08.008.
[49] A. Pirraco, P. Coelho, A. Rocha, R. Costa, L. Vasques, R. Soares, Imatinib targets PDGF
signaling in melanoma and host smooth muscle neighboring cells., J. Cell. Biochem. 111
(2010) 433–41. doi:10.1002/jcb.22725.
[50] J.A. Martinez, F.I. Milagro, K.J. Claycombe, K.L. Schalinske, Epigenetics in Adipose Tissue,
Obesity, Weight Loss, and Diabetes, Adv. Nutr. An Int. Rev. J. (2014).
doi:10.3945/an.113.004705.
[51] J. Yin, Z. Gao, Q. He, D. Zhou, Z. Guo, J. Ye, Role of hypoxia in obesity-induced disorders
of glucose and lipid metabolism in adipose tissue, AJP Endocrinol. Metab. 296 (2008) E333–
97
E342. doi:10.1152/ajpendo.90760.2008.
[52] M.G. Saklayen, The Global Epidemic of the Metabolic Syndrome, Curr. Hypertens. Rep. 20
(2018) 12. doi:10.1007/s11906-018-0812-z.
[53] Y. Cao, Angiogenesis modulates adipogenesis and obesity, J. Clin. Invest. 117 (2007) 2362–
2368. doi:10.1172/JCI32239.
[54] Y. Cao, Adipose tissuea angiogenesis as a therapiutic target for obesity and metabolic
diseases, Nat. Rev. Drug Discov. 9 (2010) 107–115.
[55] J. Han, J.-E. Lee, J. Jin, J.S. Lim, N. Oh, K. Kim, S.-I. Chang, M. Shibuya, H. Kim, G.Y. Koh,
The spatiotemporal development of adipose tissue, Development. 138 (2011) 5027–5037.
doi:10.1242/dev.067686.
[56] A.Y. Lemoine, S. Ledoux, E. Larger, Adipose tissue angiogenesis in obesity., Thromb.
Haemost. 110 (2013) 661–669. doi:10.1160/TH13-01-0073.
[57] B. Chaurasia, V.A. Kaddai, G.I. Lancaster, S.-A. Toh, E. Shiow, S. Sugii, S.A. Summers
Correspondence, D.C. Henstridge, S. Sriram, D. Lark, A. Galam, V. Gopalan, K.N.B. Prakash,
S. Sendhil Velan, S. Bulchand, T.J. Tsong, M. Wang, M.M. Siddique, G. Yuguang, K.
Sigmundsson, N.A. Mellet, J.M. Weir, P.J. Meikle, M. Shabeer, B.M. Yassin, A. Shabbir, J.A.
Shayman, Y. Hirabayashi, S.A. Summers, Adipocyte Ceramides Regulate Subcutaneous
Adipose Browning, Inflammation, and Metabolism Cell Metabolism Article Adipocyte

98
Ceramides Regulate Subcutaneous Adipose Browning, Inflammation, and Metabolism, Cell
Metab. 24 (2016) 820–834. doi:10.1016/j.cmet.2016.10.002.
[58] N. Hosogai, A. Fukuhara, K. Oshima, Y. Miyata, S. Tanaka, K. Segawa, S. Furukawa, Y.
Tochino, R. Komuro, M. Matsuda, I. Shimomura, Adipose tissue hypoxia in obesity and its
impact on adipocytokine dysregulation., Diabetes. 56 (2007) 901–11. doi:10.2337/db06-0911.
[59] M.E. Rausch, S. Weisberg, P. Vardhana, D. V Tortoriello, Obesity in C57BL/6J mice is
characterized by adipose tissue hypoxia and cytotoxic T-cell infiltration., Int. J. Obes. (Lond).
32 (2008) 451–63. doi:10.1038/sj.ijo.0803744.
[60] C. Regazzetti, P. Peraldi, T. Gremeaux, R. Najem-Lendom, I. Ben-Sahra, M. Cormont, F.
Bost, Y. Le Marchand-Brustel, J.-F. Tanti, S. Giorgetti-Peraldi, Hypoxia Decreases Insulin
Signaling Pathways in Adipocytes, Diabetes. 58 (2009) 95–103. doi:10.2337/db08-0457.
[61] J. Ye, Z. Gao, J. Yin, Q. He, Hypoxia is a potential risk factor for chronic inflammation and
adiponectin reduction in adipose tissue of ob/ob and dietary obese mice., Am. J. Physiol.
Endocrinol. Metab. 293 (2007) E1118–E1128. doi:10.1152/ajpendo.00435.2007.
[62] J. Yin, Z. Gao, Q. He, D. Zhou, Z. Guo, J. Ye, Role of hypoxia in obesity-induced disorders
of glucose and lipid metabolism in adipose tissue., Am. J. Physiol. Endocrinol. Metab. 296
(2009) E333-42. doi:10.1152/ajpendo.90760.2008.
[63] A. Loboda, A. Jozkowicz, J. Dulak, HIF-1 and HIF-2 transcription factors — Similar but not
99
identical, Mol. Cells. 29 (2010) 435–442. doi:10.1007/s10059-010-0067-2.
[64] T. Hashimoto, F. Shibasaki, Hypoxia-Inducible Factor as an Angiogenic Master Switch, Front.
Pediatr. 3 (2015). doi:10.3389/fped.2015.00033.
[65] K. Hirota, G.L. Semenza, Regulation of angiogenesis by hypoxia-inducible factor 1, Crit. Rev.
Oncol. Hematol. 59 (2006) 15–26. doi:10.1016/j.critrevonc.2005.12.003.
[66] B. Wang, I.S. Wood, P. Trayhurn, Dysregulation of the expression and secretion of
inflammation-related adipokines by hypoxia in human adipocytes., Pflugers Arch. 455 (2007)
479–92. doi:10.1007/s00424-007-0301-8.
[67] N. Halberg, T. Khan, M.E. Trujillo, I. Wernstedt-Asterholm, A.D. Attie, S. Sherwani, Z. V
Wang, S. Landskroner-Eiger, S. Dineen, U.J. Magalang, R. a Brekken, P.E. Scherer,
Hypoxia-inducible factor 1alpha induces fibrosis and insulin resistance in white adipose
tissue., Mol. Cell. Biol. 29 (2009) 4467–4483. doi:10.1128/MCB.00192-09.
[68] C. Jiang, A. Qu, T. Matsubara, T. Chanturiya, W. Jou, O. Gavrilova, Y.M. Shah, F.J.
Gonzalez, Disruption of hypoxia-inducible factor 1 in adipocytes improves insulin sensitivity
and decreases adiposity in high-fat diet-fed mice., Diabetes. 60 (2011) 2484–95.
doi:10.2337/db11-0174.
[69] M.-K. Shin, L.F. Drager, Q. Yao, S. Bevans-Fonti, D.-Y. Yoo, J.C. Jun, S. Aja, S. Bhanot, V.Y.
Polotsky, Metabolic consequences of high-fat diet are attenuated by suppression of HIF-1α.,

100
PLoS One. 7 (2012) e46562. doi:10.1371/journal.pone.0046562.
[70] K.Y. Lee, S. Gesta, J. Boucher, X.L. Wang, C.R. Kahn, The differential role of Hif1β/Arnt and
the hypoxic response in adipose function, fibrosis, and inflammation, Cell Metab. 14 (2011)
491–503. doi:10.1016/j.cmet.2011.08.006.
[71] Y. Kihira, M. Miyake, M. Hirata, Y. Hoshina, K. Kato, H. Shirakawa, H. Sakaue, N. Yamano,
Y. Izawa-Ishizawa, K. Ishizawa, Y. Ikeda, K. Tsuchiya, T. Tamaki, S. Tomita, Deletion of
Hypoxia-Inducible Factor-1α in Adipocytes Enhances Glucagon-Like Peptide-1 Secretion and
Reduces Adipose Tissue Inflammation, PLoS One. 9 (2014) e93856.
doi:10.1371/journal.pone.0093856.
[72] X. Li, J. Li, L. Wang, A. Li, Z. Qiu, L. Qi, J. Kou, K. Liu, B. Liu, F. Huang, The role of metformin
and resveratrol in the prevention of hypoxia-inducible factor 1α accumulation and fibrosis in
hypoxic adipose tissue, Br. J. Pharmacol. 173 (2016) 2001–2015. doi:10.1111/bph.13493.
[73] A.L. Basse, M.S. Isidor, S. Winther, N.B. Skjoldborg, M. Murholm, E.S. Andersen, S.B.
Pedersen, C. Wolfrum, B. Quistorff, J.B. Hansen, Regulation of glycolysis in brown adipocytes
by HIF-1α, (n.d.). doi:10.1038/s41598-017-04246-y.
[74] Z. Yu, G. Kastenmüller, Y. He, P. Belcredi, G. Möller, C. Prehn, J. Mendes, S. Wahl, W.
Roemisch-Margl, U. Ceglarek, A. Polonikov, N. Dahmen, H. Prokisch, L. Xie, Y. Li, H.-E.
Wichmann, A. Peters, F. Kronenberg, K. Suhre, J. Adamski, T. Illig, R. Wang-Sattler,
Differences between Human Plasma and Serum Metabolite Profiles, PLoS One. 6 (2011)
101
e21230. doi:10.1371/journal.pone.0021230.
[75] K. Sun, N. Halberg, M. Khan, U.J. Magalang, P.E. Scherer, Selective inhibition of hypoxia-
inducible factor 1alpha ameliorates adipose tissue dysfunction, Mol Cell Biol. 33 (2013) 904–
917. doi:10.1128/MCB.00951-12.
[76] Q. He, Z. Gao, J. Yin, J. Zhang, Z. Yun, J. Ye, Regulation of HIF-1{alpha} activity in adipose
tissue by obesity-associated factors: adipogenesis, insulin, and hypoxia., Am. J. Physiol.
Endocrinol. Metab. 300 (2011) E877–E885. doi:10.1152/ajpendo.00626.2010.
[77] X. Zhang, K.S.L. Lam, H. Ye, S.K. Chung, M. Zhou, Y. Wang, A. Xu, Adipose tissue-specific
inhibition of hypoxia-inducible factor 1α induces obesity and glucose intolerance by impeding
energy expenditure in mice, J. Biol. Chem. 285 (2010) 32869–32877.
doi:10.1074/jbc.M110.135509.
[78] J. V Silha, M. Krsek, P. Sucharda, L.J. Murphy, Angiogenic factors are elevated in overweight
and obese individuals, Int. J. Obes. 29 (2005) 1308–1314. doi:10.1038/sj.ijo.0802987.
[79] K.B. Cullberg, T. Christiansen, S.K. Paulsen, J.M. Bruun, S.B. Pedersen, B. Richelsen, Effect
of weight loss and exercise on angiogenic factors in the circulation and in adipose tissue in
obese subjects, Obesity. 21 (2013) 454–460. doi:10.1002/oby.20060.
[80] A.M. Fusaru, C.G. Pisoschi, A. Bold, C. Taisescu, R. Stǎnescu, M. Hîncu, Ş. Crǎiţoiu, I.M.
Baniţa̧, Hypoxia induced VEGF synthesis in visceral adipose depots of obese diabetic
102
patients, Rom. J. Morphol. Embryol. 53 (2012) 903–909.
[81] S.S. Doerstling, C.H. O’Flanagan, S.D. Hursting, Obesity and Cancer Metabolism: A
Perspective on Interacting Tumor–Intrinsic and Extrinsic Factors, Front. Oncol. 7 (2017) 216.
doi:10.3389/fonc.2017.00216.
[82] S.S. Choe, J.Y. Huh, I.J. Hwang, J.I. Kim, J.B. Kim, Adipose Tissue Remodeling: Its Role in
Energy Metabolism and Metabolic Disorders, Front. Endocrinol. (Lausanne). 7 (2016) 30.
doi:10.3389/fendo.2016.00030.
[83] F.-J. Lei, B.-H. Cheng, P.-Y. Liao, H.-C. Wang, W.-C. Chang, H.-C. Lai, J.-C. Yang, Y.-C. Wu,
L.-C. Chu, W.-L. Ma, Survival benefit of sphingosin-1-phosphate and receptors expressions
in breast cancer patients, Cancer Med. 7 (2018) 3743–3754. doi:10.1002/cam4.1609.
[84] S. Tulipani, M. Palau-Rodriguez, A. Miñarro Alonso, F. Cardona, A. Marco-Ramell, B. Zonja,
M. Lopez de Alda, A. Muñoz-Garach, A. Sanchez-Pla, F.J. Tinahones, C. Andres-Lacueva,
Biomarkers of Morbid Obesity and Prediabetes by Metabolomic Profiling of Human
Discordant Phenotypes, Clin. Chim. Acta. 463 (2016) 53–61.
doi:10.1016/J.CCA.2016.10.005.
[85] K.M. Boini, S. Koka, M. Xia, J.K. Ritter, T.W. Gehr, P.-L. Li, Sphingolipids in obesity and
related complications, n.d.
https://www.ncbi.nlm.nih.gov/pmc/articles/PMC5844360/pdf/nihms944127.pdf (accessed
December 18, 2018).
103
[86] C. Lipina, H.S. Hundal, Sphingolipids: agents provocateurs in the pathogenesis of insulin
resistance., Diabetologia. (2011) 1-12–12. doi:10.1007/s00125-011-2127-3.
[87] P. Gangoiti, L. Camacho, L. Arana, A. Ouro, M.H. Granado, L. Brizuela, J. Casas, G. Fabriás,
J.L. Abad, A. Delgado, A. Gómez-Muñoz, Control of metabolism and signaling of simple
bioactive sphingolipids: Implications in disease., Prog. Lipid Res. 49 (2010) 316–34.
doi:10.1016/j.plipres.2010.02.004.
[88] S. Lahiri, A.H. Futerman, The metabolism and function of sphingolipids and
glycosphingolipids., Cell. Mol. Life Sci. 64 (2007) 2270–84. doi:10.1007/s00018-007-7076-0.
[89] F. Samad, K.D. Hester, G. Yang, Y.A. Hannun, J. Bielawski, Altered adipose and plasma
sphingolipid metabolism in obesity: a potential mechanism for cardiovascular and metabolic
risk., Diabetes. 55 (2006) 2579–87. doi:10.2337/db06-0330.
[90] M. Maceyka, K.B. Harikumar, S. Milstien, S. Spiegel, Sphingosine-1-phosphate signaling and
its role in disease., Trends Cell Biol. 22 (2012) 50–60. doi:10.1016/j.tcb.2011.09.003.
[91] E. Ellen Jones, S. Dworski, D. Canals, J. Casas, G. Fabrias, D. Schoenling, T. Levade, C.
Denlinger, Y.A. Hannun, J.A. Medin, R.R. Drake, On-Tissue Localization of Ceramides and
Other Sphingolipids by MALDI Mass Spectrometry Imaging Terms of Use, Anal. Chem. 86
(2014) 8311. doi:10.1021/ac501937d.
[92] V. García-González, J. Díaz-Villanueva, O. Galindo-Hernández, I. Martínez-Navarro, G.
104
Hurtado-Ureta, A. Pérez-Arias, V. García-González, J.F. Díaz-Villanueva, O. Galindo-
Hernández, I. Martínez-Navarro, G. Hurtado-Ureta, A.A. Pérez-Arias, Ceramide Metabolism
Balance, a Multifaceted Factor in Critical Steps of Breast Cancer Development, Int. J. Mol.
Sci. 19 (2018) 2527. doi:10.3390/ijms19092527.
[93] M. Migaud, C.A. Glastonbury, K.S. Small, T.D. Spector, A.M. Valdes, M.J. Brosnan, R.P.
Mohney, M. Beaumont, A. Nikolaou, C. Menni, Metabolomic profiling to dissect the role of
visceral fat in cardiometabolic health, Obesity. 24 (2016) 1380–1388. doi:10.1002/oby.21488.
[94] M.T. Nakamura, B.E. Yudell, J.J. Loor, Regulation of energy metabolism by long-chain fatty
acids, Prog. Lipid Res. 53 (2014) 124–144. doi:10.1016/j.plipres.2013.12.001.
[95] S. Mahajan-Thakur, S. Bien-Möller, S. Marx, H. Schroeder, B. Rauch, S. Mahajan-Thakur, S.
Bien-Möller, S. Marx, H. Schroeder, B.H. Rauch, Sphingosine 1-Phosphate (S1P) Signaling
in Glioblastoma Multiforme—A Systematic Review, Int. J. Mol. Sci. 18 (2017) 2448.
doi:10.3390/ijms18112448.
[96] V. Anelli, C.R. Gault, A.J. Snider, L.M. Obeid, Role of sphingosine kinase-1 in
paracrine/transcellular angiogenesis and lymphangiogenesis in vitro., FASEB J. 24 (2010)
2727–38. doi:10.1096/fj.09-150540.
[97] C.M. Yoon, B.S. Hong, H.G. Moon, S. Lim, P.-G. Suh, Y.-K. Kim, C.-B. Chae, Y.S. Gho,
Sphingosine-1-phosphate promotes lymphangiogenesis by stimulating S1P1/Gi/PLC/Ca2+
signaling pathways., Blood. 112 (2008) 1129–38. doi:10.1182/blood-2007-11-125203.
105
[98] H. Green, O. Kehinde, An established preadipose cell line and its differentiation in culture. II.
Factors affecting the adipose conversion., Cell. 5 (1975) 19–27. doi:10.1016/0092-
8674(75)90087-2.
[99] C. Verpelli, G. Bertani, V. Cea, M. Patti, A. Bikfalvi, L. Bello, C. Sala, Anti-angiogenic therapy
induces integrin-linked kinase 1 up-regulation in a mouse model of glioblastoma., PLoS One.
5 (2010) 1–12. doi:10.1371/journal.pone.0013710.
[100] R.L. Gundry, M.Y. White, C.I. Murray, L. a Kane, Q. Fu, B. a Stanley, J.E. Van Eyk,
Preparation of proteins and peptides for mass spectrometry analysis in a bottom-up
proteomics workflow, Curr. Protoc. Mol. Biol. Chapter 10 (2009) 10.25.1-10.25.23.
doi:10.1002/0471142727.mb1025s88.
[101] A. Shevchenko, H. Tomas, J. Havlis, J. V Olsen, M. Mann, In-gel digestion for mass
spectrometric characterization of proteins and proteomes, Nat. Protoc. 1 (2006) 2856–2860.
doi:10.1038/nprot.2006.468.
[102] J. Rosenfeld, J. Capdevielle, J.C. Guillemot, P. Ferrara, In-gel digestion of proteins for internal
sequence analysis after one- or two-dimensional gel electrophoresis, Anal. Biochem. 203
(1992) 173–179. doi:10.1016/0003-2697(92)90061-B.
[103] S. Ben Aroya, M. Kupiec, The Elg1 replication factor C-like complex: a novel guardian of
genome stability., DNA Repair (Amst). 4 (2005) 409–17. doi:10.1016/j.dnarep.2004.08.003.
106
[104] B. Schäfer, C. Götz, M. Montenarh, The kinesin I family member KIF5C is a novel substrate
for protein kinase CK2., Biochem. Biophys. Res. Commun. 375 (2008) 179–83.
doi:10.1016/j.bbrc.2008.07.107.
[105] S. Dunn, E.E. Morrison, T.B. Liverpool, C. Molina-París, R. a Cross, M.C. Alonso, M.
Peckham, Differential trafficking of Kif5c on tyrosinated and detyrosinated microtubules in live
cells., J. Cell Sci. 121 (2008) 1085–95. doi:10.1242/jcs.026492.
[106] X. Zhang, S. Liu, C. Guo, J. Zong, M.-Z. Sun, The association of annexin A2 and cancers,
Clin. Transl. Oncol. 14 (2012) 634–640. doi:10.1007/s12094-012-0855-6.
[107] H. Zhai, S. Acharya, I. Gravanis, S. Mehmood, R.J. Seidman, K.R. Shroyer, K. a. Hajjar, S.E.
Tsirka, Annexin A2 Promotes Glioma Cell Invasion and Tumor Progression, J. Neurosci. 31
(2011) 14346–14360. doi:10.1523/JNEUROSCI.3299-11.2011.
[108] N. a Lokman, M.P. Ween, M.K. Oehler, C. Ricciardelli, The role of annexin A2 in
tumorigenesis and cancer progression, Cancer Microenviron. 4 (2011) 199–208.
doi:10.1007/s12307-011-0064-9.
[109] C.T. Pappas, K.T. Bliss, A. Zieseniss, C.C. Gregorio, The Nebulin family: an actin support
group., Trends Cell Biol. 21 (2011) 29–37. doi:10.1016/j.tcb.2010.09.005.
[110] H. Berns, R. Humar, B. Hengerer, F.N. Kiefer, E.J. Battegay, RACK1 is up-regulated in
angiogenesis and human carcinomas., FASEB J. 14 (2000) 2549–58. doi:10.1096/fj.99-
107
1038com.
[111] D.R. Adams, D. Ron, P.A. Kiely, RACK1, A multifaceted scaffolding protein: Structure and
function, Cell Commun. Signal. 9 (2011) 22. doi:10.1186/1478-811X-9-22.
[112] C.-L. Tsai, C.-N. Tsai, C.-Y. Lin, H.-W. Chen, Y.-S. Lee, A. Chao, T.-H. Wang, H.-S. Wang,
C.-H. Lai, Secreted stress-induced phosphoprotein 1 activates the ALK2-SMAD signaling
pathways and promotes cell proliferation of ovarian cancer cells, Cell Rep. 2 (2012) 283–293.
doi:10.1016/j.celrep.2012.07.002.
[113] B. Carpenter, C. MacKay, A. Alnabulsi, M. MacKay, C. Telfer, W.T. Melvin, G.I. Murray, The
roles of heterogeneous nuclear ribonucleoproteins in tumour development and progression,
Biochim. Biophys. Acta. 1765 (2006) 85–100. doi:10.1016/j.bbcan.2005.10.002.
[114] Y. He, M. a Brown, J. a Rothnagel, N. a Saunders, R. Smith, Roles of heterogeneous nuclear
ribonucleoproteins A and B in cell proliferation, J. Cell Sci. 118 (2005) 3173–3183.
doi:10.1242/jcs.02448.
[115] R.K. Baboota, S.M. Sarma, R.K. Boparai, K.K. Kondepudi, S. Mantri, M. Bishnoi, Microarray
based gene expression analysis of murine brown and subcutaneous adipose tissue:
significance with human., PLoS One. 10 (2015) e0127701.
doi:10.1371/journal.pone.0127701.
[116] A. Manuscript, Targeting Aldose Reductase for the treatment of cancer, Curr Cancer Drug
108
Targets. 11 (2011) 560–571.
[117] I.G. Obrosova, O. Ilnytska, V. V Lyzogubov, I. a Pavlov, N. Mashtalir, J.L. Nadler, V.R. Drel,
Effects of “Healthy” Diet and Aldose Reductase Inhibition, Diabetes. 56 (2007) 2598–2608.
doi:10.2337/db06-1176.DRG.
[118] A. Scozzafava, C.T. Supuran, F. Carta, Antiobesity carbonic anhydrase inhibitors: a literature
and patent review., Expert Opin. Ther. Pat. 23 (2013) 725–35.
doi:10.1517/13543776.2013.790957.
[119] C.T. Supuran, Carbonic anhydrases: novel therapeutic applications for inhibitors and
activators., Nat. Rev. Drug Discov. 7 (2008) 168–81. doi:10.1038/nrd2467.
[120] C.-C. Lin, T.-L. Cheng, W.-H. Tsai, H.-J. Tsai, K.-H. Hu, H.-C. Chang, C.-W. Yeh, Y.-C. Chen,
C.-C. Liao, W.-T. Chang, Loss of the respiratory enzyme citrate synthase directly links the
Warburg effect to tumor malignancy., Sci. Rep. 2 (2012) 785. doi:10.1038/srep00785.
[121] B. Schlichtholz, J. Turyn, E. Goyke, M. Biernacki, K. Jaskiewicz, Z. Sledzinski, J.
Swierczynski, Enhanced citrate synthase activity in human pancreatic cancer., Pancreas. 30
(2005) 99–104.
[122] C.-A. Maurage, E. Adam, J.-F. Minéo, S. Sarrazin, M. Debunne, R.-M. Siminski, M. Baroncini,
P. Lassalle, S. Blond, M. Delehedde, Endocan expression and localization in human
glioblastomas., J. Neuropathol. Exp. Neurol. 68 (2009) 633–41.
109
doi:10.1097/NEN.0b013e3181a52a7f.
[123] F. Matano, D. Yoshida, Y. Ishii, S. Tahara, A. Teramoto, A. Morita, Endocan, a new invasion
and angiogenesis marker of pituitary adenomas., J. Neurooncol. 117 (2014) 485–91.
doi:10.1007/s11060-014-1377-6.
[124] C.L. Donohoe, J. Lysaght, J. O ’sullivan, J. V Reynolds, Emerging Concepts Linking Obesity
with the Hallmarks of Cancer, (2016). doi:10.1016/j.tem.2016.08.004.
[125] A. Hossain, J. Gumin, F. Gao, J. Figueroa, N. Shinojima, T. Takezaki, W. Priebe, D. Villarreal,
S.-G. Kang, C. Joyce, E. Sulman, Q. Wang, F.C. Marini, M. Andreeff, H. Colman, F.F. Lang,
Mesenchymal Stem Cells Isolated From Human Gliomas Increase Proliferation and Maintain
Stemness of Glioma Stem Cells Through the IL-6/gp130/STAT3 Pathway., Stem Cells. 33
(2015) 2400–15. doi:10.1002/stem.2053.
[126] M. Delehedde, L. Devenyns, C.-A. Maurage, R.R. Vivès, Endocan in cancers: a lesson from
a circulating dermatan sulfate proteoglycan., Int. J. Cell Biol. 2013 (2013) 705027.
doi:10.1155/2013/705027.
[127] T. Aoki, S. Kato, J.C. Fox, K. Okamoto, K. Sakata, M. Morimatsu, M. Shigemori, Inhibition of
autocrine fibroblast growth factor signaling by the adenovirus-mediated expression of an
antisense transgene or a dominant negative receptor in human glioma cells in vitro., Int. J.
Oncol. 21 (2002) 629–36. http://www.ncbi.nlm.nih.gov/pubmed/12168110 (accessed April 28,
2016).
110
[128] A.J. Kiliaan, I.A. Arnoldussen, D.R. Gustafson, Adipokines: a link between obesity and
dementia?, [email protected] Lancet Neurol. 13 (2014) 913–923.
doi:10.1016/S1474-4422(14)70085-7.
[129] S. Corvera, O. Gealekman, Adipose tissue angiogenesis: impact on obesity and type-2
diabetes., Biochim. Biophys. Acta. 1842 (2014) 463–72. doi:10.1016/j.bbadis.2013.06.003.
[130] F. Mendonça, R. Soares, Obesity and cancer phenotype: Is angiogenesis a missed link?, Life
Sci. 139 (2015) 16–23. doi:10.1016/j.lfs.2015.08.009.
[131] D. Hanahan, R. a Weinberg, Hallmarks of cancer: the next generation., Cell. 144 (2011) 646–
74. doi:10.1016/j.cell.2011.02.013.
[132] P. Coelho, J. Almeida, C. Prudêncio, R. Fernandes, R. Soares, Effect of Adipocyte Secretome
in Melanoma Progression and Vasculogenic Mimicry., J. Cell. Biochem. 117 (2015) 1697–
706. doi:10.1002/jcb.25463.
[133] P. Coelho, J. Almeida, C. Prudêncio, R. Fernandes, R. Soares, Effect of Adipocyte Secretome
in Melanoma Progression and Vasculogenic Mimicry, J. Cell. Biochem. 117 (2016) 1697–
1706. doi:10.1002/jcb.25463.
[134] W. Sun, R. Depping, W. Jelkmann, Interleukin-1β promotes hypoxia-induced apoptosis of
glioblastoma cells by inhibiting hypoxia-inducible factor-1 mediated adrenomedullin
production, Cell Death Dis. 5 (2014). doi:10.1038/cddis.2013.562.

111
[135] J.E. Lawrence, N.J. Cook, R.A. Rovin, R.J. Winn, Leptin promotes glioblastoma., Neurol. Res.
Int. 2012 (2012) 870807. doi:10.1155/2012/870807.
[136] M.N. Duong, A. Geneste, F. Fallone, X. Li, C. Dumontet, C. Muller, The fat and the bad:
Mature adipocytes, key actors in tumor progression and resistance, Oncotarget. 8 (2017)
57622–57641. www.impactjournals.com/oncotarget (accessed March 29, 2018).
[137] A. Aguilar-Valles, W. Inoue, C. Rummel, G.N. Luheshi, Obesity, adipokines and
neuroinflammation, Neuropharmacology. 96 (2015) 124–134.
doi:10.1016/j.neuropharm.2014.12.023.
[138] X. Lopez, A.B. Goldfine, W.L. Holland, R. Gordillo, P.E. Scherer, Plasma ceramides are
elevated in female children and adolescents with type 2 diabetes, J. Pediatr. Endocrinol.
Metab. 26 (2013) 995–998. doi:10.1515/jpem-2012-0407.
[139] J.T. Warshauer, X. Lopez, R. Gordillo, J. Hicks, W.L. Holland, E. Anuwe, M.B. Blankfard, P.E.
Scherer, I. Lingvay, Effect of pioglitazone on plasma ceramides in adults with metabolic
syndrome, Diabetes. Metab. Res. Rev. 31 (2015) 734–744. doi:10.1002/dmrr.2662.
[140] G. Yang, L. Badeanlou, J. Bielawski, A.J. Roberts, Y.A. Hannun, F. Samad, Central role of
ceramide biosynthesis in body weight regulation, energy metabolism, and the metabolic
syndrome., Am. J. Physiol. Endocrinol. Metab. 297 (2009) E211-24.
doi:10.1152/ajpendo.91014.2008.
112
[141] W.L. Holland, S.A. Summers, Sphingolipids, insulin resistance, and metabolic disease: new
insights from in vivo manipulation of sphingolipid metabolism., Endocr. Rev. 29 (2008) 381–
402. doi:10.1210/er.2007-0025.
[142] T. Tammela, K. Alitalo, Lymphangiogenesis: Molecular mechanisms and future promise.,
Cell. 140 (2010) 460–76. doi:10.1016/j.cell.2010.01.045.
[143] T. Hla, Signaling and biological actions of sphingosine 1-phosphate., Pharmacol. Res. 47
(2003) 401–7. http://www.ncbi.nlm.nih.gov/pubmed/12676514 (accessed May 23, 2011).
[144] J.Y. Kim, J. Cho, H.R. Yang, Biochemical predictors of early onset non-alcoholic fatty liver
disease in young children with obesity, J. Korean Med. Sci. (2018).
doi:10.3346/jkms.2018.33.e122.
[145] J.C. Sirota, K. McFann, G. Targher, R.J. Johnson, M. Chonchol, D.I. Jalal, Elevated serum
uric acid levels are associated with non-alcoholic fatty liver disease independently of
metabolic syndrome features in the United States: Liver ultrasound data from the National
Health and Nutrition Examination Survey, Metabolism. (2013).
doi:10.1016/j.metabol.2012.08.013.
[146] B. Singh Gurjar, V. Garg, M. Verma, S. Meena, S.K. Vardey, Metabolic Syndrome: Can
Serum Uric Acid Along With Hepatic Enzymes Serve As Potential Marker For Metabolic
Syndrome?, n.d. www.ijmse.com (accessed June 27, 2019).
113
[147] K. Hyun, An Association between Liver Markers and Physiological Variables : Comparison
between Normal and Fatty Liver Subjects, 17 (2011) 105–112.
[148] C.A. Pickens, L.M. Sordillo, S.S. Comstock, W.S. Harris, K. Hortos, B. Kovan, J.I. Fenton,
Plasma phospholipids, non-esterified plasma polyunsaturated fatty acids and oxylipids are
associated with BMI, Prostaglandins Leukot. Essent. Fat. Acids. (2015).
doi:10.1016/j.plefa.2014.12.001.
[149] E. Lázár-Molnár, H. Hegyesi, S. Tóth, a Falus, Autocrine and paracrine regulation by
cytokines and growth factors in melanoma., Cytokine. 12 (2000) 547–554.
doi:10.1006/cyto.1999.0614.
[150] T. Hoashi, T. Kadono, K. Kikuchi, T. Etoh, K. Tamaki, Differential growth regulation in human
melanoma cell lines by TIMP-1 and TIMP-2, Biochem Biophys Res Commun. 288 (2001)
371–379. doi:10.1006/bbrc.2001.5789\nS0006-291X(01)95789-4 [pii].
[151] Y. Kotobuki, A. Tanemura, L. Yang, S. Itoi, M. Wataya-Kaneda, H. Murota, M. Fujimoto, S.
Serada, T. Naka, I. Katayama, Dysregulation of melanocyte function by Th17-related
cytokines: Significance of Th17 cell infiltration in autoimmune vitiligo vulgaris, Pigment Cell
Melanoma Res. 25 (2012) 219–230. doi:10.1111/j.1755-148X.2011.00945.x.
[152] C.L. Neudauer, J.B. McCarthy, Insulin-like growth factor I-stimulated melanoma cell migration
requires phosphoinositide 3-kinase but not extracellular-regulated kinase activation, Exp. Cell
Res. 286 (2003) 128–137. doi:http://dx.doi.org/10.1016/S0014-4827(03)00049-1.
114
[153] P.H. Quax, G.N. van Muijen, E.J. Weening-Verhoeff, L.R. Lund, K. Dano, D.J. Ruiter, J.H.
Verheijen, Metastatic behavior of human melanoma cell lines in nude mice correlates with
urokinase-type plasminogen activator, its type-1 inhibitor, and urokinase-mediated matrix
degradation, J Cell Biol. 115 (1991) 191–199.
[154] A. Naspi, V. Panasiti, F. Abbate, V. Roberti, V. Devirgiliis, M. Curzio, M. Borghi, F. Lozupone,
S. Carotti, S. Morini, E. Gaudio, S. Calvieri, P. Londei, Insulin-like-growth-factor-binding-
protein-3 (IGFBP-3) contrasts melanoma progression in vitro and in vivo., PLoS One. 9 (2014)
e98641. doi:10.1371/journal.pone.0098641.
[155] Q.T. Ostrom, L. Bauchet, F.G. Davis, I. Deltour, J.L. Fisher, C.E. Langer, M. Pekmezci, J. a.
Schwartzbaum, M.C. Turner, K.M. Walsh, M.R. Wrensch, J.S. Barnholtz-Sloan, The
epidemiology of glioma in adults: a “state of the science” review, Neuro. Oncol. 16 (2014)
896–913. doi:10.1093/neuonc/nou087.
[156] D.M. Parkin, F. Bray, J. Ferlay, P. Pisani, Global cancer statistics, 2002., CA. Cancer J. Clin.
55 (n.d.) 74–108. http://www.ncbi.nlm.nih.gov/pubmed/15761078 (accessed June 29, 2011).
[157] F.X. Pi-Sunyer, The obesity epidemic: pathophysiology and consequences of obesity, Obes.
Res. 10 Suppl 2 (2002) 97S-104S. doi:10.1038/oby.2002.202.
[158] N. Young, J.R. Van Brocklyn, Roles of sphingosine-1-phosphate (S1P) receptors in malignant
behavior of glioma cells. Differential effects of S1P2 on cell migration and invasiveness., Exp.
Cell Res. 313 (2007) 1615–27. doi:10.1016/j.yexcr.2007.02.009.
115
[159] S.P. Niclou, F. Fack, U. Rajcevic, Glioma proteomics: status and perspectives., J.
Proteomics. 73 (2010) 1823–1838. doi:10.1016/j.jprot.2010.03.007.
[160] V. Cea, P. Coelho, C. Sala, J. Costa, M.S. Diniz, C. Prudêncio, R. Fernandes, J.P. Noronha,
M. Galesio, J. Almeida, R. Soares, Adipocyte proteome and secretome influence
inflammatory and hormone pathways in glioma, Metab. Brain Dis. 34 (2018) 141–152.
doi:10.1007/s11011-018-0327-y.

116
117
APPENDIXES
I. Abstract
II. Resumen
III. Publication I
P. Coelho, J. Almeida, C. Prudêncio, R. Fernandes, R. Soares, Effect of Adipocyte Secretome in
Melanoma Progression and Vasculogenic Mimicry., J. Cell. Biochem. 117 (2015) 1697–706.
doi:10.1002/jcb.25463.
IV. Publication II
J. Almeida, J. Costa, P. Coelho, V. Cea, M. Galesio, J.P. Noronha, M.S. Diniz, C. Prudêncio, R.
Soares, C. Sala, R. Fernandes, Adipocyte proteome and secretome influence inflammatory and
hormone pathways in glioma, Metab. Brain Dis. 34 (2019) 141–152. doi:10.1007/s11011-018-0327-
y.
V. Awards
Obesity and brain cancer: proteomic analysis of the influence of the adipocyte secretome on glioma
GL261 cells. R. Fernandes, J. Costa, J. Almeida, P. Coelho, V. Cea, M. Galesio, M.S. Diniz, C.
Prudêncio, C. Sala. Prémio de Investigação Básica. 17º Congresso Português de Obesidade (2013)
i
I. Summary
Gliomas represent the most common primary malignant brain tumors in adults, with an extremely
poor prognosis. Despite its high morbidity, the etiology of glioma remains largely unknown. Obesity,
favoured by the modern lifestyle, acquired epidemic proportions nowadays, and has been associated
with many major causes of death and morbidity including malignant neoplasms. In fact, excessive
adiposity is related with increased incidence and/or death rates from a wide variety of human
cancers. Among several risk factors, lifestyle was also recently identified as a major risk factor for
the development of primary glioma. So, there might be a relationship between the increased
incidence of gliomas and dysfunction of adipose tissue. In the present study, it is explored this
relationship between the influence of adipocytes secretome on glioma cell line GL261 (CGl),
sphingolipid rheostat (sphingosine-1-phosphate/ceramide) and compare it in a similar animal model.
Using the 3T3-L1 adipocytes in culture, and its conditioned medium (adipokines-enriched medium),
it is disclosed adipocyte-released factors related to glioma behavior regarding angiogenesis, growth,
hormones and metabolism by MALDI-TOF-MS and proteomic array analysis. Then, it is studied some
modified cytokines on adipose tissue from diet-induced obese C57Bl/6J mice. To conclude, it was
analysed the sphingolipid profile, namely ceramides and sphingosine-1-phosphate levels on normal
and obese diet-induced mice serum, as well as hepatic function – AST, ALT and ALP –, cholesterol
– total, VLDL, LDL and HDL –, uric acid and glucose.
ii
In a first approach, it is was used a microarray analysis of adipocytokines released by glioma
secretome under the influence of adipocytes, by which it was observed some over and under-
expressed, inexistent or without variation proteins. STI1, hnRNPs and PGK1 are underexpressed on
CGl. Similarly, both carbonic anhydrase and aldose reductase were suppressed in glioma cells that
grown under adipokines-enriched environment. Contrariwise, RFC1, KIF5C, ANXA2, N-RAP and
RACK1 were overexpressed in GL261 cell the in the presence of the adipokines-enriched medium.
Intending to further elucidate the involvement of angiogenic secretome in glioma, it was evaluated
the profile of GL261 under conditioned medium. It was further identified factors released by adipocyte
cells, and revealed that several pro-inflammatory and angiogenic factors, such as IL6, IL11, LIF, PAI-
1, TNF-α, endocan, HGF, VEGF IGF-I, were secreted to the medium into a high extent, whereas
ADAMTS, coagulation factor III, endostatin and PDGFAA, TIMP-1 and SerpinE1 were downregulated
on CGl. The medium proteome is a desirable sample due to their accessibility and representability
due, in part, to the wide dynamic range of protein levels, which lead to the discovery of new protein
markers.
Then, it followed immunohistochemical expression analysis on adipose and tumoral tissue. This was
addressed by focusing cytokines relationship within inflammation and angiogenesis. In
immunohistochemistry evaluation it was studied previously evaluated and significantly upregulated
proteins with angiogenic and metabolic relevance- IL1β, IL6, Ob (Y-20), PDGFA and TNFα, in
adipose and tumoral tissue. On adipose tissue, it was observed overexpression of IL6 (non-
iii
significant), Ob (n.s.) and TNFα (p<0,05) in glioma HFD when compared with glioma ND. The
opposite was observed regarding IL1β (n. s.) and PDGFA (p<0,05). Nevertheless, on tumoral tissue
results were quite different, as it was not observed a significant variation in glioma group in IL6,
however it was perceived a tendency to downregulation of TNFα in glioma HFD, and a significant
underexpression of PDGFA. Contrariwise, IL1β and Ob (Y-20) tended to be overexpressed in glioma
HFD. Although, on the in situ analysis of adipose tissue, it was observed overexpression of IL6 and
underexpression of TNFα in glioma HFD when compared with glioma ND. On tumoral tissue, neither
of the proteins varied significantly, however it was observed a tendency to downregulation of TNFα
in glioma HFD.
Last of all, it was analysed serum levels of sphingolipid profile – ceramide and sphingosine-1-
phosphate – in serum of C57Bl/6J obese mice. Metabolism of sphingolipids can be activated in
different situations, such as by pro-inflammatory cytokines, growth factors and oxidative stress, which
characterize the environment in which the adipose tissue is found in obesity. So, presented data
demonstrated an overtime increased levels of ceramide and decrease of S1P. These results
reinforce the hypothesis of delayed tissue response due to hypoxic state in an earlier phase. Besides,
it was approached the main clinical and metabolic features compatible with obese animal model:
dyslipidemia and weight. So, a myriad of clinical features, such as uric acid, glucose, triglycerides,
cholesterol and hepatic enzymes (AST, ALT and ASP) were evaluated on animal serum, by a
spectrophotometric assay. The relevance of these parameters relates with their potential as
iv
metabolic biomarkers to chronic low-grade inflammation. The lipid profile and hepatic function
analysis displayed a predictable behavior of these factors according to obesity low-grade
inflammatory state and metabolic syndrome in general. On a broader analysis, and regarding uric
acid, glucose and lipoproteins – triglycerides and cholesterol -, it is noticeable a continuously
increment in its levels throughout time, except for HDL, which suffers a decrease characteristic from
the negative impact of obesity progression. Furthermore, cumulative levels of FFA in the liver,
attained through excessive dietary lipids intake, contributes to de novo synthesis of purines, which
increases its serum levels, as well as activity of hepatic enzymes, namely AST, ALT. On the opposite,
ALP expresses a slightly, but not significant, decrease on the last timepoint (20 weeks).
The present thesis discloses an interesting in vitro model for the study of glioma biology under an
“obesity” resembling environment, that can be explored for the understanding of cancer cells biology,
for the search of biomarkers, prognostic markers and therapeutic approaches. Furthermore, in vivo
model reveals some debatable data which may contribute for another approach to adipose tissue in
tumoral environment.
So, in a conclusion mode, it will be summarized the main points of this thesis:
o Adipocytes overexpressed several pro-inflammatory and angiogenic factors, such as IL6,
IL11, LIF, TNFα, endocan, HGF, IGF1 and VEGF.
o Nevertheless, they underexpressed TIMP-1, SerpinE1, coagulation factor III, endostatin,
PDGFA and ADAMTS1.
v
o Tissue response may be delayed, at an early phase, due to hypoxic state.
o On adipose tissue, IL6, Ob (Y-20) and TNFα were overexpressed in HFD group, while IL1β
and PDGFA were underexpressed.
o On tumoral tissue, IL6 did not show significant variation, though IL1β and Ob tended to be
overexpressed while TNFα and PDGFA disposed to underexpression.
o Sphingolipid analysis, as well as liver function, reinforced the premise that excessive dietary
intake worsens metabolic syndrome in general and, more precisely, chronic low-grade
inflammation.
o Relationship between obesity and cancer is paradoxical, however it is strengthened the
theory of obesity protecting against glioma only at initiation and proliferation phases.

vi
vii
II. Resumen
Los gliomas representan los tumores cerebrales malignos primarios más comunes en adultos, con
un pronóstico muy desfavorable. Pese su alta morbilidad, la etiología del glioma sigue siendo en
gran parte desconocida. La obesidad, favorecida por el estilo de vida moderno, adquirió
proporciones epidémicas en la actualidad y se ha asociado con varias causas importantes de muerte
y morbilidad, incluidas las neoplasias malignas. De hecho, la adiposidad excesiva se relaciona con
un aumento en la incidencia y / o las tasas de mortalidad de una amplia variedad de enfermedades
oncológicas humanas. Entre los varios factores de riesgo, el estilo de vida también se identificó
recientemente como un factor importante para el desarrollo de glioma primario. Por lo tanto, podría
haber una relación entre el aumento de la incidencia de gliomas y la disfunción del tejido adiposo.
En el presente estudio, se explora esta relación entre la influencia del secretoma de los adipocitos
en la línea celular de glioma GL261 (CGl), el reostato de esfingolípidos (esfingosina-1-fosfato /
ceramida) y se compara en un modelo animal similar.
Utilizando los adipocitos 3T3-L1 en cultivo y su medio condicionado (medio enriquecido con
adipocinas), se describen los factores liberados de adipocitos relacionados con el glioma, la
angiogénesis, el crecimiento, las hormonas y el comportamiento metabólico mediante MALDI-TOF-
MS y el análisis de la matriz proteómica. En seguida, se estudiaron algunas citoquinas en el tejido
adiposo de ratones C57Bl / 6J obesos inducidos por la dieta. Para concluir, se analizó el perfil de
esfingolípidos, es decir, los niveles de ceramidas y esfingosina-1-fosfato en suero de ratones
viii
inducidos por dieta normal y obesa, así como la función hepática (AST, ALT y ALP), colesterol, total,
VLDL, LDL y HDL, ácido úrico y glucosa.
En un primer enfoque, se aplica un análisis de micromatrices de las adipocitocinas liberadas por el
secretoma de glioma bajo la influencia de los adipocitos, mediante el cual se observaron algunas
proteínas sobreexpresadas y poco expresadas, inexistentes o sin variaciones. STI1, hnRNPs y
PGK1 están subexpresados en CGl. De manera similar, tanto la anhidrasa carbónica como la aldosa
reductasa se suprimen incluso en las células de glioma que crecen en un ambiente enriquecido con
adipocinas. Por el contrario, RFC1, KIF5C, ANXA2, N-RAP y RACK1 se sobreexpresan en células
GL261 en presencia del medio enriquecido con adipocinas. Con la intención de dilucidar más la
implicación del secretoma angiogénico en el glioma, se evaluó el perfil de GL261 en medio
condicionado. Se identificaron además los factores que son liberados por las células adipocitarias y
revelaron que varios factores proinflamatorios y angiogénicos, como IL6, IL11, LIF, PAI-1, TNF-α,
endocan, HGF, VEGF IGF-I, fueron secretados al medio en gran medida, mientras que ADAMTS,
factor de coagulación III, endostatina y PDGFAA, TIMP-1 y SerpinE1 no se expresaron en exceso
en CGl. El proteoma del secretoma es una muestra deseable debido a su accesibilidad y
representabilidad debido, en parte, al amplio rango dinámico de las concentraciones de proteínas,
lo que lleva al descubrimiento de nuevos marcadores proteicos.
Luego, se siguió el análisis de la expresión inmunohistoquímica en tejido adiposo y tumoral. Esto se
abordó enfocando la relación de las citoquinas dentro de la inflamación y la angiogénesis. En la
ix
evaluación de inmunohistoquímica, se estudió previamente, evaluó y aumentó significativamente las
proteínas con relevancia angiogénica y metabólica: IL1β, IL6, Ob (Y-20), PDGFA y TNFα, en tejido
adiposo y tumoral. En el tejido adiposo, se observó una sobreexpresión de IL6 (no significativa), Ob
(n.s.) y TNFα (p <0,05) en glioma HFD en comparación con glioma ND. Se observó lo contrario con
respecto a IL1β (n. S.) Y PDGFA (p <0,05). Sin embargo, en el tejido tumoral los resultados fueron
bastante diferentes, ya que no se observó una variación significativa en el grupo de glioma en IL6,
sin embargo, se percibió una tendencia a la subexpresión de TNFα en la HFD de glioma, y una
subexpresión significativa de PDGFA. Por el contrario, IL1β y Ob (Y-20) tendieron a expresarse en
exceso en glioma HFD. Aunque, en el análisis in situ en tejido adiposo, se observó sobreexpresión
de IL6 y subexpresión de TNFα en glioma HFD en comparación con glioma ND. En el tejido tumoral,
ninguna de las proteínas varió significativamente, sin embargo, se observó una tendencia a la
subexpresión de TNFα en el glioma HFD.
Por último, se analizaron los niveles séricos de perfil de esfingolípidos ceramida y esfingosina-1-
fosfato en suero de ratones obesos C57Bl / 6J. El metabolismo de los esfingolípidos se puede activar
en diferentes situaciones, como las citocinas proinflamatorias, los factores de crecimiento y el estrés
oxidativo, que caracterizan el entorno en el que se encuentra el tejido adiposo en la obesidad. Por
lo tanto, los datos presentados demostraron un aumento de los niveles de ceramida a lo largo del
tiempo y una disminución en S1P. Estos datos refuerzan la hipótesis de la respuesta tardía del tejido
debido al estado hipóxico en una fase anterior. Además, se abordaron las principales características
x
clínicas y metabólicas compatibles con el modelo animal obeso: dislipidemia y peso. Por lo tanto,
una gran cantidad de características clínicas, como ácido úrico, glucosa, triglicéridos, colesterol y
enzimas hepáticas (AST, ALT y ASP) Se evaluaron en suero animal, mediante un ensayo
espectrofotométrico. La relevancia de estos parámetros se relaciona con su potencial como
biomarcadores metabólicos para la inflamación crónica de bajo grado. El perfil lipídico y el análisis
de la función hepática mostraron un comportamiento predecible de estos factores según el estado
inflamatorio de bajo grado de la obesidad y el síndrome metabólico en general. En un análisis más
amplio, y con respecto al ácido úrico, la glucosa y las lipoproteínas (triglicéridos y colesterol), es
notable un incremento continuo en sus niveles a lo largo del tiempo, excepto el HDL, que sufre una
disminución característica del impacto negativo de la progresión de la obesidad. Además, los niveles
acumulativos de FFA en el hígado, alcanzados a través de una ingesta excesiva de lípidos en la
dieta, contribuyen a la síntesis de novo de purinas, lo que aumenta sus niveles séricos, así como la
actividad de las enzimas hepáticas, a saber, AST, ALT. Por el contrario, la ALP expresa una
disminución leve, pero no significativa, en el último punto de tiempo (20 semanas).
La presente tesis describe un interesante modelo in vitro para el estudio de la biología del glioma en
un entorno similar a la "obesidad", que se puede explorar para la comprensión de la biología de las
células cancerosas, para la búsqueda de biomarcadores, marcadores de pronóstico y enfoques
terapéuticos. Además, el modelo in vivo revela algunos datos discutibles que pueden contribuir para
otro enfoque del tejido adiposo en el entorno tumoral.
xi
Entonces, en un modo de conclusión, se resumirán los puntos principales de esta tesis:
o Las células adipocitarias sobreexpresan varios factores proinflamatorios y angiogénicos,
como IL6, IL11, LIF, TNFα, endocan, HGF, IGF1 y VEGF.
o Sin embargo, subexpresaron TIMP-1, SerpinE1, factor de coagulación III, endostatina,
PDGFA y ADAMTS1.
o La respuesta del tejido puede demorarse, en una fase temprana, debido al estado hipóxico.
o En el tejido adiposo, se sobreexpresaron IL6, Ob (Y-20) y TNFα en el grupo HFD, mientras
que IL1β y PDGFA no se expresaron.
o En el tejido tumoral, la IL6 no presentó una variación significativa, aunque IL1β y Ob
tendieron a expresarse en exceso, mientras que el TNFα y el PDGFA estaban dispuestos a
la no expresión.
o El análisis esfingolipídico, así como la función hepática, refuerzan la premisa de que la
ingesta excesiva de la dieta empeora el síndrome metabólico en general y, más
precisamente, la inflamación crónica de bajo grado.
o La relación entre la obesidad y el cáncer es paradójica, sin embargo, se refuerza la idea de
que la obesidad protege contra el glioma solo en las fases de iniciación y proliferación.

xii
xiii
III. Publication I
Title: Effect of Adipocyte Secretome in Melanoma Progression and Vasculogenic Mimicry
Pedro Coelho1,2,3, Joana Almeida2,3, Cristina Prudêncio2,3, Rúben Fernandes2,3, Raquel Soares1,3
1 Department of Biochemistry, Faculty of Medicine, University of Porto, Portugal
2 Ciências Químicas e Biomoléculas, Escola Superior de Tecnologia da Saúde do Porto, Instituto
Politécnico do Porto, Portugal
3 Instituto de Inovação e Investigação em Saúde, Universidade do Porto, Portugal
Correspondence to:
Raquel Soares
Departamento de Bioquímica, Faculdade de Medicina da Universidade do Porto,
Al. Prof. Hernâni Monteiro,
4200-319 Porto, Portugal.
Tel/Fax: (+351) 22 551 36 24
E-mail: [email protected]
Short Title: Adipocyte Secretome in Melanoma Progression
xiv
Abbreviations used: AT: adipose tissue; CM: conditioned medium; DMEM: Dulbecco's modified
eagle's medium; FBS: foetal bovine serum; FGF: fibroblast growth factor; HGF: hepatocyte growth
factor; HMEC-1: human microvascular endothelial cells; IGF: insulin-like growth factor; IGFBP:
insulin-like growth factor binding protein; IL: interleukin; LIF: leukaemia inhibitory factor; MCP-1:
monocyte chemotactic protein 1; PAI-1: plasminogen activator inhibitor-1; PBS: phosphate buffered
saline; RBP-4: Retinol binding protein-4, SAT: subcutaneous adipose tissue; SEM: standard error of
the mean; TIMP: tissue inhibitor of metalloproteinases; VAT: visceral adipose tissue; VEGF: vascular
endothelial growth factor;
xv
Abstract
Obesity, favoured by the modern lifestyle, acquired epidemic proportions nowadays. Obesity has
been associated with various major causes of death and morbidity including malignant neoplasms.
This increased prevalence has been accompanied by a worldwide increase in cutaneous melanoma
incidence rates during the last decades. Obesity involvement in melanoma aetiology has been
recognized, but the implicated mechanisms remain unclear. In the present study, it was address this
relationship and investigate the influence of adipocytes secretome on B16-F10 (B16) and MeWo
melanoma cell lines. Using the 3T3-L1 adipocyte cell line, as well as ex vivo subcutaneous (SAT)
and visceral (VAT) adipose tissue conditioned medium, it was able to show that adipocyte-released
factors play a dual role in increasing melanoma cell overall survival, both by enhancing proliferation
and decreasing apoptosis. B16 cell migration and cell-cell and cell-matrix adhesion capacity were
predominantly enhanced in the presence of SAT and VAT released factors. Melanocytes morphology
and melanin content were also altered by exposure to adipocyte conditioned medium disclosing a
more dedifferentiated phenotype of melanocytes. In addition, exposure to adipocyte-secreted
molecules induced melanocytes to rearrange, on 3D cultures, into vessel-like structures and
generate characteristic vasculogenic mimicry patterns. These findings are corroborated by the
released factors profile of 3T3-L1, SAT and VAT assessed by microarrays, and led us to highlight
the mechanisms by which adipose secretome from sub-cutaneous or visceral depots promote
melanoma progression.

xvi
Keywords: obesity, melanoma, vasculogenic mimicry, adipose tissue

xvii
Introduction
Obesity prevalence has significantly increased worldwide [Rubenstein, 2005], leading to a public
health concern and branded as “the modern epidemic” [Haffner and Taegtmeyer, 2003; Rubenstein,
2005]. The prevalence of obesity in Europe has increased by approximately 30% over the past 10
years and this phenomenon is corroborated by data from several other countries [Berghöfer et al.,
2008]. It has long been recognized that excess adipose tissue (AT) increases the risk of
cardiovascular disease, type 2 diabetes and metabolic syndrome [Haffner and Taegtmeyer, 2003;
Rubenstein, 2005], but only in the past few decades it became widely accepted that augmented body
adiposity is a risk factor for several types of malignancies [Taubes, 2012; Vucenik and Stains, 2012].
Additionally, obesity can lead to worsened prognosis, poorer treatment outcome and increased
cancer-related deaths [Parekh et al., 2012].
Cutaneous melanoma incidence rates have increased in the last decades worldwide from 3% to 7%
annually [Tuong et al., 2012]. These statistics suggest a doubling of rates every 10 to 20 years
[Marks, 2000; Garbe and Leiter, 2009], raising melanoma to the most rapidly increasing cancer in
Caucasians [Garbe and Leiter, 2009]. Several reports showed positive associations between
increased body fat and the risk of cutaneous melanoma later in life [Dennis et al., 2008; Morpurgo et
al., 2012; Nagel et al., 2012; Sergentanis et al., 2013], suggesting that the increasing incidence of
melanoma may be related to the enlarged obesity prevalence.
xviii
In vivo adiposity-related stimulation of melanoma growth has been demonstrated [Brandon et al.,
2009; Pandey et al., 2012; Wagner et al., 2012; Jung et al., 2015]. Tumour-associated macrophages
[Wagner et al., 2012; Jung et al., 2015] and endothelial cells [Jung et al., 2015] have been pointed
out as possible mediators in the growth-promoter effect of adipose tissue towards melanomas. In
fact, tumour stroma comprises many different cell types, including fibroblasts, adipocytes, immune
and endothelial cells that, along with the extracellular matrix, are key players in cancer development
and progression [Brychtova et al., 2011; Friedl and Alexander, 2011]. However, we hypothesize that
adiposity might also exert a direct effect over melanocytes without the involvement of stromal cells
in a paracrine or endocrine manner. Herein, we explored the biological role of adipocytes secretome
in B16 and MeWo melanoma cell survival and plasticity.
xix
Material and Methods
Cell Culture and In vitro treatments
B16-F10 (B16) murine melanoma cell line (ATCC CRL-6475), MeWo human melanoma cells (ATCC
HTB-65) and 3T3-L1 pre-adipocytes (ATCC CL-173) were maintained in Dulbecco's modified eagle's
medium (DMEM; Sigma-Aldrich), Human dermal microvascular endothelial cells (HMEC-1, ATTC
CRL-3243) were cultured in RPMI-1640 (Sigma-Aldrich) containing 10ng/mL epidermal growth factor
(BD Biosciences) and 1 µg/mL cortisone (Sigma-Aldrich). Both media formulations were
supplemented with 10% heat-inactivated fetal bovine serum (FBS; Sigma-Aldrich), 1%
penicillin/streptomycin/amphotericin B (Sigma-Aldrich). Cells were grown at 37ºC under a humidified
5% CO2 atmosphere. Cells were serum-deprived during 16h before incubation with each treatment
for every experiment. Unless otherwise specified, all treatments and controls were carried out in
serum-free conditions.
Adipocyte Differentiation and Conditioned Medium collection
3T3-L1 pre-adipocytes were harvested and allowed to reach confluence. After 2 days (day 0), the
differentiation was initiated by addition of a hormonal mixture composed of 2 μM insulin (Sigma-
Aldrich), 1 μM dexamethasone (Sigma-Aldrich) and 0.25 mM isobutylmethylxanthine (Fluka) in
complete medium. Three days later (day 3), the induction medium was replaced by complete medium
supplemented with insulin only. At day 7, cultures with a differentiation yield higher than 80% were
washed with phosphate buffered saline (PBS) and incubated in serum-free DMEM. After 24h (day

xx
8), the conditioned medium (CM) was harvested from the adipocyte’s cultures, spun for 5 minutes at
300g and the supernatant was stored at -80ºC for the subsequent treatments.
Adipose Tissue Organ Culture
Fragments (8–10 mg) from visceral adipose tissue (VAT) and subcutaneous adipose tissue (SAT)
depots were collected from 8 week male C57BL/6J mice. The fragments were then washed with 1%
penicillin/streptomycin/amphotericin B (Sigma-Aldrich) in PBS and cultured afterwards in 1 mL of
DMEM supplemented with 10% FBS. The fragments were serum-deprived and 24h later the CM
harvested and centrifuged at 300g for 5 minutes.
Mouse Adipokine Array Analysis
Mouse adipokine antibody arrays (-# ARY-013; R&D systems) were performed using 1 mL of 3T3-
L1, SAT and VAT CM and following the manufacturer’s protocol. The pixel density of each spot was
calculated with the microarray profiler plugin of the Image J software (NIH). The relative adipokine
levels were calculated upon normalization with the adipokine levels of B16 CM.
Cell Viability Assay
To measure B16 metabolic activity, after a 24 h incubation of 1x10⁴ cells/mL with the different
treatments, 20 μL of the MTS reagent, from CellTiter 96 Aqueous assay (Promega), was added into
each 96-plate well followed by a 3 hour incubation period. Colour development was determined by
measuring absorbance at 490 nm.
xxi
Apoptosis Assay
Terminal deoxynucleotidyl transferase-mediated deoxyuridine triphosphate nick-end labelling
(TUNEL) assay was performed in B16 cells (1x10⁴ cells/mL), after 24h incubation with the different
treatments using the in situ Cell Death Detection Kit (Roche Diagnostics) following the manufacturers
protocol. Nuclei were counter-stained with DAPI (Roche Diagnostics) and immunofluorescence was
visualized under a fluorescence microscope (Nikon). The percentage of TUNEL-positive cells was
evaluated by counting the cells stained with TUNEL divided by the total number of DAPI-stained
nuclei at a 200x magnification field. One thousand nuclei were evaluated. The results are presented
as mean ± standard error of the mean (SEM).
BrdU Proliferation Assay
B16 cells (1x10⁴ cells/mL) were cultured with standard treatments in serum-free conditions for 20h.
Then bromodeoxyuridine (BrdU; Roche Diagnostics), at a final concentration of 0.01 mM, was added
to each well for 4h. The detection was performed using the colorimetric Cell Proliferation ELISA,
BrdU (Roche Diagnostics), according to the manufacturer’s instructions.
Cell Spreading and Adhesion determination
To determine cell spreading and adhesion [Humphries, 2001], B16 cells were re-suspended in the
different treatments at a final concentration of 5x10⁴ cells/mL, seeded in a 24-well microplate and
allowed to adhere and spread for 3 hours and then washed with PBS to remove non-adherent cells.
Fixation was performed with 4% (w/v) p-formaldehyde in PBS. Afterwards, 200 μL of crystal violet
xxii
0.1% (w/v) was added to each well for 20 minutes and later washed with H2O. To evaluate the
morphologic parameters (cell area, sphericity, size and perimeter), 1000 cells were analysed by
CellProfiler software (Broad Institute) on photographs of random fields, for each treatment, captured
under an inverted microscope (Nikon) at a 200x magnification. To determine cell adhesion, the above
protocol was reproduced but only allowing cells to adhere for 30 minutes. Afterwards, crystal violet
dye was solubilized in 100 μL 10% (v/v) acetic acid (Fluka) and the absorbance measured at 570 nm
using a plate reader.
Adhesion to endothelium evaluation
HMEC-1 cells were cultured in a 24-well microplate with glass coverslips and allowed to reach
confluence. Media was aspirated and the monolayers were washed with PBS. Afterwards, 1x10⁵
cells/mL B16 cells, in the different treatments, were added to the wells for 30 minutes. To remove
non-adherent cells, the wells were washed with PBS. Fixation was performed with 4% (w/v) p-
formaldehyde for 10 minutes. Coverslips were then stained with Giemsa’s stain, thoroughly washed
in Sorensen's phosphate buffer and mounted on a microscope slide. Using a light microscope (Nikon)
the number of cells adherent to the endothelial monolayer were counted in 5 random fields.
Melanin content determination
B16 cells (5x10⁵ cells/mL), were incubated with the different treatments for 24h. Following
detachment with 0,5% trypsin, cell density was assessed on a haemocytometer. After 300g
centrifugation for 10 min, the pellet was washed twice with PBS and the melanin was solubilized in
xxiii
1.0 mL of 1M NaOH (Panreac) containing 10% (v/v) dimethyl sulfoxide (Merck). Next, the absorbance
at 475 nm was recorded. Results represent the mean absorbance (±SEM) of 1x10⁶ cells.
Transwell migration
Migration capacity was quantified on 24-well plates with 8 μm-pore transwell inserts (BD
Biosciences). B16 cells (5x10⁴ cells/ml) were harvested on inserts in serum-free medium and placed
on wells containing the standard treatments plus 10% FBS for 24h. Membranes were then stained
with crystal violet 0.1% (w/v) and visualized under a light microscope (Nikon). Five random fields of
each membrane were counted on the microscope (Nikon) at a 100x magnification.
Injury assay
To perform the injury assay, melanoma cells at confluence were scrapped from the culture dish using
a pipette tip, which left a void space. Cells were then incubated for 24h following the standard
treatments. After this period, damage recovery was then visualized and photographed under an
inverted microscope (Nikon) at a 200x magnification. The wound closure was determined by
measuring the wound area and by subtracting this value from the initial void space (CellProfiler
software; Broad Institute). Shown are the means values (±SEM) of nine measurements for each time
point and condition.
Matrigel cultures
To perform Matrigel cultures, 24-well plates were coated with 250 µL per well of Matrigel Basement
Membrane Matrix (Corning). Afterwards, B16 (5x10⁴ cells/mL) or MeWo (20x104 cells/mL)
xxiv
melanocytes harvested in the respective treatments were fed on top of the Matrigel layer. Cell growth
was then monitored and photographed under an inverted microscope (Nikon) at a 200x magnification
for 24h.
Soft-agar colony formation
The bottom of each 12-well plate was coated with 2 ml of 0.5% agarose and DMEM 2X. After
polymerization the wells were fed with 5x10³ B16 cells in 2 ml of 0.2% agar and DMEM 2X. The
medium was changed every 2-3 days. After 15 days, the wells were stained with 0.01% crystal violet
and photographed. The number and area of the colonies was assessed with ImageJ software (NIH).
Hanging-drop cell Cultures
Generation of melanoma spheroids was conducted as previously described [Foty, 2011]. Briefly,
2,5x10⁶ B16 or MeWo cells/mL were collected in the respective treatments and pippeted to the lid of
a 60mm non-adhesive petri dish leaving 10 μL drops onto the bottom of the lid. The lids were inverted,
placed on top of the PBS-filled bottom chamber of the dish and incubated for 3 days.
Statistical Analysis
Results are expressed as mean±SEM. Data was analysed with GraphPad Prism 6.0 (GraphPad
Software Inc.). Differences between samples and parameters among two experimental groups were
evaluated by Student’s t-test. When three or more conditions were evaluated, statistical analysis was
conducted through one-way ANOVA with Sidak post-hoc test. Significance was set at p<0.05.
xxv
Results
3T3-L1 secretome increases melanocytes survival, proliferation and melanin content, and decreases
apoptosis
3T3-L1 preadipocytes are a commercially available cell line for studying adipogenesis [Green and
Kehinde, 1975; Poulos et al., 2010]. Their differentiation, in culture, into mature adipocytes is well
widespread and can be achieved by established protocols. We used CM from fully differentiated 3T3-
L1 cells to explore the potential effects of adipocytes secretome over malignant melanoma B16 cells
viability, proliferation and apoptosis.
We first analysed the effects of this conditioned medium in melanoma cells viability by the MTS
assay. After a 24-hour exposure to adipocyte CM, melanoma cells showed a 48% increase in their
metabolic activity (Fig. 1A). We found as well that the fraction of proliferating B16 cells was
significantly increased, as shown by the higher BrdU incorporation, in the presence of these
adipocyte-released factors (Fig. 1B). The effect of 3T3-L1 secretome on apoptosis was examined
using TUNEL analysis. Concomitantly, 3T3-L1 CM medium decreased B16 programmed cell death
by approximately 50% (Fig. 1C). These effects were further accompanied by a significant reduction
in melanin content per cell (Fig. 1D).
Adipocyte secretome profile characterization
xxvi
The previous findings imply that adipocytes released factors stimulate melanoma cell viability and
aggressiveness. Therefore, we then assessed the secretion profile of adipocytes to further elucidate
the involvement of adipose tissue in melanoma behaviour (see Supplemental data). Given the well-
established distinct biological and metabolic roles of sub-cutaneous (SAT) and visceral (VAT)
adipose tissue, microarray assay was performed not only in 3T3-L1 cells, but also in organ cultures
of SAT and VAT fragments.
As illustrated in Fig. 2, the secretion patterns of numerous growth-factors, adipokines, cytokines and
angiogenesis-related molecules are different among the different CM. Greater levels of vascular
endothelial growth factor (VEGF) and endocan were found in SAT and VAT CM, whereas tissue
inhibitor of metalloproteinases-1 (TIMP-1) levels were significantly reduced in these two CM (Fig 2A).
On the other hand, 3T3-L1 CM exhibited higher levels of VEGF, TIMP-1 and endocan than B16-CM
(Fig 2A). The levels of the interleukin (IL) family of cytokines: IL6, IL11 and leukaemia inhibitory factor
(LIF) were also significantly overexpressed within SAT and VAT, although no substantial differences
were found in the 3T3-L1 CM (Fig 2B). Nonetheless, monocyte chemotactic protein 1 (MCP-1) and
plasminogen activator inhibitor-1 (PAI-1) expression was upregulated in every CM (Fig 2B). Adipose
tissue hormones were also identified. Resistin and leptin relative expression levels were higher in
3T3-L1, SAT and VAT CM. In addition, Retinol binding protein-4 (RBP-4) was significantly released
in SAT and VAT, but not in 3T3-L1 CM. Interestingly enough, a significant reduction in adiponectin
levels was observed in all CM (Fig 2. C). The levels of several growth factors involved both in
metabolism and in cell behaviour were also analysed. VAT CM revealed the higher expression of
xxvii
fibroblast growth factor (FGF)-21, insulin-like growth factor binding protein (IGFBP)-5, whereas
hepatocyte growth factor (HGF), insulin-like growth factor(IGF)-I, IGFBP-2, IGFBP-3 and IGFBP-6
levels were significantly higher in SAT than VAT CM (Fig 2. D).
SAT and VAT distinctively modulate melanocyte migration and cell spreading
According to the previous secretome profile, TIMP-1, an inhibitor of extracellular matrix degradation
was significantly decreased, whereas several inflammatory cytokines and angiogenic growth factors
were upregulated particularly in SAT and VAT. These findings led us to evaluate the influence of CM
in melanocytes motility. We first analysed whether 3T3-L1 CM mechanically induced a wound to B16
confluent cultures by injury assay. As illustrated in Figure 3A, the resulting void area was promptly
occupied by melanocytes upon 3T3-L1 CM incubation in comparison to untreated B16 cultures.
Following a 24h incubation with CM, the migrated distance is almost twice the distance of the control
treatment as seen by the microscopic examination of the wounds (Fig. 3B). We then examined the
effect of SAT and VAT fat depots secretome in B16 cells motility. In the double-chamber migration
assay, the number of migrating cells following a chemotactic gradient was significantly enhanced in
every treatment as compared to untreated B16 cultures (Fig. 3C). However, SAT CM exerted this
effect into a much larger extent. Cell spreading evaluation revealed that VAT and 3T3-L1 secreted
molecules, but not SAT, induced spreading dynamic of B16 cells (Fig. 3D). In addition, VAT CM-
treated B16 cells exhibited significantly higher areas and perimeter, whereas a smaller number of
round shaped cells were observed. In contrast, SAT secreted factors did not significantly alter B16
xxviii
spread plasticity (Fig. 3E). These findings highlight a distinct paracrine role of AT depots regarding
B16 locomotive behaviour: while SAT-released factors boost melanoma cell chemotaxis, VAT CM
signalling enhance cell morphological plasticity and haptotactic spreading.
AT secretome modulates melanoma cells adhesion and tumorigenesis
Decreased cell-cell adhesion and anchorage-independent growth are prominent features necessary
for successful metastization [Chiang and Massagué, 2008; Friedl and Alexander, 2011]. Therefore,
we evaluated the adhesion of CM-treated B16 cells to standard cell culture plates. Interestingly, B16
cells adhesion was significantly increased after incubation with every CM, being higher upon VAT
medium exposure (Fig 4A).
Identical findings were observed in B16 cells adhesion to endothelial cells (Fig. 4C). The number of
B16 cells adherent to HMEC-1 monolayers was significantly enhanced both after SAT and VAT CM
treatments as compared to untreated cells or to cells treated with 3T3-L1 CM (Fig. 4B), being the
highest increase found upon VAT CM incubation. These findings confirm that VAT improves B16
adhesive properties. Conversely, in the soft-agar clonogenic assay, SAT soluble factors promoted
the anchorage-independent proliferation of B16 cells upon culture in non-adherent conditions (Fig.
4D and 4E), whereas exposure to VAT CM did not exert any effect. SAT released factors increased
the number of colonies formed, but not in a statistically significant manner (Fig. 4F). These results
further emphasize the divergent roles of SAT and VAT towards melanocytes malignancy.
Adipocytes secreted factors induce malignant melanocytes vasculogenic mimicry
xxix
Given that malignant melanomas are highly vascularized tumours [Pirraco et al., 2010; Chung and
Mahalingam, 2014] and metastatic melanoma cells actively participate in tumour vascularization
[Hendrix et al., 2003; Chung and Mahalingam, 2014], we next addressed whether CM from 3T3-L1
adipocytes prompted B16 melanoma cells toward vasculogenic mimicry.
In comparison to untreated cells, 3T3-L1 CM-treated B16 cells rapidly assembled into capillary-like
structures when cultured in Matrigel basement matrix (Fig. 5A). To further confirm the three-
dimensional growth and spatial arrangement of the melanoma cells, B16 cells were cultured in
hanging-drops for 72 hours. Microscopic observation of the generated spheroids upon incubation
with 3T3-L1 CM revealed the formation of large and diffused aggregates of B16 cells, whereas in the
control treatment, a spherical and compact mass of melanocytes was observed (Fig. 5B). Next, we
used MeWo cell line to additionally examine the vasculogenic mimicry inducer effects of 3T3-L1 CM
in human melanoma cells. MeWo cells, when cultured on top of Matrigel and in the presence of 3T3-
L1 CM displayed the same vessel-like rearrangement already observed for B16 melanocytes (Fig.
5A). MeWo spheroids further revealed a loophole growth pattern when exposed to 3T3-L1-released
factors (Fig. 5B). Altogether, these findings regarding cell-cell adhesion and reorganization into
vessel-like structures formation provide additional support and reinforce the deleterious effects of fat-
secreted molecules on melanoma tumour progression.
Discussion
xxx
Emerging evidence indicates that systemic factors, including inflammatory, angiogenic or metabolic
markers, significantly influence tumour behaviour [Hanahan and Weinberg, 2011].
The current study reveals that adipocyte-released factors increase B16 melanoma cells viability,
proliferation, and reduces apoptosis and melanin content. Exposure to adipose tissue CM of these
cells further resulted in increased motility, enhancing the capacity to migrate and spread. These
findings were accompanied by an augmented adhesion capacity, in particularly to endothelial cells,
and anchorage-independent proliferation as assessed by soft agar assays. We further identified the
factors that are released by adipocyte cells of different depots, and revealed that several pro-
inflammatory factors (IL6, IL11, LIF and PAI-1), metabolic markers (IGFBPs, FGF-21), angiogenic
growth factors (endocan, HGF, VEGF IGF-I), and hormones (leptin, resistin, RBP-4) were secreted
to the medium into a high extent, whereas TIMP-1, an inhibitor of ECM degradation, and adiponectin
were significantly downregulated.
Adipose tissue is no longer considered a mere lipid store depot, but also an inflammatory and
endocrine organ [Monteiro, 2009; Mendonça and Soares, 2015]. Accordingly, obesity provides a
chronic low-grade inflammatory condition, further potentiated by the presence of hormone cues and
cytokines, which are strongly associated with disease. Therefore, the presence of high amounts of
pro-inflammatory cytokines and hormones in adipocyte CM is expected. Remarkably, the majority of
these factors are known to play a role in cell proliferation, apoptosis, migration and invasiveness, as
well as adhesion capacity. Recently, it has been reported that both leptin and resistin, two adipocyte-
xxxi
released hormones, were able to stimulate melanoma cell growth and proliferation through Akt and
fatty acid synthase modulation [Malvi et al., 2015]. In addition to these hormones, FGF-21, a
metabolic regulator also increases cell proliferation in vitro and increased tumorigenesis and invasive
potential in vivo [Osawa et al., 2009]. Likewise, FGF and IL6 are known to be produced by melanoma
cells and stimulate proliferation in a autocrine manner, while other paracrine growth factors (HGF,
IGF-I and VEGF) modulate the microenvironment and potentiate tumour growth and invasion
[149,150]. We have found that adipose tissues CM have significant higher levels of the above growth
factors, reinforcing our findings concerning the effect of CM from the distinct adipose tissue depots
studied in augmenting B16 cell proliferation, migration, ability to invade and decreasing apoptosis.
Along with the progression of melanoma, malignant melanocytes dedifferentiate losing most of their
epithelial characteristics through a process similar to epithelial-mesenchymal transition [Fenouille et
al., 2012], leading thus to more aggressive phenotypes [Thiery, 2002]. Melanogenesis is an inherent
process in melanocytes. Melanocytes respond to the inflammatory cytokines, namely IL6, with a
dose-dependent inhibition of melanogenesis [151]. Nevertheless, whenever these cells exhibit a
more malignant phenotype, melanocytes decrease melanin synthesis [Jimbow et al., 1993]. Our
findings show that when treated with CM from adipocytes, the melanin content per B16 melanocyte
was significantly reduced, further enlightening the growth-promoter and dedifferentiation paracrine
effects of adipocytes.
xxxii
Furthermore, active locomotion of tumour cells is fundamental to malignant invasive and metastatic
capacity [Zhao et al., 2001; Fidler, 2003; Friedl and Wolf, 2003]. By crossing tissue stroma and the
vascular bed, tumour cells interact with both extracellular matrix and soluble tropic factors. Our
findings showed that chemotactic migration of B16 cells was enhanced upon exposure to SAT-
released factors while cell spreading and haptotactic migration of tumour cells were positively
modulated by visceral-fat secretome. Intercellular adhesion is reduced in many aggressive tumours
[Chiang and Massagué, 2008], allowing cells to detach from the primary lesion and metastasise to
distant organs. Again, we found discrete effects among subcutaneous and visceral fat depots on B16
adhesive properties. In fact, several biological, metabolic and secretory differences distinguish intra-
abdominal visceral-adipocytes from peripheral subcutaneous adipose tissue [Ibrahim, 2010; Ali et
al., 2013]. In agreement, our results unveiled distinct effects of SAT and VAT upon melanocytes
aggressiveness. SAT CM enhances B16 locomotion and anchorage-independent proliferation. In
turn, VAT prominently improves melanocytes cell-substratum adhesion. Despite the higher release
of visceral-fat pro-inflammatory cytokines [Ibrahim, 2010], subcutaneous fat depots, which are
located close to melanoma lesions, influence the malignant transformation of melanocytes.
Nevertheless, our microarray assay revealed that the secretome profile of SAT and VAT is
significantly different regarding some of the inflammatory, hormonal and metabolic molecules
addressed. TIMP-1 and IGF-I are chemotactic agents for human melanoma cells that mediate
motility [150,152]. IGF-I was significantly higher in SAT CM while TIMP-1 was under expressed in
the adipose tissues CM. PAI-1 is also known to modulate cell adhesive properties and its
xxxiii
overexpression is correlated with the metastatic capacity of melanomas [153]. Antagonistically,
IGFBPs inhibit melanoma migratory and invasive behaviour, and induce melanocytic differentiation
[154] counterbalancing the IGF-I effects and most likely contribute to the discrete differences
observed between subcutaneous and visceral CM. The effect of the different AT depot secretome in
tumour cells behaviour is beyond the scope of this study, however our results reinforce the need for
additional molecular studies to investigate how SAT and VAT affect tumour progression.
Accumulating data point out mechanisms associating obesity to melanoma [Dennis et al., 2008;
Brandon et al., 2009; Meeran et al., 2009; Morpurgo et al., 2012; Pandey et al., 2012; Chen et al.,
2013]. Recent reports unveiled the involvement of high-fat diet-induced increased cytokines and
angiogenic factors in the crosstalk between tumour cells and macrophages [Costa et al., 2007;
Wagner et al., 2012; Jung et al., 2015; Mendonça et al., 2015]. Recruitment of the immune system
cells, which release factors that enhance tumour plasticity and the maintenance of stromal
microenvironment, has already been described for other malignancies [Fridman et al., 2012;
Hanahan and Coussens, 2012]. In contrast, our in vitro results disclose a direct effect of adiposity on
melanoma cells, without the influence of either tumour-associated cell-mediated immunity or
endothelium.
Vascularization plays a central role in tumour development and progression. Besides angiogenesis,
vasculogenic mimicry provides an alternative, angiogenic-independent tumour microcirculation
[Maniotis et al., 1999; Hendrix et al., 2003; Ribatti et al., 2013]. Melanoma cell-lined vascular
xxxiv
networks sustain a redundant blood supply required for both growth and metastasis [Maniotis et al.,
1999; Ribatti et al., 2013]. The presence of these functional vascular channels by the tumour itself is
a predictor of poor prognosis in human melanoma patients [Thies et al., 2001; Cao et al., 2013] and
might circumvent the effectiveness of anti-vascular drugs and anti-angiogenic therapies [Loges et
al., 2010]. Fully differentiated 3T3-L1 adipocytes CM were able to induce malignant melanocytes to
rearrange on Matrigel cultures into vessel-like structures typically reported for endothelial cells
[Kleinman and Martin, 2005]. Moreover, microscopic inspection of B16 and MeWo spheroids,
obtained by hanging-drop cultures, revealed the same pattern of vasculogenic mimicry observed in
cultures of human melanoma cell lines [Maniotis et al., 1999; van der Schaft et al., 2004]. Data
confirming melanoma angiogenesis stimulation by AT tropic factors has recently been highlighted
[Wagner et al., 2012; Jung et al., 2015]. However, we report for the first time supporting evidence
endorsing the potential adipocyte secretome inducer effects of tumour vasculogenic mimicry.
Accordingly, several angiogenic growth factors were significantly higher in CM, including HGF and
VEGF. HGF was involved in vascular mimicry of hepatocellular carcinoma [Lirdprapamongkol et al.,
2012]. Additionally, VEGF signalling was found to be involved in vascular mimicry through activation
of VEGFR1 expression in melanoma cells [Frank et al., 2011], explaining the increased capacity of
melanoma cells to form vasculogenic structures after treatment with adipocyte CM. Endocan, in turn,
is a new tumour invasion and angiogenic marker, being overexpressed in tumour vessels [Matano
et al., 2014]. The fact that it is upregulated in both SAT and VAT conditioned medium may also
explain the involvement of adipose tissues in tumour aggressiveness.
xxxv
Altogether, our results indicate that adipocytes secretome induce malignant melanocytes
aggressiveness. The synergic increase in melanocyte survival, adhesion, motility and plasticity allied
to the stimuli for cell-cell networks of vasculogenic mimicry patterns, support the deleterious effects
that adiposity partakes directly in melanoma progression.
Acknowledgements:
We would like to thank Professor Conceição Calhau (Faculty of Medicine of the University of Porto)
and Professor Paula Soares (Instituto de Inovação e Investigação em Saúde, Universidade do Porto)
for kindly providing the 3T3-L1 and MeWo cell lines, respectively. We are also in debt to the
“Fundação para a Ciência e a Tecnologia” (FCT) and FEDER-COMPETE for the financial support
through the research unit PEst-OE/SAU/UI0038/2011, UID/BIM/04293/2013 and the PhD grant
attributed to PC (SFRH/BD/80434/2011).
There is no conflict of interests regarding the present paper.
xxxvi
References:
Ali AT, Hochfeld WE, Myburgh R, Pepper MS. 2013. Adipocyte and adipogenesis. Eur J Cell Biol
92:229–36.
Berghöfer A, Pischon T, Reinhold T, Apovian CM, Sharma AM, Willich SN. 2008. Obesity prevalence
from a European perspective: a systematic review. BMC Public Health 8:200.
Brandon EL, Gu JW, Cantwell L, He Z, Wallace G, Hall JE. 2009. Obesity promotes melanoma tumor
growth: Role of leptin. Cancer Biol Ther 8:1871–1879.
Brychtova S, Bezdekova M, Hirnak J, Sedlakova E, Tichy M, Brychta T. 2011. Stromal
Microenvironment Alterations in Malignant Melanoma. In: Murph M, editor. Research on Melanoma
- A Glimpse into Current Directions and Future Trends. InTech.
Cao Z, Bao M, Miele L, Sarkar FH, Wang Z, Zhou Q. 2013. Tumour vasculogenic mimicry is
associated with poor prognosis of human cancer patients: A systemic review and meta-analysis. Eur
J Cancer 49:3914–3923.
Chen J, Chi M, Chen C, Zhang XD. 2013. Obesity and melanoma: Exploring molecular links. J Cell
Biochem 114:1955–1961.
Chiang AC, Massagué J. 2008. Molecular basis of metastasis. N Engl J Med 359:2814–2823.
xxxvii
Chung HJ, Mahalingam M. 2014. Angiogenesis, vasculogenic mimicry and vascular invasion in
cutaneous malignant melanoma - implications for therapeutic strategies and targeted therapies.
Expert Rev Anticancer Ther 14:621–39.
Costa C, Incio J, Soares R. 2007. Angiogenesis and chronic inflammation: Cause or consequence?
Angiogenesis 10:149–166.
Dennis LK, Lowe JB, Lynch CF, Alavanja MCR. 2008. Cutaneous melanoma and obesity in the
Agricultural Health Study. Ann Epidemiol 18:214–21.
Fenouille N, Tichet M, Dufies M, Pottier A, Mogha A, Soo JK, Rocchi S, Mallavialle A, Galibert MD,
Khammari A, Lacour JP, Ballotti R, Deckert M, Tartare-Deckert S. 2012. The epithelial-mesenchymal
transition (EMT) regulatory factor SLUG (SNAI2) is a downstream target of SPARC and AKT in
promoting melanoma cell invasion. PLoS One 7:e40378.
Fidler IJ. 2003. The pathogenesis of cancer metastasis: the “seed and soil” hypothesis revisited. Nat
Rev Cancer 3:453–458.
Foty R. 2011. A simple hanging drop cell culture protocol for generation of 3D spheroids. J Vis
Exp:2720.
Frank NY, Schatton T, Kim S, Zhan Q, Wilson BJ, Ma J, Saab KR, Osherov V, Widlund HR, Gasser
M, Waaga-Gasser AM, Kupper TS, Murphy GF, Frank MH. 2011. VEGFR-1 expressed by malignant
melanoma-initiating cells is required for tumor growth. Cancer Res 71:1474–1485.
xxxviii
Fridman WH, Pagès F, Sautès-Fridman C, Galon J. 2012. The immune contexture in human
tumours: impact on clinical outcome. Nat Rev Cancer 12:298–306.
Friedl P, Alexander S. 2011. Cancer invasion and the microenvironment: Plasticity and reciprocity.
Cell 147:992–1009.
Friedl P, Wolf K. 2003. Tumour-cell invasion and migration: diversity and escape mechanisms. Nat
Rev Cancer 3:362–74.
Garbe C, Leiter U. 2009. Melanoma epidemiology and trends. Clin Dermatol 27:3–9.
Green H, Kehinde O. 1975. An established preadipose cell line and its differentiation in culture. II.
Factors affecting the adipose conversion. Cell 5:19–27.
Haffner S, Taegtmeyer H. 2003. Epidemic obesity and the metabolic syndrome. Circulation
108:1541–1545.
Hanahan D, Coussens LM. 2012. Accessories to the Crime: Functions of Cells Recruited to the
Tumor Microenvironment. Cancer Cell 21:309–322.
Hanahan D, Weinberg RA. 2011. Hallmarks of Cancer: The Next Generation. Cell 144:646–674.
Hendrix MJC, Seftor EA, Hess AR, Seftor REB. 2003. Vasculogenic mimicry and tumour-cell
plasticity: lessons from melanoma. Nat Rev Cancer 3:411–421.
Humphries M. 2001. Cell adhesion assays. Mol Biotechnol 18:57–61.
xxxix
Ibrahim MM. 2010. Subcutaneous and visceral adipose tissue: structural and functional differences.
Obes Rev 11:11–8.
Jimbow K, Lee SK, King MG, Hara H, Chen H, Dakour J, Marusyk H. 1993. Melanin pigments and
melanosomal proteins as differentiation markers unique to normal and neoplastic melanocytes. J
Invest Dermatol 100:259S–268S.
Jung JI, Cho HJ, Jung YJ, Kwon S-H, Her S, Choi SS, Shin S-H, Lee KW, Park JHY. 2015. High-fat
diet-induced obesity increases lymphangiogenesis and lymph node metastasis in the B16F10
melanoma allograft model: roles of adipocytes and M2-macrophages. Int J Cancer 136:258–70.
Kleinman HK, Martin GR. 2005. Matrigel: Basement membrane matrix with biological activity. Semin
Cancer Biol 15:378–386.
Lirdprapamongkol K, Chiablaem K, Sila-Asna M, Surarit R, Bunyaratvej A, Svasti J. 2012. Exploring
stemness gene expression and vasculogenic mimicry capacity in well- and poorly-differentiated
hepatocellular carcinoma cell lines. Biochem Biophys Res Commun 422:429–35.
Loges S, Schmidt T, Carmeliet P. 2010. Mechanisms of resistance to anti-angiogenic therapy and
development of third-generation anti-angiogenic drug candidates. Genes Cancer 1:12–25.
Malvi P, Chaube B, Pandey V, Vijayakumar MV, Boreddy PR, Mohammad N, Singh SV, Bhat MK.
2015. Obesity induced rapid melanoma progression is reversed by orlistat treatment and dietary
intervention: role of adipokines. Mol Oncol 9:689–703.
xl
Maniotis AJ, Folberg R, Hess A, Seftor EA, Gardner LM, Pe’er J, Trent JM, Meltzer PS, Hendrix MJ.
1999. Vascular channel formation by human melanoma cells in vivo and in vitro: vasculogenic
mimicry. Am J Pathol 155:739–752.
Marks R. 2000. Epidemiology of melanoma. Clin Exp Dermatol 25:459–63.
Matano F, Yoshida D, Ishii Y, Tahara S, Teramoto A, Morita A. 2014. Endocan, a new invasion and
angiogenesis marker of pituitary adenomas. J Neurooncol 117:485–491.
Meeran SM, Singh T, Nagy TR, Katiyar SK. 2009. High-fat diet exacerbates inflammation and cell
survival signals in the skin of ultraviolet B-irradiated C57BL/6 mice. Toxicol Appl Pharmacol 241:303–
310.
Mendonça F, Soares R. 2015. Obesity and cancer phenotype: Is angiogenesis a missed link? Life
Sci 139:16–23.
Mendonça FM, de Sousa FR, Barbosa AL, Martins SC, Araújo RL, Soares R, Abreu C. 2015.
Metabolic syndrome and risk of cancer: Which link? Metabolism 64:182–189.
Monteiro R. 2009. Chronic Inflammation in the Metabolic Syndrome: Emphasis on Adipose Tissue.
In: Soares R, Costa C, editors. Oxidative Stress, Inflammation and Angiogenesis in the Metabolic
Syndrome. Dordrecht: Springer Netherlands.
xli
Morpurgo G, Fioretti B, Catacuzzeno L. 2012. The increased incidence of malignant melanoma in
obese individuals is due to impaired melanogenesis and melanocyte DNA repair. Med Hypotheses
78:533–5.
Nagel G, Bjørge T, Stocks T, Manjer J, Hallmans G, Edlinger M, Häggström C, Engeland A,
Johansen D, Kleiner A, Selmer R, Ulmer H, Tretli S, Jonsson H, Concin H, Stattin P, Lukanova A.
2012. Metabolic risk factors and skin cancer in the Metabolic Syndrome and Cancer Project (Me-
Can). Br J Dermatol 167:59–67.
Osawa T, Muramatsu M, Watanabe M, Shibuya M. 2009. Hypoxia and low-nutrition double stress
induces aggressiveness in a murine model of melanoma. Cancer Sci 100:844–851.
Pandey V, Vijayakumar MV, Ajay AK, Malvi P, Bhat MK. 2012. Diet-induced obesity increases
melanoma progression: involvement of Cav-1 and FASN. Int J Cancer 130:497–508.
Parekh N, Chandran U, Bandera E V. 2012. Obesity in Cancer Survival. Annu Rev Nutr 32:311–342.
Pirraco A, Coelho P, Rocha A, Costa R, Vasques L, Soares R. 2010. Imatinib targets PDGF signaling
in melanoma and host smooth muscle neighboring cells. J Cell Biochem 111:433–41.
Poulos SP, Dodson M V, Hausman GJ. 2010. Cell line models for differentiation: preadipocytes and
adipocytes. Exp Biol Med (Maywood) 235:1185–1193.
xlii
Ribatti D, Nico B, Cimpean AM, Raica M, Crivellato E, Ruggieri S, Vacca A. 2013. B16-F10
melanoma cells contribute to the new formation of blood vessels in the chick embryo chorioallantoic
membrane through vasculogenic mimicry. Clin Exp Med 13:143–147.
Rubenstein AH. 2005. Obesity: a modern epidemic. Trans Am Clin Climatol Assoc 116:103–111.
Sergentanis TN, Antoniadis AG, Gogas HJ, Antonopoulos CN, Adami HO, Ekbom A, Petridou ET.
2013. Obesity and risk of malignant melanoma: A meta-analysis of cohort and case-control studies.
Eur J Cancer 49:642–657.
Taubes G. 2012. Unraveling the Obesity-Cancer Connection. Science 335:28–32.
Thiery JP. 2002. Epithelial-mesenchymal transitions in tumour progression. Nat Rev Cancer 2:442–
454.
Thies A, Mangold U, Moll I, Schumacher U. 2001. PAS-positive loops and networks as a prognostic
indicator in cutaneous malignant melanoma. J Pathol 195:537–542.
Tuong W, Cheng LS, Armstrong AW. 2012. Melanoma: Epidemiology, Diagnosis, Treatment, and
Outcomes. Dermatol Clin 30:113–124.
Van der Schaft DWJ, Seftor REB, Seftor E a, Hess AR, Gruman LM, Kirschmann D a, Yokoyama Y,
Griffioen AW, Hendrix MJC. 2004. Effects of angiogenesis inhibitors on vascular network formation
by human endothelial and melanoma cells. J Natl Cancer Inst 96:1473–7.
xliii
Vucenik I, Stains JP. 2012. Obesity and cancer risk: Evidence, mechanisms, and recommendations.
Ann N Y Acad Sci 1271:37–43.
Wagner M, Bjerkvig R, Wiig H, Melero-Martin JM, Lin R-Z, Klagsbrun M, Dudley AC. 2012. Inflamed
tumor-associated adipose tissue is a depot for macrophages that stimulate tumor growth and
angiogenesis. Angiogenesis 15:481–95.
Zhao W, Liu H, Xu S, Entschladen F, Niggemann B, Zänker KS, Han R. 2001. Migration and
metalloproteinases determine the invasive potential of mouse melanoma cells, but not melanin and
telomerase. Cancer Lett 162:49–55.
Figure Legends
Figure 1. 3T3-L1 secretome increases melanoma cell survival. B16 cells were incubated with CM
from differentiated 3T3-L1 cells cultures (3T3-L1 CM) or untreated (Control) for 24h. A) An increase
in the percentage of viable melanoma cells was observed when compared with control. Results
represent the percentage of viable cells normalized by the absorbance of control. B) The number of
proliferating cells, incorporating BrdU, increased in the presence 3T3-L1 CM. Results represent the
percentage of proliferating cells normalized over the absorbance of control. C) A significant decrease
in the percentage of apoptotic cells was observed when melanocytes were treated with 3T3-L1 CM.
Results represent the percentage of apoptotic cells evaluated by the ratios of TUNEL-positive cells
xliv
versus total DAPI-counterstained nuclei. D) The melanin content per cell was significantly decreased
when melanocytes were cultured in presence of 3T3-L1 CM. Melanin concentration was calculated
by determination of OD 475. Results represent the absorbance of 1x10⁶ cells. (*p <0.05 vs. Control;
n=9)
Figure 2: Secretion profiles of 3T3-L1 cells and subcutaneous and visceral AT organ cultures. A)
Both SAT and VAT CM exhibit greater levels of VEGF and endocan with a concomitant reduction in
the expression of TIMP-1. B) Distinct relative levels of IL6, IL11 and LIF were found among SAT and
VAT CM C) Adipokines leptin and resistin are overexpressed in all CM, whereas diponectin levels
are significantly reduced D) Numerous cellular growth factors were present at considerably higher
concentrations in both VAT and SAT CM (*p<0.05 vs Control; #p<0.05 SAT CM vs VAT CM; n=2)
Figure 3. In vitro motility, migration and spreading analysis of B16 melanocytes. A) A rapid B16 cell
migration was observed after incubation with 3T3-L1 CM in comparison to untreated (Control) for
24h. Cell cultures were visualized under an inverted microscope at a 200x magnification. B) When
exposed to 3T3-L1 CM, melanocytes rapidly occupied the injury-created void area. The wound
closure was determined by measuring cultures void area and by subtracting it from the initial area of
the wound. Bars show the means values (±SEM) of nine measurements for each time point/condition
C) The effects of AT secretome on cell migration were quantified in a double-chamber assay using
FBS as a chemoattractant. The number of cells that invaded the membrane was significantly higher
when treated with 3T3-L1, and particularly with SAT and VAT CM. Mean values (±SEM) of three

xlv
independent measurements are shown (*p<0.05 vs Control; #p<0.05 SAT CM vs VAT CM; n=3). D)
B16 cells were allowed to adhere and spread for 3 hours in the standard treatments. Representative
images of crystal-violet stained melanoma cells are shown (200X). E) Morphologic analysis of B16
cells revealed that VAT and 3T3-L1 CM significantly enhanced cell spreading. Bars are the means
values ± SEM, represented as percentage of Control, of 1000 evaluated cells (*p<0.05 vs Control;
n=9)
Figure 4. Melanoma cells adhesion and anchorage-independent growth were increased after
incubation with AT CM. (A) Adhesion to culture plates for 30 min; (B) Adhesion to HMEC-1
monolayers for 30 min. VAT-released factors were prominent in enhancing melanocytes adhesive
potential both to culture plates and endothelial cells. Results are expressed as percentage of Control
(±SEM). C) Representative images (800X) of Giemsa stained slides showing B16 cells (dark blue)
adherent to HMEC-1 monolayers (pink). (D) Evaluation of anchorage-independent proliferation of
B16 melanocytes was conducted by soft-agar colony formation assay. (E) The number of colonies
formed was significantly higher in both 3T3-L1 and SAT CM treatments but not in VAT CM.(F) Mean
B16 colony area was significantly increased after 3T3-L1 CM incubation, but not after VAT or SAT
CM treatment. Bars represent means±SEM (*p<0.05 vs Control; #p<0.05 SAT CM vs VAT CM; n=3-
9).
Figure 5. Vasculogenic mimicry by melanoma cells was stimulated by AT CM. (A) B16 and MeWo
cells were cultured on top of Matrigel layers. Upon treatment with 3T3-L1 CM, melanocytes acquired
xlvi
a vessel-like tubular phenotype. Images were captured under an inverted microscope (200x) at 12
and 24 hours post treatment. (B) Microscopic examination of B16 and MeWo spheroids in hanging-
drop cultures. The presence of 3T3-L1 secreted factors inhibited the formation of a compact spheroid
cellular mass. Shown are representative light-microscopy photographs (80x) of the spheroids.
xlvii
IV. Publication II
Adipocyte secretome influences inflammatory and angiogenic pathways in glioma
Almeida J1,2,*, Costa J1,*, Coelho P1,2, Cea V3, Galesio M4, Noronha JP4, Diniz MS4, Prudêncio C1,2,
Soares R2,5, Sala C3, Fernandes R1,2,#
1- CISA, Centre for Environmental and Health Research, School of Health, Polytechnic of Porto
2- i3S, Instituto de Investigação e Inovação em Saúde, University of Porto
3- CNR Institute of Neuroscience and Department of Biotechnology and Translational Medicine,
University of Milan, Milan, Italy
4- REQUIMTE, Department of Chemistry, Faculty of Sciences and Technology, Centre for Fine
Chemistry and Biotechnology, NOVA University
5- Department of Biomedicine, Unit of Biochemistry, Faculty of Medicine, University of Porto
* equal contribution of both authors
xlviii
#Corresponding author:
Rúben Fernandes, PhD
Key words:
Adipo-proteomics, 2D-PAGE-MALDI-TOF, Glioma, Obesity
xlix
Abstract
Aims: Gliomas represent the most common primary malignant brain tumors in adults, with an
extremely poor prognosis. Despite its high morbidity, the etiology of glioma remains largely unknown.
Excess adiposity is related with increased incidence and/or death rates from a wide variety of human
cancers. Among several risk factors, lifestyle was also recently identified as a major risk factor for
the development of primary glioma. So, there might be a relationship between the increased
incidence of gliomas and dysfunction of adipose tissue. In the present study, we explore this
relationship between the influence of adipocytes secretome on glioma cell line GL261.
Methods: Using the 3T3-L1 adipocyte cell line, and its conditioned medium (adipokines-enriched
medium), we showed that adipocyte-released factors relate with glioma angiogenic, growth,
hormones and metabolic behavior by MALDI-TOF-MS and proteomic array analysis.
Results: In a first view, STI1, hnRNPs and PGK1 are underexpressed on CGl. Similarly, both
carbonic anhydrase and aldose reductase are even suppressed in glioma cells that grown under
adipokines-enriched environment. Contrariwise, RFC1, KIF5C, ANXA2, N-RAP and RACK1 are
overexpressed in GL261 cell the in the presence of the adipokines-enriched medium. We further
identified the factors that are released by adipocyte cells, and revealed that several pro-inflammatory
and angiogenic factors, such as IL6, IL11, LIF, PAI-1, TNF-α, endocan, HGF, VEGF IGF-I, were
secreted to the medium into a high extent, whereas TIMP-1 and SerpinE1 were underexpressed on
CGl.

l
Conclusions: This study discloses an interesting in vitro model for the study of glioma biology under
a “obesity” environment, that can be explored for the understanding of cancer cells biology, for the
search of biomarkers, prognostic markers and therapeutic approaches.
li
Introduction
Gliomas, a wide term which comprises all tumors arising from the supportive tissue of the brain,
represent 30% of all brain tumors and 80% of all malignant brain tumors. They are the most common
primary malignant brain tumors in adults 1,2. Prognosis is extremely poor, with a median survival
time of approximately 12 to 15 months and is almost invariably fatal 3. This tumor represents about
12-15% of all primary brain tumors and about 60-75% of all astrocytomas. Gliomas increase in
frequency with age, and affect preferentially men 3–5. Genetic factors in glioma etiology are poorly
understood; less than 5% of glioma cases are familial in origin, with only a few described by rare
genetic syndromes 6. Gliomas are heterogeneous and are typically classified according to World
Health Organization tumor grade, and also classified on the basis of cellular lineage: astrocytic,
oligodendroglial, and mixed tumors 7.
In 2001, different studies from the International Agency for Research into Cancer (IARC) and the
World Cancer Research Fund (WCRF) have reported a relationship and established a link between
obesity and cancer risk 8,9. Excess adiposity is related with an increase the incidence and/or death
rates from a wide variety of human cancers, being the most common colon, rectum, esophagus,
kidney, pancreas, gallbladder, ovary, cervix, liver, prostate and certain hematopoietic cancers 8–12.
Overweight and obesity are important risk factors for developing cancer and also for cancer related
mortality 13,14. It is important to understand the pathophysiological mechanisms involved in the link
lii
between obesity and cancer, in order to target future preventive and therapeutic strategies for cancer
in obese people 13.
Despite its high morbidity, the etiology of glioma remains largely unknown. Among several risk
factors, lifestyle was also recently identified as a major risk factor for the development of primary
glioma 15. Consequently, there might be a relationship between the increase and dysfunction of
adipose tissue. Obesity, favored by the modern lifestyle, acquired epidemic proportions nowadays,
and accelerated weight gain, in adults, is associated with increasing incidence of all central nervous
system tumors, mostly glioma 16. At the present time, it is not clear which factors might be involved
in this relation. Some studies analysed body weight in relation to survival in glioma demonstrating
higher death rates in patients with an excess body weight 17. Obesity, and in particular visceral
obesity, plays a major role in the pathogenesis of several metabolic disorders 18. Genes that influence
obesity are highly expressed in the brain and could also mediate glioma susceptibility 15,19.
Development of obesity is also associated with substantial modulation of adipose tissue (AT)
structure, involving adipogenesis, angiogenesis, and extracellular matrix remodeling 20. Thus, AT can
trigger blood vessel formation, and in turn AT endothelial cells promote pre-adipocyte differentiation.
Angiogenesis, the physiological process involving the growth of new blood vessels from existing
vasculature, plays a central role in growth and development of both normal and malignant tissues
21,22. Angiogenesis is required for AT expansion, as well as for cancer progression and metastization
liii
21,23. Anti-angiogenic therapy has been a widely used strategy to fight tumor growth, and recently has
also been acknowledged as a potential therapeutic intervention for obesity 23,24.
Furthermore, and concerning lipid diet content, evidence demonstrates that lipid metabolism is
dysregulated in obesity and there might be a common pathway between excess nutrients and
inflammation to increased metabolic risk 16,25. Increase in lipolysis in AT leads to elevation in free
fatty acids (FFA) in plasma and contribute to fat deposition in liver and skeletal muscle, which may
promote systemic insulin resistance through several mechanisms, such as induction of oxidative
stress through incomplete oxidation and inflammatory responses. However, the cause of the
adipocyte malfunction remains to be identified in obesity25.
AT is also recognized by its endocrine function as producer of biological mediators13,14. There are
several cytokines regarding cell proliferation, angiogenesis, cytoskeletal rearrangement and survival.
Some receptors and signaling pathways associated have revealed to stimulate growth and
invasiveness capacity of glioma cells, whereas others have been correlated to glioma cell
proliferation blockage 8,13,16. The mechanisms underlying the associations betwwen energy balance
and cancer risk should be clarified.
The present study aims to develop an in vitro rodent model for the study of the influence of obesity
role in glioma. We propose a model in which GL261 cells, a mouse glioma cell line, is cultured in the
presence or absence of 3T3-L1 mature adipocytes conditioned medium. The 3T3-L1 pre-adipocytes
were differentiated under controlled experiments and the adypokines and inflammation chemokines

liv
pattern expression were examined by proteome microarrays in the mature adipocytes conditioned
medium were grown.

lv
Materials and Methods
The protein expression was accessed by means of bidimensional polyacrylamide gel electrophoresis under
denatured conditions (2D-PAGE) followed by mass spectrometry analysis of the interest spot. The spots were
analysed by matrix assisted laser desorption ionization time-of-flight/mass spectrometry (MALDI-TOF-MS). The
non-conditioned glioma cells served as the control group for the conditioned glioma cells. We have used the
mature adipocytes secreted adipokines (secretome) and enriched the GL261 medium, followed by analysis of
the proteins on GL261 on a 2-dimensional proteomic gel approach, so different spots could be studied by means
of mass spectroscopy.
Chemicals
The reagents acetonitrile, iodoacetamide (IAA), dl-dithiothreitol (DTT) (99% w/w) and trypsin from porcine
pancreas (proteomics grade) were purchased from Sigma (Steinheim, Germany). Formic acid puriss for mass
spectrometry (≥98%), ammonium bicarbonate (>99.5% w/w) and the matrix assisted laser desorption ionization
MALDI matrix α-Cyano-4-hydroxycinnamic acid (α-CHCA) puriss for MALDI-MS were from Fluka (Buchs,
Switzerland). Trifluoroacetic acid (TFA, 99% v/v) was from Riedel-de-Haën (Seelze, Germany). ProteoMass
Peptide MALDI-MS Calibration Kit (MSCAL2) from Sigma was used as mass calibration standard for MALDI-
TOF-MS.
Cell culture
For the current work 3T3-L1 (purchased from American Type Culture Collection) and GL-261 (gently given by
Prof. Pedroso Lima, CNC, Coimbra, Portugal) mouse cell lines were used. 3T3-L1 and GL-261 cells were

lvi
cultured in DMEM (Dulbecco´s Modified Eagle´s Medium with 4.5g/L Glucose & L-Glutamine, without Sodium
Pyruvate. Santa Cruz Biotechnology, Inc.), supplemented with 10% FBS, and 1000 units/mL gentamycin
solution, maintained in T-25 tissue culture flasks in 5% CO2/95% air at 37oC in a humidified incubator.
Adipocyte differentiation and conditioned medium collection
3T3-L1 pre-adipocytes were propagated and allowed to reach confluence. After 2 days (day 0), the
differentiation was initiated by addition of a hormonal mixture composed of 2 μM insulin, 1 μM dexamethasone
and 0.25 mM isobutylmethylxanthine. Three days after (day 3), the induction medium was replaced by complete
medium supplemented with insulin only. At day 6 cultures were washed twice in phosphate buffered saline and
incubated in serum-free medium. After 24h (day 7), medium was harvested from the adipocyte’s cultures, spun
for 3000 g for 5 minutes and the supernatant (mature adipocytes conditioned medium) was stored at -80ºC for
the subsequent treatments. This conditioned medium is rich in adipokines which are globally refered as
secretome.
Afterwards, Glioma cells were divided in two distinct groups. On one hand, glioma cells GL-261 were grown
under the influence of the mature adipocytes secretome were designated conditioned glioma cells (CGl). On
the other hand, the control group consisted in the glioma cells cultured in the absence of 3T3-L1 conditioned
medium and was designated as non-conditioned glioma cells (NCGl).
Sample preparation for 2D-PAGE
Sample preparation for 2D-PAGE was performed according to published procedures with minor modifications
26. The cells were manual detached from the flask and were mechanically lysed at 4oC in lysis solution [CHAPS
lvii
4%, 5 mM Tris, pH 8.8, 0.05% protease inhibitor cocktail (Sigma)] using a glass potter, and the samples were
centrifuged at 2000 g for 15 minutes at 4oC in order to eliminate aggregates. The protein concentrations in each
sample were measured by means of a DC Bio-Rad assay. A total of 900 mg of protein from each sample was
precipitated with cold acetone and resuspended in thiourea buffer (7M urea, 2M thiourea 2% CHAPS, 2%
ASB14, 5% glycerol, 40 mM DTT, 4 mM TCEP, 1% 3–10 IPG buffer, Amersham), and the samples were mixed
overnight at 4oC in the dark and clarified by centrifugation at 16000 g for 15 minutes at 4oC. The supernatant
was first separated by isoelectric focusing over a pH range of 3–10 using precast first-dimension drystrip 3–10
NL 11 cm (Bio-Rad) following a multi-step protocol for 90,000 Vht (Protean IEF cell, Biorad). The first dimension
strip was equilibrated in 50 mM Tris, pH 8.8, 6 M urea, 30% glycerol, 2% SDS plus 16 mM DTT for 20 minutes,
and then plus 25 mM iodioacetamide for 15 minutes, and loaded on a midi format (11 cm) 9–16% acrylamide
gel to separate the proteins by molecular weight. Second-dimension runs were performed using Biorad midi
cells at 30 V 1 h, 300 V 4 h at a constant temperature of 18oC. Protein spots were revealed using home-made
blue Coomassie staining, and the gel images were acquired by means of an Image scanner at 300 DPI
resolution and analysed using Image2D Master Platinum software (both from Amersham).
At least three gels per condition were included in the analysis. Normalized spot volume values were studied
using SPSS software version 13.0 for statistical analysis (SPSS Inc.). In brief, the data for each spot match set
were analysed using a box-plot test in order to eliminate outliers, a K-S test to check normal distribution, an F
test to analyze the variance, and finally Student’s T test to compare the mean values, which were considered
significant for a P-value cut off of 0.01.
In-Gel Protein Digestion
lviii
In-gel digestion of the excised proteins with trypsin was performed according to published procedures with minor
modifications 27–29. Protein spots were destained for 10 min with a solution of acetonitrile 50% (v/v) in 25nM
NH4HCO3 and mixed vigorously using a vortex. After removal of the destaining solution, gel pieces were washed
with water for 10 min using vigorous vortexing. This step was repeated twice. Afterwards, the gel pieces were
dehydrated in acetonitrile for 10 min, which was then removed and the gel pieces were placed to dry in a vacuum
centrifuge. Reduction of protein disulfide bonds was performed with a solution 10mM of dithiotreitol (DTT) in
25mM NH4HCO3, for 15 min at 60 ºC. After cooling to room temperature for about 15 min, the DTT solution was
replaced with a solution 110mM of iodoacetamide (IAA) in 25mM NH4HCO3. Incubation with the alkylation agent
was performed for 35 min at room temperature in the dark. After reduction and alkylation steps, the gel pieces
were submitted once more to the washing and dehydration procedure with water and acetonitrile, in the same
way as described above. Subsequently, the gel pieces were completely dried in a vacuum centrifuge. The dried
protein spots were incubated with a solution of trypsin 25 ng/µL in 12.5 mM NH4HCO3 in an ice bath for 30 min
to rehydrate the gel and to allow enzyme penetration into it. In-gel protein digestion was performed at 37ºC
overnight. After collecting the supernatant to clean vials, further peptide extraction was performed by addiction
of a solution of trifluoroacetic acid 0.1% (v/v) in acetonitrile 50% (v/v) to the gel pieces and incubation at room
temperature with shaking for 10 min. This step was repeated twice. All extracts were pooled and evaporated to
dryness. The samples were re-suspended with 10 µL of trifluoroacetic acid 0.1% (v/v).
MALDI-TOF-MS analysis
Prior to MALDI analysis, the sample was mixed with an equal volume of the MALDI matrix solution, 10 mg/ml
α–CHCA in trifluoroacetic acid 0.1% (v/v) and acetonitrile 50% (v/v). An aliquot of the sample/matrix solution
lix
(0.5 µL) was hand-spotted onto the MALDI sample plate and the sample was allowed to dry. The mass
spectrometric analyses were performed using the Applied Biosystems MALDI-TOF-MS system model Voyager-
DE PRO Biospectrometry Workstation equipped with a nitrogen laser radiating at 337 nm (Applied Biosystems,
Foster City, USA) and the laser intensity was set just above the threshold for ion production. MALDI mass
spectra were acquired in positive ion reflectron mode, with an accelerating voltage of 20 kV, a grid voltage of
15 kV, 0.4 V of guide wire and an ion extraction delay of 100 ns. The MS spectra for each sample were based
on the average of 700 laser shots per spot with an acquisition rate of 2 ns. MS acquisition data was calibrated
externally using the ProteoMass Peptide MALDI-MS Calibration Kit.
Data analysis and database searching
All data was processed using DataExplorer 4.5 software from Applied Biosystems. Peptide Mass Fingerprint
(PMF) data was used to search for candidate proteins using the MASCOT database search
(http://www.matrixscience.com) engine. SwissProt database was selected by default for all Mascot searches.
NCBInr database was used each time no significant identification was obtained with SwissProt. Database
searches were, by default, performed with no taxonomy restriction and allowing up to a maximum peptide mass
tolerance of 100 ppm. The number of allowed missed cleavages for trypsin was set to one.
Carbamidomethylation of cysteine and methionine oxidation were selected as fixed and variable modifications,
respectively. In order to provide accurate results, protein identification was considered positive for MASCOT
protein scores higher than 77 (p<0.01) that present a minimum of 4 peptides matching.
Proteome Profiler™ Array Assay
lx
Determination of relative levels of pre-selected mouse adipokines in conditioned and non-conditioned GL261
cell cultures was performed by using Mouse Adipokine Array Kit (R&D Systems Europe, UK). Cells were rinsed
with PBS before Lysis Buffer solubilization at, approximately, 1 x 10⁷ cells/mL. Then, they were ressuspended
and rocked at 4°C for 30 minutes, following a microcentrifugation at 14,000 x g for 5 minutes. After supernatant
transfer into a clean test tube, proteins were quantified a total protein assay. Array Procedure was performed
according to manufacture instructions (Catalogue Number ARY024). Data analysis was based on pixel densities
on developed X-ray film collected and analysed using Gel-Doc XR (Bio-Rad© Laboratories), acquired by Image
Lab Software 5.2.1 (Bio-Rad© Laboratories) then quantified by ImageJ 1.49 (NIH, USA).
Statistical analysis
The differences in expression of proteins between glioma medium and CGl by Proteome Profile Microarray were
analysed by 2-way ANOVA for multiple comparisons with Prism Graphpad. P-values of <0.05 were considered
statistically significant. MALDI-TOF-MS was conducted by T-test at P-value cut off of 0.1 using default
parameters with Prism Graphpad.
Results and Discussion
In order to understand which adipocyte secreted proteins potentially influenced glioma tumor behavior, we
analysed the protein expression of glioma cells conditioned medium obtained from adipocytes cultures, by
means of bidimensional polyacrylamide gel electrophoresis under denatured conditions (2D-PAGE) followed by
mass spectrometry analysis of the selected spots. These spots were analysed by matrix assisted laser
lxi
desorption ionization time-of-flight/mass spectrometry (MALDI-TOF-MS). The non-conditioned glioma cells
(NCGl) were used as the control group for the conditioned glioma cells (CGl).
Differentially Expressed Proteins
Eleven differentially expressed spots were identified among the 1192 matched protein spots. Its detailed
information is presented in Table 1.
The 5 over-expressed proteins found on the CG1 cells. RFC1 corresponds to spot-1 with 9.38 isoelectric point,
126705 relative molecular mass and presenting a 2.32 ratio. KIF5C corresponds to spot-2, with 5.86 isoelectric
point, 109777 relative molecular mass and 2.91 ratio. ANXA2 corresponds to a spot-3 protein spot, with 7.55
isoelectric point, 38937 relative molecular mass and 2.23 ratio. NRAP, corresponds to spot-4, with 9.34
isoelectric point, 196716 relative molecular mass and 2.82 ratio. RACK 1, corresponds to spot-5, with 7.60
isoelectric point, 35511 relative molecular mass and 2.07 ratio (Table 1). The 3 spots significantly under-
expressed in CGl corresponding to 3 proteins identified as follows: STI1, corresponds to spot-6 and it presents
a 6.4 isoelectric point, 63170 relative molecular mass and 0.33 ratio; hnRNP L, corresponds to spot-7 spot, with
8.33 isoelectric point, 64550 relative molecular mass and 0.66 ratio; PGK1, corresponding to spot-8, with 8.02
isoelectric point, 44921 relative molecular mass and 0.4 ratio.
Only 2 spots were present in NCGl control group were aldose reductase, corresponds to spot-9, with 6.71
isoelectric point, 36052 relative molecular mass, and carbonic anhydrase, corresponds to spot-10, with 6.45
isoelectric point, 30124 relative molecular mass.
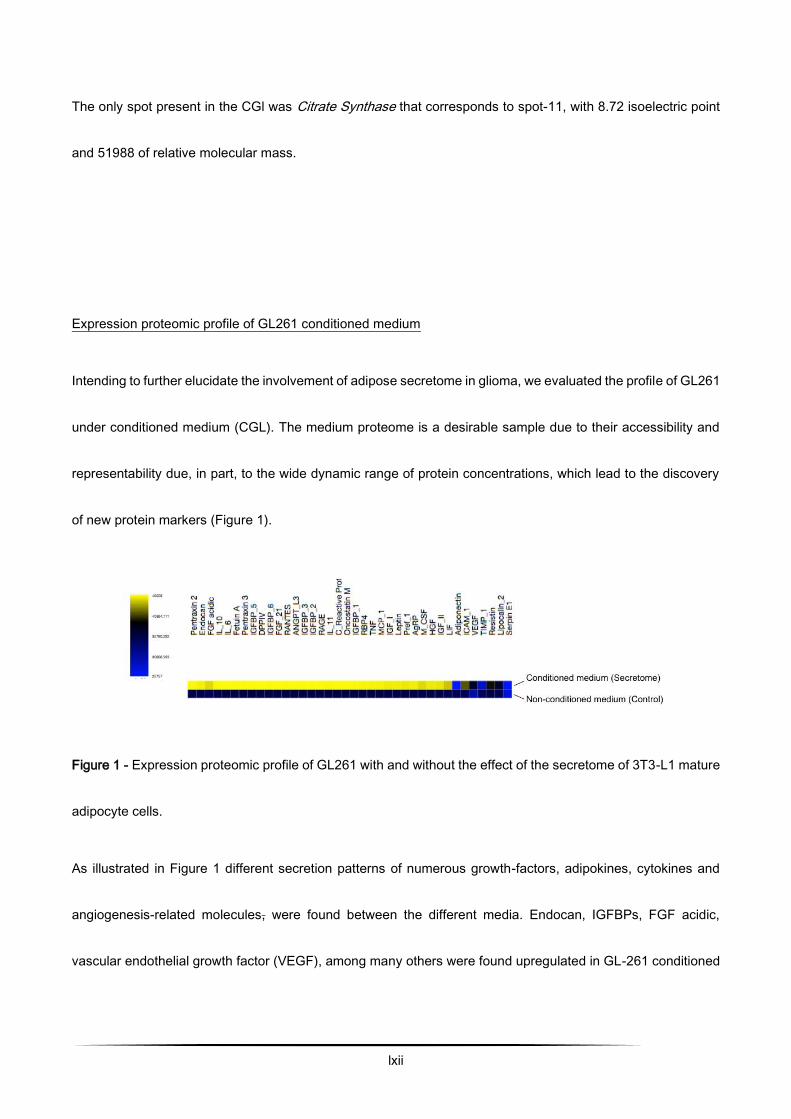
lxii
The only spot present in the CGl was Citrate Synthase that corresponds to spot-11, with 8.72 isoelectric point
and 51988 of relative molecular mass.
Expression proteomic profile of GL261 conditioned medium
Intending to further elucidate the involvement of adipose secretome in glioma, we evaluated the profile of GL261
under conditioned medium (CGL). The medium proteome is a desirable sample due to their accessibility and
representability due, in part, to the wide dynamic range of protein concentrations, which lead to the discovery
of new protein markers (Figure 1).
Figure 1 - Expression proteomic profile of GL261 with and without the effect of the secretome of 3T3-L1 mature
adipocyte cells.
As illustrated in Figure 1 different secretion patterns of numerous growth-factors, adipokines, cytokines and
angiogenesis-related molecules, were found between the different media. Endocan, IGFBPs, FGF acidic,
vascular endothelial growth factor (VEGF), among many others were found upregulated in GL-261 conditioned
lxiii
medium. Nevertheless, a significant reduction in adiponectin, serpin E1 and TIMP-1 levels were observed in
CGl (p≤ 0.01).
Conclusion
Adipose tissue is defined as a lipid store depot, inflammatory and endocrine organ 49. Thus, it provides a chronic
low grade inflammatory condition potentiated by the presence of multiple cytokines and hormones, sometimes
associated with disease. Most part of these factors are known to play a role in cell proliferation, apoptosis,
migration and invasiveness, as well as adhesion capacity, becoming expected to be overexpressed in
conditioned medium. Recent findings point that inflammatory, angiogenic or metabolic factors, significantly
influence tumor behavior 50,51. Taking into account in one hand the morbidity and the mortality associated to
gliomas and on the other hand the increased prevalence of obesity and its possible role in cancer, studies that
elucidate this relationship are of paramount importance in order to identify new glioma biomarkers, to grade
specific protein signatures to provide treatment efficacy, and to identify novel effective drug targets against
malignant glioma 52.
In the current study we analysed the proteome profile of a cellular model of brain cancer GL261 under the
presence of adipocyte secretome. Our general results suggest an increase of viability, metabolic fitness,
proliferation of tumor cell and reduced apoptosis. However, we are going to approach it by focusing on their
relationship within inflammation and angiogenesis.

lxiv
The proteomic analysis has allowed the identification of eleven well differentiated proteins that are secreted by
3T3-L1 adipocytes with a potential role in cancer biology. So we can see in table 1, it shows that we have over,
under and partially (only in one condition) expressed proteins.
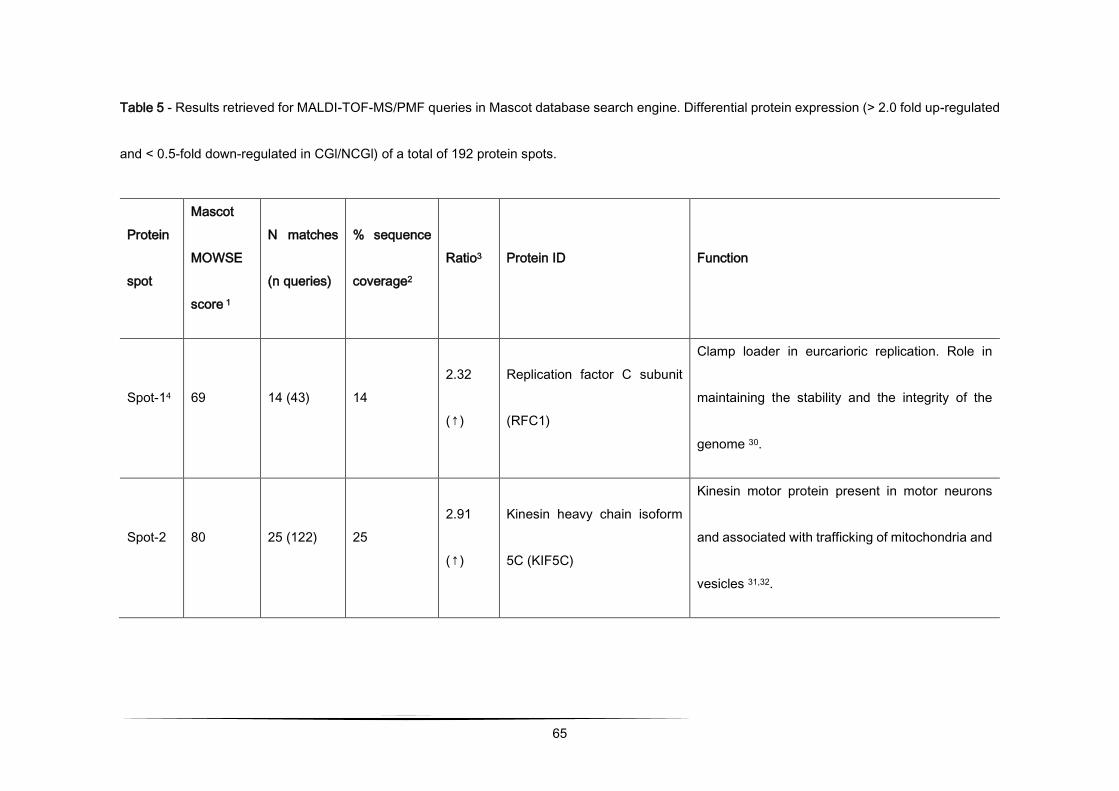
65
Table 5 - Results retrieved for MALDI-TOF-MS/PMF queries in Mascot database search engine. Differential protein expression (> 2.0 fold up-regulated
and < 0.5-fold down-regulated in CGl/NCGl) of a total of 192 protein spots.
Protein
spot
Mascot
MOWSE
score 1
N matches
(n queries)
% sequence
coverage2
Ratio3 Protein ID Function
Spot-14 69 14 (43) 14
2.32
(↑)
Replication factor C subunit
(RFC1)
Clamp loader in eurcarioric replication. Role in
maintaining the stability and the integrity of the
genome 30.
Spot-2 80 25 (122) 25
2.91
(↑)
Kinesin heavy chain isoform
5C (KIF5C)
Kinesin motor protein present in motor neurons
and associated with trafficking of mitochondria and
vesicles 31,32.
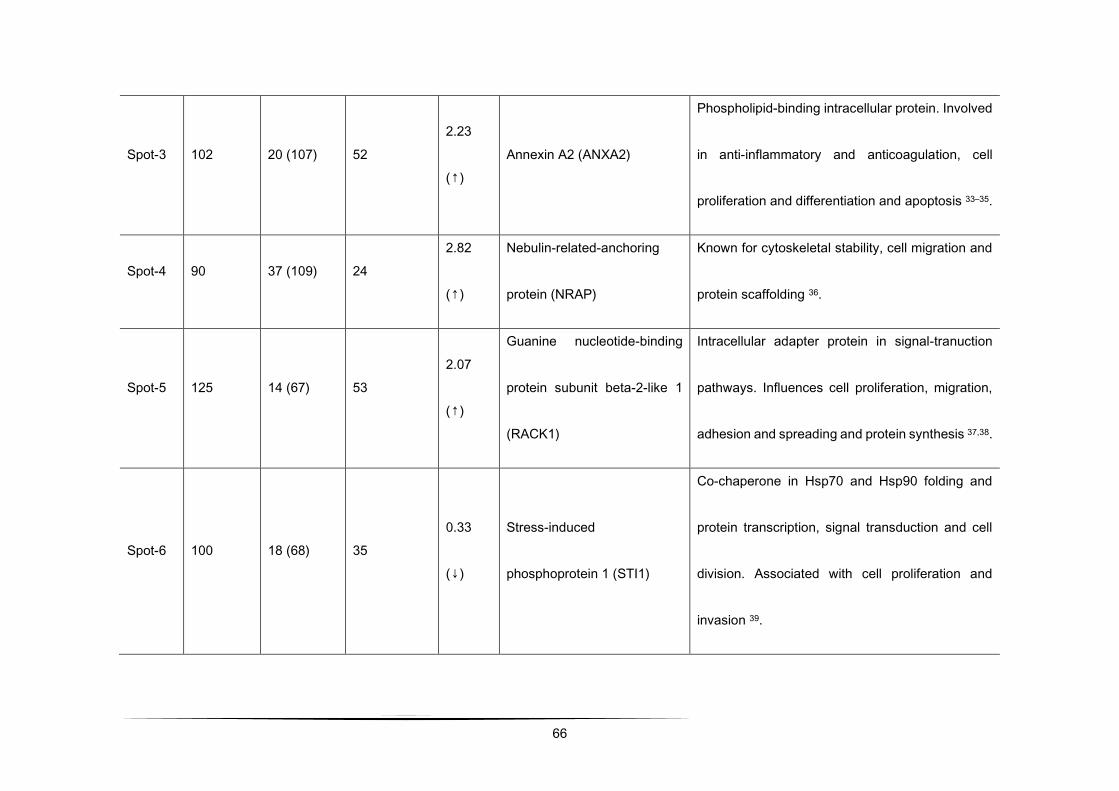
66
Spot-3 102 20 (107) 52
2.23
(↑)
Annexin A2 (ANXA2)
Phospholipid-binding intracellular protein. Involved
in anti-inflammatory and anticoagulation, cell
proliferation and differentiation and apoptosis 33–35.
Spot-4 90 37 (109) 24
2.82
(↑)
Nebulin-related-anchoring
protein (NRAP)
Known for cytoskeletal stability, cell migration and
protein scaffolding 36.
Spot-5 125 14 (67) 53
2.07
(↑)
Guanine nucleotide-binding
protein subunit beta-2-like 1
(RACK1)
Intracellular adapter protein in signal-tranuction
pathways. Influences cell proliferation, migration,
adhesion and spreading and protein synthesis 37,38.
Spot-6 100 18 (68) 35
0.33
(↓)
Stress-induced
phosphoprotein 1 (STI1)
Co-chaperone in Hsp70 and Hsp90 folding and
protein transcription, signal transduction and cell
division. Associated with cell proliferation and
invasion 39.
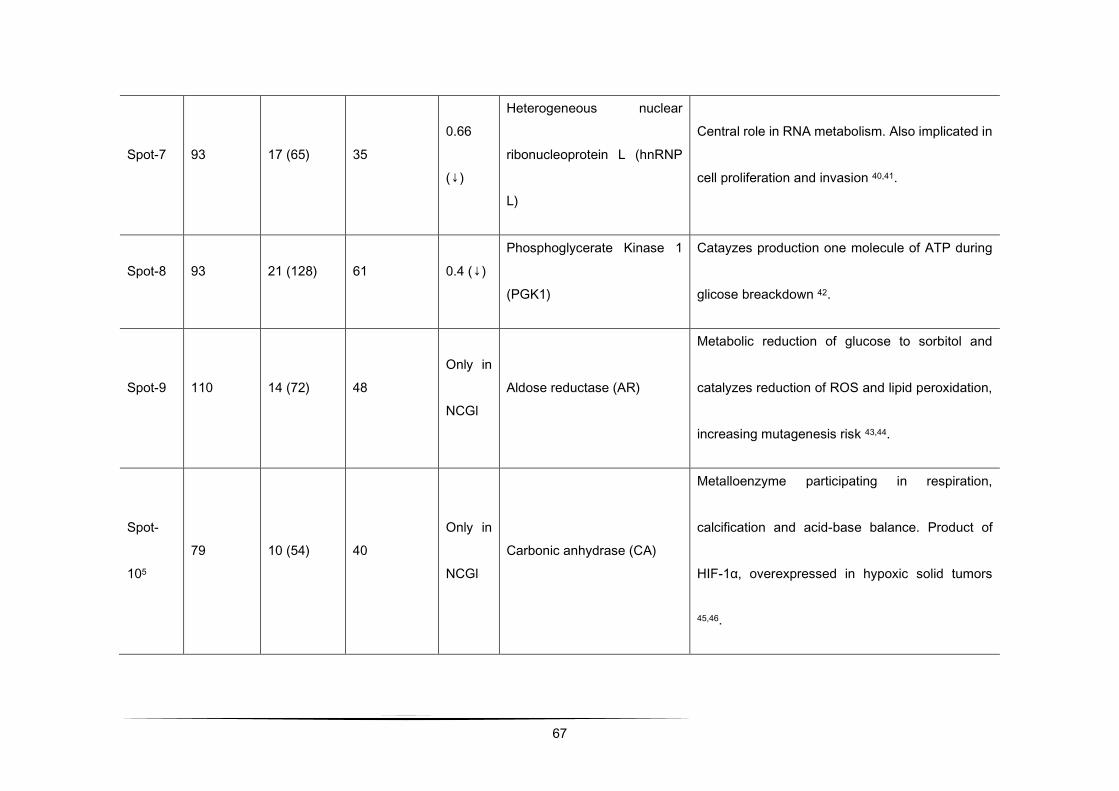
67
Spot-7 93 17 (65) 35
0.66
(↓)
Heterogeneous nuclear
ribonucleoprotein L (hnRNP
L)
Central role in RNA metabolism. Also implicated in
cell proliferation and invasion 40,41.
Spot-8 93 21 (128) 61 0.4 (↓)
Phosphoglycerate Kinase 1
(PGK1)
Catayzes production one molecule of ATP during
glicose breackdown 42.
Spot-9 110 14 (72) 48
Only in
NCGl
Aldose reductase (AR)
Metabolic reduction of glucose to sorbitol and
catalyzes reduction of ROS and lipid peroxidation,
increasing mutagenesis risk 43,44.
Spot-
105
79 10 (54) 40
Only in
NCGl
Carbonic anhydrase (CA)
Metalloenzyme participating in respiration,
calcification and acid-base balance. Product of
HIF-1α, overexpressed in hypoxic solid tumors
45,46.
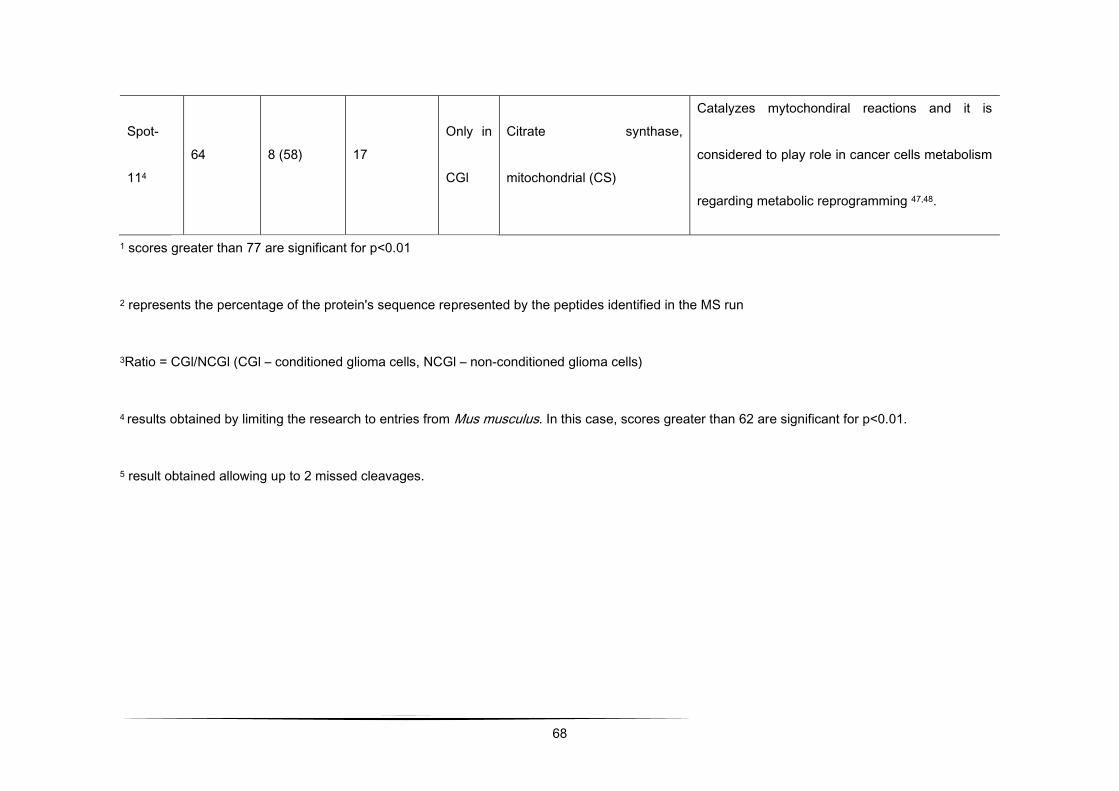
68
Spot-
114
64 8 (58) 17
Only in
CGl
Citrate synthase,
mitochondrial (CS)
Catalyzes mytochondiral reactions and it is
considered to play role in cancer cells metabolism
regarding metabolic reprogramming 47,48.
1 scores greater than 77 are significant for p<0.01
2 represents the percentage of the protein's sequence represented by the peptides identified in the MS run
3Ratio = CGl/NCGl (CGl – conditioned glioma cells, NCGl – non-conditioned glioma cells)
4 results obtained by limiting the research to entries from Mus musculus. In this case, scores greater than 62 are significant for p<0.01.
5 result obtained allowing up to 2 missed cleavages.
lxix
Our findings revealed lower expression of STI1, hnRNP L and PGK1 when glioma cells were exposed
to mature adipocytes conditioned medium. Regarding multiple effects of STI1, hnRNPs and PGK1
this under expression might reflect that the adipokines secreted by mature adipocytes might be able
to stop some important pathways in carcinogenesis, complemented with remodeling the oxidative
metabolism toward the utilization of fatty acids substrates instead of glucose. This interpretation may
be further supported by the increased expression of mitochondrial citrate synthase. Also, proteome
array profiling reveals under expression of TIMP-1, an inhibitor of ECM degradation, Serpin E1 and
adiponectin significant downregulation in conditioned medium, supporting adipokine results of
carcinogenesis development by adipocytes.
Additionally, data revealed that aldose reductase and carbonic anhydrase were present only in
glioma cells and that their expression was completely blocked when glioma cells were exposed to
mature adipocytes conditioned medium. Our findings suggested that this blockage may reflect a total
inhibition of aldose reductase and carbonic anhydrase, possibly associated to oxidative stress
response prevention, inhibition of inflammation and cancer proliferation, angiogenesis and
carcinogenesis, which may suggest some kind of protective mechanism related to obesity.
Considering overexpressed proteins in conditioned medium, RFC1, KIF5C, ANXA2, NRAP, RACK1
results were supported by overexpression of almost all the proteins profiled by arrays, comprising
angiogenesis, growth, metabolic and hormonal functions. Our analysis revealed that ANXA2
expression (2.23 fold) was more pronounced when glioma cells were exposed to CGl. This finding is
lxx
in agreement with previous studies that also revealed that ANXA2 is elevated in glioma, in which it
plays a central role in cell motility, migration, invasion and angiogenesis 34,33,35.
Moreover, and considering proteome array profiling, endocan, which is a proteoglycan secreted by
endothelial cells and upregulated by proangiogenic factors, appears to be overexpressed in tumour
vessels 53,54. Considering its overexpression in CGl, it may explain the involvement of adipose tissues
in tumor aggressiveness. In addition, adipose tissue contains diverse cells types including adipose
stromal cells, which produce a myriad of angiogenic factors, VEGF, HGF, FGF-2, and TGF,
contributing to the increment of released angiogenic and growth factor cytokines.
Thru microarray analysis we further identified the factors that are released by adipocyte cells, and
revealed that several pro-inflammatory factors (IL-6, IL-11, LIF, PAI-1, TNF-α), metabolic markers
(FGF-21, IGFBPs), angiogenic growth factors (endocan, HGF, VEGF IGF-I), and hormones (leptin,
resistin, RBP-4) were secreted to the medium into a high extent, whereas TIMP-1, an inhibitor of
ECM degradation, SerpinE1, wich encodes Plasminogen Activator Inhibitor 1 (PAI-1), were
underexpressed on CGl. Adiponectin, as it was expectable, was significantly downregulated in CGl
medium when compared with NCGl. Adiponectin modulates inflammatory responses, energy
expenditure in the CNS and periphery, glucose regulation and fatty acid catabolism. Its circulating
levels inversely correlate with insulin resistance, metabolic syndrome, obesity and cardiovascular
diseases. Curiously, different hormones related with insulin resistance and obesity, including TNF-α
and IL-6, downregulate adiponectin expression and secretion in fat cells in vitro 55,56. Our results on
lxxi
TNF-α (adipocytokine implicated in inflammation, apoptosis and cell survival), IL-6 (related to
proliferation in human glioblastoma cases, leading to poor prognosis) and IL-11, corroborate these
inverse relationship with adiponectin 57.
Endocan, as well as FGF-21, are extensively present along with pro-inflammatory and proangiogenic
molecules. It is associated with a vast number of pathological conditions where endothelium gets
highly vascularized cancers, making it a likely marker of the vascular growth and angiogenesis during
cancer evolution 58,59. These data support our findings in which endocan is overexpressed in CGl.
Moreover, and regarding other growth factors, FGF-21, HGF and IGFBPs, they all were
overexpressed in CGl. Hepatocyte Growth Factor (HGF), a multifunctional trophic factor activates a
tyrosine kinase signaling cascade, is elevated in obese adults and adolescents. In vitro, HGF
secretion from adipocytes of obese compared to lean individuals is greater 55,60.
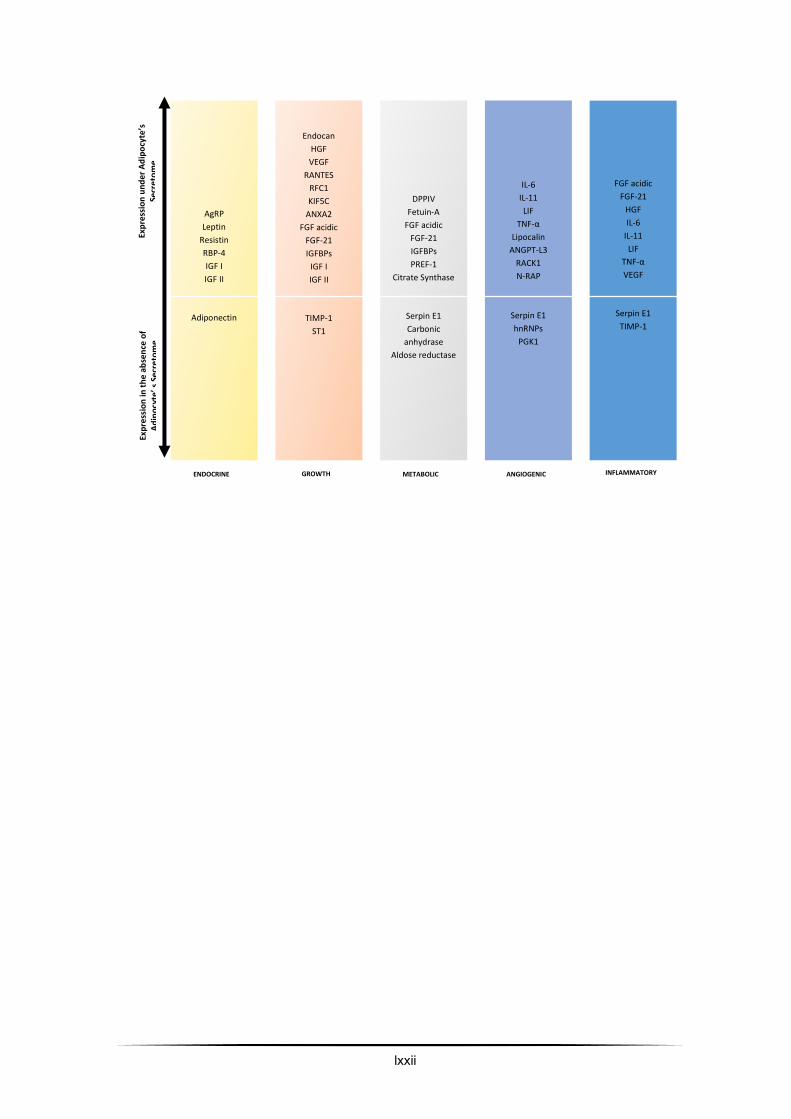
lxxii
AgRP Leptin
Resistin RBP-4 IGF I IGF II
Adiponectin
Endocan HGF VEGF
RANTES RFC1 KIF5C
ANXA2 FGF acidic
FGF-21 IGFBPs
IGF I IGF II
TIMP-1
ST1
DPPIV Fetuin-A
FGF acidic FGF-21 IGFBPs PREF-1
Citrate Synthase
Serpin E1 Carbonic
anhydrase Aldose reductase
IL-6 IL-11 LIF
TNF-α Lipocalin
ANGPT-L3 RACK1 N-RAP
Serpin E1 hnRNPs
PGK1
Exp
ress
ion
un
der
Ad
ipo
cyte’s
Se
cre
tom
e
Exp
ress
ion
in t
he
abse
nce
of
A
dip
ocy
te’ s
Sec
reto
me
ENDOCRINE GROWTH METABOLIC ANGIOGENIC INFLAMMATORY
FGF acidic FGF-21
HGF IL-6
IL-11 LIF
TNF-α VEGF
Serpin E1 TIMP-1
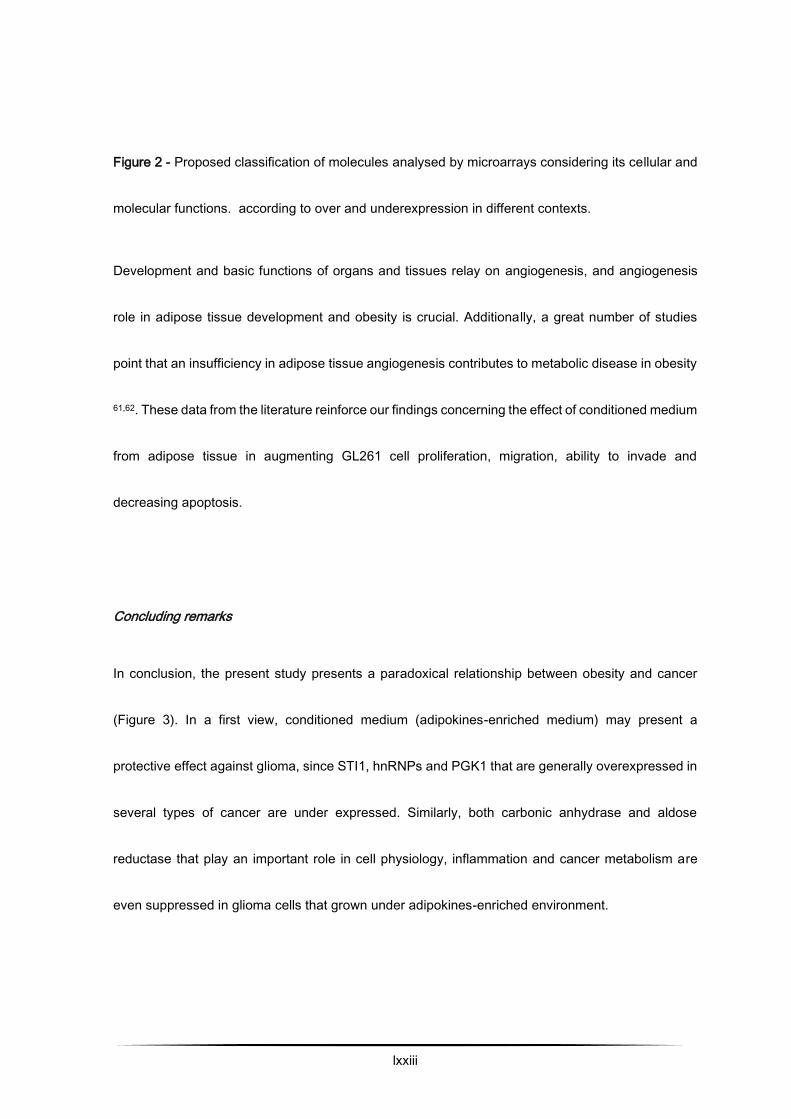
lxxiii
Figure 2 - Proposed classification of molecules analysed by microarrays considering its cellular and
molecular functions. according to over and underexpression in different contexts.
Development and basic functions of organs and tissues relay on angiogenesis, and angiogenesis
role in adipose tissue development and obesity is crucial. Additionally, a great number of studies
point that an insufficiency in adipose tissue angiogenesis contributes to metabolic disease in obesity
61,62. These data from the literature reinforce our findings concerning the effect of conditioned medium
from adipose tissue in augmenting GL261 cell proliferation, migration, ability to invade and
decreasing apoptosis.
Concluding remarks
In conclusion, the present study presents a paradoxical relationship between obesity and cancer
(Figure 3). In a first view, conditioned medium (adipokines-enriched medium) may present a
protective effect against glioma, since STI1, hnRNPs and PGK1 that are generally overexpressed in
several types of cancer are under expressed. Similarly, both carbonic anhydrase and aldose
reductase that play an important role in cell physiology, inflammation and cancer metabolism are
even suppressed in glioma cells that grown under adipokines-enriched environment.

lxxiv
Contrariwise, RFC1, KIF5C, ANXA2, N-RAP and RACK1 that are generally involved in the matrix
remodeling, proliferation, migration, invasion of cancer cells is overexpressed in GL261 cell the in
the presence of the adipokines-enriched medium. Furthermore, along with these and CG1, and as
long as we can observe on protein secretome assay, our results unfolded the damaging effects of
adipocytes secretome towards glioma aggressiveness. Also the presence of citrate synthase only in
glioma cells cultured under conditioned medium and the decreased expression of PGK1 supports
the non-tested hypothesis that under an obesity environment, glioma cells may reshuffle their
metabolic patterns towards increased lipid consumption for aerobic ATP production over glucose
and other simple sugars.
Furthermore, our MALDI-TOF and proteomic array data suggests that, on a primary phase, obesity
contributes for decreasing of the tumor initiation. Even though, as time goes by, studied growth
factors positively influence proliferation and restricted tumorigenic growth. However, as we can
observe from diminished growth and hypoxic factors, and different metalloproteases, suggesting that
previously tumor proliferation due to obesity are restricted and confined, not metastizing. Thus, our
data reinforce the idea on obesity protecting against glioma initiation and metastization (Figure 3).
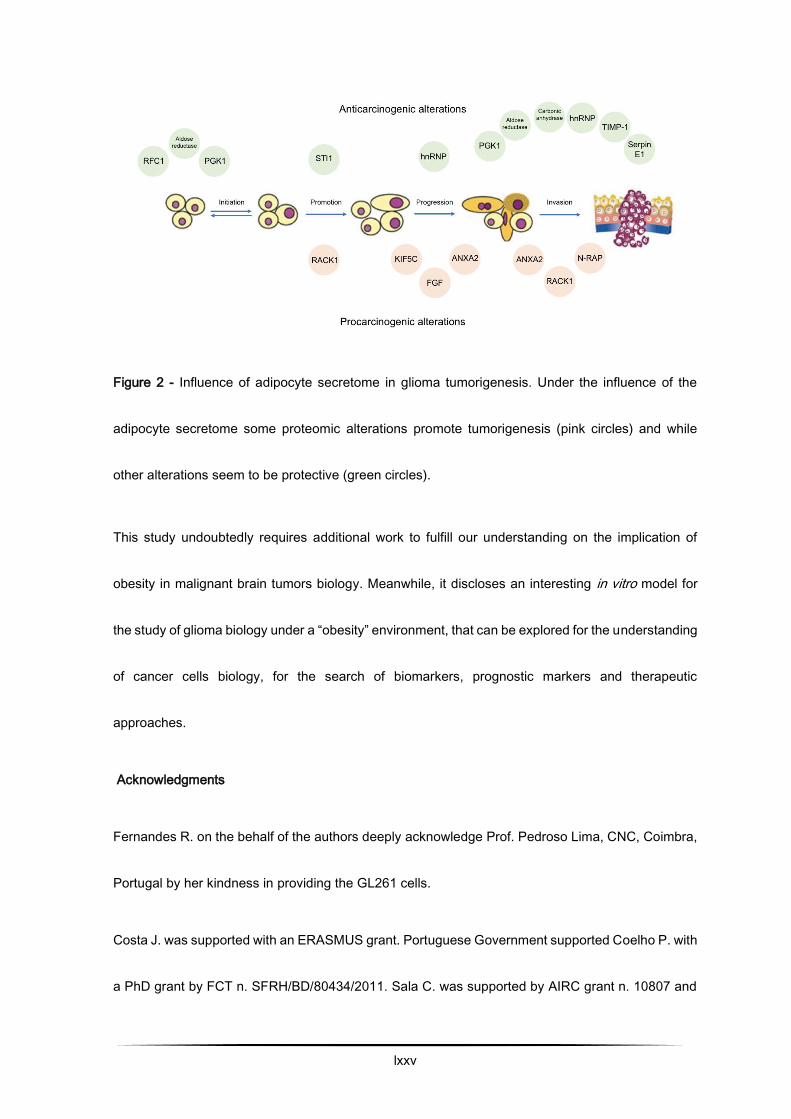
lxxv
Figure 2 - Influence of adipocyte secretome in glioma tumorigenesis. Under the influence of the
adipocyte secretome some proteomic alterations promote tumorigenesis (pink circles) and while
other alterations seem to be protective (green circles).
This study undoubtedly requires additional work to fulfill our understanding on the implication of
obesity in malignant brain tumors biology. Meanwhile, it discloses an interesting in vitro model for
the study of glioma biology under a “obesity” environment, that can be explored for the understanding
of cancer cells biology, for the search of biomarkers, prognostic markers and therapeutic
approaches.
Acknowledgments
Fernandes R. on the behalf of the authors deeply acknowledge Prof. Pedroso Lima, CNC, Coimbra,
Portugal by her kindness in providing the GL261 cells.
Costa J. was supported with an ERASMUS grant. Portuguese Government supported Coelho P. with
a PhD grant by FCT n. SFRH/BD/80434/2011. Sala C. was supported by AIRC grant n. 10807 and
lxxvi
PNR-CNR Aging Program 2012-2014. The project was partially supported by FCT (Strategic Project
Reference: UID/BIM/04293/2013).
Conflicts of interest
None to declare.
lxxvii
Bibliographic References
1. Ostrom, Q. T. et al. The epidemiology of glioma in adults: a ‘state of the science’ review.
Neuro. Oncol. 16, 896–913 (2014).
2. Parkin, D. M., Bray, F., Ferlay, J. & Pisani, P. Global cancer statistics, 2002. CA. Cancer J.
Clin. 55, 74–108
3. Patrick, W. & Kesari, S. Malignant Gliomas in Adults. N. Engl. J. Med. 359, 492–507 (2008).
4. Huse, J. T., Holland, E. & DeAngelis, L. M. Glioblastoma: Molecular Analysis and Clinical
Implications. Annu. Rev. Med. 64, 59–70 (2013).
5. Chen, J., McKay, R. M. M. & Parada, L. F. F. Malignant Glioma: Lessons from Genomics,
Mouse Models, and Stem Cells. Cell 149, 36–47 (2012).
6. Bainbridge, M. N. et al. Germline Mutations in Shelterin Complex Genes Are Associated With
Familial Glioma. JNCI J. Natl. Cancer Inst. 107, dju384-dju384 (2014).
7. Luisa, A. et al. Association between glioma susceptibility molecular etiologies. 1–6 (2012).
8. Roberts, D. L., Dive, C. & Renehan, A. G. Biological mechanisms linking obesity and cancer
risk: new perspectives. Annu. Rev. Med. 61, 301–316 (2010).
9. Khandekar, M. J., Cohen, P. & Spiegelman, B. M. Molecular mechanisms of cancer
development in obesity. Nat. Rev. Cancer 11, 886–895 (2011).
lxxviii
10. Prieto-Hontoria, P. L. et al. Role of obesity-associated dysfunctional adipose tissue in cancer:
a molecular nutrition approach. Biochim. Biophys. Acta 1807, 664–678 (2011).
11. Calle, E. E. & Thun, M. J. Obesity and Cancer. Oncogene 23, 6365–6378 (2004).
12. Pi-Sunyer, F. X. The obesity epidemic: pathophysiology and consequences of obesity. Obes.
Res. 10 Suppl 2, 97S–104S (2002).
13. van Kruijsdijk, R. C. M., van der Wall, E. & Visseren, F. L. J. Obesity and Cancer: The role
of dysfunctional adipose tissue. Cancer Epidemiol. Biomarkers Prev. 18, 2569–2578 (2009).
14. Wolin, K. Y., Carson, K. & Colditz, G. a. Obesity and Cancer. Oncologist 15, 556–565 (2010).
15. Benson, V. S., Pirie, K., Green, J., Casabonne, D. & Beral, V. Lifestyle factors and primary
glioma and meningioma tumours in the Million Women Study cohort. Br. J. Cancer 99, 185–90
(2008).
16. Young, N. & Van Brocklyn, J. R. Roles of sphingosine-1-phosphate (S1P) receptors in
malignant behavior of glioma cells. Differential effects of S1P2 on cell migration and invasiveness.
Exp. Cell Res. 313, 1615–27 (2007).
17. Siegel, E. M. et al. Prediagnostic body weight and survival in high grade glioma. J.
Neurooncol. (2013). doi:10.1007/s11060-013-1150-2
18. Calle, E. E., Thun, M. J., Petrelli, J. M., Rodriguez, C. & Heath, C. W. Body-mass index and
mortality in a prospective cohort of U.S. adults. N. Engl. J. Med. 341, 1097–105 (1999).
lxxix
19. Moore, S. C. et al. Height, Body Mass Index, and Physical Activity in Relation to Glioma Risk.
Cancer Res. 69, 8349–8355 (2009).
20. Lijnen, H. R. Angiogenesis and obesity. Cardiovasc. Res. 78, 286–93 (2008).
21. Costa, C., Soares, R. & Schmitt, F. Angiogenesis: now and then. APMIS 112, 402–12
22. Carmeliet, P. Angiogenesis in health and disease. Nat. Med. 9, 653–60 (2003).
23. Costa, C., Incio, J. & Soares, R. Angiogenesis and chronic inflammation: cause or
consequence? Angiogenesis 10, 149–66 (2007).
24. Pirraco, A. et al. Imatinib targets PDGF signaling in melanoma and host smooth muscle
neighboring cells. J. Cell. Biochem. 111, 433–41 (2010).
25. Yin, J. et al. Role of hypoxia in obesity-induced disorders of glucose and lipid metabolism in
adipose tissue. AJP Endocrinol. Metab. 296, E333–E342 (2008).
26. Verpelli, C. et al. Anti-angiogenic therapy induces integrin-linked kinase 1 up-regulation in a
mouse model of glioblastoma. PLoS One 5, 1–12 (2010).
27. Gundry, R. L. et al. Preparation of proteins and peptides for mass spectrometry analysis in
a bottom-up proteomics workflow. Curr. Protoc. Mol. Biol. Chapter 10, 10.25.1-10.25.23 (2009).
28. Shevchenko, A., Tomas, H., Havlis, J., Olsen, J. V & Mann, M. In-gel digestion for mass
spectrometric characterization of proteins and proteomes. Nat. Protoc. 1, 2856–2860 (2006).
lxxx
29. Rosenfeld, J., Capdevielle, J., Guillemot, J. C. & Ferrara, P. In-gel digestion of proteins for
internal sequence analysis after one- or two-dimensional gel electrophoresis. Anal. Biochem. 203,
173–179 (1992).
30. Aroya, S. Ben & Kupiec, M. The Elg1 replication factor C-like complex: a novel guardian of
genome stability. DNA Repair (Amst). 4, 409–17 (2005).
31. Schäfer, B., Götz, C. & Montenarh, M. The kinesin I family member KIF5C is a novel
substrate for protein kinase CK2. Biochem. Biophys. Res. Commun. 375, 179–83 (2008).
32. Dunn, S. et al. Differential trafficking of Kif5c on tyrosinated and detyrosinated microtubules
in live cells. J. Cell Sci. 121, 1085–95 (2008).
33. Zhang, X., Liu, S., Guo, C., Zong, J. & Sun, M.-Z. The association of annexin A2 and cancers.
Clin. Transl. Oncol. 14, 634–640 (2012).
34. Zhai, H. et al. Annexin A2 Promotes Glioma Cell Invasion and Tumor Progression. J.
Neurosci. 31, 14346–14360 (2011).
35. Lokman, N. a, Ween, M. P., Oehler, M. K. & Ricciardelli, C. The role of annexin A2 in
tumorigenesis and cancer progression. Cancer Microenviron. 4, 199–208 (2011).
36. Pappas, C. T., Bliss, K. T., Zieseniss, A. & Gregorio, C. C. The Nebulin family: an actin
support group. Trends Cell Biol. 21, 29–37 (2011).
lxxxi
37. Berns, H., Humar, R., Hengerer, B., Kiefer, F. N. & Battegay, E. J. RACK1 is up-regulated in
angiogenesis and human carcinomas. FASEB J. 14, 2549–58 (2000).
38. Adams, D. R., Ron, D. & Kiely, P. A. RACK1, A multifaceted scaffolding protein: Structure
and function. Cell Commun. Signal. 9, 22 (2011).
39. Tsai, C.-L. et al. Secreted stress-induced phosphoprotein 1 activates the ALK2-SMAD
signaling pathways and promotes cell proliferation of ovarian cancer cells. Cell Rep. 2, 283–293
(2012).
40. Carpenter, B. et al. The roles of heterogeneous nuclear ribonucleoproteins in tumour
development and progression. Biochim. Biophys. Acta 1765, 85–100 (2006).
41. He, Y., Brown, M. a, Rothnagel, J. a, Saunders, N. a & Smith, R. Roles of heterogeneous
nuclear ribonucleoproteins A and B in cell proliferation. J. Cell Sci. 118, 3173–3183 (2005).
42. Baboota, R. K. et al. Microarray based gene expression analysis of murine brown and
subcutaneous adipose tissue: significance with human. PLoS One 10, e0127701 (2015).
43. Manuscript, A. Targeting Aldose Reductase for the treatment of cancer. Curr Cancer Drug
Targets 11, 560–571 (2011).
44. Obrosova, I. G. et al. Effects of ‘Healthy’ Diet and Aldose Reductase Inhibition. Diabetes 56,
2598–2608 (2007).
lxxxii
45. Scozzafava, A., Supuran, C. T. & Carta, F. Antiobesity carbonic anhydrase inhibitors: a
literature and patent review. Expert Opin. Ther. Pat. 23, 725–35 (2013).
46. Supuran, C. T. Carbonic anhydrases: novel therapeutic applications for inhibitors and
activators. Nat. Rev. Drug Discov. 7, 168–81 (2008).
47. Lin, C.-C. et al. Loss of the respiratory enzyme citrate synthase directly links the Warburg
effect to tumor malignancy. Sci. Rep. 2, 785 (2012).
48. Schlichtholz, B. et al. Enhanced citrate synthase activity in human pancreatic cancer.
Pancreas 30, 99–104 (2005).
49. Mendonça, F. & Soares, R. Obesity and cancer phenotype: Is angiogenesis a missed link?
Life Sci. 139, 16–23 (2015).
50. Hanahan, D. & Weinberg, R. a. Hallmarks of cancer: the next generation. Cell 144, 646–74
(2011).
51. Coelho, P., Almeida, J., Prudêncio, C., Fernandes, R. & Soares, R. Effect of Adipocyte
Secretome in Melanoma Progression and Vasculogenic Mimicry. J. Cell. Biochem. 117, 1697–706
(2015).
52. Niclou, S. P., Fack, F. & Rajcevic, U. Glioma proteomics: status and perspectives. J.
Proteomics 73, 1823–1838 (2010).
lxxxiii
53. Maurage, C.-A. et al. Endocan expression and localization in human glioblastomas. J.
Neuropathol. Exp. Neurol. 68, 633–41 (2009).
54. Matano, F. et al. Endocan, a new invasion and angiogenesis marker of pituitary adenomas.
J. Neurooncol. 117, 485–91 (2014).
55. Cao, Y. Angiogenesis and Vascular Functions in Modulation of Obesity, Adipose
Metabolism, and Insulin Sensitivity. Cell Metab. 18, 478–489 (2013).
56. Donohoe, C. L., Lysaght, J., O ’sullivan, J. & Reynolds, J. V. Emerging Concepts Linking
Obesity with the Hallmarks of Cancer. (2016). doi:10.1016/j.tem.2016.08.004
57. Hossain, A. et al. Mesenchymal Stem Cells Isolated From Human Gliomas Increase
Proliferation and Maintain Stemness of Glioma Stem Cells Through the IL-6/gp130/STAT3 Pathway.
Stem Cells 33, 2400–15 (2015).
58. Delehedde, M., Devenyns, L., Maurage, C.-A. & Vivès, R. R. Endocan in cancers: a lesson
from a circulating dermatan sulfate proteoglycan. Int. J. Cell Biol. 2013, 705027 (2013).
59. Aoki, T. et al. Inhibition of autocrine fibroblast growth factor signaling by the adenovirus-
mediated expression of an antisense transgene or a dominant negative receptor in human glioma
cells in vitro. Int. J. Oncol. 21, 629–36 (2002).
60. Kiliaan, A. J., Arnoldussen, I. A. & Gustafson, D. R. Adipokines: a link between obesity and
dementia? [email protected] Lancet Neurol 13, 913–923 (2014).
lxxxiv
61. Corvera, S. & Gealekman, O. Adipose tissue angiogenesis: impact on obesity and type-2
diabetes. Biochim. Biophys. Acta 1842, 463–72 (2014).
62. Lemoine, A. Y., Ledoux, S. & Larger, E. Adipose tissue angiogenesis in obesity. Thromb.
Haemost. 110, 661–669 (2013).
Related Documents