RYAN HOLROYD HHP 637 Obesity: A Multi-Factorial Condition

Welcome message from author
This document is posted to help you gain knowledge. Please leave a comment to let me know what you think about it! Share it to your friends and learn new things together.
Transcript

R Y A N H O L R O Y D
H H P 6 3 7
Obesity: A Multi-Factorial Condition

What is Overweight and Obesity
• Overweight and obesity are defined as abnormal or excessive fat accumulation that may
impair health.
• The First Law of Thermodynamics states that energy is conserved, implying a human body
that takes in more calories (a measure of energy) than it expends in support of bodily
functions must store the additional calories
• Body mass index (BMI) is a simple index of weight-for-height that is commonly used to
classify overweight and obesity in adults. (1)
The WHO definition is:
a BMI greater than or equal to 25 is overweight
a BMI greater than or equal to 30 is obesity.

http://www.extreme-fitness-now.com/
A Cautionary tale to BMI measurement!

Genetics vs Environment?
• The cause of obesity is complex and multifactorial.
• The rapid increase in the prevalence of obesity over the past 20 years is a result of
environmental and cultural influences. (2)
• Over nutrition and sedentary lifestyle have supplanted physical labour and regular
physical activity.
• Genetics play a role, but unlikely to be the case in the United States and United
Kingdoms. (3)
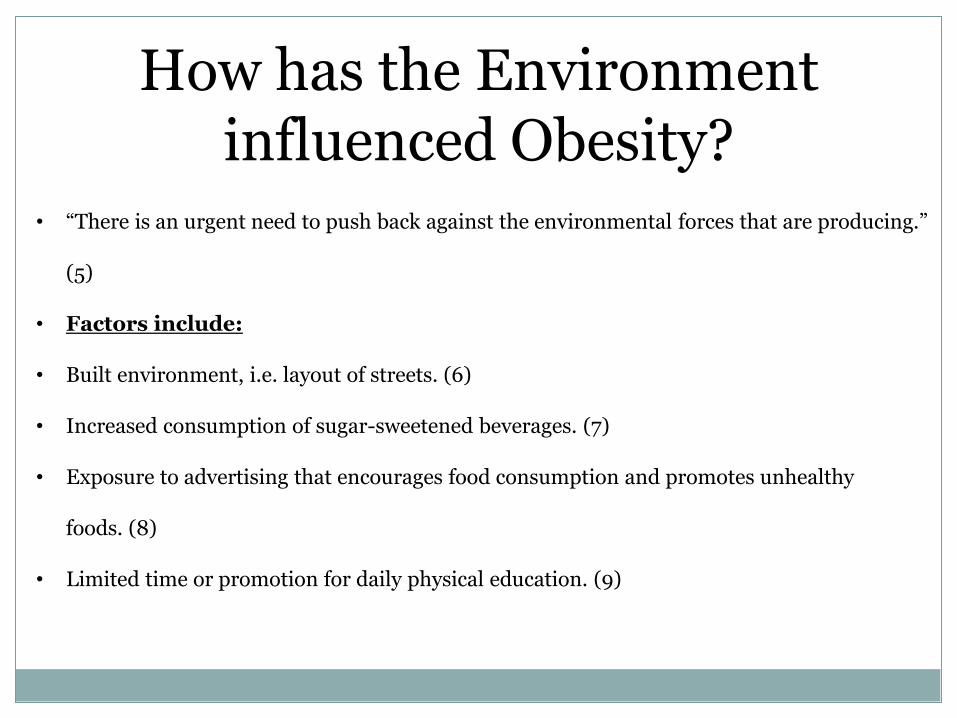
How has the Environment influenced Obesity?
• “There is an urgent need to push back against the environmental forces that are producing.”
(5)
• Factors include:
• Built environment, i.e. layout of streets. (6)
• Increased consumption of sugar-sweetened beverages. (7)
• Exposure to advertising that encourages food consumption and promotes unhealthy
foods. (8)
• Limited time or promotion for daily physical education. (9)
Pedestrian Friendly?• Residing in highly walkable neighborhoods was associated with a lower prevalence of obesity
compared to individuals living in poorly walkable neighborhoods.
• Land-use mix, nearby destinations, and the presence of sidewalks have been associated
• with less obesity. (10)
• Baton Rouge for example is promoting a Walkable, “20 minute” neighborhood. (11)
• But what other factors and measure of accessibility of environment
are available?
http://rainiervalleypost.com/local-group-training-walking-ambassadors-to-lead-rainier-valley-tours/
Walkability
http://www.walkscore.com/LA/Lake_Charles
• Cities are graded on a score from 0-100. Scores are labelled as: walker’s paradise,
daily errands do not require a car (90-100); very walkable, most errands can be
accomplished on foot (70-89) to car-dependent, almost all errands require a car (0-
24).
• Lake Charles has an average Walk Score of 35 with 71,993 residents.

Sugar-Consumption• High association a high intake of sugar sweetened beverages and the development of obesity.
Odds ratio of becoming obese increased 1.6 times for each additional sugar-sweetened drink
consumed every day.
• One can of soda provides up to 150 kcal and 40–50 g sugar in the form of high-fructose which
is equivalent to 10 teaspoons of table sugar.
• Schulze et al provides strong, scientifically sound evidence that excess calories from soft
drinks are directly contributing to the epidemics of obesity and type 2 diabetes, at least in the
United States, and should help convince the US government that
further changes in health policy are needed. (12)

Salt and Fat• Developed evolutionary trait for humans to crave fat and store as adipose tissue.
Years on… Palatable food is now cheap, fast and not had to be personally hunted!
• With food now readily available (in most countries!), a situation of higher energy
intake is seen.
• High levels of fat increase cholesterol levels in the blood. High low-density
cholesterol is associated with increased stroke, heart attack and blocking of
arteries (atherosclerosis). (13)
Low Density vs High Density Lipoproteins
• Low and high density lipoproteins represent two different cholesterols, with
contrasting roles. Both can also exist in very low density (VLDL) and very high density
(VHDL), which both carry out intensified versions of their prerequisite.
• Low Density Lipoproteins carries cholesterol from your liver to the cells that need it. If
there is too much cholesterol for the cells to use, it can build up in the artery walls.
• This leads to fatty deposits which, over time, reduce or completely block your blood
supply forming an atheroma.
• Atheroma’s have the ability to reduce oxygen delivery to cells. An atheroma in the
the carotid arteries can lead to stroke and potential loss of neural functioning.

Low Density vs High Density Lipoproteins (2)
• Those with higher levels of high density protein levels tend to have fewer
problems with cardiovascular diseases. (14)
• High Density Lipoproteins carries cholesterol from the cells to the liver. Which
then become resynthesized and excreted from the body as bile.
http://blog.wellnessfx.com/2013/10/17/cholesterol-wrong-all-along/

Promotion of Physical Activity
• Physical activity is defined as any bodily movement produced by skeletal muscles
that requires energy expenditure.
• Percent of adults 18 years of age and over who met the Physical Activity
Guidelines for aerobic physical activity: 49.6% (2012). (15)
• Obesity and related comorbidities occur when
energy intake (EI) exceeds energy
expenditure (EE) over time.
• EE is proportional to resting (basal)
metabolic rate and thermogenesis.http://cte.sfasu.edu/wp-content/uploads/2012/01/2_Principles_of_Digestion_and_Metabolism.html

Promotion of Physical Activity (2)
• While energy expenditure can be influenced by keeping energy intake low,
evidence seems to suggest that we are bad predictors of adequate calorific intake.
(16)
• Therefore physical activity could be a useful tool in utilizing excess calories and
combating obesity.
• People still do not meet the recommended 150 minutes of moderate-intensity
aerobic physical activity throughout the week or do at least 75 minutes of
vigorous-intensity.
• Cited reasons usually include lack of quality motivation! (17)
Motivation Within Physical Activity
• Motivation theories may be viewed as being on a continuum for people to range
from total disinterest to complete enjoyment and excitement for PA.
• Lack of motivation can broadly be explained by two orders of factors – people
may not be interested in PA or not value its outcomes.
• Self-determination theory (SDT) has emerged as popular framework.
• SDT explains that people can sit anywhere on the scale from being amotivated,
PA being performed for guilt or external value to enjoyment and internalized
pleasure.

Self –Determination Theory
https://learningsnippets.wordpress.com/tag/self-determination-theory/

Success at Applying Motivational PA Interventions
• People are usually good at forming intentions, but not at performing behavior.
• Low adherence can usually be observed after applying an intervention.
• The goal of motivation interventions is to educate the participant and give skills
to apply by themselves.
• Physical activity interventions are getting better at achieving these goals,
although there is still a long way to go!

Review• Obesity is a multi factorial issue, with a number of interrelated problems that
have created the current epidemic.
• The built environment, lack of cities walkability, high sugar and fat diets, poor
promotion of physical activity, and poor motivational goals could explain some of
this problem.
• In 2010, the Centers for Disease Control and Prevention (CDC) reported higher
numbers once more, counting 35.7% of American adults as obese, and 17%
of American children. (15)
• Still a long way to go!
References1. WHO.INT, (2014). WHO | Obesity and overweight. [online] Available at:
http://www.who.int/mediacentre/factsheets/fs311/en/ [Accessed 30 Oct. 2014].
2. Canadian Medical Association. (2007). 2006 Canadian Clinical Practice Guidelines on the Management
and Prevention of Obesity in Adults and Children. Canadian Medical Association.
3. Yang, W., Kelly, T., & He, J. (2007). Genetic epidemiology of obesity. Epidemiologic reviews, 29 (1), 49-
61.
4. Friedman, J. M. (2003). A war on obesity, not the obese. Science, 299 (5608), 856-858.
5. Mobley, L. R., Root, E. D., Finkelstein, E. A., Khavjou, O., Farris, R. P., & Will, J. C. (2006). Environment,
obesity, and cardiovascular disease risk in low-income women. American journal of preventive
medicine, 30(4), 327-332.
6. Booth, K. M., Pinkston, M. M., & Poston, W. S. C. (2005). Obesity and the built environment. Journal of
the American Dietetic Association, 105(5), 110-117.
7. Duffey, K. J., & Popkin, B. M. (2007). Shifts in patterns and consumption of beverages between 1965 and
2002. Obesity, 15(11), 2739-2747.
8. Andreyeva, T., Kelly, I. R., & Harris, J. L. (2011). Exposure to food advertising on television: associations
with children's fast food and soft drink consumption and obesity. Economics & Human Biology, 9(3), 221-
233.
9. Blair, S. N., & Brodney, S. (1999). Effects of physical inactivity and obesity on morbidity and mortality:
current evidence and research issues. Medicine and science in sports and exercise, 31, S646-S662.
10. Scott MM, Dubowitz T, Cohen DA. Regional differences in walking frequency and BMI: What role does
the built environment play for Blacks and Whites? Health Place. 2009;15:882–7.
11. Brgov.com, (2014). Official Baton Rouge Government Website. [online] Available at:
https://brgov.com/ [Accessed 7 Nov. 2014].
12. Ludwig DS, Peterson KE, Gortmaker SL. Relation between consumption of sugar-sweetened drinks and
childhood obesity: a prospective, observational analysis. Lancet. 2001;357:505-508.
13. NHS.UK, (2014). Is saturated fat bad for me? - Health questions - NHS Choices. [online] Available at:
http://www.nhs.uk/chq/pages/1124.aspx?categoryid=51 [Accessed 19 Nov. 2014].
14. Toth, P. P. (2005). The “good cholesterol” high-density lipoprotein. Circulation,111(5), e89-e91.
15. CDC.GOV, (2014). Fast Stats - Exercise or Physical Activity. [online] Available at:
http://www.cdc.gov/nchs/fastats/exercise.htm [Accessed 19 Nov. 2014].
16. Lichtman, S. W., Pisarska, K., Berman, E. R., Pestone, M., Dowling, H., Offenbacher, E., ... &
Heymsfield, S. B. (1992). Discrepancy between self-reported and actual caloric intake and exercise in obese
subjects. New England Journal of Medicine, 327(27), 1893-1898.
17. Thøgersen-Ntoumani, C., & Ntoumanis, N. (2006). The role of self-determined motivation in the
understanding of exercise-related behaviours, cognitions and physical self-evaluations. Journal of sports
sciences, 24(4), 393-404.
Related Documents