Placement Document Not for Circulation and Strictly Confidential Serial Number: ___ THIS PLACEMENT DOCUMENT IS NOT AN ADVERTISEMENT UNDER THE REAL ESTATE (REGULATION AND DEVELOPMENT) ACT, 2016 AND IS NOT INTENDED TO INFORM PERSONS ABOUT OUR PROJECTS OR TO INVITE ANY PERSON TO MAKE ADVANCES OR DEPOSITS IN RELATION TO ANY OF OUR PROJECTS OBEROI REALTY LIMITED Registered and Corporate Office: Commerz, 3 rd Floor, International Business Park, Oberoi Garden City, Off Western Express Highway, Goregaon (East), Mumbai 400 063 Tel: +91 22 6677 3333; Fax: +91 22 6677 3334 Contact Person: Bhaskar Kshirsagar, Company Secretary and Compliance Officer, Tel: +91 22 6677 3333; Fax: +91 22 6677 3334 Website: www.oberoirealty.com; E-mail: [email protected] Oberoi Realty Limited (our “Company”) was incorporated as Kingston Properties Private Limited on May 8, 1998 under the Companies Act, 1956 in Mumbai. The name of the Company was changed to Oberoi Realty Private Limited on October 23, 2009. Subsequently, the Company was converted into a public limited company on December 14, 2009 and consequently, the name was changed to Oberoi Realty Limited. For further details, please see the section entitled “General Information” on page 196.) Our Company is issuing 2,40,00,000 equity shares of face value of ₹ 10 each (the “Equity Shares”) at a price of ₹ 500.00 per Equity Share (the “Issue Price”), including a premium of ₹ 490.00 per Equity Share, aggregating to ₹ 1,200.00 crore (the “Issue”). For details, please see the section entitled “Summary of the Issue” on page 34. THE ISSUE IS BEING UNDERTAKEN IN RELIANCE UPON SECTIONS 42 AND 62 OF THE COMPANIES ACT, 2013, AS AMENDED, READ WITH RULE 14 OF THE COMPANIES (PROSPECTUS AND ALLOTMENT OF SECURITIES) RULES, 2014, AS AMENDED, AND OTHER APPLICABLE PROVISIONS OF THE COMPANIES ACT, 2013 AND RULES FRAMED THEREUNDER, AND CHAPTER VIII OF THE SECURITIES AND EXCHANGE BOARD OF INDIA (ISSUE OF CAPITAL AND DISCLOSURE REQUIREMENTS) REGULATIONS, 2009, AS AMENDED (THE “SEBI REGULATIONS”) THE ISSUE AND DISTRIBUTION OF THIS PLACEMENT DOCUMENT IS BEING MADE TO ELIGIBLE QIBs IN RELIANCE UPON SECTIONS 42 AND 62 OF THE COMPANIES ACT, 2013 AND THE RULES PRESCRIBED THEREUNDER, AND CHAPTER VIII OF THE SEBI REGULATIONS. THIS PLACEMENT DOCUMENT IS PERSONAL TO EACH BIDDER AND DOES NOT CONSTITUTE AN OFFER OR INVITATION OR SOLICITATION OF AN OFFER TO THE PUBLIC OR TO ANY OTHER BIDDER OR CLASS OF BIDDERS WITHIN OR OUTSIDE INDIA OTHER THAN ELIGIBLE QIBs. THE PRELIMINARY PLACEMENT DOCUMENT WAS CIRCULATED ONLY TO SUCH ELIGIBLE QIBs WHOSE NAMES WERE RECORDED BY OUR COMPANY PRIOR TO MAKING AN INVITATION TO SUBSCRIBE TO THE EQUITY SHARES. YOU ARE NOT AUTHORISED TO, AND MAY NOT, (1) DELIVER THIS PLACEMENT DOCUMENT TO ANY OTHER PERSON; OR (2) REPRODUCE THIS PLACEMENT DOCUMENT IN ANY MANNER WHATSOEVER; OR (3) RELEASE ANY PUBLIC ADVERTISEMENTS OR UTILISE ANY MEDIA, MARKETING OR DISTRIBUTION, CHANNELS OR AGENTS TO INFORM THE PUBLIC AT LARGE ABOUT THE ISSUE. ANY DISTRIBUTION OR REPRODUCTION OF THIS PLACEMENT DOCUMENT IN WHOLE OR IN PART IS UNAUTHORISED. FAILURE TO COMPLY WITH THIS INSTRUCTION MAY RESULT IN A VIOLATION OF THE SEBI REGULATIONS OR OTHER APPLICABLE LAWS OF INDIA AND OTHER JURISDICTIONS. INVESTMENTS IN EQUITY SHARES INVOLVE A DEGREE OF RISK AND BIDDERS SHOULD NOT INVEST IN THE ISSUE UNLESS THEY ARE PREPARED TO TAKE THE RISK OF LOSING ALL, OR PART, OF THEIR INVESTMENT. BIDDERS ARE ADVISED TO CAREFULLY READ THE SECTION ENTITLED “RISK FACTORS” ON PAGE 39 BEFORE MAKING AN INVESTMENT DECISION RELATING TO THE ISSUE. EACH BIDDER IS ADVISED TO CONSULT ITS OWN ADVISORS ABOUT THE PARTICULAR CONSEQUENCES OF AN INVESTMENT IN THE EQUITY SHARES BEING ISSUED PURSUANT TO THE ISSUE. BIDDERS OF THE EQUITY SHARES OFFERED SHOULD CONDUCT THEIR OWN DUE DILIGENCE ON THE EQUITY SHARES. IF YOU DO NOT UNDERSTAND THE CONTENTS OF THIS PLACEMENT DOCUMENT, YOU SHOULD CONSULT AN AUTHORISED FINANCIAL ADVISER. The Equity Shares are listed on BSE Limited (“BSE”) and National Stock Exchange of India Limited (“NSE”, and together with BSE, the “Stock Exchanges”). The closing price of the outstanding Equity Shares on BSE and NSE as on June 12, 2018 was ₹ 511.00 and ₹ 511.65 per Equity Share, respectively. Our Company has received in-principle approvals pursuant to Regulation 28(1) of the Securities and Exchange Board of India (Listing Obligations and Disclosure Requirements) Regulations, 2015, as amended (the “SEBI Listing Regulations”) for listing of the Equity Shares to be issued pursuant to the Issue, from each of BSE and NSE on June 13, 2018. Our Company shall make applications to the Stock Exchanges for obtaining final listing and trading approvals for the Equity Shares to be issued pursuant to the Issue. The Stock Exchanges assume no responsibility for the correctness of any statements made, opinions expressed or reports contained herein. Admission of the Equity Shares to be issued pursuant to the Issue for trading on the Stock Exchanges should not be taken as an indication of the merits of our Company or the Equity Shares. OUR COMPANY HAS PREPARED THIS PLACEMENT DOCUMENT SOLELY FOR PROVIDING INFORMATION IN CONNECTION WITH THE ISSUE. A copy of the Preliminary Placement Document dated June 13, 2018 (which included disclosures prescribed under Form PAS-4 (as defined hereinafter)) has been delivered to the Stock Exchanges. A copy of this Placement Document (which includes disclosures prescribed under Form PAS-4) has been delivered to the Stock Exchanges and will be filed with the Registrar of Companies, Maharashtra at Mumbai (the “RoC”). Our Company shall also make the requisite filings with the RoC and the Securities and Exchange Board of India (“SEBI”) within the stipulated period as required under the Companies Act, 2013 and the Companies (Prospectus and Allotment of Securities) Rules, 2014, as amended. This Placement Document has not been reviewed by SEBI, the Stock Exchanges, the RoC or any other regulatory or listing authority and is intended only for use by QIBs. This Placement Document has not been and will not be registered as a prospectus with the RoC, will not be circulated or distributed to the public in India or any other jurisdiction, and will not constitute a public offer in India or any other jurisdiction. Invitations for subscription of Equity Shares to be issued pursuant to the Issue shall only be made pursuant to the Preliminary Placement Document (as defined hereinafter) together with the Application Form (as defined hereinafter). For further details, please see t he section entitled “Issue Procedure” on page 145. The distribution of the Preliminary Placement Document and this Placement Document or the disclosure of its contents without our Company’s prior consent to any person, other than QIBs and persons retained by QIBs to advise them with respect to their subscription to Equity Shares, is unauthorised and prohibited. Each Bidder, by accepting delivery of this Placement Document, agrees to observe the foregoing restrictions and to make no copies of this Placement Document or any documents referred to in this Placement Document. The information on our Company’s website or any website directly or indirectly linked to our Company’s website does not constitute nor should form part of this Placement Document and Bidders should not rely on such information contained in, or available through, any such websites. The Equity Shares have not been and will not be registered under the United States Securities Act of 1933, as amended (the “Securities Act”) and may not be offered or sold within the United States or to, or for the account or benefit of, U.S. persons (as defined in Regulation S (“Regulation S”) under the Securities Act), except pursuant to an exemption from, or in a transaction not subject to, the registration requirements of the Securities Act and applicable state securities laws. Accordingly, the Equity Shares are being offered and sold (a) in the United States only to persons reasonably believed to be “qualified institutional buyers” (as defined in Rule 144A under the Securities Act ( “Rule 144A”) and referred to in this Placement Document as “U.S. QIBs”) in transactions exempt from the registration requirements of the Securities Act and (b) outside the United States in compliance with Regulation S under the Securities Act and the applicable laws of the jurisdictions where those offers and sales occur. Bidders in the United States are hereby notified that our Company is relying on an exemption from the registration requirements. The Equity Shares are transferable only in accordance with the restrictions described under the sections entitled “Selling Restrictions” and “Transfer Restrictions” on pages 157 and 164, respectively. For the avoidance of doubt, the term U.S. QIBs does not refer to a category of institutional investors defined under applicable Indian regulations and referred to in this Placement Document as “QIBs”. OUR INDEPENDENT, NON-EXECUTIVE DIRECTOR, ANIL HARISH, HAS BEEN IDENTIFIED AS A WILFUL DEFAULTER IN ACCORDANCE WITH THE GUIDELINES ISSUED BY RBI. FOR FURTHER DETAILS, PLEASE SEE THE SECTION ENTITLED “WILFUL DEFAULTERS” ON PAGE 141. BOOK RUNNING LEAD MANAGERS JM Financial Limited Morgan Stanley India Company Private Limited This Placement Document is dated June 19, 2018.

OBEROI REALTY LIMITED · 2018-06-19 · Website: ; E-mail: [email protected] Oberoi Realty Limited (our “Company”) was incorporated as Kingston Properties Private Limited on
Apr 17, 2020
Welcome message from author
This document is posted to help you gain knowledge. Please leave a comment to let me know what you think about it! Share it to your friends and learn new things together.
Transcript

Placement Document
Not for Circulation and Strictly Confidential
Serial Number: ___
THIS PLACEMENT DOCUMENT IS NOT AN ADVERTISEMENT UNDER THE REAL ESTATE (REGULATION AND DEVELOPMENT) ACT, 2016 AND IS NOT INTENDED TO INFORM PERSONS ABOUT OUR
PROJECTS OR TO INVITE ANY PERSON TO MAKE ADVANCES OR DEPOSITS IN RELATION TO ANY OF OUR PROJECTS
OBEROI REALTY LIMITED
Registered and Corporate Office: Commerz, 3rd Floor, International Business Park, Oberoi Garden City, Off Western Express Highway, Goregaon (East), Mumbai 400 063
Tel: +91 22 6677 3333; Fax: +91 22 6677 3334
Contact Person: Bhaskar Kshirsagar, Company Secretary and Compliance Officer, Tel: +91 22 6677 3333; Fax: +91 22 6677 3334
Website: www.oberoirealty.com; E-mail: [email protected]
Oberoi Realty Limited (our “Company”) was incorporated as Kingston Properties Private Limited on May 8, 1998 under the Companies Act, 1956 in Mumbai. The name of the Company
was changed to Oberoi Realty Private Limited on October 23, 2009. Subsequently, the Company was converted into a public limited company on December 14, 2009 and consequently,
the name was changed to Oberoi Realty Limited. For further details, please see the section entitled “General Information” on page 196.)
Our Company is issuing 2,40,00,000 equity shares of face value of ₹ 10 each (the “Equity Shares”) at a price of ₹ 500.00 per Equity Share (the “Issue Price”), including a premium of ₹
490.00 per Equity Share, aggregating to ₹ 1,200.00 crore (the “Issue”). For details, please see the section entitled “Summary of the Issue” on page 34.
THE ISSUE IS BEING UNDERTAKEN IN RELIANCE UPON SECTIONS 42 AND 62 OF THE COMPANIES ACT, 2013, AS AMENDED, READ WITH RULE 14 OF
THE COMPANIES (PROSPECTUS AND ALLOTMENT OF SECURITIES) RULES, 2014, AS AMENDED, AND OTHER APPLICABLE PROVISIONS OF THE
COMPANIES ACT, 2013 AND RULES FRAMED THEREUNDER, AND CHAPTER VIII OF THE SECURITIES AND EXCHANGE BOARD OF INDIA (ISSUE OF
CAPITAL AND DISCLOSURE REQUIREMENTS) REGULATIONS, 2009, AS AMENDED (THE “SEBI REGULATIONS”)
THE ISSUE AND DISTRIBUTION OF THIS PLACEMENT DOCUMENT IS BEING MADE TO ELIGIBLE QIBs IN RELIANCE UPON SECTIONS 42 AND 62 OF THE
COMPANIES ACT, 2013 AND THE RULES PRESCRIBED THEREUNDER, AND CHAPTER VIII OF THE SEBI REGULATIONS. THIS PLACEMENT DOCUMENT IS
PERSONAL TO EACH BIDDER AND DOES NOT CONSTITUTE AN OFFER OR INVITATION OR SOLICITATION OF AN OFFER TO THE PUBLIC OR TO ANY
OTHER BIDDER OR CLASS OF BIDDERS WITHIN OR OUTSIDE INDIA OTHER THAN ELIGIBLE QIBs. THE PRELIMINARY PLACEMENT DOCUMENT WAS
CIRCULATED ONLY TO SUCH ELIGIBLE QIBs WHOSE NAMES WERE RECORDED BY OUR COMPANY PRIOR TO MAKING AN INVITATION TO SUBSCRIBE
TO THE EQUITY SHARES.
YOU ARE NOT AUTHORISED TO, AND MAY NOT, (1) DELIVER THIS PLACEMENT DOCUMENT TO ANY OTHER PERSON; OR (2) REPRODUCE THIS
PLACEMENT DOCUMENT IN ANY MANNER WHATSOEVER; OR (3) RELEASE ANY PUBLIC ADVERTISEMENTS OR UTILISE ANY MEDIA, MARKETING OR
DISTRIBUTION, CHANNELS OR AGENTS TO INFORM THE PUBLIC AT LARGE ABOUT THE ISSUE. ANY DISTRIBUTION OR REPRODUCTION OF THIS
PLACEMENT DOCUMENT IN WHOLE OR IN PART IS UNAUTHORISED. FAILURE TO COMPLY WITH THIS INSTRUCTION MAY RESULT IN A VIOLATION
OF THE SEBI REGULATIONS OR OTHER APPLICABLE LAWS OF INDIA AND OTHER JURISDICTIONS.
INVESTMENTS IN EQUITY SHARES INVOLVE A DEGREE OF RISK AND BIDDERS SHOULD NOT INVEST IN THE ISSUE UNLESS THEY ARE PREPARED TO
TAKE THE RISK OF LOSING ALL, OR PART, OF THEIR INVESTMENT. BIDDERS ARE ADVISED TO CAREFULLY READ THE SECTION ENTITLED “RISK
FACTORS” ON PAGE 39 BEFORE MAKING AN INVESTMENT DECISION RELATING TO THE ISSUE. EACH BIDDER IS ADVISED TO CONSULT ITS OWN
ADVISORS ABOUT THE PARTICULAR CONSEQUENCES OF AN INVESTMENT IN THE EQUITY SHARES BEING ISSUED PURSUANT TO THE ISSUE. BIDDERS
OF THE EQUITY SHARES OFFERED SHOULD CONDUCT THEIR OWN DUE DILIGENCE ON THE EQUITY SHARES. IF YOU DO NOT UNDERSTAND THE
CONTENTS OF THIS PLACEMENT DOCUMENT, YOU SHOULD CONSULT AN AUTHORISED FINANCIAL ADVISER.
The Equity Shares are listed on BSE Limited (“BSE”) and National Stock Exchange of India Limited (“NSE”, and together with BSE, the “Stock Exchanges”). The closing price of the outstanding
Equity Shares on BSE and NSE as on June 12, 2018 was ₹ 511.00 and ₹ 511.65 per Equity Share, respectively. Our Company has received in-principle approvals pursuant to Regulation 28(1) of the
Securities and Exchange Board of India (Listing Obligations and Disclosure Requirements) Regulations, 2015, as amended (the “SEBI Listing Regulations”) for listing of the Equity Shares to be issued
pursuant to the Issue, from each of BSE and NSE on June 13, 2018. Our Company shall make applications to the Stock Exchanges for obtaining final listing and trading approvals for the Equity Shares
to be issued pursuant to the Issue. The Stock Exchanges assume no responsibility for the correctness of any statements made, opinions expressed or reports contained herein. Admission of the Equity
Shares to be issued pursuant to the Issue for trading on the Stock Exchanges should not be taken as an indication of the merits of our Company or the Equity Shares.
OUR COMPANY HAS PREPARED THIS PLACEMENT DOCUMENT SOLELY FOR PROVIDING INFORMATION IN CONNECTION WITH THE ISSUE.
A copy of the Preliminary Placement Document dated June 13, 2018 (which included disclosures prescribed under Form PAS-4 (as defined hereinafter)) has been delivered to the Stock Exchanges. A
copy of this Placement Document (which includes disclosures prescribed under Form PAS-4) has been delivered to the Stock Exchanges and will be filed with the Registrar of Companies, Maharashtra
at Mumbai (the “RoC”). Our Company shall also make the requisite filings with the RoC and the Securities and Exchange Board of India (“SEBI”) within the stipulated period as required under the
Companies Act, 2013 and the Companies (Prospectus and Allotment of Securities) Rules, 2014, as amended. This Placement Document has not been reviewed by SEBI, the Stock Exchanges, the RoC or
any other regulatory or listing authority and is intended only for use by QIBs. This Placement Document has not been and will not be registered as a prospectus with the RoC, will not be circulated or
distributed to the public in India or any other jurisdiction, and will not constitute a public offer in India or any other jurisdiction.
Invitations for subscription of Equity Shares to be issued pursuant to the Issue shall only be made pursuant to the Preliminary Placement Document (as defined hereinafter) together with the Application
Form (as defined hereinafter). For further details, please see the section entitled “Issue Procedure” on page 145. The distribution of the Preliminary Placement Document and this Placement Document
or the disclosure of its contents without our Company’s prior consent to any person, other than QIBs and persons retained by QIBs to advise them with respect to their subscription to Equity Shares, is
unauthorised and prohibited. Each Bidder, by accepting delivery of this Placement Document, agrees to observe the foregoing restrictions and to make no copies of this Placement Document or any
documents referred to in this Placement Document.
The information on our Company’s website or any website directly or indirectly linked to our Company’s website does not constitute nor should form part of this Placement Document and Bidders should
not rely on such information contained in, or available through, any such websites.
The Equity Shares have not been and will not be registered under the United States Securities Act of 1933, as amended (the “Securities Act”) and may not be offered or sold within the United States or
to, or for the account or benefit of, U.S. persons (as defined in Regulation S (“Regulation S”) under the Securities Act), except pursuant to an exemption from, or in a transaction not subject to, the
registration requirements of the Securities Act and applicable state securities laws. Accordingly, the Equity Shares are being offered and sold (a) in the United States only to persons reasonably believed
to be “qualified institutional buyers” (as defined in Rule 144A under the Securities Act ( “Rule 144A”) and referred to in this Placement Document as “U.S. QIBs”) in transactions exempt from the
registration requirements of the Securities Act and (b) outside the United States in compliance with Regulation S under the Securities Act and the applicable laws of the jurisdictions where those offers
and sales occur. Bidders in the United States are hereby notified that our Company is relying on an exemption from the registration requirements. The Equity Shares are transferable only in accordance
with the restrictions described under the sections entitled “Selling Restrictions” and “Transfer Restrictions” on pages 157 and 164, respectively. For the avoidance of doubt, the term U.S. QIBs does not
refer to a category of institutional investors defined under applicable Indian regulations and referred to in this Placement Document as “QIBs”.
OUR INDEPENDENT, NON-EXECUTIVE DIRECTOR, ANIL HARISH, HAS BEEN IDENTIFIED AS A WILFUL DEFAULTER IN ACCORDANCE WITH THE GUIDELINES ISSUED
BY RBI. FOR FURTHER DETAILS, PLEASE SEE THE SECTION ENTITLED “WILFUL DEFAULTERS” ON PAGE 141.
BOOK RUNNING LEAD MANAGERS
JM Financial Limited Morgan Stanley India Company Private Limited
This Placement Document is dated June 19, 2018.

TABLE OF CONTENTS
NOTICE TO INVESTORS .................................................................................................................................................................... 1
REPRESENTATIONS BY INVESTORS ............................................................................................................................................. 4
OFFSHORE DERIVATIVE INSTRUMENTS .................................................................................................................................... 9
DISCLAIMER CLAUSE OF THE STOCK EXCHANGES ............................................................................................................. 10
PRESENTATION OF FINANCIAL AND OTHER INFORMATION ............................................................................................ 11
INDUSTRY AND MARKET DATA ................................................................................................................................................... 13
AVAILABLE INFORMATION .......................................................................................................................................................... 15
FORWARD-LOOKING STATEMENTS .......................................................................................................................................... 16
ENFORCEMENT OF CIVIL LIABILITIES .................................................................................................................................... 17
EXCHANGE RATES ........................................................................................................................................................................... 18
DEFINITIONS AND ABBREVIATIONS .......................................................................................................................................... 19
DISCLOSURE REQUIREMENTS UNDER FORM PAS-4 PRESCRIBED UNDER THE COMPANIES ACT, 2013 .............. 24
SUMMARY OF BUSINESS ................................................................................................................................................................ 27
SUMMARY OF THE ISSUE ............................................................................................................................................................... 34
SELECTED FINANCIAL INFORMATION ..................................................................................................................................... 36
RISK FACTORS .................................................................................................................................................................................. 39
MARKET PRICE INFORMATION .................................................................................................................................................. 66
USE OF PROCEEDS ........................................................................................................................................................................... 68
CAPITALISATION STATEMENT .................................................................................................................................................... 69
CAPITAL STRUCTURE ..................................................................................................................................................................... 70
DIVIDENDS .......................................................................................................................................................................................... 72
MANAGEMENT’S DISCUSSION AND ANALYSIS OF FINANCIAL CONDITION AND RESULTS OF OPERATIONS ... 73
INDUSTRY OVERVIEW .................................................................................................................................................................... 89
OUR BUSINESS ................................................................................................................................................................................... 98
REGULATIONS AND POLICIES ................................................................................................................................................... 128
BOARD OF DIRECTORS AND SENIOR MANAGEMENT ........................................................................................................ 133
WILFUL DEFAULTERS .................................................................................................................................................................. 141
PRINCIPAL SHAREHOLDERS ...................................................................................................................................................... 142
ISSUE PROCEDURE ........................................................................................................................................................................ 145
PLACEMENT ..................................................................................................................................................................................... 155
SELLING RESTRICTIONS ............................................................................................................................................................. 157
TRANSFER RESTRICTIONS .......................................................................................................................................................... 164
CERTAIN U.S. FEDERAL INCOME TAX CONSIDERATIONS ................................................................................................ 167
THE SECURITIES MARKET OF INDIA ....................................................................................................................................... 171
DESCRIPTION OF THE EQUITY SHARES ................................................................................................................................. 174
STATEMENT OF TAX BENEFITS ................................................................................................................................................. 177
LEGAL PROCEEDINGS .................................................................................................................................................................. 190
STATUTORY AUDITORS ............................................................................................................................................................... 195
GENERAL INFORMATION ............................................................................................................................................................ 196
FINANCIAL STATEMENTS............................................................................................................................................................ 197
DECLARATION ................................................................................................................................................................................ 370

1
NOTICE TO INVESTORS
Our Company has furnished, and accepts full responsibility for, all of the information contained in this Placement
Document and confirms that to the best of its knowledge and belief, having made all reasonable enquiries, this Placement
Document contains all information with respect to our Company, its Subsidiaries, its Joint Ventures, its Joint Venture
(Subsidiaries) and the Equity Shares, which is material in the context of the Issue. The statements contained in this
Placement Document relating to our Company, its Subsidiaries, its Joint Ventures, its Joint Venture (Subsidiaries) and the
Equity Shares are in all material respects, true, accurate and not misleading, and the opinions and intentions expressed in
this Placement Document with regard to our Company, its Subsidiaries, its Joint Ventures, its Joint Venture (Subsidiaries)
and the Equity Shares are honestly held, have been reached after considering all relevant circumstances and are based on
reasonable assumptions and information presently available to our Company. There are no other facts in relation to our
Company, its Subsidiaries, its Joint Ventures, its Joint Venture (Subsidiaries) and the Equity Shares, the omission of which
would, in the context of the Issue, make any statement in this Placement Document misleading in any material respect.
Further, our Company has made all reasonable enquiries to ascertain such facts and to verify the accuracy of all such
information and statements.
JM Financial Limited and Morgan Stanley India Company Private Limited (collectively, the “Book Running Lead
Managers”) have not separately verified all of the information contained in this Placement Document (financial, legal or
otherwise). Accordingly, none of the Book Running Lead Managers or any of their respective shareholders, employees,
counsel, officers, directors, representatives, agents, associates or affiliates make any express or implied representation,
warranty or undertaking, and no responsibility or liability is accepted by the Book Running Lead Managers or any of their
respective shareholders, employees, counsel, officers, directors, representatives, agents, associates or affiliates as to the
accuracy or completeness of the information contained in this Placement Document or any other information supplied in
connection with the Issue or the distribution of the Equity Shares. Each person receiving this Placement Document
acknowledges that such person has neither relied on the Book Running Lead Managers nor any of their respective
shareholders, employees, counsel, officers, directors, representatives, agents, associates or affiliates other than our
Company in connection with such person’s investigation of the accuracy of such information or such person’s investment
decision, and each such person must rely on its own examination of our Company and the merits and risks involved in
investing in the Equity Shares.
No person is authorised to give any information or to make any representation not contained in this Placement Document
and any information or representation not so contained must not be relied upon as having been authorised by or on behalf
of the Book Running Lead Managers. The delivery of this Placement Document at any time does not imply that the
information contained in it is correct as of any time subsequent to its date.
The Equity Shares to be issued pursuant to the Issue have not been approved, disapproved or recommended by the
U.S. Securities and Exchange Commission, any other federal or state authorities in the United States or the
securities authorities of any non-U.S. jurisdiction or any other U.S. or non-U.S. regulatory authority. No authority
has passed on, or endorsed, the merits of the Issue or the accuracy or adequacy of this Placement Document. Any
representation to the contrary is a criminal offence in the United States and may be a criminal offence in other
jurisdictions.
The distribution of this Placement Document and the issue of the Equity Shares in certain jurisdictions may be restricted
by law. As such, this Placement Document does not constitute, and may not be used for or in connection with, an offer or
solicitation by anyone in any jurisdiction in which such offer or solicitation is not authorised or to any person to whom it
is unlawful to make such offer or solicitation. In particular, no action has been taken by our Company or the Book Running
Lead Managers which would permit an offering of the Equity Shares or distribution of this Placement Document in any
jurisdiction other than India where action for that purpose is required. Accordingly, the Equity Shares may not be offered
or sold, directly or indirectly, and neither this Placement Document nor any Issue materials in connection with the Equity
Shares may be distributed or published in or from any country or jurisdiction that would require registration of the Equity
Shares in such country or jurisdiction.
The Equity Shares have not been and will not be registered under the Securities Act, and may not be offered or sold within
the United States except pursuant to an exemption from, or in a transaction not subject to, the registration requirements of
the Securities Act and applicable state securities laws. The Equity Shares are transferable only in accordance with the
restrictions described in the section entitled “Transfer Restrictions” on page 164.
Within the United States, this Placement Document is being provided only to persons who are U.S. QIBs. Distribution of
this Placement Document to any person other than the offeree specified by the Book Running Lead Managers or their
respective representatives, and those persons, if any, retained to advise such offeree with respect thereto, is unauthorised,
and any disclosure of its contents, without prior written consent of our Company, is prohibited. Any reproduction or
distribution of this Placement Document in the United States, in whole or in part, and any disclosure of its contents to any
other person is prohibited.
The communication of this Placement Document and any other document or materials relating to the issue of the Equity
Shares offered hereby is not being made, and such documents and/ or materials have not been approved, by an authorised
person for the purposes of section 21 of the United Kingdom’s Financial Services and Markets Act 2000, as amended (the

2
“FSMA”). Accordingly, such documents and/ or materials are not being distributed to, and must not be passed on to, the
general public in the United Kingdom. The communication of such documents and/ or materials as a financial promotion
is only being made to those persons in the United Kingdom falling within the definition of investment professionals (as
defined in Article 19(5) of the Financial Services and Markets Act 2000 (Financial Promotion) Order 2005 (the “Financial
Promotion Order”), or within Article 49(2)(a) to (d) of the Financial Promotion Order, or to any other persons to whom
it may otherwise lawfully be made under the Financial Promotion Order (all such persons together being referred to as
“relevant persons”). In the United Kingdom, the Equity Shares offered hereby are only available to, and any investment
or investment activity to which this Placement Document relates will be engaged in only with, relevant persons. Any
person in the United Kingdom that is not a relevant person should not act or rely on this Placement Document or any of
its contents.
In making an investment decision, Bidders must rely on their own examination of our Company and the terms of the Issue,
including the merits and risks involved. Bidders should not construe the contents of this Placement Document as legal,
tax, accounting or investment advice. Bidders should consult their own counsel and advisors as to business, legal, tax,
accounting and related matters concerning the Issue. In addition, neither our Company nor the Book Running Lead
Managers are making any representation to Bidders regarding the legality of an investment in the Equity Shares by such
Bidder under applicable laws or regulations.
Each subscriber to the Equity Shares in the Issue is deemed to have acknowledged, represented and agreed that it
is a QIB and is eligible to invest in India and in our Company under Indian laws, including Chapter VIII of the
SEBI Regulations and Section 42 of the Companies Act, 2013 and the rules and regulations made thereunder and
is not prohibited by SEBI or any other regulatory authority from buying, selling or dealing in securities. This
Placement Document contains summaries of certain terms of certain documents, which are qualified in their
entirety by the terms and conditions of such documents and disclosures included in the section entitled “Risk
Factors” on page 39.
The information on our Company’s website at www.oberoirealty.com or the websites of each of our Subsidiaries and Joint
Ventures, or any website directly or indirectly linked to our Company’s website or the website of each of the Book Running
Lead Managers, their associates or their affiliates, does not constitute or form part of this Placement Document. This
Placement Document contains summaries of certain terms of certain documents, which summaries are qualified in their
entirety by the terms and conditions of such documents.
NOTICE TO BIDDERS IN THE UNITED STATES
The Equity Shares have not been recommended by any U.S. federal or state securities commission or regulatory authority.
Furthermore, the foregoing authorities have not confirmed the accuracy or determined the adequacy of this Placement
Document or approved or disapproved the Equity Shares. Any representation to the contrary is a criminal offence in the
United States. In making an investment decision Bidders must rely on their own examination of our Company and the terms
of the offer, including the merits and risks involved. The Equity Shares have not been and will not be registered under the
Securities Act or any other applicable law of the United States and, unless so registered, may not be offered or sold within
the United States except pursuant to an exemption from, or in a transaction not subject to, the registration requirements of
the Securities Act and applicable state securities laws. Accordingly, the Equity Shares are being offered and sold (a) in the
United States only to U.S. QIBs in transactions exempt from the registration requirements of the Securities Act and (b)
outside the United States in compliance with Regulation S and the applicable laws of the jurisdiction where those offers and
sales occur. The Equity Shares are transferable only in accordance with the restrictions described in the sections entitled
“Selling Restrictions” and “Transfer Restrictions” on pages 157 and 164, respectively.
NOTICE TO BIDDERS IN THE EUROPEAN ECONOMIC AREA
This Placement Document has been prepared on the basis that all offers of Equity shares will be made pursuant to an
exemption under the Prospectus Directive, as implemented in Member States of the European Economic Area (“EEA”),
from the requirement to produce a prospectus for offers of Equity Shares. The expression “Prospectus Directive” means
Directive 2003/71/EC of the European Parliament and Council EC (and amendments thereto, including the 2010 PD
Amending Directive and Prospectus Regulation (EU) 2017/1129, to the extent applicable and to the extent implemented
in the Relevant Member State (as defined below)) and includes any relevant implementing measure in each Member State
that has implemented the Prospectus Directive (each a “Relevant Member State”). Accordingly, any person making or
intending to make an offer within the EEA of Equity Shares which are the subject of the placement contemplated in this
Placement Document should only do so in circumstances in which no obligation arises for our Company or any of the
Book Running Lead Managers to produce a prospectus for such offer. None of our Company and the Book Running Lead
Managers have authorized, nor do they authorize, the making of any offer of Equity Shares through any financial
intermediary, other than the offers made by the Book Running Lead Managers which constitute the final placement of
Equity Shares contemplated in this Placement Document.

3
Information to Distributors
Solely for the purposes of the product governance requirements contained within: (a) EU Directive 2014/65/EU on markets
in financial instruments, as amended (“MiFID II”); (b) Articles 9 and 10 of Commission Delegated Directive (EU)
2017/593 supplementing MiFID II; and (c) local implementing measures (together, the “MiFID II Product Governance
Requirements”), and disclaiming all and any liability, whether arising in tort, contract or otherwise, which any
“manufacturer” (for the purposes of the MiFID II Product Governance Requirements) may otherwise have with respect
thereto, the Equity Shares have been subject to a product approval process, which has determined that such Equity Shares
are: (i) compatible with an end target market of retail investors and investors who meet the criteria of professional clients
and eligible counterparties, each as defined in MiFID II; and (ii) eligible for distribution through all distribution channels
as are permitted by MiFID II (the “Target Market Assessment”). Notwithstanding the Target Market Assessment,
“distributors” (for the purposes of the MiFID II Product Governance Requirements) (“Distributors”) should note that: the
price of the Equity Shares may decline and investors could lose all or part of their investment; the Equity Shares offer no
guaranteed income and no capital protection; and an investment in the Equity Shares is compatible only with investors
who do not need a guaranteed income or capital protection, who (either alone or in conjunction with an appropriate
financial or other adviser) are capable of evaluating the merits and risks of such an investment and who have sufficient
resources to be able to bear any losses that may result therefrom. The Target Market Assessment is without prejudice to
the requirements of any contractual, legal or regulatory selling restrictions in relation to the Issue.
For the avoidance of doubt, the Target Market Assessment does not constitute: (a) an assessment of suitability or
appropriateness for the purposes of MiFID II; or (b) a recommendation to any investor or group of investors to invest in,
or purchase, or take any other action whatsoever with respect to the Equity Shares. Each Distributor is responsible for
undertaking its own target market assessment in respect of the Equity Shares and determining appropriate distribution
channels.

4
REPRESENTATIONS BY INVESTORS
References herein to “you” or “your” in this section are to the Bidders in the Issue.
By Bidding for, or subscribing to, any Equity Shares offered in the Issue, you are deemed to have represented to, warranted
to, acknowledged to, and agreed with, our Company and the Book Running Lead Managers, as follows:
1. You are a QIB as defined in Regulation 2(1)(zd) of the SEBI Regulations, having a valid and existing registration
under applicable laws and regulations of India, not excluded pursuant to Regulation 86(1)(b) of the SEBI
Regulations and undertake to acquire, hold, manage or dispose of any Equity Shares that are Allotted to you in
accordance with Chapter VIII of the SEBI Regulations and the Companies Act and undertake to comply with the
SEBI Regulations, the Companies Act and all other applicable laws, including any reporting obligations, or
declarations as required by the Companies Act and other applicable law;
2. If you are a foreign portfolio investor, you are an Eligible FPI as defined in this Placement Document and have
a valid and existing registration with SEBI under the applicable laws in India, and can participate in the Issue
only under Schedule 2 of FEMA 2017. FVCIs are not permitted to participate in the Issue. Further, Eligible FPIs
may invest in such number of Equity Shares such that the total FPI investment in our Company does not exceed
30% of the post-Issue paid-up capital of our Company on a fully diluted basis;
3. You are eligible to invest in India and in our Company under applicable laws, including FEMA 2017 and have
not been prohibited by the SEBI or any other regulatory authority from buying, selling or dealing in securities or
otherwise accessing the capital markets;
4. You will make all necessary filings with appropriate regulatory authorities, including the RBI, as required
pursuant to applicable laws;
5. If you are Allotted Equity Shares pursuant to the Issue, you shall not, for a period of one year from the date of
Allotment, sell the Equity Shares so acquired except on the floor of the Stock Exchanges (additional restrictions
apply if you are in the United States). For additional restrictions in this regard, please see the sections entitled
“Selling Restrictions” and “Transfer Restrictions” beginning on pages 157 and 164, respectively;
6. You have made, or are deemed to have made, as applicable, the representations, warranties, acknowledgements
and undertakings detailed in the sections entitled “Selling Restrictions” and “Transfer Restrictions” on pages 157
and 164, respectively;
7. You are aware that this Placement Document (which includes disclosures prescribed under Form PAS-4) has not
been and will not be registered as a prospectus under the Companies Act, 2013, the SEBI Regulations or under
any other law in force in India. This Placement Document has not been reviewed, verified or affirmed by SEBI,
the Stock Exchanges, the RoC or any other statutory, regulatory or listing authority and is intended only for use
by Eligible QIBs;
8. The Preliminary Placement Document and this Placement Document have been submitted to the Stock Exchanges
for record purposes only and the Preliminary Placement Document and this Placement Document will be
displayed on the websites of our Company and the Stock Exchanges. This Placement Document will be filed with
the RoC and submitted to SEBI within the stipulated time period as required under the Companies Act, 2013 and
the rules made thereunder;
9. You are entitled to subscribe to, and acquire, the Equity Shares offered pursuant to the Issue, under the laws of
all relevant jurisdictions that apply to you, and you have: (i) fully observed such laws; (ii) the necessary capacity;
and (iii) obtained all necessary consents, governmental or otherwise, and authorisations and complied with all
necessary formalities, to enable you to commit to participation in the Issue and to perform your obligations in
relation thereto (including, without limitation, in the case of any person on whose behalf you are acting, all
necessary consents and authorisations to agree to the terms set out or referred to in this Placement Document),
and will honour such obligations;
10. None of our Company, the Book Running Lead Managers and any of their respective shareholders, directors,
officers, employees, counsel, representatives, agents or affiliates is making any recommendations to you or
advising you regarding the suitability of any transactions it may enter into in connection with the Issue and your
participation in the Issue is on the basis that you are not, and will not, up to the Allotment, be a client of the Book
Running Lead Managers. Neither the Book Running Lead Managers nor any of their shareholders, directors,
officers, employees, counsel, representatives, agents or affiliates have any duties or responsibilities to you for
providing the protection afforded to their clients or customers or for providing advice in relation to the Issue and
are not in any way acting in any fiduciary capacity;
11. You confirm that, either: (i) you have not participated in or attended any investor meetings or presentations by
our Company or its agents (the “Company Presentations”) with regard to our Company or the Issue; or (ii) if
you have participated in or attended any Company Presentations: (a) you understand and acknowledge that the

5
Book Running Lead Managers may not have knowledge of the statements that our Company or its agents may
have made at such Company Presentations and are therefore unable to determine whether the information
provided to you at such Company Presentations may have had any material misstatements or omissions, and,
accordingly you acknowledge that the Book Running Lead Managers have advised you not to rely in any way on
any information that was provided to you at such Company Presentations, and (b) you confirm that you have not
been provided any material or price sensitive information relating to our Company and the Issue that was not
publicly available;
12. Your decision to subscribe to the Equity Shares to be issued pursuant to the Issue has not been made on the basis
of any information relating to our Company which is not set forth in the Preliminary Placement Document or this
Placement Document;
13. You are subscribing to the Equity Shares to be issued pursuant to the Issue in accordance with applicable laws
and by participating in the Issue, you are not in violation of any applicable law, including but not limited to the
SEBI Insider Trading Regulations, the Securities and Exchange Board of India (Prohibition of Fraudulent and
Unfair Trade Practices relating to Securities Market) Regulations, 2003, as amended, and the Companies Act,
2013;
14. All statements other than statements of historical fact included in this Placement Document, including, without
limitation, those regarding our financial position, business strategy, plans and objectives of management for
future operations (including development plans and objectives relating to our Company’s business), are forward-
looking statements. Such forward-looking statements involve known and unknown risks, uncertainties and other
important factors that could cause actual results to be materially different from future results, performance or
achievements expressed or implied by such forward-looking statements. Such forward-looking statements are
based on numerous assumptions regarding our present and future business strategies and environment in which
we will operate in the future. You should not place undue reliance on forward-looking statements, which speak
only as at the date of this Placement Document. Our Company or any of our shareholders, Directors, officers,
employees, counsel, advisors, representatives, agents or affiliates assume no responsibility to update any of the
forward-looking statements contained in this Placement Document;
15. You are aware and understand that the Equity Shares are being offered only to Eligible QIBs, pursuant to the
Issue, and are not being offered to the general public, and the Allotment of the same shall be at the discretion of
our Company, in consultation with the Book Running Lead Managers;
16. You are aware that if you are Allotted more than 5% of the Equity Shares in the Issue, our Company shall be
required to disclose your name and the number of the Equity Shares Allotted to you to the Stock Exchanges. The
Stock Exchanges will make the same available on their website and you consent to such disclosures;
17. You have been provided a serially numbered copy of the Preliminary Placement Document and this Placement
Document and have read each of them in its entirety, including in particular, the section entitled “Risk Factors”
beginning on page 39;
18. In making your investment decision, you have (i) relied on your own examination of our Company on a
consolidated basis and the terms of the Issue, including the merits and risks involved; (ii) made your own
assessment of our Company on a consolidated basis, the Equity Shares offered in the Issue and the terms of the
Issue; (iii) consulted your own independent counsel and advisors or otherwise have satisfied yourself concerning,
without limitation, the effects of local laws; (iv) relied solely on the information contained in the Preliminary
Placement Document and no other disclosure or representation by our Company or its Directors, its Promoter, its
Subsidiaries or any other party; (v) received all information that you believe is necessary or appropriate in order
to make an investment decision in respect of our Company on a consolidated basis and the Equity Shares offered
in the Issue; and (vi) relied upon your own investigation and resources in deciding to invest in the Issue;
19. Neither our Company nor the Book Running Lead Managers or any of their respective shareholders, directors,
officers, employees, counsel, representatives, agents or affiliates have provided you with any tax advice or
otherwise made any representations regarding the tax consequences of purchase, ownership and disposal or any
other aspect in relation to the Equity Shares (including but not limited to the Issue and the use of the proceeds
from the Equity Shares). You will obtain your own independent tax advice from a reputable service provider and
will not rely on our Company or the Book Running Lead Managers or any of their shareholders, directors,
officers, employees, counsel, representatives, agents or affiliates when evaluating the tax consequences in relation
to the Equity Shares (including but not limited to the Issue and the use of the proceeds from the Equity Shares).
You waive and agree not to assert any claim against our Company or the Book Running Lead Managers or any
of their respective shareholders, directors, officers, employees, counsel, representatives, agents or affiliates with
respect to the tax aspects of the Equity Shares or as a result of any tax audits by tax authorities, wherever situated;
20. You are a sophisticated investor and have such knowledge and experience in financial, business and investment
matters as to be capable of evaluating the merits and risks of an investment in the Equity Shares. You are
experienced in investing in private placement transactions of securities of companies in a similar nature of

6
business, similar stage of development and in similar jurisdictions. You and any accounts for which you are
subscribing to the Equity Shares (i) are each able to bear the economic risk of your investment in the Equity
Shares; (ii) will not look to our Company, the Book Running Lead Managers or any of their shareholders,
directors, officers, employees, counsel, representatives, agents or affiliates for all or part of any such loss or losses
that may be suffered in connection with the Issue, including losses arising out of non-performance by our
Company of any of its respective obligations or any breach of any representations and warranties by our
Company, whether to you or otherwise; (iii) are able to sustain a complete loss on the investment in the Equity
Shares; (iv) have no need for liquidity with respect to the investment in the Equity Shares; and (v) have no reason
to anticipate any change in your circumstances or any accounts for which you are subscribing, financial or
otherwise, which may cause or require any sale or distribution by you or them of all or any part of the Equity
Shares. You acknowledge that an investment in the Equity Shares involves a high degree of risk and that the
Equity Shares are, therefore, a speculative investment. You are seeking to subscribe to the Equity Shares in the
Issue for your own investment and not with a view to resell or distribute;
21. If you are acquiring the Equity Shares to be issued pursuant to the Issue for one or more managed accounts, you
represent and warrant that you are authorised in writing, by each such managed account to acquire such Equity
Shares for each managed account and to make (and you hereby make) the representations, warranties,
acknowledgements and agreements herein for and on behalf of each such account, reading the reference to “you”
to include such accounts;
22. You are not a Promoter of our Company or any of its affiliates and are not a person related to the Promoter, either
directly or indirectly and your Bid does not directly or indirectly represent the Promoter or Promoter Group of
our Company or persons related to the Promoter;
23. You agree that in terms of Section 42(7) of the Companies Act, 2013 and Rule 14(3) of the PAS Rules, we shall
file the list of Eligible QIBs (to whom the Preliminary Placement Document has been circulated) along with other
particulars and other filings required under the Companies Act, 2013 with the RoC and the SEBI within 30 days
of circulation of the Preliminary Placement Document and other filings under the Companies Act, 2013. You are
aware that our Company shall make necessary filings with the RoC pursuant to the Allotment, which shall include
certain details including your name, address and number of Equity Shares Allotted to you;
24. You have no rights under a shareholders’ agreement or voting agreement with the Promoter or persons related to
the Promoter, no veto rights or right to appoint any nominee director on our Board other than the rights acquired,
if any, in the capacity of a lender not holding any Equity Shares, which shall not be deemed to be a person related
to the Promoter of our Company;
25. You will have no right to withdraw your Bid after the Bid/Issue Closing Date;
26. You are eligible to bid for and hold, as applicable, the Equity Shares Allotted to you together with any Equity
Shares held by you prior to the Issue. Further, you confirm that your aggregate holding after the Allotment of the
Equity Shares shall not exceed the level permissible as per any applicable laws;
27. The Bid made by you would not result in triggering an open offer under the Securities and Exchange Board of
India (Substantial Acquisition of Shares and Takeovers) Regulations, 2011, as amended (the “Takeover
Regulations”);
28. The number of Equity Shares Allotted to you pursuant to the Issue, together with other Allottees that belong to
the same group or are under same control shall not exceed 50% of the Issue. For the purposes of this
representation:
(a). the expression ‘belong to the same group’ shall derive meaning from the concept of ‘companies under
the same group’ as provided under Section 372(11) of the Companies Act, 1956; and
(b). ‘control’ shall have the same meaning as is assigned to it by Regulation 2(1)(e) of the Takeover
Regulations;
29. You shall not undertake any trade in the Equity Shares credited to your beneficiary account until such time that
the final listing and trading approvals for such Equity Shares issued pursuant to the Issue are granted by the Stock
Exchanges;
30. You are aware that (i) applications for in-principle approval, in terms of Regulation 28(1) of the SEBI Listing
Regulations, for listing and trading of the Equity Shares to be issued pursuant to the Issue, on the Stock
Exchanges, were made and an in-principle approval has been received by our Company from each of the Stock
Exchanges; and (ii) the application for the final listing and trading approval will be made only after Allotment.
There can be no assurance that the final approvals for listing and trading of such Equity Shares on the Stock
Exchanges will be obtained in time or at all. Our Company shall not be responsible for any delay or non-receipt
of such final approvals or any loss arising from such delay or non-receipt;

7
31. You are aware and understand that the Book Running Lead Managers have entered into a placement agreement
with our Company whereby the Book Running Lead Managers have, subject to the satisfaction of certain
conditions set out therein, agreed to manage the Issue and use reasonable efforts to procure subscriptions for the
Equity Shares to be issued pursuant to the Issue, on the terms and conditions set forth therein;
32. The contents of this Placement Document are exclusively the responsibility of our Company, and neither the
Book Running Lead Managers nor any person acting on their behalf has or shall have any liability for any
information, representation or statement contained in this Placement Document or any information previously
published by or on behalf of our Company and will not be liable for your decision to participate in the Issue based
on any information, representation or statement contained in the Preliminary Placement Document or this
Placement Document or otherwise. By participating in the Issue, you agree to the same and confirm that the only
information you are entitled to rely on, and on which you have relied in committing yourself to acquire the Equity
Shares is contained in the Preliminary Placement Document and this Placement Document, such information
being all that you deem necessary to make an investment decision in respect of the Equity Shares, you have
neither received nor relied on any other information, representation, warranty or statement made by or on behalf
of the Book Running Lead Managers or our Company or any of their respective affiliates or any other person,
and neither the Book Running Lead Managers nor our Company nor any other person will be liable for your
decision to participate in the Issue based on any other information, representation, warranty or statement that you
may have obtained or received;
33. You understand that the Book Running Lead Managers and their affiliates do not have any obligation to purchase
or acquire all or any part of the Equity Shares subscribed by you in the Issue or to support any losses directly or
indirectly sustained or incurred by you for any reason whatsoever in connection with the Issue, including non-
performance by us or any of our respective obligations or any breach of any representations or warranties by us,
whether to you or otherwise;
34. You understand that the Equity Shares have not been and will not be registered under the Securities Act or with
any securities regulatory authority of any state of the United States and accordingly, may not be offered or sold
within the United States, except in reliance on an exemption from the registration requirements of the Securities
Act.;
35. If you are within the United States, you are a U.S. QIB, and are acquiring the Equity Shares for your own account
or for the account of an institutional investor who also meets the definition of a U.S. QIB, for investment purposes
only, and not with a view to, or for resale in connection with, the distribution (within the meaning of any United
States securities laws) thereof, in whole or in part and are not an affiliate of our Company or a person acting on
behalf of such an affiliate;
36. If you are outside the United States, you are subscribing for the Equity Shares in an “offshore transaction” within
the meaning of Regulation S under the Securities Act, and are not our Company’s or the Book Running Lead
Managers’ affiliate or a person acting on behalf of such an affiliate;
37. You understand and agree that the Equity Shares are transferable only in accordance with the restrictions
described under the sections entitled “Selling Restrictions” and “Transfer Restrictions” on pages 157 and 164,
respectively, particularly, you represent and agree that you will only reoffer, resell, pledge or otherwise transfer
the Equity Shares only (A) (i) to a person whom the beneficial owner and/or any person acting on its behalf
reasonably believes is a U.S. QIB in a transaction meeting the requirements of Rule 144A or (ii) in an offshore
transaction complying with Rule 903 or Rule 904 of Regulation S under the Securities Act and (B) in accordance
with all applicable laws, including the securities laws of the States of the United States;
38. You agree that any dispute arising out of in connection with the Issue will be governed by and construed in
accordance with the laws of India, and the courts in Mumbai, India shall have exclusive jurisdiction to settle any
disputes which may arise out of or in connection with the Issue, the Preliminary Placement Document and this
Placement Document;
39. Each of the representations, warranties, acknowledgements and agreements set out above shall continue to be
true and accurate at all times up to and including the Allotment, listing and trading of the Equity Shares issued
pursuant to the Issue;
40. You agree to indemnify and hold our Company, the Book Running Lead Managers and their respective
shareholders, directors, officers, employees and affiliates harmless from any and all costs, claims, liabilities and
expenses (including legal fee and expenses) arising out of or in connection with any breach or alleged breach of
the foregoing representations, warranties, acknowledgements and undertakings made by you in this Placement
Document. You agree that the indemnity set forth in this paragraph shall survive the resale of the Equity Shares
issued pursuant to the Issue by, or on behalf of, the managed accounts; and
41. Our Company, the Book Running Lead Managers, their respective affiliates and others will rely on the truth and
accuracy of the foregoing representations, warranties, acknowledgements and undertakings, which are given to

8
the Book Running Lead Managers on their own behalf and on behalf of our Company, and are irrevocable. It is
agreed that if any of such representations, warranties, acknowledgements and undertakings are no longer accurate,
you will promptly notify our Company and the Book Running Lead Managers.

9
OFFSHORE DERIVATIVE INSTRUMENTS
Subject to compliance with all applicable Indian laws, rules, regulations, guidelines and approvals in terms of Regulation
22 of the SEBI FPI Regulations, an Eligible FPI, including the affiliates of the Book Running Lead Managers, may issue,
subscribe or otherwise deal in offshore derivative instruments (as defined under the SEBI FPI Regulations as any
instrument, by whatever name called, which is issued overseas by a FPI against securities held by it that are listed or
proposed to be listed on any recognised stock exchange in India, as its underlying) (all such offshore derivative instruments
are referred to herein as “P-Notes”), for which they may receive compensation from the purchasers of such instruments.
Further, in accordance with the SEBI Circular dated November 24, 2014, FPIs shall issue P-Notes to only those subscribers
which meet the eligibility criteria as laid down in Regulation 4 of the SEBI FPI Regulations and which do not have any
opaque structure(s), as defined under the SEBI FPI Regulations. P-Notes may be issued only in favour of those entities
which are regulated by any appropriate foreign regulatory authorities in the countries of their incorporation, subject to
compliance with ‘know your client’ requirements. An FPI shall also ensure that no further issue or transfer of any
instrument referred to above is made to any person other than such entities regulated by appropriate foreign regulatory
authorities. P-Notes have not been, and are not being offered, or sold pursuant to this Placement Document. This Placement
Document does not contain any information concerning P-Notes or the issuer(s) of any P-Notes, including any information
regarding any risk factors relating thereto.
In terms of the SEBI FPI Regulations, the issue of Equity Shares to a single FPI or an investor group (which means the
same set of ultimate beneficial owner(s) investing through multiple entities) is not permitted to be 10% or above of our
post-Issue Equity Share capital. As per the circular issued by SEBI on November 24, 2014, these investment restrictions
shall also apply to subscribers of offshore derivative instruments. Two or more subscribers of offshore derivative
instruments having a common beneficial owner shall be considered together as a single subscriber of the offshore
derivative instruments. In the event a prospective investor has investments as a FPI and as a subscriber of offshore
derivative instruments, these investment restrictions shall apply on the aggregate of the FPI and offshore derivative
instruments investments held in the underlying company.
Any P-Notes that may be issued are not securities of our Company and do not constitute any obligation of, claims on or
interests in our Company. Our Company has not participated in any offer of any P-Notes, or in the establishment of the
terms of any P-Notes, or in the preparation of any disclosure related to any P-Notes. Any P-Notes that may be offered are
issued by, and are the sole obligations of, third parties that are unrelated to our Company. Our Company and the Book
Running Lead Managers do not make any recommendation as to any investment in P-Notes and do not accept any
responsibility whatsoever in connection with any P-Notes. Any P-Notes that may be issued are not securities of the Book
Running Lead Managers and do not constitute any obligations of or claims on the Book Running Lead Managers. Affiliates
of the Book Running Lead Managers which are Eligible FPIs may purchase, to the extent permissible under law, the Equity
Shares in the Issue, and may issue P-Notes in respect thereof.
Bidders interested in purchasing any P-Notes have the responsibility to obtain adequate disclosures as to the
issuer(s) of such P-Notes and the terms and conditions of any such P-Notes from the issuer(s) of such P-Notes.
Neither SEBI nor any other regulatory authority has reviewed or approved any P-Notes or any disclosure related
thereto. Bidders are urged to consult their own financial, legal, accounting and tax advisors regarding any
contemplated investment in P-Notes, including whether P-Notes are issued in compliance with applicable laws and
regulations.

10
DISCLAIMER CLAUSE OF THE STOCK EXCHANGES
As required, a copy of this Placement Document has been submitted to each of the Stock Exchanges. The Stock Exchanges
do not in any manner:
(1) warrant, certify or endorse the correctness or completeness of the contents of this Placement Document;
(2) warrant that the Equity Shares will be listed or will continue to be listed on the Stock Exchanges; or
(3) take any responsibility for the financial or other soundness of our Company, its Promoter, its management or any
scheme or project of our Company;
and it should not for any reason be deemed or construed to mean that this Placement Document has been cleared or
approved by the Stock Exchanges. Every person who desires to apply for or otherwise acquire any Equity Shares may do
so pursuant to an independent inquiry, investigation and analysis and shall not have any claim against the Stock Exchanges
whatsoever, by reason of any loss which may be suffered by such person consequent to or in connection with, such
subscription/acquisition, whether by reason of anything stated or omitted to be stated herein, or for any other reason
whatsoever.

11
PRESENTATION OF FINANCIAL AND OTHER INFORMATION
Certain Conventions
In this Placement Document, unless otherwise specified or the context otherwise indicates or implies, references to “you”,
“your”, “offeree”, “purchaser”, “subscriber”, “recipient”, “investors”, “prospective investors” and “potential investor” are
to the Bidders of Equity Shares in the Issue, references to the “Company” or the “Issuer” are to our Company and
references to “we”, “us” or “our” are to our Company together with the Subsidiaries and Joint Ventures, on a consolidated
basis.
References in this Placement Document to “India” are to the Republic of India and its territories and possessions and the
“Government” or the “Central Government” or the “state government” are to the Government of India (“GoI”), or the
governments of any state in India, as applicable and as the case may be. All references herein to the “U.S.” or the “United
States” are to the United States of America and its territories and possessions. References to the singular also refers to the
plural and one gender also refers to any other gender, wherever applicable. Further, estimated completion dates for our
projects as provided in this Placement Document may differ from completion dates provided under RERA registration or
as may be updated thereafter.
Real Estate Information
Land area for a particular project disclosed in this Placement Document is calculated on the basis of the total area for
which available floor space index is proposed to be utilized for that project, and might significantly differ from the land
areas required to be disclosed as per RERA. The Company has given the areas to make them comparable with other
projects of other developers across the country, and these areas do not represent the basis of the transaction entered into
with the customers.
The information provided in this Placement Document in the form of pictures, artistic renders, areas, rates, consideration,
project details, amongst others, does not purport or tantamount to any disclosure under the RERA and the Maharashtra
Real Estate (Regulation and Development) (Registration of real estate projects, Registration of real estate agents, rates of
interest and disclosures on website) Rules, 2017 (“MahaRERA”) and should not be construed to be or constitute a
prospectus, advertisements, solicitations, marketing, offer for sale, invitation to offer, invitation to acquire including within
the purview of RERA and/or MahaRERA.
Financial and Other Information
In this Placement Document, references to “USD”, “$”, “U.S.$” and “U.S. dollars” are to the legal currency of the United
States and references to, “₹”, “Rs.”, “INR” and “Rupees” are to the legal currency of India.
Our Company publishes its financial statements in Indian Rupees. Prior to April 1, 2016, we prepared our financial
statements in accordance with the accounting principles generally accepted in India (“Indian GAAP”), prescribed by the
Institute of Chartered Accountants of India (“ICAI”), the Companies Act, 1956, the Companies Act, 2013, Accounting
Standards notified under the Companies Act and the requirements of the SEBI Listing Regulations, each as applicable.
With effect from April 1, 2016, we adopted Indian Accounting Standards (“Ind AS”) prescribed under Section 133 of the
Companies Act, 2013 read with the rules made thereunder and, accordingly, our financial statements as of and for the
years ended March 31, 2018 and March 31, 2017 have been prepared in accordance with Ind AS and the Companies Act
(the “Ind AS Audited Consolidated Financial Statements”). Our financial statements as of and for the year ended March
31, 2016 have been prepared in accordance with Indian GAAP and restated in accordance with Ind AS for comparative
information and presented in the Ind AS Audited Consolidated Financial Statements for the year ended March 31, 2017.
For more information about our transition to Ind AS and a reconciliation between Indian GAAP and Ind AS, please see
Note 4.2 to the Audited Consolidated Financial Statements for the year ended March 31, 2017, included on page 293. The
financial statements for the financial years ended March 31, 2018 and March 31, 2017, prepared under Ind AS, and the
financial statements for the year ended March 31, 2016, restated in accordance with Ind AS for comparative information,
are not comparable with financial statements prepared for prior periods in accordance with Indian GAAP.
The audited financial statements as at and for the year ended March 31, 2018 have been audited by S R B C & CO LLP,
Chartered Accountants, while the audited financial statements as at and for the years ended March 31, 2017 and March
31, 2016 have been audited by our previous statutory auditors, M/s. P. Raj & Co., Chartered Accountants.
Our Company does not quantify the impact of U.S. GAAP or International Financial Reporting Standards (“IFRS”) on
the financial data included in this Placement Document, nor does our Company provide a reconciliation of its financial
statements to U.S. GAAP or IFRS. Each of U.S. GAAP and IFRS differ in certain significant respects from Ind AS or
Indian GAAP, as applicable. Accordingly, the degree to which the consolidated financial statements prepared in
accordance with Ind AS or Indian GAAP included in this Placement Document will provide meaningful information is
entirely dependent on the reader’s familiarity with the respective accounting practices. Any reliance by persons not familiar
with Indian accounting practices on the financial disclosures presented in this Placement Document should accordingly
be limited. For differences in accounting principles, please see the section entitled “Risk Factors - Significant differences

12
exist between Ind AS and Indian GAAP on one hand and other accounting principles, such as US GAAP and IFRS on the
other, which may be material to investors’ assessments of our financial condition” on page 62.
The Financial Year of our Company commences on April 1 of each calendar year and ends on March 31 of the succeeding
calendar year. Unless otherwise stated, references in this Placement Document to a particular year are to the calendar year
ended on December 31, and to a particular “Financial” or “Financial Year” or “FY” or “Fiscal” or “Fiscal Year” are to the
twelve month period ended on March 31 of that year.
All figures appearing in this Placement Document have been rounded off to two decimal places. Accordingly, the figures
shown as totals herein may be not be an arithmetic aggregation of the figures which precede them.
References to the singular also refer to the plural and one gender also refers to any other gender, wherever applicable. All
the numbers in this Placement Document have been presented in lakhs or whole numbers, unless stated otherwise. One
lakh represents 1,00,000 and one crore represents 1,00,00,000.

13
INDUSTRY AND MARKET DATA
Industry and market data used in this Placement Document has been obtained or derived from publicly available
information as well as various industry publications and sources.
Statistical information, industry and market data used throughout this Placement document has been obtained from the
2018 report titled “Overview of Mumbai Metropolitan Region” (the “PropEquity Report”) which is a commissioned
report prepared by P.E. Analytics (“PropEquity”), the report titled “2018 Asia Pacific – Real Estate Market Outlook
India” issued by CBRE, Inc. (“CBRE”) in the first quarter of 2018, the report titled “CBRE Marketview – India Office”
issued by CBRE in the second half of 2017, and the report titled “Hotel Review Report – 2017, India” issued by STR, Inc.
(“STR”) and Horwath HTL Limited. (“Horwath”) in 2017.
Our Company has not commissioned any report for purposes of this Placement Document other than the PropEquity
Report. We commissioned PropEquity to provide an independent assessment of the opportunities, dynamics and
competitive landscape of the real estate industry in MMR.
Industry publications generally state that the information contained in such publications has been obtained from publicly
available documents from various sources believed to be reliable but their accuracy and completeness are not guaranteed
and their reliability cannot be assured. Accordingly, no investment decisions should be made on the basis of such
information. Although we believe the industry and market data used in this Placement Document is reliable, it has not
been independently verified by us or the Book Running Lead Managers or any of their affiliates or advisors. The extent to
which the industry and market data used in this Placement Document is meaningful depends on the reader’s familiarity
with and understanding of the methodologies used in compiling such data. There are no standard data gathering
methodologies in the industry in which our Company conducts its business, and methodologies and assumptions may vary
widely among different industry sources. Accordingly, investment decisions should not be based solely on such
information.
CBRE Disclaimer:
This report is based on public information considered to be reliable and other market assumptions and CBRE does not
warrant the accuracy or completeness of the information contained herein. Users are advised to read the entire report and
conduct their own research / due diligence before relying on the contents of this report. Any person’s reliance on the
Report is on an as is where is basis with no specific representations and warranties by CBRE. CBRE owes no person or
entity any contractual or tort liability with respect to their reliance on this report.
CBRE Links:
Particulars Report Page
India Office, Q1 2018 https://www.cbre.co.in/en/research-reports/India-Office-MarketView-Q1-2018
Retail H2, 2017 https://www.cbre.co.in/en/research-reports/India-Retail-Market-View-H2-2017
India Market Outlook 2018 https://www.cbre.com/report-download?PUBID=3b120338-ee2a-4495-8363-
cf5d4ff1104b
In addition, the reports can be found on our website as follows: https://www.oberoirealty.com/real-estate-
investment/investors#!investor_kit
PropEquity Disclaimer:
1. The Data has been prepared/collected by P.E. Analytics based upon information available to the public and
sources, believed to be reliable. Though utmost care has been taken to ensure its accuracy, no representation or
warranty, express or implied, is made that it is accurate or complete. P.E. Analytics has reviewed the Data and,
in so far as it includes current or historical information, it is believed to be reliable, although its accuracy and
completeness cannot be guaranteed.
2. P.E. Analytics accepts no liability and will not be liable for any losses or damages arising directly or indirectly
(including special, incidental, consequential, punitive or exemplary damages) from your use of the research,
howsoever arising, and including any losses, damages or expenses arising from, but not limited to, any defects,
errors, imperfections, faults, mistakes or inaccuracies in the research data, its contents.
This data is subject to change and cannot be verified with complete certainty due to limits on the availability and reliability
of the raw data and other limitations and uncertainties inherent in any statistical survey. In many cases, there is no readily
available external information (whether from industry associations, government bodies or other organisations) to validate
market-related analysis and estimates, so we have also relied on internally developed estimates.

14
Neither we nor the Book Running Lead Managers have independently verified this data and neither we nor the Book
Running Lead Managers make any representation regarding the accuracy or completeness of such data. Similarly, internal
estimates and surveys, industry forecasts and market research, while believed to be reliable, have not been independently
verified and neither we nor the Book Running Lead Managers make any representation as to the accuracy and
completeness of information based on trade, industry and government publications and websites, data reports compiled
by government bodies, professional organisations and analysts, or from other external sources.
The extent to which the market and industry data used in this Placement Document is meaningful depends on the
familiarity with and understanding of the reading of the methodologies used in compiling such data.
Marriott Disclaimer:
The Marriott group (which includes Marriott or any of its affiliates) is not a promoter or sponsor of the Company. The
Marriott group does not, or will not, vouch for the accuracy and completeness of any statements or information included
in this Placement Document and shall not be held responsible for the same. Further, our Company has no rights or interests
over the trademarks owned by Marriott or its affiliates.

15
AVAILABLE INFORMATION
Our Company has agreed that, for so long as any Equity Shares are “restricted securities” within the meaning of Rule
144(a)(3) under the Securities Act, our Company will, during any period in which it is neither subject to Section 13 or
15(d) of the U.S. Securities Exchange Act of 1934, as amended nor exempt from reporting pursuant to Rule 12g3-2(b)
thereunder, provide to any holder or beneficial owner of such restricted securities or to any prospective purchaser of such
restricted securities designated by such holder or beneficial owner, upon the request of such holder, beneficial owner or
prospective purchaser, the information required to be provided by Rule 144A(d)(4) under the Securities Act, subject to
compliance with applicable provisions of Indian law.

16
FORWARD-LOOKING STATEMENTS
Certain statements contained in this Placement Document that are not statements of historical fact constitute “forward-
looking statements”. Investors can generally identify forward-looking statements by terminology such as “aim”,
“anticipate”, “believe”, “continue”, “can”, “could”, “estimate”, “expect”, “intend”, “may”, “objective”, “plan”,
“potential”, “project”, “pursue”, “shall”, “should”, “target”, “will”, “would”, or other words or phrases of similar import.
Similarly, statements that describe the strategies, objectives, plans or goals of our Company are also forward-looking
statements. However, these are not the exclusive means of identifying forward-looking statements.
All statements regarding our expected financial conditions, results of operations, business plans and prospects are forward-
looking statements. These forward-looking statements include statements as to our business strategy, planned projects,
revenue and profitability (including, without limitation, any financial or operating projections or forecasts), new business
and other matters discussed in this Placement Document that are not historical facts. These forward-looking statements
contained in this Placement Document (whether made by us or any third party), are predictions and involve known and
unknown risks, uncertainties, assumptions and other factors that may cause the actual results, performance or achievements
of our Company to be materially different from any future results, performance or achievements expressed or implied by
such forward-looking statements or other projections. All forward-looking statements are subject to risks, uncertainties
and assumptions about our Company that could cause actual results to differ materially from those contemplated by the
relevant forward-looking statement. Important factors that could cause the actual results, performances and achievements
of our Company to be materially different from any of the forward-looking statements include, among others:
geographical concentration in the MMR region and the economic, regulatory and other changes;
performance of, and the prevailing conditions affecting, the real estate market in Mumbai and in India generally;
implementation of RERA;
volatility in prices of, or shortages of, key building materials;
financial stability of our tenants, in particular, our key tenants and our hotel and school operators;
changes to the slum rehabilitation schemes currently in effect in Mumbai; and
difficulties in expanding our business into additional geographical markets in India.
Additional factors that could cause actual results, performance or achievements of our Company to differ materially
include, but are not limited to, those discussed under the sections entitled “Risk Factors”, “Industry Overview”,
“Management’s Discussion and Analysis of Financial Condition and Results of Operations” and “Our Business” on pages
39, 89, 73 and 98, respectively.
The forward-looking statements contained in this Placement Document are based on the beliefs of our management, as
well as the assumptions made by, and information currently available to, the management of our Company. Although we
believe that the expectations reflected in such forward-looking statements are reasonable at this time, it cannot assure
Bidders that such expectations will prove to be correct. Given these uncertainties, Bidders are cautioned not to place undue
reliance on such forward-looking statements. In any event, these statements speak only as of the date of this Placement
Document or the respective dates indicated in this Placement Document, and we undertake no obligation to update or
revise any of them, whether as a result of new information, future events or otherwise. If any of these risks and uncertainties
materialize, or if any of our Company’s underlying assumptions prove to be incorrect, the actual results of operations or
financial condition of our Company could differ materially from that described herein as anticipated, believed, estimated
or expected. All subsequent forward-looking statements attributable to us are expressly qualified in their entirety by
reference to these cautionary statements.

17
ENFORCEMENT OF CIVIL LIABILITIES
Our Company is a public limited liability company incorporated under the laws of India. Certain of our Directors and Key
Managerial Personnel named herein are residents of India and a majority of the assets of our Company and such persons
are located in India. As a result, it may be difficult or may not be possible for investors outside India to effect service of
process upon our Company or such persons in India, or to enforce judgments obtained against such parties outside India.
Recognition and enforcement of foreign judgments is provided for under Section 13 and Section 44A of the Code of Civil
Procedure, 1908, as amended (the “Civil Procedure Code”), on a statutory basis. Section 13 of the Civil Procedure Code
provides that a foreign judgment shall be conclusive regarding any matter directly adjudicated upon between the same
parties or parties litigating under the same title, except: (i) where the judgment has not been pronounced by a court of
competent jurisdiction; (ii) where the judgment has not been given on the merits of the case; (iii) where it appears on the
face of the proceedings that the judgment is founded on an incorrect view of international law or a refusal to recognise the
law of India in cases in which such law is applicable; (iv) where the proceedings in which the judgment was obtained were
opposed to natural justice; (v) where the judgment has been obtained by fraud; or (vi) where the judgment sustains a claim
founded on a breach of any law then in force in India.
India is not a party to any international treaty in relation to the recognition or enforcement of foreign judgments. However,
Section 44A of the Civil Procedure Code provides that a foreign judgment rendered by a superior court (within the meaning
of that section) in any jurisdiction outside India which the Government has by notification declared to be a reciprocating
territory, may be enforced in India by proceedings in execution as if the judgment had been rendered by a competent court
in India. However, Section 44A of the Civil Procedure Code is applicable only to monetary decrees not being in the nature
of any amounts payable in respect of taxes or other charges of a like nature or in respect of a fine or other penalties and
does not include arbitration awards.
Among other jurisdictions, the United Kingdom of Great Britain and Northern Ireland, Republic of Singapore and Hong
Kong have been declared by the Government to be reciprocating territories for the purposes of Section 44A of the Civil
Procedure Code, but the United States of America has not been so declared. A judgment of a court in a jurisdiction which
is not a reciprocating territory may be enforced only by a fresh suit upon the judgment and not by proceedings in execution.
The suit must be brought in India within three years from the date of the foreign judgment in the same manner as any other
suit filed to enforce a civil liability in India. It is unlikely that a court in India would award damages on the same basis as
a foreign court if an action is brought in India. Furthermore, it is unlikely that an Indian court would enforce foreign
judgments if it viewed the amount of damages awarded as excessive or inconsistent with public policy of India. Further,
any judgment or award in a foreign currency would be converted into Rupees on the date of such judgment or award and
not on the date of payment. A party seeking to enforce a foreign judgment in India is required to obtain approval from the
RBI to repatriate outside India any amount recovered, and any such amount may be subject to income tax in accordance
with applicable laws.

18
EXCHANGE RATES
Fluctuations in the exchange rate between the Rupee and the U.S. dollar will affect the U.S. dollar equivalent of the Rupee
price of the Equity Shares on the Stock Exchanges. These fluctuations will also affect the conversion into U. S. dollar of
any cash dividends paid in Rupees on the Equity Shares.
The following table sets forth, for the periods indicated, information with respect to the exchange rate between the Rupee
and the U.S. dollar (in Rupees per U.S. dollar) based on the reference rates released by the RBI. No representation is made
that the Rupees amounts actually represent such amounts in U.S. dollar or could have been or could be converted into
USD at the rates indicated, any other rates, or at all.
On June 12, 2018, the exchange rate (the RBI reference rate) was ₹ 67.46 to USD 1. (Source: www.rbi.org.in)
(₹ per USD)
Period end Average(1) High(2) Low(3)
Financial Year:
2018 65.04 64.45 65.76 63.35
2017 64.84 67.09 68.72 64.84
2016 66.33 65.46 68.78 62.16
Quarter ended:
March 31, 2018 65.04 64.31 65.23 63.35
December 31, 2017 63.93 64.74 65.55 63.93
September 30, 2017 65.36 64.29 65.76 63.63
June 30, 2017 64.74 64.46 65.04 64.00
Month ended:
May 31, 2018 67.45 67.54 68.39 66.61
April 30, 2018 66.78 65.64 66.83 64.93
March 31, 2018 65.04 65.02 65.23 64.80
February 28, 2018 65.10 64.37 65.10 63.61
January 31, 2018 63.69 63.64 63.98 63.35
December 31, 2017 63.93 64.24 64.54 63.93 (Source: www.rbi.org.in)
Notes: (1) Average of the official rate for each working day of the relevant period;
(2) Maximum of the official rate for each working day of the relevant period;
(3) Minimum of the official rate for each working day of the relevant period; and (4) If the RBI reference rate is not available on a particular date due to a public holiday, exchange rates of the previous working day have been
disclosed.
(5) The RBI reference rates are rounded off to two decimal places.

19
DEFINITIONS AND ABBREVIATIONS
This Placement Document uses the definitions and abbreviations set forth below, which you should consider when reading
the information contained herein. References to any legislation, act or regulation shall be to such term as amended from
time to time. Unless otherwise specified, the capitalised terms used in this Placement Document shall have the meaning
as defined hereunder.
The words and expressions used in this Placement Document but not defined herein, shall have, to the extent applicable,
the meaning ascribed to such terms under the Companies Act, the SEBI Regulations, the SCRA, the Depositories Act or
the rules and regulations made thereunder. Notwithstanding the foregoing, terms used in the sections entitled “Statement
of Tax Benefits” and “Financial Statements” on pages 177 and 197, respectively, shall have the meaning given to such
terms in such sections.
Company Related Terms
Term Description
the Company, our Company
or the Issuer
Oberoi Realty Limited, a public limited company incorporated under the Companies
Act, 1956 and having its registered and corporate office at Commerz, 3rd Floor,
International Business Park, Oberoi Garden City, Off Western Express Highway,
Goregaon (East), Mumbai 400 063
we, our or us Our Company along with its Subsidiaries, Joint Ventures and Joint Venture
(Subsidiaries)
Articles or Articles of
Association
The articles of association of our Company, as amended from time to time
Audited Consolidated
Financial Statements
Our audited consolidated financial statements along with the respective notes thereto,
(i) as at and for the Financial Years ended March 31, 2018 prepared in accordance with
the Companies Act, 2013 and Ind AS together with the report dated April 24, 2018
issued by S R B C & CO LLP, Chartered Accountants (ii) as at and for the Financial
Years ended March 31, 2017 prepared in accordance with the Companies Act, 2013
and Ind AS together with the report dated May 4, 2017 issued by M/s. P. Raj & Co.,
Chartered Accountants (iii) as at and for the Financial Years ended March 31, 2016
prepared in accordance with the Companies Act, 2013 and Indian GAAP together with
the report dated April 29, 2016 issued by M/s. P. Raj & Co., Chartered Accountants
Board of Directors or Board The board of directors of our Company or any duly constituted committee thereof
Directors The directors of our Company
Equity Shares The equity shares of our Company having a face value of ₹10 each
ESOP Scheme The Employee Stock Option Scheme 2009
Joint Ventures I-Ven Realty Limited and Sangam City Township Private Limited
Joint Venture (Subsidiaries) The joint ventures formed with certain of our Subsidiaries being, Zaco Aviation, Oasis
Realty, Siddhivinayak Realties Private Limited, Astir Realty LLP, Buoyant Realty
LLP, Saldanha Realty and Infrastructure LLP, Metropark Infratech and Realty
Developments Private Limited, Shri Siddhi Avenues LLP, Schematic Estate LLP and
Pursuit Realty LLP
Key Managerial Personnel The key managerial personnel of our Company as disclosed in the section entitled
“Board of Directors and Senior Management” on page 133
KPSL Kingston Property Services Limited, one of our Subsidiaries
Marriott Marriott International, Inc.
Memorandum or
Memorandum of Association
The memorandum of association of our Company, as amended from time to time
OCL Oberoi Constructions Limited, one of our Subsidiaries
Registered and Corporate
Office
The registered and corporate office of our Company situated at Commerz, 3rd Floor,
International Business Park, Oberoi Garden City, Off Western Express Highway,
Goregaon (East), Mumbai 400 063
Promoter Vikas Oberoi
Promoter Group Persons and entities constituting the promoter group of our Company and as
determined in accordance with the SEBI Regulations
Sangam City Township Sangam City Township Private Limited, one of our Joint Ventures
Senior Managerial Personnel Our senior managerial personnel as disclosed in the section entitled “Board of
Directors and Senior Management” on page 133
Shri Siddhi Avenues Shri Siddhi Avenues LLP, one of our Joint Venture (Subsidiaries)
SRIL Saldanha Realty and Infrastructure LLP, one of our Joint Venture (Subsidiaries)
SRPL Siddhivinayak Realties Private Limited, one of our Joint Venture (Subsidiaries)
Subsidiaries Expressions Realty Private Limited, Incline Realty Private Limited, Integrus Realty
Private Limited, Kingston Hospitality and Developers Private Limited, Kingston

20
Term Description
Property Services Limited, Oberoi Constructions Limited, Oberoi Mall Limited,
Perspective Realty Private Limited and Sight Realty Private Limited.
Statutory Auditors S R B C & CO LLP, Chartered Accountants
Issue Related Terms
Term Description
Allocated/ Allocation The allocation of Equity Shares by our Company following the determination of the
Issue Price to successful Bidders on the basis of the Application Form submitted by
them, in consultation with the Book Running Lead Managers and in compliance with
Chapter VIII of the SEBI Regulations
Allot/ Allotment/ Allotted Unless, the context otherwise requires, the issue and allotment of Equity Shares to be
issued pursuant to the Issue
Allottees Bidders to whom Equity Shares are issued and Allotted pursuant to the Issue
Application Form The form (including any revisions thereof) pursuant to which an Eligible QIB shall
submit a Bid for the Equity Shares in the Issue
Bid(s) Indication of interest of a Bidder, including all permitted revisions and modifications
thereto, as provided in the Application Form, to subscribe for the Equity Shares to be
issued pursuant to the Issue
Bid/Issue Closing Date June 19, 2018, which is the last date up to which the Application Forms shall be
accepted by our Company or the Book Running Lead Managers on behalf of our
Company
Bid/Issue Opening Date June 13, 2018, which is the first date from which acceptance of the Application Forms
shall have commenced by our Company or the Book Running Lead Managers on behalf
of our Company
Bid/Issue Period Period between the Bid/Issue Opening Date and the Bid/Issue Closing Date, inclusive
of both days, during which Bidders can submit their Bids
Bidder Any prospective investor, being an Eligible QIB, who makes a Bid pursuant to the
terms of the Preliminary Placement Document and the Application Form
Book Running Lead
Managers
JM Financial Limited and Morgan Stanley India Company Private Limited
CAN or Confirmation of
Allocation Note
Note or advice to successful Bidders confirming Allocation of Equity Shares to such
successful Bidders after determination of the Issue Price and requesting payment for
the entire applicable Issue Price for all Equity Shares Allocated to such successful
Bidders
Closing Date The date on which Allotment of Equity Shares pursuant to the Issue shall be made, i.e.
on or about June 21, 2018
Cut-off Price The Issue Price of the Equity Shares to be issued pursuant to the Issue which shall be
finalised by our Company at its discretion in consultation with the Book Running Lead
Managers
Designated Date The date of credit of Equity Shares to the successful Bidders’s demat account, as
applicable to the respective Eligible QIBs
Eligible QIB QIBs which are not excluded pursuant to regulation 86(1)(b) of the SEBI Regulations.
Eligible FPIs applying under Schedule 2 of the FEMA 2017 will be considered as
Eligible QIBs in addition to other non-resident QIBs. However, FVCIs are not
permitted to participate in the Issue
Escrow Agent Axis Bank Limited
Escrow Account The account entitled “Oberoi Realty Limited-QIP-2018-19” opened with the Escrow
Agent, with regard to any money received/ to be received towards the subscription of
the Equity Shares, subject to the terms of the Escrow Agreement
Escrow Agreement The escrow agreement dated June 13, 2018, entered into amongst our Company, the
Escrow Agent and the Book Running Lead Managers for collection of the Bid Amounts
and for remitting refunds, if any, of the amounts collected, to the Bidders
Floor Price The floor price of ₹ 509.29 per Equity Share, which has been calculated in accordance
with Regulation 85(1) of Chapter VIII of the SEBI Regulations. In terms of the SEBI
Regulations, the Issue Price cannot be lower than the Floor Price, except that our
Company has offered a discount of not more than 5% on the Floor Price in terms of
Regulation 85(1) of the SEBI Regulations
Issue The offer, issue and Allotment of 2,40,00,000 Equity Shares to Eligible QIBs, each at
a price of ₹ 500.00 per Equity Share, pursuant to Chapter VIII of the SEBI Regulations
and the provisions of the Companies Act, 2013
Issue Price ₹ 500.00 per Equity Share
Issue Size The issue of 2,40,00,000 Equity Shares aggregating to ₹ 1,200.00 crore

21
Term Description
Mutual Fund A mutual fund registered with SEBI under the Securities and Exchange Board of India
(Mutual Funds) Regulations, 1996
Pay-in Date The last date specified in the CAN for payment of application monies by the Eligible
QIBs
Placement Agreement The placement agreement dated June 13, 2018 entered into amongst our Company and
the Book Running Lead Managers
Placement Document This placement document dated June 19, 2018 issued by our Company in accordance
with Chapter VIII of the SEBI Regulations and Sections 42 and 62 of the Companies
Act, 2013
Preliminary Placement
Document
The preliminary placement document dated June 13, 2018 issued in accordance with
Chapter VIII of the SEBI Regulations and Sections 42 and 62 of the Companies Act,
2013
Pricing Date The date of determination of the number of Equity Shares to be placed through the
Issue and the Issue Price
QIBs or Qualified
Institutional Buyers
Qualified institutional buyers as defined under Regulation 2(1)(zd) of the SEBI
Regulations or such other persons as may be permitted by applicable laws to acquire
the Equity Shares to be issued pursuant to the Issue
QIP Qualified institutions placement, being private placement to QIBs under Chapter VIII
of the SEBI Regulations and applicable sections of the Companies Act, 2013, read with
applicable rules of the Companies (Prospectus and Allotment of Securities) Rules,
2014
Relevant Date June 13, 2018, which is the date of the meeting of the committee duly authorised by
the Board deciding to open the Issue
Technical/Industry Related Terms
Term Description
CC Commencement Certificate
Completed projects Projects where construction has been completed and an occupation certificate has been
obtained
Developable Area The total area which we develop in each of our projects, including carpet area, common
area, service and storage area, car parking and other open areas on which we may
undertake any development.
The carpet areas are calculated as per the law prevailing prior to the introduction of
RERA.
FSI Floor Space Index, which means the quotient of the ratio of the combined gross floor
area of all floors, excepting areas specifically exempted, to the total area of the plot
Internal Floor Area Internal floor area is fixed for our Completed projects.
For our Ongoing and Planned projects, internal floor area is determined on the basis of
maximum FSI and assuming maximum TDRs that can be utilised in the project (TDRs
may not have been actually acquired by us at the time of this calculation)
IOA Intimation of Approval
IOD Intimation of Disapproval
LOI Letter of Intent
MCGM Municipal Corporation of Greater Mumbai
MHADA Maharashtra Housing Area Development Authority
MOFA Maharashtra Ownership of Flats (Regulation of the Promotion of Construction, Sale,
Management and Transfer) Act, 1963
NA Order Non Agricultural Order
OC Occupation Certificate
Occupancy Level The combined Saleable Area of the occupied units of a project as a percentage of the
total Saleable Area of the project available for lease
Ongoing project A project in respect of which the necessary legal documents relating to the acquisition
of land or development rights have been executed by us and/ or key land related
approvals have been obtained and any one of the following activities are being
undertaken (not necessarily in the sequence set out herein): (a) on-site construction of
the project has commenced; (b) initial detailed design for civil and landscaping is being
undertaken and work has commenced on detailed design; (c) project launch activity
which includes the construction of a show residence, sales office and other supporting
infrastructure at the project site has commenced; or (d) an architect has been appointed
and a detailed concept design is being prepared
Planned project A project for which land or development rights have been acquired or a memorandum

22
Term Description
of understanding or an agreement to acquire or a joint development agreement has been
executed, in each case, by us, either directly or indirectly, and preliminary management
development plans are complete
Saleable Area The part of the developable area over which we may have some or all economic interest
and for which the respective owner or, in the case of projects for which we follow a
lease model, the tenant, is obliged to pay or for which we estimate that the respective
owner or tenant will pay.
All figures are based on management’s estimates.
SRA Slum Rehabilitation Authority
TDR Transferable Development Rights, which means, when in certain circumstances, the
development potential of land may be separated from the land itself and may be made
available to the owner of the land in the form of transferable development rights
Conventional and General Terms/Abbreviations
Term Description
AGM Annual general meeting
AIF(s) Alternative investment funds, as defined and registered with SEBI under the Securities
and Exchange Board of India (Alternative Investment Funds) Regulations, 2012
AS Accounting Standards issued by ICAI
AY Assessment year
BSE BSE Limited
Calendar Year Year ending on December 31 of the relevant year
Category III Foreign
Portfolio Investor
An FPI registered as a category III foreign portfolio investor under the SEBI FPI
Regulations
CDSL Central Depository Services (India) Limited
CIN Corporate identification number
Civil Procedure Code The Code of Civil Procedure, 1908
Companies Act The Companies Act, 1956 or the Companies Act, 2013, as applicable
Companies Act, 1956 The Companies Act, 1956 and the rules made thereunder (without reference to the
provisions thereof that have ceased to have effect upon notification of the Notified
Sections)
Companies Act, 2013 The Companies Act, 2013 and the rules made thereunder, to the extent in force pursuant
to notification of the Notified Sections
Depositories Act The Depositories Act, 1996
Depository A depository registered with SEBI under the Securities and Exchange Board of India
(Depositories and Participants) Regulations, 1996
Depository Participant A depository participant as defined under the Depositories Act
EGM Extraordinary general meeting
Eligible FPIs Foreign portfolio investors that are eligible to participate in the Issue and do not include
Category III Foreign Portfolio Investors who are not allowed to participate in the Issue
FDI Foreign direct investment
FDI Policy Consolidated Foreign Direct Investment Policy notified under Circular No. D/o IPP F.
No. 5(1)/2017-FC-1, effective from August 28, 2017 issued by the Department of
Industrial Policy and Promotion, Ministry of Commerce and Industry, Government of
India
FEMA The Foreign Exchange Management Act, 1999, and the regulations issued thereunder
FEMA 2017 The Foreign Exchange Management (Transfer or Issue of Security by a Person
Resident Outside India) Regulations, 2017
FIR First Information Report
Fiscal Year, financial year,
Financial Year, FY or Fiscal
Period of 12 months ended March 31 of that particular year, unless otherwise stated
Form PAS-4 Form PAS-4 as prescribed under the Companies (Prospectus and Allotment of
Securities) Rules, 2014
FPI Foreign portfolio investors as defined under the SEBI FPI Regulations and includes
person who has been registered under the SEBI FPI Regulations.
FVCI Foreign venture capital investors as defined and registered with SEBI under the
Securities and Exchange Board of India (Foreign Venture Capital Investors)
Regulations, 2000
GAAP Generally Accepted Accounting Principles
GAAR General anti-avoidance rules
GDP Gross domestic product

23
Term Description
GIR General index registrar
GoI/Government Government of India, unless otherwise specified
GST Goods and services tax
IAS Rules Companies (Indian Accounting Standards) Rules, 2015
ICAI The Institute of Chartered Accountants of India
IFRS International Financial Reporting Standards of the International Accounting Standards
Board
Income Tax Act The Income-tax Act, 1961
Ind AS Indian accounting standards prescribed under Section 133 of the Companies Act, 2013,
as notified under Rule 3 of the IAS Rules
Indian GAAP Generally accepted accounting principles in India
IT Information technology
Maharashtra Real Estate
Regulatory Authority
The real estate regulatory authority established by the State of Maharashtra under
RERA
MAT Minimum alternate tax
MCA Ministry of Corporate Affairs
MMR Mumbai Metropolitan Region
MoU Memorandum of understanding
Notified Sections Sections of the Companies Act, 2013 that have been notified by the Government of
India
NRE Non-resident (external)
NRI Non-resident Indian
NSDL National Securities Depository Limited
NSE National Stock Exchange of India Limited
PAN Permanent account number
PAS Rules The Companies (Prospectus and Allotment of Securities) Rules, 2014
RBI Reserve Bank of India
RBI Act The Reserve Bank of India Act, 1934
Real Estate Regulatory
Authority
The real estate regulatory authority established under RERA
Regulation S Regulation S under the U.S. Securities Act
RERA Real Estate (Regulation and Development) Act, 2016
RoC Registrar of Companies, Maharashtra, at Mumbai
Rs./Rupees/INR/₹ Indian Rupees
Rule 144A Rule 144A under the U. S. Securities Act
SCRA Securities Contracts (Regulation) Act, 1956
SCRR Securities Contracts (Regulation) Rules, 1957
SDJM Sub-Divisional Judicial Magistrate
SEBI Securities and Exchange Board of India
SEBI Act The Securities and Exchange Board of India Act, 1992
SEBI SBEB Regulations The Securities and Exchange Board of India (Share Based Employee Benefits)
Regulations, 2014
SEBI FPI Regulations The Securities and Exchange Board of India (Foreign Portfolio Investors) Regulations,
2014
SEBI Insider Trading
Regulations
The Securities and Exchange Board of India (Prohibition of Insider Trading)
Regulations, 2015
SEBI Listing Regulations The Securities and Exchange Board of India (Listing Obligations and Disclosure
Requirements) Regulations, 2015
SEBI Regulations The Securities and Exchange Board of India (Issue of Capital and Disclosure
Requirements) Regulations, 2009
Stock Exchanges The BSE and the NSE
STT Securities transaction tax
Takeover Regulations Securities and Exchange Board of India (Substantial Acquisition of Shares and
Takeover) Regulations, 2011
U.K. United Kingdom
US$/U.S. dollar/USD United States Dollar, the legal currency of the United States of America
U.S. GAAP Generally accepted accounting principles in the United States of America
U.S. QIBs Qualified institutional buyers as defined in Rule 144A
U.S. Securities Act The U.S. Securities Act of 1933, as amended
VCF Venture capital fund as defined and registered with SEBI under the Securities and
Exchange Board of India (Venture Capital Fund) Regulations, 1996 or the SEBI AIF
Regulations, as the case may be

24
DISCLOSURE REQUIREMENTS UNDER FORM PAS-4 PRESCRIBED UNDER THE COMPANIES ACT,
2013
The disclosure requirements as provided in Form PAS-4 and the relevant pages in this Placement Document where these
disclosures, to the extent applicable, are provided below:
Sr.
No.
Disclosure Requirements Relevant Page of this Placement
Document
1. GENERAL INFORMATION
a. Name, address, website and other contact details of the company indicating
both registered office and corporate office.
Cover page, 196
b. Date of incorporation of the company. Cover page, 196
c. Business carried on by the company and its subsidiaries with the details of
branches or units, if any.
98
d. Brief particulars of the management of the company. 133
e. Names, addresses, DIN and occupations of the directors. 133
f. Management’s perception of risk factors. 39
g. Details of default, if any, including therein the amount involved, duration
of default and present status, in repayment of:
190
(i) Statutory dues;
(ii) Debentures and interest thereon;
(iii) Deposits and interest thereon; and
(iv) Loan from any bank or financial institution and interest thereon.
h. Names, designation, address and phone number, email ID of the nodal/
compliance officer of the company, if any, for the private placement offer
process.
196
2. PARTICULARS OF THE OFFER
a. Date of passing of board resolution. 34, 70, 146 and 196
b. Date of passing of resolution in the general meeting, authorising the offer
of securities.
34, 70, 146 and 196
c. Kinds of securities offered (i.e. whether share or debenture) and class of
security.
Cover page, 34
d. Price at which the security is being offered including the premium, if any,
along with justification of the price.
Cover page, 34
e. Name and address of the valuer who performed valuation of the security
offered.
Not applicable
f. Amount which the company intends to raise by way of securities. Cover page, 34
g. Terms of raising of securities: Not applicable
(i) Duration, if applicable;
(ii) Rate of dividend;
(iii) Rate of interest;
(iv) Mode of payment; and
(v) Repayment.
h. Proposed time schedule for which the offer letter is valid. 20
i. Purposes and objects of the offer. 68
j. Contribution being made by the promoters or directors either as part of the
offer or separately in furtherance of such objects.
Not applicable
k. Principle terms of assets charged as security, if applicable. Not applicable
3. DISCLOSURES WITH REGARD TO INTEREST OF DIRECTORS, LITIGATION ETC.
a. Any financial or other material interest of the directors, promoters or key
managerial personnel in the offer and the effect of such interest in so far as
it is different from the interests of other persons.
Not applicable
b. Details of any litigation or legal action pending or taken by any Ministry or
Department of the Government or a statutory authority against any
promoter of the offeree company during the last three years immediately
preceding the year of the circulation of the offer letter and any direction
issued by such Ministry or Department or statutory authority upon
conclusion of such litigation or legal action.
190
c. Remuneration of directors (during the current year and last three financial
years).
136
d. Related party transactions entered during the last three financial years
immediately preceding the year of circulation of offer letter including with
regard to loans made or, guarantees given or securities provided.
140
e. Summary of reservations or qualifications or adverse remarks of auditors
in the last five financial years immediately preceding the year of circulation
88

25
Sr.
No.
Disclosure Requirements Relevant Page of this Placement
Document
of offer letter and of their impact on the financial statements and financial
position of the company and the corrective steps taken and proposed to be
taken by the company for each of the said reservations or qualifications or
adverse remark.
f. Details of any inquiry, inspections or investigations initiated or conducted
under the Companies Act or any previous company law in the last three
years immediately preceding the year of circulation of offer letter in the
case of company and all of its subsidiaries. Also if there were any
prosecutions filed (whether pending or not) fines imposed, compounding of
offences in the last three years immediately preceding the year of the offer
letter and if so, section-wise details thereof for the company and all of its
subsidiaries.
190
g. Details of acts of material frauds committed against the company in the last
three years, if any, and if so, the action taken by the company.
190
4. FINANCIAL POSITION OF THE COMPANY
a. The capital structure of the company in the following manner in a tabular
form:
70
(i)(a) The authorised, issued, subscribed and paid up capital (number of
securities, description and aggregate nominal value);
(b) Size of the present offer;
(c) Paid up capital:
(A) After the offer;
(B) After conversion of convertible instruments (if applicable); and Not applicable
(d) Share premium account (before and after the offer). 70
(ii) The details of the existing share capital of the issuer company in a tabular
form, indicating therein with regard to each allotment, the date of allotment,
the number of shares allotted, the face value of the shares allotted, the price
and the form of consideration.
70
Provided that the issuer company shall also disclose the number and price
at which each of the allotments were made in the last one year preceding
the date of the offer letter separately indicating the allotments made for
considerations other than cash and the details of the consideration in each
case.
Not applicable
b. Profits of the company, before and after making provision for tax, for the
three financial years immediately preceding the date of circulation of offer
letter.
197
c. Dividends declared by the company in respect of the said three financial
years; interest coverage ratio for last three years (Cash profit after tax plus
interest paid/interest paid).
72
d. A summary of the financial position of the company as in the three audited
balance sheets immediately preceding the date of circulation of offer letter.
36
e. Audited Cash Flow Statement for the three years immediately preceding
the date of circulation of offer letter.
36
f. Any change in accounting policies during the last three years and their
effect on the profits and the reserves of the company.
293
5. A DECLARATION BY THE DIRECTORS THAT
a. The company has complied with the provisions of the Act and the rules
made thereunder.
370
b. The compliance with the Act and the rules does not imply that payment of
dividend or interest or repayment of debentures, if applicable, is guaranteed
by the Central Government.
c. The monies received under the offer shall be used only for the purposes and
objects indicated in the Offer letter.
I am authorised by the Committee of Directors, a committee of our Board
of Directors, vide resolution number 3 dated June 19, 2018 to sign this form
and declare that all the requirements of Companies Act, 2013 and the rules
made thereunder in respect of the subject matter of this form and matters
incidental thereto have been complied with. Whatever is stated in this form
and in the attachments thereto is true, correct and complete and no
information material to the subject matter of this form has been suppressed
or concealed and is as per the original records maintained by the promoters
subscribing to the Memorandum of Association and Articles of Association

26
Sr.
No.
Disclosure Requirements Relevant Page of this Placement
Document
It is further declared and verified that all the required attachments have been
completely, correctly and legibly attached to this form.

27
SUMMARY OF BUSINESS
Unless otherwise indicated, the financial information as of and for the years ended March 31, 2018 and 2017 has been
extracted or derived from our Ind AS Audited Consolidated Financial Statements for the respective years, and the financial
information as of and for the year ended March 31, 2016 has been extracted or derived from our financial statements for
the year ended March 31, 2016 restated in accordance with Ind AS for comparative information and presented in the Ind
AS Audited Consolidated Financial Statements for the year ended March 31, 2017.
OVERVIEW
We are a real estate development company operating in the Mumbai Metropolitan Region (“MMR”), focused on premium
developments. We believe that our customer-centric approach and our focus on delivering high quality projects have
enabled us to establish a reputed brand. We, together with our Promoter and Promoter Group, have a track record of over
30 years of developing high quality projects that are driven by an emphasis on strong project execution, contemporary
architecture and quality construction. As of March 31, 2018, we, together with our Promoter and Promoter Group, have
delivered over 40 projects across micro market segments in MMR covering approximately 11,298,358 square feet of
Saleable Area.
While our focus is on residential projects, we have a diversified portfolio of projects across key segments of the real estate
market including residential, office space, retail, hospitality and social infrastructure projects in mixed-use and single-
segment developments. By integrating residential projects with office space, retail, hospitality or social infrastructure
projects, we seek to create “destination developments” such as Oberoi Garden City, which we believe enhance the
desirability of our mixed-use projects.
Our in-house team leverages many decades of strong real estate industry experience in the execution of land acquisitions,
the procurement of regulatory approvals and sales and marketing. We have a proven and scalable outsourcing model that
emphasises quality design, construction and property management. We work with international and domestic architects
and contractors. We believe that this outsourcing model provides us with the scalability required to undertake large
developments and also enables our management to focus on the key drivers of our business.
Through our deep understanding of the regulatory processes for property development in our markets and a compliance-
driven approach to our business, we seek to ensure effective risk management and timely delivery to our customers. Under
the guidance of our highly experienced management team, we seek to maintain an optimal capital structure with prudent
use of leverage. We believe this has enabled us to adapt to the changing market environment in a focused and constructive
manner. This has also developed our ability to understand our customer needs enabling us to determine product mix and
configuration. Our transparent and customer-friendly processes enhance customer experience and customer satisfaction.
We currently follow a sale model for our residential projects and a predominantly lease model for our office space and
retail projects as we believe this provides us with stable cash flows. In the past, we have also followed a sale model for a
portion of our office space projects. In our hospitality projects, we currently follow an operating agreement model,
whereby the hotel is owned by us and operated by a hotel chain. As of March 31, 2018, we own 1,698,161 square feet of
Saleable Area of our Completed office space (including 100,900 square feet of Saleable Area occupied by us) and retail
projects, which follow the lease model, and 381,820 square feet of Saleable Area of our Completed hospitality project,
which follows the operating agreement model.
We currently have 11 Ongoing and 15 Planned projects, which we expect to provide a total Saleable Area of approximately
28,020,823 square feet. The estimated Saleable Area of our Ongoing and Planned projects as of March 31, 2018 is
summarised in the table below:
Project Type(1) Ongoing Percentage of
Total
Ongoing
Estimated
Saleable Area
Planned Percentage of
Total Planned
Estimated
Saleable Area
Grand Total Percentage
of Total
Estimated
Saleable
Area
Estimated
Saleable Area
(in sq. ft.)(1)
No. of
Projects
Estimated
Saleable Area
(in sq. ft.)(1)
No. of
Projects
Estimated
Saleable Area
(in sq. ft.)(1)
No. of
Projects
Residential 9,949,202 7 75.59% 7,430,537 5 50.01% 17,379,739 12 62.02%
Office Space - - 0.00% 3,764,331 4 25.33% 3,764,331 4 13.43%
Retail 2,579,270 2 19.60% 279,939 1 1.88% 2,859,209 3 10.20%
Hospitality 313,300 1 2.38% 2,142,927 3 14.42% 2,456,227 4 8.77%
Social Infrastructure
319,707 1 2.43% 1,241,611 2 8.36% 1,561,318 3 5.57%
Total 13,161,479 11 100.00% 14,859,344 15 100.00% 28,020,823 26 100.00% (1) Information provided in respect of our Ongoing and Planned projects is based on current management plans and subject to change. In general, we expect to
begin construction on our Planned projects over the next three years.
Our consolidated total revenue and consolidated profit after tax were ₹ 129,200.70 lakhs and ₹ 45,880.32 lakhs for the
year ended March 31, 2018, ₹ 116,104.19 lakhs and ₹ 37,858.76 lakhs for the year ended March 31, 2017 and ₹ 145,891.41
lakhs and ₹ 43,555.60 lakhs for the year ended March 31, 2016.
28
COMPETITIVE STRENGTHS
Our primary competitive strengths include the following:
Favourably positioned to benefit from the rapidly evolving regulatory environment
We believe that we are favourably positioned to benefit from recent regulatory changes affecting the Indian real estate
industry, such as the introduction of the Real Estate (Regulation and Development) Act, 2016 (“RERA”), the
implementation of a comprehensive national goods and services tax (“GST”) regime, currency demonetisation and the
enactment of the Insolvency and Bankruptcy Code, 2016.
● RERA became effective in May 2017 and was aimed at enhancing accountability, transparency and uniformity
in practices across the real estate industry. Under RERA, real estate developers are required to register ongoing
projects, prior to the commencement of any marketing of such projects, with the applicable Real Estate
Regulatory Authority established pursuant to RERA. The registration process and subsequent ongoing disclosure
requirements are expected to provide greater transparency through the mandatory disclosure of information such
as project approval status, construction progress and sales volumes. In addition, RERA encourages financial
discipline through measures such as the “70:30 rule” which mandates that 70% of project receivables must be
maintained in a segregated account with permitted withdrawals only for land and construction costs in line with
the percentage of project completion (as certified by an architect, an engineer and a chartered accountant). This
measure safeguards customer interests and also effectively increases upfront working capital requirements for
property developers, which we believe will benefit well-capitalised companies like us by raising barriers to entry
for new entrants in our market. RERA also imposes penalties for non-compliance and establishes
grievance/dispute resolution procedures. For further details, please see the section entitled “Regulations and
Policies” on page 128.
● GST (implemented in July 2017) combines multiple taxes and levies by the Central and State Governments into
a unified tax structure. We expect the GST regime will be beneficial to real estate developers as well as purchasers
as it facilitates reducing the cost of complying with multiple tax systems and simplifies the purchase processes
for real estate. We believe that simplified processes will reduce the scope for non-transparent transactions and
benefit large, organised and transparent developers like us.
● In addition, we expect that we will benefit from demonetisation measures (undertaken in November 2016) in the
long term through formalisation of the economy and enhanced accountability, transparency and investor and
consumer confidence that we believe will result from these measures.
● The Insolvency and Bankruptcy Code, 2016, enacted in May 2016, created a single insolvency and bankruptcy
framework in India and established clear processes for corporate insolvency resolution and liquidation. We
believe that there will be an increase in insolvency and bankruptcy proceedings and, correspondingly, more
opportunities for us to make strategic acquisitions of stressed assets.
We expect the reforms will create a level playing field in the real estate industry and benefit well-organised real estate
developers, such as our Company, with established compliance processes and disciplined financial management. We
believe our core strengths, including our customer-centric approach, our established brands, our commitment to
transparency and our strong corporate governance and internal compliance processes, together with our focus on strategic
land acquisitions, our strong balance sheet and outsourced execution strategy position us favourably to benefit from the
changing regulatory environment. In addition, as real estate developers with weaker processes and systems exit the
industry due to the higher cost of doing business, we expect to benefit from strategic acquisition opportunities in the
industry.
Strong presence in MMR with established brand and reputation
Most of our projects are located in MMR. Mumbai is one of the most attractive real estate markets in India with one of
the largest average residential ticket sizes across various segments (Source: PropEquity, MMR Overview (Q1 2013-Q1
2018)). We have deep knowledge of the market and regulatory environment in MMR that we leverage to identify
opportunities in the region. We also believe that Mumbai’s position as the financial capital of India, together with the
demographics of the Mumbai population, with a high-income earning and discerning customer base and an expanding
segment of young, upwardly-mobile professionals provide an attractive market for our projects. We also benefit from the
limited availability and high prices of land in Mumbai, which creates demand for our projects while maintaining high
barriers to entry. In addition, we believe that proposed extensive infrastructure development in MMR in general, and
improved connectivity in the areas in which our projects are located, will generate greater demand for our projects. Many
of our large projects are located in close proximity to metro rail stations (existing, planned or under construction), which
we believe is particularly valuable for our retail and office space projects.
We believe our focus on customer satisfaction and emphasis on strong project execution, contemporary architecture, timely
delivery and quality construction have enabled us to establish a reputed brand and achieve sales at early stages of

29
development. In Fiscal Year 2017, we were awarded “Most Aspiring Real Estate Brand” in India at the Global Brands
Magazine Awards in the United Kingdom. We believe our established brand and reputation has enabled us, and will
continue to enable us, to obtain land development rights pursuant to which we develop land owned by third parties on a
revenue-share basis.
Proven and scalable business model with execution capabilities across verticals
Together with our Promoter and Promoter Group, we have a track record of delivering over 40 projects across multiple
verticals covering approximately 11,298,358 square feet of Saleable Area as of March 31, 2018. Our emphasis has been
on contemporary and environmentally friendly design, quality construction and property management.
Our strength is in the execution of land acquisitions, the procurement of regulatory approvals and sales and marketing.
We have an in-house team that leverages many decades of strong real estate industry experience in those areas. We
outsource all of our construction and design work to external service providers, such as architects and contractors, with
whom we have strong and long-standing relationships. We believe this outsourcing model has been a key factor of our
scalability. We believe that our reputation as a reliable and leading developer enables us to work with domestic and
international architects and contractors, particularly when there is high demand for their services. Our outsourcing model
enables us to leverage the expertise of our service providers, while enabling our management to focus on the key drivers
of our business. In addition, we have experienced and capable design management and project management teams in-
house who oversee and execute all aspects of project development to ensure timely project delivery within expected
specifications and budget. We also believe that our outsourcing model provides us with the scalability required not only
to undertake large developments such as Oberoi Garden City in Mumbai, but also to explore opportunities and undertake
similar and other developments in different parts of India.
In addition, our projects span different segments of the real estate market, such as residential, office space, retail,
hospitality and social infrastructure. We have created “destination developments” by developing integrated mixed-use
developments such as Oberoi Garden City, which is anchored by a shopping mall, a hotel, office spaces and an international
school. We believe large integrated developments enhance customer satisfaction, provide synergistic opportunities,
transform the positioning of the micro-market and help command a premium. Further, we are also currently developing
Sky City, an integrated mixed-use development in Borivali (East), Mumbai.
Robust pipeline of Ongoing and Planned projects across segments
We believe that we have a strong project pipeline which provides near term cash flow visibility. We currently have 11
Ongoing and 15 Planned projects. For information about our Ongoing and Planned projects, please see the table under “—
Overview” on page 27. We expect to launch most of these projects in the market over the next three to five years.
Approximately 6,623,539 square feet of estimated Saleable Area of our Ongoing and Planned office space and retail
projects will complement our Completed retail project, Oberoi Mall, which has approximately 552,893 square feet of
Saleable Area, and our Completed office space projects, Commerz I and Commerz II – Phase I, which have a combined
estimated Saleable Area of approximately 1,145,269 square feet (including 100,900 square feet of Saleable Area which is
occupied by us). These are indicative of our strategic focus on our retail and office space developments. Our Ongoing and
Planned projects span across various real estate verticals and are in locations that generally provide greater cash flow
visibility. We believe our pipeline of Ongoing and Planned projects across diverse real estate segments will provide
balanced cash flow and will help mitigate sector specific industry cycles.
Cash flow stability from our rental and hospitality properties
We currently follow a predominantly lease model for our office space and retail properties, which provides us with a stable
stream of cash flow to better manage cyclical risks. The table below summarises our Completed office space and retail
projects as of March 31, 2018:
Project
Name
Development Site /
Location
Project Type Actual
Saleable Area
(sq. ft.)
Total Saleable Area
Sold/ Booked for
Sale/ Leased (sq. ft.)
Occupancy
Level (%)
Actual Completion
Date(1)
Commerz I Oberoi Garden City,
Goregaon (E), Mumbai
Office space 318,600(2) 261,274 82.13 March 2008
Commerz II –
Phase I
Oberoi Garden City,
Goregaon (E), Mumbai
Office space 725,769 344,860 47.52 December 2013
Oberoi Mall Oberoi Garden City,
Goregaon (E), Mumbai
Retail 552,893 549,397 99.37 March 2008
(1) The completion date for our Completed projects is the date we received a full occupation certificate for each project.
(2) Excludes 100,900 square feet of Saleable Area which is occupied by us.
In addition, we own one Completed hotel, The Westin Mumbai – Garden City, with 269 rooms. The average Occupancy
Level for The Westin Mumbai – Garden City was 80.78% for the year ended March 31, 2018. We have leased the premises
of our Completed social infrastructure project, Oberoi International School, Goregaon to Oberoi Foundation, a public
charitable trust. As of March 31, 2018, the total estimated Saleable Area in our Planned and Ongoing retail, office space,

30
hospitality and social infrastructure projects was approximately 10,641,084 square feet. The table below summarises our
Planned and Ongoing retail and office space projects as of March 31, 2018:
Project Name(1) Development Site / Location Project Type(4)
Actual Saleable Area
(sq. ft.)(4)
Commerz II – Phase II Oberoi Garden City, Goregaon (E), Mumbai Office space 2,298,000
Mulund Commercial Mulund – West, Mumbai Office space 140,345
Sky City Extension Borivali, Mumbai Office space 1,046,047
Sangamcity – Commercial(2) Sangamcity, Sangamwadi, Pune Office space 279,939(2)
I-Ven Mall(3) Worli, Mumbai Retail 1,020,000(3)
Sky City Mall Borivali, Mumbai Retail 1,559,270
Sangamcity - Retail(2) Sangamcity, Sangamwadi, Pune Retail 279,939(2)
Total
6,623,539
(1) Information provided in respect of our Ongoing and Planned projects is based on current management plans and subject to change. In general,
we expect to begin construction on our Planned projects over the next three years.
(2) The land area and estimated Saleable Area reflects our 31.67% share in the joint venture. (3) Our share in the project is 50.00% of the estimated Saleable Area.
(4) Excludes approximately 2,456,227 square feet of Saleable Area in our hospitality projects and approximately 1,561,318 square feet of Saleable
Area in our social infrastructure projects.
Our consolidated rental and other related revenue was ₹ 23,383.05 lakhs (18.10% of our total revenue), ₹ 19,389.58 lakhs
(16.70% of our total revenue) and ₹ 17,886.01 lakhs (12.26% of our total revenue) for the years ended March 31, 2018,
2017 and 2016, respectively, from our Completed office space, retail projects and social infrastructure projects. Our
consolidated rent received from Oberoi Foundation (as per Ind AS 24 “Related Party Disclosures”) was ₹ 3,847.66 lakhs
for the year ended March 31, 2018. Our consolidated revenue from hospitality was ₹ 12,781.53 lakhs (9.89% of our total
revenue), ₹ 12,574.28 lakhs (10.83% of our total revenue) and ₹ 12,712.43 lakhs (8.71% of our total revenue) for the years
ended March 31, 2018, 2017 and 2016, respectively. The chart below shows our rental revenue from our Completed office
space, retail projects and social infrastructure projects for the years ended March 31, 2010 through 2018, as well as revenue
from hospitality for the same period.
Note: Figures mentioned above for FY 10 to FY 15 are in accordance with Indian GAAP and from FY 16 onwards as per Ind AS.
Prudent financial management
We strive to maintain an optimal capital structure with prudent use of leverage and a conservative debt policy. As of March
31, 2018, we maintained a debt to equity ratio of 0.28 (calculated as the ratio of long term borrowings (non-current), short
term borrowings (current) and current maturities of long term borrowings (non-current) to equity share capital and other
equity). We believe that we are well positioned to leverage our balance sheet to take advantage of a favourable business
cycle or market opportunity and we are well prepared for an adverse business cycle. The following chart shows our net
debt as of each of the fiscal years indicated. As indicated in the chart, during the year ended March 31, 2015, we acquired
the land for our Sky City development in Borivali (East), Mumbai and our net debt increased to ₹ 60,787.29 lakhs as of
March 31, 2015. After the acquisition, we repaid a portion of our outstanding borrowings and our net debt decreased to ₹
8,712.13 lakhs as of March 31, 2016. As of March 31, 2018, our net debt was ₹ 156,152.88 lakhs.

31
Note: Figures mentioned above for FY 10 to FY 15 are in accordance with Indian GAAP and from FY 16 onwards as per Ind AS.
We have also demonstrated a consistent track record of profitability, with consolidated profit after tax of ₹ 45,880.32
lakhs, ₹ 37,858.76 lakhs and ₹ 43,555.60 lakhs for the years ended March 31, 2018, 2017 and 2016, respectively. As of
March 31, 2018, our consolidated net worth, which includes equity share capital and other equity, was ₹ 609,237.37 lakhs
and we had cash and cash equivalents, other bank balances, fixed deposits with banks having remaining maturity for more
than twelve months, and investments in mutual funds of ₹ 13,253.35 lakhs. The following chart shows our consolidated
net worth and cash and cash equivalents as of each of the fiscal years indicated:
Note: Figures mentioned above for FY 10 to FY 15 are in accordance with Indian GAAP and from FY 16 onwards as per Ind AS.
In addition, all of our development sites which we own are fully paid for. We believe this mitigates one of the major risks
involved in project development. We believe that our financial strength and strong project pipeline make us well positioned
for changes in market conditions.
Strong and stable management team with strong corporate governance framework and business processes
We have a strong and experienced management team. Our management team has a long-term vision and has successfully
identified suitable land parcels and created landmark “destination developments”. We also believe that our management

32
team’s understanding of the market and flexibility in managing our operating and financial leverage has enabled us to
adapt to the changing market conditions in a focused and constructive manner. We believe that the understanding of the
management team about the real estate market will enable us to continue to take advantage of current and future market
opportunities.
We have a strong corporate governance framework driven by our board of directors. More than 50% of the members of
our board of directors are independent directors. In addition, we believe we have adopted detailed and transparent
disclosure practices. We were awarded the “Best for Disclosure & Transparency” and “Best for Investor Relations” in the
Corporate Governance Poll 2016 conducted by Asiamoney.
We also use technology and IT solutions extensively, including ERP, CRM, design and execution tools. With strong
corporate governance and business processes, we believe we are well positioned to manage and deal with business and
compliance risks.
STRATEGY
The key elements of our business strategy are as follows:
Widen customer base
We have strategically evaluated to create accessible developments with distinctive designs, functionalities, quality
construction and finishes to address aspirational customers through different brands. We intend to capitalise on our
expertise, experience, and business model to expand our customer base by offering products which are more accessible,
yet carry the same quality and finishes, albeit at slightly lower specifications. This strategy will allow us to cater to a wide
array of customers which desire aspirational developments and in our view are currently under served by the market
participants.
Drive scale
We intend to continue to follow our outsourcing model and further strengthen our relationships with key reputed service
providers such as architects and contractors. We believe our outsourcing model will enable our management to continue
to focus on our core business by outsourcing the design and construction of our projects to our service providers. We
expect to leverage our experience, expertise and business model to expand our portfolio across residential, retail, office
space, hospitality and social infrastructure through mixed-use developments. In particular, we intend to strategically push
towards retail developments where we see opportunity in light of increasing urbanisation, improving consumer confidence,
rising consumption patterns and expansion of leading retail brands in India. We intend to accomplish this by leveraging
our existing expertise as the developer of a profitable mall, our existing relationships with retail tenants and our focus on
prime locations with high connectivity.
Strategic land acquisition
We intend to take advantage of emerging consolidation opportunities in the real estate industry generated by regulatory
changes, such as RERA, and other market factors, by following a flexible strategy for land acquisition. We intend to
continue to evaluate various land acquisitions models, such as outright purchase, joint ventures, joint development and
development management. We also anticipate that insolvency and bankruptcy proceedings under the Insolvency and
Bankruptcy Code, 2016 against or by debt-ridden companies will provide opportunities to acquire stressed assets. We also
intend to continue to actively manage our operational and financial leverage to adapt to changing markets, as we have in
the past. For example, in 2002 and 2005, we leveraged to make acquisitions of land, such as in Mulund, Goregaon and
JVLR, as our management anticipated a growth in the real estate market. However, in 2007 and 2008, we prudently did
not make any land acquisitions even though we had adequate cash reserves as our management had concerns about the
viability of projects. Then in 2009 and 2014, we took advantage of multiple land acquisition opportunities, by acquiring
land in Worli (through a joint venture) and Borivali, respectively. Please see the chart under “—Competitive Strengths –
Prudent financial management” on page 30 for a depiction of our use of leverage in connection with our Borivali
acquisition.
Flexibility in capital investment and mode of development
We focus on acquiring land for development in the near- to medium-term. While we have purchased and will continue to
purchase land for development by making upfront payments for the land, we also seek to develop projects through
alternative structures that reduce our upfront capital commitment, such as entering into joint development or development
management agreements. For example, in our Oasis Realty development, our joint venture partner is responsible for
carrying out the slum rehabilitation portion, and we expect to earn revenue from the development and sale of the free-sale
portion (the portion of the development which can be commercially exploited to compensate for the obligation of
developing the slum rehabilitation component) on a revenue-share basis. In this way, we also benefit from the slum
development expertise of others and manage our development risks. We believe that such development strategies enable
our joint venture partners to get more value out of their land as our brand and the quality of our product are able to add

33
value to their property. In turn, we are then able to access quality land to develop and sell without significant capital
investment.
Expand across locations
While MMR remains and is expected to remain our primary focus, we have strategically evaluated and will continue to
evaluate, growth opportunities in other parts of India on a case by case basis. We intend to continue to focus on MMR
with a preference for large projects such as Oberoi Garden City, Sky City, Eternia and Enigma. Our development sites are
located in distinct areas of MMR, with different target markets, and we intend to continue to tailor our projects to the
particular requirements of each market.
Adaptive sales strategy
We intend to continue to our customer-centric approach by focusing on customer satisfaction throughout the property
ownership lifecycle, which includes property evaluation and research, property purchase, delivery of unit and post
possession. During the evaluation phase, we will continue to help our customers in informed decision-making by
simplifying sales terms and conditions. We also intend to continue to focus on providing our customers full disclosure of
sales terms and conditions, as well as innovative solutions and offers, such as our recent offer of payment terms with zero
GST impact and deferred payment options. During the property purchase stage, we aim to enhance our customers’
experience by providing dedicated relationship managers. We also aim to continue our focus on timely deliveries and
maintaining long term relationships with customers post possession.

34
SUMMARY OF THE ISSUE
The following is a general summary of the terms of the Issue. This summary should be read in conjunction with, and is
qualified in its entirety by, the more detailed information appearing elsewhere in this Placement Document, including the
sections entitled “Risk Factors”, “Use of Proceeds”, “Issue Procedure”, “Placement” and “Description of the Equity
Shares” on pages 39, 68, 145, 155 and 174, respectively.
Issuer Oberoi Realty Limited
Face Value ₹ 10 per Equity Share
Issue Price ₹ 500.00 per Equity Share
Floor Price ₹ 509.29 per Equity Share, calculated in accordance with Regulation 85(1) under
Chapter VIII of the SEBI Regulations.
Our Company has offered a discount of not more than 5% on the Floor Price in terms
of Regulation 85(1) of the SEBI Regulations.
Issue Size Issue of 2,40,00,000 Equity Shares, aggregating to ₹ 1,200.00 crore.
A minimum of 10% of the Issue Size i.e. 24,00,000 Equity Shares, shall be available
for Allocation to Mutual Funds only and 2,16,00,000 Equity Shares should be
available for Allocation to all Eligible QIBs, including Mutual Funds.
If no Mutual Fund subscribes to the minimum portion mentioned above, such
minimum portion or part thereof may be Allotted to other QIBs.
Date of Board Resolution April 24, 2018
Date of Shareholders’
Resolution
June 5, 2018
Eligible Investors Eligible QIBs to whom the Preliminary Placement Document and the Application
Form was circulated and who are eligible to bid and participate in the Issue. For
further details, please see the sections entitled “Issue Procedure – Qualified
Institutional Buyers” and “Transfer Restrictions” on pages 148 and 164.
Equity Shares issued and
outstanding immediately prior
to the Issue
33,96,02,237 Equity Shares
Equity Shares issued and
outstanding immediately after
the Issue
36,36,02,237 Equity Shares
Listing and Trading Our Company has obtained in-principle approvals dated June 13, 2018 in terms of
Regulation 28(1) of the SEBI Listing Regulations from the Stock Exchanges, for
listing of the Equity Shares issued pursuant to the Issue. Our Company will make
applications to each of the Stock Exchanges after Allotment to obtain final listing
and trading approval for the Equity Shares after the Allotment and after the credit of
the Equity Shares to the beneficiary account of the Depository Participant,
respectively.
Lock-up For details in relation to lock-up, please see the section entitled “Placement – Lock-
up” on page 155 for a description of restrictions on our Company in relation to the
Equity Shares.
Minimum Issue Size The minimum value of offer or invitation to subscribe for each Eligible QIB is
₹20,000 calculated at the face value of the Equity Shares.
Transferability Restrictions The Equity Shares Allotted pursuant to the Issue shall not be sold for a period of one
year from the date of Allotment, except on the floor of the Stock Exchanges. For
details in relation to other transfer restrictions, please see the section entitled
“Transfer Restrictions” on page 164.
Use of Proceeds The gross proceeds from the Issue are ₹ 1,200 crore.
The net proceeds from the Issue, after deducting estimated issue expenses including
fees, commissions and expenses of the Issue amounting to approximately ₹ 15 crore,
will be approximately ₹ 1,185 crore. Please see the section entitled “Use of
Proceeds” on page 68 for further information in relation to the use of net proceeds
from the Issue.
Risk Factors For details, please see the section entitled “Risk Factors” on page 39 for a discussion
of risks you should consider before deciding whether to subscribe for the Equity
Shares.
Pay-In Date The last date specified in the CAN sent to Eligible QIBs for payment of application
money.

35
Closing The Allotment of the Equity Shares pursuant to the Issue is expected to be made on
or about June 21, 2018.
Ranking The Equity Shares being issued pursuant to the Issue shall be subject to the
provisions of the Memorandum of Association and Articles of Association and shall
rank pari passu in all respects with the existing Equity Shares, including rights in
respect of dividends. Our shareholders will be entitled to participate in dividends and
other corporate benefits, if any, declared by our Company after the Closing Date, in
compliance with the Companies Act, 2013, the SEBI Listing Regulations and other
applicable laws and regulations. Our shareholders may attend and vote in
shareholders’ meetings on the basis of one vote for every Equity Share held.
For details, please see the section entitled “Description of the Equity Shares” on page
174.
Security Codes for the Equity
Shares
ISIN INE093I01010
BSE Code 533273
NSE Code OBEROIRLTY

36
SELECTED FINANCIAL INFORMATION
Prior to April 1, 2016, we prepared our financial statements in accordance with the Indian GAAP, prescribed by the ICAI,
the Companies Act, 1956, the Companies Act, 2013, Accounting Standards notified under the Companies Act and the
requirements of the SEBI Listing Regulations, each as applicable. With effect from April 1, 2016, we adopted Ind AS
prescribed under Section 133 of the Companies Act, 2013 read with the rules made thereunder and, accordingly, our
financial statements as of and for the years ended March 31, 2018 and March 31, 2017 have been prepared in accordance
with Ind AS and the Companies Act.
Our financial statements as of and for the year ended March 31, 2016 have been prepared in accordance with Indian
GAAP and restated in accordance with Ind AS for comparative information and presented in the Ind AS Audited
Consolidated Financial Statements for the year ended March 31, 2017. For more information about our transition to Ind
AS and a reconciliation between Indian GAAP and Ind AS, please see Note 4.2 to the Audited Consolidated Financial
Statements for the year ended March 31, 2017, included on page 293. The financial statements for the financial years
ended March 31, 2018 and March 31, 2017, prepared under Ind AS, and the financial statements for the year ended March
31, 2016, restated in accordance with Ind AS for comparative information, are not comparable with financial statements
prepared for prior periods in accordance with Indian GAAP. For further details, please see the sections entitled
“Management’s Discussion and Analysis of Financial Condition and Results of Operations” and “Financial Statements”
on pages 73 and 197, respectively.
Summary of Statement of Profit and Loss (Consolidated basis)
Particulars
For the year ended
March 31, 2018
For the year ended
March 31, 2017
For the year ended
March 31, 2016
(Ind AS) (Ind AS) (Ind AS)
(₹ in lakhs) (₹ in lakhs) (₹ in lakhs)
INCOME
Revenue from operations 1,26,542.90 1,11,374.39 1,41,614.71
Other income 2,657.80 4,729.80 4,276.70
Total revenue (A) 1,29,200.70 1,16,104.19 1,45,891.41
EXPENSES
Operating costs 95,034.64 43,707.13# 62,953.69#
Changes in inventories (48,247.66) - -
Excise duty 3.16 12.36 13.71
Employee benefits expense 6,715.33 6,416.17 5,705.84
Finance cost 686.31 557.22 683.26
Depreciation and amortisation 4,906.76 4,949.54 4,899.50
Other expenses 5,511.57 4,232.08 5,311.13
Total expenses (B) 64,610.11 59,874.50 79,567.13
Profit before share of profit of joint ventures
(net) and exceptional items (A-B) 64,590.59 56,229.69 66,324.28
Share of Profit/ (Loss) of joint ventures (net) 361.97 313.93 159.50
Profit before tax 64,952.56 56,543.62 66,483.78
Tax Expense
Current tax 21,976.10 18,677.95 21,653.27
Deferred tax (3,019.39) 6.91 1,229.09
Short / (excess) provision of tax in earlier years 115.53 (0.00) 45.82
Profit after tax (C) 45,880.32 37,858.76 43,555.60
Other comprehensive income
Items that will not be reclassified to profit or
loss in subsequent period
Re-measurement gains / (losses) on defined
benefit plans 172.56 30.95 (39.95)
Income tax effect (56.64) (10.78) 13.45
Share of other comprehensive income in Joint
Ventures
Re - measurement gains / (losses) on defined
benefit plans 4.22 3.35 (2.24)
Income tax effect (1.47) (1.04) 0.69
Total other comprehensive income/ (expenses)
for the year net of tax (D) 118.67 22.48 (28.05)
Total comprehensive income for the year (C +
D) (Comprising profit / (loss) and other
comprehensive income for the year)*
45,998.99 37,881.24 43,527.55
Earnings per equity share (face value of ₹10)

37
Particulars
For the year ended
March 31, 2018
For the year ended
March 31, 2017
For the year ended
March 31, 2016
(Ind AS) (Ind AS) (Ind AS)
(₹ in lakhs) (₹ in lakhs) (₹ in lakhs)
- Basic (in ₹) 13.51 11.15 12.96
- Diluted (in ₹) 13.51 11.15 12.96 # Operating costs includes changes in inventories
* Entire attributable to owner of parent
Summary of Balance Sheet (Consolidated basis)
Particulars
As on March 31, 2018 As on March 31, 2017 As on March 31, 2016
(Ind AS) (Ind AS) (Ind AS)
(₹ in lakhs) (₹ in lakhs) (₹ in lakhs)
ASSETS
(I) Non-current assets
(a) Property, Plant and equipments 20,623.87 22,750.90 24,400.28
(b) Capital work in progress 11,244.63 10,950.88& 4,876.15
(c) Investment properties 76,773.46 71,536.86 73,042.70
(d) Intangible assets 236.97 206.92 257.73
(e) Intangible assets under development 18.79 - -
(f) Financial assets
(i) Investments 2,40,655.32 1,60,178.05 1,37,664.74
(ii) Other financial assets 410.99 - -
(g) Deferred tax assets (net) 14,578.54 9,974.06 10,294.88
(h) Other non-current assets 14,615.61 14,311.03 14,009.28
3,79,158.18 2,89,908.70 2,64,545.76
(II) Current assets
(a) Inventories 4,24,673.38 3,76,636.72 3,33,924.39
(b) Financial Assets
(i) Investments 1,349.05 22,252.01 7,446.02
(ii) Trade receivables 18,131.39 10,578.83 11,224.49
(iii) Cash and cash equivalents 8,106.02 21,347.61 21,137.19
(iv) Bank balances other than (iii) above 3,566.29 13,818.64 10,049.32
(v) Loans 15,733.63 13,369.84 6,904.83
(vi) Other financial assets 232.60 - -
(c) Current tax assets (net) 1,863.84 1,783.85 1,908.26
(d) Other current assets 1,69,658.32 95,717.71 91,235.85
6,43,314.52 5,55,505.21 4,83,830.35
TOTAL ASSETS (I + II) 10,22,472.70 8,45,413.91 7,48,376.11
EQUITY AND LIABILITIES
(I) Equity
(a) Equity share capital 33,960.23 33,953.55 33,930.39
(b) Other equity 5,75,277.14 5,38,642.50 5,00,182.31
6,09,237.37 5,72,596.05 5,34,112.70
(II) Liabilities
(i) Non-current liabilities
(a) Financial liabilities
(i) Borrowings 67,864.18 74,937.77 34,943.38
(ii) Trade payables 1,463.53 713.29 375.49
(iii) Other financial liabilities 8,451.03 6.19 337.84
(b) Provisions 165.97 170.77 137.41
(c) Deferred tax liabilities (net) 3,705.16 - -
(d) Other non-current liabilities 1,445.75 7,100.58 4,624.14
83,095.62 82,928.60 40,418.26
(ii) Current liabilities
(a) Financial liabilities
(i) Borrowings 26,585.76 8,908.00 10,708.00
(ii) Trade payables 13,079.89 5,410.18 4,246.41
(iii) Other financial liabilities 96,555.60 3,442.68 2,086.76
(b) Other current liabilities 1,93,494.19 1,71,927.55 1,56,514.05
(c) Provisions 42.56 200.85 289.93
(d) Current tax liabilities (net) 381.71 - -
3,30,139.71 1,89,889.26 1,73,845.15
TOTAL LIABILITIES (i + ii) 4,13,235.33 2,72,817.86 2,14,263.41
TOTAL EQUITY AND LIABILITIES (I + II) 10,22,472.70 8,45,413.91 7,48,376.11 & Capital work in progress includes intangible assets under development.

38
Summary of Cash Flow Statement (Consolidated basis)
Particulars
For the year ended
March 31, 2018
For the year ended
March 31, 2017
For the year ended
March 31, 2016
(Ind AS) (Ind AS) (Ind AS)
(₹ in lakhs) (₹ in lakhs) (₹ in lakhs)
Net Cash inflow/ (outflow) from operating activities (20,582.80) 17,354.31 45,309.08
Net Cash inflow/ (outflow) from investing activities (58,825.01) (43,892.84) (12,081.93)
Net Cash inflow/ (outflow) from financing activities 65,099.99 33,556.29 (20,422.94)
Net increase/ (decrease) in cash and cash
equivalents (14,307.82) 7,017.76 12,804.21
Add: cash and cash equivalents at beginning of the
year 23,583.89 28,583.21 15,779.00
Cash and cash equivalents at end of the year 9,276.07 35,600.97 28,583.21
Reconciliation Statement of Cash and Bank Balances (Consolidated basis)
Particulars
For the year ended
March 31, 2018
For the year ended
March 31, 2017
For the year ended
March 31, 2016
(Ind AS) (Ind AS) (Ind AS)
(₹ in lakhs) (₹ in lakhs) (₹ in lakhs)
Cash and cash equivalents at the end of the year as
per above 9,276.07 35,600.97 28,583.21
Add: Balance with banks in dividend / unclaimed
dividend accounts 2.64 2.13 4.37
Add: Fixed deposits with banks, having remaining
maturity for less than twelve months 2,886.93 7,541.42 4,724.70
Add: Fixed deposits with banks (lien marked) 1,087.71 6,275.09 5320.25
Less: Short term liquid investment (out of the same
investment of ₹ 4.96 lakh (₹ 3,466.77 lakh) is lien
marked)
(1,170.05) (14,253.36) (7,446.02)
Fixed deposits with banks, having remaining
maturity for more than twelve months (410.99) - -
Cash and bank balance as per balance sheet 11,672.31 35,166.25 31,186.51

39
RISK FACTORS
Investment in the Equity Shares involves a high degree of risk and you should not invest any funds in the Issue unless you
can afford to take the risk of losing all or a part of your investment. You should carefully consider all the information in
this Placement Document, including the risks and uncertainties described below, before making an investment in the
Equity Shares. If any or some combination of the following risks actually occur, our business, prospects, financial
condition, results of operations, cash flows and the value of our properties could suffer, the market price of the Equity
Shares could decline and you may lose all or part of your investment. Unless specified or quantified in the relevant risk
factors below, we are not in a position to quantify the financial implications of any of the risks mentioned below. The risks
and uncertainties described in this section are those that our management believes are material, but these risks and
uncertainties may not be the only ones we face. Prospective investors should rely on their own examination of business,
financial statements and the industry. Prospective investors should consult their tax, financial and legal advisors.
Additional risks and uncertainties, including those that we are not aware of or deem immaterial, may also result in
decreased revenues, increased expenses or other events that could result in a decline in the value of the Equity Shares.
Any potential investor in our Equity Shares should pay particular attention to the fact that we are subject to a regulatory
environment in India which may differ significantly from that in other jurisdictions.
Unless otherwise indicated, the financial information as of and for the years ended March 31, 2018 and 2017 has been
extracted or derived from our Ind AS Audited Consolidated Financial Statements and the financial information as of and
for the year ended March 31, 2016 has been extracted or derived from our financial statements for the year ended March
31, 2016 restated in accordance with Ind AS for comparative information and presented in the Ind AS Audited
Consolidated Financial Statements for the year ended March 31, 2017.
This Placement Document also contains forward-looking statements that involve risks and uncertainties. Our actual
results could differ materially from those anticipated in these forward-looking statements as a result of certain factors,
including considerations described below and in the section entitled “Forward Looking Statements” on page 16.
To obtain a better understanding of our business, you should read this section in conjunction with the other sections of
this Placement Document, including the sections entitled “Our Business”, “Management’s Discussion and Analysis of
Financial Conditions and Results of Operations” and “Financial Statements” on pages 98, 73 and 197, respectively,
together with all other financial information contained in this Placement Document.
INTERNAL RISK FACTORS
RISKS RELATING TO OUR BUSINESS
1. There are outstanding legal proceedings pending against our Company, Subsidiaries, Joint Ventures and Joint
Ventures (Subsidiaries), which, if determined adversely, could affect our business, prospects, financial
condition, cash flows and results of operations.
Our Company, Subsidiaries, Joint Ventures and Joint Ventures (Subsidiaries) are subject to various legal
proceedings. These legal proceedings are pending at different levels of adjudication before various courts,
tribunals, statutory, regulatory and other judicial authorities, and, if determined against us, could adversely affect
our business, prospects, financial condition and results of operations. Such proceedings could divert management
time and attention, and consume financial resources in their defence or prosecution. We can give no assurance
that these legal proceedings will be decided in our favour or that no further liability may arise from such
proceedings in the future. Any new developments, such as any change in applicable Indian law or any rulings
against us by appellate courts or tribunals, may require us to make provisions in our financial statements that
could increase expenses and current liabilities, which could adversely affect our results of operations. Moreover,
as at March 31, 2018, our Company has certain unpaid statutory dues because of disputes. Further, we may be
involved in disputes with various parties involved in development and sale of our properties, such as contractors,
sub-contractors, suppliers, joint venture partners, occupants, and claimants of title over land and governmental
authorities. For details, please see the section entitled “Legal Proceedings” on page 190.
2. We depend significantly on our success in our residential business, as this is our primary focus.
Our primary focus is on the development of premium residential real estate projects for sale. As of March 31,
2018, our Ongoing, Planned and Completed (but not fully sold) residential projects constituted approximately
62.02% of the total estimated Saleable Area in our Ongoing, Planned and Completed projects (excluding
Completed projects that have been fully sold). We rely on our ability to understand the preferences of our
residential customers and to develop projects that suit their needs. We aim to create aspirational projects that we
believe have distinctive designs or functionalities with quality construction and finishes, as we believe that this
enhances our brand and reputation, and enables us to sell our units at early stages of development. Our inability
to provide customers with distinctive designs or functionalities and quality construction or our failure to
continually anticipate and respond to customer needs may affect our business and prospects and could lead to

40
some of our customers favouring our competitors, which could, in turn, materially and adversely affect our
business prospects, financial condition and results of operations.
3. Our real estate development activities are geographically concentrated in and around MMR. Consequently,
we are exposed to risks from economic, regulatory and other changes in MMR, which in turn may have an
adverse effect on our business, results of operations, cash flows and financial condition.
Our real estate development activities are primarily focused in and around MMR, which may perform differently
from, and may be subject to market conditions and regulatory developments that are different from, real estate
markets in other parts of India or the world. Other than our Planned project at Sangam City, which is located in
Pune, all of our Ongoing and Planned projects are located in MMR. For details of our projects, please see the
section entitled “Our Business” on page 98.
The real estate market in MMR may be affected by various factors outside our control, including prevailing local
and economic conditions, changes in the supply and demand for properties comparable to those we develop,
changes in the applicable governmental regulations, economic conditions, demographic trends, employment and
income levels and interest rates, among other factors. These factors may contribute to fluctuations in real estate
price, rate of sales and the availability of land in MMR and could adversely affect the demand for, and pricing
of, our Ongoing and Planned projects. Any such risk may be further exacerbated by the illiquid nature of real
estate investments generally. Consequently, our business, results of operations, cash flows and financial condition
have been and will continue to be heavily dependent on the performance of, and the prevailing conditions
affecting the real estate market in MMR.
4. Our business is subject to RERA, which may require more time and cost to comply with.
The Government notified RERA in the official gazette on May 1, 2016 and RERA became effective in May 2017.
RERA has been introduced to regulate the real estate industry and to ensure, among others, imposition of certain
responsibilities on real estate developers and accountability toward customers and protection of their interest.
RERA has imposed certain obligations on real estate developers, including us, such as mandatory registration of
real estate projects, not issuing any advertisements or accepting advances unless real estate projects are registered
under RERA, maintenance of a separate account for amounts realized from each real estate project and restrictions
on withdrawal of amounts from such accounts and taking customer approval for major changes in sanction plan.
In addition, we will have to comply with state-specific rules and regulations which will be enacted by the relevant
state government where our Ongoing projects are or our future or Planned projects may be located, due to the
introduction of RERA. For instance, Maharashtra has issued the Maharashtra Real Estate (Regulation
Development) (Registration of Real Estate Projects, Registration of Real Estate Agents, Rates, of Interest and
Disclosure on Website) Rules, 2017 along with four other Rules. While most of the state governments have
notified rules in relation to RERA, other states are in the process of doing so. For details, please see the section
entitled “Regulations and Policies” on page 128.
To ensure compliance with the requirements of RERA, we may need to allocate additional resources, which may
increase our regulatory compliance costs and divert management attention. Further, we may face challenges in
interpreting and complying with the provisions of RERA due to limited jurisprudence on them. In the event our
interpretation of provisions of RERA differs from, or contradicts with, any judicial pronouncements or
clarifications issued by the Government in the future, we may face regulatory actions or we may be required to
undertake remedial steps. Any non-compliance of the provisions of RERA or such state-specific legislations may
result in punishments (including fines or imprisonment) and revocation of registration of our Ongoing projects,
which may have an adverse effect on our business, operations and financial condition.
5. It is difficult to predict our future performance, or compare our historical performance between periods, as
our revenue fluctuates significantly from period to period. In particular, the revenue recognition policy
applicable to us may change going forward.
Until March 31, 2018, we recognized revenue in accordance with the Guidance Note on “Accounting for Real
Estate Transactions (for entities to whom Ind AS is applicable)” issued by the Institute of Chartered Accountants
of India (“ICAI”) in May 2016, which required recognition of revenue under the percentage of completion
method and allowed recognition of revenue only when (i) all critical approvals necessary for project
commencement have been obtained, (ii) at least 25% of estimated construction and development cost (excluding
land, development rights and borrowing cost) have been incurred, (iii) at least 25% of the total saleable area is
secured by agreement or a letter of allotment (containing salient terms of agreement to sell) with buyers and (iv)
receipt of at least 10% of the sales consideration per contract. We refer to the requirement under clauses (ii) and
(iii) above as the “25% Threshold” in this Placement Document. The percentage of completion is calculated
based on the total project cost incurred to the total estimated project cost including land and borrowing cost.
Starting April 1, 2018, we would be required to recognize revenue in accordance with a new revenue standard,
Ind AS 115 “Revenue from contracts with customers” which was notified on March 28, 2018 and establishes a

41
five-step model to account for revenue arising from contracts with customers. The new revenue standard will
supersede all current revenue recognition requirements under Ind AS and the Guidance Note described above.
We believe that our contracts with customers satisfy the conditions of Ind AS 115 for recognition of revenue over
time, and we therefore expect to continue recognizing revenue under the percentage of completion method going
forward. However, Ind AS 115 does not explicitly specify the 25% Threshold, prescribed under the percentage
of completion method under the erstwhile Guidance Note. In order to ensure that our historical results are
comparable to our future results, and in the absence of any threshold specified in Ind AS 115, we may follow the
25% Threshold as part of our revenue recognition policy. However, there can be no assurance that we will not be
required to change the 25% Threshold and apply a different threshold either as a result of further accounting or
regulatory guidance or a change in the practice in this regard or for any other reason whatsoever. In the event
there is a change in the 25% Threshold in our revenue recognition policy, it may have a material impact on our
revenues going forward and our revenue may fluctuate significantly period over period. Further, in such an event
our historical revenues may not be comparable to our revenues going forward and period-to-period comparisons
of our results of operations may not be meaningful and should not be relied upon as indicative of our future
performance.
In addition, under the percentage of completion method of revenue recognition, our revenue from sales depends
upon the volume of bookings that we are able to obtain in relation to our projects as well as the rate of progress
of construction. Our bookings depend on our ability to market and sell our projects and the willingness of our
customers to pay for developments or enter into sale agreements well in advance of receiving possession of
properties, which can be affected by prevailing market sentiment. Construction progress depends on various
factors, including the availability of labour and raw materials, the timely receipt of regulatory clearances and the
absence of contingencies such as litigation and adverse weather conditions. The occurrence of any such
contingencies could cause our revenues to fluctuate significantly, which could in turn adversely affect our
margins. We also cannot predict when and at what prices we may acquire the land development rights we require
for a given project. In acquiring the land development rights, we pay the government a premium which has
increased significantly and could continue increasing in the future. In addition, we complete differing numbers
of projects in each period, and cannot predict with certainty the rate of progress of construction or time of the
completion of our real estate developments due to lags in development timetables occasionally caused by
unforeseen circumstances.
We also derive some recurring revenues from lease income in respect of certain of our office space and retail
developments. Lease payment defaults by tenants would cause us to lose the revenue associated with such leases.
In the event of a tenant default, we may experience delays in enforcing our rights as landlord and may incur
substantial costs in protecting our investment and re-leasing our property and we may not be able to re-lease the
property for the rent previously received, if at all.
Our results of operations may also fluctuate from period to period due to a combination of other factors beyond
our control, including the timing during each year of the sale or rental of properties that we have developed, and
any volatility in expenses such as land and development right acquisition and construction costs. Depending on
our operating results in one or more periods, we may experience cash flow problems, thereby resulting in our
business, financial condition and results of operations being adversely affected. Such fluctuations may also
adversely affect our ability to fund ongoing and future projects.
As a result of one or more of these factors, we may record significant turnover or profits during one accounting
period and significantly lower turnover or profits during prior or subsequent accounting periods. Therefore, we
believe that period-to-period comparisons of our results of operations are not necessarily meaningful and should
not be relied upon as indicative of our future performance.
6. Certain information in this Placement Document is based on management estimates which may change, and
we cannot assure you of the completeness or the accuracy of other statistical data contained in this Placement
Document.
Certain information contained in this Placement Document, such as the quantum of land or development rights
owned by us, the location and type of development, the Saleable Area, Developable Area, estimated construction
commencement and completion dates, our funding requirements and our intended use of proceeds of the Issue,
is based solely on management estimates. The total area of property that is ultimately developed and the actual
total Saleable Area may differ from the descriptions of the property presented herein and a particular project may
not be completely booked, sold, leased or developed until a date subsequent to the expected completion date.
We may also have to revise our funding estimates, development plans (including the type of proposed
development) and the estimated construction commencement and completion dates of our projects depending on
future contingencies and events, including, among others:
(i) changes in laws and regulations;
(ii) receipt of statutory and regulatory approvals;

42
(iii) irregularities or claims with respect to title to land or agreements related to the acquisition of land;
(iv) the ability of competitors to complete their services in a timely manner and on budget;
(v) delays, cost overruns or modifications to our Ongoing and Planned projects;
(vi) commencement of new projects and new initiatives; and
(vii) changes in our business plans due to prevailing economic conditions.
In addition, the industry and market data in the section entitled “Industry Overview” on page 89 is based on the
PropEquity Report and various publications and reports from agencies that we believe are reliable. We
commissioned the PropEquity Report for the purpose of confirming our understanding of the industry in
connection with the Issue. However, neither we, nor any of our affiliates or advisors connected with the Issue has
verified the information in the PropEquity Report or the publications and reports cited. Further, the PropEquity
Report and the other publications and reports cited were prepared based on information as of specific dates and
may no longer be current or reflect current trends. Due to possibly flawed or ineffective data collection methods
or discrepancies between published information and market practice, the statistics herein may be inaccurate or
may not be comparable to statistics produced elsewhere and should not be unduly relied upon. Further, there is
no assurance that they are stated or compiled on the same basis or with the same degree of accuracy, as the case
may be, in reports or other publicly available information prepared by the same or different third party analysts.
Opinions in the PropEquity Report and cited publications and reports that are based on such estimates,
projections, forecasts and assumptions may thus prove to be inaccurate. Therefore, we cannot guarantee the
quality or reliability of such materials, nor do we make any representations as to their accuracy or completeness.
7. Our management has discretion in how it may use the proceeds of the Issue and it may use them in ways you
may not agree with.
Our use of the proceeds of the Issue is at the discretion of the management of our Company. As described in the
section entitled “Use of Proceeds” on page 68, we intend to use the Net Proceeds for (i) the acquisition of land,
land development rights, or development rights (directly or indirectly through other means) by paying premiums,
fees or charges as required under applicable laws to the regulatory authorities; (ii) working capital requirements
of our Company; (iii) to invest in our Subsidiaries, Joint Ventures and affiliates; (iv) capital expenditure; (v)
repayment of debt; (vi) any cost incurred towards the objects of our Company; and (vii) general corporate
purposes as per our Company’s growth and business related plans from time to time. However, we have not
entered into any definitive agreements and do not have any definite and specific commitments towards the
aforementioned purposes for which our Company intends to use the Net Proceeds. The planned use of the Net
Proceeds is based on current conditions and is subject to change in light of changes in external circumstances,
costs, other financial conditions or business strategies. Our management will have broad discretion in how we
apply the proceeds and there is no assurance that we will use the proceeds of the Issue in ways with which you
agree.
8. We may not hold, or may not be able to prove that we hold, good title to our real estate assets and we do not
have and may not be able to obtain title insurance guaranteeing title or land development rights.
In India, property records do not provide a guarantee of title. Property records in India have not been fully
computerised and are generally maintained and updated manually through physical records of all land-related
documents. This process may take a significant amount of time and result in inaccuracies or errors. For example,
we have identified discrepancies in the land area in revenue records, the area in title deeds and/or the actual
physical area of some of our land. In certain cases, our name may not have been updated in the land records as
owners of the land. It is therefore difficult to obtain and rely on accurate and up-to-date property records, which
could delay or impede our development or acquisition activities.
In addition, we may not have good and marketable title to some of our land as a result of non-execution or non-
registration or inadequate stamping of conveyance deeds and other acquisition documents, or may be subject to,
or affected by, encumbrances of which we may not be aware. A portion of land for which we are seeking to obtain
development rights consists of agricultural land. The title to agricultural land is often fragmented and the land
may, in many cases, have multiple owners and claimants who may not have perfect title to it. The land may also
be subject to acquisition proceedings under applicable laws. Some of our projects are also being executed through
joint ventures with third parties who may not have good and marketable title. Legal disputes in respect of land
title can take several years and considerable expense to resolve if they become the subject of court proceedings
and their outcome can be uncertain. If we or the owners of the land, with whom we enter into joint venture or
development agreements are unable to resolve such disputes with these claimants, we may lose our interest in
such land.
We may not therefore be able to assess or identify disputes, unregistered encumbrances or adverse possession
rights over title to real property in which we have invested or may invest. Failure to obtain, or to prove that we
hold, good title to a particular plot of land may materially prejudice the success of a development for which that
plot is a critical part, may require us to write off expenditures in respect of that development and may adversely
affect our property valuations and prospects. Prospective investors should note that neither legal counsel to our
43
Company nor to the Book Running Lead Managers is providing opinions in respect of title to our land. For details,
please see the section entitled “Our Business” on page 98.
In certain instances, the consideration for land acquisition is payable on a deferred basis. If we are unable to make
such deferred payment on time, or at all, on our current land reserves or future land reserves, it would materially
or adversely affect our ability to develop such land and may also result in a failure to realize a profit on our initial
investment.
The lands registered in our name may have irregularities in title or irregularities may arise in the future. In
addition, title insurance is not commercially available in India to guarantee title or land development rights in
respect of land. The difficulty of obtaining title insurance in India means that title records provide only for
presumptive rather than guaranteed title, and that we face uninsured risk of loss of lands we believe we own
interests in or have development rights over. The absence of title insurance, coupled with the difficulties in
verifying title to land, may increase our exposure to third-party claims to the property. We can provide no
assurance that we have, or may not be able to prove that we hold, valid title or rights in respect of all of the land
we believe we own or have development rights over and are unable to insure against such risk.
9. We pay advances for land purchases and if we are unable to close the transaction, we may lose the entire
advance.
We face risks relating to the payment of advances for certain land purchases. In certain cases, we had, have and
may pay advances for land purchases which go towards the purchase price of the land upon closing. However, if
we fail to successfully complete such a transaction where we have paid an advance, we may lose a portion of, or
the entirety of, the advance. There is no guarantee that we will be able to close a transaction. There are a variety
of factors that can affect our ability to close, some of which may not be in our control. For example, we may have
to obtain the necessary approvals for transfer of the land, we may have insufficient funds to complete the sale or
we may decide not to purchase the land whether because of changes in economic conditions, political conditions
or social infrastructures. We could also find ourselves liable to the sellers of the land for losses suffered by them.
There can be no assurance as to how much of the advance would be refunded to us or how much we would need
to compensate the seller in excess of the advance, should the transaction not close.
10. We may not be able to successfully identify and acquire suitable land for development or successfully identify
and collaborate with joint venture partners for projects executed pursuant to joint development or joint
development management models, which may adversely affect our business and growth prospects.
Our ability to identify suitable land for development is vital to our business. Once a potential development site
has been identified, site visits and feasibility studies/surveys are undertaken, which include detailed analyses of
factors such as regional demographics, gap analysis of current property development initiatives and market needs,
and market trends. Such information may not be accurate, complete or current. Any decision to acquire land,
which is based on inaccurate, incomplete or outdated information or any change in circumstances, may result in
certain risks and liabilities associated with the acquisition of such land, which could adversely affect our business,
financial condition and results of operations.
Our ability to acquire ownership or development rights over suitable sites is dependent on a number of factors
that may be beyond our control. These factors include the availability of suitable land, market conditions, the
willingness of land owners to sell or grant development rights over land on attractive terms, the availability and
cost of any required financing, encumbrances on the land, government directives on land use, and the obtaining
of permits and approvals for land development. In addition, it is our normal practice to evidence our preliminary
agreements to acquire interest in land in the form of a memorandum of understanding. However, conveyance of
the land does not occur upon signing of the memorandum of understanding and formal transfer of title to or
interest in land by the seller (at which time stamp duty becomes payable) is generally completed only after all
requisite governmental consents and approvals have been obtained. Our acquisition of interests in land are
therefore also subject to the risk that sellers may during such time identify and transact with alternative purchasers
or decide not to sell the land.
In addition, we also seek to develop projects through alternative structures that reduce our upfront capital
commitment, such as entering into joint development or development management agreements. However, we
cannot assure that we will be able to identify and secure the collaboration, on terms beneficial to us or at all, of
joint venture partners for any projects we seek to develop pursuant to a joint development or development
management model. In addition, pursuant to guidelines issued by the Maharashtra Real Estate Regulatory
Authority in 2017, all land owners and investors in a real estate project subject to a revenue sharing arrangement
will be treated as promoters for purposes of relevant laws and regulations. The added regulatory burden of being
treated as a promoter may dissuade certain land owners and investors from entering into joint development or
development management arrangements with us. If we are unable to successfully identify and secure the
collaboration of land owners and investors as joint venture partners, we may be required to change our business

44
strategy from that described in this Placement Document and our business, financial condition and results of
operations may be materially affected.
11. Our registered trademark and trade name “Oberoi Realty” may be infringed by third parties and we may be
subject to intellectual property disputes.
We have registered the trademark and trade name “Oberoi Realty” with the trademarks registry at Mumbai under
Class 16, Class 19, Class 36 and Class 37. Third parties may infringe upon our trademark and/or trade name, or
our joint venture partners may misuse the trademark and/or trade name “Oberoi Realty”, causing damage to our
business prospects, reputation and goodwill. Unauthorised use by any third parties of the trade name “Oberoi
Realty” may also cause damage to our business prospects, reputation and goodwill and result in a dilution of the
value of our trademark and trade name. If we are unable to register our trademarks for various reasons including
our inability to remove objections to our trademark applications, we may not be able to claim registered
ownership of such trademarks and consequently, we may not be able to seek remedies for infringement of those
trademarks by third parties other than relief against passing off by other entities, causing damage to our business
prospects, competitive position, reputation and goodwill. We may not be able to detect any unauthorized use or
take appropriate and timely steps to enforce or protect our trademarks.
Oberoi Hotels Private Limited and our wholly-owned subsidiary, Oberoi Constructions Limited (“OCL”) have
entered into an agreement dated November 27, 2009 pursuant to which OCL is entitled to use the mark “Oberoi”
with respect to its real estate and construction businesses and only in conjunction with construction, development,
realty or words connoting real estate affairs. Additionally, in the event OCL decides to enter into activities which
overlap with the main business and operations of Oberoi Hotels Private Limited, OCL may do so provided it does
not use the mark “Oberoi”. Oberoi Hotels Private Limited and OCL have agreed to take fair measures to avoid
consumer confusion with respect to their areas of business.
In addition, although our Promoter has entered into a non-compete undertaking with our Company dated
December 23, 2009, for certain identified projects, including projects being developed by Promoter Group entities
over which we have no direct control, and in certain circumstances, he can continue to develop real estate under
the “Oberoi Realty” brand or any other brand other than through our Company or its Subsidiaries. Accordingly,
any actions on the part of our Promoter or such Promoter Group entities that negatively affect the “Oberoi Realty”
brand could also have a material adverse effect on our business, financial condition and results of operations.
We may also be required to defend against charges of infringement of trademark or proprietary rights of third
parties. These defences could require us to incur substantial expenses and to divert significant effort of our
technical and management personnel, and could result in our loss of rights to use the “Oberoi Realty” brand or
require us to pay monetary damages or royalties to licence proprietary rights from third parties. For example, we
are subject to pending litigation regarding the use of the trademark “THREE SIXTY WEST”. For further details,
please see the section entitled “Legal Proceedings” on page 190. An adverse outcome of any dispute with respect
to our trademark or other proprietary rights could adversely affect our business, financial condition and results of
operations.
Further, we may not have adequate mechanisms in place to protect our confidential information. While we do
take precautions to protect confidential information against breach of trust by employees, consultants, customers
and suppliers, unauthorised disclosure of confidential information may still occur.
12. Cybersecurity, data security and data privacy breaches may create liability for us, damage our reputation, and
harm our business.
In the ordinary course of business, we have access to and routinely process the personal information of customers,
employees and joint venture partners. While we have programs and measures in place designed to safeguard this
data, and while we have implemented access controls designed to limit the risk of unauthorized use or disclosure
by employees, the techniques used to obtain unauthorized access to data are complex and changing, and may be
difficult to detect for long periods of time. A cyberattack, disruption, intrusion, theft or other breach or an
inadvertent act by an employee, could result in unauthorized access to, or disclosure of, confidential data,
resulting in civil or criminal penalties, costs and reputational harm that could materially and adversely affect our
business, financial condition and results of operations. As the cybersecurity landscape evolves, we may find it
necessary to make further investments to protect data and infrastructure, which can be costly.
Data collection and storage are increasingly subject to legislation and regulations in various jurisdictions and
governments and international organisations are increasingly acting to protect the privacy and security of personal
information. For example, the European General Data Protection Regulation imposes, amongst other things,
obligations on data controllers and provides mechanisms to safeguard data subjects. Complying with these
evolving and varying requirements could require significant expense and effort. In addition, violations of these
laws can result in significant penalties, claims by regulators or third parties, and damage to our brand and
business.

45
13. We will continue to be controlled by our Promoter and certain related entities after the completion of the Issue.
As of March 31, 2018, our Promoter, Vikas Oberoi, and certain members of the Promoter Group hold 72.49% of
the issued, subscribed and paid-up Equity Share capital of our Company. Upon completion of the Issue, our
Promoter and certain members of the Promoter Group together will continue to own a substantial share of our
Equity Share capital, which will allow them to control the outcome of matters submitted to our Board or
shareholders for approval. After the Issue, our Promoter will continue to exercise significant control or exert
significant influence over our business and major policy decisions, including but not limited to the following:
(i) controlling the election of directors;
(ii) controlling the selection of senior management;
(iii) approving significant corporate transactions, including acquisitions and disposals of our assets or
business, or change of control transactions;
(iv) making overall strategic and investment decisions;
(v) approving our annual budgets; and
(vi) amending our Memorandum and Articles of Association.
The interests of our Promoter and certain members of the Promoter Group may conflict with your interests and
the interests of our other shareholders, and our Promoter and certain members of the Promoter Group could make
decisions that may materially and adversely affect our business operations, and hence the value of your
investment in the Equity Shares.
14. Our operations in the hospitality and social infrastructure segments pose additional risks that are distinct from
those applicable to our other businesses.
We developed The Westin Mumbai - Garden City, which is operated and managed by Starwood Asia Pacific
Hotels & Resorts Pte Ltd, a subsidiary of Marriott International, Inc. (collectively, “Marriott”), under the Westin
brand, on an operating agreement model. We are currently developing The Ritz-Carlton Mumbai – Worli,
Mumbai, which will be owned equally by us and our joint venture partners, and operated and managed by Marriott
under The Ritz-Carlton brand. Siddhivinayak Realties Private Limited (“SRPL”), in which our wholly-owned
subsidiary, OCL, holds a 50% interest, has entered into an agreement for the acquisition from Tulip Hospitality
Services Limited of the property formerly known as “Centaur Hotel”, which is planned to be developed into what
we refer to as “Juhu Hotel”. We developed Oberoi International School – Goregaon, which is operated and
managed by the Oberoi Foundation, a public charitable trust. We also are developing the Oberoi International
School, JVLR Campus, wherein the part Occupancy certificate has been received. It is leased to, and operated
by, the Oberoi Foundation. While we have outsourced, and intend to continue to outsource the operation and
management of all our hotels and Oberoi International School campuses, we remain subject to all of the risks
inherent in the hospitality and social infrastructure segments, including, but not limited to, a competitive
environment characterised by well-established and well-capitalised competitors.
The hotel industry entails risks that are distinct from those applicable to our business of developing residential
properties for sale and developing office space and retail properties for sale or lease, including the supply of hotel
rooms exceeding demand, the failure to attract and retain business and leisure travellers as well as adverse
international, national or regional travel or security conditions. The hotel industry is particularly sensitive to
safety concerns. Our business has in the past declined and may in the future decline after incidents of actual or
threatened terrorism, during periods of political instability or conflict or during other periods in which travellers
become concerned about safety issues, including as a result of natural disasters such as tsunamis or earthquakes
or when travel might involve health-related risks such as during the outbreaks of epidemic or pandemic diseases.
Such events are outside our control and could result in a significant decrease in demand for hotels. Any such
decrease in demand, depending on its scope and duration, together with any other issues affecting travel safety,
could have a material adverse effect on our hospitality business, results of operations and financial condition.
The social infrastructure market also entails distinct risks. The success of Oberoi International School, Goregaon,
depends primarily on our ability to attract students and to retain them by delivering a satisfactory learning
experience. If the school is unable to continue to attract students, its revenues may decline, which may have a
material adverse effect on our business, financial condition and results of operations.
15. The development rights in respect of our Planned project at Sangam City, Sangamwadi are subject to
conditions, certain of which have not been or may not be satisfied; if these conditions are not satisfied, this
land may not be available for development by us.
In respect of our Planned project at Sangam City, Sangamwadi, Pune, development agreements have been
executed in favour of our joint venture entity which is the developer, Sangam City Township Private Limited
(“Sangam City Township”). As of the date of the execution of the development agreements, the relevant land
was agricultural land, and some of these development agreements contain a condition that the developer has to
obtain the permission for the conversion of the land from agricultural to non-agricultural use within a certain

46
period from the date of execution of the respective development agreement. If the developer fails to do so, the
owner of the land will have the option to terminate the development agreement. In respect of certain of these
development agreements, the time period for conversion of the land from agricultural to non-agricultural use has
expired and the owners therefore have the right to terminate these agreements. While none of these development
agreements has been terminated, in the event that we are unable to obtain the requisite permission and the
development agreements terminate, we may not be able to develop the project as presently envisaged or at all.
This may in turn adversely affect our business, financial condition and results of operation.
16. We have not obtained certain approvals or permits for some of our projects and may be unable to obtain or
renew required approvals and permits in a timely manner or at all and existing approvals or permits may be
suspended or revoked.
To successfully execute projects and operate our business, we are required to obtain statutory and regulatory
approvals, licenses, registration and permits and applications need to be made at appropriate stages of the projects.
For example, we are required to obtain the approval of building plans, layout plans, environmental consents and
fire safety clearances during various stages of the projects. In addition, we are required to obtain a certificate of
change of land use in respect of our industrial or agricultural land. Where we develop projects on a joint venture
basis, our ability to develop such projects is, in some cases, dependent on our joint venture partners or other third
parties obtaining necessary approvals and permits.
We have applied for certain approvals, which are currently pending and we may need to apply for renewal of
certain approvals which may expire from time to time, in the ordinary course of our business.
We may encounter material difficulties in fulfilling any conditions precedent to the approvals described above or
any approvals that we may require in the future, some of which are onerous and may require us to incur substantial
expenditure that we may not have anticipated. We may also not be able to adapt to recently introduced laws,
regulations or policies, such as RERA, that may come into effect from time to time with respect to the property
industry in general or the particular processes with respect to the granting of the approvals. There may also be
delays on the part of the administrative bodies in reviewing our applications and granting approvals or the
approvals issued to us may be suspended or revoked in the event of non-compliance or alleged non-compliance
with any terms or conditions thereof, or pursuant to any regulatory action. If we fail to obtain or renew, or
experience material delays in obtaining or renewing, the requisite governmental approvals, or if any approvals
are suspended or revoked, the schedule of development and the sale of our projects could be substantially
disrupted or impeded, which could have a material adverse effect on our business, prospects, financial condition
and results of operations.
17. Some or all of our Ongoing and Planned projects may not be completed by their expected completion dates or
at all.
As of March 31, 2018, we had 11 Ongoing projects and 15 Planned projects. For details, please see the section
entitled “Our Business” on page 98. We have procured preliminary architect plans and completed our
management development plans for some of our Planned projects. However, we have not yet formulated our
financing plans for these projects, other than with respect to the purchase of land, and have not applied for any
regulatory consents or approvals for some of these projects. Our Ongoing and Planned projects are subject to
significant changes and modifications from our currently estimated management plans and timelines as a result
of factors outside our control, including, among others:
(i) availability of raw materials and financing;
(ii) increases in construction costs;
(iii) failure or delay in securing necessary statutory or regulatory approvals and permits for us to develop
certain projects;
(iv) natural disasters and weather conditions, such as the monsoon season from June to September;
(v) reliance on third party contractors; and
(vi) the risk of decreased market demand during the development of, or subsequent to the launch of, a project.
Buyers of our residential units may also terminate their arrangements with us or initiate regulatory or legal action
if we fail to deliver the unit as per the timelines stipulated in the sale agreement, and we may be liable to refund
the purchase price with interest.
We may also change our management plans and timelines for strategic, marketing, internal planning and other
reasons such as economic downturns, availability of financing, interest rates and foreign exchange rates. Such
changes and modifications may have a significant impact on our Ongoing and Planned projects, and consequently,
we may not develop these projects as planned, or at all, which may have an adverse effect on our business, results
of operations and financial condition.

47
We might also be exposed to penalties under RERA. The aggregate penalties we may be liable to pay in the event
of delays in completion may affect the overall profitability of the project and therefore adversely affect our
business, results of operations and financial condition.
18. We have not obtained a written title opinion or search report in respect of our Planned projects in Juhu,
Mumbai and Sangamwadi, Pune.
There may be a number of uncertainties relating to land title in India including, among other things, difficulties
in obtaining title guarantees and fragmented or defective title. As part of our internal process, we seek to retain
lawyers to conduct due diligence and assessment exercises and/or provide us title search reports, written or
otherwise, prior to acquiring land, entering into joint or sole development agreements with land owners, and
undertaking projects. While we have undertaken enquiries and conducted due diligence we have not obtained a
title report in respect of our development site at Juhu, Mumbai, which is planned to be developed into what we
refer to as “Juhu Hotel”, as this land is subject to outstanding litigation. For details, please see the section entitled
“Legal Proceedings” on page 190. Hence, we may not be aware of all the risks associated with this land.
OCL, through its joint venture SRPL, has entered into a master asset purchase agreement with Tulip Hospitality
Services Limited dated March 31, 2005 and paid advances and deposit for acquisition of the abovementioned
property. No further definitive agreements have been executed subsequently and we have not obtained any title
reports in relation to this development site.
Additionally, our Company also holds a 31.67% interest in Sangam City Township, a special purpose vehicle,
established for a development comprising total land area of approximately 56 acres at Sangamwadi, Pune. While
we have undertaken enquiries and conducted due diligence, we have not obtained a title report in respect of our
development site at Sangamwadi, Pune because the process of land aggregation for the project is still ongoing.
Since we have not obtained a title report or search report in respect of these development sites, we may not be
aware of all the risks associated with these properties and there may be deficiencies in our title to this land. In the
event that any of these risks materialise, we may not be able to develop our project as currently planned. We
could also face a risk of loss of the property, the loss of our investment as well as any future revenues, any of
which would have an adverse effect on our business, financial condition and results of operations.
Additionally, if the dispute in relation to our development site at Juhu, Mumbai is not resolved in our favour, we
could face a risk of loss of the property, the loss of our investment in the property, be required to pay additional
amounts or be subject to restrictions and conditions that may have an adverse effect on our business, financial
condition and results of operations.
19. There have been delays in the implementation of some of our projects for which we are liable to pay interest
under certain of our sale agreements and we may encounter delays in the future.
There have been delays in the commencement, scheduled implementation and estimated completion of certain of
our projects. These delays have been due to delays in obtaining approvals and delays in execution, among other
things.
For the projects registered under RERA, any non-compliance of the provisions of RERA or such state-specific
legislation may result in penalties (including fines or imprisonment) and the revocation of registration of our
Ongoing projects. If there is a delay in handing over possession of the unit or premises to the buyer in accordance
with the terms of the agreement for sale, or due to the discontinuation of the promoter’s business or suspension
or revocation of registration thereunder, the buyer may withdraw from the project, and the promoter must return
the amount received from the buyer, along with interest and compensation as provided under RERA or if the
buyer does not intend to withdraw from the project, the promoter shall pay interest for every month of delay, until
the handing over of the possession, at such rate as may be prescribed under RERA. Also, if the promoter is unable
to complete the construction within the time specified in the declaration submitted for registration, and the
extension thereof, the Authority may revoke the registration and among other things, facilitate the balance
development by the competent authority or the association of buyers or in any other manner as the Authority may
determine. This could adversely affect our business, operations and financial condition.
For completed projects where an occupation certificate has been obtained, under the sale agreements which we
enter into with our customers, where the customer exercises a right to cancel the sale on account of delays in the
completion and hand over of the project, we are liable to refund amounts paid to date with interest. The interest
payable is calculated at a fixed rate for the period of the delay. In accordance with the provisions of the
Maharashtra Ownership of Flats (Regulation of the Promotion of Construction, Sale, Management and Transfer)
Act, 1963 (the “MOFA”), a real estate developer is required to pay interest at 9% p.a.

48
We may also encounter delays in the commencement, scheduled implementation and estimated completion of
our projects in the future, which could result in additional liabilities, including under RERA, and may adversely
affect our financial condition and results of operations.
20. Our Company has made investments and advanced non-interest bearing unsecured loans to its Subsidiaries
and joint ventures and the same involve a substantial degree of risk.
As of March 31, 2018, we have made investments in our joint ventures represented by Non-Current Investment
in equity shares, preference shares, perpetual bonds and capital contribution, Current investment in optionally
convertible debentures and loans to joint ventures of ₹ 255,458.04 lakhs consolidated. These investments may be
illiquid and we may not be able to realise any benefits or may have to defer their realisation potentially for a
considerable period of time. Further, such investments may be subject to impairment due to litigation, or other
factors, that may adversely affect our investee entities. For example, as of March 31, 2018, our current capital
contribution in Saldanha Realty and Infrastructure LLP (“SRIL”), which is involved in certain legal disputes,
was ₹ 4,656.83 lakhs. Further, if our joint ventures are unable to effectively utilise our investments in them due
to litigation or any other factors, our business, financial conditions and results of operations could be adversely
affected. For further details, please see the section entitled “–We depend on various third parties, including our
joint venture partners, contractors and independent service providers, over whom we may have no control.”
Further, we may incur additional costs or be unable to participate in other opportunities which could have been
more lucrative and thereby adversely affecting our financial condition and results of operations. The loans
advanced to Subsidiaries and joint ventures may not be repaid on a timely basis or at all.
21. We depend on various third parties, including our joint venture partners, contractors and independent service
providers, over whom we may have no control.
We depend on various third parties, including our joint venture partners, contractors and independent service
providers, over whom we may have no control, for the development of all of our projects. We undertake certain
projects in cooperation with other real estate development companies or third parties. For example, our Company
holds a 31.67% interest in Sangam City, a special purpose vehicle established for a mixed-use development
project comprising total land area of approximately 56 acres of land located in Sangamwadi, Pune. Oasis Realty
is an unincorporated joint venture between our wholly-owned subsidiaries, OCL and Astir Realty LLP, and
Skylark Buildcon Private Limited and Shree Vrunda Enterprises to develop a mixed-use development of
approximately 25,95,646 square feet of Saleable Area in Worli, Mumbai. SRPL, a special purpose vehicle in
which our wholly-owned subsidiary, OCL, holds a 50% interest, has entered into an agreement for the acquisition
from Tulip Hospitality Services Limited of the property formerly known as “Centaur Hotel”, which is planned to
be developed into what we refer to as “Juhu Hotel”. Further, our Company’s wholly-owned subsidiary,
Expressions Realty Private Limited, holds a 50% interest in SRIL and we have made a capital contribution
aggregating to ₹ 4,656.83 lakhs in SRIL. Our investments in joint ventures may be exposed to the risk of
impairment due to litigation or other factors that may adversely affect such joint ventures. For further details,
please see the section entitled, “–Our Company has made investments and advanced non-interest bearing
unsecured loans to its Subsidiaries and joint ventures and the same involve a substantial degree of risk.” on page
48.
Arrangements governing our joint ventures may provide us with only partial control over the operations of the
joint ventures under certain circumstances. Where we are a minority participant in a joint venture, there may exist
inherent potential conflicts of interests with our joint venture partners, who may make significant decisions
without our consent that affect our interests, such as delaying project execution timetables. Moreover, we may
not have entered into agreements with some of our joint venture partners, contractors and independent service
providers.
In addition, it may be necessary for us to obtain consent from a joint venture partner before we can cause the joint
venture to make or implement a particular business development decision or to distribute profits to us or there
may be disputes between us and our joint venture partners, among our joint venture partners or between our joint
venture partners and the land owner or another third party. These and other factors may cause our joint venture
partners to act in a way contrary or conflicting to our interests, or otherwise be unwilling to fulfil their obligations
under our joint venture arrangements, which could have a material adverse effect on our business, financial
condition and results of operation. In addition, our joint venture partners may fail to develop the rehabilitation
portion of the slum rehabilitation projects in accordance with the regulations and directives of the Slum
Rehabilitation Authority (“SRA”) overseeing such projects. For example, our joint venture partners, Skylark
Buildcon Private Limited and Shree Vrunda Enterprises are required to obtain a Letter of Intent from the SRA to
obtain additional FSI to be utilised for a project. Further, we have also entered into a development agreement
with Abhedya SRA Sahakari Gruhnirman Sanstha to redevelop approximately 7.48 acres of land to build Sky
City Extension, a Planned office project in Borivali (East). In addition, there are certain encumbrances on the
land that is proposed to be developed and our joint venture partners may not have completed all the formalities

49
required under applicable laws. We may therefore lose part of or all our development rights over the free-sale
portion.
Further, we engage independent architects and construction contractors, who may in turn hire sub- contractors
and other third parties, for the design and construction of all our projects. The success of our projects therefore
depends significantly on the performance of various third parties, including our contractors and service providers.
As we do not control any of our contractors or service providers, we cannot ensure they perform their obligations
and services satisfactorily, to a standard that meets our requirements or targeted quality levels or that they are not
involved in corruption or other improper conduct in relation to our projects. We may also not be able to recover
compensation for any resulting defective work or materials. We may therefore incur losses as a result of our
projects being delayed or disrupted or having to fund the repair of defective work or pay damages to persons who
have suffered loss as a result of such defective work. We may also be required to incur additional cost or time to
develop our projects, which could adversely affect our business, financial condition and results of operations.
Our joint venture partners, contractors and service providers may also face financial, legal or other difficulties,
which may affect their ability to continue with the project and consequently, may have a material adverse effect
on our business, financial conditions and results of operations. We may therefore be required to make additional
investments in the joint venture, provide extra funding or become liable for other obligations, which could result
in delays to our projects, reduced profits or, in some cases, significant losses.
22. We may experience volatility in prices of, or shortages of, key building materials and labour.
Our ability to develop projects profitably depends upon our construction contractors’ ability to source adequate
building supplies at budgeted prices. We have experienced shortages of key building materials, such as cement
and steel in the past and have also experienced significant price volatility in the cement and steel markets. The
prices and supply of key building materials depend on factors outside our control, including changes in import
restrictions, such as changes to customs duties and licensing policies, and changes in the cost of raw materials,
general economic conditions, competition, production costs and levels, transportation costs, and indirect taxes.
In addition, our supply chain may be periodically interrupted by work stoppages and labour disputes affecting
our suppliers, their distributors, or the transporters of our supplies. Our ability to develop and construct projects
profitably is dependent on our ability to obtain an adequate and timely supply of building materials within our
estimated budget.
During periods of shortages in building materials, such as cement and steel, we may not be able to complete
projects according to our previously established timelines, at our previously estimated project cost, or at all, which
could harm our results of operations and financial condition. In addition, during periods of volatility in the price
of building materials, where prices have increased significantly or unexpectedly, we may not be able to pass the
increase in construction costs through to our customers, which could reduce or eliminate the profits we attain
with regards to our developments. These factors could adversely affect our business, results of operations and
cash flows.
23. We rely on the financial stability of our tenants of leased premises, in particular, our key tenants, schools and
our hotel operators.
The demand for our retail and office space units may be adversely affected by the financial stability of our tenants
and prospective tenants, which may depend on general economic conditions. For example, during the last
economic downturn, some of our retail tenants terminated their tenancies and we agreed to grant concessions to
several other tenants to enable them to continue operations from the leased premises. In the event of a default by
a tenant and/or termination of a lease agreement, we may suffer a rental shortfall and incur additional costs,
including legal expenses, in maintaining, insuring and re-letting the property. If we are unable to re-let or renew
lease contracts promptly, if the rentals upon such re-leasing or renewals are significantly lower than the expected
value or if reserves, if any, for these purposes prove inadequate, our results of operations, financial condition and
the value of our real estate could be adversely affected.
In addition, some of our retail properties are anchored by key tenants, which, due to size, reputation or other
factors, may be particularly responsible for drawing other tenants and shoppers to such properties. For example,
our Completed retail project, Oberoi Mall, in Goregaon, Mumbai has anchor tenants such as department stores
and a multiplex cinema. Our ability to lease any vacant retail units and the value of such units could be adversely
affected by the loss of an anchor tenant or key tenant in the event such tenant terminates its lease, files for
bankruptcy or insolvency or experiences a downturn in its business.
Oberoi International School, Goregaon and Oberoi International School, JVLR are owned by us and rented to a
public charitable trust. Meanwhile, we depend on third party operators to operate and manage our hospitality
projects. In our hospitality projects, we currently follow an operating agreement model whereby the hotel is
owned by us and operated by a hotel chain. If we are unable to procure operators for our hotels or if our existing

50
operating or licence agreements are terminated, our results of operations, financial condition and the value of our
real estate could also be adversely affected.
24. We may not be able to manage our growth strategy effectively or it may change in the future.
Our business strategy includes the development of residential, office space, retail, hospitality and social
infrastructure projects primarily in MMR and in other parts of India, if suitable opportunities arise. Our
developments have primarily focused on residential projects but, pursuant to this strategy, we currently have
various real estate projects under development, including retail developments and hotels. In the future, we may
decide to undertake projects in additional business lines of real estate development. As we grow and diversify,
we may not be able to execute our projects efficiently on such an increased scale, which could result in delays,
increased costs and diminished quality, each adversely affecting our reputation. This future growth may strain
our managerial, operational, financial and other resources.
Moreover, the availability of land, as well as its use and development, is subject to regulations by various local
authorities. For example, if a specific parcel of land has been deemed as agricultural land, depending on its
location, no commercial or residential development may be permitted beyond certain specified timelines or
without the prior approval of the local authorities, as applicable. For more information, please see the section
entitled “Regulations and Policies” on page 128. We may also be required by applicable laws or court orders to
incur expenditures and undertake activities in addition to real estate development on certain portions of our land
reserves. Accordingly, our inability to acquire parcels of land or development rights, or any restrictions on the
use of our land, may adversely affect our business and growth prospects.
If we are unable to manage our growth strategy effectively, our business, financial condition and results of
operations may be adversely affected. In addition, depending on prevailing market conditions, regulatory changes
and other commercial considerations, we may be required to change our business model and we may therefore
decide not to continue to follow our business strategies described in this Placement Document.
25. We may experience difficulties in expanding our business into additional geographical markets in India.
While MMR remains and is expected to remain our primary focus, we may evaluate growth opportunities in other
parts of India on a case-by-case basis. However, we have limited experience in conducting business outside MMR
and have not previously completed any real estate development projects outside of Mumbai. Apart from our
Planned development in Sangam City, which is located in Pune, all of our projects are currently located in MMR.
We may not be able to leverage our experience in MMR to expand into other cities as a result of various features
which may differ in other cities and with which we may be unfamiliar, such as:
(i) competition;
(ii) regulatory and taxation regimes;
(iii) business practices and customs;
(iv) languages;
(v) customer tastes, preferences, behaviour and culture;
(vi) construction methods because of different terrains; and
(vii) land and related laws applicable in other states.
If we enter new markets and geographical areas in India, we are likely to compete not only with national
developers, but also local developers who may have an established local presence, are more familiar with local
regulations, business practices and customs, have stronger relationships with local contractors, suppliers, relevant
government authorities, and who have access to existing land reserves, all of which may give them a competitive
advantage over us. Our inability to expand into and compete successfully in areas outside MMR real estate market
may adversely affect our business prospects.
26. We have reversed some of the revenue recognised in prior periods as a result of cancelled bookings for certain
of our projects and may be required to do so in the future.
We and our customers have cancelled bookings for certain of our projects in recent years. For example, we have
cancelled bookings where our customers have failed to make instalment payments. In addition, where projects
are delayed beyond the scheduled completion date, our customers may have a right to cancel their bookings. For
some of these projects, we had recognised all or a portion of the income from these bookings as revenue. We
have consequently been required to reverse the revenue recognised from these bookings. If an increasing number
of bookings are cancelled in respect of projects where we have recognised revenue, this could lead to a decline
in our business prospects, financial position and results of operations.
27. We may not be able to generate profits at the same rate of return that we earn from our historical projects.
We acquired a substantial portion of the land for our currently Completed, Ongoing and Planned projects during

51
periods when land prices were generally lower than prevailing market prices. We cannot guarantee that we will
be able to continue acquiring land at lower prices. The profits that we generate from our projects may not be
utilised in our business at or above the rate of return that we earn from these projects and we may not utilise
capital in the most efficient manner. For example, there may be periods during which we may deposit funds in
fixed deposits or other short- term investments that generate low post-tax returns. We may also invest in mutual
funds which are exposed to market and credit risks and may not generate rates of return above the rates of return
we earn on our other investments, or at all, or such investments may result in losses. Our failure to generate rates
of return on our capital equal to or above the rate of return we earn on our projects may decrease our return on
net worth and capital employed, which may in turn adversely affect our business prospects, financial condition
and results of operation.
28. We may not maintain adequate insurance coverage to cover all losses or liabilities that may arise from our
operations.
We obtain contractors all risk policies for buildings under construction to cover construction risks, and special
perils policies for completed buildings. We generally maintain insurance covering our assets and operations at
levels that we believe to be appropriate. We also ensure that our main contractors obtain risk insurance policies
while carrying out any activities on our behalf. We have a director’s and officer’s liability policy for our directors
and officers, and group personnel accident and mediclaim policies for our employees. We have also obtained a
Commercial General Liability Insurance policy and Crime Policy to cover third party liability.
However, we face the risk of losses from a variety of sources, including, but not limited to, risks relating to
construction, catastrophic events, terrorist risk, vandalism, theft of construction supplies and loss of business. If
we suffer any losses, damages and liabilities in the course of our operations and real estate development, we may
not have sufficient insurance or funds to cover such losses. Additionally, there may be various other risks and
losses for which we are not insured because such risks are uninsurable or not insurable on commercially
acceptable terms, such as general liability insurance or coverage for contractor‘s liability, timely project
completion, loss of rent or profit, construction defects or consequential damages for a tenant‘s lost profits. Any
damage suffered by us in respect of uninsured events would not be covered by such insurance policies and we
would bear the effect of such losses. In addition, any claim under the insurance policies maintained by us may
not be honoured fully or on time.
Furthermore, in the future we may not be able to maintain insurance of the types or at levels which we deem
necessary or adequate. Moreover, any payments we make to cover any losses, damages or liabilities or any delays
we experience in receiving appropriate payments from our insurers could have an adverse effect on our financial
condition and results of operations. Any such uninsured losses or liabilities could result in a material adverse
effect on our business operations, financial conditions and results of operations.
29. We are exposed to third party indemnification and liability claims.
Some of the agreements that we have entered into with third parties place indemnity obligations on us that require
us to compensate such third parties for loss or damage suffered by them on account of a default or breach by us.
In the event that such third parties successfully invoke these indemnity clauses under their respective agreements,
we may be liable to compensate them for loss or damage suffered in respect of such agreements, which may
materially and adversely affect our financial condition.
We may be subject to claims resulting from defects in our developments, including claims brought under RERA
and the MOFA, as applicable. Further, under RERA, if any structural defect or any defect in workmanship, quality
or provision of services or any other obligations of the promoter is brought to the notice of the promoter within
five years by the buyer from the date of handing over possession, it shall be the duty of the promoter to rectify
such defects, without further charge, within 30 days. Actual or claimed defects in equipment procured and/or
construction quality could give rise to claims, liabilities, costs and expenses, including repairing the damaged
property, or relating to loss of life, personal injury, damage to property, damage to equipment and facilities, loss
of production or suspension of operations. We may also be exposed to third party liability claims for injury or
damage sustained on our properties, such as our mall and hotel. These liabilities and costs could have a material
adverse effect on our business, financial condition and results of operations. For details, please see the section
entitled “Legal Proceedings” on page 190.
30. We face significant competition in our business. If we are unable to compete successfully, our business,
financial condition and results of operations will be adversely affected.
The real estate development industry in India, while fragmented, is highly competitive and we face competition
in MMR (where our business activities are presently focused) from numerous sources including other large Indian
real estate development and construction companies.

52
We compete on the basis of location, facilities and supporting infrastructure, services and price and our growth
and success will depend on our ability to accurately identify the needs of our customers across all market segments
and recognise and respond to changing trends within and across the various segments. Competitors with greater
resources could acquire land in more desirable locations, offer more attractive prices than we are able to or
anticipate or respond sooner to the requirements of customers. Intensified competition between property
developers may result in increased land prices, an oversupply of properties, a slowdown in the approval process
for new property developments by the relevant government authorities, lower real estate prices, and lower sales
at our properties, all of which may have a material adverse effect on our business, financial condition and results
of operations. We cannot assure you that we will be able to compete successfully in the future against our existing
or potential competitors or that increased competition will not have an adverse effect on our profitability.
In the hospitality industry, we compete with international, regional and local hotel companies, some of which
have greater name recognition and financial resources than we do. Competitive factors at each hotel destination
include room rates, quality of accommodation, name recognition, service levels and convenience of location, and
to a lesser extent, the quality and scope of other amenities, as well as the ability to respond to changes in consumer
demographics and preferences. New or existing competitors may offer significantly lower rates than our rates or
offer greater convenience, services or amenities or significantly expand or improve facilities in the locations in
which we operate, thereby adversely affecting our results of operations.
As we may expand our business activities to include real estate development in other regions throughout India,
we may experience competition in the future from competitors with significant operations elsewhere in India. In
addition, although land acquisition in India has historically been subject to regulatory restrictions on foreign
investment, if these restrictions are relaxed, we may face increased competition from foreign real estate
development firms.
31. We are dependent upon the experience and skills of our senior management team and skilled employees.
We believe that our senior management team has contributed significantly to the development of our business.
In particular, Vikas Oberoi, our Chairman and Managing Director, has been instrumental in the development and
implementation of our business strategy. The loss or interruption of the continued services of any member of our
senior management team, and Vikas Oberoi in particular, would disrupt our business and adversely affect our
financial condition and results of operations.
We also believe that the success of our real estate development activities is dependent on our ability to attract,
train, motivate, and retain highly skilled employees. Our professionally qualified staff members include
engineers, design consultants, marketing specialists, treasury officers, costing consultants, procurement officers
and accountants. In the event we are unable to maintain or recruit a sufficient number of skilled employees, our
business and results of operations may be adversely affected. Competition for senior management and skilled
employees is intense and the pool of qualified candidates is limited. We may not therefore be able to attract and/or
retain suitable senior management and skilled employees. In addition, if any member of our senior management
team or any of our other key personnel joins a competitor or forms a competing company, we may lose key future
development opportunities to our competitors, and our business prospects, financial condition and results of
operations will be adversely affected.
32. We have entered into related party transactions but may have been able to obtain more favourable terms if
such transactions had been entered into with unrelated parties.
We have entered into, and may in the future enter into, certain transactions with our Subsidiaries, joint ventures,
directors, employees and their relatives, Promoter and companies controlled by our Promoter, including
companies engaged in our line of business or in related areas. Such transactions include non-interest bearing
unsecured loans that we have advanced to our Subsidiaries and joint ventures. Such loans may not be repaid on
a timely basis or at all. For details of our related party transactions, please see the sections entitled “Related Party
Transactions” and “– Our Company has made investments and advanced non-interest bearing unsecured loans
to its Subsidiaries and Joint Ventures and the same involve a substantial degree of risk” on pages 140 and 48,
respectively.
These transactions were primarily made in the ordinary course of business but we may have been able to obtain
more favourable terms had such transactions been entered into with unrelated parties. We may have incurred
additional costs or have been unable to participate in other opportunities which could have been more lucrative,
thereby adversely affecting our financial condition and results of operations. It is likely that we will continue to
enter into further related party transactions in the future. We cannot assure you that such transactions, individually
or in the aggregate, will not have an adverse effect on our results of operations and financial condition.
33. We are dependent on our IT systems for the execution and management of our projects.
We use information and communication technologies extensively to manage and execute our projects and to

53
improve our overall efficiency. We have successfully implemented the SAP enterprise resource planning system
to help us to manage all of our resources. In addition, our project management team uses software, such as
Microsoft Project, to review the progress of each project and monitor cost and time overruns, if any.
These systems may be susceptible to outages due to fire, floods, power loss, telecommunications failures, natural
disasters, break-ins and similar events. Any delay in implementation or any disruption in the functioning of our
IT systems could have a material adverse effect on our business if it causes loss of data or affects our ability to
track, record and analyse the progress of our projects, process financial information, manage our creditors and
debtors, or engage in normal business activities. In addition, our systems and proprietary data stored electronically
may be vulnerable to computer viruses, cybercrime, computer hacking and similar disruptions from unauthorized
tampering. If such unauthorized use of our systems were to occur, data related to our projects, customers and
other proprietary information could be compromised. The occurrence of any of these events could adversely
affect our business, interrupt our operations, subject us to increased operating costs and expose us to litigation.
34. We may have certain contingent liabilities and capital commitments not provided for which may adversely
affect our financial condition.
As of March 31, 2018, our contingent liabilities that are not provided for (as disclosed in our financial statements),
as per Ind AS 37 “Provisions, Contingent Liabilities and Contingent Assets”, capital commitments and other
commitments, are as detailed in the following table:
(₹ in lakh)
As of March 31, 2018
Summary details of Contingent Liabilities (to the extent not provided for)
Corporate guarantee given 6,600.00
MVAT matters in dispute 242.42
Income-tax matters in dispute 920.81
Service tax matters in dispute 928.47
Capital Commitments
Capital contracts (net of advances) 2,014.88
Capital commitment to joint venture(1) 13,703.00
Total 24,409.58 Corporate guarantee consists of an irrevocable and unconditional corporate guarantee by our Company with respect to our Three Sixty West project.
(1) The principal components of our contingent liabilities as of March 31, 2018 were capital commitments to joint ventures, primarily comprising payment for the
acquisition from Tulip Hospitality Services Limited of the property formerly known as “Centaur Hotel”, which we refer to as “Juhu Hotel”.
Any or all of these contingent liabilities and commitments may become actual liabilities. In the event that any of
our contingent liabilities become non-contingent, our business, financial condition and results of operations may
be materially and adversely affected. Our capital commitments not provided for could adversely affect our
financial condition if such commitments are not executed according to the terms and conditions of the respective
contracts. For further information, please see the section entitled “Financial Statements” on page 197.
35. Our financing agreements impose certain restrictions on our operations, and our failure to comply with
operational and financial covenants may adversely affect our reputation, business and financial condition.
Certain of our financing arrangements impose restrictions on the utilisation of the loan for certain specified
purposes. We cannot assure you that we will comply with all our covenants in the future, or that we can obtain
necessary waivers for all non-compliances or remedy defaults in time or at all.
Moreover, under certain existing financing agreements, the lenders have the right to withdraw their facilities in
the event of any change in circumstances, including but not limited to, any material change in the ownership or
shareholding pattern of our Company. Such financing agreements also require us to maintain certain financial
ratios. If our future cash flows from operations and other capital resources are insufficient to pay our debt
obligations or our contractual obligations, or to fund our other liquidity needs, we may be forced to sell assets or
attempt to restructure or refinance our existing indebtedness. Our ability to restructure or refinance our debt will
depend on the condition of the capital markets, our financial condition at such time and the terms of our other
outstanding debt instruments. Any refinancing of our debt could be at higher interest rates and may require us to
comply with more onerous covenants, which could further restrict our business operations. The terms of existing
or future debt instruments may restrict us from adopting some of these alternatives. In addition, any failure to
make payment of interest or principal on our outstanding indebtedness on a timely basis would likely result in a
reduction of our creditworthiness or credit rating, which could harm our ability to incur additional indebtedness
on acceptable terms.
36. Acquiring interests in companies to gain access to the land held by them involves a substantial degree of risk.
In the past, we have acquired stakes in companies or entities to gain access to the land they own. Going forward,

54
we may enter into development agreements or collaboration agreements with third parties that have acquired, or
are in the process of acquiring, developments rights to the land we want access to.
These properties may be subject to various encumbrances such as existing tenancies, occupancies and litigations.
In some cases, the companies in which we have obtained an interest may have existing indebtedness under which
the property of our Company is charged. Thus, we may be forced to negotiate with parties or settle existing claims
over the property. In addition, the companies we acquire may have existing regulatory non-compliances. While
we seek to investigate the rights and liabilities of these companies, and to conduct due diligence of the properties
and structures they own before acquiring their shares, we may be subject to claims by third parties, including
amounts due to them or rights over the property we own.
Further, we may not be aware of all the risks associated with our acquisitions. Following the completion of the
acquisition, we may have to make significant capital expenditures to maintain the assets we acquired and to
comply with regulatory requirements. The costs and liabilities actually incurred in connection with the
acquisitions may exceed those anticipated.
37. We benefit from our relationship with our Promoter and our business and growth prospects may decline if we
cannot benefit from this relationship in the future.
We benefit in many ways from our relationship with our Promoter, Vikas Oberoi, as a result of his reputation,
experience and knowledge of the real estate industry. Vikas Oberoi has been associated with the property
development, real estate and construction sector in Mumbai for over 30 years. He has been primarily responsible
for the direction and growth of our business and has been instrumental in our strategic planning, including
identifying our current development projects. Our Promoter has executed an understanding dated December 23,
2009, pursuant to which he has agreed not to undertake the development or execution of any new real estate
projects under the brand name “Oberoi” or any other brand name with certain exceptions.
We cannot assure you that we will be able to continue to take advantage of the benefits from this relationship in
the future. If we lose our relationship with Vikas Oberoi for any reason, our business and growth prospects may
decline and our financial condition and results of operations may be adversely affected.
38. Corrupt practices or fraud or improper conduct may delay the development of a project and adversely affect
our business and results of operations.
The real estate industry in India is not immune to the risks of corrupt practices or fraud or improper practices.
Construction projects in all parts of the world provide opportunities for corruption, fraud or improper conduct,
including bribery, deliberate poor workmanship, theft or embezzlement by employees, contractors or customers
or the deliberate supply of low quality materials. If we or any other persons involved in any of the projects are
the victim of or involved in any such practices, our reputation or our ability to complete the relevant projects as
contemplated may be disrupted, thereby adversely affecting our business and results of operations.
39. We may be classified as a passive foreign investment company (a “PFIC”) for U.S. federal income tax
purposes, which could result in adverse U.S. federal income tax consequences to U.S. holders of Equity Shares.
A non-U.S. corporation will be classified as a PFIC for any taxable year if either: (a) at least 75% of its gross
income is “passive income” for purposes of the PFIC rules or (b) at least 50% of the value of its assets (determined
on the basis of a quarterly average) is attributable to assets that produce or are held for the production of passive
income. Based on the current and anticipated composition of our income, assets and operations, we do not expect
to be treated as a PFIC for the current taxable year or in the foreseeable future. However, whether we are treated
as a PFIC is a factual determination that is made on an annual basis after the close of each taxable year. This
determination will depend on, among other things, the ownership and the composition of the income and assets,
as well as the value of the assets (which may fluctuate with our market capitalization), of our Company and its
subsidiaries from time to time. Moreover, the application of the PFIC rules is unclear in certain respects. The
IRS or a court may disagree with our determinations, including the manner in which we determine the value of
our assets and the percentage of our assets that are passive assets under the PFIC rules. Therefore there can be no
assurance that we will not be classified as a PFIC for the current taxable year or for any future taxable year. If we
were treated as a PFIC for any taxable year during which a U.S. investor held Equity Shares, such U.S. investor
could be subject to adverse U.S. federal income tax consequences. See “Taxation—United States Federal Income
Taxation—Passive Foreign Investment Company Considerations.
RISKS RELATING TO OUR EQUITY SHARES AND THE ISSUE
40. The Equity Shares issued pursuant to the Issue may not be listed on the Stock Exchanges in a timely manner,
or at all, and prospective investors may not be able to immediately sell their Equity Shares on a Stock
Exchange.

55
In accordance with Indian law and practice, permission for listing and trading of the Equity Shares issued pursuant
to the Issue will not be granted until after the Equity Shares have been issued and allotted. Approval for listing
and trading will require all relevant documents authorising the issuing of Equity Shares to be submitted and there
could therefore be a failure or delay in listing the Equity Shares on the Stock Exchanges. Any failure or delay in
obtaining such approval would restrict your ability to dispose of your Equity Shares.
The regulation and monitoring of Indian securities markets and the activities of investors, brokers and other
participants differ, in some cases significantly, from those in Europe and the U.S. The Stock Exchanges have in
the past experienced problems, including temporary exchange closures, broker defaults, settlements delays and
strikes by brokerage firm employees, which, if continuing or recurring, could affect the market price and liquidity
of the securities of Indian companies, including the Equity Shares, in both domestic and international markets. A
closure of, or trading stoppage on, either of the Stock Exchanges could adversely affect the trading price of the
Equity Shares.
41. The price of the Equity Shares may be volatile, which could result in substantial losses for investors acquiring
the Equity Shares in the Issue.
The market price of the Equity Shares may be volatile and could fluctuate significantly and rapidly in response
to, among others, the following factors, some of which are beyond our control:
(i) volatility in the Indian and global securities market or in the value of the Rupee relative to the U.S.
Dollar, the Euro and other foreign currencies;
(ii) our profitability and performance;
(iii) changes in financial analysts‘ estimates of our performance or recommendations;
(iv) perceptions about our future performance or the performance of Indian companies in general;
(v) performance of our competitors and the perception in the market about investments in the real estate
sector;
(vi) adverse media reports about us or the Indian real estate sector;
(vii) significant developments in India‘s economic liberalisation and deregulation policies;
(viii) significant developments in India‘s fiscal and environmental regulations;
(ix) economic developments in India and in other countries; and
(x) any other political or economic factors.
These fluctuations may be exaggerated if the trading volume of the Equity Shares is low. Volatility in the price
of the Equity Shares may be unrelated or disproportionate to our results of operations. It may be difficult to assess
our performance against either domestic or international benchmarks.
Indian stock exchanges, including the Stock Exchanges, have experienced substantial fluctuations in the prices
of listed securities and problems such as temporary exchange closures, broker defaults, settlement delays and
strikes by brokers. Further, certain restrictions have, in the past, been imposed on trading in certain securities,
limitations on price movements and margin requirements. Further, disputes have occurred between listed
companies, stock exchanges and other regulatory bodies, which in some cases may have had a negative effect on
market sentiment. If such or similar problems were to continue or recur, they could affect the market price and
liquidity of the securities of Indian companies, including the Equity Shares.
42. There are restrictions on daily movements in the price of the Equity Shares, which may adversely affect a
shareholder’s ability to sell, or the price at which it can sell, the Equity Shares at a particular point in time.
The price of our Equity Shares will be subject to a daily circuit breaker imposed on listed companies by all stock
exchanges in India, which does not allow transactions beyond a certain level of volatility in the price of the Equity
Shares. This circuit breaker operates independently of the index-based market-wide circuit breakers generally
imposed by the SEBI on Indian stock exchanges. The percentage limit on our circuit breaker is set by the stock
exchanges based on the historical volatility in the price and trading volume of the Equity Shares. The stock
exchanges are not required to, and do not, inform us of the percentage limit of the circuit breaker from time to
time, and may change it without our knowledge. This circuit breaker effectively limits upward and downward
movements in the price of the Equity Shares. As a result, shareholders‘ ability to sell the Equity Shares, or the
price at which they can sell the Equity Shares, may be adversely affected at a particular point in time.
43. Investors may be subject to Indian taxes arising out of capital gains on the sale of the Equity Shares. Recently,
the Finance Act, 2018 levies taxes on long term capital gains exceeding ₹ 1,00,000 arising from the sale of
Equity Shares on or after April 1, 2018, while continuing to exempt the unrealized capital gains earned up to
January 31, 2018 on such Equity Shares.
Under current Indian tax laws, unless specifically exempted, capital gains arising from the sale of Equity Shares
within 12 months in an Indian company are generally taxable in India. STT will be levied on and collected by an

56
Indian stock exchange on which our Equity Shares are sold. Any gain realised on the sale of Equity Shares held
for more than 12 months to an Indian resident, which are sold other than on a recognised stock exchange and on
which no STT has been paid, will be subject to long term capital gains tax in India.
Further, any gain realised on the sale of listed equity shares held for a period of 12 months or less will be subject
to short-term capital gains tax in India. In case of a shareholder being non-resident, capital gains arising from the
sale of equity shares of an Indian company will be exempt from taxation in India in cases where the exemption
from taxation in India is provided under a treaty between India and the country of which the seller is resident.
Generally, Indian tax treaties do not limit India’s ability to impose tax on capital gains. As a result, residents of
other countries may be liable for tax in India as well as in their own jurisdiction on a gain upon the sale of our
Equity Shares and credit for the taxes paid in India are allowed to take in their country, depending on prevailing
tax laws of that country.
44. Your ability to acquire and sell Equity Shares offered in the Issue is restricted by the distribution, solicitation
and transfer restrictions set forth in this Placement Document.
No actions have been taken to permit a public offering of our Equity Shares offered in the Issue in any jurisdiction.
As such, your ability to acquire Equity Shares offered in the Issue is restricted by the distribution and solicitation
restrictions set forth in this Placement Document. For further information, please see the section entitled “Selling
Restrictions” on page 157. Furthermore, our Equity Shares offered in the Issue are subject to restrictions on
transferability and resale. For details, please see the section entitled “Transfer Restrictions” on page 164. You
are required to inform yourself about and observe these restrictions. Our representatives, our agents and us will
not be obligated to recognize any acquisition, transfer or resale of our Equity Shares offered in the Issue made
other than in compliance with applicable law.
45. Future issuances or sales of the Equity Shares could dilute your shareholding and significantly affect the
trading price of the Equity Shares.
The future issuance of Equity Shares by us, the disposal of Equity Shares by any of our major shareholders or the
perception that such issuance or sales may occur, may lead to the dilution of your shareholding in our Company
or significantly affect the trading price of the Equity Shares. These sales could also impair our ability to raise
additional capital through the sale of our equity securities in the future. We cannot assure you that we will not
issue further Equity Shares or that the shareholders will not dispose of, pledge or otherwise encumber their Equity
Shares. In addition, any perception by investors that such issuances or sales might occur could also affect the
trading price of our Equity Shares.
46. Your right to participate in any future rights offerings could be limited, which would cause dilution to your
holdings.
If we offer to our shareholders rights to subscribe for additional Equity Shares or any right of any other nature,
we will have discretion as to the procedure to be followed in making the rights available to our shareholders or
in disposing of the rights for the benefit of our shareholders and making the Net Proceeds available to our
shareholders subject to the provision of the Companies Act, applicable law and the Articles. We may choose not
to offer the rights to our shareholders outside India. For example, we will not offer such rights to our shareholders
in the United States unless:
(i) a registration statement is in effect, if a registration statement under the Securities Act is required in
order for us to offer such rights to holders and sell the securities represented by such rights; or
(ii) the offering and sale of such rights or the underlying securities to such holders are exempt from
registration under the provisions of the Securities Act.
Whenever we make a rights or similar offering of our Equity Shares, we will evaluate the costs and potential
liabilities associated with, and our ability to comply with U.S. regulations, for any such registration statement
and any other factors we consider appropriate. We have no obligation to prepare or file any registration statement
under the Securities Act. If we do not file a registration statement and no exemption from registration under the
Securities Act is available, then U.S. holders of our Equity Shares would be unable to participate in rights or
similar offerings and would suffer dilution of their shareholdings. Consequently, we cannot assure you that you
will be able to maintain your proportional interests in the Equity Shares.

57
EXTERNAL RISK FACTORS
RISKS RELATING TO THE REAL ESTATE DEVELOPMENT INDUSTRY IN INDIA
47. Our business is heavily dependent on the performance of, and the prevailing conditions affecting, the real
estate market in MMR and in India generally.
Our real estate projects are located primarily in MMR. As of March 31, 2018, all our Completed, Ongoing and
Planned projects, other than the Sangam City project, are located in MMR. For details of our projects and land
reserves, please see the section entitled “Our Business” on page 98. As a result, our business, financial condition
and results of operations have been and will continue to be heavily dependent on the performance of, and the
prevailing conditions affecting, the real estate market in MMR and in India generally.
The real estate market in MMR and in India generally may be affected by various factors outside our control,
including, among others:
(i) prevailing local economic, income and demographic conditions;
(ii) availability of consumer financing (interest rates and eligibility criteria for loans);
(iii) availability of and demand for properties comparable to those we develop;
(iv) changes in governmental policies relating to zoning and land use;
(v) changes in applicable regulatory schemes; and
(vi) the cyclical nature of demand for and supply of real estate.
These factors may result in fluctuations in real estate prices and the availability of land, which may negatively
affect the demand for and the value of our projects, and may result in delays to or the cancellation of our projects,
the cancellation of sales bookings or the termination of lease agreements. In particular, the real estate market in
Mumbai and India was significantly affected by the global financial crisis that began in the second half of 2007.
During economic downturns, market sentiment may be adversely affected, buyers may become cautious, rentals
of office space may face downward pressure and sales or collections could be adversely affected which may have
a material adverse effect on our financial condition and results of operation.
Limited availability of land in MMR, combined with increased demand for residential, office space and retail
properties, has also resulted in, and is expected to continue to result in, increased competition to acquire land for
the purposes of development in MMR. This has, in turn, caused an increase in the price of land in MMR and is
expected to continue to cause further increases. We may not therefore be able to afford or may decide not to
acquire additional land as a result of such price increases, particularly if we are not able to transfer our acquisition
costs to our customers. Regulations by different local authorities relating to the availability, use or development
of land could also lead to further shortages of suitable and affordable land available for development.
Our inability to acquire adjoining parcels of land may also affect some of our existing and future development
activities as we acquire parcels of land at various locations, which can be subsequently consolidated to form a
single land area, upon which we can undertake development. Any failure to acquire neighbouring parcels of land
in the future on terms that are acceptable to us, or at all, may cause a delay or force us to abandon or modify our
development plans, which may adversely affect our returns on our initial investment.
48. Our operations could be adversely affected by changes to the FSI/TDR regime in MMR.
We and other developers are subject to municipal planning and land use regulations in effect in MMR and in
other cities in India, including Pune, which limit the maximum square footage of completed buildings we may
construct on plots to specified amounts, calculated based on a ratio of the combined gross floor area of all floors,
except areas specifically exempted, to the total area of each plot of land (the floor space index, or “FSI”).
Transferable Development Rights (“TDRs”), in the form of a Development Rights Certificate granted by the
relevant statutory authority (the Municipal Corporation of Greater Mumbai (the “MCGM”) in Mumbai), provide
a mechanism by which a person, who is unable to use the available FSI of his/her plot for various reasons, is
permitted to use the unused FSI on other properties in accordance with applicable regulations or transfer the
unused FSI to a third party. Some of our development sites are reserved for public purposes or for providing
public amenities such as roads, gardens, playgrounds, hospitals and schools. If we decide to develop such sites,
we are required to develop them in accordance with the applicable reservation and hand over the completed
development to the MCGM or other relevant authority. In return, we are compensated by grants of TDRs in the
form of FSI, which can be used by us within the same development or, subject to certain restrictions, within
another development or transferred to a third party.
Sometimes, a development site has potential for development, but FSI has already been consumed. In such cases,
we can acquire FSI by way of TDRs and utilise it on such developments. For example, we acquire TDRs from
58
third parties to enable us to build beyond the approved limit for our buildings (therefore resulting in an increase
in the total Saleable Area of our projects). If we are unable to acquire such TDRs or if we are unable to acquire
them at the expected price, then this may impact our ability to complete certain projects due to us having
insufficient FSI or because of a significant increase in the cost of completing such projects. The price and
availability of TDRs may have an adverse effect on our ability to complete our projects and on our financial
condition and results of operations.
In addition, if the regulations were changed to reduce the applicable FSI or to disallow the acquisition or
utilisation of TDRs, we may not be able to develop our projects to the full extent of their estimated Saleable Area,
and our business, financial condition and results of operations could be materially and adversely affected.
49. Our ability to generate revenue could be affected by any changes to the slum rehabilitation schemes currently
in effect in MMR.
Some of our joint venture partners participate as developers, in slum rehabilitation projects under the slum
rehabilitation scheme contained in the Development Control Regulations for Greater Bombay, 1991, promulgated
by the MCGM in exercise of its powers under the Maharashtra Regional and Town Planning Act, 1966. Under
this scheme, developers are responsible for carrying out the slum rehabilitation component and, as compensation
for carrying out such rehabilitation works, they receive development rights from the Government of Maharashtra
or may be entitled to sell the remainder of the development (the “free-sale” portion) in the open market, at their
own discretion and to retain the sale proceeds. We undertake to develop the free-sale portion of such
developments. We are currently developing the free-sale portion of a slum rehabilitation project on a revenue-
share basis, and may, in the future, continue to develop projects either with joint venture partners or our own on
such land. If the slum rehabilitation scheme in effect in MMR were to significantly change or be terminated, we
may be required to purchase developable land from third parties at significantly increased costs, and may not be
able to acquire development rights over sufficient suitable land at acceptable costs for our future development
projects, which may in turn adversely affect our business, financial condition and results of operation.
50. Our business is capital intensive and significantly dependent on the availability of real estate financing in
India.
Our business is cyclical and highly capital-intensive, requiring substantial capital to develop and market our
projects. We expect that we will require additional funding to meet our capital expenditure needs, which could
result in incurrence of indebtedness and leverage and therefore, borrowing costs and require us to comply with
certain restrictive covenants.
Our ability to obtain financing on favourable commercial terms, if at all, will depend on a number of factors,
including:
(i) our future financial condition, results of operations and cash flows;
(ii) the amount and terms of any existing indebtedness;
(iii) general market conditions and market conditions for financing activities by real estate companies; and
(iv) economic, political and other conditions in India and, in particular, MMR.
Challenging conditions, including continued disruptions in the capital and credit markets as a result of
uncertainty, changing or increased regulation of financial institutions, reduced alternatives or failures of
significant financial institutions, may significantly diminish the availability of credit to us and our customers. In
addition, any failure to make payments of interest or principal on our outstanding indebtedness on a timely basis
would likely result in a reduction of our creditworthiness or credit rating, which could harm our ability to incur
additional indebtedness on acceptable terms. Such events may require us to delay or abandon some or all of our
planned projects, reduce planned expenditures and advances to obtain land or development rights, and reduce the
scale of our operations, and may adversely affect the sales of, and market rates for, our projects, and,
consequently, our profitability. In addition, Indian regulations on foreign investment in housing, built-up
infrastructure and construction and development projects impose significant restrictions, which may impact the
availability of financing for our operations. Further, under current Indian regulations except for certain limited
purposes, external commercial borrowings cannot be raised for investment in real estate, which may further
restrict our ability to obtain necessary financing. In the event we are not able to raise additional financing on
favourable terms, or at all, our planned capital expenditure, business, results of operations and prospects could
be adversely affected.
51. Tax benefits available to us and our customers may be withdrawn.
Various tax benefits under the Income Tax Act, 1961 are available to us and purchasers of residential premises
who have obtained loans from banks or other financial institutions. A change in the law, including the proposed
migration to the direct tax code, or in the interpretation of the law may result in the discontinuation or withdrawal

59
of these tax benefits, which could adversely affect the ability or willingness of our customers to purchase our
residential projects and therefore, affect our financial condition and results of operations.
In addition, certain tax benefits we had previously claimed may be denied and we may therefore be required to
pay the relevant tax authorities the amounts in relation to the claimed tax benefits. For details of our taxation
related disputes, please see the section entitled “Legal Proceedings” on page 190. This could adversely affect our
financial condition and results of operations.
52. Our business, results of operations and growth plan could be adversely affected by the incidence and rate of
property taxes and stamp duties.
As a property owning and development company, we are subject to the property tax regimes in jurisdictions in
which we operate. Stamp duty is payable for the agreements entered into in respect of the properties we buy and
sell. These taxes could increase in the future, and new types of property taxes, stamp duties and service and other
value added taxes may be introduced which may increase our overall costs. If these property taxes, stamp duties
and service or other value added taxes were to increase, our acquisition costs and sale values may be affected,
resulting in a reduction of our profitability. Any such changes in the incidence or rates of property taxes or stamp
duties or service and other value added taxes could have an adverse effect on our financial condition and results
of operations.
53. We face labour risks, including potential increases in labour and labour related litigation costs.
We operate in a labour-intensive industry and we or our contractors hire casual labour to work on our projects.
In the event of a labour dispute, if we or our contractors are unable to successfully negotiate with the workmen
or sub-contractors, it could result in work stoppages or increased operating costs as a result of higher than
anticipated wages or benefits. It may also be difficult to procure the required skilled workers for existing or future
projects. Either of these factors could adversely affect our business, financial condition, results of operations and
cash flows. In addition, we may be liable for or exposed to sanctions, penalties or losses arising from accidents
or damages caused by our workers or contractors.
Pursuant to the memorandum of settlement dated January 13, 2017 entered into between our Company and the
Bharatiya Kamgar Sena, a registered trade union, eligible employees are entitled to certain monetary and other
benefits. These benefits could substantially increase our costs, thereby adversely affecting our business,
prospects, results of operations and financial conditions.
54. Our operations and the work force on our development sites are exposed to various hazards.
We conduct various site studies prior to the acquisition of any parcel of land and its construction and development.
However, there are certain unanticipated or unforeseen risks that may arise due to adverse weather and geological
conditions, such as storms, outbreaks of disease, hurricanes, lightning, floods, landslides, monsoons, rockslides
and earthquakes and other reasons. In particular, our operations may be adversely affected by difficult working
conditions during the monsoon season from June to September, which may restrict our ability to commence
construction activities and fully utilise our resources. Additionally, our operations are subject to hazards inherent
in providing these services, such as the risk of equipment failure, impact from falling objects, collision, work-
related accidents, fire, or explosion, including hazards that may cause injury and loss of life, severe damage to
and destruction of property and equipment, and environmental damage. If any one of these hazards or other
hazards were to affect our business, our results of operations may be adversely affected. Moreover, any injury to
or loss of life of the workers employed on our construction sites may expose us to liability and / or compensation
claims.
55. Changes in interest rates in India could adversely affect our business and the market for our real estate
developments.
Our results of operations, and the purchasing power of our real estate customers, are substantially affected by
prevailing interest rates and the availability of credit in the Indian economy.
Our ability to borrow funds for the development of our real estate projects is affected in part by the prevailing
interest rates available to us from leading Indian banks. Changes in prevailing interest rates affect our interest
expense in respect of our borrowings, and our interest income in respect of our interest on short-term deposits
with banks and loans to associates. Significantly, the interest rate at which we may borrow funds, and the
availability of capital to us for development purposes, affects our results of operations by limiting or facilitating
the number of projects we may undertake and determining the return which we must obtain from each project to
meet our obligations under our borrowings.
Changes in interest rates also affect the ability and willingness of our prospective real estate customers,
particularly the customers for our residential properties, to obtain financing for their purchases of our completed

60
developments. The interest rate at which our real estate customers may borrow funds for the purchase of our
properties affects the affordability and purchasing power of, and hence the demand for, our real estate
developments.
Changes in interest rates also affect the valuation of our office space projects and retail projects. Any adverse
effects on the valuation of our properties could have a material adverse effect on the enterprise value of our
business.
An increase in interest rates in India could adversely affect our credit ratings, which would have a direct effect
on our interest costs, as the interest rates on our borrowings are at times, directly linked to our credit ratings.
There can be no assurance that variations in interest rates and interest rate policy by the RBI will not adversely
affect our financial condition and results of operations.
56. A decline in India’s foreign exchange reserves may affect liquidity and interest rates in the Indian economy,
which could adversely affect our financial condition.
India‘s foreign exchange reserves totalled approximately US$ 422.53 billion as of March 31, 2018. Reserves
reached an all-time high of $426 billion on April 13, 2018, but has since declined. Further declines in foreign
exchange reserves could adversely affect the valuation of the India Rupee. In addition, it could result in reduced
liquidity and higher interest rates that could adversely affect our future financial performance and the market
price of the Equity Shares.
57. Our business is subject to extensive and changing laws, rules and regulations, which may become more
stringent in the future.
The real estate sector in India is heavily regulated by the central, state and local governments. Real estate
developers are therefore required to comply with various Indian laws and regulations, including policies and
procedures established and implemented by local authorities. Accordingly, our business is governed by various
laws and regulations including the Right to Fair Compensation and Transparency in Land Acquisition,
Rehabilitation and Resettlement Act, 2013, RERA and the rules made thereunder, including state specific rules,
the Indian Stamp Act, 1899, the Maharashtra Regional and Town Planning Act, 1966, the Maharashtra Stamp
Act, 1958, the Indian Registration Act, 1908, the MOFA, the Environment (Protection) Act, 1986 and the
Consumer Protection Act, 1986.
The Government of India has also implemented a comprehensive national goods and services tax (“GST”) regime
with effect from July 1, 2017 that combines multiple taxes and levies by the Central and State Governments into
a unified tax structure. While the Government of India and certain state governments have announced that all
committed incentives will be protected following the implementation of the GST, given that the various rules and
regulations regarding the new regime are being evaluated in terms of various implications concerning the GST,
we cannot assure you as to this or as to any other aspect of the tax regime following implementation of the GST
including anti-profiteering regulations of the new tax regime and availability of input tax credit.
Further, the General Anti-Avoidance Rules (“GAAR”) became effective from April 1, 2017. The tax
consequences of the GAAR provisions being applied to an arrangement could result in the denial of tax benefits
to an arrangement, among other consequences. In the absence of any such precedents on the subject, the
application of these provisions is uncertain. If the GAAR provisions are made applicable to our Company, it may
have an adverse tax impact on us.
In November 2016, the Government of India introduced demonetisation, which an immediate effect of decreasing
the liquidity of cash in India, thereby negatively affecting consumer spending. It was an important factor in the
drop of residential sales in India in financial year 2017. The impacts of the demonetisation on India’s economic
growth, credit demand, credit quality, liquidity and interest rates is uncertain. The long term effects of
demonetisation on our business are uncertain and we cannot accurately predict the effects thereof on our business,
results of operations, financial condition and prospects.
Furthermore, on March 28, 2018, the MCA notified Ind AS 115, Revenue from Contracts with Customers, to be
applicable from April 1, 2018. For details, please see the section entitled “Management’s Discussion and Analysis
of Financial Condition and Results of Operations” on page 73.
Regulatory authorities may allege that we are not in compliance with applicable laws and regulations and may
subject us to regulatory action including penalties, seizure of land and other civil or criminal proceedings.
Our business could be adversely affected by any change in laws, municipal plans or interpretation of existing
laws, or promulgation of new laws, rules and regulations applicable to us. We may not be able to adapt to new

61
laws, regulations or policies that may come into effect from time to time with respect to the real estate sector,
which may cause a delay in the implementation of our projects. For example, the Bombay High Court put a stay
on new development permissions (other than for redevelopment projects) for construction of buildings from
March 2016 onwards, which was temporarily relaxed in March 2018 for six months with effect from March 15,
2018. For more information, please see the section entitled “Legal Proceedings” on page 190.
Unfavourable changes in or interpretations of existing, or the promulgation of new laws, rules and regulations
including foreign investment laws governing our business, operations and group structure could result in us being
deemed to be in contravention of such laws and may require us to apply for additional approvals including the
Development Control Regulation 2034 which is proposed to be made applicable to development of real estate
and land in Maharashtra. We may incur increased costs and other burdens relating to compliance with such new
requirements, which may also require significant management time and other resources, and any failure to comply
may adversely affect our business, prospects and results of operations. Uncertainty in the applicability,
interpretation or implementation of any amendment to, or change in, governing law, regulation or policy,
including by reason of an absence, or a limited body, of administrative or judicial precedent may be time
consuming as well as costly for us to resolve and may affect our business, prospects and results of operations.
For instance, while we are of the view that we are not required to obtain certain environment approvals in relation
to certain of our projects, we cannot assure you that the regulator or the courts will agree with our interpretation
of the legal requirements. Accordingly, non-compliance with legal requirements, including such non-compliance
arising out of uncertainty in the applicability, interpretation or implementation of any law, could have a material
adverse effect on our business, financial condition and results of operations.
58. We face significant risks before we realise any income from our real estate developments because of the length
of time required for completion of each project.
Real estate developments typically require substantial capital outlay during the acquisition of land or development
rights and/or construction phases and it may take a year or more before income or positive cash flows may be
generated through sales of a real estate development. Depending on the size of the development, the time span
for completing a real estate development runs into several years. Consequently, changes in the business
environment during the length of time a project requires for completion may affect the revenue and cost of the
development during the period from project commencement to completion, directly impacting on the profitability
of the project. Factors that may affect the profitability of a project include the risk that the receipt of government
approvals may take more time than expected, the failure to complete construction according to original
specifications, schedule or budget, and lacklustre sales or leasing of properties. The sales and the value of a real
estate development project may be adversely affected by a number of factors, including but not limited to the
national, state and local business climate and regulatory environment, local real estate market conditions,
perceptions of property buyers and tenants in terms of the convenience and attractiveness of the project and
competition from other available or prospective properties developments.
If any of the risks described above materialises, our returns on investment may be delayed and/or lower than
originally expected by us and our financial performance may be adversely affected.
59. A significant portion of our working capital needs are funded by presales. Any cancellation of sales or changes
in the laws or regulations governing the use of presales may affect our working capital and financial position.
Our presales, done during construction of a project, have allowed us to benefit from deposit and instalment
payments from our customers, which we use as working capital. This allows us to maintain healthy levels of
working capital and to reduce our debt servicing costs. Any decrease in our presales may increase our working
capital needs.
In addition, our ability to use such presales to meet our working capital needs may be affected by laws or
regulations, or changes in the Government’s interpretation or implementation thereof. We may be unable to find
alternative sources of working capital in a timely manner, which could have adverse effect on our financial
position.
60. Our lands may be subject to compulsory acquisition by the government, which may adversely affect our
business, prospects, results of operations and financial conditions.
The right to own property in India is subject to restrictions that may be imposed by the Government. In particular,
the Government, under the provisions of the Right to Fair Compensation and Transparency in Land Acquisition,
Rehabilitation and Resettlement Act, 2013 (the “Land Acquisition Act, 2013”) has the right to compulsorily
acquire any land if such acquisition is for a “public purpose”, after providing compensation to the owner.
However, the compensation paid pursuant to such acquisition may not be adequate to compensate the owner for
the loss of such property. The likelihood of such acquisitions may increase as the central and state governments
seek to acquire land for the development of infrastructure projects such as roads, railways, airports and townships.
Any such action in respect of one or more of our Ongoing or Planned projects could adversely affect our business.

62
61. Significant differences exist between Ind AS and Indian GAAP on one hand and other accounting principles,
such as U.S. GAAP and IFRS on the other, which may be material to investors’ assessments of our financial
condition.
Our consolidated financial statements have been prepared in accordance with Ind AS from periods beginning
April 1, 2016. We have not attempted to quantify the impact of U.S. GAAP or IFRS on the financial data included
in this Placement Document, nor do we provide a reconciliation of our financial statements to those of U.S.
GAAP or IFRS. U.S. GAAP and IFRS differ in significant respects from Ind AS and Indian GAAP. Accordingly,
the degree to which the Ind AS and Indian GAAP financial statements, which are included in this Placement
Document will provide meaningful information is entirely dependent on the reader’s level of familiarity with
Indian accounting practices. Any reliance by persons not familiar with Indian accounting practices on the
financial disclosures presented in this Placement Document should accordingly be limited.
RISKS RELATING TO THE INDIAN ECONOMY
62. Our business is substantially affected by prevailing economic conditions in India.
We perform all of our real estate development activities in India, all of our projects are located in India, and the
predominant portion of our customers are Indian companies or Indian nationals. As a result, we are highly
dependent on prevailing economic conditions in India and our results of operation are significantly affected by
factors influencing the Indian economy. Factors that may adversely affect the Indian economy, and hence our
results of operations, include:
(i) any increase in Indian interest rates or inflation;
(ii) any scarcity of credit or other financing in India, resulting in an adverse impact on economic conditions
in India and scarcity of financing of our real estate developments and the purchase thereof by our
customers;
(iii) prevailing income conditions among Indian consumers and Indian corporations;
(iv) changes in India’s present tax, trade, fiscal or monetary policies, such as the application of GST;
(v) natural disasters, political instability, communal disturbances, riots, civil unrest, terrorism or military
conflict in India or in countries in the region or globally, including in India‘s various neighbouring
countries;
(vi) prevailing national, regional or global economic conditions, including in India‘s principal export
markets; and
(vii) other significant regulatory or economic developments in or affecting India or its real estate development
sector.
In addition to the factors set forth above, our business may be affected by adverse changes specific to the
residential, office space, retail and hospitality real estate markets. Demand in the residential real estate market
may be adversely affected by changes such as a decrease in disposable income or a rise in residential mortgage
rates or a decline in the population. Demand for our office space developments may be adversely affected by
deteriorating economic conditions that could prompt current and potential tenants to place any expansion plans
on hold or to search for locations with lower rental rates. Our business may also be affected by adverse changes
specific to the retail industry, which has historically been and could be in the future adversely affected by, the
adverse financial condition of some large retail companies, ongoing consolidation in the retail sector in India, the
excess amount of retail space in a number of Indian regional markets, an increase in consumer purchases through
catalogues or the
Internet and reduction in the demand for tenants to occupy our shopping centres as a result of the Internet and
ecommerce, the timing and costs associated with property improvements and rentals, any changes in taxation and
zoning laws and adverse government regulation. We are also susceptible to factors which may adversely affect
demand in the hospitality industry, such as reduced international and domestic travel, competition in the industry
and new hotel supply in the market (which could harm our Occupancy Levels), labour costs, worker‘s
compensation and healthcare related costs, the impact of unionisation, operational costs, political instability,
terrorist activity and natural disasters.
63. Financial instability and volatility in securities markets in countries other than India could disrupt our
business and adversely affect the price of our Equity Shares.
The Indian market and the Indian economy are influenced by economic and market conditions in other countries,
particularly emerging market countries in Asia. Financial turmoil in Europe and elsewhere in the world in recent
years has affected the Indian economy. Although economic conditions are different in each country, the Indian
market and Indian economy are influenced by economic and market conditions in other countries and investors’
reactions to developments in one country may have an adverse effect on the securities of companies in other
countries, including India. Recently, the currencies of a few Asian countries suffered depreciation against the

63
U.S. Dollar owing to amongst other, the announcement by the U.S. government that it may consider reducing its
quantitative easing measures.
A loss of investor confidence in the financial systems of other emerging markets may cause increased volatility
in Indian financial markets and the Indian economy in general. Any worldwide financial instability could also
have a negative impact on the Indian economy, including the movement of exchange rates and interest rates in
India, which could adversely affect the Indian financial sector in particular. Any financial disruption could have
an adverse effect on our business, future financial performance, shareholders’ equity and the price of our Shares.
The global credit and equity markets have experienced substantial dislocations, liquidity disruptions and market
corrections in recent years. Since September, 2008, liquidity and credit concerns and volatility in the global credit
and financial markets increased significantly with the bankruptcy or acquisition of, and government assistance
extended to, several major U.S. and European financial institutions. These and other related events, such as the
European sovereign debt crisis, have had a significant impact on the global credit and financial markets as a
whole, including reduced liquidity, greater volatility, widening of credit spreads and a lack of price transparency
in global credit and financial markets. In response to such developments, legislators and financial regulators in
the United States and other jurisdictions, including India, have implemented a number of policy measures
designed to add stability to the financial markets.
However, the overall impact of these and other legislative and regulatory efforts on the global financial markets
is uncertain, and they may not have the intended stabilizing effects. In the event that the current difficult
conditions in the global credit markets continue or if there is any significant financial disruption, such conditions
could have an adverse effect on our business, future financial performance and the trading price of our Equity
Shares.
64. Natural or manmade disasters in India, including MMR, could have a negative impact on the Indian economy
and cause our business to suffer.
The occurrence of natural disasters, including hurricanes, floods, earthquakes, tornadoes, monsoons, fires,
explosions, pandemic diseases, and manmade disasters, including acts of terrorism and military actions, could
delay the construction and completion of projects, thereby adversely affecting our results of operations or
financial condition. Although constructed and maintained to withstand certain natural events, our buildings
constructed and in progress may not survive such catastrophic events, or may experience substantial damage. In
addition, our operations may be adversely affected by difficult working conditions during the monsoon season
from June to September that may restrict our ability to commence construction activities and fully utilise our
resources. This may deprive us of rental income with regard to properties that we rent to third parties, result in
losses with regard to our works in progress and expose us to claims from our tenants or customers.
Such events could also adversely affect our hospitality business segment. For instance, India has experienced
civil and social unrest, terrorist attacks and other acts of violence in the past. The occurrence of any of the
foregoing could create a greater perception that investment in Indian companies involves a higher degree of risk
and, even if unrelated to our business, could adversely affect our operations, revenues and profitability, and the
price of our Equity Shares. The consequences of any terrorist attacks or armed conflicts are unpredictable and
may include the issuance of travel advisories warning people to defer and/or avoid travel to certain locations in
which we operate, as well as a general reluctance of people to travel. We may not be able to foresee events that
could have an adverse effect on the travel and hospitality and leisure industry, the locations in which our hotels
are located and our business and results of operations.
65. Inflation in India could have an adverse effect on our profitability and if significant, on our financial
condition.
The annual rate of inflation, was at 3.18% (provisional) for the month of April 2018 (over April 2017) as
compared to 2.47% (provisional) for the previous month and 3.85% during the corresponding month of 2017
(Source: Index Numbers of Wholesale Price in India, Review for the month of April 2018, published on May 14,
2018 by Government of India, Ministry of Commerce and Industry). Continued high rates of inflation may
increase our expenses related to salaries or wages payable to our employees or any other expenses. There can be
no assurance that we will be able to pass on any additional expenses to our customers or that our revenue will
increase proportionately corresponding to such inflation. Accordingly, high rates of inflation in India could have
an adverse effect on our profitability and, if significant, on our financial condition.
66. Currency exchange rate fluctuations may affect the value of the Equity Shares.
The exchange rate between the Rupee and other foreign currencies, including the U.S. Dollar, the British pound
sterling, the Euro, the Hong Kong Dollar, the Singapore Dollar and the Japanese Yen, has changed substantially
in recent years and may fluctuate substantially in the future. Fluctuations in the exchange rate between the foreign
currencies with which an investor may have purchased Rupees may affect the value of the investment in our

64
Equity Shares. Specifically, if there is a change in relative value of the Rupee to a foreign currency, each of the
following values will also be affected:
(i) you may be unable to the foreign currency equivalent of the Rupee trading price of our Equity Shares in
India;
(ii) the foreign currency equivalent of the proceeds that you would receive upon the sale in India of any of
our Equity Shares; and
(iii) the foreign currency equivalent of cash dividends, if any, on our Equity Shares, which will be paid only
in Rupees.
You may be unable to convert Rupee proceeds into a foreign currency of your choice, or the rate at which any
such conversion could occur could fluctuate. In addition, our market valuation could be seriously harmed by a
devaluation of the Rupee if investors in jurisdictions outside India analyse its value based on the relevant foreign
currency equivalent of our financial condition and results of operations.
67. Foreign investors are subject to foreign investment restrictions under Indian law.
Under the foreign exchange regulations currently in force in India, transfers of shares between non- residents and
residents are permitted (subject to certain exceptions) if they comply with the pricing guidelines and reporting
requirements specified by the RBI. If the transfer of shares is not in compliance with such pricing guidelines or
reporting requirements or fall under any of the exceptions, then the prior approval of the RBI will be required.
Additionally, shareholders who seek to convert the Rupee proceeds from a sale of shares in India into foreign
currency and repatriate that foreign currency from India will require a no objection or a tax clearance certificate
from the income tax authority. The Government of India may impose foreign exchange restrictions in certain
emergency situations, including situations where there are sudden fluctuations in interest rates or exchange rates,
where the Government of India experiences extreme difficulty in stabilising the balance of payments, or where
there are substantial disturbances in the financial and capital markets in India. These restrictions may require
foreign investors to obtain the Government of India’s approval before acquiring Indian securities or repatriating
the interest or dividends from those securities or the proceeds from the sale of those securities. Thus, we cannot
assure you that any required approval from the RBI or any other Government agency can be obtained on any
particular terms or at all.
68. Rights of shareholders under Indian laws may differ from the laws of other jurisdictions.
Our articles of association and Indian law govern our corporate affairs. Indian legal principles related to corporate
procedures, directors’ fiduciary duties and liabilities, and shareholders’ rights may differ from those that would
apply to a company in another jurisdiction. Shareholders’ rights including in relation to class actions, under Indian
law may not be as extensive as shareholders’ rights under the laws of other countries or jurisdictions.
69. It may not be possible for you to enforce any judgment obtained outside India, including in the United States,
against our Company or any of our Company’s affiliates in India, except by way of a suit in India on such
judgment.
We are incorporated under the laws of India and our executive Directors and executive officers reside in India.
A substantial majority of our assets, and the assets of our Directors and officers, are also located in India.
As a result, you may be unable to:
(i) effect service of process outside of India upon us and our Directors and officers; or
(ii) enforce in courts outside of India judgments obtained in such courts against us and our Directors and
officers.
For details, please see the section entitled “Enforcement of Civil Liabilities” on page 17.
70. There may be less information available about companies listed on Indian securities markets than about
companies listed on securities markets in other countries.
Our Equity Shares are not listed on any stock exchange outside India. There is a difference between the level of
regulation, disclosure and monitoring of the Indian securities markets and the activities of investors, brokers and
other participants, and that of markets in the U.S. and other more developed economies. SEBI is responsible for
ensuring and improving disclosure and other regulatory standards for the Indian securities markets. SEBI has
issued regulations and guidelines on disclosure requirements, insider trading and other matters. There may be
less publicly available information about Indian public companies, including us, than is regularly disclosed by
public companies in other countries with more mature securities markets. As a result, you may have access to
less information about our business, results of operations and financial conditions (and those of our competitors

65
that are listed on the Indian Stock Exchanges and other stock exchanges in India) on an ongoing basis than you
may have in the case of companies subject to reporting requirements of other countries.
71. A downgrade of India’s sovereign debt rating may adversely affect our ability to raise debt financing.
Any adverse revisions by international rating agencies to the credit ratings of the Indian national government’s
sovereign domestic and international debt may adversely affect our ability to raise financing by resulting in a
change in the interest rates and other commercial terms at which we may obtain such financing. This could have
a material adverse effect on our capital expenditure plans, business and financial performance. A downgrading
of the Indian national government’s debt rating may occur, for example, upon a change of government tax or
fiscal policy, which are outside our control.

66
MARKET PRICE INFORMATION
As at the date of this Placement Document, 33,96,02,237 Equity Shares are issued, subscribed and outstanding. The Equity
Shares have been listed and are available for trading on BSE and NSE.
On June 12, 2018, the closing price of the Equity Shares on BSE and NSE was ₹ 511.00 and ₹ 511.65 per Equity Share,
respectively. Since the Equity Shares are actively traded on the Stock Exchanges, the market price and other information
for each of BSE and NSE has been given separately.
(i) The following tables set forth the reported high, low and average market prices and the trading volumes of the
Equity Shares on the Stock Exchanges on the dates on which such high and low prices were recorded for the
Financial Years ended March 31, 2018, March 31, 2017 and March 31, 2016:
BSE
Financial
Year
High (₹) Date of high Number of
Equity
Shares
traded on
the date of
high
Total turnover of
Equity Shares
traded on date of
high (₹)
Low (₹) Date of low Number of
Equity
Shares
traded on
the date of
low
Total turnover
of Equity Shares
traded on date
of low (₹)
Average
price for
the year
(₹)
2018 559.45 February 26,
2018
2,62,504 14,26,71,983.00 342.95 June 28, 2017 13,989 48,60,732.00 434.84
2017 385.15 March 22,
2017
40,972 1,58,06,208.00 232.00 April 8, 2016 3,362 7,88,945.00 302.79
2016 315.95 May 11, 2015 51,376 1,64,68,808.00 210.30 September 2,
2015
23,268 49,64,145.00 263.68
(Source: www.bseindia.com)
NSE
Financial
Year
High (₹) Date of high Number of
Equity
Shares
traded on
the date of
high
Total turnover of
Equity Shares
traded on date of
high (₹)
Low (₹) Date of low Number of
Equity
Shares
traded on
the date of
low
Total turnover
of Equity Shares
traded on date
of low (₹)
Average
price for
the year
(₹)
2018 559.30 February 26,
2018
22,95,099 1,24,40,58,578.35 344.50 June 29, 2017 1,26,598 4,34,91,145.40 434.81
2017 385.20 March 22,
2017
9,07,421 34,58,33,348.40 230.75 April 8, 2016 1,33,625 3,13,38,455.70 302.92
2016 317.05 May 11, 2015 7,30,626 23,46,71,576.05 210.15 September 2,
2015
2,76,177 5,85,71,109.00 263.79
(Source: www.nseindia.com)
Notes:
1. High, low and average prices are based on the daily closing prices. 2. In the case of a year, average represents the average of the closing prices of all trading days of each year presented.
3. In case of two days with the same high or low price, the date with the higher volume has been chosen.
(ii) The following tables set forth the reported high, low and average market prices and the trading volumes of the
Equity Shares on the Stock Exchanges on the dates on which such high and low prices were recorded during each
of the last six months:
BSE
Month year High
(₹)
Date of
high
Number
of Equity
Shares
traded
on date
of high
Total turnover
of Equity
Shares traded
on date of high
(₹)
Low (₹) Date of low Number
of Equity
Shares
traded
on date
of low
Total
turnover of
Equity
Shares
traded on
date of low
(₹)
Averag
e price
for the
month
(₹)
May 2018 550.85 May 14, 2018 61,231 3,39,02,715.00 497.45 May 24, 2018 25,327 1,25,89,622.00 520.16
April 2018 579.30 April 23, 2018 1,81,131 10,18,43,224.00 496.5 April 4, 2018 21,970 11,110,456.00 524.37
March 2018 555.65 March 13,
2018
66,359 3,65,92,715.00 472.50 March 23, 2018 30,108 14,259,366.00 504.82
February 2018 559.45 February 26,
2018
2,62,504 14,26,71,983.00 456.75 February 9, 2018 26,856 12,469,010.00 485.26
January 2018 553.30 January 11,
2018
55,376 3,01,14,610.00 479.45 January 1, 2018 17,901 8,719,659.00 512.89
December 2017 480.10 December 20,
2017
7,830 37,59,819.00 451.85 December 12,
2017
17,294 7,832,906.00 469.47
(Source: www.bseindia.com)

67
NSE
Month year High
(₹)
Date of
high
Number
of Equity
Shares
traded
on date
of high
Total turnover
of Equity
Shares traded
on date of high
(₹)
Low
(₹)
Date of low Number
of Equity
Shares
traded
on date
of low
Total
turnover of
Equity
Shares
traded on
date of low
(₹)
Average
price
for the
month
(₹)
May 2018 555.85 May 14, 2018 7,19,479 40,01,89,929.80 498.55 March 24, 2018 2,44,579 12,13,87,236.90 520.60
April 2018 577.15 April 23, 2018 23,14,914 1,29,71,48,544.65 496.05 April 4, 2018 3,16,409 15,97,61,866.05 524.51
March 2018 556.95 March 13, 2018 11,11,325 61,35,45,191.45 468.65 March 23, 2018 3,98,449 18,80,41,519.55 504.38
February 2018 559.30 February 26,
2018
22,95,099 1,24,40,58,578.35 454.45 February 9, 2018 7,67,406 35,62,88,445.35 485.26
January 2018 555.25 January 11,
2018
6,73,424 36,56,55,414.55 479.60 January 3, 2018 2,43,441 11,68,64,682.25 512.75
December 2017 481.20 December 29,
2017
3,20,138 15,33,53,544.75 451.05 December 12,
2017
1,36,255 6,18,10,409.65 469.19
(Source: www.nseindia.com)
Notes: 1. High, low and average prices are based on the daily closing prices.
2. In the case of a month, average represents the average of the closing prices of all trading days of each month presented.
3. In case of two days with the same high or low price, the date with the higher volume has been chosen.
(iii) The following table set forth the details of the number of Equity Shares traded and the turnover during the last
six months and the Financial Years ended March 31, 2018, 2017 and 2016 on the Stock Exchanges:
Period Number of Equity Shares Traded Turnover (In ₹)
BSE NSE BSE NSE
Year ended March 31, 2018 1,20,84,587 8,50,15,510 5,35,25,70,007.00 38,04,21,84,668.75
Year ended March 31, 2017 1,15,79,493 7,29,64,275 3,62,84,39,049.00 22,31,61,02,553.45
Year ended March 31, 2016 59,34,234 5,41,28,226 1,62,28,44,975.00 14,52,10,62,535.90
May 2018 9,88,228 73,74,998 52,27,29,873.00 3,89,51,77,006.80
April 2018 12,23,837 1,18,70,828 66,38,10,444.00 6,47,48,86,499.75
March 2018 9,17,824 1,05,65,110 46,70,02,835.00 5,40,22,14,066.60
February 2018 7,92,364 83,11,004 41,01,97,834.00 4,22,74,21,335.35
January 2018 10,70,678 79,73,183 56,40,00,479.00 4,12,58,39,113.90
December 2017 4,94,051 41,00,870 23,11,36,244.00 1,93,35,00,450.50 (Source: www.bseindia.com and www.nseindia.com)
(iv) The following table sets forth the market price on the Stock Exchanges on April 25, 2018, the first working day
following the approval of our Board of Directors for the Issue:
BSE NSE
Open High Low Close Number
of Equity
Shares
traded
Volume (₹) Open High Low Close Number
of Equity
Shares
traded
Volume (₹)
567.75 591.85 556.70 571.00 1,28,567 7,40,56,779.00 569.00 592.80 557.00 569.20 10,48,556 60,34,48,469.05
(Source: www.bseindia.com and www.nseindia.com)

68
USE OF PROCEEDS
The gross proceeds from the Issue are ₹ 1,200 crore.
The net proceeds from the Issue, after deducting estimated issue expenses including fees, commissions and expenses of
the Issue amounting to approximately ₹ 15 crore, will be approximately ₹ 1,185 crore (the “Net Proceeds”).
Subject to compliance with applicable laws and regulations, our Company intends to use the Net Proceeds for various
purposes, including but not limited to, (i) acquisition of land, land development rights or development rights (directly or
indirectly through any other means) by paying premium, fee or charges as required under applicable laws to the regulatory
authorities; (ii) working capital requirements of the our Company; (iii) to invest in our Subsidiaries, Joint Ventures and
affiliates; (iv) capital expenditure; (v) repayment of debt; (vi) any cost incurred towards the objects of our Company; and
(vii) general corporate purposes as per our Company’s growth and business related plans from time to time.
As permissible under applicable laws, our Company’s management will have the flexibility in deploying the Net Proceeds.
Pending utilisation of the Net Proceeds, our Company intends to invest the funds in creditworthy instruments, including
money market, mutual funds, and deposits with banks and corporates or other securities. Such investments would be in
accordance with the investment policies as approved by our Board from time to time and applicable laws.
Our Board shall determine the quantum of Net Proceeds to be deployed by our Company from the Issue, depending on
business opportunities or requirements of our Company from time to time.
Since the Net Proceeds of the Issue are proposed to be utilized towards the purposes set forth above, and not for
implementing any specific project, the following disclosure requirements under the SEBI Regulations are not applicable:
(i) break-up of cost of the project; (ii) means of financing such project; and (iii) proposed deployment status of the proceeds
at each stage of the project.
Neither our Promoter, nor any of our other Directors are making any contribution either as part of the Issue or separately
in furtherance of the objects of the Issue.

69
CAPITALISATION STATEMENT
The following table sets forth our Company’s capitalization and total debt as at March 31, 2018 extracted from the Audited
Consolidated Financial Statements and as adjusted to give effect to the receipt of gross proceeds for the Issue. This table
should be read in conjunction with the sections entitled “Management’s Discussion and Analysis of Financial Condition
and Results of Operations” and “Financial Statements” on pages 73 and 197, respectively:
(₹ in lakhs)
Particulars Pre-Issue (As at March
31, 2018)
(On a consolidated
basis)
Increase/(decrease) due
to the Issue(1)
Amount after
considering the Issue
(i.e. Post-Issue) - (On a
consolidated basis)(2)
Borrowings
Long term (Non-Current) 67,864.18 - 67,864.18
Short term (Current) 26,585.76 - 26,585.76
Current maturities of long term
(Non-Current) borrowings
74,956.29 - 74,956.29
Total Borrowings - A 1,69,406.23 - 1,69,406.23
Equity
Equity Share Capital* 33,960.23 2,400.00 36,360.23
Other Equity 5,75,277.14 1,17,600.00 6,92,877.14
Total Equity - B 6,09,237.37 1,20,000.00 7,29,237.37
Total Capitalization 7,78,643.60 1,20,000.00 8,98,643.60 *Equity Share capital includes voting rights in respect of 200 Equity Shares are frozen due to such Equity Shares being held in demat or unclaimed
suspense account.
Notes: (1) Adjustments to reflect the number of Equity Shares issued pursuant to the Issue and proceeds from the Issue. Adjustments do not include Issue
related expenses. (2) As adjusted to reflect the number of Equity Shares issued pursuant to the Issue and proceeds from the Issue. Adjustments do not include Issue related
expenses.

70
CAPITAL STRUCTURE
The share capital of our Company as at the date of this Placement Document is set forth below:
Aggregate value at face value (₹)
A AUTHORISED EQUITY SHARE CAPITAL
42,50,00,000 Equity Shares 4,25,00,00,000
B ISSUED, SUBSCRIBED AND PAID-UP EQUITY SHARE CAPITAL BEFORE THE ISSUE
33,96,02,237 Equity Shares 3,39,60,22,370
C PRESENT ISSUE IN TERMS OF THIS PLACEMENT DOCUMENT
2,40,00,000 Equity Shares aggregating to ₹ 1,200.00 crore(1) 24,00,00,000
D PAID-UP EQUITY SHARE CAPITAL AFTER THE ISSUE
36,36,02,237 Equity Shares 3,63,60,22,370
E SHARE PREMIUM ACCOUNT
Before the Issue(2) 16,73,64,58,413
After the Issue 28,49,64,58,413 Equity Share capital includes voting rights in respect of 200 Equity Shares are frozen due to such Equity Shares being held in demat or unclaimed suspense account. (1) The Issue has been authorised by our Board pursuant to resolution dated April 24, 2018, and by the shareholders of our Company pursuant to the
special resolution dated June 5, 2018. (2) As of March 31, 2018
Equity Share capital history of our Company
(1) The history of the Equity Share capital of our Company is set forth below:
Date of allotment Number of
Equity Shares
issued
Face value
(₹)
Issue
price (₹)
Consideratio
n
Reasons/ mode of allotment
May 8, 1998 300 10 10 Cash Allotment to initial subscribers to
the Memorandum of Association
January 24, 2002 9,54,750 10 20 Cash Further issue under Section 81(1)
of the Companies Act, 1956
February 6, 2002 10,44,950 10 20 Cash Further issue under Section 81(1)
of the Companies Act, 1956
March 5, 2005 3,00,000 10 600 Cash Further issue under Section 81(1)
of the Companies Act, 1956
January 17, 2007 3,00,642 10 21,327.7 Cash Further issue under Section 81(1)
of the Companies Act, 1956
December 30, 2009 28,60,70,620 10 - Other than
cash
Bonus Issue in the ratio of 110
Equity Shares for each Equity
Share held on the record date
October 15, 2010 3,95,62,000 10 260 Cash Initial public offering by our
Company
July 20, 2015 1,10,00,000 10 295 Cash Preferential Allotment to Aranda
Investments (Mauritius) Pte. Ltd.
Our Company has not made any allotments of its Equity Shares in the last one year preceding the date of this Placement
Document.
Employee Stock Option Scheme 2009
Our Company instituted the Employee Stock Option Scheme 2009 (“ESOP 2009”) on December 4, 2009 pursuant to
Board and shareholders resolutions both dated December 4, 2009. ESOP 2009 was amended pursuant to the Board and
the shareholders resolutions dated May 4, 2010 to the effect that inter alia in the event of change in the constitution or
control of our Company, the vesting of options shall be determined by the Compensation Committee instead of the vesting
schedule mentioned in ESOP 2009. Further, the Compensation Committee has been authorised to re-price the options
which are not exercised in accordance with the amended ESOP 2009 and applicable laws provided that this is not
detrimental to the employees. The purpose of ESOP 2009 is to attract, retain, reward and motivate employees to contribute
to the growth and profitability of our Company. The maximum aggregate number of Equity Shares in respect of which the
options may be granted under the ESOP 2009 is 14,43,356 Equity Shares.

71
The following table sets forth details in respect of the ESOP Scheme as on March 31, 2018:
Sr. No. Particulars Number of Options
1. Total number of options 14,43,356
2. Total number of options granted 13,49,553
3. Options vested -
4. Options exercised 3,68,975
5. Options lapsed or forfeited 9,80,578
6. Total number of options outstanding -
The following table sets forth a summary of the allotments of Equity Shares made by our Company pursuant to the exercise
of stock options granted under the ESOP Scheme:
Quarter during which allotments were
made
No. of Equity
Shares Allotted
Face Value
Issue Price Consideration
Quarter ended March 31, 2015 4,707 10 260 Cash
Quarter ended June 30, 2015 37,834 10 260 Cash
Quarter ended September 30, 2015 - - - -
Quarter ended December 31, 2015 27,566 10 260 Cash
Quarter ended March 31, 2016 476 10 260 Cash
Quarter ended June 30, 2016 59,104 10 260 Cash
Quarter ended September 30, 2016 17,656 10 260 Cash
Quarter ended December 31, 2016 36,505 10 260 Cash
Quarter ended March 31, 2017 1,18,316 10 260 Cash
Quarter ended June 30, 2017 66,811 10 260 Cash

72
DIVIDENDS
Our Company has adopted dividend distribution policy effective from August 19, 2016. The declaration and payment of
dividends, if any, will be recommended by our Board and approved by the shareholders of our Company, in their
discretion, subject to the provisions of the Articles of Association and the Companies Act, 2013. Dividend, if any, is
distributed to the shareholders in proportion to the amount paid-up on the shares held by them and includes interim
dividend. The declaration of dividends will be dependent on a number of internal and external factors, including, but not
limited to, cash balances, overall financial position of our Company, present and future profitability, growth outlook, cash
flows from operations, cash requirements for operations and investments, the political and economic environment, events
in Indian or abroad having or likely to have an impact on the operations of the Company, and other such factor that the
Board deems relevant. There is no guarantee that any dividends will be declared or paid or that the amount thereof will
not be decreased in the future.
Our Board may consider declaring interim dividend based on our Company’s performance during the year. Our Board
may also recommend final dividend at the end of the year.
The following table sets forth the dividend per Equity Share and the total amount of dividends declared on the Equity
Shares for Financial Years 2018, 2017 and 2016:
Particulars Financial Year
2018
Financial Year
2017
Financial Year
2016
Face value of Equity Shares (₹ per Equity Share) 10 10 10
Dividend on Equity Shares (₹ per Equity Share) 2 2 2
Interim dividend on Equity Shares* (In ₹ lakhs) - - 6,786.08
Final dividend on Equity Shares* (In ₹ lakhs) 6,792.04 6,792.04 -
Total dividend on Equity Shares* (In ₹ lakhs) 6,792.04 6,792.04 6,786.08
Dividend Rate (%)** 20 20 20
Dividend Distribution Tax on above dividend (In ₹ lakhs) 1,396.12 1,382.70 1,381.49 *Excludes tax on dividend ** Dividend Rate = Dividend per Equity Share / Face value per Equity Share
The amounts paid as dividends in the past are not necessarily indicative of our Company’s future dividend amounts.

73
MANAGEMENT’S DISCUSSION AND ANALYSIS OF FINANCIAL CONDITION AND RESULTS OF
OPERATIONS
The following discussion is intended to convey management’s perspective on our financial condition and results of
operations as of and for the years ended March 31, 2018, 2017 and 2016.
Prior to April 1, 2016, we prepared our financial statements in accordance with Indian GAAP and the Companies Act.
With effect from April 1, 2016, we adopted Ind AS notified under the Companies Act and, accordingly, our financial
statements as of and for the year ended March 31, 2017 and subsequent periods have been prepared in accordance with
Ind AS and the Companies Act. In this section, (i) the financial information as of and for the years ended March 31, 2018
and 2017 has been extracted or derived from the Ind AS Audited Consolidated Financial Statements and (ii) the financial
information as of and for the year ended March 31, 2016 has been extracted or derived from the financial statements for
the year ended March 31, 2016 restated in accordance with Ind AS for comparative information and presented in the Ind
AS Audited Consolidated Financial Statements for the year ended March 31, 2017. For more information about our
transition to Ind AS and a reconciliation between Indian GAAP and Ind AS, see Note 4.2 to the Audited Consolidated
Financial Statements for the year ended March 31, 2017, included in the section entitled “Financial Statements” on page
293.
The financial statements for the financial years ended March 31, 2018 and March 31, 2017, prepared under Ind AS, and
the financial statements for the year ended March 31, 2016, restated in accordance with Ind AS for comparative
information, are not comparable with financial statements prepared for prior periods in accordance with Indian GAAP.
Ind AS and Indian GAAP differ in certain respects from each other and from IFRS and U.S. GAAP and other accounting
principles with which prospective investors may be familiar.
The financial information in this section is presented in “lakhs”. One lakh represents 100,000.
This discussion and analysis contains forward-looking statements that reflect our current views with respect to future
events and financial performance. Our actual results may differ materially from those anticipated in these forward-looking
statements as a result of any number of factors, including those set forth in the sections entitled “Risk Factors” and
“Forward-Looking Statements” on pages 39 and 16, respectively.
Overview
We are a real estate development company operating in MMR, focused on premium developments. We believe that our
customer-centric approach and our focus on delivering high quality projects have enabled us to establish a reputed brand.
We, together with our Promoter and Promoter Group, have a track record of over 30 years of developing high quality
projects that are driven by an emphasis on strong project execution, contemporary architecture and quality construction.
As of March 31, 2018, we, together with our Promoter and Promoter Group, have delivered over 40 projects across micro
market segments in MMR covering approximately 11,298,358 square feet of Saleable Area.
While our focus is on residential projects, we have a diversified portfolio of projects across key segments of the real estate
market including residential, office space, retail, hospitality and social infrastructure projects in mixed-use and single-
segment developments. By integrating residential projects with office space, retail, hospitality or social infrastructure
projects, we seek to create “destination developments” such as Oberoi Garden City, which we believe enhance the
desirability of our mixed-use projects.
Our in-house team leverages many decades of strong real estate industry experience in the execution of land acquisitions,
the procurement of regulatory approvals and sales and marketing. We have a proven and scalable outsourcing model that
emphasises quality design, construction and property management. We work with international and domestic architects
and contractors. We believe that this outsourcing model provides us with the scalability required to undertake large
developments and also enables our management to focus on the key drivers of our business.
Through our deep understanding of the regulatory processes for property development in our markets and a compliance-
driven approach to our business, we seek to ensure effective risk management and timely delivery to our customers. Under
the guidance of our highly experienced management team, we seek to maintain an optimal capital structure with prudent
use of leverage. We believe this has enabled us to adapt to the changing market environment in a focused and constructive
manner. This has also developed our ability to understand our customer needs enabling us to determine product mix and
configuration. Our transparent and customer-friendly processes enhance customer experience and customer satisfaction.
We currently follow a sale model for our residential projects and a predominantly lease model for our office space and
retail projects as we believe this provides us with stable cash flows. In the past, we have also followed a sale model for a
portion of our office space projects. In our hospitality projects, we currently follow an operating agreement model,
whereby the hotel is owned by us and operated by a hotel chain. As of March 31, 2018, we own 1,698,161 square feet of
Saleable Area of our Completed office space (including 100,900 square feet of Saleable Area occupied by us) and retail
projects, which follow the lease model, and 381,820 square feet of Saleable Area of our Completed hospitality project,
which follows the operating agreement model.

74
We currently have 11 Ongoing and 15 Planned projects, which we expect to provide a total Saleable Area of approximately
28,020,823 square feet.
Our consolidated total revenue and consolidated profit after tax were ₹ 129,200.70 lakhs and ₹ 45,880.32 lakhs for the
year ended March 31, 2018, ₹ 116,104.19 lakhs and ₹ 37,858.76 lakhs for the year ended March 31, 2017 and ₹ 145,891.41
lakhs and ₹ 43,555.60 lakhs for the year ended March 31, 2016.
Factors Affecting Our Results of Operations and Financial Condition
Our business and results of operations are affected by a number of significant factors, including the following:
Fluctuations in market prices for our projects
Our total revenue is affected by the sales and rental prices of our projects which are affected by prevailing market
conditions and prices in the real estate sector in MMR and in India generally (including market forces of supply and
demand), the nature and location of our projects, and other factors such as our brand and reputation and the design of the
projects.
Supply and demand market conditions are affected by various factors outside our control, including:
prevailing local economic, income and demographic conditions;
availability of consumer financing (interest rates and eligibility criteria for loans);
availability of tax benefits that make projects more affordable to customers;
availability of and demand for projects comparable to those we develop;
changes in governmental policies relating to zoning and land use;
changes in applicable regulatory schemes; and
competition from other real estate developers.
The real estate sector is also significantly influenced by global and domestic economic conditions. During economic
downturns, buyers may become cautious, rentals of office space may face downward pressure and consumer sentiment
and market spending may be adversely affected, any of which may have a material adverse effect on our financial condition
and results of operations. Since most of our Ongoing and Planned projects are concentrated in Mumbai, we are particularly
affected by changes in real estate market conditions in Mumbai and its surrounding areas.
Sales volume and rate of progress of construction and development
Revenue from projects, which comprised 66.06% of our total revenue in the year ended March 31, 2018, 64.29% in the
year ended March 31, 2017 and 72.88% in the year ended March 31, 2016 is recognised in accordance with the percentage
of project completion method with respect to that portion relating to the sale of our projects. Please see the section entitled
“―Critical Accounting Policies” on page 78. Under the percentage of project completion method of revenue recognition,
our revenue from sales and costs recognised in any particular period depend on the volume of bookings (as compared with
the Saleable Area for the respective project) we have been able to obtain, as well as the rate of progress of construction of
our projects. We include the cost of acquiring land, land development rights and TDRs in calculating construction cost for
purposes of our percentage of project completion method of revenue recognition.
The volume of bookings depends on our ability to design projects that will meet customer preferences and market trends,
and to timely market and sell our projects, the willingness of customers to pay for the projects or enter into sale agreements
well in advance of receiving possession of the projects and general market conditions. Our bookings also depend on our
ability to market our projects and we utilize innovative solutions and offers to make our projects attractive to potential
customers. For example, we recently launched an innovative marketing offer consisting of payment terms with zero GST
impact and deferred payment options.
Subject to applicable laws and regulations, we market and sell our projects in phases, depending on the type and scale of
the project and on market conditions.
Construction progress depends on various factors, including the availability and cost of labour and raw materials, the
actual cost of construction (which is particularly affected by fluctuations in the market price for raw materials such as steel
and cement) and changes to the estimated total construction cost, the competence of and priority given to our projects by
our contractors, the receipt of approvals and regulatory clearances, access to utilities such as electricity and water, and the
absence of contingencies such as litigation and adverse weather conditions. As we and our contractors import certain
materials for use in our projects, construction progress is also dependent on the timely shipment and clearance of materials.
We generally do not recognise income for our residential projects until the construction work reaches a certain level and
the percentage of completion over the course of construction is not distributed equally through the period as it depends on
the actual cost incurred during any particular period as well as the amount of estimated total construction cost which may
vary during the period of development.

75
During the years ended March 31, 2018, 2017 and 2016, the following residential projects affected our revenue recognition
on the percentage of project completion method:
Year ended March 31,
Project(1) 2018 2017 2016
Exquisite Completed Completed Completed(2)
Esquire Under construction Under construction Under construction(4)
Prisma Under construction Under construction Under construction(3) (1) Commencement and completion of construction in the table above is defined from a revenue recognition perspective and does not take into account approvals and
regulatory clearances for legal completion.
(2) Commenced revenue recognition in the quarter ending December 31, 2010.
(3) Commenced revenue recognition in the quarter ending March 31, 2015.
(4) Commenced revenue recognition in the quarter ended December 31, 2015.
As of March 31, 2018, revenue recognition for our projects Sky City, Eternia, Enigma and Three Sixty West has not
commenced, since these projects yet to reach the threshold limit.
Occupancy Levels of our leased office space, retail and social infrastructure projects and the rental rates charged and
realised
We receive lease income from rentals of our Completed office space projects, Commerz I and Commerz II – Phase I, and
our Completed retail project, Oberoi Mall.
The amount that we receive in lease income is based upon the amount of space we have leased and the rate per square foot
we charge for that leased space. The occupancy and rates we charge per square foot depend on various factors including
the location and design of the project, the tenant mix (this is relevant in the case of shopping malls), prevailing economic
conditions and competition. The amount that we receive in lease income from our office space projects is also dependent
on demand and supply generally, general economic conditions, business confidence and competition. Our lease income
is also affected by escalation clauses contained in certain of our lease agreements, which provide for an escalation of rental
at fixed points during the period of the lease. As of March 31, 2018, the Occupancy Levels for our office space projects
were 82.13% (Commerz I) and 47.52% (Commerz II – Phase I) and for our shopping mall was 99.37%.
We lease retail space in our shopping mall either on a fixed rental, variable (revenue-based) rental, fixed plus variable or
fixed or variable (whichever is higher) basis. The more consumers spend at stores for which the rent contains a variable
component, the more lease income we will receive. The amount of money spent by consumers at these stores is dependent
on numerous factors including prevailing economic conditions and competition from other shopping malls and stores. In
addition, the fixed portion of monthly rent generally increases at certain stages over the lease term by an agreed amount.
We also intend to lease space in our Ongoing and Planned social infrastructure projects, either on fixed rental, fixed plus
variable (revenue based) or variable rental basis. Social infrastructure projects, such as schools, hospitals and education
complexes are essential services and are not dependent on economic cycles. We have entered into a leave and licence
agreement, dated March 23, 2018, with the Oberoi Foundation, a public charitable trust, with respect to its operation of
Oberoi International School, Goregaon. We have also entered into a leave and licence agreement dated March 23, 2018
with Oberoi Foundation with respect to its operation of Oberoi International School, JVLR Campus. Pursuant to each
agreement, we receive monthly license fees from Oberoi Foundation.
Cost and availability of land and land development rights
The cost of land, which includes the amounts paid for freehold rights, leasehold rights and fungible FSI as well as the
construction cost of areas given to landlords in consideration for joint development rights and the cost of registration and
stamp duty, represents a substantial part of our project cost, particularly since our projects are located in MMR. We acquire
land and land development rights from the government and private parties. We acquire land or enter into arrangements to
develop land in advance of planning and designing our projects. Please see the section entitled “Our Business – Key
Business Processes” on page 121. The profitability of our business is dependent on our land acquisition costs and our
growth is dependent on the availability of land for our future development. We compete with other developers to identify
and acquire land of suitable size and location for the development of our projects.
We acquired a substantial portion of the land for our currently Completed, Ongoing and Planned projects when land prices
were generally lower than prevailing market prices; however, we may not be able to continue acquiring and at prices lower
than prevailing market prices. In addition, our land acquisition costs may increase as a result of our preference for larger
parcels of land being available for development.
In addition to direct purchases from land owners, we expect that future sources of land parcels will include slum
rehabilitation schemes, infrastructure development projects, cluster redevelopment projects or the sale of former
manufacturing facilities. Our ability to maintain or improve on our profit margin (which we define as Profit Before Tax
as a percentage of Total Revenue) will depend on our ability to sell or rent our projects at corresponding prices that reflect
the increased cost of land.
Land in MMR is subject to developable plot ratios determined by the state government. In certain parts of MMR, the
developable plot ratios may be increased up to a maximum limit by the use of land development rights.

76
In future, we may seek to jointly develop new projects under a development management model. The benefit of a
development management model is that it is an “asset light” model where we act as the development manager for other
developers and land owners in return for a share of revenue or profit or a management fee, without any commitment on
our part in terms of sales price, sales velocity and construction cost. This model has become popular in recent years due
to an increase in the number of distressed projects in the real estate market.
We acquire land development rights to increase the Saleable Area of our developments and, to the extent we generate
TDRs from reservations on land we own, we generally retain these TDRs, although we may liquidate a portion of these
TDRs for short-term cash flows. There is an active market for the purchase and sale of TDRs which is affected by a number
of factors, including prevailing conditions of demand and supply in the real estate market, timing of completion of projects
which generate TDRs, the extent to which increase in developable plot ratio may be allowed by making payment to the
state government and changes in the TDR regulatory regime in MMR. The cost of land development rights as a proportion
of project costs depends upon the quantum of land development rights utilised in the project and the cost of acquisition of
land development rights.
From time to time, we seek to acquire land or land development rights through a competitive bidding process. We are
typically required to enter into a deed of conveyance, a lease deed or a deed for development rights transferring title or
leasehold rights or development rights in our favour. The registration charges and stamp duty are also typically payable
by us. Additional costs include those incurred in complying with regulatory formalities, such as fees paid for change of
land use. Typically for acquisition of land or land development rights, we are required to pay an advance prior to or at the
time of executing transaction agreements, with the remaining purchase price due upon completion of the acquisition. We
may acquire lands through auction and prior to bidding in the auction, we may be required to pay a refundable deposit or
earnest money. In certain cases, we may be required to furnish a bank guarantee for which we would be required to pay
the applicable bank charges.
We also acquire the right to develop projects through arrangements with other parties that own land or land development
rights. The other party is typically given the option, as consideration, to either share the sale proceeds with us in a
predetermined proportion depending upon the nature of the project and the location of the land, or to receive a
predetermined portion of the developed area which such party may market at its expense. We may also acquire stakes in
companies or entities to gain access to land they own and we may enter into development management agreements or
collaboration agreements with third parties that have acquired, or are in the process of acquiring, development rights to
the land we want to access. As of March 31, 2018 we had interest in eight projects through such arrangements, namely:
Three Sixty West; The Ritz-Carlton Mumbai – Worli, Mumbai; Juhu Hotel; Sangam City; Tardeo; Malabar Hill; I-Ven
Mall; and I-Ven Hotel.
Cost of construction/development/hotel expenses
In addition to the cost of land and land development rights described above, our cost of construction/development /hotel
expenses comprises primarily the cost of raw materials (in particular cement and steel), contractors, architects and other
consultants, construction materials, finishes and food, beverage and hotel operating expenses.
Cost of third party contractors, architects and consultants
We outsource the design and construction of our projects. We engage international and domestic architects under fixed
price contracts and third-party contractors under item rate contracts which specify a fixed contract price, subject to an
indexed pricing schedule for certain items such as steel, cement and labour. Certain of our contracts with our contractors
also provide for an incentive bonus to be paid if the project is completed within a specified time frame. Other variable
costs comprise indirect taxes in connection with the contract. We typically engage contractors through a competitive
bidding process.
The progress and quality of construction of the projects we develop depends on the availability and skill of our contractors
and consultants, as well as contingencies affecting them, including labour and industrial actions such as strikes and
lockouts. Such labour and industrial actions may cause significant delays to the construction timetables for our projects,
and we may therefore be required to find replacement contractors and consultants at higher cost. As a result, any increase
in prices resulting from higher construction costs could adversely affect our profit margins, demand for our projects and
the relative affordability of our projects as compared to our competitors’ products.
Cost of raw materials, construction materials and finishes
Our cost of construction/development is affected by price fluctuations in raw materials (in particular cement and steel),
electrical accessories, plumbing materials, flooring (tiles), painting, lifts and escalators. These and other construction
materials and finishes form a significant portion of our cost of construction. Raw materials prices may be affected by
shortages in supply and price volatility caused by various factors beyond our control, including general economic
conditions, competition, production levels, transportation costs and changes in import restrictions. In addition, our supply
chain may be periodically interrupted by circumstances beyond our control, including work stoppages and labour disputes
affecting our suppliers, their distributors, or the transporters of our supplies.

77
We typically enter into “turnkey” contracts and our contractors are responsible for the purchase of raw materials, including
cement and steel (typically subject to an indexed pricing schedule). If there are extraordinary price increases in
construction materials due to increase in demand, or shortages in supply, the contractors we hire for construction or
development work may be unable to fulfil their contractual obligations and we may have to engage another contractor at
a higher cost, or we may end up doing the work ourselves or we may face delay in the construction of our projects. Prices
for steel and cement in particular fluctuated significantly during the last five fiscal years. In addition, during periods of
volatility in the price of building materials, where prices have increased significantly or unexpectedly, we may not be able
to pass price increases through to our customers, particularly as we generally aim to sell a significant portion of our
residential units prior to project completion, which could reduce or eliminate the profits we attain with regard to our
projects, or even result in losses. As a result, increases in costs for any construction materials may impact our construction
costs, and consequently our profitability.
If the actual cost of a project increases so that the total cost of the project exceeds or is estimated to exceed total income,
we recognise the loss immediately.
Mix of residential, office space, retail and other projects developed and mix of projects developed for lease and for
sale
Our total revenue is derived primarily from the development of residential projects for sale and the leasing of office space,
retail and social infrastructure projects and from hotel operations. The decision to sell or lease a project depends upon the
nature of the development and its location. Generally, we develop our residential projects for sale, office space and retail
projects for sale and/or lease, hospitality projects for ownership (and outsource operations pursuant to an operating
management agreement) and social infrastructure projects for lease, and intend to continue to do so in the future. As of
March 31, 2018, five projects have been leased or are being retained for lease: Commerz I, Commerz II – Phase I, Oberoi
Mall, Oberoi International School, Goregaon and Oberoi International School, JVLR Campus.
Our consolidated rental and other revenue was 18.10%, 16.70% and 12.26% of our total revenue in the years ended March
31, 2018, 2017 and 2016, respectively, from our Completed office space, retail and social infrastructure projects. Our
rental revenue depends primarily on the mix of office space and retail space available for lease and factors that affect the
rental rates we charge.
As of March 31, 2018, we had lease agreements for 58.07% of our leasable office space and 99.37% of our leasable retail
space. These agreements generally provide for an initial term that is not subject to early termination at the option of the
tenant, followed by a subsequent term whereby the tenant is permitted to terminate upon a prescribed notice period.
Factors affecting operating results of our hospitality segment
Our Completed hospitality project, The Westin Mumbai – Garden City, commenced operations on May 1, 2010. We also
have one Ongoing hospitality project (The Ritz-Carlton Mumbai – Worli, Mumbai) and three Planned hospitality projects.
Revenue from hospitality comprised 9.89%, 10.83% and 8.71% of our total revenue in the years ended March 31, 2018,
2017 and 2016, respectively. Our operating results in our hospitality segment are affected by the average Occupancy Level
of the hotel, room rates charged and revenues from food and beverages, which are in turn affected by a number of factors,
including the following:
● the state of the Indian economy, which will affect the number of business travellers generally to MMR;
● proximity to offices, corporates and convention centres, as business travellers to MMR generally select hotels on
the basis of proximity to meeting or conference venues;
● outbreak of pandemic diseases in Asia in general or India in particular which would affect our customers‘ decision
to travel to MMR;
● terrorist attacks and other significant events: India has experienced civil and social unrest, terrorist attacks and
other acts of violence in the past and any actual or threatened acts of violence in the future (including accompanied
by travel advisories from various countries) will likely have an adverse effect on our operating results;
● pricing of rooms: our room rates are set on the basis of market conditions and value perception is created through
the brand of the hotel operator and the use of promotional packages. However, we may be required to adjust our
pricing strategies from time to time in response to market changes and the pricing strategies of our competitors,
which may have an adverse effect on our margins, and accordingly, our income and profitability;
● competition: the hospitality and leisure industry in Mumbai is highly competitive and competitive factors include
room rates, quality of accommodation and service, brand recognition, convenience of location and, to a lesser
extent, scope of other amenities. Our ability to compete for customers will have a significant effect on our
operating results;
● seasonality, our business is adversely affected by the monsoon period in India during June to September and
positively affected by typical periods of high occupancy during October to February; and
● staff costs and operating expenses: a significant component of operating expenses for our hospitality segment
consists of salaries and related expenses. Attracting competent, highly qualified employees is important to the
success of our hospitality business as our employees have extensive contact with our customers and the positive
influence of customer relations positively affects our ability to attract repeat customers to our hotels. We hire our

78
employees primarily from MMR and other parts of India, but may also hire expatriates because local candidates
may not be sufficiently qualified, which will increase our operating expenses.
Changes in interest rates
One of the major drivers behind the growth of demand for housing units is rising disposable income and the availability
of housing loans at affordable interest rates. Changes in interest rates affect the ability and willingness of prospective
customers of our residential projects, and other projects for sale, to obtain financing to purchase our projects, and hence
the demand for such projects.
In addition, the acquisition of land and development rights, and the development of real estate projects require substantial
capital expenditure. Our ability to obtain financing, as well as the cost of such financing, affects our business and
operations. As of March 31, 2018, 2017 and 2016, our total outstanding indebtedness (consisting of long term borrowings
(non-current), short term borrowings (current) and current maturities of long term borrowings (non-current)) was ₹
169,406.23 lakhs, ₹ 86,864.28 lakhs and ₹ 47,344.67 lakhs, respectively. For the years ended March 31, 2018, 2017 and
2016, our total interest expense was ₹ 10,976.65 lakhs, ₹ 7,205.63 lakhs and ₹ 6,204.10 lakhs, respectively, before
allocating to cost of projects.
Industry factors
Regulatory framework
The real estate sector in India is subject to many regulations. Regulations applicable to our operations include standards
regarding land acquisition, the ratio of built-up area to land area, land usage, the suitability of building sites, road access,
necessary community facilities, open spaces, water supply, sewage disposal systems, electricity supply, environmental
suitability and size of the project. Approval of development plans is conditioned on, among other things, completion of
the acquisition of the project site and the developer‘s administrative capabilities. Approvals must be obtained at the
national, state and local levels, and our results of operations are expected to continue to be affected by the nature and
extent of the regulation of our business, including the relative time and cost involved in procuring approvals for each new
project, which can vary from project to project. For example, RERA, which was notified in May 2016 and implemented
on May 1, 2017, has imposed certain obligations on real estate developers, including us, such as mandatory registration of
real estate projects, not issuing any advertisements or accepting advances unless real estate projects are registered under
RERA, restrictions on use of funds received from customers prior to project completion and taking customer approval for
major changes in sanction plan. RERA was implemented in Maharashtra under the Maharashtra Real Estate (Regulation
Development) (Registration of Real Estate Projects, Registration of Real Estate Agents, Rates, of Interest and Disclosure
on Website) Rules, 2017. Certain sections of the GST Act took effect from July 1, 2017 and any new rules or regulations
thereunder may also have a material effect on our results of operations. For additional information regarding RERA and
applicable laws and regulations in general, please see “Regulations and Policies” on page 128.
Critical Accounting Policies
We prepare our financial statements in conformity with Ind AS. In applying these accounting policies, we are required to
make judgments, estimates and assumptions that affect the reported amounts of assets and liabilities, disclosure of
contingent liabilities and reported amounts of revenues and expenses as of and during the reporting period and that are not
readily apparent from other sources. The estimates and associated assumptions are based on historical experience and
other factors that we consider to be relevant. Actual results may differ from these estimates.
The estimates and underlying assumptions are reviewed at each reporting date. Revisions to accounting estimates are
recognised in the period in which the estimate is revised if the revision affects only that period, or in the period of the
revision and future periods if the revision affects both current and future periods.
We believe the following are the critical accounting policies and related judgments and estimates used in the preparation
of our consolidated financial statements. For more information on each of these policies, see “Note 2 — Significant
Accounting Policies” and “Note 3 – Use of Judgment and Estimates” in the notes to our Audited Consolidated Financial
Statements for the year ended March 31, 2018 on pages 208 and 222, respectively.
Revenue recognition
We recognise revenue to the extent that it is probable that the economic benefits will flow to us and the revenue can be
reliably measured, regardless of when the payment is being made. We measure revenue at the fair value of the
consideration received or receivable, taking into account contractually defined terms of payment and excluding taxes or
duty.
Revenue from real estate projects. Revenue from project development sales is recognised on the percentage of project
completion method. Through March 31, 2018, we recognised revenue in accordance with the Guidance Note on
“Accounting for Real Estate Transactions (for entities to whom Ind AS is applicable)” issued by ICAI in May 2016, which
required recognition of revenue under the percentage of completion method and allowed recognition of revenue only when

79
(i) all critical approvals necessary for project commencement have been obtained, (ii) at least 25% of estimated
construction and development cost (excluding land, development rights and borrowing cost) have been incurred, (iii) at
least 25% of the total saleable area is secured by agreement or letter of allotment (containing salient terms of agreement
to sell) with buyers and (iv) receipt of at least 10% of the sales consideration per contract. The percentage of completion
is calculated based on the total project cost incurred to the total estimated project cost including land and borrowing cost.
Our management exercises judgment in determining when to commence revenue recognition – for example, our
management makes estimates, some of which are technical in nature, regarding, where relevant, the percentage of
completion, costs to completion and the area available for sale. During the course of the project, our estimates may be
revised, if appropriate, by our management. The effect of such changes to estimates is recognised prospectively in the
period such changes are determined. However, when the total project cost is estimated to exceed total revenue from the
project, the loss is recognised immediately.
Our management also exercises judgment in determining the nature of costs to be included in determining project cost for
percentage of project completion. We include the cost of land acquisition and land development rights in calculating actual
or estimated total project cost for the purposes of determining percentage of completion.
Beginning on and after April 1, 2018, we recognise revenue in accordance with Ind AS 115. Ind AS 115 was not effective
for the periods covered in our Audited Consolidated Financial Statements. For information about Ind AS 115 and its
expected impact on our financial statements, please see the section entitled “—New Accounting Standards and
Interpretations Not Yet Adopted by our Company” on page 87. See also “Risk Factors - It is difficult to predict our future
performance, or compare our historical performance between periods, as our revenue fluctuates significantly from period
to period. In particular, the revenue recognition policy applicable to us may change going forward” on page 40.
Revenue from hospitality. In our hospitality segment, revenues comprise sales of rooms, food and beverages and allied
services relating to hotel operations. Revenue is recognized when the services are rendered, provided there is evidence of
an arrangement, tariff/rates are fixed or are determinable, and collectability is reasonably certain. Revenue from sales of
goods or services is net of indirect taxes, returns and discounts.
Revenue from lease rentals. Our rental agreements for tenants in our office space and retail projects are generally
considered operating leases as the risk and rewards incidental to ownership of the projects remains substantially vested in
us as landlord. Under Ind AS, rent under operating leases is charged to our profit and loss account on a straight line basis
over the lease term, unless there is another systematic basis which is more representative of the time pattern of the lease.
Revenue from lease rentals is net of indirect taxes, if any.
Revenue from property management services is recognised at the value of the service provided and is net of indirect taxes,
if any.
Inventories
Our inventories include construction work-in-progress and completed units. In our hospitality segment, inventories include
food and beverages and hospitality-related operating supplies. Construction materials and consumables are valued at cost
or net realisable value, whichever is lower. Construction materials and consumables purchased for construction work
issued to construction are treated as consumed. Construction work-in-progress includes costs of projects which have not
been offered for sale, unsold units in projects that have been offered for sale and units where the customer has given an
advance towards purchase of the unit but the threshold for recognising revenue under the percentage of project completion
method, has not been achieved. Construction work-in-progress includes cost of land, development rights, rates and taxes,
construction costs, borrowing costs, other direct expenditure, allocated overheads and other incidental expenses, and is
valued at cost or net realisable value, whichever is lower. Our inventories of completed units are valued at cost or net
realisable value, whichever is lower. Our management estimates net realisable value of our inventories of completed units,
including market value of inventories of completed units, to determine which value to assign to these inventories. Stocks
of food and beverages are carried at cost, net of taxes (computed on a moving weighted average basis) or at net realisable
value, whichever is lower. Cost includes all expenses incurred in bringing the goods to their present location and condition.
Hospitality-related operating supplies (i.e. guest amenities, maintenance supplies and rack brochures) are valued at cost,
(computed on a moving weighted average basis net of taxes) or at net realisable value and are expensed as and when
purchased.
Impairment of assets
We assess at each reporting date whether there is any indication that an asset may be impaired based on internal or external
factors. We recognise an impairment loss when the carrying amount of an asset exceeds its recoverable amount (which is
the greater of the asset’s fair value less cost of disposals and value in use).
At each reporting date, if there is any indication that a previously assessed impairment loss no longer exists or may have
decreased, we estimate the asset’s recoverable amount. A previously recognised impairment loss is reversed only if there
has been a change in the assumptions used to determine the asset’s recoverable amount since the last impairment loss was
recognised. The reversal is limited so that the carrying amount of the asset does not exceed its recoverable amount, nor

80
exceed the carrying amount that would have been determined, net of depreciation, had no impairment loss been recognised
for the asset in prior years.
Our management’s significant judgments and estimates related to impairment include the determination if an event has
occurred to warrant an impairment test. If a test is required, other significant judgments and estimates include our
management’s expectations of future cash flows, and the calculation of the fair value of the assets impaired.
Depreciation
We calculate depreciation in accordance with Part C of Schedule II of the Companies Act, 2013, from the date the assets
were put to use on a straight line basis at the rate prescribed. Management reviews its estimate of the useful lives of
depreciable / amortisable assets at each reporting date, based on the expected usage of the assets. Uncertainties in these
estimates relate to technical and economic obsolescence that may change the usage of certain assets.
Provisions and contingent liabilities
We make provisions when we have a present obligation as a result of a past event, it is probable that an outflow of economic
resources will be required to settle the obligation and a reliable estimate can be made of the amount of the obligation.
Accordingly, our management is required to make judgments on the probability that an outflow or economic resources is
required and that a reliable estimate can be made to estimate the amount to provision. A disclosure for contingent liability
is made when there is possible or present obligation that may or may not require an outflow of resources.
Employee benefits
We make contributions to the provident fund and pension fund and make provision for leave encashment schemes and
contribution to gratuity fund for our employees on the basis of actuarial valuations made at the end of the fiscal period and
these are recognised in our profit and loss account. We engage third party consultants to provide the actuarial valuations
and these are based on actuarial estimates. Our management reviews these valuations in each fiscal period and any actuarial
gains and losses are recognised immediately in the statement of other comprehensive income.
Results of Operations
The following table presents a summary of our consolidated statement of profits and losses by amount and as a percentage
of our total revenue during the periods indicated. Our historical results presented below are not necessarily indicative of
the results that may be expected for any other future period.
(₹ in lakh, except for percentages)
Year ended March 31,
2018 2017 2016
₹ % of Total
Revenue
₹ % of Total
Revenue
₹ % of Total
Revenue
Income
Revenue from operations 126,542.90 97.94 111,374.39 95.93 141,614.71 97.07
Other income 2,657.80 2.06 4,729.80 4.07 4,276.70 2.93
Total revenue 129,200.70 100.00 116,104.19 100.00 145,891.41 100.00
Expenses
Operating costs
95,034.64 73.56 43,707.13(1) 37.64 62,953.69(1) 43.15
Changes in inventories (48,247.66) (37.34) - - - -
Excise duty 3.16 0.00 12.36 0.01 13.71 0.01
Employee benefits expense 6,715.33 5.20 6,416.17 5.53 5,705.84 3.91
Finance cost 686.31 0.53 557.22 0.48 683.26 0.47
Depreciation and amortisation 4,906.76 3.80 4,949.54 4.26 4,899.50 3.36
Other expenses 5,511.57 4.27 4,232.08 3.65 5,311.13 3.64
Total expenses 64,610.11 50.01 59,874.50 51.57 79,567.13 54.54
Profit before share of profit of joint
ventures (net) and exceptional items
64,590.59 49.99 56,229.69 48.43 66,324.28 45.46
Share of Profit/(Loss) of joint ventures (net) 361.97 0.28 313.93 0.27 159.50 0.11
Profit before tax 64,952.56 50.27 56,543.62 48.70 66,483.78 45.57
Tax expense
Current tax 21,976.10 17.01 18,677.95 16.09 21,653.27 14.84
Deferred tax (3,019.39) (2.34) 6.91 0.01 1,229.09 0.84
Short/(excess) provision of tax in earlier years 115.53 0.09 (0.00) 0.00 45.82 0.03
Profit after tax 45,880.32 35.51 37,858.76 32.61 43,555.60 29.85
(1) Change in inventories formed a part of operating costs in the years ended March 31, 2017 and 2016.

81
Income
Our total revenue consists of revenue from operations and other income. Revenue from operations consists of revenue
from projects, revenue from hospitality, rental and other related revenues, property management revenues and other
operating revenue. Revenue from projects comprises primarily revenue from sales of our residential projects and other
projects developed for sale, recognised under the percentage of project completion method, reflecting progress in the
constructions of such projects and the number of units sold. Revenue from hospitality includes revenue from the sale of
rooms, food and beverages and allied services relating to hotel operations. Rental and other related revenues comprises
rental income from our leased projects. Property management revenues comprises revenues from our property
management services. Other operating revenue comprises primarily of transfer fees, cancellation charges, sale of scrap
and interest on delayed payments.
Other income comprises primarily income from investments (interest and dividend income).
The following table presents the components of our revenue from operations during the periods indicated:
(₹ in lakh) Year ended March 31,
2018 2017 2016
Revenue from projects 85,353.40 74,638.28 106,329.06
Revenue from hospitality 12,781.53 12,574.28 12,712.43
Rental and other related revenues 23,383.05 19,389.58 17,886.01
Property and management revenues 4,204.42 3,849.53 3,849.64
Other operating revenue 820.50 922.72 837.57
Revenue from operations 126,542.90 111,374.39 141,614.71
Expenses
Our total expenses consists of operating costs, excise duty, employee benefits expense, finance cost, depreciation and
amortisation and other expenses. Operating costs comprise primarily the cost of land, land development rights and TDRs,
cost of construction, materials and labour, professional charges such as architect and contractor fees, and rates and taxes
paid to regulatory authorities, recognised under the percentage of project completion method, reflecting progress in the
construction of such projects and the number of units sold, and food, beverage and hotel operating expenses. Employee
benefits expense comprises primarily payments to employees, including salaries and payments to the Provident Fund and
Gratuity Fund. Interest and finance charges comprise primarily expenses incurred with respect to any interest on loans and
bank charges paid for letters of credit and bank guarantees. Other expenses comprise primarily brokerage expenses,
advertising and marketing expenses, repairs and maintenance, security expenses, information technology expenses,
insurance charges, corporate social responsibility expenses, electricity charges, legal and professional charges, conveyance
and travelling expenses, hire charges, printing and stationery expenses, communication expenses and directors fees.
Employee benefits, other expenses and interest and finance charges
We incur expenses relating to employee benefits, other expenses (primarily administration, such as advertising and
marketing, utilities and other corporate overheads) and interest and finance (letters of credit, bank guarantees and other
indebtedness). These expenses are allocated to project work in progress, capital work in progress or debited to the profit
and loss statement. Our expense booking practice is to identify those expenses which are attributable to a particular project
and to debit such expenses to those projects as project work in progress or capital work in progress, as applicable. Expenses
which are not attributable to a particular project are considered to be common costs and charged to the profit and loss
statement of the financial year or period in which such costs were incurred as a period cost.
Year Ended March 31, 2018 Compared with Year Ended March 31, 2017
Income
Total revenue increased 11.28% from ₹ 116,104.19 lakhs in the year ended March 31, 2017 to ₹ 129,200.70 lakhs in the
year ended March 31, 2018 primarily due to an increase in revenue from projects and rental and other related revenues.
Revenue from operations. Revenue from operations increased 13.62% from ₹ 111,374.39 lakhs in the year ended March
31, 2017 to ₹ 126,542.90 lakhs in the year ended March 31, 2018, primarily due to an increase in rental and other related
revenues, revenue from projects, and property management revenues, partially offset by a decrease in other operating
revenue.
Revenue from projects. Revenue from projects increased 14.36% from ₹ 74,638.28 lakhs in the year ended March 31, 2017
to ₹ 85,353.40 lakhs in the year ended March 31, 2018, primarily due to revenue being recognized as construction
progressed and an increase in units sold (net of cancellations) from 72 units during the year ended March 31, 2017 to 82
units during the year ended March 31, 2018. A majority of the units sold during the year ended March 31, 2017 were in
our Ongoing residential project, Esquire. We also recognised a higher percentage of the revenues for the units sold in
Esquire and Prisma in the year ended March 31, 2018 compared to the year ended March 31, 2017, as a result of a higher
percentage of completion in the year ended March 31, 2018 for each of these projects.

82
Revenue from hospitality. Revenue from hospitality increased 1.65% from ₹ 12,574.28 lakhs in the year ended March 31,
2017 to ₹ 12,781.53 lakhs in the year ended March 31, 2018, in line with an increase in Occupancy Levels for The Westin
Mumbai – Garden City from 79.86% for the year ended March 31, 2017 to 80.78% for the year ended March 31, 2018.
Rental and other related revenues. Rental and other related revenues increased 20.60% from ₹ 19,389.58 lakhs in the year
ended March 31, 2017 to ₹ 23,383.05 lakhs in the year ended March 31, 2018, primarily due to an increase in the
Occupancy Level for Commerz II – Phase I from 20.33% for the year ended March 31, 2017 to 44.89% for the year ended
March 31, 2018, partially offset by a decline in the Occupancy Level for Commerz I from 88.47% in the year ended March
31, 2017 to 83.71% in the year ended March 31, 2018. The Occupancy Level for Oberoi Mall was 99.13% for the year
ended March 31, 2018 compared to 95.32% for the year ended March 31, 2017.
Property and management revenues. Property and management revenues increased 9.22% from ₹ 3,849.53 lakhs in the
year ended March 31, 2017 to ₹ 4,204.42 lakhs in the year ended March 31, 2018, primarily due to the increase in
Occupancy Level in Commerz II – Phase I.
Other operating revenue. Other operating revenue decreased 11.08% from ₹ 922.72 lakhs in the year ended March 31,
2017 to ₹ 820.50 lakhs in the year ended March 31, 2018, primarily due to a decrease in miscellaneous income.
Other Income. Other income decreased 43.81% from ₹ 4,729.80 lakhs in the year ended March 31, 2017 to ₹ 2,657.80
lakhs in the year ended March 31, 2018, primarily due to lower interest income on fixed deposits and lower treasury
income resulting from lower cash balances available for investment during the year.
Expenses
Total expenses increased 7.91% from ₹ 59,874.50 lakhs in the year ended March 31, 2017 to ₹ 64,610.11 lakhs in the year
ended March 31, 2018, primarily due to increases in operating costs, finance cost and other expenses.
Operating costs. Operating costs (including the impact of changes in inventories) increased 7.05% from ₹ 43,707.13 lakhs
in the year ended March 31, 2017 to ₹ 46,786.99 lakhs in the year ended March 31, 2018, primarily due to an increase in
construction activity, as reflected in our higher materials, labour and contract cost, partially offset by a decrease in expenses
for land, development rights and TDRs.
Excise duty. Excise duty decreased 74.43% from ₹ 12.36 lakhs in the year ended March 31, 2017 to ₹ 3.16 lakhs in the
year ended March 31, 2018, primarily due to the implementation of GST commencing July 2017.
Employee benefits expense. Employee benefits expense increased 4.66% from ₹ 6,416.17 lakhs in the year ended March
31, 2017 to ₹ 6,715.32 lakhs in the year ended March 31, 2018, primarily due to an increase in number of employees and
annual increments.
Finance cost. Finance cost (net of allocation) increased 23.17% from ₹ 557.22 lakhs in the year ended March 31, 2017 to
₹ 686.31 lakhs in the year ended March 31, 2018, primarily due to an increase in borrowings.
Depreciation and amortisation. Depreciation and amortisation decreased marginally by 0.86% from ₹ 4,949.54 lakhs in
the year ended March 31, 2017 to ₹ 4,906.76 lakhs in the year ended March 31, 2018.
Other expenses. Other expenses increased 30.23% from ₹ 4,232.08 lakhs in the year ended March 31, 2017 to ₹ 5,511.57
lakhs in the year ended March 31, 2018, primarily due to an increase in advertising and marketing expenses. Brokerage
expenses also increased in the year ended March 31, 2018 compared to the year ended March 31, 2017 as a result of an
increase in leasing of office space. In addition, we incurred higher corporate social responsibility expenses during the year
ended March 31, 2018.
Tax expense
Current tax increased 17.66% from ₹ 18,677.95 lakhs in the year ended March 31, 2017 to ₹ 21,976.10 lakhs in the year
ended March 31, 2018, primarily due to the increase in profit before tax. Our statutory income tax rate for each of the
years ended March 31, 2018 and 2017 was 34.61%. We recognized a deferred tax credit of ₹ 3,019.39 lakhs in the year
ended March 31, 2018, compared to a charge of ₹ 6.91 lakhs in the year ended March 31, 2017.
Profit After Tax
As a result of the above, profit after tax increased 21.19% from ₹ 37,858.76 lakhs in the year ended March 31, 2017 to ₹
45,880.32 lakhs in the year ended March 31, 2018.

83
Year Ended March 31, 2017 Compared with Year Ended March 31, 2016
Income
Total revenue decreased 20.42% from ₹ 145,891.41 lakhs in the year ended March 31, 2016 to ₹ 116,104.19 lakhs in the
year ended March 31, 2017 primarily due to a decrease in revenue from operations.
Revenue from operations. Revenue from operations decreased 21.35% from ₹ 141,614.71 lakhs in the year ended March
31, 2016 to ₹ 111,374.39 lakhs in the year ended March 31, 2017, primarily due to a decrease in revenue from projects,
partially offset by an increase in rental and other related revenues.
Revenue from projects. Revenue from projects decreased 29.80% from ₹ 106,329.06 lakhs in the year ended March 31,
2016 to ₹ 74,638.28 lakhs in the year ended March 31, 2017, primarily due to higher revenue from projects during the
year ended March 31, 2016, compared to the following year, as we commenced revenue recognition for Esquire in the
third quarter of the year ended March 31, 2016.
Revenue from hospitality. Revenue from hospitality decreased 1.09% from ₹ 12,712.43 lakhs in the year ended March 31,
2016 to ₹ 12,574.28 lakhs in the year ended March 31, 2017, primarily due to lower banquet income.
Rental and other related revenues. Rental and other related revenues increased 8.41% from ₹ 17,886.01 lakhs in the year
ended March 31, 2016 to ₹ 19,389.58 lakhs in the year ended March 31, 2017, primarily due to an increase in the
Occupancy Level for Commerz II – Phase I from 13.02% for the year ended March 31, 2016 to 20.33% for the year ended
March 31, 2017. The Occupancy Level for Commerz I was 88.47% in both March 31, 2017 and 2016. The Occupancy
Level for Oberoi Mall was 95.32% for the year ended March 31, 2017 compared to 99.37% for the year ended March 31,
2016.
Property and management revenues. Property and management revenues were ₹ 3,849.53 lakhs in the year ended March
31, 2017 and ₹ 3,849.64 lakhs in the year ended March 31, 2016.
Other operating revenue. Other operating revenue increased 10.17% from ₹ 837.57 lakhs in the year ended March 31,
2016 to ₹ 922.72 lakhs in the year ended March 31, 2017, primarily due to an increase in miscellaneous income.
Other Income. Other income increased 10.59% from ₹ 4,276.70 lakhs in the year ended March 31, 2016 to ₹ 4,729.80
lakhs in the year ended March 31, 2017, primarily due to an increase in interest income.
Expenses
Total expenses decreased 24.75% from ₹ 79,567.13 lakhs in the year ended March 31, 2016 to ₹ 59,874.50 lakhs in the
year ended March 31, 2017, primarily due to revenue recognition.
Operating costs. Operating costs decreased 30.57% from ₹ 62,953.69 lakhs in the year ended March 31, 2016 to ₹
43,707.13 lakhs in the year ended March 31, 2017, primarily due to a decrease in revenue recognition.
Excise duty. Excise duty decreased 9.85% from ₹ 13.71 lakhs in the year ended March 31, 2016 to ₹ 12.36 lakhs in the
year ended March 31, 2017, primarily due to the decrease in hotel operating cost.
Employee benefits expense. Employee benefits expense increased 12.45% from ₹ 5,705.84 lakhs in the year ended March
31, 2016 to ₹ 6,416.17 lakhs in the year ended March 31, 2017 due to an increase in number of employees and annual
increments.
Finance cost. Finance cost (net of allocation) decreased 18.45% from ₹ 683.26 lakhs in the year ended March 31, 2016 to
₹ 557.22 lakhs in the year ended March 31, 2017, primarily due to a decrease in bank and finance charges.
Depreciation and amortisation. Depreciation and amortisation increased 1.02% from ₹ 4,899.50 lakhs in the year ended
March 31, 2016 to ₹ 4,949.54 lakhs in the year ended March 31, 2017.
Other expenses. Other expenses decreased 20.32% from ₹ 5,311.13 lakhs in the year ended March 31, 2016 to ₹ 4,232.08
lakhs in the year ended March 31, 2017, primarily due to a decrease in advertising and marketing expenses.
Tax expense
Current tax decreased 13.74% from ₹ 21,653.27 lakhs in the year ended March 31, 2016 to ₹ 18,677.95 lakhs in the year
ended March 31, 2017 primarily due to a decrease in profit before tax. Our statutory income tax rate for each of the years
ended March 31, 2017 and 2016 was 34.61%. We recognized a deferred tax charge of ₹ 6.91 lakhs in the year ended March
31, 2017, compared to a charge of ₹ 1,229.09 lakhs in the year ended March 31, 2016.

84
Profit After Tax
As a result of the above, profit after tax decreased 13.08% from ₹ 43,555.60 lakhs in the year ended March 31, 2016 to ₹
37,858.76 lakhs in the year ended March 31, 2017.
Liquidity and Capital Resources
Historically, our principal sources of liquidity have been funds available under our working capital facilities, term loans,
cash flow from operating activities and cash flow from financing activities. As of March 31, 2018, we had ₹ 8,106.02
lakhs of cash and cash equivalents and ₹ 3,977.28 lakhs in fixed deposits with banks having remaining maturity for less
than twelve months and fixed deposits with banks (lien marked) and balances with banks in dividend/unclaimed dividend
accounts.
Cash Flows
The following table sets forth our consolidated cash flows for the years ended March 31, 2018, 2017 and 2016:
(₹ in lakh)
For the year ended March 31,
2018 2017 2016
Net Cash Inflow / (Outflow) from operating activities (20,582.80) 17,354.31 45,309.08 Net Cash Inflow / (Outflow) from investing activities (58,825.01) (43,892.84) (12,081.93) Net Cash Inflow / (Outflow) from financing activities 65,099.99 33,556.29 (20,422.94) Net increase/(decrease) in Cash and Cash Equivalents (14,307.82) 7,017.76 12,804.21
Cash Flows from Operating Activities
Net cash outflow from operating activities for the year ended March 31, 2018 was ₹ 20,582.80 lakhs. Adjustments to
reconcile operating cash profit before working capital changes of ₹ 68,210.56 lakhs to net cash outflow from operating
activities was primarily for loans and advances of ₹ 75,234.40 lakhs and inventories of ₹ 37,727.85 lakhs, partially offset
by other liabilities of ₹ 36,703.77 lakhs and trade payables of ₹ 9,470.08 lakhs. Loans and advances increased primarily
due to a deposit paid in connection with land acquisitions. Inventories increased primarily due to construction cost incurred
for our Mulund and Sky City projects. Other liabilities increased primarily due to billing in excess of revenue recognized
for Mulund and Sky City projects. Trade payables increased primarily due to increase in sundry creditors for our projects
Sky City and Mulund.
Net cash inflow from operating activities for the year ended March 31, 2017 was ₹ 17,354.31 lakhs. Adjustments to
reconcile operating cash profit before working capital changes of ₹ 64,055.91 lakhs to net cash inflow from operating
activities was primarily for inventories of ₹ 42,787.57 lakhs, partially offset by other liabilities of ₹ 17,331.15 lakhs.
Inventories increased primarily due to an increase in cost incurred for land-related premiums and construction cost incurred
for our Mulund and Sky City projects. Other liabilities increased primarily due to billing in excess of revenue recognized
for our Mulund and Sky City projects.
Net cash inflow from operating activities for the year ended March 31, 2016 was ₹ 45,309.08 lakhs. Adjustments to
reconcile operating cash profit before working capital changes of ₹ 73,055.03 lakhs to net cash inflow from operating
activities was primarily for inventories of ₹ 34,173.32 lakhs, partially offset by other liabilities of ₹ 29,107.75 lakhs.
Inventories increased primarily due to an increase in cost incurred for land related premium for Sky City project and
construction cost incurred for our Prisma and Esquire projects. Other liabilities increased primarily due to billing in excess
of revenue recognized for our Mulund and Sky City projects.
Cash Flows from Investing Activities
Net cash outflow from investing activities for the year ended March 31, 2018 was ₹ 58,825.01 lakhs, consisting of
investments in our joint ventures of ₹ 72,556.16 lakhs, primarily for investments in Oasis Realty, and a decrease in other
assets of ₹ 21,858.95 lakhs (primarily due to a decrease in fixed deposits with banks).
Net cash outflow from investing activities for the year ended March 31, 2017 was ₹ 43,892.84 lakhs, primarily consisting
of investments in our joint venture of ₹ 30,137.55 lakhs, primarily for investments in Oasis Realty, and loans and advances
to our joint ventures of ₹ 5,633.21 lakhs.
Net cash outflow from investing activities for the year ended March 31, 2016 was ₹ 12,081.93 lakhs, consisting of
investments in our joint venture of ₹ 16,613.31 lakhs, primarily for investments in Oasis Realty, partially offset by a
decrease in other assets of ₹ 2,856.16 lakhs (primarily due to a decrease in fixed deposits with banks).

85
Cash Flows from Financing Activities
Net cash inflow from financing activities for the year ended March 31, 2018 was ₹ 65,099.99 lakhs, primarily consisting
of proceeds from long term borrowings of ₹ 68,500.00 lakhs and short term borrowings of ₹ 14,561.00 lakhs, offset by
interest paid (gross) of ₹ 9,959.97 lakhs and dividends paid of ₹ 8,174.75 lakhs.
Net cash inflow from financing activities for the year ended March 31, 2017 was ₹ 33,556.29 lakhs, primarily consisting
of proceeds from the issuance of debentures by our wholly-owned subsidiary, Incline Realty Private Limited, in an
aggregate principal amount of ₹ 75,000.00 lakhs, partially offset by our redemption of ₹ 35,000.00 lakhs aggregate
principal amount of debentures previously issued by our wholly-owned Subsidiary, Incline Realty Private Limited and
interest paid of ₹ 5,245.82 lakhs.
Net cash outflow from financing activities for the year ended March 31, 2016 was ₹ 20,422.94 lakhs, primarily consisting
of the prepayment of ₹ 25,000.00 lakhs aggregate principal amount of debentures issued by our wholly-owned subsidiary,
Incline Realty Private Limited in 2016, dividends paid of ₹ 16,069.69 lakhs and interest paid of ₹ 6,834.06 lakhs.
Sufficiency of Capital Resources
We believe that available funds from existing cash and cash equivalents, together with expected cash flows generated by
operations and financing activities, including this offering, will be sufficient to fund our working capital and capital
expenditure requirements for the next 12 months.
Capital Expenditures
Except as described below, we did not have, for the years ended March 31, 2018, 2017 and 2016, any material expenditure
on, or divestment of, capital investments (including any interests in another corporation) nor any material commitments
for capital expenditures. We do not have any material capital investment which is being made or divested.
Our capital expenditures (represented by additions to property, plant and equipment, investment properties, intangible
assets, capital work in progress and intangible assets under development, less capital work in progress capitalised during
the year and intangible assets under development capitalised during the year) were ₹ 8,442.65 lakhs, ₹ 7,901.56 lakhs and
₹ 4,349.37 lakhs, in each of the years ended March 31, 2018, 2017 and 2016, respectively. These were used primarily for
Oberoi International School, JVLR Campus.
During the current financial year, we intend to incur capital expenditures for Planned Retail and Office projects. We intend
to finance these capital expenditures primarily from cash flows from operations and financing activities. Our actual capital
expenditures may differ due to various factors, including our future cash flows, results of operations and financial
condition, our ability to obtain financing in the future to fund capital expenditures, acquisitions and other general corporate
activities, our ability to implement any of our strategies and general domestic and international political conditions,
changes in governmental rules and regulations or actions taken by regulatory authorities.
Indebtedness
As of March 31, 2018, we had total outstanding indebtedness (consisting of long term borrowings (non-current), short
term borrowings (current) and current maturities of long term borrowings (non-current)) of ₹ 169,406.23 lakhs, including
non-convertible debentures, borrowings under working capital facilities and term loans from banks. Our borrowings are
typically secured by a mortgage over the land and/or charge on the assets, hypothecation of receivables and by a corporate
guarantee.
In June 2016, our wholly-owned subsidiary, Incline Realty Private Limited, issued and sold in a private placement ₹
75,000.00 lakhs aggregate principal amount of 9.25% listed, rated, redeemable secured non-convertible debentures. The
debentures were issued in three series, redeemable on April 23, 2019, 2020 and 2021, respectively. The debentures are
secured by (i) a mortgage on certain unsold residential units in a project being developed by Incline Realty Private Limited;
(ii) a charge on receivables and an escrow account into which receivables are deposited from the sale of units in a project
being developed by Incline Realty Private Limited; and (iii) an irrevocable and unconditional corporate guarantee by our
Company.
In August 2017, we entered into a secured working capital facility agreement with Axis Bank Limited for a line of credit
of up to ₹ 30,000 lakhs. The line of credit is secured by a mortgage on certain commercial units in one of our projects.
Interest is payable monthly on the facility, at an annual rate equal to the lender’s marginal cost of funds based lending rate
(MCLR) plus an applicable spread. As of March 31, 2018, the applicable interest rate was 8.90% and we had borrowed ₹
14,636.66 lakhs under this facility.
In November 2017, we entered into a secured master facility agreement with Housing Development Finance Corporation
Limited for a term loan of up to ₹ 75,000 lakhs. The term loan is secured by a mortgage on certain residential units in two
of our projects. Interest is payable monthly on the term loan, at an annual rate equal to the lender’s corporate prime lending
rate (CPLR) plus an applicable spread. As of March 31, 2018, the applicable interest rate was 9.15% and we had borrowed

86
₹ 67,864.18 lakhs under this facility. The term loan is repayable 60 months from the date of the first drawdown and we
have an option to prepay the loan in full or part.
Interest Coverage Ratios
Our interest coverage ratio, which we define as earnings before interest and tax divided by finance cost, was 5.98x, 7.92x
and 10.83x for the years ended March 31, 2018, 2017 and 2016, respectively on a consolidated basis.
Contractual Obligations
Our future aggregate cash payment obligations under our contractual obligations on a consolidated basis as of March 31,
2018 are listed below.
(₹ in lakh)
Payments due by period(1)
Total Less than 1
year
1-3 years 3-5 years More than 5
years
Operating Lease Obligations - - - - -
Purchase Obligations
Capital Commitment to JV 13,703.00 - - - -
Capital work in progress 2,014.88 2,014.88 - - -
Total 15,717.88 2,014.88 - - - (1) For the Company and the Subsidiaries only
Off-Balance Sheet Arrangements
Except for the contingent liabilities set forth below, we have not entered into any financial guarantees or other
commitments to guarantee the payment obligations of any third parties. We have not entered into any transactions with
unconsolidated entities, derivative contracts that are indexed to our shares and classified as shareholders’ equity, that are
not reflected in our consolidated financial statements.
Contingent Liabilities
As of March 31, 2018 we had contingent liabilities that are not provided for (as per Ind AS 37 “Provisions, Contingent
Liabilities and Contingent Assets”), capital commitments and other commitments as follows:
(₹ in lakh)
As of March 31, 2018
Summary details of Contingent Liabilities (to the extent not provided for)
Corporate guarantee given 6,600.00
MVAT matters in dispute 242.42
Income-tax matters in dispute 920.81
Service tax matters in dispute 928.47
Capital Commitments
Capital contracts (net of advances) 2,014.88
Capital commitment to joint venture(1) 13,703.00
Total 24,409.58 Corporate guarantee consists of an irrevocable and unconditional corporate guarantee by our Company with respect to our Three Sixty West project.
(1) The principal components of our contingent liabilities as of March 31, 2018 were capital commitments to joint ventures, primarily comprising payment for the
acquisition from Tulip Hospitality Services Limited of the property formerly known as “Centaur Hotel”, which we refer to as “Juhu Hotel”.
Quantitative and Qualitative Disclosure of Market Risk
We are exposed to various types of market risks during the normal course of business. We are exposed to credit risk,
liquidity risk and market risk (comprising currency risk, interest rate risk and commodity price risk) in the normal course
of our business.
Our risk management policies are established to identify and analyse the risks we face, to set appropriate risk limits and
controls and to monitor risks and adherence to limits. Risk management policies and systems are reviewed regularly to
reflect changes in market conditions and our activities. We are exposed to various types of market risks in the normal
course of business. The following discussion and analysis, which constitute “forward-looking” statements that involve
risk and uncertainties, summarise our exposure to different market risks.
Credit Risk
Credit risk is the risk of financial loss to us if a customer or counterparty to a financial instrument fails to abide by the
terms and conditions of its financial contract with us, principally the failure to make required payments on amounts due
to us. We are exposed to credit risk from our operating activities (primarily trade and other receivables) and from our
financing activities, including investments in debt securities and balances with banks and financial institutions.

87
Trade and other receivables
We face credit risk from buyers of our residential projects or from the tenants who pay rent. Our exposure to credit risk is
influenced mainly by the individual characteristics of each customer. The credit risk we face is mitigated by the terms of
our standard agreement with buyers, whereby we do not hand over physical possession of the project until we have received
the amounts due. In the case of our lease arrangements, we generally obtain a security deposit of between three and 12
months’ rent from our tenants which can be used to set-off any amounts owed to us by our tenants at the termination or
expiration of the lease.
Investments in debt securities
In terms of our investments in debt securities, no impairment has been recognized on such investments, as we have only
invested in redeemable optionally convertible debentures and the settlement of such instruments is linked to the completion
of the respective underlying projects.
Cash and cash equivalents
Credit risks from balances with banks and financial institutions are managed by our treasury in accordance with our policy.
We limit our exposure to credit risk by only investing surplus funds with approved counterparties and within credit limits
assigned to each counterparty. These limits minimise the concentration of risks and therefore mitigates financial loss in
the event a counterparty fails to make payments.
Liquidity Risk
Liquidity risk is the risk that we will encounter difficulty in meeting the obligations associated with our financial liabilities
that are settled by delivering cash or another financial asset. We aim to ensure that we will have sufficient liquidity to meet
our liabilities when they come due, under both normal and stressed conditions, so as to avoid incurring unacceptable losses
or risking damage to our reputation. We manage our liquidity through the use of surplus funds, bank overdrafts, bank
loans, debentures and inter-corporate loans.
We have assessed our concentration of risks with respect to refinancing our debt and found it to be low. We also have
access to a sufficiently diverse pool of funding.
Market Risk
Market risk is the risk that changes in market prices – such as foreign exchange rates, interest rates and equity prices –
will affect our income or the value of our holdings of financial instruments. We are exposed to market risk primarily
related to foreign exchange rate risk, interest rate risk and the market value of certain commodities. Our exposure to market
risk is a function of investing and borrowing activities and revenue generating and operating activities.
Foreign Currency Risk. Foreign currency risk is the risk that the fair value or future cash flows of an exposure will fluctuate
because of changes in foreign exchange rates. We are exposed to the risk of changes in foreign exchange rates primarily
due to our operating activities, when expenses are denominated in a foreign currency. In our residential and hospitality
segments, we also receive certain revenues denominated in foreign currency, depending on the customer. However, we
mitigate foreign currency risk in such cases by converting the foreign currency to Indian Rupees immediately; the customer
remains responsible for paying us the full amount in Indian Rupees and for any shortfall as a result of the currency
conversion. We closely track and observe the movement of foreign currency with regards to Indian Rupees and also
forward cover rate. We determine whether to cover or keep the foreign currency exposure based on the above.
Interest Rate Risk. Interest rate risk can be either fair value interest rate risk or cash flow interest rate risk. Fair value
interest rate risk is the risk of changes in the fair value of fixed interest bearing investments because of interest rate
fluctuations. Cash flow interest rate risk is the risk that the future cash flows of floating interest bearing investments will
fluctuate because of fluctuations in the interest rates. Our interest rate risk arises from borrowings. Borrowings issued at
fixed rates expose us to fair value interest rate risks. As of March 31, 2018, we had ₹ 77,997.39 lakhs of fixed-rate
borrowings and ₹ 82,500.84 lakhs of floating-rate borrowings.
Commodity Price Risk. As a project developer, we are exposed to the risk that prices for certain construction materials
used to build our projects (including cement and steel) will increase. These materials are global commodities whose prices
are cyclical in nature and fluctuate in accordance with global market conditions. We are exposed to the risk that we may
not be able to pass increased commodities costs to our customers, which would lower our margins. Our overall risk
management program focuses on the volatile nature of the steel and cement market, thereby seeking to minimise potential
adverse effects of such volatility on our financial performance.
New Accounting Standards and Interpretations Not Yet Adopted by our Company
Ind AS 115 “Revenue from contracts with customers” was issued on March 29, 2018 and establishes a five-step model to
account for revenue arising from contracts with customers. Under Ind AS 115, revenue is recognised at an amount that
reflects the consideration to which an entity expects to be entitled in exchange for transferring goods or services to a
88
customer. The new revenue standard will supersede all current revenue recognition requirements under Ind AS and the
guidance note of real estate issued by ICAI. Ind AS 115 is applicable to us for annual periods beginning on or after April
1, 2018. We believe that our contracts with customers satisfy the conditions of Ind AS 115 for recognition of revenue
over time and, therefore, we expect to continue recognising revenue under the percentage of completion method that was
prescribed under the erstwhile Guidance Note. See also “Risk Factors - It is difficult to predict our future performance, or
compare our historical performance between periods, as our revenue fluctuates significantly from period to period. In
particular, the revenue recognition policy applicable to us may change going forward” on page 40.
Additional Information
Known trends or uncertainties
Other than as described in the sections entitled “Risk Factors,” “Management’s Discussion and Analysis of Financial
Condition and Results of Operations” and elsewhere in this Placement Document, to our knowledge there are no known
trends or uncertainties that have or had or are expected to have a material adverse impact on our income or income from
continuing operations.
Future relationship between costs and income
Other than as described in the sections entitled “Risk Factors” and “Management’s Discussion and Analysis of Financial
Condition and Results of Operations” and elsewhere in this Placement Document, to our knowledge there are no known
factors which will have a material adverse impact on our operation and finances.
Competitive conditions
For details, please see the section entitled “Our Business – Our Competitors” on page 125.
Seasonality of business
While bookings for our residential units are spread through the year, we typically experience an increased number of
bookings for our residential units during certain festive periods every year. In addition, our operations may be adversely
affected by difficult working conditions during the monsoon season from June to September that may restrict our ability
to commence construction activities and fully utilise our resources. We also expect that our hospitality business will be
positively affected by typical periods of high occupancy during October to February. Our business is also cyclical and
fluctuates in line with the general economic and real estate industry cycles.
Auditor Observations and Matters of Emphasis
There are no qualifications or matters of emphasis highlighted by the auditors in their reports to our consolidated financial
statements for the last five fiscal years ended March 31, 2018.
Significant Developments after March 31, 2018
Except as stated elsewhere in this Placement Document, to our knowledge no circumstances have arisen since the date of
the last financial statements as disclosed in this Placement Document which materially and adversely affects or is likely
to affect, our operations or profitability, or the value of our assets or our ability to pay our material liabilities within the
next twelve months.

89
INDUSTRY OVERVIEW
The information in this section is derived from various government publications and industry data sources, including
reports prepared by CBRE, Horwath and PropEquity. We commissioned the PropEquity report, “Overview of Mumbai
Metropolitan Region”. Neither we nor any other person connected with the Issue has verified this information. Industry
sources and publications generally state that the information contained therein has been obtained from sources generally
believed to be reliable, but that their accuracy, completeness and underlying assumptions are not guaranteed and their
reliability cannot be assured. Industry publications are also prepared based on information as of specific dates and may
no longer be current or reflect current trends. Accordingly, investment decisions should not be based on such information.
For further details, please see the section entitled “Industry and Market Data” on page 13.
The section below also contains certain information from certain reports and materials prepared by CBRE, which is
subject to the following disclaimer: “This report is based on public information considered to be reliable and other market
assumptions and CBRE does not warrant the accuracy or completeness of the information contained herein. Users are
advised to read the entire report and conduct their own research / due diligence before relying on the contents of this
report. Any person’s reliance on the Report is on an as is where is basis with no specific representations and warranties
by CBRE. CBRE owes no person or entity any contractual or tort liability with respect to their reliance on this report.”
Such reports and materials are available at https://www.cbre.co.in/en/research-reports/India-Office-MarketView-Q1-
2018; https://www.cbre.co.in/en/research-reports/India-Retail-Market-View-H2-2017; https://www.cbre.com/report-
download?PUBID=3b120338-ee2a-4495-8363-cf5d4ff1104b; and https://www.oberoirealty.com/real-estate-
investment/investors#!investor_kit.
The Indian Real Estate Market
The real estate sector in India involves the development of residential housing, commercial buildings, malls, hotels,
industrial facilities and warehouses, restaurants, cinemas, high street retail outlets and the purchase and sale of land
development rights.
The real estate industry is closely associated with the macroeconomic condition of a country or region. The following
factors have a significant impact on demand and supply within the industry:
● Economic growth. The year 2017 was one full of short-term disruptions in the Indian economy, largely due to
the implementation of several policy reforms. India’s economic growth dipped marginally during the year to
reach approximately 6.75% in 2017-18, as several sectors such as manufacturing, construction and infrastructure
felt the downward impact of these structural policy changes. However, this impact has been waning and India is
emerging as the world’s fastest growing economy, with real GDP growth expected to reach 7.4% in 2018 and
7.8% in 2019 (Source: 2018 Asia Pacific – Real Estate Market Outlook India, CBRE, 2018).
● Government reforms. While the past two years have witnessed numerous steps to ease the investment
environment, further streamlining of the regulatory environment is expected to attract and sustain interest in the
sector. A key structural policy reform was RERA, which came into effect on May 1, 2017. RERA has been a
positive step towards resolving issues related to accountability, transparency and investor confidence. It is also
expected to revive end-user sentiment, resulting in a more resilient and end-user driven demand in the residential
sector. GST, another key policy reform, was implemented in July 2017. GST is expected to reduce the cost of
complying with multiple tax systems and improve the formality of the largely informal real estate sector. The
warehousing segment is expected to be the biggest beneficiary as GST removes federal barriers and improves
supply chain efficiency (Source: 2018 Asia Pacific – Real Estate Market Outlook India, CBRE, 2018).
● Growing trend of urbanization. According to Census 2011, about 377 million Indians or 31.14% of the country’s
population lived in urban areas. Key factors such as unemployment and lower income levels, among others, are
increasingly influencing people to gravitate towards cities and towns, leading to increased housing requirements
in urban areas (Source: Report on Trend and Progress of Housing in India, National Housing Bank, 2016). Given
this trend, the urban population is expected to grow to 600 million (40% of India’s total population) by 2031 and
850 million (50% of India’s total population) by 2051 (Source: Handbook of Urban Statistics, Ministry of Urban
Development, 2016).
● Growing middle class. According to the World Economic Forum, the middle class population in India has
doubled from 300 million to 600 million between 2004 and 2012, and is likely to overtake that of the U.S. and
China by 2027 (Source: 6 Surprising Facts About India’s Exploding Middle Class, World Economic Forum,
2016). The growing middle class is expected to significantly drive domestic consumption.
● Increasing Mortgages Penetration. Outstanding housing loans grew from less than ₹ 3 trillion in financial year
1997 to more than ₹ 12 trillion in financial year 2016. As of financial year 2016, the housing finance market in
the country is expected to grow at an annual rate of over 15% in the next five years (Source: Report on Trend
and Progress of Housing in India, National Housing Bank, 2016).

90
Residential Real Estate Sector in India
The residential real estate sector consists of the development of apartments, houses and plotted developments in urban and
rural areas.
India’s structural policy reforms, such as demonetization and RERA, have had a significant impact on the residential
sector, driving down residential inventory. According to CBRE, post-RERA, housing sales and new project launches
across all major Indian cities declined by about 14% and 35%, respectively. Although sales improved marginally in cities
such as Bangalore, Hyderabad, Chennai, Mumbai, Pune and Kolkata in the second half of 2017, sentiments have remained
subdued in Delhi-NCR, with developers adopting a wait-and-watch approach while launching new projects. However,
cities such as Mumbai and Pune, which have dedicated regulatory authorities, reported the launch of several old and new
projects post-RERA (Source: 2018 Asia Pacific – Real Estate Market Outlook India, CBRE, 2018).
As developers grow accustomed to RERA, the residential segment is expected to show some signs of recovery in 2018.
CBRE predicts a market shift towards credible and sustainable developers and towards end-user-centric markets. The
residential supply in India is expected to improve by the first half of 2018 as RERA-compliant builders gain more
confidence. Post RERA implemented, developers have become confident enough to start launching not only new projects
but also relaunching old projects after registering them with RERA. Also, consolidation activity among developers and
landowners is expected to intensify, with larger players working with smaller and more financially stressed developers.
Several cities, especially Mumbai, Bangalore, Hyderabad, Chennai and Pune, are expected to report upticks in project
launches in the first half of 2018 (Source: 2018 Asia Pacific – Real Estate Market Outlook India, CBRE, 2018).
Similarly, on the demand side, the implementation of RERA reduced demand in the residential segment, with buyers
opting for restraint in their purchasing decisions. However, these fence-sitting buyers are expected to enter the market as
they grow accustomed to the reform. As a result, the residential real estate market in India will shift towards being a buyer-
focused market, which will amplify future sales. As consumers re-enter the residential market, they will also likely
continue to benefit from attractive discounts and payment plans (Source: 2018 Asia Pacific – Real Estate Market Outlook
India, CBRE, 2018).
Overall, investors’ confidence is likely to improve as RERA reduces perceptions of risk associated with the real estate
market in India, resulting in an inflow of institutional capital rationalising the cost of capital (Source: 2018 Asia Pacific –
Real Estate Market Outlook India, CBRE, 2018).
MMR Residential Real Estate Market
Mumbai is the largest Indian city in terms of population and number of houses, housing approximately 2% of India’s
population (Source: Population Census, 2011). Mumbai is often called the “financial capital of India”, being a hub of
major national as well as international banks and financial institutions. The City is one of the most sought out destinations
for upcoming companies in the banking and financial services sectors. Mumbai also boasts the presence of many of the
major players in the IT/ITES domain. MMR has a wide demographic profile and market breadth across price points. About
86% of the total population is from the working age group, out of which 33% are aged 18 to 35 years old (Source: Overview
of Mumbai Metropolitan Region, PropEquity, May 31, 2018).
MMR is the metropolitan area consisting of the metropolis of Mumbai and its hinterland. MMR extends over an area of
4,355 square kilometres and with a population of 20,748,395, it is among
the top ten most populated urban agglomerations in the world. The real
estate market in MMR is often divided into the following sub-regions
(Source: Overview of Mumbai Metropolitan Region, PropEquity, May 31,
2018):
● Mumbai City (South Mumbai) – Considered one of the most
prestigious and costly place to live in India.
● Suburbs (Western and Central Mumbai) – These are the regions
with the highest price variations seen in the extreme micro-
markets. Peripheral markets like Vasai-Virar, beyond the Vasai
creek, are among the fastest growing in the MMR.
● Thane region and beyond – Upcoming residential hub owing to
a major boost in infrastructure and the opening of several IT
companies.
● Navi-Mumbai – One of the largest planned cities in the world,
this region is recognised as a destination for the middle class
population.
Source: Overview of Mumbai Metropolitan Region,
PropEquity, May 31, 2018.
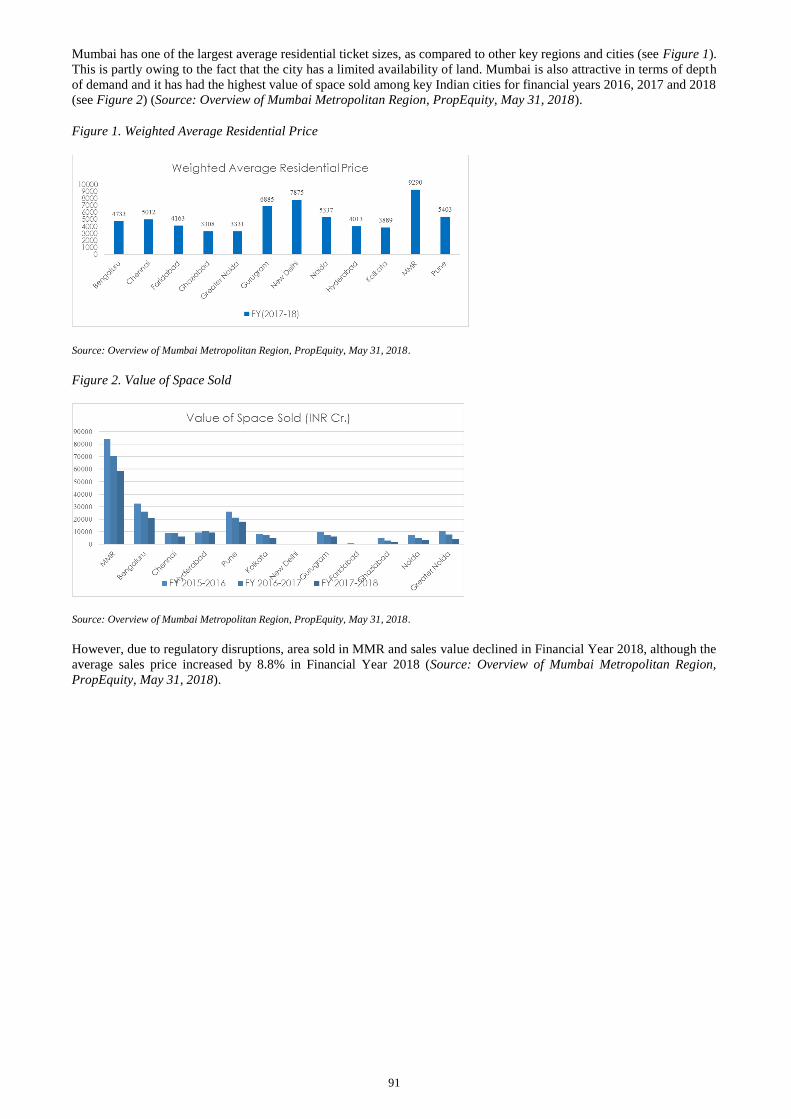
91
Mumbai has one of the largest average residential ticket sizes, as compared to other key regions and cities (see Figure 1).
This is partly owing to the fact that the city has a limited availability of land. Mumbai is also attractive in terms of depth
of demand and it has had the highest value of space sold among key Indian cities for financial years 2016, 2017 and 2018
(see Figure 2) (Source: Overview of Mumbai Metropolitan Region, PropEquity, May 31, 2018).
Figure 1. Weighted Average Residential Price
Source: Overview of Mumbai Metropolitan Region, PropEquity, May 31, 2018.
Figure 2. Value of Space Sold
Source: Overview of Mumbai Metropolitan Region, PropEquity, May 31, 2018.
However, due to regulatory disruptions, area sold in MMR and sales value declined in Financial Year 2018, although the
average sales price increased by 8.8% in Financial Year 2018 (Source: Overview of Mumbai Metropolitan Region,
PropEquity, May 31, 2018).

92
Source: Overview of Mumbai Metropolitan Region, PropEquity, May 31, 2018.
MMR also has many proposed and developing infrastructure projects, including the Metro Rail Transit System, the
Mumbai Monorail System, the Road Linkage projects, the Extension of Suburban Railways, the Western Freeway, the
Proposed Coastal Ring Road – MSRDC Project, and the Mumbai Trans Harbour Link. These developments would enhance
the attractiveness of real estate in Mumbai. Below is the snapshot of the proposed developments (Source: Overview of
Mumbai Metropolitan Region, PropEquity, May 31, 2018).
Source: Overview of Mumbai Metropolitan Region, PropEquity, May 31, 2018.
Commercial Real Estate Market in India
Despite a crunch in the availability of ready-to-move-in space in 2017, office leasing remained resilient, dipping only
marginally by 3.5% over 2017 (Source: 2018 Asia Pacific – Real Estate Market Outlook India, CBRE, 2018).
Although technology disruptions are likely to marginally reduce office leasing in 2018, augmented demand from other
industry sectors, such as banking, financial services, engineering and manufacturing, and research and consulting, are
expected to offset that marginal decline. Leasing by sectors like pharmaceuticals, healthcare, telecommunications and
Figure 3. Sales Value
Figure 4. Area Sold (Mn Sqft.)
Figure 5. Weighted Average Sales Price (INR)

93
aviation is also expected to pick up, and co-working/business centre operators are expected to expand (Source: 2018 Asia
Pacific – Real Estate Market Outlook India, CBRE, 2018).
Pre-commitment is likely to remain popular amongst occupiers as it allows higher rental arbitrage, efficient portfolio
evaluation and greater availability of quality offerings. The pre-lease period is expected to rise for buildings scheduled for
completion within the next four years, considering occupiers’ partialness towards operating from quality assets. In
contrast, occupiers in completed properties would increasingly prefer a shorter lease period to gain flexibility (Source:
2018 Asia Pacific – Real Estate Market Outlook India, CBRE, 2018).
While low-quality supply is expected to face competition and leasing hurdles in 2018, occupier interest in quality assets
is expected to drive demand. This will help narrow the supply-demand gap, as seen in the graph below (Source: 2018 Asia
Pacific – Real Estate Market Outlook India, CBRE, 2018).
Figure 6. Supply and Demand of Commercial Real Estate
Source: 2018 Asia Pacific – Real Estate Market Outlook India, CBRE, 2018.
The other key factors expected to drive growth in the commercial real estate market are as follows (Source: 2018 Asia
Pacific – Real Estate Market Outlook India, CBRE, 2018).
● Infrastructure development and improved connectivity. As growing traffic congestion makes job location an
increasingly important factor in an employee’s job selection, employers are increasingly making location
decisions based on employee preferences and are selecting developments that are connected through various
modes of transport. Infrastructure availability will be a prominent concern for occupiers while implementing their
location strategies.
● Expansion of business operations by global players in India. India remains one of the top outsourcing destinations
in APAC. In 2017, the US, APAC and EMEA corporates accounted for most of the office leasing activity,
primarily due to India’s low-cost and skilled labour force. Despite recent disruptions, CBRE predicts this trend
to continue into 2018 as new players enter the market and global players expand operations.
● Industrial policy initiatives by state governments. Various states, including Maharashtra, Telangana and
Karnataka have taken measures to attract key industries such as IT, pharmaceuticals and telecommunications.
CBRE predicts that states will continue launching initiatives, such as road shows and investment meets, in 2018
to ensure targeted players favour them for relocation or consolidation.
● Evolving technology in a digital era. Technology is significantly affecting the business, talent and real estate
needs of corporate India. Developers will increasingly opt for smart buildings which deploy technology that
maximizes operational and energy efficiencies and optimize space usage. LEED certified buildings are likely to
be popular with occupiers.
● Expansion of office portfolios of private equity and institutional firms. Private equity and institutional firms have
expanded their real estate portfolios in the past two years by acquiring completed, well-leased prime office assets.
India’s first REIT listing is also likely to improve investor sentiments, potentially propelling major corporations
to lease or purchase space in similar quality buildings scheduled for completion in 2018.
MMR Commercial Real Estate Market
Rental values and capital values remained stable from 2017 to the first quarter of 2018, as seen in the graphs below
(Source: CBRE Marketview – India Office, Q1 2018, CBRE, 2018).
Figure 7. Rental Value Movement

94
Source: CBRE Marketview – India Office, Q1 2018, CBRE, 2018
Figure 8. Capital Value Movement
Source: CBRE Marketview – India Office, Q1 2018, CBRE, 2018
Demand was largely led by BFSI firms which took up small- and medium-sized spaces across micro-markets, with small-
to-medium-sized deals continuing to dominate leasing activity. Leasing interest continued for sectors such as
infrastructure, real estate, logistics and co-working operators. A leading co-working operator leased a large sized space in
Goregaon peripheral business district in the first quarter of financial year 2018 (Source: CBRE Marketview – India Office,
Q1 2018, CBRE, 2018).
Retail Real Estate Market in India
The year 2017 saw the addition of about 3.4 million sq. ft. of fresh retail space across seven key cities – Mumbai, NCR,
Pune, Bengaluru, Kolkata, Chennai and Hyderabad. Supply in the retail sector was particularly robust in the second half
of 2017, as almost 2 million sq. ft. came into the market in that period. A majority of this supply was concentrated in
Mumbai, Delhi-NCR, Pune, Bangalore and Kolkata. In terms of new global entrants into the country, 2017 witnessed the
entry of several international brands (Source: 2018 Asia Pacific – Real Estate Market Outlook India, CBRE, 2018).
A key regulatory reform in the beginning of 2018 was the allowance of 100% FDI in single brand retail through the
automatic route, as compared to the previous regulation which allowed up to 49% FDI through automatic route and up to
100% through an approval process. This key reform will spur the expansion of new and existing international brands in
India (Source: 2018 Asia Pacific – Real Estate Market Outlook India, CBRE, 2018).
Other key factors expected to drive growth in the commercial real estate market are as follows Source: 2018 Asia Pacific
– Real Estate Market Outlook India, CBRE, 2018):
● Demand for quality spaces. New supply is expected to create expansion opportunities for several brands which
have been waiting for space in organised centres. New and innovative F&B concepts are also expected to
contribute to growth in demand for quality retail spaces.
● Convergence of offline and online retail. India has the fastest growing e-commerce market in the world. However,
over the past few quarters, the online retail segment has seen considerable consolidation. Many online retailers
0
50
100
150
200
250
300
CBD ABD EBD (Worli,
Prabhadevi)
EBD (Lower
Parel)
SBD PBD (Malad,
Goregaon)
(IT)
PBD (Powai,
Vikhroli)
(IT)
BD (Thane,
New
Mumbai) (IT)
(IN
R /
sq
. ft
. /
mo
nth
)
Q1 2017 Q2 2017 Q3 2017 Q4 2017 Q1 2018
0
10,000
20,000
30,000
40,000
CBD ABD EBD (Worli,
Prabhadevi)
EBD (Lower
Parel)
SBD PBD (Malad,
Goregaon)
(IT)
PBD (Powai,
Vikhroli)
(IT)
BD (Thane,
New
Mumbai) (IT)
(IN
R /
sq
. ft
.)
Q1 2017 Q2 2017 Q3 2017 Q4 2017 Q1 2018

95
have ventured into traditional brick and mortar real estate businesses by opening experience and sales outlets to
drive their online sales.
● Quality spaces to command a premium. Quality retail developments are expected to continue commanding higher
rentals. Operational centres that cater to the relevant customer segments and generate greater revenue per footfall
will continue to be in demand and will command higher rentals.
MMR Retail Real Estate Market
In 2017, there was steady demand for established high street locations. The steady churn in leasing gave shopping centres
an opportunity to provide fresh space to new brands entering the retail sector. For instance, international brands such as
Mango and Massimo Dutti opened their first stores in Mumbai at High Street Phoenix in Lower Parel. In addition, Marks
and Spencer, Ethos and Aeropostale leased space in Oberoi Mall, Goregaon. Inox opened its new luxury format – Inox
Insignia at Atria Mall in Worli, while retailers such as Vijay Sales and Pantaloons continued to expand their presence
across the city. F&B, leisure and wellness businesses were also active players in the market (Source: CBRE Marketview
– India Retail, H2 2017, CBRE, 2017).
Rentals also remained largely stable for both high streets and malls across micro-markets due to steady demand, as seen
below (Source: CBRE Marketview – India Retail, H2 2017, CBRE, 2017).
Figure 9. High Street Rental Value Movement Figure 10. Shopping Centre Value Movement
Source: CBRE Marketview – India Retail, H2 2017, CBRE, 2017. Source: CBRE Marketview – India Retail, H2 2017, CBRE, 2017.
Figure 11. Sub-Market Key Stats
High Streets Average Rent in
H2 2017 (INR/sq.
ft. / month)
Average Rent in
H1 2017INR/sq.
ft. / month)
Half Yearly
Change (%)
Y-o-Y Change
(%)
Linking Road 500-700 500-700 0.0 -7.7
Colaba Causeway 450-600 450-600 0.0 0.0
Kemps Corner 450-500 450-500 0.0 0.0
Mall Clusters Average Rent in
H2 2017 (INR/sq.
ft. / month)
Average Rent in
H1 2017 (INR/sq.
ft. / month)
Half Yearly
Change (%)
Y-o-Y Change
(%)
Central Mumbai 600-750 600-750 0.0 0.0
Western Suburbs (Andheri,
Goregaon, Malad) 250-390 250-390 0.0 0.0
Eastern Suburbs (Kurla,
Ghatkopar, Bhandup) 125-290 125-290 0.0 0.2
Source: CBRE Marketview – India Retail, H2 2017, CBRE, 2017.
Hospitality Sector in India
In 2017, the occupancy for all key markets and across all segments, with the exception of the Up-UpMid segment for
Chennai, crossed 60%. Only Mumbai maintained an occupancy over 70% on a market-wide basis. The average daily rate
(ADR) growth has been modest across most markets. Meanwhile, all markets, with the exception of Gurugram,

96
experienced an increase in revenue per available room (RevPAR) (Source: STR - Horwath HTL India Hotel Review Report,
2017, jointly published by Horwath HTL and STR).
According to this report, Mumbai and Goa maintained their places as leaders in the hospitality sector. Goa’s ADR crossed
₹ 8,000, while Mumbai’s ADR and RevPAR were just slightly below ₹ 8,000 and ₹ 6,000 respectively. Mumbai is the
only market in the Busy-Superior rate zone (per the classification adopted for the purpose of the captioned report), as
illustrated in the graph below (Source: STR - Horwath HTL India Hotel Review Report, 2017).
Performance in the different segments of the hospitality sector in 2017 were as follows (Source: STR - Horwath HTL India
Hotel Review Report, 2017):
● Luxury-Upper Up Segment. The Luxury-Upper Up segment had around 49,000 rooms, making up 37% of the all-
India chain affiliated inventory. Of this, 38,000 rooms, or 79% of the segmental supply, were in the key markets
– Mumbai, New Delhi, Gurugram and rest of NCR, Bengaluru, Chennai, Hyderabad, Kolkata, Pune, Ahmedabad,
Goa, Jaipur and Kochi. While the Busy-Superior zone remained empty, Mumbai was busy but with moderate
rates.
● Upscale-Upper Mid Segment. The Upscale-Upper Mid segment had around 53,000 rooms, making up 40% of the
all-India chain affiliated inventory. Of this, 32,000 rooms, or 60% of the segmental supply, were in the key
markets adopted for the captioned report. Mumbai was the only city in the Strong-Superior zone in this segment.

97
● Midscale-Economy Segment. The Midscale-Economy segment had just under 31,000 rooms, or 23% of the all-
India chain affiliated inventory. Of this, 15,000 rooms, or 50% of the segmental supply, were in the key markets.
Mumbai was the only market in the strong occupancy and superior rate zone.
According to STR – Horwath HTL India Hotel Review Report 2017, Mumbai experienced an increase in its occupancy
rate to 75%, while it’s ADR and RevPAR grew by 3.4% and 5.4% respectively. Mumbai’s RevPAR growth was higher,
as compared to the average RevPAR growth across India of 3.8%. Luxury and upper-up hotels dominate Mumbai’s room
supply share, thereby establishing Mumbai’s rate leadership.

98
OUR BUSINESS
Unless otherwise indicated, the financial information as of and for the years ended March 31, 2018 and 2017 has been
extracted or derived from our Ind AS Audited Consolidated Financial Statements for the respective years, and the financial
information as of and for the year ended March 31, 2016 has been extracted or derived from our financial statements for
the year ended March 31, 2016 restated in accordance with Ind AS for comparative information and presented in the Ind
AS Audited Consolidated Financial Statements for the year ended March 31, 2017.
OVERVIEW
We are a real estate development company operating in MMR, focused on premium developments. We believe that our
customer-centric approach and our focus on delivering high quality projects have enabled us to establish a reputed brand.
We, together with our Promoter and Promoter Group, have a track record of over 30 years of developing high quality
projects that are driven by an emphasis on strong project execution, contemporary architecture and quality construction.
As of March 31, 2018, we, together with our Promoter and Promoter Group, have delivered over 40 projects across micro
market segments in MMR covering approximately 11,298,358 square feet of Saleable Area.
While our focus is on residential projects, we have a diversified portfolio of projects across key segments of the real estate
market including residential, office space, retail, hospitality and social infrastructure projects in mixed-use and single-
segment developments. By integrating residential projects with office space, retail, hospitality or social infrastructure
projects, we seek to create “destination developments” such as Oberoi Garden City, which we believe enhance the
desirability of our mixed-use projects.
Our in-house team leverages many decades of strong real estate industry experience in the execution of land acquisitions,
the procurement of regulatory approvals and sales and marketing. We have a proven and scalable outsourcing model that
emphasises quality design, construction and property management. We work with international and domestic architects
and contractors. We believe that this outsourcing model provides us with the scalability required to undertake large
developments and also enables our management to focus on the key drivers of our business.
Through our deep understanding of the regulatory processes for property development in our markets and a compliance-
driven approach to our business, we seek to ensure effective risk management and timely delivery to our customers. Under
the guidance of our highly experienced management team, we seek to maintain an optimal capital structure with prudent
use of leverage. We believe this has enabled us to adapt to the changing market environment in a focused and constructive
manner. This has also developed our ability to understand our customer needs enabling us to determine product mix and
configuration. Our transparent and customer-friendly processes enhance customer experience and customer satisfaction.
We currently follow a sale model for our residential projects and a predominantly lease model for our office space and
retail projects as we believe this provides us with stable cash flows. In the past, we have also followed a sale model for a
portion of our office space projects. In our hospitality projects, we currently follow an operating agreement model,
whereby the hotel is owned by us and operated by a hotel chain. As of March 31, 2018, we own 1,698,161 square feet of
Saleable Area of our Completed office space (including 100,900 square feet of Saleable Area occupied by us) and retail
projects, which follow the lease model, and 381,820 square feet of Saleable Area of our Completed hospitality project,
which follows the operating agreement model.
We currently have 11 Ongoing and 15 Planned projects, which we expect to provide a total Saleable Area of approximately
28,020,823 square feet. The estimated Saleable Area of our Ongoing and Planned projects as of March 31, 2018 is
summarised in the table below:
Project Type(1) Ongoing Percentage of
Total
Ongoing
Estimated
Saleable Area
Planned Percentage of
Total Planned
Estimated
Saleable Area
Grand Total Percentage
of Total
Estimated
Saleable
Area
Estimated
Saleable Area
(in sq. ft.)(1)
No. of
Projects
Estimated
Saleable Area
(in sq. ft.)(1)
No. of
Projects
Estimated
Saleable Area
(in sq. ft.)(1)
No. of
Projects
Residential 9,949,202 7 75.59% 7,430,537 5 50.01% 17,379,739 12 62.02%
Office Space - - 0.00% 3,764,331 4 25.33% 3,764,331 4 13.43%
Retail 2,579,270 2 19.60% 279,939 1 1.88% 2,859,209 3 10.20%
Hospitality 313,300 1 2.38% 2,142,927 3 14.42% 2,456,227 4 8.77%
Social Infrastructure
319,707 1 2.43% 1,241,611 2 8.36% 1,561,318 3 5.57%
Total 13,161,479 11 100.00% 14,859,344 15 100.00% 28,020,823 26 100.00%
(1) Information provided in respect of our Ongoing and Planned projects is based on current management plans and subject to change. In
general, we expect to begin construction on our Planned projects over the next three years.
Our consolidated total revenue and consolidated profit after tax were ₹ 129,200.70 lakhs and ₹ 45,880.32 lakhs for the
year ended March 31, 2018, ₹ 116,104.19 lakhs and ₹ 37,858.76 lakhs for the year ended March 31, 2017 and ₹ 145,891.41
lakhs and ₹ 43,555.60 lakhs for the year ended March 31, 2016.

99
COMPETITIVE STRENGTHS
Our primary competitive strengths include the following:
Favourably positioned to benefit from the rapidly evolving regulatory environment
We believe that we are favourably positioned to benefit from recent regulatory changes affecting the Indian real estate
industry, such as the introduction of RERA, the implementation of a comprehensive national GST regime, currency
demonetisation and the enactment of the Insolvency and Bankruptcy Code, 2016.
● RERA became effective in May 2017 and was aimed at enhancing accountability, transparency and uniformity
in practices across the real estate industry. Under RERA, real estate developers are required to register ongoing
projects, prior to the commencement of any marketing of such projects, with the applicable Real Estate
Regulatory Authority established pursuant to RERA. The registration process and subsequent ongoing disclosure
requirements are expected to provide greater transparency through the mandatory disclosure of information such
as project approval status, construction progress and sales volumes. In addition, RERA encourages financial
discipline through measures such as the “70:30 rule” which mandates that 70% of project receivables must be
maintained in a segregated account with permitted withdrawals only for land and construction costs in line with
the percentage of project completion (as certified by an architect, an engineer and a chartered accountant). This
measure safeguards customer interests and also effectively increases upfront working capital requirements for
property developers, which we believe will benefit well-capitalised companies like us by raising barriers to entry
for new entrants in our market. RERA also imposes penalties for non-compliance and establishes
grievance/dispute resolution procedures. For further details, please see the section entitled “Regulations and
Policies” on page 128.
● GST (implemented in July 2017) combines multiple taxes and levies by the Central and State Governments into
a unified tax structure. We expect the GST regime will be beneficial to real estate developers as well as purchasers
as it facilitates reducing the cost of complying with multiple tax systems and simplifies the purchase processes
for real estate. We believe that simplified processes will reduce the scope for non-transparent transactions and
benefit large, organised and transparent developers like us.
● In addition, we expect that we will benefit from demonetisation measures (undertaken in November 2016) in the
long term through formalisation of the economy and enhanced accountability, transparency and investor and
consumer confidence that we believe will result from these measures.
● The Insolvency and Bankruptcy Code, 2016, enacted in May 2016, created a single insolvency and bankruptcy
framework in India and established clear processes for corporate insolvency resolution and liquidation. We
believe that there will be an increase in insolvency and bankruptcy proceedings and, correspondingly, more
opportunities for us to make strategic acquisitions of stressed assets.
We expect the reforms will create a level playing field in the real estate industry and benefit well-organised real estate
developers, such as our Company, with established compliance processes and disciplined financial management. We
believe our core strengths, including our customer-centric approach, our established brands, our commitment to
transparency and our strong corporate governance and internal compliance processes, together with our focus on strategic
land acquisitions, our strong balance sheet and outsourced execution strategy position us favourably to benefit from the
changing regulatory environment. In addition, as real estate developers with weaker processes and systems exit the
industry due to the higher cost of doing business, we expect to benefit from strategic acquisition opportunities in the
industry.
Strong presence in MMR with established brand and reputation
Most of our projects are located in MMR. Mumbai is one of the most attractive real estate markets in India with one of
the largest average residential ticket sizes across various segments (Source: PropEquity, MMR Overview (Q1 2013-Q1
2018)). We have deep knowledge of the market and regulatory environment in MMR that we leverage to identify
opportunities in the region. We also believe that Mumbai’s position as the financial capital of India, together with the
demographics of the Mumbai population, with a high-income earning and discerning customer base and an expanding
segment of young, upwardly-mobile professionals provide an attractive market for our projects. We also benefit from the
limited availability and high prices of land in Mumbai, which creates demand for our projects while maintaining high
barriers to entry. In addition, we believe that proposed extensive infrastructure development in MMR in general, and
improved connectivity in the areas in which our projects are located, will generate greater demand for our projects. Many
of our large projects are located in close proximity to metro rail stations (existing, planned or under construction), which
we believe is particularly valuable for our retail and office space projects.
We believe our focus on customer satisfaction and emphasis on strong project execution, contemporary architecture, timely
delivery and quality construction have enabled us to establish a reputed brand and achieve sales at early stages of
development. In Fiscal Year 2017, we were awarded “Most Aspiring Real Estate Brand” in India at the Global Brands

100
Magazine Awards in the United Kingdom. We believe our established brand and reputation has enabled us, and will
continue to enable us, to obtain land development rights pursuant to which we develop land owned by third parties on a
revenue-share basis.
Proven and scalable business model with execution capabilities across verticals
Together with our Promoter and Promoter Group, we have a track record of delivering over 40 projects across multiple
verticals covering approximately 11,298,358 square feet of Saleable Area as of March 31, 2018. Our emphasis has been
on contemporary and environmentally friendly design, quality construction and property management.
Our strength is in the execution of land acquisitions, the procurement of regulatory approvals and sales and marketing.
We have an in-house team that leverages many decades of strong real estate industry experience in those areas. We
outsource all of our construction and design work to external service providers, such as architects and contractors, with
whom we have strong and long-standing relationships. We believe this outsourcing model has been a key factor of our
scalability. We believe that our reputation as a reliable and leading developer enables us to work with domestic and
international architects and contractors, particularly when there is high demand for their services. Our outsourcing model
enables us to leverage the expertise of our service providers, while enabling our management to focus on the key drivers
of our business. In addition, we have experienced and capable design management and project management teams in-
house who oversee and execute all aspects of project development to ensure timely project delivery within expected
specifications and budget. We also believe that our outsourcing model provides us with the scalability required not only
to undertake large developments such as Oberoi Garden City in Mumbai, but also to explore opportunities and undertake
similar and other developments in different parts of India.
In addition, our projects span different segments of the real estate market, such as residential, office space, retail,
hospitality and social infrastructure. We have created “destination developments” by developing integrated mixed-use
developments such as Oberoi Garden City, which is anchored by a shopping mall, a hotel, office spaces and an international
school. We believe large integrated developments enhance customer satisfaction, provide synergistic opportunities,
transform the positioning of the micro-market and help command a premium. Further, we are also currently developing
Sky City, an integrated mixed-use development in Borivali (East), Mumbai.
Robust pipeline of Ongoing and Planned projects across segments
We believe that we have a strong project pipeline which provides near term cash flow visibility. We currently have 11
Ongoing and 15 Planned projects. For information about our Ongoing and Planned projects, please see the table under “—
Overview” on page 98. We expect to launch most of these projects in the market over the next three to five years.
Approximately 6,623,539 square feet of estimated Saleable Area of our Ongoing and Planned office space and retail
projects will complement our Completed retail project, Oberoi Mall, which has approximately 552,893 square feet of
Saleable Area, and our Completed office space projects, Commerz I and Commerz II – Phase I, which have a combined
estimated Saleable Area of approximately 1,145,269 square feet (including 100,900 square feet of Saleable Area which is
occupied by us). These are indicative of our strategic focus on our retail and office space developments. Our Ongoing and
Planned projects span across various real estate verticals and are in locations that generally provide greater cash flow
visibility. We believe our pipeline of Ongoing and Planned projects across diverse real estate segments will provide
balanced cash flow and will help mitigate sector specific industry cycles.
Cash flow stability from our rental and hospitality properties
We currently follow a predominantly lease model for our office space and retail properties, which provides us with a stable
stream of cash flow to better manage cyclical risks. The table below summarises our Completed office space and retail
projects as of March 31, 2018:
Project
Name
Development Site /
Location
Project Type Actual
Saleable Area
(sq. ft.)
Total Saleable Area
Sold/ Booked for
Sale/ Leased (sq. ft.)
Occupancy
Level (%)
Actual Completion
Date(1)
Commerz I Oberoi Garden City,
Goregaon (E), Mumbai
Office space 318,600(2) 261,274 82.13 March 2008
Commerz II – Phase I
Oberoi Garden City, Goregaon (E), Mumbai
Office space 725,769 344,860 47.52 December 2013
Oberoi Mall Oberoi Garden City,
Goregaon (E), Mumbai
Retail 552,893 549,397 99.37 March 2008
(1) The completion date for our Completed projects is the date we received a full occupation certificate for each project. (2) Excludes 100,900 square feet of Saleable Area which is occupied by us.
In addition, we own one Completed hotel, The Westin Mumbai – Garden City, with 269 rooms. The average Occupancy
Level for The Westin Mumbai – Garden City was 80.78% for the year ended March 31, 2018. We have leased the premises
of our Completed social infrastructure project, Oberoi International School, Goregaon to Oberoi Foundation, a public
charitable trust. As of March 31, 2018, the total estimated Saleable Area in our Planned and Ongoing retail, office space,
hospitality and social infrastructure projects was approximately 10,641,084 square feet. The table below summarises our
Planned and Ongoing retail and office space projects as of March 31, 2018:

101
Project Name(1) Development Site / Location Project Type(4) Actual Saleable Area
(sq. ft.)(4)
Commerz II – Phase II Oberoi Garden City, Goregaon (E), Mumbai Office space 2,298,000
Mulund Commercial Mulund – West, Mumbai Office space 140,345
Sky City Extension Borivali, Mumbai Office space 1,046,047
Sangamcity – Commercial(2) Sangamcity, Sangamwadi, Pune Office space 279,939(2)
I-Ven Mall(3) Worli, Mumbai Retail 1,020,000(3)
Sky City Mall Borivali, Mumbai Retail 1,559,270
Sangamcity - Retail(2) Sangamcity, Sangamwadi, Pune Retail 279,939(2)
Total
6,623,539
(1) Information provided in respect of our Ongoing and Planned projects is based on current management plans and subject to change. In general,
we expect to begin construction on our Planned projects over the next three years.
(2) The land area and estimated Saleable Area reflects our 31.67% share in the joint venture. (3) Our share in the project is 50.00% of the estimated Saleable Area.
(4) Excludes approximately 2,456,227 square feet of Saleable Area in our hospitality projects and approximately 1,561,318 square feet of Saleable
Area in our social infrastructure projects.
Our consolidated rental and other related revenue was ₹ 23,383.05 lakhs (18.10% of our total revenue), ₹ 19,389.58 lakhs
(16.70% of our total revenue) and ₹ 17,886.01 lakhs (12.26% of our total revenue) for the years ended March 31, 2018,
2017 and 2016, respectively, from our Completed office space, retail projects and social infrastructure projects. Our
consolidated rent received from Oberoi Foundation (as per Ind AS 24 “Related Party Disclosures”) was ₹ 3,847.66 lakhs
for the year ended March 31, 2018. Our consolidated revenue from hospitality was ₹ 12,781.53 lakhs (9.89% of our total
revenue), ₹ 12,574.28 lakhs (10.83% of our total revenue) and ₹ 12,712.43 lakhs (8.71% of our total revenue) for the years
ended March 31, 2018, 2017 and 2016, respectively. The chart below shows our rental revenue from our Completed office
space, retail projects and social infrastructure projects for the years ended March 31, 2010 through 2018, as well as revenue
from our hospitality segment for the same period.
Note: Figures mentioned above for FY 10 to FY 15 are in accordance with Indian GAAP and from FY 16 onwards as per Ind AS.
Prudent financial management
We strive to maintain an optimal capital structure with prudent use of leverage and a conservative debt policy. As of March
31, 2018, we maintained a debt to equity ratio of 0.28 (calculated as the ratio of long term borrowings (non-current), short
term borrowings (current) and current maturities of long term borrowings (non-current) to equity share capital and other
equity). We believe that we are well positioned to leverage our balance sheet to take advantage of a favourable business
cycle or market opportunity and we are well prepared for an adverse business cycle. The following chart shows our net
debt as of each of the fiscal years indicated. As indicated in the chart, during the year ended March 31, 2015, we acquired
the land for our Sky City development in Borivali (East), Mumbai and our net debt increased to ₹ 60,787.29 lakhs as of
March 31, 2015. After the acquisition, we repaid a portion of our outstanding borrowings and our net debt decreased to ₹
8,712.13 lakhs as of March 31, 2016. As of March 31, 2018, our net debt was ₹ 156,152.88 lakhs.

102
Note: Figures mentioned above for FY 10 to FY 15 are in accordance with Indian GAAP and from FY 16 onwards as per Ind AS.
We have also demonstrated a consistent track record of profitability, with consolidated profit after tax of ₹ 45,880.32
lakhs, ₹ 37,858.76 lakhs and ₹ 43,555.60 lakhs for the years ended March 31, 2018, 2017 and 2016, respectively. As of
March 31, 2018, our consolidated net worth, which includes equity share capital and other equity, was ₹ 609,237.37 lakhs
and we had cash and cash equivalents, other bank balances, fixed deposits with banks having remaining maturity for more
than twelve months and investments in mutual funds of ₹ 13,253.35 lakhs. The following chart shows our consolidated
net worth and cash and cash equivalents as of each of the fiscal years indicated:
Note: Figures mentioned above for FY 10 to FY 15 are in accordance with Indian GAAP and from FY 16 onwards as per Ind AS.
In addition, all of our development sites which we own are fully paid for. We believe this mitigates one of the major risks
involved in project development. We believe that our financial strength and strong project pipeline make us well positioned
for changes in market conditions.
Strong and stable management team with strong corporate governance framework and business processes
We have a strong and experienced management team. Our management team has a long-term vision and has successfully
identified suitable land parcels and created landmark “destination developments”. We also believe that our management

103
team’s understanding of the market and flexibility in managing our operating and financial leverage has enabled us to
adapt to the changing market conditions in a focused and constructive manner. We believe that the understanding of the
management team about the real estate market will enable us to continue to take advantage of current and future market
opportunities.
We have a strong corporate governance framework driven by our board of directors. More than 50% of the members of
our board of directors are independent directors. In addition, we believe we have adopted detailed and transparent
disclosure practices. We were awarded the “Best for Disclosure & Transparency” and “Best for Investor Relations” in the
Corporate Governance Poll 2016 conducted by Asiamoney.
We also use technology and IT solutions extensively, including ERP, CRM, design and execution tools. With strong
corporate governance and business processes, we believe we are well positioned to manage and deal with business and
compliance risks.
STRATEGY
The key elements of our business strategy are as follows:
Widen customer base
We have strategically evaluated to create accessible developments with distinctive designs, functionalities, quality
construction and finishes to address aspirational customers through different brands. We intend to capitalise on our
expertise, experience, and business model to expand our customer base by offering products which are more accessible,
yet carry the same quality and finishes, albeit at slightly lower specifications. This strategy will allow us to cater to a wide
array of customers which desire aspirational developments and in our view are currently under served by the market
participants.
Drive scale
We intend to continue to follow our outsourcing model and further strengthen our relationships with key reputed service
providers such as architects and contractors. We believe our outsourcing model will enable our management to continue
to focus on our core business by outsourcing the design and construction of our projects to our service providers. We
expect to leverage our experience, expertise and business model to expand our portfolio across residential, retail, office
space, hospitality and social infrastructure through mixed-use developments. In particular, we intend to strategically push
towards retail developments where we see opportunity in light of increasing urbanisation, improving consumer confidence,
rising consumption patterns and expansion of leading retail brands in India. We intend to accomplish this by leveraging
our existing expertise as the developer of a profitable mall, our existing relationships with retail tenants and our focus on
prime locations with high connectivity.
Strategic land acquisition
We intend to take advantage of emerging consolidation opportunities in the real estate industry generated by regulatory
changes, such as RERA, and other market factors, by following a flexible strategy for land acquisition. We intend to
continue to evaluate various land acquisitions models, such as outright purchase, joint ventures, joint development and
development management. We also anticipate that insolvency and bankruptcy proceedings under the Insolvency and
Bankruptcy Code, 2016 against or by debt-ridden companies will provide opportunities to acquire stressed assets. We also
intend to continue to actively manage our operational and financial leverage to adapt to changing markets, as we have in
the past. For example, in 2002 and 2005, we leveraged to make acquisitions of land, such as in Mulund, Goregaon and
JVLR, as our management anticipated a growth in the real estate market. However, in 2007 and 2008, we prudently did
not make any land acquisitions even though we had adequate cash reserves as our management had concerns about the
viability of projects. Then in 2009 and 2014, we took advantage of multiple land acquisition opportunities, by acquiring
land in Worli (through a joint venture) and Borivali, respectively. Please see the chart under “—Competitive Strengths –
Prudent financial management” on page 101 for a depiction of our use of leverage in connection with our Borivali
acquisition.
Flexibility in capital investment and mode of development
We focus on acquiring land for development in the near- to medium-term. While we have purchased and will continue to
purchase land for development by making upfront payments for the land, we also seek to develop projects through
alternative structures that reduce our upfront capital commitment, such as entering into joint development or development
management agreements. For example, in our Oasis Realty development, our joint venture partner is responsible for
carrying out the slum rehabilitation portion, and we expect to earn revenue from the development and sale of the free-sale
portion (the portion of the development which can be commercially exploited to compensate for the obligation of
developing the slum rehabilitation component) on a revenue-share basis. In this way, we also benefit from the slum
development expertise of others and manage our development risks. We believe that such development strategies enable
our joint venture partners to get more value out of their land as our brand and the quality of our product are able to add

104
value to their property. In turn, we are then able to access quality land to develop and sell without significant capital
investment.
Expand across locations
While MMR remains and is expected to remain our primary focus, we have strategically evaluated and will continue to
evaluate, growth opportunities in other parts of India on a case by case basis. We intend to continue to focus on MMR
with a preference for large projects such as Oberoi Garden City, Sky City, Eternia and Enigma. Our development sites are
located in distinct areas of MMR, with different target markets, and we intend to continue to tailor our projects to the
particular requirements of each market.
Adaptive sales strategy
We intend to continue to our customer-centric approach by focusing on customer satisfaction throughout the property
ownership lifecycle, which includes property evaluation and research, property purchase, delivery of unit and post
possession. During the evaluation phase, we will continue to help our customers in informed decision-making by
simplifying sales terms and conditions. We also intend to continue to focus on providing our customers full disclosure of
sales terms and conditions, as well as innovative solutions and offers, such as our recent offer of payment terms with zero
GST impact and deferred payment options. During the property purchase stage, we aim to enhance our customers’
experience by providing dedicated relationship managers. We also aim to continue our focus on timely deliveries and
maintaining long term relationships with customers post possession.
OUR CORPORATE STRUCTURE
Our Company was incorporated as Kingston Properties Private Limited on May 8, 1998. The name of our Company was
changed to Oberoi Realty Private Limited on October 23, 2009 and was further changed to Oberoi Realty Limited on
December 14, 2009. In 2006, the principal business operations of our various group entities were consolidated under our
Company and, following this consolidation, except for certain projects which were excluded from our structure for
regulatory reasons, all real estate development activity has been and will continue to be performed by us.
Our Promoter and Promoter Group have been developing real estate since 1983. Our Promoter has, pursuant to an
undertaking dated December 23, 2009, agreed not to undertake the development or construction of any new real estate
projects under “Oberoi Realty” or any other brand name with certain exceptions. This undertaking is effective until our
Promoter holds more than 50% of the paid-up equity share capital of our Company or the power to exercise more than
50% of the voting rights in our Company.
The following diagram illustrates our current corporate structure:
(1) Sangam City Township is a special purpose vehicle, in which the Company, DB Realty Limited, and Avinash Bhosale Group each hold a
31.67% interest and Siddharth Mayur, Shaila R. Mayur and Bhavana S. Mayur together hold the remaining 5% stake. Sangam City Township is a joint venture for the development of a total of approximately 56 acres of land located in Sangamwadi, Pune. Please see “— Our Real
Estate Developments – Sangam City – Sangamwadi, Pune” on page 119.

105
(2) Siddhivinayak Realties Private Limited (“SRPL”) is a special purpose vehicle, jointly owned by OCL, Aseela Vinod Goenka, Shabana Shahid
Balwa, Neelkamal Realtors & Builders Private Limited, Marine Drive Hospitality & Realty Private Limited, BD & P Hotels (India) Private Limited, Y J Realty and Aviation Private Limited and KG Enterprises (Vinod Goenka and Sunita Bali), which was established in connection
with a joint venture to acquire the assets and properties of Tulip Hospitality Services Limited. Please see “—Our Real Estate Developments
– Juhu Hotel - Juhu, Mumbai” on page 120. (3) Oasis Realty is not a separate legal entity. It is an unincorporated joint venture among our wholly-owned subsidiaries, OCL and Astir Realty
LLP, and Skylark Buildcon Private Limited and Shree Vrunda Enterprises to develop a mixed-use development of approximately 26 lakhs
square feet of Saleable Area in Worli, Mumbai. Please see “—Our Real Estate Developments – Three Sixty West - Worli, Mumbai” on page 115.
(4) Zaco Aviation is not a separate legal entity. It is an unincorporated joint venture entered into with Intervalve (India) Limited, El-O-Matic
(India) Private Limited, Serum Institute of India Limited, Swapnali Constructions and OCL for the acquisition and shared corporate use of a helicopter.
(5) I-Ven Realty Limited is a special purpose vehicle, which owns 4.12 acres of land at Worli, Mumbai. I-Ven Realty Limited is equally and
jointly owned by us and Mr. Vikas Oberoi, the Chairman and Managing Director of our Company. (6) Shri Siddhi Avenues LLP (“Shri Siddhi Avenues”) is a special purpose vehicle, which is in the process of developing 1.82 acres of land at
Tardeo, Mumbai under a slum rehabilitation scheme. We hold a 50% interest in Shri Siddhi Avenues and Kishor B. Rathod, Mahindra B.
Rathod, Raju B. Rathod and Jignesh P. Kothari together hold the remaining 50% stake.
The following table identifies development sites that contain Completed or Ongoing projects that are developed by the
entities or joint ventures identified above and contribute to the revenue of our Company:
Entity / Joint Venture Development Site / Location
Oberoi Realty Limited Oberoi Garden City, Goregaon, Mumbai (except Oberoi Mall)
Malabar Hill Project, Malabar Hill, Mumbai
Oberoi Mall Limited Oberoi Mall, Oberoi Garden City, Goregaon, Mumbai
Oberoi Constructions Limited Splendor, Andheri – East, Mumbai
Eternia and Enigma, Mulund – West, Mumbai
Oasis Realty Three Sixty West, Worli, Mumbai
The Ritz-Carlton Mumbai – Worli, Mumbai
Siddhivinayak Realties Private Limited Juhu Hotel, Juhu, Mumbai
Sangam City Township Private Limited Sangam City, Sangamwadi, Pune
Incline Realty Private Limited Sky City, Borivali, Mumbai
Shri Siddhi Avenues LLP Tardeo, Mumbai
I-Ven Realty Limited I-Ven Mall
I-Ven Hotel
DESCRIPTION OF OUR BUSINESS
Our Business Operations
We are a real estate development company operating in MMR, focused on premium developments. We have a diversified
portfolio of projects in mixed-use or single-segment developments, which cover key segments of the real estate market,
namely: (i) residential, (ii) office space, (iii) retail, (iv) hospitality and (v) social infrastructure. These segments, and our
current business models for our projects in each segment, are depicted in the following diagram:
(1) The terms “lease” and “lease model”, as used in this Placement Document, include premises which are occupied pursuant to a number of
different legal arrangements, including lease, licence, business conducting and other similar arrangements, and the term “tenant” refers to
a party which occupies any of our properties under any such arrangement. (2) In our hospitality projects, we currently follow an operating agreement model, whereby the hotel is owned by us and operated by a third
party operator.
(3) For our Completed social infrastructure project, Oberoi International School, Goregaon we have followed a lease model, whereby the school is owned by us and operated by Oberoi Foundation, a public charitable trust pursuant to a leave and licence agreement dated March 23,
2018. For our Planned and Ongoing social infrastructure projects we currently plan to lease the land for development and operation by third
parties
Our Business
Residential Office Space Retail Hospitality Social
Infrastructure
Sale Sale/Lease (1) Sale/Lease (1) Owned (2) Lease (1) (3)
Segment
Business
Model

106
As of March 31, 2018, we, together with our Promoter and our Promoter Group, have delivered over 40 projects covering
approximately 11,298,358 square feet of Saleable Area. As of March 31, 2018, we have approximately 28,020,823 square
feet of Saleable Area of Ongoing and Planned projects, in the aggregate, consisting of 13,161,479 square feet of Saleable
Area of Ongoing projects and 14,859,344 square feet of Saleable Area of Planned projects.
Our principal focus, across our developments, is on premium residential projects in MMR as we believe that there exist
significant growth opportunities in this segment of the real estate market and this region. As of March 31, 2018, our
Ongoing, Planned and Completed (not fully sold) residential projects constituted 62.02% of the total estimated Saleable
Area in our Completed, Ongoing and Planned projects (excluding Completed projects that have been fully sold).
The table below summarises all our Completed residential projects that have been fully sold as of March 31, 2018:
Project Name Development Site / Location
Saleable Area
(sq. ft.)
Total Number
of Units
Completion
Date(1)
Plazo (Ghuman Villa)(2) Plazo (Ghuman Villa), Juhu, Mumbai 19,850 10 September 2001
Rehabilitation Project(3) Goregaon – East, Mumbai 56,794 173 May 2002
Beachwood House(2) Oberoi Enclave, Juhu, Mumbai 27,000 10 January 2005
Oberoi Crest(2) Oberoi Crest, Khar, Mumbai 23,300 11 May 2006
Seawind(2)(4) Oberoi Enclave, Juhu Mumbai 23,500 8 October 2006
Woods Oberoi Garden City, Goregaon – East, Mumbai 598,200 600 May 2008
Oberoi Springs Oberoi Springs, Andheri – West, Mumbai 643,065 645 October 2009
Splendor Splendor, Andheri – East, Mumbai 1,279,152 1,296 July 2011
Splendor Grande Splendor, Andheri – East, Mumbai 285,740 157 September 2013
Priviera Santacruz – West, Mumbai 18,800 8 May 2015
Total 2,975,401 2,918
(1) The completion date for our Completed projects is the date we received a full occupation certificate for each project.
(2) Each of Plazo (Ghuman Villa), Beachwood House, Oberoi Crest and Seawind were developed by OCL before OCL became a wholly-owned subsidiary of the Company in December 2006.
(3) We developed this slum rehabilitation project on 0.71 acres of land within the Oberoi Garden City development site and obtained TDRs
which we sold. (4) Our Seawind project was sold to Beachwood Properties Private Limited, a Promoter Group entity, in October 2006.
The table below summarises all our Completed office space projects that we developed on a sale model and have been
fully sold as of March 31, 2018:
Project Name Development Site / Location Saleable Area (sq. ft.) Completion Date(1)
Oberoi Chambers(2) Oberoi Chambers, Andheri – West, Mumbai 86,123 May 2004
Oberoi Trade Center Andheri – West, Mumbai 49,850 March 2001
Oberoi Garden Estates Chandivali, Mumbai 518,522 March 2000
Adhikari Chambers Andheri – West, Mumbai 29,000 October 1999
(1) The completion date for our Completed projects is the date we received a full occupation certificate for each project.
(2) Oberoi Chambers was developed by OCL before OCL became a wholly-owned subsidiary of the Company in December 2006.
We believe that real estate development consists of: (i) land acquisition; (ii) development approvals; (iii) concept design
and design development; (iv) construction; and (v) sales. We classify our projects as “Completed”, “Ongoing” or
“Planned” depending on their respective stages of development. Our classification of properties reflects the basis on which
we operate our business and may differ from classifications used by other developers. Please see the section entitled
“Definitions and Abbreviations” on page 19.
Our Residential Projects
We currently have seven Ongoing and five Planned residential projects, as well as three Completed residential projects
that have not been fully sold, which we expect to provide a total Saleable Area of approximately 21,088,930 square feet
comprising 62.02% of the total Saleable Area of all our Ongoing, Planned and Completed (but not fully sold) projects.
For these projects, our focus is on developing premium residential apartment complexes for sale. We typically receive a
down payment at the time of booking a unit and the remainder through periodic payments linked to certain other time or
construction milestones while the project is being developed. We generally launch such projects and commence the sales
process for a portion of the total number of units to be sold around the time of commencing construction.
Residential projects, either in mixed-use or single segment developments, are our primary business focus. Thirteen of our
residential projects form part of mixed-use developments. By integrating residential projects with premium office space,
retail, hospitality or social infrastructure projects, we have sought to establish our mixed- use developments as “destination
developments”, which we believe enhances the desirability of the location of our residential units.
Our Ongoing and Planned residential projects, as well as our Completed residential projects that have not been fully sold,
in each case as of March 31, 2018, are summarised in the following table:

107
Project
Name(1)
Development Site / Location Status Actual or
Estimated
Saleable Area
(sq. ft.)(1)
Actual or
Estimated
Total
Number of
Units(1)
Total Saleable
Area Sold/
Booked for
Sale/ Leased
(sq. ft.)
Total
Number of
Units Sold /
Booked for
Sale
Actual or
Estimated
Completion
Date(1)(2)
Seven Oberoi Garden City, Goregaon - East, Mumbai
Completed 39,550 7 33,900 6 June 2010
Exquisite Oberoi Garden City, Goregaon
- East, Mumbai
Completed 1,547,610 802 1,402,175 766 May 2015
Esquire(5)
Oberoi Garden City, Goregaon – East, Mumbai
Completed 2,122,031 882 1,334,126 555 April 2018
Three Sixty
West - I(6)(7)
Oasis Realty, Worli, Mumbai Ongoing 1,694,716 172 420,722 46 December
2020(3)
Three Sixty
West - II(6)
Oasis Realty, Worli, Mumbai Ongoing 587,630 28 21,547 1 December
2020(3)
Prisma Splendor, Andheri – East, Mumbai
Ongoing 268,750 91 209,011 70 June 2018(3)
Maxima(10) Splendor, Andheri – East,
Mumbai
Ongoing 376,106 166 - - -
Sky City – I Sky City, Borivali – East, Mumbai
Ongoing 2,885,000 1,835 1,337,327 901 December 2022
Eternia Mulund - West, Mumbai Ongoing 2,148,000 1,293 509,810 317 December
2021
Enigma Mulund – West, Mumbai Ongoing 1,989,000 671 354,195 135 December 2021
Sky City – II Sky City, Borivali – East,
Mumbai
Planned 1,708,000 1,131 - - -
Exquisite– III Oberoi Garden City, Goregaon
- East, Mumbai
Planned 4,587,500 1,546 - - -
Sangam City Sangam City, Sangamwadi,
Pune
Planned 773,951(4)
- - - -
Malabar Hill Malabar Hill, Mumbai Planned 15,829(8)
6 - - -
Tardeo Tardeo, Mumbai Planned 345,257(9)
94 - - -
Total 21,088,930 8,724 5,622,813 2,797
(1) Information provided in respect of our Ongoing and Planned projects is based on current management plans and subject to change. In
general, we expect to begin construction on our Planned projects over the next three years.
(2) The completion date for our Completed projects is the date we received a full occupation certificate for each project. (3) The estimated completion date for our Ongoing projects is the estimated completion date per RERA registration.
(4) The estimated Saleable Area reflects our 31.67% share in the joint venture.
(5) Part occupation certificate received in January 2018 and full occupation certificate received in April 2018. (6) The estimated Saleable Area reflects the total estimated Saleable Area of the project. The project is being developed by Oasis Realty, an
unincorporated joint venture between our wholly-owned subsidiaries, OCL and Astir Realty LLP, and Skylark Buildcon Private Limited and
Shree Vrunda Enterprises. Pursuant to the joint venture arrangement, we are entitled to receive 25% to 40% of the net revenues generated by the project. Please see “—Our Real Estate Developments – Three Sixty West - Worli, Mumbai”.
(7) Total Saleable Area sold/booked for sale/leased and total number of units sold/booked for sale include transfers from the joint venture at the
same rate at which such units were originally sold in 2006-2007. (8) The estimated Saleable Area reflects our 40.27% share in the project.
(9) Our share in the project is 50.00% of the estimated Saleable Area
(10) Sales have not commenced for Maxima; therefore, the project has not yet been registered under RERA.
Our Office Space Projects
We currently have two Completed and four Planned office space projects, which we expect to provide a total Saleable
Area of approximately 4,909,599 square feet comprising 14.39% of the total estimated Saleable Area of our Completed,
Ongoing and Planned projects (excluding Completed projects that have been fully sold). For these projects, our focus is
on developing multi-tenanted developments targeted towards corporations seeking office space for front-office operations.
We developed our two Completed office space projects, Commerz I and Commerz II – Phase I, on a lease model, as we
believe this model provides us with a stable source of cash flow and near-term cash visibility. We generally lease office
space on a “bare shell” basis, whereby all internal fittings are to be installed by the tenant. We may, however, adopt a
mixed sale/lease or total sale model in the future, or continue to follow the lease model for our Ongoing and Planned office
space projects, depending on prevailing market conditions.
Our office space projects, as of March 31, 2018, are summarised in the following table:
Project Name(1) Development Site / Location Status Actual or
Estimated
Saleable
Area (sq.
ft.) (1)
Total Saleable
Area Sold/
Booked for Sale/
Leased (sq. ft.)
Occupancy
Level (%)
Actual
Completion
Date (1)(2)
Commerz I Oberoi Garden City, Goregaon (E), Mumbai
Completed 318,600(3) 261,274 82.13 March 2008
Commerz II – Phase
I
Oberoi Garden City, Goregaon (E),
Mumbai
Completed 725,769 344,860 47.52 December 2013
Commerz II – Phase II
Oberoi Garden City, Goregaon (E), Mumbai
Planned 2,298,000 - - -

108
Project Name(1) Development Site / Location Status Actual or
Estimated
Saleable
Area (sq.
ft.) (1)
Total Saleable
Area Sold/
Booked for Sale/
Leased (sq. ft.)
Occupancy
Level (%)
Actual
Completion
Date (1)(2)
Mulund Commercial Mulund - West, Mumbai Planned 140,345 - - -
Sangam City –
Commercial Sangam City, Sangamwadi, Pune
Planned 279,939(4) - - -
Sky City Extension Borivali, Mumbai Planned 1,046,047 - - -
Total 4,909,599 606,134
(1) Information provided in respect of our Ongoing and Planned projects is based on current management plans and subject to change. In general, we expect to begin construction on our Planned projects over the next three years.
(2) The completion date for our Completed projects is the date we received or expect to receive a full occupation certificate for each project.
(3) This excludes 100,900 square feet of Saleable Area occupied by us. (4) The land area and estimated Saleable Area reflects our 31.67% share in the joint venture.
Our Retail Projects
We currently have one Completed, two Ongoing and one Planned retail project, which we expect to provide a total Saleable
Area of approximately 3,412,101 square feet comprising 10.00% of the total estimated Saleable Area of our Completed,
Ongoing and Planned projects (excluding Completed projects that have been fully sold). For these projects, our focus is
on developing multi-tenanted shopping malls targeted towards premium brand retail outlets. In our retail malls, we aim to
establish a superior tenant profile, including established retailers and anchor tenants. The mix of retail outlets within our
malls is carefully planned based on the profile of the relevant catchment areas as well as our understanding of consumer
preferences, with the aim of attracting shoppers and ensuring an attractive mix of international, national and leading local
retailers.
We developed our Completed retail project, Oberoi Mall, on a lease model, whereby we have leased retail space to tenants
on either a fixed rental, variable (revenue-based) rental, fixed plus variable or fixed or variable (whichever is higher) basis.
We may, however, adopt a mixed sale/lease or total sale model in the future, or continue to follow the lease model for our
Ongoing and Planned retail projects, depending on prevailing market conditions.
Our retail projects, as of March 31, 2018, are summarised in the following table:
Project Name(1) Development Site / Location Status Actual or
Estimated
Saleable Area
(sq. ft.)(1)
Total Saleable
Area Sold/
Booked for Sale/
Leased (sq. ft.)
Occupancy
Level (%)
Actual
Completion
Date(1)(2)
Oberoi Mall Oberoi Garden City, Goregaon (E), Mumbai
Completed 552,893 549,397 99.37 March 2008
I-Ven Mall(3) Worli, Mumbai Ongoing 1,020,000(3) - - -
Sky City Mall Borivali, Mumbai Ongoing 1,559,270 - - -
Sangam City – Retail Sangam City, Sangamwadi, Pune Planned 279,939(4) - - -
Total 3,412,101 549,397
(1) Information provided in respect of our Ongoing and Planned projects is based on current management plans and subject to change. In general, we expect to begin construction on our Planned projects over the next three years.
(2) The completion date for our Completed projects is the date on which we received a full occupation certificate for each project.
(3) Our share in the project is 50.00% of the estimated Saleable Area. (4) The land area and estimated Saleable Area reflects our 31.67% share in the joint venture.
Our Hospitality Projects
We currently have one Completed, one Ongoing and three Planned hospitality projects, which we expect to provide a total
Saleable Area of approximately 2,838,047 square feet comprising 8.32% of the total Saleable Area of our Completed,
Ongoing and Planned projects (excluding Completed projects that have been fully sold). For these projects, our focus is
on developing hotels in the luxury and upmarket segments to form part of selected mixed-use developments.
We developed our Completed hospitality project, The Westin Mumbai - Garden City, on an operating agreement model,
whereby the hotel building (including fixtures and fittings) is owned by us and operated and managed by Starwood Asia
Pacific Hotels & Resorts Pte Ltd, a subsidiary of Marriott International, Inc. (collectively, “Marriott”), under the Westin
brand. We are developing our Ongoing hospitality project, The Ritz-Carlton Mumbai – Worli, Mumbai, on the same basis,
whereby the hotel building (including fixtures and fittings) is owned by us and operated and managed by Marriott, under
The Ritz-Carlton brand. We currently intend to adopt a similar business model for our Planned projects, although this may
change depending upon market conditions and our strategy from time to time.
Our hospitality projects, as of March 31, 2018, are summarised in the following table:
Project Name (1) Development Site / Location Status Actual or
Estimated
Saleable Area
(sq. ft.) (1)
Actual or
Estimated
Number of
Rooms(1)
Actual
Completion
Date (1)
The Westin Mumbai - Garden
City Oberoi Garden City, Goregaon (E), Mumbai
Completed 381,820 269 April 2010

109
The Ritz-Carlton Mumbai –
Worli, Mumbai(2) Oasis Realty, Worli, Mumbai
Ongoing 313,300 221 -
I-Ven Hotel(3) Worli, Mumbai Planned 680,000 400 -
Sky City Hotel Borivali, Mumbai Planned 173,140 250 -
Juhu Hotel(4) Juhu Hotel, Juhu, Mumbai Planned 1,289,787 - -
Total 2,838,047 1,140
(1) Information provided in respect of our Ongoing and Planned projects is based on current management plans and subject to change. In
general, we expect to begin construction on our Planned projects over the next three years. (2) The land area and estimated Saleable Area reflects the total land area and total estimated Saleable Area of the project. The project is being
developed by Oasis Realty, an unincorporated joint venture between our wholly-owned subsidiaries, OCL and Astir Realty LLP, and Skylark
Buildcon Private Limited and Shree Vrunda Enterprises. Pursuant to the joint venture arrangement, we are entitled to receive 50% of the net revenues generated by the project. Please see “—Our Real Estate Developments – Three Sixty West - Worli, Mumbai”.
(3) Our share in the project is 50.00% of the estimated Saleable Area.
(4) Our ability to develop the Juhu Hotel development site depends, among other things, upon us prevailing in the ongoing arbitration relating to our acquisition of the site. Please see the section entitled “Legal Proceedings” on page 190.The land area and estimated Saleable Area
reflects our 50% share in the joint venture and not the total land area and estimated Saleable Area of the development site.
Our Social Infrastructure Projects
We currently have one Completed, one Ongoing and two Planned social infrastructure projects, which we expect to provide
a total Saleable Area of approximately 1,866,627 square feet contributing 5.47% of total Saleable Area of our Completed,
Ongoing and Planned projects (excluding Completed projects that have been fully sold). These projects are developed
primarily to comply with land reservations within large land parcels in accordance with the Development Control
Regulations. Pursuant to these regulations, we may operate or lease such projects – for example, the Oberoi International
School, Goregaon, a co-educational private school – or, if required under the reservations as developable area earmarked
for the MCGM and we decide to develop the land, we hand over the development in exchange for TDRs or FSI benefits.
For example, we developed municipal staff quarters on a portion of the land in Oberoi Garden City and used the resulting
FSI benefits in the development of our Woods and Seven projects. We also developed a road on the Oberoi Garden City
development site, which we handed over to the MCGM in exchange for TDRs, which we sold to a third party. TDRs may
be used by us in the development of other projects within the same development or for certain other developments in
accordance with the provisions of the Development Control Regulations or may be transferred to a third party.
Our social infrastructure projects, as of March 31, 2018, are summarised in the following table:
Project Name (1) Development Site / Location Status Estimated Saleable
Area (sq. ft.)(1)
Actual or Estimated
Completion Date(1)
Oberoi International School, Goregaon Campus
Oberoi Garden City, Goregaon (E), Mumbai
Completed 305,309 June 2010
Oberoi International School, JVLR
Campus(2) Splendor, Andheri (E), Mumbai
Ongoing 319,707 -
Education Complex(3) Oberoi Garden City, Goregaon (E), Mumbai
Planned 866,130 -
Hospital(3) Oberoi Garden City, Goregaon (E),
Mumbai
Planned 375,481 -
Total 1,866,627
(1) Information provided in respect of our Ongoing and Planned projects is based on current management plans and subject to change. In general, we expect to begin construction on our Planned projects over the next three years.
(2) Part occupancy certificate received in August 2017.
(3) We currently plan to lease the land for the Education Complex and the Hospital for development and operation by third parties.
In addition to the Ongoing and Planned Social Infrastructure projects identified in the table above, our Oberoi Garden City
development site has non-developable land reservations for two recreation grounds measuring approximately 2.89 acres
and 1.51 acres, for a garden measuring approximately 2.09 acres and a playground measuring approximately 3.15 acres.
We may hand over all or a portion of the area earmarked for the recreation grounds and garden to the MCGM in exchange
for development rights that we currently intend to use in the development of residential and office space within Oberoi
Garden City. However, we may also use all or a portion of these development rights on another development or transfer
these development rights to a third party.
Our Real Estate Developments
Our Completed, Ongoing and Planned projects are spread across 15 development sites, primarily located in MMR. These
include four development sites developed by OCL before OCL became a wholly-owned subsidiary of our Company in
December 2006. In identifying potential development sites, we focus on a range of factors, including location, size,
potential end use, other developments in the surrounding area, demographics, infrastructure and quality of title.
The following map provides an illustration of the location of our Completed and Ongoing projects in MMR as of March
31, 2018.

110
Our Completed, Ongoing and Planned projects are located, or will be located, within the following developments:
(i) Oberoi Garden City, Goregaon, Mumbai;
(ii) Splendor, Andheri (E), Mumbai;
(iii) I-Ven, Worli, Mumbai;
(iv) Three Sixty West, Worli, Mumbai;
(v) Eternia and Enigma, Mulund (W), Mumbai
(vi) Sky City, Borivali, Mumbai;
(vii) Sangam City, Sangamwadi, Pune;
(viii) Juhu Hotel, Juhu, Mumbai;
(ix) Malabar Hill, Mumbai; and
(x) Tardeo, Mumbai
These developments comprise land owned by us, or lands in respect of which we have development rights or lands for
which for which joint development agreements have been entered into.
Certain of our development sites are subject to litigation. If we or the owners of such land or our joint development partners
do not succeed in such proceedings, we may lose our rights over such land. For details about our pending litigations, please
see the section entitled “Legal Proceedings” on page 190.
Recent land acquisitions
On September 22, 2017, we were selected as the successful bidder by GlaxoSmithKline Pharmaceuticals Limited for the
acquisition of approximately 60 acres of land located at Thane, Maharashtra, for a purchase price of ₹ 55,500 lakhs. The
closing of the transaction is subject to compliance and adherence with the terms and conditions of the bid, including receipt
of all statutory and regulatory approvals from relevant authorities and the execution of definitive agreements between us
and GlaxoSmithKline Pharmaceuticals Limited in connection with the transaction.
Oberoi Garden City – Goregaon, Mumbai
Our flagship mixed-use development is Oberoi Garden City, an integrated development on approximately 75.24 acres of
land in Goregaon (East), in the western suburbs of Mumbai, adjacent to the arterial Western Express Highway and
overlooking Aarey Milk Colony. The development is approximately ten kilometres from Mumbai’s domestic airport and
international airport.

111
The Oberoi Garden City integrated development currently comprises the following Completed, Ongoing and Planned
residential, office space, retail, hospitality and social infrastructure projects:
(1) We also developed a slum rehabilitation project on 0.71 acres of land within the Oberoi Garden City development site and obtained TDRs
which we sold.
Oberoi Garden City includes, or will include, among other projects: (i) Oberoi Mall, a retail complex covering
approximately 552,893 square feet of Saleable Area; (ii) a mixed-use commercial tower covering approximately 801,320
square feet of Saleable Area, which includes (a) Commerz I, consisting of approximately 318,600 square feet of Saleable
Area of office space (excluding 100,900 square feet of Saleable Area occupied by us), (b) The Westin Mumbai – Garden
City, a 269-room hotel operated and managed by Marriott, (c) Commerz II – Phase I, consisting of approximately 725,769
square feet of Saleable Area of office space and (d) Commerz II – Phase II, a Planned office space project, expected to
consist of approximately 2,298,000 square feet of Saleable Area of office space; (iii) Seven, a seven-unit luxury residential
gated community covering approximately 39,550 square feet of Saleable Area; (iv) Exquisite, a 802-unit residential
complex, covering approximately 1,547,610 square feet of Saleable Area; (v) Esquire, a 882-unit residential complex,
covering approximately 2,122,031 square feet of Saleable Area; (vi) Exquisite – III, a Planned residential project, expected
to consist of an approximately 1,546-unit residential complex covering approximately 4,587,500 square feet of Saleable
Area; and (vii) social infrastructure projects, including Oberoi International School, Goregaon, a hospital and an education
complex. We have also developed a slum rehabilitation project in accordance with a scheme approved by the SRA.
The status of each category of project within the Oberoi Garden City development as of March 31, 2018 is summarised in
the following table:
Status(1) Actual or Estimated Saleable Area (sq. ft.)
Residential Office Space Retail Hospitality Social
Infrastructure
Total
Completed Projects 4,364,185(2) 1,145,269(3) 552,893 381,820 305,309 6,749,476
Ongoing Projects - - - - - -
Planned Projects 4,587,500 2,298,000 - - 1,241,611 8,127,111
Total 8,951,685 3,443,269 552,893 381,820 1,546,920 14,876,587
(1) Information provided in respect of our Ongoing and Planned projects is based on current management plans and subject to change. In
general, we expect to begin construction on our Planned projects over the next three years. (2) Includes 938,990 square feet of unsold Saleable Area for Completed residential projects as of March 31, 2018.
(3) Includes 100,900 square feet of Saleable Area occupied by us.
The individual projects within the Oberoi Garden City development, and their status as of March 31, 2018, are summarised
in the following table and described in further detail below:
Project Name(1)(2) Project Type (1)(2) Status Actual or
Estimated
Saleable Area
(sq. ft.)(1)(2)
Actual or
Estimated
Total
Number of
Units(1)(5)
Total Saleable
Area Sold/
Booked for
Sale/ Leased
(sq. ft.)
Total
Number of
Units Sold
/ Booked
for Sale
Actual
Completion
Date(1)(2)(3)
Seven Residential Completed 39,550 7 33,900 6 June 2010
Exquisite Residential Completed 1,547,610 802 1,402,175 766 May 2015
Esquire Residential Completed 2,122,031 882 1,334,126 555 April 2018
Exquisite – III Residential Planned 4,587,500 1,546 - - -
Commerz I Office Space Completed 318,600(4) - 261,274 - March 2008
Commerz II – Phase I Office Space Completed 725,769 - 344,860 - December 2013
Oberoi Garden City
Residential
Completed
Ongoing
Projects
Planned
Projects
Woods(1)
Seven
Exquisite
Esquire
Exquisite III
Office Space
Commerz I
Commerz II
(Phase I)
Retail
Oberoi Mall
Hospitality
The Westin
Mumbai -
Garden City
Social
Hospital and
Education
Complex
Oberoi
International
School,
Goregaon
Commerz II
(Phase II)

112
Project Name(1)(2) Project Type (1)(2) Status Actual or
Estimated
Saleable Area
(sq. ft.)(1)(2)
Actual or
Estimated
Total
Number of
Units(1)(5)
Total Saleable
Area Sold/
Booked for
Sale/ Leased
(sq. ft.)
Total
Number of
Units Sold
/ Booked
for Sale
Actual
Completion
Date(1)(2)(3)
Commerz II – Phase II Office Space Planned 2,298,000 - - - -
Oberoi Mall Retail Completed 552,893 - 549,397 - March 2008
The Westin Mumbai -
Garden City
Hospitality Completed 381,820 - - - April 2010
Oberoi International School, Goregaon
Social Infrastructure Completed 305,309 - 305,309 - June 2010
Education Complex Social Infrastructure Planned 866,130 - - - -
Hospital Social Infrastructure Planned 375,481 - - - -
(1) Information provided in respect of our Ongoing and Planned projects is based on current management plans and subject to change. In
general, we expect to begin construction on our Planned projects over the next three years. (2) Excludes 654,994 square feet of Saleable Area for Completed projects that have been fully sold as of March 31, 2018.
(3) The completion date for our Completed projects is the date we received a full occupation certificate for each project.
(4) Excludes 100,900 square feet of Saleable Area occupied by us.
Completed Residential Projects
● Seven is a luxury residential gated community, with a total Saleable Area of approximately 39,550 square feet.
The facilities and amenities for each detached residence include a private garden area, swimming pool, basement
car parking, internal courtyard and provision for an internal elevator. The target market for this project is high
net worth individuals who are looking for detached residences within a gated community. The project was
completed in June 2010. Out of the seven units, six units have been sold as of March 31, 2018.
● Exquisite is a residential apartment complex, with a total Saleable Area of approximately 1,547,610 square feet.
The facilities and amenities include a gymnasium, squash courts, swimming pool, indoor and outdoor children’s
play area, jogging track and a multi-purpose hall. The target market for this project is the upper-middle income
segment. The project was completed in May 2015. Out of the 802 units, 766 units have been sold as of March
31, 2018. Exquisite was awarded the “Iconic Residential Project in Western Mumbai’ award at the Mid-Day Real
Estate Icons, 2016, as well as the “Acetech Special Recognition” Award for “Innovation in Design” at the Acetech
Alpha Awards, 2015.
● Esquire is a residential apartment complex, with a total Saleable Area of approximately 2,122,031 square feet.
The facilities and amenities include a gymnasium, squash courts, swimming pool, children’s play area, jogging
track, squash courts, tennis courts and a multi-purpose hall. The target market for this project is the upper-middle
income segment. The project was completed in April 2018. Out of the 882 units, 555 units have been sold as of
March 31, 2018. Esquire won the Quality of Life Category award at the Trends Realty Titans awards presented
by Economic Times in Fiscal 2016.
Planned Residential Projects
● Exquisite - III is a Planned residential apartment complex, with an estimated total Saleable Area of approximately
4,587,500 square feet.
Completed Office Space Projects
● Commerz I is a mixed-use building consisting of approximately 801,320 square feet of Saleable Area consisting
of an office space component and a hospitality component. Office space occupies approximately 318,600 square
feet or approximately 75.95% of the total Saleable Area (excluding 100,900 square feet of Saleable Area occupied
by us). The target market is corporations seeking office space for front-office operations. The project was
completed in March 2008. Of the approximately 318,600 square feet of Saleable Area available for lease, 261,274
square feet of Saleable Area was leased as of March 31, 2018, implying an Occupancy Level of approximately
82.13%.
● Commerz II is the initial phase of an office space development to be completed in two phases, comprising two
towers, totalling approximately 3,023,769 square feet (725,769 square feet in Phase I and 2,298,000 square feet
in Phase II) of Saleable Area. The target market is corporate clients looking for large format office space for
lease.
Commerz II – Phase I was completed in December 2013. Of the approximately 725,769 square feet of Saleable
Area available for lease, 344,860 square feet of Saleable Area was leased as of March 31, 2018, implying an
Occupancy Level of approximately 47.52%.
We operate Commerz I and Commerz II – Phase I on a lease model, whereby we generally lease our office space
on a “bare shell” basis, with internal fittings to be installed by the tenant. All of the leased office space is leased
on terms of five to nine years, with a lock-in period generally of three to five years, after which the lease may be
terminated upon three to nine months written notice. In addition to rent, in most cases, tenants are required to pay

113
a common area maintenance charge and property taxes. We require a security deposit of seven to 12 months’ rent
in respect of each of our leased office space premises. Our current tenants include head offices of leading
multinational and domestic companies. Commerz II has received the Health and Safety in High-Rise Award at
the High-Rise India Summit and Awards, 2018, the “Commercial project of the year” award from the
Accommodation Times and the “Commercial project of the year” award at the Real Estate and Infrastructure
Awards presented by DNA.
Planned Office Space Projects
● Commerz II – Phase II is the second phase of the Commerz II office space development. Commerz II – Phase
II is expected to consist of approximately 2,298,000 square feet of Saleable Area.
Completed Retail Projects
● Oberoi Mall opened on April 15, 2008 with approximately 552,893 square feet of Saleable Area. It is owned by
a special purpose vehicle, Oberoi Mall Private Limited, which is a wholly-owned subsidiary of our Company.
The facilities include two levels of basement parking with capacity for approximately 1,000 cars, a large central
atrium with natural light, elevators and escalators for internal circulation, central air-conditioning and an
integrated building management system. The target tenants include premium brand retail outlets. Of the
approximately 552,893 square feet of leasable retail space, 549,397 square feet has been leased, as of March 31,
2018, implying an Occupancy Level of 99.37%.
We lease retail space to our anchor tenants on lease terms of five to ten years, with a lock-in period of five to
seven years, during which the tenant does not have a right to terminate the lease. After the lock-in period, the
lease may be terminated upon six months written notice, where applicable. For our non-anchor tenants, lease
terms range from one to nine years, with a lock-in period of one to five years, after which the lease may be
terminated upon three to six months written notice. We utilise a range of rental models, including fixed rental,
variable (revenue-based) rental, fixed plus variable or fixed or variable (whichever is higher) bases. In addition
to rent, in most cases, tenants are required to pay a common area maintenance charge, property taxes and fees for
advertisements and signage. In some cases, property taxes and some of these additional components are included
within the rental amount. In addition, our tenants are required to pay a security deposit of six to 24 months’ rent.
Oberoi Mall has received several awards and accolades, including being recognized as the “Most admired
shopping centre of the year-marketing and promotions (West)” at the IMAGES Shopping Centre Awards 2016,
the “Shopping center of the year” award at the Golden Globe Tiger Awards 2016-Kuala Lumpur and the
“Shopping centre of the year award Metro (West) 2016” at the National Awards for Excellence, 2016.
Additionally, Oberoi Mall was the recipient of the “Most admired green shopping centre of the year” award at
the Images Shopping Centre Awards, 2015 and the runners-up award for “Ecological sustainability” at the
Infrastructure, Faculty, Human Resources and Realty Association Awards 2017-18.
Completed Hospitality Projects
● The Westin Mumbai - Garden City is a 269-room hotel operated and managed by Marriott under the Westin
brand. The hotel occupies approximately 381,820 square feet of Saleable Area within a mixed-use tower also
occupied by the Commerz I office space project. The hotel commenced operations on May 1, 2010.
The hotel is owned by us and operated pursuant to an Operating Services Agreement between ORL and Starwood
Asia Pacific Hotels & Resorts Pte Ltd, a subsidiary of Marriott, dated January 2, 2008, and related agreements,
including a System License Agreement, a Centralized Services Agreement and a Development Consulting
Services Agreement. The initial term of the Operating Services Agreement is 20 years, renewable by mutual
consent for up to two additional terms of five years each. The System License Agreement provides for the use by
us of the Westin trademarks, in accordance with the terms of such agreement, the operating system for the hotel
and technical assistance from Westin Hotel Management, L.P., a subsidiary of Marriott. The Centralized Services
Agreement provides for the use of the reservations, sales and marketing and guest loyalty programmes established
by Westin, in accordance with the terms of such agreement and the Development Consulting Services Agreement
provides for consultancy advice from Westin Hotel Management L.P. to us, our architects, engineers, designers
and consultants with respect to the design, decorating and furnishing of the hotel, in accordance with the terms
of such agreement.
Pursuant to the Operating Services Agreement and related agreements, Marriott operates and manages the hotel
on our behalf and we pay Marriott a fee for its services. Marriott’s fees are calculated, in part, based on the
revenue of the hotel and, in part, based on the adjusted gross operating profit of the hotel. Marriott is also entitled
to certain reimbursements.
The average Occupancy Level of the hotel for the year ended March 31, 2018 was 80.78%.

114
Completed Social Infrastructure Projects
● Oberoi International School, Goregaon is a school comprising approximately 305,309 square feet of Saleable
Area. The school was established in August 2008.
The Oberoi International School building is owned by our Company and leased to and operated by Oberoi
Foundation, a public charitable trust, pursuant to a leave and licence agreement dated March 23, 2018. The leave
and license agreement is for a period of 60 months beginning April 1, 2018 and provides for a license fee of ₹
245 lakhs per month for the first thirty six months and ₹ 280 lakhs per month for the next twenty four months.
Planned Social Infrastructure Projects
● Hospital Project. Oberoi Garden City has a land reservation measuring approximately 1.25 acres within the
development site for construction of a hospital, with an estimated Saleable Area of approximately 375,481 square
feet. We currently plan to lease the land for development and operation by third parties.
● Education Complex. Oberoi Garden City also has a land reservation measuring approximately 3.63 acres within
the development site for construction of an education complex with an estimated Saleable Area of approximately
866,130 square feet. We currently plan to lease the land for development and operation by third parties.
Splendor – Andheri (E), Mumbai
Splendor is a mixed-use development, comprising residential and social infrastructure projects, on approximately 21.50
acres of land in Andheri in the western suburbs of Mumbai. The development is conveniently located near the arterial
Western Express Highway and overlooks Aarey Milk Colony, a no-development green zone. This development site is
being developed by our wholly-owned subsidiary, OCL.
The status of each category of project within the Splendor development as of March 31, 2018 is summarised in the
following table:
Status Estimated Saleable Area (sq. ft.)(1)
Residential Office Space Social Infrastructure Total
Completed Projects(2) 1,564,892 - - 1,564,892
Ongoing Projects 644,856 - 319,707 964,563
Planned Projects - - - -
Total 2,209,748 - 319,707 2,529,455
(1) Information provided in respect of our Ongoing and Planned projects is based on current management plans and subject to change. In
general, we expect to begin construction on our Planned projects over the next three years.
(2) Fully sold as of March 31, 2018.
The individual projects within the Splendor development, and their status as of March 31, 2018, are summarised in the
following table and described in further detail below:
Project Name(1)(2) Project Type(1) Status Estimated
Saleable Area
(sq. ft.)(1)
Estimated
Total
Number of
Units(1)
Total Saleable
Area Sold/ Booked
for Sale/ Leased
(sq. ft.)
Total Number
of Units Sold /
Booked for
Sale
Actual or
Estimated
Completion
Date(1)(3)
Prisma Residential Ongoing 268,750 91 209,011 70 June 2018
Maxima(4) Residential Ongoing 376,106 166 - - -
Oberoi International
School, JVLR Campus(5)
Social
Infrastructure
Ongoing 319,707 - - - -
(1) Information provided in respect of our Ongoing and Planned projects is based on current management plans and subject to change. In general, we expect to begin construction on our Planned projects over the next three years.
(2) Excludes 1,564,892 square feet of Saleable Area for Completed residential projects that have been fully sold as of March 31, 2018.
(3) The estimated completion date for our Ongoing projects is the estimated completion date per RERA registration. (4) Sales have not commenced for Maxima; therefore, the project has not yet been registered under RERA.
(5) Part Occupancy Certificate received on August 5, 2017.
Ongoing Residential Projects
● Prisma is an Ongoing residential apartment complex, comprising one 31 storey tower, totalling approximately
91 units, with an estimated total Saleable Area of approximately 268,750 square feet. The facilities and amenities
are expected to include an entrance lobby with high ceiling, gymnasium and swimming pool. The target market
for this project is the upper-middle income segment. Out of the 91 units, 70 units have been sold as of March 31,
2018. Of the approximately 268,750 square feet of Saleable Area, approximately 209,011 square feet was booked
for sale as of March 31, 2018.
● Maxima is an Ongoing residential apartment complex, comprising one 36 storey tower, totalling approximately
166 units, with an estimated total Saleable Area of approximately 376,106 square feet. The facilities and amenities
are expected to include a clubhouse, gymnasium, swimming pool and children’s play area. The target market for
this project is the upper-middle income segment.

115
Ongoing Social Infrastructure Projects
● Oberoi International School, JVLR Campus. The Splendor complex has a land reservation measuring
approximately 1.61 acres within the development site for construction of a school, with an estimated Saleable
Area of approximately 319,707 square feet. We currently plan to lease the land for development and operation of
the school by Oberoi Foundation. The Splendor complex also has land reservations for a recreation ground and a
road set back measuring approximately 2.79 acres. We have already handed over the area earmarked for such
developments to the MCGM in exchange for land development rights that we currently intend to use in the
development of residential projects within the Splendor complex.
The Oberoi International School, JVLR Campus building is owned by our Company, for which a part Occupancy
Certificate was received on August 5, 2017, and is leased by us to Oberoi Foundation, a public charitable trust,
pursuant to a leave and licence agreement dated March 23, 2018. Currently, we receive a license fee of ₹ 86 lakhs
per month for the area for which we have received a part Occupancy Certificate, which will increase to ₹ 187
lakhs per month once we receive a full Occupancy Certificate.
Three Sixty West - Worli, Mumbai
Three Sixty West is a mixed-use development of approximately 26 lakhs square feet of Saleable Area in Worli, located
on the arterial Annie Besant Road. Three Sixty West is being developed by Oasis Realty, an unincorporated joint venture
between our wholly-owned subsidiaries, OCL and Astir Realty LLP, on the one hand, and Skylark Buildcon Private
Limited and Shree Vrunda Enterprises, on the other hand.
As joint venture partners, OCL and Astir Realty LLP are responsible for developing the free-sale portion arising from the
slum redevelopment project being undertaken on the property. The rehabilitation component of the slum redevelopment
project is the responsibility of the other joint venture partners, Skylark Buildcon Private Limited and Shree Vrunda
Enterprises.
The individual projects within the Three Sixty West development, and their status as of March 31, 2018, are summarised
in the following table and described in further detail below:
Project Name(1) Project Type Status Estimated
Saleable Area
(sq. ft.)(1)
Estimated
Total
Number of
Units(1)
Total Saleable
Area Sold/
Booked for
Sale/ Leased
(sq. ft.)
Total Number
of Units Sold /
Booked for
Sale
Actual or
Estimated
Completion
Date(1)
Three Sixty West Residential Ongoing 2,282,346 200 442,269 47 December 2020(2)
The Ritz-Carlton Mumbai – Worli, Mumbai
Hospitality Ongoing 313,300 - - - -
(1) Information provided in respect of our Ongoing and Planned projects is based on current management plans and subject to change. In
general, we expect to begin construction on our Planned projects over the next three years. (2) The estimated completion date for our Ongoing projects is the estimated completion date per RERA registration.
The transaction structure envisages that we would be entitled to a percentage of the net revenues (calculated as gross
revenues from property sales less construction costs) of the joint venture. For the residential development, our share of the
net revenues is calculated based on the sale price per square foot according to a graded scale, pursuant to which we would
receive 25% to 40% of net revenues depending upon the sale price per square foot of each premises. For the hospitality
component, we would receive a 50% share of net revenues.
The project is expected to consist of two high-rise towers: (i) a mixed-use tower consisting of The Ritz-Carlton Mumbai
– Worli, Mumbai, to be operated and managed by Marriott, with approximately 221 rooms, and residential units that are
part of the Three Sixty West residential complex and (ii) Three Sixty West, a residential tower to be managed by The Ritz-
Carlton, which together with the residential units in the mixed-use tower, forms our 200-unit Three Sixty West residential
complex. The residential units of both the Towers are managed by The Ritz-Carlton, in terms of the residential operating
agreement. Strategically located in Worli, less than a kilometer from the prominent Bandra-Worli sea link, the
development has been designed to be a luxury landmark adorning the Arabian Sea.
Terms of the residential operating agreement:
Please see below the extract of Exhibit D of the residential operating agreement dated April 18, 2014 (the “Residential
Operating Agreement”). Kindly note that Exhibit D of the Residential Operating Agreement does not relate to
offering of debt or equity capital by our Company (being, Oberoi Realty Limited) and this Placement Document
does not relate to any public or any other offering of equity interest by any of the Developers (as defined under
the Residential Operating Agreement). All capitalised terms used in this section entitled “– Terms of the residential
operating agreement” shall have the meaning ascribed to it in the Residential Operating Agreement.
Public Offering Statements
All capitalized terms used under this section of the Public Offering Statement shall have the same meaning as ascribed to
them under the Residential Operating Agreement dated April 18, 2014 entered into between the Developer and Marriott

116
Hotels India Private Limited (“Residential Operating Agreement”). A copy of the Residential Operating Agreement is
available for inspection at the office of the Developer and shall be available at the office of both the Residential Association
and the Developer after the formation of the Residential Association.
The Developer has entered into the Residential Operating Agreement entered into with Marriott to manage the Residential
Project by providing services including, among other things, the following services for the Residential Project, all of
which may be modified by Marriott from time to time in accordance with the terms of the Residential Operating
Agreement), including, (i) concierge services: such as means doorman and front desk/concierge services; day porter;
arranging for services of seamstress, laundry, dry cleaning, transportation; business center services; and (ii) Valet Parking
Service: Marriott shall provide valet parking services for Unit Owners who own or lease parking spaces in the Residential
Project. Unit Owners who own or lease garage spaces shall be assessed a valet parking fee to cover the cost of the valet
parking services. It is understood that any maintenance and repair costs for the parking shall be a Common Expense; (iii)
Additional Services: Marriott shall make available to each Unit Owner for individual Units upon request certain additional
services for which a separate price list shall be established, such as housekeeping services, and maintenance and repair
services for individual Units (collectively, Additional Services); and (iv) Supplemental services while Marriott is operator
of The Ritz-Carlton Mumbai – Worli, Mumbai: Marriott may, for so long as Marriott is operator of The Ritz-Carlton
Mumbai – Worli, Mumbai, and subject to our consent and execution of a services agreement between The Ritz-Carlton
Mumbai – Worli and each Unit Owner, Marriott shall provide to the Unit Owners:
(i) direct billing privileges at The Ritz-Carlton Mumbai – Worli (provided that prior to any Unit Owner receiving such
privileges, such Unit Owner shall provide The Ritz-Carlton Mumbai – Worli with such credit and billing information as
shall be requested by The Ritz-Carlton Mumbai – Worli); and (ii) room service if and only if, in Marriott’s sole discretion,
Marriott determines that it is able to do so in accordance with the RITZ-CARLTON Standards, given, among other things,
the physical layout and connections between the The Ritz-Carlton Mumbai – Worli and the condominium (it being
understood and agreed that each Unit Owner will pay Marriott, as operator of The Ritz- Carlton Mumbai – Worli, directly
for any room service costs and expenses incurred by such Unit Owner).
The Ritz-Carlton Mumbai – Worli’s general manager, director of finance, director of human resources, and director of
engineering (collectively, the “Key Positions”) will be shared with the Residential Project. Accordingly, the Residential
Association will pay The Ritz-Carlton Mumbai – Worli, 15% of the total compensation expenses incurred by The Ritz-
Carlton Mumbai – Worli for the Key Positions (excluding any portion of any bonus payment that is solely attributable to
the performance of the The Ritz-Carlton Mumbai – Worli). Additionally, the Residential Association will pay The Ritz-
Carlton Mumbai – Worli for an allocated portion of The Ritz-Carlton Mumbai – Worli’s "administrative and general"
expenses (approximately a minimum of `30,00,000 per year, subject to adjustment for any increase in the Inflation Index
each year.
The Units are being sold by us and not by Marriott and Marriott is not part of or an assignee or an agent for us and has not
acted as broker, finder or agent in connection with the sale of the Units. Marriott shall not under any circumstances be
construed or treated as the ‘Promoter’ of the Residential Project or an ‘assignee of the Promoter’ for the purposes of
Maharashtra Ownership of Flats (Regulation of the Promotion of Construction, Sale, Management and Transfer) Act, 1963
(MOFA, as may be amended/extended from time to time and includes any act/statute enacted to replace or substitute
MOFA). Marriott has not confirmed the accuracy of any marketing or sales materials provided by us. A prospective
purchaser, by executing a sale and a purchase agreement for a Unit shall agree that the prospective purchaser shall have
no right to use or interest in the Ritz-Carlton Marks and shall waive and release Marriott from and against any liability
with respect to any representations or defects or any other claim whatsoever relating to the marketing to the prospective
purchaser and prospective purchaser acknowledges that in the event the Residential Operating Agreement expires or is
terminated for any reason, all services to be provided by Marriott to the Residential Project shall cease.
The Residential Association shall be obligated to pay Marriott in consideration of Marriott providing the services under
the Residential Operating Agreement, an Operating Fee as follows:
(i) for the first three years from Opening Date, an amount equal to `1,00,000 per Fiscal Year on each Sold Unit, subject
to a minimum of an amount equal to `1,00,000 per Unit on at least 50% of the Total Units per Fiscal Year. If the number
of Sold Units at any time prior to the expiry of three years from Opening Date, exceeds 50% of the Total Units, then
Operating Fee of `1,00,000 per Unit will be charged on all Sold Units for such Fiscal Year. It is further clarified that if
the number of Sold Units at any time prior to the expiry of three years from Opening Date is less than 50% of the Total
Units, in such event we shall pay (and may collect such amounts from Unit Owners) `1,00,000 per Unit per Fiscal Year
on the Sold Units and we shall pay `100,000 per Unit per Fiscal Year on the difference between (a) 50% of the Total Units
and (b) the Sold Units. For example, if the Total Units are 100 and Sold Units are 40, then we shall be liable to pay
`1,00,000 per Unit on 10 Units; the result being the difference of (a) 50% of 100 Units, i.e. 50 Units and (b) 40 (being the
number of Sold Units). (ii) for the period starting on the expiry of the third year from Opening Date until the expiration of
the Term or the termination of the Residential Operating Agreement whichever is earlier, an amount equal to `1,00,000
per Unit per Fiscal Year on each Unit (whether sold or unsold). The Operating Fee shall be subject to adjustment for any
increase in the Inflation Index each year subject to a maximum increase of 5% each year. The Operating Fee shall be pro-
rated and paid monthly in Indian Rupees, in advance, on or before the start of each calendar month of a calendar year. The
first payment of the Operating Fee under the Residential Operating Agreement shall be due and owing and shall be paid

117
to Marriott on the Opening Date; if the Opening Date is on a date other than the first day of a calendar month, then the
amount of this first payment shall be pro-rated to reflect payment for less than a full calendar month. All costs and expenses
incurred by Marriott in providing the Services shall be paid to Marriott by the Residential Association no later than the
tenth day of the month following the month in which such costs and expenses were incurred.
Marriott is dependent on The Ritz-Carlton Mumbai – Worli to provide the Services and on or before the Opening Date
and the Residential Association, us and Marriott shall enter into a cost sharing arrangement with respect to shared
infrastructure and shared services between the The Ritz-Carlton Mumbai – Worli, Mumbai and Residential Project, in
such form and manner acceptable to the parties thereto.
Marriott shall not be responsible for any deficiency in our title to the Site. Marriott will not be liable for defects of design
and/or construction, any deficiency in the standard of raw materials used, and, in general, for any difference between what
we promise to Unit Owners and what is ultimately delivered to Unit Owners. In the event the Residential Operating
Agreement between us (or the Residential Association upon novation of the Residential Operating Agreement to the
Residential Association) and Marriott is terminated for any reason in accordance with the terms of the Residential
Operating Agreement, all services to be provided by Marriott to the Residential Project, Mumbai shall cease.
In respect of the use of Permitted Statements and/or RITZ-CARLTON Marks, Unit Owners. Residential Association and
we recognize that we have no rights or interest whatsoever in any of the RITZ-CARLTON Marks and we have no rights
to use, or attempt to register or assert claims of any kinds with regard to the Permitted Statements or the RITZ-CARLTON
Marks. Further, Unit Owners. Residential Association and we have irrevocably and unconditionally waived our right to
claim or receive any damages, including consequential, incidental, special, or punitive damages, arising out of, pertaining
to or in any way associated with the cessation of the use of the RITZ-CARLTON Marks at or in connection with
Residential Project upon the expiration or termination of the Residential Operating Agreement in accordance with the
Residential Operating Agreement.
Further, Marriott is dependent on our resources and The Ritz-Carlton Mumbai – Worli to provide the Additional Services
or Supplemental Services and if we or The Ritz-Carlton Mumbai – Worli do not provide resources then Operator will not
be in a position to render the additional services or supplemental services and such termination of additional services or
supplemental services shall not be a default or shall not result in any liability to Marriott.
Ongoing Residential Projects
● Three Sixty West is an Ongoing residential apartment complex, comprising two towers (including one tower that
will also house The Ritz-Carlton Mumbai – Worli, Mumbai), totalling approximately 200 units, with an estimated
total Saleable Area of approximately 2,282,346 square feet. The project was launched in January 2010. Out of
the 200 units, 47 units have been sold as of March 31, 2018. Of the approximately 2,282,346 square feet of
Saleable Area, approximately 442,269 square feet was booked for sale as of March 31, 2018. Three Sixty West
will be managed by The Ritz-Carlton. For further details, please see the section entitled “ – Terms of the
residential operating agreement” on page 115.
Ongoing Hospitality Projects
● The Ritz-Carlton Mumbai – Worli, Mumbai is a hotel that we are currently developing. Upon completion, the
hotel will be operated and managed by Marriott. The hotel occupies approximately 313,300 square feet of
Saleable Area. The hotel is expected to be completed in September 2019.
The hotel is owned by us and operated in accordance with an Operating Agreement between us and Marriott
Hotels India Private Limited, a subsidiary of Marriott, dated April 18, 2014, and related agreements, including a
Technical Services Agreement, a License and Royalty Agreement, an International Marketing Program
Participation Agreement, and an Electronic Technology and Services Agreement. The initial term of the
Operating Agreement is 25 years, renewable by mutual consent. The License and Royalty Agreement provides
for the use by us of The Ritz-Carlton trademarks, in accordance with the terms of such agreement, while the
International Marketing Program Participation Agreement provides for international marketing, advertising,
promotions and sales through Global Hospitality Licensing S.à r.l., a subsidiary of Marriott, in accordance with
the terms of such agreement. The Electronic Technology and Services Agreement provides for our use of
technical assistance from Renaissance Services B.V., a subsidiary of Marriott, which includes the use of the
reservations system and guest loyalty programs set up by Marriott and its affiliates, in accordance with the terms
of such agreement.
Pursuant to the Operating Agreement and related agreements, Marriott operates and manages the hotel on our
behalf. Marriott’s fees are calculated based on the gross revenue of the hotel. In addition, pursuant to the License
and Royalty Agreement, we must pay Global Hospitality Licensing S.à r.l. a base royalty fee calculated based on
the gross revenue of the hotel, and an additional royalty fee calculated based on the available operating profit of
the hotel.

118
Eternia and Enigma – Mulund, Mumbai
We are developing two residential complexes on two non-contiguous pieces of land aggregating to approximately 18.26
acres of land in Mulund in the central suburbs of Mumbai. The development is located on LBS Marg, a key road in the
central suburbs, and overlooks Yeoor Hills and Borivali National Park. This development is our first in the eastern suburbs
of Mumbai.
The status of each category of project within this development as of March 31, 2018 is summarised in the following table:
Status Estimated Saleable Area (sq. ft.)(1)
Residential Office Space Social Infrastructure Total
Completed Projects - - - -
Ongoing Projects 4,137,000 - - 4,137,000
Planned Projects - 140,345 - 140,345
Total 4,137,000 140,345 - 4,277,345
(1) Information provided in respect of our Ongoing and Planned projects is based on current management plans and subject to change. In
general, we expect to begin construction on our Planned projects over the next three years.
The development comprises two Ongoing residential projects and one Planned office space project, the details of which,
and their status as of March 31, 2018, are summarised in the following table, and described in further detail below:
Project Name(1) Project
Type(1)
Status Estimated
Saleable Area
(sq. ft.) (1)
Estimated
Total Number
of Units(1)
Total Saleable
Area Sold/
Booked for Sale/
Leased (sq. ft.)
Total Number of
Units Sold / Booked
for Sale
Estimated
Completion Date(1)
Eternia Residential Ongoing 2,148,000 1,293 509,810 317 December 2021(2)
Enigma Residential Ongoing 1,989,000 671 354,195 135 December 2021(2)
Mulund Commercial Office Space Planned 140,345 - - - -
(1) Information provided in respect of our Ongoing and Planned projects is based on current management plans and subject to change. In general, we expect to begin construction on our Planned projects over the next three years.
(2) The estimated completion date for our Ongoing projects is the estimated completion date per RERA registration.
Ongoing Residential Projects
● Eternia is an Ongoing residential development project located in Mulund, comprising four 65 storey towers,
totalling 1,293 units, with an estimated total Saleable Area of approximately 2,148,000 square feet. The facilities
and amenities will include a gymnasium, squash courts, swimming pool, children’s play area and a jogging track.
The target market for this project is the upper-middle income segment. The project was launched in January 2015
and 317 units have been booked for sale as of March 31, 2018. Of the approximately 2,148,000 square feet of
Saleable Area, approximately 509,810 square feet was booked for sale as of March 31, 2018.
● Enigma is an Ongoing residential development project located in Mulund, comprising two 67 storey towers,
totalling 671 units, with an estimated total Saleable Area of approximately 1,989,000 square feet. The facilities
and amenities will include a gymnasium, squash courts, skating rink, swimming pool, children’s play area and a
jogging track. The target market for this project is the upper middle income segment. The project was launched
in January 2015 and 135 units have been booked for sale as of March 31, 2018. Of the approximately 1,989,000
square feet of Saleable Area, approximately 354,195 square feet was booked for sale as of March 31, 2018.
Planned Office Space Projects
● Mulund Commercial. We propose to develop a commercial space building in the development. The proposed
total Saleable Area for the project is approximately 140,345 square feet.
Sky City – Borivali (East), Mumbai
Sky City is a mixed-use development on approximately 25 acres of land in Borivali (East), in the western suburbs of
Mumbai, located off Western Express Highway overlooking Borivali National Park. In addition, we have entered into a
Development Agreement with Abhedya S.R.A. Sahakari Gruhnirman Sanstha for the redevelopment of an additional area
of approximately 7.48 acres of land. Sky City was adjudged the “Residential Property of the Year” at the Realty Plus
Excellence Awards, 2016.
Sky City includes, or will include, among other projects: (i) Sky City I, five 61-storey residential complex, covering
approximately 2,885,000 square feet of Saleable Area; (ii) Sky City II, a residential complex, covering approximately
1,708,000 square feet of Saleable Area; (iii) Sky City Mall, a retail complex covering approximately 1,559,270 square feet
of Saleable Area; (iv) a hotel covering approximately 173,140 square feet of Saleable Area, to be operated and managed
by a third party; and (v) Sky City Extension, an office space project with approximately 1,046,047 square feet of Saleable
Area.

119
The status of each category of project within the Sky City development as of March 31, 2018 is summarised in the
following table:
Status(1) Actual or Estimated Saleable Area (sq. ft.)
Residential Office Space Retail Hospitality Social
Infrastructure
Total
Completed Projects - - - - - -
Ongoing Projects 2,885,000 - 1,559,270 - - 4,444,270
Planned Projects 1,708,000 1,046,047 - 173,140 - 2,927,187
Total 4,593,000 1,046,047 1,559,270 173,140 - 7,371,457
(1) Information provided in respect of our Ongoing and Planned projects is based on current management plans and subject to change. In
general, we expect to begin construction on our Planned projects over the next three years.
The individual projects within the Sky City development, and their status as of March 31, 2018, are summarised in the
following table and described in further detail below:
Project Name(1) Project Type (1)
Status Actual or
Estimated
Saleable
Area (sq. ft.) (1)
Actual or Estimate d
Total Number of Units(1)
Total Saleable
Area Sold/
Booked for Sale/
Leased (sq. ft.)
Total
Number of
Units Sold /
Booked for
Sale
Estimated
Completion Date(1)
Sky City I Residential Ongoing 2,885,000 1,835 1,337,327 901 December 2022(2)
Sky City II Residential Planned 1,708,000 1,131 - - -
Sky City Mall Retail Ongoing 1,559,270 - - - March 2021
Sky City Hotel Hospitality Planned 173,140 - - - -
Sky City Extension(3) Office Space Planned 1,046,047 - - - -
(1) Information provided in respect of our Ongoing and Planned projects is based on current management plans and subject to change. In
general, we expect to begin construction on our Planned projects over the next three years. (2) The estimated completion date for our Ongoing projects is the estimated completion date per RERA registration.
(3) We have entered into a Development Agreement with Abhedya S.R.A. Sahakari Gruhnirman Sanstha for the redevelopment of this area of
land. The transaction is in progress.
Ongoing Residential Projects
● Sky City I is an Ongoing residential apartment complex, comprising five 61-storey towers, totalling
approximately 1,835 units, with an estimated total Saleable Area of approximately 2,885,000 square feet. The
facilities and amenities will include a gymnasium, squash court, swimming pool, children’s play area, jogging
track, cricket net, rock climbing and a multi-purpose hall. The target market for this project is the upper-middle
income segment. The project was launched in January 2015 and 901 units have been booked for sale as of March
31, 2018. Of the approximately 2,885,000 square feet of Saleable Area, approximately 1,337,327 square feet was
booked for sale as of March 31, 2018.
Planned Residential Projects
● Sky City II is a Planned residential apartment complex, expected to comprise three 61-storey towers, totalling
approximately 1,131 units, with an estimated total Saleable Area of approximately 1,708,000 square feet.
Ongoing Retail Projects
● Sky City Mall is an Ongoing retail facility with an estimated total Saleable Area of approximately 1,559,270
square feet of Leasable Area. We expect to complete the project by March 2021.
Planned Hospitality Projects
● Sky City Hotel is a Planned project expected to consist of 250 to 300 rooms. The project will be managed by a
third party operator which is yet to be appointed.
Planned Office Space Projects
● Sky City Extension is a Planned office space project with approximately 1,046,047 square feet of saleable area.
Sangam City – Sangamwadi, Pune
We hold a 31.67% interest in Sangam City Township, a special purpose vehicle established to acquire land development
rights in respect of, and to develop, a mixed-use development project located on a total of approximately 56 acres of land
located in Sangamwadi, Pune. The land development rights are subject to the procurement by us of certain regulatory
approvals to convert the designated use of the land from agricultural use to non-agricultural use. Please see the section
entitled “Risk Factors – The development rights in respect of our Planned project at Sangam City, Sangamwadi are subject
to certain conditions, certain of which have not been or may not be satisfied; if these conditions are not satisfied, this land
may not be available for development by us” on page 45.

120
The consideration for the land development rights comprises cash and constructed Saleable Area. A portion of the cash
consideration has been paid to the land owners and the remaining portion of the consideration is being held in escrow and
will be released to the land owners when a non-agricultural use certificate is obtained for such land.
Project Name(1)
Project Type Status Actual or Estimated Saleable Area (sq. ft.)
Sangam City Residential Planned 773,951(2)
Sangam City Office Space Planned 279,939(2)
Sangam City Retail Planned 279,939(2)
(1) Information provided in respect of our Ongoing and Planned projects is based on current management plans and subject to change. In general, we expect to begin construction on our Planned projects over the next three years.
(2) The estimated Saleable Area reflects our 31.67% share in the joint venture.
Juhu Hotel – Juhu, Mumbai
We hold a 50% interest in SRPL, a joint venture among our wholly-owned subsidiary, OCL, Aseela Vinod Goenka,
Shabana Shahid Balwa, Neelkamal Realtors & Builders Private Limited, Marine Drive Hospitality & Realty Private
Limited, BD & P Hotels (India) Private Limited, Y J Realty and Aviation Private Limited and KG Enterprises (Vinod
Goenka and Sunita Bali). Siddhivinayak Realties has entered into an agreement for the acquisition of certain assets and
properties of Tulip Hospitality Services Limited consisting of a beachfront property formerly known as “Centaur Hotel”,
which we refer to as “Juhu Hotel”. The total plot area is approximately 6.10 acres and the total estimated Saleable Area
of the property is approximately 2,579,573 square feet. The estimated Saleable Area reflecting our 50% share in the joint
venture is approximately 1,289,787 square feet.
We intend to develop this property into a hotel. However, the completion of the acquisition is subject to the resolution of
arbitration proceedings commenced in 2005 and related court proceedings. Please see the section entitled “Legal
Proceedings” on page 190.
Project Name(1)
Project Type Status Actual or Estimated Saleable Area (sq. ft.)
Juhu Hotel(2)
Hospitality Planned 1,289,787
(1) Information provided in respect of our Ongoing and Planned projects is based on current management plans and subject to change. (2) Our ability to develop the Juhu Hotel development site depends, among other things, upon us prevailing in the ongoing arbitration relating
to our acquisition of the site. Please see the section entitled “Legal Proceedings” on page 190. The estimated Saleable Area reflects our 50%
share in the joint venture and not the estimated Saleable Area of the development site.
Malabar Hill Project – Malabar Hill, Mumbai
Malabar Hill Project is a residential development on approximately 0.13 acres of land at Malabar Hill in Mumbai.
The Malabar Hill Project development comprises a single Planned residential project, the details of which, as of March
31, 2018, are summarised in the following table, and described in further detail below:
Project Name Project Type Status(1) Actual or Estimated Saleable Area (sq.
ft.) (1)
Actual or Estimated Total Number of
Units
Malabar Hill Residential Planned 15,829(2) 6
(1) Information provided in respect of our Ongoing and Planned projects is based on current management plans and subject to change. In
general, we expect to begin construction on our Planned projects over the next three years. (2) The estimated Saleable Area reflects our 40.27% share in the project.
Planned Residential Projects
● Malabar Hill Project is a premium residential apartment complex, located in Malabar Hill, Mumbai. It consists
of one tower of six duplex units, with a total Saleable Area of approximately 39,301 square feet, of which our
share is approximately 40.27%. The project will have high end facilities and amenities, including multiple levels
of car parking. The target market for this project is the ultra-high income segment.
Tardeo – Tardeo, Mumbai
Shri Siddhi Avenues is a special purpose vehicle which is developing a residential project, in which we hold 50% interest.
The remaining 50% interest is jointly held by Kishor B. Rathod, Mahindra B. Rathod, Raju B. Rathod and Jignesh P.
Kothari. Shri Siddhi Avenues is currently involved in a redevelopment project on approximately 1.85 acres of land at
Tardeo, Mumbai under a slum rehabilitation scheme. We expect to generate a free-sale Saleable Area of approximately
345,257 square feet by redeveloping the existing slums on this land.
Project Name Project Type Status(1) Actual or Estimated Saleable Area
(sq. ft.) (1)
Actual or Estimated Total Number
of Units
Tardeo Residential Planned 345,257(2) 94

121
(1) Information provided in respect of our Ongoing and Planned projects is based on current management plans and subject to change. In
general, we expect to begin construction on our Planned projects over the next three years. (2) Our share in the project is 50.00% of the estimated Saleable Area
KEY BUSINESS PROCESSES
The process of real estate development can be divided into distinct stages of activity. These stages are as follows:
Although this flowchart reflects the general sequence of project execution, a number of functions overlap in the process
to ensure seamless implementation of the development and construction of a project.
Land Acquisition Strategy
The profitability of our business is dependent on our land acquisition costs and our growth is dependent on the availability
of land for our future development. We acquired a substantial portion of the land for our currently Completed, Ongoing
and Planned projects in the past when our management anticipated growth in the real estate market, taking advantage of
multiple land acquisition opportunities, by acquiring land in Worli (through a joint venture) and Borivali, respectively.
See the chart under “—Competitive Strengths – Prudent financial management” for a depiction of our use of leverage in
connection with our Borivali acquisition. We intend to take advantage of emerging consolidation opportunities in the real
estate industry generated by regulatory changes, such as RERA, and other market factors, by following a flexible strategy
for land acquisition. We also anticipate that insolvency and bankruptcy proceedings under the Insolvency and Bankruptcy
Code, 2016 against or by debt-ridden companies will provide opportunities to acquire stressed assets. We intend to
continue to evaluate various land acquisitions models, such as outright purchase, joint ventures, joint development and
development management.
We acquire land and land development rights from the government and private parties. We seek to acquire land or land
development rights through a competitive bidding process. The cost of acquisition of land and land development rights,
which includes the amounts paid for freehold rights, leasehold rights and fungible FSI, construction cost of areas given to
landlords in consideration for land development rights and cost of registration and stamp duty, represents a substantial
part of our project cost in urban areas such as MMR. We are typically required to enter into a deed of conveyance, a lease
deed or a deed for development rights transferring title or leasehold rights or development rights in our favour. The
registration charges and stamp duty are also typically payable by us. Additional costs include those incurred in complying
with regulatory formalities, such as fees paid for change of land use.
Typically for acquisition of land or land development rights, we are required to pay an advance at the time of executing
transaction agreements, with the remaining purchase price due upon completion of the acquisition. We may acquire lands
through auction and prior to bidding in the auction, we may be required to pay a refundable deposit or earnest money. In
certain cases, we may be required to furnish a bank guarantee for which we would be required to pay the applicable bank
charges.
We also acquire the right to develop properties through arrangements with other entities, which own the land or land
development rights. The other party is typically given the option, as consideration, to either share the sale proceeds in a
pre-determined proportion depending upon the nature of the project and the location of the land or to receive a pre-
determined portion of the developed area which such party may market at its expense.
We may also look at acquiring land holding companies as a means of acquiring land and/or land development rights.
Once a potential development site has been identified, we undertake site visits and consult market reports/surveys and
consider, among other factors:
● location, including frontage, surrounding developments and landmarks and views;
● size of the development site;
● potential end use of the site;
● land acquisition cost;
● regional demographics;

122
● gap analysis of current property development initiatives and market needs;
● financial viability of the proposed project;
● feasibility of construction and adequacy of support infrastructure;
● availability of utility services;
● title searches and related legal due diligence;
● market trends; and
● regulatory issues.
After conducting such analysis, our senior management makes the final decision with regard to the financial feasibility of
the acquisition and the scope of the projects to be developed on the proposed site.
After a decision is made to proceed with the acquisition of land or land development rights, we take necessary steps to
acquire the land or development rights. We enter into negotiations with the seller of land or land development rights in
order to reach a preliminary acquisition agreement, usually documented in a memorandum of understanding. Once we
have completed our preliminary due diligence on the land, we enter into final agreements to acquire the land.
We endeavour to obtain valid title to our land and development rights. Wherever possible, we obtain legal opinions that
confirm our title to the land or development rights purchased from third parties. Please see the sections entitled “Risk
Factors – We may not hold, or may not be able to prove that we hold, good title to our real estate assets and we do not
have and may not be able to obtain title insurance guaranteeing title or land development rights” on page 42.
We are subject to municipal planning and land use regulations in effect in MMR and in other cities in India, including
Pune, which limit the maximum square footage of completed buildings we may construct on plots to specified amounts,
calculated based on FSI.
TDRs, in the form of a Development Rights Certificate granted by the relevant statutory authority (the MCGM in
Mumbai), provide a mechanism by which a person, who is unable to use the available FSI of his/her plot for various
reasons, is permitted to use the unused FSI on other properties in accordance with applicable regulations or transfer the
unused FSI to a third party. Some of our development sites are reserved for public purposes or for providing public
amenities such as roads, gardens, playgrounds, hospitals and schools. If we decide to develop such sites, we are required
to develop them in accordance with the applicable reservation and hand over the completed development to the MCGM
or other relevant authority. In return, we are compensated by a grant of TDRs in the form of FSI, which can be used by us
within the same development or, subject to certain restrictions, within another development or transferred to a third party.
Sometimes, a development site has potential for development, but basic FSI has already been consumed. In such cases,
we can acquire FSI by way of TDRs and utilise it on such developments. For example, we acquire TDRs from third parties
to enable us to build beyond the approved limit for our buildings (therefore resulting in an increase in the total Saleable
Area of our projects).
Regulatory Approvals
We retain responsibility for obtaining all necessary approvals and permits for each of our projects and have a liaison team,
comprising architects, engineers and legal professionals, whose function is to obtain approvals from various government
authorities. Approvals and permits are required throughout the development process.
We believe that real estate development is a localised business and detailed local knowledge is required for obtaining
timely approvals. We work in close coordination with the civic authorities and we believe that we have the requisite
knowledge of the process and requirements for obtaining all necessary approvals in MMR. The legal regimes governing
land development vary across geographic regions in India and the approvals and permits required may differ for projects
outside of MMR.
Design and Architecture
We coordinate with international and national design firms and architects for our projects. In particular, we hire third
parties, including international firms, to design projects which are complex and require specific technical expertise and to
design specific projects. Our emphasis is on use of advanced technologies like computer aided design software to ensure
optimisation of costs and space. We also have in-house design and project management teams that are responsible for
designing, budgeting, planning, contracting and tracking the execution of projects. Our specialised in-house design and
project management teams are experienced in adapting international design concepts to suit the requirements of MMR
real estate market. In addition, we also engage other external consultants for the planning of our projects. The designing
and architect firms and structural consultants are engaged by us separately for each project and are particular to the project.

123
The work performed by these third parties must comply with specifications provided by us and, in all cases, is subject to
our review.
Generally, depending upon the size and complexity of a project, it takes approximately six months to a year to complete
the planning and design phase and to obtain all necessary approvals and permits required to commence work.
Concept design and master planning
Following acquisition of a development site or development rights, we determine the type and scale of project to be
undertaken, based upon, among other things, research reports, which profile prospective clients. This process results in
the preparation of a project brief, which is submitted to an external architect, who is responsible for the conceptual design
of the project. The conceptual design includes master planning, phasing of development and the type and orientation of
buildings. Once a concept design is prepared, it is sent to our experienced in-house design management team, which
evaluates the design and coordinates with the architect to finalise the concept. The final decision on the conceptualisation
of each project and the development of each property is made by our senior management.
Design development
The output of the concept design phase is a master plan with a broad description of the planned development in presentation
format. The design development phase involves further detailing of the design concept. Detailed specifications and
drawings of each activity are prepared by our in-house design management team, which ensures certifications, No
Objection Certificates (NOCs) and approvals are obtained for the commencement of the project from various regulatory
and governmental authorities. In accordance with our outsourcing strategy, we intend to use external design firms to
perform this role in our future projects.
Execution
Construction and Procurement
The project execution phase commences once the detailed specifications and drawings have been prepared, the project
structure is finalised, necessary approvals have been obtained, the required resources are ascertained and the project
schedule is fixed.
We typically outsource the construction of our projects to a number of contractors for different aspects of the project,
while retaining a project management role. We select contractors through an open tender process, although we generally
engage suppliers and contractors with whom we have worked on previous developments. In addition to appointing reputed
domestic and international companies for the construction of the structural “core and shell” of a project, we separately
appoint contractors for the excavation works, the “envelope”, or facade, of the structure and for specialist components of
the project, such as lifts, heating, ventilation and air conditioning (HVAC) and Intelligent Building Management Systems,
and various other activities, such as internal and external painting, flooring, plumbing and electrical installation works and
installation of other amenities, such as swimming pools. The coordination of all of these components is managed by our
project management team.
We believe that our outsourcing model enables us to leverage the expertise of our service providers and also enables our
management to focus on other aspects of our business. We also believe that our outsourcing model provides us with the
scalability required not only to undertake large developments such as the Oberoi Garden City project in Goregaon, Mumbai
but also to explore opportunities and undertake similar and other developments in different parts of India.
We typically staff each of our projects with an on-site project manager, civil engineers, surveyors, quality control officers,
sales and marketing personnel and inventory control officers. In addition, finance and accounting personnel, IT personnel,
legal personnel and human resources personnel are involved in our projects, as required. Our personnel retain all on-site
project management and oversight roles.
Quality Control
We emphasise quality control to ensure that our buildings meet our standards. We control quality by selecting only
experienced design and construction companies. To ensure construction quality, our construction contracts contain quality
warranties and penalty provisions for poor work quality. In the event of delay or poor work quality, the contractor may be
required to pay pre-agreed damages under our construction contracts. We typically obtain a bank guarantee or withhold
approximately 5% of the agreed construction fees for up to one year after completion of the construction as a deposit to
guarantee quality, which provides us assurance for our contractors’ work quality. Our contractors are also subject to our
quality control procedures, including examination of materials and supplies, on-site inspection and production of progress
reports. We require our contractors to comply with relevant laws and regulations, as well as our own standards and
specifications. We closely monitor the construction work for quality, timing and cost control reasons. Our project
construction management team consists of 374 employees as of March 31, 2018, including employees who are
professionally qualified civil engineers or surveyors and are responsible for supervising and managing the construction

124
schedule and quality of the construction work. In addition, the construction of real estate projects is regularly inspected
and supervised by local governmental authorities.
Sales and Marketing
Marketing
We market our projects through our internal marketing team, and through external brokers and consultants. We maintain
a database consisting of our existing customers, referrals and leads we have generated through various advertising and
awareness campaigns. Our direct sales efforts are a combination of telephonic marketing, tours of our model homes and
digital marketing, all of which is handled by our internal marketing team.
We employ various marketing approaches depending on whether the project is residential, office space or retail. These
include launch events, corporate presentations, internet marketing, direct and indirect marketing, as well as print
advertising, site branding and outdoor advertising. We have received several awards in recognition of our marketing
campaigns. For example, Oberoi Mall has received the award for “Most admired marketing campaign” at the ET Now
Awards, 2018 for Retail Excellence as well as the “Retail marketing campaign of the year” for their Cricket Carnival at
the Asia Africa GCC Retail Excellence Awards, 2016.
Sales
For our residential projects, we typically follow a pre-sale model, whereby we offer units for sale prior to completion.
Sales generally are conducted by our sales staff on the project site, as well as through third party brokers. Upon booking
of a residential unit, in accordance with current regulations, we typically receive up to 10% of the purchase price as down
payment at the time of booking and the remainder through periodic payments linked to certain other time or construction
milestones while the project is being developed. We price our residential units based on our analysis of demand in a
particular region, taking into consideration market demographics, location, future supply and competition. Under
applicable laws, we are liable to pay interest on payments already made to us by our customers in respect of any delay in
the completion and hand over of the project to our customers and, where the customer exercises a right to cancel the sale,
we are liable to refund amounts paid to date with interest. The interest payable is calculated at a fixed rate on a monthly
basis for the period of the delay.
We transfer title to the customer upon completion of construction of the building or structure and after execution of the
definitive agreement with the customer. We transfer the title of the land on which the building is located to an independent
housing society after all the buildings or structures within a project are turned over to owners or housing societies. The
day-to-day management and control of the completed building is then relinquished to the management board or society of
the owners. Following the transfer of title to the customer, we remain subject to statutory warranties, including those
provided for under the Maharashtra Ownership of Flats (Regulation of the Promotion of Construction, Sale, Management
and Transfer) Act, 1963 (the “Ownership of Flats Act”). Please see the section entitled “Regulations and Policies” on
page 128.
For our office space and retail projects, we currently retain ownership of our properties which are occupied by third parties
pursuant to a number of different legal arrangements, including lease, license, business conducting and other similar
arrangements. We may, however, adopt a mixed sale/lease or total sale model in respect of our Ongoing and Planned
office space projects, depending on prevailing market conditions.
For our hospitality projects, we expect that a significant number of our room reservations will be made through corporate
clients and travel agents. In addition, we expect hotel guests will make room reservations directly with the hotel or through
the relevant hotel website.
Most of our enquiries are handled and processed by the respective sales offices.
Property Management
Our property management Subsidiary, Kingston Property Services Limited (“KPSL”), provides property management and
maintenance services for leased properties in our retail projects. Property management and maintenance services for our
leased office space project are currently provided by KPSL and we plan to use KPSL to provide such services for our
office space and other projects in the future.
Examples of the property management and maintenance services facilitated by KPSL include back-up power generation,
central air conditioning, water supply, drainage pumping, janitorial services, security services, parking management, pest
control, fire detection and solid waste disposal and management. We outsource most of these operations to qualified and
experienced vendors, although we take responsibility for developing standard operating procedures, maintenance
schedules and addressing complaints.

125
OUR COMPETITORS
The real estate development industry in India, including MMR, while fragmented, is highly competitive. We expect to
face increased competition from large domestic as well as international property development companies. We compete
for the sale and lease of our projects. We believe that we are able to distinguish ourselves from our competitors on the
basis of our strong presence in MMR, our established brand and reputation, the quality of our design and construction, and
the location of our projects.
We also compete to acquire land and land development rights. The availability of suitable land parcels for our projects
(particularly of the size we target and in desirable locations) is limited in MMR. However, we believe that our established
brand and reputation provide us with a competitive advantage when competing for land development rights, as we believe
third-party land owners recognise our ability to successfully close transactions.
We presently compete with various regional and national real estate developers. As we may expand our business activities
to include real estate development in other parts of India, we may experience competition in the future from competitors
with significant operations elsewhere in India.
HEALTH, SAFETY AND ENVIRONMENT
We are committed to complying with applicable health, safety and environmental regulations and other requirements in
our operations. To help ensure effective implementation of our safety policies and practices, at the beginning of every
property development we identify potential material hazards, evaluate material risks and institute, implement and monitor
appropriate risk mitigation measures. We believe that accidents and occupational health hazards can be significantly
reduced through the systematic analysis and control of risks and by providing appropriate training to management,
employees and sub-contractors.
As a real estate developer in India, we are subject to various mandatory national, state and municipal environmental laws
and regulations. Our operations are also subject to inspection by government officials with regard to various environmental
issues. In addition to compliance with the requisite environmental laws and regulations, we have adopted various
technologies for energy and water conservation in our projects, such as rainwater harvesting and sewage treatment plants.
For further details, please see the section entitled “Regulations and Policies” on page 128.
CORPORATE SOCIAL RESPONSIBILITY
Our corporate social responsibility initiatives include measures to promote education, including through the conservation
and renovation of school buildings and classrooms; promote healthcare and sanitation; and environmental sustainability
initiatives, including clean and renewable energy projects and natural resource conservation. We have adopted a Corporate
Social Responsibility policy in compliance with the requirements of the Companies Act, 2013 and the Companies
(Corporate Social Responsibility) Rules, 2014 notified by the Central Government.
OUR EMPLOYEES
Our work force consists mostly of permanent employees. As of March 31, 2016, 2017 and 2018 we had 1,022, 1,080 and
1,153 permanent employees, respectively. As of March 31, 2018, we had 149 temporary employees.
The breakdown of our employees by business activity is summarised in the following table:
As of March 31, 2018
Business Activity Number of Employees
Architecture 41
Engineering 374
Finance and Accounts 75
Human Resources Department and Employee Services 20
Managing Director’s Office 22
Marketing and Corporate Communications 19
Information Technology 7
Legal and Secretarial 9
Liaison 23
Property Management Services 27
Sales and Marketing 77
Project and Business Development 9
Oberoi Mall 31
The Westin Mumbai - Garden City 419
Total 1,153
As of March 31, 2018, approximately 17.43% of our employees were members of a registered trade union. We have not
experienced any material strikes, work stoppages, labour disputes or actions by or with our employees, and we consider
our relationship with our employees to be good. As part of our strategy to improve operational efficiency, we regularly
organise in-house and external training programs for our employees.

126
Employees in India enjoy certain statutory rights, which prevent them from being dismissed or made redundant, except in
limited circumstances.
INFORMATION TECHNOLOGY
We make extensive use of information and communication technologies for the execution and management of our projects
and consider information technology to be a strategic tool to assist us to improve our overall efficiency. We have
successfully implemented a leading enterprise resource planning system to help us to manage all of our resources. In
addition, our project management team uses CRM, design and execution tools to review the progress of each project and
monitor cost and time overruns, if any.
INTELLECTUAL PROPERTY
We have registered our trademark and trade name “Oberoi Realty” with the trademarks registry at Mumbai under Class
16, Class 19, Class 36 and Class 37.
Oberoi Hotels Private Limited and OCL have entered into an agreement dated November 27, 2009 allowing OCL to use
the “Oberoi” trademark in connection with its real estate, construction and infrastructure projects.
In addition, several of our Promoter Group entities, over which we have no direct control, may continue to develop existing
real estate projects under the “Oberoi Realty” brand as they are not otherwise prohibited from doing so under the
undertaking by our Promoter dated December 23, 2009. Please see the section entitled “Risk Factors – Our registered
trademark and trade name “Oberoi Realty” may be infringed by third parties and we may be subject to intellectual
property disputes” on page 44.
Pursuant to a System Licence Agreement dated January 2, 2008 between the Company and Westin Hotel Management,
L.P., a subsidiary of Marriott, we are permitted to use the “Westin” brand in connection with the operation of The Westin
Mumbai - Garden City, subject to the terms of such agreement. In addition, pursuant to a License and Royalty Agreement,
dated April 18, 2014, between us and Global Hospitality Licensing S.à r.l., we are permitted to use the “The Ritz-Carlton”
brand in connection with the operation of The Ritz-Carlton Mumbai – Worli, Mumbai, subject to the terms of such
agreement.
INSURANCE
Our operations are subject to hazards inherent in the real estate industry, such as work accidents, fires, earthquakes, floods
and other force majeure events, acts of terrorism and explosions, including hazards that may cause injury and loss of life,
severe damage to and the destruction of property and equipment and environmental damage. We obtain contractors all
risks policies for our projects under construction to cover construction risks. We generally maintain insurance covering
our assets and operations at levels that we believe to be appropriate. We also ensure that our main contractors obtain risk
insurance policies while carrying out any activities on our behalf. We have a director’s and officer’s liability policy for
our directors and officers, and group personnel accident and mediclaim policies for our employees. We have also obtained
a commercial general liability policy and Crime Policy to cover third party liability.
For our Oberoi Mall project, we maintain a loss of profits policy, which covers consequential loss as a result of fire and
public liability non-industrial risks. The mall building and all other assets therein are insured under a fire and special perils
policy, which also covers earthquake and terrorism risks. For The Westin Mumbai - Garden City, we have obtained a
Commercial General Liability insurance policy to cover third party liability. The hotel building and all other assets therein
are insured under a Fire and Special Perils policy, which also covers earthquake and terrorism risks. We also maintain a
loss of profits policy, which covers consequential loss as a result of fire.
For our Commerz office space project, we maintain a loss of profits policy, which covers consequential loss as a result of
fire and public liability non-industrial risks. The Commerz building and all other assets therein are insured under a fire
and special perils policy, which also covers earthquake and terrorism risks.
AWARDS
We have received several awards over the past years, including the following:
Fiscal Year Award
2018 Adjudged “Real Estate Company of the Year” by Construction Week India Awards 2017
2017 Awarded “Most Aspiring Real Estate Brand India 2016” and “Best Residential High Rise Architectural
Award, India 2016” at Global Brands Magazine Awards, United Kingdom
Awarded the Times Realty Icon Award for Commerz II
Adjudged the “Developer of the year- Residential” at the Realty Plus Conclave & Excellence Awards
(West), 2016
2016 Adjudged as one of the Top Ten Brands at Mumbai’s Hot 50 Brands 2015 by Paul Writer

127
Fiscal Year Award
The Elite Club was adjudged the “Most admired loyalty program of the year” at the Lokmat National
Awards for Excellence in Real-estate and Infrastructure, 2015
Felicitated as one of the top ten builders of the decade at the 10th CWAB Awards, 2015
Winner of the “Developer of the year- residential” and “Developer of the year- commercial” awards
at the 7th Realty Plus Conclave and Excellence Awards 2016
Winner of the “Digital marketer of the year” award in the real estate category at the Digital Marketers
Awards 2015
Priviera awarded the “Luxury Project of the Year” Award at the Real Estate Innovation &
Infrastructure Awards presented by DNA
Priviera awarded Best Residential Project Award in the Luxury Segment at the 10th CNBC – AWAAZ
Real Estate Awards 2015-16
Priviera awarded the Luxury Quotient Category award at the Trends Realty Titans awards presented
by Economic Times

128
REGULATIONS AND POLICIES
The following description is a summary of certain sector specific laws and regulations in India, which are applicable to
us. The information detailed in this section has been obtained from publications available in the public domain. The
regulations and their descriptions set out below may not be exhaustive, and are only intended to provide general
information to the bidders and are neither designed nor intended to substitute for professional legal advice. Judicial and
administrative interpretations are subject to modification or clarification by subsequent legislative, judicial or
administrative decisions.
Our Company is engaged in the business of real estate development. Since its business involves acquisition of land, land
development and concept design and design development, it is governed by a number of central and state legislation
regulating substantive and procedural aspects of the acquisition of, and transfer of land as well as town and city planning.
For the purposes of executing our projects, we may be required to obtain licenses and approvals at various stages. These
licenses and approvals depend upon the prevailing laws and regulations and may be obtained from the relevant state and /
or local governing bodies such as the Municipal Corporation, the Municipal Council, the Village Panchayat, the
Development Authority, the Town Planning Authority, the Environmental Department, the Pollution Control Board and
the Aviation Department, the City Survey Department, the Collector, etc.
The following is an overview of some of the important laws and regulations, which are relevant to our business as real
estate developer.
PROPERTY RELATED LEGISLATIONS
Central Legislations
Real Estate (Regulation and Development) Act, 2016 and the rules made thereunder (the “RERA”)
RERA mandates that promoters of all projects which are under the sale model that are ongoing and for which completion
certificate has not been issued, can only market the project if it is registered with the Real Estate Regulatory Authority
(the “Authority”) established under the act. It also mandates the functions and duties of the promoters including that the
promoters must park 70% of all project receivables in a separate account. Drawdown from such account is permitted for
land and construction costs only, in line with the percentage of project completion (as certified by an architect, an engineer
and a chartered accountant). Further, a promoter can accept only up to 10% of the apartment cost as advance payment
application fee prior to entering into a written agreement for sale with any person. Further, the promoter is prohibited from
creating any charge or encumbrance on any apartment after executing an agreement for the same. In the event such charge
or encumbrance is created, it will not affect the right and interest of the allottee. Further, the promoter shall not transfer or
assign his majority rights and liabilities in respect of a real estate project to a third party without obtaining permission for
two-third of the allottees (except for the promoter), and prior written approval of the Authority, provided that such
transfer/assignment shall not affect the allotment or sale of units in the project. It is required that a promoter obtain all
insurances in respect of the real estate projects such as insurance in respect of title of land and construction.
Non-registration of a real estate project as per RERA would result in penalties up to 10% of the estimated cost of the
project as determined by the Authority. Contravention of any other provision of RERA or order issued by the Authority
may result in penalties up to 5% of estimated cost of the project. Further, the promoter’s contravention or failure to comply
with any order of the Appellate Tribunal formed under the act will result in imprisonment for a term extending to three
years or with fine up to 10% of estimated cost of the project, or with both.
Additionally if the promoter fails to give possession of the apartment, plot or building in accordance with the terms of
agreement for sale, or due to discontinuance of business or suspension or revocation of registration under the act, the
allottee may withdraw from the project, and the promoter must return the amount received from the allottee, along with
interest and compensation as provided under the act or if the allottee does not intend to withdraw from the project, the
promoter shall pay interest for every month of delay, till the handing over of the possession, at such rate as may be
prescribed under the act. Also, if promoter is unable to complete the construction within the time specified in the
declaration submitted for registration, and the extension thereof, the Authority may revoke the registration and facilitate
the balance development by the competent authority or the association of allottees or in any other manner as the Authority
may determine. In case there is a defect in the title of the land due to which the allottees suffer loss, then the promoter is
liable to compensate the allottees for the same.
We are also required to comply with the rules and regulations issued under RERA by the state governments. For instance,
Maharashtra has issued the Maharashtra Real Estate (Regulation Development) (Registration of Real Estate Projects,
Registration of Real Estate Agents, Rates, of Interest and Disclosure on Website) Rules, 2017 along with four other Rules.
The Right to Fair Compensation and Transparency in Land Acquisition, Rehabilitation and Resettlement Act, 2013
and the rules made thereunder (the “Land Acquisition Act, 2013”)
The Land Acquisition Act, 2013 provides for the procedure to be undertaken when the government seeks to acquire land
in any area for a public purpose including carrying out a social assessment study to determine inter alia whether the

129
acquisition would serve a public purpose. It also provides for fair compensation to be provided in lieu of the land acquired
along with the measures for rehabilitation and resettlement of the affected persons. The compensation is determined by
taking into consideration, amongst other things, the market value of the land, damage sustained by interested persons, and
consequence of the acquisition on the person.
Transfer of Property Act, 1882 (the “TP Act”)
The TP Act governs the transfer of immovable property between living persons, where the transfer of property is not by
way of operation of law.
Registration Act, 1908 (the “Registration Act”)
The Registration Act requires for compulsory registration of certain documents, including documents relating to transfer
of immovable property (including conveyance). A document must be registered within four months from the date of its
execution and must be registered with the sub-registrar within whose sub-district the whole or some portion of the property
is situated. A document will not affect the property comprised in it, nor be treated as evidence of any transaction affecting
such property (except as evidence of a contract in a suit for specific performance or as evidence of part performance under
the TP Act or as collateral), unless it has been registered.
Indian Stamp Act, 1899 (the “Stamp Act”)
The Stamp Act requires stamp duty to be paid on all instruments specified in Scheduled 1 of the Stamp Act. The applicable
rates for stamp duty on instruments chargeable with duty vary from state to state. Instruments chargeable to duty under
the Stamp Act, which are not duly stamped, cannot be admitted in court as evidence of the transaction contained therein.
The Stamp Act also provides for impounding of instruments that are not sufficiently stamped or not stamped at all by the
Collector if the Collector finds the instrument to not have been duly stamped, he may impose a penalty of the amount
(which may be five or ten times the proper stamp duty, or the amount of deficient portion of the stamp duty payable).
Indian Easements Act, 1882 (the “Easements Act”)
The Easements Act codifies easements in India, including the nature of easements as continuous or discontinuous and
apparent or non-apparent. Under the Easements Act, an easement may be imposed by any person in the circumstances and
to the extent to which he may transfer his interest in the property. Once an easement is obtained, a person may enjoy the
property (“Dominant Heritage”) in respect of which it is granted. An easement is a right which the owner or occupier of
land possesses for the beneficial enjoyment of that land and which permits him to do or to prevent something from being
done, in or upon, other land not his own. Under the Easements Act, a license is defined as a right to use property without
any interest in favour of the licensee. The period and incident may be revoked and grounds for the same may be provided
in the license agreement entered in between the licensee and the licensor.
Foreign Exchange Laws
The foreign investment in our Company is governed by the FEMA, as amended, the FEMA 2017, the FDI Policy, and the
SEBI FPI Regulations.
Currently, 100% FDI is permitted under the automatic route in the companies which are engaged in construction-
development projects (including development of townships, construction of residential or commercial premises, roads or
bridges, hotels, resorts, hospitals, educational institutions, recreational facilities, city and regional level infrastructure and
townships) subject to compliance with prescribed conditions. The conditions prescribed are as follows:
(i) Each phase of the construction development project would be considered as a separate project;
(ii) The investor will be permitted to exit on completion of the project or after development of trunk infrastructure
i.e. roads, water supply, street lighting, drainage and sewerage. However, a person resident outside India will be
permitted to exit and repatriate foreign investment before the completion of project under automatic route,
provided that a lock-in-period of three years, calculated with reference to each tranche of foreign investment has
been completed. Further, transfer of stake from a person resident outside India to another person resident outside
India, without repatriation of foreign investment will neither be subject to any lock-in period nor to any
government approval;
(iii) The project shall conform to the norms and standards, including land use requirements and provision of
community amenities and common facilities, as laid down in the applicable building control regulations, bye-
laws, rules, and other regulations of the concerned State Government, municipal or local body concerned;
(iv) The Indian investee company will be permitted to sell only developed plots, i.e. plots where trunk infrastructure
i.e. roads, water supply, street lighting, drainage and sewerage, have been made available;
(v) The Indian investee company shall be responsible for obtaining all necessary approvals, including those of the
building or layout plans, developing internal and peripheral areas and other infrastructure facilities, payment of

130
development, external development and other charges and complying with all other requirements as prescribed
under applicable rules, bye-laws, regulations of the State Government, municipal or local body concerned; and
(vi) The concerned State Government, municipal or local body concerned, which approves the building/ development
plans, will monitor compliance of the above conditions by the developer.
FDI is not permitted in an entity which is engaged or proposes to engage in real estate business (as defined in FDI Policy
of 2017), construction of farm houses and trading in transferable development rights. Condition of lock-in period (in sub-
clause (ii) above) does not apply to hotels and tourist resorts, hospitals, special economic zones, educational institutions,
old age homes and investment by NRIs. Additionally, foreign investment up to 100% under automatic route is permitted
in completed projects for operating and managing townships, malls / shopping complexes and business centres.
Consequent to such foreign investment, transfer of ownership and/or control of the investee company from persons resident
in India to persons resident outside India is also permitted. However, there would be a lock-in-period of three years,
calculated with reference to each tranche of foreign investment and transfer of immovable property or part thereof is not
permitted during this period. Completion of the project will be determined as per the local bye-laws / rules and other
regulations of State Governments.
STATE LEGISLATIONS
We develop real estate projects in Maharashtra. Accordingly, legislations passed by the state government in Maharashtra
are applicable to us for our projects. These include legislations relating to classification of land use and development of
agricultural land. Further, we require several approvals from local authorities such as municipal bodies. The approvals
required may vary depending on the state, the local area and the stage of completion of the project.
Maharashtra
The Bombay Village Panchayats Act, 1958 (the “BVP Act”)
The BVP Act empowers the panchayat to levy taxes on buildings and lands within the limits of the village, shop keeping
and hotel keeping, trade or calling other than agriculture. The panchayat passes a resolution specifying the tax to be levied
and the rate at which it is to be levied and then notify it to the public. Any person may in writing object to the levy of tax.
The panchayat may, at a special meeting, pass a resolution to propose the abolition or variation of any tax already levied.
The tax is primarily leviable from the actual occupier of the building or land, if such occupier is the owner of the building
or land. If the land or building is occupied by the lessee, the tax is leviable on the lessor. Tax on shop-keeping and hotel-
keeping is to be paid by the proprietor of the shop or hotel. Tax on trades and calling is levied on the person carrying on
the business.
The Maharashtra Stamp Act, 1958 (the “MS Act”)
The MS Act governs stamp duty on instruments in the state of Maharashtra. This act levies stamp duty on documents /
instruments by which any right or liability is or purports to be created, transferred, limited, extended, extinguished or
recorded. All instruments chargeable with duty and executed by any person are required to be stamped before or at the
time of execution or immediately thereafter on the next working day following the day of execution. Instruments not duly
stamped are incapable of being admitted in court as evidence of the transaction in question. The State government has the
authority to impound insufficiently stamped documents.
The Maharashtra Tenancy and Agricultural Lands Act, 1948 (the “MTAL Act”)
The MTAL Act regulates tenancy of agricultural land in areas of the state of Maharashtra within which our projects are
situated. The MTAL Act lays down provisions with respect to the term for which tenancy could be granted, renewal and
termination of a tenancy and quantum of rent payable by a tenant. The transfer of land to non-agriculturists is barred except
in the manner provided under the MTAL Act. Through the Maharashtra Amendment Act, 2016, the MTAL Act was
amended to allow transfer of agricultural land following under municipal corporation limits to non-agriculturalists with
the specific condition that the land will be put to non-agricultural use within five years from the date of transfer. In certain
cases, if the land is not put to non-agricultural use within the specified time period, an extension of a further five years
may be granted by the collector on payment of non-utilization charges. If the land is not put to non-agricultural use within
the maximum period of ten years, the land shall vest in the Government after a one-month notice is given to the purchaser
by the collector.
Maharashtra Land Revenue Code, 1966 (the “MLR Code”)
The MLR Code is a consolidated code governing the sphere of land revenue and powers of revenue officers in the state of
Maharashtra. Under the MLR Code, the Commissioner is the chief controlling authority in all matters connected with the
land revenue for a particular division within the state, subject to the superintendence, direction and control of the State
Government. Land revenue has been defined to mean all sums and payments claimable by the State Government on
account of any land or interest in or right exercisable over any land held, and any cess or rate authorised by the State
Government, any rent, lease money, quit rent or any other payment provided under any law or contract. All land, whether
applied for agricultural or other purposes, and wherever situated, is liable for the payment of land revenue to the State

131
Government as provided under the MLR Code, unless otherwise exempted. Further, any arrears of land revenue due on a
land shall be a paramount charge on the land and shall have precedence over every other debt, demand or claim. The MLR
Code also provides for the constitution of Maharashtra Revenue Tribunal.
The Maharashtra Ownership of Flats (Regulation of the Promotion of Construction, Sale, Management and Transfer)
Act, 1963 (the “Ownership of Flats Act”)
The Ownership of Flats Act applies throughout the State of Maharashtra for completed projects which are not registered
under RERA. The Ownership of Flats Act applies to promoters/developers who intend to construct a block or building of
flats on ownership basis. It requires promoters to make full and true disclosures regarding the nature of title to land on
which the construction is to take place and all encumbrances on the land. The promoter/developer is required to enter into
a written agreement for the sale of flats with each purchaser and the agreement contains prescribed particulars with relevant
copies of documents. These agreements must be compulsorily registered. Any contravention of the provisions of the
Ownership of Flats Act may be punishable with imprisonment for a term of up to three years or a fine, or both.
The Maharashtra Housing and Area Development Act, 1976 (the “MHADA”)
The Maharashtra Housing and Area Development Act, 1976 has been enacted for giving effect to the policy of the state
towards securing the principle specified in the Constitution of India and the execution of the proposals, plans or projects
therefore and acquisition therefore of the lands and buildings and transferring the lands, buildings or tenements therein to
the needy persons and cooperative societies of occupiers of such lands or buildings. MHADA consolidated the law relating
to housing, repairing and reconstruction of dangerous buildings and carrying out improvement works in slum area. It
establishes the Maharashtra Housing and Area Development Authority with a view to integrate the activities and functions
of different statutory bodies which coordinates the activities of seven regional housing boards.
Development Control Regulations for Greater Mumbai, 1991 (the “Development Regulations”)
The Development Control Regulations have been enacted to effectuate planned development and optimal use of land in
the municipal corporations of Greater Mumbai and apply to building activity and development work in the areas within
the jurisdictions of the municipal corporation. The constructions by our Company must be in accordance with the
requirements and specifications including safety requirements provided under the regulations and be compliant with the
safety requirements provided therein.
Development Control Regulations for Mumbai Metropolitan Region, 1999 (the “Development Control Regulations for
MMR”)
The Development Control Regulations for MMR apply to the development of any land situated within the Mumbai
Metropolitan Region as defined in the Mumbai Metropolitan Region Development Authority Act, 1974. Under the
Development Control Regulations for MMR no person can carry out any development (except those stated in proviso to
Section 43 of the Maharashtra Regional Town Planning Act, 1966.) without obtaining permission from the Planning
Authority and other relevant authorities including zilla parishads and the pollution control board.
The Development Control Regulations for MMR have demarcated the region into various zones for development purposes
including urbanisable zones, industrial zone, recreation and tourism development zone, green zones and forest zone.
Maharashtra Regional and Town Planning Act, 1966 (the “MRTP Act”)
The MRTP Act provides for the creation of new towns and compulsory acquisition of land required for public purposes.
The MRTP Act provides a mechanism for the better preparation of planning proposals and their effective execution.
ENVIRONMENT LAWS
The major statutes in India which seek to regulate and protect the environment against pollution related activities in India
include the Environment Protection Act, 1986, the Environment (Protection) Rules, 1986, the Water (Prevention and
Control of Pollution) Act, 1974, the Air (Prevention and Control of Pollution) Act, 1981, Hazardous and Other Wastes
(Management, Handling and Transboundary Movement) Rules, 2016 and the Public Liability Insurance Act, 1991. The
basic purpose of these statutes is to control, abate and prevent pollution. In order to achieve these objectives, Pollution
Control Boards (the “PCBs”), which are vested with diverse powers to deal with water and air pollution, have been set up
in each state. The PCBs are responsible for setting the standards for maintenance of clean air and water, directing the
installation of pollution control devices in industries and undertaking inspection to ensure that industries are functioning
in compliance with the standards prescribed. These authorities also have the power of search, seizure and investigation if
the authorities are aware of or suspect pollution that is not in accordance with such regulations. All industries and factories
are required to obtain consent orders from the PCBs, which are indicative of the fact that the factory or industry in question
is functioning in compliance with the pollution control norms. These consent orders are required to be renewed annually.

132
LABOUR LAWS
In addition to the aforementioned material legislations which are applicable to our Company, other legislations that may
be applicable to the operations of our Company include:
Contract Labour Act, 1970;
Inter State Migrant Workers Act, 1979;
Factories Act, 1948;
Payment of Wages Act, 1936;
Payment of Bonus Act, 1965;
Employees’ State Insurance Act, 1948;
Employees’ Provident Funds and Miscellaneous Provisions Act, 1952;
Equal Remuneration Act, 1976;
Payment of Gratuity Act, 1972;
Maharashtra Shops and Establishments (Regulation of Employment and Conditions of Service) Act, 2017;
Minimum Wages Act, 1948;
Hazardous Chemicals Rules, 1989;
Industrial Disputes Act, 1947;
Employee’s Compensation Act, 1923; and
Building and other Construction Workers (Regulation of Employment and Condition of Service) Act, 1996.

133
BOARD OF DIRECTORS AND SENIOR MANAGEMENT
Board of Directors
The composition of our Board is governed by the provisions of the Companies Act, 2013, the rules prescribed thereunder,
the SEBI Listing Regulations and the Articles. Our Board presently comprises seven Directors, including two Executive
Directors and five Non-Executive Directors, of which four are Independent Directors. Our Chairman is an Executive
Director. In accordance with the Articles, our Company shall not have less than three Directors (excluding alternate
directors) and not more than 15 Directors. The quorum for meetings of our Board is one-third of the total number of
Directors (excluding Directors, if any, whose places may be vacant at the time and any fraction contained in that one-third
being rounded off as one), or two Directors, whichever is higher. Where the number of interested Directors exceeds or is
equal to two-thirds of the total strength of our Board, the number of Directors who are not interested and are present at the
meeting, not being less than two, shall be the quorum for such meeting.
Pursuant to the provisions of the Articles, at least two-thirds of the total numbers of Directors are liable to retire by rotation,
with one-third of such number retiring at each AGM. A retiring Director is eligible for re-election. Further, as per the
Companies Act, 2013, the Independent Directors may be appointed for a maximum of two consecutive terms of up to five
consecutive years each and thereafter after an expiration of a period of three years prior to re-appointment. Any re-
appointment of Independent Directors shall be on the basis of, the performance evaluation report and approval by the
shareholders of our Company, by way of a special resolution.
The following table sets forth details regarding our Board as of the date of this Placement Document:
Sr.
No.
Name Designation Term DIN Address Occupation
1. Vikas Oberoi
Chairman and
Managing
Director
For a term of five
years from
December 4, 2014
00011701 Plot No. 70, 12th N. S. Road,
JVPD Scheme, Juhu, Vile
Parle, Mumbai 400 049
Entrepreneur
2. Bindu Oberoi Non-
Independent,
Non-
Executive
Director
Liable to retire by
rotation
00837711 Plot No. 70, 12th N. S. Road,
JVPD Scheme, Juhu, Vile
Parle Mumbai 400 049
Entrepreneur
3. Saumil Daru Non-
Independent,
Executive
Director
For a term of five
years from May 10,
2014 and liable to
retire by rotation
03533268 A-2301 Oberoi Woods, Off
Western Express Highway,
Goregaon (East), Mumbai 400
063
Service
4. Anil Harish Independent,
Non-
Executive
Director
For a term of five
years from August
27, 2014
00001685 13, CCI Chambers, 1st Floor,
Dinshaw Wacha Road,
Mumbai 400 020
Lawyer
5. Karamjit Singh
Kalsi
Independent,
Non-
Executive
Director
For a term of five
years from July 1,
2015
02356790 15, Central Park West,
Apartment 5A, New York,
New York 10023
Business
6. Tilokchand P.
Ostwal
Independent,
Non-
Executive
Director
For a term of five
years from August
27, 2014
00821268 103, Falcon’s Crest, G.D.
Ambekar Marg, Parel, Mumbai
400 012
Chartered
Accountant
7. Venkatesh
Mysore
Independent,
Non-
Executive
Director
For a term of five
years from August
27, 2014
01401447 The Imperial, North Tower
Apartment 4305, BB Nakashe
Marg, Tardeo, Mumbai 400
034
Service
Brief Biographies of our Directors
1. Vikas Oberoi is the Chairman and Managing Director of our Company. He has been on the Board since its
incorporation. Prior to joining our Company he has worked with various Promoter Group and group companies
and has more than three decades of experience in the real estate sector. He has been recognised as of the “India’s
Top Builders of 2017” at the “Construction World Architect and Builder” awards. He is involved in the formulation
of corporate strategy and planning, overall execution and management, and concentrates on the growth and
diversification plans of our Company. He is also on India Advisory Board of the Harvard Business School.
2. Bindu Oberoi is a Non-Independent, Non-Executive Director of our Company. She has been on the Board since
December 2006. She is involved in the areas of interiors, designing and landscaping for the projects.

134
3. Saumil Daru is a Non-Independent, Executive Director of our Company. He is also the group Chief Financial
Officer and heads the finance, accounts, tax and secretarial departments. He has been associated with us since
October 2002. Prior to joining us, he was employed with Ernst & Young India Private Limited and has over 20
years’ experience in tax, accounts and finance.
4. Anil Harish is an Independent, Non-Executive Director of our Company. He has been on the Board since
September 2009. He was a member of the managing committee of the Indian Merchants Chamber and is a partner
at D. M. Harish & Co., Advocates. He specializes in practice areas pertaining to real estate, taxation and
collaboration. He is also a trustee of Hyderabad (Sind) National Collegiate Board.
5. Karamjit Singh Kalsi is an Independent, Non-Executive Director of our Company. He has been on the Board
since September 2014. He is the founder and partner of GreenOak Real Estate LP, a partner-owned real estate
investment advisory firm, having offices at New York, London, Tokyo and Los Angeles. He was previously the
global co-head of Morgan Stanley’s Real Estate Investing (MSREI) business and president of the Morgan Stanley
Real Estate Funds. He has also been cited in several publications for his profile in the real estate industry, including
Private Equity Real Estate magazine as one of the “30 Most Influential” people in private equity real estate globally.
6. Tilokchand P. Ostwal is an Independent, Non-Executive Director of our Company. He has been on the Board
since December 2007. He is a practicing chartered accountant with experience of approximately 40 years. He was
the vice-chairman of the executive board of International Fiscal Association, Netherlands. He is a member of
international taxation committees of The Bombay Chartered Accountant Society and Indian Merchants Chamber.
He is a visiting professor at Vienna University, Austria. He has also been appointed as a member of a group
constituted by the United Nations for developing transfer pricing manual and documentation for developing
countries. He is a partner of T. P. Ostwal & Associates and DTS & Associates, Chartered Accountants. His firm
has been rated as one of the leading Tier 3 firms of India by “World Tax 2017 – The Comprehensive Guide to the
World’s Leading Tax Firms”, and has also been ranked 15th as a leading firm in India in “World Transfer Pricing
2017 – The Comprehensive Guide to the World’s Leading Transfer Pricing Firms”. He is involved in handling
international tax issues on cross-border transactions for a wide range of clients in India.
7. Venkatesh Mysore is an independent, Non-Executive Director of our Company since July 2011. Venkatesh
Mysore has been the CEO and MD of Knight Riders Sports Private Limited (Kolkata Knight Riders) since October,
2010 and CEO of Red Chillies Entertainments Private Limited since February, 2013.
Relationship with Other Directors
Except for Vikas Oberoi and Bindu Oberoi, none of the Directors are related to each other. Bindu Oberoi is the sister of
Vikas Oberoi.
Borrowing Powers of our Board
Our Board is empowered to borrow money in accordance with Sections 179 and 180 of the Companies Act, 2013. Further,
in accordance with the Articles of Association, our Board has been empowered to borrow funds subject to certain
conditions as required to be met in accordance with applicable laws.
Interest of our Directors
Our Non-Executive Directors may be deemed to be interested to the extent of fee payable to them for attending meetings
of our Board or committees thereof, commission and sitting fee payable, as well as to the extent of reimbursement of
expenses payable to them, and our Executive Directors may be deemed to be interested to the extent of remuneration and
other benefits payable to them for services rendered as per their terms of appointment or such share of the profits in terms
of the profit share program of our Company.
Certain Directors may also be regarded as interested in any Equity Shares held by them and also to the extent of any
dividend payable to them and other distributions in respect of the Equity Shares held by them.
Except as provided below and in the section entitled “Financial Statements” on page 197 and the agreement dated January
19, 2015 entered into between our Company and the Managing Director in relation to his terms of appointment, our
Company has not entered into any contract, agreement or arrangement during the two years immediately preceding the
date of this Placement Document in which any of our Directors are interested, directly or indirectly, and no payments have
been made to them in respect of any such contracts, agreements, arrangements which are proposed to be made with them,
except:
Our Company, based on an approval received from our Board, may avail a loan of up to ₹ 25,000 lakhs from Vikas
Oberoi, which was approved by the shareholders of our Company on July 1, 2015 and August 19, 2016. As of
March 31, 2018, our Company has availed a non-interest bearing loan amounting to ₹ 8,908.00 lakhs from Vikas
Oberoi, who is a related party (as per Ind AS 24 “Related Party Disclosures”).

135
Other than as disclosed in this Placement Document, there were no outstanding transactions other than in the ordinary
course of business and at arms’ length undertaken by our Company, in which our Directors were interested parties.
There are no existing or potential conflicts of interest between any duties owed to our Company by our Directors and the
private interests or external duties of our Directors.
As on the date of this Placement Document, there are no outstanding loans which have been extended by our Company to
any of our Directors.
Shareholding of Directors
The following table provides the shareholding of our Directors in our Company as on the date of this Placement Document:
Name Number of Equity Shares Percent of the issued and paid-up
Equity Share capital (in %)
Vikas Oberoi 21,28,73,614 62.68
Bindu Oberoi 111 0.00
Saumil Daru 47,960* 0.01 *includes shareholding with relatives.
Terms of appointment of our Executive Directors
Vikas Oberoi
Pursuant to a resolution passed on January 17, 2007, the Board approved the appointment of Vikas Oberoi as the Chairman
of our Company. Further, pursuant to a shareholders’ resolution passed held on August 27, 2014, the shareholders of our
Company approved the appointment of Vikas Oberoi as the Managing Director for a period of five years with effect from
December 4, 2014. The terms of appointment as provided under agreement dated January 19, 2015 entered into between
our Company and the Managing Director in relation to his terms of appointment are as follows:
S. No. Category Remuneration
1. Basic Salary ₹ 1 per month.
2. Annual Commission An amount not exceeding 0.25% of the net profits of our Company for the year
(computed in the manner provided under Section 198 of the Companies Act,
2013) and the quantum as may be determined by our Board.
3. Perquisites and Allowances Housing (Company’s owned, hired or leased accommodation).
Reimbursement of expenses at actuals pertaining to gas, fuel, water,
electricity and telephone expenses.
Reimbursement of all medical expenses incurred in India for self and
immediate family (spouse and dependent children) at actuals (including
domiciliary and medical expenses and insurance premium for medical and
hospitality policy, as applicable).
Leave travel allowance for self and immediate family in accordance with
the rules of our Company.
Club fee of two corporate clubs in India (including admission and
membership fee).
Personal accident insurance coverage for self and group health insurance
coverage for self and family members as per the rules of our Company.
Our Company’s contribution towards the provident fund and
superannuation fund on basic salary as per the rules of our Company.
Gratuity, as applicable to the senior management of our Company or the
Group, including continuity of service for the time served elsewhere,
within the Group. For the purposes of gratuity, provident fund and other
like benefits, if any, such leave balance due, the service of the director will
be considered as continuous service with our Company from the date of his
joining our Company or the Group.
Car and driver for use on our Company’s business as per the rules of our
Company.
Leave and encashment of leave as per the rules of our Company.
Saumil Daru
Pursuant to a shareholders’ resolution passed on August 27, 2014, the shareholders of our Company approved the
appointment of Saumil Daru as the Non-Independent, Executive Director, designated as Director – Finance, for a term of
five years from May 10, 2014. The terms of appointment of Saumil Daru were revised pursuant to a shareholders’
resolution passed on July 1, 2015 and are as follows:

136
S. No. Category Remuneration
1. Basic Salary ₹ 4,70,000 per month, with such increments as may be determined by the Board
2. Perquisites and Allowances House rent allowance at the rate of 50% of the basic salary, subject to rules
of our Company.
Leave travel allowance and other allowances, as per rules of our Company.
Provision for Company provided accommodation and car as per the rules
of our Company.
Reimbursement of medical, professional development, petrol and car
maintenance expenses as per rules of our Company.
Personal accident insurance coverage for self and group health insurance
coverage for self and family members as per the rules of our Company.
Company’s contribution towards provident fund and to superannuation
fund on basic salary, as per rules of our Company.
Gratuity as applicable to senior management of the Company or the group,
including continuity of service for time served elsewhere, within the group.
For the purpose of gratuity, provident fund and other like benefits, if any,
such as leave balance due, the service of the director will be considered as
continuous service with our Company from the date of his joining the
group or the Company.
Leave and encashment of leave, in accordance with the rules of our
Company.
Benefits, perquisites, allowances, reimbursements and facilities as may be
determined by the Board from time to time.
Subject to the above, Saumil Daru shall be governed by such other rules as
to payment or otherwise as are applicable to the senior executives of our
Company from time to time.
3. Employee Stock Options Grant of options under employee stock option scheme(s) formulated by our
Company as may be determined by the Board, subject to requisite approvals
under the Companies Act, 2013 and the SEBI guidelines, regulations etc.
4. Ex gratia As per rules of our Company.
5. Performance linked
variable pay
Such amount as may be determined by the Board.
Remuneration of our Directors
Executive Directors
The following tables set forth the compensation paid by our Company to the Executive Directors during the current
Financial Year, as of the date of this Placement Document (to the extent applicable) and Financial Years 2018, 2017 and
2016 as per the unconsolidated financial statements (as per Ind AS 24 “Related Party Disclosures”):
(in ₹ lakhs)
Financial Year Remuneration Perquisites and
Allowances
Others Total
Vikas Oberoi*
2019 0.00 - - 0.00
2018 0.00 - - 0.00
2017 0.00 - - 0.00
2016 0.00 - - 0.00
Saumil Daru
2019 10.34 19.99 - 30.33
2018 628.36 0.14 - 628.51
2017 673.48 22.94 - 696.42
2016 198.98 2.69 0.00** 201.67 * Vikas Oberoi was paid a remuneration at the rate of ` 1 per month. ** As on March 31, 2016, 60,398 options were granted to Saumil Daru pursuant to the ESOP Scheme.
Non-Executive Directors

137
The following tables set forth all compensation paid by our Company to the Non-Executive Directors during the current
Financial Year, as of the date of this Placement Document (to the extent applicable) and the Financial Years 2018, 2017
and 2016 as per the unconsolidated financial statements (as per Ind AS 24 “Related Party Disclosures”):
(in ₹ lakhs)
Financial Year 2019
Name of the
Directors
Commission paid to
Directors
Remuneration Directors’ Sitting
Fee
Total
Bindu Oberoi - - - -
Anil Harish - - 0.85 0.85
Karamjit Singh Kalsi - - 0.50 0.50
Tilokchand P. Ostwal - - 0.95 0.95
Venkatesh Mysore - - 0.95 0.95
(in ₹ lakhs)
Financial Year 2018
Name of the
Directors
Commission paid to
Directors
Remuneration Directors’ Sitting
Fee
Total
Bindu Oberoi - - - -
Anil Harish 11.0 - 4.00 15.00
Karamjit Singh Kalsi 11.0 - 0.50 11.50
Tilokchand P. Ostwal 11.0 - 4.40 15.40
Venkatesh Mysore 11.0 - 2.75 13.75
(in ₹ lakhs)
Financial Year 2017
Name of the
Directors
Commission paid to
Directors
Remuneration Directors’ Sitting
Fee
Total
Bindu Oberoi - - - -
Anil Harish 11.0 - 4.00 15.00
Karamjit Singh Kalsi 11.0 - 1.00 12.00
Tilokchand P. Ostwal 11.0 - 4.90 15.90
Venkatesh Mysore 11.0 - 3.15 14.15
(in ₹ lakhs)
Financial Year 2016
Name of the
Directors
Commission paid to
Directors
Remuneration Directors’ Sitting
Fee
Total
Bindu Oberoi - - - -
Anil Harish 10.00 - 4.50 14.50
Karamjit Singh Kalsi 10.00 - 1.00 11.00
Tilokchand P. Ostwal 10.00 - 5.40 15.40
Venkatesh Mysore 10.00 - 4.35 14.35
Changes in Directors of our Company
The following table sets forth details regarding changes in our Board in the last three Financial Years:
Name of the Director Date Reason for change
Karamjit Singh Kalsi July 1, 2015 Regularisation of appointment and
appointment as a Non-Executive,
Independent Director

138
Organisation Chart of our Company
BOARD OF DIRECTORS
Saumil Daru
Director
Finance and Chief
Financial
Officer
Jaswinder
Singh Sandhu
Executive Vice
President - EPC
Rajendra
Chandorkar
Executive Vice President -
Architecture
Reema Kundnani
Vice President, Head -
Marketing, Corporate Communications and
Luxury Residential Sales
Rochelle
Chatterjee
Vice President, Head - Residential
Sales
Naveen Sodhiya
Chief
Information Officer –
Information
Technology
Meenakshi
Bhattacharjee
Vice President – Human Resources
& Employee
Services
Rajeevan Nair
Executive Vice
President and Chief
Legal Officer
Bhaskar Kshirsagar
Company Secretary
Arunkumar
Kotian
Vice President – Corporate
Affairs
VIKAS OBEROI

139
Key Managerial Personnel
In addition to our Managing Director, Vikas Oberoi, and Chief Financial Officer, Saumil Daru, the following are the Key
Managerial Personnel of our Company, as of the date of this Placement Document:
For details of biography of our Managing Director, Vikas Oberoi and Chief Financial Officer, Saumil Daru, please see the
section entitled “ - Brief Biographies of our Directors” on page 133.
Bhaskar Kshirsagar is the Company Secretary. He joined our Company on November 1, 2007. Prior to joining our
Company, he has worked with Puneet Resins Limited and Arihant Capital Markets Limited, and has approximately 13
years of experience in secretarial functions.
Senior Managerial Personnel
The following are our Senior Managerial Personnel, as of the date of this Placement Document.
Jaswinder Singh Sandhu is the Executive Vice President – Engineering, Procurement and Construction of our Company.
He has been associated with us since 2002. He has approximately 15 years of experience.
Rajendra Chandorkar is the Executive Vice President – Architecture of our Company. He has been associated with us
since July 10, 1999. Prior to joining our Company, he was employed with Kalpataru Construction Overseas Private
Limited and has approximately 20 years of experience.
Reema Kundnani is the Vice President, Head - Marketing, Corporate Communications and Luxury Residential Sales.
She has been associated with us since December 28, 2009. Prior to joining our Company she has worked with i-Flex
Solutions Limited, Larsen & Toubro Infotech Limited, indbazaar.com Limited and Satyam Computer Services Limited.
Arunkumar Kotian is the Vice President – Corporate Affairs of our Company and is involved in the decision making of
the liaison department. He has been associated with our Promoter Group since 1990.
Rochelle Chatterjee is the Vice President, Head - Residential Sales of our Company. She has been associated with us
since January 7, 2010. Prior to joining our Company, she was employed with Thomas Cook (India) Limited and has
approximately 19 years of experience.
Naveen Sodhiya is the Chief Information Officer of our Company. He has been associated with us since March 1, 2018.
Prior to joining our Company, he was employed with Tata Consultancy Services Limited and has approximately 21 years
of experience.
Meenakshi Bhattacharjee is the Vice President – Human Resources & Employee Services of our Company. She has
been associated with us since February 1, 2018. Prior to joining our Company, she was employed with Kalpataru Limited
and has over 16 years of experience in human resources across hospitality, engineering and real estate sectors.
Rajeevan Nair is the Executive Vice President and Chief Legal Officer of our Company. He has been associated with us
since September 21, 2017. He is an associate member of the Institute of Internal Auditors. Prior to joining our Company,
he was employed with Welspun Energy Private Limited and has over 28 years of experience in legal, corporate affairs and
corporate compliance fields.
Shareholding of Key Managerial Personnel and Senior Managerial Personnel
The following table provides the shareholding of the Key Managerial Personnel and Senior Managerial Personnel in our
Company as on the date of this Placement Document:
Name Number of Equity Shares Percentage of issued and paid-
up Equity Share capital (in %)
Vikas Oberoi 21,28,73,614 62.68
Saumil Daru 47,960* 0.01
Jaswinder Singh Sandhu 1,000 0.00
Bhaskar Kshirsagar 700 0.00
Arunkumar Kotian 853 0.00 *includes shareholding with relatives.
Relationship with other Key Managerial Personnel and Senior Managerial Personnel
None of our Key Managerial Personnel or Senior Managerial Personnel is related to each other.

140
Interest of Key Managerial Personnel and Senior Managerial Personnel
The Key Managerial Personnel and Senior Managerial Personnel do not have any interest in our Company other than to
the extent of the remuneration or benefits which they are entitled to as per their terms of appointment and reimbursement
of expenses incurred by them in the ordinary course of business and to the extent of the Equity Shares held by them or
their dependants in our Company, if any, and any dividend payable to them and other distributions in respect of such
Equity Shares. Further, certain of our Key Managerial Personnel and Senior Managerial Personnel may be interested to
the extent of such share of the profits in terms of the profit share program of our Company For details of interests of Vikas
Oberoi and Saumil Daru, please see the section entitled “- Interest of our Directors” on page 134.
As on the date of this Placement Document, there are no loans outstanding, extended by our Company to any of our Key
Managerial Personnel or Senior Managerial Personnel.
Except as provided in the section entitled “Financial Statements” on page 197, and except as disclosed in this Placement
Document, our Company has not entered into any contract, agreement or arrangement during the two years immediately
preceding the date of this Placement Document in which any of the Key Managerial Personnel or Senior Managerial
Personnel are interested, directly or indirectly, and no payments have been made to them in respect of any such contracts,
agreements, arrangements which are proposed to be made with them.
Corporate Governance
Our Board presently consists of seven Directors. In compliance with the requirements of the SEBI Listing Regulations,
our Board consists of four Independent Directors, including one woman Director.
Our Company is in compliance with the requirements of the applicable regulations, including the SEBI Listing
Regulations, and the Companies Act, 2013, in respect of corporate governance, including constitution of our Board and
committees thereof. The corporate governance framework is based on an effective independent Board, separation of our
Board’s supervisory role from the executive management team and constitution of our Board committees, as required
under law. Our Board functions either as full Board or through various committees constituted to oversee specific
operational areas.
Committees of our Board of Directors
In terms of the SEBI Listing Regulations and the Companies Act, 2013, our Company has constituted the following
committees:
(i) Audit Committee;
(ii) Nomination, Remuneration, Compensation and Management Development Committee;
(iii) Stakeholders’ Relationship Committee; and
(iv) Corporate Social Responsibility Committee.
Other Confirmations
None of our Directors, Promoter, Key Managerial Personnel or Senior Managerial Personnel has any financial or other
material interest in the Issue.
Except as disclosed in the section entitled “Wilful Defaulters” on page 141, neither our Company, nor our Directors or
Promoter have ever been identified as wilful defaulters by any bank or financial institution or consortium thereof, in
accordance with the guidelines on wilful defaulters issued by the RBI.
Neither our Company, nor our Directors or Promoter have been debarred from accessing capital markets under any order
or direction made by SEBI.
Related Party Transactions
For details in relation to the related party transactions entered by our Company during the last three Financial Years
immediately preceding the date of this Placement Document, please see the section entitled “Financial Statements” on
page 197.

141
WILFUL DEFAULTERS
Except as disclosed below, our Company, our Directors or our Promoter have not ever been identified as wilful defaulters
by any bank or financial institution or consortium thereof, in accordance with the guidelines on wilful defaulters issued
by the RBI:
S.
No.
Particulars Details
1. Name of the entity declared as a wilful
defaulter
Unitech Limited where Anil
Harish, one of our Directors,
was an independent director on
its board of directors.
Valecha Engineering Limited
where Anil Harish, one of our
Directors, was an independent
director on its board of
directors.
2. Name of the bank declaring the entity as a
wilful defaulter
Life Insurance Corporation of
India
Syndicate Bank
3. The year in which the entity was declared
as a wilful defaulter
2015 2017
4. Outstanding amount when the entity was
declared as a wilful defaulter
` 36,051.00 lakh (as on June
30, 2015)
` 5,817.86 lakh (as on
September 30, 2017)
5. Steps taken, if any, for the removal of the
entity from the list of wilful defaulters
Anil Harish has, by way of separate letters both dated June 11,
2018, requested Life Insurance Corporation of India and
Syndicate Bank to remove his name from the list of wilful
defaulters on the following grounds:
(i). he was an independent director on the boards of Valecha
Engineering Limited and Unitech Limited and is not a
director of either entity as of date;
(ii). In terms of the Master Circular on Wilful Defaulters issued
by the Reserve Bank of India dated July 1, 2015 bearing
reference number RBI/2015-16/100
DBR.No.CID.BC.22/20.16.003/2015-16 (the “Master
Circular”), banks and financial institutions, while reporting
details of wilful defaulters to credit information companies
are permitted to remove the names of non-whole time
directors, including nominee directors and independent
directors, in respect of whom, no information about their
complicity is available, in the default or wilful default of the
borrowing company amongst other criteria. In addition to
being an independent director, he also fulfilled the criteria
above.
(iii). he holds less than 1% of the shareholding of Valecha
Engineering Limited and does not hold any shares of Unitech
Limited.
(iv). as an independent director of both, Valecha Engineering
Limited and Unitech Limited, he was not responsible for the
conduct of Valecha Engineering Limited and Unitech
Limited, respectively, and did not exercise any executive
powers of management in either Valecha Engineering
Limited and Unitech Limited.
6. Other disclosures, as deemed fit by the
issuer (Oberoi Realty Limited), in order to
enable Bidders to take an informed
decision
Anil Harish is an Independent, Non-Executive Director of our
Company and accordingly, does not exercise any executive
powers in the Company.

142
PRINCIPAL SHAREHOLDERS
I. The following table sets forth the details regarding the equity shareholding pattern of our Company, as on March 31, 2018:
Category of shareholder Nos. of
shareholders*
No. of fully paid
up Equity Shares
held
Total nos. of
Equity Shares
held
Shareholding as a % of
total no. of Equity
Shares (calculated as per
SCRR, 1957)
Number of Locked in shares Number of Equity
Shares held in
dematerialized
form
No. (a) As a % of total
Shares held
Promoter and Promoter Group 5 24,61,74,946 24,61,74,946 72.49 - 0.00 24,61,74,946
Public 24,070 9,34,27,291 9,34,27,291 27.51 - 0.00 9,34,27,188
Shares underlying DRs - - - 0.00 - 0.00 -
Shares held by Employee Trust - - - 0.00 - 0.00 -
Non Promoter-Non Public - - - 0.00 - 0.00 -
Grand Total 24,075 33,96,02,237 33,96,02,237 100.00 - 0.00 33,96,02,134 * Consolidated in terms of SEBI circular number SEBI/HO/CFD/CMD/CIR/P/2017/128 dated December 19, 2017.
II. The following table sets forth the details regarding the equity shareholding of the Promoter and Promoter Group as on March 31, 2018:
Category of shareholder Nos. of
shareholders
No. of fully paid
up Equity Shares
held
Total nos.
Equity Shares
held
Shareholding as a % of
total no. of Equity
Shares (calculated as per
SCRR, 1957)
Number of Locked in shares Number of Equity
Shares held in
dematerialized
form
No. (a) As a % of total
Shares held
Indian
Individuals 1 21,28,73,614 21,28,73,614 62.68 - 0.00 21,28,73,614
Vikas Oberoi 1 21,28,73,614 21,28,73,614 62.68 - 0.00 21,28,73,614
Any Other (Promoter Group) 4 3,33,01,332 3,33,01,332 9.81 - 0 3,33,01,332
Santosh R. Oberoi 1 1,110 1,110 9.81 - 0.00 1,110
Bindu Oberoi 1 111 111 0.00 - 0.00 111
Gayatri Vikas Oberoi 1 111 111 0.00 - 0.00 111
R S Estate Developers Private
Limited
1 3,33,00,000 3,33,00,000 9.81 - 0.00 3,33,00,000
Sub Total 5 24,61,74,946 24,61,74,946 9.81 - 0 24,61,74,946
Foreign
Foreign - - - - - - -
Total 5 24,61,74,946 24,61,74,946 72.49 - 0.00 24,61,74,946

143
III. The following table sets forth the details regarding the equity shareholding of persons belonging to the public category as on March 31, 2018*:
Category and name of
shareholders
Nos. of
shareholde
r
No. of fully
paid up
Equity
Shares held
Total nos.
shares held
Shareholding as a
% of total no. of
shares (calculated
as per SCRR,
1957)
Voting Rights Number of Locked in
shares
Number of
Equity Shares
held in
dematerialized
form
No. of voting
rights
As a % of
total shares
held
No.(a) As a % of
total Shares
held (b)
Institutions (B1)
Mutual Funds/ 6 96,70,445 96,70,445 2.85 96,70,445 2.85 - 0.00 96,70,445
L&T Mutual Fund Trustee
Limited (various schemes)
1 40,13,884 40,13,884 1.18 40,13,884 1.18 - 0.00 40,13,884
Alternate Investment Funds 1 7,00,000 7,00,000 0.21 7,00,000 0.21 - 0.00 7,00,000
Foreign Portfolio Investors 206 7,46,37,856 7,46,37,856 21.98 7,46,37,856 21.98 - 0.00 7,46,37,856
Franklin Templeton
Investment Funds
1 1,03,81,671 1,03,81,671 3.06 1,03,81,671 3.06 - 0.00 1,03,81,671
Stichting Depositary Apg
Emerging Markets Equity
Pool
1 56,33,539 56,33,539 1.66 56,33,539 1.66 - 0.00 56,33,539
Oppenheimer International
Small-Mid Company Fund
1 41,51,083 41,51,083 1.22 41,51,083 1.22 - 0.00 41,51,083
Wellington Trust Company,
National Association
Multiple Common Trust
Funds Trust, Emerging
Markets Opportunities
Portfolio
1 39,05,073 39,05,073 1.15 39,05,073 1.15 - 0.00 39,05,073
Blackrock Global Funds
Asian Dragon Fund
1 34,04,195 34,04,195 1.00 34,04,195 1.00 - 0.00 34,04,195
Financial Institutions/ Banks 2 18,100 18,100 0.01 18,100 0.01 - 0.00 18,100
Sub Total B1 215 8,50,26,401 8,50,26,401 25.04 8,50,26,401 25.04 - 0.00 8,50,26,401
Central Government/ State
Government(s)/ President of
India (B2)
0 0 - 0.00 0.00 - 0.00 -
Non-Institutions (B3) 0 0 - 0.00 0.00 - 0.00 -
Individual share capital up to
₹ 2 Lacs
22,142 34,69,410 34,69,410 1.02 34,69,410 1.02 - 0.00 34,69,307
Individual share capital in
excess of ₹ 2 Lacs
18 18,82,747 18,82,747 0.55 18,82,747 0.55 - 0.00 18,82,747
Any Other (specify) 1,695 30,48,733 30,48,733 0.90 30,48,733 0.90 - 0.00 30,48,733
Trusts 5 5,360 5,360 0.00 5,360 0.00 - 0.00 5,360
HUF 578 2,68,960 2,68,960 0.08 2,68,960 0.08 - 0.00 2,68,960
Non Resident Indians 691 4,09,412 4,09,412 0.12 4,09,412 0.12 - 0.00 4,09,412

144
Category and name of
shareholders
Nos. of
shareholde
r
No. of fully
paid up
Equity
Shares held
Total nos.
shares held
Shareholding as a
% of total no. of
shares (calculated
as per SCRR,
1957)
Voting Rights Number of Locked in
shares
Number of
Equity Shares
held in
dematerialized
form
No. of voting
rights
As a % of
total shares
held
No.(a) As a % of
total Shares
held (b)
Clearing Members 160 2,00,207 2,00,207 0.06 2,00,207 0.06 - 0.00 2,00,207
Bodies Corporate 261 21,64,794 21,64,794 0.64 21,64,794 0.64 - 0.00 21,64,794
Sub-Total (B3) 23,855 84,00,890 84,00,890 2.47 84,00,890 2.47 - 0.00 84,00,787
Total Public Shareholding
(B)= (B1)+(B2)+(B3)
24,070 9,34,27,291 9,34,27,291 27.51 9,34,27,291 27.51 - 0.00 9,34,27,188
* Please note that the voting rights in respect of 200 Equity Shares are frozen due to such Equity Shares being held in demat or unclaimed suspense account.
IV. The following table sets forth the details regarding the equity shareholding of the non-promoter non-public shareholders as on March 31, 2018:
Category & name of our
Shareholders
Nos. of
Shareholder
No. of fully paid
up Equity
Shares held
Total nos.
shares held
Shareholding as a % of
total no. of shares
(calculated as per SCRR,
1957)
Number of Locked in shares Number of Equity
Shares held in
dematerialized form
(Not Applicable)
No As a % of total
Shares held
Custodian/ DR Holder 0 0 0 0 - 0.00 0
Employee Benefit Trust 0 0 0 0 - 0.00 0
V. Details of disclosure made by the Trading Members holding 1% or more of the total number of Equity Shares of our Company as on March 31, 2018: Nil

145
ISSUE PROCEDURE
The following is a summary intended to present a general outline of the procedure relating to the application, payment,
Allocation and Allotment of the Equity Shares to be issued pursuant to the Issue. The procedure followed in the Issue may
differ from the one mentioned below, and investors are presumed to have apprised themselves of any such changes from
our Company or the Book Running Lead Managers.
Bidders are advised to inform themselves of any restrictions or limitations that may be applicable to them. Investors that
apply in the Issue will be required to confirm and will be deemed to have represented to our Company, the Book Running
Lead Managers and their respective directors, officers, agents, affiliates and representatives that they are Eligible QIBs
and are eligible under all applicable laws, rules, regulations, guidelines and approvals to acquire the Equity Shares. Our
Company and the Book Running Lead Managers and their respective directors, officers, agents, affiliates and
representatives accept no responsibility or liability for advising any investor on whether such Bidder is eligible to acquire
the Equity Shares. Please see the sections entitled “Selling Restrictions” and “Transfer Restrictions” on pages 157 and
164, respectively.
Qualified Institutions Placement
The Issue is being made to Eligible QIBs in accordance with Chapter VIII of the SEBI Regulations and Section 42 of the
Companies Act, 2013, through a qualified institutions placement. Under Chapter VIII of the SEBI Regulations and Section
42 of the Companies Act, 2013, a listed issuer in India may issue equity shares, non-convertible debt instruments along
with warrants and convertible securities (other than warrants) to QIBs, provided, inter alia, that:
a special resolution approving the qualified institutions placement has been passed by its shareholders. Such
special resolution must specify (i) that the allotment of the Equity Shares is proposed to be made pursuant to the
qualified institutions placement; and (ii) the relevant date;
equity shares of the same class of such issuer, which are proposed to be allotted through the qualified institutions
placement or pursuant to conversion or exchange of eligible securities, are listed on a recognized stock exchange
in India that has nation-wide trading terminals for a period of at least one year prior to the date of issuance of
notice to its shareholders for convening the meeting to pass the above-mentioned special resolution;
such issuer should have completed allotments with respect to any offer or invitation made, or should have
withdrawn, or abandoned any invitation or offer made by the issuer;
the aggregate of the proposed issue and all previous qualified institutions placements made by the issuer in the
same financial year does not exceed five times the net worth (as defined in the SEBI Regulations) of the issuer
as per the audited balance sheet of the previous financial year;
the offer must be made through a private placement offer letter and an application form serially numbered and
addressed specifically to the QIB to whom the offer is made and is sent to such QIBs within 30 days of recording
the names of such QIBs;
the payment to be made for subscription to the equity shares shall be made from the bank account of the person
subscribing to such securities and in case of securities to be held by joint holders, the payment for subscription
to the securities shall be paid from the bank account of the person whose name appears first in the application;
prior to circulating the private placement offer letter, the issuer must prepare and record a list of QIBs to whom
the offer will be made. The offer must be made only to such persons whose names are recorded by the issuer
prior to the invitation to subscribe;
the issuer shall offer to each allottee such number of equity shares in the issue which would aggregate to at least
₹ 20,000 calculated at the face value of the equity shares; and
at least 10% of the equity shares issued to QIBs must be allotted to Mutual Funds, provided that, if this portion
or any part thereof to be allotted to Mutual Funds remains unsubscribed, it may be allotted to other QIBs.
Bidders are not allowed to withdraw their Bids after the Bid/Issue Closing Date.
Bidders will be required to make certain certifications in order to participate in the Issue including that they are either (i)
outside the U.S. and purchasing the Equity Shares in an offshore transaction (as defined in Regulation S) or (ii) a “qualified
institutional buyer” as defined in Rule 144A. For further details, please see the section entitled “Representations by
Investors” on page 4.
Additionally, there is a minimum pricing requirement for pricing the equity shares offered in a qualified institutions
placement under the SEBI Regulations. The floor price of the equity shares shall not be less than the average of the weekly
high and low of the closing prices of the equity shares of the same class quoted on the stock exchange during the two

146
weeks preceding the relevant date as calculated in accordance with Chapter VIII of the SEBI Regulations. Provided
however that an issuer may offer a discount of not more than 5% on the price so calculated for the qualified institutions
placement as above, subject to the approval of the shareholders by a special resolution pursuant to Regulation 82(a) of the
SEBI Regulations.
The “relevant date” referred to above, means the date of the meeting in which the board of directors or the committee of
directors duly authorized by the board of directors decides to open the proposed issue and the “stock exchange” means
any of the recognised stock exchanges in India on which the equity shares of the issuer of the same class are listed and on
which the highest trading volume in such equity shares has been recorded during the two weeks immediately preceding
the relevant date.
Equity shares must be allotted within 12 months from the date of the shareholders resolution approving the qualified
institutions placement and also within 60 days from the date of receipt of application money from the successful applicants.
The equity shares issued pursuant to the qualified institutions placement must be issued on the basis of a placement
document that shall contain all material information including the information specified in Schedule XVIII of the SEBI
Regulations and Form PAS- 4.
The Preliminary Placement Document and this Placement Document are private documents provided to only select
Eligible QIBs, through serially numbered copies and are required to be placed on the website of the stock exchanges
concerned and of the issuer with a disclaimer to the effect that they are in connection with an issue to QIBs and no offer
is being made to the public or to any other category of investors.
Securities allotted to a QIB pursuant to a qualified institutions placement shall not be sold by the allottee for a period of
one year from the date of allotment except on a recognised stock exchange in India.
The minimum number of allottees for each QIP shall not be less than:
Two, where the issue size is less than or equal to ₹ 250 crore; and
Five, where the issue size is greater than ₹ 250 crore.
No single allottee shall be allotted more than 50% of the issue size. QIBs that belong to the same group or that are under
same control shall be deemed to be a single allottee for this purpose.
The issuer shall also make the requisite filings with the relevant registrar of companies, Stock Exchanges, and SEBI within
the stipulated period as required under the Companies Act, 2013 and the PAS Rules.
Our Company has filed a copy of the Preliminary Placement Document and this Placement Document with the Stock
Exchanges.
Our Company has received in-principle approval from each of the Stock Exchanges on June 13, 2018 in terms of
Regulation 28(1) of the SEBI Listing Regulations for the Issue. The Board of Directors has authorized the Issue pursuant
to a resolution passed at its meeting held on April 24, 2018. The shareholders of our Company have authorized the Issue
pursuant to a special resolution passed on June 5, 2018.
The Equity Shares have not been, and will not be registered, under the Securities Act or any other applicable law
of the United States and, unless so registered, may not be offered or sold within the United States, except pursuant
to an exemption from, or in a transaction not subject to, the registration requirements of the Securities Act and
applicable state securities laws. Accordingly, the Equity Shares are only being offered and sold (i) within the United
States only to persons reasonably believed to be “qualified institutional buyers” (as defined in Rule 144A under the
Securities Act and referred to in this Placement Document as “U.S. QIBs”, for the avoidance of doubt, the term
U.S. QIBs does not refer to a category of institutional investor defined under applicable Indian regulations and
referred to in this Placement Document as “QIBs”) in transactions exempt from, or not subject to, the registration
requirements of the Securities Act, and (ii) outside the United States in offshore transactions in reliance on
Regulation S under the Securities Act and the applicable laws of the jurisdiction where those offers and sales occur.
For further information, please see the sections entitled “Selling Restrictions” and “Transfer Restrictions” on pages
157 and 164, respectively.
Issue Procedure
1. Our Company or the Book Running Lead Managers shall circulate serially numbered copies of the Preliminary
Placement Document and the serially numbered Application Form, either in electronic form or physical form, to
Eligible QIBs and the Application Form shall be specifically addressed to such Eligible QIBs. Pursuant to section
42(7) of the Companies Act, 2013, our Company shall maintain complete record of the Eligible QIBs to whom
the Preliminary Placement Document and the serially numbered Application Form have been dispatched. Our
Company will make the requisite filings with the RoC and with SEBI within the stipulated time period as required
under the Companies Act, 2013 and the rules made thereunder.

147
2. The list of Eligible QIBs to whom the Preliminary Placement Document and the Application Form is delivered
shall be determined by our Company at its sole discretion in consultation with the Book Running Lead Managers.
Unless a serially numbered Preliminary Placement Document along with the Application Form is
addressed to a particular Eligible QIB, no invitation shall be deemed to have been made to such Eligible
QIB to make an offer to subscribe to Equity Shares pursuant to the Issue. Even if such documentation were
to come into the possession of any person other than the intended recipient, no offer or invitation to offer shall
be deemed to have been made to such other person and any Bid that does not comply with this requirement shall
be treated as invalid.
3. Eligible QIBs may submit the Application Form, including any revisions thereof, during the Bid/Issue Period to
the Book Running Lead Managers.
4. Bidders shall submit Bids for, and our Company shall issue and allot to each Allottee at least such number of
Equity Shares in the Issue which would aggregate to ₹ 20,000 calculated at the face value of the Equity Shares.
5. Eligible QIBs will be required to indicate the following in the Application Form:
a. name of the Eligible QIB to whom Equity Shares are to be Allotted;
b. number of Equity Shares Bid for;
c. price at which they are agreeable to subscribe for the Equity Shares provided that Eligible QIBs may
also indicate that they are agreeable to submit a bid at the “Cut-off Price” which shall be any price as
may be determined by our Company at its discretion in consultation with the Book Running Lead
Managers at or above the Floor Price, net of such discount as approved in accordance with SEBI
Regulations and decided by the Board/ Committee of Directors. Our Company has offered a discount of
not more than 5% to the Floor Price in accordance with the proviso of Regulation 85(1) of the SEBI
Regulations;
d. a representation that it is either (i) outside the United States and acquiring the Equity Shares in an
offshore transaction under Regulation S, or (ii) an institutional investor that is a “qualified institutional
buyer” as defined in Rule 144A, and it has agreed to certain other representations set forth in the
Application Form; and
e. the details of the beneficiary account(s) maintained with the Depository Participants to which the Equity
Shares should be credited.
Eligible FPIs are required to indicate their SEBI registration number in the Application Form.
6. Once a duly filled in Application Form is submitted by an Eligible QIB, such Application Form constitutes an
irrevocable offer and the same cannot be withdrawn after the Bid/Issue Closing Date. The Bid/Issue Closing Date
shall be notified to the Stock Exchanges and the Eligible QIBs shall be deemed to have been given notice of such
date after the receipt of the Application Form.
7. The Bids made by asset management companies or custodians of Mutual Funds shall specifically state the names
of the schemes concerned for which the Bids are made. In case of a Mutual Fund, a separate Bid can be made in
respect of each scheme of the mutual fund registered with SEBI and such Bids in respect of more than one scheme
of the Mutual Fund will not be treated as multiple Bids provided that the Bids clearly indicate the scheme for
which the Bid has been made. Bids by various schemes or funds of a Mutual Fund will be treated as one Bid from
the Mutual Fund. Under the current regulations, the following restrictions are applicable for investments by
Mutual Funds: No mutual fund scheme shall invest more than 10% of its net asset value in Equity Shares or
equity related instruments of any company provided that the limit of 10% shall not be applicable for investments
in index funds or sector or industry specific funds. No mutual fund under all its schemes should own more than
10% of any company's paid-up capital carrying voting rights. Bidders are advised to ensure that any single Bid
from them does not exceed the investment limits or maximum number of Equity Shares that can be held by them
under applicable laws.
8. Based on the Application Forms received, our Company shall, at its discretion, after closure of the Issue, in
consultation with the Book Running Lead Managers, determine the final terms including the Issue Price, the
number of Equity Shares to be issued pursuant to the Issue and the QIBs to whom such Equity Shares shall be
allocated. We shall notify the Stock Exchanges of the Issue Price. Our Company shall also intimate the Stock
Exchanges about the meeting to decide the Issue Price, two working days in advance (excluding the date of the
intimation and the date of the meeting). On determining the Issue Price and the Eligible QIBs to whom Allocation
shall be made, the Book Running Lead Managers, shall on behalf of our Company, send the CANs along with a
serially numbered Placement Document to the Eligible QIBs who have been Allocated Equity Shares either in
electronic form or by physical delivery. The dispatch of the CANs shall be deemed a valid, binding and
irrevocable contract for the Eligible QIBs to pay the entire Issue Price for all the Equity Shares Allocated to such

148
Eligible QIB. The CAN shall contain details such as the number of Equity Shares Allocated to the Eligible QIB,
payment instructions including the details of the amounts payable by the Eligible QIB for Allotment of the Equity
Shares in its name and the Pay-In Date as applicable to the respective Eligible QIBs.
Following the receipt of the CAN, each Eligible QIB would have to make the payment of the entire application
monies for the Equity Shares indicated in the CAN at the Issue Price through electronic transfer to the Escrow
Account by the Pay-in Date as specified in the CAN sent to the respective QIB. Please note that the allocation
shall be at the absolute discretion of our Company and will be based on consultation with the Book
Running Lead Managers.
9. No payment shall be made by Eligible QIBs in cash. Please note that any payment of application monies for the
Equity Shares shall be made from the bank accounts of the relevant Eligible QIBs applying for the Equity Shares
and our Company shall keep a record of the bank accounts from where such payment for subscriptions have been
received. Monies payable on Equity Shares to be held by joint holders shall be paid from the bank account of the
person whose name appears first in the Application Form. Pending Allotment, all monies received for
subscription of the Equity Shares shall be kept by our Company in a separate bank account with a scheduled bank
and shall be utilised only for the purposes permitted under the Companies Act, 2013.
10. Upon receipt of the application monies from the Eligible QIBs, our Company shall Allot Equity Shares as per the
details in the CAN to the Eligible QIBs. Our Company will intimate the details of the Allotment to the Stock
Exchanges.
11. After passing the resolution for Allotment, our Company will intimate to the Stock Exchanges the details of the
Allotment and apply for approvals for listing of the Equity Shares on the Stock Exchanges prior to crediting the
Equity Shares into the beneficiary account maintained with the Depository Participant by the Eligible QIBs.
12. After receipt of the listing approvals from the Stock Exchanges, our Company shall credit the Equity Shares into
the beneficiary account maintained with the Depository Participant accounts of the respective Eligible QIB in
accordance with the details submitted by the Eligible QIBs in the Application Forms.
13. Our Company shall then apply to Stock Exchanges for the final listing and trading permission.
14. The Equity Shares that have been credited to the beneficiary account maintained with the Depository Participant
of the Eligible QIBs shall be eligible for trading on the Stock Exchanges only upon the receipt of final listing and
trading approval from Stock Exchanges.
15. Upon receipt of the final listing and trading approval from the Stock Exchanges, our Company shall inform the
Eligible QIBs who have received Allotment of the receipt of such approval.
16. Our Company and the Book Running Lead Managers shall not be responsible for any delay or non-receipt of the
communication of the final listing and trading permissions from the Stock Exchanges or any loss arising from
such delay or non-receipt. Final listing and trading approval granted by the Stock Exchanges is also placed on
their respective websites. Eligible QIBs are advised to apprise themselves of the status of the receipt of the
permissions from Stock Exchanges or our Company.
Qualified Institutional Buyers
Only QIBs as defined in Regulation 2(1)(zd) of the SEBI Regulations and not otherwise excluded pursuant to Regulation
86(1)(b) of Chapter VIII of the SEBI Regulations are eligible to invest in the Issue. Under Regulation 86(1)(b) of the SEBI
Regulations, no Allotment shall be made, either directly or indirectly, to any Eligible QIB who is a Promoter or any person
related to the Promoter.
Eligible FPIs applying under Schedule 2 of the FEMA 2017 will be considered as Eligible QIBs in addition to other non-
resident QIBs. FVCIs are not permitted to participate in the Issue. Further, Eligible FPIs may invest in such number of
Equity Shares such that the total FPI investment in our Company does not exceed 30% of the post-Issue paid-up capital
of our Company on a fully diluted basis.
In terms of the SEBI Regulations, QIBs include:
AIFs;
Eligible FPIs;
FVCIs;
Insurance companies registered with Insurance Regulatory and Development Authority;
Insurance funds set up and managed by the army, navy, or air force of the Union of India;

149
Insurance funds set up and managed by the Department of Posts, India;
Multilateral and bilateral development financial institutions;
Mutual funds registered with SEBI;
Pension Funds with minimum corpus of ₹ 25 crore;
Provident Funds with minimum corpus of ₹ 25 crore;
Public financial institutions as defined in section 2(72) of the Companies Act, 2013;
Scheduled commercial banks;
State industrial development corporations;
National Investment Fund set up by resolution no. F. No. 2/3/2005-DDII dated November 23, 2005 of the
Government of India published in the Gazette of India;
Venture capital funds registered with SEBI; and
Systemically important non- banking financial companies registered with the RBI having a net-worth of more
than ₹ 500 crore as per their last audited financial statements.
Eligible FPIs participating in the Issue under Schedule 2 of the FEMA 2017, are permitted to participate in the
Issue in addition to other non-resident QIBs. FVCIs are not permitted to participate in the Issue. Further, Eligible
FPIs may invest in such number of Equity Shares such that the total FPI investment in our Company does not
exceed 30% of the post-Issue paid-up capital of our Company on a fully diluted basis.
All non-resident Eligible QIBs shall ensure that the investment amount is paid as per RBI’s Notification No. FEMA
20(R)/ 2017-RB dated November 7, 2017, as amended from time to time.
In terms of the SEBI FPI Regulations, the issue of Equity Shares to a single FPI or an investor group (which means the
same set of ultimate beneficial owner(s) investing through multiple entities) is not permitted to be 10% or above of our
post-Issue Equity Share capital. Further, in terms of the FEMA, the total holding by each FPI shall be below 10% of the
total paid-up Equity Share capital of our Company and the total holdings of all FPIs put together shall not exceed 24% of
our paid-up Equity Share capital. The aggregate limit of 24% may be increased up to the sectoral cap by way of a resolution
passed by the Board of Directors followed by a special resolution passed by the shareholders of our Company. Currently
the FPI limit of our Company is 30% of our paid-up Equity Share capital.
Eligible FPIs are permitted to participate in the Issue subject to compliance with conditions and restrictions which may be
specified by the Government from time to time.
In terms of FEMA 2017, for calculating the aggregate holding of FPIs in a company, holding of all registered FPIs shall
be included.
Under Regulation 86(1)(b) of the SEBI Regulations, no allotment shall be made pursuant to the Issue, either directly or
indirectly, to any Eligible QIB being our Promoter or any person related to our Promoter. Eligible QIBs which have all or
any of the following rights shall be deemed to be persons related to our Promoter:
i Rights under a shareholders’ agreement or voting agreement entered into with our Promoter or persons related to
our Promoter;
ii Veto rights; or
iii A right to appoint any nominee director on the Board.
Provided however that an Eligible QIB which does not hold any Equity Shares in our Company and who has acquired the
aforesaid rights in the capacity of a lender shall not be deemed to be a person related to the Promoter.
Neither our Company nor the Book Running Lead Managers nor any of their respective directors, officers, counsel,
advisors, representatives, agents or affiliates are liable for any amendments or modification or changes in
applicable laws or regulations, which may occur after the date of this Placement Document. Eligible QIBs are
advised to make their independent investigations and satisfy themselves that they are eligible to apply. Eligible
QIBs are advised to ensure that any single Application Form from them does not exceed the investment limits or
maximum number of Equity Shares that can be held by them under applicable law or regulation or as specified in
this Placement Document. Further, Eligible QIBs are required to satisfy themselves that any requisite compliance
pursuant to this Allotment such as public disclosures under applicable laws is complied with. Eligible QIBs are

150
advised to consult their advisers in this regard. Furthermore, Eligible QIBs are required to satisfy themselves that
their Application Form would not eventually result in triggering an open offer under the Takeover Regulations.
Note: Affiliates or associates of the Book Running Lead Managers who are Eligible QIBs may participate in the Issue
subject to compliance with applicable laws.
Allotments made to VCFs and AIFs in the Issue are subject to the rules and regulations that are applicable to each of them
respectively, including in relation to lock-in requirements.
A minimum of 10% of the Equity Shares offered in the Issue shall be Allotted to Mutual Funds. If no Mutual Fund is
agreeable to take up the minimum portion as specified above, such minimum portion or part thereof may be Allotted to
other Eligible QIBs.
Bid Process
Application Form
Eligible QIBs are permitted to only use the serially numbered Application Forms (which is addressed to the Eligible QIB)
supplied by our Company or the Book Running Lead Managers in either electronic form or by physical delivery for the
purpose of making a Bid (including any revision of a Bid) in terms of the Preliminary Placement Document.
By making a Bid (including revisions thereof) for Equity Shares pursuant to the terms of the Preliminary Placement
Document, each Eligible QIB will be deemed to have made the following representations and warranties, and the
representations, warranties, acknowledgements and agreements made under section entitled “Representations by
Investors”. The representations listed in this section shall be included in the Application Form:
1. The Eligible QIB confirms that it is a QIB in terms of Regulation 2(1)(zd) of the SEBI Regulations and has a
valid and existing registration under the applicable laws of India and is eligible to participate in the Issue and is
not excluded under Regulation 86 of the SEBI Regulations;
2. The Eligible QIB confirms that in the event it is a foreign portfolio investor, it is an Eligible FPI, and is applying
in the Issue under Schedule 2 of the FEMA 2017;
3. The Eligible QIB confirms that it is not a Promoter of our Company and is not a person related to the Promoter
of our Company, either directly or indirectly and its Application Form does not directly or indirectly represent
the Promoter or Promoter Group or a person related to the Promoter of our Company;
4. The Eligible QIB confirms that it has no rights under a shareholders’ agreement or voting agreement with the
Promoter or persons related to the Promoter, no veto rights or right to appoint any nominee director on the Board
of our Company other than such rights acquired in the capacity of a lender (not holding any Equity Shares);
5. The Eligible QIB acknowledges that it has no right to withdraw its Bid after the Bid/Issue Closing Date;
6. The Eligible QIB confirms that if Equity Shares are Allotted pursuant to the Issue, it shall not, for a period of one
year from Allotment, sell such Equity Shares otherwise than on the floor of the recognized Stock Exchanges;
7. The Eligible QIB confirms that the Eligible QIB is eligible to Bid and hold Equity Shares so Allotted and together
with any Equity Shares held by the Eligible QIB prior to the Issue. The Eligible QIB further confirms that its
holding of the Equity Shares does not, and shall not, exceed the level permissible as per any applicable regulations
applicable to the Eligible QIB;
8. The Eligible QIB confirms that the Bids will not eventually result in triggering an open offer under the Takeover
Regulations;
9. The Eligible QIB confirms that, together with other Eligible QIBs participating in the Issue that belongs to the
same group or is under same control, the Allotment to the Eligible QIB shall not exceed 50% of the Issue Size.
For the purposes of this statement:
a. The expression “belongs to the same group” shall derive meaning from the concept of “companies under
the same group” as provided in Section 372(11) of the Companies Act, 1956; and
b. “Control” shall have the same meaning as is assigned to it by Clause 1(e) of Regulation 2 of the Takeover
Regulations.
10. The Eligible QIBs shall not undertake any trade in the Equity Shares credited to its Depository Participant account
until such time that the final listing and trading approval for the Equity Shares is issued by the Stock Exchanges.
11. The Eligible QIB acknowledges, represents and agrees that in the event its total interest in the paid-up share
capital of our Company or voting rights in our Company, whether direct or indirect, beneficial or otherwise (any

151
such interest, your “Holding”), when aggregated together with any existing Holding and/or Holding of any of
the persons acting in concert, results in Holding of 5.00% or more of the total paid-up share capital of, or voting
rights in, our Company, a disclosure of the aggregate shareholding and voting rights will have to be made under
the Takeover Regulations. In case such Eligible QIB is an existing shareholder who, together with persons acting
in concert, holds 5.00% or more of the underlying paid up share capital of, or voting rights in our Company a
disclosure will have to be made under the Takeover Regulations in the event of a change of 2% or more in the
existing Holding of the Eligible QIB and persons acting in concert.
12. The Eligible QIB confirms that:
a) If it is within the United States, it is a qualified institutional buyer (as defined in Rule 144A under the
Securities Act and referred to in this Placement Document as “U.S. QIB”) who is, or are acquiring the
Equity Shares for its own account or for the account of an institutional investor who also meets the
requirement of a U.S. QIB, for investment purposes only and not with a view to, or for resale in
connection with, the distribution (within the meaning of any United States securities laws) thereof, in
whole or in part and are not our affiliate or a person acting on behalf of such an affiliate;
b) If it is outside the United States, it is subscribing to the Equity Shares in an offshore transaction in
reliance on Regulation S under the U.S. Securities Act, and is not our affiliate or a person acting on
behalf of such an affiliate.
13. It has read and understood, and by making a Bid for the Equity Shares through the Application Forms and
pursuant to the terms of the Preliminary Placement Document, will be deemed to have made the representations,
warranties and agreements made under the sections entitled “Notice to Investors”, “Representations by
Investors”, “Selling Restrictions” and “Transfer Restrictions” on pages 1, 4, 157 and 164, respectively.
ELIGIBLE QIBs MUST PROVIDE THEIR PAN, DEPOSITORY ACCOUNT DETAILS, THEIR DEPOSITORY
PARTICIPANT’S NAME, DEPOSITORY PARTICIPANT IDENTIFICATION NUMBER AND BENEFICIARY
ACCOUNT NUMBER IN THE APPLICATION FORM. ELIGIBLE QIBs MUST ENSURE THAT THE NAME
GIVEN IN THE APPLICATION FORM IS EXACTLY THE SAME AS THE NAME IN WHICH THE
DEPOSITORY ACCOUNT IS HELD.
IF SO REQUIRED BY THE BOOK RUNNING LEAD MANAGERS, THE ELIGIBLE QIB SUBMITTING A
BID, ALONG WITH THE APPLICATION FORM, WILL ALSO HAVE TO SUBMIT REQUISITE
DOCUMENT(S) TO THE BOOK RUNNING LEAD MANAGERS TO EVIDENCE THEIR STATUS AS A “QIB”
AS DEFINED HEREINABOVE. IF SO REQUIRED BY THE BOOK RUNNING LEAD MANAGERS, THE
ESCROW AGENT OR ANY STATUTORY OR REGULATORY AUTHORITY IN THIS REGARD,
INCLUDING AFTER THE BID/ISSUE CLOSING DATE, THE ELIGIBLE QIB SUBMITTING A BID AND/OR
BEING ALLOTTED EQUITY SHARES IN THE ISSUE, WILL ALSO HAVE TO SUBMIT REQUISITE
DOCUMENT(S) TO FULFILL THE KNOW YOUR CUSTOMER (KYC) NORMS.
Demographic details such as an address and a bank account will be obtained by the Book Running Lead Managers from
the Depositories as per the Depository Participant account details given above.
The submission of an Application Form by the Eligible QIB shall be deemed a valid, binding and irrevocable offer for the
Eligible QIB to pay the entire Issue Price for its share of Allotment (as indicated by the CAN) and becomes a binding
contract on the Eligible QIB, upon issuance of the CAN by the Issuer in favour of the Eligible QIB.
Submission of Application Form
All Application Forms shall be required to be duly completed with information including the name of the Eligible QIB,
the price and the number of Equity Shares applied. The Application Form shall be submitted to any of the Book Running
Lead Managers either through electronic form or through physical delivery at the following addresses:
Name of the Book
Running Lead
Managers
Address Contact Person E-mail Phone (Telephone and
Fax)
JM Financial
Limited
7th Floor, Cnergy, Appasaheb
Marathe Marg, Prabhadevi,
Mumbai 400 025
Hiren
Raipancholia
[email protected] Tel: +91 22 6630 3030
Fax: +91 22 6630 3330
Morgan Stanley
India Company
Private Limited
18F, Tower 2, One Indiabulls
Centre, 841, Senapati Bapat
Marg, Mumbai 400 013
Urvish
Rambhia
oberoiqip@morganstanley.
com
Tel: +91 22 6118 1000
Fax: +91 22 6118 1040
The Book Running Lead Managers shall not be required to provide any written acknowledgement of such submission.
Bank Account Details

152
Each Eligible QIB shall mention the details of the bank account from which the payment has been made along with a
confirmation that the payment has been made from such account.
Permanent Account Number or PAN
Each Eligible QIB should mention its Permanent Account Number (“PAN”) allotted under the IT Act. The copy of the
PAN card is required to be submitted with the Application Form. Bids without this information will be considered
incomplete and is liable to be rejected. It is to be specifically noted that an Eligible QIB should not submit the GIR number
instead of the PAN as the Application Form is liable to be rejected on this ground.
Pricing and Allocation
Build-up of the book
The Eligible QIBs shall submit their Bids (including the revision thereof) through the Application Form within the Bidding
Period to the Book Running Lead Managers and cannot be withdrawn after the Bid/ Issue Closing Date. The book shall
be maintained by the Book Running Lead Managers.
Price discovery and Allocation
Our Company at its discretion, in consultation with the Book Running Lead Managers, shall determine the Issue Price for
the Equity Shares, which shall be at or above the Floor Price. Our Company has offered a discount of not more than 5%
on the Floor Price in terms of Regulation 85(1) of the SEBI Regulations.
After finalisation of the Issue Price, our Company has updated the Preliminary Placement Document with the Issue details
and filed the same with Stock Exchanges as this Placement Document.
Method of Allocation
Our Company shall determine the Allocation in consultation with the Book Running Lead Managers on a discretionary
basis and in compliance with Chapter VIII of the SEBI Regulations.
Bids received from the Eligible QIBs at or above the Issue Price shall be grouped together to determine the total demand.
The Allocation to all such Eligible QIBs will be made at the Issue Price. Allocation to Mutual Funds for up to a minimum
of 10% of the Issue Size shall be undertaken subject to valid Application Form being received at or above the Issue Price.
THE DECISION OF OUR COMPANY, IN CONSULTATION WITH THE BOOK RUNNING LEAD
MANAGERS, IN RESPECT OF ALLOCATION SHALL BE FINAL AND BINDING ON ALL ELIGIBLE QIBs.
ELIGIBLE QIBs MAY NOTE THAT ALLOCATION OF EQUITY SHARES IS AT THE SOLE AND
ABSOLUTE DISCRETION OF OUR COMPANY, IN CONSULTATION WITH THE BOOK RUNNING LEAD
MANAGERS, AND ELIGIBLE QIBs MAY NOT RECEIVE ANY ALLOCATION EVEN IF THEY HAVE
SUBMITTED VALID APPLICATION FORMS AT OR ABOVE THE ISSUE PRICE. NEITHER OUR
COMPANY NOR THE BOOK RUNNING LEAD MANAGERS ARE OBLIGED TO ASSIGN ANY REASONS
FOR SUCH NON-ALLOCATION.
All Application Forms duly completed along with payment and a copy of the PAN card or PAN allotment letter shall be
submitted to the Book Running Lead Managers as per the details provided in the respective CAN.
CAN
Based on the Application Forms received, our Company, in consultation with the Book Running Lead Managers, will, in
its sole and absolute discretion, decide the list of Eligible QIBs to whom the serially numbered CAN shall be sent, pursuant
to which the details of the Equity Shares Allocated to them and the details of the amounts payable for Allotment of the
same in their respective names shall be notified to such Eligible QIBs. Additionally, the CAN would include details of
Escrow Account into which such payments would need to be made, Pay-In Date as well as the probable Designated Date.
The Eligible QIBs who have been Allotted Equity Shares pursuant to the Issue, would also be sent a serially numbered
Placement Document either in electronic form or by physical delivery along with the serially numbered CAN.
The dispatch of the serially numbered Placement Document and the CAN to the Eligible QIB shall be deemed a valid,
binding and irrevocable contract for the Eligible QIB to furnish all details that may be required by the Book Running Lead
Managers and our Company and to pay the entire Issue Price for all the Equity Shares Allocated to such Eligible QIB.
ELIGIBLE QIBs ARE ADVISED TO INSTRUCT THEIR DEPOSITORY PARTICIPANT TO ACCEPT THE
EQUITY SHARES THAT MAY BE ALLOCATED / ALLOTTED TO THEM PURSUANT TO THE ISSUE.
Bank Account for the Payment of Bid Money

153
Our Company has opened an escrow account titled “Oberoi Realty Limited-QIP-2018-19” (the “Escrow Account”) with
the Escrow Agent in terms of the arrangements amongst our Company, the Book Running Lead Managers and the Escrow
Agent. The Eligible QIBs will be required to deposit the entire amount payable for the Equity Shares Allocated to it by
the Pay-In Date as mentioned in their respective CAN.
Payments are to be made only through electronic fund transfer. Payments through cheques are liable to be rejected.
If the payment is not made favouring the Escrow Account within the time stipulated in the CAN, the Application Form
and the CAN of the Eligible QIB are liable to be cancelled.
In case of cancellations or default by the Eligible QIBs, our Company at its sole and absolute discretion in consultation
with the Book Running Lead Managers has the right to re-allocate the Equity Shares at the Issue Price among existing or
new Eligible QIBs, subject to the compliance with the requirements of the Companies Act, 2013 and the SEBI Regulations.
Our Company undertakes to utilise the amount in the Escrow Account only for the purposes of: (i) adjustments against
Allotment of Equity Shares in the Issue; or (ii) repayment of application money if our Company is not able to Allot Equity
Shares in the Issue.
Designated Date and Allotment of Equity Shares
1. The Equity Shares will not be Allotted unless the Eligible QIBs pay the Issue Price to the Escrow Account as
stated above.
2. Subject to the satisfaction of the terms and conditions of the Placement Agreement, our Company will ensure
that the Allotment of the Equity Shares is completed by the Designated Date provided in the CAN for the Eligible
QIBs who have paid the aggregate subscription amounts as stipulated in the CAN.
3. In accordance with the SEBI Regulations, Equity Shares will be issued and Allotment shall be made only in the
dematerialised form to the Allottees. Allottees will have the option to re-materialise the Equity Shares, if they so
desire, as per the provisions of the Companies Act, 2013 and the Depositories Act.
4. Our Company reserves the right to cancel the Issue at any time up to Allotment without assigning any reasons
whatsoever.
5. Post receipt of the in-principle approval of the Stock Exchanges, the Issuer shall credit the Equity Shares into the
Depository Participant accounts of the Eligible QIBs.
6. Following the Allotment and credit of Equity Shares pursuant to the Issue into the Eligible QIBs, Depository
Participant account, our Company will apply for final listing and trading approval for trading on the Stock
Exchanges.
7. In the event our Company is unable to Issue and Allot the Equity Shares or on cancellation of the Issue, within
60 days from the date of receipt of application money, in accordance with section 42 of the Companies Act, 2013
our Company shall repay the application money within 15 days from expiry of 60 days, failing which our
Company shall repay that money with interest at the rate of 12% per annum from expiry of the 60th day. The
application money to be refunded by us shall be refunded to the same bank account from which application money
was remitted by the Eligible QIBs.
8. The Escrow Agent shall release the monies lying to the credit of the Escrow Account to our Company after the
receipt of the final listing and trading approval from the Stock Exchanges.
9. In case of Eligible QIBs who have been Allotted more than 5% of the Equity Shares in the Issue, our Company
shall disclose the name and the number of the Equity Shares Allotted to such Eligible QIB to the Stock Exchanges
and Stock Exchanges shall make the same available on their website.
Other Instructions
Our Right to Reject Bids
Our Company at its discretion, in consultation with the Book Running Lead Managers, may reject Bids, in part or in full,
without assigning any reasons whatsoever. The decision of our Company and the Book Running Lead Managers in relation
to the rejection of Bids shall be final and binding.
Equity Shares in dematerialised form with NSDL or CDSL
1. The Allotment of the Equity Shares in the Issue shall be only in dematerialised form, (i.e., not in the form of
physical certificates but be fungible and be represented by the statement issued through the electronic mode).

154
2. An Eligible QIB applying for Equity Shares must have at least one beneficiary account with a Depository
Participant of either NSDL or CDSL prior to making the Bid.
3. Allotment to a successful Eligible QIB will be credited in electronic form directly to the beneficiary account (with
the Depository Participant) of the Eligible QIB.
4. Equity Shares in electronic form can be traded only on the stock exchanges having electronic connectivity with
NSDL and CDSL. The Stock Exchanges have electronic connectivity with NSDL and CDSL.
5. The trading of the Equity Shares would be in dematerialised form only for all Eligible QIBs in the demat segment
of Stock Exchanges.
6. Our Company will not be responsible or liable for the delay in the credit of the Equity Shares due to errors in the
Application Forms or on part of the Eligible QIBs.

155
PLACEMENT
Placement Agreement
The Book Running Lead Managers have entered into the Placement Agreement dated June 13, 2018 with our Company,
pursuant to which the Book Running Lead Managers have agreed to manage the Issue and to act as placement agents in
connection with the proposed Issue and to use their reasonable efforts to procure subscription for the Equity Shares to be
issued pursuant to the Issue.
The Placement Agreement contains customary representations, warranties and indemnities from our Company and the
Book Running Lead Managers, and it is subject to the satisfaction of certain conditions and termination in accordance
with the terms contained therein.
Applications shall be made to list the Equity Shares issued pursuant to the Issue and admit them to trading on the Stock
Exchanges. No assurance can be given as to the liquidity or sustainability of the trading market for such Equity Shares,
the ability of holders of the Equity Shares to sell their Equity Shares or the price at which holders of the Equity Shares
will be able to sell their Equity Shares.
This Placement Document has not been, and will not be, registered as a prospectus with the RoC and, no Equity Shares
issued pursuant to the Issue, will be offered in India or overseas to the public or any members of the public in India or any
other class of prospective investors, other than Eligible QIBs.
In connection with the Issue, the Book Running Lead Managers or their affiliates may, for their own account, subscribe to
the Equity Shares or enter into asset swaps, credit derivatives or other derivative transactions relating to the Equity Shares
to be issued pursuant to the Issue at the same time as the offer and sale of the Equity Shares, or in secondary market
transactions. As a result of such transactions, the Book Running Lead Managers may hold long or short positions in such
Equity Shares. These transactions may comprise a substantial portion of the Issue and no specific disclosure will be made
of such positions. Affiliates of the Book Running Lead Managers may purchase Equity Shares and be Allotted Equity
Shares for proprietary purposes and not with a view to distribute or in connection with the issuance of P-Notes. For further
details, please see the section entitled “Offshore Derivative Instruments” on page 9.
From time to time, the Book Running Lead Managers, and their affiliates and associates have engaged in, or may in the
future engage in, transactions with, and perform services, including but not limited to investment banking, advisory,
banking, trading services for our Company, the Subsidiaries, the Joint Ventures, group companies, affiliates and the
shareholders of our Company, as well as to their respective associates and affiliates, pursuant to which fee and
commissions have been paid, or will be paid, to the Book Running Lead Managers and their affiliates and associates.
Lock-up
Our Promoter shall not, without the prior written consent of the Book Running Lead Managers, during the period
commencing on the Closing Date and ending 60 days after the Closing Date (the “Lock-up Period”), directly or indirectly
(a) purchase, issue, offer, lend, sell, pledge, encumber, contract to purchase, contract to sell or otherwise dispose of or
grant options, issue warrants or offer rights entitling any person to subscribe or purchase any interest in any Equity Shares
held by our Promoter or any securities convertible into or exercisable or exchangeable for the Equity Shares held by our
Promoter; (b) enter into any swap or other agreement or any transaction that transfers, in whole or in part, directly or
indirectly, any of the economic consequences associated with the ownership of the Equity Shares held by our Promoter,
whether any such transaction is to be settled by the delivery of Equity Shares held by our Promoter or other securities
convertible into or exercisable or exchangeable for the Equity Shares held by our Promoter, in cash or otherwise; (c) sell,
lend, contract to sell, purchase any option or contract to sell, grant any option, right or warrant to purchase, lend or
otherwise transfer or dispose of, directly or indirectly, any shares or interest in an entity which holds any Equity Shares
held by our Promoter; or (d) publicly announce any intention to enter into any of the above described in (a), (b), or (c)
above. Provided that the above restrictions shall not be applicable, if any of the actions mentioned in (a), (b) or (c) above
are required to be undertaken pursuant to any change in applicable Law, or a direction of a court of law or the RBI, SEBI
or any other regulatory or governmental authority, after the date of the Placement Agreement. The restrictions provided
above shall be applicable to all Equity Shares held by our Promoter. Further, any Equity Shares acquired by our Promoter
during the Lock-up Period, either from the open market or inter-se transfer, shall constitute Lock-up Shares, and shall be
subject to the restrictions contained herein.
Our Company will not, for a period commencing the date of the Placement Agreement and 45 days after the Closing Date,
without the prior written consent of the Book Running Lead Managers, directly or indirectly (a) issue, offer, contract to
issue or otherwise dispose of or grant options, issue warrants or offer rights entitling person to subscribe or purchase any
interest in any Equity Shares or any securities convertible into or exercisable or exchangeable for Equity Shares (including,
without limitation, securities convertible into or exercisable or exchangeable for Equity Shares which may be deemed to
be beneficially owned); (b) enter into any swap or other agreement or any transaction that transfers, in whole or in part,
directly or indirectly, any of the economic consequences associated with the ownership of the Equity Shares or any
securities convertible into or exercisable or exchangeable for Equity Shares, regardless, whether any of the transaction is
to be settled by the delivery of Equity Shares or other securities convertible into or exercisable or exchangeable for the

156
Equity Shares, in cash or otherwise; (c) enter into any transaction (including a transaction involving derivatives) having
an economic effect similar to that of an issue, offer, sale or deposit of the Equity Shares in any depository receipt facility;
(d) contract to issue any option or contract to grant any option, right or warrant to purchase, lend or otherwise transfer or
dispose of, directly or indirectly, any shares or interest in an entity which holds any Equity Shares; or (e) publicly announce
any intention to enter into any of the above described in (a), (b), (c) or (d) above. Provided that the above restrictions shall
not be applicable to (i) the Issue; or (ii) any consolidation of our Company’s holding in, or restructuring involving its,
Subsidiaries, Joint Ventures, Joint Venture (Subsidiaries) or its affiliates.

157
SELLING RESTRICTIONS
The distribution of this Placement Document or any offering material and the offering, sale or delivery of the Equity
Shares is restricted by law in certain jurisdictions. Therefore, persons who may come into possession of this Placement
Document or any offering material are advised to consult with their own legal advisors as to what restrictions may be
applicable to them and to observe such restrictions. This Placement Document may not be used for the purpose of an offer
or invitation in any circumstances in which such offer or invitation is not authorized.
General
No action has been taken or will be taken that would permit a public offering of the Equity Shares to occur in any
jurisdiction other than India, or the possession, circulation or distribution of this Placement Document or any other material
relating to the Company or the Equity Shares in any jurisdiction where action for such purpose is required. Accordingly,
the Equity Shares may not be offered or sold, directly or indirectly, and neither this Placement Document nor any offering
materials or advertisements in connection with the Equity Shares may be distributed or published in or from any country
or jurisdiction except under circumstances that will result in compliance with any applicable rules and regulations of any
such country or jurisdiction. The Issue will be made in compliance with the applicable SEBI regulations. Each purchaser
of the Equity Shares in the Issue will be deemed to have made acknowledgments and agreements as described under the
section entitled “Transfer Restrictions” on page 164.
Australia
This document does not constitute a prospectus or other disclosure document under the Corporations Act 2001 (Cth)
(“Australian Corporations Act”) and does not purport to include the information required of a disclosure document
under the Australian Corporations Act. This document has not been lodged with the Australian Securities and Investments
Commission (“ASIC”) and no steps have been taken to lodge it as such with ASIC. Any offer in Australia of the Equity
Shares under this document may only be made to persons who are “sophisticated investors” (within the meaning of section
708(8) of the Australian Corporations Act), to “professional investors” (within the meaning of section 708(11) of the
Australian Corporations Act) or otherwise pursuant to one or more exemptions under section 708 of the Australian
Corporations Act so that it is lawful to offer the Equity Shares in Australia without disclosure to investors under Part 6D.2
of the Australian Corporations Act.
Any offer of the Equity Shares for on-sale that is received in Australia within 12 months after their issue by the Company,
or within 12 months after their sale by a selling security holder (or a Book Running Lead Manager) under the Issue, as
applicable, is likely to need prospectus disclosure to investors under Part 6D.2 of the Australian Corporations Act, unless
such offer for on-sale in Australia is conducted in reliance on a prospectus disclosure exemption under section 708 of the
Australian Corporations Act or otherwise. Any persons acquiring the Equity Shares should observe such Australian on-
sale restrictions.
Bahrain
This document has been prepared for private information purposes of intended investors only who will be accredited
investors. For this purpose, an “accredited investor” means: (i) an individual holding financial assets (either singly or
jointly with a spouse) of US$1,000,000 or more; (ii) a company, partnership, trust or other commercial undertaking which
has financial assets available for investment of not less than US$1,000,000; or (iii) a government, supranational
organization, central bank or other national monetary authority or a state organization whose main activity is to invest in
financial instruments (such as a state pension fund). This document is intended to be read by the addressee only.
No invitation has been made in or from the Kingdom of Bahrain and there will be no marketing or offering of the Equity
Shares to any potential investor in Bahrain. All marketing and offering is made and will be made outside of the Kingdom
of Bahrain. None of the Central Bank of Bahrain, the Bahrain Stock Exchange or any other regulatory authority in Bahrain
has reviewed, nor has it approved, this document or the marketing of Equity Shares and takes no responsibility for the
accuracy of the statements and information contained in this document, nor shall it have any liability to any person for any
loss or damage resulting from reliance on any statements or information contained herein. This document is not subject to
the regulations of the Central Bank of Bahrain that apply to public offerings of securities, and the extensive disclosure
requirements and other protections that these regulations contain.
Canada
The Equity Shares will not be qualified for sale under the securities laws of any province or territory of Canada. The
Equity Shares may not be offered, sold or distributed, directly or indirectly, in or to or for the benefit of a resident of any
province or territory of Canada except pursuant to an exemption from the requirement to file a prospectus in such province
or territory of Canada in which the offer or sale is made and only through a dealer duly registered under the applicable
securities laws of such provinces in circumstances where no exemption from the applicable registered dealer requirement
is available.
The Equity Shares may be sold only to purchasers in a province or territory of Canada purchasing, or deemed to be

158
purchasing, as principal that are accredited investors, as defined in National Instrument 45-106 Prospectus Exemptions
(“NI-45-106”) or subsection 73.3(1) of the Securities Act (Ontario), and are permitted clients, as defined in National
Instrument 31-103 Registration Requirements, Exemptions and Ongoing Registrant Obligations. Any resale of the Equity
Shares must be made in accordance with an exemption from, or in a transaction not subject to, the prospectus requirements
of applicable securities laws.
Securities legislation in certain provinces or territories of Canada may provide a purchaser with remedies for rescission or
damages if this Placement Document (including any amendment thereto) contains a misrepresentation, provided that the
remedies for rescission or damages are exercised by the purchaser within the time limit prescribed by the securities
legislation of the purchaser’s province or territory. The purchaser should refer to any applicable provisions of the securities
legislation of the purchaser’s province or territory for particulars of these rights or consult with a legal advisor.
Pursuant to section 3A.3 of National Instrument 33-105 Underwriting Conflict to comply with the disclosures (“NI 33-
105”), neither the Company nor the Book Running Lead Managers are required re requirements of NI 33-105 regarding
underwriter conflicts of interest in connection with the offering of Equity Shares.
Upon receipt of this Placement Document, each Canadian purchaser hereby confirms that it has expressly requested that
all documents evidencing or relating in any way to the sale of the securities described herein (including for greater certainty
any purchase confirmation or any notice) be drawn up in the English language only. Par la réception de ce document,
chaque acheteur canadien confirme par les présentes qu’il a expressément exigé que tous les documents faisant foi ou se
rapportant de quelque manière que ce soit à la vente des valeurs mobilières décrites aux présentes (incluant, pour plus de
certitude, toute confirmation d’achat ou tout avis) soient rédigés en anglais seulement.
Cayman Islands
This document does not constitute a public offer of the Equity Shares, whether by way of sale or subscription, in the
Cayman Islands. Each Book Running Lead Manager has represented and agreed that it has not offered or sold, and will
not offer or sell, directly or indirectly, any Equity Shares to any member of the public in the Cayman Islands.
People’s Republic of China
This Placement Document may not be circulated or distributed in the People’s Republic of China (the “PRC”) and the
Equity Shares may not be offered or sold directly or indirectly to any resident of the PRC, or offered or sold to any person
for reoffering or resale directly or indirectly to any resident of the PRC except pursuant to applicable laws and regulations
of the PRC. Neither this offering circular nor any advertisement or other offering material may be distributed or published
in the PRC, except under circumstances that will result in compliance with any applicable laws and regulations.
European Economic Area
In relation to each Member State of the EEA Area which has implemented the Directive 2003/71/EC (and any amendment
thereto, including Directive 2010/73/EU 2010, to the extent implemented in each relevant EEA Member State) and any
relevant implementing measure in each relevant EEA Member State (the “Prospectus Directive”) (each a “Relevant
Member State”), an offer to the public of any Equity Shares may not be made in that Relevant Member State, except if
the Equity Shares are offered to the public in that Relevant Member State at any time under the following exemptions
under the Prospectus Directive, if they have been implemented in that Relevant Member State:
to any legal entity which is a qualified investor as defined in the Prospectus Directive;
to fewer than 150 natural or legal persons (other than qualified investors as defined in the Prospectus Directive)
subject to obtaining the prior consent of the Book Running Lead Managers for any such offer; or
in any other circumstances falling within Article 3(2) of the Prospectus Directive,
provided that no such offer of Equity Shares shall result in a requirement for the publication by the Company or any of
the Book Running Lead Managers of a prospectus pursuant to Article 3 of the Prospectus Directive and each person who
initially acquires Equity Shares or to whom any offer is made will be deemed to have represented, warranted and agreed
to and with the Book Running Lead Managers and the Company that it is a “qualified investor” within the meaning of the
law in that relevant EEA Member State which has implemented Article 2(1)(e) of the Prospectus Directive.
For the purposes of this section, the expression an “offer of Equity Shares to the public” in relation to any Equity Shares
in any Relevant Member State means the communication in any form and by any means of sufficient information of the
terms of the offer and the Equity Shares to be offered so as to enable an investor to decide to purchase or subscribe for the
Equity Shares, as the same may be varied in that Relevant Member State by any measure implementing the Prospectus
Directive in that Relevant Member State.
In the case of any Equity Shares being offered to a financial intermediary, as that term is used in Article 3(2) of the
Prospectus Directive, such financial intermediary will also be deemed to have represented, acknowledged and agreed that
the Equity Shares subscribed for or acquired by it in the Offering have not been subscribed for or acquired on a non-
159
discretionary basis on behalf of, nor have they been subscribed for or acquired with a view to their offer or resale to persons
in circumstances which may give rise to an offer of any Equity Shares to the public other than their offer or resale in a
Relevant Member State to qualified investors (as so defined) or in circumstances in which the prior consent of the Book
Running Lead Managers has been obtained to each such proposed offer or resale. The Company, its directors, the Book
Running Lead Managers and their affiliates, and others will rely upon the truth and accuracy of the foregoing
representation, acknowledgement and agreement. Notwithstanding the above, a person who is not a qualified investor and
who has notified the Book Running Lead Managers of such fact in writing may, with the consent of the Book Running
Lead Managers, be permitted to subscribe for or purchase Equity Shares in the Offering.
Germany
The offering is not a public offering in the Federal Republic of Germany. The Equity Shares may be offered and sold in
the Federal Republic of Germany only in accordance with the provisions of the Securities Prospectus Act
(Wertpapierprospektgesetz) of the Federal Republic of Germany (the “German Securities Prospectus Act”) and any
other applicable German law. Consequently, in Germany the Equity Shares will only be available to, and this document
and any other offering material in relation to the Equity Shares is directed only at, persons who are qualified investors
(qualifizierte Anleger) within the meaning of Section 2 No. 6 of the German Securities Prospectus Act. Any resale of the
Equity Shares in Germany may only be made in accordance with the German Securities Prospectus Act and other
applicable laws. The Company has not, and does not intend to, file a securities prospectus with the German Federal
Financial Supervisory Authority (Bundesanstalt für Finanzdienstleistungsaufsicht) (“BaFin”) or obtain a notification to
BaFin from another competent authority of a member state of the European Economic Area, with which a securities
prospectus may have been filed, pursuant to Section 17(3) of the German Securities Prospectus Act.
Hong Kong
The Equity Shares may not be offered or sold in Hong Kong by means of any document other than (i) in circumstances
which do not constitute an offer to the public within the meaning of the Companies (Winding Up and Miscellaneous
Provisions) Ordinance (Cap. 32, Laws of Hong Kong), or (ii) to ‘‘professional investors’’ within the meaning of the
Securities and Futures Ordinance (Cap. 571, Laws of Hong Kong) and any rules made thereunder, or in other
circumstances which do not result in the document being a ‘‘prospectus’’ within the meaning of the Companies (Winding
Up and Miscellaneous Provisions) Ordinance (Cap. 32, Laws of Hong Kong) and no advertisement, invitation or document
relating to the shares may be issued or may be in the possession of any person for the purpose of issue (in each case
whether in Hong Kong or elsewhere), which is directed at, or the contents of which are likely to be accessed or read by,
the public in Hong Kong (except if permitted to do so under the laws of Hong Kong) other than with respect to shares
which are or are intended to be disposed of only to persons outside Hong Kong or only to ‘‘professional investors’’ within
the meaning of the Securities and Futures Ordinance (Cap. 571, Laws of Hong Kong) and any rules made thereunder.
Japan
The Equity Shares have not been and will not be registered under the Financial Instruments and Exchange Act of Japan
(Law. No. 25 of 1948 as amended) (the “FIEA”) and disclosure under the FIEA has not been and will not be made with
respect to the Equity Shares. No Equity Shares have, directly or indirectly, been offered or sold, and may not, directly or
indirectly, be offered or sold in Japan or to, or for the benefit of, any resident of Japan as defined in the first sentence of
Article 6, Paragraph 1, Item 5 of the Foreign Exchange and Foreign Trade Law of Japan (“Japanese Resident”) or to
others for re-offering or re-sale, directly or indirectly in Japan or to, or for the benefit of, any Japanese Resident except (i)
pursuant to an exemption from the registration requirements of the FIEA and (ii) in compliance with any other relevant
laws, regulations and governmental guidelines of Japan.
If an offeree does not fall under a “qualified institutional investor” (tekikaku kikan toshika), as defined in Article 10,
Paragraph 1 of the Cabinet Office Ordinance Concerning Definition Provided in Article 2 of the Financial Instruments
and Exchange Act (the “Qualified Institutional Investor”), the Equity Shares will be offered in Japan by a private
placement to small number of investors (shoninzu muke kanyu), as provided under Article 23-13, Paragraph 4 of the FIEA,
and accordingly, the filing of a securities registration statement for a public offering pursuant to Article 4, Paragraph 1 of
the FIEA has not been made.
If an offeree falls under the Qualified Institutional Investor, the Equity Shares will be offered in Japan by a private
placement to the Qualified Institutional Investors (tekikaku kikan toshikamuke kanyu), as provided under Article 23-13,
Paragraph 1 of the FIEA, and accordingly, the filing of a securities registration statement for a public offering pursuant to
Article 4, Paragraph 1 of the FIEA has not been made. To subscribe the Equity Shares (the “QII Equity Shares”) such
offeree will be required to agree that it will be prohibited from selling, assigning, pledging or otherwise transferring the
QII Equity Shares other than to another Qualified Institutional Investor.
Republic of Korea

160
We are not making any representation with respect to the eligibility of any recipients of this document to acquire the
Equity Shares therein under the laws of Korea, including, but without limitation, the Foreign Exchange Transaction Law
and Regulations thereunder. The Equity Shares have not been and will not be registered under the Financial Investment
Services and Capital Markets Act of Korea (the “FSCMA”). Accordingly, the Equity Shares may not be offered, sold or
delivered, or offered or sold to any person for re-offering or resale, directly or indirectly, in Korea or to, or for the account
or benefit of, any resident of Korea (as such term is defined under the Foreign Exchange Transaction Law of Korea and
its Enforcement Decree), for a period of one year from the date of issuance of the Equity Shares, except (i) where relevant
requirements are satisfied, the Equity Shares may be offered, sold or delivered to or for the account or benefit of a Korean
resident which falls within certain categories of qualified professional investors as specified in the FSCMA, its
Enforcement Decree and the Regulation on Securities Issuance and Disclosure promulgated thereunder, or (ii) as otherwise
permitted under applicable Korean laws and regulations.
Furthermore, the Equity Shares may not be re-sold to Korea residents unless the purchaser of the Equity Shares complies
with all applicable regulatory requirements (including, but not limited to, governmental approval requirements under the
Foreign Exchange Transaction Law and its subordinate decrees and regulations) in connection with purchase of the Equity
Shares.
Kuwait
This document is not for circulation in Kuwait and does not constitute an offer to sell, or the solicitation of an offer to
subscribe for or buy, the Equity Shares in Kuwait. The Equity Shares have not been licensed for offering in Kuwait by the
Kuwait Capital Markets Authority, the Ministry of Commerce and Industry or the Central Bank of Kuwait or any other
relevant Kuwaiti government agency. The offering of the Equity Shares in Kuwait on the basis of a private placement or
public offering is, therefore, restricted in accordance with Decree Law No. 31 of 1990 and the implementing regulations
thereto (as amended), Ministerial Order No. 113 of 1992 and Law No. 7 of 2010 and the bylaws thereto (as amended). No
private or public offering of the Equity Shares is being made in Kuwait, and no agreement relating to the sale of the Equity
Shares will be concluded in Kuwait. No marketing or solicitation or inducement activities are being used to offer or market
the Equity Shares in Kuwait.
Mauritius
The Equity Shares may not be offered, distributed or sold, directly or indirectly, in Mauritius or to any resident of
Mauritius, except as permitted by applicable Mauritius law, including but not limited to the Mauritius Securities Act. No
offer or distribution of securities will be made to the public in Mauritius.
New Zealand
No action has been or will be taken by the Book Running Lead Managers which would permit a public offering of any of
the Equity Shares, or possession or distribution of any offering material in relation to the Equity Shares to the public in
New Zealand other than pursuant to the exemptions set out below. Each Book Running Lead Manager represents and
agrees, that:
(i). it has not offered, sold or delivered and will not directly or indirectly offer, sell or deliver any of the Equity
Shares; and
(ii). it will not distribute any Placement Document or advertisement in relation to any offer of the Equity Shares;
in New Zealand other than:
to persons who are each required to pay a minimum subscription price for the Equity Shares of at least
NZ$500,000 (disregarding any amount lent by the offeror, the Company or any associated person of the offeror
or the Company); or
in other circumstances where there is no contravention of the Securities Act 1978 of New Zealand.
Each Book Running Lead Manager will be deemed to represent and agree that it has not offered or sold, and will not offer
or sell, any of the Equity Shares to persons whom it believes to be persons to whom any amounts payable on the Equity
Shares are or would be subject to New Zealand resident withholding tax, unless such persons certify that they hold a valid
certificate of exemption for New Zealand resident withholding tax purposes and provide a New Zealand tax file number
to such Book Running Lead Manager (in which event the Book Running Lead Manager shall provide details thereof to
the Company.
Sultanate of Oman
This document does not constitute a public offer of securities in the Sultanate of Oman, as contemplated by the Commercial
Companies Law of Oman (Royal Decree No. 4/1974) or the Capital Market Law of Oman (Royal Decree No. 80/1998)
and Ministerial Decision No.1/2009 or an offer to sell or the solicitation of any offer to buy non- Omani securities in the
Sultanate of Oman.

161
This document is strictly private and confidential. It is being provided to a limited number of sophisticated investors solely
to enable them to decide whether or not to invest in the Equity Shares outside of the Sultanate of Oman, upon the terms
and subject to the restrictions set out herein and may not be reproduced or used for any other purpose or provided to any
person other than the original recipient. Additionally, this document is not intended to lead to the making of any contract
within the territory or under the laws of the Sultanate of Oman.
The Capital Market Authority and the Central Bank of Oman take no responsibility for the accuracy of the statements and
information contained in this document or for the performance of the Company or the Equity Shares nor shall they have
any liability to any person for damage or loss resulting from reliance on any statement or information contained herein.
Qatar (excluding the Qatar Financial Centre)
This document and the offering of the Equity Shares have not been, and will not be: (i) lodged or registered with, or
reviewed or approved by, the Qatar Central Bank, the Qatar Financial Markets Authority the Ministry of Business and
Trade or any other governmental authority in the State of Qatar or (ii) authorized, permitted or licensed for offering or
distribution in Qatar, and the information contained in this document does not, and is not intended to, constitute a public
or general offer or other invitation in respect to the Equity Shares in the State of Qatar. Accordingly, the Equity Shares are
not being, and will not be, offered, issued or sold in the State of Qatar, and this document is not being, and will not be,
distributed in the State of Qatar. The offering, marketing, issue and sale of the Equity Shares and distribution of this
document is being made in, and is subject to the laws, regulations and rules of jurisdictions outside of the State of Qatar.
No application has been or will be made for the Equity Shares to be listed or traded on the Qatar Exchange or the QE
Venture Market.
This document is strictly private and confidential, and is being sent to a limited number of institutional and/or sophisticated
investors (a) upon their request and confirmation that they understand the statements above; and (b) on the condition that
it will not be provided to any person other than the original recipient, and is not for general circulation and may not be
reproduced or used for any other purpose.
Qatar Financial Centre
This document does not, and is not intended to, constitute an invitation or offer of securities from or within the Qatar
Financial Centre (the “QFC”), and accordingly should not be construed as such. This document has not been reviewed or
approved by or registered with the Qatar Financial Centre Authority, the Qatar Financial Centre Regulatory Authority or
any other competent legal body in the QFC. This document is strictly private and confidential, and may not be reproduced
or used for any other purpose, nor provided to any person other than the recipient thereof. The Company has not been
approved or licensed by or registered with any licensing authorities within the QFC.
Singapore
This Placement Document has not been registered as a prospectus with the Monetary Authority of Singapore. Accordingly,
this Placement Document and any other document or material in connection with the offer or sale, or invitation for
subscription or purchase, of any Equity Shares, whether directly or indirectly, to persons in Singapore other than (a) to an
institutional investor under Section 274 of the Securities and Futures Act, Chapter 289 of Singapore, or the Securities and
Futures Act, (b) to a relevant person pursuant to Section 275(1), or any person pursuant to Section 275(1A), and in
accordance with the conditions specified in Section 275, of the Securities and Futures Act, or (c) otherwise pursuant to,
and in accordance with the conditions of, any other applicable provision of the Securities and Futures Act.
Where the Equity Shares are subscribed or purchased under Section 275 of the Securities and Futures Act by a relevant
person which is:
(i). a corporation (which is not an accredited investor (as defined in Section 4A of the Securities and Futures Act))
the sole business of which is to hold investments and the entire share capital of which is owned by one or more
individuals, each of whom is an accredited investor; or
(ii). a trust (where the trustee is not an accredited investor) whose sole purpose is to hold investments and each
beneficiary of the trust is an individual who is an accredited investor:
securities (as defined in Section 239(1) of the Securities and Futures Act) of that corporation or the beneficiaries’ rights
and interest (howsoever described) in that trust shall not be transferred within six months after that corporation or that
trust has acquired the Equity Shares pursuant to an offer made under Section 275 of the Securities and Futures Act except:
to an institutional investor or to a relevant person defined in Section 275(2) of the Securities and Futures Act, or
to any person arising from an offer referred to in Section 275(1A) or Section 276(4)(i)(B) of the Securities and
Futures Act;
where no consideration is or will be given for the transfer;
where the transfer is by operation of law;

162
as specified in Section 276(7) of the Securities and Futures Act; or
as specified in Regulation 32 of the Securities and Futures (Offers of Investments) (Shares and Debentures)
Regulations 2005 of Singapore.
Switzerland
The Equity Shares may not be publicly offered in Switzerland and will not be listed on the SIX Swiss Exchange (“SIX”)
or on any other stock exchange or regulated trading facility in Switzerland. This document has been prepared without
regard to the disclosure standards for issuance prospectuses under Article 652a or Article 1156 of the Swiss Code of
Obligations or the disclosure standards for listing prospectuses under Articles 27 ff. of the SIX Listing Manual or the
listing rules of any other stock exchange or regulated trading facility in Switzerland. Neither this document nor any other
offering or marketing material relating to the Equity Shares or the Issue may be publicly distributed or otherwise made
publicly available in Switzerland.
Neither this document nor any other offering or marketing material relating to the Equity Shares or the Issue or us have
been or will be filed with or approved by any Swiss regulatory authority. In particular, this document will not be filed
with, and the Issue will not be supervised by, the Swiss Financial Market Supervisory Authority FINMA (“FINMA”), and
the Issue has not been and will not be authorized under the Swiss Federal Act on Collective Investment Schemes (“CISA”).
The investor protection afforded to acquirers of interests in collective investment schemes under the CISA does not extend
to acquirers of the Equity Shares.
The Equity Shares are being offered in Switzerland by way of a private placement, i.e., to a small number of selected
investors only, without any public offer and only to investors who do not purchase the Equity Shares with the intention to
distribute them to the public. The investors will be individually approached from time to time. This document, as well as
any other offering or marketing material relating to the Equity Shares, is confidential and it is exclusively for the use of
the individually addressed investors in connection with the offer of the Equity Shares in Switzerland and it does not
constitute an offer to any other person. This document may only be used by those investors to whom it has been handed
out in connection with the Issue described herein and may neither directly nor indirectly be distributed or made available
to other persons without our express consent. It may not be used in connection with any other offer and shall in particular
not be copied and/or distributed to the public in or from Switzerland.
United Arab Emirates (excluding the Dubai International Financial Centre)
This document has not been, and is not intended to be, approved by the UAE Central Bank, the UAE Ministry of Economy,
the Emirates Securities and Commodities Authority or any other authority in the United Arab Emirates (the “UAE”) or
any other authority in any of the free zones established and operating in the UAE. The Equity Shares have not been and
will not be offered, sold or publicly promoted or advertised in the United Arab Emirates other than in compliance with
any laws applicable in the United Arab Emirates governing the issue, offering and sale of such securities.
Dubai International Financial Centre
The Equity Shares have not been offered and will not be offered to any persons in the Dubai International Financial Centre
except on that basis that an offer is:
(i). an “Exempt Offer” in accordance with the Markets Rules (MKT) module of the Dubai Financial Services
Authority (the “DFSA”); and
(ii). made only to persons who meet the Professional Client criteria set out in Rule 2.3.2 of the DFSA Conduct of
Business Module of the DFSA rulebook.
United Kingdom
Each Book Running Lead Manager, severally and not jointly, has represented and warranted that:
(i). it has only communicated or caused to be communicated and will only communicate or cause to be
communicated an invitation or inducement to engage in investment activity (within the meaning of Section 21
of the Financial Services and Markets Act 2000 (the “FSMA”) in connection with the offer or sale of the Equity
Shares in circumstances in which Section 21(1) of the FSMA does not apply to the Company; and
(ii). it has complied and will comply with all applicable provisions of the FSMA with respect to anything done by
it in relation to the Equity Shares in, from or otherwise involving the United Kingdom.
Any investment or investment activity to which this document relates is directed only at, available only to, and will be
engaged in only with (i) persons who are outside the United Kingdom (ii) investment professionals falling within Article
19(5) of the Financial Services and Markets Act 2000 (Financial Promotion) Order 2005 (the “Order”), persons falling
within Article 49(2)(a) to (d) (“high net worth companies, unincorporated associations, etc.”) of the Order or (iv) or persons
to whom it can otherwise lawfully be communicated (all such persons together being referred to as “relevant persons”).

163
Persons who are not relevant persons should not take any action on the basis of this document and should not act or rely
on it or any of its contents.
United States
Please see the section entitled “Transfer Restrictions” on page 164.

164
TRANSFER RESTRICTIONS
Due to the following restrictions, investors are advised to consult their legal counsel prior to purchasing Equity Shares
or making any resale, pledge or transfer of the Equity Shares.
The Equity Shares have not been, and will not be registered, under the Securities Act or any other applicable law
of the United States and, unless so registered, may not be offered or sold within the United States, except pursuant
to an exemption from, or in a transaction not subject to, the registration requirements of the Securities Act and
applicable state securities laws. Accordingly, the Equity Shares are only being offered and sold (i) within the United
States only to persons reasonably believed to be “qualified institutional buyers” (as defined in Rule 144A under the
Securities Act and referred to in this Placement Document as “U.S. QIBs”, for the avoidance of doubt, the term
U.S. QIBs does not refer to a category of institutional investor defined under applicable Indian regulations and
referred to in this Placement Document as “QIBs”) in transactions exempt from, or not subject to, the registration
requirements of the Securities Act, and (ii) outside the United States in offshore transactions in reliance on
Regulation S under the Securities Act and the applicable laws of the jurisdiction where those offers and sales occur.
The Equity Shares have not been and will not be registered, listed or otherwise qualified in any other jurisdiction
outside India and may not be offered or sold, and Bids may not be made by persons in any such jurisdiction, except
in compliance with the applicable laws of such jurisdiction.
Until the expiry of 40 days after the commencement of the Issue, an offer or sale of Equity Shares within the United States
by a dealer (whether or not it is participating in the Issue) may violate the registration requirements of the Securities Act.
Equity Shares Offered and Sold within the United States
Each purchaser that is acquiring the Equity Shares offered pursuant to the Issue within the United States, by its acceptance
of the Preliminary Placement Document and this Placement Document and of the Equity Shares, will be deemed to have
acknowledged, represented to and agreed with the Company and the Book Running Lead Managers that it has received a
copy of the Preliminary Placement Document and this Placement Document and such other information as it deems
necessary to make an informed investment decision and that:
1. the purchaser is authorized to consummate the purchase of the Equity Shares offered pursuant to the Issue in
compliance with all applicable laws and regulations;
2. the purchaser acknowledges that the Equity Shares offered pursuant to the Issue have not been and will not be
registered under the Securities Act or with any securities regulatory authority of any state of the United States
and accordingly may not be offered or sold within the United States except pursuant to an exemption from, or in
a transaction not subject to, the registration requirements of the Securities Act;
3. the purchaser (i) is a U.S. QIB, (ii) is aware that the sale to it is being made in a transaction exempt from or not
subject to the registration requirements of the Securities Act, and (iii) is acquiring such Equity Shares for its own
account or for the account of a qualified institutional buyer with respect to which it exercises sole investment
discretion;
4. the purchaser is not an affiliate of the Company or a person acting on behalf of an affiliate;
5. if, in the future, the purchaser decides to offer, resell, pledge or otherwise transfer such Equity Shares, or any
economic interest therein, such Equity Shares or any economic interest therein may be offered, sold, pledged or
otherwise transferred only (A) (i) to a person whom the beneficial owner and/or any person acting on its behalf
reasonably believes is a U.S. QIB in a transaction meeting the requirements of Rule 144A or (ii) in an offshore
transaction complying with Rule 903 or Rule 904 of Regulation S under the Securities Act and (B) in accordance
with all applicable laws, including the securities laws of the states of the United States. The purchaser understands
that the transfer restrictions will remain in effect until the Company determines, in its sole discretion, to remove
them;
6. the Equity Shares are “restricted securities” within the meaning of Rule 144(a)(3) under the Securities Act and
no representation is made as to the availability of the exemption provided by Rule 144 for resales of any such
Equity Shares;
7. the purchaser will not deposit or cause to be deposited such Equity Shares into any depositary receipt facility
established or maintained by a depositary bank other than a Rule 144A restricted depositary receipt facility, so
long as such Equity Shares are “restricted securities” within the meaning of Rule 144(a)(3) under the Securities
Act;

165
8. the purchaser agrees that neither the purchaser, nor any of its affiliates, nor any person acting on behalf of the
purchaser or any of its affiliates, will make any “directed selling efforts” as defined in Regulation S under the
Securities Act in the United States with respect to the Equity Shares;
9. the purchaser understands that such Equity Shares (to the extent they are in certificated form), unless the
Company determines otherwise in accordance with applicable law, will bear a legend substantially to the
following effect:
THE EQUITY SHARES REPRESENTED HEREBY HAVE NOT BEEN AND WILL NOT BE
REGISTERED UNDER THE U.S. SECURITIES ACT OF 1933, AS AMENDED (THE “SECURITIES
ACT”) OR WITH ANY SECURITIES REGULATORY AUTHORITY OF ANY STATE OR OTHER
JURISDICTION OF THE UNITED STATES AND MAY NOT BE OFFERED, SOLD, PLEDGED OR
OTHERWISE TRANSFERRED EXCEPT (1) TO A PERSON WHOM THE SELLER OR ANY PERSON
ACTING ON ITS BEHALF REASONABLY BELIEVES IS A QUALIFIED INSTITUTIONAL BUYER
WITHIN THE MEANING OF RULE 144A UNDER THE SECURITIES ACT IN A TRANSACTION
MEETING THE REQUIREMENTS OF RULE 144A UNDER THE SECURITIES ACT, OR (2) IN AN
OFFSHORE TRANSACTION COMPLYING WITH RULE 903 OR RULE 904 OF REGULATION S
UNDER THE SECURITIES ACT, IN EACH CASE IN ACCORDANCE WITH ANY APPLICABLE
SECURITIES LAWS OF ANY STATE OF THE UNITED STATES.
10. the Company will not recognize any offer, sale, pledge or other transfer of such Equity Shares made other than
in compliance with the above-stated restrictions; and
11. the purchaser acknowledges that the Company, the Book Running Lead Managers, their respective affiliates and
others will rely upon the truth and accuracy of the foregoing acknowledgements, representations and agreements
and agrees that, if any of such acknowledgements, representations and agreements deemed to have been made by
virtue of its purchase of such Equity Shares are no longer accurate, it will promptly notify the Company, and if
it is acquiring any of such Equity Shares as a fiduciary or agent for one or more accounts, it represents that it has
sole investment discretion with respect to each such account and that it has full power to make the foregoing
acknowledgements, representations and agreements on behalf of such account.
All Other Equity Shares Offered and Sold in the Issue
Each purchaser that is acquiring the Equity Shares offered pursuant to the Issue outside the United States, by its acceptance
of the Preliminary Placement Document and this Placement Document and of the Equity Shares offered pursuant to the
Issue, will be deemed to have acknowledged, represented to and agreed with the Company and the Book Running Lead
Managers that it has received a copy of the Preliminary Placement Document and this Placement Document and such other
information as it deems necessary to make an informed investment decision and that:
1. the purchaser is authorized to consummate the purchase of the Equity Shares offered pursuant to the Issue in
compliance with all applicable laws and regulations;
2. the purchaser acknowledges that the Equity Shares offered pursuant to the Issue have not been and will not be
registered under the Securities Act or with any securities regulatory authority of any state of the United States
and accordingly may not be offered or sold within the United States except pursuant to an exemption from, or in
a transaction not subject to, the registration requirements of the Securities Act;
3. the purchaser is purchasing the Equity Shares offered pursuant to the Issue in an offshore transaction meeting the
requirements of Rule 903 of Regulation S under the Securities Act;
4. the purchaser and the person, if any, for whose account or benefit the purchaser is acquiring the Equity Shares
offered pursuant to the Issue, was located outside the United States at the time (i) the offer was made to it and (ii)
when the buy order for such Equity Shares was originated and continues to be located outside the United States
and has not purchased such Equity Shares for the account or benefit of any person in the United States or entered
into any arrangement for the transfer of such Equity Shares or any economic interest therein to any person in the
United States;
5. the purchaser is not an affiliate of the Company or a person acting on behalf of an affiliate;
6. if, in the future, the purchaser decides to offer, resell, pledge or otherwise transfer such Equity Shares, or any
economic interest therein, such Equity Shares or any economic interest therein may be offered, sold, pledged or
otherwise transferred only (A) (i) to a person whom the beneficial owner and/or any person acting on its behalf
reasonably believes is a U.S. QIB in a transaction meeting the requirements of Rule 144A or (ii) in an offshore
transaction complying with Rule 903 or Rule 904 of Regulation S under the Securities Act and (B) in accordance
with all applicable laws, including the securities laws of the States of the United States. The purchaser understands

166
that the transfer restrictions will remain in effect until the Company determines, in its sole discretion, to remove
them;
7. the purchaser agrees that neither the purchaser, nor any of its affiliates, nor any person acting on behalf of the
purchaser or any of its affiliates, will make any “directed selling efforts” as defined in Regulation S under the
Securities Act in the United States with respect to the Equity Shares;
8. the purchaser understands that such Equity Shares (to the extent they are in certificated form), unless the
Company determine otherwise in accordance with applicable law, will bear a legend substantially to the following
effect:
THE EQUITY SHARES REPRESENTED HEREBY HAVE NOT BEEN AND WILL NOT BE
REGISTERED UNDER THE U.S. SECURITIES ACT OF 1933, AS AMENDED (THE “SECURITIES
ACT”) OR WITH ANY SECURITIES REGULATORY AUTHORITY OF ANY STATE OR OTHER
JURISDICTION OF THE UNITED STATES AND MAY NOT BE OFFERED, SOLD, PLEDGED OR
OTHERWISE TRANSFERRED EXCEPT (1) TO A PERSON WHOM THE SELLER OR ANY PERSON
ACTING ON ITS BEHALF REASONABLY BELIEVES IS A QUALIFIED INSTITUTIONAL BUYER
WITHIN THE MEANING OF RULE 144A UNDER THE SECURITIES ACT IN A TRANSACTION
MEETING THE REQUIREMENTS OF RULE 144A UNDER THE SECURITIES ACT, OR (2) IN AN
OFFSHORE TRANSACTION COMPLYING WITH RULE 903 OR RULE 904 OF REGULATION S
UNDER THE SECURITIES ACT, IN EACH CASE IN ACCORDANCE WITH ANY APPLICABLE
SECURITIES LAWS OF ANY STATE OF THE UNITED STATES.
9. the Company will not recognize any offer, sale, pledge or other transfer of such Equity Shares made other than
in compliance with the above-stated restrictions; and
10. the purchaser acknowledges that the Company, the Book Running Lead Managers, their respective affiliates and
others will rely upon the truth and accuracy of the foregoing acknowledgements, representations and agreements
and agrees that, if any of such acknowledgements, representations and agreements deemed to have been made by
virtue of its purchase of such Equity Shares are no longer accurate, it will promptly notify the Company, and if
it is acquiring any of such Equity Shares as a fiduciary or agent for one or more accounts, it represents that it has
sole investment discretion with respect to each such account and that it has full power to make the foregoing
acknowledgements, representations and agreements on behalf of such account.
The Company, the Book Running Lead Managers and their affiliates, and others will rely upon the truth and accuracy of
the foregoing representation, acknowledgement and agreement.
Bidders are advised to ensure that any Bid from them does not exceed the investment limits or maximum number of Equity
Shares that can be held by them under applicable law.

167
CERTAIN U.S. FEDERAL INCOME TAX CONSIDERATIONS
United States Federal Income Taxation
The following discussion describes certain U.S. federal income tax consequences to U.S. Holders (as defined below), and
solely to the extent described below under “—U.S. Foreign Account Tax Compliance Act (FATCA)”, to non-U.S. persons,
of an investment in the Equity Shares. This summary applies only to U.S. Holders that acquire Equity Shares in exchange
for cash in the Issue, hold Equity Shares as capital assets within the meaning of Section 1221 of the Code (as defined
below) and have the U.S. dollar as their functional currency.
This discussion is based on the tax laws of the United States as in effect on the date of this Placement Document, including
the Internal Revenue Code of 1986, as amended (the “Code”), and U.S. Treasury regulations in effect or, in some cases,
proposed, as of the date of this Placement Document, as well as judicial and administrative interpretations thereof available
on or before such date. All of the foregoing authorities are subject to change, and any such change could apply retroactively
and could affect the U.S. federal income tax consequences described below. The statements in this Placement Document
are not binding on the U.S. Internal Revenue Service (the “IRS”) or any court, and thus we can provide no assurance that
the U.S. federal income tax consequences discussed below will not be challenged by the IRS or will be sustained by a
court if challenged by the IRS. Furthermore, this summary does not address any estate or gift tax consequences, any state,
local or non-U.S. tax consequences or any other tax consequences other than U.S. federal income tax consequences.
The following discussion does not describe all the tax consequences that may be relevant to any particular investor or to
persons in special tax situations such as:
banks and certain other financial institutions;
regulated investment companies;
real estate investment trusts;
insurance companies;
broker-dealers;
traders that elect to mark to market;
tax-exempt entities;
persons liable for alternative minimum tax or the Medicare contribution tax on net investment income;
U.S. expatriates;
persons holding Equity Shares as part of a straddle, hedging, constructive sale, conversion or integrated
transaction;
persons that actually or constructively own 10% or more of the Company’s stock by vote or value;
persons subject to special tax accounting rules as a result of any item of gross income with respect to the Equity
Shares being taken into account in an applicable financial statement;
persons that are resident or ordinarily resident in or have a permanent establishment in a jurisdiction outside the
United States;
persons who acquired Equity Shares pursuant to the exercise of any employee share option or otherwise as
compensation; or
persons holding Equity Shares through partnerships or other pass-through entities.
PROSPECTIVE PURCHASERS ARE URGED TO CONSULT THEIR TAX ADVISORS ABOUT THE
APPLICATION OF THE U.S. FEDERAL TAX RULES TO THEIR PARTICULAR CIRCUMSTANCES AS
WELL AS THE STATE, LOCAL AND NON-U.S. TAX CONSEQUENCES TO THEM OF THE PURCHASE,
OWNERSHIP AND DISPOSITION OF EQUITY SHARES.
As used herein, the term “U.S. Holder” means a beneficial owner of Equity Shares that, for U.S. federal income tax
purposes, is or is treated as:
an individual who is a citizen or resident of the United States;

168
a corporation created or organized in or under the laws of the United States, any state thereof or the District of
Columbia;
an estate whose income is subject to U.S. federal income taxation regardless of its source; or
a trust that (1) is subject to the supervision of a court within the United States and the control of one or more U.S.
persons or (2) has a valid election in effect under applicable U.S. Treasury regulations to be treated as a U.S.
person.
The tax treatment of a partner in an entity or arrangement treated as a partnership for U.S. federal income tax purposes
that holds Equity Shares generally will depend on such partner’s status and the activities of the partnership. A U.S. Holder
that is a partner in such partnership should consult its tax advisor.
Dividends and Other Distributions on Equity Shares
Subject to the passive foreign investment company considerations discussed below, the gross amount of distributions made
by the Company with respect to Equity Shares (including the amount of any non-U.S. taxes withheld therefrom, if any)
generally will be includible as dividend income in a U.S. Holder’s gross income in the year received, to the extent such
distributions are paid out of the Company’s current or accumulated earnings and profits, as determined under U.S. federal
income tax principles. Because the Company does not maintain calculations of its earnings and profits under U.S. federal
income tax principles, a U.S. Holder should expect all cash distributions will be reported as dividends for U.S. federal
income tax purposes. Such dividends will not be eligible for the dividends-received deduction allowed to U.S. corporations
with respect to dividends received from other U.S. corporations. Dividends received by non-corporate U.S. Holders may
be “qualified dividend income,” which is taxed at the lower applicable capital gains rate, provided that (1) the Company
is eligible for the benefits of the tax treaty between the United States and India (the “Treaty”), (2) the Company is not a
passive foreign investment company (as discussed below) for either the taxable year in which the dividend was paid or the
preceding taxable year, (3) the U.S. Holder satisfies certain holding period requirements and (4) the U.S. Holder is not
under an obligation to make related payments with respect to positions in substantially similar or related property. U.S.
Holders should consult their tax advisors regarding the availability of the lower rate for dividends paid with respect to
Equity Shares.
The amount of any distribution paid in foreign currency will be equal to the U.S. dollar value of such currency, translated
at the spot rate of exchange on the date such distribution is received, regardless of whether the payment is in fact converted
into U.S. dollars at that time.
Dividends on the Equity Shares generally will constitute foreign source income for foreign tax credit limitation purposes.
Subject to certain complex conditions and limitations, Indian taxes withheld on any distributions on the Equity Shares
may be eligible for credit against a U.S. Holder’s federal income tax liability. If a refund of the tax withheld is available
under the laws of India or under the Treaty, the amount of tax withheld that is refundable will not be eligible for such
credit against a U.S. Holder’s U.S. federal income tax liability (and will not be eligible for the deduction against U.S.
federal taxable income). If the dividends constitute qualified dividend income as discussed above, the amount of the
dividend taken into account for purposes of calculating the foreign tax credit limitation will generally be limited to the
gross amount of the dividend, multiplied by the reduced rate applicable to the qualified dividend income, divided by the
highest rate of tax normally applicable to dividends. The limitation on foreign taxes eligible for credit is calculated
separately with respect to specific classes of income. For this purpose, dividends distributed by the Company with respect
to Equity Shares will generally constitute “passive category income.” A U.S. Holder may not be able to claim a U.S.
foreign tax credit for any dividend distribution tax payable by the Company. The rules relating to the determination of the
U.S. foreign tax credit are complex, and U.S. Holders should consult their tax advisors regarding the availability of a
foreign tax credit in their particular circumstances and the possibility of claiming a deduction (in lieu of the foreign tax
credit) for any foreign taxes paid or withheld.
Sale or Other Taxable Disposition of Equity Shares
Subject to the passive foreign investment company considerations discussed below, upon a sale or other taxable disposition
of Equity Shares, a U.S. Holder will recognize capital gain or loss in an amount equal to the difference between the amount
realized and the U.S. Holder’s adjusted tax basis in such Equity Shares. Any such gain or loss generally will be treated as
long-term capital gain or loss if the U.S. Holder’s holding period in the Equity Shares exceeds one year. Non-corporate
U.S. Holders (including individuals) generally will be subject to U.S. federal income tax on long-term capital gain at
preferential rates. The deductibility of capital losses is subject to significant limitations.
Gain or loss, if any, realized by a U.S. Holder on the sale or other disposition of Equity Shares generally will be treated as
U.S. source gain or loss for U.S. foreign tax credit limitation purposes. As a result, the use of U.S. foreign tax credits
relating to any Indian income tax imposed upon gains in respect of Equity Shares may be limited. U.S. Holders should
consult their tax advisors regarding the tax consequences if Indian taxes are imposed on a taxable disposition of Equity
Shares and their ability to credit any Indian tax against their U.S. federal income tax liability.
If the consideration received upon the sale or other disposition of Equity Shares is paid in foreign currency, the amount

169
realized will be the U.S. dollar value of the payment received, translated at the spot rate of exchange on the date of taxable
disposition. The Equity Shares are listed on the National Stock Exchange of India Limited and BSE Limited. If the Equity
Shares are treated as traded on an established securities market for U.S. federal income tax purposes and the relevant U.S.
Holder is either a cash basis taxpayer or an accrual basis taxpayer who has made a special election (which must be applied
consistently from year to year and cannot be changed without the consent of the IRS), such holder will determine the U.S.
dollar value of the amount realized in foreign currency by translating the amount received at the spot rate of exchange on
the settlement date of the sale. An accrual basis taxpayer that does not make the special election will recognize exchange
gain or loss to the extent attributable to the difference between the exchange rates on the sale date and the settlement date,
and such exchange gain or loss generally will constitute U.S.-source ordinary income or loss.
A U.S. Holder’s initial tax basis in Equity Shares generally will equal the cost of such Equity Shares. If a U.S. Holder
used foreign currency to purchase the Equity Shares, the cost of the Equity Shares will be the U.S. dollar value of the
foreign currency purchase price on the date of purchase, translated at the spot rate of exchange on that date. If the Equity
Shares are treated as traded on an established securities market for U.S. federal income tax purposes and the relevant U.S.
Holder is either a cash basis taxpayer or an accrual basis taxpayer who has made the special election described above, the
U.S. Holder will determine the U.S. dollar value of the cost of such Equity Shares by translating the amount paid at the
spot rate of exchange on the settlement date of the purchase.
Passive Foreign Investment Company Considerations
The Company will be classified as a passive foreign investment company (a “PFIC”) for any taxable year if either: (a) at
least 75% of its gross income is “passive income” for purposes of the PFIC rules or (b) at least 50% of the value of its
assets (determined on the basis of a quarterly average) is attributable to assets that produce or are held for the production
of passive income. For this purpose, passive income includes interest, dividends and other investment income, with certain
exceptions. The PFIC rules also contain a look-through rule whereby the Company will be treated as owning its
proportionate share of the assets and earning its proportionate share of the income of any other corporation in which it
owns, directly or indirectly, 25% or more (by value) of the stock.
Under the PFIC rules, if the Company were considered a PFIC at any time that a U.S. Holder holds the Equity Shares, the
Company would continue to be treated as a PFIC with respect to such investment unless (i) the Company ceased to be a
PFIC and (ii) the U.S. Holder made a “deemed sale” election under the PFIC rules.
Based on the current and anticipated composition of the income, assets and operations of the Company, the Company does
not expect to be treated as a PFIC for the current taxable year or in the foreseeable future. However, whether the Company
is treated as a PFIC is a factual determination that is made on an annual basis after the close of each taxable year. This
determination will depend on, among other things, the ownership and the composition of the income and assets, as well
as the value of the assets (which may fluctuate with our market capitalization) of the Company and its subsidiaries from
time to time. Moreover, the application of the PFIC rules is unclear in certain respects. The IRS or a court may disagree
with our determinations, including the manner in which we determine the value of our assets and the percentage of our
assets that are passive assets under the PFIC rules. Therefore there can be no assurance that the Company will not be
classified as a PFIC for the current taxable year or for any future taxable year.
If the Company is considered a PFIC at any time that a U.S. Holder holds Equity Shares, any gain recognized by the U.S.
Holder on a sale or other disposition of the Equity Shares, as well as the amount of any “excess distribution” (defined
below) received by the U.S. Holder, would be allocated ratably over the U.S. Holder’s holding period for the Equity
Shares. The amounts allocated to the taxable year of the sale or other disposition (or the taxable year of receipt, in the case
of an excess distribution) and to any year before the Company became a PFIC would be taxed as ordinary income. The
amount allocated to each other taxable year would be subject to tax at the highest rate in effect for individuals or
corporations, as appropriate, for that taxable year, and an interest charge would be imposed. For the purposes of these
rules, an excess distribution is the amount by which any distribution received by a U.S. Holder on Equity Shares exceeds
125% of the average of the annual distributions on the Equity Shares received during the preceding three years or the U.S.
Holder’s holding period, whichever is shorter. Certain elections may be available that would result in alternative treatments
(such as mark-to-market treatment) of the Equity Shares if the Company is considered a PFIC.
If the Company is considered a PFIC, a U.S. Holder will also be subject to annual information reporting requirements.
U.S. Holders should consult their tax advisors about the potential application of the PFIC rules to an investment in Equity
Shares.
Information Reporting and Backup Withholding
Dividend payments with respect to Equity Shares and proceeds from the sale, exchange or redemption of Equity Shares
may be subject to information reporting to the IRS and U.S. backup withholding. A U.S. Holder may be eligible for an
exemption from backup withholding if the U.S. Holder furnishes a correct taxpayer identification number and makes any
other required certification or is otherwise exempt from backup withholding. U.S. Holders who are required to establish
their exempt status may be required to provide such certification on IRS Form W-9. U.S. Holders should consult their tax
advisors regarding the application of the U.S. information reporting and backup withholding rules.

170
Backup withholding is not an additional tax. Amounts withheld as backup withholding may be credited against a U.S.
Holder’s U.S. federal income tax liability, and such U.S. Holder may obtain a refund of any excess amounts withheld
under the backup withholding rules by timely filing an appropriate claim for refund with the IRS and furnishing any
required information.
Additional Information Reporting Requirements
Certain U.S. Holders who are individuals (and certain entities) that hold an interest in “specified foreign financial assets”
(which may include the Equity Shares) are required to report information relating to such assets, subject to certain
exceptions (including an exception for Equity Shares held in accounts maintained by certain financial institutions).
Penalties can apply if U.S. Holders fail to satisfy such reporting requirements. U.S. Holders should consult their tax
advisors regarding the applicability of these requirements to their acquisition and ownership of Equity Shares.
U.S. Foreign Account Tax Compliance Act (FATCA)
Provisions under the Code and U.S. Treasury regulations promulgated thereunder commonly known as “FATCA” may
impose a withholding tax on certain “foreign passthru payments” made by a non-U.S. financial institution (including an
intermediary) that has entered into an agreement with the IRS to perform certain diligence and reporting obligations (each
such non-U.S. financial institution, a “Participating Foreign Financial Institution”). If payments on the Equity Shares are
made by a Participating Foreign Financial Institution (including an intermediary), this withholding may be imposed on
such payments if made to any non-U.S. financial institution (including an intermediary) that is not a Participating Foreign
Financial Institution and is not otherwise exempt from FATCA or other holders who do not provide sufficient identifying
information to the payor, to the extent such payments are considered “foreign passthru payments”. Under current guidance,
the term “foreign passthru payment” is not defined and it is therefore not clear whether or to what extent payments on
the Equity Shares would be considered foreign passthru payments. Withholding on foreign passthru payments would not
be required with respect to payments made before January 1, 2019.
The United States has entered into intergovernmental agreements with many jurisdictions (including India) that modify
the FATCA withholding regime described above. It is not yet clear how the intergovernmental agreements between the
United States and these jurisdictions will address “foreign passthru payments” and, if the Company is a financial
institution, whether such agreements will require the Company or other financial institutions to withhold or report on
payments on the Equity Shares to the extent they are treated as foreign passthru payments. Prospective investors should
consult their tax advisors regarding the application of FATCA, or any intergovernmental agreement or non-U.S. legislation
implementing FATCA, to their investment in Equity Shares.
THE DISCUSSION ABOVE IS A GENERAL SUMMARY. IT DOES NOT COVER ALL TAX MATTERS THAT
MAY BE IMPORTANT TO YOU. EACH PROSPECTIVE PURCHASER SHOULD CONSULT ITS OWN TAX
ADVISOR ABOUT THE TAX CONSEQUENCES OF AN INVESTMENT IN EQUITY SHARES UNDER THE
INVESTOR’S OWN CIRCUMSTANCES.

171
THE SECURITIES MARKET OF INDIA
The information in this section has been extracted from documents available on the website of SEBI and the Stock
Exchanges and has not been prepared or independently verified by our Company or the Book Running Lead Managers or
any of their respective affiliates or advisors.
The Indian Securities Market
India has a long history of organised securities trading. In 1875, the first stock exchange was established in Mumbai. BSE
and NSE are the significant stock exchanges in terms of the number of listed companies, market capitalisation and trading
activity.
Stock Exchange Regulation
Indian stock exchanges are regulated primarily by SEBI, as well as by the Government acting through the Ministry of
Finance, Capital Markets Division, under the SCRA and the SCRR. SEBI, in exercise of its powers under the SCRA and
the SEBI Act, notified the SCR (SECC) Regulations on June 20, 2012, which regulate inter alia the recognition, ownership
and internal governance of stock exchanges and clearing corporations in India together with providing for minimum
capitalisation requirements for stock exchanges. The SCRA, the SCRR and the SCR (SECC) Regulations along with
various rules, bye-laws and regulations of the respective stock exchanges, regulate the recognition of stock exchanges, the
qualifications for membership thereof and the manner, in which contracts are entered into, settled and enforced between
members of the stock exchanges.
The SEBI Act empowers SEBI to regulate the Indian securities markets, including stock exchanges and intermediaries in
the capital markets, promote and monitor self-regulatory organisations and prohibit fraudulent and unfair trade practices.
Regulations concerning minimum disclosure requirements by public companies, investor protection, insider trading,
substantial acquisitions of shares and takeover of companies, buy-backs of securities, employee stock option schemes,
stockbrokers, merchant bankers, underwriters, mutual funds, FPIs, credit rating agencies and other capital market
participants have been notified by the relevant regulatory authority.
Listing of Securities
The listing of securities on a recognised Indian stock exchange is regulated by the applicable Indian laws including the
Companies Act, the SCRA, the SCRR, the SEBI Act and various guidelines and regulations issued by SEBI and the SEBI
Listing Regulations. The SCRA empowers the governing body of each recognised stock exchange to suspend trading of
or withdraw admission to dealings in a listed security for breach of or non-compliance with any conditions or breach of a
company’s obligations under the SEBI Listing Regulations or for any reason, subject to the issuer receiving prior written
notice of the intent of the exchange and upon granting of a hearing in the matter. SEBI also has the power to amend the
SEBI Listing Regulations and bye-laws of the stock exchanges in India, to overrule a stock exchange’s governing body
and withdraw recognition of a recognised stock exchange. Further, the SEBI Listing Regulations inter alia also provide
for disclosures to be made by a company after delisting.
Delisting
SEBI has notified the Securities and Exchange Board of India (Delisting of Equity Shares) Regulations, 2009 in relation
to the voluntary and compulsory delisting of equity shares from the stock exchanges which were significantly modified in
2015. In addition, certain amendments to the SCRR have also been notified in relation to delisting.
Minimum Level of Public Shareholding
Pursuant to an amendment of the SCRR in June 2010, all listed companies (except public sector undertakings) were
required to maintain a minimum public shareholding of 25%. However, pursuant to a subsequent amendment to the SCRR,
a public company, including public sector undertakings, seeking to get a particular class or kind of securities listed shall
offer and allot to the public (i) at least 25% of such class or kind of securities issued by the company, if the post issue
capital is less than or equal to ₹ 16,00,00,00,000, (ii) at least such percentage of such class or kind of securities issued by
the company equivalent to ₹ 4,00,00,00,000, if the post issue capital of the company is more than ₹ 16,00,00,00,000 but
less than or equal to ₹ 40,00,00,00,000 or (iii) at least 10% of such class or kind of securities issued by the company, if
the post issue capital of the company is above ₹ 40,00,00,00,000. In case of (ii) and (iii) above, the public shareholding is
required to be increased to 25% within a period of three years from the date of listing of the securities. In this regard, SEBI
has provided several mechanisms to comply with this requirement. Where the public shareholding in a listed company
falls below 25% at any time, such company shall bring the public shareholding to 25% within a maximum period of 12
months from the date of such the public shareholding having fallen below the 25% threshold.
Index-Based Market-Wide Circuit Breaker System
In order to restrict abnormal price volatility in any particular stock, SEBI has instructed stock exchanges to apply daily
circuit breakers which do not allow transactions beyond a certain level of price volatility. The index-based market-wide
circuit breaker system (equity and equity derivatives) applies at three stages of the index movement, at 10%, 15% and

172
20%. These circuit breakers, when triggered, bring about a co-ordinated trading halt in all equity and equity derivative
markets nationwide. The market-wide circuit breakers are triggered by movement of either the SENSEX of BSE or the
CNX NIFTY of NSE, whichever is breached earlier.
In addition to the market-wide index-based circuit breakers, there are currently in place individual scrip-wise price bands
of up to 20% movements either up or down. However, no price bands are applicable on scrips on which derivative products
are available or scrips included in indices on which derivative products are available.
The stock exchanges in India can also exercise the power to suspend trading during periods of market volatility. Margin
requirements are imposed by stock exchanges that are required to be paid by the stockbrokers.
BSE
Established in 1875, BSE is the oldest stock exchange in India. It is also the first stock exchange in India to obtain
permanent recognition from the Government under the SCRA. BSE has also recently received recognition as a ‘Designated
Offshore Securities Market’ (DOSM) from the United States Securities and Exchange Commission.
NSE
NSE was established in 1992 by financial institutions and banks to provide nationwide online, satellite-linked, screen-
based trading facilities with market-makers and electronic clearing and settlement for securities including government
securities, debentures, public sector bonds and units. NSE was recognised as a stock exchange under the SCRA in April
1993 and commenced operations in the wholesale debt market segment in June 1994. The capital market (equities) segment
commenced operations in November 1994 and operations in the derivatives segment commenced in June 2000.
Internet-based Securities Trading and Services
Internet trading takes place through order routing systems, which route client orders to exchange trading systems for
execution. Stockbrokers interested in providing this service are required to apply for permission to the relevant stock
exchange and also have to comply with certain minimum conditions stipulated under applicable law. NSE became the first
exchange to grant approval to its members for providing internet based trading services. Internet trading is possible on
both the “equities” as well as the “derivatives” segments of NSE.
Trading Hours
Trading on both NSE and BSE occurs from Monday to Friday, between 9:15 a.m. and 3:30 p.m. IST (excluding the 15
minutes pre-open session from 9:00 a.m. to 9:15 a.m.). BSE and NSE are closed on public holidays. The recognised stock
exchanges have been permitted to set their own trading hours (in the cash and derivatives segments) subject to the condition
that (i) the trading hours are between 9.00 a.m. and 5.00 p.m.; and (ii) the stock exchange has in place a risk management
system and infrastructure commensurate to the trading hours
Trading Procedure
In order to facilitate smooth transactions, BSE replaced its open outcry system with BSE On-line Trading facility in 1995.
This totally automated screen based trading in securities was put into practice nation-wide. This has enhanced transparency
in dealings and has assisted considerably in smoothening settlement cycles and improving efficiency in back-office work.
NSE has introduced a fully automated trading system called National Exchange for Automated Trading (“NEAT”), which
operates on strict time/price priority besides enabling efficient trade. NEAT has provided depth in the market by enabling
large number of members all over India to trade simultaneously, narrowing the spreads.
Takeover Regulations
Disclosure and mandatory bid obligations for listed Indian companies under Indian law are governed by the Takeover
Regulations, which provides specific regulations in relation to substantial acquisition of shares and takeover. Once the
equity shares of a company are listed on a stock exchange in India, the provisions of the Takeover Regulations will apply
to any acquisition of the company’s shares/voting rights/control. The Takeover Regulations prescribe certain thresholds
or trigger points in the shareholding a person or entity has in the listed Indian company, which give rise to certain
obligations (including mandatory open offer) on part of the acquirer. Acquisitions up to a certain threshold prescribed
under the Takeover Regulations mandate specific disclosure requirements, while acquisitions crossing particular
thresholds may result in the acquirer having to make an open offer of the shares of the target company. The Takeover
Regulations also provides for the possibility of indirect acquisitions, imposing specific obligations on the acquirer in case
of such indirect acquisition.

173
Insider Trading Regulations
The Insider Trading Regulations have been notified by SEBI to prohibit and penalise insider trading in India.
An insider is, inter alia, prohibited from trading in securities of a listed or proposed to be listed company when in
possession of unpublished price sensitive information (“UPSI”) and to provide access to any person including other
insiders to the above referred UPSI except where such communication is for legitimate purposes, performance of duties
or discharge of legal obligations. UPSI shall include any information, relating to a company or its securities, directly or
indirectly, that is not generally available which upon becoming generally available, is likely to materially affect the price
of the securities.
The Insider Trading Regulations also provide disclosure obligations for promoters, directors, key managerial personnel
and employees, with respect to their shareholding in a company, and the changes therein. The definition of “insider” means
any person who is a connected person or is in possession of or having access to unpublished price sensitive information.
The terms “connected person” means any person who is or has during the six months prior to the concerned act been
associated with a company, directly or indirectly, in any capacity including by reason of frequent communication with its
officers or by being in any contractual, fiduciary or employment relationship or by being a director, officer or an employee
of the company or holds any position including a professional or business relationship between himself and the company
whether temporary or permanent, that allows such person, directly or indirectly, access to unpublished price sensitive
information or is reasonably expected to allow such access.
The board of directors of all listed companies are required to formulate and publish on the company’s website a code of
practices and procedures for fair disclosure of UPSI along with a code of conduct for its employees and other connected
persons for compliances with the Insider Trading Regulations.
Depositories
The Depositories Act provides a legal framework for the establishment of depositories to record ownership details and
effect transfers in book-entry form. Further, SEBI framed regulations in relation to, inter alia, the registration of such
depositories, the registration of participants as well as the rights and obligations of the depositories, participants, companies
and beneficial owners. The depository system has significantly improved the operation of the Indian securities markets.
Derivatives (Futures and Options)
Trading in derivatives is governed by the SCRA, the SCRR and the SEBI Act. The SCRA was amended in February 2000
and derivatives contracts were included within the term “securities”, as defined by the SCRA. Trading in derivatives in
India takes place either on separate and independent derivatives exchanges or on a separate segment of an existing stock
exchange. The derivatives exchange or derivatives segment of a stock exchange functions as a self-regulatory organisation
under the supervision of the SEBI.

174
DESCRIPTION OF THE EQUITY SHARES
The following is information relating to the Equity Shares including a brief summary of the Memorandum and Articles
and the Companies Act. Bidders are urged to read the Memorandum and Articles carefully, and consult with their advisers,
as the Memorandum and Articles and applicable Indian law, and not this summary, govern the rights attached to the
Equity Shares.
Authorised Capital
The authorised share capital of the Company is ₹ 42,500.00 lakhs comprising 42,50,00,000 Equity Shares. As on the date
of this Placement Document, the issued, subscribed and paid-up equity share capital of the Company is ₹ 33,960.22 lakhs
comprising of 33,96,02,237 fully paid-up Equity Shares. The Equity Shares are listed on BSE and NSE.
Dividends
Under Indian law, a company pays dividend upon a recommendation by its board of directors and approval by a majority
of the shareholders at the AGM held in each Financial Year. Our Board may declare and pay interim dividends in
accordance with applicable law. The shareholders have no right to declare dividend at a rate higher than such rate
recommended by our Board. Subject to certain conditions laid down by Section 123 of the Companies Act, no dividend
can be declared or paid by a company for any Financial Year except: (a) out of the profits of the company for that year,
calculated in accordance with the provisions of the Companies Act; or (b) out of the profits of the company for any previous
Financial Year arrived at as required to be computed in terms of the Companies Act and remaining undistributed; or (c)
out of both; or (d) out of money provided by the Government of India or a State Government for payment of dividend by
our Company in pursuance of a guarantee given by that Government.
The Equity Shares issued pursuant to the Issue shall rank pari passu with the existing Equity Shares in all respects
including entitlements to any dividends that may be declared by our Company.
Subject to the provisions of the Companies Act, no shareholder shall be entitled to receive payment of any interest or
dividends in respect of his Equity Share(s), whilst any money may be due or owing from him to our Company in respect
of such Equity Share(s) held either individually or jointly with any other person and our Board may deduct from the
dividend payable to any such shareholder all sums of money, if any, payable by such shareholder to our Company on
account of calls or otherwise in relation to the Equity Shares. Unless otherwise directed, dividend, interest or other monies
in respect of the Equity Shares may be paid in electronic mode or by cheque or warrant to the shareholder or person entitled
or in case of joint-holders to the joint-holder first named in the register of members or to such person and to such address
as the holder or the joint holders direct in writing to our Company. Our Company is not liable for any cheque or warrant
lost in transmission, or for any dividend lost or delayed.
Issue of Bonus Shares and Capitalisation of Reserves
In addition to permitting dividends to be paid out of current or retained earnings as described above, the Companies Act
permits our Board, if so approved by the shareholders in a general meeting, to distribute an amount transferred in the
securities premium account or the capital redemption reserve account to its shareholders, in the form of fully paid up bonus
ordinary shares, which are similar to stock dividend. However, bonus of ordinary shares must be distributed to shareholders
in proportion to the number of ordinary shares owned by them as recommended by our Board. No issue of bonus shares
may be made by capitalizing reserves created by revaluation of assets. Further, any issue of bonus shares would be subject
to the SEBI Regulations and the Companies Act.
The Articles provide that our Company may, in any general meeting, upon the recommendation of our Board, resolve that
any part of the amount standing to the credit of any of our Company’s reserve accounts, or to the credit of the profit and
loss account, or otherwise available for distribution be capitalized.
Issue of Additional Equity Shares
Subject to the provisions of the Companies Act, our Company may increase its Equity Share capital by issuing new Equity
Shares on such terms and with such rights as it, by action of its shareholders in a general meeting may determine.
According to Section 62 of the Companies Act, such new Equity Shares shall be offered to existing equity shareholders
in proportion to the amount paid up on those shares at that date. The offer shall be made by notice specifying the number
of Equity Shares offered and the date (being not less than 15 days and not exceeding 30 days from the date of the offer)
within which the offer, if not accepted, will be deemed to have been declined. After such date or upon receipt of earlier
intimation from persons to whom such notice is given that they decline to accept the Equity Shares offered, our Board
may dispose of the Equity Shares offered in respect of which no acceptance has been received in a manner which shall not
be disadvantageous to the shareholders of our Company. The offer is deemed to include a right exercisable by the person
concerned to renounce the shares offered to him in favour of any other person.
Under the provisions of Section 62(1)(c) of the Companies Act, new Equity Shares may be offered to any persons whether
or not those persons include existing equity shareholders, or employees to whom shares have been allotted under a scheme

175
of employee stock option, either for cash or for a consideration other than cash, if a special resolution to that effect is
passed by our Company’s shareholders in a general meeting, subject to pre-emptive rights of existing shareholders, if any.
The Articles provide that our Company, from time to time and subject to the provisions of the Companies Act, may
consolidate or sub-divide its existing Equity Shares into shares of larger or smaller amount or may cancel any Equity Share
not taken or agreed to be taken by any person.
General meetings of shareholders
There are two types of general meetings of the shareholders:
(i) AGM; and
(ii) EGM.
Our Company must hold its AGM within six months after the expiry of each Financial Year provided that not more than
15 months shall elapse between the AGM and next one, unless extended by the RoC at its request for any special reason
for a period not exceeding three months. Our Board may convene an EGM when necessary or at the request of a
shareholder or shareholders holding in the aggregate not less than one tenth of our Company’s issued paid up capital
(carrying a right to vote in respect of the relevant matter on the date of receipt of the requisition).
Notices, either in writing or through electronic mode, convening a meeting setting out the date, day, hour, place and agenda
of the general meeting must be given to members at least 21 clear days prior to the date of the proposed meeting. An
annual general meeting may be called after giving shorter notice if consent is received, in writing or electronic mode, from
not less than 95% of the shareholders entitled to vote. An extra ordinary general meeting may be called after giving shorter
notice if consent is received, from majority of the shareholders entitled to vote and who represent not less than 95% of
such part of the paid up share capital. Unless the Articles provide for a larger number, such number of shareholders, shall
constitute a quorum for a general meeting of our Company, whether AGM or EGM as specified under the Companies Act.
The quorum requirements applicable to shareholder meetings under the Companies Act have to be physically complied
with.
In accordance with Section 110 of the Companies Act and the rules made thereunder, a company intending to pass a
resolution relating to matters such as, but not limited to, amendment in the objects clause of the Memorandum, the issuing
of shares with different voting or dividend rights, a variation of the rights attached to a class of shares or debentures or
other securities, buy-back of shares, giving loans or extending guarantees in excess of limits prescribed in the Companies
Act, is required to obtain the resolution passed by means of a postal ballot instead of transacting the business in the
company’s general meeting, unless facility to vote by electronic means under Section 108 of the Companies Act, 2013 is
provided. A notice of postal ballot to all the shareholders shall be sent along with a draft resolution explaining the reasons
therefore and requesting them to send their assent or dissent in writing on a postal ballot within a period of 30 days from
the date of dispatch of the notice. The shareholders may exercise their right to vote at general meetings or through postal
ballot by voting through electronic voting mechanism.
Voting rights
Section 108 of the Companies Act and Rule 20 of the Companies (Management and Administration) Rules, 2014 deal
with the exercise of right to vote by members by electronic means. In terms of Rule 20, every listed company (other than
a company referred to in Chapters XB or XC of the SEBI Regulations) is required to provide to its members facility to
exercise their right to vote at general meetings by electronic means. The Ministry of Corporate Affairs, has clarified that
voting by show of hands would not be allowable in cases where Rule 20 is applicable.
Transfer of shares
Shares held through depositories are transferred in the form of book entries or in electronic form in accordance with the
regulations laid down by the SEBI. These regulations provide the regime for the functioning of the depositories and the
participants and set out the manner in which the records are to be kept and maintained and the safeguards to be followed
in this system. Transfers of beneficial ownership of shares held through a depository are exempt from stamp duty. Our
Company has entered into an agreement for such depository services with the NSDL and the CDSL. The SEBI requires
that our Company’s shares for trading and settlement purposes be in book-entry form for all investors, except for
transactions that are not made on a stock exchange and transactions that are not required to be reported to the stock
exchange. Our Company shall keep a book in which every transfer or transmission of shares will be entered.
Pursuant to the SEBI Listing Regulations, in the event our Company has not affected the transfer of shares within 15 days
from the date of receipt of request for transfer or where our Company has failed to communicate to the transferee any valid
objection to the transfer within the stipulated time period of 15 days, it is required to compensate the aggrieved party for
the opportunity loss caused during the period of the delay. The Equity Shares shall be freely transferable subject to
applicable laws. Under the SEBI Listing Regulations, notice of such refusal must be sent to the transferee within one
month of the date on which the transfer was lodged with our Company.

176
According to the Articles, any person who becomes entitled to Equity Shares by reason of death of a member shall be
entitled to the same dividend and other advantages to which he would be entitled if he was a registered member except
that he shall not be entitled to exercise any rights in the meetings of our Company, before being registered as a member
of our Company.

177
STATEMENT OF TAX BENEFITS
The Board of Directors
Oberoi Realty Limited
3rd Floor, International Business Park,
Oberoi Garden City, Off Western Express Highway,
Goregaon (East), Mumbai,
Maharashtra 400063
Dear Sirs,
Statement of Possible Tax Benefits available to Oberoi Realty Limited and its shareholders under the Indian tax
laws
1. We hereby confirm that the enclosed Annexure, prepared by Oberoi Realty Limited (‘the Company’), provides the
possible tax benefits available to the Company and to the shareholders of the Company under the Income-tax Act,
1961 (‘the Act’) as amended by the Finance Act 2018, i.e. applicable for the Financial Year 2018-19 relevant to the
assessment year 2019-20, presently in force in India. Several of these benefits are dependent on the Company or its
shareholders fulfilling the conditions prescribed under the relevant provisions of the Act. Hence, the ability of the
Company and / or its shareholders to derive the tax benefits is dependent upon their fulfilling such conditions which,
based on business imperatives the Company faces in the future, the Company or its shareholders may or may not
choose to fulfil.
2. The benefits discussed in the enclosed statement are not exhaustive and the preparation of the contents stated is the
responsibility of the Company’s management. We are informed that this statement is only intended to provide general
information to the investors and is neither designed nor intended to be a substitute for professional tax advice. In view
of the individual nature of the tax consequences and the changing tax laws, each investor is advised to consult his or
her own tax consultant with respect to the specific tax implications arising out of their participation in the issue.
3. We do not express any opinion or provide any assurance as to whether:
(i) the Company or its shareholders will continue to obtain these benefits in future;
(ii) the conditions prescribed for availing the benefits have been / would be met with; and
(iii) the revenue authorities/courts will concur with the views expressed herein.
4. The contents of the enclosed statement are based on information, explanations and representations obtained from the
Company and on the basis of their understanding of the business activities and operations of the Company.
For S R B C & CO LLP
Chartered Accountants
ICAI Firm Registration Number: 324982E/E300003
per Vinayak Pujare
Partner
Membership Number: 101143
Place of Signature: Mumbai
Date: June 13, 2018

178
Special tax benefits available to the Company
1. Benefit under Section 80-IBA:
The following specific tax benefits are available to the Company after fulfilling conditions as per the respective
provisions of the relevant tax laws: In accordance with and subject to the conditions specified in Section 80-IBA
of the Income tax Act, 1961 (hereinafter referred to as ‘the Act’), the Company may be entitled for a deduction
of an amount equal to hundred percent of profits and gains derived from the business of developing and building
housing projects.
The aforesaid benefits are available to the Company subject to fulfilment of prescribed conditions. However, as
per Section 115JB of the Act, the Company shall be required to pay MAT at the rate of 18.5% (plus
applicable surcharge and cess) on book profits as computed under the said section, irrespective of the
tax benefits available.
General tax benefit to the Company
1. Business or Professional Income:
The computation of business income normally is based on the profits shown in the financial statements, after
adjusting for exempt income, non-deductible expenditure, special deductions and unabsorbed losses and
depreciation. The central government has issued certain income computation and disclosure standards relating to
particular taxpayers or classes of income.
2. Tax on Dividend Income received from Domestic Company:
Dividends earned from investment in shares of Indian Company are exempt from tax in accordance with and
subject to the provisions of section 10(34) read with section 115-O of the Act.
However, as per section 94(7) of the Act, losses arising from sale/ transfer of shares, where such shares are
purchased within three months prior to the record date and sold within three months from the record date, will be
disallowed to the extent such loss does not exceed the amount of dividend claimed exempt.
3. Exemption of Dividend Income received from units of Mutual Funds:
Income earned from investment in units of a specified Mutual Fund is exempt from tax under section 10(35) of
the Act. However, as per section 94(7) of the Act, losses arising from the sale/ redemption of units purchased
within three months prior to the record date (for entitlement to receive income) and sold within nine months from
the record date, will be disallowed to the extent such loss does not exceed the amount of income claimed exempt.
Further, as per section 94(8) of the Act, if an investor purchases units within three months prior to the record date
for entitlement of bonus, and is allotted bonus units without any payment on the basis of holding original units
on the record date and such person sells/ redeems the original units within nine months of the record date, then
the loss arising from sale/ redemption of the original units will be ignored for the purpose of computing income
chargeable to tax and the amount of loss ignored shall be regarded as the cost of acquisition of the bonus units.
4. Tax on Long Term Capital Gain:
Long term capital gains and tax on the same would arise in the following cases:
Nature and period of holding of Shares Tax Treatment
(i) Listed Shares:
Where the equity shares in a company are held
for a period of more than 12 months prior to
the date of transfer of the shares in case of
shares of a company listed on a Recognised
Stock Exchange in India;
In accordance with section 112A of the Act, the tax
payable on the capital gains exceeding Rs.0.10
million shall be calculated at the rate of 10%
without indexation benefit as provided in the second
proviso to section 48 of the Act.
(ii) Unlisted Shares:
Where the equity shares in a company are held
for a period of more than 24 months in case of
shares of other companies prior to the date of
transfer of the shares.
In accordance with section 112 of the Act, taxable
long-term capital gains are subject to tax at a rate of
20% (plus applicable surcharge and education cess)
after indexation benefit, as provided in the second
proviso to section 48 of the Act.

179
In accordance with and subject to the provisions of section 48 of the Act, in order to arrive at the quantum of capital
gains, the following amounts would be deductible from the full value of consideration:
i. Cost of acquisition/ improvement of the shares as adjusted by the cost inflation index (only for Resident
shareholder of unlisted company) notified by the Central Government; and
ii. Expenditure incurred wholly and exclusively in connection with the transfer of shares
5. Tax on Short Term Capital Gain:
Short term capital gains and tax on the same would arise in the following cases:
Nature and period of holding of Shares Tax Treatment
(i) Listed Shares:
Where the equity shares in a company are held
for a period of not more than 12 months prior
to the date of transfer where the sale is made
on or after October 1, 2004 on a recognized
stock exchange and the transaction is
chargeable to Securities Transaction Tax.
In accordance with section 111A of the Act,
taxable short-term capital gains are subject to tax
at a rate of 15% (plus applicable surcharge and
education cess).
(ii) Unlisted Shares:
Where the equity shares in a company are held
for a period of not more than 24 months in
case of shares of other companies prior to the
date of transfer of the shares.
In accordance with section 111A of the Act,
taxable short-term capital gains are subject to tax
at a normal rate of tax i.e. 30% (plus applicable
surcharge and education cess).
6. Allowable Deduction/Amortisation of certain preliminary expenses:
The Company will be entitled to amortise certain preliminary expenditure, specified under section 35D(2) of the
Act, subject to the limit specified in Section 35D(3) of the Act. The deduction is allowable for an amount equal
to one-fifth of such expenditure for each of five successive assessment years beginning with the assessment year
in which the business commences.
7. Exemption on interest, premium on redemption or other payment on notified securities, bonds, certificates
issued by the Central Government:
Income by way of interest, premium on redemption or other payment on notified securities, bonds, certificates
issued by the Central Government is exempt from tax under section 10(15) of the Act in accordance with and
subject to the conditions and limits as may be specified in notifications.
8. Depreciation Allowance:
The depreciation rates in respect of Motor Cars is 15%, furniture & fittings is 10%, Intangible assets is 25%,
Computers 40%, Buildings (Residential) is 5% and Buildings (Others) is 10%.
9. Set off & Carry forwarding of Losses:
The loss under the head “Profit and Gains from Business or Profession” can be set-off against all heads of income
other than head “Salaries” and the excess loss after set-off, if any can be carried forward for set-off against the
income under the head “Profit and Gains from Business or Profession” of the next eight Assessment Years.
10. Set off & Carry forwarding of Unabsorbed Depreciation:
The unabsorbed depreciation, if any, can be adjusted against any other income and can be carried forward
indefinitely for set-off against the income of future years.
11. Allowability of Carry forwarding the MAT Credit:
As per provisions of Section 115JAA of the Act, the Company is eligible to claim credit for Minimum Alternate
Tax (MAT) paid for any assessment year commencing on or after April 1, 2006 against normal income-tax
payable in subsequent assessment years. The amount of MAT credit available shall be the difference between
MAT payable under section 115JB of the Act and taxes payable on total income computed under normal
provisions of the Act.

180
The Finance Act, 2017 has amended the above provision with effect from AY 2018-19 to provide that MAT
credit shall be available for set-off up to fifteen years succeeding the Assessment Year in which MAT credit
arises.
12. Allowability of Bad debts:
Under section 36(1)(vii), any bad debt or part thereof written off as irrecoverable in the accounts is allowable as
a deduction from the total income.
13. Disallowance of expenditures incurred on exempted Income:
Section 14A of the Act restricts claim for deduction of expenses incurred in relation to incomes which do not
form part of the total income under the Act. Thus, any expenditure incurred to earn tax exempt income is not tax
deductible expenditure. The Assessing Officer may make disallowance under section 14A read with Rule 8D of
the Income-tax Rules, 1962 (‘the Rules’), if he is not satisfied with the correctness of the claim of the assessee in
respect of such expenditure.
14. Dividend Distribution Tax (DDT):
In accordance with section 115-O of the Act, any amount declared, distributed or paid by the Company to
shareholders, whether out of current or accumulated profits, shall be charged to additional income tax at the rate
of 15% plus applicable surcharge on Income tax of 12% and the health & education cess of 4%.
In view of the amendment brought in by Finance (No.2) Act, 2014, for the purpose of determining the tax on
distributed profits payable in accordance with Section 115-O of the Act, the amount of dividends on or after 1
April 2003 needs to be increased to such amount as would, after reduction of tax on such increased amount at the
specified rate, be equal to the net distributed profits. Resultantly, the effective rate of tax will be 17.647 percent
(plus applicable surcharge & cess) of the amount of dividends declared, distributed or paid by the Company.
15. Application of provisions of DDT to Deemed Dividend
Dividend distributed by a domestic company is subject to Dividend Distribution Tax payable by such company.
Prior to amendment by Finance Act 2018, deemed dividend under sub-clause (e) of clause (22) of section of 2
the Act used to taxed in the hands of the recipient at the applicable marginal rate. The Finance Act 2018 has
deleted the Explanation to Chapter XII-D occurring after section 115Q of the Act so as to bring deemed dividends
also under the scope of Dividend Distribution Tax under section 115-O. Further, such deemed dividend is required
to be taxed at the rate of 30% (without grossing up and also to be increased by surcharge and health & education
cess) in order to prevent camouflaging dividend in various ways such as loans and advances as per the provisions
of section 115-O of the Act. This amendment relating to imposition of Dividend Distribution Tax on deemed
dividend will apply to transactions referred to in sub-clause (e) of clause (22) of section 2 of the Act undertaken
on or after 1st April, 2018.
16. Corporate Tax Rates:
The tax rate is 30%. The surcharge on Income tax is 7%, if the total income exceeds Rs.10.0 million and,
12% if the total income exceeds Rs.100.0 million. Health & Education cess (H&EC) is 4% on tax &
surcharge.
In case of companies having turnover of less than Rs.2.50 billion in Financial Year 2016-17, the tax rate will
be 25% plus surcharge and H&EC for Financial Year 2018-19.
17. Minimum Alternate Tax:
A Minimum Alternate Tax (MAT) is imposed at 18.5% (plus the surcharge and H&EC) on the adjusted book
profits of Companies whose tax liability is less than 18.5% of their book profits.
General Tax Benefits to the Shareholders of the Company
(I) Under the Income-tax Act
A) Residents
1. Exemption and Taxability on Dividend Income received from Domestic Company:

181
Dividends earned from investment in shares of Indian Company are exempt from tax in accordance with and
subject to the provisions of section 10(34) read with section 115-O of the Income tax Act, 1961 (hereinafter
referred to as ‘the Act’).
However, as per section 94(7) of the Act, losses arising from sale/ transfer of shares, where such shares are
purchased within three months prior to the record date and sold within three months from the record date, will be
disallowed to the extent such loss does not exceed the amount of dividend claimed exempt.
However, as per section 115BBDA of the Act, the income earned by way of dividend in excess of Rs.1 million
is chargeable to tax at the rate of 10% on gross basis in the hands of all resident assessees except domestic
company and certain funds, trusts, institutions, etc.
2. Disallowance of expenditures incurred on exempted Income:
Section 14A of the Act restricts claim for deduction of expenses incurred in relation to incomes which do not
form part of the total income under the Act. Thus, any expenditure incurred to earn tax exempt income (ie
dividend/exempt long-term capital gains) is not a tax deductible expenditure.
3. Allowance of Securities Transaction Tax (STT) paid by a shareholder:
Under section 36(1)(xv) of the Act, Securities Transaction Tax paid by a shareholder in respect of taxable
securities transactions entered into in the course of its business, would be allowed as a deduction if the income
arising from such taxable securities transactions is included in the income computed under the head “Profits and
gains of business or profession”.
4. Set off of losses under the head “Capital Gain”:
As per the provision of Section 71(3), if there is a loss under the head “Capital Gains”, it cannot be set-off with
the income under any other head. Section 74 provides that the short term capital loss can be set-off against both
Short term and Long term capital gain. But Long term capital loss cannot be set-off against short term capital
gain. The unabsorbed short term capital loss can be carried forward for next eight assessment years and can be
set off against any capital gains in subsequent years. The unabsorbed long term capital loss can be carried forward
for next eight assessment years and can be set off only against long term capital gains in subsequent years
5. Tax on Long Term Capital Gain:
Long term capital gains and tax on the same would arise to a resident shareholder in the following cases:
Nature and period of holding of Shares Tax Treatment
(i) Listed Shares:
Where the equity shares in a company are held
for a period of more than 12 months prior to
the date of transfer of the shares in case of
shares of a company listed on a Recognised
Stock Exchange in India;
In accordance with section 112A of the Act, the tax
payable on the capital gains exceeding Rs.0.10
million shall be calculated at the rate of 10%
without indexation benefit as provided in the second
proviso to section 48 of the Act.
(ii) Unlisted Shares:
Where the equity shares in a company are held
for a period of more than 24 months in case of
shares of other companies prior to the date of
transfer of the shares.
In accordance with section 112 of the Act, taxable
long-term capital gains are subject to tax at a rate of
20% (plus applicable surcharge and education cess)
after indexation benefit, as provided in the second
proviso to section 48 of the Act.
In accordance with and subject to the provisions of section 48 of the Act, in order to arrive at the quantum of
capital gains, the following amounts would be deductible from the full value of consideration:
i. Cost of acquisition/ improvement of the shares as adjusted by the cost inflation index (only for Resident
shareholder of unlisted company) notified by the Central Government; and
ii. Expenditure incurred wholly and exclusively in connection with the transfer of shares
Further, section 55(2)(ac) inserted by Finance Act 2018 further provides that cost of acquisition of specified
capital asset referred to in section 112A acquired prior to 1 February 2018 shall be higher of –

182
- Cost of acquisition of such asset and
- Lower of -
(A) The Fair Market Value of such asset
(B) Full value of consideration received or accruing as a result of transfer of capital asset
6. Tax on Short Term Capital Gain:
Short term capital gains and tax on the same would arise to a resident shareholder in the following cases:
Nature and period of holding of Shares Tax Treatment
(i) Listed Shares:
Where the equity shares in a company are held
for a period of not more than 12 months prior
to the date of transfer where the sale is made
on or after October 1, 2004 on a recognized
stock exchange and the transaction is
chargeable to Securities Transaction Tax.
In accordance with section 111A of the Act,
taxable short-term capital gains are subject to tax
at a rate of 15% (plus applicable surcharge and
education cess).
(ii) Unlisted Shares:
Where the equity shares in a company are held
for a period of not more than 24 months in
case of shares of other companies prior to the
date of transfer of the shares.
In accordance with section 111A of the Act,
taxable short-term capital gains are subject to tax
at a normal rate of tax i.e. 30% (plus applicable
surcharge and education cess).
7. Exemption from Capital Gains:
Under section 54EC of the Act, long term capital gain arising on the transfer of shares of the Company [other
than the sale referred to in section 10(38) of the Act] is exempt from tax to the extent the same is invested in
certain notified bonds within a period of six months from the date of such transfer (up to a maximum limit of Rs
5.0 million) for a minimum period of three years.
The Finance Act, 2018 in this regard has restricted the scope to capital gains arising from long-term capital assets,
being land or building and to make available funds at the disposal of eligible bond issuing company for more than
three years, it has amended section 54EC so as to provide that capital gain arising from the transfer of a long-
term capital asset, being land or building or both, invested in the long-term specified asset at any time within a
period of six months after the date of such transfer, the capital gain shall not be charged to tax subject to certain
conditions specified in this section.
The definition of long-term specified asset, for making any investment under the section on or after the 1st day
of April, 2018, shall mean any bond, redeemable after five years and issued on or after 1st day of April, 2018 by
the National Highways Authority of India or by the Rural Electrification Corporation Limited or any other bond
notified by the Central Government in this behalf. This amendment will take effect, from 1st April, 2019 and
will, accordingly, apply in relation to the assessment year 2019-20 and subsequent assessment years.
In accordance with section 54F, long-term capital gains arising on the transfer of shares of the Company held by
an individual and on which Securities Transaction Tax is not payable, shall be exempt from capital gains tax if
the net consideration is utilised, within a period of one year before, or two years after the date of transfer, in the
purchase of a new residential house, or for construction of a residential house within three years. Such benefit
will not be available if the individual-
owns more than one residential house, other than the new residential house, on the date of transfer of
the shares; or
purchases another residential house within a period of one year after the date of transfer of the shares;
or
constructs another residential house within a period of three years after the date of transfer of the shares;
and
the income from such residential house, other than the one residential house owned on the date of transfer
of the original asset, is chargeable under the head “Income from house property”.

183
If only a part of the net consideration is so invested, so much of the capital gains as bears to the whole of the
capital gain the same proportion as the cost of the new residential house bears to the net consideration shall be
exempt.
If the new residential house is transferred within a period of three years from the date of purchase or construction,
the amount of capital gains on which tax was not charged earlier, shall be deemed to be income chargeable under
the head “Capital Gains” of the year in which the residential house is transferred.
8. Tax on Income received without inadequate consideration:
If an individual or HUF receives any property, which includes shares, without consideration, the aggregate fair
market value of which exceeds Rs.50,000, the whole of the fair market value of such property will be considered
as income in the hands of the recipient. Similarly, if an individual or HUF receives any property, which includes
shares, for consideration which is less than the fair market value of the property by an amount exceeding
Rs.50,000, the fair market value of such property as exceeds the consideration will be considered as income in
the hands of the recipient
The Finance Act, 2017 has inserted a new clause under sub-section (2) of section 56 of the Act to provide that
receipt of any sum of money or any property by any person from any person after 01st April 2017, without
consideration or for inadequate consideration in excess of Rs.50,000 shall be chargeable to tax in the hands of
the recipient under the head "Income from other sources". These amendments have become applicable with effect
from 1st April, 2018 and accordingly, applicable in relation to the assessment year 2018-19 and subsequent
assessment years
The Finance Act 2018 has further amended section 56(2)(x) to provide that no adjustments shall be made in a
case where the variation between stamp duty value and the sale consideration is not more than the higher of
following amounts namely:
(i) Amount of fifty thousand rupees and
(ii) five percent of the sale consideration.
These amendments will take effect from 1st April, 2019 and will, accordingly, apply in relation to the assessment
year 2019-20 and subsequent assessment years.
9. Tax Rates for Individuals, HUFs, BOI and Association of Persons:
Slab of income (Rs.) Rate of tax (%)
Up to Rs.0.25 million Nil
Rs.0.251 million to Rs.0.50 million 5%
Rs.0.501 million to Rs.1 million 20%
Above Rs.1 million 30%
Notes:
(i) In respect of senior citizens resident in India, the basic exemption limit is Rs.0.30 million.
(ii) In case super senior citizen who is of the age of eighty years or more, the basic exemption is Rs.0.50
million.
(iii) Surcharge on income tax is at the rate of 10% if total income exceeding Rs.5 million but non exceeding
Rs.10 million and at the rate of 15% if total income exceeding Rs.10 million. However, the surcharge
shall be subject to marginal relief (where income exceeds fifty lakh rupees, the total amount payable as
income-tax and surcharge shall not exceed total amount payable as income-tax on total income of fifty
lakh rupees by more than the amount of income that exceeds fifty lakh rupees)
(iv) Health & Education Cess will be levied at the rate of 4% on income tax and surcharge.
(v) The rebate is available to a resident individual if his total income does not exceed Rs. 3,50,000. The
amount of rebate shall be 100% of income-tax or Rs.2,500, whichever is less.
B) Non-Residents
1. Taxability on Dividend Income received from Domestic Company:

184
Dividends earned from investment in shares of Indian Company are exempt from tax in accordance with and
subject to the provisions of section 10(34) read with section 115-O of the Income tax Act, 1961 (hereinafter
referred to as ‘the Act’).
However, as per section 94(7) of the Act, losses arising from sale/ transfer of shares, where such shares are
purchased within three months prior to the record date and sold within three months from the record date, will be
disallowed to the extent such loss does not exceed the amount of dividend claimed exempt.
2. Benefit of Double Tax Avoidance Agreement (DTAA/ Tax Treaty):
As per the provisions of Section 90, the Non Resident shareholder has an option to be governed by the provisions
of the tax treaty, if they are more beneficial than the domestic law wherever India has entered into Double
Taxation Avoidance Agreement (DTAA) with the relevant country for avoidance of double taxation of income.
3. Computation of Capital Gains on Investment made in foreign currency:
In accordance with section 48, capital gains arising out of transfer of capital assets being shares in the company
shall be computed by converting the cost of acquisition, expenditure in connection with such transfer and the full
value of the consideration received or accruing as a result of the transfer into the same foreign currency as was
initially utilised in the purchase of the shares and the capital gains computed in such foreign currency shall be
reconverted into Indian currency, such that the aforesaid manner of computation of capital gains shall be
applicable in respect of capital gains accruing/arising from every reinvestment thereafter in, and sale of, shares
and debentures of, an Indian company including the Company.
4. Tax on Long Term Capital Gain:
Long term capital gains and tax on the same would arise to a non-resident shareholder in the following cases:
Nature and period of holding of Shares Tax Treatment
(i) Listed Shares:
Where the equity shares in a company are held
for a period of more than 12 months prior to
the date of transfer of the shares in case of
shares of a company listed on a Recognised
Stock Exchange in India;
In accordance with section 112A of the Act, the tax
payable on the capital gains exceeding Rs.0.10
million shall be calculated at the rate of 10%
without indexation benefit as provided in the second
proviso to section 48 of the Act.
(ii) Unlisted Shares:
Where the equity shares in a company are held
for a period of more than 24 months in case of
shares of other companies prior to the date of
transfer of the shares.
In accordance with section 112 of the Act, taxable
long-term capital gains are subject to tax at a rate of
10% (plus applicable surcharge and education cess).
In case of non-resident shareholder, the indexation
benefit as provided in the second proviso to section
48 of the Act is not available.
In accordance with and subject to the provisions of section 48 of the Act, in order to arrive at the quantum of
capital gains, the following amounts would be deductible from the full value of consideration:
(a) Cost of acquisition/ improvement of the shares as adjusted by the cost inflation index (only for Resident
shareholder of unlisted company) notified by the Central Government; and
(b) Expenditure incurred wholly and exclusively in connection with the transfer of shares.
Section 55(2)(ac) inserted by Finance Act 2018 further provides that cost of acquisition of specified capital asset
referred to in section 112A acquired prior to 1 February 2018 shall be higher of –
- Cost of acquisition of such asset and
- Lower of ---
(A) The fair market value of such asset
(B) Full value of consideration received or accruing as a result of transfer of capital asset
5. Tax on Short Term Capital Gain:
Short term capital gains and tax on the same would arise to a non-resident shareholder in the following cases:

185
Nature and period of holding of Shares Tax Treatment
(i) Listed Shares:
Where the equity shares in a company are held
for a period of not more than 12 months prior
to the date of transfer where the sale is made
on or after October 1, 2004 on a recognized
stock exchange and the transaction is
chargeable to Securities Transaction Tax.
In accordance with section 111A of the Act,
taxable short-term capital gains are subject to tax
at a rate of 15% (plus applicable surcharge and
education cess).
(ii) Unlisted Shares:
Where the equity shares in a company are held
for a period of not more than 24 months in
case of shares of other companies prior to the
date of transfer of the shares.
In accordance with section 111A of the Act,
taxable short-term capital gains are subject to tax
at a normal rate of tax i.e. 30% (plus applicable
surcharge and education cess).
6. Exemption from Capital Gains:
Under section 54EC of the Act, long term capital gain arising from the transfer of a long term capital asset (being
land or building or both) is exempt from tax to the extent the same is invested in certain notified bonds within a
period of six months from the date of such transfer (up to a maximum limit of Rs.5.0 million) for a minimum
period of three years.
The Finance Act, 2018 in this regard has restricted the scope to capital gains arising from long-term capital assets,
being land or building and to make available funds at the disposal of eligible bond issuing company for more than
three years, it has amended section 54EC so as to provide that capital gain arising from the transfer of a long-
term capital asset, being land or building or both, invested in the long-term specified asset at any time within a
period of six months after the date of such transfer, the capital gain shall not be charged to tax subject to certain
conditions specified in this section.
The definition of long-term specified asset, for making any investment under the section on or after the 1st day
of April, 2018, shall mean any bond, redeemable after five years and issued on or after 1st day of April, 2018 by
the National Highways Authority of India or by the Rural Electrification Corporation Limited or any other bond
notified by the Central Government in this behalf. This amendment will take effect, from 1st April, 2019 and will,
accordingly, apply in relation to the assessment year 2019-20 and subsequent assessment years
In accordance with section 54F, long-term capital gains arising on the transfer of the shares of the Company held
by an individual and on which Securities Transaction Tax is not payable, shall be exempt from capital gains tax
if the net consideration is utilised, within a period of one year before, or two years after the date of transfer, in
the purchase of a new residential house, or for construction of a residential house within three years subject to
regulatory feasibility. Such benefit will not be available if the individual-
owns more than one residential house, other than the new residential house, on the date of transfer of
the shares; or
purchases another residential house within a period of one year after the date of transfer of the shares;
or
constructs another residential house within a period of three years after the date of transfer of the shares;
and
the income from such residential house, other than the one residential house owned on the date of transfer
of the original asset, is chargeable under the head “Income from house property”.
If only a part of the net consideration is so invested, so much of the capital gains as bears to the whole of the
capital gain the same proportion as the cost of the new residential house bears to the net consideration shall be
exempt.
If the new residential house is transferred within a period of three years from the date of purchase or construction,
the amount of capital gains on which tax was not charged earlier, shall be deemed to be income chargeable under
the head “Capital Gains” of the year in which the residential house is transferred.

186
C) Non-Resident Indians
A Non-Resident Indian has the option to be governed by the provisions of Chapter XII-A of the Income-tax Act,
1961 which reads as under:
In accordance with section 115-I, where a Non-Resident Indian opts not to be governed by the provisions of
Chapter XII-A for any assessment year, his total income for that assessment year (including income arising from
investment in the company) will be computed and tax will be charged according to the other provisions of the
Income-tax Act, 1961.
1. Filing of Return of Income in India:
In accordance with section 115G, it is not necessary for a Non-Resident Indian to file a return of income under
section 139(1), if his total income consists only of investment income earned on shares of the company acquired
out of convertible foreign exchange or income by way of long-term capital gains earned on transfer of shares of
the company acquired out of convertible foreign exchange or both, and the tax deductible has been deducted at
source from such income under the provisions of Chapter XVII-B of the Income-tax Act, 1961.
2. Benefit of Double Tax Avoidance Agreement (DTAA/ Tax Treaty):
As per the provisions of Section 90, the NRI shareholder has an option to be governed by the provisions of the
tax treaty, if they are more beneficial than the domestic law wherever India has entered into Double Taxation
Avoidance Agreement (DTAA) with the relevant country for avoidance of double taxation of income.
3. Exemption on Dividend Income received from Domestic Company:
In accordance with section 10(34), dividend income declared, distributed or paid by the Company (referred to in
section 115-O) will be exempt from tax.
4. Tax on Long Term Capital Gain:
In accordance with section 115E, income from investment or income from long-term capital gains on transfer
of assets other than specified asset shall be taxable at the rate of 20% (plus education cess). Income by way
of long term capital gains in respect of a specified asset (as defined in Section 115C(f) of the Income-tax Act,
1961), shall be chargeable at 10% (plus education cess).
In accordance with section 115F, subject to the conditions and to the extent specified therein, long-term capital
gains arising from transfer of shares of the company acquired out of convertible foreign exchange, and on
which Securities Transaction Tax is not payable, shall be exempt from capital gains tax, if the net
consideration is invested within six months of the date of transfer in any specified new asset and such specified
assets is not converted or transferred into money within a period of three years from the date of acquisition.
5. Tax on Short Term Capital Gain:
Short term capital gains and tax on the same would arise to a non-resident shareholder in the following cases:
Nature and period of holding of Shares Tax Treatment
(i) Listed Shares:
Where the equity shares in a company are held
for a period of not more than 12 months prior
to the date of transfer where the sale is made
on or after October 1, 2004 on a recognized
stock exchange and the transaction is
chargeable to Securities Transaction Tax.
In accordance with section 111A of the Act,
taxable short-term capital gains are subject to tax
at a rate of 15% (plus applicable surcharge and
education cess).
(ii) Unlisted Shares:
Where the equity shares in a company are held
for a period of not more than 24 months in
case of shares of other companies prior to the
date of transfer of the shares.
In accordance with section 111A of the Act,
taxable short-term capital gains are subject to tax
at a normal rate of tax i.e. 30% (plus applicable
surcharge and education cess).
If the provisions of Section 111A are not applicable to the short term capital gains, then the tax will be chargeable
at the applicable normal rates plus surcharge and education cess.

187
6. Exemption from Capital Gains:
Under section 54EC of the Act, long term capital gain arising on the transfer of shares of the Company [other
than the sale referred to in section 10(38) of the Act] is exempt from tax to the extent the same is invested in
certain notified bonds within a period of six months from the date of such transfer (up to a maximum limit of Rs
5.0 million) for a minimum period of three years.
The Finance Act, 2018 in this regard has restricted the scope to capital gains arising from long-term capital assets,
being land or building and to make available funds at the disposal of eligible bond issuing company for more than
three years, it has amended section 54EC so as to provide that capital gain arising from the transfer of a long-
term capital asset, being land or building or both, invested in the long-term specified asset at any time within a
period of six months after the date of such transfer, the capital gain shall not be charged to tax subject to certain
conditions specified in this section.
The definition of long-term specified asset, for making any investment under the section on or after the 1st day
of April, 2018, shall mean any bond, redeemable after five years and issued on or after 1st day of April, 2018 by
the National Highways Authority of India or by the Rural Electrification Corporation Limited or any other bond
notified by the Central Government in this behalf. This amendment will take effect, from 1st April, 2019 and
will, accordingly, apply in relation to the assessment year 2019-20 and subsequent assessment years.
In accordance with section 54F, long-term capital gains arising on the transfer of the shares of the Company held
by an individual or Hindu Undivided Family on which Securities Transaction Tax is not payable, shall be exempt
from capital gains tax if the net consideration is utilised, within a period of one year before, or two years after the
date of transfer, in the purchase of a new residential house, or for construction of a residential house within three
years subject to regulatory feasibility. Such benefit will not be available if the individual or Hindu Undivided
Family-
owns more than one residential house, other than the new residential house, on the date of transfer of
the shares; or
purchases another residential house within a period of one year after the date of transfer of the shares;
or
constructs another residential house within a period of three years after the date of transfer of the shares;
and
the income from such residential house, other than the one residential house owned on the date of transfer
of the original asset, is chargeable under the head “Income from house property”.
If only a part of the net consideration is so invested, so much of the capital gains as bears to the whole of the
capital gain the same proportion as the cost of the new residential house bears to the net consideration shall be
exempt.
If the new residential house is transferred within a period of three years from the date of purchase or construction,
the amount of capital gains on which tax was not charged earlier, shall be deemed to be income chargeable under
the head “Capital Gains” of the year in which the residential house is transferred.
7. Transfer of assets
The Finance Act 2018 has amended the section 47 of the Act so as to provide that transactions in the following
assets, by a non-resident on a recognized stock exchange located in any International Financial Services Centre
shall not be regarded as transfer, if the consideration is paid or payable in foreign currency:— (i) bond or Global
Depository Receipt, as referred to in sub-section (1) of section 115AC; or 12 (ii) rupee denominated bond of an
Indian company; or (iii) derivative. This amendment will take effect, from 1st April, 2019 and will, accordingly,
apply in relation to the assessment year 2019-20 and subsequent assessment years.
D) Foreign Institutional Investors (FIIs)
1. Exemption on Dividend Income received from Domestic Company:
In accordance with section 10(34), dividend income declared, distributed or paid by the Company (referred to in
section 115-O) will be exempt from tax in the hands of Foreign Institutional Investors (FIIs).

188
2. Tax on Capital Gains:
In accordance with section 115AD, FIIs will be taxed at 10% (plus applicable surcharge and education cess) on
long-term capital gains (computed without indexation of cost and foreign exchange fluctuation), if Securities
Transaction Tax is not payable on the transfer of the shares and at 15% (plus applicable surcharge and education
cess) in accordance with section 111A on short-term capital gains arising on the sale of the shares of the Company
which is subject to Securities Transaction Tax. If the provisions of Section 111A are not applicable to the short
term capital gains, then the tax will be charged at the rate of 30% plus applicable surcharge and education cess,
as applicable.
Section 112A of the Act provides that where the total income, includes any income chargeable under the head
“Capital gains”, arising from the transfer of a long-term capital asset, being an equity share in a company or a
unit of an equity oriented fund or a unit of a business trust, subject to the conditions specified under the section,
the tax payable on the capital gains exceeding Rs.0.10 million shall be calculated at the rate of 10%.
3. Benefit of Double Tax Avoidance Agreement (DTAA/ Tax Treaty):
As per the provisions of Section 90, the Non Resident shareholder has an option to be governed by the provisions
of the tax treaty, if they are more beneficial than the domestic law wherever India has entered into Double
Taxation Avoidance Agreement (DTAA) with the relevant country for avoidance of double taxation of income.
4. No TDS on capital gain arising from the transfer of securities referred to in section 115AD:
Under section 196D (2) of the Income-tax Act, 1961, no deduction of tax at source will be made in respect of
income by way of capital gain arising from the transfer of securities referred to in section 115AD.
5. Exemption from Capital Gains:
Under section 54EC of the Act, long term capital gain arising on the transfer of shares of the Company [other
than the sale referred to in section 10(38) of the Act] is exempt from tax to the extent the same is invested in
certain notified bonds within a period of six months from the date of such transfer (up to a maximum limit of Rs
5.0 million) for a minimum period of three years.
The Finance Act, 2018 in this regard has restricted the scope to capital gains arising from long-term capital assets,
being land or building and to make available funds at the disposal of eligible bond issuing company for more than
three years, it has amended section 54EC so as to provide that capital gain arising from the transfer of a long-
term capital asset, being land or building or both, invested in the long-term specified asset at any time within a
period of six months after the date of such transfer, the capital gain shall not be charged to tax subject to certain
conditions specified in this section.
The definition of long-term specified asset, for making any investment under the section on or after the 1st day
of April, 2018, shall mean any bond, redeemable after five years and issued on or after 1st day of April, 2018 by
the National Highways Authority of India or by the Rural Electrification Corporation Limited or any other bond
notified by the Central Government in this behalf. This amendment will take effect, from 1st April, 2019 and
will, accordingly, apply in relation to the assessment year 2019-20 and subsequent assessment years.
E) Persons carrying on business or profession in shares and securities.
Under section 36(1)(xv) of the Act, Securities Transaction Tax paid by a shareholder in respect of taxable
securities transactions entered into in the course of its business, would be allowed as a deduction if the income
arising from such taxable securities transactions is included in the income computed under the head “Profits and
gains of business or profession”.
A non-resident taxpayer has an option to be governed by the provisions of the Income-tax Act, 1961 or the
provisions of a Tax Treaty that India has entered into with another country of which the investor is a tax resident,
whichever is more beneficial (section 90(2) of the Act).
F) Mutual Funds
Under section 10(23D) of the Act, exemption is available in respect of income (including capital gains arising on
transfer of shares of the Company) of a Mutual Fund registered under the Securities and Exchange Board of India
Act, 1992 or such other Mutual fund set up by a public sector bank or a public financial institution or authorized
by the Reserve Bank of India and subject to the conditions as the Central Government may specify by notification.
However, the Mutual Funds would be required to pay tax on distributed income to unit holders as per the
provisions of Section 115R of the Act. However, w.e.f. 1 October 2014, for the purpose of determining additional

189
income tax, the amount of distributed income shall be increased to such amount as would after reduction of
additional income tax on such increased amount at the rate specified be equal to the amount of income distributed
by mutual fund.
G) Venture Capital Companies/Funds
In terms of section 10(23FB) of the Act, income of:-
Venture Capital company which has been granted a certificate of registration under the Securities and Exchange
Board of India Act, 1992; and
Venture Capital Fund, operating under a registered trust deed or a venture capital scheme made by Unit trust of
India, which has been granted a certificate of registration under the Securities and Exchange Board of India Act,
1992, from investment in a Venture Capital Undertaking, is exempt from income tax,
Exemption available under the Act is subject to investment in domestic company whose shares are not listed and
which is engaged in certain ‘specified’ business/ industry.
Notes:
1. The above Statement sets out the provisions of law in a summary manner only and is not a complete analysis or
listing of all potential tax consequences of the purchase, ownership and disposal of shares.
2. The above statement covers only certain relevant direct tax law benefits and does not cover any indirect tax law
benefits or benefit under any other law.
3. The above statement of possible tax benefits are as per the current direct tax laws relevant for the assessment year
2019-20. Several of these benefits are dependent on the Company or its shareholder fulfilling the conditions
prescribed under the relevant tax laws.
4. This statement is intended only to provide general information to the investors and is neither designed nor
intended to be a substitute for professional tax advice. In view of the individual nature of tax consequences, each
investor is advised to consult his/her own tax advisor with respect to specific tax consequences of his/her
investment in the shares of the Company.
5. In respect of non-residents, the tax rates and consequent taxation mentioned above will be further subject to any
benefits available under the relevant DTAA, if any, between India and the country in which the non-resident has
fiscal domicile.
6. No assurance is given that the revenue authorities/courts will concur with the views expressed herein. Our views
are based on the existing provisions of law and its interpretation, which are subject to changes from time to time.
We do not assume responsibility to update the views consequent to such changes.

190
LEGAL PROCEEDINGS
Our Company, certain of its Subsidiaries, Joint Ventures and Joint Ventures (Subsidiaries) are involved in various legal
proceedings from time to time, mostly arising in the ordinary course of business and are limited to project-related litigation
for our Ongoing Projects and Planned Projects. These legal proceedings are initiated by us and also by other parties.
These legal proceedings are primarily in the nature of writ petitions, criminal complaints, civil suits by us and petitions
pending before various authorities. We believe that the number of proceedings in which we are involved in is not unusual
for a company of our size in the context of doing business in India.
For the purposes of this section of this Placement Document, certain outstanding legal and other proceedings involving
our Company, our Subsidiaries, our Joint Ventures, the Joint Ventures (Subsidiaries) and Directors have been considered
important and disclosed below. The amount involved in these proceedings, excluding criminal proceedings and statutory
and regulatory actions, equivalent to or exceeding 2% of the consolidated profit after tax of our Company for the Financial
Year 2018 amounting to or exceeding ₹ 918.00 lakhs. Further, other than as disclosed in this section, (i) there is no other
litigation has been treated as material in our opinion; (ii) there is no litigation or legal action pending or taken by any
Ministry or Department of the Government or a statutory authority against our Promoter during the last three years
preceding the year of this Placement Document and no directions have been issued by such Ministry or Department or
statutory authority upon conclusion of such litigation or legal action; (iii) there are no inquiries, inspections or
investigations initiated or conducted under the Companies Act, 2013 or the Companies Act, 1956, in the last three years
preceding the year of this Placement Document involving our Company and our Subsidiaries. Additionally, there were no
prosecutions filed (whether pending or not) fines imposed, compounding of offences in the last three years immediately
preceding the year of this Placement Document for our Company and our Subsidiaries; (iv) there are no defaults in
repayment of statutory dues, dues owed to holders of securities, any issuance of debentures and interest thereon, deposits
and interests thereon and any loan obtained from any other bank or financial institution and interest thereon as of the
date of this Placement Document; and (v) there are no material frauds committed against our Company in the last three
years.
I. Litigation involving our Company
A. Litigation against our Company
Consumer Cases
1. Oberoi Woods Co-operative Housing Society Limited (the “Complainant Society”) filed a consumer complaint
(the “Complaint”) against our Company and others (the “Opposite Parties”) before the National Consumer
Disputes Redressal Commission, alleging deficiency in services and unfair trade practices under the provisions of
the Consumer Protection Act, 1986 for alleged non-compliance with statutory and contractual obligations including
rectification of defects in construction, leakage problems and other sub-standard works in relation to the Oberoi
Woods project. The Complainant Society has prayed that (i) it be declared that the Opposite Parties be held guilty
of deficiency in services and unfair trade practices; (ii) pay ₹ 617.50 lakhs towards expenses incurred to rectify the
leakages and other substandard work undertaken in the Complainant Society; (ii) the Opposite Party be ordered
and directed to replace lifts in towers A, B and C of Oberoi Woods or in the alternative be directed to pay a sum of
₹392 lakhs as expenses for the same; (iii) the Opposite Party be directed to pay the Complainant Society tax and
maintenance charges amounting to ₹4.74 lakhs; (v) the Opposite Party be directed to pay ₹ 58.52 lakhs towards
expenses incurred for water tanker; (vi) the Opposite Party be directed to pay compensation to the Complainant
Society, ₹ 143.04 lakhs being the interest on the corpus fund collected from the members; (vii) the Opposite Party
be directed to execute a deed of conveyance in respect of the disputed property and in the event of failure to comply
with this, levy a penalty of ₹ 0.01 lakhs per day until compliance; (viii) the Opposite Parties be mandatorily ordered
and directed to hand over the Complainant Society along with the original documents; (viii) refund all excess
amounts collected from the members of the Complainant Society along with interest at the rate of 24% per annum
until the date of refund; (ix) the Opposite Parties be directed to pay a sum of ₹ 10.00 lakhs for the inconvenience
and hardships suffered by the members of the Complainant Society and costs amounting to ₹ 5.00 lakhs. The
aggregate amount involved in the matter is ₹ 1,231.00 lakhs along with interest. The matter is currently pending.
Civil Cases
1. Splendor Complex Co-operative Housing Society Limited (the “Plaintiff”) filed a suit against our Company, OCL
and others (the “Defendants”) before the High Court of Bombay. The Plaintiff has alleged, amongst other things,
that the ongoing constructions of the buildings Prisma and Maxima are in violation of applicable laws, including
the Maharashtra Ownership of Flats Act, 1963 and the Development Control Regulations for Greater Bombay,
1991. The Plaintiff has prayed before the High Court of Bombay, (i) to grant a permanent injunction restricting the
Defendants from undertaking any further construction of Prisma and Maxima; (ii) to order the Defendants to
execute a deed of conveyance in respect of the suit property; (iii) to furnish true accounts of the amounts collected
from the flat owners; (iv) to declare that the Defendants are liable to pay ₹ 34,700 lakhs, along with any additional
amount due on account of breaches, at an interest rate of 18% per annum. The matter is currently pending.

191
2. Mohit Chandra Bhardwaj and others (the “Plaintiffs”) have filed a suit and an application against our Company
and the Mumbai Municipal Corporation (the “Defendants”) before the City Civil Court, Dindoshi, Borivali
Division, Goregaon, Mumbai (the “Court”) and Divisional Joint Registrar, Co-operative Housing Society,
respectively, alleging, amongst others, that the additional proposed construction is illegal and that the alteration
plan has not been permitted without prior consent of the flat owners, which includes the Plaintiffs (the “Suit”). The
Plaintiffs prayed, amongst other things, that the concerned society be de-registered, the additional proposed
building constructed on the north-west side of the existing buildings is declared illegal, and the Persons be
adequately compensated for the discrepancy between the area mentioned in each of the sale deeds and the area
actually granted. The Court passed an order dated December 7, 2016 erroneously disposing off the notice of motion
of the Petitioner (the “Order”). The Plaintiff, Mohit Chandra Bharadwaj filed a writ petition before the High Court
of Bombay aggrieved by the Order. The matter is currently pending.
3. Mohit Chandra Bhardwaj and others (the “Petitioners”) has filed writ petitions against our Company, Vikas Oberoi
and others (“Respondents”) before the High Court of Bombay alleging that our Company has undertaken illegal
construction and structural amendments without prior approval of the flat owners, as required under applicable law.
The Petitioners have prayed, amongst other things for, (i) proper findings in relation to the delay in formation of
the society be recorded, which is in violation of Section 10 of the Maharashtra Ownership of Flats Act, 1963; (ii)
providing access to proper accounts; (iii) all illegal constructions be demolished; and (iv) an appropriate writ may
be issued to certain persons regarding issuance of further permissions, approvals, occupation certificates and
commencement certificates.
4. EIH Limited and Oberoi Hotels Private Limited by way of letter dated August 30, 2016 alleging that Vikas Oberoi,
our Company, OCL and Oasis Realty there was infringement and passing off of their trademarks, namely “The
Oberoi”, “threesixty”, “threesixty◦” and “threesixtyone” in respect of their on-going project (the “Trademarks”).
Vikas Oberoi, our Company and Oasis Realty through their letter dated September 28, 2016 denying these
allegations. EIH Limited and Oberoi Hotels Private Limited (the “Plaintiffs”) filed a suit and an interlocutory
application against Vikas Oberoi, our Company, Oasis Realty, Sahana Realty Private Limited and others (the
“Defendants”) before the High Court of Delhi (the “High Court”), alleging infringement of the Plaintiff’s
Trademarks by the Defendants by collaborating, developing and promoting their project. The Plaintiffs, have
prayed for the following reliefs (i) a decree for interim and permanent injunction to be granted restraining the
Defendants and its officers from using the Trademarks, either individually or in conjunction with any other
trademark identical, or deceptively, similar to the Trademarks in any manner; (ii) an order be passed, directing the
Defendant to destroy all catalogues, brochures, publicity material, stickers, bearing the Trademarks, either
individually or in conjunction with any other trademark identical, or deceptively, similar to the Trademarks in any
manner; (iii) an order be passed directing rendition of any accounts of profit illegally earned by the Defendants
from use of the Trademarks, either individually or in conjunction with any other trademark identical, or deceptively,
similar to the Trademarks in any manner; (iv) an order directing the Defendants to pay a sum of ₹ 100.00 lakhs
towards damages; and (v) an order for costs. The Defendants in their written statement dated February 25, 2017
have denied all allegations in the said matter and further requested dismissal of the suit on the grounds that the
matter is beyond the jurisdiction of the High Court. The Defendants have also filed an application dated March 20,
2017 before the High Court for dismissal of the matter as the High Court lacks jurisdiction in relation to the matter.
The Plaintiffs have through their reply dated April 7, 2017 requested the High Court to dismiss the application of
the Defendants as the Plaintiffs reside in New Delhi. The matters are currently pending.
5. Anita Anil Chavan (“Petitioner”) had filed a writ petition before the High Court of Bombay (the “Court”) against
the Commissioner of Police and our Company, amongst others, for alleged violation of the Noise Pollution
(Regulation and Control) Rules, 2000 (the “Writ Petition”). After perusing the prayer sought in the Writ Petition,
the Court directed the matter to be placed before the appropriate court and the Writ Petition to be filed as a public
interest litigation (the “PIL”). During the pendency of the PIL, our Company was directed to file an affidavit to the
effect that the construction activities would not be carried out between 7 p.m and 7 a.m (the “Affidavit”), which
was duly filed by the Company. Subsequently, the Petitioner filed an affidavit before the Court stating that the
construction activities were being carried out between 7 p.m. and 7 a.m. and sought an order to cancel all
construction permits granted in favour of the Company. The Court appointed an officer to inspect the site to
ascertain if our Company was in violation of the Affidavit. Through its order dated August 23, 2016, the Court
directed the Company not to carry out construction between 10 p.m. to 6 a.m., as per the Noise Pollution
(Regulation and Control) Rules, 2000. Subsequently the PIL was disposed of through an order dated September 6,
2016. During the pendency of the PIL, the Petitioner filed a contempt petition before the High Court of Bombay
against our Company and certain of our Directors (the “Defendants”). The matter is currently pending.

192
II. Litigation involving our Subsidiaries
A. Litigation against our Subsidiaries
Litigation against OCL
Civil Cases
1. Janak Shankarlal Keshriya (the “Petitioner”) filed a public interest litigation dated October 20, 2016 before the
High Court of Bombay against the Union of India, OCL, Incline Realty Private Limited (“IRPL”) and others (the
“Respondents”) in relation to the alleged violation by OCL and IRPL in obtaining environmental clearance and
wildlife clearance as required under various laws and notifications issued by the Ministry of Environment for
construction work on land beyond the 20,000 square meters within 10 kilometers of ‘protected area’, while carrying
out development of the projects, Enigma, Eternia and Sky City across Mumbai (the “PIL”). In respect of this matter
the Petitioner has prayed that the High Court of Bombay, including, (i) issue writs of certiorari, mandamus and
prohibition against the Respondents (other than OCL and IRPL); (ii) issue directions to OCL and IRPL to suspend
construction activities undertaken in Mulund, Nahur and Borivali lands beyond 20,000 square meters; (iii) take
action against OCL and IRPL under the Environmental Protection Act; (iv) take action to reject any application
made by OCL and IRPL to procure wildlife clearance; (v) restrain OCL and IRPL from selling or offering to sell
flats or accommodation units from the building to be constructed at Mulund, Nahur and Borivali lands; (vi) issue
an interim order revoking or suspending OCL and IRPL from undertaking construction activities at Mulund, Nahur
and Borivali lands; (vii) suspend all permissions granted to OCL and IRPL for the project at Mulund, Nahur and
Borivali lands; (viii) issue an interim order to direct the other Respondents from processing the applications for
clearances filed by OCL in respect of the Mulund, Nahur and Borivali lands. OCL has filed an affidavit dated
September 14, 2017 in response to the PIL stating that all permissions and clearances as required under applicable
law have been obtained by OCL and IRPL, as applicable, and are valid and subsisting and accordingly has prayed
for dismissal of the PIL. The matter is currently pending.
2. For details of additional litigation involving OCL, please see the section entitled “Legal Proceedings – Litigation
involving our Company – Litigation against our Company – Civil Cases” on page 190.
Consumer Cases
1. Oberoi Springs Co-operative Housing Society Limited (the “Complainant Society”) filed a consumer complaint
dated November 12, 2012 (the “Complaint”) against OCL, Excel Industries Limited and Shroff Charitable Trust
(the “Opposite Parties”) before the National Consumer Disputes Redressal Commission, alleging deficiency in
services and unfair trade practices by the Opposite Parties, as per the Consumer Protection Act, 1986 due to breach
of the provisions of the MOFA applicable to the Complainant Society. The Complainant Society has further alleged
that the Opposite Parties have failed to comply with their contractual and statutory obligations including (i) failing
to transfer their right, title and interest in favour of the Complainant Society within four months, resulting in
violation of Section 11 of MOFA read with the rules made thereunder, (ii) conversion of MCGM sanctioned
parking lots by the Complainant Society and the subsequent sale of these parking lots to members of the
Complainant Society at varied rates, (iii) insufficient supply of water from municipal sources; and (iv) deviation in
the plans by the Opposite Parties without the prior approval of the flat owners. The Complainant Society, has prayed
that the Opposite Parties be directed to, amongst other things, (i) jointly and severally execute the deed of
conveyance; (ii) provide all original documents of title in respect of the Complainant Society along with full and
complete accounts of the monies collected from the members of the Complainant Society; (iii) reimburse ₹ 160.00
lakhs to the Complainant Society, being the expenses incurred for obtaining tanker water from January 2010 to
July 2012; (iv) reimburse ₹ 4,220.00 lakhs for the parking space sold illegally to the members of the Complainant
Society; (v) pay ₹ 645.00 lakhs for the one time club membership fee collected from the members of the
Complainant Society; and (vi) such other relief as may be considered fit. The aggregate amount involved in the
matter is ₹ 6,227.98 lakhs and interest. The matter is currently pending.
Litigation by OCL
Civil Cases
1. A special leave petition (“SLP”) was filed by OCL against the State of Maharashtra and others (the “Petitioners”)
before the Supreme Court of India challenging that the order of the High Court of Bombay declaring that certain
land held by OCL as ‘private forest’ under the Maharashtra Private Forests (Acquisition) Act, 1975. In accordance
with the order of the Supreme Court of India dated December 8, 2009, OCL had deposited the net present value
amounting to ₹ 1,091.15 lakhs with the Deputy Conservator of Forests, Thane for the non-forest use of the land,
subject to the outcome of the SLP. Subsequently, OCL filed a civil appeal dated January 24, 2017 and prayed that,
amongst other things, the Deputy Conservator of Forests, Thane, State of Maharashtra be directed to refund the
amount of net present value, being ₹ 1,091.15 lakhs be refunded to OCL, along with the interest at such rate as may

193
be directed in accordance with the order of the Supreme Court of India dated January 30, 2014 stating that the land
does not fall within the forest zone. The matter is currently pending.
Litigation against Incline Realty Private Limited
For details of litigation involving IRPL, please see the section entitled “Legal Proceedings – Litigation involving
our Subsidiaries – Litigation against our Subsidiaries – Litigation against OCL – Civil Cases” on page 192.
III. Litigation involving the Joint Ventures (Subsidiaries)
A. Litigation against the Joint Ventures (Subsidiaries)
Litigation against Oasis Realty
1. For details of additional litigation involving Oasis Realty, please see the section entitled “Legal Proceedings –
Litigation involving our Company – Litigation against our Company – Civil Cases” on page 190.
Litigation against Saldanha Realty and Infrastructure LLP (“SRIL”)
Civil Cases
1. Sudha Navin Parikh and others (the “Plaintiffs”) filed a suit for specific performance against SRIL, the Bombay
Xavierian Corporation Private Limited (“BXCPL”) and others (collectively, the “Defendants”) before the High
Court of Bombay seeking conveyance of the property situated at Mulgaon (the “Disputed Property”) in
performance of the agreement dated April 1, 1962 entered into between BXCPL and Ambalal C. Shah for
conveyance of the Disputed Property which was subsequently transferred pursuant to an order of the Charity
Commissioner dated October 21, 2016 which approved the conveyance from BXCPL to SRIL (the “Order”). The
Plaintiffs prayed that (i) BXCPL be ordered to execute the deed of conveyance in favour of the Plaintiffs for all the
right, title and interest in the Disputed Property and SRIL be ordered to join the execution of such deed of
conveyance, on such terms and conditions, as may be decided by the High Court of Bombay or alternatively an
officer of the High Court of Bombay execute the conveyance in the event BXCPL or SRIL fail or neglect to execute
the conveyance or join in the execution of the conveyance; and (ii) a permanent order and injunction be issued
restraining the Defendants, either themselves or through others, from selling, transferring, alienating, encumbering
or creating any third party rights of whatever nature in respect of the Disputed Property (“Prayer I”). The Plaintiffs
have alternatively prayed, without prejudice to the Prayer, that the High Court issue permanent order and injunction
be issued restraining the Defendants, either themselves or through others, from selling, transferring, alienating,
encumbering or creating any third party rights of whatever nature in respect of the Disputed Property (“Prayer
II”). The Plaintiffs have alternative to Prayer I and in addition to Prayer II, prayed that (i) an order be passed
directing BXCPL and SRPIL to pay, jointly and/or severally ₹ 15,000 lakhs. Subsequently, SRIL filed a written
statement stating, amongst other things, that the suit is barred by the law of limitation and is accordingly, liable to
be dismissed. The Plaintiffs filed a writ petition dated February 22, 2018 before the High Court of Bombay alleging
that the Defendants had obtained the Order illegally and was invalid and prayed that the Order be set aside. The
matter is currently pending.
Litigation against Siddhivinayak Realties Private Limited (“SRPL”)
Arbitration Proceedings
1. V. Hotels Limited and others (the “Claimants”) have filed a statement of claim against SRPL (the “Respondent”)
for the breach of the master asset purchase agreement (the “Agreement”) which was executed between the
disputing parties on March 31, 2005, pursuant to which the Respondent agreed to purchase a certain hotel property,
namely, Centaur Hotel, Juhu beach, Mumbai, together with eleven flats in Mumbai from Tulip Star Hotels Limited
for the consideration mentioned therein. The Claimants sought, amongst other things, for a declaration that the
Agreement stands terminated pursuant to the repudiatory breaches committed by the Respondent and for recovery
of damages for the said breach in the amount of ₹ 1,800.00 lakhs. The Respondents have filed their written
statement and a counter claim on September 30, 2006 claiming, amongst other things, that the Agreement is in
force and seeking order restraining the Claimants from forfeiting the payments already made under the Agreement.
The Claimants have filed their reply to the counter claim of the Respondents. The Claimants and the Respondents
have submitted affidavits of witnesses. Further, the Claimants initiated arbitration proceedings, praying that the
Agreement be declared as null and void. The arbitrator, by the order dated July 13, 2011 (the “2011 Award”) held
that (i) the Agreement has been terminated by repudiated on the part of the Claimant and acceptance by the
Respondents of the same; (ii) the Claimant being unwilling to complete the Agreement would accordingly not be
entitled to specific performance; and (ii) directed the Claimants to refund a sum of ₹ 7,300.00 lakhs to the
Respondent which was submitted by way of a cheque which was not accepted by the Respondent. The 2011 Award
was thereafter challenged by the Respondent in the High Court of Bombay under Section 34 of the Arbitration and
Conciliation Act, 1996 (the “Arbitration Act”) praying that (i) the 2011 Award be quashed and set aside; and (ii)

194
the Claimants be restrained from disposing or alienating, encumbering or parting with the possession of the property
or entering into any agreement in respect of the disputed hotel property. Subsequently, the High Court of Bombay,
by its order dated May 10, 2013 allowed 2011 Award to be set aside (the “2013 Award”). Thereafter, the Claimants
filed an appeal under Section 37 of the Arbitration Act against the 2013 Award (the “Appeal”). The Respondents
had filed a caveat in anticipation of the Appeal. The matter is currently pending.
B. Litigation by the Joint Ventures (Subsidiaries)
Litigation by Siddhivinayak Realties Private Limited
Civil Cases
1. SRPL (the “Plaintiff”) filed a suit against V. Hotels Limited, Tulip Hotels Private Limited, Tulip Start Hotels
Limited and others (the “Defendants”) before the High Court of Bombay in relation to the specific performance
of the master asset purchase agreement dated March 31, 2005 entered into between the disputing parties (the
“Agreement”). The Plaintiff has prayed, amongst other things, that (i) the Agreement be declared valid, subsisting
and binding upon the Defendants; (ii) the Defendants be ordered to specifically perform the Agreement; (iii) the
Defendants be jointly and severally be ordered to pay to the Plaintiff, compensation of ₹ 21,333.90 lakhs or such
other amount as the High Court of Bombay may deem fit. In the alternative, the Plaintiffs have prayed that the
Defendants be ordered to pay a sum of ₹ 2,99,957.00 lakhs as compensation. The Defendants have filed a written
statement and have, subsequently, filed an application under Order XIII A of the Code of Civil Procedure, 1908
for summary dismissal of the suit alleging that the said suit is barred by limitation. The matter is currently pending.
Statutory and Regulatory inspections
Our Company and certain of our Subsidiaries are subject to periodic inspections by Governmental authorities with respect
to controls, laws and regulations application to our Company and such Subsidiaries. Such Governmental authorities may
impose warnings, penalties and restrictions upon our Company and Subsidiaries in the event of any irregularities or non-
compliance with any applicable laws, regulations and guidelines by our Company and Subsidiaries.
Inquiries, inspections or investigations initiated or conducted under the Companies Act, 2013 or the Companies Act,
1956, in the last three years preceding the year of this Placement Document involving our Company and our
Subsidiaries
Notices
1. Our Company has received a call for information through a letter dated May 25, 2018 by the MCA (the “Letter”)
requiring our Company to submit certain information and documents due to alleged non-compliance by our
Company in respect of the amount spent on corporate social responsibility activities in the Financial Year ended
2016 as required under Section 135 of the Companies Act, 2013. Our Company has responded to the Letter by
way of its letter dated June 13, 2018 providing necessary information sought from our Company in respect of the
amount spent on corporate social responsibility activities in the Financial Year ended 2016.
2. Our Company has received a letter dated May 14, 2018 from the Ministry of Corporate Affairs (the “Notice”)
regarding their observation that our Company having more than two layers of subsidiaries which requires certain
form filing to be made by our Company which have not been made, which may be held to be in contravention of
the Companies (Restriction on number of Layers) Rules, 2017. Our Company has responded to the Notice by
way of letter its dated June 8, 2018 providing necessary clarifications that our Company does not have more than
two layers of subsidiaries.
3. Our Company and OCL have separately received letters each dated March 30, 2017 regarding alleged
inconsistencies in cost audit report submitted by our Company and OCL for the Financial Year ended March 31,
2016. Our Company and OCL have responded to the letters by way of separate letters each dated April 20, 2017,
respectively, providing necessary clarifications.
Defaults in repayment of statutory dues by our Company
1. For details of non-payment of statutory dues in the last three Financial Years, all of which are disputed by our
Company, please see the section entitled “Financial Statements” beginning on page 197.

195
STATUTORY AUDITORS
S R B C & CO LLP, Chartered Accountants, are independent auditors with respect to our Company as required by the
Companies Act, 2013 and in accordance with the guidelines prescribed by ICAI, and have been appointed as the Statutory
Auditors of our Company, pursuant to the approval of the shareholders of our Company at the meeting held on September
19, 2017, to hold office for a term of five years, that is, from the conclusion of the 19th AGM until the conclusion of the
24th AGM to be held in the year 2022.
The audited financial statements as at and for the year ended March 31, 2018 have been audited by S R B C & CO LLP,
Chartered Accountants, while the audited financial statements as at and for the years ended March 31, 2017 and March
31, 2016 have been audited by our previous statutory auditors, M/s. P. Raj & Co., Chartered Accountants.
Our audited consolidated financial statements for the financial year ended March 31, 2018 are prepared in accordance with
the Ind AS and Companies Act, 2013 together with the report issued by S R B C & CO LLP, Chartered Accountants and
our audited consolidated financial statements for the financial years ended March 31, 2017 and March 31, 2016, are
prepared in accordance with the Ind AS and Indian GAAP, respectively, and the Companies Act, 2013 together with the
report issued by M/s. P. Raj & Co., Chartered Accountants which have been included in this Placement Document.

196
GENERAL INFORMATION
Our Company was incorporated as Kingston Properties Private Limited on May 8, 1998 under the Companies
Act, 1956. The name of the Company was changed to Oberoi Realty Private Limited on October 23, 2009. The
Company was converted into a public limited company on December 14, 2009 and consequently, the name was
changed to Oberoi Realty Limited.
Our Company’s Registered and Corporate Office is situated at Commerz, 3rd Floor, International Business Park,
Oberoi Garden City, Off Western Express Highway, Goregaon (East), Mumbai 400 063.
Our CIN is L45200MH1998PLC114818.
The Issue has been authorised by our Board on April 24, 2018 and the shareholders of our Company pursuant to
the special resolution dated June 5, 2018 approving the issue of securities, aggregating up to ₹ 2,000 crore,
inclusive of premium.
The Equity Shares are listed on BSE and NSE.
Our Company has received in-principle approvals under Regulation 28(1) of the SEBI Listing Regulations from
each of BSE and NSE, on June 13, 2018, to list the Equity Shares to be issued pursuant to the Issue.
Copies of our Memorandum of Association and Articles of Association will be available for inspection between
11:00 am to 1:00 pm on any working day (except Saturdays) at our Registered and Corporate Office.
Except as disclosed in this Placement Document, our Company has obtained all consents, approvals and
authorisations required in connection with the Issue.
There has been no significant change in the financial or trading position since March 31, 2018, the date of the
Financial Statements included in this Placement Document, except as disclosed herein.
The audited consolidated financial statements as at and for the year ended March 31, 2018 have been audited by
S R B C & CO LLP, Chartered Accountants, while the audited consolidated financial statements as at and for the
years ended March 31, 2017 and March 31, 2016 have been audited by our previous auditors, M/s. P. Raj & Co.,
Chartered Accountants.
Except as disclosed in this Placement Document, there are no litigation or arbitration proceedings against or
affecting us, or our assets or revenues, nor are we aware of any pending or threatened litigation or arbitration
proceedings, which are or might be material in the context of the Issue. For further details, please see the section
entitled “Legal Proceedings” on page 190.
Our Company confirms that it is in compliance with the minimum public shareholding requirements as specified
in the SCRR and the SEBI Listing Regulations.
The Floor Price is ₹ 509.29 per Equity Share, calculated in accordance with the provisions of Chapter VIII of the
SEBI Regulations, as certified by S R B C & CO LLP, Chartered Accountants, the Statutory Auditors, by their
certificate dated June 13, 2018. Our Company has offered a discount of not more than 5% on the Floor Price in
terms of Regulation 85(1) of the SEBI Regulations.
Details of the Company Secretary and Compliance Officer of our Company are as follows:
Bhaskar Kshirsagar
Commerz, 3rd Floor
International Business Park, Oberoi Garden City
Off Western Express Highway
Goregaon (East), Mumbai 400 063
Tel No: +91 22 6677 3333; Fax: +91 22 6677 3334
E-mail: [email protected]

197
FINANCIAL STATEMENTS
Financial Statements Page Number
Audited Consolidated Financial Statements for the Financial Years 2018, 2017 and 2016 198

To the Members of Oberoi Realty Limited
Report on the Consolidated Ind AS Financial Statements
We have audited the accompanying consolidated Ind AS financial statements of Oberoi Realty Limited (hereinafter referred to as “the Holding Company”), its subsidiaries (the Holding Company and its subsidiaries together referred to as “the Group”) its joint ventures, comprising of the consolidated Balance Sheet as at March 31, 2018, the consolidated Statement of Profit and Loss including other comprehensive income, the consolidated Cash Flow Statement, the consolidated Statement of Changes in Equity for the year then ended, and a summary of significant accounting policies and other explanatory information (hereinafter referred to as “the consolidated Ind AS financial statements”).
Management’s Responsibility for the Consolidated Financial Statements
The Holding Company’s Board of Directors is responsible for the preparation of these consolidated Ind AS financial statements in terms of the requirement of the Companies Act, 2013 (“the Act”) that give a true and fair view of the consolidated financial position, consolidated financial performance including other comprehensive income, consolidated cash flows and consolidated statement of changes in equity of the Group including its Joint Ventures in accordance with accounting principles generally accepted in India, including the Accounting Standards specified under Section 133 of the Act, read with the Companies (Indian Accounting Standard) Rules, 2015, as amended. The respective Board of Directors of the companies included in the Group and of its joint ventures are responsible for maintenance of adequate accounting records in accordance with the provisions of the Act for safeguarding of the assets of the Group and of its joint ventures and for preventing and detecting frauds and other irregularities; the selection and application of appropriate accounting policies; making judgments and estimates that are reasonable and prudent; and the design, implementation and maintenance of adequate internal financial controls, that were operating effectively for ensuring the accuracy and completeness of the accounting records, relevant to the preparation and presentation of the financial statements that give a true and fair view and are free from material misstatement, whether due to fraud or error, which have been used for the purpose of preparation of the consolidated Ind AS financial statements by the Directors of the Holding Company, as aforesaid.
Auditor’s Responsibility
Our responsibility is to express an opinion on these consolidated Ind AS financial statements based on our audit. While conducting the audit, we have taken into account the provisions of the Act, the accounting and auditing standards and matters which are required to be included in the audit report under the provisions of the Act and the Rules made thereunder. We conducted our audit in accordance with the Standards on Auditing, issued by the Institute of Chartered Accountants of India, as specified under Section 143(10) of the Act. Those Standards require that we comply with ethical requirements and plan and perform the audit to obtain reasonable assurance about whether the financial statements are free from material misstatement.
An audit involves performing procedures to obtain audit evidence about the amounts and disclosures in the consolidated financial statements. The procedures selected depend on the auditor’s judgment, including the assessment of the risks of material misstatement of the consolidated financial statements, whether due to fraud or error. In making those risk assessments, the auditor considers internal financial control relevant to the Holding Company’s preparation of the consolidated Ind AS financial statements that give a true and fair view in order to design audit procedures that are appropriate in the circumstances. An audit also includes evaluating the appropriateness of accounting policies used and the reasonableness of the accounting estimates made by the Holding Company’s Board of Directors, as well as evaluating the overall presentation of the consolidated financial statements. We believe that the audit evidence obtained by us and the audit evidence obtained by the other auditors in terms of their reports referred to in sub-paragraph (a) of the Other Matters paragraph below, is sufficient and appropriate to provide a basis for our audit opinion on the consolidated Ind AS financial statements.
Opinion
In our opinion and to the best of our information and according to the explanations given to us and based on the consideration of reports of other auditors on separate financial statements and on the other financial information of the subsidiaries and joint ventures, the aforesaid consolidated Ind AS financial statements give the information required by the Act in the manner so required and give a true and fair view in conformity with the accounting principles generally accepted in India of the consolidated state of affairs of the Group, its joint ventures as at March 31, 2018, their consolidated profit including other comprehensive income, their consolidated cash flows and consolidated statement of changes in equity for the year ended on that date.
INDEPENDENT AUDITOR’S REPORT ON CONSOLIDATED IND AS FINANCIAL STATEMENTS
2017-18 69198

Other Matter
(a) We did not audit the financial statements and other financial information, in respect of two subsidiaries, whose Ind AS financial statements include total assets of ` 8.45 lakh and net assets of ` 8.16 lakh as at March 31, 2018, and total revenues of ` 0.17 lakh and net cash outflows of ` 5.81 lakh for the year ended on that date. These financial statement and other financial information have been audited by other auditors, which financial statements, other financial information and auditor’s reports have been furnished to us by the management. The consolidated Ind AS financial statements also include the Group’s share of net profit of ` 46.64 lakh for the year ended March 31, 2018, as considered in the consolidated financial statements, in respect of three joint ventures, whose financial statements, other financial information have been audited by other auditors and whose reports have been furnished to us by the Management. Our opinion on the consolidated Ind AS financial statements, in so far as it relates to the amounts and disclosures included in respect of these subsidiaries and joint ventures and our report in terms of sub-sections (3) of Section 143 of the Act, in so far as it relates to the aforesaid subsidiaries and joint ventures, is based solely on the reports of such other auditors.
(b) The Ind AS consolidated financial statements of the Company for the year ended March 31, 2017, included in these consolidated Ind AS financial statements, have been audited by the predecessor auditor who expressed an unmodified opinion on those statements on May 4, 2017.
(c) The consolidated Ind AS financial statements also include the Group’s share of net loss of ` 0.73 lakh for the year ended March 31, 2018, as considered in the consolidated financial statements, in respect of three joint ventures, whose financial statements, other financial information have not been audited and whose unaudited financial statements, other unaudited financial information have been furnished to us by the Management. Our opinion, in so far as it relates amounts and disclosures included in respect of these joint ventures, and our report in terms of sub-sections (3) of Section 143 of the Act in so far as it relates to the aforesaid joint ventures, is based solely on such unaudited financial statement and other unaudited financial information. In our opinion and according to the information and explanations given to us by the Management, these financial statements and other financial information are not material to the Group.
Our opinion above on the consolidated Ind AS financial statements, and our report on Other Legal and Regulatory Requirements above, is not modified in respect of the above matters with respect to our reliance on the work done and the reports of the other auditors and the financial statements and other financial information certified by the Management.
Report on Other Legal and Regulatory Requirements
As required by section 143 (3) of the Act, based on our audit and on the consideration of report of the other auditors on separate financial statements and the other financial information of subsidiaries and joint ventures, as noted in the ‘other matter’ paragraph we report, to the extent applicable, that:
(a) We / the other auditors whose reports we have relied upon have sought and obtained all the information and explanations which to the best of our knowledge and belief were necessary for the purpose of our audit of the aforesaid consolidated Ind AS financial statements;
(b) In our opinion proper books of account as required by law relating to preparation of the aforesaid consolidation of the financial statements have been kept so far as it appears from our examination of those books and reports of the other auditors;
(c) The consolidated Balance Sheet, consolidated Statement of Profit and Loss including the Statement of Other Comprehensive Income, the consolidated Cash Flow Statement and consolidated Statement of Changes in Equity dealt with by this Report are in agreement with the books of account maintained for the purpose of preparation of the consolidated Ind AS financial statements;
(d) In our opinion, the aforesaid consolidated Ind AS financial statements comply with the Accounting Standards specified under section 133 of the Act, read with Companies (Indian Accounting Standard) Rules, 2015, as amended;
(e) On the basis of the written representations received from the directors of the Holding Company as on March 31, 2018 taken on record by the Board of Directors of the Holding Company and the reports of the statutory auditors who are appointed under Section 139 of the Act, of its subsidiary companies and joint ventures incorporated in India, none of the directors of the Group’s companies, its joint ventures incorporated in India is disqualified as on March 31, 2018 from being appointed as a director in terms of Section 164 (2) of the Act.
70 2017-18199

(f) With respect to the adequacy and the operating effectiveness of the internal financial controls over financial reporting of the Holding Company and its subsidiary companies and joint ventures incorporated in India, refer to our separate report in “Annexure 1” to this report;
(g) With respect to the other matters to be included in the Auditor’s Report in accordance with Rule 11 of the Companies (Audit and Auditors) Rules, 2014, in our opinion and to the best of our information and according to the explanations given to us and based on the consideration of the report of the other auditors on separate financial statements as also the other financial information of the subsidiaries and joint ventures, as noted in the ‘Other matter’ paragraph:
i. The consolidated Ind AS financial statements disclose the impact of pending litigations on its consolidated financial position of the Group and its joint ventures – Refer Note 41 to the consolidated Ind AS financial statements;
ii. The Group and its joint ventures did not have any material foreseeable losses in long-term contracts including derivative contracts during the year ended March 31, 2018;
iii. There were no amounts which were required to be transferred to the Investor Education and Protection Fund by the Holding Company, its subsidiaries and joint ventures incorporated in India during the year ended March 31, 2018.
For S R B C & CO LLPChartered AccountantsICAI Firm Registration Number 324982E / E300003
per Sudhir SoniPartnerMembership No: 41870Place: MumbaiDate: April 24, 2018
2017-18 71200

Report on the Internal Financial Controls under Clause (i) of Sub-section 3 of Section 143 of the Companies Act, 2013 (“the Act”)
In conjunction with our audit of the consolidated Ind AS financial statements of Oberoi Realty Limited as of and for the year ended March 31, 2018, we have also audited the internal financial controls over financial reporting of Oberoi Realty Limited (“the Holding Company”) and its subsidiary companies and its joint ventures, which are companies incorporated in India as of that date.
Management’s Responsibility for Internal Financial Controls
The respective Board of Directors of the Holding Company, its subsidiary companies, and joint ventures, which are companies incorporated in India, are responsible for establishing and maintaining internal financial controls based on the internal control over financial reporting criteria established by the Holding Company considering the essential components of internal control stated in the Guidance Note on Audit of Internal Financial Controls Over Financial Reporting issued by the Institute of Chartered Accountants of India. These responsibilities include the design, implementation and maintenance of adequate internal financial controls that were operating effectively for ensuring the orderly and efficient conduct of its business, including adherence to the respective company’s policies, the safeguarding of its assets, the prevention and detection of frauds and errors, the accuracy and completeness of the accounting records, and the timely preparation of reliable financial information, as required under the Act.
Auditor’s Responsibility
Our responsibility is to express an opinion on the company’s internal financial controls over financial reporting based on our audit. We conducted our audit in accordance with the Guidance Note on Audit of Internal Financial Controls Over Financial Reporting (the “Guidance Note”) and the Standards on Auditing, both, issued by Institute of Chartered Accountants of India, and deemed to be prescribed under section 143(10) of the Act, to the extent applicable to an audit of internal financial controls. Those Standards and the Guidance Note require that we comply with ethical requirements and plan and perform the audit to obtain reasonable assurance about whether adequate internal financial controls over financial reporting was established and maintained and if such controls operated effectively in all material respects.
Our audit involves performing procedures to obtain audit evidence about the adequacy of the internal financial controls system over financial reporting and their operating effectiveness. Our audit of internal financial controls over financial reporting included obtaining an understanding of internal financial controls over financial reporting, assessing the risk that a material weakness exists, and testing and evaluating the design and operating effectiveness of internal control based on the assessed risk. The procedures selected depend on the auditor’s judgement, including the assessment of the risks of material misstatement of the financial statements, whether due to fraud or error.
We believe that the audit evidence we have obtained is sufficient and appropriate to provide a basis for our audit opinion on the Holding Company, its subsidiary companies and its joint ventures incorporated in India, internal financial controls system over financial reporting.
Meaning of Internal Financial Controls Over Financial Reporting
A company’s internal financial control over financial reporting is a process designed to provide reasonable assurance regarding the reliability of financial reporting and the preparation of financial statements for external purposes in accordance with generally accepted accounting principles. A company’s internal financial control over financial reporting includes those policies and procedures that (1) pertain to the maintenance of records that, in reasonable detail, accurately and fairly reflect the transactions and dispositions of the assets of the company; (2) provide reasonable assurance that transactions are recorded as necessary to permit preparation of financial statements in accordance with generally accepted accounting principles, and that receipts and expenditures of the company are being made only in accordance with authorisations of management and directors of the company; and (3) provide reasonable assurance regarding prevention or timely detection of unauthorised acquisition, use, or disposition of the company’s assets that could have a material effect on the financial statements.
ANNEXURE 1 REFERRED TO IN PARAGRAPH (f) UNDER THE HEADING “REPORT ON OTHER LEGAL AND REGULATORY REQUIREMENTS” OF OUR REPORT OF EVEN DATE
72 2017-18201

Inherent Limitations of Internal Financial Controls Over Financial Reporting
Because of the inherent limitations of internal financial controls over financial reporting, including the possibility of collusion or improper management override of controls, material misstatements due to error or fraud may occur and not be detected. Also, projections of any evaluation of the internal financial controls over financial reporting to future periods are subject to the risk that the internal financial control over financial reporting may become inadequate because of changes in conditions, or that the degree of compliance with the policies or procedures may deteriorate.
Opinion
In our opinion, the Holding Company, its subsidiary companies and its joint ventures, which are companies incorporated in India, have, maintained in all material respects, an adequate internal financial controls system over financial reporting and such internal financial controls over financial reporting were operating effectively as at March 31, 2018, based on the internal control over financial reporting criteria established by the Holding Company considering the essential components of internal control stated in the Guidance Note on Audit of Internal Financial Controls Over Financial Reporting issued by the Institute of Chartered Accountants of India.
For S R B C & CO LLPChartered AccountantsICAI Firm Registration Number 324982E / E300003
per Sudhir SoniPartnerMembership No: 41870Place: MumbaiDate: April 24, 2018
2017-18 73202

CONSOLIDATED BALANCE SHEET
(` in Lakh)AS AT NOTE MARCH 31, 2018 MARCH 31, 2017
ASSETSI) Non-current assetsa) Property, plant and equipments 2 20,623.87 22,750.94 b) Capital work in progress 3 11,244.63 10,903.62 c) Investment properties 4 76,773.46 71,536.84 d) Intangible assets 5 236.97 206.92 e) Intangible assets under development 6 18.79 47.26 f) Financial assets
i) Investments 7 2,40,655.32 1,60,178.05 ii) Other financial assets 8 410.99 587.55
g) Deferred tax assets (net) 9.1 14,578.54 12,578.69 h) Other non-current assets 10 14,615.61 14,311.03
3,79,158.18 2,93,100.90 II) Current assetsa) Inventories 11 4,24,673.38 3,76,636.72 b) Financial assets
i) Investments 12 1,349.05 22,252.01 ii) Trade receivables 13 18,131.39 10,578.83 iii) Cash and cash equivalents 14 8,106.02 9,330.53 iv) Bank balances other than (iii) above 15 3,566.29 25,248.16 v) Loans 16 15,733.63 13,369.84 vi) Other financial assets 8 232.60 253.45
c) Current tax assets (net) 17 1,863.84 2,312.52 d) Other current assets 10 1,69,658.32 95,464.23
6,43,314.52 5,55,446.29 TOTAL ASSETS (I+II) 10,22,472.70 8,48,547.19
EQUITY AND LIABILITIES
I) Equitya) Equity share capital 18 33,960.23 33,953.55 b) Other equity 19 5,75,277.14 5,38,642.52
6,09,237.37 5,72,596.07 II) Liabilitiesi) Non-current liabilitiesa) Financial liabilities
i) Borrowings 20 67,864.18 74,937.77 ii) Trade payables 21 1,463.53 659.41 iii) Other financial liabilities 22 8,451.03 6,404.51
b) Provisions 23 165.97 170.77 c) Deferred tax liabilities (net) 9.2 3,705.16 2,604.63 d) Other non-current liabilities 24 1,445.75 756.14
83,095.62 85,533.23 ii) Current liabilitiesa) Financial liabilities
i) Borrowings 20 26,585.76 11,926.51 ii) Trade payables 21 13,079.89 4,686.88 iii) Other financial liabilities 22 96,555.60 15,594.96
b) Other current liabilities 24 1,93,494.19 1,57,480.03 c) Provisions 23 42.56 200.85 d) Current tax liabilities (net) 25 381.71 528.66
3,30,139.71 1,90,417.89 TOTAL LIABILITIES (i+ii) 4,13,235.33 2,75,951.12 TOTAL EQUITY AND LIABILITIES (I+II) 10,22,472.70 8,48,547.19
Significant accounting policiesThe accompanying notes form an integral part of the financial statements
1
As per our report of even date For and on behalf of the Board of Directors
For S R B C & CO LLPChartered AccountantsFirm Registration Number 324982E / E300003 Vikas Oberoi T. P. Ostwal
Chairman & Managing Director Directorper Sudhir Soni DIN 00011701 DIN 00821268PartnerMembership No.: 41870 Saumil Daru Bhaskar KshirsagarMumbai, April 24, 2018 Director - Finance cum Chief Financial Officer Company Secretary
DIN 03533268 M No. A19238
74 2017-18203

CONSOLIDATED STATEMENT OF PROFIT AND LOSS
(` in Lakh)FOR THE YEAR ENDED NOTE MARCH 31, 2018 MARCH 31, 2017
INCOMERevenue from operations 26 1,26,542.90 1,11,374.39 Other income 27 2,657.80 4,760.29 Total revenue (A) 1,29,200.70 1,16,134.68
EXPENSESOperating costs 28 95,034.64 85,971.38 Changes in inventories 29 (48,247.66) (43,098.18)Excise duty 30 3.16 12.36 Employee benefits expense 31 6,715.33 6,416.17 Finance cost 32 686.31 557.22 Depreciation and amortisation 33 4,906.76 4,949.54 Other expenses 34 5,511.57 5,096.50 Total expenses (B) 64,610.11 59,904.99
and exceptional items(A-B) 64,590.59 56,229.69
Share of Profit / (Loss) of joint ventures (net) 361.97 313.93 64,952.56 56,543.62
Tax expenseCurrent tax 17 21,976.10 18,677.95 Deferred tax 9 (3,019.39) 6.91 Short / (excess) provision of tax in earlier years 115.53 -
(C) 45,880.32 37,858.76
Other comprehensive income
subsequent periodRe - measurement gains / (losses) on defined benefit plans
172.56 30.95
Income tax effect (56.64) (10.78)Share of other comprehensive income in Joint VenturesRe - measurement gains / (losses) on defined benefit plans
4.22 3.35
Income tax effect (1.47) (1.04)Total other comprehensive income / (expenses) for the year net of tax
(D) 118.67 22.48
Total comprehensive income for the year
income for the year)*
(C+D) 45,998.99 37,881.24
Earnings per equity share (face value of `10) 35- Basic (in `) 13.51 11.15 - Diluted (in `) 13.51 11.15
*Entire attributable to owner of the parent.Significant accounting policiesThe accompanying notes form an integral part of the financial statements
1
As per our report of even date For and on behalf of the Board of Directors
For S R B C & CO LLPChartered AccountantsFirm Registration Number 324982E / E300003 Vikas Oberoi T. P. Ostwal
Chairman & Managing Director Directorper Sudhir Soni DIN 00011701 DIN 00821268PartnerMembership No.: 41870 Saumil Daru Bhaskar KshirsagarMumbai, April 24, 2018 Director - Finance cum Chief Financial Officer Company Secretary
DIN 03533268 M No. A19238
2017-18 75204

A.
Equ
ity
Sha
re C
ap
ita
l(`
in L
akh)
Pa
rtic
ula
rs
Note
Am
ou
nt
As a
t Apr
il 1,
201
618
33,
930.
39
Cha
nge
in e
quity
sha
re c
apita
l 2
3.16
As
at M
arch
31,
201
718
33,9
53.5
5
Cha
nge
in e
quity
sha
re c
apita
l 6
.68
As
at
Ma
rch
31, 2018
18
33,9
60.2
3
B.
Oth
er
Equ
ity
(` in
Lak
h)
Pa
rtic
ula
rsN
ote
Rese
rves
an
d S
urp
lus
Reta
ined
ea
rnin
gs
Secu
riti
es
pre
miu
m
acc
ou
nt
Gen
era
l re
serv
eC
ap
ita
l re
dem
pti
on
re
serv
e
Ca
pit
al
rese
rve
Ca
pit
al
rese
rve o
n
con
solid
ati
on
Tota
l
A.
Ba
lan
ce a
s a
t A
pri
l 1, 2016
19
2,9
3,4
02.7
2 1
,66,6
18.6
0
23,2
75.8
2
5,7
10.0
0
3,5
90.0
0
7,5
85.1
9
5,0
0,1
82.3
3C
ha
ng
es
du
rin
g t
he y
ea
rEx
erci
se o
f sto
ck o
ptio
ns -
5
78.9
5 -
-
-
-
5
78.9
5 Pr
ofit
for
the
year
37,
858.
76
-
-
-
-
-
37,
858.
76
Oth
er
com
pre
hen
sive
in
com
eRe
mea
sure
men
t of
the
net
def
ined
ben
efit
liabi
litie
s /
asse
t, ne
t of t
axes
22.
48
-
-
-
-
-
22.
48
B.
Tota
l ch
an
ges
du
rin
g t
he y
ea
r 3
7,8
81.2
4 5
78.9
5
-
-
-
-
38,4
60.1
9
(A+
B)
Ba
lan
ce a
s a
t M
arc
h 3
1, 2017
19
3,3
1,2
83.9
6
1,6
7,1
97.5
5
23,2
75.8
2
5,7
10.0
0
3,5
90.0
0
7,5
85.1
9
5,3
8,6
42.5
2
(` in
Lak
h)
Pa
rtic
ula
rsN
ote
Rese
rves
an
d S
urp
lus
Reta
ined
ea
rnin
gs
Secu
riti
es
pre
miu
m
acc
ou
nt
Gen
era
l re
serv
eC
ap
ita
l re
dem
pti
on
re
serv
e
Ca
pit
al
rese
rve
Ca
pit
al
rese
rve o
n
con
solid
ati
on
Tota
l
A.
Ba
lan
ce a
s a
t A
pri
l 1, 2017
19
3,3
1,2
83.9
6
1,6
7,1
97.5
5
23,2
75.8
2
5,7
10.0
0
3,5
90.0
0
7,5
85.1
9
5,3
8,6
42.5
2
Ch
an
ges
du
rin
g t
he y
ea
rEx
erci
se o
f sto
ck o
ptio
ns -
1
67.0
3 -
-
-
-
1
67.0
3 D
ivid
ends
(inc
ludi
ng d
ivid
end
dist
ribut
ion
tax)
(8,1
74.7
5) -
-
-
-
-
(8
,174
.75)
Def
erre
d ta
x lia
bilit
ies
- ta
x on
und
istri
bute
d pr
ofits
(1,3
56.6
5)-
--
--
(1,3
56.6
5)Pr
ofit
for
the
year
45,
880.
32
--
--
- 4
5,88
0.32
O
ther
com
pre
hen
sive
in
com
eRe
mea
sure
men
t of t
he n
et d
efin
ed b
enef
it lia
bilit
ies
/ as
set,
net o
f tax
es 1
18.6
7 -
-
-
-
-
1
18.6
7
B.
Tota
l ch
an
ges
du
rin
g t
he y
ea
r 3
6,4
67.5
9
167.0
3
-
-
-
-
36,6
34.6
2
(A+
B)
Ba
lan
ce a
s a
t M
arc
h 3
1, 2018
19
3,6
7,7
51.5
5
1,6
7,3
64.5
8
23,2
75.8
2
5,7
10.0
0
3,5
90.0
0
7,5
85.1
9
5,7
5,2
77.1
4
CO
NSO
LID
ATE
D S
TATE
MEN
T O
F C
HA
NG
ES I
N E
QU
ITY
FOR
TH
E YE
AR
EN
DED
As p
er o
ur r
epor
t of e
ven
date
For
and
on b
ehal
f of t
he B
oard
of D
irect
ors
For
S R
B C
& C
O L
LPC
harte
red
Acco
unta
nts
Firm
Reg
istra
tion
Num
ber
3249
82E
/ E3
0000
3V
ika
s O
bero
iT.
P. O
stw
al
Cha
irman
& M
anag
ing
Dire
ctor
Dire
ctor
per
Sud
hir
Son
i D
IN 0
0011
701
DIN
008
2126
8Pa
rtner
Mem
bers
hip
No.
: 418
70Sa
um
il D
aru
Bh
ask
ar
Ksh
irsa
ga
rM
umba
i, Ap
ril 2
4, 2
018
Dire
ctor
- F
inan
ce c
um C
hief
Fin
anci
al O
ffice
rC
ompa
ny S
ecre
tary
DIN
035
3326
8M
No.
A19
238
76 2017-18205

CONSOLIDATED CASH FLOW STATEMENT
(` in Lakh)FOR THE YEAR ENDED MARCH 31, 2018 MARCH 31, 2017
CASH FLOW FROM OPERATING ACTIVITIES: 64,590.59 56,229.69
Depreciation and amortisation 4,906.76 4,949.54 Interest income (including fair value change in financial instruments) (1,978.37) (3,741.85)Interest expenses (including fair value change in financial instruments) 686.31 557.22 Re - measurement gains / (losses) on defined benefit plans 175.31 33.26 Dividend income (137.39) (163.73)Profit on sale of investments (net) (241.19) (817.85)Gain from foreign exchange fluctuation (net) (1.95) (8.21)Loss on sale / discarding of investment properties (net) 116.50 117.05 (Gain) / loss on sale / discarding of property, plant and equipments (net) 0.90 (2.42)Loss on sale / discarding of intangible assets (net) 2.11 - Share of profit of joint ventures 361.97 313.93 Sundry balances written back (270.99) (30.51)
68,210.56 57,436.12
Movement for working capitalIncrease / (decrease) in trade payables 9,470.08 1,096.78 Increase / (decrease) in other liabilities 36,703.77 16,403.92 Increase / (decrease) in financial liabilities 6,772.97 927.22 Increase / (decrease) in provisions (163.10) (55.71)(Increase) / decrease in loans and advances (75,234.40) (4,631.09)(Increase) / decrease in financial assets 20.85 (50.42)(Increase) / decrease in trade receivables (7,552.56) 645.67 (Increase) / decrease in inventories (37,727.85) (36,139.15)Cash generated from operations 500.32 35,633.34 Direct taxes (paid) / refund (net) (21,083.12) (18,250.41)
(A) (20,582.80) 17,382.93
CASH FLOW FROM INVESTING ACTIVITIES:(Acquisition) / (adjustments) / sale of property, plant and equipments, investment properties, intangible assets / addition to capital work in progress (net)
(7,725.99) (7,625.20)
Interest received 627.48 2,293.09 Dividend received 137.39 163.73 Decrease / (increase) in loans and advances to / for joint ventures (net) (1,407.87) (5,633.21)Decrease / (increase) in investment in joint ventures (72,556.16) (30,137.55)(Acquisition) / sale of investments (net) 241.19 817.85 (Increase) / decrease in other assets 21,858.95 (15,788.62)
(B) (58,825.01) (55,909.91)
CASH FLOW FROM FINANCING ACTIVITIES:Increase in equity share capital (including share premium) 173.71 602.11 Repayment of short term unsecured borrowings - (1,800.00)Proceeds from short term secured loan (net) 14,561.00 - Proceeds from long term secured loan 68,500.00 - Proceeds from issue of short term secured debentures - 75,000.00 Prepayment of short term secured debentures - (35,000.00)Interest paid (gross) (9,959.97) (5,274.44)Dividend paid (including dividend distribution tax) (8,174.75) -
(C) 65,099.99 33,527.67
Net increase / (decrease) in cash and cash equivalents (A+B+C) (14,307.82) (4,999.31)Add: cash and cash equivalents at the beginning of the year 23,583.89 28,583.20 Cash and cash equivalents at the end of the year 9,276.07 23,583.89
2017-18 77206

CONSOLIDATED CASH FLOW STATEMENT (CONTD.)
(` in Lakh)
FOR THE YEAR ENDED MARCH 31, 2018 MARCH 31, 2017
COMPONENTS OF CASH AND CASH EQUIVALENTS AS ATCash on hand 44.59 39.86Balance with banks 2,158.48 3,659.44Cheques on hand 155.79 -Fixed deposits with banks, having original maturity of three months or less 5,747.16 5,631.23Add: Short term liquid investment 1,170.05 14,253.31Cash and cash equivalents at the end of the year 9,276.07 23,583.89
RECONCILIATION STATEMENT OF CASH AND BANK BALANCES(` in Lakh)
AS AT MARCH 31, 2018 MARCH 31, 2017
Cash and cash equivalents at the end of the year as per above 9,276.07 23,583.89 Add: Balance with banks in dividend / unclaimed dividend accounts 2.64 2.13 Add: Fixed deposits with banks, having remaining maturity for less than twelve months
2,886.93 19,558.49
Add: Fixed deposits with banks (lien marked) 1,087.71 6,275.09 Less: Short term liquid investment (out of the same investment of ` 4.96 lakh (` 3,446.77 lakh) is lien marked (refer note 12)
(1,170.05) (14,253.36)
Fixed deposits with banks, having remaining maturity for more than twelve months (410.99) (587.55)Cash and bank balance as per balance sheet (refer note 14 & 15) 11,672.31 34,578.69
DISCLOSURE AS REQUIRED BY IND AS 7
(` in Lakh)
March 31, 2018 Opening balance
Non cash changes
Closing balance
Short term secured borrowings 77,956.28 11,509.02 3,168.75 92,634.05 Long term secured borrowings - 67,814.67 49.51 67,864.18 Short term unsecured borrowings 8,908.00 - - 8,908.00
86,864.28 79,323.69 3,218.26 1,69,406.23
(` in Lakh)
March 31, 2017 Opening balance
Non cash changes
Closing balance
Short term unsecured borrowings 10,708.00 (1,800.00) - 8,908.00 Long term secured borrowings 35,000.00 40,000.00 2,956.28 77,956.28
45,708.00 38,200.00 2,956.28 86,864.28
Significant accounting policies (refer note 1)The accompanying notes form an integral part of the financial statements
As per our report of even date For and on behalf of the Board of Directors
For S R B C & CO LLPChartered AccountantsFirm Registration Number 324982E / E300003 Vikas Oberoi T. P. Ostwal
Chairman & Managing Director Directorper Sudhir Soni DIN 00011701 DIN 00821268PartnerMembership No.: 41870 Saumil Daru Bhaskar KshirsagarMumbai, April 24, 2018 Director - Finance cum Chief Financial Officer Company Secretary
DIN 03533268 M No. A19238
78 2017-18207

1. NATURE OF OPERATIONS
Oberoi Realty Limited (the ‘Company’ or ‘ORL’), a public limited company is incorporated in India under provisions of the Companies Act applicable in India. The consolidated financial statement comprises financial statements of the Company together with its subsidiaries and joint arrangements (collectively referred to as the ‘Group’) for the year ended March 31, 2018. The Group is engaged primarily in the business of real estate development and hospitality.
The Company is headquartered in Mumbai, India. The shares of the Company are listed on the BSE Limited and National Stock Exchange of India Limited. Its registered office is situated at Commerz, 3rd Floor, International Business Park, Oberoi Garden City, Off Western Express Highway, Goregaon (East), Mumbai- 400 063.
The consolidated financial statements for the year ended March 31, 2018 were authorised and approved for issue by the Board of Directors on April 24, 2018.
2. SIGNIFICANT ACCOUNTING POLICIES
2.1 Basis of preparation
The consolidated financial statements of the Group have been prepared in accordance with the Indian Accounting Standards (Ind AS) as notified under section 133 of the Companies Act read with the Companies (Indian Accounting Standards) Rules 2015 (as amended).
The consolidated financial statements have been prepared on a historical cost basis, except for certain financial instruments which are measured at fair values at the end of each reporting period, as explained in the accounting policies below.
The consolidated financial statements are presented in Indian Rupee (“INR”) and all values are rounded to the nearest INR Lakh, except when otherwise indicated.
2.2 Basis of consolidation
The consolidated financial statements comprise of financial statements of the Company and its subsidiaries and joint arrangements for which the Company fulfils the criteria pursuant to Ind AS 110 and joint arrangements within the scope of Ind AS 111.
2.2.1 Subsidiaries
Subsidiaries are entities controlled by the Company. Control exists if and only if all of the following conditions are satisfied –
(a) Power over the investee (i.e. existing rights that give it the current ability to direct the relevant activities of the investee);
(b) Exposure, or rights to variable returns from its involvement with the investee; and
(c) The ability to use its power over the investee to affect the amount of the investors’ returns
Subsidiaries are consolidated from the date control commences until the date control ceases.
The financial statements of the subsidiaries are consolidated on a line-by-line basis and intra-group balances and transactions including unrealised gain / loss from such transactions are eliminated upon consolidation. The consolidated financial statements are prepared using uniform accounting policies for like transactions and other events in similar circumstances.
All the subsidiaries are wholly owned subsidiaries and therefore there is no non-controlling interest.
NOTES FORMING PART OF CONSOLIDATED FINANCIAL STATEMENTS
2017-18 79208

Details of subsidiaries considered in the CFS are as under:
Name of the Company Country of incorporation
% of ownership as on
March 31, 2018
Principal Activities
Oberoi Constructions Limited India 100% Real EstateOberoi Mall Limited India 100% Real EstateExpressions Realty Private Limited India 100% Real EstateIncline Realty Private Limited India 100% Real EstateIntegrus Realty Private Limited India 100% Real EstateSight Realty Private Limited India 100% Real EstateKingston Hospitality and Developers Private Limited
India 100% Real Estate
Kingston Property Services Limited* India 100% PMS*Buoyant Realty LLP India 100% Real EstateAstir Realty LLP India 100% Real EstatePerspective Realty Private Limited India 100% Real EstatePursuit Realty LLP India 100% Real Estate* Property Management Services
2.2.2 Joint arrangements
(i) Joint ventures
A joint venture is a type of joint arrangement whereby the parties have joint control of the arrangement and have rights to the net assets of the arrangement. Joint Control is the contractually agreed sharing of control of an arrangement, which exists only when decisions about the relevant activities require unanimous consent of the parties sharing control.
The Group’s investments in joint venture are accounted for using the equity method. Under the equity method, the investment in a joint venture is initially recognised at cost. The carrying amount of the investment is adjusted to recognise changes in the Group’s share of net assets of joint venture since the acquisition date. Goodwill relating to the joint venture is included in the carrying amount of the investment and is not tested for impairment individually.
Unrealised gains and losses resulting from transactions between the Group and the joint venture are eliminated to the extent of the interest in the joint venture.
The financial statements of joint ventures are prepared for the same reporting period as the Group. Where necessary, adjustments are made to bring the accounting policies in line with those of the Group.
For details of joint venture considered in the consolidated financial statements as at March 31, 2018 please refer note 37.
(ii) Joint operation
A joint operation is a joint arrangement whereby the parties that have joint control of the arrangement have rights to the assets and obligations for the liabilities, relating to the arrangement. Those parties are called joint operators.
For details of joint operation considered in the consolidated financial statements as at March 31, 2018, please refer note 37.
All subsidiaries and joint arrangements have a reporting date of March 31.
NOTES FORMING PART OF CONSOLIDATED FINANCIAL STATEMENTS
80 2017-18209

NOTES FORMING PART OF CONSOLIDATED FINANCIAL STATEMENTS
2.2.3 Business combinations and goodwill
Business combinations are accounted for using the acquisition method.
The cost of an acquisition is measured as the aggregate of the consideration transferred, measured at acquisition date fair value and the amount of any non-controlling interests in the acquiree. For each business combination, the Group elects whether to measure the non- controlling interests in the acquiree at fair value or at the proportionate share of the acquiree’s identifiable net assets. Acquisition related costs are recognised in the Statement of Profit and Loss as incurred.
At the acquisition date, the identifiable assets acquired and the liabilities assumed are recognised at their acquisition date fair values. For this purpose, the liabilities assumed include contingent liabilities representing present obligation and they are measured at their acquisition date fair values irrespective of the fact that outflow of resources embodying economic benefits is not probable.
When the Group acquires a business, it assesses the financial assets and liabilities assumed for appropriate classification and designation in accordance with the contractual terms, economic circumstances, operating or accounting policies and pertinent conditions as at the acquisition date.
Goodwill is initially measured at cost. Following initial recognition, goodwill is measured at cost less any accumulated impairment losses. Any impairment loss for goodwill is recognised in the Statement of Profit and Loss. An impairment loss recognised for goodwill is not reversed in subsequent periods.
The Group as required by Ind AS 1 presents assets and liabilities in the Balance Sheet based on current / non-current classification.
Deferred tax assets and liabilities are classified as non-current assets and liabilities.
The Group’s normal operating cycle in respect of operations relating to the construction of real estate projects may vary from project to project depending upon the size of the project, type of development, project complexities and related approvals. Operating cycle for all completed projects and hospitality business is based on 12 months period. Assets and liabilities have been classified into current and non-current based on their respective operating cycle.
2.4 Foreign currencies
Initial recognition
Foreign currency transactions are recorded in the functional currency (Indian Rupee) by applying to the foreign currency amount, the exchange rate between the functional currency and the foreign currency on the date of the transaction.
Conversion
All monetary items outstanding at year end denominated in foreign currency are converted into Indian Rupees at the reporting date exchange rate. Non-monetary items, which are measured in terms of historical cost denominated in a foreign currency, are reported using the exchange rate at the date of the transaction and non-monetary items which are carried at fair value or other similar valuation denominated in a foreign currency are reported using the exchange rates that existed when the values were determined.
Exchange differences
The exchange differences arising on such conversion and on settlement of the transactions are recognised in the Statement of Profit and Loss.
2017-18 81210

2.5 Property, plant and equipments (PPE)
Recognition and initial measurement
Property, plant and equipments are stated at cost less accumulated depreciation / amortisation and impairment losses, if any.
Cost comprises the purchase price and any attributable / allocable cost of bringing the asset to its working condition for its intended use. The cost also includes direct cost and other related incidental expenses. Revenue earned, if any, during trial run of assets is adjusted against cost of the assets. Cost also includes the cost of replacing part of the plant and equipments.
Borrowing costs relating to acquisition / construction / development of tangible assets, which takes substantial period of time to get ready for its intended use are also included to the extent they relate to the period till such assets are ready to be put to use.
When significant components of property and equipments are required to be replaced at intervals, recognition is made for such replacement of components as individual assets with specific useful life and depreciation, if these components are initially recognised as separate asset. All other repair and maintenance costs are recognised in the Statement of Profit and Loss as incurred.
Subsequent measurement (depreciation and useful lives)
Depreciation is provided from the date the assets are put to use, on straight line basis as per the useful life of the assets as prescribed under Part C of Schedule II of the Companies Act, 2013.
Building 60 yearsBuilding -Temporary structures 3 yearsPlant and machinery 15 yearsFurniture and fixtures 8 years / 10 yearsElectrical installations and equipments 10 yearsOffice equipments* 5 yearsComputers 3 yearsVehicles 8 yearsAircraft 20 years
*Mobile handsets - 3 years
Depreciation method, useful life and residual value are reviewed periodically.
Leasehold land and improvements are amortised on the basis of duration and other terms of lease.
Assets individually costing less than or equal to ` 0.05 lakh are fully depreciated in the year of purchase except under special circumstances.
The carrying amount of PPE is reviewed periodically for impairment based on internal / external factors. An impairment loss is recognised wherever the carrying amount of assets exceeds its recoverable amount. The recoverable amount is the greater of the asset’s net selling price and value in use.
De-recognition
PPE are derecognised either when they have been disposed of or when they are permanently withdrawn from use and no future economic benefit is expected from their disposal. The difference between the net disposal proceeds and the carrying amount of the asset is recognised in the Statement of Profit and Loss in the period of de-recognition.
NOTES FORMING PART OF CONSOLIDATED FINANCIAL STATEMENTS
82 2017-18211

2.6 Intangible assets
Recognition and initial measurement
Intangible assets are stated at cost less accumulated amortisation and impairment losses, if any. Cost comprises the acquisition price, development cost and any attributable / allocable incidental cost of bringing the asset to its working condition for its intended use.
Subsequent measurement (amortisation)
All intangible assets with definite useful life are amortised on a straight line basis over the estimated useful lives.
Computer Software 5 years
The carrying amount of intangible asset is reviewed periodically for impairment based on internal / external factors. An impairment loss is recognised wherever the carrying amount of an asset exceeds its recoverable amount. The recoverable amount is the greater of the asset’s net selling price and value in use.
2.7 Investment properties
Recognition and initial measurement
Investment properties are properties held to earn rentals or for capital appreciation, or both. Investment properties are measured initially at cost, including transaction costs. The cost comprises purchase price, borrowing cost if capitalization criteria are met and directly attributable cost of bringing the asset to its working condition for the intended use.
Subsequent measurement (depreciation and useful lives)
Subsequent costs are included in the asset’s carrying amount or recognised as a separate asset, as appropriate, only when it is probable that future economic benefits associated with the item will flow to the Group.
Though the Group measures investment property using cost based measurement, the fair value of investment property is disclosed in the notes. Fair values are determined based on an annual evaluation performed by an accredited external independent valuer who holds a recognised and relevant professional qualification and has experience in the category of the investment property being valued.
Investment properties are stated at cost less accumulated depreciation and accumulated impairment loss, if any, subsequently. Depreciation is provided from the date the assets are put to use, on straight line method as per the useful life of the assets as prescribed under Part C of Schedule II of the Companies Act, 2013
Building 60 yearsBuilding - Temporary structures 3 yearsPlant and machinery 15 yearsFurniture and fixtures 8 years / 10 yearsElectrical installations and equipments 10 yearsOffice equipments* 5 yearsComputers 3 yearsLessee specific assets and improvements Over lease period or useful life as
prescribed in Schedule II, whichever is lower
*Mobile handsets - 3 years
For above classes of assets, based on internal assessment, the management believes that the useful lives as given above best represent the period over which management expects to use these assets.
Assets individually costing less than or equal to ` 0.05 Lakh are fully depreciated in the year of purchase except under special circumstances.
Leasehold land and improvements are amortised on the basis of duration and other terms of lease.
The carrying amount of investment property is reviewed periodically for impairment based on internal / external factors. An impairment loss is recognised wherever the carrying amount of assets exceeds its recoverable amount. The recoverable amount is the greater of the asset’s net selling price and value in use.
NOTES FORMING PART OF CONSOLIDATED FINANCIAL STATEMENTS
2017-18 83212

When significant components of investment properties are required to be replaced at intervals, recognition is made for such replacement of components as individual assets with specific useful life and depreciation, if these components are initially recognised as separate asset. All other repair and maintenance costs are recognised in the Statement of Profit and Loss as incurred.
De-recognition
Investment properties are derecognised either when they have been disposed of or when they are permanently withdrawn from use and no future economic benefit is expected from their disposal. The difference between the net disposal proceeds and the carrying amount of the asset is recognised in the Statement of Profit and Loss in the period of de-recognition.
2.8 Capital work in progress
Capital work in progress is stated at cost less impairment losses, if any. Cost comprises of expenditures incurred in respect of capital projects under development and includes any attributable / allocable cost and other incidental expenses. Revenues earned, if any, from such capital project before capitalisation are adjusted against the capital work in progress.
2.9 Revenue recognition
Revenue is recognised to the extent that it is probable that the economic benefits will flow to the Group and the revenue can be reliably measured, regardless of when the payment is being made. Revenue is measured at the fair value of the consideration received or receivable, taking into account contractually defined terms of payment and excluding taxes or duty. The Group assesses its revenue arrangements against specific criteria in order to determine if it is acting as principal or agent. The Group concluded that it is acting as a principal in all of its revenue arrangements. The specific recognition criteria described below must also be met before revenue is recognised.
Revenue is recognised as follows:
The Group follows the percentage of project completion method for its projects.
Revenue is recognised in accordance with the Guidance Note on “Accounting for Real Estate Transactions (for entities to whom Ind AS is applicable)” issued by the Institute of Chartered Accountants of India (“ICAI”). The Group recognises revenue in proportion to the actual project cost incurred (including land cost) as against the total estimated project cost (including land cost), subject to achieving the threshold level of project cost (excluding land cost) as well as area sold and depending on the type of project. Revenue is recognised net of indirect taxes and on execution of either an agreement or a letter of allotment.
The estimates relating to percentage of completion, costs to completion, area available for sale etc. being of a technical nature are reviewed and revised periodically by the management and are considered as change in estimates and accordingly, the effect of such changes in estimates is recognised prospectively in the period in which such changes are determined. Land cost includes the cost of land, land related development rights and premium.
2.9.2 Revenue from hospitality
Revenue comprises sale of rooms, food and beverages and allied services relating to hotel operations. Revenue is recognised upon rendering of the service, provided pervasive evidence of an arrangement exists, tariff / rates are fixed or are determinable and collectability is reasonably certain. Revenue from sales of goods or rendering of services is net of indirect taxes, returns and discounts.
NOTES FORMING PART OF CONSOLIDATED FINANCIAL STATEMENTS
84 2017-18213

2.9.3 Revenue from lease rentals and related income
Lease income is recognised in the Statement of Profit and Loss on straight line basis over the lease term, unless there is another systematic basis which is more representative of the time pattern of the lease. Revenue from lease rentals is disclosed net of indirect taxes, if any.
Revenue from property management service is recognised at value of service and is disclosed net of indirect taxes, if any.
2.9.4 Finance income
Finance income is recognised as it accrues using the Effective Interest Rate (EIR) method. Finance income is included in other income in the Statement of Profit and Loss.
2.9.5 Dividend income
Revenue is recognised when the Group’s right to receive the payment is established, which is generally when shareholders approve the dividend.
2.9.6 Other income
Other incomes are accounted on accrual basis, except interest on delayed payment by debtors and liquidated damages which are accounted on acceptance of the Group’s claim.
2.10 Leases
The determination of whether an arrangement is (or contains) a lease is based on the substance of the arrangement at the inception of the lease. The arrangement is, or contains, a lease if fulfilment of the arrangement is dependent on the use of a specific asset or assets and the arrangement conveys a right to use the asset or assets, even if that right is not explicitly specified in an arrangement.
2.10.1 Where the group entity is the lessee
Lease arrangements where the risks and rewards incidental to ownership of an asset substantially vest with the lessor are recognised as operating lease. Operating lease payments are recognised as an expense in the Statement of Profit and Loss on straight line basis over the lease term, unless there is another systematic basis which is more representative of the time pattern of the lease.
Lease deposits given are a financial asset and are measured at amortised cost under Ind AS 109 since it satisfies Solely Payment of Principal and Interest (SPPI) condition. The difference between the present value and the nominal value of deposit is considered as prepaid rent and recognised over the lease term. Unwinding of discount is treated as finance income and recognised in the Statement of Profit and Loss.
2.10.2 Where the group entity is the lessor
Assets given under operating leases are included in investment properties. Lease income is recognised in the Statement of Profit and Loss on straight line basis over the lease term, unless there is another systematic basis which is more representative of the time pattern of the lease.
Initial direct costs incurred in negotiating and arranging an operating lease are added to the carrying amount of the leased asset and recognised over the lease term on the same basis as rental income.
Lease deposits received are financial instruments (financial liability) and need to be measured at fair value on initial recognition. The difference between the fair value and the nominal value of deposits is considered as rent in advance and recognised over the lease term on a straight line basis. Unwinding of discount is treated as interest expense (finance cost) for deposits received and is accrued as per the EIR method.
NOTES FORMING PART OF CONSOLIDATED FINANCIAL STATEMENTS
2017-18 85214

2.11 Financial instruments
A financial instrument is any contract that gives rise to a financial asset of one entity and a financial liability or equity instrument of another entity.
EIR is the rate that exactly discounts the estimated future cash receipts or payments over the expected life of the financial instruments or a shorter period, where appropriate, to the net carrying amount of the financial asset or liability.
2.11.1 Financial assets
Initial measurement
Financial assets are recognised when the Group becomes a party to the contractual provisions of the instrument. Financial assets are initially measured at fair value. Transaction costs that are directly attributable to the acquisition or issue of financial assets (other than financial assets at fair value through profit or loss) are added to or deducted from the fair value measured on initial recognition of financial asset.
Subsequent measurement
(i) Financial assets at amortised cost
Financial assets are measured at the amortised cost, if both of the following criteria are met:
a. These assets are held within a business model whose objective is to hold assets for collecting contractual cash flows; and
b. Contractual terms of the asset give rise on specified dates to cash flows that are SPPI on the principal amount outstanding.
After initial measurement, such financial assets are subsequently measured at amortised cost using the EIR method. The EIR amortisation is included in other income in the Statement of Profit and Loss. The losses arising from impairment are recognised in the Statement of Profit and Loss.
(ii) Financial assets at fair value through other comprehensive income (FVTOCI)
Financial assets are classified as FVTOCI if both of the following criteria are met:
a. These assets are held within a business model whose objective is achieved both by collecting contractual cash flows and selling the financial assets; and
b. Contractual terms of the asset give rise on specified dates to cash flows that are SPPI on the principal amount outstanding.
Fair value movements are recognised in the Other Comprehensive Income (OCI). On de-recognition of the asset, cumulative gain or loss previously recognised in OCI is reclassified from the equity to the Statement of Profit and Loss.
Any financial assets, which does not meet the criteria for categorisation as at amortised cost or as FVTOCI, are classified as at FVTPL. Gain or losses are recognised in the Statement of Profit and Loss.
(iv) Equity instruments
Equity instruments which are held for trading and contingent consideration recognised by an acquirer in a business combination are classified as FVTPL, and measured at fair value with all changes recognised in the Statement of Profit and Loss.
NOTES FORMING PART OF CONSOLIDATED FINANCIAL STATEMENTS
86 2017-18215
De-recognition
The Group derecognises a financial asset when the contractual rights to the cash flows from the financial asset expire or it transfers the financial asset and the transfer qualifies for de-recognition.
When the Group has transferred its rights to receive cash flows from an asset or has entered into a pass-through arrangement, it evaluates if and to what extent it has retained the risks and rewards of ownership. When it has neither transferred nor retained substantially all of the risks and rewards of the asset, nor transferred control of the asset, the Group continues to recognise the transferred asset to the extent of the Group’s continuing involvement. In that case, the Group also recognises an associated liability. The transferred asset and the associated liability are measured on a basis that reflects the rights and obligations that the Group has retained.
The Group follows ‘simplified approach’ for recognition of impairment loss allowance on:
a. Trade receivables; and
b. All lease receivables resulting from transactions within the scope of Ind AS 17.
The application of simplified approach does not require the Group to track changes in credit risk. Rather, it recognises impairment loss allowance based on lifetime Expected Credit Loss (ECL) at each reporting date, right from its initial recognition.
For recognition of impairment loss on other financial assets and risk exposure, the Group determines whether there has been a significant increase in the credit risk since initial recognition. If credit risk has not increased significantly, 12-month ECL is used to provide for impairment loss. However, if credit risk has increased significantly, lifetime ECL is used. If, in a subsequent period, credit quality of the instrument improves such that there is no longer a significant increase in credit risk since initial recognition, then the Group reverts to recognising impairment loss allowance based on 12-month ECL.
Lifetime ECL are the expected credit losses resulting from all possible default events over the expected life of a financial instrument. The 12-month ECL is a portion of the lifetime ECL which results from default events that are possible within 12 months after the reporting date.
ECL is the difference between all contractual cash flows that are due to the Group in accordance with the contract and all the cash flows that the entity expects to receive (i.e. all cash shortfalls), discounted at the original EIR.
2.11.2 Financial liabilities
Initial measurement
Financial liabilities are classified, at initial recognition, as financial liabilities at fair value through profit or loss, loans and borrowings, payables, or as derivatives designated as hedging instruments in an effective hedge, as appropriate.
All financial liabilities are recognised initially at fair value and, in the case of loans and borrowings and payables, net of directly attributable transaction costs.
The Group’s financial liabilities include trade and other payables, loans and borrowings and financial guarantee contracts.
Loans and borrowings
After initial recognition, interest-bearing loans and borrowings are subsequently measured at amortised cost using the EIR method. Gains and losses are recognised in profit or loss when the liabilities are derecognised as well as through the EIR amortisation process.
NOTES FORMING PART OF CONSOLIDATED FINANCIAL STATEMENTS
2017-18 87216

Amortised cost is calculated by taking into account any discount or premium on acquisition and fees or costs that are an integral part of the EIR. The EIR amortisation is included as finance costs in the Statement of Profit and Loss.
Intercompany loans not repayable on demand are discounted to its present value using incremental borrowing rate applicable to the borrower entity. The difference between the carrying value of the loan and its present value is accounted based on the relationship with the borrower for e.g. in case of subsidiary, the difference is shown as further equity infusion in the subsidiary. The unwinding of discount from the date of loan to the transition date is shown as an income and recognised in “Retained Earnings” of the Lender.
Financial guarantee contracts
Financial guarantee contracts issued by the Group are those contracts that require a payment to be made to reimburse the holder for a loss it incurs because the specified debtor fails to make a payment when due in accordance with the terms of a debt instrument. Financial guarantee contracts are recognised initially as a liability at fair value. Subsequently, the liability is measured at the higher of the amount of loss allowance determined as per impairment requirements of Ind AS 109 and the amount recognised less cumulative amortisation.
De-recognition
A financial liability (or a part of a financial liability) is derecognised from the Group’s Balance Sheet when the obligation specified in the contract is discharged or cancelled or expires. When an existing financial liability is replaced by another from the same lender on substantially different terms, or the terms of an existing liability are substantially modified, such an exchange or modification is treated as the derecognition of the original liability and the recognition of a new liability. The difference in the respective carrying amounts is recognised in the Statement of Profit or Loss.
Financial assets and financial liabilities are offset and the net amount is reported in the Balance Sheet if there is a currently enforceable legal right to offset the recognised amounts and there is an intention to settle on a net basis, to realise the assets and settle the liabilities simultaneously.
2.11.3 Fair value measurement
Fair value is the price that would be received to sell an asset or paid to transfer a liability in an orderly transaction between market participants at the measurement date. The fair value measurement is based on the presumption that the transaction to sell the asset or transfer the liability takes place either:
The fair value of an asset or a liability is measured using the assumptions that market participants would use when pricing the asset or liability, assuming that market participants act in their economic best interest.
A fair value measurement of a non-financial asset takes into account a market participant’s ability to generate economic benefits by using the asset in its highest and best use or by selling it to another market participant that would use the asset in its highest and best use.
The Group uses valuation techniques that are appropriate in the circumstances and for which sufficient data are available to measure fair value, maximising the use of relevant observable inputs:
value measurement is directly or indirectly observable
value measurement is unobservable
NOTES FORMING PART OF CONSOLIDATED FINANCIAL STATEMENTS
88 2017-18217

For assets and liabilities that are recognised in the financial statements on a recurring basis, the Group determines whether transfers have occurred between levels in the hierarchy by re-assessing categorisation (based on the lowest level input that is significant to the fair value measurement as a whole) at the end of each reporting period.
For the purpose of fair value disclosures, the Group has determined classes of assets and liabilities on the basis of the nature, characteristics and risks of the asset or liability and the level of the fair value hierarchy as explained above.
2.12 Cash and cash equivalents
Cash and cash equivalent in the Balance Sheet comprise cash at banks and on hand, demand deposit and short-term deposits, which are subject to an insignificant risk of changes in value.
For the purpose of the consolidated statement of cash flows, cash and cash equivalents consist of cash and short-term deposits, as defined above.
The amendments to Ind AS 7 require entities to provide disclosure of changes in their liabilities arising from financing activities, including both changes arising from cash flows and non-cash changes (such as foreign exchange gains or losses). The Company has provided the information for both the current and the comparative period in Cash Flow Statement.
2.13 Income taxes
2.13.1 Current income tax
Current income tax are measured at the amount expected to be paid to the taxation authorities using the tax rates and tax laws that are in force at the reporting date.
Current income tax relating to items recognised outside the Statement of Profit and Loss is recognised outside the Statement of Profit and Loss (either in other comprehensive income or in equity). Current tax items are recognised in correlation to the underlying transaction either in OCI or directly in equity.
The Group offsets current tax assets and current tax liabilities where it has a legally enforceable right to set off the recognised amounts and where it intends either to settle on a net basis, or to realize the assets and settle the liability simultaneously.
Management periodically evaluates positions taken in the tax returns with respect to situations in which applicable tax regulations are subject to interpretation and establishes provisions where appropriate.
2.13.2 Deferred tax
Deferred tax is provided using the liability method on temporary differences between the tax bases of assets and liabilities and their carrying amounts for financial reporting purposes at the reporting date.
Deferred tax liabilities are recognised for all taxable temporary differences, except:
(i) When the deferred tax liability arises from the initial recognition of goodwill or an asset or liability in a transaction that is not a business combination and, at the time of the transaction, affects neither the accounting profit nor taxable profit or loss.
(ii) In respect of taxable temporary differences associated with investments in subsidiaries, associates and interests in joint ventures, when the timing of the reversal of the temporary differences can be controlled and it is probable that the temporary differences will not reverse in the foreseeable future.
Deferred tax assets are recognised to the extent that it is probable that taxable profit will be available against which the deductible temporary differences and the carry forward of unused tax credits and unused tax losses can be utilised.
The carrying amount of deferred tax assets is reviewed at each reporting date and reduced to the extent that it is no longer probable that sufficient taxable profit will be available to allow all or part of the deferred tax asset to be utilised.
NOTES FORMING PART OF CONSOLIDATED FINANCIAL STATEMENTS
2017-18 89218

Deferred taxes are provided on the undistributed earnings of subsidiaries where it is expected that the earnings of the subsidiary will be distributed in the foreseeable future.
Deferred tax assets and liabilities are offset when they relate to income taxes levied by the same taxation authority and the relevant entity intends to settle its current tax assets and liabilities on a net basis.
Deferred tax relating to items recognised outside the Statement of Profit and Loss is recognised outside the Statement of Profit and Loss. Such deferred tax items are recognised in correlation to the underlying transaction either in other comprehensive income or directly in equity.
Deferred tax assets and liabilities are measured using substantively enacted tax rates expected to apply to taxable income in the years in which the temporary differences are expected to be received or settled.
Minimum Alternate Tax (‘MAT’) credit is recognised as deferred asset only when and to the extent there is convincing evidence that the entity will pay normal income tax during the specified period. In the year in which the Group recognises MAT credit as an asset in accordance with Ind AS 12, the said asset is created by way of credit to the Statement of Profit and Loss and shown as “Deferred Tax”. The Group reviews the “MAT Credit” asset at each reporting date and reduces to the extent that it is no longer probable that sufficient taxable profit will be available to allow all or part of the MAT to be utilised.
The carrying amounts of assets are reviewed at each reporting date if there is any indication of impairment based on internal / external factors. An impairment loss is recognised wherever the carrying amount of an asset exceeds its recoverable amount. The recoverable amount is the greater of the asset’s fair value less cost of disposals and value in use. In assessing value in use, the estimated future cash flows are discounted to their present value using a pre-tax discount rate that reflects current market assessments of the time value of money and the risks specific to the asset. Fair value is the price that would be received to sell an asset or paid to transfer a liability in orderly transaction between market participants at the measurement date. After impairment, depreciation is provided on the revised carrying amount of the asset over its remaining useful life.
The Group bases its impairment calculation on detailed budgets and forecast calculations, which are prepared separately for the Company Cash Generating Unit’s (CGU) to which the individual assets are allocated. These budgets and forecast calculations generally cover a period of five years. For longer periods, a long-term growth rate is calculated and applied to project future cash flows after the fifth year.
Impairment losses are recognised in the Statement of Profit and Loss in expense categories.
An assessment is made at each reporting date as to whether there is any indication that previously recognised impairment losses may no longer exist or may have decreased. If such indication exists, the Company estimates the asset’s or CGU’s recoverable amount. A previously recognised impairment loss is reversed only if there has been a change in the assumptions used to determine the asset’s recoverable amount since the last impairment loss was recognised. The reversal is limited so that the carrying amount of the asset does not exceed its recoverable amount, nor exceed the carrying amount that would have been determined, net of depreciation, had no impairment loss been recognised for the asset in prior years.
2.15 Inventories
2.15.1 Construction materials and consumables
The construction materials and consumables are valued at lower of cost or net realisable value. The construction materials and consumables purchased for construction work issued to construction are treated as consumed.
2.15.2 Construction work in progress
The construction work in progress is valued at lower of cost or net realisable value. Cost includes cost of land, development rights, rates and taxes, construction costs, borrowing costs, other direct expenditure, allocated overheads and other incidental expenses.
NOTES FORMING PART OF CONSOLIDATED FINANCIAL STATEMENTS
90 2017-18219

Finished stock of completed projects and stock in trade of units is valued at lower of cost or net realisable value.
2.15.4 Food and beverages
Stock of food and beverages are valued at lower of cost (computed on a moving weighted average basis, net of taxes) or net realisable value. Cost includes all expenses incurred in bringing the goods to their present location and condition.
2.15.5 Hospitality related operating supplies
Hospitality related operating supplies are valued at lower of cost (computed on a moving weighted average basis, net of taxes) or net realisable value and are expensed as and when purchased.
2.16 Share based payments - Equity-settled transactions
The cost of equity-settled transactions is determined by the fair value at the date when the grant is made using an appropriate valuation model.
That cost is recognised, together with a corresponding increase in Share-Based Payment (SBP) reserves in equity, over the period in which the performance and / or service conditions are fulfilled in employee benefits expense. The cumulative expense recognised for equity-settled transactions at each reporting date until the vesting date reflects the extent to which the vesting period has expired and the Group’s best estimate of the number of equity instruments that will ultimately vest. The Statement of Profit and Loss expense or credit for a period represents the movement in cumulative expense recognised as at the beginning and end of that period and is recognised in employee benefits expense.
The dilutive effect of outstanding options is reflected as additional share dilution in the computation of diluted earnings per share.
The amendments in Ind AS 102 addresses three main areas: the effects of vesting conditions on the measurement of a cash-settled share-based payment transaction; the classification of a share-based payment transaction with net settlement features for withholding tax obligations; and accounting where a modification to the terms and conditions of a share-based payment transaction changes its classification from cash settled to equity settled.
The Group applied these amendments without restating prior periods. However, their application has no effect on the Group’s financial position and performance as the Group had no such transaction.
2.17 Provisions and contingent liabilities
(i) A provision is recognised when:
settle the obligation; and
pre-tax rate that reflects, when appropriate, the risks specific to the liability. When discounting is used, the increase in the provision due to the passage of time is recognised as a finance cost.
(ii) A disclosure for a contingent liability is made when there is a possible obligation or a present obligation that may, but probably may not, require an outflow of resources. A contingent liability also arises in extreme cases where there is a probable liability that cannot be recognised because it cannot be measured reliably.
(iii) Where there is a possible obligation or a present obligation such that the likelihood of outflow of resources is remote, no provision or disclosure is made.
NOTES FORMING PART OF CONSOLIDATED FINANCIAL STATEMENTS
2017-18 91220

2.18 Borrowing costs
Borrowing costs that are directly attributable to the acquisition / construction of qualifying assets or for long - term project development are capitalised as part of their costs.
Borrowing costs are considered as part of the asset cost when the activities that are necessary to prepare the assets for their intended use are in progress.
Borrowing costs consist of interest and other costs that Group incurs in connection with the borrowing of funds. Other borrowing costs are recognised as an expense, in the period in which they are incurred.
2.19 Segment reporting
Based on the “management approach” as defined in Ind AS 108 – Operating Segments, the Chairman and Managing Director / Chief Financial Officer evaluates the Group’s performance based on an analysis of various performance indicators by business segment. Segment revenue and expense include amounts which can be directly attributable to the segment and allocable on reasonable basis. Segment assets and liabilities are assets / liabilities which are directly attributable to the segment or can be allocated on a reasonable basis. Income / expenses / assets / liabilities relating to the enterprise as a whole and not allocable on a reasonable basis to business segments are reflected as unallocated income / expenses / assets / liabilities.
Retirement benefits in the form of contribution to provident fund and pension fund are charged to the Statement of Profit and Loss.
Gratuity is in the nature of a defined benefit plan.
Provision for gratuity is calculated on the basis of actuarial valuations carried out at reporting date and is charged to the Statement of Profit and Loss. The actuarial valuation is computed using the projected unit credit method.
Re-measurements, comprising of actuarial gains and losses, the effect of the asset ceiling, excluding amounts included in net interest on the net defined benefit liability and the return on plan assets (excluding amounts included in net interest on the net defined benefit liability), are recognised immediately in the Balance Sheet with a corresponding debit or credit to retained earnings through OCI in the period in which they occur. Re-measurements are not reclassified to profit or loss in subsequent periods.
Leave encashment is recognised as an expense in the Statement of Profit and Loss account as and when they accrue. The Group determines the liability using the projected unit credit method, with actuarial valuations carried out as at Balance Sheet date. Actuarial gains and losses are recognised in the statement of other comprehensive income.
2.21 Earnings per share
Basic earnings per share is calculated by dividing the net profit / (loss) for the year attributable to equity shareholders (after deducting preference dividends and attributable taxes) by weighted average number of equity shares outstanding during the year.
For the purpose of calculating diluted earnings per share, the net profit / (loss) for the year attributable to equity shareholders and the weighted average numbers of shares outstanding during the year are adjusted for the effects of all dilutive potential equity shares.
NOTES FORMING PART OF CONSOLIDATED FINANCIAL STATEMENTS
92 2017-18221

3. USE OF JUDGMENTS AND ESTIMATES
The preparation of consolidated financial statements in conformity with Ind AS requires management to make judgments, estimates and assumptions that affect the reported amounts of assets, liabilities, income, expenses and disclosures of contingent assets and liabilities at the reporting date. However, uncertainty about these assumptions and estimates could result in outcomes that require a material adjustment to the carrying amount of the asset or liability affected in future periods.
Estimates and underlying assumptions are reviewed at each reporting date. Any revision to accounting estimates and assumptions are recognised prospectively i.e. recognised in the period in which the estimate is revised and future periods affected.
The following are significant management judgments in applying the accounting policies of the Group that have a significant effect on the financial statements.
3.1.1 Joint arrangements
The joint arrangements are separately incorporated. The Group has, after considering the structure and form of the arrangement, the terms agreed by the parties in the contractual arrangement and the Group’s rights and obligations arising from the arrangement, classified its interests as joint ventures under Ind AS 111 Joint Arrangements. As a consequence it accounts for its investments using the equity method.
3.1.2 Revenue recognition of sale of premises
Revenue is recognised using the percentage of completion method as construction progresses. The percentage of completion is estimated by reference to the stage of the projects determined based on the proportion of costs incurred to date and the total estimated costs to complete.
The Group determines whether a property is classified as investment property or as inventory:
(i) Investment property comprises land and buildings that are not occupied for use by, or in the operations of, the Group, nor for sale in the ordinary course of business, but are held primarily to earn rental income and capital appreciation. These buildings are rented to tenants and are not intended to be sold in the ordinary course of business.
(ii) Inventory comprises property that is held for sale in the ordinary course of business. Principally these are properties that the Group develops and intends to sell before or on completion of construction.
3.1.4 Operating lease contracts – the group as lessor
The Group has entered into leases of its investment properties. The Group has determined based on an evaluation of the terms and conditions of the arrangements, that it retains all the significant risks and rewards of ownership of these properties and so accounts for the leases as operating leases.
3.1.5 Recognition of deferred tax assets
The extent to which deferred tax assets can be recognised is based on an assessment of the probability of the Group’s future taxable income against which the deferred tax assets can be utilised. In addition, significant judgement is required in assessing the impact of any legal or economic limits or uncertainties in tax jurisdictions.
NOTES FORMING PART OF CONSOLIDATED FINANCIAL STATEMENTS
2017-18 93222

3.2 Estimates and assumptions
The management classifies the assets and liabilities into current and non-current categories based on the operating cycle of the respective business / projects.
3.2.2 Impairment of assets
In assessing impairment, management estimates the recoverable amounts of each asset or CGU (in case of non-financial assets) based on expected future cash flows and uses an estimated interest rate to discount them. Estimation relates to assumptions about future cash flows and the determination of a suitable discount rate.
3.2.3 Useful lives of depreciable / amortisable assets (Property, plant and equipments, intangible assets and investment property)
Management reviews its estimate of the useful lives of depreciable / amortisable assets at each reporting date, based on the expected usage of the assets. Uncertainties in these estimates relate to technical and economic obsolescence that may change the usage of certain assets.
3.2.4 Inventories
Inventory is stated at the lower of cost or net realisable value (NRV).
NRV for completed inventory property is assessed including but not limited to market conditions and prices existing at the reporting date and is determined by the Group based on net amount that it expects to realise from the sale of inventory in the ordinary course of business.
NRV in respect of inventories under construction is assessed with reference to market prices (reference to the recent selling prices) at the reporting date less estimated costs to complete the construction, and estimated cost necessary to make the sale. The costs to complete the construction are estimated by management.
The cost of defined benefit gratuity plan and the present value of the gratuity obligation along with leave salary are determined using actuarial valuations. An actuarial valuation involves making various assumptions such as standard rates of inflation, mortality, discount rate, attrition rates and anticipation of future salary increases. Due to the complexities involved in the valuation and its long-term nature, a defined benefit obligation is highly sensitive to changes in these assumptions. All assumptions are reviewed at each reporting date.
3.2.6 Fair value measurements
Management applies valuation techniques to determine the fair value of financial instruments (where active market quotes are not available) and non-financial assets. This involves developing estimates and assumptions consistent with how market participants would price the instrument / assets. Management bases its assumptions on observable data as far as possible but this may not always be available. In that case Management uses the best relevant information available. Estimated fair values may vary from the actual prices that would be achieved in an arm’s length transaction at the reporting date.
NOTES FORMING PART OF CONSOLIDATED FINANCIAL STATEMENTS
94 2017-18223

NO
TE 2
. P
RO
PER
TY, P
LAN
T A
ND
EQ
UIP
MEN
TS(`
in L
akh)
Part
icu
lars
B
uild
ing
s*#
Fu
rnit
ure
a
nd
eq
uip
men
ts*
Pla
nt
an
d
ma
chin
ery*
E
lect
rica
l in
sta
lla
tion
s a
nd
eq
uip
men
ts*
Veh
icle
s* A
ircr
aft
* C
om
pu
ters
* T
ota
l
Gro
ss c
arry
ing
valu
e as
at A
pril
1, 2
017
17,
474.
66
2,7
60.1
2 9
6.60
4
,047
.30
1,5
14.0
1 8
30.5
9 5
05.3
4 3
57.2
9 2
7,58
5.91
Ad
ditio
ns
7.1
4 1
1.17
1
1.65
3
2.30
-
7
6.47
-
2
3.52
1
62.2
5 (D
educ
tions
) / (D
ispos
als)
-
(3
.35)
(0.5
2) (2
1.24
) -
-
-
-
(2
5.11
)G
ross
ca
rryi
ng
va
lue
as
at
Ma
rch
31, 2018
17,4
81.8
0
2,7
67.9
4
107.7
3
4,0
58.3
6
1,5
14.0
1
907.0
6
505.3
4
380.8
1
27,7
23.0
5
Accu
mul
ated
dep
reci
atio
n as
at A
pril
1, 2
017
643
.38
1,3
17.5
6 4
8.11
1
,820
.53
585
.35
194
.64
78.
74
146
.66
4,8
34.9
7 D
epre
ciat
ion
for t
he y
ear
321
.83
668
.69
17.
46
716
.36
292
.73
123
.88
39.
37
88.
78
2,2
69.1
0 (D
educ
tions
) / (D
ispos
als)
-
(1
.26)
(0.5
2) (3
.11)
-
-
-
-
(4.8
9)C
losi
ng
acc
um
ula
ted
dep
reci
ati
on
as
at
Ma
rch
31, 2018
965.2
1
1,9
84.9
9
65.0
5
2,5
33.7
8
878.0
8
318.5
2
118.1
1
235.4
4
7,0
99.1
8
Net
ca
rryi
ng
va
lue
as
at
Ma
rch
31, 2018
16,5
16.5
9
782.9
5
42.6
8
1,5
24.5
8
635.9
3
588.5
4
387.2
3
145.3
7
20,6
23.8
7
The
Gro
up h
as n
o re
stric
tions
on
the
real
isabi
lity
of it
s Pr
oper
ty, P
lant
and
Equ
ipm
ents
and
the
sam
e ar
e fre
e fro
m a
ny e
ncum
bran
ces.
* Th
e ab
ove
incl
udes
Gro
ss B
lock
of `
510
.74
lakh
(`
510.
74 la
kh) h
eld
in th
e na
me
of A
OP
on c
o-ow
ners
hip
basis
.
# B
uild
ing
incl
udes
5 s
hare
s of
`10
eac
h of
a h
ousin
g so
ciet
y, w
hich
is p
endi
ng fo
r tra
nsfe
r.
(` in
Lak
h)Pa
rtic
ula
rs
Bu
ild
ing
s*#
Fu
rnit
ure
a
nd
eq
uip
men
ts*
Pla
nt
an
d
ma
chin
ery*
E
lect
rica
l in
sta
lla
tion
s a
nd
eq
uip
men
ts*
Veh
icle
s* A
ircr
aft
* C
om
pu
ters
* T
ota
l
Gro
ss c
arry
ing
valu
e as
at A
pril
1, 2
016
17,
473.
22
2,5
36.9
2 6
9.32
3
,990
.75
1,5
14.0
1 4
79.7
9 5
05.3
4 2
16.4
8 2
6,78
5.83
Ad
ditio
ns
1.9
0 2
23.7
3 2
8.51
6
7.80
-
3
55.5
1 -
1
41.3
3 8
18.7
8 (D
educ
tions
) / (D
ispos
als)
(0
.46)
(0.5
3) (1
.23)
(11.
25)
-
(4.7
1) -
(0
.52)
(18.
70)
Gro
ss c
arr
yin
g v
alu
e a
s a
t M
arc
h 3
1, 2017
17,4
74.6
6
2,7
60.1
2
96.6
0
4,0
47.3
0
1,5
14.0
1
830.5
9
505.3
4
357.2
9
27,5
85.9
1
Accu
mul
ated
dep
reci
atio
n as
at A
pril
1, 2
016
321
.91
649
.30
28.
11
909
.29
292
.62
77.
62
39.
37
67.
29
2,3
85.5
1 D
epre
ciat
ion
for t
he y
ear
321
.78
668
.30
20.
64
913
.42
292
.73
117
.02
39.
37
79.
79
2,4
53.0
5 (D
educ
tions
) / (D
ispos
als)
(0
.31)
(0.0
4) (0
.64)
(2.1
8) -
-
-
(0
.42)
(3.5
9)C
losi
ng
acc
um
ula
ted
dep
reci
ati
on
as
at
Ma
rch
31, 2017
643.3
8
1,3
17.5
6
48.1
1
1,8
20.5
3
585.3
5
194.6
4
78.7
4
146.6
6
4,8
34.9
7
Net
ca
rryi
ng
va
lue
as
at
Ma
rch
31, 2017
16,8
31.2
8
1,4
42.5
6
48.4
9
2,2
26.7
7
928.6
6
635.9
5
426.6
0
210.6
3
22,7
50.9
4
NO
TES
FOR
MIN
G P
AR
T O
F C
ON
SOLI
DA
TED
FIN
AN
CIA
L ST
ATE
MEN
TS
2017-18 95224

NO
TE 3
. C
AP
ITA
L W
OR
K I
N P
RO
GR
ESS
(` in
Lak
h)Pa
rtic
ula
rs P
rop
ert
y, P
lan
t a
nd
Eq
uip
men
ts
In
vest
men
t P
rop
ert
ies
Tota
l M
arc
h 3
1, 2018
Ma
rch
31, 2017
Ma
rch
31, 2018
Ma
rch
31, 2017
Ma
rch
31, 2018
Ma
rch
31, 2017
Ope
ning
cap
ital w
ork
in p
rogr
ess
3.7
1 3
42.3
0 1
0,89
9.91
4
,533
.85
10,9
03.6
2
4,8
76.1
5
Addi
tions
3
2.34
2
54.2
6 8
,060
.82
7,3
44.9
8 8
,093.1
6
7,5
99.2
4
Cap
italis
ed d
urin
g th
e ye
ar
(3.6
7) (5
92.8
5) (7
,748
.48)
(978
.92)
(7,7
52.1
5)
(1,5
71.7
7)
Clo
sin
g c
ap
ita
l w
ork
in
pro
gre
ss
32.3
8
3.7
1
11,2
12.2
5
10,8
99.9
1
11,2
44.6
3
10,9
03.6
2
Cap
ital w
ork
in p
rogr
ess
as a
t Mar
ch 3
1, 2
018
mai
nly
com
pris
es o
f exp
endi
ture
tow
ards
offi
ce s
pace
bui
ldin
g.
NO
TE 4
. IN
VES
TMEN
T P
RO
PER
TIES
(` in
Lak
h)Pa
rtic
ula
rs
La
nd
-
freeh
old
B
uild
ing
s F
urn
itu
re
an
d
eq
uip
men
ts
Pla
nt
an
d
ma
chin
ery
E
lect
rica
l in
sta
lla
tion
s a
nd
eq
uip
men
ts
Com
pu
ters
T
ota
l
Gro
ss c
arry
ing
valu
e as
at A
pril
1, 2
017
11,
102.
41
51,
187.
93
1,0
09.4
1 9
.55
10,
981.
18
2,0
82.4
9 5
.26
76,
378.
23
Addi
tions
8
39.3
7 4
,854
.65
1,0
85.1
6 1
.27
762
.65
301
.44
0.1
0 7
,844
.64
(Ded
uctio
ns) /
(Dis
posa
ls)
-
(0.2
1) (4
.19)
(0.0
4) (8
5.05
) (0
.09)
-
(89.
58)
Gro
ss c
arr
yin
g v
alu
e a
s a
t M
arc
h 3
1, 2018
11,9
41.7
8
56,0
42.3
7
2,0
90.3
8
10.7
8
11,6
58.7
8
2,3
83.8
4
5.3
6
84,1
33.2
9
Accu
mul
ated
dep
reci
atio
n as
at A
pril
1, 2
017
-
1,8
06.2
9 5
14.2
5 5
.69
1,8
41.6
9 6
69.9
3 3
.54
4,8
41.3
9 D
epre
ciat
ion
for
the
year
-
9
56.5
8 2
50.6
0 1
.73
979
.11
357
.05
1.5
4 2
,546
.61
(Ded
uctio
ns) /
(Dis
posa
ls)
-
(0.2
1) (2
.91)
(0.0
4) (2
4.94
) (0
.07)
-
(28.
17)
Clo
sin
g a
ccu
mu
late
d d
ep
reci
ati
on
as
at
Ma
rch
31, 2018
-
2,7
62.6
6
761.9
4
7.3
8
2,7
95.8
6
1,0
26.9
1
5.0
8
7,3
59.8
3
Net
carr
yin
g v
alu
e a
s a
t M
arc
h 3
1, 2018
11,9
41.7
8
53,2
79.7
1
1,3
28.4
4
3.4
0
8,8
62.9
2
1,3
56.9
3
0.2
8
76,7
73.4
6
Inve
stmen
t pro
perty
com
prisi
ng o
f ide
ntifi
ed a
rea
of o
ne o
f the
com
mer
cial
pro
ject
s ad
mea
surin
g 2,
03,5
13.4
4 sq
ft o
f the
Gro
up a
re m
ortg
aged
in c
onne
ctio
n w
ith a
vaili
ng w
orki
ng c
apita
l lo
an. (
refe
r not
e 20
)(`
in L
akh)
Pa
rtic
ula
rs
La
nd
-
freeh
old
B
uild
ing
s F
urn
itu
re
an
d
eq
uip
men
ts
Pla
nt
an
d
ma
chin
ery
E
lect
rica
l in
sta
lla
tion
s a
nd
eq
uip
men
ts
Com
pu
ters
T
ota
l
Gro
ss c
arry
ing
valu
e as
at A
pril
1, 2
016
11,
102.
41
50,
947.
14
936
.20
9.0
9 1
0,43
4.96
2
,046
.05
5.2
6 7
5,48
1.11
Ad
ditio
ns
-
351
.76
87.
90
0.4
6 5
49.1
1 3
9.02
-
1
,028
.25
(Ded
uctio
ns) /
(Dis
posa
ls)
-
(110
.97)
(14.
69)
-
(2.8
9) (2
.58)
-
(131
.13)
Gro
ss c
arr
yin
g v
alu
e a
s a
t M
arc
h 3
1, 2017
11,1
02.4
1
51,1
87.9
3
1,0
09.4
1
9.5
5
10,9
81.1
8
2,0
82.4
9
5.2
6
76,3
78.2
3
Ac c
umul
ated
dep
reci
atio
n as
at A
pril
1, 2
016
-
902
.91
282
.87
3.2
8 9
12.8
2 3
34.7
3 1
.82
2,4
38.4
3 D
epre
ciat
ion
for
the
year
-
9
06.4
1 2
42.0
8 2
.41
929
.46
336
.54
1.7
2 2
,418
.62
(Ded
uctio
ns) /
(Dis
posa
ls)
-
(3.0
3) (1
0.70
) -
(0
.59)
(1.3
4) -
(1
5.66
)C
losi
ng
acc
um
ula
ted
dep
reci
ati
on
as
at
Ma
rch
31, 2017
-
1,8
06.2
9
514.2
5
5.6
9
1,8
41.6
9
669.9
3
3.5
4
4,8
41.3
9
Net
carr
yin
g v
alu
e a
s a
t M
arc
h 3
1, 2017
11,1
02.4
1
49,3
81.6
4
495.1
6
3.8
6
9,1
39.4
9
1,4
12.5
6
1.7
2
71,5
36.8
4
NO
TES
FOR
MIN
G P
AR
T O
F C
ON
SOLI
DA
TED
FIN
AN
CIA
L ST
ATE
MEN
TS
96 2017-18225

NOTE 4. INVESTMENT PROPERTIES (CONTD.)
Type Valuation techniqueinputs
Inter-relationship between
and fair value measurementInvestment properties Discounted cash flow
technique- refer note belowDiscount Rate
Terminal Year Growth Rate12.41% to 15.22%
5%
Under a DCF method, forecast cash flows are discounted back to the present date, generating a net present value for the cash flow stream of the business.
A terminal value at the end of the explicit forecast period is then determined and that value is also discounted back to the Valuation Date to give an overall value for the business.
A Discounted cash flow methodology typically requires the forecast period to be of such a length to enable the business to achieve a stabilised level of earnings, or to be reflective of an entire operation cycle for more cyclical industries.
The rate at which the future cash flows are discounted (“the discount rate”) should reflect not only the time value of money, but also the risk associated with the business future operations. The discount rate most generally employed is Weighted Average Cost of Capital (“WACC”), reflecting an optimal as opposed to actual financing structure.
In calculating the terminal value, regard must be had to the business potential for further growth beyond the explicit forecast period. The “Constant Growth Model”, which applies an expected constant level of growth to the cash flow forecast in the last year of the forecast period and assumes such growth is achieved in perpetuity, is a common method. These results would be cross-checked, however, for reasonability to implied exit multiples.
Generally, a change in the assumption made for the estimated rental value is accompanied by:
1. A directionally similar change in the rent growth per annum and discount rate (and exit yield).
2. An opposite change in the long term vacancy rate.
(` in Lakh)Particulars March 31, 2018 March 31, 2017
Rental income derived from investment properties 23,383.05 19,389.58 Direct operating expenses (including repairs and maintenance) generating rental income
1,439.00 1,583.04
Direct operating expenses (including repairs and maintenance) that did not generate rental income
- -
21,944.05 17,806.54 Depreciation for the year 2,546.61 2,418.62
19,397.44 15,387.92
(ii) Contractual obligations
Refer note 41 for disclosure of contractual obligations to purchase, construct or develop investment properties or its repairs, maintenance or enhancements.
(iii) Leasing arrangements
The Group’s investment properties consist of four commercial properties in Mumbai. The management has determined that the investment properties consist of - Commerz, Commerz II phase I, Oberoi International School and Oberoi Mall based on the nature, characteristics and risks of each property.
(` in Lakh)Particulars March 31, 2018 March 31, 2017
Not later than one year 14,128.99 10,390.73 Later than one year and not later than five years 26,414.28 17,932.16 Later than five years 21,935.77 - Lease income recognised during the year in profit and loss 23,383.05 19,389.58
NOTES FORMING PART OF CONSOLIDATED FINANCIAL STATEMENTS
2017-18 97226

NOTE 4. INVESTMENT PROPERTIES (CONTD.)
(iv) Fair value
As at March 31, 2018 the fair values of the properties are ` 3,53,580 lakh (` 3,12,840 lakh). These valuations are based on valuations performed by independent valuer. All fair value estimates for investment properties are included in level 3.
The Group has no restrictions on the realisability of its investment properties.
NOTE 5. INTANGIBLE ASSETS
(` in Lakh)Particulars Computer Software Gross carrying value as at April 1, 2017 359.63 Additions 123.22 (Deductions) / (Disposals) (4.24)Gross carrying value as at March 31, 2018 478.61 Accumulated amortisation as at April 1, 2017 152.72 Amortisation for the year 91.05 (Deductions) / (Disposals) (2.13)Closing accumulated amortisation as at March 31, 2018 241.64 Net carrying value as at March 31, 2018 236.97 Addition to intangible assets mainly comprises of purchases of software.
(` in Lakh)Particulars Computer Software Gross carrying value as at April 1, 2016 332.58 Additions 27.06 (Deductions) / (Disposals) - Gross carrying value as at March 31, 2017 359.64 Accumulated amortisation as at April 1, 2016 74.85 Amortisation for the year 77.87 (Deductions) / (Disposals) - Closing accumulated amortisation as at March 31, 2017 152.72 Net carrying value as at March 31, 2017 206.92
NOTE 6. INTANGIBLE ASSETS UNDER DEVELOPMENT
(` in Lakh)
Particulars March 31, 2018 March 31, 2017
Opening capital work in progress 47.26 - Additions 11.71 101.02 Capitalised during the year (40.18) (53.76)Closing capital work in progress 18.79 47.26
Intangible assets under development mainly comprises of expenditure towards software.
NOTES FORMING PART OF CONSOLIDATED FINANCIAL STATEMENTS
98 2017-18227

(` in Lakh)
NOTE 7. INVESTMENTS March 31, 2018 March 31, 2017Non-currentUnquoted
component)4,18,26,070 (4,18,26,070) equity shares of `10 each fully paid up of Siddhivinayak Realties Private Limited
4,184.88 4,187.75
9,500 (9,500) equity shares of `10 each fully paid up of Sangam City Township Private Limited
2,661.82 2,765.24
5,00,000 (5,00,000) equity shares of `10 each fully paid up of I-Ven Realty Limited
29,054.63 29,176.80
15,121 (15,121) equity shares of `100 each fully paid up of Metropark Infratech and Realty Developments Private Limited
144.36 149.11
equity component)Saldanha Realty And Infrastructure LLP (1) 4,653.77 4,571.94 Shri Siddhi Avenues LLP (2) 220.85 672.72 Schematic Estate LLP (3) - -
Oasis Realty 1,90,635.96 1,18,036.99
Investment carried at amortised cost
3,62,500 (3,62,500) 1% non cumulative non convertible preference shares of `10 each fully paid up of I-Ven Realty Limited
681.43 616.68
84,15,875 (Nil) perpetual bond of ` 100 each fully paid up of I-Ven Realty Limited
8,415.88 -
Investment in government securitiesNational saving certificate (in the name of employee of the Company) 1.74 0.82
2,40,655.32 1,60,178.05
Aggregate Value of unquoted investments 2,40,655.32 1,60,178.05
(` in Lakh)Fixed capital investments in partnership Partners name Share of
partnerMarch
31, 2018March
31, 2017
1) Capital in Saldanha Realty And Infrastructure LLP Allwyn Saldanha 25.00% 12.50 12.50 Geraldine Saldanha 25.00% 12.50 12.50 Expressions Realty Private Limited
50.00% 25.00 25.00
Total 100.00% 50.00 50.00 2) Capital in Shri Siddhi Avenues LLP Integrus Realty Private
Limited50.00% 1,000.00 1,000.00
Kishor Rathod 17.50% 0.18 0.18 Mahendra Rathod 15.00% 0.15 0.15 Raju Rathod 14.00% 0.14 0.14 Jignesh Kothari 3.50% 0.04 0.04 Total 100.00% 1,000.51 1,000.51
3) Capital in Schematic Estate LLP Shri Siddhi Avenues LLP 99.90% 1.00 1.00 Integrus Realty Private Limited
0.10% 0.00 0.00
Total 100.00% 1.00 1.00
NOTES FORMING PART OF CONSOLIDATED FINANCIAL STATEMENTS
2017-18 99228

(` in Lakh)
NOTE 8. OTHER FINANCIAL ASSETSLONG TERM (NON-CURRENT) SHORT TERM (CURRENT)
March 31, 2018
March 31, 2017
March 31, 2018
March 31, 2017
Unsecured and considered good
Accrued income - - 232.60 253.45 Fixed deposits with banks, having remaining maturity for more than twelve months (refer note 15)
410.99 587.55 - -
410.99 587.55 232.60 253.45
Accrued income consist of amount recoverable from tenants on account of contractual obligations.
(` in Lakh)
NOTE 9. DEFERRED TAX March 31, 2018 March 31, 2017
Deferred tax assetsOn other expenses 8.87 11.05 On carried forward losses 153.88 97.94
Deferred tax liabilitiesOn depreciation and amortisation 98.98 139.19 On fair valuation of investments 0.04 4.51
63.73 (34.71)Add: MAT credit 14,514.81 12,613.40
9.1 Deferred tax assets (net) 14,578.54 12,578.69
Deferred tax liabilitiesOn depreciation and amortisation 2,083.62 2,219.06 On lease equalisation reserve assets 319.01 443.44 On fair valuation of investments - 0.64 On others 2.15 - On undistributed profits 1,356.65 -
Deferred tax assetsOn other expenses 56.27 58.51
9.2 Deferred tax liabilities (net) 3,705.16 2,604.63
Movement in deferred tax
(` in Lakh)Particulars TotalAs at April 1, 2016 10,294.87 - to profit or loss (6.91) - MAT credit (303.12) - to other comprehensive income (10.78)As at March 31, 2017 9,974.06 - to profit or loss 3019.39 - MAT credit (706.78) - on undistributed profit (1356.65) - to other comprehensive income (56.64)As at March 31, 2018 10,873.38
NOTES FORMING PART OF CONSOLIDATED FINANCIAL STATEMENTS
100 2017-18229

(` in Lakh)
NOTE 10. OTHER ASSETSLONG TERM (NON-CURRENT) SHORT TERM (CURRENT)
March 31, 2018
March 31, 2017
March 31, 2018
March 31, 2017
Unsecured and considered goodCapital advances 321.82 223.39 - -
Advances other than capital advancesSecurity deposits 13,165.73 13,150.16 35,714.68 35,694.21 Other advancesAdvances to vendors 63.00 63.00 95,807.53 38,053.07 Advances recoverable in cash or kind 321.69 186.75 8,855.26 9,118.89 Balance with government authorities - - 17,442.82 6,300.65 Revenue in excess of billing - - 11,000.26 5,073.51
OthersPrepaid expenses 31.02 54.95 571.60 578.15 Lease equalisation reserve 712.35 632.78 266.17 645.75
14,615.61 14,311.03 1,69,658.32 95,464.23
(` in Lakh)
NOTE 11. INVENTORIES March 31, 2018 March 31, 2017
Plots of land 514.91 514.91 Works in progress 4,11,298.02 3,60,244.99 Finished goods 11,492.63 14,324.06 Food and beverages etc. 143.04 116.98 Assets held for sale - 161.18 Others (transferrable development rights) 1,224.78 1,274.60
4,24,673.38 3,76,636.72
Inventory comprising of unsold identified units admeasuring 3,54,946 sq ft in two projects of the Group are mortgaged to a bank for availing term loan. (Refer note 20)
NOTES FORMING PART OF CONSOLIDATED FINANCIAL STATEMENTS
2017-18 101230

(` in Lakh)NOTE 12. INVESTMENTS March 31, 2018 March 31, 2017
CurrentUnquotedInvestment carried at amortised cost
0% optionally convertible debenture of `100 each fully paid up of I-Ven Realty LimitedNil (47,95,000) 2011-Series-1 to 5 - 4,673.20 Nil (18,31,000) 2012-Series-1 to 9 - 1,783.85 Nil (10,000) 2013-Series-1 to 4 - 9.75 Nil (3,89,500) 2014-Series-1 to 9 - 379.53 Nil (4,42,875) 2015-Series-1 to 8 - 432.17 Nil (3,49,000) 2016-Series-1 to 26 - 341.14 Nil (2,44,000) 2017-Series-1 to 12 - 238.97
0% optionally convertible debentures of Siddhivinayak Realties Private Limited of `100 each fully paid up5,950 (5,950) 2012 Series-1 and 2 5.36 5.50 52,620 (52,620) 2013 Series-1 to 16 47.51 48.70 48,000 (48,000) 2014 Series-1 to 11 43.21 44.32 8,250 (8,250) 2015 Series-1 and 2 7.49 7.67 36,200 (36,200) 2016 Series-1 to 7 33.11 33.85 38,000 (Nil) 2017 Series-1 to 7 42.32 -
Quoted
Investment in mutual funds257 (7,174) units of ̀ 1,000 each of Axis Liquid Fund - Direct Plan - Growth Option (257 units having market value of ` 4.96 lakh is lien marked)
4.96 129.37
Nil (13,058) units of ` 100 Birla Sun Life Cash Plus Direct Plan - Growth Option (954 units having market value of ` 2.49 lakh is lien marked)
- 34.12
5,609 (2,67,649) units of ` 1,000 each of BOI AXA Liquid Fund - Direct - Growth Option
112.38 5,015.07
Nil (19,02,479) units of `100 each of DHFL Pramerica Insta Cash Plus Fund -Direct Plan - Growth Option (16,29,606 units having market value of ` 3,444.28 lakh is lien marked)
- 4,021.02
Nil (1,20,141) units of ` 1,000 each of Kotak Floater Short Term Fund - Direct Plan - Growth Option
- 3,207.02
Nil (46,081) units of ` 1,000 each of Principal Cash Management Fund - Direct Plan - Growth Option
- 729.95
Nil (3,280) units of ` 1,000 each of Reliance Liquid Fund - Treasury Plan - Direct Plan - Growth Option
- 130.15
3,791 (Nil) units of ` 100 DHFL Pramerica Insta Cash Plus Fund - Direct Plan - Growth Option
8.56 -
5,117 (44,244) units of ̀ 1,000 each of L&T Liquid Fund - Direct - Growth Option
121.93 986.66
38,553 (Nil) units of ` 1,000 Invesco India Liquid Fund - Direct Plan - Growth Option
922.22 -
1,349.05 22,252.01 Aggregate amount ofMarket value of quoted investments 1,170.05 14,253.36 Aggregate Value of unquoted investments 179.00 7,998.65
NOTES FORMING PART OF CONSOLIDATED FINANCIAL STATEMENTS
102 2017-18231

(` in Lakh)
NOTE 13. TRADE RECEIVABLES March 31, 2018 March 31, 2017
Unsecured and considered good 18,131.39 10,578.83 18,131.39 10,578.83
No trade or other receivable are due from directors or other officers of the Group either severally or jointly with any other person. Nor any trade or other receivable are due from firms or private companies respectively in which any director is a partner, a director or a member.
Trade receivables are non-interest bearing and are generally on terms as per the contract / agreement.
(` in Lakh)
NOTE 14. CASH AND CASH EQUIVALENTS March 31, 2018 March 31, 2017
Balances with banks 2,158.48 3,659.44 Cheques on hand 155.79 - Cash on hand 44.59 39.86 Fixed deposits with banks, having original maturity of three months or less 5,747.16 5,631.23
8,106.02 9,330.53
(` in Lakh)
NOTE 15. OTHER BANK BALANCES March 31, 2018 March 31, 2017
Balance with banks in dividend / unclaimed dividend accounts 2.64 2.13 Fixed deposits with banks, having remaining maturity for less than twelve months 2,886.93 19,558.49 Fixed deposits with banks (lien marked) 1,087.71 6,275.09
3,977.28 25,835.71 Less : Amount disclosed under non-current asset (refer note 8) (410.99) (587.55)
3,566.29 25,248.16
(` in Lakh)
NOTE 16. LOANS March 31, 2018 March 31, 2017
Unsecured and considered goodLoans to related parties (refer note 38)Loans to joint ventures 14,625.46 12,208.60 Other loans and advancesLoans to others 1,105.25 1,105.25 Loans to employees 2.92 55.99
15,733.63 13,369.84
Advances to related parties includeDue from the private limited company (JV) in which the Company’s director is a director
3,444.39 3,118.81
Loans to related parties and others are interest free and are repayable on demand except for one party where the interest is charged as per the terms of the agreement. The loan have been granted for meeting their business requirements.
NOTES FORMING PART OF CONSOLIDATED FINANCIAL STATEMENTS
2017-18 103232

(` in Lakh)
NOTE 17. CURRENT TAX ASSETS (NET) March 31, 2018 March 31, 2017
Income tax (net of provisions) 1,863.84 2,312.52 1,863.84 2,312.52
(` in Lakh)
Particulars March 31, 2018 March 31, 2017
64,590.59 56,229.69 Tax on accounting Profit at statutory income tax rate of 34.608% (March 31, 2017: 34.608%)
22,353.51 19,459.97
Adjustment for expenses disallowed under Income Tax Act 2,052.94 1,718.89 Change in tax rate in respect of subsidiaries in consolidation (10.35) (4.22)Adjustment for allowable under Income Tax Act (2,253.52) (2,133.02)Adjustment for exempted income (43.60) (138.35)Others (122.88) (225.32)
Tax) 21,976.10 18,677.95
(` in Lakh)
NOTE 18. SHARE CAPITAL March 31, 2018 March 31, 2017
Authorised share capital42,50,00,000 (42,50,00,000) equity shares of ` 10 (Rupees ten only) each 42,500.00 42,500.00
42,500.00 42,500.00 Issued, subscribed and paid up share capital33,96,02,237 (33,95,35,426) equity shares of ` 10 (Rupees ten only) each fully paid up
33,953.55 33,930.39
Add: Issue of fresh shares on exercise of options vested under Employee Stock Option Scheme
6.68 23.16
33,960.23 33,953.55
A. Reconciliation of shares outstanding at the beginning and at the end of the year
Equity shares
ParticularsMarch 31, 2018 March 31, 2017
in No. (` in Lakh) in No. (` in Lakh)At the beginning of the year 33,95,35,426 33,953.55 33,93,03,845 33,930.39 Add: Issue of fresh shares on exercise of options vested under Employee Stock Option Scheme
66,811 6.68 2,31,581 23.16
At the end of the year 33,96,02,237 33,960.23 33,95,35,426 33,953.55
B. Terms / rights attached to equity shares
The Company has only one class of equity shares having par value of ` 10 per share. Each shareholder of equity shares is entitled to one vote per share. The Company declares dividends in Indian rupees. The dividend proposed by the Board of Directors is subject to the approval of the shareholders in the ensuing Annual General Meeting.
In the event of liquidation of the Company, the holders of equity shares will be entitled to receive remaining assets of the Company, after distribution of all preferential amounts. The distribution will be in proportion to the number of equity shares held by the shareholders.
The Board of Directors of the Company has proposed dividend of ` 2 (` 2) per equity share for the financial year 2017-2018. The payment of dividend is subject to approval of the shareholders in the ensuing Annual General Meeting of the Company. The total cash outflows on account of Proposed Equity Dividend would be ` 6,792.04 lakh (` 6,792.04 lakh).
NOTES FORMING PART OF CONSOLIDATED FINANCIAL STATEMENTS
104 2017-18233

NOTE 18. SHARE CAPITAL (CONTD.)
C. Details of shareholders holding more than 5% shares in the Company
Equity shares
Name March 31, 2018 March 31, 2017
in No. % Holding in No. % Holding i) Vikas Oberoi 21,28,73,614 62.68% 21,28,73,614 62.70%ii) R S Estate Developers Private Limited 3,33,00,000 9.81% 3,33,00,000 9.81%
As per the records of the Company, including its register of shareholders / members and other declarations received from shareholders regarding beneficial interest, the above shareholding represents both legal and beneficial ownership of shares.
D. Shares reserved for issue under options
The Company instituted an Employees Stock Option Scheme (‘ESOP 2009’) pursuant to the Board and Shareholders’ resolution dated December 04, 2009. As per ESOP 2009, the Company is authorised to grant 14,43,356 (14,43,356) options comprising equal number of equity shares in one or more tranches to the eligible employees of the Company and its subsidiaries. The employee will have the option to exercise the right within three years from the date of vesting of options. Under ESOP 2009, 13,49,553 (13,49,553) options have been granted, out of which as on date of balance sheet Nil (94,739) options are outstanding.
The following information relates to the Employee Stock Options as on March 31, 2018
Particulars
Number of options
Exercise price (`)
Weighted average exercise price (`)
Weighted average contractual life
of options as on the date of
grant (Years)Outstanding at the beginning of the year 94,739 260 260 4.20 Less: Lapsed / forfeited / cancelled during the year 27,928 - - - Less: Exercised during the year 66,811 260 260 - Outstanding at the end of the year - - - - Exercisable at the end of the year - - - -
The following information relates to the Employee Stock Options as on March 31, 2017
Particulars
Number of options
Exercise price (`)
Weighted average exercise price (`)
Weighted average contractual life
of options as on the date of
grant (Years)Outstanding at the beginning of the year 5,15,751 260 260 4.20 Less: Lapsed / forfeited / cancelled during the year 1,89,431 - - - Less: Exercised during the year 2,31,581 260 260 - Outstanding at the end of the year 94,739 260 260 4.20 Exercisable at the end of the year 94,739 260 260 4.20
The employee share based payments have been accounted using the intrinsic value method measured by a difference between the market price of the underlying equity shares as at the date of grant and the exercise price. Since the market price of the underlying equity shares on the grant date is same as exercise price of the option, the intrinsic value of option is determined as ` Nil (` Nil). Hence no compensation expense has been recognised. Under the fair value method, there would have been no impact on the basic and diluted EPS for the year.
NOTES FORMING PART OF CONSOLIDATED FINANCIAL STATEMENTS
2017-18 105234

(` in Lakh)
NOTE 19. OTHER EQUITY March 31, 2018 March 31, 2017
General reserveBalance in General reserve 23,275.82 23,275.82
23,275.82 23,275.82
Capital redemption reserveBalance in Capital redemption reserve 5,710.00 5,710.00
5,710.00 5,710.00
Capital reserveBalance in Capital reserve 3,590.00 3,590.00
3,590.00 3,590.00 Securities premium accountOpening balance 1,67,197.55 1,66,618.60 Add: Receipt during the year 167.03 578.95
1,67,364.58 1,67,197.55
Capital reserve on consolidationBalance in Capital reserve on consolidation 7,585.19 7,585.19
7,585.19 7,585.19
Retained earningsOpening balance 3,31,283.96 2,93,402.72 Profit during the year as per statement of profit and loss 45,880.32 37,858.76 Items of other comprehensive income recognised directly in retained earnings
-Transfer to retained earnings of re - measurement gains / (losses) on defined benefit plans, net of taxes
118.67 22.48
Dividend (including dividend distribution tax) (8,174.75) - Deferred tax liabilities - tax on undistributed profits (1,356.65) -
3,67,751.55 3,31,283.96 5,75,277.14 5,38,642.52
(` in Lakh)
NOTE 20. BORROWINGSLONG TERM (NON-CURRENT) SHORT TERM (CURRENT)
March 31, 2018
March 31, 2017
March 31, 2018
March 31, 2017
i) Loan from related party (refer note 38)UnsecuredFrom director* - - 8,908.00 8,908.00
- - 8,908.00 8,908.00 *Interest free and repayable on demand
ii) Debentures (refer below note a)Secured9.25% Redeemable non-convertible debenture250 (250) - Series V (Face value of `100.00 lakh (Nil) each fully paid up), redeemable on April 23, 2019
24,992.50 24,986.04 1,013.70 1,006.17
250 (250) - Series VI (Face value of `100.00 lakh (Nil) each fully paid up), redeemable on April 23, 2020
24,985.39 24,979.24 1,013.70 1,006.17
250 (250) - Series VII (Face value of `100.00 lakh (Nil) each fully paid up), redeemable on April 23, 2021
24,978.40 24,972.49 1,013.70 1,006.17
74,956.29 74,937.77 3,041.10 3,018.51
NOTES FORMING PART OF CONSOLIDATED FINANCIAL STATEMENTS
106 2017-18235

(` in Lakh)
NOTE 20. BORROWINGS (CONTD.)LONG TERM (NON CURRENT) SHORT TERM (CURRENT)
March 31, 2018
March 31, 2017
March 31, 2018
March 31, 2017
iii) Line of credit (refer below note b)Secured- Line of credit from bank - - 14,636.66 -
- - 14,636.66 -
iv) Term Loan (refer below note c)Secured- From bank 67,864.18 - - -
67,864.18 - - - Total (i+ii+iii+iv) 1,42,820.47 74,937.77 26,585.76 11,926.51 Less: Current maturities of long term borrowings (refer note 22)
(74,956.29) - - -
67,864.18 74,937.77 26,585.76 11,926.51
a) Terms of Redeemable Non-Convertible Debentures
In June 2016, the Company has issued 750 number 9.25% Redeemable Non-Convertible Debentures (NCDs) (Series V, VI, VII) of ` 100.00 lakh each amounting to ` 75,000.00 lakh through private placement. The entire issue proceeds have been utilised in accordance with the objects of the issue.
The coupon rate is 9.25% p.a., payable semi-annually. The Company has an option to redeem the Series VI and Series VII NCDs prior to the scheduled redemption date mentioned above in one or more tranches, subject to payment of early redemption premium.
During the previous year ended March 31, 2017, debentures (Series III and IV) amounting to ` 35,000.00 lakh has been redeemed by the Company prior to its scheduled redemption date.
Security
The Debentures are secured by (i) mortgage of the unsold identified residential units (inventories) in one of the project of the subsidiary company, (ii) charge on receivables and Escrow Account into which receivables are deposited from the sale of flats in one of the project of the subsidiary company and (iii) further secured by way of an irrevocable and unconditional corporate guarantee of the Company. The security cover as required under the terms of the issue of the said Debentures is maintained.
b) During the year ended on March 31, 2018, the Company has availed working capital credit limit of ` 30,000.00 lakh from Axis Bank Ltd. for meeting working capital requirement of its various under construction projects. This credit limit carries a monthly interest of 8.90% p.a. (Base Rate+PLC) and as on March 31, 2018, ` 14,561.00 lakh was drawn by the Group. The said credit limit is for a period of 48 months with scheduled repayment of 25% at the end of each year, from the date of first drawdown.
The Loan is secured by mortgage of the identified commercial units in one of the project of the Company. The security cover as required under the terms of the loan is maintained. (refer note 4)
c) During the year ended on March 31, 2018, the Company has availed a Term Loan of ̀ 75,000 lakh from HDFC Ltd. for meeting its working capital requirement. Currently this Term Loan is on a monthly interest payment of 9.15% p.a. (Base Rate+PLC) on ` 68,500 lakh was drawn by the Company till March 31, 2018. The Term Loan is for a period of 60 months, from the date of first drawdown. The Company has an option to pre-pay the loan fully or partially.
The Term Loan is secured by mortgage of the unsold identified residential units (inventories) in two projects of the Company with charge on receivable therefrom. The security cover as required under the terms of the term loan is maintained.
NOTES FORMING PART OF CONSOLIDATED FINANCIAL STATEMENTS
2017-18 107236

(` in Lakh)
NOTE 21. TRADE PAYABLESLONG TERM (NON-CURRENT) SHORT TERM (CURRENT)
March 31, 2018
March 31, 2017
March 31, 2018
March 31, 2017
Trade payablesTotal outstanding dues of micro enterprises and small enterprises
276.50 - 718.30 32.62
Total outstanding dues of creditors other than micro enterprises and small enterprises
1,187.03 659.41 12,361.59 4,654.26
1,463.53 659.41 13,079.89 4,686.88 Trade payables are non-interest bearing and are settled in accordance with the contract terms with the vendors.
(` in Lakh)
NOTE 22. OTHER FINANCIAL LIABILITIESLONG TERM (NON-CURRENT) SHORT TERM (CURRENT)
March 31, 2018
March 31, 2017
March 31, 2018
March 31, 2017
Financial liabilities measured at amortised costCurrent maturities of long term borrowings (refer note 20) - - 74,956.29 - Guarantee liabilities 30.18 6.19 30.10 422.04 Trade deposits 8,195.73 6,344.44 14,317.20 11,098.15
OthersUnclaimed dividend - - 2.64 2.13 Capital creditors 225.12 53.88 1,402.92 723.30 Others - - 5,846.45 3,349.34
8,451.03 6,404.51 96,555.60 15,594.96
Guarantee liabilities are on account of financial guarantee given on behalf of joint venture.
Trade deposits are deposits received from the tenants for leasing of commercial properties. These deposits are interest free and are repayable as per the terms of the contract. These are carried at amortised cost.
Capital creditor are creditors for the acquisition of property, plant and equipments and investment properties.
Other financial liabilities includes amounts payable to vendors / customers in the usual course of business.
(` in Lakh)
NOTE 23. PROVISIONSLONG TERM (NON-CURRENT) SHORT TERM (CURRENT)
March 31, 2018
March 31, 2017
March 31, 2018
March 31, 2017
Provision for gratuity - - 15.70 169.18 Provision for leave salary 165.97 170.77 26.86 31.67
165.97 170.77 42.56 200.85
NOTES FORMING PART OF CONSOLIDATED FINANCIAL STATEMENTS
108 2017-18237

(` in Lakh)
NOTE 25. CURRENT TAX LIABILITIES (NET) March 31, 2018 March 31, 2017
Income tax (net of provisions) 381.71 528.66 381.71 528.66
(` in Lakh)
NOTE 26. REVENUE FROM OPERATIONS March 31, 2018 March 31, 2017
Revenue from operations Revenue from projects 85,353.40 74,638.27 Revenue from hospitality 12,781.53 12,574.28 Rental and other related revenues 23,383.05 19,389.58 Property and management revenues 4,204.42 3,849.53 Other operating revenue 820.50 922.73
1,26,542.90 1,11,374.39
(` in Lakh)
NOTE 27. OTHER INCOME March 31, 2018 March 31, 2017
Interest income on Bank fixed deposits 578.15 2,256.30 Financial assets measured at amortised cost 1,350.89 1,448.76 Others 49.33 36.79 Dividend income on investments 137.39 163.73 Profit on sale of investments (net) 237.77 808.61 Profit of investments in mutual fund measured at fair value through profit and loss account (net)
3.42 9.24
Other non-operating income 300.85 36.86 2,657.80 4,760.29
(` in Lakh)
NOTE 24. OTHER LIABILITIESLONG TERM (NON-CURRENT) SHORT TERM (CURRENT)
March 31, 2018
March 31, 2017
March 31, 2018
March 31, 2017
Billing in excess of revenue recognised - - 1,75,569.10 1,42,706.71 Rent received in advance 1,445.75 756.14 1,090.46 609.19 Advances from customers - - 3,690.43 2,975.95 Other payablesOther deposits - - 1,033.21 16.71 Provision for expenses - - 7,855.33 10,070.09 Statutory dues - - 4,110.44 937.84 Others - - 145.22 163.54
1,445.75 756.14 1,93,494.19 1,57,480.03
NOTES FORMING PART OF CONSOLIDATED FINANCIAL STATEMENTS
2017-18 109238

(` in Lakh)
NOTE 28. OPERATING COSTS March 31, 2018 March 31, 2017
Expenses incurred during the year Land, development right and transferrable development rights 3,488.79 11,500.29 Materials, labour and contract cost 61,630.82 43,732.50 Other project costs 4,318.79 3,994.88 Rates and taxes 1,960.05 5,746.06 Professional charges 1,850.73 2,615.36 Food, beverages and hotel expenses 4,521.46 4,658.97
Add: transferred from current assets - 547.03
Employee benefits expense 6,483.13 5,733.36 Other expenses 2,102.24 1,815.07 Finance cost 10,290.34 6,648.41
(A) 96,646.35 86,991.93 Less:Transfer to current assets / PPE / investment properties / capital work in progress
1,611.71 1,020.55
(B) 1,611.71 1,020.55 (A-B) 95,034.64 85,971.38
(` in Lakh)
NOTE 29. CHANGES IN INVENTORIES March 31, 2018 March 31, 2017
Opening StockOpening balance of works in progress 3,60,244.99 3,17,855.83 Opening stock of finished goods 14,324.06 13,578.09 Opening stock of food and beverages etc. 116.98 153.93
(A) 3,74,686.03 3,31,587.85
Closing StockClosing balance of works in progress 4,11,298.02 3,60,244.99 Closing stock of finished goods 11,492.63 14,324.06 Closing stock of food and beverages etc. 143.04 116.98
(B) 4,22,933.69 3,74,686.03
(Increase) / decrease in inventoriesof works in progress (51,053.03) (42,389.16)of finished goods 2,831.43 (745.97)of food and beverages etc. (26.06) 36.95
(A-B) (48,247.66) (43,098.18)
(` in Lakh)
NOTE 30. EXCISE DUTY March 31, 2018 March 31, 2017
Excise duty 3.16 12.36 3.16 12.36
NOTES FORMING PART OF CONSOLIDATED FINANCIAL STATEMENTS
110 2017-18239

(` in Lakh)
NOTE 31. EMPLOYEE BENEFITS EXPENSE March 31, 2018 March 31, 2017
Employee costs 11,962.85 11,047.16 Contribution to provident fund, gratuity and others 747.87 718.30 Staff welfare expenses 487.74 384.07
13,198.46 12,149.53 Less: allocated to projects / capitalised 6,483.13 5,733.36
6,715.33 6,416.17
(` in Lakh)
NOTE 32. FINANCE COST March 31, 2018 March 31, 2017
Interest expenses Financial liabilities at amortised cost 10,976.65 7,205.63
10,976.65 7,205.63 Less: allocated to projects / capitalised 10,290.34 6,648.41
686.31 557.22
(` in Lakh)
NOTE 33. DEPRECIATION AND AMORTISATION March 31, 2018 March 31, 2017
Depreciation on property, plant and equipments 2,269.10 2,453.05 Depreciation on investment properties 2,546.61 2,418.62 Amortisation of intangible assets 91.05 77.87
4,906.76 4,949.54
(` in Lakh)
NOTE 34. OTHER EXPENSES March 31, 2018 March 31, 2017Advertising and marketing expenses 1,363.36 1,143.40 Brokerage expenses 1,859.18 1,646.84 Books and periodicals expenses 2.54 2.27 Communication expenses 88.02 76.13 Conveyance and travelling expenses 169.19 179.31 Corporate social responsibility expenses 306.28 84.13 Directors sitting fees and commission 71.38 69.31 Donations 18.87 30.24 Electricity charges 300.04 274.87 Hire charges 168.91 47.47 Information technology expenses 388.90 371.22 Insurance charges 336.47 349.71 Legal and professional charges 214.60 149.96 Loss on sale / discarding of investment properties (net) 116.50 117.05 Loss on sale / discarding of property, plant and equipments (net) 0.90 - Loss on sale / discarding of intangible assets (net) 2.11 - Membership and subscription charges 57.33 26.25 Miscellaneous expenses 366.76 614.15 Payment to auditor 75.70 105.88 Printing and stationery expenses 161.25 133.51 Rent expenses 29.00 19.99 Repairs and maintenance Building 156.96 81.77 Plant and machinery 110.49 121.45 Others 782.71 902.21 Security expenses 428.25 339.13 Vehicle expenses 38.11 25.32
7,613.81 6,911.57 Less: allocated to projects / capitalised 2,102.24 1,815.07
5,511.57 5,096.50
NOTES FORMING PART OF CONSOLIDATED FINANCIAL STATEMENTS
2017-18 111240

(` in Lakh)
NOTE 35. EARNINGS PER SHARE (EPS) March 31, 2018 March 31, 2017
Profit after tax as per Statement of Profit and Loss 45,880.32 37,858.76 Weighted average number of equity shares for basic EPS (in No.) 33,95,97,653 33,93,94,402 Add: Weighted average potential equity shares on grant of option under ESOP (in No.)
- 18,559
Weighted average number of equity shares for diluted EPS (in No.) 33,95,97,653 33,94,12,961Face value of equity share (`) 10 10 Basic earnings per share (`) 13.51 11.15 Diluted earnings per share (`) 13.51 11.15
(` in Lakh)
NOTE 36. EMPLOYEE BENEFITS March 31, 2018 March 31, 2017
A.Employer’s contribution to provident fund 452.12 425.98 Employer’s contribution to pension fund 75.33 68.22 Employer’s contribution to ESIC 15.27 13.33 Labour welfare fund contribution for workmen 0.40 0.38
(` in Lakh)
B. GRATUITY LEAVE ENCASHMENT
March 31, 2018
March 31, 2017
March 31, 2018
March 31, 2017
i) Change in present value of obligationsPresent value obligation at the beginning of the year 1,201.32 1,000.96 202.44 169.68 Interest cost 88.83 78.02 14.97 13.23 Service cost 185.01 183.08 67.39 56.75 Re-measurement (gain) / loss (395.44) (11.77) (63.65) (11.97)Benefit paid (68.68) (37.66) (28.32) (25.25)Employee’s transfer (0.08) (11.31) - - Present value obligation at the end of the year 1,010.96 1,201.32 192.83 202.44
ii) Change in fair value of plan assetsFair value of plan assets at the beginning of the year 1,038.31 743.30 - - Return on plan asset 76.78 57.94 - - Employer’s contribution 177.17 266.85 - - Return on plan assets, excluding amount recognised in net interest expense
(0.49) 19.19 - -
Benefit paid (68.68) (37.66) - - Employee’s transfer (0.08) (11.31) - - Closing balance of fair value of plan assets 1,223.01 1,038.31 - -
iii) Amount recognised in the balance sheetPresent value of obligation at the end of the year 1,010.96 1,201.32 192.83 202.44 Fair value of plan assets at the end of the year 1,223.01 1,038.31 - - Net assets / (liabilities) recognised in the balance sheet
212.05 (163.01) (192.83) (202.44)
iv)lossCurrent service cost 185.01 183.08 67.39 56.75 Interest cost 88.83 78.02 14.97 13.23 Return on plan asset (76.78) (57.94) - - Re-measurement (gain) / loss - - (63.65) (11.97)
loss 197.06 203.16 18.71 58.01
NOTES FORMING PART OF CONSOLIDATED FINANCIAL STATEMENTS
112 2017-18241

(` in Lakh)
B. GRATUITY LEAVE ENCASHMENT
March 31, 2018
March 31, 2017
March 31, 2018
March 31, 2017
v) Expense recognised in other comprehensive incomeRe-measurement (gain) / loss (395.44) (11.77) - - Return on plan assets, excluding amount recognised in net interest expense
0.49 (19.19) - -
(394.95) (30.96) - - Total (income) / expenses (197.89) 172.20 18.71 58.01
Out of the above (income) / expenses Recognised in profit and loss 197.06 203.16 18.71 58.01 Recognised in other comprehensive income (394.95) (30.96) - -
vi) Movement in the liabilities recognised in balance sheetOpening net liability (163.01) (257.66) (202.44) (169.68)Income / (expenses) as above 197.89 (172.20) (18.71) (58.01)Contribution paid 177.17 266.85 28.32 25.25 Closing net assets / (liabilities) 212.05 (163.01) (192.83) (202.44)
vii)Current portion *212.05 *(163.01) (26.86) (31.67)Non-current portion - - (165.97) (170.77)
* The current portion being asset ` 212.05 lakh (` 6.16 lakh) is not recognised in the balance sheet on conservative basis.
Actuarial assumptions GRATUITY LEAVE ENCASHMENT
March 31, 2018
March 31, 2017
March 31, 2018
March 31, 2017
Interest / discount rate 7.60% 7.40% 7.60% 7.40%Annual expected increase in salary cost 8.00% 9.50% 8.00% 9.50%
Gratuity plan
Gratuity is payable to all eligible employees of the Group on death or on resignation, or on retirement after completion of five years of service.
Leave plan
Eligible employees can carry forward leaves in first month of financial year during tenure of service or encash the same on death, permanent disablement or resignation.
D. Broad category of plan assets relating to gratuity as a percentage of total plan assets as at,
Particulars March 31, 2018 March 31, 2017
Government of India securities Nil Nil High quality corporate bonds Nil Nil Equity shares of listed companies Nil Nil Property Nil Nil Policy of insurance 100% 100%
100% 100%
NOTE 36. EMPLOYEE BENEFITS (CONTD.)
NOTES FORMING PART OF CONSOLIDATED FINANCIAL STATEMENTS
2017-18 113242

NOTE 36. EMPLOYEE BENEFITS (CONTD.)
Re-measurement (gains) and losses-experience history
(` in Lakh)
Particulars GRATUITY LEAVE ENCASHMENT
March 31, 2018
March 31, 2017
March 31, 2018
March 31, 2017
(Gains) / losses on obligation due to change in assumptionRe-measurement (gains) / losses on obligation due to change in demographic assumption (e.g. employee turnover and mortality)
(4.48) 19.06 (2.20) (0.16)
Re-measurement (gains) / losses on obligation due to change in financial assumption (e.g. future increase in salary)
(265.98) (14.45) (27.48) (0.72)
Re-measurement (gains) / losses on obligation due to change in experience variance (i.e. actual experience vs assumptions)
(124.98) (16.38) (33.97) (11.09)
(395.44) (11.77) (63.65) (11.97)
Sensitivity analysisA quantitative sensitivity analysis for significant assumption is as follows:
(` in Lakh)
ParticularsMarch 31, 2018 March 31, 2017
Increase Decrease Increase DecreaseGratuityDiscount Rate (- / + 1%) 870.39 1,182.01 1,026.35 1,415.83 Salary Growth Rate (- / + 1%) 1,180.36 869.11 1,409.42 1,027.79 Attrition Rate (- / + 50%) 990.80 1,035.05 1,170.03 1,239.09
Leave Discount Rate (- / + 1%) 170.13 220.66 179.23 230.85 Salary Growth Rate (- / + 1%) 220.48 169.86 230.13 179.32 Attrition Rate (- / + 50%) 193.41 191.84 201.99 201.69
Expected employer’s contribution in future years
(` in Lakh)
Particulars GRATUITY LEAVE ENCASHMENT
March 31, 2018
March 31, 2017
March 31, 2018
March 31, 2017
1 year 34.26 37.10 26.86 31.67 Between 2 and 5 years 128.00 156.25 44.45 49.85 Between 6 and 10 years 145.00 114.09 19.01 19.00 Beyond 10 years 3,623.42 4,462.22 606.77 580.47 Total expected payments 3,930.69 4,769.66 697.09 680.99
The average duration of the defined benefit plan obligation at the end of the reporting period is 15 years (15 years).
Risk exposure
a. Asset Volatility:
The plan liabilities are calculated using the discount rate set with reference to Government securities bond yields; if plan assets underperform this yield, this will create a deficit.
b. Change in Government securities bond yields:
A decrease in bond yields will increase plan liabilities, although this will be partially offset by an increase in the value of the plans bond holdings.
NOTES FORMING PART OF CONSOLIDATED FINANCIAL STATEMENTS
114 2017-18243

NOTE 37. INTEREST IN JOINT VENTURE
A. Group Information
Joint venture in which group is a co-venturer
Name of the Entity
Country of incorporation
Percentage of holding as on March 31,
2018
Percentage of holding as on March 31,
2017
Principal Activities
Siddhivinayak Realties Private Limited (‘SRPL’) India 50% 50% Real EstateSangam City Township Private Limited (‘SCTPL’) India 31.67% 31.67% Real EstateMetropark Infratech And Realty Developments Private Limited (‘MIRD’)
India 33% 33% Real Estate
Saldanha Realty And Infrastructure LLP ('SRIL') India 50% 50% Real EstateShri Siddhi Avenues LLP ('SSAL') India 50% 50% Real EstateOasis Realty (‘OR’)@ India 25% - 40% 25% - 40% Real EstateSchematic Estate LLP ('SELLP') (incorporated on February 10, 2017)
India 50.05% 50.05% Real Estate
I-Ven Realty Limited (‘I-Ven’) India 50% 50% Real Estate
@ The ownership interest mentioned is for Residential business of Oasis Realty. In hospitality business of Oasis Realty, ownership interest of the Group is 50%.
For more information on Joint ventures, refer disclosures notes in the following section:
Joint operation in which Group is a co-venturer
Name of the Entity
Country of incorporation
Percentage of holding as
on March 31, 2018
Percentage of holding as
on March 31, 2017
Principal Activities
Zaco Aviation (AoP)# India 25% 25% Real Estate
# The Group has 25% interest in Zaco Aviation a joint venture, which was set up as a association of person together with Intervalve (India) Limited, EL-O-Matic (India) Private Limited, Serum International Limited and Swapnali Constructions for the purpose of purchase of an asset. The principal place of business of the joint operation is in India.
The Group has interest in various joint ventures as given below. The group’s interest in these joint ventures are accounted for using equity method in the consolidated financial statements.
For commitments and contingent liabilities relating to joint ventures please refer note 41.
NOTES FORMING PART OF CONSOLIDATED FINANCIAL STATEMENTS
2017-18 115244

NOTE 37. INTEREST IN JOINT VENTURE (CONTD.)
(` in Lakh)
Summarised Balance sheet
Oasis Realty (‘OR’) Siddhivinayak Realties Private Limited (‘SRPL’)
March 31, 2018
March 31, 2017
March 31, 2018
March 31, 2017
Proportion of ownership interest held by the Group at the year end
31.35% 27.80% 50.00% 50.00%
Non-current assets 472.94 477.20 8,761.92 8,711.20 Current assets (a) 2,88,495.34 2,44,214.41 37.95 28.34 Total Assets (I) 2,88,968.28 2,44,691.61 8,799.87 8,739.54
Non-current liabilities including deferred tax (b) 4,032.49 1,803.69 8.64 6.79 Current liabilities including tax payable (c) 98,948.12 1,29,860.66 402.51 351.88 Total Liabilities (II) 1,02,980.61 1,31,664.35 411.15 358.67
Total Net Assets (I-II) 1,85,987.67 1,13,027.26 8,388.72 8,380.87
(a) Includes cash and cash equivalents 26.08 168.34 10.31 4.12 (b) Includes non current financial liabilities (excluding trade and other payables and provisions)
- - - -
(c) Includes current financial liabilities (excluding trade and other payables and provisions)
- 49,987.64 374.56 308.41
(` in Lakh)Oasis Realty (‘OR’) Siddhivinayak Realties
Private Limited (‘SRPL’)March
31, 2018March
31, 2017March
31, 2018March
31, 2017Revenue 300.65 273.75 - 0.61 Operating costs (6.58) - - - Employee benefits expense (76.73) (66.26) - - Other expenses (54.95) (61.90) (1.92) (0.98)Finance cost (0.01) - - -
162.38 145.59 (1.92) (0.37)Tax expense 43.73 32.71 - -
118.65 112.88 (1.92) (0.37)Other comprehensive income 8.76 8.50 - - Total comprehensive income for the year
Comprehensive Income for the year)
127.41 121.38 (1.92) (0.37)
Group’s share of profit for the year 39.94 33.74 (0.96) (0.19)
NOTES FORMING PART OF CONSOLIDATED FINANCIAL STATEMENTS
116 2017-18245
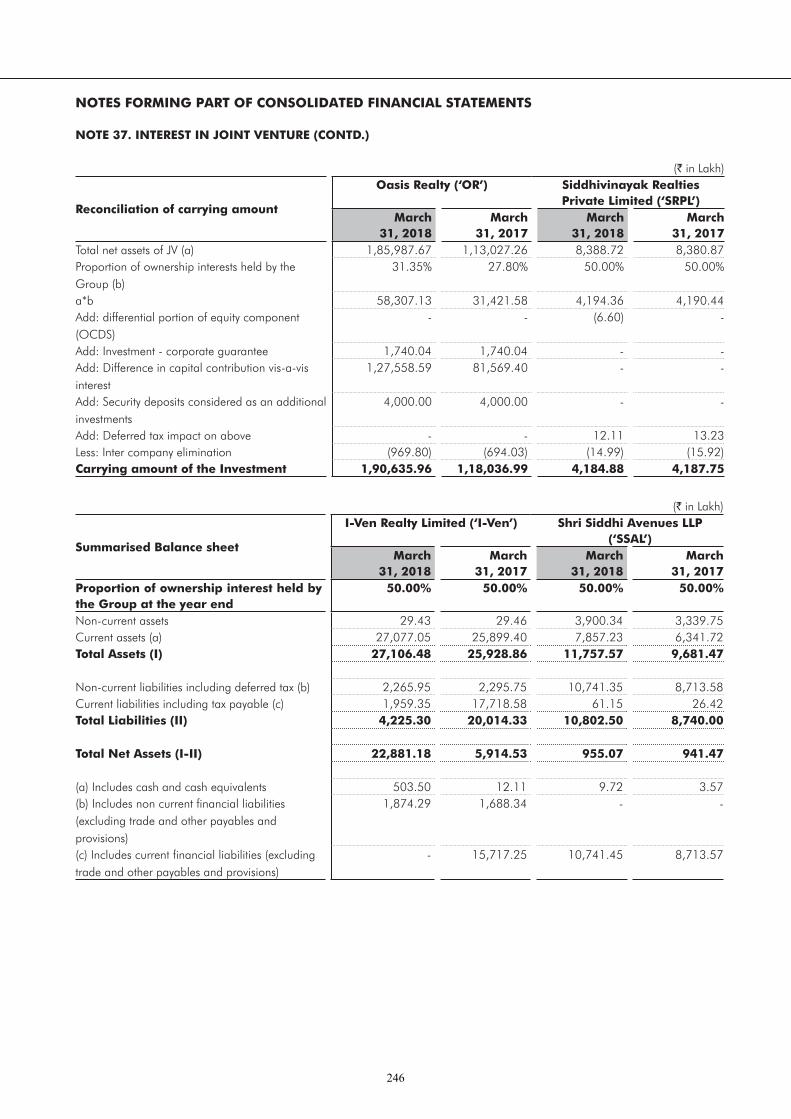
NOTE 37. INTEREST IN JOINT VENTURE (CONTD.)
(` in Lakh)
Reconciliation of carrying amount
Oasis Realty (‘OR’) Siddhivinayak Realties Private Limited (‘SRPL’)
March 31, 2018
March 31, 2017
March 31, 2018
March 31, 2017
Total net assets of JV (a) 1,85,987.67 1,13,027.26 8,388.72 8,380.87 Proportion of ownership interests held by the Group (b)
31.35% 27.80% 50.00% 50.00%
a*b 58,307.13 31,421.58 4,194.36 4,190.44 Add: differential portion of equity component (OCDS)
- - (6.60) -
Add: Investment - corporate guarantee 1,740.04 1,740.04 - - Add: Difference in capital contribution vis-a-vis interest
1,27,558.59 81,569.40 - -
Add: Security deposits considered as an additional investments
4,000.00 4,000.00 - -
Add: Deferred tax impact on above - - 12.11 13.23 Less: Inter company elimination (969.80) (694.03) (14.99) (15.92)Carrying amount of the Investment 1,90,635.96 1,18,036.99 4,184.88 4,187.75
(` in Lakh)
Summarised Balance sheet
I-Ven Realty Limited (‘I-Ven’) Shri Siddhi Avenues LLP (‘SSAL’)
March 31, 2018
March 31, 2017
March 31, 2018
March 31, 2017
Proportion of ownership interest held by the Group at the year end
50.00% 50.00% 50.00% 50.00%
Non-current assets 29.43 29.46 3,900.34 3,339.75 Current assets (a) 27,077.05 25,899.40 7,857.23 6,341.72 Total Assets (I) 27,106.48 25,928.86 11,757.57 9,681.47
Non-current liabilities including deferred tax (b) 2,265.95 2,295.75 10,741.35 8,713.58 Current liabilities including tax payable (c) 1,959.35 17,718.58 61.15 26.42 Total Liabilities (II) 4,225.30 20,014.33 10,802.50 8,740.00
Total Net Assets (I-II) 22,881.18 5,914.53 955.07 941.47
(a) Includes cash and cash equivalents 503.50 12.11 9.72 3.57 (b) Includes non current financial liabilities (excluding trade and other payables and provisions)
1,874.29 1,688.34 - -
(c) Includes current financial liabilities (excluding trade and other payables and provisions)
- 15,717.25 10,741.45 8,713.57
NOTES FORMING PART OF CONSOLIDATED FINANCIAL STATEMENTS
2017-18 117246

NOTE 37. INTEREST IN JOINT VENTURE (CONTD.)
(` in Lakh)I-Ven Realty Limited (‘I-Ven’) Shri Siddhi Avenues LLP
(‘SSAL’)March
31, 2018March
31, 2017March
31, 2018March
31, 2017Revenue 42.15 1.28 634.12 554.54 Other expenses (10.90) (1.38) (0.75) (0.48)Depreciation and amortisation - - (0.66) (0.01)Finance cost - - (613.05) (545.93)
31.25 (0.10) 19.66 8.12 Tax expense 8.35 (0.03) 6.07 2.61
22.90 (0.07) 13.59 5.51 Other comprehensive income - - - - Total comprehensive income for the year
Comprehensive Income for the year)
22.90 (0.07) 13.59 5.51
Group’s share of profit for the year 11.45 (0.04) 6.80 2.76
(` in Lakh)
Reconciliation of carrying amount
I-Ven Realty Limited (‘I-Ven’) Shri Siddhi Avenues LLP (‘SSAL’)
March 31, 2018
March 31, 2017
March 31, 2018
March 31, 2017
Total net assets of JV (a) 22,881.18 5,914.53 955.07 941.47 Proportion of ownership interests held by the Group (b)
50.00% 50.00% 50.00% 50.00%
a*b 11,440.59 2,957.27 477.54 470.74 Add: Adjustment to share of profit in retained earnings
- - (0.14) (0.05)
Add / (Less): Goodwill / (Capital reserve) 25,487.06 25,487.06 - - Add: Differential portion of equity component (NCPS)
652.25 652.25 - -
Add: Difference in capital contribution vis-a-vis interest
- - 528.05 528.05
Add: Deferred tax impact on above 1,610.92 1,666.65 - - Add: Perpetual bond (8,415.88) - - - Less: Inter company elimination (1,720.31) (1,586.43) (784.60) (326.02)Carrying amount of the Investment 29,054.63 29,176.80 220.85 672.72
NOTES FORMING PART OF CONSOLIDATED FINANCIAL STATEMENTS
118 2017-18247

NOTE 37. INTEREST IN JOINT VENTURE (CONTD.)
(` in Lakh)
Summarised Balance sheet
Saldanha Realty And Infrastructure LLP (‘SRIL’)
Sangam City Township Private Limited (‘SCTPL’)
March 31, 2018
March 31, 2017
March 31, 2018
March 31, 2017
Proportion of ownership interest held by the Group at the year end
50.00% 50.00% 31.67% 31.67%
Non-current assets 0.14 0.45 - - Current assets (a) 3,794.41 3,670.35 16,605.14 15,877.83 Total Assets (I) 3,794.55 3,670.80 16,605.14 15,877.83
Non-current liabilities including deferred tax (b) - - 9,843.04 9,559.43 Current liabilities including tax payable (c) 750.70 729.31 10.92 7.44 Total Liabilities (II) 750.70 729.31 9,853.96 9,566.87
Total Net Assets (I-II) 3,043.85 2,941.49 6,751.18 6,310.96
(a) Includes cash and cash equivalents 73.33 29.75 0.16 0.49 (b) Includes non current financial liabilities (excluding trade and other payables and provisions)
- - 8,521.03 7,621.37
(c) Includes current financial liabilities (excluding trade and other payables and provisions)
- - - -
(` in Lakh)Saldanha Realty And
Infrastructure LLP (‘SRIL’)Sangam City Township
Private Limited (‘SCTPL’)March
31, 2018March
31, 2017March
31, 2018March
31, 2017Revenue - - - - Other expenses (0.25) (0.35) (0.96) (0.92)Finance cost (0.23) - (0.05) (0.05)
(0.48) (0.35) (1.01) (0.97)Tax expense - - - 0.12
(0.48) (0.35) (1.01) (1.09)Other comprehensive income - - - -Total comprehensive income for the year
Comprehensive Income for the year)
(0.48) (0.35) (1.01) (1.09)
Group’s share of profit for the year (0.24) (0.18) (0.32) (0.35)
NOTES FORMING PART OF CONSOLIDATED FINANCIAL STATEMENTS
2017-18 119248

NOTE 37. INTEREST IN JOINT VENTURE (CONTD.)
(` in Lakh)
Reconciliation of carrying amount
Saldanha Realty And Infrastructure LLP (‘SRIL’)
Sangam City Township Private Limited (‘SCTPL’)
March 31, 2018
March 31, 2017
March 31, 2018
March 31, 2017
Total net assets of JV (a) 3,043.85 2,941.49 6,751.18 6,310.96 Proportion of ownership interests held by the Group (b)
50.00% 50.00% 31.67% 31.67%
a*b 1,521.93 1,470.75 2,137.88 1,998.47 Add / (Less): Adjustment to share of profit in retained earnings
- - (0.34) (0.34)
Add / (Less): Goodwill / (Capital reserve) 0.79 0.79 - - Add: Grossing up of capital contribution - - 2,255.77 2,255.77 Add: Deferred tax impact on above - - (1,064.74) (925.01)Add: Difference in capital contribution vis-a-vis interest
3,131.06 3,100.40 - -
Less: Inter company elimination - - (666.75) (563.65)Carrying amount of the Investment 4,653.78 4,571.94 2,661.82 2,765.24
(` in Lakh)
Summarised Balance sheet
Metropark Infratech And Realty Developments Private Limited
(‘MIRD’)
Schematic Estate LLP (‘SELLP’)
March 31, 2018
March 31, 2017
March 31, 2018
March 31, 2017
Proportion of ownership interest held by the Group at the year end
33.00% 33.00% 0.10% 0.10%
Non-current assets 471.30 433.35 - - Current assets (a) 540.73 521.33 516.89 517.49 Total Assets (I) 1,012.03 954.68 516.89 517.49
Non-current liabilities including deferred tax (b) 3.16 11.78 - - Current liabilities including tax payable (c) 732.47 675.76 0.18 5.59 Total Liabilities (II) 735.63 687.54 0.18 5.59
Total Net assets (I-II) 276.40 267.14 516.71 511.90
(a) Includes cash and cash equivalents 1.76 9.50 1.91 2.51 (b) Includes non current financial liabilities (excluding trade and other payables and provisions)
- - - -
(c) Includes current financial liabilities (excluding trade and other payables and provisions)
732.44 669.04 - -
NOTES FORMING PART OF CONSOLIDATED FINANCIAL STATEMENTS
120 2017-18249

NOTE 37. INTEREST IN JOINT VENTURE (CONTD.)
(` in Lakh)Metropark Infratech And Realty Developments Private Limited
(‘MIRD’)
Schematic Estate LLP (‘SELLP’)
March 31, 2018
March 31, 2017
March 31, 2018
March 31, 2017
Revenue 0.02 32.46 - - Other expenses (0.51) (0.15) (0.18) (0.10)Finance cost (0.01) - 0.00 -
(0.50) 32.31 (0.18) (0.10)Tax expense - 6.63 - -
(0.50) 25.68 (0.18) (0.10)Other comprehensive income - - - -Total comprehensive income for the year
Comprehensive Income for the year)
(0.50) 25.68 (0.18) (0.10)
Group’s share of profit for the year (0.17) 8.47 (0.00) (0.00)
(` in Lakh)
Reconciliation of carrying amount
Metropark Infratech And Realty Developments Private Limited
(‘MIRD’)
Schematic Estate LLP (‘SELLP’)
March 31, 2018
March 31, 2017
March 31, 2018
March 31, 2017
Total net assets of JV (a) 276.40 267.14 516.71 511.90 Proportion of ownership interests held by the Group (b)
33.00% 33.00% 0.10% 0.10%
a*b 91.21 88.16 0.52 0.51 Add: Difference in capital contribution vis-à-vis interest
- - (0.52) (0.51)
Add / (Less): Goodwill / (Capital reserve) (0.00) (0.00) - - Add: Grossing up of capital contribution 57.22 51.22 - - Add: Deferred tax impact on above 30.01 33.27 - - Less: Inter company elimination (34.08) (23.54) - - Carrying amount of the Investment 144.36 149.11 - -
NOTES FORMING PART OF CONSOLIDATED FINANCIAL STATEMENTS
2017-18 121250

NO
TE 3
8. R
ELA
TED
PA
RTY
DIS
CLO
SUR
ES
A.
Na
me o
f re
late
d p
art
ies
an
d r
ela
ted
pa
rty
rela
tion
ship
i)
Rela
ted
pa
rtie
s w
ith
wh
om
tra
nsa
ctio
ns
ha
ve t
aken
pla
ce d
uri
ng
th
e y
ea
r
Join
t ven
ture
s Sa
ngam
City
Tow
nshi
p Pr
ivat
e Li
mite
d
Zaco
Avi
atio
n O
asis
Rea
lty
I-Ven
Rea
lty L
imite
d Sa
ldan
ha R
ealty
and
Infra
stru
ctur
e LL
P Ai
on R
ealty
LLP
M
etro
park
Infra
tech
And
Rea
lty D
evel
opm
ents
Priv
ate
Lim
ited
Shri
Sidd
hi A
venu
es L
LP
Sche
mat
ic E
stat
e LL
P Si
ddhi
vina
yak
Real
ties
Priv
ate
Lim
ited
Key
man
agem
ent
pers
onne
l and
thei
r re
lativ
es
Vika
s O
bero
i Bi
ndu
Obe
roi
Sant
osh
Obe
roi
Gay
atri
Obe
roi
Saum
il D
aru
Dar
sha
Dar
u An
il H
aris
h Ka
ram
jit S
ingh
Kal
si
Tilo
kcha
nd P
Ost
wal
Ve
nkat
esh
Mys
ore
Bher
ulal
Cho
udha
ry
Entit
ies
whe
re k
ey
man
agem
ent p
erso
nnel
ha
ve s
igni
fican
t inf
luen
ce
R S
Esta
te D
evel
oper
s Pr
ivat
e Li
mite
d O
bero
i Fou
ndat
ion
R. S
. V. A
ssoc
iate
s Aq
uila
Rea
lty P
rivat
e Lt
d N
eo R
ealty
Priv
ate
Lim
ited
NO
TES
FOR
MIN
G P
AR
T O
F C
ON
SOLI
DA
TED
FIN
AN
CIA
L ST
ATE
MEN
TS
122 2017-18251

NO
TE 3
8. R
ELA
TED
PA
RTY
DIS
CLO
SUR
ES (
CO
NTD
.)
B.
Rela
ted
pa
rty
tra
nsa
ctio
ns
(` in
Lak
h)
Na
ture
of
tra
nsa
ctio
nN
am
e
Join
t ve
ntu
res
Key
ma
na
gem
en
t p
ers
on
nel
an
d t
heir
rela
tive
sEn
titi
es
wh
ere
key
ma
na
gem
en
t p
ers
on
nel h
ave
Ma
rch
31, 2018
Ma
rch
31, 2017
Ma
rch
31, 2018
Ma
rch
31, 2017
Ma
rch
31, 2018
Ma
rch
31, 2017
Amou
nt r
ecei
ved
on b
ehal
f of
Oas
is R
ealty
-
0.1
1 -
-
-
-
O
bero
i Fou
ndat
ion
-
-
-
-
-
0.2
6
Cur
rent
cap
ital c
ontri
butio
n ac
coun
t -
paid
Sald
anha
Rea
lty a
nd In
frast
ruct
ure
LLP
82.
07
113
.70
-
-
-
-
Oas
is R
ealty
73,
200.
19
35,
551.
00
-
-
-
-
Cur
rent
cap
ital c
ontri
butio
n ac
coun
t -
rece
ived
bac
kAi
on R
ealty
LLP
-
4.0
2 -
-
-
-
Oas
is R
ealty
367
.19
5,6
50.0
0 -
-
-
-
Com
mis
sion
pai
d to
dire
ctor
Anil
Har
ish
-
-
11.
00
11.
00
-
-
Kara
mjit
Sin
gh K
alsi
-
-
11.
00
11.
00
-
-
T P
Ost
wal
-
-
18.
00
18.
00
-
-
Venk
ates
h M
ysor
e -
-
1
1.00
1
1.00
-
-
Cor
pora
te g
uara
ntee
giv
enO
asis
Rea
lty -
3
,680
.63
-
-
-
-
Dire
ctor
sitt
ing
fees
Anil
Har
ish
-
-
4.0
0 4
.00
-
-
Bher
ulal
Cho
udha
ry -
-
0
.68
2.0
5 -
-
Ka
ram
jit S
ingh
Kal
si -
-
0
.50
1.0
0 -
-
T
P O
stw
al -
-
1
0.35
1
0.95
-
-
Ve
nkat
esh
Mys
ore
-
-
4.8
5 6
.10
-
-
Dep
osit
give
nZa
co A
viat
ion
-
3.0
5 -
-
-
-
Dep
osit
rece
ived
Obe
roi F
ound
atio
n -
-
-
-
3
,172
.00
16.
50
Div
iden
d pa
idBi
ndu
Obe
roi
-
-
0.0
0 -
-
-
G
ayat
ri O
bero
i -
-
0
.00
-
-
-
R S
Esta
te D
evel
oper
s Pr
ivat
e Li
mite
d -
-
-
-
6
66.0
0 -
Sa
ntos
h O
bero
i -
-
0
.02
-
-
-
Vika
s O
bero
i -
-
4
,257
.47
-
-
-
Saum
il D
aru
-
-
0.9
5 -
-
-
D
arsh
a D
aru
-
-
0.0
1 -
-
-
NO
TES
FOR
MIN
G P
AR
T O
F C
ON
SOLI
DA
TED
FIN
AN
CIA
L ST
ATE
MEN
TS
2017-18 123252

NO
TES
FOR
MIN
G P
AR
T O
F C
ON
SOLI
DA
TED
FIN
AN
CIA
L ST
ATE
MEN
TS
NO
TE 3
8. R
ELA
TED
PA
RTY
DIS
CLO
SUR
ES (
CO
NTD
.)
B.
Rela
ted
pa
rty
tra
nsa
ctio
ns
(Con
td.)
(`
in L
akh)
Na
ture
of
tra
nsa
ctio
nN
am
e
Join
t ve
ntu
res
Key
ma
na
gem
en
t p
ers
on
nel
an
d t
heir
rela
tive
sEn
titi
es
wh
ere
key
ma
na
gem
en
t p
ers
on
nel h
ave
Ma
rch
31, 2018
Ma
rch
31, 2017
Ma
rch
31, 2018
Ma
rch
31, 2017
Ma
rch
31, 2018
Ma
rch
31, 2017
Inte
rest
on
loan
( m
easu
red
at
amor
tised
cos
t)Sa
ngam
City
Tow
nshi
p Pr
ivat
e Li
mite
d 2
22.4
8 1
37.6
5 -
-
-
-
Met
ropa
rk In
frate
ch A
nd R
ealty
D
evel
opm
ents
Priv
ate
Lim
ited
21.
41
3.3
7 -
-
-
-
Shri
Sidd
hi A
venu
es L
LP 1
,530
.20
591
.88
-
-
-
-
Inte
rest
on
pref
eren
ce s
hare
sI-V
en R
ealty
Lim
ited
32.
37
29.
34
-
-
-
-
Inte
rest
on
OC
D (m
easu
red
at
amor
tised
cos
t)I-V
en R
ealty
Lim
ited
101
.51
184
.16
-
-
-
-
Sidd
hivi
naya
k Re
altie
s Pr
ivat
e Li
mite
d -
3
.04
-
-
-
-
Inte
rest
inco
me
on O
CD
(mea
sure
d at
am
ortis
ed c
ost)
Sidd
hivi
naya
k Re
altie
s Pr
ivat
e Li
mite
d 0
.93
-
-
-
-
-
Equi
ty c
ompo
nent
of i
nter
est f
ree
loan
Met
ropa
rk In
frate
ch A
nd R
ealty
D
evel
opm
ents
Priv
ate
Lim
ited
5.9
6 -
-
-
-
-
Loan
giv
enM
etro
park
Infra
tech
And
Rea
lty
Dev
elop
men
ts P
rivat
e Li
mite
d 3
7.40
1
4.35
-
-
-
-
Shri
Sidd
hi A
venu
es L
LP 6
50.7
0 5
,053
.00
-
-
-
-
Loan
rep
aid
Vika
s O
bero
i -
-
-
1
,800
.00
-
-
Inve
stm
ent i
n de
bent
ures
I-Ven
Rea
lty L
imite
d 1
8.00
5
79.0
0 -
-
-
-
S
iddh
ivin
ayak
Rea
lties
Priv
ate
Lim
ited
38.
00
34.
70
-
-
-
-
Reco
very
of e
xpen
ses
Neo
Rea
lty P
rivat
e Li
mite
d -
-
-
-
0
.19
0.1
1 O
asis
Rea
lty 2
68.3
9 2
27.8
9 -
-
-
-
O
bero
i Fou
ndat
ion
-
-
-
-
1.4
6 1
.26
Rede
mpt
ion
of d
eben
ture
sI-V
en R
ealty
Lim
ited
8,0
79.3
8 -
-
-
-
-
Subs
crip
tion
of p
erpe
tual
bon
dI-V
en R
ealty
Lim
ited
8,4
15.8
8 -
-
-
-
-
Reim
burs
emen
t of e
xpen
ses
Obe
roi F
ound
atio
n -
-
-
-
0
.82
0.5
8 Za
co A
viat
ion
34.
91
52.
87
-
-
-
-
Rem
uner
atio
nBi
ndu
Obe
roi
-
-
80.
00
80.
00
-
-
Vika
s O
bero
i -
-
0
.00
0.0
0 -
-
124 2017-18253

NO
TES
FOR
MIN
G P
AR
T O
F C
ON
SOLI
DA
TED
FIN
AN
CIA
L ST
ATE
MEN
TS
C.
Clo
sin
g b
ala
nce
s of
rela
ted
pa
rtie
s(`
in L
akh)
Na
ture
of
tra
nsa
ctio
nN
am
e
Join
t ve
ntu
res
Key
ma
na
gem
en
t p
ers
on
nel
an
d t
heir
rela
tive
sEn
titi
es
wh
ere
key
ma
na
gem
en
t p
ers
on
nel
Ma
rch
31, 2018
Ma
rch
31, 2017
Ma
rch
31, 2018
Ma
rch
31, 2017
Ma
rch
31, 2018
Ma
rch
31, 2017
Equi
ty c
ompo
nent
of i
nter
est f
ree
loan
Sang
am C
ity T
owns
hip
Priv
ate
Lim
ited
3,3
01.1
3 3
,301
.13
-
-
-
-
Met
ropa
rk In
frate
ch A
nd R
ealty
D
evel
opm
ents
Priv
ate
Lim
ited
115
.41
109
.45
-
-
-
-
Equi
ty c
ompo
nent
of o
ptio
nally
co
nver
tible
deb
entu
re in
clud
ed in
co
st o
f inv
estm
ent
I-Ven
Rea
lty L
imite
d 3
,115
.26
3,1
15.2
6 -
-
-
-
Si
ddhi
vina
yak
Real
ties
Priv
ate
Lim
ited
46.
59
42.
82
-
-
-
-
Equi
ty c
ompo
nent
of p
refe
renc
e sh
ares
I-Ven
Rea
lty L
imite
d 1
,071
.75
1,0
71.7
5 -
-
-
-
NO
TE 3
8. R
ELA
TED
PA
RTY
DIS
CLO
SUR
ES (
CO
NTD
.)
B.
Rela
ted
pa
rty
tra
nsa
ctio
ns
(Con
td.)
(` in
Lak
h)
Na
ture
of
tra
nsa
ctio
nN
am
e
Join
t ve
ntu
res
Key
ma
na
gem
en
t p
ers
on
nel
an
d t
heir
rela
tive
sEn
titi
es
wh
ere
key
ma
na
gem
en
t p
ers
on
nel h
ave
Ma
rch
31, 2018
Ma
rch
31, 2017
Ma
rch
31, 2018
Ma
rch
31, 2017
Ma
rch
31, 2018
Ma
rch
31, 2017
Saum
il D
aru
-
-
628
.36
696
.42
-
-
Rent
rec
eive
dN
eo R
ealty
Priv
ate
Lim
ited
-
-
-
-
0.1
2 0
.12
Obe
roi F
ound
atio
n -
-
-
-
3
,847
.66
2,8
61.2
1 Aq
uila
Rea
lty P
rivat
e Li
mite
d -
-
-
-
0
.58
-
Sale
of a
sset
sI-V
en R
ealty
Lim
ited
-
0.5
0 -
-
-
-
O
asis
Rea
lty 1
.18
-
-
-
-
-
Shri
Sidd
hi A
venu
es L
LP 2
.30
-
-
-
-
-
Purc
hase
of m
ater
ials
Oas
is R
ealty
-
1.3
0 -
-
-
-
Sale
of m
ater
ials
Oas
is R
ealty
6
.15
-
-
-
-
-
Sale
of u
nits
(sla
b de
man
d)R.
S. V
. Ass
ocia
tes
-
-
-
-
75.
87
168
.25
Oas
is R
ealty
20.
69
-
-
-
-
-
2017-18 125254

NO
TES
FOR
MIN
G P
AR
T O
F C
ON
SOLI
DA
TED
FIN
AN
CIA
L ST
ATE
MEN
TS
C.
Clo
sin
g b
ala
nce
s of
rela
ted
pa
rtie
s (C
on
td.)
(` in
Lak
h)
Na
ture
of
tra
nsa
ctio
nN
am
e
Join
t ve
ntu
res
Key
ma
na
gem
en
t p
ers
on
nel
an
d t
heir
rela
tive
sEn
titi
es
wh
ere
key
ma
na
gem
en
t p
ers
on
nel
Ma
rch
31, 2018
Ma
rch
31, 2017
Ma
rch
31, 2018
Ma
rch
31, 2017
Ma
rch
31, 2018
Ma
rch
31, 2017
Inve
stm
ent i
n op
tiona
lly
conv
ertib
le d
eben
ture
(mea
sure
d at
am
ortis
ed c
ost)
Sidd
hivi
naya
k Re
altie
s Pr
ivat
e Li
mite
d 1
79.0
0 1
40.0
4 -
-
-
-
I-V
en R
ealty
Lim
ited
-
7,8
58.6
1 -
-
-
-
Loan
giv
enSa
ngam
City
Tow
nshi
p Pr
ivat
e Li
mite
d 3
,444
.39
3,1
18.8
1 -
-
-
-
Met
ropa
rk In
frate
ch A
nd R
ealty
D
evel
opm
ents
Priv
ate
Lim
ited
439
.61
376
.22
-
-
-
-
Shri
Sidd
hi A
venu
es L
LP 1
0,74
1.45
8
,713
.57
-
-
-
-
Cur
rent
cap
ital c
ontri
butio
nSa
ldan
ha R
ealty
and
Infra
stru
ctur
e LL
P 4
,656
.83
4,5
74.7
6 -
-
-
-
Oas
is R
ealty
1,8
9,72
9.02
1
,14,
636.
50
-
-
-
-
Subs
crip
tion
of p
erpe
tual
bon
dI-V
en R
ealty
Lim
ited
8,4
15.8
8 -
-
-
-
-
Loan
rec
eive
dVi
kas
Obe
roi
-
-
8,9
08.0
0 8
,908
.00
-
-
Dep
osit
rece
ived
Obe
roi F
ound
atio
n -
-
-
-
3
,972
.00
816
.50
Cor
pora
te g
uara
ntee
giv
enO
asis
Rea
lty 6
,600
.00
55,
238.
65
-
-
-
-
Reim
burs
emen
t of
expe
nses
Zaco
Avi
atio
n 7
.37
4.1
1 -
-
-
-
Reco
very
of e
xpen
ses
Neo
Rea
lty P
rivat
e Li
mite
d -
-
-
-
0
.11
0.0
7
Expe
nses
tow
ards
gra
tuity
and
leav
e en
cash
men
t pro
visi
ons
are
dete
rmin
ed a
ctua
rially
on
an o
vera
ll G
roup
bas
is a
t the
end
of e
ach
year
and
acc
ordi
ngly
hav
e no
t bee
n co
nsid
ered
in
the
abov
e in
form
atio
n of
Ms.
Bin
du O
bero
i and
Mr.
Saum
il D
aru.
NO
TE 3
8. R
ELA
TED
PA
RTY
DIS
CLO
SUR
ES (
CO
NTD
.)
126 2017-18255

NOTE 39. SEGMENT INFORMATION
For management purposes, the Group is organised into business units based on its services and has two reportable segments, as follows:
1. The Real Estate segment which develops and sells residential properties and lease commercial properties
2. The Hospitality segment which is into the business of managing the hotel.
(` in Lakh)
ParticularsMarch 31, 2018 March 31, 2017
Real estate
Hospitality Total Real estate
Hospitality Total
Segment revenue 1,13,675.37 12,867.53 1,26,542.90 98,699.85 12,674.54 1,11,374.39 Segment result 61,011.27 2,438.09 63,449.36 50,229.33 2,409.53 52,638.86 Unallocated income net of unallocated expenses
(150.83) 406.20
63,298.53 53,045.06 Less: Interest and finance charges (686.31) (557.22)Add: Interest income 1,978.37 3,741.85
(net) and exceptional items
64,590.59 56,229.69
Share of Profit / (Loss)of joint ventures (net)
361.97 - 361.97 313.93 - 313.93
64,952.56 56,543.62 Provision for tax (19,072.24) (18,684.86)
45,880.32 37,858.76
Other information Segment assets 7,37,554.44 20,822.54 7,58,376.98 6,03,299.12 23,548.12 6,26,847.24 Unallocated corporate assets (B) 2,64,095.72 2,21,699.95 Total assets 10,22,472.70 8,48,547.19 Segment liabilities 4,05,839.81 3,306.03 4,09,145.84 2,69,924.58 2,891.15 2,72,815.73 Unallocated corporate liabilities (B) 4,089.49 3,135.39 Total liabilities 4,13,235.33 2,75,951.12 Capital expenditure for the year (net of transfers)
7,352.31 35.44 7,387.75 7,770.93 - 7,770.93
Unallocated capital expenditure for the year
199.80 2,13,333.00
Depreciation for the year 2,666.63 1,793.24 4,459.87 2,519.80 1,990.64 4,510.44 Unallocated depreciation for the year
446.89 439.10
Notes:
A. Based on the “management approach” as defined in Ind AS 108 – Operating Segments, the Chairman and Managing Director / Chief Financial Officer evaluates the Group’s performance based on an analysis of various performance indicators by business segment. Accordingly information has been presented along these segments. The accounting principles used in the preparation of the financial statement are consistently applied in individual segment to prepare segment reporting.
B. Unallocated Corporate Assets includes temporary surplus and Unallocated Corporate Liabilities includes deferred tax liabilities. Income earned on temporary investment of the same has been shown in ‘Unallocable Income net of Unallocable Expenditure’.
NOTES FORMING PART OF CONSOLIDATED FINANCIAL STATEMENTS
2017-18 127256

NOTE 40. LEASES
The lease expense for cancellable and non-cancellable operating leases was ` 29.00 lakh (` 19.99 lakh) for the year ended March 31, 2018.
(` in Lakh)Assets taken on operating lease March 31, 2018 March 31, 2017
Future minimum lease payments under non-cancellable operating lease :Not later than one year - 9.39 Later than one year and not later than five years - - Later than five years - -
NOTE 41. CONTINGENT LIABILITIES, CAPITAL COMMITMENTS AND OTHER COMMITMENTS
(` in Lakh)A. Summary details of contingent liabilities (to the extent not
provided for)March 31, 2018 March 31, 2017
1. Corporate guarantee given 6,600.00 55,238.65 2. MVAT matters in dispute 242.42 228.063. Income-tax matters in dispute 920.81 2,917.92 4. Service tax matters in dispute 928.47 1,249.48
B. Capital Commitmentsa) Capital contracts (net of advances) 2,014.88 4,257.39 b) Capital commitment to joint venture (net of advances) 13,703.00 13,703.00
C. Other Litigations
A. The Group is subject to legal proceedings and claims, which have arisen in the ordinary course of business, the impact of which is not quantifiable. These cases are pending with various courts. After considering the circumstances and legal advice received, management believes that these cases will not adversely affect its financial statements.
B. The sales tax department of the government of Maharashtra has completed the VAT assessments w.r.t. the returns filed by the Group on the sale of flats to the customers during the period beginning from June 2006 till March 2012 and determined the VAT and interest liability. For some of the years, the Group has challenged the assessment order and opted for appeal, which is pending for hearing. Vide an order of the Hon’ble Supreme Court of India, the recovery of interest amounts in such cases has been stayed. However, the Group has opted to settle and pay interest for some of the years under The Maharashtra Settlement of Arrears in Disputes Act, 2016. Part of the amount has been collected by the Group from the flat purchasers on account of such liability and the Group is reasonably confident of recovering all the outstanding amount on account of VAT from flat purchasers.
NOTES FORMING PART OF CONSOLIDATED FINANCIAL STATEMENTS
128 2017-18257

NOTE 42. FINANCIAL INSTRUMENTS – FAIR VALUES AND RISK MANAGEMENT
The carrying value of financial instruments by categories is as follows:
(` in Lakh)
Particulars
CARRYING VALUEAs at March 31, 2018 As at March 31, 2017
At Cost Fair Value
through
loss
Amotised Cost
At Cost Fair Value
through
loss
Amotised Cost
Financial assets Cash and cash equivalents - - 8,106.02 - - 9,330.53 Other bank balances - - 3,566.29 - - 25,248.16 Trade receivables - - 18,131.39 - - 10,578.83 Loans - - 15,733.63 - - 13,369.84 Investments:
Investment in preference shares
- - 681.43 - - 616.68
Investment in optionally convertible debentures
- - 179.00 - - 7,998.65
Investment in government securities
- - 1.74 - - 0.82
Investment in mutual funds
- 1,170.05 - - 14,253.36 -
Investment in joint ventures
2,39,972.15 - - 1,59,560.55 - -
Other financial assets - - 643.59 - - 841.00 2,39,972.15 1,170.05 47,043.09 1,59,560.55 14,253.36 67,984.51
Financial liabilities Borrowings:
9.25% Redeemable non-convertible debenture
- - 77,997.39 - - 77,956.28
From director - - 8,908.00 - - 8,908.00 Line of credit - - 14,636.66 - - - Term Loan - - 67,864.18 - - -
Trade payables - - 14,543.42 - - 5,346.29 Other financial liabilities - - 30,050.34 - - 21,999.47
- - 2,13,999.99 - - 1,14,210.04
B. Fair values
The table which provides the fair value measurement hierarchy of the Company’s assets and liabilities is as follows:
(` in Lakh)
March 31, 2018CARRYING
VALUEFAIR VALUE
Level 1 Level 2 Level 3Financial assets Loans carried at amortised cost 3,884.01 - 3,790.00 - Investments at cost:
Investment in preference shares 681.43 - 580.00 - Investment in optionally convertible debentures 179.00 - 172.00 -
Investments at fair value through profit or loss:Investment in mutual funds 1,170.05 - 1,170.05 -
5,914.49 - 5,712.05 -
NOTES FORMING PART OF CONSOLIDATED FINANCIAL STATEMENTS
2017-18 129258

NOTE 42. FINANCIAL INSTRUMENTS – FAIR VALUES AND RISK MANAGEMENT (CONTD.)
Financial liabilities at amotised cost Borrowings:
9.25% Redeemable non-convertible debenture 77,997.39 - 79,062.00 - Line of credit 14,636.66 - 14,401.00 - Term Loan 67,864.18 - 67,090.00 -
Other financial liabilities 22,573.22 - 19,926.93 - 1,83,071.45 - 1,80,479.93 -
(` in Lakh)
March 31, 2017CARRYING
VALUEFAIR VALUE
Level 1 Level 2 Level 3Financial assets Loans carried at amortised cost 3,495.03 - 3,330.00 - Investments at cost:
Investment in preference shares 616.68 - 553.11 -Investment in optionally convertible debentures 7,998.65 - 7,994.98 -
Investments at fair value through profit or loss:Investment in mutual funds 14,253.36 - 14,253.36 -
26,363.72 - 26,131.45 -
Financial liabilities at amotised cost Borrowings:
9.25% Redeemable non-convertible debenture 77,956.28 - 78,351.96 -Other financial liabilities 17,870.82 - 16,082.58 -
95,827.10 - 94,434.54 - The management assessed that carrying amount of cash and cash equivalents, trade receivables, loans, investment in government securities, unsecured borrowings, trade payable and other financial liabilities approximate their fair values largely due to the short-term maturities of these instruments.
C. Measurement of fair values
The table which shows the valuation techniques used in measuring Level 2 and Level 3 fair values, as well as the significant unobservable inputs used is as follows:
Financial instruments measured at fair value
Type Valuation technique
unobservable inputs
Range
Sensitivity of the input to fair
value
Change in discount rate by 500 basis points would increase / (decrease) as
below (` in Lakh)Financial Assets:- Investment in optionally convertible debentures
Discounted cash flow technique- The fair value is estimated considering net present value calculated using discount rates derived from quoted prices of similar instruments with similar maturity and credit rating that are traded in active markets, adjusted by an illiquidity factor
Discount rate
10.3% 9 / (9)
- Investment in preference shares
13% 30 / (30)
- Loans 10.3% and 10.9% 190 / (190)
Financial Liabilities:- Non convertible debentures
Discounted cash flow technique- The fair value is estimated considering net present value calculated using discount rates derived from quoted prices of similar instruments with similar maturity and credit rating that are traded in active markets, adjusted by an illiquidity factor
Discount rate
8.3% to 8.6% 3,954 / (3,954)
- Trade deposits 10.6% 440 / (440)- Corporate guarantee 10.6% 10 / (10)- Line of credit 10.9% 10 / (10)
- Term loan 11.2% 3,350 / (3,350)
NOTES FORMING PART OF CONSOLIDATED FINANCIAL STATEMENTS
130 2017-18259

NOTE 42. FINANCIAL INSTRUMENTS – FAIR VALUES AND RISK MANAGEMENT (CONTD.)
Transfers between Levels 1 and 2
There have been no transfers between Level 1 and Level 2 during the respective period presented above.
D. Financial risk management
The Company has exposure to the following risks arising from financial instruments:
Credit risk ;
Liquidity risk ; and
Market risk
Risk management framework
The Company’s board of directors has overall responsibility for the establishment and oversight of the Company’s risk management framework. The board of directors has established the Risk Management Committee, which is responsible for developing and monitoring the Company’s risk management policies. The committee reports regularly to the board of directors on its activities.
The Company’s risk management policies are established to identify and analyse the risks faced by the Company, to set appropriate risk limits and controls and to monitor risks and adherence to limits. Risk management policies and systems are reviewed regularly to reflect changes in market conditions and the Company’s activities. The Company, through its training and management standards and procedures, aims to maintain a disciplined and constructive control environment in which all employees understand their roles and obligations.
i. Credit risk
Credit risk is the risk of financial loss to the Company if a customer or counterparty to a financial instrument fails to meet its contractual obligations, and arises principally from the Company’s receivables from customers and investments in debt securities.
The carrying amount of the financial assets which represents the maximum credit exposure is as follows:
Trade and other receivables
The Group’s exposure to credit risk is influenced mainly by the individual characteristics of each customer. However credit risk with regards to trade receivable is almost negligible in case of its residential sale and lease rental business as the same is done to the fact that in case of its residential sell business it does not handover possession till entire outstanding is received. Similarly in case of lease rental business, the group keep 3 to 12 months rental as deposit from the occupants.
No impairment is observed on the carrying value of trade receivable.
Investment in debt securities
The Group has investment only in redeemable optionally convertible debentures and the settlement of such instruments is linked to the completion of the respective underlying projects. No impairment has been recognised on such investments till date.
Cash and cash equivalents
Credit risk from balances with banks and financial institutions is managed by the Company’s treasury department in accordance with the Company’s policy. Investments of surplus funds are made only with approved counterparties and within credit limits assigned to each counterparty. Counterparty credit limits are reviewed by the Company’s Investment Committee comprising of Mr. Venkatesh Mysore (Chairperson), Mr. Anil Harish, Mr. T.P. Ostwal (Independent Directors) and Mr. Vikas Oberoi (Non-Independent Director) on an annual basis, and may be updated throughout the year subject to approval of the Company’s Investment Committee. The limits are set to minimise the concentration of risks and therefore mitigate financial loss through counterparty’s potential failure to make payments.
NOTES FORMING PART OF CONSOLIDATED FINANCIAL STATEMENTS
2017-18 131260

NOTE 42. FINANCIAL INSTRUMENTS – FAIR VALUES AND RISK MANAGEMENT (CONTD.)
ii. Liquidity risk
Liquidity risk is the risk that the Group will encounter difficulty in meeting the obligations associated with its financial liabilities that are settled by delivering cash or another financial asset. The Group’s approach to managing liquidity is to ensure as far as possible that it will have sufficient liquidity to meet its liabilities when they are due, under both normal and stressed condition, without incurring unacceptable losses or risking damage to the Group’s reputation.
The Group’s objective is to maintain a balance between continuity of funding and flexibility through the use of surplus funds, bank overdrafts, bank loans, debentures and inter-corporate loans.
The Group assessed the concentration of risk with respect to refinancing its debt and concluded it to be low. The Group has access to a sufficient variety of sources of funding.
Exposure to liquidity risk
The following are the remaining contractual maturities of financial liabilities at the reporting date. The amounts are gross and undiscounted, and include estimated interest payments and exclude the impact of netting agreements.
(` in Lakh)
March 31, 2018
CONTRACTUAL CASH FLOWSCarrying amount
Within 1 Year
1-2 years 2-5 years More than 5 years
Borrowings:9.25% Redeemable non-convertible debenture
77,997.39 3,041.10 24,992.50 49,963.79 -
Line of credit 14,636.66 - - 14,636.66 Term Loan 67,864.18 - - 67,864.18
Loans from related parties 8,908.00 8,908.00 - - - Trade payables 14,543.42 13,079.89 1,463.53 - - Other financial liabilities 30,050.34 21,599.31 8,451.03 - -
2,13,999.99 46,628.30 34,907.06 1,32,464.63 -
(` in Lakh)
March 31, 2017
CONTRACTUAL CASH FLOWSCarrying amount
Within 1 Year
1-2 years 2-5 years More than 5 years
Borrowings:9.25% Redeemable non-convertible debenture
77,956.28 3,018.51 - 74,937.77 -
Loans from related parties 8,908.00 8,908.00 - - - Trade payables 5,346.29 4,686.88 659.41 - - Other financial liabilities 21,999.47 15,594.96 6,404.51 - -
1,14,210.04 32,208.35 7,063.92 74,937.77 -
iii. Market risk
Market risk is the risk that changes in market prices – such as foreign exchange rates, interest rates and equity prices – will affect the Company’s income or the value of its holdings of financial instruments. Market risk is attributable to all market risk sensitive financial instruments including foreign currency receivables and payables and long term debt. We are exposed to market risk primarily related to foreign exchange rate risk, interest rate risk and the market value of certain commodities. Thus, our exposure to market risk is a function of investing and borrowing activities and revenue generating and operating activities. The objective of market risk management is to avoid excessive exposure in our revenues and costs
Currency risk
Foreign currency risk is the risk that the fair value or future cash flows of an exposure will fluctuate because of changes in foreign exchange rates. The Company’s exposure to the risk of changes in foreign exchange rates relates primarily to the Group’s operating activities (when expense is denominated in a foreign currency).
The Company closely tracks and observes the movement of foreign currency with regards to INR and also forward cover rate. The Company decides to cover or keep the foreign currency exposure open based on the above.
NOTES FORMING PART OF CONSOLIDATED FINANCIAL STATEMENTS
132 2017-18261

NOTE 42. FINANCIAL INSTRUMENTS – FAIR VALUES AND RISK MANAGEMENT (CONTD.)
Exposure to currency risk
The currency profile of financial assets and financial liabilities is as follows:
(` in Lakh)
ParticularsMarch
31, 2018March
31, 2018March
31, 2018March
31, 2018USD SGD Euro Total
Financial liabilities Trade payables 252.88 - - 252.88
252.88 - - 252.88
(` in Lakh)
ParticularsMarch
31, 2017March
31, 2017March
31, 2017March
31, 2017USD SGD Euro Total
Financial liabilities Trade payables 464.03 1.04 9.90 474.97
464.03 1.04 9.90 474.97
Sensitivity analysis
A reasonably possible strengthening (weakening) of the Indian Rupee against US dollars / EUR / SGD at March 31 would have affected the measurement of financial instruments denominated in US dollars and affected equity and profit or loss by the amounts shown below. This analysis assumes that all other variables, in particular interest rates, remain constant and ignores any impact of forecast sales and purchases.
(` in Lakh)
Effect in INRStrengthening Weakening
March 31, 201810% movement USD 25.29 (25.29)
25.29 (25.29)
(` in Lakh)
Effect in INRStrengthening Weakening
March 31, 201710% movement USD 46.40 (46.40)EURO 0.10 (0.10)SGD 0.99 (0.99)
47.49 (47.49)
Interest rate risk
Interest rate risk can be either fair value interest rate risk or cash flow interest rate risk. Fair value interest rate risk is the risk of changes in fair values of fixed interest bearing investments because of fluctuations in the interest rates. Cash flow interest rate risk is the risk that the future cash flows of floating interest bearing investments will fluctuate because of fluctuations in the interest rates.
NOTES FORMING PART OF CONSOLIDATED FINANCIAL STATEMENTS
2017-18 133262

NOTES FORMING PART OF CONSOLIDATED FINANCIAL STATEMENTS
NOTE 42. FINANCIAL INSTRUMENTS – FAIR VALUES AND RISK MANAGEMENT (CONTD.)
Exposure to interest rate risk
The Group’s interest rate risk arises from borrowings . Borrowings issued at fixed rates exposes to fair value interest rate risk. The interest rate profile of the Group’s interest-bearing financial instruments as reported to the management of the Group is as fo llows.
(` in Lakh)
Particulars March 31, 2018 March 31, 2017
Fixed-rate instrumentsBorrowings 77,997.39 77,956.28 Floating-rate instrumentsBorrowings 82,500.84 -
1,60,498.23 77,956.28
The Company does not account for any fixed-rate financial assets or financial liabilities at fair value through profit or loss. Therefore, a change in interest rates at the reporting date would not affect profit or loss.
The following table demonstrates the sensitivity to a reasonably possible change in interest rates on that portion of loans and borrowings affected. With all other variables held constant, the Group’s profit before tax is affected through the impact on floating rate borrowings, is as follows:
(` in Lakh) Increase/
decrease in basis points
before tax*
March 31, 2018INR - Increase 25 (63.83)INR - Decrease 25 63.83
March 31, 2017
INR - Increase - -
INR - Decrease - -
*Gross without considering inventorisation of borrowing cost.
Commodity price risk
The Group’s activities are exposed to steel and cement price risks and therefore its overall risk management program focuses on the volatile nature of the steel and cement market, thus seeking to minimize potential adverse effects on the Group’s financial performance on account of such volatility.
The risk management committee regularly reviews and monitors risk management principles, policies, and risk management activities.
134 2017-18263

NOTES FORMING PART OF CONSOLIDATED FINANCIAL STATEMENTS
NOTE 42. FINANCIAL INSTRUMENTS – FAIR VALUES AND RISK MANAGEMENT (CONTD.)
E. Capital management
The Group’s policy is to maintain a strong capital base so as to maintain investor, creditor and market confidence and to sustain future development of the business. Management monitors the return on capital as well as the level of dividends to ordinary shareholders.
The Group manages its capital structure and makes adjustments in light of changes in economic conditions and the requirements of the financial covenants. To maintain or adjust the capital structure, the Group may adjust the dividend payment to shareholders, return capital to shareholders or issue new shares. The Group monitors capital using a gearing ratio, which is net debt divided by total capital plus net debt. The Group includes within net debt, interest and non interest bearing loans and borrowings, less cash and cash equivalents, excluding discontinued operations.
The Group’s adjusted net debt to equity ratio is as follows.
(` in Lakh)
Particulars March 31, 2018 March 31, 2017
Total liabilities 1,69,406.23 86,864.28 Less : Cash and cash equivalent 8,106.02 9,330.53
1,61,300.21 77,533.75 Total equity 6,09,237.37 5,72,596.07
6,09,237.37 5,72,596.07 Adjusted net debt to adjusted equity ratio 0.26 0.14
NOTE 43. DISCLOSURE ON SPECIFIED BANK NOTES (SBNS)
During the previous year, the Group had specified bank notes or other denomination note as defined in the MCA notification G.S.R. 308(E) dated March 31, 2017 on the details of Specified Bank Notes (SBN) held and transacted during the period from November 8, 2016 to December, 30 2016, the denomination wise SBNs and other notes as per the notification is given below:
(` in Lakh)
Particulars SBNs* Other denomination
Total
Closing cash in hand as on November 8, 2016 15.88 23.21 39.09 (+) Permitted receipts - 118.18 118.18 (+) Withdrawal - 11.99 11.99 (-) Permitted payments - (28.93) (28.93)(-) Amount deposited in Banks (15.88) (89.82) (105.70)Closing cash in hand as on December 30, 2016 - 34.63 34.63
* For the purposes of this clause, the term ‘Specified Bank Notes’ shall have the same meaning provided in the notification of the Government of India, in the Ministry of Finance, Department of Economic Affairs number S.O. 3407(E), dated the 8th November, 2016.
NOTE 44. OTHER SUPPLEMENTARY INFORMATION
Disclosure in respect of the Guidance Note issued by Institute of Chartered Accountants of India on “Accounting for Real Estate Transactions”.
(` in Lakh)
Particulars March 31, 2018 March 31, 2017
Amount of project revenue recognised as revenue in the reporting period 83,894.65 74,638.27
The Aggregate amount of costs incurred an profits recognised (Less recognised losses) to date for project in progress
6,29,637.59 5,04,200.25
The amount of advance received 763.80 257.45The amount of Work-in-progress and the value of inventories 4,11,585.87 3,60,362.57Excess of revenue recognised over actual bills raised (Unbilled revenue) 7,017.09 -
2017-18 135264

NOTE 45. Previous year figures were audited by Chartered Accountant firm other than S R B C & CO LLP.
NOTE 46. STANDARDS ISSUED BUT NOT YET EFFECTIVE
The amendments to standards that are issued, but not yet effective, up to the date of issuance of the Group’s financial statements are disclosed below. The Group intends to adopt these standards, if applicable, when they become effective.
The Ministry of Corporate Affairs (MCA) has issued the Companies (Indian Accounting Standards) Amendment Rules, 2017 and Companies (Indian Accounting Standards) Amendment Rules, 2018 amending the following standard:
Ind AS 115 Revenue from contracts with customers
Ind AS 115 was issued on 29 March 2018 and establishes a five-step model to account for revenue arising from contracts with customers. Under Ind AS 115, revenue is recognised at an amount that reflects the consideration to which an entity expects to be entitled in exchange for transferring goods or services to a customer.
The new revenue standard will supersede all current revenue recognition requirements under Ind AS and the guidance note of real estate issued by ICAI. Ind AS 115 is applicable to the Group for annual periods beginning on or after April 1, 2018.
Based on the preliminary discussion with legal experts, management believes that the contract satisfies the conditions of Ind AS 115 for recognition of revenue over time. Hence the effects of applying Ind AS 115 on the financial statements will be immaterial.
NOTE 47. Previous year figures have been regrouped, re-arranged and re-classified wherever necessary to conform to current year’s classification.
NOTES FORMING PART OF CONSOLIDATED FINANCIAL STATEMENTS
As per our report of even date For and on behalf of the Board of Directors
For S R B C & CO LLPChartered AccountantsFirm Registration Number 324982E / E300003 Vikas Oberoi T. P. Ostwal
Chairman & Managing Director Directorper Sudhir Soni DIN 00011701 DIN 00821268PartnerMembership No.: 41870 Saumil Daru Bhaskar KshirsagarMumbai, April 24, 2018 Director - Finance cum Chief Financial Officer Company Secretary
DIN 03533268 M No. A19238
136 2017-18265

We have audited the accompanying consolidated Ind AS financial statements of Oberoi Realty Limited (“the Holding Company”), its subsidiaries and its joint arrangements (collectively referred to as “the Company” or “the Group”) which comprise of the consolidated Balance Sheet as at March 31, 2017, the consolidated Statement of Profit and Loss (including other comprehensive income), the consolidated Statement of Cash Flows and the consolidated Statement of Changes in Equity for the year then ended and a summary of the significant accounting policies and other explanatory information (herein after referred to as “the consolidated Ind AS financial statements”).
To the Members of Oberoi Realty Limited
Report on the Consolidated Ind AS Financial Statements
The Holding Company’s Board of Directors is responsible for the preparation of these consolidated Ind AS financial statements in terms of the requirements of the Companies Act, 2013 (hereinafter referred to as “the Act”) that give a true and fair view of the consolidated financial position, consolidated financial performance (including other comprehensive income), consolidated cash flows and consolidated changes in equity of the Group in accordance with the accounting principles generally accepted in India, including the Indian Accounting Standards (Ind AS) prescribed under Section 133 of the Act read with relevant rules issued thereunder. The respective Board of Directors of the companies included in the Group are responsible for maintenance of adequate accounting records in accordance with the provisions of the Act for safeguarding the assets of the Group and for preventing and detecting frauds and other irregularities; the selection and application of appropriate accounting policies; making judgements and estimates that are reasonable and prudent; and the design, implementation and maintenance of adequate internal financial controls, that were operating effectively for ensuring the accuracy and completeness of the accounting records, relevant to the preparation and presentation of the consolidated Ind AS financial statements that give a true and fair view and are free from material misstatement, whether due to fraud or error, which have been used for the purpose of preparation of the consolidated Ind AS financial statements by the Directors of the Holding Company, as aforesaid.
Management’s Responsibility for the Consolidated Ind AS Financial Statements
Our responsibility is to express an opinion on these consolidated Ind AS financial statements based on our audit.
While conducting the audit, we have taken into account the provisions of the Act, the accounting and auditing standards and matters which are required to be included in the audit report under the provisions of the Act and the Rules made there under.
We conducted our audit in accordance with the Standards on Auditing specified under section 143(10) of the Act. Those standards require that we comply with ethical requirements and plan and perform the audit to obtain reasonable assurance about whether the consolidated Ind AS financial statements are free from material misstatement.
An audit involves performing procedures to obtain audit evidence about the amounts and the disclosures in the consolidated Ind AS financial statements. The procedures selected depend on the auditor’s judgement, including the assessment of the risks of material misstatement of the consolidated Ind AS financial statements, whether due to fraud or error. In making those risk assessments, the auditor considers internal financial control relevant to the Holding Company’s preparation of the consolidated Ind AS financial statements that give a true and fair view in order to design audit procedures that are appropriate in the circumstances. An audit also includes evaluating the appropriateness of the accounting policies used and the reasonableness of the accounting estimates made by the Holding Company’s Board of Directors, as well as evaluating the overall presentation of the consolidated Ind AS financial statements.
We believe that the audit evidence obtained by us and the audit evidence obtained by other auditor in terms of their report referred to in Other Matters paragraph below is sufficient and appropriate to provide a basis for our audit opinion on the consolidated Ind AS financial statements.
Auditors’ Responsibility
INDEPENDENT AUDITORS’ REPORT ON CONSOLIDATED IND AS FINANCIAL STATEMENTS
In our opinion and to the best of our information and according to the explanations given to us, and based on the consideration of the other auditor’s report on financial statements of the joint arrangement, the aforesaid consolidated Ind AS financial statements give the information required by the Act in the manner so required and give a true and fair view in conformity with the accounting principles generally accepted in India including the Ind AS, of the consolidated financial
Opinion
2016-178283
266

position of the Group as at March 31, 2017 and its consolidated financial performance (including other comprehensive income), its consolidated cash flows and the consolidated changes in equity for the year then ended.
We did not audit the financial statements of one of the joint arrangements included in the consolidated financial results, whose financial statements reflect total assets of ` 947.99 lakh as at March 31, 2017, total revenue of ` 32.46 lakh for the year ended March 31, 2017 and reflects Group’s share of net profit of ` 8.47 lakh for the year ended on March 31, 2017. This financial statement have been audited by other auditors whose reports have been furnished to us by the management, and our opinion so far as it relates to this joint arrangement is based solely on the report of other auditor.
The financial statements of two joint arrangements included in the consolidated financial results is on the basis of unaudited management accounts whose financial statement reflects total assets of ̀ 20,541.35 lakh as at March 31, 2017, total revenue of ` Nil for the year ended March 31, 2017 and reflects Group’s share of net loss of ` 0.52 lakh for the year ended on March 31, 2017. These financial statements have not been audited and our opinion so far it relates to these joint arrangements is based solely on such unaudited management accounts.
Other Matters
Report on Other Legal and Regulatory Requirements
We have sought and obtained all the information and explanations which to the best of our knowledge and belief were necessary for the purposes of our audit of the aforesaid consolidated Ind AS financial statements;
The consolidated Balance Sheet, the consolidated Statement of Profit and Loss (including other comprehensive income), the consolidated Statement of Cash Flows and consolidated Statement of Changes in Equity dealt with by this Report are in agreement with the relevant books of account maintained for the purpose of preparation of the consolidated Ind AS financial statements;
In our opinion, proper books of account as required by law relating to preparation of the aforesaid consolidated Ind AS financial statements have been kept so far as it appears from our examination of those books and reports of other auditor;
As required by Section 143(3) of the Act, we report to the extent applicable, that:
(a)
(b)
(c)
In our opinion, the aforesaid consolidated Ind AS financial statements comply with the Accounting Standards specified under Section 133 of the Act, read with relevant rules issued there under;
On the basis of the written representations received from the directors of the Holding Company as on March 31, 2017 taken on record by the Board of Directors of the Holding Company and the reports of the statutory auditors of its subsidiary companies incorporated in India, none of the Directors of the Group are disqualified as on March 31, 2017 from being appointed as a Director of that Company in terms of Section 164(2) of the Act;
With respect to the adequacy of the internal financial controls over financial reporting of the Group and the operating effectiveness of such controls, refer to our separate report in “Annexure A”; and
with respect to the other matters to be included in the Auditor’s Report in accordance with Rule 11 of the Companies (Audit and Auditors) Rules, 2014, in our opinion and to the best of our information and according to the explanations given to us:
the consolidated Ind AS financial statements disclose the impact of pending litigations on the consolidated financial position of the Group - Refer Note 38.A.(4) to the consolidated Ind AS financial statements;
provision has been made in the consolidated Ind AS financial statements, as required under the applicable law or accounting standards, for material foreseeable losses, if any, on long term contracts including derivatives contracts;
(d)
(e)
(f)
(g)
i.
ii.
iii. there has been no delay in transferring amounts, required to be transferred, to the Investor Education and Protection Fund by the Holding Company and its subsidiary companies incorporated in India; and
267

the Holding Company and its subsidiaries incorporated in India have provided for requisite disclosures in its consolidated Ind AS financial statements as to holdings as well as dealings in Specified Bank Notes during the period from November 8, 2016 to December 30, 2016.
Based on audit procedures and relying on the management representation we report that the disclosures are in accordance with books of account maintained by the Holding Company and its subsidiaries incorporated in India and as produced to us by the management of the Holding Company - Refer Note 40 to the consolidated Ind AS financial statements.
For P. RAJ & CO.Chartered Accountants Firm Registration No. 108310W
P. S. ShahPartnerMembership No. 44611Mumbai, May 4, 2017
iv.
2016-178485
268

ANNEXURE - A TO THE AUDITORS’ REPORT
In conjunction with our audit of the consolidated Ind AS financial statements of Oberoi Realty Limited as of and for the year ended March 31, 2017, we have audited the internal financial controls over financial reporting of Oberoi Realty Limited (“the Holding Company”) and its subsidiary companies incorporated in India as of that date.
Report on the Internal Financial Controls under Clause (i) of Sub-section 3 of Section 143 of the Companies Act,2013 (“the Act”)
The Respective Board of Directors of the Holding Company and its subsidiary companies incorporated in India, are responsible for establishing and maintaining internal financial controls based on the internal control over financial reporting criteria established by the Holding Company and its subsidiary companies incorporated in India considering the essential components of internal control stated in the Guidance Note on Audit of Internal Financial Controls over Financial Reporting issued by the Institute of Chartered Accountants of India (“ICAI’). These responsibilities include the design, implementation and maintenance of adequate internal financial controls that were operating effectively for ensuring the orderly and efficient conduct of its business, including adherence to respective company’s policies, the safeguarding of its assets, the prevention and detection of frauds and errors, the accuracy and completeness of the accounting records, and the timely preparation of reliable financial information, as required under the Companies Act, 2013.
Management’s Responsibility for Internal Financial Controls
Our responsibility is to express an opinion on the Holding Company's and its subsidiary companies incorporated in India, internal financial controls over financial reporting based on our audit. We conducted our audit in accordance with the Guidance Note on Audit of Internal Financial Controls over Financial Reporting (the “Guidance Note”) issued by ICAI and the Standards on Auditing, issued by ICAI and deemed to be prescribed under section 143(10) of the Companies Act, 2013, to the extent applicable to an audit of internal financial controls, both issued by the Institute of Chartered Accountants of India. Those Standards and the Guidance Note require that we comply with ethical requirements and plan and perform the audit to obtain reasonable assurance about whether adequate internal financial controls over financial reporting was established and maintained and if such controls operated effectively in all material respects.
Our audit involves performing procedures to obtain audit evidence about the adequacy of the internal financial controls system over financial reporting and their operating effectiveness. Our audit of internal financial controls over financial reporting included obtaining an understanding of internal financial controls over financial reporting, assessing the risk that a material weakness exists, and testing and evaluating the design and operating effectiveness of internal control based on the assessed risk. The procedures selected depend on the auditor’s judgment, including the assessment of the risks of material misstatement of the Ind AS financial statements, whether due to fraud or error.
We believe that the audit evidence we have obtained is sufficient and appropriate to provide a basis for our audit opinion on the Holding Company’s and its subsidiary companies incorporated in India, internal financial controls system over financial reporting.
Auditors’ Responsibility
A company's internal financial control over financial reporting is a process designed to provide reasonable assurance regarding the reliability of financial reporting and the preparation of financial statements for external purposes in accordance with generally accepted accounting principles. A company's internal financial control over financial reporting includes those policies and procedures that
(1)
(2)
(3)
Meaning of Internal Financial Controls over Financial Reporting
provide reasonable assurance regarding prevention or timely detection of unauthorised acquisition, use, or disposition of the company's assets that could have a material effect on the financial statements.
provide reasonable assurance that transactions are recorded as necessary to permit preparation of financial statementsin accordance with generally accepted accounting principles, and that receipts and expenditures of the company are being made only in accordance with authorisations of management and directors of the company; and
pertain to the maintenance of records that, in reasonable detail, accurately and fairly reflect the transactions and dispositions of the assets of the company;
269

Because of the inherent limitations of internal financial controls over financial reporting, including the possibility of collusion or improper management override of controls, material misstatements due to error or fraud may occur and not be detected. Also, projections of any evaluation of the internal financial controls over financial reporting to future periods are subject to the risk that the internal financial control over financial reporting may become inadequate because of changes in conditions, or that the degree of compliance with the policies or procedures may deteriorate.
Inherent Limitations of Internal Financial Controls over Financial Reporting
In our opinion, the Holding Company and its subsidiary companies incorporated in India, have, in all material respects, an adequate internal financial controls system over financial reporting and such internal financial controls over financial reporting were operating effectively as at March 31, 2017, based on the internal controls over financial reporting criteria established by the Holding Company and its subsidiary companies considering the essential components of internal control stated in the Guidance Note on Audit of Internal Financial Controls Over Financial Reporting issued by the ICAI.
For P. RAJ & CO.Chartered AccountantsFirm Registration No. 108310W
P. S. ShahPartnerMembership No. 44611Mumbai, May 4, 2017
Opinion
2016-178687
270

AS AT
I) a) Property, plant and equipmentsb) Investment propertiesc) d) Capital work in progresse) Financial assets i) Investmentsf) Deferred tax assets (net)g) Other non-current assets
2345
678
24,400.28 73,042.70
257.73 4,876.15
1,37,664.74
10,294.88 14,009.28
NOTE MARCH 31, 2017 MARCH 31, 2016 APRIL 1, 2015
ASSETS
22,750.90 71,536.86
206.92 10,950.88
1,60,178.05 9,974.06
14,311.03
26,269.15 75,047.75
149.15 1,664.59
1,20,730.67 10,223.09 14,298.78
2,89,908.70 2,64,545.76 2,48,383.18
II) a) Inventoriesb) Financial assets i) Investments ii) Trade receivables iii) Cash and cash equivalents iv) Bank balances other than (iii) above v) Loansc) Current tax assets (net)d) Other current assets
9
101112131415
8
3,76,636.72
22,252.01 10,578.83 21,347.61 13,818.64 13,369.84
1,783.85 95,717.71
3,33,924.39
7,446.02 11,224.49 21,137.19 10,049.32
6,904.83 1,908.26
91,235.85
2,99,697.89
- 7,529.25
15,779.01 12,902.40
3,987.20 3,743.51
97,334.91
5,55,505.21 4,40,974.17
8,45,413.91
4,83,830.35
7,48,376.11 6,89,357.35TOTAL ASSETS (I+II)
1,89,889.26 1,73,845.15
2,72,817.86
8,45,413.91
2,14,263.41
7,48,376.11
1,47,251.41
2,15,283.32
6,89,357.35
82,928.60 40,418.26 68,031.91
II) i) a) Financial liabilities i) Borrowings ii) Trade payables iii) Other financial liabilitiesb) Provisionsc) Other non-current liabilities
1819202122
74,937.77 713.29
6.19 170.77
7,100.58
34,943.38 375.49 337.84 137.41
4,624.14
59,864.54 101.08 727.86 118.36
7,220.07
5,72,596.05 4,74,074.03
I) a) Equity share capitalb) Other equity
1617
33,953.55 5,38,642.50
5,34,112.70
33,930.39 5,00,182.31
32,823.80 4,41,250.23
EQUITY AND LIABILITIES
ii) a) Financial liabilities i) Borrowings ii) Trade payables iii) Other financial liabilitiesb) Other current liabilitiesc)
1819202221
1
8,908.00 5,410.18 3,442.68
1,71,927.55 200.85
10,708.00 4,246.41 2,086.76
1,56,514.05 289.93
10,708.00 3,488.81 8,635.56
1,24,035.04 384.00
TOTAL LIABILITIES (i+ii)
TOTAL EQUITY AND LIABILITIES (I+II)
Significant accounting policiesThe accompanying notes form an integral part of the financial statements
As per our report of even date
For P. RAJ & CO. Chartered AccountantsFirm Registration No. 108310W
For and on behalf of the Board of Directors
Vikas OberoiChairman & Managing Director
T. P. OstwalDirector
P. S. ShahPartnerMembership No.44611Mumbai, May 4, 2017
Saumil DaruDirector - Finance cum Chief Financial Officer
Bhaskar KshirsagarCompany Secretary
(` in Lakh) CONSOLIDATED BALANCE SHEET
Non-current assets
Current assets
Equity
LiabilitiesNon-current liabilities
Current liabilities
Intangible assets
Provisions
271

FOR THE YEAR ENDED NOTE MARCH 31, 2016MARCH 31, 2017
INCOMERevenue from operationsOther incomeTotal revenue
EXPENSESOperating costsExcise dutyEmployee benefits expenseOther expensesDepreciation and amortisationInterest and finance chargesTotal expensesProfit before taxTax expenseCurrent taxDeferred taxShort / (excess) provision of tax in earlier yearsNet profit / (loss) after taxes and before share of profit (loss) of associates / joint venturesShare of Profit / (loss) of associates / joint ventures (net)Net profit / (loss) after taxes and share of profit / (loss) of associates / joint ventures
Significant accounting policiesThe accompanying notes form an integral part of the financial statements
As per our report of even date
For P. RAJ & CO. Chartered AccountantsFirm Registration No. 108310W
For and on behalf of the Board of Directors
Vikas OberoiChairman & Managing Director
T. P. OstwalDirector
P. S. ShahPartnerMembership No.44611Mumbai, May 4, 2017
Saumil DaruDirector - Finance cum Chief Financial Officer
Bhaskar KshirsagarCompany Secretary
Other comprehensive income Re - measurement gains / (losses) on defined benefit plans Income tax effect Share of Other Comprehensive Income in Associates and Joint Ventures, to the extent not to be classified into profit / (loss) Re - measurement gains / (losses) on defined benefit plans Income tax effectTotal comprehensive income / (expenses) for the year net of taxTotal comprehensive income for the year (Comprising profit / (loss) and other comprehensive income for the year)
Earnings per equity share (face value of ` 10) - Basic (in `) - Diluted (in `)
30.95 (10.78)
3.35 (1.04) 22.48
37,881.24
11.15 11.15
(39.95) 13.45
(2.24) 0.69
(28.05)43,527.55
12.96 12.96
(A)
(B)
(C)
(A-B)
(C+D)
2324
252627282930
15
31
1
(D)
1,11,374.39 4,729.80
1,16,104.19
43,707.13 12.36
6,416.17 4,232.08 4,949.54
557.22 59,874.50 56,229.69
18,677.95 6.91
(0.00)
37,858.76
37,544.83
313.93
21,653.27 1,229.09
45.82
43,555.60159.50
62,953.69 13.71
5,705.84 5,311.13 4,899.50
683.26 79,567.13 66,324.28
1,41,614.71 4,276.70
1,45,891.41
43,396.10
CONSOLIDATED STATEMENT OF PROFIT AND LOSS(` in Lakh)
2016-178889
272

Part
icu
lar
Part
icu
lars
N
ote
Re
tain
edea
rnin
gs
Rese
rves
an
d S
urp
lus
Tota
l
Tota
l Pa
rtic
ula
rs
Note
Re
tain
edea
rnin
gs
(` in
Lak
h)
(` in
Lak
h)
(` in
Lak
h)
17
17
17
17
32,8
23.8
0
2,6
5,9
44.8
4
38,4
60.1
9 5
,38,6
42.5
0 3
7,8
81.2
4 3
,31,2
83.9
4
58,9
32.0
8
CO
NSO
LID
ATE
D S
TATE
MEN
T O
F C
HA
NG
ES IN
EQ
UIT
YA
. Eq
uity
Sh
are
Cap
ital
B. O
ther
Eq
uity
A.
B.
(A+
B)
Am
ou
nt
Note
Ch
an
ges
du
rin
g t
he
year
Exer
cise
of s
tock
opt
ions
Issu
e of
fres
h sh
ares
on
pref
eren
tial b
asis
Amou
nts
utili
zed
for
issu
e of
fres
h sh
ares
on
pref
eren
tial b
asis
Rem
easu
rem
ent o
f the
net
def
ined
ben
efit
liabi
lity/
asse
t, ne
t of t
axes
Div
iden
ds (i
nclu
ding
cor
pora
te d
ivid
end
tax)
Prof
it fo
r th
e ye
ar
Bala
nce
as
at
Ap
ril 1
, 2015
Ch
an
ges
du
rin
g t
he
year
Exer
cise
of s
tock
opt
ions
Rem
easu
rem
ent o
f the
net
def
ined
ben
efit
liabi
lity/
asse
t, ne
t of t
axes
Prof
it fo
r th
e ye
ar
Bala
nce
as
at
Ap
ril 1
, 2016
Tota
l ch
an
ges
du
rin
g t
he
year
Bala
nce
as
at
Marc
h 3
1, 2016
A. B.
(A+
B)Tota
l ch
an
ges
du
rin
g t
he
year
Bala
nce
as
at
Marc
h 3
1, 2017
- -
43,
555.
60
37,8
58,7
6-
164
.69
31,
350.
00 (4
0.47
)
(16,
069.
69)
4,4
1,2
50.2
3
27,4
57.8
6
2,9
3,4
02.7
0 5
,00,1
82.3
1
Rese
rves
an
d S
urp
lus
As a
t Apr
il 1,
201
5
As a
t Mar
ch 3
1, 2
016
As
at
Marc
h 3
1, 2017
33,9
53.5
516
16
16
33,
930.
39C
hang
e in
equ
ity s
hare
cap
ital
Cha
nge
in e
quity
sha
re c
apita
l
1,10
6.59
23.1
6
(16,
069.
69)
43,
555.
60
- 2
2.48
5,0
0,1
82.3
1
Cap
ital
rese
rve
Cap
ital
rese
rve
3,5
90.0
0- ---
3,5
90.0
0
3,5
90.0
0
3,5
90.0
0
Cap
ital
red
emp
tion
re
serv
e
Cap
ital
red
emp
tion
re
serv
e
5,7
10.0
0--
5,7
10.0
0 - ---
5,7
10.0
0
5
,710.0
0
Gen
eral
rese
rve
Gen
eral
rese
rve
23,2
75.8
2
23,2
75.8
2 --- -
23,2
75.8
2 - - - - -
-
-
- -
-
- - - - - -
23,2
75.8
2
Secu
ritie
sp
rem
ium
acc
ou
nt
Secu
ritie
sp
rem
ium
acc
ou
nt
31,4
74.2
2
578.9
5 1
,67,1
97.5
5
1,3
5,1
44.3
8
578
.95 -
164
.69
31,
350.
00 (4
0.47
)
1,6
6,6
18.6
0
1,6
6,6
18.6
0 2
,93,4
02.7
0
(28.
05)
Cap
ital r
edem
ptio
n
rese
rve
on
con
solid
atio
n
Cap
ital r
edem
ptio
n
rese
rve
on
con
solid
atio
n
7,5
85.1
9- ---
7,5
85.1
9
7,5
85.1
9
7,5
85.1
9- - - ---
- - - ---
578.
9522
.48
37,
858.
76
(28.
05)
As p
er o
ur r
epor
t of e
ven
date
For
P. R
AJ
& C
O.
Cha
rtere
d Ac
coun
tant
sFi
rm R
egis
tratio
n N
o. 1
0831
0W
For
and
on b
ehal
f of t
he B
oard
of D
irect
ors
Vik
as
Ob
eroi
Cha
irman
& M
anag
ing
Dire
ctor
T. P
. O
stw
al
Dire
ctor
P. S
. Sh
ah
Partn
erM
embe
rshi
p N
o.44
611
Mum
bai,
May
4, 2
017
Sau
mil
Daru
Dire
ctor
- F
inan
ce c
um C
hief
Fin
anci
al O
ffice
rBh
ask
ar
Ksh
irsa
gar
Com
pany
Sec
reta
ry
--
273

MARCH 31, 2017 MARCH 31, 2016
CASH FLOW FROM OPERATING ACTIVITIES:
Adjustments forDepreciation and amortisationInterest income (including fair value change in financial instruments)Interest expenses (including fair value change in financial instruments)Re - measurement gains / (losses) on defined benefit plansDividend incomeLoss / (profit) on sale of investments (net)Loss / (gain) from foreign exchange fluctuation (net)(Gain) / loss on sale / discarding of investment properties (net)(Gain) / loss on sale / discarding of property, plant and equipment (net)Share of profit of an associate and a joint ventureSundry balances written off / (back)
Profit before tax as per statement of profit and loss
4,949.54 (3,741.85) 7,177.01
33.26 (163.73) (817.85)
(8.21) 117.05
(2.42) 313.93 (30.51)
64,055.91
56,229.69
66,324.28
4,899.50 (2,768.17) 6,085.55
(41.50) (110.85)
(1,395.60) 11.63
0.73 (0.13)
159.50 (109.91)
73,055.03
Movement for working capitalIncrease / (decrease) in trade payablesIncrease / (decrease) in other liabilitiesIncrease / (decrease) in provisions(Increase) / decrease in loans and advances(Increase) / decrease in trade receivables(Increase) / decrease in inventoriesCash generated from operationsDirect taxes (paid) / refundNet cash inflow / (outflow) from operating activities
Operating cash profit before working capital changes
1,096.78 17,331.15
(55.71) (4,681.51)
645.67 (42,787.57) 35,604.72 (18,250.41) 17,354.31
796.64 29,107.75
(75.03) 1,444.52 (3,695.24)
(34,173.32) 66,460.35 (21,151.27) 45,309.08(A)
CASH FLOW FROM INVESTING ACTIVITIES:(Acquisition) / (adjustments) / sale of property, plant and equipment,investment properties, intangible assets / addition to capital work in progress (net)Interest receivedDividend receivedDecrease / (increase) in loans and advances to / for joint ventures (net)Decrease / (increase) in investment in joint ventures(Acquisition) / sale of investments (net)(Increase) / decrease in other assetsNet cash inflow / (outflow) from investing activities
(7,625.20)
2,293.09 163.73
(5,633.21) (30,137.55)
817.85 (3,771.55)
(43,892.84)
(3,977.46)
1,756.71 110.85
2,389.51 (16,613.31)
1,395.61 2,856.16
(12,081.93)(B)
CASH FLOW FROM FINANCING ACTIVITIES:Increase in equity share capital (including share premium)Repayment of borrowings Proceeds from issue of debenturesPrepayment of debenturesRepayment of debenturesInterest paidDividend paid (including dividend distribution tax)Net cash inflow / (outflow) from financing activities
(1,800.00) 75,000.00
(35,000.00) -
(5,245.82) -
33,556.29
- -
(25,000.00) (5,100.00) (6,834.06)
(16,069.69) (20,422.94)(C)
(A+B+C)Net increase / (decrease) in cash and cash equivalentsAdd: cash and cash equivalents at the beginning of the yearCash and cash equivalents at the end of the year
7,017.76 28,583.21
35,600.97
12,804.21 15,779.00 28,583.21
FOR THE YEAR ENDED
CONSOLIDATED CASH FLOW STATEMENT
602.11 32,580.81
(` in Lakh)
2016-179091
274

CONSOLIDATED CASH FLOW STATEMENT
Cash on handBalance with banksFixed deposits with banks, having original maturity of three months or lessFixed deposit with banks, having original maturity of more than threemonths but less than twelve monthsAdd: Short term liquid investmentCash and cash equivalents at the end of the year
39.86 3,659.44 3,558.57
14,089.74
14,253.36 35,600.97
16.67 4,049.94 4,793.94
12,276.64
7,446.02 28,583.21
MARCH 31, 2017 MARCH 31, 2016
MARCH 31, 2017 MARCH 31, 2016
COMPONENTS OF CASH AND CASH EQUIVALENTS
AS AT
AS AT
Cash and cash equivalents at the end of the year as per aboveAdd: Balance with banks in dividend / unclaimed dividend accountsAdd: Fixed deposits with banks, having original maturity of more than twelve monthsAdd: Fixed deposits with banks (lien marked)Less: Short term liquid investment (out of the same investmentof ` 3,446.77 lakh (` 989.86 lakh) is lien marked)Cash and bank balance as per balance sheet (refer note 12 and 13)
28,583.21 4.37
4,724.70 5,320.25
(7,446.02) 31,186.51
RECONCILIATION STATEMENT OF CASH AND BANK BALANCES
Significant accounting policies (refer note 1)The accompanying notes form an integral part of the financial statements
As per our report of even dateFor P. RAJ & CO. Chartered AccountantsFirm Registration No. 108310W
P. S. ShahPartnerMembership No.44611Mumbai, May 4, 2017
Vikas OberoiChairman & Managing Director
Saumil DaruDirector - Finance cum Chief Financial Officer
T. P. OstwalDirector
Bhaskar KshirsagarCompany Secretary
For and on behalf of the Board of Directors
35,600.97 2.13
7,541.42 6,275.09
(14,253.36) 35,166.25
(` in Lakh)
(` in Lakh)
275

Oberoi Realty Limited (the ‘Company’ or ‘ORL’), a public limited company is incorporated in India under the Companies Act 1956. The consolidated financial statement comprises financial statements of the Company, together with its subsidiaries and joint arrangements (collectively referred to as the ‘Group’) for the year ended March 31, 2017. The Group is engaged primarily in the business of real estate development and hospitality.
The Company is headquartered in Mumbai, India. The shares of the Company are listed on the BSE Limited and National Stock Exchange of India Limited. Its registered office is situated at Commerz, 3rd Floor, International Business Park, Oberoi Garden City, Off Western Express Highway, Goregaon (East), Mumbai- 400 063.
The consolidated financial statements for the year ended March 31, 2017 were authorized and approved for issue by the Board of Directors on May 04, 2017.
The consolidated financial statements of the Group have been prepared in accordance with the Indian Accounting Standards as notified under section 133 of the Companies Act 2013 read with Rule 3 of the Companies (Indian Accounting Standards) Rules 2015 by Ministry of Corporate Affairs (‘MCA’) as amended by the Companies (Indian Accounting Standards) Rules, 2016.
For all periods up to and including the year ended March 31, 2015 the Group prepared its financial statements in accordance with accounting standards notified under the section 133 of the Companies Act 2013, read together with paragraph 7 of the Companies (Accounts) Rules, 2014 (Indian GAAP) as amended from time to time.
The financial statements for the year ended March 31, 2017 are the Group’s first Ind AS financial statements. The Group has adopted Ind AS standards effective from April 01, 2016 with comparatives for year ending March 31, 2016 and April 01, 2015 being restated and the adoptions were carried out in accordance with Ind AS 101 – First time adoption of Indian Accounting Standards. All applicable Ind AS have been applied consistently and retrospectively wherever required. Please refer to note 4.2 for information on how the Group has adopted Ind AS.
The consolidated financial statements have been prepared on a historical cost basis, except for certain financial instruments which are measured at fair values at the end of each reporting period, as explained in the accounting policies below.
The consolidated financial statements comprise of financial statements of the Company and its subsidiaries and joint arrangements for which the Company fulfils the criteria pursuant to Ind AS 110 and joint arrangements within the scope of Ind AS 111.
1. NATURE OF OPERATIONS
2. SIGNIFICANT ACCOUNTING POLICIES
2.1
2.2 Basis of consolidation
Subsidiaries are entities controlled by the Company. Control exists if and only if all of the following conditions are satisfied–
(a) Power over the investee (i.e. existing rights that give it the current ability to direct the relevantactivities of the investee);
(b) Exposure, or rights to variable returns from its involvement with the investee; and(c) The ability to use its power over the investee to affect the amount of the investors’ returns
Subsidiaries are consolidated from the date control commences until the date control ceases.
2.2.1 Subsidiaries
NOTES FORMING PART OF CONSOLIDATED FINANCIALS STATEMENTS
Basis of preparation
2016-179293
276

The financial statements of the subsidiaries are consolidated on a line-by-line basis and intra-group balances and transactions including unrealized gain / loss from such transactions are eliminated upon consolidation. Consolidated financial statements are prepared using uniform accounting policies for like transactions and other events in similar circumstances.
Name of the company
Country of Incorporation
Principal activities
% of ownership as on March 31, 2017, March 31, 2016 and April 01, 2015
Oberoi Constructions Limited
Oberoi Mall Limited
Expressions Realty Private Limited
Incline Realty Private Limited
Integrus Realty Private Limited
Sight Realty Private Limited
Kingston Hospitality and Developers
Private Limited
Kingston Property Services Limited
Buoyant Realty LLP
Astir Realty LLP
Perspective Realty Private Limited
Pursuit Realty LLP**
India
India
India
India
India
India
India
India
India
India
India
India
100%
100%
100%
100%
100%
100%
100%
100%
100%
100%
100%
100%
Real Estate
Real Estate
Real Estate
Real Estate
Real Estate
Real Estate
Real Estate
PMS*
Real Estate
Real Estate
Real Estate
Real Estate
All the subsidiaries are wholly owned subsidiaries and therefore there is no Non-controlling interest.
Details of subsidiaries considered in the consolidated financial statements are as under:
* Property Management Services**incorporated on February 10, 2017
2.2.2
(i) Joint ventures
A joint venture is a type of joint arrangement whereby the parties have joint control of the arrangement and have rights to the net assets of the arrangement. Joint Control is the contractually agreed sharing of control of an arrangement, which exists only when decisions about the relevant activities require unanimous consent of the parties sharing control.
The Group’s investments in joint venture are accounted for using the equity method. Under the equity method, the investment in a joint venture is initially recognised at cost. The carrying amount of the investment is adjusted to recognise changes in the Group’s share of net assets of joint venture since the acquisition date. Goodwill relating to the joint venture is included in the carrying amount of the investment and is not tested for impairment individually.
Unrealised gains and losses resulting from transactions between the Group and the joint venture are eliminated to the extent of the interest in the joint venture.
The financial statements of joint ventures are prepared for the same reporting period as the Group. Where necessary, adjustments are made to bring the accounting policies in line with those of the Group.
For details of joint venture considered in the consolidated financial statements as at March 31, 2017 please refer note 33.
NOTES FORMING PART OF CONSOLIDATED FINANCIALS STATEMENTS
Joint arrangements
277

A joint operation is a joint arrangement whereby the parties that have joint control of the arrangement have rights to the assets and obligations for the liabilities, relating to the arrangement. Those parties are called joint operators.
For details of joint operation considered in the consolidated financial statements as at March 31, 2017, please refer note 33.
In accordance with Ind AS 101 provisions related to first time adoption, the Group has elected to apply Ind AS accounting for business combinations prospectively from April 01, 2015. As such, previous Indian GAAP balances relating to business combinations entered into before that date, including goodwill, have been carried forward. The first time adoption exemption is applied across consolidatedfinancial statement including Joint Arrangement.
Business Combinations are accounted for using the acquisition method.
The cost of an acquisition is measured as the aggregate of the consideration transferred, measured at acquisition date fair value and the amount of any non-controlling interests in the acquiree. For each business combination, the Group elects whether to measure the non-controlling interests in the acquiree at fair value or at the proportionate share of the acquiree’s identifiable net assets. Acquisition related costs are recognised in the statement of profit and loss as incurred.
At the acquisition date, the identifiable assets acquired and the liabilities assumed are recognised at their acquisition date fair values. For this purpose, the liabilities assumed include contingent liabilities representing present obligation and they are measured at their acquisition date fair values irrespective of the fact that outflow of resources embodying economic benefits is not probable.
When the Group acquires a business, it assesses the financial assets and liabilities assumed for appropriate classification and designation in accordance with the contractual terms, economic circumstance, operating or accounting policies and pertinent conditions as at the acquisition date.
Goodwill is initially measured at cost. Following initial recognition, goodwill is measured at cost less any accumulated impairment losses. Any impairment loss for goodwill is recognised in the statement of profit and loss. An impairment loss recognised for goodwill is not reversed in subsequent periods.
The Group’s normal operating cycle in respect of operations relating to the construction of real estate projects may vary from project to project depending upon the size of the project, type of development, project complexities and related approvals. Operating cycle for all completed projects and hospitality business is based on 12 months period. Assets and liabilities have been classified into current and non-current based on their respective operating cycle.
Initial recognition
Foreign currency transactions are recorded in the functional currency (Indian Rupee) by applying to the foreign currency amount the exchange rate between the functional currency and the foreign currency on the date of the transaction.
2.2.3 Business combinations and goodwill
2.3 Current / non-current classification
2.4 Foreign currencies
NOTES FORMING PART OF CONSOLIDATED FINANCIALS STATEMENTS
(ii) Joint operation
All Subsidiaries and joint arrangements have a reporting date of March 31.
2016-179495
278

Building 60 years
15 years10 years10 years5 years3 years8 years
20 years
3 yearsTemporary structuresPlant and machineryFurniture and fixturesElectrical installations and equipments Office equipments*ComputersVehiclesAircraft
Conversion
All monetary items outstanding at year end denominated in foreign currency are converted into Indian Rupees at the reporting date exchange rate. Non-monetary items, which are measured in terms of historical cost denominated in a foreign currency, are reported using the exchange rate at the date of the transaction and non-monetary items which are carried at fair value or other similar valuation denominated in a foreign currency are reported using the exchange rates that existed when the values were determined.
Exchange differences
The exchange differences arising on such conversion and on settlement of the transactions are recognised in the statement of profit and loss.
Transition to Ind AS
Under the previous Indian GAAP, property plant and equipment were carried in the balance sheet at cost less accumulated depreciation/amortisation and impairment losses, if any. The Group has elected to regard those values of property, plant and equipment as deemed cost at the date of transition to Ind AS (April 01, 2015).
Recognition and initial measurement
Property, plant and equipment are stated at cost less accumulated depreciation / amortisation and impairment losses, if any.
Cost comprises the purchase price and any attributable / allocable cost of bringing the asset to its working condition for its intended use. The cost also includes direct cost and other related incidental expenses. Revenue earned, if any, during trial run of assets is adjusted against cost of the assets. Cost also includes the cost of replacing part of the plant and equipment.
Borrowing costs relating to acquisition / construction / development of tangible assets, which takes substantial period of time to get ready for its intended use are also included to the extent they relate to the period till such assets are ready to be put to use.
Subsequent measurement (depreciation and useful lives)
When significant components of property and equipment are required to be replaced at intervals, recognition is made for such replacement of components as individual assets with specific useful life and depreciation, if these components are initially recognised as separate asset. All other repair and maintenance costs are recognised in the statement of profit and loss as incurred.
Depreciation is provided from the date the assets are ready to be put to use, on straight line method as per the useful life of the assets as prescribed under Part C of Schedule II of the Companies Act, 2013.
2.5 Property, plant and equipment (PPE)
NOTES FORMING PART OF CONSOLIDATED FINANCIALS STATEMENTS
*Mobile handsets - 3 years
279

Depreciation method, useful life and residual value are reviewed periodically.
Leasehold land and improvements are amortised on the basis of duration and other terms of lease.
The carrying amount of PPE is reviewed periodically for impairment based on internal / external factors. An impairment loss is recognised wherever the carrying amount of assets exceeds its recoverable amount. The recoverable amount is the greater of the asset’s net selling price and value in use.
De-recognition
PPE are derecognised either when they have been disposed of or when they are permanently withdrawn from use and no future economic benefit is expected from their disposal. The difference between the net disposal proceeds and the carrying amount of the asset is recognised in the statement of profit and loss in the period of de-recognition.
Transition to Ind AS
Under the previous Indian GAAP, intangible assets, were carried in the balance sheet at cost less accumulated depreciation / amortisation and impairment losses, if any. The Group has elected to regard those values of intangible assets as deemed cost at the date of transition to Ind AS (April 01, 2015).
Recognition and initial measurement
Intangible assets are stated at cost less accumulated amortisation and impairment losses, if any. Cost comprises the acquisition price, development cost and any attributable / allocable incidental cost of bringing the asset to its working condition for its intended use.
The cost of intangible assets acquired in a business combination is their fair value at the date of acquisition.
Subsequent measurement (Amortization)
All intangible assets with definite useful life are amortized on a straight line basis over the estimated useful lives not exceeding 5 years.
The carrying amount of intangible asset is reviewed periodically for impairment based on internal / external factors. An impairment loss is recognised wherever the carrying amount of an asset exceeds its recoverable amount. The recoverable amount is the greater of the asset’s net selling price and value in use.
Transition to Ind AS
Under the previous Indian GAAP, investment properties were carried in the balance sheet at cost less accumulated depreciation / amortisation and impairment losses, if any. The Group has elected to regard those values of investment properties as deemed cost at the date of transition to Ind AS (April 01, 2015).
Recognition and initial measurement
Investment properties are properties held to earn rentals or for capital appreciation, or both. Investment properties are measured initially at cost, including transaction costs. The cost comprises purchase price,borrowing cost if capitalization criteria are met and directly attributable cost of bringing the asset to its working condition for the intended use.
2.6 Intangible assets
2.7 Investment properties
NOTES FORMING PART OF CONSOLIDATED FINANCIALS STATEMENTS
2016-179697
280

Subsequent costs are included in the asset’s carrying amount or recognised as a separate asset, as appropriate, only when it is probable that future economic benefits associated with the item will flow to the Group.
Though the Group measures investment property using cost based measurement, the fair value of investment property is disclosed in the notes. Fair values are determined based on an annual evaluation performed by an accredited external independent valuer who holds a recognised and relevant professional qualification and has experience in the category of the investment property being valued.
Subsequent measurement (depreciation and useful lives)
Investment Properties are stated at cost less accumulated depreciation and accumulated impairment loss, if any, subsequently. Depreciation is provided from the date the assets are ready to be put to use, on straight line method as per the useful life of the assets as prescribed under Part C of Schedule II of the Companies Act, 2013 except for the following class of assets where the management has estimated useful life which differs from the useful life prescribed under the Act.
For above classes of assets, based on internal assessment, the management believes that the useful lives as given above best represent the period over which management expects to use these assets.
Leasehold land and improvements are amortised on the basis of duration and other terms of lease.
The carrying amount of Investment Property is reviewed periodically for impairment based on internal / external factors. An impairment loss is recognised wherever the carrying amount of assets exceeds its recoverable amount. The recoverable amount is the greater of the asset’s net selling price and value in use.
When significant components of Investment Properties are required to be replaced at intervals, recognition is made for such replacement of components as individual assets with specific useful life and depreciation, if these components are initially recognised as separate asset. All other repair and maintenance costs are recognised in the statement of profit and loss as incurred.
De-recognition
Investment properties are derecognised either when they have been disposed of or when they are permanently withdrawn from use and no future economic benefit is expected from their disposal. The difference between the net disposal proceeds and the carrying amount of the asset is recognised in the statement of profit and loss in the period of de-recognition.
Capital work in progress is stated at cost less impairment losses, if any. Cost comprises of expenditures incurred in respect of capital projects under development and includes any attributable / allocable cost and other incidental expenses. Revenues earned, if any, from such capital project before capitalisation are adjusted against the capital work in progress.
Lessee specific assets and improvements Over lease period or useful life as prescribed in Schedule II, whichever is lower
2.8 Capital work in progress
NOTES FORMING PART OF CONSOLIDATED FINANCIALS STATEMENTS
281

The Group follows the percentage of project completion method for its projects.
The Group recognises revenue in proportion to the actual project cost incurred (including land cost) as against the total estimated project cost (including land cost), subject to achieving the threshold level of project cost (excluding land cost) as well as area sold, in line with the “Revised Guidance Note on Accounting for Real Estate Transaction” (for entities to whom Ind AS is applicable) and depending on the type of project.
Revenue is recognised net of indirect taxes and on execution of either an agreement or a letter of allotment.
The estimates relating to percentage of completion, costs to completion, area available for sale etc. being of a technical nature are reviewed and revised periodically by the management and are considered as change in estimates and accordingly, the effect of such changes in estimates is recognised prospectively in the period in which such changes are determined.
Land cost includes the cost of land, land related development rights and premium.
Room revenue is recognised based on occupancy. Revenue from sale of food and beverages and other allied services is recognised as and when the services are rendered. Revenue includes excise duty and the same is recognised net of trade discounts and sales tax / value added tax (VAT), if any.
Lease income is recognised in the statement of profit and loss on straight line basis over the lease term, unless there is another systematic basis which is more representative of the time pattern of the lease. Revenue from lease rentals is disclosed net of indirect taxes, if any.
Revenue from property management service is recognised at value of service and is disclosed net of indirect taxes, if any.
For all financial instruments measured at amortised cost, interest income is recognised using the effective interest rate (EIR), which is the rate that exactly discounts the estimated future cash payments or receipts through the expected life of the financial instrument or a shorter period, where appropriate, to the net carrying amount of the financial assets. Interest income is included in other income in the statement of profit and loss.
Revenue is recognised when the Company’s right to receive the payment is established, which is generally when shareholders approve the dividend.
Other incomes are accounted on accrual basis, except interest on delayed payment by debtors and liquidated damages which are accounted on acceptance of the Group’s claim.
2.9.1 Revenue from real estate projects
2.9 Revenue recognition
NOTES FORMING PART OF CONSOLIDATED FINANCIALS STATEMENTS
2.9.2 Revenue from hospitality
2.9.3 Revenue from lease rentals and related income
2.9.4 Interest income
2.9.5 Dividend income
2.9.6 Other income
2016-179899
282

2.10 Leases
Lease arrangements where the risks and rewards incidental to ownership of an asset substantially vest with the lessor are recognised as operating lease. Operating lease payments are recognised as an expense in the statement of profit and loss on straight line basis over the lease term, unless there is another systematic basis which is more representative of the time pattern of the lease.
Lease deposits given are a financial asset and are measured at amortised cost under Ind AS 109 since it satisfies Solely Payment of Principal and Interest (SPPI) condition. The difference between the present value and the nominal value of deposit is considered as prepaid rent and recognised over the lease term. Unwinding of discount is treated as finance income and recognised in the profit & loss account.
Assets given under operating leases are included in Investment Properties. Lease income is recognised in the statement of profit and loss on straight line basis over the lease term, unless there is another systematic basis which is more representative of the time pattern of the lease.
Initial direct costs incurred in negotiating and arranging an operating lease are added to the carrying amount of the leased asset and recognised over the lease term on the same basis as rental income.
Lease deposits received are financial instruments (financial liability) and need to be measured at fair value on initial recognition. The difference between the fair value and the nominal value of deposits is considered as rent in advance and recognised over the lease term on a straight line basis. Unwinding of discount is treated as interest expense (finance cost) for deposits received and is accrued as per the EIR method.
2.10.1 Where the group entity is the lessee
2.10.2 Where the group entity is the lessor
A financial instrument is any contract that gives rise to a financial asset of one entity and a financial liability or equity instrument of another entity.
2.11 Financial instruments
Initial measurement
Financial assets are recognised when the Group becomes a party to the contractual provisions of the instrument. Financial assets are initially measured at fair value. Transaction costs that are directly attributable to the acquisition or issue of financial assets (other than financial assets at fair value through profit or loss) are added to or deducted from the fair value measured on initial recognition of financial asset.
Subsequent measurement
(i) Financial assets at amortised cost
Financial assets are measured at the amortised cost, if both of the following criteria are met:
a. These assets are held within a business model whose objective is to hold assets for collecting contractual cash flows; and b. Contractual terms of the asset give rise on specified dates to cash flows that are solely payments of principal and interest (SPPI) on the principal amount outstanding.
After initial measurement, such financial assets are subsequently measured at amortised cost using the EIR method. The EIR amortisation is included in other income in the statement of profit and loss. The losses arising from impairment are recognised in the statement of profit and loss.
2.11.1 Financial assets
NOTES FORMING PART OF CONSOLIDATED FINANCIALS STATEMENTS
283

NOTES FORMING PART OF CONSOLIDATED FINANCIALS STATEMENTS
Financial assets are classified as FVTOCI if both of the following criteria are met:
a. These assets are held within a business model whose objective is achieved both by collecting contractual cash flows and selling the financial assets; and
b.
Fair value movements are recognised in the other comprehensive income (OCI). On de-recognition of the asset, cumulative gain or loss previously recognised in OCI is reclassified from the equity to the statement of profit and loss.
De-recognition
The Group derecognises a financial asset when the contractual rights to the cash flows from the financial asset expire or it transfers the financial asset and the transfer qualifies for de-recognition.
Impairment of financial assets
The Group follows ‘simplified approach’ for recognition of impairment loss allowance on:
a. Trade receivables; and
b. All lease receivables resulting from transactions within the scope of Ind AS 17.
The application of simplified approach does not require the Group to track changes in credit risk. Rather, it recognises impairment loss allowance based on lifetime Expected Credit Loss (ECL) at each reporting date, right from its initial recognition.
For recognition of impairment loss on other financial assets and risk exposure, the Group determines whether there has been a significant increase in the credit risk since initial recognition. If credit risk has not increased significantly, 12-month ECL is used to provide for impairment loss. However, if credit risk has increased significantly, lifetime ECL is used. If, in a subsequent period, credit quality of the instrument improves such that there is no longer a significant increase in credit risk since initial recognition, then the Group reverts to recognising impairment loss allowance based on 12-month ECL.
Lifetime ECL are the expected credit losses resulting from all possible default events over the expected life of a financial instrument. The 12-month ECL is a portion of the lifetime ECL which results from default events that are possible within 12 months after the reporting date.
ECL is the difference between all contractual cash flows that are due to the Group in accordance with the contract and all the cash flows that the entity expects to receive (i.e. all cash shortfalls), discounted at the original EIR.
(ii) Financial assets at fair value through other comprehensive income (FVTOCI)
(iii) Financial assets at fair value through profit or loss (FVTPL)
(iv) Equity instruments
Any financial assets, which does not meet the criteria for categorization as at amortised cost or as FVTOCI, are classified as at FVTPL. Gain or losses are recognised in the statement of profit and loss.
Equity instruments which are held for trading and contingent consideration recognised by an acquirer in a business combination are classified as FVTPL, and measured at fair value with all changes recognised in the statement of profit and loss.
Contractual terms of the asset give rise on specified dates to cash flows that are solely payments of principal and interest (SPPI) on the principal amount outstanding.
2016-17100101
284

NOTES FORMING PART OF CONSOLIDATED FINANCIALS STATEMENTS
Initial measurement
Financial liabilities are classified, at initial recognition, as financial liabilities at fair value through profit or loss, loans and borrowings, payables, or as derivatives designated as hedging instruments in an effective hedge, as appropriate.
All financial liabilities are recognised initially at fair value and, in the case of loans and borrowings and payables, net of directly attributable transaction costs.
The Group’s financial liabilities include trade and other payables, loans and borrowings and financial guarantee contracts.
Subsequent measurement
Financial liabilities are subsequently carried at amortized cost using the EIR method. For trade and other payables maturing within operating cycle, the carrying amounts approximate the fair value due to the short maturity of these instruments.
De-recognition
A financial liability (or a part of a financial liability) is derecognised from the Group's balance sheet when the obligation specified in the contract is discharged or cancelled or expires.
Financial guarantee contracts
Financial guarantee contracts issued by the Group are those contracts that require a payment to be made to reimburse the holder for a loss it incurs because the specified debtor fails to make a payment when due in accordance with the terms of a debt instrument. Financial guarantee contracts are recognised initially as a liability at fair value. Subsequently, the liability is measured at the higher of the amount of loss allowance determined as per impairment requirements of Ind AS 109 and the amount recognised less cumulative amortisation.
Loan and borrowings
After initial recognition, interest-bearing loans and borrowings are subsequently measured at amortised cost using the EIR method.
Intercompany loans are discounted to its present value using incremental borrowing rate applicable to the borrower entity. The difference between the carrying value of the loan and its present value is accounted based on the relationship with the borrower for e.g. in case of subsidiary, the difference is shown as further equity infusion in the subsidiary. The unwinding of discount from the date of loan to the transition date is shown as an income and recognised in "Retained earnings" of the Lender.
2.11.2 Financial liabilities
285
NOTES FORMING PART OF CONSOLIDATED FINANCIALS STATEMENTS
The Group measures financial instruments at fair value on initial recognition and uses valuation techniques that are appropriate in the circumstances and for which sufficient data are available to measure fair value, maximising the use of relevant observable inputs and minimising the use of unobservable inputs.
All assets and liabilities for which fair value is measured or disclosed in the financial statements are categorised within the fair value hierarchy, described as follows, based on the lowest level input that is significant to the fair value measurement as a whole:
• Level 1 — Quoted (unadjusted) market prices in active markets for identical assets or liabilities• Level 2 — Valuation techniques for which the lowest level input that is significant to the fair value measurement is directly or indirectly observable• Level 3 — Valuation techniques for which the lowest level input that is significant to the fair value measurement is unobservable
2.11.3 Fair value measurement
Initial recognition and subsequent measurement
The Group uses derivative financial instruments, (forward currency contracts) to hedge its foreign currency risks. Such derivative financial instruments are initially recognised at fair value on the date on which a derivative contract is entered into and are subsequently re-measured at fair value.
Derivatives are carried as financial assets when the fair value is positive and as financial liabilities when the fair value is negative.
Any gains or losses arising from changes in the fair value of derivatives are taken directly to statement of profit and loss.
2.12 Derivative financial instruments
Cash and cash equivalent in the balance sheet comprise cash at banks and on hand, demand deposit and short-term deposits, which are subject to an insignificant risk of changes in value.
For the purpose of the consolidated statement of cash flows, cash and cash equivalents consist of cash and short-term deposits, as defined above, net of outstanding bank overdrafts as they are considered an integral part of the Group’s cash management process.
2.13 Cash and cash equivalents
Current income tax assets and liabilities are measured at the amount expected to be recovered from or paid to the taxation authorities using the tax rates and tax laws that are in force at the reporting date.
Current income tax relating to items recognised outside the statement of profit and loss is recognised outside the statement of profit and loss (either in other comprehensive income or in equity). Current tax items are recognised in correlation to the underlying transaction either in OCI or directly in equity.
The Group offsets current tax assets and current tax liabilities where it has a legally enforceable right to set off the recognised amounts and where it intends either to settle on a net basis, or to realize the assets and settle the liability simultaneously.
Deferred income tax is recognised using the balance sheet approach.
2.14.1 Current income tax
2.14.2 Deferred tax
2.14 Income taxes
2016-17102103
286

NOTES FORMING PART OF CONSOLIDATED FINANCIALS STATEMENTSDeferred tax liabilities are recognised for all taxable temporary differences, except:
(i)
(ii)
Deferred tax assets are recognised to the extent that it is probable that taxable profit will be available against which the deductible temporary differences and the carry forward of unused tax credits and unused tax losses can be utilised.
The carrying amount of deferred tax assets is reviewed at each reporting date and reduced to the extent that it is no longer probable that sufficient taxable profit will be available to allow all or part of the deferred tax asset to be utilised.
Deferred taxes are not provided on the undistributed earnings of subsidiaries where it is expected that the earnings of the subsidiary will not be distributed in the foreseeable future.
Deferred tax assets and liabilities are offset when they relate to income taxes levied by the same taxation authority and the relevant entity intends to settle its current tax assets and liabilities on a net basis.
Deferred tax relating to items recognized outside the statement of profit and loss is recognised outside the statement of profit and loss. Such deferred tax items are recognised in correlation to the underlying transaction either in other comprehensive income or directly in equity.
Deferred tax assets and liabilities are measured using substantively enacted tax rates expected to apply to taxable income in the years in which the temporary differences are expected to be received or settled.
Minimum Alternate Tax (‘MAT’) credit is recognised as an asset only when and to the extent there is convincing evidence that the entity will pay normal income tax during the specified period. In the year in which the Company recognises MAT credit as an asset in accordance with the Guidance Note on Accounting for Credit Available in respect of Minimum Alterna-tive Tax under the Income-tax Act, 1961, the said asset is created by way of credit to the statement of profit and loss and shown as “MAT Credit Entitlement”. The Group reviews the “MAT Credit Entitlement” asset at each reporting date and reduces to the extent that it is no longer probable that sufficient taxable profit will be available to allow all or part of the MAT to be utilised.
When the deferred tax liability arises from the initial recognition of goodwill or an asset or liability in a transaction that is not a business combination and, at the time of the transaction, affects neither the accounting profit nor taxable profit or loss.
In respect of taxable temporary differences associated with investments in subsidiaries, associates and interests in joint ventures, when the timing of the reversal of the temporary differences can be controlled and it is probable that the temporary differences will not reverse in the foreseeable future.
The Group assesses, at each reporting date, whether there is an indication that an asset may be impaired. If any indication exists, or when annual impairment testing for an asset is required, the Group estimates the asset’s recoverable amount. An asset’s recoverable amount is the higher of an asset’s or cash-generating unit’s (CGU) fair value less costs of disposal and its value in use. Recoverable amount is determined for an individual asset, unless the asset does not generate cash inflows that are largely independent of those from other assets or groups of assets. When the carrying amount of an asset or CGU exceeds its recoverable amount, the asset is considered impaired and is written down to its recoverable amount.
In assessing value in use, the estimated future cash flows are discounted to their present value using a pre-tax discount rate that reflects current market assessments of the time value of money and the risks specific to the asset. In determining fair value less costs of disposal, recent market transactions are taken into account. If no such transactions can be identified, an appropriate valuation model is used. These calculations are corroborated by valuation multiples, quoted market prices or other available fair value indicators.
2.15 Impairment of non-financial assets
287

NOTES FORMING PART OF CONSOLIDATED FINANCIALS STATEMENTS
2.16.1 Construction materials and consumables
2.16.2 Construction work in progress
2.16.3 Finished stock of completed projects (ready units)
2.16.4 Food and beverages
2.16.5 Hospitality related operating supplies
2.16
Measurement and disclosure of the employee share-based payment plans is done in accordance with SEBI (Employee Stock Option Scheme and Employee Stock Purchase Scheme) Guidelines, 1999 and the Guidance Note on Accounting for Employee Share-based Payments, issued by ICAI. The Company measures compensation cost relating to employee stock options using the intrinsic value method. Compensation expense is amortized over the vesting period of the option on a straight line basis.
2.17 Share based payments - Equity-settled transactions
(ii)
(iii)
2.18
Inventories
Provisions and contingent liabilities
A disclosure for a contingent liability is made when there is a possible obligation or a present obligation that may, but probably may not, require an outflow of resources. A contingent liability also arises in extreme cases where there is a probable liability that cannot be recognised because it cannot be measured reliably.
• The Group has a present obligation (legal or constructive) as a result of a past event;• It is probable that an outflow of resources embodying economic benefits will be required to settle the obligation; and• A reliable estimate can be made of the amount of the obligation.
Where there is a possible obligation or a present obligation such that the likelihood of outflow of resources is remote, no provision or disclosure is made.
(i) A provision is recognised when:
The construction materials and consumables are valued at lower of cost or net realisable value. The construction materials and consumables purchased for construction work issued to the construction work in progress are treated as consumed.
The construction work in progress is valued at lower of cost or net realisable value. Cost includes cost of land, development rights, rates and taxes, construction costs, borrowing costs, other direct expenditure, allocated overheads and other incidental expenses.
Finished stock of completed projects and stock in trade of units is valued at lower of cost or net realisable value.
Stock of food and beverages are valued at lower of cost (computed on a moving weighted average basis, net of taxes) or net realizable value. Cost includes all expenses incurred in bringing the goods to their present location and condition.
Hospitality related operating supplies such as guest amenities and maintenance supplies are expensed as and when purchased.
2016-17104105
288

Borrowing costs that are directly attributable to the acquisition / construction of qualifying assets or for long - term project development are capitalised as part of their costs.
Borrowing costs are considered as part of the asset cost when the activities that are necessary to prepare the assets for their intended use are in progress.
Borrowing costs consist of interest and other costs that Group incurs in connection with the borrowing of funds. Other borrowing costs are recognised as an expense, in the period in which they are incurred.
2.19 Borrowing costs
Based on the “management approach” as defined in Ind AS 108 – Operating Segments, the Chairman and Managing Director / Chief Operating Decision Maker evaluates the Group’s performance based on an analysis of various performance indicators by business segment. Segment revenue and expense include amounts which can be directly attributable to the segment and allocable on reasonable basis. Segment assets and liabilities are assets / liabilities which are directly attributable to the segment or can be allocated on a reasonable basis. Income / expenses / assets / liabilities relating to the enterprise as a whole and not allocable on a reasonable basis to business segments are reflected as unallocated income / expenses / assets / liabilities.
2.20 Segment reporting
Retirement benefits in the form of contribution to provident fund and pension fund are charged to the statement of profit and loss.
Gratuity is in the nature of a defined benefit plan.
Provision for gratuity is calculated on the basis of actuarial valuations carried out at reporting date and is charged to the statement of profit and loss. The actuarial valuation is computed using the projected unit credit method.
Re-measurements, comprising of actuarial gains and losses, the effect of the asset ceiling, excluding amounts included in net interest on the net defined benefit liability and the return on plan assets (excluding amounts included in net interest on the net defined benefit liability), are recognised immediately in the balance sheet with a corresponding debit or credit to retained earnings through OCI in the period in which they occur. Re-measurements are not reclassified to profit or loss in subsequent periods.
Leave encashment is recognised as an expense in the statement of profit and loss account as and when they accrue. The Group determines the liability using the projected unit credit method, with actuarial valuations carried out as at balance sheet date. Actuarial gains and losses are recognised in the statement of other comprehensive income.
2.21 Employee benefits
Basic earnings per share is calculated by dividing the net profit / (loss) for the year attributable to equity shareholders (after deducting preference dividends and attributable taxes) by weighted average number of equity shares outstanding during the year.
For the purpose of calculating diluted earnings per share, the net profit / (loss) for the year attributable to equity shareholders and the weighted average numbers of shares outstanding during the year are adjusted for the effects of all dilutive potential equity shares.
2.22 Earnings per share
NOTES FORMING PART OF CONSOLIDATED FINANCIALS STATEMENTS
2.21.1 Defined contribution plans
2.21.2 Defined benefit plans
2.21.3 Other employee benefits
289

The preparation of consolidated financial statements in conformity with Ind AS requires management to make judgments, estimates and assumptions that affect the reported amounts of assets, liabilities, income, expenses and disclosures of contingent assets and liabilities at the reporting date. However, uncertainty about these assumptions and estimates could result in outcomes that require a material adjustment to the carrying amount of the asset or liability affected in future periods. Estimates and underlying assumptions are reviewed at each reporting date. Any revision to accounting estimates and assumptions are recognised prospectively i.e. recognised in the period in which the estimate is revised and future periods affected.
3 USE OF JUDGMENTS AND ESTIMATES
The following are significant management judgements in applying the accounting policies of the Group that have a significant effect on the financial statements.
3.1 Significant management judgements
Revenue is recognised using the percentage of completion method as construction progresses. The percentage of completion is estimated by reference to the stage of the projects determined based on the proportion of costs incurred to date and the total estimated costs to complete.
3.1.1 Significant management judgements
The Group determines whether a property is classified as investment property or as inventory:
(i)
(ii)
3.1.2 Classification of property
The Group has entered into leases of its investment properties. The Group has determined based on an evaluation of the terms and conditions of the arrangements, that it retains all the significant risks and rewards of ownership of these properties and so accounts for the leases as operating leases.
3.1.3 Operating lease contracts – the Group as lessor
The extent to which deferred tax assets can be recognised is based on an assessment of the probability of the Group’s future taxable income against which the deferred tax assets can be utilized. In addition, significant judgement is required in assessing the impact of any legal or economic limits or uncertainties in various tax jurisdictions.
3.1.4 Recognition of deferred tax assets
The management classifies the assets and liabilities into current and non-current categories based on the operating cycle of the respective business / projects.
3.2 Estimates and assumptions
3.2.1 Classification of assets and liabilities into current and non-current
NOTES FORMING PART OF CONSOLIDATED FINANCIALS STATEMENTS
Investment property comprises land and buildings that are not occupied for use by, or in the operations of, the Group, nor for sale in the ordinary course of business, but are held primarily to earn rental income and capital appreciation. These buildings are rented to tenants and are not intended to be sold in the ordinary course of business.
Inventory comprises property that is held for sale in the ordinary course of business. Principally these are properties that the Group develops and intends to sell before or on completion of construction.
2016-17106107
290

In assessing impairment, management estimates the recoverable amounts of each asset or CGU (in case of non-financial assets) based on expected future cash flows and uses an estimated interest rate to discount them. Estimation relates to assumptions about future cash flows and the determination of a suitable discount rate.
3.2.2 Impairment of assets
Inventory is stated at the lower of cost or net realisable value (NRV).
NRV for completed inventory property is assessed including but not limited to market conditions and prices existing at the reporting date and is determined by the Group based on net amount that it expects to realise from the sale of inventory in the ordinary course of business.
NRV in respect of inventories under construction is assessed with reference to market prices (reference to the recent selling prices) at the reporting date less estimated costs to complete the construction, and estimated cost necessary to make the sale. The costs to complete the construction are estimated by management.
3.2.4 Inventories
The cost of defined benefit gratuity plan and the present value of the gratuity obligation along with leave salary are determined using actuarial valuations. An actuarial valuation involves making various assumptions such as standard rates of inflation, mortality, discount rate, attrition rates and anticipation of future salary increases. Due to the complexities involved in the valuation and its long-term nature, a defined benefit obligation is highly sensitive to changes in these assumptions. All assumptions are reviewed at each reporting date.
3.2.5 Defined benefit obligation (DBO)
Management applies valuation techniques to determine the fair value of financial instruments (where active market quotes are not available) and non-financial assets. This involves developing estimates and assumptions consistent with how market participants would price the instrument / assets. Management bases its assumptions on observable data as far as possible but this may not always be available. In that case management uses the best relevant information available. Estimated fair values may vary from the actual prices that would be achieved in an arm’s length transaction at the reporting date.
3.2.6 Fair value measurements
The date of transition to Ind AS is April 01, 2015. The Group applied Ind AS 101 ‘First-time Adoption of Indian Accounting Standards’ in preparing these first Ind AS consolidated financial statements. The effects of the transition to Ind AS on equity, total comprehensive income and reported cash flows are presented in this section and are further explained in the accompanying notes.
Accordingly, the Group has prepared financial statements which comply with Ind AS applicable for periods ending on March 31, 2017 together with the comparative period data as at and for the year ended March 31, 2016 and April 01, 2015 being restated as described in the summary of significant accounting policies. In preparing these financial statements, the Group’s opening balance sheet was prepared as at April 01, 2015, the Group’s date of transition to Ind AS. This note explains the principal adjustments made and exemptions applied by the Group in restating its previous Indian GAAP financial statements, including the balance sheet as at April 01, 2015 and the financial statements as at and for the year ended March 31, 2016.
4 FIRST TIME ADOPTION OF IND AS
Management reviews its estimate of the useful lives of depreciable / amortisable assets at each reporting date, based on the expected usage of the assets. Uncertainties in these estimates relate to technical and economic obsolescence that may change the usage of certain assets.
3.2.3
NOTES FORMING PART OF CONSOLIDATED FINANCIALS STATEMENTS
Useful lives of depreciable / amortisable assets (Property, plant and equipment, intangible assets and investment property)
291

NOTES FORMING PART OF CONSOLIDATED FINANCIALS STATEMENTS4.1 First-time adoption exemptions applied
Fair value measurement of financial assets or financial liabilities at initial recognition
Property, plant and equipment (PPE), Intangible assets (IA) and Investment properties (IP)
Upon transition, Ind AS 101 permits certain exemptions from full retrospective application of Ind AS. The Group has applied the mandatory exceptions and certain optional exemptions, in preparing these financial statements, as set out below:
4.1.1 Mandatory exemptions applied by the Group
As per Ind AS 109, financial assets and liabilities that had been de-recognised before the date of transition to Ind AS under previous Indian GAAP have not been recognised under Ind AS.
As per Ind AS 109, impairment of financial assets needs to be applied retrospectively. The Group has reasonable and supportable information to determine the credit risk and it has concluded that the credit risk remains the same on the date of transition which was assessed to such instrument on the date of its initial recognition. Hence there is no impairment which is to be given effect retrospectively.
(ii)
(i)
4.1.2 Optional exemptions applied by the Group
Ind AS 101 provides optional exemption not to apply Ind AS 103 to any past Business combinations. Accordingly all the past Business combinations (acquisition of certain interests in joint arrangements) prior to April 01, 2015 have been accounted in accordance with previous Indian GAAP. Goodwill arising from business combination has been stated at the carrying amount of investment under Ind AS.
Ind AS 101 provides optional exemption not to apply Ind AS 102 to all equity instruments that vested before that date of transition. Company has issued Stock Options under Employee Stock Option Plan (ESOP 2009). However, all the options have been vested before the transition date i.e. April 01, 2015. Therefore, Company has availed the exemption.
Ind AS 101 provides optional exemption to have a deemed cost as a starting point for the items of PPE, IA and IP instead of cost determined as per the requirement of Ind AS 16. Group has opted to carry forward the PPE, IA and IP under Ind AS at deemed costs i.e. carrying value under previous Indian GAAP as on April 01, 2015.
Ind AS 101 provides optional exemption to use a deemed cost when measuring an investment in a subsidiary, joint venture or associate in the separate opening statement of financial position instead of cost determined as per the requirement of Ind AS 27. In its separate financial statements, Group has measured investments in subsidiaries and joint arangements at deemed cost i.e. carrying value under previous Indian GAAP as on April 01, 2015.
Ind AS 111 provides optional exemption to recognise the investment in the joint venture at transition date as aggregate of the carrying amounts of the assets and liabilities previously proportionately consolidated and goodwill arising from acquisition, if any, when the entity changes from proportionate consolidation to the equity method. Group has measured investments in joint venture at deemed cost i.e.carrying value under previous Indian GAAP as on April 01, 2015.
Ind AS 101 provides optional exemption to apply Ind AS 109 prospectively. Group has availed the said exemption.
(i) Business combinations
(ii) Share based payment transactions
(iv) Investments in subsidiaries and joint arrangements
(v) Joint ventures
(vi)
(iii)
2016-17108109
292

4.2 Reconciliations The following reconciliations provide the effect of transition to Ind AS from IGAAP in accordance with Ind AS 101: 1 Equity as at April 1, 2015 and March 31, 2016 2 Net profit for the year ended March 31, 2016
1 Reconciliation Statement of equity as previously reported under IGAAP to Ind AS
ASSETSI) Non-current assetsa) Property, plant and equipmentb) Investment propertyc) Intangible assetsd) Capital work in progresse) Goodwill on consolidationf) Financial assets i) Investmentsg) Deferred tax assets (net)h) Other non-current assets
2,6,7,912
2,3,10
62,862.79 10,629.41 17,466.22
2,20,601.84
74,801.95
(334.53) (3,456.94)
43,943.92
1,37,664.74
10,294.88 14,009.28
2,64,545.76
1,20,730.67
10,223.09 14,298.78
2,48,383.18
64,329.77
(268.67) (3,665.89)
33,333.24
II) Current assetsa) Inventoriesb) Financial assets i) Investments ii) Trade receivables iii) Cash and cash equivalents iv) Bank balances other than (iii) above v) Loansc) Current tax assets (net)d) Other current assets
TOTAL ASSETS (I+II)
2,4,5
2,8222
2,92
2,3,10
3,93,059.06
7,441.12 11,702.91 21,763.53 10,322.38
9,227.55 1,966.91
97,604.64 5,53,088.10 7,73,689.94
(59,134.67)
4.90 (478.42) (626.34) (273.06)
(2,322.72)
(58.65) (6,368.79)
(69,257.75) (25,313.83)
3,33,924.39
7,446.02 11,224.49 21,137.19 10,049.32
6,904.83 1,908.26
91,235.85 4,83,830.35 7,48,376.11
56,400.90 10,491.76 17,964.67
2,15,049.94
3,48,174.74
- 8,281.35
16,157.22 13,211.27
1,635.36 3,782.69
1,03,278.55 4,94,521.18 7,09,571.12
2,99,697.89
- 7,529.25
15,779.01 12,902.40
3,987.20 3,743.51
97,334.91 4,40,974.17 6,89,357.35
(48,476.85)
- (752.10) (378.21) (308.87)
2,351.84
(39.18) (5,943.64)
(53,547.01) (20,213.77)
Particulars Balance Sheet as at March 31, 2016
Explanation Opening Balance Sheet as at April 1, 2015
EQUITY AND LIABILITIESI) Equitya) Equity share capitalb) Other equity
2,13
33,930.38 4,96,497.93
5,30,428.31
0.01 3,684.38 3,684.39
33,930.39 5,00,182.31
5,34,112.70
32,823.80 4,30,604.83
4,63,428.63
32,823.80 4,41,250.23
4,74,074.03
-10,645.40
10,645.40
II) Liabilitiesi) Non-current liabilitiesa) Financial liabilities i) Borrowings ii) Trade payables iii) Other financial liabilitiesb) Provisionsc) Other non-current liabilities
4211
2,142,3,10
48,444.88 700.95
- 138.53
5,031.03 54,315.39
(13,501.50) (325.46) 337.84
(1.12) (406.89)
(13,897.13)
34,943.38 375.49 337.84 137.41
4,624.14 40,418.26
72,991.61 645.59
- 119.09
7,824.42 81,580.71
59,864.54 101.08 727.86 118.36
7,220.07 68,031.91
(13,127.07) (544.51) 727.86
(0.73) (604.35)
(13,548.80)i) Current liabilitiesa) Financial liabilities i) Borrowings ii) Trade payables iii) Other financial liabilitiesb) Other current liabilitiesc) Provisions
TOTAL LIABILITIES (i+ii)TOTAL EQUITY AND LIABILITIES (I+II)
42
4,112,3,10
13
10,814.17 4,642.81 4,896.75
1,68,295.41 297.10
1,88,946.24 2,43,261.63 7,73,689.94
(106.17) (396.40)
(2,809.99) (11,781.36)
(7.17) (15,101.09) (28,998.22) (25,313.83)
10,708.00 4,246.41 2,086.76
1,56,514.05 289.93
1,73,845.15 2,14,263.41 7,48,376.11
10,814.17 3,532.37 6,351.29
1,35,575.03 8,288.92
1,64,561.78 2,46,142.49 7,09,571.12
10,708.00 3,488.81 8,635.56
1,24,035.04 384.00
1,47,251.41 2,15,283.32 6,89,357.35
(106.17) (43.56)
2,284.27(11,539.99) (7,904.92)
(17,310.37)(30,859.17)(20,213.77)
(` in Lakh)
Effects oftransition to
Ind AS IGAAP IGAAP Ind AS Ind AS
Effects oftransition to
Ind AS
NOTES FORMING PART OF CONSOLIDATED FINANCIALS STATEMENTS
97,452.71 -
257.75 5,394.69
26,538.27
1,21,21,222
(73,052.43) 73,042.70
(0.02) (518.54)
(26,538.27)
24,400.28 73,042.70
257.73 4,876.15
-
1,01,327.73 -
149.27 2,177.34
26,538.27
(75,058.58) 75,047.75
(0.12) (512.75)
(26,538.27)
26,269.15 75,047.75
149.15 1,664.59
-
293

--
--
-
Other comprehensive income Re - measurement gains / (losses) on defined benefit plans Income tax effect Share of Other Comprehensive Income in Associates and Joint Ventures, to the extent not to be classified into profit / (loss)
Particulars Explanation Year Ended March 31, 2016
INCOMERevenue from operationsOther incomeTotal revenue
EXPENSESOperating costsExcise dutyEmployee benefits expenseOther expensesDepreciation and amortisationInterest and finance chargesTotal expensesProfit before Exceptional items and taxPrior period income / (expenses)Add/Less: Exceptional itemsProfit before share of profit/(loss) from joint ventures and taxesShare of Profit / (loss) of associates / joint ventures (net)Profit before taxesTax expenseCurrent taxDeferred tax(Excess) / short provision of tax in earlier years
(39.95) 13.45
(39.95) 13.45
805.71 656.10
1,461.81
1,40,809.00 3,620.60
1,44,429.60
62,956.61 13.71
5,763.37 5,330.10 4,899.49
78,979.39
21,663.251,149.89
45.87
(9.98) 79.20 (0.05)
21,653.27 1229.09
45.82
2,3,102,4,5,6,7,8,9,11
2
2,14
(2.92) -
(57.53) (18.97)
0.01 667.15 587.74 874.07 65,450.21
-
---
65,450.21
65,450.21 1,033.57 66,483.78 159.50 159.50
874.07 66,324.28
62,953.69 13.71
5,705.84 5,311.13 4,899.50
683.26 79,567.13 66,324.28
1,41,614.71 4,276.70
1,45,891.41
IGAAP Ind ASEffects of transitionto Ind AS
2 Reconciliation Statement of Profit and Loss as previously reported under IGAAP to Ind AS
(` in Lakh)
42,591.20 964.40 43,555.60
936.35
(28.05) (28.05)
43,527.55 42,591.20
16.11
2
4,6,7
-
-
22,12
2
1412
2
14 (1.55) (1.55)
Total comprehensive income / (expenses) for the year net of tax
Total comprehensive income for the year (Comprising profit/(loss) and other comprehensive income for the year)
Profit/ loss for the period
NOTES FORMING PART OF CONSOLIDATED FINANCIALS STATEMENTS
2016-17110111
294

NOTES FORMING PART OF CONSOLIDATED FINANCIALS STATEMENTSExplanations for the reconciliation of the Balance Sheet and Profit and Loss Statement as previously reported under IGAAP to Ind AS:
1. Property Plant and Equipment, Investment Properties and Intangibles Assets
Under the previous Indian GAAP, investment property were presented as part of Fixed Asset, whereas under Ind AS, investment properties are required to be shown separately under the head "Investment Property". The Group has elected to measure property, plant and equipment, intangible assets and investment properties at deemed cost at the date of transition to Ind AS.
2. Joint Venture
The Group holds as on March 31, 2016 50% (April 01, 2015: 50%) interest in Aion Realty LLP, in Saldanha Realty And Infrastructure LLP, in I-Ven Realty Limited, in Siddhivinayak Realties Private Limited, 31.67% (April 01, 2015: 31.67%) in Sangam City Township Private Limited, 33% (April 01, 2015: 33%) in Metropark Infratech And Realty Developments Private Limited, 27% (April 01, 2015: 25%) in Oasis Realty and 50% in Shri Siddhi Avenues LLP. Under previous Indian GAAP, the Group had proportionately consolidated its interest in the said entities in the Consolidated Financial Statement. On transition to Ind AS, the Group has assessed and determined that the said entities are its Joint Ventures (JV's) under Ind AS 111 Joint Arrangements. Therefore, it needs to be accounted for using the equity method as against proportionate consolidation. For the application of equity method, the initial investment is measured as the aggregate of Ind AS amount of assets and liabilities that the Group had previously proportionately consolidated including any goodwill arising on acquisition. Derecognition of proportionately consolidated JVs has resulted in change in balance sheet, statement of profit and loss and cash flow statement.
3. Lease straight lining On the transition date, the group has recognised operating lease rentals on a straight line basis retrospectively from the date of commencement of lease, including fit-out (rent free) period. 4. Redeemable non convertible debenture (NCDs)
NCDs are measured at amortised cost. Transaction costs incurred towards origination of borrowing have been deducted from the carrying amount of borrowing as part of interest expenses by applying the EIR method. Under previous Indian GAAP, these transaction cost were charged to statement of profit and loss as and when incurred.
5. Foreign currency derivative Under the previous Indian GAAP, forward premium is required to be amortised over the forward contract period. Under Ind AS, the fair value (mark to market gains and losses) of forward foreign exchange contracts is to be recognised in statement of profit and loss. 6. 0% Optionally convertible debentures (OCD)
Under the previous Indian GAAP, OCDs have been classified as investment measured at cost. Under Ind AS, OCDs are measured at fair value on initial recognition. The discounting rate to be used is the borrowing rate applicable to the borrower on the date of issue of OCDs. The difference between the fair value and the nominal value is considered as investment in other equity of joint ventures, since OCDs satisfies SPPI criteria, subsequent recognition has been measured at amortised costs using the EIR method. The unwinding of discount is treated as finance income and recognised in statement of profit and loss.
7. Non cumulative non convertible preference shares (NCPS)
Under the previous Indian GAAP, NCPS has been classified as a long term investments and are carried at cost. Under Ind AS, initially the same been measured at fair value. Subsequently it has been measured at amortised costs using the EIR method. The unwinding of discount is treated as finance income and recognised in statement of profit and loss. The excess of carrying amount over the fair value of NCPS after discounting has been shown as Investment in other equity of joint venture.
8. Fair Value of Investments
Under the previous Indian GAAP, investment in mutual funds were classified as current investments. Current investments were carried at lower of cost and fair value. Under Ind AS, these investments are required to be measured at fair value. The resulting fair value changes of these investments have been recognised in retained earning / statement of profit and loss.
9. Inter-company loans
Under the previous Indian GAAP, the interest free inter-company loans were carried at nominal amount. Under Ind AS such loans are measured at fair value on initial recognition. The discounting rate to be used is the borrowing rate applicable to the borrower on the date of the loan. The difference between the fair value and the nominal value of loan is considered as investment in subsidiaries / joint ventures. Subsequently such loans are measured at amortised costs. The unwinding of discount is treated as interest income and is accrued as per the EIR method.
295

NOTES FORMING PART OF CONSOLIDATED FINANCIALS STATEMENTS10. Security deposits
Under the previous Indian GAAP, the interest free security deposits both received and paid were carried at nominal amount. Under Ind AS, Lease/Security deposits received and paid are measured at fair value on initial recognition. Unwinding of discount is treated as interest expense/income and is accrued as per the EIR method. The difference between the fair value and the nominal value of deposits is considered as rent in advance/prepaid rent and recognised over the lease term on a straight line basis.
11. Corporate guarantee
Under Ind AS, corporate financial guarantee given are measured at their fair value on initial recognition. Subsequently these contracts are measured at the higher of amount of impairment loss allowance as per Ind AS 109 and amount initially recognised less, where appropriate, cumulative amortisation recognised.
12. Deferred Tax
Under the previous Indian GAAP, tax expenses in consolidated financial statements were computed by performing line by line addition of tax expenses of the parent and its subsidiaries. Under Ind AS, deferred tax has been recognised on the adjustment made on transition to Ind As.Previous Indian GAAP required deferred tax accounting using the income statement approach, which focuses on differences between taxable profits and accounting profits for the period. Ind AS 12 required entities to account for deferred taxes using the balance sheet approach, which focuses on temporary differences between the carrying amount of an asset or liability in the balance sheet and its tax base. The application of Ind AS 12 approach has resulted in recognition of deferred tax on new temporary differences which was not required under previous Indian GAAP.
13. Proposed dividend
Under the previous Indian GAAP, proposed dividend including dividend distribution tax (DDT), were recognised as liability in the period to which they relate, irrespective of when they were declared. Under Ind AS, proposed dividend is recognised as a liability in the period in which it is declared by the Company, usually when approved by shareholders in a general meeting or paid.
14. Defined benefit liabilities
Both under previous Indian GAAP and Ind AS, the Group recognised costs related to its post-employment defined benefit plan on an actuarial basis. Under previous Indian GAAP, the entire cost, including remeasurements, are charged to profit or loss. Under Ind AS, remeasurements [comprising of actuarial gains and losses, the effect of the asset ceiling, excluding amounts included in net interest on the net defined benefit liability and the return on plan assets excluding amounts included in net interest on the net defined benefit liability] are recognised immediately in the balance sheet with a corresponding debit or credit to retained earnings through OCI.
15. Figures for the previous year have been regrouped, re-arranged, reclassified wherever necessary.
2016-17112113
296

NO
TES
FORM
ING
PA
RT O
F C
ON
SOLI
DA
TED
FIN
AN
CIA
L ST
ATE
MEN
TS
-
Part
icu
lars
A
ircr
aft
* R
esid
entia
l b
uild
ing
#
(` in
Lak
h)
505
.34
505.3
4 3
9.37
39.3
7 78.7
4
426.6
0
62.
54
1.
21
2.4
2
60.1
2
17
,410
.68
1.9
0(0
.46)
2,5
36.9
2 2
23.7
3 (0
.53)
3,9
90.7
5 6
7.80
(1
1.25
)
Gro
ss c
arry
ing
valu
e as
at A
pril
1, 2
016
Add
ition
s (D
educ
tions
) / (D
ispo
sals
)
47
9.79
355
.51
77.
63
117.
02
1,5
14.0
1
8
30.5
9
Elec
tric
al
inst
alla
tion
s an
d e
qu
ipm
ents
*
Pla
nt
an
d
m
ach
iner
y*
V
ehic
les*
C
om
pu
ters
* To
tal
O
ffic
e eq
uip
men
ts*
Bu
ildin
gs
F
urn
iture
an
d f
ixtu
res*
Gro
ss c
arr
yin
g v
alu
e as
at
Marc
h 3
1, 2017
A
ccum
ulat
ed d
epre
ciat
ion
and
am
ortis
atio
n as
at A
pril
1, 2
016
Dep
reci
atio
n fo
r th
e ye
ar
(Ded
uctio
ns) /
(Dis
posa
ls)
Clo
sin
g a
ccu
mu
late
d d
epre
ciatio
n a
nd
a
mort
isatio
n a
s at
Marc
h 3
1, 2017
Net
carr
yin
g v
alu
e as
at
Marc
h 3
1, 2017
69.
32
28.
51
(1.2
3) 96.6
0
1,5
14.0
1
-
-
635.9
4
-
216
.47
141
.33
(0
.52)
3
57.2
8
210.6
2
26,
785.
82
818.
78
(18.
70)
2,3
85.5
4 2
,453
.05
22,7
50.9
0
27,5
85.9
0
Part
icu
lars
A
ircr
aft
* Re
sid
entia
l b
uild
ing
#
(` in
Lak
h)
505
.34
39.3
7 -
39.3
7
465.9
7
62.
54
1.21
-
61.3
3
1.2
1
17,
408.
05
17,0
89.9
7
320.7
1
2,2
90.8
3 64
9.61
(0.3
1)
1,8
87.6
2
3,8
64.4
2 90
9.37
(0.0
8) 3
,081.4
6
909.2
9
Gro
ss c
arry
ing
valu
e as
at A
pril
1, 2
015
(Dee
med
cos
t) A
dditi
ons
(Ded
uctio
ns) /
(Dis
posa
ls)
4
80.2
9 77
.89
(0.2
6) 77.6
3
479.7
9
Ele
ctri
cal
in
stalla
tion
s an
d e
qu
ipm
ents
*
Pla
nt
an
d
m
ach
iner
y*
V
ehic
les*
C
om
pu
ters
* To
tal
O
ffic
e eq
uip
men
ts*
Bu
ildin
gs
F
urn
iture
an
d f
ixtu
res*
Gro
ss c
arr
yin
g v
alu
e as
at
Marc
h 3
1, 2016
Acc
umul
ated
dep
reci
atio
n an
d a
mor
tisat
ion
as a
t Apr
il 1,
201
5 D
epre
ciat
ion
for
the
year
(D
educ
tions
) / (D
ispo
sals
) C
losi
ng
acc
um
ula
ted
dep
reci
atio
n a
nd
a
mort
isatio
n a
s at
Marc
h 3
1, 2016
Net
carr
yin
g v
alu
e as
at
Marc
h 3
1, 2016
48.
35
41.2
0
28.
13 (0
.01)
1,5
12.9
9
292
.62
-
292.6
2
1,2
21.3
9
96
.34
67.
30
(0.0
1) 6
7.2
9
149.1
8
26,
269.
15
2
,385.5
4
24,4
00.2
8
402.1
6
Not
e:
* Th
e ab
ove
incl
udes
Gro
ss B
lock
of `
510
.74
lakh
(PY
` 5
10.7
4 la
kh) h
eld
in th
e na
me
of A
OP
on c
o-ow
ners
hip
basi
s.
# R
esid
entia
l bui
ldin
g in
clud
es 5
sha
res
of `
10 e
ach
of a
hou
sing
soc
iety,
whi
ch is
pen
ding
for
trans
fer.
NO
TE 2
: P
RO
PERTY
, PL
AN
T A
ND
EQ
UIP
MEN
TS
520.
80
(4.
13)
120.
171.
35 (1
.85)
1.0
2 -12
8.10
(1.7
7) 2
1.03
(0.
06)
246.
50
(0.4
1)2.
63
-
-
-
-
-
-
-
-
-
-
-
-
-
-
-
320.
71
(3.
59)
(
0.42
)
2,38
6.21
(0.3
1)32
0.57
17,4
12.1
2 6
2.5
4
1.21
640.9
7
16,7
71.1
5
320.
71
-
-
-
-
649.
30
668.
30
(0.0
4)
1,3
17.5
6
1,4
42.5
6
2,7
60.1
2
--
28.1
2
20.
64
(0.6
4)
48.1
2
48.4
8
913.
42
(2.1
8)
909.
2929
2.62
292.
73
1,8
20.5
3585.3
5
928.6
62,2
26.7
7
4,0
47.3
0
-
(4.7
1)
649.3
028.1
2
(0.6
7)
26,7
85.8
2216.4
71,5
14.0
13,9
90.7
569.3
22,5
36.9
2
17,4
10.6
862.5
4505.3
4
(0.0
4)
67.
29
79.
79
146.6
6
4,8
35.0
0
194.6
5
297

NO
TES
FORM
ING
PA
RT O
F C
ON
SOLI
DA
TED
FIN
AN
CIA
L ST
ATE
MEN
TS
A Part
icu
lars
La
nd
-
fr
eeh
old
La
nd
-
fr
eeh
old
(` in
Lak
h)
(` in
Lak
h)
11,
102.
41
11,1
02.4
1 5
0,94
7.15
351
.76
1,8
06.2
9 9
02.9
1
936
.20
87.
90 (1
4.69
)
9.0
9 0
.46
2,0
46.0
5 3
9.02
2,0
82.4
9
Gro
ss c
arry
ing
valu
e as
at A
pril
1, 2
016
Add
ition
s (D
educ
tions
) / (D
ispo
sals
)
7
5,48
1.13
1
,028
.25
76,3
78.2
5
Gro
ss c
arr
yin
g v
alu
e as
at
Marc
h 3
1, 2017
O
peni
ng A
ccum
ulat
ed d
epre
ciat
ion
and
am
ortis
atio
n as
at A
pril
1, 2
016
Dep
reci
atio
n fo
r th
e ye
ar
(Ded
uctio
ns) /
(Dis
posa
ls)
Clo
sin
g a
ccu
mu
late
d d
epre
ciatio
n a
nd
a
mort
isatio
n a
s at
Marc
h 3
1, 2017
10,
434.
97
54
9.11
(2.
89)
1
0,9
81.1
9
5.2
6
-
-
5
.26
Fu
rnitu
res
an
d f
ixtu
res
11,
102.
41
11,1
02.4
1
11,1
02.4
1
Part
icu
lars
50,
783.
0716
4.08
902.9
1
50,0
44.2
4
916.
03
282
.87
282.8
7
653.3
3
6.7
9
3.2
8 3.2
8
5.8
1
2,
041.
214.
84
334
.73
334.7
3
1,7
11.3
2
Gro
ss c
arry
ing
valu
e as
at A
pril
1, 2
015
(Dee
med
cos
t) A
dditi
ons
(Ded
uctio
ns) /
(Dis
posa
ls)
Gro
ss c
arr
yin
g v
alu
e as
at
Marc
h 3
1, 2016
Ope
ning
Acc
umul
ated
dep
reci
atio
n an
d a
mor
tisat
ion
as a
t Apr
il 1,
201
5 D
epre
ciat
ion
for
the
year
(D
educ
tions
) / (D
ispo
sals
)
Clo
sin
g a
ccu
mu
late
d d
epre
ciatio
n a
nd
a
mort
isatio
n a
s at
Marc
h 3
1, 2016
Net
carr
yin
g v
alu
e as
at
Marc
h 3
1, 2016
10,1
94.6
5
912.8
2
9,5
22.1
5
3.59
1.8
2
1.8
2
3.4
4
Fu
rnitu
res
an
d f
ixtu
res
75,
047.
75
75,4
81.1
3
2,4
38.4
3
73,0
42.7
0
NO
TE 3
: I
NV
ESTM
ENT
PRO
PERTI
ES
495.1
6
1,0
09.4
1(1
10.9
7)51,1
87.9
4
(0.5
9)(1
.34)
(2.5
8)
(15.
66)
(131
.13)
(10.
70)
514.2
5
-
- - - - - -
-
2.41
92
9.46
912.
8233
4.73
336.
54
1.82
2,
438.
43
2,41
8.62
1.72
-
Build
ing
s
Build
ing
s
Elec
tric
al
inst
alla
tion
san
d e
qu
ipm
ents
Elec
tric
al
inst
alla
tion
san
d e
qu
ipm
ents
Com
pu
ters
Com
pu
ters
Tota
l
Tota
l
Plan
t an
dm
ach
iner
y
Plan
t an
dm
ach
iner
y
Off
ice
equ
ipm
ents
Off
ice
equ
ipm
ents
4,8
41.3
9
- -
- -
- - - - - - -
- -
- -
- -
-
- -
- -
-
50,9
47.1
5936.2
010,4
34.9
72,0
46.0
5
912.
8390
2.91
(0.0
1)(0
.01)
2,43
8.44
20.1
72.
30
9.0
95.2
6
240.
52(0
.20)
1.
6743
3.58
(0.2
0)
11,1
02.4
1N
et c
arr
yin
g v
alu
e as
at
Marc
h 3
1, 2017
906.
41
49,3
81.6
5
282.
87
242.
08
(3.0
3)
3.28
9.5
5
5.6
91,8
41.6
9669.9
33.5
4
1.7
21,4
12.5
63.8
69,1
39.5
071,5
36.8
6
2016-17114115
298

Particulars
(` in Lakh)
Not later than one year Later than one year and not later than five years Later than five years Lease income recognised during the year in profit and loss
March 31, 2016 April 1, 2015
10,390.73 17,932.16 - 18,638.12
4,929.57 5,497.43 - 17,391.59
8,314.22 6,060.37 - -
(ii) Contractual obligations
(iii) Leasing arrangements
(iv) Fair value
Refer Note 38 for disclosure of contractual obligations to purchase, construct or develop investment property or its repairs, maintenance or enhancements.
The Group’s investment properties consist of four commercial properties in Mumbai. The management has determined that the investment properties consist of - Commerz, Commerz II phase I, Oberoi International School and Oberoi Mall based on the nature, characteristics and risks of each property.
As at March 31, 2017, March 31, 2016 and April 1, 2015, the fair values of the properties are ` 3,12,840 lakh, ` 2,56,340 lakh and ` 2,48,500 lakh respectively. These valuations are based on valuations performed by independent valuer. All fair value estimates for investment propertries are included in level 3. The Group has no restrictions on the realisability of its investment properties and no contractual obligations to purchase, construct or develop investment properties or for repairs, maintenance and enhancements.
NOTES FORMING PART OF CONSOLIDATED FINANCIAL STATEMENTS
NOTE 3 : INVESTMENT PROPERTIES (contd.)
Particulars
(` in Lakh)
Rental income derived from investment properties Direct operating expenses (including repairs and maintenance) generating rental income Direct operating expenses (including repairs and maintenance) that did not generate rental income
Profit arising from investment properties before depreciation
Depreciation for the year Profit arising from investment properties
March 31, 2016
17,886.01 1,255.80 -
March 31, 2017
19,389.58 1,583.04 -
17,806.54
15,387.92
2,418.62
16,630.21
14,191.77
2,438.44
(i) Amounts recognised in profit and loss for investment properties
March 31, 2017
299

Particulars
(` in Lakh)
Gross carrying value as at April 1, 2016 Additions (Deductions) / (Disposals) Gross carrying value as at March 31, 2017
Accumulated depreciation and amortisation as at April 1, 2016 Amortisation for the year (Deductions) / (Disposals) Closing accumulated depreciation and amortisation as at March 31, 2017 Net carrying value as at March 31, 2017
Computer Software
332.58 27.06 -
359.64 74.85
77.87 - 152.72 206.92
(` in Lakh)
(` in Lakh)
Particulars
Gross carrying value as at April 1, 2015 (Deemed cost) Additions (Deductions) / (Disposals)
Gross carrying value as at March 31, 2016 Accumulated depreciation and amortisation as at April 1, 2015 Amortisation for the year (Deductions) / (Disposals) Closing accumulated depreciation and amortisation as at March 31, 2016
Computer Software
149.15 183.43 -
332.58
74.85 74.85 257.73 Net carrying value as at March 31, 2016
Note: Addition to intangible assets mainly comprises of purchases of software licenses.
AS AT
March 31, 2017 March 31, 2016 April 1, 2015
Property, Plantand Equipments
Investment Property
Intangible assets Total
7.39 342.30 13.89
10,896.23 4,533.85 1,591.75
47.26 - 58.95
10,950.88 4,876.15 1,664.59
NOTE 4 : INTANGIBLE ASSETS
Note : Capital work in progress as at March 31, 2017 mainly comprises of expenditure towards social infrastructure (School) and office space building.
NOTE 5 : CAPITAL WORK IN PROGRESS
-
-
NOTES FORMING PART OF CONSOLIDATED FINANCIAL STATEMENTS
2016-17116117
300

Investments in partnership firms as at March 31, 2017 March 31, 2016 April 1, 2015
(` in Lakh)
Allwyn SaldanhaGeraldine SaldanhaExpressions Realty Private LimitedTotal
Partners NameShare ofpartner
25.00%25.00%50.00%
100.00%
12.50 12.50 25.00 50.00
50.00%50.00%
100.00%50.00%17.50%15.00%14.00%
3.50%100.00%
1,000.00 0.18 0.15 0.14 0.04
1,000.5199.90%
0.10%100.00%
- - -
12.50 12.50 25.00 50.00
1,000.00 0.18 0.15 0.14 0.04
1,000.51 1.00 0.00 1.00
- - -
5.00 5.00
10.00
12.50 12.50 25.00 50.00
- - - - - - - - -
5.00 5.00
10.00
NOTE 6 : INVESTMENTS MARCH 31, 2017 MARCH 31, 2016 APRIL 1, 2015
(` in Lakh)
Investment in equity of joint ventures 4,18,26,070 (March 31, 2016: 4,18,26,070, April 1, 2015: 4,18,26,070) equity shares of ` 10 each fully paid up of Siddhivinayak Realties Private Limited 9,500 (March 31, 2016: 9,500, April 1, 2015: 9,500) equity shares of ` 10 each fully paid up of Sangam City Township Private Limited 5,00,000 (March 31, 2016: 5,00,000, April 1, 2015: 5,00,000) equity shares of ` 10 each fully paid up of I-Ven Realty Limited 15,121 (March 31, 2016: 15,121, April 1, 2015: 15,121) equity shares of ` 100 each fully paid up of Metropark Infratech and Realty Developments Private Limited
Investment in partnership firms of joint ventures Saldanha Realty And Infrastructure LLP (1)
Aion Realty LLP (2)
Shri Siddhi Avenues LLP (3)
Schematic Estate LLP (4)
Investment in joint venture Oasis Realty (AOP)
Investment carried at amortised cost Investment in preference shares of joint venture 3,62,500 (March 31, 2016: 3,62,500, April 1, 2015: 3,62,500) 1% non cumulative non convertible Preference Shares of ` 10 each fully paid up of I-Ven Realty Limited
Investment in debentures of joint ventures 0% optionally convertible debenture of ` 100 each fully paid up of I-Ven Realty Limited Nil (March 31, 2016: 47,95,000, April 1, 2015: 47,95,000) 2011-Series-1 to 5 Nil (March 31, 2016: 18,31,000, April 1, 2015: 18,31,000) 2012-Series-1 to 9 Nil (March 31, 2016: 10,000, April 1, 2015: 10,000) 2013-Series-1 to 4 Nil (March 31, 2016: 3,89,500, April 1, 2015: 3,89,500) 2014-Series-1 to 9 Nil (March 31, 2016: 4,42,875, April 1, 2015: 7,500) 2015-Series-1 to 8 Nil (March 31, 2016: 14,000, April 1, 2015: Nil) 2016-Series-1and 2
0% optionally convertible debentures of `100 each fully paid up of Siddhivinayak Realties Private Limited Nil (March 31, 2016: 5,950, April 1, 2015: 5,950) 2012-Series-1 and 2 Nil (March 31, 2016: 52,620, April 1, 2015: 52,620) 2013-Series-1 to 16 Nil (March 31, 2016: 48,000, April 1, 2015: 48,000) 2014-Series-1 to 11 Nil (March 31, 2016: 8,250, April 1,2015: Nil) 2015-Series-1 and 2 Nil (March 31, 2016: 1,500, April 1, 2015: Nil) 2015-Series-1 Investment in government securities National saving certificate (in the name of employee of the Company)
4,187.75
2,765.24
29,176.80
149.11
4,571.94
- 672.72
0.00
1,18,036.99
616.68
- - - - - -
- - - - -
4,190.20
2,858.94
29,540.92
139.65
4,458.41 4.35
988.94 -
88,251.65
558.01
4,215.00 1,606.62
8.81342.04 391.79
12.43
4.95 43.94 39.86
6.96 1.27
4,193.42
2,944.03
29,811.21
151.78
4,320.55 4.28
- -
73,150.24
504.67
3,800.67 1,446.58
7.96 308.17
5.95 -
4.46 39.64 35.85
- -
Oberoi Constructions LimitedAllwyn SaldanhaTotalIntegrus Realty Private LimitedKishor R`athodMahendra RathodRaju RathodJignesh Kothari TotalShri Siddhi Avenues LLPIntegrus Realty Private LimitedTotal
1) Capital in Saldanha Realty And Infrastructure LLP
2) Capital in Aion Realty LLP
3) Capital in Shri Siddhi Avenues LLP
4) Capital in Schematic Estate LLP
0.82 1,60,178.05
- 1,37,664.74
1.21 1,20,730.67
NOTES FORMING PART OF CONSOLIDATED FINANCIAL STATEMENTS
Non-current
Unquoted
301

MARCH 31, 2017 MARCH 31, 2016 APRIL 1, 2015
(` in Lakh)
Deferred tax assets On other expenses On carried forward lossesDeferred tax liabilities On depreciation On lease equalisation reserve On fair valuation of investments
Add: MAT credit entitlementDeferred tax assets (net)
69.56 97.94
NOTE 7 : DEFERRED TAX ASSETS (NET)
2,358.25 443.44
5.15(2,639.34)12,613.40 9,974.06
92.05 98.26
2,479.10 332.02
0.83 (2,621.64) 12,916.52 10,294.88
51.23 -
2,477.48 267.18
- (2,693.43) 12,916.52
10,223.09
Movement in deferred tax
TotalParticular
(` in Lakh)
As at April 1, 2015 - to profit or loss - to other comprehensive incomeAs at March 31, 2016 - to profit or loss - to other comprehensive incomeAs at March 31, 2017
10,223.09 (71.79)
- 10,294.88
320.82 -
9,974.06
NOTE : 8 OTHER ASSETS
NOTE : 9 INVENTORIES
MARCH 31, 2017 MARCH 31, 2016 APRIL 1, 2015
APRIL1, 2015
(` in Lakh)
MARCH 31, 2017
LONG TERM (NON CURRENT) SHORT TERM (CURRENT)
MARCH 31, 2016 APRIL 1, 2015
Unsecured and considered goodCapital advances
Advances other than capital advancesSecurity depositsOther advancesAdvances to vendorsAdvances recoverable in cash or kindRevenue in excess of billing
OthersPrepaid expensesAccrued incomeAdvance against flatsLease equilisation reserve
-
35,694.21
38,053.09 12,839.95
5,073.51
-
35,686.69
34,728.42 10,989.55
6,365.04
-
36,584.27
34,356.39 6,380.35
19,048.80
223.39
13,150.16
63.00 186.75
87.52
13,020.39
63.00 86.38
122.72
12,898.19
63.73 727.64
MARCH 31, 2017 MARCH 31, 2016
(` in Lakh)
Plots of landWorks in progress Finished goodsFood and beverages etc.Assets held for saleOthers (transferrable development rights)
514.91 3,60,244.99
14,324.06 116.98 161.18
1,274.60 3,76,636.72
514.91 3,17,855.83
13,578.09 153.93
- 1,821.63
3,33,924.39
514.91 2,72,443.94
22,198.16 136.80
- 4,404.08
2,99,697.89
- - -
54.95 - -
632.78 14,311.03
42.01 - -
709.98 14,009.28
9.76 - -
476.74 14,298.78
578.15 253.45
2,579.60 645.75
95,717.71
449.31 194.12
2,579.60 243.12
91,235.85
423.69 233.58
- 307.83
97,334.91
NOTES FORMING PART OF CONSOLIDATED FINANCIAL STATEMENTS
2016-17118119
302

NOTES FORMING PART OF CONSOLIDATED FINANCIAL STATEMENTS
MARCH 31, 2017 MARCH 31, 2016 APRIL1, 2015
(` in Lakh)
CurrentUnquotedInvestment carried at amortised cost Investment in debentures of joint ventures 0% optionally convertible debenture of ` 100 each fully paid up of I-Ven Realty Limited 47,95,000 (March 31, 2016: Nil, April 1, 2015: Nil) 2011-Series-1 to 5 18,31,000 (March 31, 2016: Nil, April 1, 2015: Nil) 2012-Series-1 to 9 10,000 (March 31, 2016: Nil, April 1, 2015: Nil) 2013-Series-1 to 4 3,89,500 (March 31, 2016: Nil, April 1, 2015: Nil) 2014-Series-1 to 9 4,42,875 (March 31, 2016: Nil, April 1, 2015: Nil) 2015-Series-1 to 8 3,49,000 (March 31, 2016: Nil, April 1, 2015: Nil) 2016-Series-1 to 26 2,44,000 (March 31, 2016: Nil, April 1, 2015: Nil) 2017-Series-1 to 12
0% optionally convertible debentures of Siddhivinayak Realties Private Limited of ` 100 each fully paid up 5,950 (March 31, 2016: Nil, April 1, 2015: Nil) 2012-Series-1 and 2 52,620 (March 31, 2016: Nil, April 1, 2015: Nil) 2013-Series-1 to 16 48,000 (March 31, 2016: Nil, April 1, 2015: Nil) 2014-Series-1 to 11 8,250 (March 31, 2016: Nil, April 1, 2015: Nil) 2015-Series-1 and 2 36,200 (March 31, 2016: Nil, April 1, 2015: Nil) 2016-Series-1 to 7
QuotedInvestment carried at fair value through profit or loss Investment in mutual funds 7,174 (March 31, 2016: Nil, April 1, 2015: Nil) units of ` 1,000 each of Axis Liquid Fund - Direct Plan - Growth Option 13,058 (March 31, 2016: 11,229, April 1, 2015: Nil) units of ` 100 Birla Sun Life Cash Plus Direct Plan - Growth Option (March 31, 2017: 954 units having market value of ` 2.49 lakh is lien marked) 2,67,649 (March 31, 2016: Nil, April 1, 2015: Nil) units of ` 1,000 each of BOI AXA Liquid Fund - Direct - Growth Option 19,02,479 (March 31, 2016: 75,395, April 1, 2015: Nil) units of ` 100 each of DHFL Pramerica Insta Cash Plus Fund -Direct Plan - Growth Option (March 31, 2017: 16,29,606 units having market value of ` 3,444.28 lakh is lien marked) 1,20,141 (March 31, 2016: 1,09,751, April 1, 2015: Nil) units of ` 1,000 each of Kotak Floater Short Term Fund - Direct Plan - Growth Option 44,244 (March 31, 2016: Nil, April 1, 2015: Nil) units of ` 1,000 each of L&T Liquid Fund - Direct - Growth Option 46,081 (March 31, 2016: Nil, April 1, 2015: Nil) units of ` 1,000 each of Principal Cash Management Fund - Direct Plan - Growth Option 3,280 (March 31, 2016: 1,632, April 1, 2015: Nil) units of ` 1000 each of Reliance Liquid Fund - Treasury Plan - Direct Plan - Growth Option Nil (March 31, 2016: 264, April 1, 2015: Nil) units of ` 1,000 each of Kotak Liquid Scheme Plan A - Direct Plan - Growth Option Nil (March 31, 2016: 386, April 1, 2015: Nil) units of ` 1,000 each of HDFC Cash Management Fund - Savings Plan - Direct Plan - Growth Option
4,673.20 1,783.85
9.75 379.53 432.17 341.14 238.97
129.37
34.12
5,015.07
4,021.02
3,207.02
986.66
729.95
130.15
-
-
148.43
2,728.78
-
-
60.28
8.12
12.20
Nil (March 31, 2016: 15,56,948, April 1, 2015: Nil) units of ` 100 each of ICICI Prudential Liquid -Direct Plan - Growth Option (March 31, 2016: 4,41,336 units having book value of ` 989.86 lakh is lien marked) Nil (March 31, 2016: 24,340, April 1, 2015: Nil) units of ` 1,000 each of Reliance Liquidity Fund - Direct Plan - Growth Option Nil (March 31, 2016: 17,346, April 1, 2015: Nil) units of ` 1,000 each of SBI Premier Liquid Fund - Direct Plan - Growth Option
Aggregate amount of Book value of quoted investmentsMarket value of quoted investments
22,252.01 7,446.02
3,492.03
555.85
413.01
5.50 48.70 44.32
7.67 33.85
-------
-----
-----
--
-
-
-
-
-
-
-
-
-
-
-
-
-
-
--
-
-
-
-------
14,235.21 14,253.36
7,437.12 7,446.02
27.32
NOTE 10 : INVESTMENTS
303

NOTES FORMING PART OF CONSOLIDATED FINANCIAL STATEMENTS
MARCH 31, 2017 MARCH 31, 2016 APRIL 1, 2015
(` in Lakh)
(` in Lakh)
10,578.83
10,578.83
11,224.49
11,224.49
7,529.25
7,529.25
MARCH 31, 2017 MARCH 31, 2016 APRIL 1, 2015
Balances with banksCash on handFixed deposits with banks, having original maturity of three months or lessFixed deposit with banks, having original maturity of more than three months but less than twelve months
3,659.44
39.86
3,558.57
14,089.74
21,347.61
4,049.94
16.67
4,793.94
12,276.64
21,137.19
3,562.18
39.22
12,177.61
-
15,779.01
Unsecured and considered good
NOTE 11 : TRADE RECEIVABLES
NOTE 12 : CASH AND CASH EQUIVALENTS
(` in Lakh)
(` in Lakh)
4.37
5,320.25
10,049.32
1.29
10,035.87
12,902.40
MARCH 31, 2017 MARCH 31, 2016 APRIL 1, 2015
Balance with banks in dividend / unclaimed dividend accountsFixed deposits with banks, having original maturity of more than twelve monthsFixed deposits with banks (lien marked)
NOTE 13 : OTHER BANK BALANCES
2.13
6,275.09
13,818.64
7,541.42 4,724.70 2,865.24
MARCH 31, 2017 MARCH 31, 2016 APRIL 1, 2015NOTE 14 : LOANS
CurrentUnsecured and considered goodLoans to related parties (refer note 34)Loan to joint ventures
Other loans and advancesLoan to othersLoans to employees
Loans / advances due by directors or other officers, etc.Advances to related parties includeDue from the private limited company (JV) in which the Company's director is a director
12,208.60
1,105.25 55.99
13,369.84
3,118.81
5,778.71
1,105.2520.87
6,904.83
2,824.03
2,879.38
1,105.252.57
3,987.20
2,556.48
MARCH 31, 2017 MARCH 31, 2016 APRIL 1, 2015(` in Lakh)
NOTE 15 : CURRENT TAX ASSETS (NET)
Income tax (net of provisions) 1,783.85 1,783.85
1,908.26 1,908.26
3,743.51 3,743.51
Accounting Profit before Income Tax Tax on Accounting Profit at statutory income tax rate of 34.608% (March 31, 2016: 34.608%)Adjustment for disallowable expensesChange in tax rate in respect of subsidiaries in consolidationAdjustment for expenses / deductions allowable under Income Tax Act Adjustment for exempt income Adjustment for Computation as per Income Computation and Disclosure StandardsTax expense reported in the Statement of profit & loss (Current Tax)
56,229.6919,459.97
1,718.89(4.22)
(2,133.03)(138.35)(225.32)
18,677.95
66,324.2822,953.51
1,876.10(4.01)
(2,019.98)(36.40)
(1,115.95)21,653.27
March 31, 2016March 31, 2017Particular
Note: Reconciliation of tax expense and the accounting profit multiplied by India’s domestic tax rate for March 31, 2017 and March 31, 2016:
(` in Lakh)
2016-17120121
304

NOTES FORMING PART OF CONSOLIDATED FINANCIAL STATEMENTS
(` in Lakh)
B. Terms / rights attached to equity sharesThe Company has only one class of equity shares having par value of ` 10 per share. Each shareholder of equity shares is entitled to one vote per share. The Company declares dividends in Indian rupees. The dividend proposed by the Board of Directors is subject to the approval of the shareholders in the ensuing Annual General Meeting.
The Board of Directors of the Company has proposed dividend of ` 2 per equity share for the financial year 2016-2017. The payment of dividend is subject to approval of the shareholders in the ensuing Annual General Meeting of the Company. For the previous year, the Board of Directors of the Company recommended and shareholders approved dividend of ` 2 per equity share.
Authorised share capital42,50,00,000 (42,50,00,000) equity shares of ` 10 (Rupees ten only) each
Issued, subscribed and paid up share capital33,95,35,426 (33,93,03,845) equity shares of ` 10 (Rupees ten only) each fully paid upAdd: Issue of fresh shares on preferential basisAdd: Issue of fresh shares on exercise of options vested under Employee Stock Option Scheme
42,500.00
42,500.00
42,500.00
42,500.00
42,500.00
42,500.00
33,930.39
-
23.16
33,953.55
32,823.80
1,100.00
6.59
33,930.39
32,823.80
-
-
32,823.80
MARCH 31, 2017 MARCH 31, 2016 APRIL 1, 2015NOTE 16 : SHARE CAPITAL
A. Reconciliation of shares outstanding at the beginning and at the end of the yearEquity shares
March 31, 2016
At the beginning of the yearAdd: Issue of fresh shares on preferential basisAdd: Issue of fresh shares on exercise of options vested under Employee Stock Option SchemeAt the end of the year
33,930.39 -
23.16 33,953.55
32,82,37,969 1,10,00,000
65,876
33,93,03,845
March 31, 2017
` in Lakh in No. ` in Lakh in No.
33,93,03,845 -
2,31,581 33,95,35,426
32,823.80 1,100.00
6.59
33,930.39
Particulars
C. Details of shareholders holding more than 5% shares in the Company
As per the records of the Company, including its register of shareholders / members and other declarations received from shareholders regarding beneficial interest, the above shareholding represents both legal and beneficial ownership of shares.
Equity shares
April 1, 2015
i) Vikas Oberoiii) R S Estate Developers Private Limited
21,28,72,504
3,33,00,000
in No. % Holding
64.85%
10.15%
March 31, 2016
21,28,72,504 3,33,00,000
in No. % Holding
62.74%9.81%
March 31, 2017
21,28,73,614
3,33,00,000
in No. % Holding
62.70%9.81%
Name
D. Shares reserved for issue under options The Company instituted an Employees Stock Option Scheme (‘ESOP 2009’) pursuant to the Board and Shareholders’ resolution dated December 04, 2009. As per ESOP 2009, the Company is authorised to grant 14,43,356 (14,43,356) options comprising equal number of equity shares in one or more tranches to the eligible employees of the Company and its subsidiaries. The employee will have the option to exercise the right within three years from the date of vesting of options. Under ESOP 2009, 13,49,553 (13,49,553) options have been granted, out of which as on date of balance sheet 94,739 (5,15,751) options are outstanding.
305

NOTES FORMING PART OF CONSOLIDATED FINANCIAL STATEMENTS
NOTE 16 : SHARE CAPITAL (contd.)
The following information relates to the Employee Stock Options as on March 31, 2017
Particulars
Outstanding at the beginning of the yearLess: Lapsed / forfeited / cancelled during the yearLess: Exercised during the yearOutstanding at the end of the yearExercisable at the end of the year
260 -
260 260 260
Weightedaverage
exercise price(`)
Weighted averagecontractual lifeof options as on
the date ofgrant (Years)
4.20--
4.204.20
5,15,751 1,89,431 2,31,581
94,739 94,739
Number of options
Exercise price(`)
260 -
260 260 260
Weightedaverage
exercise price(`)
Weighted averagecontractual lifeof options as on
the date ofgrant (Years)
Number of options
Exercise price(`)
The following information relates to the Employee Stock Options as on March 31, 2016
Particulars
Outstanding at the beginning of the yearLess: Lapsed / forfeited / cancelled during the yearLess: Exercised during the yearOutstanding at the end of the yearExercisable at the end of the year
260 -
260 260 260
4.20--
4.204.20
7,32,534 1,50,907
65,876 5,15,751 5,15,751
260 -
260 260 260
The employee share based payments have been accounted using the intrinsic value method measured by a difference between the market price of the underlying equity shares as at the date of grant and the exercise price. Since the market price of the underlying equity shares on the grant date is sameas exercise price of the option, the intrinsic value of option is determined as ` Nil (` Nil). Hence no compensation expense has been recognised. Under the fair value method, there would have been no impact on the basic and diluted EPS for the year.
2016-17122123
306

NOTES FORMING PART OF CONSOLIDATED FINANCIAL STATEMENTS
MARCH 31, 2017
LONG TERM (NON-CURRENT) SHORT TERM (CURRENT)
MARCH 31, 2016 APRIL 1, 2015 MARCH 31, 2017 MARCH 31, 2016 APRIL 1, 2015
i) Loan from related party (refer note 34)Unsecured From director* -
-
- -
-
- --
-
-
-
-
- -
- -
-
8,908.00 8,908.00
24,962.92
24,964.81
24,931.56 1,209.49
5,345.30
1,203.90
1,203.90
10,708.00 10,708.00
10,708.00 10,708.00
General reserveBalance in General reserve
Capital redemption reserveBalance in Capital redemption reserve
Capital reserveBalance in Capital reserve
Securities premium accountOpening balanceAdd: receipt during the yearLess: share issue expensesBalance in Securities premium account
Capital reserve on consolidationBalance in Capital reserve on consolidation
Retained earningsOpening balance Profit during the year as per statement of profit and lossItems of other comprehensive income recognised directly in retained earnings
Transfer to retained earnings of re - measurement gains / (losses) on defined benefit plans, net of taxes
Dividend (including dividend distribution tax)
23,275.82 23,275.82
5,710.00 5,710.00
3,590.00 3,590.00
1,66,618.60 578.95
-
7,585.19
7,585.19
2,93,402.70 37,858.76
22.48
-
3,31,283.94 5,38,642.50
23,275.82 23,275.82
5,710.00 5,710.00
3,590.00 3,590.00
1,35,144.38 31,514.69
7,585.19 7,585.19
2,65,944.84 43,555.60
(28.05)
(16,069.69)
2,93,402.70 5,00,182.31
23,275.82 23,275.82
5,710.00 5,710.00
3,590.00 3,590.00
1,35,144.38 - -
7,585.19 7,585.19
2,65,944.84 -
- -
2,65,944.84 4,41,250.23
*Interest free and repayable on demand
MARCH 31, 2017 MARCH 31, 2016 APRIL 1, 2015
(` in Lakh)
NOTE 17 : OTHER EQUITY
(` in Lakh)
NOTE 18 : BORROWINGS
ii) DebenturesSecured10.85% Redeemable Non-Convertible DebentureNil (Nil) - Series I (Face value of ` Nil (` Nil) each fully paid up), redeemable on April 21, 2015Nil (Nil) - Series II (Face value of ` Nil (` Nil) each fully paid up), redeemable on April 21, 2016Nil (250) - Series III (Face value of ` Nil (` 100.00 lakh) each fully paid up), redeemable on April 21, 2017
-
(40.47) 1,67,197.55 1,66,618.60 1,35,144.38
307

NOTES FORMING PART OF CONSOLIDATED FINANCIAL STATEMENTS
Terms of Redeemable Non-Convertible Debentures
During the year ended March 31, 2017, the Company has issued 750 number 9.25% Redeemable Non-Convertible Debentures (NCDs) (Series V, VI, VII) of ` 100.00 lakh each amounting to ` 75,000.00 lakh through private placement. The entire issue proceeds have been utilised in accordance with the objects of the issue.
The coupon rate is 9.25% p.a., payable semi-annually. The Company has an option to redeem the Series VI and Series VII NCDs prior to the scheduled redemption date mentioned above in one or more tranches, subject to payment of early redemption premium.
During the year ended March 31, 2017, debentures (Series III and IV) amounting to ` 35,000.00 lakh has been redeemed by the Company prior to its scheduled redemption date.
Security
The Debentures are secured by (i) mortgage of the unsold identified residential units (inventories) in one of the project of the subsidiary company, (ii) charge on receivables and Escrow Account into which receivables are deposited from the sale of flats in one of the project of the subsidiary company and (iii) further secured by way of an irrevocable and unconditional corporate guarantee of the Company. The security cover as required under the terms of the issue of the said Debentures is maintained.
MARCH 31, 2017
LONG TERM (NON-CURRENT) SHORT TERM (CURRENT)
MARCH 31, 2016 APRIL 1, 2015 MARCH 31, 2017 MARCH 31, 2016 APRIL 1, 2015
-
-
-
-
- - -
-
-
-
-
-
-
9,980.46
34,943.38 59,864.54
9,968.17 - 483.80 481.56
(` in Lakh)
NOTE 18 : BORROWINGS
24,986.04
24,979.24
24,972.49
74,937.77
34,943.38 59,864.54 74,937.77
34,943.38 59,864.54 74,937.77
Nil (100) - Series IV (Face value of ` Nil (` 100.00 lakh) each fully paid up), redeemable on August 21, 20179.25% Redeemable Non-Convertible Debenture250 (Nil) - Series V (Face value of ` 100.00 lakh (Nil) each fully paid up), redeemable on April 23, 2019250 (Nil) - Series VI (Face value of ` 100.00 lakh (Nil) each fully paid up), redeemable on April 23, 2020250 (Nil) - Series VII (Face value of ` 100.00 lakh (Nil) each fully paid up), redeemable on April 23, 2021
Less: Amount included under 'other financial liabilities'
1,006.17
1,006.17
1,006.17
(3,018.51)
3,018.51
11,926.51
8,908.00
(1,693.29)
1,693.29
12,401.29
10,708.00
-
-
-
(8,234.66)
8,234.66
18,942.66
10,708.00
(contd.)
Total (i+ii)
2016-17124125
308

NOTES FORMING PART OF CONSOLIDATED FINANCIAL STATEMENTS
Trade payablesTotal outstanding dues of micro enterprises and small enterprises Total outstanding dues of creditors other than micro enterprises and small enterprisesOthersTotal outstanding dues of micro enterprises and small enterprises Total outstanding dues of creditors other than micro enterprises and small enterprises
Terms and conditions of the above :Trade payables are non-interest bearing and are settled in accordance with the contract terms with the vendors.For explanations on the Company’s credit risk management processes, please refer to note 39.
MARCH 31, 2017
LONG TERM (NON-CURRENT) SHORT TERM (CURRENT)
MARCH 31, 2016 APRIL 1, 2015 MARCH 31, 2017 MARCH 31, 2016 APRIL 1, 2015
-
-
659.41
53.88
-
319.56
-
101.08
(` in Lakh)
NOTE 19 : TRADE PAYABLES
- -
713.29
55.93
375.49
-
101.08
32.62
42.76
4,654.26
680.54
12.05
3,956.63
2,820.10
668.71
- -
5,410.18
277.73
4,246.41
-
3,488.81
(` in Lakh)
Financial liabilities measured at amortised costCurrent portion of long term borrowings (refer note 18)Guarantee liabilityOthersDividend payout accountUnclaimed dividend
LONG TERM (NON-CURRENT) SHORT TERM (CURRENT)
-
-
-
6.19
6.19
NOTE 20 : OTHER FINANCIAL LIABILITIES
-
-
-
337.84
337.84
-
-
-
727.86
727.86
3,018.51
- -
2.13
422.04
3,442.68
1,693.29
2.64 1.73 1.29
389.10
8,234.66
399.61
2,086.76 8,635.56
Provision for employee benefitsProvision for gratuity (refer note 32)Provision for leave salary (refer note 32)
LONG TERM (NON-CURRENT) SHORT TERM (CURRENT)
-
170.77
170.77
(` in Lakh)
NOTE 21 : PROVISIONS
-
137.41
137.41
-
118.36
118.36
169.18
31.67
200.85
257.66 351.49
32.27
289.93
32.51
384.00
MARCH 31, 2017 MARCH 31, 2016 APRIL 1, 2015 MARCH 31, 2017 MARCH 31, 2016 APRIL 1, 2015
MARCH 31, 2017 MARCH 31, 2016 APRIL 1, 2015 MARCH 31, 2017 MARCH 31, 2016 APRIL 1, 2015
309

NOTES FORMING PART OF CONSOLIDATED FINANCIAL STATEMENTS
Revenue from operations Revenue from projects Revenue from hospitality Rental and other related revenues Property and management revenuesOther operating revenue
74,638.28 12,574.28 19,389.58
3,849.53 922.72
1,11,374.39
1,06,329.06 12,712.43 17,886.01
3,849.64 837.57
1,41,614.71
2,256.30 1,448.76
36.79 163.73 808.61
9.24 6.37
4,729.80
1,645.26 1,011.46
111.45 110.85
1,386.71 8.89 2.08
LONG TERM (NON-CURRENT) SHORT TERM (CURRENT)
(` in Lakh)
NOTE 22 : OTHER LIABILITIES
Billing in excess of revenue recognisedRent received in advanceAdvances from customersTrade depositsOther payablesOther depositsProvision for expensesStatutory duesOthers
-
756.14 -
6,344.44
- - - -
7,100.58
-
299.68 -
4,324.46
- - - -
4,624.14
-
366.87 -
6,853.20
- - - -
7,220.07
1,42,706.71
609.19 2,975.95
11,098.15
16.71 10,070.12
937.84 3,512.88
1,71,927.55
1,25,404.44
373.12 3,546.74
10,769.01
0.21 10,769.44
825.96 4,825.13
1,56,514.05
1,03,586.74
563.17 -
7,748.01
- - -
12,137.12 1,24,035.04
Interest income on Bank fixed deposits Financial assets measured at amortised cost OthersDividend income on investmentsProfit on sale of investments (net)Profit / (loss) of investments in mutual fund measured at fair value through profit and loss account (net)Other non-operating income
NOTE 23 : REVENUE FROM OPERATIONS
(` in Lakh)
MARCH 31, 2016MARCH 31, 2017
NOTE 24 : OTHER INCOME
(` in Lakh)
MARCH 31, 2016MARCH 31, 2017
MARCH 31, 2017 MARCH 31, 2016 APRIL 1, 2015 MARCH 31, 2017 MARCH 31, 2016 APRIL 1, 2015
2016-17126127
310

NOTES FORMING PART OF CONSOLIDATED FINANCIAL STATEMENTS
12.36 12.36
13.71 13.71
Excise duty
11,047.16 718.30 384.07
12,149.53 5,733.36 6,416.17
10,429.91 661.19 433.70
11,524.80 5,818.96 5,705.84
Employee costsContribution to provident fund, gratuity and othersStaff welfare expenses
Less: allocated to projects / capitalized
3,17,855.83 13,578.09
153.93 3,31,587.85
547.03
11,500.29 43,732.50
5,641.72 5,746.06 2,615.36 4,658.97
5,733.36 1,002.166,648.41
87,825.86
3,60,244.99 14,324.06
116.98 1,020.55
3,75,706.58 43,707.13
2,72,443.94 22,198.16
136.80 2,94,778.90
2,822.56
35,740.86 25,677.65
8,883.35 10,760.36
2,360.53 4,907.94
5,818.96 617.84
5,520.84 1,03,110.89
3,17,855.83 13,578.09
153.93 3,348.25
3,34,936.10 62,953.69
NOTE 25 : OPERATING COSTS
(` in Lakh)
MARCH 31, 2016MARCH 31, 2017
Opening balance of works in progress Opening stock of finished goodsOpening stock of food and beverages etc.
Add: transferred from current assetsAdd: expenses incurred during the year Land, development right and transferrable development rights Materials, labour and contract cost Other project costs Rates and taxes Professional charges Food, beverages and hotel expenses
Allocated expenses to projects Employee benefits expense Other expenses Interest and finance charges
Less:Closing balance of works in progressClosing stock of finished goodsClosing stock of food and beverages etc.Transfer to current assets / PPE / investment properties / capital work in progress
NOTE 26 : EXCISE DUTY
(` in Lakh)
MARCH 31, 2016MARCH 31, 2017
NOTE 27 : EMPLOYEE BENEFITS EXPENSE
(` in Lakh)
MARCH 31, 2016MARCH 31, 2017
Advertising and marketing expensesBooks and periodicals expensesCommunication expensesConveyance and travelling expensesCorporate social responsibility expensesDirectors sitting fees and commissionDonationsElectricity chargesHire chargesInformation technology expensesInsurance chargesLegal and professional charges(Gain) / loss on foreign exchange fluctuation (net)(Gain) / loss on sale / discarding of investment properties (net)(Gain) / loss on sale / discarding of property, plant and equipment (net)Membership and subscription chargesMiscellaneous expenses
1,143.40 2.27
76.13 179.31
84.13 69.31 30.24
274.87 47.47
371.22 349.71 149.96
(8.21) 117.05
(2.42) 26.25
594.29
1,651.11 2.54
93.43 226.05 574.82
75.02 46.60
203.37 43.48
364.30 242.09
99.56 11.63
0.73 (0.13) 21.29
237.27
NOTE 28 : OTHER EXPENSES
(` in Lakh)
MARCH 31, 2016MARCH 31, 2017
(A)
(B)
(C)(A+B-C)
311

NOTES FORMING PART OF CONSOLIDATED FINANCIAL STATEMENTS
NOTE 29 : DEPRECIATION AND AMORTISATION
Payment to auditor (refer note below)Printing and stationery expensesRent expensesRepairs and maintenance Building Plant and machinery OthersSecurity expensesVehicle expenses
Less: allocated to projects / capitalised
105.88 133.51
19.99
81.77 121.45 902.21 339.13
25.32 5,234.24 1,002.16 4,232.08
100.07 188.87
18.61
137.24 148.96
1,228.13 190.45
23.48 5,928.97
617.84 5,311.13
Note : Payment to auditor
NOTE 28 : OTHER EXPENSES (contd.)
(` in Lakh)
MARCH 31, 2016MARCH 31, 2017
MARCH 31, 2016MARCH 31, 2017
As auditor Statutory audit fees (including for Limited Review) Tax audit fees
In other capacity Taxation matters Company law matters Other servicesOut of pocket expenses
70.05 17.00
16.50 2.00 0.21 0.12
105.88
72.05 12.50
12.50 2.00 0.92 0.10
100.07
2,453.05 2,418.62
77.87 4,949.54
2,386.21 2,438.44
74.85 4,899.50
7,177.01 28.62
7,205.63 6,648.41
557.22
6,085.55 118.55
6,204.10 5,520.84
683.26
37,858.76 33,93,94,402
18,559 33,94,12,961
10 11.15 11.15
43,555.60 33,59,77,183
- # 33,59,77,183
10 12.96 12.96
# Anti-dilutive
(` in Lakh)
(` in Lakh)
March 31, 2016March 31, 2017
Depreciation on property, plant and equipmentsDepreciation on investment propertiesAmortisation of intangible assets
NOTE 30 : INTEREST AND FINANCE CHARGES
(` in Lakh)
March 31, 2016March 31, 2017Interest expenses Financial liabilities at amortised costBank and finance charges
Less: allocated to projects / capitalized
NOTE 31 : EARNINGS PER SHARE (EPS)
(` in Lakh)
March 31, 2016March 31, 2017
Profit after tax as per statement of profit and loss Weighted average number of equity shares for basic EPS (in No.) Add: Weighted average potential equity shares on grant of option under ESOP (in No.) Weighted average number of equity shares for diluted EPS (in No.) Face value of equity share (`) Basic earnings per share (`) Diluted earnings per share (`)
2016-17128129
312

NOTES FORMING PART OF CONSOLIDATED FINANCIAL STATEMENTS
NOTE 32 : EMPLOYEE BENEFITS
425.98 68.22 13.33
0.38
359.70 56.91 11.77
0.34
(` in Lakh)
(` in Lakh)
MARCH 31, 2016MARCH 31, 2017
A.
Employer’s contribution to provident fund Employer’s contribution to pension fund Employer’s contribution to ESIC Labour welfare fund contribution for workmen
Defined contribution plans
1,000.97 78.02
183.08 -
(11.77) (37.66) (11.31)
1,201.33
743.29 57.94
266.83 19.19
(37.66) (11.31)
1,038.30
1,201.31 1,038.28
1,000.95 743.29
202.44 -
169.68 -
343.23 27.52
366.25 34.70
(47.15) 18.74
743.29
- - - - -- -
- - - - -- -
700.30 56.66
164.57 33.20 74.65
(47.15) 18.74
1,000.97
169.68 13.23 56.75
- (11.97) (25.25)
- 202.44
150.87 12.10 52.19
4.65 (0.06)
(50.07) -
169.68
March 31, 2017 March 31, 2016 March 31, 2017 March 31, 2016
i)
ii)
iii)
Present value obligation at the beginning of the year Interest cost Service cost Past service cost - vested benefits Re-measurement (or actuarial) (gain) / loss Benefit paid Employee's transfer Present value obligation at the end of the year
Change in fair value of plan assets Fair value of plan assets at the beginning of the yearExpected return on plan assetEmployer's contributionReturn on plan assets , excluding amount recognisedin net interest expense Benefit paid Employee's transfer Closing balance of fair value of plan assets
Amount recognised in the balance sheet Present value of obligation at the end of yearFair value of plan assets at the end of the yearNet liability recognised in the balance sheet
B. Defined benefit plans
Change in present value of obligations
Gratuity Leave encashment
183.08 78.02
- -
(57.94) -
203.16
(11.77) (19.19)
(30.96) 172.20
203.16 (30.96)
232.48 39.95
58.01 -
68.88 -
74.65 (34.70)
39.95 272.43
- - -
58.01
- - -
68.88
164.57 56.66
5.57 33.20
(27.52) -
232.48
56.75 13.23
- - -
(11.97) 58.01
52.19 12.10
- 4.65
- (0.06) 68.88
iv)Current service costInterest costPast service cost - non vested benefitsPast service cost - vested benefitsExpected return on plan assetsRe-measurement (or actuarial) (gain) / lossExpenses recognised in statement of profit and loss
Expense recognised in statement of profit and loss
v)Re-measurement (or actuarial) (gain) / lossReturn on plan assets, excluding amount recognisedin net interest expense
Total expenses
Out of the above expenses Recognised in profit and loss Recognised in other comprehensive income
Expense recognised in other comprehensive income
257.66 172.20
(266.83) 163.03
351.48 272.43
(366.25) 257.66
169.68 58.01
(25.25) 202.44
150.87 68.88
(50.07) 169.68
vi) Movement in the liability recognised in balance sheetOpening net liabilityExpenses as aboveContribution paidClosing net liability
*163.03 -
257.66 -
31.67 170.77
32.27 137.41
vii) Classification of defined benefit obligationsCurrent portionNon-current portion
* The current portion is net of asset of `6.16 lakh which is not recognised in the balance sheet on conservative basis.
163.03 257.66 202.44 169.68
313

NOTES FORMING PART OF CONSOLIDATED FINANCIAL STATEMENTS
(` in Lakh)
March 31, 2017 March 31, 2016 March 31, 2017 March 31, 2016
Actuarial (Gains) / losses on obligation due to change in demographic assumption (e.g. employee turnover and mortality)Actuarial (Gains) / losses on obligation due to change in financialassumption (e.g. future increase in salary)
(Gains) / losses on obligation due to changein assumption
Gratuity Leave encashment
7.40%9.50%
7.80%10.00%
8.00%10.00%
7.40%9.50%
7.80%10.00%
8.00%10.00%
C. General Description of significant defined plans
Gratuity planGratuity is payable to all eligible employees of the Company on death or on resignation, or on retirement after completion of five years of service.
D. Broad category of plan assets relating to gratuity as a percentage of total plan assets as at,
Actuarial gains and losses-Experience history
Leave plan
March 31, 2017 March 31, 2016 April 1, 2015 March 31, 2017 March 31, 2016 April 1, 2015
Interest / discount rate Annual expected increasein salary cost
Gratuity Leave encashment
Nil Nil Nil Nil
100%100%
Nil Nil Nil Nil
100%100%
Nil Nil Nil Nil
100%100%
March 31, 2017 March 31, 2016 April 1, 2015
Government of India securitiesHigh quality corporate bondsEquity shares of listed companiesPropertyPolicy of insurance
1,168.03 861.36
1% increase(` in Lakh)
1% decrease(` in Lakh)
Future salary increases
NOTE 32 : EMPLOYEE BENEFITS (contd.)
Actuarial assumptions
19.06
(14.45)
(0.16)
6.11 (14.71)
24.26
Gratuity Plan
Assumptions
Sensitivity Level
Impact on defined benefitobligation
March 31, 2017 March 31, 2016
Eligible employees can carry forward defined leave as per HR policy in month of April of every year during tenure of service or encash the same on death, permanent disablement or resignation.
Sensitivity analysis
A quantitative sensitivity analysis for significant assumption as shown below:
860.03 1,173.40
1% increase(` in Lakh)
1% decrease(` in Lakh)
Discount rate
1,409.42 1,027.79
1% increase(` in Lakh)
1% decrease(` in Lakh)
Future salary increases
1,026.35 1,415.83
1% increase(` in Lakh)
1% decrease(` in Lakh)
Discount rate
189.84 152.65
1% increase(` in Lakh)
1% decrease(` in Lakh)
Future salary increases
Leave Plan
Assumptions
Sensitivity Level
Impact on defined benefitobligation
March 31, 2017 March 31, 2016
152.54 190.41
1% increase(` in Lakh)
1% decrease(` in Lakh)
Discount rate
230.13 179.32
1% increase(` in Lakh)
1% decrease(` in Lakh)
Future salary increases
179.23 230.85
1% increase(` in Lakh)
1% decrease(` in Lakh)
Discount rate
(0.72) (1.42)
2016-17130131
314

NOTES FORMING PART OF CONSOLIDATED FINANCIAL STATEMENTS
37.10 156.25 114.09
4,462.22 4,769.66
39.96 149.52 124.19
3,874.65 4,188.32
31.67 49.85 19.00 580.47 680.99
32.27 45.39 21.53 443.13 542.31
NOTE 32 : EMPLOYEE BENEFITS (contd.)
Expected employer's contribution in future years
Risk exposure
(` in Lakh)
March 31, 2017 March 31, 2016 March 31, 2017 March 31, 2016
1 yearBetween 2 and 5 yearsBetween 6 and 10 yearsBeyond 10 yearsTotal expected payments
Particulars Gratuity Leave encashment
a. Asset Volatility: The plan liabilities are calculated using the discount rate set with reference to Government securities bond yields; if plan assets underperform this yield, this will create a deficit.
b. Change in Government securities bond yields:A decrease in bond yields will increase plan liabilities, although this will be partially offset by an increase in the value of the plans' bond holdings.
** Shri Siddhi Enterprise was converted into Shri Siddhi Avenues LLP on March 17, 2016.@ The ownership interest mentioned is for Residential business of AoP. In hospitality business of Oasis Realty, ownership interest of the Group is 50%.
Joint venture in which group is a co-venturer
NOTE 33 : INTEREST IN JOINT VENTURE
A. Group Information
Percentage ofholding as on
March 31,2016
Percentage ofholding as onApril 01, 2015
Percentage ofholding as on
March 31,2017
PrincipalActivities
Siddhivinayak Realties Private Limited (‘SRPL’)Aion Realty LLP (‘AR’)Sangam City Township Private Limited (‘SCTPL’)Metropark Infratech And Realty DevelopmentsPrivate Limited (‘MIRD’)Saldanha Realty And Infrastructure LLP ('SRIL')Shri Siddhi Avenues LLP ('SSAL') (formerly ShriSiddhi Enterprise, Acquired on April 15, 2015)**Oasis Realty (AoP) (‘OR’)@
Schematic Estate LLP ('SELLP')(incorporated on February 10, 2017)I-Ven Realty Limited (‘I-Ven’)
Real EstateReal EstateReal EstateReal Estate
Real EstateReal Estate
Real EstateReal Estate
Real Estate
50%50%
31.67%33%
50%50%
25%-40% -
50%
IndiaIndiaIndiaIndia
IndiaIndia
IndiaIndia
India
50%50%
31.67%33%
50%50%
25%-40%50.05%
50%
50%50%
31.67%33%
50%50%
25%-40% -
50%
Country ofincorporation
Name of the Entity
315

NOTES FORMING PART OF CONSOLIDATED FINANCIAL STATEMENTS
NOTE 33 : INTEREST IN JOINT VENTURE (contd.)
Joint operation in which Group is a co-venturer
Percentage ofholding as on
March 31,2016
Percentage ofholding as onApril 01, 2015
Percentage ofholding as on
March 31,2017
Principalactivities
Zaco Aviation (AoP)# Real Estate25%India 25% 25%
Country ofincorporation
Name of the Entity
# The Group has 25% interest in Zaco Aviation a joint venture, which was set up as a association of person together with Intervalve (India) Limited, EL-O-Matic (India) Private Limited, Serum International Limited and Swapnali Constructions for the purpose of purchase of an asset. The principal place of business of the joint operation is in India.
Interest in joint ventureThe Group has interest in various joint ventures as given below. The group's interest in these joint ventures are accounted for using equity method in the consolidated financial statements.
Summarised financial information of the joint venture, based on its Ind AS financial statements, and reconciliation with the carrying amount of the investment in consolidated financial statements are set out as below:
(i) Commitments and contingent liabilities in respect of joint ventures: For commitments and contingent liabilities relating to joint ventures please refer note 38.
27.80% 27.00% 25.00% 50.00% 50.00% 50.00%
March 31, 2017Summarised Balance sheet
March 31, 2016 April 1, 2015 March 31, 2017 March 31, 2016 April 1, 2015
Proportion of ownership interest heldby the Group at the year end
Non-current assetsCurrent assets (a)Total Assets (I)
470.252,44,189.41
2,44,659.66
168.34-
49,987.64
4.12-
280.06
2,514.9349,795.84
18,119.93
21.05193.97
-
23.89159.88
-
1,329.1251,966.44
5,000.00
700.841,88,058.24
1,88,759.08
553.391,56,812.93
1,57,366.32
8,711.2028.34
8,739.54
8,564.2731.66
8,595.93
8,539.8527.38
8,567.23
Non-current liabilities including deferred tax (b)Current liabilities including tax payable (c)Total Liabilities (II)
1,796.741,29,835.66
1,31,632.40
50,999.1754,755.02
1,05,754.19
54,141.4335,538.8089,680.23
6.79351.88358.67
205.9214.04
219.96
176.3416.53
192.87
Total Net Assets (I-II) 1,13,027.26 83,004.89 67,686.09 8,380.87 8,375.97 8,374.36
(a) Includes cash and cash equivalents (b) Includes financial liabilities (excludingtrade and other payables and provisions)(c) Includes financial liabilities (excludingtrade and other payables and provisions)
Oasis Realty (AoP) (‘OR’) Siddhivinayak Realties Private Limited (‘SRPL’)
(` in Lakh)
Siddhivinayak Realties Private Limited (‘SRPL’)
RevenueEmployee benefits expenseOther expensesProfit before taxTax expenseProfit after taxOther comprehensive incomeTotal comprehensive income for the year(Comprising Profit / (Loss) and OtherComprehensive Income for the year)Group’s share of profit for the year
273.75(66.26)(61.90)145.59
32.71112.88
8.50121.38
33.74
199.04(56.99)(65.34)76.7118.3058.41(5.60)52.81
14.26
0.61-
(0.98)(0.37)
- (0.37)
- (0.37)
(0.19)
0.34-
(1.47)(1.13)(0.00) (1.13)
- (1.13)
(0.57)
March 31, 2017Summarised statement of Profit and Loss
March 31, 2016 March 31, 2017 March 31, 2016
Oasis Realty (AoP) (‘OR’)
(` in Lakh)
For more information on Joint ventures, refer disclosures notes in the following section:
2016-17132133
316

NOTES FORMING PART OF CONSOLIDATED FINANCIAL STATEMENTS
Total Net assets of JV (a)Proportion of ownership interests held bythe Group (b)a*bInvestment - corporate guaranteeAdd: Difference in capital contributionvis-a-vis interestAdd: Security deposits consideredas an additional investmentsDeferred tax impact on aboveLess: Inter company eliminationCarrying amount of the Investment
1,13,027.2627.80%
31,421.581,740.04
81,569.41
4,000.00
- (694.03)
1,18,037.00
83,004.8927.00%
22,411.321,671.80
60,645.49
4,000.00
- (476.96)
88,251.65
8,380.8750.00%
4,190.44- -
-
13.23(15.92)
4,187.75
8,375.9750.00%
4,187.99- -
-
12.05(9.84)
4,190.20
NOTE 33 : INTEREST IN JOINT VENTURE (contd.)
A reconciliation of the above summarised financial information to the carrying amount of the investment
Siddhivinayak Realties Private Limited (‘SRPL’)
March 31, 2017Reconciliation of carrying amount
March 31, 2016 March 31, 2017 March 31, 2016
Oasis Realty (AoP) (‘OR’)
(` in Lakh)
50.00% 50.00% 50.00% 50.00%
Non-current assetsCurrent assets (a)Total Assets (I)
29.4625,898.8825,928.34
2,295.7517,718.0620,013.81
5,914.53
12.112,243.88
17,629.69
29.8223,578.5523,608.37
15,706.472,033.90
17,740.37
5,868.00
34.1715,706.47
1,912.54
2.8121,602.8621,605.67
13,929.561,907.19
15,836.75
5,768.92
1.1413,929.56
1,904.82
3,339.756,341.729,681.47
8,713.5826.42
8,740.00
941.47
3.570.01
8,713.57
2,299.891,239.313,539.20
2,595.198.04
2,603.23
935.97
7.52
(56.60)
---
---
-
-
-
Non-current liabilities including deferred tax (b)Current liabilities including tax payable (c)Total Liabilities (II)
Total Net Assets (I-II)
(a) Includes cash and cash equivalents (b) Includes financial liabilities (excludingtrade and other payables and provisions)(c) Includes financial liabilities (excludingtrade and other payables and provisions)
50.00% 50.00%
March 31, 2017
Summarised Balance sheet
March 31, 2016 April 1, 2015 March 31, 2017 March 31, 2016 April 1, 2015
Proportion of ownership interest heldby the Group at the year end
I-Ven Realty Limited (‘I-Ven’)Shri Siddhi Avenues LLP ('SSAL')(formerly Shri Siddhi Enterprise,
Acquired on April 15, 2015)
(` in Lakh)
Shri Siddhi Avenues LLP
RevenueOther expensesDepreciation and amortisationInterest and finance chargesProfit before taxTax expenseProfit after taxOther comprehensive incomeTotal comprehensive income for the year(Comprising Profit / (Loss) and OtherComprehensive Income for the year)Group’s share of profit for the year
1.28(1.38)
--
(0.10)(0.03)(0.07)
- (0.07)
(0.04)
9.71(2.33)
--
7.3810.79(3.41)
-(3.41)
(1.71)
554.54(0.48)(0.01)
(545.93)8.122.615.51
-5.51
2.76
299.89(1.07)
-(306.30)
(7.48)0.46
(7.94)-
(7.94)
(3.97)
March 31, 2017Summarised statement of Profit and Loss
March 31, 2016 March 31, 2017 March 31, 2016
I-Ven Realty Limited (‘I-Ven’)
(` in Lakh)
2,595.19 -
317

NOTES FORMING PART OF CONSOLIDATED FINANCIAL STATEMENTS
Non-current assetsCurrent assets (a)Total Assets (I)
---
---
-
--
-
8.24-
-
8.18 29.75 67.93 73.37
- 8.228.22
- 0.110.11
8.11
0.018.188.19
- 0.220.22
7.97
0.455,321.405,321.85
- 729.31729.31
4,592.54
0.905,187.905,188.80
- 709.61709.61
4,479.19
1.353,403.313,404.66
-3,360.773,360.77
43.89
Non-current liabilities including deferred tax (b)Current liabilities including tax payable (c)Total Liabilities (II)
Total Net Assets (I-II)
(a) Includes cash and cash equivalents (b) Includes financial liabilities (excludingtrade and other payables and provisions)(c) Includes financial liabilities (excludingtrade and other payables and provisions)
NOTE 33 : INTEREST IN JOINT VENTURE (contd.)
A reconciliation of the above summarised financial information to the carrying amount of the investment
Total Net assets of JV (a)Proportion of ownership interests held bythe Group (b)a*bAdd: Adjustment to Share of profitin retained earingsAdd/(Less): Goodwill/ (Capital reserve)Add: Differential portion of Equity component (NCPS)Add: Difference in capital contributionvis-a-vis interestDeferred tax impact on aboveLess: Inter company eliminationCarrying amount of the Investment
5,914.5350.00%
2,957.27-
25,487.06652.25
-
5,868.0050.00%
2,934.00-
25,487.06652.25
-
941.4750.00%
470.74(0.05)
--
528.05
935.9750.00%
467.99-
--
528.05
Shri Siddhi Avenues LLP
March 31, 2017Reconciliation of carrying amount
March 31, 2016 March 31, 2017 March 31, 2016
I-Ven Realty Limited (‘I-Ven’)
(` in Lakh)
50.00% 50.00% 50.00% 50.00% 50.00% 50.00%
March 31, 2017Summarised Balance sheet
March 31, 2016 April 1, 2015 March 31, 2017 March 31, 2016 April 1, 2015
Proportion of ownership interest heldby the Group at the year end
Aion Realty LLP (‘AR’) Saldanha Realty And Infrastructure LLP ('SRIL')
(` in Lakh)
Saldanha Realty And Infrastructure LLP ('SRIL')
March 31, 2017Summarised statement of Profit and Loss
March 31, 2016 March 31, 2017 March 31, 2016
Aion Realty LLP (‘AR’)
(` in Lakh)
RevenueOther expensesInterest and finance chargesProfit before taxTax expenseProfit after taxOther comprehensive incomeTotal comprehensive income for the year(Comprising Profit / (Loss) and OtherComprehensive Income for the year)Group’s share of profit for the year
------
-
-
0.33(0.12)(0.02)0.190.060.13
0.07
------
-
-(0.73)(0.04)(0.77)
-
(0.39)
2,646.76
(0.77)
1,666.66(1,586.43)
29,176.81
1,656.24(1,188.62)
29,540.93
- (326.01)672.73
- (7.10)
988.94
-
-
-
-
- -
-
(0.77)0.13 -- - - -
2016-17134135
318

NOTES FORMING PART OF CONSOLIDATED FINANCIAL STATEMENTS
Total Net assets of JV (a)Proportion of ownership interests held bythe Group (b)a*bAdd/(Less): Goodwill/ (Capital reserve)Add: Difference in capital contributionvis-a-vis interestCarrying amount of the Investment
--
---
-
8.1150.00%
4.060.29
-
4.35
4,592.5450.00%
2,296.270.79
2,274.88
4,571.94
4,479.1950.00%
2,239.600.79
2,218.03
4,458.42
NOTE 33 : INTEREST IN JOINT VENTURE (contd.)
A reconciliation of the above summarised financial information to the carrying amount of the investment
Saldanha Realty And Infrastructure LLP ('SRIL')
March 31, 2017Reconciliation of carrying amount
March 31, 2016 March 31, 2017 March 31, 2016
Aion Realty LLP (‘AR’)
(` in Lakh)
31.67% 31.67% 31.67% 33.00%
Non-current assetsCurrent assets (a)Total Assets (I)
Non-current liabilities including deferred tax (b)Current liabilities including tax payable (c)Total Liabilities (II)
Total Net Assets (I-II)
(a) Includes cash and cash equivalents (b) Includes financial liabilities (excludingtrade and other payables and provisions)(c) Includes financial liabilities (excludingtrade and other payables and provisions)
33.00% 33.00%
March 31, 2017
Summarised Balance sheet
March 31, 2016 April 1, 2015 March 31, 2017 March 31, 2016 April 1, 2015
Proportion of ownership interest heldby the Group at the year end
Sangam City Township Private Limited (’SCTPL’)
Metropark Infratrech And Realty Developments Private Limited (’MIRD’)
(` in Lakh)
-15,219.5015,219.50
470.0512,379.6612,849.71
2,369.79
0.49470.05
12,372.21
- 15,009.4515,009.45
561.1412,077.4212,638.56
2,370.89
0.17561.14
12,075.44
-14,817.1314,817.13
643.8111,801.2812,445.09
2,372.04
0.79643.81
11,796.88
433.35514.64947.99
10.96669.07680.03
267.96
9.5010.96
669.07
419.00514.37933.37
12.52681.22693.74
239.63
6.0112.52
681.22
419.00489.27908.27
23.82644.64668.46
239.81
6.1923.82
644.63
Sangam City Township Private Limited (’SCTPL’)
Metropark Infratrech And Realty Developments Private Limited (’MIRD’)
RevenueOther expensesInterest and finance chargesProfit before taxTax expenseProfit after taxOther comprehensive incomeTotal comprehensive income for the year(Comprising Profit / (Loss) and OtherComprehensive Income for the year)Group’s share of profit for the year
March 31, 2017
Summarised statement of Profit and Loss
March 31, 2016 March 31, 2017 March 31, 2016
(` in Lakh)
-(0.92)(0.05)(0.97)(0.12)(1.09)
(0.35)
0.02(0.97)(0.04)(0.99)(0.16)(1.15)
(0.36)
(1.15)
32.46(0.15)
-
32.31-
32.31
- (0.11)(0.07)(0.18)
-(0.18)
(1.09) 32.31
10.66
(0.18)- - - -
(0.06)
319

NOTE 33 : INTEREST IN JOINT VENTURE (contd.)
A reconciliation of the above summarised financial information to the carrying amount of the investment
Sangam City Township Private Limited (’SCTPL’)
Metropark Infratrech And Realty Developments Private Limited (’MIRD’)
March 31, 2017
Reconciliation of carrying amount
March 31, 2016 March 31, 2017 March 31, 2016
(` in Lakh)
Total Net assets of JV (a)Proportion of ownership interests held by the Group (b)a*bAdd/(Less): Adjustment to Share of profit in retained earingsAdd/(Less): Goodwill/ (Capital reserve)Grossing up of capital contributionDeferred tax impact on aboveLess: Inter company eliminationCarrying amount of the Investment
2,369.7931.67%
750.40(0.34)
-1,558.741,020.05(563.65)
2,765.24
2,370.8931.67%
750.78(0.34)
-1,558.741,020.05(470.30)
2,858.94
267.9633.00%
88.43-
(0.00)51.2233.00
(23.53)149.12
239.6333.00%
79.08-
(0.00)49.4533.00
(21.88)139.65
0.10%
Summarised Balance sheetMarch 31, 2017
Proportion of ownership interest held by the Group at the year end
Non-current assetsCurrent assets (a)Total Assets (I) Non-current liabilities including deferred tax (b)Current liabilities including tax payable (c)Total Liabilities (II) Total Net Assets (I-II) (a) Includes cash and cash equivalents (b) Includes financial liabilities (excluding trade and other payables and provisions)(c) Includes financial liabilities (excluding trade and other payables and provisions)
Schematic Estate LLP
(` in Lakh)
-517.49517.49
-5.59
Summarised statement of Profit and LossMarch 31, 2017
Schematic Estate LLP
(` in Lakh)
RevenueOther expensesProfit before taxTax expenseProfit after taxOther comprehensive incomeTotal comprehensive income for the year (Comprising Profit / (Loss) and Other Comprehensive Income for the year)Group’s share of profit for the year
-(0.10)(0.10)
-(0.10)
-
(0.10)(0.00)
NOTES FORMING PART OF CONSOLIDATED FINANCIAL STATEMENTS
A reconciliation of the above summarised financial information to the carrying amount of the investment
Reconciliation of carrying amountMarch 31, 2016
Schematic Estate LLP
(` in Lakh)
Total Net assets of JV (a)Proportion of ownership interests held by the Group (b)a*bAdd difference in capital contribution vis-a-vis interestCarrying amount of the Investment
511.900.10%
0.51(0.51)
-
--
5.59511.90
2.51
2016-17136137
320

NO
TES
FORM
ING
PA
RT O
F C
ON
SOLI
DA
TED
FIN
AN
CIA
L ST
ATE
MEN
TS
NO
TE 3
4 :
REL
ATE
D P
ARTY
DIS
CLO
SURES
A. N
am
e of
rela
ted
part
ies
an
d r
elate
d p
art
y re
latio
nsh
ip
i) R
elate
d p
art
ies
with
wh
om
tra
nsa
ctio
ns
have
take
n p
lace
du
rin
g t
he
year
Join
t ven
ture
sSa
ngam
City
Tow
nshi
p Pr
ivat
e Li
mite
d
O
asis
Rea
lty (A
oP)
I-Ven
Rea
lty L
imite
d
Sa
ldan
ha R
ealty
and
Infra
stru
ctur
e LL
P
Ai
on R
ealty
LLP
Met
ropa
rk In
frate
ch A
nd R
ealty
Dev
elop
men
ts P
rivat
e Li
mite
d
Sh
ri Si
ddhi
Ave
nues
LLP
(fro
m M
arch
17,
201
6)
Sh
ri Si
ddhi
Ent
erpr
ises
(fro
m A
pril
15, 2
015
till M
arch
16,
201
6)
Si
ddhi
vina
yak
Real
ties
Priv
ate
Lim
ited
Key
man
agem
ent
pers
onne
l and
thei
rre
lativ
es
Vika
s O
bero
i
Bind
u O
bero
i
Ranv
ir O
bero
i
Sant
osh
Obe
roi
G
ayat
ri O
bero
i
Saum
il D
aru
Dar
sha
Dar
u
An
il H
aris
h
Ka
ram
jit S
ingh
Kal
si
Ti
lokc
hand
Ost
wal
Venk
ates
h M
ysor
e
Bh
erul
al C
houd
hary
Entit
ies
whe
re k
ey
man
agem
ent p
erso
nnel
ha
ve s
igni
fican
t inf
luen
ce
R S
Esta
te D
evel
oper
s Pr
ivat
e Li
mite
d O
bero
i Fou
ndat
ion
R. S
. V. A
ssoc
iate
s O
bero
i Ass
ocia
tes
Neo
Rea
lty P
rivat
e Li
mite
d
Joi
nt o
pera
tions
ZA
CO
Avi
atio
n (A
oP)
321

(` in
Lak
h)
Natu
re o
f tr
an
sact
ion
Nam
e J
oin
t ve
ntu
res
/ Jo
int
op
eratio
ns
Sale
of u
nit s
lab
dem
and
Adva
nce
give
n
Amou
nt r
ecei
ved
on b
ehal
f of
Cur
rent
cap
ital c
ontri
butio
n ac
coun
t - p
aid
Cur
rent
cap
ital c
ontri
butio
n ac
coun
t - r
ecei
ved
back
Com
mis
sion
pai
d to
dire
ctor
Cor
pora
te g
uara
ntee
giv
en
R S
Esta
te D
evel
oper
s Pr
ivat
eLi
mite
d
Oas
is R
ealty
(AoP
)
Oas
is R
ealty
(AoP
)O
bero
i Fou
ndat
ion
Sald
anha
Rea
lty a
nd
Infra
stru
ctur
e LL
PO
asis
Rea
lty (A
oP)
Aion
Rea
lty L
LP
Oas
is R
ealty
(AoP
)
Anil
Har
ish
Kara
mjit
Sin
gh K
alsi
Tilo
kcha
nd O
stw
alVe
nkat
esh
Mys
ore
Oas
is R
ealty
(AoP
)
-
-
0.11
-
56.
85
35,5
51.0
0
4.
02
5,6
50.0
0
-
-
-
-
3,6
80.6
3
-
1,
750.
00
0
.99
-
69.
13 1
5,26
6.00
-
-
-
-
-
-
10,
808.
02
-
-
-
-
-
-
-
-
10.0
0
10
.00
16.0
0
10
.00
-
-
-
-
-
-
-
-
-
10.0
0
10
.00
16.0
0
10
.00
-
-
-
-
0
.26
-
-
-
-
-
-
-
-
-
13.4
0
-
-
-
-
-
-
-
-
-
-
-
-
Key
man
ag
emen
t p
erso
nn
el
a
nd
th
eir
rela
tives
En
titie
s w
her
e ke
y m
an
ag
emen
t p
erso
nn
el h
ave
sig
nif
ican
t in
flu
ence
M
arc
h 3
1, 2017 M
arc
h 3
1, 2016 M
arc
h 3
1, 2017 M
arc
h 3
1, 2016 M
arc
h 3
1, 2017 M
arc
h 3
1, 2016
B. Re
late
d p
art
y tr
an
sact
ion
s
Dire
ctor
sitt
ing
fees
Dep
osit
give
n
Dep
osit
rece
ived
Div
iden
d pa
id
Anil
Har
ish
Bher
ulal
Cho
udha
ryKa
ram
jit S
ingh
Kal
siTi
lokc
hand
Ost
wal
Venk
ates
h M
ysor
e
ZAC
O A
viat
ion
(AoP
)
Obe
roi F
ound
atio
n
Bind
u O
bero
iG
ayat
ri O
bero
iRa
nvir
Obe
roi
R S
Esta
te D
evel
oper
s Pr
ivat
e Li
mite
dSa
ntos
h O
bero
iVi
kas
Obe
roi
Saum
il D
aru
Ashw
in D
aru
Dar
sha
Dar
u
-
-
-
-
-
3.05
-
-
-
-
-
-
-
-
-
-
-
-
-
-
-
0.
35
-
-
-
-
-
-
-
-
-
-
4.
00
2.
05
1.
00
10.
95
6.
10
-
-
-
-
-
-
-
-
-
-
-
4.
50
1.
00
1.
00
10.
58
7.
20
-
-
0.
00
0.
00
0.
04
-
0.
04
8,5
14.9
0
0.24
0.02
0.02
-
-
-
-
-
-
16.
50
-
-
-
-
-
-
-
-
-
-
-
-
-
-
-
-
-
-
-
1
,332
.00
-
-
-
-
-
In
tere
st in
com
eSh
ri Si
ddhi
Ave
nues
LLP
Shri
Sidd
hi E
nter
pris
es
7.87
152
.37
59
1.88
-
-
-
-
-
-
-
-
-
NO
TE 3
4 :
REL
ATE
D P
ARTY
DIS
CLO
SURES
(co
ntd
.)
NO
TES
FORM
ING
PA
RT O
F C
ON
SOLI
DA
TED
FIN
AN
CIA
L ST
ATE
MEN
TS
2016-17138139
322

Loan
giv
en
Loan
rep
aid
Loan
rec
eive
d ba
ck
Inve
stm
ent i
n de
bent
ures
Purc
hase
of a
sset
s
Reco
very
of e
xpen
ses
Reim
burs
emen
t of e
xpen
ses
Met
ropa
rk In
frate
ch A
nd R
ealty
D
evel
opm
ents
Priv
ate
Lim
ited
Shri
Sidd
hi A
venu
es L
LPSh
ri Si
ddhi
Ent
erpr
ises
Vika
s O
bero
i
Shri
Sidd
hi E
nter
pris
es
I-Ven
Rea
lty L
imite
dSi
ddhi
vina
yak
Real
ties
Priv
ate
Lim
ited
ZAC
O A
viat
ion
(AoP
)
Neo
Rea
lty P
rivat
e Li
mite
dO
asis
Rea
lty (A
oP)
Obe
roi F
ound
atio
n
Obe
roi F
ound
atio
nZA
CO
Avi
atio
n (A
oP)
14.
35
5,0
53.0
0
-
-
-
34.
70
-
-
2
27.8
9
-
52.
87
-
5.
00
2,3
14.1
0
-
12.
35
4
49.3
8
9.75
0.
12
2
16.4
5
-
40.
00
-
-
-
1,8
00.0
0
-
-
-
-
-
-
-
-
-
-
-
-
-
-
-
-
-
-
-
-
-
-
-
-
-
-
-
0.
11
-
1.
26
0.
58
-
-
-
-
-
-
-
-
0.
28
-
4.65
-
-
Natu
re o
f tr
an
sact
ion
Nam
e J
oin
t ve
ntu
res
/ Jo
int
op
eratio
ns
Inte
rest
on
loan
( m
easu
red
atam
ortis
ed c
ost)
Inte
rest
on
pref
eren
ce s
hare
s
Inte
rest
on
OC
D (
mea
sure
d at
am
ortis
ed c
ost)
Sang
am C
ity T
owns
hip
Priv
ate
Lim
ited
Met
ropa
rk In
frate
ch A
nd R
ealty
D
evel
opm
ents
Priv
ate
Lim
ited
I-Ven
Rea
lty L
imite
d
I-Ven
Rea
lty L
imite
d
Sidd
hivi
naya
k Re
altie
s Pr
ivat
e Li
mite
d
20
1.43
3
.37
5
8.67
36
8.33
6
.08
2
67.5
5
24.
51
5
3.34
316
.07
4.
64
-
-
-
-
-
-
-
-
-
-
-
-
-
-
-
-
-
-
-
-
Key
man
ag
emen
t p
erso
nn
el
a
nd
th
eir
rela
tives
En
titie
s w
her
e ke
y m
an
ag
emen
t p
erso
nn
el h
ave
sig
nif
ican
t in
flu
ence
M
arc
h 3
1, 2017 M
arc
h 3
1, 2016 M
arc
h 3
1, 2017 M
arc
h 3
1, 2016 M
arc
h 3
1, 2017 M
arc
h 3
1, 2016
B. Re
late
d p
art
y tr
an
sact
ion
s
--
NO
TE 3
4 :
REL
ATE
D P
ARTY
DIS
CLO
SURES
(co
ntd
.)
NO
TES
FORM
ING
PA
RT O
F C
ON
SOLI
DA
TED
FIN
AN
CIA
L ST
ATE
MEN
TS
(` in
Lak
h)
-
- -
- -
579
.00
323

Natu
re o
f tr
an
sact
ion
Nam
e J
oin
t ve
ntu
res
/ Jo
int
op
eratio
ns
Equi
ty c
ompo
nent
of i
nter
est
free
loan
Equi
ty c
ompo
nent
of
optio
nally
con
verti
ble
debe
ntur
e
Inve
stm
ent i
n op
tiona
lly
conv
ertib
le d
eben
ture
(m
easu
red
at a
mor
tised
cos
t)
Sang
am C
ity T
owns
hip
Priv
ate
Lim
ited
Met
ropa
rk In
frate
ch A
nd
Real
ty D
evel
opm
ents
Priv
ate
Lim
ited
I-Ven
Rea
lty L
imite
d
Sidd
hivi
naya
k Re
altie
s Pr
ivat
e Li
mite
d
I-Ven
Rea
lty L
imite
d
Sidd
hivi
naya
k Re
altie
s Pr
ivat
e Li
mite
d
3
,301
.13
109
.45
3
,115
.26
42
.82
7
,858
.61
140
.04
3
,301
.13
106
.80
3
,081
.53
39
.01
5
,569
.33
79
.95
-
-
-
-
-
-
-
-
-
-
-
-
-
-
-
-
-
-
-
-
-
-
-
-
Key
man
ag
emen
t p
erso
nn
el
a
nd
th
eir
rela
tives
En
titie
s w
her
e ke
y m
an
ag
emen
t p
erso
nn
el h
ave
sig
nif
ican
t in
flu
ence
M
arc
h 3
1, 2017 M
arc
h 3
1, 2016 M
arc
h 3
1, 2017 M
arc
h 3
1, 2016
M
arc
h 3
1, 2017
M
arc
h 3
1, 2016
C. C
losi
ng
bala
nce
s of
rela
ted
part
ies
(` in
Lak
h)
Natu
re o
f tr
an
sact
ion
Nam
e J
oin
t ve
ntu
res
/ Jo
int
op
eratio
ns
Key
man
ag
emen
t p
erso
nn
el
a
nd
th
eir
rela
tives
En
titie
s w
her
e ke
y m
an
ag
emen
t p
erso
nn
el h
ave
sig
nif
ican
t in
flu
ence
M
arc
h 3
1, 2017 M
arc
h 3
1, 2016 M
arc
h 3
1, 2017 M
arc
h 3
1, 2016 M
arc
h 3
1, 2017 M
arc
h 3
1, 2016
Rem
uner
atio
n
Rent
rec
eive
d
Sale
of a
sset
s
Purc
hase
of m
ater
ial
Sale
of m
ater
ials
Sale
of u
nits
sla
b de
man
d
Bind
u O
bero
iVi
kas
Obe
roi
Saum
il D
aru
Neo
Rea
lty P
rivat
e Li
mite
dO
bero
i Fou
ndat
ion
I-Ven
Rea
lty L
imite
d
Oas
is R
ealty
(AoP
)
Oas
is R
ealty
(AoP
)
R. S
. V. A
ssoc
iate
s
-
-
-
-
-
0.
50
1.
30
-
-
-
-
-
-
-
-
-
0.
21
-
80.
00
0
.00
696.
42
-
-
-
-
-
-
77.
50
0
.00
201.
66
-
-
-
-
-
-
-
-
-
0.1
2 2,
861.
21
-
-
-
16
8.25
-
-
-
0.12
2
,733
.97
-
-
-
1
02.4
3
(` in
Lak
h)
NO
TES
FORM
ING
PA
RT O
F C
ON
SOLI
DA
TED
FIN
AN
CIA
L ST
ATE
MEN
TS
B. Re
late
d p
art
y tr
an
sact
ion
s
NO
TE 3
4 :
REL
ATE
D P
ARTY
DIS
CLO
SURES
(co
ntd
.)2016-17
140141
324

Loan
giv
en
Cur
rent
cap
ital c
ontri
butio
n
Sang
am C
ity T
owns
hip
Priv
ate
Lim
ited
Met
ropa
rk In
frate
ch A
nd R
ealty
Dev
elop
men
ts Pr
ivat
e Li
mite
d
Shri
Sidd
hi A
venu
es L
LP
Sald
anha
Rea
lty a
nd
Infra
stru
ctur
e LL
PO
asis
Rea
lty (A
oP)
3
118.
81
376
.22
8
,713
.57
4
,574
.76
114,
636.
50
2
,824
.03
359
.49
2
,595
.19
4
,461
.06
85,
333.
52
-
-
-
-
-
-
-
-
-
-
-
-
-
-
-
-
-
-
-
-
Loan
rec
eive
d
Reco
very
of e
xpen
ses
Dep
osit
rece
ived
Cor
pora
te g
uara
ntee
giv
en
Reim
burs
emen
t of e
xpen
ses
Vika
s O
bero
i
Neo
Rea
lty P
rivat
e Li
mite
d
Obe
roi F
ound
atio
n
Oas
is R
ealty
(AoP
)
ZAC
O A
viat
ion
(AoP
)
-
-
-
55,2
38.6
5
4.
11
-
-
-
72,6
92.6
8
1.
56
8,9
08.0
0
-
-
-
-
-
-
-
-
0
.07
816
.50
-
-
0
.15
800
.00
-
-
Natu
re o
f tr
an
sact
ion
Nam
e J
oin
t ve
ntu
res
/ Jo
int
op
eratio
ns
Key
man
ag
emen
t p
erso
nn
el
a
nd
th
eir
rela
tives
En
titie
s w
her
e ke
y m
an
ag
emen
t p
erso
nn
el h
ave
sig
nif
ican
t in
flu
ence
Marc
h 3
1, 2017 M
arc
h 3
1, 2016 M
arc
h 3
1, 2017 M
arc
h 3
1, 2016
M
arc
h 3
1, 2017
M
arc
h 3
1, 2016
(` in
Lak
h)
NO
TE 3
4 :
REL
ATE
D P
ARTY
DIS
CLO
SURES
(co
ntd
.)
C. C
losi
ng
bala
nce
s of
rela
ted
part
ies
NO
TES
FORM
ING
PA
RT O
F C
ON
SOLI
DA
TED
FIN
AN
CIA
L ST
ATE
MEN
TS
10,
708.
00
--
325

NOTES FORMING PART OF CONSOLIDATED FINANCIAL STATEMENTS
MARCH 31, 2017 MARCH 31, 2016
REAL ESTATE HOSPITALITY TOTAL REAL ESTATE HOSPITALITY TOTAL
(` in Lakh)
Segment revenue Segment result Unallocated income net of unallocated expenses Operating profit Less: Interest and finance charges Add: Interest income Profit before tax Provision for tax Profit after tax Other Information Segment assets Unallocated corporate assets (B) Total assets Segment liabilities Unallocated corporate liabilities Total liabilities Capital expenditure for the year (net of transfers) Unallocated capital expenditure for the year Depreciation for the year Unallocated depreciation for the year
98,699.84 50,229.33
406.20
2,18,566.68
2,72,817.86 2,14,263.40
8,45,413.92 7,48,376.10
1,79,504.15
486.84
12,674.54 2,409.53
1,11,374.38 52,638.86
53,045.06 (557.22)
56,229.69(18,684.86)
37,544.83
64,239.37 (683.26)
66,324.28 (22,928.18) 43,396.10
1,28,777.25 61,551.15
12,837.45 2,201.38
1,41,614.7063,752.53
23,548.12 6,26,847.24 5,43,551.94 25,320.01 5,68,871.95
2,519.80
1,990.64
4,510.44439.10
4,503.96 395.53
2,497.51
2,006.45
2,891.15 2,72,815.73 2.13
2,10,964.86 3,294.17 2,14,259.03
4.37
Notes:
NOTE 35: SEGMENT INFORMATION
6,03,299.12
2,69,924.58
Based on the “management approach” as defined in Ind AS 108 – Operating Segments, the Chairman and Managing Director / Chief Operating Decision Maker evaluates the Company’s performance based on an analysis of various performance indicators by business segment. Accordingly information has been presented along these segments. The accounting principles used in the preparation of the financial statement are consistently applied in individual segment to prepare segment reporting.
Unallocated corporate assets includes temporary surplus. Income earned on temporary investment of the same has been shown in 'Unallocable Income net of Unallocable Expenditure'.
A
B
7,770.93 7,770.93- 2,054.85 30.24 2,085.09
152.81 615.98
3,741.85 2,768.17
2016-17142143
326

NOTE 36 : UTILISATION OF PROCEEDS FROM PREFERENTIAL ISSUE
NOTE 37 : LEASES
Statement of utilisation of amount received from allotment of Equity shares on preferential basis: Particulars of fund utilisation Amount received from allotment of Equity Shares on Preferential basisLess: Deployment of funds received from the preferential allotmenta) Share issue expenses b) Investment in Subsidiary Company by way of loan towards it's working capital requirements
(A)
(B)
(A-B)
40.47 32,409.53
32,450.00
MARCH 31, 2016
(` in Lakh)
(` in Lakh)
Future minimum lease payments under non-cancellable operating lease :Not later than one yearLater than one year and not later than five yearsLater than five yearLease payments recognised during the year in the statement of profit and loss
9.39 - -
22.83
9.40 - -
14.30
- - - -
MARCH 31, 2017 MARCH 31, 2016 APRIL 1, 2015
Assets taken on operating lease
NOTES FORMING PART OF CONSOLIDATED FINANCIAL STATEMENTS
32,450.00
Balance amount to be utilised -
327

9,456.41
228.062,917.921,249.48
-2,570.43
Amounts notascertainable
55,238.65
B. Capital Commitments 1. Capital contracts (net of advances) 2. Capital commitment to joint venture (net of advances)
4,257.3913,703.00
9,429.48
228.062,856.611,199.99
395.151,287.77
Amounts notascertainable
72,692.68
6,515.94 13,703.00
8,564.51
320.551,972.881,394.98
395.15423.07
Amounts notascertainable
63,595.95
2,564.46 13,703.00
NOTES FORMING PART OF CONSOLIDATED FINANCIAL STATEMENTS
NOTE 38 : CONTINGENT LIABILITIES AND CAPITAL COMMITMENTS
(` in Lakh)
MARCH 31, 2017 MARCH 31, 2016 APRIL 1, 2015
A. Summary details of contingent liabilities
1. Letters of credit net of margin (March 31, 2017: gross ` 808.07 lakh, March 31, 2016: gross ` 1,860.65 lakh, April 1, 2015: gross ` 36.00 lakh) 2. Bank guarantees net of margin (March 31, 2017: gross ` 1,290.92 lakh, March 31, 2016: gross ` 1,157.73 lakh, April 1, 2015: gross ` 185.32 lakh) 3. Indemnity bonds given in the favour of the government under Export Promotion Capital Goods Scheme (net of bank guarantees)4. Litigation a) Legal cases against the Company not acknowledged as debt (excluding certain matters where amount are not ascertainable) b) MVAT matters in dispute c) Income-tax matters in dispute d) Service tax matters in dispute e) Property tax matters in dispute 5. Claims against the Company not acknowledged as debt 6. Certain other additional matters which are under dispute but which are not acknowledged as debt by the Company 7. Corporate guarantee given
-
-
1,588.42
-
-
1,513.70
-
-
1,560.34
The sales tax department of the government of Maharashtra has completed the VAT assessments w.r.t. the returns filed by the Company on the sale of flats to the customers during the period beginning from June 2006 till March 2012 and determined the VAT and interest liability. For some of the years, the Group has challenged the assessment order and opted for appeal, which is pending for hearing. Vide an order of the Hon’ble Supreme Court of India, the recovery of interest amounts in such cases has been stayed. However, the Group has opted to settle and pay interest for some of the years under The Maharashtra Settlement of Arrears in Disputes Act, 2016. Part of the amount has been collected by the Group from the flat purchasers on account of such liability and the Group is reasonably confident of recovering all the outstanding amount on account of VAT from flat purchasers.
C.
2016-17144145
328

NOTE 39 : FINANCIAL INSTRUMENTS – FAIR VALUES AND RISK MANAGEMENT
A. Accounting classification
The carrying value of financial instruments by categories are as follows:
Fair Value through
profit or loss
March 31, 2017 March 31, 2016
Carrying Value
AmortisedCost
April 1, 2015
Investments: Investment in preferencesharesInvestment in optionally convertible debenturesInvestment in governmentsecuritiesInvestment in mutual fundsInvestment in subsidary / joint ventures
Borrowings: 9.25% Redeemable Non-Convertible Debenture From director Trade payablesOther financial liability
-
- - - -
Financial liabilities
Particulars
Cash and cash equivalentsBank balancesTrade receivablesLoans
Financial assets
(` in Lakh)
At CostFair Value through
profit or loss
AmortisedCost
At CostFair Value through
profit or loss
AmortisedCost
At Cost
- - - -
-
-
-
- 1,59,560.55
1,59,560.55
-
- - - -
- - - -
-
-
-
14,253.36-
14,253.36
77,956.28
8,908.00 6,123.47
430.36 93,418.11
21,347.61 13,818.64 10,578.83 13,369.84
616.68
7,998.65
0.82
- -
67,731.07
-
- - - -
- - - -
-
-
-
- 1,30,433.06
1,30,433.06
-
- - - -
- - - -
-
-
-
7,446.02 -
7,446.02
36,636.67
10,708.00 4,621.90
731.31 52,697.88
21,137.19 10,049.32 11,224.49
6,904.83
558.01
6,673.67
-
- -
56,547.51
- - - - -
- - - -
-
-
-
- 1,14,575.51
1,14,575.51
-
- - - -
- - - -
-
-
-
- -
-
68,099.20
10,708.00 35,89.89 1,128.76
83,525.85
504.67
5,649.28
1.21
- -
46,353.02
15,779.01 12,902.40
7,529.25 3,987.20
NOTES FORMING PART OF CONSOLIDATED FINANCIAL STATEMENTS
(` in Lakh)
Fair valueMarch 31, 2017
Financial assets Bank balancesInvestments:Investment in preference sharesInvestment in optionally convertible debentures
Financial liabilitiesBorrowings:9.25% Redeemable Non-Convertible Debenture
Level 1 Level 2 Level 3
-
- -
- 78,351.96 -
-
- -
13,222.42
553.11 7,994.98
B. Fair ValuesThe following table provides the fair value measurement hierarchy of the Company's assets and liabilities:
329

NOTE 39 : FINANCIAL INSTRUMENTS – FAIR VALUES AND RISK MANAGEMENT (contd.)
(` in Lakh)
Fair valueMarch 31, 2016
Financial assets Bank balancesInvestments:Investment in preference sharesInvestment in optionally convertible debentures
Financial liabilitiesBorrowings:10.85% Redeemable Non-Convertible Debenture
Level 1 Level 2 Level 3
-
- -
- 36,779.55 -
-
- -
7,173.46
453.84 6,434.09
(` in Lakh)
Fair valueApril 1, 2015
Financial assets Bank balancesInvestments:Investment in preference sharesInvestment in optionally convertible debentures
Financial liabilitiesBorrowings:10.85% Redeemable Non-Convertible Debenture
Level 1 Level 2 Level 3
-
- -
- 68,401.07 -
-
- -
3,458.72
440.80 5,351.98
The management assessed that carrying amount of cash and cash equivalents, trade receivables, loans, Investment in mutual funds, borrowings, trade payable and other financial liabilities approximate their fair values largely due to the short-term maturities of these instruments.
NOTES FORMING PART OF CONSOLIDATED FINANCIAL STATEMENTS
The following tables show the valuation techniques used in measuring Level 2 and Level 3 fair values, as well as the significant unobservable inputs used.
C. Measurement of fair values
Financial instruments measured at fair value
Inter-relationship betweensignificant unobservable inputsand fair value measurement
Significantunobservable inputs
Valuation techniqueType
Financial Assets: - Investment in optionally convertible debentures- Investment in preference shares- Investment in government securities- Loans- Fixed deposit with maturity beyond twelve months
Not Applicable Not Applicable
Discounted cash flow technique - The fair value is estimated considering net present value calculated using discount rates derived from quoted prices of similar instruments with similar maturity and credit rating that are traded in active markets, adjusted by an illiquidity factor
Financial Liabilities:- Debentures- Loans from related party
Not Applicable Not Applicable
Discounted cash flow technique- The fair value is estimated considering net present value calculated using discount rates derived from quoted prices of similar instruments with similar maturity and credit rating that are traded in active markets, adjusted by an illiquidity factor
There have been no transfers between Level 1 and Level 2 during the respective period presented above.Transfers between Levels 1 and 2
2016-17146147
330

NOTE 39 : FINANCIAL INSTRUMENTS – FAIR VALUES AND RISK MANAGEMENT (contd.)
NOTES FORMING PART OF CONSOLIDATED FINANCIAL STATEMENTS
The Company’s board of directors has overall responsibility for the establishment and oversight of the Company’s risk management framework. The board of directors has established the Risk Management Committee, which is responsible for developing and monitoring the Company’s risk management policies. The committee reports regularly to the board of directors on its activities. The Company’s risk management policies are established to identify and analyse the risks faced by the Company, to set appropriate risk limits and controls and to monitor risks and adherence to limits. Risk management policies and systems are reviewed regularly to reflect changes in market conditions and the Company’s activities. The Company, through its training and management standards and procedures, aims to maintain a disciplined and constructive control environment in which all employees understand their roles and obligations.
Risk management framework
Credit risk is the risk of financial loss to the Company if a customer or counterparty to a financial instrument fails to meet its contractual obligations, and arises principally from the Company's receivables from customers and investments in debt securities.
The carrying amount of following financial assets represents the maximum credit exposure:
i. Credit risk
The Company has exposure to the following risks arising from financial instruments:• Credit risk • Liquidity risk and• Market risk
D. Financial risk management
The Group’s exposure to credit risk is influenced mainly by the individual characteristics of each customer. However credit risk with regards to trade receivable is almost negligible in case of its residential sale and lease rental business as the same is done to the fact that in case of its residential sell business it doesnot handover possession till entire outstanding is received. similarly in case of lease rental business, the group keep 3 to 12 months rental as deposit from the occupants.
No impairment is observed on the carrying value of trade receivable.
Trade and other receivables
The Group has investment only in redeemable optionally convertible debentures and the settlement of such instruments is linked to the completion of the respective underlying projects. No impairment has been recognised on such investments till date.
Investment in debt securities
Credit risk from balances with banks and financial institutions is managed by the Company’s treasury department in accordance with the Company’s policy. Investments of surplus funds are made only with approved counterparties and within credit limits assigned to each counterparty. Counterparty credit limits are reviewed by the Investment Committee of the Board comprising of Mr. Venkatesh Mysore (Chairperson), Mr. Anil Harish, Mr. T.P. Ostwal, (Independent Directors) and Mr. Vikas Oberoi (Non-Independent Director) on an annual basis, and may be updated throughout the year subject to approval of the Investment Committee. The limits are set to minimise the concentration of risks and therefore mitigate financial loss through counterparty’s potential failure to make payments.
Cash and cash equivalents
Liquidity risk is the risk that the Group will encounter difficulty in meeting the obligations associated with its financial liabilities that are settled by delivering cash or another financial asset. The Group’s approach to managing liquidity is to ensure as far as possible that it will have sufficient liquidity to meet its liabilities when they are due, under both normal and stressed condition, without incurring unacceptable losses or risking damage to the Group’s reputation. The Group’s objective is to maintain a balance between continuity of funding and flexibility through the use of surplus funds, bank overdrafts, bank loans, debentures and inter-corporate loans. The Group assessed the concentration of risk with respect to refinancing its debt and concluded it to be low. The Group has access to a sufficient variety of sources of funding.
ii. Liquidity Risk
331

The following are the remaining contractual maturities of financial liabilities at the reporting date. The amounts are gross and undiscounted, and include estimated interest payments and exclude the impact of netting agreements.
Exposure to liquidity risk
77,956.28
8,908.00 6,123.47
430.36
77,956.28
8,908.00 6,123.47
430.36
3,018.51
8,908.00 5,410.18
430.36
-
- 713.29
-
74,937.77
- - -
-
- - -
Borrowings:9.25% Redeemable Non-Convertible DebentureLoans from related partiesTrade payablesOther financial liability
Borrowings:10.85% Redeemable Non-Convertible DebentureLoans from related partiesTrade payablesOther financial liability
Borrowings:10.85% Redeemable Non-Convertible DebentureLoans from related partiesTrade payablesOther financial liability
March 31, 2016
March 31, 2017
April 1, 2015
93,418.11 93,418.11 17,767.05 713.29 74,937.77 -
36,636.67
10,708.00 4,621.90
731.31
36,636.67
10,708.00 4,621.90
731.31
11,673.75
10,708.00 4,246.41
731.31
24,962.92
- 375.49
-
-
- - -
-
- - -
52,697.88 52,697.88 27,359.47 25,338.41 --
68,099.20
10,708.00 3,589.89 1,128.76
68,099.20
10,708.00 3,589.89 1,128.76
8,234.66
10,708.00 3,488.81 1,128.76
24,964.81
- 101.08
-
-
- -
-
34,899.73
- - -
83,525.85 83,525.85 23,560.23 25,065.89 - 34,899.73
NOTE 39 : FINANCIAL INSTRUMENTS – FAIR VALUES AND RISK MANAGEMENT (contd.)
NOTES FORMING PART OF CONSOLIDATED FINANCIAL STATEMENTS
(₹ in Lakh)
Contractual Cash Flows
Carryingamount Total
Within1 year 1-2 years 2-5 years
More than5 years
(₹ in Lakh)
Contractual Cash Flows
Carryingamount Total
Within1 year 1-2 years 2-5 years
More than5 years
(₹ in Lakh)
Contractual Cash Flows
Carryingamount Total
Within1 year 1-2 years 2-5 years
More than5 years
2016-17148149
332

Market risk is the risk that changes in market prices – such as foreign exchange rates, interest rates and equity prices – will affect the Company’s income or the value of its holdings of financial instruments. Market risk is attributable to all market risk sensitive financial instruments including foreign currency receivables and payables and long term debt. We are exposed to market risk primarily related to foreign exchange rate risk, interest rate risk and the market value of certain commodities. Thus, our exposure to market risk is a function of investing and borrowing activities and revenue generating and operating activities. The objective of market risk management is to avoid excessive exposure to these risks in our revenues and costs.
Foreign currency risk is the risk that the fair value or future cash flows of an exposure will fluctuate because of changes in foreign exchange rates. The Company’s exposure to the risk of changes in foreign exchange rates relates primarily to the Group’s operating activities (when expense is denominated in a foreign currency).
The Company closely tracks and observes the movement of foreign currency with regards to INR and also forward cover rate. The Company decides to cover or keep the foreign currency exposure open based on the above.
iii. Market risk
Currency risk
NOTE 39 : FINANCIAL INSTRUMENTS – FAIR VALUES AND RISK MANAGEMENT (contd.)
NOTES FORMING PART OF CONSOLIDATED FINANCIAL STATEMENTS
The currency profile of financial assets and financial liabilities are as below:
Exposure to currency risk
464.03
464.03
1.04
1.04
9.90
9.90
474.97
474.97
March 31, 2017USD
March 31, 2017SGD
March 31, 2017EURO
March 31, 2017TOTAL
Financial liabilities
Trade payables
Particulars
526.50
526.50
526.50
526.50
March 31, 2016USD
March 31, 2016TOTAL
Financial liabilities
Trade payables
Particulars
(` in Lakh)
(` in Lakh)
381.49
381.49
381.49
381.49
April 1, 2015USD
April 1, 2015 TOTAL
Financial liabilities
Trade payables
Particulars
(` in Lakh)
333

Interest rate risk
Interest rate risk can be either fair value interest rate risk or cash flow interest rate risk. Fair value interest rate risk is the risk of changes in fair values of fixed interest bearing investments because of fluctuations in the interest rates. Cash flow interest rate risk is the risk that the future cash flows of floating interest bearing investments will fluctuate because of fluctuations in the interest rates.
Particulars March 31, 2016March 31, 2017
Fixed-rate instruments Financial Liabilities 36,636.67
36,636.67 77,956.28 77,956.28
(` in Lakh)
Fair value sensitivity analysis for fixed-rate instruments
The Group does not account for any fixed-rate financial assets or financial liabilities at fair value through profit or loss Therefore, a change in interest rates at the reporting date would not affect profit or loss.
Exposure to interest rate risk
The Group’s interest rate risk arises from borrowings. Borrowings issued at fixed rates exposes to fair value interest rate risk. The interest rate profile of the Group’s interest-bearing financial instruments as reported to the management of the Group is as follows.
Commodity Price Risk
The Group’s activities are exposed to steel and cement price risks and therefore its overall risk management program focuses on the volatile nature of the steel and cement market, thus seeking to minimize potential adverse effects on the group’s financial performance on account of such volatility.
The Risk management committee regularly reviews and monitors risk management principles, policies, and risk management activities.
The Group’s policy is to maintain a strong capital base so as to maintain investor, creditor and market confidence and to sustain future development of the business. Management monitors the return on capital as well as the level of dividends to ordinary shareholders. The Group manages its capital structure and makes adjustments in light of changes in economic conditions and the requirements of the financial covenants. To maintain or adjust the capital structure, the Group may adjust the dividend payment to shareholders, return capital to shareholders or issue new shares. The Group monitors capital using a gearing ratio, which is net debt divided by total capital plus net debt. The Group includes within net debt, interest and non interest bearing loans and borrowings, less cash and cash equivalents, excluding discontinued operations.
The Group’s adjusted net debt to equity ratio were as follows.
E. Capital Management
86,864.28
21,347.61
572,596.05 572,596.05
0.11
65,516.67
5,34,112.70 534,112.70
0.05
26,207.48
47,344.67
21,137.19
March 31, 2017 March 31, 2016
Total liabilities
Less : Cash and cash equivalent
Adjusted net debt
Total equity
Adjusted equity
Adjusted net debt to adjusted equity ratio
Particulars
(` in Lakh)
NOTE 39 : FINANCIAL INSTRUMENTS – FAIR VALUES AND RISK MANAGEMENT (contd.)
NOTES FORMING PART OF CONSOLIDATED FINANCIAL STATEMENTS
2016-17150151
334

NOTE 40 : DISCLOSURE ON SPECIFIED BANK NOTES (SBNS)
During the year, the Group had specified bank notes or other denomination note as defined in the MCA notification G.S.R. 308(E) dated March 31, 2017 on the details of Specified Bank Notes (SBN) held and transacted during the period from November 8, 2016 to December, 30 2016, the denomination wise SBNs and other notes as per the notification is given below:
* For the purposes of this clause, the term ‘Specified Bank Notes’ shall have the same meaning provided in the notification of the Government of India, in the Ministry of Finance, Department of Economic Affairs number S.O. 3407(E), dated the November 8, 2016.
Closing cash in hand as on November 8, 2016 (+) Permitted receipts (+) Withdrawal ( - ) Permitted payments ( - ) Amount deposited in Banks Closing cash in hand as on December 30, 2016
(` in Lakh)
15.88 - - -
(15.88) -
23.21 118.18
11.99 (28.93) (89.82) 34.63
39.09 118.18
11.99 (28.93)
(105.70) 34.63
SBNs* Other denomination TotalParticulars
NOTES FORMING PART OF CONSOLIDATED FINANCIAL STATEMENTS
NOTE 41 : OTHER NOTES
In our opinion, all current assets appearing in the balance sheet as at March 31, 2017 have a value on realisation in the ordinary course of the Group business at least equal to the amount at which they are stated in the balance sheet.
Balance of trade receivable, trade payables and loans and advances are subject to confirmation from respective parties and reconciliation, if any.
The Group is engaged in real estate development. The group has acquired various lands / development rights and certain projects are at initial stage of implementation. The projects may be developed with various end uses, such as hotel, retail outlets, plots, residential, commercial and IT specific use. Such projects will be classified under investment properties, PPE or inventories, as the case may be, based on ultimate end use as per final development of the property. Pending such reclassification on final development of such properties, such plots and the cost incurred on development of projects is included under the head ‘Works in progress’ or ‘Plots of land’ as part of ‘Current assets’.
A joint venture partner in AoP availed certain credit facilities from the banks against the mortgage of 21 identified flats and receivables thereof. However, the firm's share in receivables from the project is not impacted.
Standards issued but not yet effective:
The Government of India through the Ministry of Corporate Affairs in consultation with the National Advisory Committee on Accounting Standards has issued the Companies (Indian Accounting Standards) (Amendment) Rules, 2017 which are effective from April 1, 2017. These amendments are as follows:
A
Previous year figures have been regrouped, re-arranged and re-classified wherever necessary to conform to current year's classification.
Figures have been rounded off to the nearest thousand.G
B
C
D
E
F
Amendments to IND AS 102 that address three main areas: the effects of vesting conditions on the measurement of a cash-settled share-based payment transaction; the classification of a share-based payment transaction with net settlement features for withholding tax obligations; and accounting where a modification to the terms and conditions of a share-based payment transaction changes its classification from cash settled to equity settled. On adoption, entities are required to apply the amendments without restating prior periods, but retrospective application is permitted if elected for all three amendments and other criteria are met. The Group is assessing the potential effect of the amendments on its consolidated financial statements [the same is not expected to have a material impact on its consolidated financial statements].
The amendments to IND AS 7 Statement of Cash Flows are part of the IASB’s Disclosure Initiative and require an entity to provide disclosures that enable users of financial statements to evaluate changes in liabilities arising from financing activities, including both changes arising from cash flows and non-cash changes. On initial application of the amendment, entities are not required to provide comparative information for preceding periods. Application of amendments will result in additional disclosure provided by the Group.
1.
2.
As per our report of even dateFor P. RAJ & CO. Chartered AccountantsFirm Registration No. 108310W
P. S. ShahPartnerMembership No.44611Mumbai, May 4, 2017
Vikas OberoiChairman & Managing Director
Saumil DaruDirector - Finance cum Chief Financial Officer
T. P. OstwalDirector
Bhaskar KshirsagarCompany Secretary
For and on behalf of the Board of Directors
335

INDEPENDENT AUDITOR’S REPORT ON CONSOLIDATED FINANCIAL STATEMENTS
To the Members of Oberoi Realty Limited
Report on the Consolidated Financial Statements We have audited the accompanying consolidated financial statements of Oberoi Realty Limited (“the Company”) , its subsidiaries and its joint ventures (collectively referred to as “the Group”), comprising of the Consolidated Balance Sheet as at March 31, 2016, the Consolidated Statement of Profit and Loss, the Consolidated Cash Flow Statement for the year then ended, and a summary of the significant accounting policies and other explanatory information (hereinafter referred to as “the consolidated financial statements”).
Management’s Responsibility for the Consolidated Financial Statements The Company’s Board of Directors is responsible for the matters stated in Section 134 (5) of the Companies Act, 2013 (“the Act”) with respect to the preparation and presentation of these consolidated financial statements that give a true and fair view of the consolidated financial position, consolidated financial performance and consolidated cash flows of the Group in accordance with the accounting principles generally accepted in India, including the Accounting Standards specified under Section 133 of the Companies Act, 2013 (hereinafter referred to as “the Act”) read with Rule 7 of the Companies (Accounts) Rules, 2014. This responsibility also includes maintenance of adequate accounting records in accordance with the provisions of the Act for safeguarding of the assets of the Group and for preventing and detecting frauds and other irregularities; the selection and application of appropriate accounting policies; making judgments and estimates that are reasonable and prudent; and the design, implementation and maintenance of adequate internal financial controls, that were operating effectively for ensuring the accuracy and completeness of the accounting records, relevant to the preparation and presentation of the financial statements that give a true and fair view and are free from material misstatement, whether due to fraud or error.
Auditor’s ResponsibilityOur responsibility is to express an opinion on the consolidated financial statements based on our audit. We have taken into account the provisions of the Act, the accounting and auditing standards and matters which are required to be included in the audit report under the provisions of the Act and the Rules made there under.
We conducted our audit in accordance with the Standards on Auditing specified under section 143 (10) of the Act. Those standards require that we comply with ethical requirements and plan and perform the audit to obtain reasonable assurance about whether the consolidated financial statements are free from material misstatement.
An audit involves performing procedures to obtain audit evidence about the amounts and the disclosures in the consolidated financial statements. The procedures selected depend on the auditor’s judgment, including the assessment of the risks of material misstatement of the consolidated financial statements, whether due to fraud or error. In making those risk assessments, the auditor considers internal financial control relevant to the Company’s preparation of the consolidated financial statements that give a true and fair view in order to design audit procedures that are appropriate in the circumstances. An audit also includes evaluating the appropriateness of the accounting policies used and the reasonableness of the accounting estimates made by the Company’s Board of Directors, as well as evaluating the overall presentation of the consolidated financial statements.
We believe that the audit evidence obtained by us is sufficient and appropriate to provide a basis for our audit opinion on the consolidated financial statements.
OpinionIn our opinion and to the best of our information and according to the explanations given to us, and based on the consideration of the other auditor’s report on financial statements of the joint ventures, the aforesaid consolidated financial statements give the information required by the Act in the manner so required and give a true and fair view in conformity with the accounting principles generally accepted in India,
(a) in the case of the Consolidated Balance Sheet, of the state of affairs of the Company as at March 31, 2016;
(b) in the case of the Consolidated Statement of Profit and Loss, of the profit for the year ended on that date; and
(c) in the case of the Consolidated Cash Flow Statement, of the cash flows for the year ended on that date.
336

2015-16 65
64
For P. RAJ & CO.Chartered AccountantsFirm Registration No. 108310W
P. S. ShahPartnerMembership No. 44611Mumbai, April 29, 2016
Other MattersWe did not audit the financial statements of its two Joint Ventures, whose financial statements reflect the Group’s share of net assets of H4,614.11 Lakh as at March 31, 2016 and total revenue of H Nil and net loss of H0.37 Lakh for the year then ended. These financial statements have been audited by other auditors whose reports have been furnished to us, and our opinion is based solely on the reports of other auditors.
The financial statements of one of its Joint Venture is on the basis of unaudited management accounts and the financial statements reflect the Group’s share of net assets of H1,414.07 Lakh as at March 31, 2016 and total revenues of H Nil and net loss of H0.38 Lakh for the year then ended.
Report on Other Legal and Regulatory Requirements 1. As required by sub-section 3 of Section 143 of the Act, we report, to the extent applicable, that:
a. We have sought and obtained all the information and explanations which to the best of our knowledge and belief were necessary for the purposes of our audit of the aforesaid consolidated financial statements.
b. In our opinion, proper books of account as required by law relating to preparation of the aforesaid consolidated financial statements have been kept so far as it appears from our examination of those books.
c. The Consolidated Balance Sheet, the Consolidated Statement of Profit and Loss and the Consolidated Cash Flow Statement dealt with by this Report are in agreement with the relevant books of account maintained for the purpose of preparation of the consolidated financial statements.
d. In our opinion, the aforesaid consolidated financial statements comply with the Accounting Standards specified under Section 133 of the Act, read with Rule 7 of the Companies (Accounts) Rules, 2014.
e. On the basis of the written representations received from the directors of the Holding Company as on March 31, 2016 taken on record by the Board of Directors of the Company and the report of the statutory auditors of its subsidiary companies, none of the Directors of the Group companies are disqualified as on March 31, 2016 from being appointed as a Director of that Company in terms of sub-section 2 of Section 164 of the Act.
f. With respect to the adequacy of the internal financial controls over financial reporting of the Group and the operating effectiveness of such controls, refer to our separate report in “Annexure A”; and
g. with respect to the other matters to be included in the Auditor’s Report in accordance with Rule 11 of the Companies (Audit and Auditors) Rules, 2014, in our opinion and to the best of our information and according to the explanations given to us:
i. The consolidated financial statements disclose the impact of pending litigations on the consolidated financial position of the Group. Refer Note 33. A. 4 to the consolidated financial statements;
ii. Provision has been made in the consolidated financial statements, as required under the applicable law or accounting standards, for material foreseeable losses, if any, on long term contracts including derivatives contracts and
iii. There were no amounts, which were required to be transferred, to the Investor Education and Protection Fund by the Holding Company and subsidiary companies incorporated in India.
337

ANNEXURE - A TO THE AUDITOR’S REPORT
Report on the Internal Financial Controls under Clause (i) of Sub-section 3 of Section 143 of the Companies Act, 2013 (“the Act”)In conjunction with our audit of the consolidated financial statements of the Company as of and for the year ended March 31, 2016, we have audited the internal financial controls over financial reporting of Oberoi Realty Limited (“the Company”) and its subsidiary companies, as of that date.
Management’s Responsibility for Internal Financial ControlsThe respective Board of Directors of the Company and its subsidiary companies, are responsible for establishing and maintaining internal financial controls based on the internal control over financial reporting criteria established by the Company considering the essential components of internal control stated in the Guidance Note on Audit of Internal Financial Controls over Financial Reporting issued by the Institute of Chartered Accountants of India (“ICAI’). These responsibilities include the design, implementation and maintenance of adequate internal financial controls that were operating effectively for ensuring the orderly and efficient conduct of its business, including adherence to company’s policies, the safeguarding of its assets, the prevention and detection of frauds and errors, the accuracy and completeness of the accounting records, and the timely preparation of reliable financial information, as required under the Companies Act, 2013.
Auditors’ ResponsibilityOur responsibility is to express an opinion on the Company’s internal financial controls over financial reporting based on our audit. We conducted our audit in accordance with the Guidance Note on Audit of Internal Financial Controls over Financial Reporting (the “Guidance Note”) issued by ICAI and the Standards on Auditing, issued by ICAI and deemed to be prescribed under section 143(10) of the Companies Act, 2013, to the extent applicable to an audit of internal financial controls, both issued by the Institute of Chartered Accountants of India. Those Standards and the Guidance Note require that we comply with ethical requirements and plan and perform the audit to obtain reasonable assurance about whether adequate internal financial controls over financial reporting was established and maintained and if such controls operated effectively in all material respects.
Our audit involves performing procedures to obtain audit evidence about the adequacy of the internal financial controls system over financial reporting and their operating effectiveness. Our audit of internal financial controls over financial reporting included obtaining an understanding of internal financial controls over financial reporting, assessing the risk that a material weakness exists, and testing and evaluating the design and operating effectiveness of internal control based on the assessed risk. The procedures selected depend on the auditor’s judgment, including the assessment of the risks of material misstatement of the financial statements, whether due to fraud or error.
We believe that the audit evidence we have obtained is sufficient and appropriate to provide a basis for our audit opinion on the Company’s internal financial controls system over financial reporting.
Meaning of Internal Financial Controls over Financial ReportingA company’s internal financial control over financial reporting is a process designed to provide reasonable assurance regarding the reliability of financial reporting and the preparation of financial statements for external purposes in accordance with generally accepted accounting principles. The Company’s internal financial control over financial reporting includes those policies and procedures that
338

2015-16 67
66
1. pertain to the maintenance of records that, in reasonable detail, accurately and fairly reflect the transactions and dispositions of the assets of the Company;
2. provide reasonable assurance that transactions are recorded as necessary to permit preparation of financial statements in accordance with generally accepted accounting principles, and that receipts and expenditures of the company are being made only in accordance with authorisations of management and directors of the Company; and
3. provide reasonable assurance regarding prevention or timely detection of unauthorised acquisition, use, or disposition of the Company’s assets that could have a material effect on the financial statements.
Inherent Limitations of Internal Financial Controls over Financial ReportingBecause of the inherent limitations of internal financial controls over financial reporting, including the possibility of collusion or improper management override of controls, material misstatements due to error or fraud may occur and not be detected. Also, projections of any evaluation of the internal financial controls over financial reporting to future periods are subject to the risk that the internal financial control over financial reporting may become inadequate because of changes in conditions, or that the degree of compliance with the policies or procedures may deteriorate.
OpinionIn our opinion, the Company and its subsidiary companies, have, in all material respects, an adequate internal financial controls system over financial reporting and such internal financial controls over financial reporting were operating effectively as at March 31, 2016, based on the internal control over financial reporting criteria established by the Company considering the essential components of internal control stated in the Guidance Note on Audit of Internal Financial Controls Over Financial Reporting issued by the ICAI.
For P. RAJ & CO.Chartered AccountantsFirm Registration No. 108310W
P. S. ShahPartnerMembership No. 44611Mumbai, April 29, 2016
339

CONSOLIDATED BALANCE SHEET (H in Lakh)
AS AT MARCH 31, NOTE 2016 2015
EQUITY AND LIABILITIESShareholders’ fundsShare capital 2 33,930.38 32,823.80 Reserves and surplus 3 4,96,497.93 4,30,604.82
5,30,428.31 4,63,428.62 Non-current liabilitiesLong term borrowings 4 48,444.88 72,991.61 Deferred tax liabilities 5 2,287.11 2,424.77 Trade payables 6 700.95 645.59 Other long-term liabilities 7 5,031.03 7,824.42 Long-term provisions 8 138.53 119.09
56,602.50 84,005.48 Current liabilitiesShort-term borrowings 9 10,814.17 10,814.17 Trade payables 6 4,642.81 3,532.37 Other current liabilities 10 1,73,192.17 1,41,926.32 Short-term provisions 8 297.10 8,288.91
1,88,946.25 1,64,561.77 Total 7,75,977.06 7,11,995.87
ASSETSNon-current assetsFixed assets Tangible assets 11 97,452.71 1,01,327.73 Intangible assets 11 257.75 149.27 Capital work in progress 5,394.68 2,177.34 Goodwill on consolidation 26,538.27 26,538.27 Non-current investments 12 - 1.21 Long-term loans and advances 13 1,37,890.96 1,25,316.06
2,67,534.37 2,55,509.88 Current assetsCurrent investments 14 7,441.12 - Inventories 15 3,93,059.07 3,48,174.73 Trade receivables 16 11,702.91 8,281.35 Cash and bank balances 17 32,085.91 29,368.49 Short-term loans and advances 13 61,483.96 70,302.15 Other current assets 18 2,669.72 359.27
5,08,442.69 4,56,485.99 Total 7,75,977.06 7,11,995.87 Significant accounting policies 1The accompanying notes form an integral part of the financial statements
As per our report of even date For and on behalf of the Board of DirectorsFor P. RAJ & CO.Chartered AccountantsFirm Registration No. 108310W
P. S. Shah Vikas Oberoi T. P. OstwalPartner Chairman & Managing Director DirectorMembership No.44611Mumbai, April 29, 2016 Saumil Daru Bhaskar Kshirsagar Director - Finance Company Secretary cum Chief Financial Officer
340

2015-16 69
68
As per our report of even date For and on behalf of the Board of DirectorsFor P. RAJ & CO.Chartered AccountantsFirm Registration No. 108310W
P. S. Shah Vikas Oberoi T. P. OstwalPartner Chairman & Managing Director DirectorMembership No.44611Mumbai, April 29, 2016 Saumil Daru Bhaskar Kshirsagar Director - Finance Company Secretary cum Chief Financial Officer
CONSOLIDATED STATEMENT OF PROFIT AND LOSS (H in Lakh)
FOR THE YEAR ENDED MARCH 31, NOTE 2016 2015
INCOME
Revenue from operations 19 1,40,809.00 92,266.75
Other income 20 3,620.60 1,748.52
Total revenue (A) 1,44,429.60 94,015.27
EXPENSES
Operating costs 21 62,970.34 31,480.67
Employee benefits expense 22 5,763.36 5,264.54
Other expenses 23 5,330.10 4,142.18
Total expenses (B) 74,063.80 40,887.39
Profit before interest, depreciation and amortisation and taxes (EBITDA)
(A-B) 70,365.80 53,127.88
Depreciation and amortisation 24 4,899.49 4,029.30
Interest and finance charges 25 16.11 176.24
Profit before tax 65,450.20 48,922.34
Tax expense
Current tax 21,663.25 15,662.62
Deferred tax (137.54) 240.13
Short / (excess) provision of tax in earlier years 45.87 (8.63)
MAT credit (entitlement) / written off 1,287.42 1,316.24
Profit after tax 42,591.20 31,711.98
Earnings per equity share (face value of H10) 26
- Basic (in H) 12.68 9.66
- Diluted (in H) 12.68 9.66
Significant accounting policies 1
The accompanying notes form an integral part of the financial statements
341

CONSOLIDATED CASH FLOW STATEMENT (H in Lakh)
FOR THE YEAR ENDED MARCH 31, 2016 2015
CASH FLOW FROM OPERATING ACTIVITIES:
Profit before tax as per statement of profit and loss 65,450.20 48,922.34
Adjustments for
Increase in ownership interest in joint venture (3.95) -
Depreciation and amortisation 4,901.82 4,034.18
Interest income (2,119.68) (832.25)
Interest expenses 7,166.03 8,701.86
Dividend income (110.90) (467.59)
Loss / (profit) on sale of investments (net) (1,387.94) (445.52)
Loss / (gain) from foreign exchange fluctuation (net) 11.63 1.86
Loss / (gain) on sale / discarding of fixed assets (net) 0.60 (0.55)
Sundry balances written off / (back) (109.91) (34.93)
Operating cash profit before working capital changes 73,797.90 59,879.40
Movement for working capital
Increase / (decrease) in trade payables 1,599.12 1,534.39
Increase / (decrease) in other liabilities 31,383.42 52,359.33
Increase / (decrease) in provisions (71.16) 300.18
(Increase) / decrease in loans and advances 5,446.82 (9,667.51)
(Increase) / decrease in trade receivables (3,421.56) 338.27
(Increase) / decrease in inventories (44,884.32) (1,83,262.15)
Cash generated / (used) from operations 63,850.22 (78,518.09)
Direct taxes (paid) / refund (21,180.77) (15,305.05)
Net cash inflow / (outflow) from operating activities (A) 42,669.45 (93,823.14)
CASH FLOW FROM INVESTING ACTIVITIES:
(Acquisition) / (adjustments) / sale of fixed assets / addition to capital work in progress (net)
(4,653.07) 2,925.73
Interest received 1,897.18 845.69
Dividend received 110.90 467.59
Decrease / (increase) in loans and advances to / for joint ventures (net)
(13,142.46) (5,790.77)
(Acquisition) / sale of investments (net) 1,389.15 445.43
(Increase) / decrease in other assets (9,944.28) (7,703.59)
Net cash inflow / (outflow) from investing activities (B) (24,342.58) (8,809.92)
342

2015-16 71
70
CONSOLIDATED CASH FLOW STATEMENT (contd.) (H in Lakh)
FOR THE YEAR ENDED MARCH 31, 2016 2015
CASH FLOW FROM FINANCING ACTIVITIES:Issue of equity shares (including share premium) 32,580.81 12.24 Proceeds from term borrowings 5,446.05 17,449.61 Repayment of term borrowings (1,350.41) - Proceeds from issue of debentures - 75,000.00 Prepayment of debentures (25,000.00) (9,900.00)Repayment of debentures (5,100.00) - Interest paid (8,622.46) (5,520.81)Dividend paid (including dividend distribution tax) (16,069.69) (7,680.33)Net cash inflow / (outflow) from financing activities (C) (18,115.70) 69,360.71 Net increase / (decrease) in cash and cash equivalents (A+B+C) 211.17 (33,272.35)Add: cash and cash equivalents at the beginning of the year 16,157.22 49,429.57 Cash and cash equivalents at the end of the year 16,368.39 16,157.22
COMPONENTS OF CASH AND CASH EQUIVALENTS (H in Lakh)
AS AT MARCH 31, 2016 2015
Cash on hand 56.33 79.23 Balance with banks in current accounts 4,092.44 3,910.02 Fixed deposits with banks, having original maturity of three months or less 4,778.50 12,167.97 Cash and cash equivalents 8,927.27 16,157.22 Add: Short term liquid investment 7,441.12 - Cash and cash equivalents at the end of the year 16,368.39 16,157.22
RECONCILIATION STATEMENT OF CASH AND BANK BALANCE (H in Lakh)
AS AT MARCH 31, 2016 2015
Cash and cash equivalents at the end of the year as per above 16,368.39 16,157.22 Add: Balance with banks in dividend / unclaimed dividend accounts 4.37 1.29 Add: Fixed deposit with banks, having original maturity of more than three months but less than twelve months
12,836.26 -
Add: Fixed deposits with banks, having original maturity of more than twelve months
4,597.67 2,809.57
Add: Fixed deposits with banks (lien marked) 5,720.34 10,400.41 Less: Short term mutual funds (out of the same investment of H 989.00 Lakh is lien marked)
(7,441.12) -
Cash and bank balance as per balance sheet (refer note 17) 32,085.91 29,368.49 Significant accounting policies (refer note 1)The accompanying notes form an integral part of the financial statements.
As per our report of even date For and on behalf of the Board of DirectorsFor P. RAJ & CO.Chartered AccountantsFirm Registration No. 108310W
P. S. Shah Vikas Oberoi T. P. OstwalPartner Chairman & Managing Director DirectorMembership No.44611Mumbai, April 29, 2016 Saumil Daru Bhaskar Kshirsagar Director - Finance Company Secretary cum Chief Financial Officer
343

NATURE OF OPERATIONS Oberoi Realty Limited (the ‘Company’ or ‘ORL’), a public limited company, together with its subsidiaries and joint ventures (collectively referred to as the ‘Group’) is engaged primarily in the business of real estate development and hospitality.
1. SIGNIFICANT ACCOUNTING POLICIES
A. Basis of preparation The consolidated financial statements have been prepared to comply in all material respects with the mandatory
Accounting Standards notified by Companies (Accounts) Rules, 2014, (as amended) and the relevant provisions of the Companies Act, 2013. The consolidated financial statements have been prepared under the historical cost convention on an accrual basis in accordance with the accounting principles generally accepted in India. The accounting policy has been consistently applied by the Group.
B. Principles of consolidation The consolidated financial statements are prepared using the financial statements of the Company, its
subsidiaries and joint ventures. The consolidated financial statements have been prepared in accordance with Accounting Standard (‘AS’) - 21 ‘Consolidated Financial Statements’ and AS - 27 ‘Financial Reporting of Interests in Joint Ventures’, other applicable accounting standards, as applicable, notified by the Companies (Accounts) Rules, 2014 (as amended).
The consolidated financial statements have been prepared using uniform accounting policies for like transactions and other events, in similar circumstances, to the extent possible on the following basis:
i) Subsidiaries (a) The financial statements of subsidiaries are consolidated on a line by line basis by adding together the
book values of like items of assets, liabilities, income and expenses after fully eliminating intra-group balances / transactions and resulting elimination of unrealised profits and losses, if any.
(b) Minority interest, if any, in the net assets value of consolidated subsidiaries consist of
- The amount of equity attributable to minority shareholders as at the date of its investment or the date immediately preceding the date of investments in the subsidiary; and
- The minority shareholders’ share of movements in equity since the date the holding subsidiary relationship came into existence.
ii) Joint ventures The financial statements of joint ventures are consolidated using the proportionate consolidation method
and accordingly, the Group’s share of the assets, liabilities, income and expenses of jointly controlled operations / entities / assets, as the case may be, is consolidated as per AS - 27 – ‘Financial Reporting of Interests in Joint Ventures’.
The excess of cost, if any, to the Group of its investments in the subsidiary / joint venture over the Group’s portion of equity of the subsidiary / joint venture, as at the date of its investment or the date immediately preceding the date of investment, is recognised in the consolidated financial statements as goodwill, which is tested for impairment, if any, at balance sheet date.
The excess, if any, of the Group’s portion of equity of the subsidiary / joint venture over the cost to the Group of its investment in the subsidiary / joint venture as at the date of its investment or the date immediately preceding the date of investment is treated as capital reserve.
Depending upon the terms of agreement between the Partners, the LLP can be a Subsidiary under AS-21, Associate under AS-23 or Jointly Controlled Entity under AS-27 and the financial statements are consolidated accordingly.
C. Use of estimates The preparation of consolidated financial statements in conformity with generally accepted accounting
principles requires management to make estimates and assumptions that affect the reported amounts of assets
NOTES FORMING PART OF CONSOLIDATED FINANCIAL STATEMENTS
344

2015-16 73
72
NOTES FORMING PART OF CONSOLIDATED FINANCIAL STATEMENTS
and liabilities and disclosure of contingent liabilities as at the date of the consolidated financial statements and the results of operations during the reporting period. Although these estimates are based upon management’s best knowledge of current events, plans and actions, actual results could differ from these estimates. Any revision to accounting estimates and assumptions are recognised prospectively.
D. Tangible assets, intangible assets and capital work in progress Tangible assets are stated at cost less accumulated depreciation and impairment losses, if any. Cost comprises
the purchase price and any attributable / allocable cost of bringing the asset to its working condition for its intended use. The cost also includes direct cost and other related incidental expenses. Revenues earned, if any during trial run of assets is adjusted against cost of the assets.
Intangible assets are stated at cost less accumulated amortisation and impairment losses, if any. Cost comprises the acquisition price, development cost and any attributable / allocable incidental cost of bringing the asset to its working condition for its intended use.
Capital work in progress is stated at cost less impairment losses, if any. Cost comprises of expenditures incurred in respect of capital projects under development and includes any attributable / allocable cost and other incidental expenses. Revenues earned, if any, before capitalisation from such capital project are adjusted against the capital work in progress.
Borrowing costs relating to acquisition / construction / development of tangible assets, intangible assets and capital work in progress which takes substantial period of time to get ready for its intended use are also included to the extent they relate to the period till such assets are ready to be put to use.
E. Depreciation and amortisation i) Tangible assets (a) Depreciation is provided from the date the assets are ready to be put to use, on straight line method
as per the useful life of the assets as prescribed under Part C of Schedule II of the Companies Act, 2013 except for the following class of assets where the management has estimated useful life which differs from the useful life prescribed under the Act.
Mobile handsets 3 years
Lessee specific assets and improvements Over lease period or useful life as prescribed in Schedule II, whichever is lower
For these classes of assets, based on internal assessment, the management believes that the useful lives as given above best represent the period over which management expects to use these assets. Hence the useful lives for these assets are different from the useful lives as prescribed under Part C of Schedule II of the Companies Act, 2013.
Depreciation method, useful life and residual value are reviewed periodically.
(b) Assets individually costing less than or equal to H0.05 Lakh are fully depreciated in the year of purchase except under special circumstances.
ii) Intangible assets Intangible assets are amortised using straight line method over the estimated useful life, not exceeding 5
years. Amortisation method, useful life and residual value are reviewed periodically.
iii) Leasehold land and improvements are amortised on the basis of duration and other terms of lease.
F. Impairment of tangible / intangible assets The carrying amount of tangible assets / intangible assets is reviewed periodically for any indication of
impairment based on internal / external factors. An impairment loss is recognised wherever the carrying amount of an asset exceeds its recoverable amount. The recoverable amount is the greater of the asset’s net selling price and value in use.
345

G. Investments Investments are classified into long-term (non-current) and short-term (current) investments. Investments
intended to be held for not more than a year are classified as short-term investments. All other investments are classified as long-term investments. Long-term investments are stated at cost less permanent diminution in value, if any. Short-term investments are stated at the lower of cost or fair value.
H. Valuation of Inventories i) Construction materials and consumables The construction materials and consumables are valued at lower of cost or net realisable value. The
construction materials and consumables purchased for construction work issued to the construction work in progress are treated as consumed.
ii) Construction work in progress The construction work in progress is valued at lower of cost or net realisable value. Cost includes cost of
land, development rights, rates and taxes, construction costs, borrowing costs, other direct expenditure, allocated overheads and other incidental expenses.
iii) Finished stock of completed projects (ready units) Finished stock of completed projects and stock in trade of units is valued at lower of cost or net realisable
value.
iv) Food and beverages Stock of food and beverages are valued at lower of cost (computed on a moving weighted average basis,
net of taxes) or net realizable value. Cost includes all expenses incurred in bringing the goods to their present location and condition.
v) Hospitality related operating supplies Hospitality related operating supplies such as guest amenities and maintenance supplies are expensed as
and when purchased.
I. Segment reporting The Group’s reporting segments are identified based on activities, risk and reward structure, organisation
structure and internal reporting systems. Segment revenue and expense include amounts which can be directly attributable to the segment and allocable on reasonable basis. Segment assets and liabilities are assets / liabilities which are directly attributable to the segment or can be allocated on a reasonable basis. Income / expenses / assets / liabilities relating to the enterprise as a whole and not allocable on a reasonable basis to business segments are reflected as unallocated income / expenses / assets / liabilities.
J. Revenue recognition i) Revenue from real estate projects The Group follows the percentage of project completion method for its projects. The revenue recognition
policy is as under:
The Group recognises revenue in proportion to the actual project cost incurred (including land cost) as against the total estimated project cost (including land cost), subject to achieving the threshold level of project cost (excluding land cost) as well as area sold, in line with the Guidance Note issued by ICAI and depending on the type of project.
Revenue is recognised net of indirect taxes and on execution of either an agreement or a letter of allotment.
The estimates relating to percentage of completion, costs to completion, area available for sale etc. being of a technical nature are reviewed and revised periodically by the management and are considered as change in estimates and accordingly, the effect of such changes in estimates is recognised prospectively in the period in which such changes are determined.
Land cost includes the cost of land, land related development rights and premium.
NOTES FORMING PART OF CONSOLIDATED FINANCIAL STATEMENTS
346

2015-16 75
74
ii) Revenue from hospitality Room revenue is recognised based on occupancy. Revenue from sale of food and beverages and other
allied services is recognised as and when the services are rendered.
Revenue is recognised net of trade discounts and indirect taxes, if any.
iii) Revenue from lease rentals and related income Lease income is recognised in the statement of profit and loss on straight line basis over the lease term,
unless there is another systematic basis which is more representative of the time pattern of the lease. Revenue from lease rental is disclosed net of indirect taxes, if any.
Revenue from property management service is recognised at value of service and is disclosed net of indirect taxes, if any.
iv) Other income Dividend income is recognised when the right to receive dividend is established.
Other incomes are accounted on accrual basis, except interest on delayed payment by debtors and liquidated damages which are accounted on acceptance of the Group’s claim.
K. Foreign currency transactions Foreign currency transactions are recorded in the reporting currency (Indian Rupee) by applying to the foreign
currency amount the exchange rate between the reporting currency and the foreign currency on the date of the transaction.
All monetary items denominated in foreign currency are converted into Indian rupees at the year-end exchange rate. The exchange differences arising on such conversion and on settlement of the transactions are recognised in the statement of profit and loss. Non-monetary items in terms of historical cost denominated in a foreign currency are reported using the exchange rate prevailing on the date of the transaction.
L. Leases i) Where a group entity is the lessee Lease arrangements where the risks and rewards incidental to ownership of an asset substantially vest with
the lessor are recognised as operating lease. Operating lease payments are recognised as an expense in the statement of profit and loss on straight line basis over the lease term, unless there is another systematic basis which is more representative of the time pattern of the lease.
ii) Where a group entity is the lessor Assets representing lease arrangements given under operating leases are included in fixed assets. Lease
income is recognised in the statement of profit and loss on straight line basis over the lease term, unless there is another systematic basis which is more representative of the time pattern of the lease.
Initial direct costs are recognised immediately in the statement of profit and loss.
M. Taxation i) Provision for income tax is made under the liability method after availing exemptions and deductions at
the rates applicable under the Income-tax Act, 1961.
ii) Deferred tax resulting from timing difference between book and tax profits is accounted for using the tax rates and laws that have been enacted as on the balance sheet date.
iii) Deferred tax assets arising on the temporary timing differences are recognised only if there is reasonable certainty of realisation.
iv) Minimum Alternate Tax (‘MAT’) credit is recognised as an asset only when and to the extent there is convincing evidence that the Group will pay normal income tax during the specified period. In the year in which the Group recognises MAT credit as an asset in accordance with the Guidance Note on Accounting for Credit Available in respect of Minimum Alternative Tax under the Income-tax Act, 1961, the said asset is created by way of credit to the statement of profit and loss and shown as “MAT Credit Entitlement”.
NOTES FORMING PART OF CONSOLIDATED FINANCIAL STATEMENTS
347

The Group reviews the “MAT Credit Entitlement” asset at each reporting date and writes down the asset to the extent the Group does not have convincing evidence that it will be able to utilise the MAT Credit Entitlement within the period specified under the Income-tax Act, 1961.
N. Employee stock option scheme The employee share based payments are accounted on the basis of ‘intrinsic value of option’ representing
the excess of the market price on the date of grant over the exercise price of the shares granted under the ‘Employee Stock Option Scheme’ of the Company and is amortised as deferred employees compensation on a straight line basis over the vesting period in accordance with the SEBI (Employee Stock Option Scheme and Employee Stock Purchase Scheme) Guidelines, 1999.
O. Provisions and contingent liabilities i) A provision is recognised when
(a) The Group has a present obligation as a result of a past event;
(b) It is probable that an outflow of resources embodying economic benefits will be required to settle the obligation; and
(c) A reliable estimate can be made of the amount of the obligation.
ii) A disclosure for a contingent liability is made when there is a possible obligation or a present obligation that may, but probably may not, require an outflow of resources. A contingent liability also arises in extreme cases where there is a probable liability that cannot be recognised because it cannot be measured reliably.
iii) Where there is a possible obligation or a present obligation such that the likelihood of outflow of resources is remote, no provision or disclosure is made.
P. Borrowing costs Borrowing costs that are directly attributable to the acquisition / construction of qualifying assets or for long -
term project development are capitalised as part of their costs.
Borrowing costs are considered as part of the asset cost when the activities that are necessary to prepare the assets for their intended use are in progress.
Other borrowing costs are recognised as an expense, in the period in which they are incurred.
Q. Employee benefits i) Defined contribution plans Retirement benefits in the form of contribution to provident fund and pension fund are charged to statement
of profit and loss.
ii) Defined benefit plans Gratuity is in the nature of a defined benefit plan.
Provision for gratuity is calculated on the basis of actuarial valuations carried out at balance sheet date and is charged to the statement of profit and loss. The actuarial valuation is performed using the projected unit credit method.
Actuarial gains and losses are recognised immediately in the statement of profit and loss.
iii) Other employee benefits Leave encashment is recognised as an expense in the statement of profit and loss as and when they accrue.
The Group determines the liability using the projected unit credit method, with actuarial valuations carried out as at balance sheet date. Actuarial gains and losses are recognised immediately in the statement of profit and loss.
R. Earnings per share Basic earnings per share is calculated by dividing the net profit / (loss) for the year attributable to equity
NOTES FORMING PART OF CONSOLIDATED FINANCIAL STATEMENTS
348

2015-16 77
76
shareholders (after deducting preference dividends and attributable taxes) by weighted average number of equity shares outstanding during the year.
For the purpose of calculating diluted earnings per share, the net profit / (loss) for the year attributable to equity shareholders and the weighted average numbers of shares outstanding during the year are adjusted for the effects of all dilutive potential equity shares.
S. The details of entities included in these consolidated financial statement are as under:
Name of entity CountryOwnership interest Ownership
interest held by2016 2015SubsidiariesOberoi Constructions Limited (‘OCL’) India 100% 100% ORLOberoi Mall Limited (‘OML’) India 100% 100% ORLKingston Property Services Limited (‘KPSL’) India 100% 100% ORLKingston Hospitality and Developers Private Limited (‘KHDPL’)
India 100% 100% ORL
Expressions Realty Private Limited (‘ERPL’) India 100% 100% ORLPerspective Realty Private Limited (‘PRPL’) India 100% 100% OCLSight Realty Private Limited (‘SiRPL’) India 100% 100% ORLIncline Realty Private Limited (‘IRPL’)(incorporated on March 25, 2014
India 100% 100% ORL
Integrus Realty Private Limited (‘InRPL’)(incorporated on April 3, 2014)
India 100% 100% ORL
Joint venture entitiesSiddhivinayak Realties Private Limited (‘SRPL’) India 50% 50% OCLSangam City Township Private Limited (‘SCTPL’) India 31.67% 31.67% ORLAion Realty LLP (‘AR’)*(Acquired on May 16, 2013)
India 50% 50% OCL
Saldanha Realty And Infrastructure LLP (‘SRIL’)*(Acquired on October 18, 2013)
India 50% 50% ERPL
Metropark Infratech And Realty Developments Private Limited (‘MIRD’)(Acquired on August 26, 2013)
India 33% 33% SiRPL
I-Ven Realty Limited (‘I-Ven’) India 50% 50% ORLBuoyant Realty LLP (‘BRL’)* # India 100% 100% ORL 99.01% (99.01%)
OCL 0.99% (0.99%)Astir Realty LLP (‘ARL’)* India 100% 100% ORL 10% (10%)
OCL 90% (90%)Oasis Realty (AoP) (‘OR’)@ India 25%-40% 25%-40% OCL 2% (2%)
ARL 98% (98%) Zaco Aviation (AoP) (‘ZA’) India 25% 25% OCLShri Siddhi Avenues LLP (SSAL) (formerly Shri Siddhi Enterprise, Acquired on April 15, 2015)^
India 50% - InRPL
* Buoyant Realty LLP, Astir Realty LLP, Aion Realty LLP, Saldanha Realty And Infrastructure LLP and Shri Siddhi Avenues LLP are treated as body corporate and consolidated accordingly.
# Buoyant Realty Private Limited was converted into Buoyant Realty LLP on March 4, 2015. @ The ownership interest mentioned is for Residential business of AoP. In Hospitality business of Oasis Realty,
ownership interest of the Group is 50%. ^ Shri Siddhi Enterprise was converted into Shri Siddhi Avenues LLP on March 17, 2016.
NOTES FORMING PART OF CONSOLIDATED FINANCIAL STATEMENTS
349
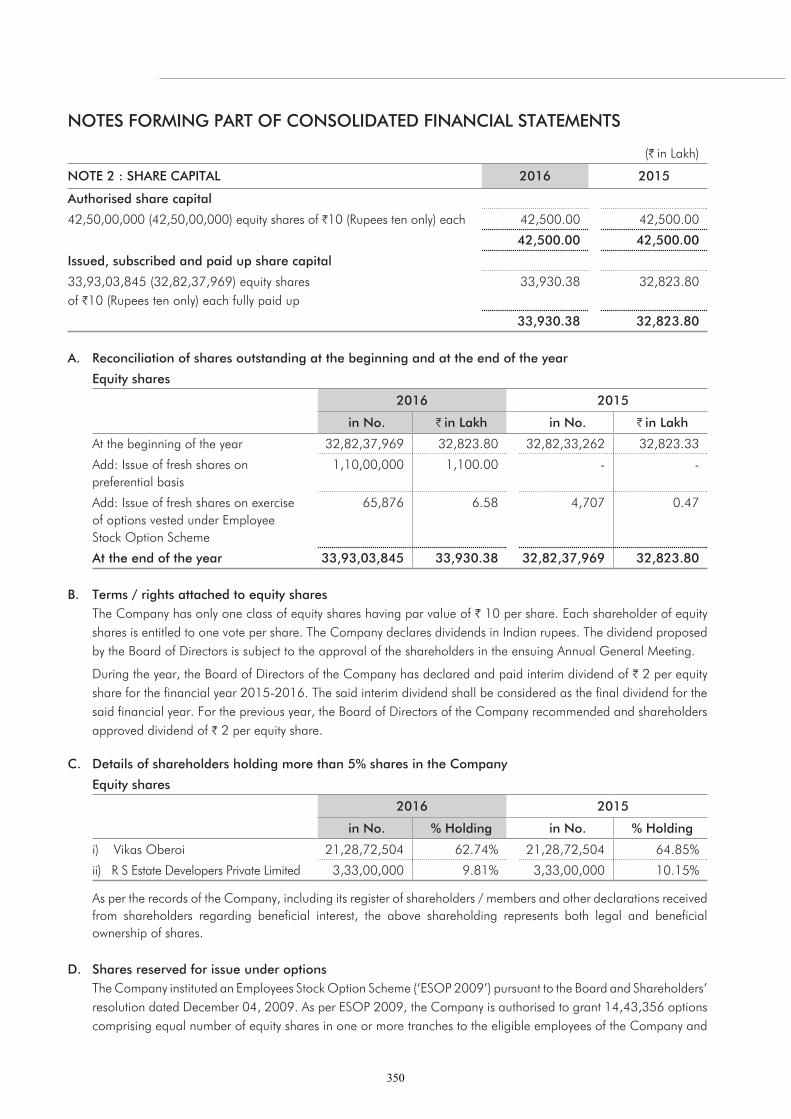
(H in Lakh)
NOTE 2 : SHARE CAPITAL 2016 2015
Authorised share capital
42,50,00,000 (42,50,00,000) equity shares of H10 (Rupees ten only) each 42,500.00 42,500.00
42,500.00 42,500.00
Issued, subscribed and paid up share capital
33,93,03,845 (32,82,37,969) equity shares of H10 (Rupees ten only) each fully paid up
33,930.38 32,823.80
33,930.38 32,823.80
A. Reconciliation of shares outstanding at the beginning and at the end of the year
Equity shares
2016 2015
in No. H in Lakh in No. H in Lakh
At the beginning of the year 32,82,37,969 32,823.80 32,82,33,262 32,823.33
Add: Issue of fresh shares on preferential basis
1,10,00,000 1,100.00 - -
Add: Issue of fresh shares on exercise of options vested under Employee Stock Option Scheme
65,876 6.58 4,707 0.47
At the end of the year 33,93,03,845 33,930.38 32,82,37,969 32,823.80
C. Details of shareholders holding more than 5% shares in the Company
Equity shares
2016 2015
in No. % Holding in No. % Holding
i) Vikas Oberoi 21,28,72,504 62.74% 21,28,72,504 64.85%
ii) R S Estate Developers Private Limited 3,33,00,000 9.81% 3,33,00,000 10.15%
B. Terms / rights attached to equity shares The Company has only one class of equity shares having par value of H 10 per share. Each shareholder of equity
shares is entitled to one vote per share. The Company declares dividends in Indian rupees. The dividend proposed by the Board of Directors is subject to the approval of the shareholders in the ensuing Annual General Meeting.
During the year, the Board of Directors of the Company has declared and paid interim dividend of H 2 per equity share for the financial year 2015-2016. The said interim dividend shall be considered as the final dividend for the said financial year. For the previous year, the Board of Directors of the Company recommended and shareholders approved dividend of H 2 per equity share.
As per the records of the Company, including its register of shareholders / members and other declarations received from shareholders regarding beneficial interest, the above shareholding represents both legal and beneficial ownership of shares.
D. Shares reserved for issue under options The Company instituted an Employees Stock Option Scheme (‘ESOP 2009’) pursuant to the Board and Shareholders’
resolution dated December 04, 2009. As per ESOP 2009, the Company is authorised to grant 14,43,356 options comprising equal number of equity shares in one or more tranches to the eligible employees of the Company and
NOTES FORMING PART OF CONSOLIDATED FINANCIAL STATEMENTS
350

2015-16 79
78
The following information relates to the Employee Stock Options as on March 31, 2016
Particulars Number of options
Exercise price (H)
Weighted average
exercise price (H)
Weighted average contractual life of options as on the
date of grant (Years)Outstanding at the beginning of the year 7,32,534 260 260 4.20Less: Lapsed / forfeited / cancelled during the year
1,50,907 - - -
Less: Exercised during the year 65,876 260 260 - Outstanding at the end of the year 5,15,751 260 260 4.20Exercisable at the end of the year 5,15,751 260 260 4.20
The employee share based payments have been accounted using the intrinsic value method measured by a difference between the market price of the underlying equity shares as at the date of grant and the exercise price. Since the market price of the underlying equity shares on the grant date is same as exercise price of the option, the intrinsic value of option is determined as H Nil. Hence no compensation expense has been recognised. Under the fair value method, there would have been no impact on the basic and diluted EPS for the year.
(H in Lakh)
NOTE 3 : RESERVES AND SURPLUS 2016 2015
General reserveOpening balance 23,275.82 23,309.32 Less: depreciation (net of taxes) - 33.50
23,275.82 23,275.82 Capital redemption reserveBalance in Capital redemption reserve 5,710.00 5,710.00
5,710.00 5,710.00 Capital reserveBalance in Capital reserve 3,590.00 3,590.00
3,590.00 3,590.00 Securities premium accountOpening balance 1,35,144.38 1,35,132.61 Add: receipt during the year 31,514.69 11.77 Less: share issue expenses 40.47 -
1,66,618.60 1,35,144.38 Capital reserve on consolidationBalance in Capital reserve on consolidation 7,585.19 7,585.19
7,585.19 7,585.19 Surplus in statement of profit and lossOpening balance 2,55,299.43 2,31,488.66 Add: increase in ownership interest in joint venture (3.83) - Add: profit during the year as per statement of profit and loss 42,591.20 31,711.98 Less: Appropriations Interim dividend 6,786.08 - Final dividend 0.76 6,564.76 Dividend distribution tax 1,381.64 1,336.45
2,89,718.32 2,55,299.43 4,96,497.93 4,30,604.82
its subsidiaries. The employee will have the option to exercise the right within three years from the date of vesting of options. Under ESOP 2009, 13,49,553 options have been granted, out of which as on date of balance sheet 5,15,751 options are outstanding.
NOTE 2 : SHARE CAPITAL (contd.)
NOTES FORMING PART OF CONSOLIDATED FINANCIAL STATEMENTS
351

Terms of Non Convertible Debentures1) The coupon rate is 10.85% p.a., payable semi- annually. The Company has an option to redeem the debentures
prior to the scheduled redemption date mentioned above in one or more tranches out of the sale proceeds of the security offered, subject to payment of early redemption premium. The Company also has a call option on Series III and IV on April 21, 2016 and August 21, 2016 respectively, subject to payment of prepayment premium. During the current year, the Company prepaid Series II debentures prior to its original date of redemption.
2) Security The Debentures are unsecured for the purposes of Section 71(3) of the Companies Act, 2013. However, they are
secured by (i) mortgage of an immovable property of the Subsidiary Company, (ii) certain immovable properties of the holding company and the hypothecation and escrow of the receivables thereof and (iii) further secured by way of an irrevocable and unconditional corporate guarantee of the Company. The security cover as required under the terms of the issue of the said Debentures is maintained.
Term Loan Term Loan from bank and others is secured by mortgage of certain immovable properties of the joint venture project
and the hypothecation of all current assets of the joint venture project, excluding certain identified receivables. The loan is further secured by an irrevocable and unconditional corporate guarantee of the Company. The Term Loan is repayable in 9 quarterly instalments commencing from March 31, 2016.
(H in Lakh)
NOTE 4 : BORROWINGS (SECURED)Long term (non-current) Short term (current)
2016 2015 2016 2015
Secured
1. 10.85% Redeemable Non-Convertible Debentures
Nil (150) - Series I (Face value of H Nil (H34.00 Lakh) each fully paid up), redeemable on April 21, 2015
- - - 5,100.00
Nil (250) - Series II (Face value of H
Nil (H100.00 Lakh) each fully paid up), redeemable on April 21, 2016
- 25,000.00 - -
250 (250) - Series III (Face value of H100.00 Lakh each fully paid up), redeemable on April 21, 2017
25,000.00 25,000.00 - -
100 (100) - Series IV (Face value of H100.00 Lakh each fully paid up), redeemable on August 21, 2017
10,000.00 10,000.00 - -
35,000.00 60,000.00 - 5,100.00
2. Term Loan
- From Bank 10,673.48 10,711.04 3,883.91 1,030.57
- From Others 2,771.40 2,280.57 1,008.47 219.43
13,444.88 12,991.61 4,892.38 1,250.00
48,444.88 72,991.61 4,892.38 6,350.00
NOTES FORMING PART OF CONSOLIDATED FINANCIAL STATEMENTS
352

2015-16 81
80
(H in Lakh)
NOTE 5 : DEFERRED TAX LIABILITIES 2016 2015
Deferred tax liabilities
On depreciation 2,477.77 2,476.23
Deferred tax assets
On other expenses 190.66 51.46
Deferred tax liabilities (net) 2,287.11 2,424.77
(H in Lakh)
NOTE 6 : TRADE PAYABLESNon-current portion Current portion
2016 2015 2016 2015
Trade payables
Total outstanding dues of micro enterprises and small enterprises
- 0.06 12.05 4.96
Total outstanding dues of creditors other than micro enterprises and small enterprises
645.02 645.53 4,348.92 2,854.60
Others
Total outstanding dues of micro enterprises and small enterprises
- - - 2.43
Total outstanding dues of creditors other than micro enterprises and small enterprises
55.93 - 281.84 670.38
700.95 645.59 4,642.81 3,532.37
(H in Lakh)
NOTE 7 : OTHER LONG-TERM LIABILITIES 2016 2015
Trade deposits 5,031.03 7,824.42
5,031.03 7,824.42
NOTES FORMING PART OF CONSOLIDATED FINANCIAL STATEMENTS
353

(H in Lakh)
NOTE 10 : OTHER CURRENT LIABILITIES 2016 2015
Current portion of long term borrowings (refer note 4) 4,892.38 6,350.00
Billing in excess of revenue 1,33,264.99 1,07,544.03
Advances from customers 4,805.30 3,541.45
Dividend payout account 2.64 -
Unclaimed dividend 1.73 1.29
Trade deposits 10,778.04 7,805.91
Other payables
Other deposits 0.21 0.20
Provision for expenses 13,417.54 14,617.77
Statutory dues 848.18 608.71
Others 5,181.16 1,456.96
1,73,192.17 1,41,926.32
(H in Lakh)
NOTE 9 : SHORT-TERM BORROWINGS (UNSECURED) 2016 2015
Others 10,814.17 10,814.17
10,814.17 10,814.17
Loans and advance from related party (refer note 30) 10,708.00 10,708.00
(H in Lakh)
NOTE 8 : PROVISIONSLong term (non-current) Short term (current)
2016 2015 2016 2015
Provision for employee benefits
Provision for gratuity (refer note 28) - - 264.81 355.15
Provision for leave salary (refer note 28) 138.53 119.09 32.29 32.55
138.53 119.09 297.10 387.70
Others
Proposed equity dividend - - - 6,564.76
Provision for dividend distribution tax - - - 1,336.45
- - - 7,901.21
138.53 119.09 297.10 8,288.91
NOTES FORMING PART OF CONSOLIDATED FINANCIAL STATEMENTS
354

2015-16 83
82
NO
TE 1
1 :
FIX
ED A
SSET
S
(H
in L
akh)
Part
icul
ars
Gro
ss b
lock
Acc
umul
ated
dep
reci
atio
n an
d am
ortis
atio
nN
et b
lock
As
At
01
-04
-20
15
Incr
ease
in
owne
rshi
p in
tere
st in
jo
int
vent
ure
Add
ition
sD
educ
tions
As
At
31
-03
-20
16
As
At
01
-04
-20
15
Incr
ease
in
owne
rshi
p in
tere
st in
jo
int
vent
ure
For
the
year
**D
educ
tions
Tran
sfer
red
to
Rese
rves
and
Su
rplu
s^
As
At
31
-03
-20
16
As
At
31
-03
-20
16
As
At
31
-03
-20
15
Tang
ible
Ass
ets
Land
- fr
eeho
ld11
,102
.41
--
-11
,102
.41
--
--
--
11,1
02.4
111
,102
.41
Resi
dent
ial b
uild
ing#
72.1
0-
--
72.1
09.
55-
1.21
--
10.7
661
.34
62.5
5Bu
ildin
gs72
,229
.22
0.05
166.
70-
72,3
95.9
74,
037.
620.
051,
223.
80-
-5,
261.
4767
,134
.50
68,1
91.6
0El
ectri
cal i
nsta
llatio
ns4,
772.
88-
5.86
-4,
778.
741,
218.
67-
627.
35-
-1,
846.
022,
932.
723,
554.
21Fu
rnitu
re a
nd fi
xtur
es*
6,23
2.90
0.53
266.
682.
496,
497.
623,
020.
370.
1093
3.31
2.38
-3,
951.
402,
546.
223,
212.
53O
ffice
equ
ipm
ents
*23
8.28
0.12
23.4
10.
1326
1.68
181.
890.
0331
.80
0.09
-21
3.63
48.0
556
.39
Plan
t and
mac
hine
ry19
,460
.24
0.25
368.
613.
6119
,825
.49
5,39
8.62
0.04
1,82
2.43
1.74
-7,
219.
3512
,606
.14
14,0
61.6
2C
ompu
ter*
756.
200.
2812
2.06
11.7
886
6.76
655.
410.
2169
.70
11.7
5-
713.
5715
3.19
100.
79Ve
hicl
es*
913.
82-
1.35
4.75
910.
4243
3.53
-77
.89
3.17
-50
8.25
402.
1748
0.29
Airc
raft*
831.
85-
--
831.
8532
6.51
-39
.37
--
365.
8846
5.97
505.
34To
tal t
angi
ble
asse
ts(A
)1
,16
,60
9.9
01
.23
95
4.6
72
2.7
61
,17
,54
3.0
41
5,2
82
.17
0.4
34
,82
6.8
61
9.1
3-
20
,09
0.3
39
7,4
52
.71
1,0
1,3
27
.73
prev
ious
yea
r77
,704
.58
-38
,951
.25
45.9
31,
16,6
09.9
011
,334
.64
-3,
946.
1042
.45
43.8
815
,282
.17
1,01
,327
.73
66,3
69.9
4In
tang
ible
Ass
ets
Com
pute
r so
ftwar
e81
8.80
0.04
183.
43-
1,00
2.27
669.
530.
0374
.96
--
744.
5225
7.75
149.
27To
tal i
ntan
gibl
e as
sets
(B)
81
8.8
00
.04
18
3.4
3-
1,0
02
.27
66
9.5
30
.03
74
.96
--
74
4.5
22
57
.75
14
9.2
7pr
evio
us y
ear
789.
81-
28.9
9-
818.
8058
1.45
-88
.08
--
669.
5314
9.27
208.
36To
tal A
sset
s(A
+B)
1,1
7,4
28
.70
1.2
71
,13
8.1
02
2.7
61
,18
,54
5.3
11
5,9
51
.70
0.4
64
,90
1.8
21
9.1
3-
20
,83
4.8
59
7,7
10
.46
1,0
1,4
77
.00
prev
ious
yea
r78
,494
.39
-38
,980
.24
45.9
31,
17,4
28.7
011
,916
.09
-4,
034.
1842
.45
-15
,951
.70
1,01
,477
.00
66,5
78.3
0N
otes
:#
Re
side
ntia
l bui
ldin
g in
clud
es 5
sha
res
of H
10 e
ach
of a
hou
sing
soc
iety
, whi
ch is
pen
ding
for
trans
fer.
*
The
abov
e in
clud
es g
ross
blo
ck o
f H 8
41.3
3 (p
revi
ous
year
H 8
41.2
1) h
eld
in th
e na
me
of A
oP o
n co
-ow
ners
hip
basi
s.**
Re
fer
note
24,
for
depr
ecia
tion
and
amor
tisat
ion
capi
talis
ed /
allo
cate
d to
pro
ject
.^
As
per
par
a 7
(b) o
f Not
es to
Par
t C o
f Sch
edul
e II
to th
e C
ompa
nies
Act
, 20
13,
whe
re th
e re
mai
ning
use
ful l
ife o
f an
asse
t as
on th
e ef
fect
ive
date
i.e.
Apr
il 1,
201
4 is
nil,
the
carr
ying
am
ount
of t
he a
sset
(net
of t
axes
) is
reco
gnis
ed in
op
enin
g ba
lanc
e of
ret
aine
d ea
rnin
gs i.
e. G
ener
al R
eser
ve.
A.
Ass
ets
give
n on
ope
ratin
g le
ase
The
Gro
up h
as e
nter
ed in
to c
omm
erci
al p
rope
rty le
ases
, the
det
ails
of w
hich
are
as
unde
r. L
ease
s in
clud
e a
clau
se to
ena
ble
revi
sion
of t
he L
ease
s re
ntal
cha
rges
from
tim
e to
tim
e. (H
in L
akh)
Cla
ss o
f A
sset
s: C
omm
erci
al P
rem
ises
2
01
62
01
5
Gro
ss b
lock
70,
551.
05
70,
115.
63
Accu
mul
ated
dep
reci
atio
n 8
,610
.21
6,1
71.9
5 D
epre
ciat
ion
for
the
year
2,4
38.1
9 1
,508
.32
B.Fu
ture
min
imum
leas
e pa
ymen
ts r
ecei
vabl
es u
nder
non
-can
cella
ble
oper
atin
g le
ase
(H in
Lak
h)
20
16
20
15
Not
late
r th
an o
ne y
ear
4,9
29.5
7 8
,314
.22
Late
r th
an o
ne y
ear
and
not l
ater
than
five
yea
rs 5
,497
.43
6,0
60.3
7 La
ter
than
five
yea
r -
-
Le
ase
inco
me
reco
gnis
ed d
urin
g th
e ye
ar in
pro
fit a
nd lo
ss
16,
357.
43
15,
895.
33
NO
TES
FORM
ING
PA
RT O
F C
ON
SOLI
DA
TED
FIN
AN
CIA
L ST
ATE
MEN
TS
355

(H in Lakh)
NOTE 12 : NON-CURRENT INVESTMENTS 2016 2015
Long term - Non-trade investments (valued at cost unless stated otherwise)
Investments in government securities
National saving certificate (in the name of employee of the Company) - 1.21
- 1.21
Aggregate amount of
Book value of unquoted investments - 1.21
(H in Lakh)
NOTE 13 : LOANS AND ADVANCES (UNSECURED AND CONSIDERED
GOOD)
Long term (non-current) Short term (current)
2016 2015 2016 2015
Capital advances 3,837.52 3,872.72 - -
Advances to vendors 205.64 206.37 36,020.95 35,427.36
Deposits 52,758.85 53,508.43 84.70 88.77
Advances recoverable in cash or kind 86.38 725.92 12,385.03 7,409.90
Revenue in excess of billing - - 6,365.04 19,048.80
Loans and advances to related parties (refer note 30)
65,959.17 53,669.80 2,218.03 2,148.90
Other loans and advances 1,556.22 406.27 1,945.78 1,945.78
Current capital contribution in LLP (refer note 30) 528.55 - - -
1,24,932.33 1,12,389.51 59,019.53 66,069.51
Other loans and advances
Income tax (net of provisions) 12,916.52 12,916.52 1,966.91 3,782.69
Prepaid expenses 42.11 10.03 476.65 447.38
Loans to employees - - 20.87 2.57
12,958.63 12,926.55 2,464.43 4,232.64
1,37,890.96 1,25,316.06 61,483.96 70,302.15
Loans / advances due by directors or other officers, etc.
Advances to related parties include - -
Due from the private limited company (JV) in which the Company’s director is a director
241.05 244.54
NOTES FORMING PART OF CONSOLIDATED FINANCIAL STATEMENTS
356

2015-16 85
84
(H in Lakh)
NOTE 14 : CURRENT INVESTMENTS 2016 2015
Current investments (valued at lower of cost or fair value, unless stated otherwise)Investments in units of mutual funds (quoted, non-trade) :11,229 (Nil) units of H100 each of Birla Sun Life Cash Plus - Direct Plan - Growth Option
27.12 -
77,448 (Nil) units of H100 each of DHFL Pramerica Insta Cash Plus Fund -Direct Plan - Growth Option
152.00 -
386 (Nil) units of H1000 each of HDFC Cash Management Fund - Savings Plan - Direct Plan - Growth Option
12.00 -
15,56,948 (Nil) units of H100 each of ICICI Prudential Liquid -Direct Plan - Growth Option (4,41,336 units having book value of H989.00 Lakh is lien marked)
3,489.00 -
1,09,751 (Nil) units of H1,000 each of Kotak Floater Short Term Fund - Direct Plan - Growth Option
2,726.00 -
1,632 (Nil) units of H1,000 each of Reliance Liquid Fund - Treasury Plan - Direct Plan - Growth Option
60.00 -
24,340 (Nil) units of H1,000 each of Reliance Liquidity Fund - Direct Plan - Growth Option
555.00 -
17,346 (Nil) units of H1,000 each of SBI Premier Liquid Fund - Direct Plan - Growth Option
412.00 -
264 (Nil) units of H1,000 each of Kotak Liquid Scheme Plan A - Direct Plan - Growth Option
8.00 -
7,441.12 - Aggregate amount of Book value of quoted investments 7,441.12 - Market value of quoted investments 7,450.06 -
(H in Lakh)
NOTE 15 : INVENTORIES 2016 2015
Plots of land 514.91 514.91
Works in progress 3,76,990.51 3,20,920.78
Finished goods 13,578.09 22,198.16
Food and beverages etc. 153.93 136.80
Others (including transferrable development rights) 1,821.63 4,404.08
3,93,059.07 3,48,174.73
NOTES FORMING PART OF CONSOLIDATED FINANCIAL STATEMENTS
357

(H in Lakh)
NOTE 16 : TRADE RECEIVABLES (UNSECURED AND CONSIDERED GOOD)
2016 2015
Outstanding for a period exceeding six months from the date of becoming due for payment
1,808.86 2,878.38
Other receivables 9,894.05 5,402.97
11,702.91 8,281.35
(H in Lakh)
NOTE 17 : CASH AND BANK BALANCES 2016 2015
Cash and cash equivalents
Cash on hand 56.33 79.23
Balance with banks in current accounts 4,092.44 3,910.02
Fixed deposits with banks, having original maturity of three months or less 4,778.50 12,167.97
8,927.27 16,157.22
Other bank balances
Balance with banks in dividend / unclaimed dividend accounts 4.37 1.29
Fixed deposit with banks, having original maturity of more than three months but less than twelve months
12,836.26 -
Fixed deposit with banks, having original maturity of more than twelve months 4,597.67 2,809.57
Fixed deposits with banks (lien marked) 5,720.34 10,400.41
23,158.64 13,211.27
32,085.91 29,368.49
(H in Lakh)
NOTE 18 : OTHER ASSETS 2016 2015
Interest accrued but not due 348.19 125.69
Others 2,321.53 233.58
2,669.72 359.27
(H in Lakh)
NOTE 19 : REVENUE FROM OPERATIONS 2016 2015
Revenue from operations Revenue from projects 1,06,329.06 59,028.83 Revenue from hospitality 12,712.43 12,169.16 Rental and other related revenues 17,080.30 16,497.88 Property and management revenues 3,849.64 3,396.69 Other operating revenue 837.57 1,174.19
1,40,809.00 92,266.75
NOTES FORMING PART OF CONSOLIDATED FINANCIAL STATEMENTS
358

2015-16 87
86
(H in Lakh)
NOTE 20 : OTHER INCOME 2016 2015
Interest income on
Bank fixed deposits 1,695.77 820.29
Others 423.91 11.96
Dividend income on investments 110.90 467.59
Profit on sale of investments (net) 1,387.94 445.52
Other non-operating income 2.08 3.16
3,620.60 1,748.52
(H in Lakh)
NOTE 21 : OPERATING COSTS 2016 2015
Opening balance of works in progress 3,20,920.78 1,63,726.53
Opening stock of finished goods 22,198.16 502.35
Opening stock of food and beverages etc. 136.80 127.81
(A) 3,43,255.74 1,64,356.69
Add: transferred from current assets 2,822.56 -
Add: expenses incurred during the year
Share of works in progress in joint venture 3,113.58 -
Land, development right and transferrable development rights 35,983.10 1,50,427.25
Materials, structural, labour and contract cost 31,427.44 29,268.85
Other project costs 9,458.67 6,555.39
Rates and taxes 11,582.93 6,693.04
Professional charges 2,988.24 2,353.88
Food, beverages and hotel expenses 4,907.94 4,677.81
Depreciation and amortisation 2.33 4.88
Allocated expenses to projects
Employee benefits expense 6,040.96 4,224.47
Other expenses 733.26 1,066.43
Interest and finance charges 7,269.09 8,756.23
(B) 1,16,330.10 2,14,028.23
Less:
Closing balance of works in progress 3,76,990.51 3,20,920.78
Closing stock of finished goods 13,578.09 22,198.16
Closing stock of food and beverages etc. 153.93 136.80
Transfer to current assets / fixed assets / capital work in progress 5,892.97 3,648.51
(C) 3,96,615.50 3,46,904.25
(A+B-C) 62,970.34 31,480.67
NOTES FORMING PART OF CONSOLIDATED FINANCIAL STATEMENTS
359

(H in Lakh)
NOTE 22 : EMPLOYEE BENEFITS EXPENSE 2016 2015
Employee costs 10,647.84 8,336.05 Contribution to provident fund, gratuity and others 717.68 750.05 Staff welfare expenses 438.80 402.91
11,804.32 9,489.01 Less: allocated to projects / capitalized 6,040.96 4,224.47
5,763.36 5,264.54
(H in Lakh)
NOTE 23 : OTHER EXPENSES 2016 2015
Advertising and marketing expenses 1,663.87 2,136.82 Books and periodicals expenses 2.58 1.88 Communication expenses 95.99 80.02 Conveyance and travelling expenses 277.09 251.20 Corporate social responsibility expenses 574.82 71.56 Directors sitting fees and commission 75.02 51.97 Donations 46.60 46.98 Electricity charges 204.87 424.16 Hire charges 43.71 20.83 Information technology expenses 368.00 327.42 Insurance charges 265.56 195.52 Legal and professional charges 104.44 167.68 (Gain) / loss on foreign exchange fluctuation (net) 11.63 1.86 (Gain) / loss on sale / discarding of fixed asset (net) 0.60 (0.55)Membership and subscription charges 21.45 14.81 Miscellaneous expenses 242.84 161.91 Payment to auditor (refer below note) 99.68 91.15 Printing and stationery expenses 189.53 150.61 Rent expenses 16.76 14.02 Repairs and maintenance Building 138.02 113.39 Plant and machinery 149.76 158.53 Others 1,228.60 433.42 Security expenses 218.46 275.58 Vehicle expenses 23.48 17.84
6,063.36 5,208.61 Less: allocated to projects / capitalised 733.26 1,066.43
5,330.10 4,142.18
Note: Payment to auditor (H in Lakh)
2016 2015
As auditor Statutory audit fees (including for Limited Review) 74.04 65.42 Tax audit fees 13.04 13.00 In other capacity Taxation matters 12.50 12.50 Out of pocket expenses 0.11 0.23
99.69 91.15
NOTES FORMING PART OF CONSOLIDATED FINANCIAL STATEMENTS
360

2015-16 89
88
(H in Lakh)
NOTE 24 : DEPRECIATION AND AMORTISATION 2016 2015
Depreciation on tangible assets 4,826.86 3,946.10
Amortisation of intangible assets 74.96 88.08
4,901.82 4,034.18
Less: allocated to projects / capitalized 2.33 4.88
4,899.49 4,029.30
(H in Lakh)
NOTE 26 : EARNINGS PER SHARE (EPS) 2016 2015
Profit after tax as per statement of profit and loss 42,591.20 31,711.98
Weighted average number of equity shares for basic EPS (in No.) 33,59,77,183 32,82,33,590
Add: Weighted average potential equity shares on grant of option under ESOP (in No.)
- # 18,885
Weighted average number of equity shares for diluted EPS (in No.) 33,59,77,183 32,82,52,475
Face value of equity share (H) 10 10
Basic earnings per share (H) 12.68 9.66
Diluted earnings per share (H) 12.68 9.66
# Anti-dilutive
(H in Lakh)
NOTE 27 : PROPOSED DIVIDEND AND DIVIDEND DISTRIBUTION TAX 2016 2015
Proposed dividend
Equity shares - 6,564.76
Dividend distribution tax
Equity shares - 1,336.45
- 7,901.21
(H in Lakh)
NOTE 25 : INTEREST AND FINANCE CHARGES 2016 2015
Interest expenses 7,166.03 8,701.86
Bank and finance charges 119.17 230.61
7,285.20 8,932.47
Less: allocated to projects / capitalized 7,269.09 8,756.23
16.11 176.24
NOTES FORMING PART OF CONSOLIDATED FINANCIAL STATEMENTS
361

(H in Lakh)
NOTE 28 : EMPLOYEE BENEFITS 2016 2015
A. Defined contribution plans
Employer’s contribution to provident fund 367.47 339.17
Employer’s contribution to pension fund 58.36 47.59
Employer’s contribution to ESIC 11.64 11.17
Labour welfare fund contribution for workmen 0.34 0.36
(H in Lakh)
B. Defined benefit plansGratuity Leave encashment
2016 2015 2016 2015
i) Change in present value of obligations Present value obligation at the beginning of the year 707.39 347.29 151.64 136.54 Adjustment to opening balance 20.20 - 0.06 - Interest cost 57.34 28.08 12.16 10.47 Service cost 168.82 198.81 52.60 204.74 Past service cost- (non vested benefits) - 11.70 - - Past service cost -(vested benefits) 33.63 233.00 4.68 - Benefit paid (47.20) (45.33) (50.20) (31.08) Actuarial (gains) / losses 77.11 (66.16) (0.12) (169.03) Present value obligation at the end of the year 1,017.29 707.39 170.82 151.64 ii) Change in fair value of plan assets Fair value of plan assets at the beginning of the year 346.67 283.74 - - Adjustment to opening balance 19.90 10.77 - - Expected return on plan assets 27.81 24.69 - - Contribution 370.37 73.57 50.20 31.08 Benefit paid (47.20) (45.33) (50.20) (31.08) Actuarial gains / (losses) 34.92 (0.77) - - Closing balance of fair value of plan assets 752.47 346.67 - - iii) Experience history (Gains) / losses on obligation due to change in
assumption 10.48 58.00 4.77 9.26
Experience (gains) / losses on obligation 66.63 (124.16) (4.88) (178.30) Actuarial gains / (losses) on plan assets 34.92 (0.77) - - iv) Amount recognised in the balance sheet Present value of obligation at the end of year 1,017.28 707.38 170.82 151.64 Fair value of plan assets at the end of the year 752.47 346.67 - - Funded status (264.81) (360.72) (170.82) (151.64) Unrecognised past service cost - non vested benefits - 5.57 - - Net assets / (liability) recognised in the balance
sheet (264.81) (355.15) (170.82) (151.64)
v) Expense recognised in statement of profit and loss
Current service cost 168.82 198.81 52.60 204.74 Interest cost 57.34 28.08 12.16 10.47 Past service cost- (non vested benefits) 5.57 11.70 0.08 - Past service cost -(vested benefits) 33.63 233.00 4.60 - Expected return on plan assets (27.81) (24.69) - -
NOTES FORMING PART OF CONSOLIDATED FINANCIAL STATEMENTS
362

2015-16 91
90
D. Broad category of plan assets relating to gratuity as a percentage of total plan assets as on March 31,
2016 2015
Government of India securities Nil Nil
High quality corporate bonds Nil Nil
Equity shares of listed companies Nil Nil
Property Nil Nil
Policy of insurance 100% 100%
100% 100%
Actuarial assumptions
Gratuity Leave encashment
2016 2015 2016 2015
Interest / discount rate 7.80% 8.00% 7.80% 8.00%Expected return on plan assets 8.00% 8.00% - -Annual expected increase in salary cost 10.00% 10.00% 10.00% 10.00%
(H in Lakh)
B. Defined benefit plansGratuity Leave encashment
2016 2015 2016 2015
Unrecognised past service cost - non vested benefits - (5.57) - - Net actuarial (gains) / losses recognised for the
year 42.19 (65.39) (0.12) (169.03)
Expenses recognised in statement of profit and loss
279.74 375.94 69.32 46.18
vi) Movement in the liability recognised in balance sheet
Opening net liability 355.15 63.55 151.64 136.54 Adjustment to opening balance 0.29 (10.77) 0.06 - Expenses as above 279.74 375.94 69.32 46.18 Contribution paid (370.37) (73.57) (50.20) (31.08) Closing net liability 264.81 355.15 170.82 151.64 vii) Classification of defined benefit obligations Non-current portion - - 138.53 119.09 Current portion 264.81 355.15 32.29 32.55
C. General Description of significant defined plans Gratuity plan Gratuity is payable to all eligible employees on death or on resignation, or on retirement after completion of five
years of service.
Leave plan Eligible employees can carry forward leave in month of April of every year during tenure of service or encash the
same on death, permanent disablement or resignation.
NOTE 28 : EMPLOYEE BENEFITS (contd.)
NOTES FORMING PART OF CONSOLIDATED FINANCIAL STATEMENTS
363

(H in Lakh)
NOTE 29 : SEGMENT INFORMATION
2016 2015
Real estate Hospitality Total Real estate Hospitality Total
Segment revenue 1,27,971.55 12,837.45 1,40,809.00 80,011.51 12,255.24 92,266.75
Segment result 60,674.87 2,200.50 62,875.37 46,635.53 1,339.06 47,974.59
Unallocated income net of unallocated expenses
471.26 291.74
Operating profit 63,346.63 48,266.33
Less: Interest and finance charges
(16.11) (176.24)
Add: Interest income 2,119.68 832.25
Profit before tax 65,450.20 48,922.34
Provision for tax (22,859.00) (17,210.36)
Profit after tax 42,591.20 31,711.98
Other information
Segment assets 6,97,857.90 33,604.36 7,31,462.26 6,47,449.19 34,893.05 6,82,342.24
Unallocated corporate assets (A)
44,514.80 29,653.63
Total assets 7,75,977.06 7,11,995.87
Segment liabilities 2,39,956.07 3,301.19 2,43,257.26 2,34,977.11 3,262.87 2,38,239.98
Unallocated corporate liabilities
2,291.49 10,327.27
Total liabilities 2,45,548.75 2,48,567.25
Capital expenditure for the year (net of transfers)
2,053.64 36.04 2,089.68 (1,875.26) 42.97 (1,832.29)
Unallocated capital expenditure for the year
615.98 110.74
Depreciation for the year 2,497.51 2,006.45 4,503.96 1,554.13 2,083.55 3,637.68
Unallocated depreciation for the year
395.53 391.62
Note: A. Unallocated corporate assets includes temporary surplus. Income earned on temporary investment of the same has
been shown in ‘Unallocable Income net of Unallocable Expenses’.
B. The Company is developing through a joint venture a mixed use project comprising of a hotel and residences. Pending the final set of approvals which will give clarity on the overall size of the project, the total cost of H42,726.89 Lakh incurred till date is reflected under the real estate segment and the relevant cost shall be allocated to the hospitality segment once there is certainty. However, the revenue recognition of this project has not yet commenced and hence there is no impact of the same on the segment revenue.
NOTES FORMING PART OF CONSOLIDATED FINANCIAL STATEMENTS
364

2015-16 93
92
NOTE 30 : RELATED PARTY DISCLOSURES
A. Name of related parties and related party relationship
i) Related parties with whom transactions have taken place during the year
Joint ventures Sangam City Township Private Limited
ZACO Aviation (AoP)
Oasis Realty (AoP)
I-Ven Realty Limited
Saldanha Realty and Infrastructure LLP
Aion Realty LLP
Metropark Infratech And Realty Developments Private Limited
Shri Siddhi Avenues LLP (from March 17, 2016)
Shri Siddhi Enterprises (from April 15, 2015 till March 16, 2016)
Key management personnel Vikas Oberoi
and their relatives Bindu Oberoi
Ranvir Oberoi
Santosh Oberoi
Gayatri Oberoi
Saumil Daru
Darsha Daru
Ashwin Daru
Entities where key management R S Estate Developers Private Limited
personnel have significant influence Oberoi Foundation
R. S. V. Associates
Oberoi Associates
Neo Realty Private Limited
B. Related party transactions (H in Lakh)
Nature of transaction NameJoint ventures
Entities where key management personnel
have significant influence
Key management personnel and their
relatives
2016 2015 2016 2015 2016 2015
Slab demand for flat (Sale of unit)
R S Estate Developers Private Limited
- - 13.40 - - -
Advance given Oasis Realty (AoP) 10,995.76 14,350.19 - - - -
Metropark Infratech And Realty Developments Private Limited
- 268.00 - - - -
Saldanha Realty and Infrastructure LLP
69.13 1,077.65 - - - -
Advance given for unit (slab demand)
Oasis Realty (AoP) 1,277.50 - - - - -
Advance received back Sangam City Township Private Limited
3.48 1.27 - - - -
Allotment of debentures Vikas Oberoi - - - - 449.38 668.50
Amount received on behalf of Oasis Realty (AoP) 0.72 - - - - -
Cancellation of units Santosh Oberoi - - - - - 2,560.36
Corporate guarantee given Oasis Realty (AoP) 6,784.52 18,950.07 - - - -
NOTES FORMING PART OF CONSOLIDATED FINANCIAL STATEMENTS
365

NOTE 30 : RELATED PARTY DISCLOSURES (contd.)
B. Related party transactions (H in Lakh)
Nature of transaction NameJoint ventures
Entities where key management personnel
have significant influence
Key management personnel and their
relatives
2016 2015 2016 2015 2016 2015
Current capital contribution account - paid
Aion Realty LLP - 50.00 - - - -
Shri Siddhi Enterprises 528.55
Current capital contribution account - received back
Aion Realty LLP - 50.00 - - - -
Deposit given ZACO Aviation (AoP) 0.35 - - - - -
Deposit received Oberoi Foundation - - - 67.26 - -
Dividend paid Bindu Oberoi - - - - 0.00 0.00
Gayatri Oberoi - - - - 0.00 0.00
Ranvir Oberoi - - - - 0.04 0.02
R S Estate Developers Private Limited
- - - - 1,332.00 666.00
Santosh Oberoi - - - - 0.04 0.02
Vikas Oberoi - - - - 8,514.90 4,257.45
Saumil Daru - - - - 0.24 0.01
Darsha Daru - - - - 0.02 0.01
Ashwin Daru - - - - 0.02 0.01
Interest income Shri Siddhi Avenues LLP 7.87 - - - - -
Shri Siddhi Enterprises 152.37 - - - - -
Loan given Shri Siddhi Avenues LLP 2.50 - - - - -
Shri Siddhi Enterprises 1,356.83 - - - - -
Loan received Vikas Oberoi - - - - - 10,708.00
Loan received back Shri Siddhi Enterprises 6.17 - - - - -
Purchase of assets Oasis Realty (AoP) - 2.41 - - - -
ZACO Aviation (AoP) 0.12 2.72 - - - -
Recovery of deposit ZACO Aviation (AoP) - 0.57 - - - -
Recovery of expenses Neo Realty Private Limited - - 0.28 - - -
Oasis Realty (AoP) 210.73 308.43 - - - -
Oberoi Foundation - - 4.65 4.21 - -
Redemption of debentures Vikas Oberoi - - - - - 615.00
Reimbursement of expenses I-Ven Realty Limited 1.31 1.35 - - - -
Oberoi Foundation - - - 2.01 - -
ZACO Aviation (AoP) 40.12 47.72 - - - -
Remuneration Bindu Oberoi - - - - 77.50 50.00
Vikas Oberoi - - - - - 129.55
Saumil Daru - - - - 203.26 179.71
Rent received Neo Realty Private Limited - - 0.12 0.12 - -
Oberoi Foundation - - 2,733.97 2,614.93 - -
Sale of assets ZACO Aviation (AoP) - 0.25 - - - -
Sale of materials Oasis Realty (AoP) 0.15 0.07 - - - -
Sale of units slab demand Santosh Oberoi - - - - - 2,560.36
R. S. V. Associates - - 102.43 67.98 - -
NOTES FORMING PART OF CONSOLIDATED FINANCIAL STATEMENTS
366

2015-16 95
94
NOTE 30 : RELATED PARTY DISCLOSURES (contd.)
C. Closing balances of related parties (H in Lakh)
Nature of transaction NameJoint ventures
Entities where key management personnel
have significant influence
Key management personnel and their
relatives
2016 2015 2016 2015 2016 2015
Advance given Sangam City Township Private Limited
241.05 244.54 - - - -
Oasis Realty (AoP) 64,421.02 53,425.26 - - - -
Metropark Infratech And Realty Developments Private Limited
268.00 268.00 - - - -
Saldanha Realty and Infrastructure LLP
2,218.03 2,148.90 - - - -
Loan given Shri Siddhi Avenues LLP 1,297.09 - - - - -
Current capital contribution account
Shri Siddhi Avenues LLP 528.55 - - - - -
Loan received Vikas Oberoi - - - - 10,708.00 10,708.00
Deposit received Oberoi Foundation - - 800.00 800.00 - -
Corporate guarantee given Oasis Realty (AoP) 54,852.48 49,779.26 - - - -
Reimbursement of expenses ZACO Aviation (AoP) 1.56 0.36 - - - -
(H in Lakh)
NOTE 32 : LEASES 2016 2015
Assets taken on operating lease
Future minimum lease payments under non-cancellable operating lease :
Not later than one year 440.64 467.64
Later than one year and not later than five years - 431.24
Later than five year - -
Lease payments recognised during the year in the statement of profit and loss 475.39 475.71
(H in Lakh)
NOTE 31 : UTILISATION OF PROCEEDS FROM PREFERENTIAL ISSUE 2016
Statement of utilisation of amount received from allotment of Equity shares on preferential basis:
Particulars of fund utilisation
Amount received from allotment of Equity Shares on Preferential basis (A) 32,450.00
Less: Deployment of funds received from the preferential allotment
a) Share issue expenses 40.47
b) Investment in Subsidiary Company by way of loan towards it's working capital requirements
32,409.53
(B) 32,450.00
Balance amount to be utilised (A-B) -
NOTES FORMING PART OF CONSOLIDATED FINANCIAL STATEMENTS
367

(H in Lakh)
NOTE 33 : CONTINGENT LIABILITIES AND CAPITAL COMMITMENTS 2016 2015
A. Summary details of contingent liabilities
1. Letters of credit net of margin (gross H 1,860.65 Lakh previous year H 36.00 Lakh)
- -
2. Bank guarantees net of margin (gross H 1,157.73 Lakh previous year H 1,185.32 Lakh)
- -
3. Indemnity bonds given in favour of the government under Export Promotion Capital Goods Scheme (net of bank guarantees)
1,513.70 1,560.34
4. Litigation
a) Legal cases against the Group not acknowledged as debt (excluding certain matters where amount are not ascertainable)
9,425.98 8,561.01
b) MVAT matters in dispute 228.06 320.55
c) Income-tax matters in dispute 2,856.61 1,972.88
d) Service tax matters in dispute 1,199.99 1,394.98
e) Property tax matters in dispute 395.15 395.15
5. Claims against the Group not acknowledged as debt 1,287.77 423.07
6. Certain other additional matters which are under dispute but which are not acknowledged as debt by the Group
Amounts not ascertainable
Amounts not ascertainable
7. Corporate guarantees given (excluding corporate guarantee given for raising debentures in a subsidiary, refer note C below)
54,852.48 49,779.26
B. Capital Commitments
a) Capital contracts (net of advances) 6,515.94 2,564.46
b) Capital commitment to joint venture (net of advances) 13,703.00 13,703.00
C. The Company has mortgaged certain immovable properties and granted hypothecation and escrow of the receivables thereof as a security in respect of the debentures outstanding alongwith accrued interest aggregating to H 35,703.47 Lakh issued by a wholly owned subsidiary. The Company has also issued an irrevocable and unconditional corporate guarantee in respect of the same.
D. The sales tax department of the government of Maharashtra has completed the VAT assessments in connection with the returns filed by the Group on the sale of flats to the customers during the period beginning from June 2006 till March 2012 and determined the interest liability at H1,361.17 Lakh on the assessed amounts. However, vide an order of the Hon’ble Supreme Court of India the recovery of interest amounts in such cases has been stayed. Part of the amount has been collected by the Group from the flat purchasers on account of such liability. Pending the final decision in the matter, no effect is given in the profit and loss account for the same.
NOTES FORMING PART OF CONSOLIDATED FINANCIAL STATEMENTS
368

2015-16 97
96
NOTE 34 : OTHER NOTES
A. In our opinion, all current assets appearing in the balance sheet as at March 31, 2016 have a value on realisation in the ordinary course of the Group business at least equal to the amount at which they are stated in the balance sheet.
B. Balance of trade receivable, trade payables and loans and advances are subject to confirmation from respective parties and reconciliation, if any.
C. The Group is engaged in real estate development. The group has acquired various lands / development rights and certain projects are at initial stage of implementation. The projects may be developed with various end uses, such as hotel, retail outlets, plots, residential, commercial and IT specific use. Such projects will be classified under fixed assets or inventories, as the case may be, based on ultimate end use as per final development of the property. Pending such reclassification on final development of such properties, such plots and the cost incurred on development of projects is included under the head ‘Work in progress’ or ‘Plots of land’ as part of ‘Current assets’.
D. The Group’s normal operating cycle in respect of operations relating to the construction of real estate projects may vary from project to project depending upon the size of the project, type of development, project complexities and related approvals. Operating cycle for all completed projects and hospitality business is based on 12 months period. Assets and liabilities have been classified into current and non-current based on the operating cycle.
E. A joint venture partner in Oasis Realty availed certain credit facilities from the banks against the mortgage of 21 identified flats and receivables thereof. However, the Company’s share in receivables from the project is not impacted.
F. Previous year figures have been regrouped, re-arranged and re-classified wherever necessary to conform to current year’s classification.
G. Figures have been rounded off to the nearest thousand.
As per our report of even date For and on behalf of the Board of DirectorsFor P. RAJ & CO.Chartered AccountantsFirm Registration No. 108310W
P. S. Shah Vikas Oberoi T. P. OstwalPartner Chairman & Managing Director DirectorMembership No.44611Mumbai, April 29, 2016 Saumil Daru Bhaskar Kshirsagar Director - Finance Company Secretary cum Chief Financial Officer
NOTES FORMING PART OF CONSOLIDATED FINANCIAL STATEMENTS
369

370
DECLARATION
Our Company certifies that all relevant provisions of Chapter VIII and Schedule XVIII of the SEBI Regulations have been
complied with and no statement made in this Placement Document is contrary to the same. Our Company further certifies
that all the statements in this Placement Document are true and correct.
Signed by
__________________
Saumil Daru
Non-Independent, Executive Director
Date: June 19, 2018
Place: Mumbai

371
DECLARATION
We, the Directors of the Company, certify that:
(i) our Company has complied with the provisions of the Companies Act, 2013 and the rules made thereunder;
(ii) the compliance with the Companies Act, 2013 and the rules made thereunder does not imply that payment of
dividend or interest or repayment of debentures, if applicable, is guaranteed by the Central Government; and
(iii) the monies received under the offer shall be used only for the purposes and objects indicated in this Placement
Document (which includes disclosures prescribed under Form PAS-4).
Signed by:
__________________
Saumil Daru
Non-Independent, Executive Director
I am authorized by the QIP Committee, a committee of our Board of Directors, through resolution number 3, dated June
19, 2018 to sign this form and declare that all the requirements of Companies Act, 2013 and the rules made thereunder in
respect of the subject matter of this form and matters incidental thereto have been complied with. Whatever is stated in
this form and in the attachments thereto is true, correct and complete and no information material to the subject matter of
this form has been suppressed or concealed and is as per the original records maintained by the promoter subscribing to
the Memorandum of Association and the Articles of Association.
It is further declared and verified that all the required attachments have been completely, correctly and legibly attached to
this form.
Signed:
__________________
Saumil Daru
Non-Independent, Executive Director
Date: June 19, 2018
Place: Mumbai

372
OBEROI REALTY LIMITED
Registered and Corporate Office
Commerz, 3rd Floor, International Business Park, Oberoi Garden City, Off Western Express Highway, Goregaon
(East), Mumbai 400 063
Details of the Company Secretary and Compliance Officer
Bhaskar Kshirsagar
Commerz, 3rd Floor
International Business Park, Oberoi Garden City
Off Western Express Highway
Goregaon (East), Mumbai 400 063
Tel No: +91 22 6677 3333; Fax: +91 22 6677 3334
E-mail: [email protected]
BOOK RUNNING LEAD MANAGERS
JM Financial Limited Morgan Stanley India Company Private Limited
7th Floor, Cnergy, Appasaheb Marathe Marg, Prabhadevi,
Mumbai 400 025
18F, Tower 2, One Indiabulls Centre, 841, Senapati Bapat
Marg, Mumbai 400 013
LEGAL COUNSEL TO OUR COMPANY AS TO INDIAN LAW
Cyril Amarchand Mangaldas
Peninsula Chambers, Peninsula Corporate Park
Ganpatrao Kadam Marg, Lower Parel
Mumbai 400 013
LEGAL COUNSEL TO THE BOOK RUNNING LEAD MANAGERS AS TO INDIAN LAW
Luthra & Luthra
Law Offices
20th Floor, Tower 2, Unit A2
Indiabulls Finance Centre, Elphinstone Road
Senapati Bapat Marg, Lower Parel
Mumbai 400 013
INTERNATIONAL LEGAL COUNSEL TO THE BOOK RUNNING LEAD MANAGERS
Latham & Watkins LLP
9 Raffles Place
#42-02 Republic Plaza
Singapore 048619
STATUTORY AUDITORS TO OUR COMPANY
S R B C & CO LLP, Chartered Accountants
14th floor, The Ruby, 29 Senapati Bapat Marg, Dadar
(West), Mumbai 400 028
PREVIOUS STATUTORY AUDITORS
P. Raj & Co.
3/1218, Navjivan Comm. Prem.
Lamington Road, Mumbai 400 008
Related Documents


