www.people-press.org WEDNESDAY, SEPTEMBER 19, 2012 Democrats Narrow Engagement Gap Obama Ahead with Stronger Support, Better Image and Lead on Most Issues FOR FURTHER INFORMATION CONTACT: Andrew Kohut President, Pew Research Center Carroll Doherty and Michael Dimock Associate Directors Scott Keeter Director of Survey Research 1615 L St, N.W., Suite 700 Washington, D.C. 20036 Tel (202) 419-4350 Fax (202) 419-4399 www.people-press.org

Welcome message from author
This document is posted to help you gain knowledge. Please leave a comment to let me know what you think about it! Share it to your friends and learn new things together.
Transcript

www.people-press.org
WEDNESDAY, SEPTEMBER 19, 2012
Democrats Narrow Engagement Gap
Obama Ahead with Stronger Support, Better Image and Lead on Most Issues
FOR FURTHER INFORMATION CONTACT:
Andrew Kohut
President, Pew Research Center
Carroll Doherty and Michael Dimock
Associate Directors
Scott Keeter
Director of Survey Research
1615 L St, N.W., Suite 700 Washington, D.C. 20036 Tel (202) 419-4350 Fax (202) 419-4399 www.people-press.org

www.people-press.org

2
www.people-press.org
Democrats Narrow Engagement Gap Obama Ahead with Stronger Support, Better Image and Lead on Most Issues At this stage in the campaign, Barack Obama is in a strong position compared with past victorious presidential candidates. With an eight-point lead over Mitt Romney among likely voters, Obama holds a bigger September lead than the last three candidates who went on to win in November, including Obama four years ago. In elections since 1988, only Bill Clinton, in 1992 and 1996, entered the fall with a larger advantage. Not only does Obama enjoy a substantial lead in the horserace, he tops Romney on a number of key dimensions. His support is stronger than his rival’s, and is positive rather than negative. Mitt Romney’s backers are more ardent than they were pre-convention, but are still not as enthusiastic as Obama’s. Roughly half of Romney’s supporters say they are voting against Obama rather than for the Republican nominee. With the exception of Bill Clinton in 1992, candidates lacking mostly positive backing have lost in November. The latest national survey by the Pew Research Center for the People & the Press, conducted September 12-16, 2012 among 3,019 adults including 2,424 registered voters, finds that Obama continues to be the more likable candidate by a substantial margin; his favorability rating has risen to 55% from 50% in late July, with 42% now expressing an unfavorable view of him.
Obama’s September Advantage Likely voters % % Sept 2012 51 Obama 43 Romney Obama +8 Sept 2008 46 Obama 46 McCain even Sept 2004 46 Kerry 47 Bush Bush +1 Sept 2000 48 Gore 43 Bush Gore +5 Sept 1996 50 Clinton 38 Dole Clinton +12 Sept 1992* 53 Clinton 38 Bush Clinton +15 Sept 1988* 44 Dukakis 50 Bush Bush +6
PEW RESEARCH CENTER Sept. 12-16, 2012. *1988 and 1992 data based on registered voters.
Obama’s Support Stronger, More Positive
Obama
Supporters Romney
Supporters Support candidate % % Strongly 68 56 Only moderately 31 43 Don’t know 1 1 100 100 Vote is more a vote… For your candidate 74 45 Against other candidate 22 52 Don’t know 3 3 100 100 N 1,188 1,062
PEW RESEARCH CENTER Sept. 12-16, 2012. Based on registered voters.
3
www.people-press.org
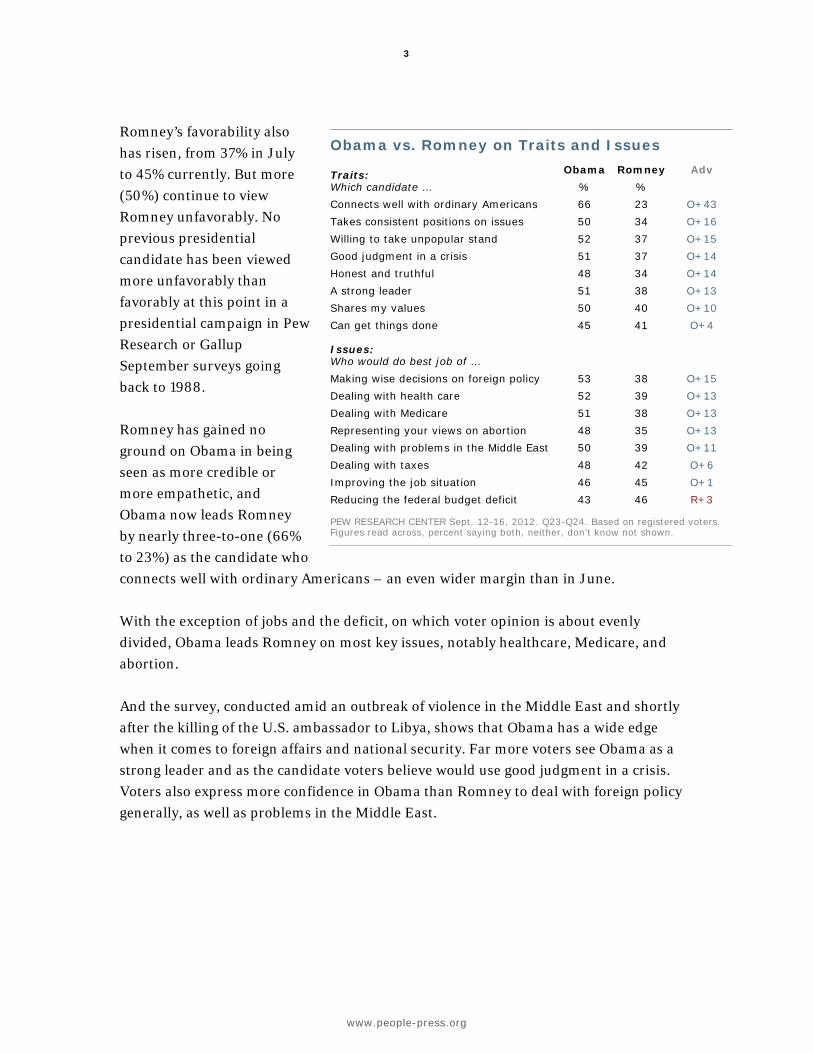
Romney’s favorability also has risen, from 37% in July to 45% currently. But more (50%) continue to view Romney unfavorably. No previous presidential candidate has been viewed more unfavorably than favorably at this point in a presidential campaign in Pew Research or Gallup September surveys going back to 1988. Romney has gained no ground on Obama in being seen as more credible or more empathetic, and Obama now leads Romney by nearly three-to-one (66% to 23%) as the candidate who connects well with ordinary Americans – an even wider margin than in June. With the exception of jobs and the deficit, on which voter opinion is about evenly divided, Obama leads Romney on most key issues, notably healthcare, Medicare, and abortion. And the survey, conducted amid an outbreak of violence in the Middle East and shortly after the killing of the U.S. ambassador to Libya, shows that Obama has a wide edge when it comes to foreign affairs and national security. Far more voters see Obama as a strong leader and as the candidate voters believe would use good judgment in a crisis. Voters also express more confidence in Obama than Romney to deal with foreign policy generally, as well as problems in the Middle East.
Obama vs. Romney on Traits and Issues
Traits: Which candidate …
Obama Romney Adv % %
Connects well with ordinary Americans 66 23 O+43 Takes consistent positions on issues 50 34 O+16 Willing to take unpopular stand 52 37 O+15 Good judgment in a crisis 51 37 O+14 Honest and truthful 48 34 O+14 A strong leader 51 38 O+13 Shares my values 50 40 O+10 Can get things done 45 41 O+4 Issues: Who would do best job of … Making wise decisions on foreign policy 53 38 O+15 Dealing with health care 52 39 O+13 Dealing with Medicare 51 38 O+13 Representing your views on abortion 48 35 O+13 Dealing with problems in the Middle East 50 39 O+11 Dealing with taxes 48 42 O+6 Improving the job situation 46 45 O+1 Reducing the federal budget deficit 43 46 R+3
PEW RESEARCH CENTER Sept. 12-16, 2012. Q23-Q24. Based on registered voters. Figures read across, percent saying both, neither, don’t know not shown.

4
www.people-press.org
71 73 72 72 72
65
60
66 64
71
64
61
63 62
66
40
50
60
70
80
Mar May Jul Sep
Independent
Democrat Republican
Obama also has a number of other advantages over his challenger. As has been the case for much of the past year, the Democratic Party is better regarded than the GOP by a significant margin; currently, 53% of voters view the Democratic Party favorably while 46% have a favorable opinion of the GOP. Michelle Obama remains extremely popular – 66% have a favorable opinion of the first lady. About as many voters (70%) view Bill Clinton favorably. Joe Biden’s favorable ratings remain mixed, but that also is the case for Paul Ryan, Romney’s running mate. Both Biden and Ryan are among the least popular vice presidential candidates in recent history. The new survey, which began a week after the Democratic convention ended, finds that Democratic engagement in the 2012 election has spiked, and the engagement gap evident earlier in the campaign has largely disappeared. Democratic voters are now as likely as Republicans to say they have given quite a lot of thought to the election and are following campaign news as closely. Democratic voters also are as committed to voting, and as certain of their vote, as are their GOP counterparts. Consequently, Obama’s overall advantage – he leads 51% to 42% among registered voters – does not narrow significantly when looking only at those most likely to vote. Among 2,192 likely voters, Obama leads Romney, 51% to 43%.
Democratic Favorability Advantage
Favor- able
Unfavor- able
No opinion
% % %
The candidates
Barack Obama 55 42 3=100 Mitt Romney 45 50 5=100
The VP candidates
Joe Biden 45 44 10=100 Paul Ryan 40 44 16=100
The spouses
Michelle Obama 66 23 10=100 Ann Romney 46 24 30=100
The past presidents
Bill Clinton 70 26 4=100 G.W. Bush 43 53 4=100
The parties
Dem Party 53 42 4=100 Rep Party 46 50 5=100
PEW RESEARCH CENTER Sept. 12-16, 2012. Q22. Based on registered voters. Figures may not add to 100% because of rounding.
Democrats Close Engagement Gap % given a lot of thought to the election
PEW RESEARCH CENTER Sept. 12-16, 2012. Based on registered voters.

5
www.people-press.org
Overall interest in the 2012 election is not as high as it was at this point in the 2008 campaign, with a similar decline among both Democrats and Republicans. But the dropoff in engagement is most noticeable among younger Americans. Just 48% of voters younger than 30 have given a lot of thought to the 2012 election, down from 65% at this point four years ago. The share of young people who say they are closely following election news is down by about half (from 35% to 18%). By contrast, there has been no falloff in engagement among African American voters. Engagement among black voters, which was higher in September 2008 than in previous elections dating to 1992, remains just as high going into the final weeks of the 2012 campaign. The nation’s economic situation continues to be Romney’s best friend in this campaign. While trailing on most issues, he runs about even with Obama as the candidate best able to improve the job situation, and there is little indication that voters are feeling better about economy. Just 12% rate national economic conditions as excellent or good. Just 25% say the economy is recovering, while a 46% plurality still thinks it will be a long time before it recovers. Despite these gloomy opinions, the economy has not turned into a clear advantage for Romney. Almost the same number express confidence in Obama to do the right thing when it comes to fixing the economy (52%); as say the same about Romney (49%). But the focus on economic issues may benefit Romney among swing voters. Roughly one-in-five voters (22%) are not fully committed to a candidate at this point in the race, and Romney leads Obama by significant margins among
Engagement Down from 2008, Particularly among Young Voters % given a lot of thought to the election 1992 1996 2000 2004 2008 2012 % % % % % % All voters 69 56 58 71 78 70 Republican 72 65 66 75 81 72 Democrat 74 57 58 70 79 71 Independent 63 46 51 68 77 66 18-29 58 46 41 57 65 48 30-49 74 56 57 71 78 70 50-65 68 59 66 76 86 75 65+ 70 61 64 73 77 75 White 70 56 60 72 80 70 Black 66 50 54 64 76 76
PEW RESEARCH CENTER Sept. 12-16, 2012. Based on registered voters. Figures from all years from September surveys.
Neither Candidate Inspires Greater Confidence on Economy Confidence in ____ to do the right thing when it comes to fixing the economy
Great deal/ Fair amount
Not much/ None DK
Barack Obama % % % Sept 2012 52 46 2=100 Dec 2009 51 46 3=100 Jan 2009 75 22 3=100 Mitt Romney Sept 2012 49 49 2=100
PEW RESEARCH CENTER Sept. 12-16, 2012. Q38. Figures may not add to 100% because of rounding. Based on registered voters.

6
www.people-press.org
these voters as better able to improve the job situation and balance the budget deficit. Confidence in Obama’s economic stewardship is down significantly since shortly before he took office, but has stabilized in recent years. In January 2009, just prior to his inauguration, fully 75% of voters said they had confidence in Obama to do the right things to fix the economy. After a controversial stimulus plan, heated debate over health care reform and persistently high unemployment, that percentage fell to 51% in December 2009. The current measure shows little change. Other personal evaluations of Obama show a similar trajectory. The percentage of voters saying Obama makes them feel “hopeful” fell precipitously during the first year of his presidency (from 69% just after his election to 52% in March 2010), but has slipped no further in the three years since (50% in the current survey). Nearly two-thirds (64%) continue to describe Obama as “inspiring,” down from a high of 81% in the days after he was elected, but about the same as in early 2010 (59%). The survey finds that overall patterns of voter support for Obama and Romney have changed little over the course of the campaign. Obama holds a 56% to 37% lead among women registered voters, but only runs about even among men (47% Romney, 46% Obama). Voters younger than 30 continue to support Obama by a wide margin (59% to 33%). Voters 30 to 49 favor Obama by a 52% to 41% margin; older voters are more evenly divided. Romney draws broad support from white evangelical Protestants. Race and ethnicity remain key correlates of candidate support: 92% of black voters support Obama, as do 69% of Latinos, compared with 43% of white non-Hispanics. Among whites, Romney runs better among white men and white working class voters than among women and white college graduates. These patterns broadly parallel racial divides in the 2008 vote. And in that regard, a special analysis of the survey finds that racially conservative attitudes play no greater role in opposition to Obama than they did in 2008.

7
www.people-press.org

8
www.people-press.org
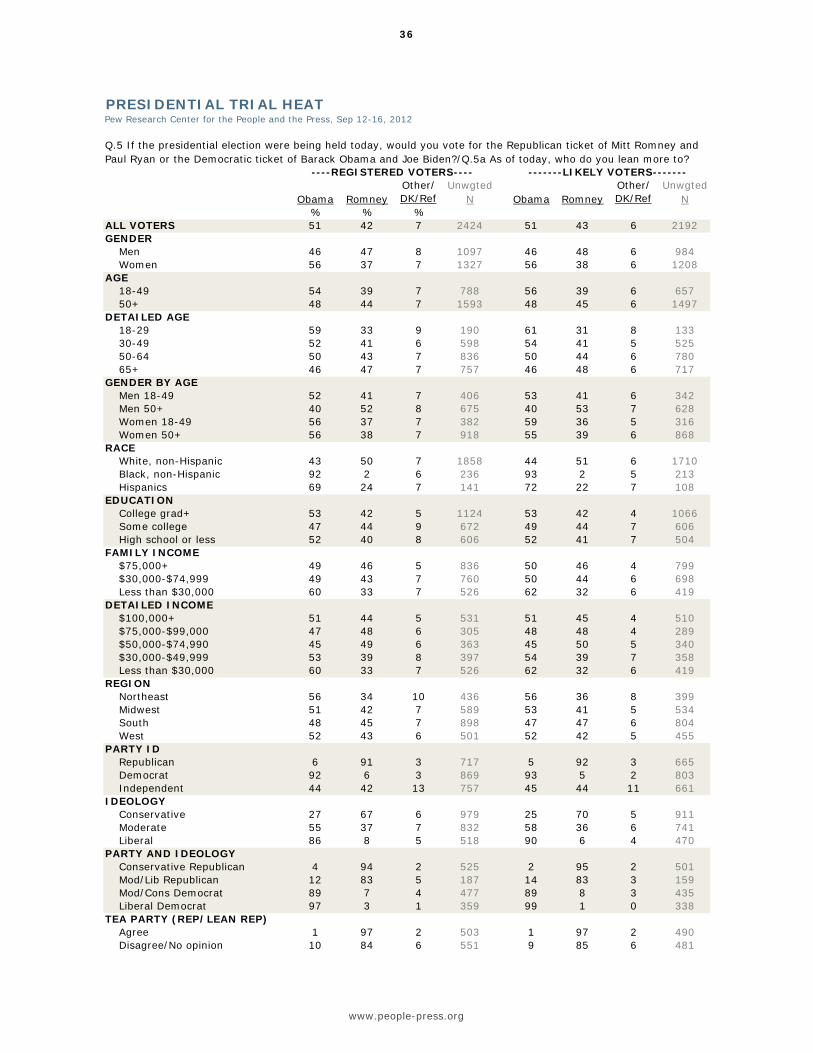
SECTION 1: THE OBAMA-ROMNEY MATCHUP The current preferences among voter groups are strikingly similar to those seen on Election Day four years ago. Barack Obama generally leads Mitt Romney among the same groups that favored him in 2008, and he trails among the groups that supported Republican John McCain. Obama’s greatest support is found among African American registered voters, who favor him by a margin of 92%-2%; that is comparable to Obama’s 95%-4% margin in 2008. He also runs well ahead among Hispanic voters (69%-24%) and has a 59%-33% advantage among voters under 30. He leads by 65%-27% among those who are unaffiliated with a religion. And Obama has a nearly 20-point advantage among women (56%-37%), while running even among men (46% Obama, 47% Romney). Four years ago, Obama won the independent vote by a 52%-44% margin. In the current poll he is tied with Romney among independents (44% Obama, 42% Romney). Romney has nearly unanimous support among Republicans (91%), while Obama matches him among Democrats (92%). There is no indication in the poll that white evangelical Protestants are any less supportive of Romney than they were of McCain in 2008 or George W. Bush in 2004. Romney leads Obama among this group by 74%-19%; McCain beat Obama among white evangelicals by 73%-
Patterns of Voter Support, 2008 and 2012
2008
Exit Poll 2012
Reg Voter 2012
N Oba-ma
Mc- Cain
Oba-ma
Rom- ney
% % % % Total 53 45 51 42 2424 Men 49 48 46 47 1097 Women 56 43 56 37 1327 18-29 66 32 59 33 190 30-44 52 46 53 41 360 45-64 50 49 50 43 1074 65+ 45 53 46 47 757 White 43 55 43 50 1858 Black 95 4 92 2 236 Hispanic 67 31 69 24 141 College grad+ 53 45 53 42 1124 Some college 51 47 47 44 672 HS or less 54 44 52 40 606 $100,000+ 49 49 51 44 531 $50k-$99,999 49 49 46 48 668 Less than $50k 60 38 57 35 923 Republican 9 90 6 91 717 Democrat 89 10 92 6 869 Independent 52 44 44 42 757 Protestant 45 54 43 50 1262 White evang. 26 73 19 74 524 White mainline 44 55 45 46 437 Black Prot. 94 4 95 2 183 Catholic 54 45 54 39 541 White non-Hisp 47 52 47 46 435 Unaffiliated 75 23 65 27 381
PEW RESEARCH CENTER Sept. 12-16, 2012. Q5/5a. Based on registered voters. Whites and blacks are non-Hispanic; Hispanics are of any race. Exit poll results from NEP and the Roper Center for Public Opinion Research.

9
www.people-press.org
26%. But Obama is tied with Romney among both white mainline Protestants (45% Obama, 46% Romney) and white non-Hispanic Catholics (47%-46%); McCain edged Obama among both of these groups in 2008. White Voters Today vs. Four Years Ago White voters are a critical group for Mitt Romney, given the ongoing decline in the percentage of white non-Hispanic voters in the electorate and the strong support for Obama among non-white voters. He currently holds a 50%-43% lead among whites, which is slightly smaller than McCain’s advantage in 2008. But Romney is doing somewhat better than McCain among younger white voters. Obama beat McCain in this group by 10 points (54%-44%), but is running about even with Romney (46%-44%). Similarly, Romney leads Obama among white independents (48%-40%). In 2008, Obama battled McCain to a draw among this group (49% McCain, 47% Obama). While Romney is winning the white working class vote, it is by a smaller margin than four years ago. Romney leads Obama by a 50% to 41% margin among whites who have not attended college. This group favored McCain by a 58% to 40% margin in the 2008 Exit Polls. White college graduates are divided between Obama and Romney (48% back each). The question of how attitudes about racial and ethnic minorities would affect voter support for Barack Obama has been asked ever since he first appeared as a viable candidate for the Democratic presidential nomination in 2007. Analysis conducted in 2008 found that voters who expressed conservative attitudes on questions dealing with race and ethnicity were less likely to say they would vote for Obama in the general
White Voters, 2008 and 2012
2008
Exit Poll 2012
Reg Voter 2012
N Oba-ma
Mc- Cain
Oba-ma
Rom- ney
% % % % Total 43 55 43 50 1858 Men 41 57 37 56 826 Women 46 53 47 45 1032 18-29 54 44 46 44 117 30-44 41 57 44 50 249 45-64 42 56 44 50 830 65+ 40 58 38 55 644 College grad+ 47 51 48 48 885 Some college 40 58 38 53 520 HS or less 40 58 41 50 446 $100,000+ 44 55 47 49 437 $50k-$99,999 42 56 41 53 551 Less than $50k 47 51 44 48 646 Republican 8 91 4 93 639 Democrat 85 14 89 8 558 Independent 47 49 40 48 613 PEW RESEARCH CENTER Sept. 12-16, 2012. Q5/5a. Based on registered voters. Whites and blacks are non-Hispanic; Hispanics are of any race.

10
www.people-press.org
election. This was especially true during the presidential primary amidst the controversy over statements about race by Rev. Jeremiah Wright, Obama’s former pastor. Attitudes about race and ethnicity remain associated with the vote in 2012. But after taking into account partisan affiliation and demographic characteristics, the independent impact of these attitudes on the vote is modest, and no greater now than it was four years ago. Swing Vote Smaller Than Usual, But One-in-Five Still Not Certain Compared with many previous elections at this point in the campaign, more voters this year say they are absolutely certain to vote for their chosen candidate. Only 22% of registered voters (and 18% of likely voters) can be classified as swing voters (undecided, only leaning toward a candidate, or say there is a chance they might change their mind). Four years ago, 27% of voters were still open to persuasion at this point in the campaign. Between 1992 and 2000, about three-in-ten voters in September were not yet certain about their choice. In the current poll, 43% of all registered voters say they are certain to vote for Barack Obama, while 35% say they are certain to vote for Mitt Romney. Among less certain Obama voters, 3% only lean to him and 5% say they might change their mind. Among less certain Romney voters, 3% only lean to the Republican, while 3% say there is a chance they might vote for Obama. Just 7% of voters decline to indicate any preference between the candidates.
More Voters Say Their Mind is Made Up
Sept 1992
Sept 1996
Sept 2000
Sept 2004
Sept 2008
Sept 2012
Registered voters % % % % % % Certain Democratic 41 41 35 36 38 43 Certain Republican 26 28 31 40 35 35 Certain 3rd party -- 3 1 1 -- -- Swing voters 33 29 33 24 27
22 100 100 100 100 100 100
PEW RESEARCH CENTER Sept. 12-16, 2012. Q5/Q5a, Q7 & Q8. Based on registered voters. Certain voters are those who back Romney or Obama and say there is no chance they will support the other. Swing voters are undecided, only lean toward a candidate or say there is still a chance they will support the other. Figures may not add to 100% because of rounding.
Components of the Swing Vote % Certain Obama 43 Lean Obama (3%) 8 Chance Romney (5%) Swing voters 22 7 Pure undecided 7 Lean Romney (3%) Certain Romney 35 Chance Obama (3%) 100
PEW RESEARCH CENTER Sept. 12-16, 2012. Q5/Q5a, Q7 & Q8. Based on registered voters. Figures may not sum to subtotals and totals because of rounding.

11
www.people-press.org
Strong Support for Both Candidates Increases In addition to his overall lead over Romney, Obama also enjoys high levels of strong support among voters. Today, about one-third of all voters (35%) strongly back Obama, while 24% strongly back Romney. Obama’s strong support is among the highest in recent election cycles —comparable both to his strong support in September 2008 (30% strongly) and George W. Bush’s in September 2004 (33% strongly). Strong support for Romney also has grown over the last several months. In June, not long after the conclusion of the contentious GOP primary battle, just 17% of voters said they supported Romney strongly; today 24% do so. This rise in strong support for the GOP candidate is evident across Romney supporters and is most pronounced among conservative Republicans--about two-thirds (69%) of whom now say they back Romney strongly, up from 51% in June.
Obama’s Advantage in Strong Support
Sept 1988
Oct 1992
Sept 1996
Sept 2000
Sept 2004
Sept 2008
Sept 2012
% % % % % % % Dem candidate 44 48 52 47 43 46 51 Strongly 19 23 26 25 22 30 35 Rep candidate 50 35 34 41 49 44 42 Strongly 26 14 17 21 33 25 24 Other/DK 6 17 14 8 12 7 10 100 100 100 100 100 100 100 Candidates Dukakis
Bush Clinton Bush
Clinton Dole
Gore Bush
Kerry Bush
Obama McCain
Obama Romney
PEW RESEARCH CENTER Sept. 12-16, 2012. Q5/Q5a/Q5b. Based on registered voters Figures may not add to 100% because of rounding.
Growth in Strong Support for Both Candidates Obama Romney June Sept Change June Sept Change % % % % All voters 30 35 +5 17 24 +7 Conservative Rep 1 2 +1 51 69 +18 Mod/Lib Rep 3 4 +1 36 43 +7 Independent 19 20 +1 10 16 +6 Cons/Mod Dem 59 66 +7 2 3 +1 Liberal Dem 77 85 +8 * 0 0
PEW RESEARCH CENTER Sept. 12-16, 2012. Q5/Q5a/Q5b. Based on registered voters. Figures may not add to 100% because of rounding.

12
www.people-press.org
Election about Obama – For Both Supporters and Opponents About three-quarters of Obama’s voters (74%) say their choice is more a vote for Obama than against Romney. Obama’s positive support is relatively high and comparable to the positive support among George W. Bush’s backers in 2004 (77% for Bush vs. 19% against John Kerry). Although incumbents typically enjoy more positive than negative support, the proportion of backers who currently say their vote is for him is greater than it was for both Bill Clinton in September 1996 (67%) and George H.W. Bush in September 1992 (54%). More Romney supporters characterize their vote as a vote against Obama than as a vote for Romney (52% vs. 45%). This is typically the case for challengers to incumbent presidents; Romney’s backers are less anti-incumbent than John Kerry’s were in 2004, when 60% said their vote was primarily against Bush. The last successful presidential campaign with more negative than positive voters was Bill Clinton’s 1992 race; in September of that year, 54% of his supporters said their votes were more against then-president George H.W. Bush than for Clinton.
More Romney Backers See Vote as Against Obama than For Romney
Among those who back the Democrat:
For Dem
Against Rep DK
% % % Sept 2012 (Obama) 74 22 3=100 Sept 2008 (Obama) 71 24 5=100 Sept 2004 (Kerry) 34 60 6=100 Sept 2000 (Gore) 64 30 6=100 Sept 1996 (Clinton) 67 30 4=100 Sept 1992 (Clinton) 40 54 6=100 Sept 1988 (Dukakis) 48 42 10=100
Among those who back the Republican:
For Rep
Against Dem DK
% % % Sept 2012 (Romney) 45 52 3=100 Sept 2008 (McCain) 66 28 6=100 Sept 2004 (Bush) 77 19 4=100 Sept 2000 (Bush) 60 33 7=100 Sept 1996 (Dole) 48 48 4=100 Sept 1992 (Bush) 54 42 4=100 Sept 1988 (Bush) 61 31 8=100
PEW RESEARCH CENTER Sept. 12-16, 2012. Q5/5a/5c/5d. Based on registered voters. Figures may not add to 100% because of rounding. “Would you say that your choice is more a vote FOR [name] or more a vote AGAINST [name]?” *1996 was pro-candidate, anti-other two candidates (including Perot).

13
www.people-press.org
When asked to give the main reason they want to see Romney win, 38% refer to issues they hope he can handle well, such as the economy, health care, and reducing the size of government. But about as many Romney supporters (37%) offer negative assessments of Obama as the main reason for their vote. This is comparable to the third (33%) of John Kerry’s supporters in 2004 who cited George W. Bush as the main reason behind their vote. Far fewer Obama supporters describe their preference in terms of dislike of Romney. Just 13% cited something negative about Romney in explaining why they want to see Obama win. Roughly four-in-ten (41%) list issues they prefer Obama on, such as his support for the middle class, dealing with the economy, and health care reform. And 29% of Obama voters simply say he has done a good job, or he needs more time, or that he has done enough to deserve another term.
Main Reason You Want Your Candidate to Win
Obama voters Romney voters % % 41 Obama’s issues/positions 38 Romney’s issues/positions 10 For the middle class 18 Economy/Jobs 8 Economy/Jobs 6 Republican/Conservative 7 Health care 4 Health care 5 Like his positions (general) 3 Reduce the debt/deficit 5 Democrat 17 Obama’s personal qualities 19 Romney’s personal qualities 4 The better candidate 5 Shares my values/beliefs 3 Better for the country 4 Business experience 2 Smart/Intelligent 2 Experienced 13 Anti-Romney 37 Anti-Obama 6 Against Romney 19 Get rid of Obama/one term 2 Favors rich/not middle class 7 Obama’s policy failures 2 Anti-Republican 5 Country is in bad shape 29 Obama’s Record
13 Done a good job 9 Deserves another chance/term 9 Allow him to continue policies 12 Other 13 Other
PEW RESEARCH CENTER Sept. 12-16, 2012. Q9. Open ended responses, figures may add to more than 100% because multiple responses were allowed. Based on registered voters.
14
www.people-press.org
78 78 87 84 84
69
56 59
71 78
70
47
29 27
46 50 44
1992 1996 2000 2004 2008 2012
Definitely plan to vote Given a lot of thought to election Following election news very closely
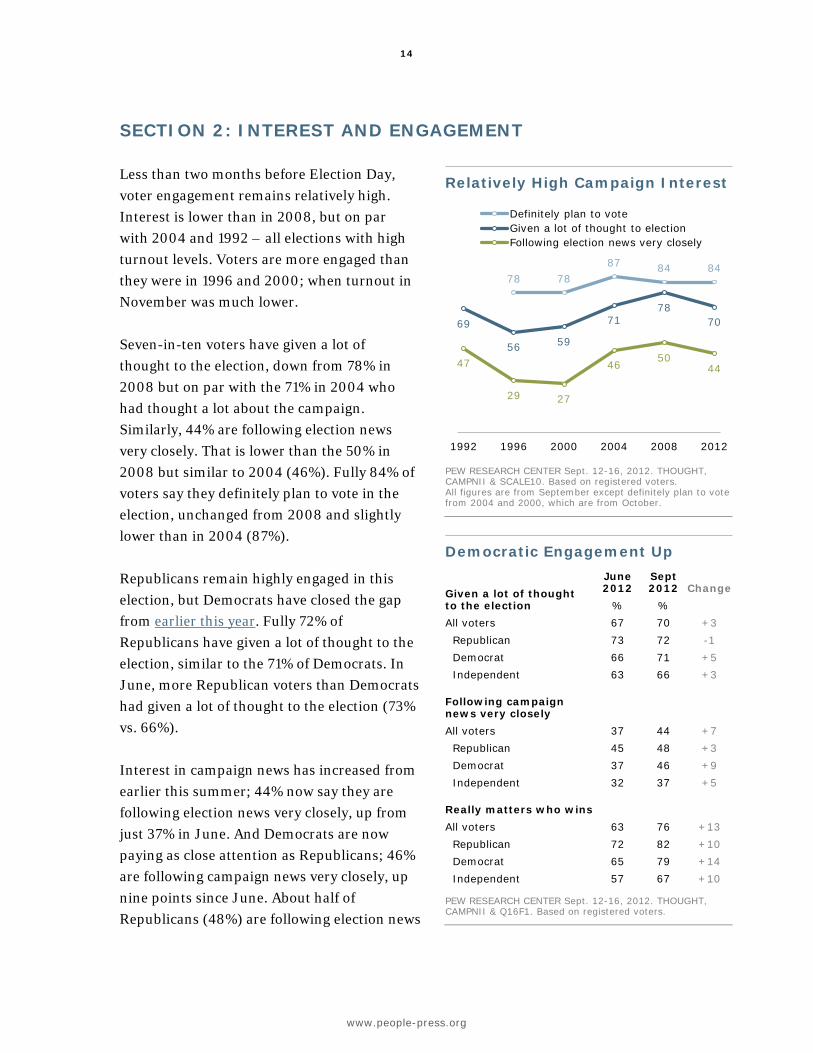
SECTION 2: INTEREST AND ENGAGEMENT Less than two months before Election Day, voter engagement remains relatively high. Interest is lower than in 2008, but on par with 2004 and 1992 – all elections with high turnout levels. Voters are more engaged than they were in 1996 and 2000; when turnout in November was much lower. Seven-in-ten voters have given a lot of thought to the election, down from 78% in 2008 but on par with the 71% in 2004 who had thought a lot about the campaign. Similarly, 44% are following election news very closely. That is lower than the 50% in 2008 but similar to 2004 (46%). Fully 84% of voters say they definitely plan to vote in the election, unchanged from 2008 and slightly lower than in 2004 (87%). Republicans remain highly engaged in this election, but Democrats have closed the gap from earlier this year. Fully 72% of Republicans have given a lot of thought to the election, similar to the 71% of Democrats. In June, more Republican voters than Democrats had given a lot of thought to the election (73% vs. 66%). Interest in campaign news has increased from earlier this summer; 44% now say they are following election news very closely, up from just 37% in June. And Democrats are now paying as close attention as Republicans; 46% are following campaign news very closely, up nine points since June. About half of Republicans (48%) are following election news
Relatively High Campaign Interest
PEW RESEARCH CENTER Sept. 12-16, 2012. THOUGHT, CAMPNII & SCALE10. Based on registered voters. All figures are from September except definitely plan to vote from 2004 and 2000, which are from October.
Democratic Engagement Up
Given a lot of thought to the election
June 2012
Sept 2012 Change
% % All voters 67 70 +3 Republican 73 72 -1 Democrat 66 71 +5 Independent 63 66 +3 Following campaign news very closely All voters 37 44 +7 Republican 45 48 +3 Democrat 37 46 +9 Independent 32 37 +5 Really matters who wins All voters 63 76 +13 Republican 72 82 +10 Democrat 65 79 +14 Independent 57 67 +10
PEW RESEARCH CENTER Sept. 12-16, 2012. THOUGHT, CAMPNII & Q16F1. Based on registered voters.

15
www.people-press.org
very closely, little changed from three months ago (45%). More voters also say it really matters who wins this presidential election – 76% say that when it comes to making progress on the important issues it really matters who wins, up from 63% in June. Fully 79% of Democrats now say this, up 14 points since June and on par with where they were in September 2008 (78%). A large majority of Republicans (82%) also say it really matters who wins. More Republicans say this now than did so in June (72%) and in 2008 (71%). About as many Romney supporters (80%) as Obama supporters (78%) say it really matters who wins this fall’s election. In September 2008, Obama voters were more likely than McCain voters to say it really mattered who won (79% vs. 67%). Long-Term Trends in Engagement There is little gap between Republicans and Democrats in interest in the campaign and intention to vote. A similar proportion of Republican (88%) and Democratic voters (87%) say they definitely plan to vote in the election. Similarly, Republicans and Democrats are about equally likely to say they have given a lot of thought to the election. In September 2008, 2004 and 1992, there were was little partisan difference in thought given to the election. However, in 1996 and 2000, Republican voters were giving more thought to the campaign.
Little Partisan Gap in Engagement
Given a lot of thought to the election
1992 1996 2000 2004 2008 2012 % % % % % % 69 56 59 71 78 70
Republican 72 65 66 75 81 72 Democrat 74 57 58 70 79 71 Independent 63 46 51 68 77 66 R-D gap D+2 R+8 R+8 R+5 R+2 R+1 Following election news very closely 47 29 27 46 50 44 Republican 48 31 32 50 53 48 Democrat 52 30 27 45 51 46 Independent 43 23 22 44 48 37 R-D gap D+4 R+1 R+5 R+5 R+2 R+2 Definitely plan to vote -- 78 78 87 84 84 Republican -- 83 82 90 89 88 Democrat -- 79 81 89 86 87 Independent -- 69 72 84 78 79 R-D gap -- R+4 R+1 R+1 R+3 R+1
PEW RESEARCH CENTER Sept. 12-16, 2012. THOUGHT, CAMPNII & SCALE10. Based on registered voters. All figures are from September except definitely plan to vote from 2004 and 2000, which are from October.

16
www.people-press.org
As in most previous campaigns, there are no significant partisan differences in interest in campaign news. In the current survey, 48% of Republicans, 46% of Democrats and 37% of independents say they are following election news very closely. Obama Favored to Win Roughly half (53%) of voters think that Obama is most likely to win the election this fall, about double the number (24%) who think Romney has the advantage. Obama has had a wide lead over Romney on this measure all year. At this point in 2008, the race seemed far more competitive to voters, 39% said Obama was most likely to win and 39% said McCain. But Obama had gained significant ground by October, when 61% of voters said he was most likely to win. A slim majority of Republicans (54%) say Romney is going to win while 22% think Obama is most likely to win and 24% are unsure. By comparison, 83% of Democratic voters say Obama is most likely to win. Independents see Obama as more likely to win by about two-to-one (45% vs. 23%). Among Romney supporters, about half (53%) say he is most likely to win; by comparison, 82% of Obama supporters expect their candidate to win. Among swing voters, far more expect Obama than Romney to win (50% vs. 12%); 39% are unsure.
Romney Voters Unsure Whether Their Candidate Will Win
Who is most likely to win the election?
Obama Romney DK % % %
All voters 53 24 23=100 Republican 22 54 24=100 Democrat 83 4 13=100 Independent 45 23 31=100 Support Obama 82 3 15=100 Romney 22 53 26=100
PEW RESEARCH CENTER Sept. 12-16, 2012. Q15. Based on registered voters. Figures may not add to 100% because of rounding.

17
www.people-press.org

18
www.people-press.org
50 55
50 50 55
48 43
48 45 42
Unfavorable
Favorable
Sept 2012
Nov 2011
38
29
41 37
45
45
55 47
52 50
Unfavorable
Favorable
Sept 2012
Nov 2011
SECTION 3: VIEWS OF THE CANDIDATES As has been the case throughout the past year, Barack Obama maintains a sizeable favorability advantage over Mitt Romney. Currently, 55% of registered voters express a favorable opinion of Obama, just 45% say the same of his challenger. Voter impressions of Romney have improved substantially over the past six months. In March – during the heat of the GOP primary campaign – his favorability rating fell as low as 29%, when many Republicans who backed other candidates for the nomination did not feel favorably toward him. Much of the recovery in his ratings since this period comes from within his own partisan base. Currently, 88% of Republicans offer a favorable impression of Romney, up from 76% in July and just 60% in March. Romney’s image also has become more positive among independents since the spring, though it is little changed since July. Currently, as many independent voters view Romney unfavorably (47%) as favorably (46%). In July, independent voters also were divided (41% favorable, 44% unfavorable). In March, just 28% of independents viewed Romney favorably; 52% had an unfavorable impression. Obama’s standing among independents has improved significantly over the past few months. Currently, 50% of independents offer a favorable impression of Obama, up from 41% in July and 43% in June.
Obama Maintains Favorability Advantage
Barack Obama Mitt Romney
PEW RESEARCH CENTER Sept. 12-16, 2012. Q22a-b. Based on registered voters.
Independent Views of Romney Remain Divided Total Rep Dem Ind September 2012 % % % % Favorable 45 88 13 46 Unfavorable 50 9 84 47 Don’t know 5 3 3 7 100 100 100 100 July 2012 Favorable 37 76 9 41 Unfavorable 52 18 83 44 Don’t know 6 10 8
15 100 100 100 100
June 2012 Favorable 41 75 14 41 Unfavorable 47 17 75 45 Don’t know 8 12 11
14 100 100 100 100
March 2012 Favorable 29 60 10 28 Unfavorable 55 29 76 52 Don’t know 15 11 14
20 100 100 100 100
PEW RESEARCH CENTER Sept. 12-16, 2012. Q22b. Based on registered voters. Figures may not add to 100% because of rounding.

19
www.people-press.org
52 54 59 62
53 63
55
40 39 35 30
42 34
42
Dukakis Clinton Clinton Gore Kerry Obama Obama
Favorable
Unfavorable
1988 1992 1996 2000 2004 2008 2012
Democratic candidates
58 49
53 51 54 61
45 36
46 37
41 43 35
50
GHW Bush GHW Bush Dole GW Bush GW Bush McCain Romney
Favorable
Unfavorable
Republican candidates
A review of Pew Research Center and Gallup favorability ratings from September finds that Romney is the only presidential candidate over the past seven election cycles to be viewed more unfavorably than favorably.
No Previous Candidate in Negative Territory at This Point in Campaign Candidate favorability in September
Fav diff R+6 D+5 D+6 D+11 R+1 D+2 D+10
PEW RESEARCH CENTER Sept. 12-16, 2012. Q22a-b. Based on registered voters. 1988-2000 data from Gallup September surveys.

20
www.people-press.org
Obama Holds Edge on Most Traits and Issues Barack Obama continues to hold wide leads over Romney on a number of issues and candidate traits tested. Most notably, two-thirds of registered voters (66%) say Obama is the candidate better described by the phrase “connects well with ordinary Americans,” while 23% say that better describes Romney. The gap on this question has grown somewhat since it was last asked in June, when Obama held a 59% to 28% advantage over Romney. Even among voters who support Romney, only about half (51%) say he connects with ordinary Americans better than Obama, while 34% say Obama is better in this regard. While Obama’s advantage is smaller on the other traits tested, he continues to hold a decided edge on many, including as the candidate who takes consistent positions on issues (16 points), is willing to take a stand even if unpopular (15 points) and would use good judgment in a crisis (14 points). In most cases, Obama fares better against Romney than he did against McCain at a similar point in 2008. For example, 51% now see Obama as having better judgment in a crisis compared with 37% who say Romney. Four years ago, Obama and John McCain were running about even on this question: 45% said McCain was more likely to use good judgment in a crisis and 42% said Obama.
Obama vs. Romney on Traits and Issues
Traits: Which candidate …
Obama Romney Adv % %
Connects well with ordinary Americans 66 23 O+43 Takes consistent positions on issues 50 34 O+16 Willing to take unpopular stand 52 37 O+15 Good judgment in a crisis 51 37 O+14 Honest and truthful 48 34 O+14 A strong leader 51 38 O+13 Shares my values 50 40 O+10 Can get things done 45 41 O+4 Issues: Who would do best job of … Making wise decisions on foreign policy 53 38 O+15 Dealing with health care 52 39 O+13 Dealing with Medicare 51 38 O+13 Reflecting your views on abortion 48 35 O+13 Dealing with problems in the Middle East 50 39 O+11 Dealing with taxes 48 42 O+6 Improving the job situation 46 45 O+1 Reducing the federal budget deficit 43 46 R+3
PEW RESEARCH CENTER Sept. 12-16, 2012. Q23-24. Based on registered voters. Figures read across, percent volunteering both, neither and don’t know not shown.

21
www.people-press.org
Obama holds comparable advantages on many of the issues tested, including dealing with foreign policy (15 points), dealing with health care (13 points) and dealing with Medicare (13 points). About half (52%) say Obama would do the better job dealing with health care; 39% say Romney would. Despite the divisive debate over the 2010 health care law, these numbers are similar to September 2008 (52% Obama, 31% McCain). The incumbent does not have an edge on two other high profile concerns – improving the job situation and reducing the federal budget deficit. While 46% say Obama would do the best job of improving the job situation, nearly as many say Romney would do best (45%). This is largely unchanged from June (42% Obama, 46% Romney). Voters are also split over which candidate would do the best job of reducing the federal budget deficit (46% Romney, 43% Obama). Romney has lost considerable ground on this issue. In June, Romney had a 14-point advantage (50% to 36%) over Obama on the deficit; today, he leads by only three points. However, the deficit was a very strong issue for Obama four years ago. That October, 50% said Obama would do a better job on the deficit, while 30% said McCain would.

22
www.people-press.org
Obama’s Advantage with Swing Voters Among the roughly one-in-five voters considered swing voters – either because they are undecided or haven’t fully committed to Obama or Romney – Obama also holds a substantial edge on many of these traits and issues. But when it comes to the key issue of jobs, by a 44% to 27% margin, swing voters say Romney would do the best job of improving the job situation (another 28% say neither or have no opinion). And while Romney and Obama are tied overall with respect to who can best deal with the budget deficit, Romney holds a decided 46% to 19% edge among swing voters on this issue. However, swing voters feel that Obama connects well with ordinary Americans and they see him as having better judgment in a crisis, as a stronger leader, and more consistent in his positions. And while four-in-ten swing voters don’t see either candidate as more honest and truthful than the other, Obama still holds a wide advantage over Romney (38% to 21%).
Perceptions of Swing Voters
Traits: Which candidate …
Obama Romney Neither
(vol) Both/DK
(vol) % % % %
Connects with ordinary Americans 66 16 8 11=100 Willing to take unpopular stand 52 28 7 14=100 Good judgment in a crisis 46 24 9 21=100 Takes consistent positions 45 23 14 17=100 A strong leader 43 26 13 17=100 Shares my values 43 28 16 14=100 Honest and truthful 38 21 19 21=100 Can get things done 35 35 12 18=100 Issues: Who would do best job of … Making decisions on foreign policy 40 27 12 20=100 Dealing with health care 42 28 12 18=100 Reflecting your views on abortion 38 23 12 27=100 Dealing with Medicare 36 27 14 22=100 Dealing with Middle East 36 27 14 23=100 Dealing with taxes 30 39 11 20=100 Improving the job situation 27 44 13 15=100 Reducing federal budget deficit 19 46 17 18=100
PEW RESEARCH CENTER Sept 12-16, 2012. Q23-24. Based on those classified as swing voters, meaning they are undecided, only lean toward a candidate, or say there is still a chance they will change their mind. (N=246 on traits, N=232 on issues). Statistically significant advantages in bold.

23
www.people-press.org
22 16
30 33
16 24
31 25
Obama Romney
None at all
Not much
Fair amount
Great deal
Confidence in each to do the right thing when it comes to fixing the economy
Tackling the Nation’s Economic Troubles As with who can best address the job situation, neither candidate has a clear advantage among registered voters when it comes to fixing the economy. Roughly half (52%) say they have a great deal (22%) or a fair amount (30%) of confidence in Obama to do the right thing when it comes to the economy. Similarly, 49% of voters say they have at least a fair amount of confidence in Romney on the economy. Voters have stronger feelings about Obama than about Romney. More have a great deal of confidence in Obama than Romney when it comes to the economy (22% vs. 16%), but more also say they have no confidence at all in Obama (31% vs. 25%). In January 2009 shortly before Obama took office, confidence in his ability to handle the economy was extremely high: fully 75% of voters had at least a fair amount of confidence in him. Even among Republicans, nearly half (48%) expressed at least a fair amount of confidence in his economic plans. But that level of confidence fell sharply over Obama’s first year in office. By December 2009, only 51% of voters expressed confidence in his economic stewardship and 52% say that today. Romney holds a slim edge over Obama on the economy among independent voters; 53% express at least a fair amount of confidence in Romney, 46% in Obama. The same is true among swing voters by about the same margin (53% confident in Romney, 45% in Obama). Voters in low income households express far
Confidence on the Economy
PEW RESEARCH CENTER Sept. 12-16, 2012. Q38. Based on registered voters.
Romney Has Slim Advantage on Economy among Independents Great deal/fair amount of confidence in each to do the right thing when it comes to fixing the economy
Obama Romney N
% % All Voters 52 49 2,424 Republican 10 89 717 Democrat 90 17 869 Independent 46 53 757 Family income $75,000 or more 49 52 836 $30,000-$74,999 49 52 760 Less than $30,000 63 42 526
PEW RESEARCH CENTER Sept. 12-16, 2012. Q38. Based on registered voters.

24
www.people-press.org
more confidence in Obama than Romney when it comes to fixing the economy, while those with household incomes of $30,000 or more rate the candidates about the same. Voters’ Descriptions of Candidates Romney’s favorability deficit is reflected in how voters associate specific traits and qualities with each of the candidates. Fully 64% of registered voters say they think of Obama as “inspiring,” while 34% say they do not. Just 36% of voters view Romney as inspiring, while 60% say he is not. Romney also is more widely viewed as “hard-to-like” than Obama: 43% of voters say Romney is hard-to-like; just 24% say this describes Obama. However, about as many voters view Romney as “decisive” (55%) as say that about Obama (57%). The survey also includes measures of how both candidates make people feel: Far more voters say that Obama makes them feel “proud” than say that about Romney (51% vs. 35%). But the differences are far narrower in views about whether the candidates make people feel “hopeful” and “angry.” Half (50%) say Obama makes them feel hopeful, while almost as many (48%) say he does not. Just 44% say Romney makes them feel hopeful, while 54% say he does not. At the same time, neither Obama nor Romney engenders a great deal of anger. Three-in-ten (31%) say Obama makes them feel angry, compared with 26% who say the same about Romney. About half of voters (49%) say Obama makes them feel “disappointed,” while 50% say he does not. Opinion also is divided about whether Romney makes voters feel “worried”: 48% say Romney makes them feel worried, while 50% say he does not.
Obama Seen as More ‘Inspiring,’ Romney as More ‘Hard to Like’
Think of each as… Obama Romney Diff
% % Inspiring 64 36 +28 Decisive 57 55 +2 Hard-to-like 24 43 -19 How does each make you feel? Proud 51 35 +16 Hopeful 50 44 +6 Angry 31 26 +5 Disappointed 49 -- -- Worried -- 48 --
PEW RESEARCH CENTER Sept. 12-16, 2012. Q25-Q28. Based on registered voters.

25
www.people-press.org
Views of Obama: 2008-2012 Obama’s image is not nearly as positive as it was in the days following his 2008 election victory. In a post-election survey of voters, fully 81% said they thought of Obama as inspiring, while 69% said he made them feel hopeful and 65% said Obama made them feel proud. Perceptions became more negative over the first two years of Obama’s presidency, but a sizable majority (64%) continues to describe Obama as inspiring. Obama’s image has not changed a great deal since 2010, however. As many voters say Obama makes them feel proud today (51%) as did so in October 2011 (45%) and March 2010 (48%). Similarly, the percentage saying Obama made them feel hopeful fell from 69% to 52% between the post-election survey in 2008 and March 2010. That percentage fell further, to 43% in October 2011, but has increased since then to 50% today. Over the past year, there has been a decline in the percentage of voters saying they are disappointed in Obama. In October 2011, 55% expressed disappointment with Obama, while 44% did not. Today, voters are divided, with 49% saying he makes them feel disappointed and 50% saying he does not. Obama has long engendered anger from some voters. In March 2008, during the Democratic
Obama’s Post-Election Glow Long Gone
Think of Obama as … Yes No DK % % %
Inspiring September 2012 64 34 1=100 March 2010 59 38 2=100 November 2008 81 18 1=100 September 2008 71 26 3=100 April 2008 66 31 3=100 Decisive September 2012 57 38 5=100 March 2010 56 38 7=100 Hard to like September 2012 24 75 2=100 April 2008 25 71 4=100 Does Obama make you feel? Proud September 2012 51 45 3=100 October 2011 45 52 3=100 March 2010 48 48 4=100 November 2008 65 32 3=100 March 2008 42 53 5=100 Hopeful September 2012 50 48 2=100 October 2011 43 55 2=100 March 2010 52 46 2=100 November 2008 69 29 2=100 March 2008 54 43 3=100 Disappointed September 2012 49 50 1=100 October 2011 55 44 2=100 March 2010 46 51 3=100 Angry September 2012 31 68 1=100 October 2011 31 68 1=100 March 2010 31 67 2=100 November 2008 9 91 *=100 March 2008 26 71 3=100
PEW RESEARCH CENTER Sept. 12-16, 2012. Q25-Q26. Based on registered voters. Nov. 2008 based on post-election callback survey of voters. Figures may not add to 100% because of rounding.

26
www.people-press.org
primary campaign, 26% of voters said Obama made them feel angry. That fell to 9% in the November 2008 post-election poll but rebounded to 31% in 2010 and has remained at that level since. Swing Voters’ Views of the Candidates There are substantial differences in how Romney and Obama voters view the candidates’ traits and characteristics. But even many of those who say they are certain to vote for Mitt Romney reject the idea that Obama is hard to like. Nearly half of certain Romney voters (47%) say Obama is hard to like, but about as many (52%) say he is not hard to like. By contrast, nearly two-thirds of certain Obama voters (65%) say Romney is hard to like. Among swing voters, many more describe Obama as inspiring than say that about Romney (62% vs. 38%). And nearly twice as many swing voters say Romney is hard to like than describe Obama that way (43% vs. 22%). But swing voters are as likely to view Romney as decisive (56%) as Obama (54%). Swing voters have mixed feeling about both candidates. Roughly half (55%) say they are disappointed in Obama but about as many (47%) say Obama makes them feel proud. Conversely, while 46% of swing voters say that Romney worries them, a comparable percentage says Romney makes them feel hopeful (40%).
Nearly Twice as Many Swing Voters Say Romney Hard to Like
Think of each as… Obama
Certain Romney
Certain Obama
Swing voter
% % % Inspiring 26 96 62 Decisive 23 87 54 Hard-to-like 47 6 22 Romney Inspiring 73 7 38 Decisive 88 27 56 Hard-to-like 16 65 43 N 441 488 232
PEW RESEARCH CENTER Sept. 12-16, 2012. Q25 & Q27. Based on registered voters. Certain voters are those who back Romney or Obama and say there is no chance they will support the other. Swing voters are undecided, only lean toward a candidate, or say there is still a chance they will support the other.
Swing Voters Have Mixed Feelings about Obama and Romney
How does each make you feel? Obama
Certain Romney
Certain Obama
Swing voter
% % % Proud 6 91 47 Hopeful 3 93 42 Angry 69 3 26 Disappointed 94 9 55 Romney Proud 79 5 25 Hopeful 94 4 40 Angry 3 49 18 Worried 10 81 46 N 482 535 246
PEW RESEARCH CENTER Sept. 12-16, 2012. Q26 & Q28. Based on registered voters. Certain voters are those who back Romney or Obama and say there is no chance they will support the other. Swing voters are undecided, only lean toward a candidate, or say there is still a chance they will support the other.

27
www.people-press.org
Voters’ Take on Candidates’ Ideologies Nearly half (47%) of registered voters say that Obama’s positions on issues are about right, while 39% say they are too liberal. About one-in-ten (9%) say they are not liberal enough. Fewer (38%) say Romney’s positions on issues are about right ideologically, with 35% saying his positions are too conservative, and 19% not conservative enough. Among Republican voters, 72% say Romney’s positions are about right, while 19% say they are not conservative enough. Even among Republicans who think of themselves as conservative, 70% say Romney’s positions are about right, and just 22% say he is not conservative enough. Similarly, most Democratic voters (79%) say Obama’s positions are about right, while 10% say they are not liberal enough. Just 9% say they are too liberal. Among liberal Democrats, just 14% believe Obama is not liberal enough, while 82% say his positions are about right.
Views of Candidates’ Ideology
Obama’s positions on issues are…
All voters Rep Dem Ind
% % % % Too liberal 39 79 9 42 Not liberal enough 9 5 10 11 About right 47 12 79 41 Don’t know 5 3 3 6 100 100 100 100 Romney’s positions on issues are… Too conservative 35 8 57 34 Not conserv. enough 19 19 20 19 About right 38 72 13 38 Don’t know 8 2 9 10 100 100 100 100 N 1,263 365 468 383
PEW RESEARCH CENTER Sept. 12-16, 2012. Q29 & Q30. Based on registered voters. Figures may not add to 100% because of rounding.

28
www.people-press.org
Obama and Romney on National Security The recent turmoil in the Middle East appears to have had little impact in opinions about Obama’s approach to foreign policy and national security issues. In a separate survey, conducted Sept. 13-16 among 1,001 adults, including 824 registered voters, 47% say Obama’s approach to national security is not tough enough, while 40% say it is about right. This is unchanged from previous surveys conducted in April 2010 and November 2009, when similar percentages of voters said Obama was not tough enough in his approach to foreign policy and national security. That survey also found that 45% of the public who had followed news about the recent attacks on U.S. embassies in the Middle East approved of the way Obama is handling the situation (36% disapproved). Just 25% approved of Mitt Romney’s comments on the situation, while 48% disapproved. (For more, see “Middle East Turmoil Closely Followed: Romney’s Comments Viewed Negatively,” Sept. 17, 2012.) About a third of registered voters (34%) say Mitt Romney’s approach to foreign policy and national security issues would be about right. About one-in-five (22%) say Romney’s foreign policy would not be tough enough, while 16% say it would be too tough. Nearly three-in-ten (28%) offer no opinion.
Little Change in Views of Obama’s Approach to National Security Obama’s approach to foreign policy and national security …
June 2009
Nov 2009
April 2010
Sept 2012
% % % % Too tough 2 3 2 1 Not tough enough 39 49 47 47 About right 52 42 42 40 Don’t know 7 7 8
12 100 100 100 100
PEW RESEARCH CENTER Sept. 13-16, 2012. PEW6. Based on registered voters. Figures may not add to 100% because of rounding.
How Would Romney Approach Foreign Policy?
Romney’s approach to foreign policy/national security would be …
Sept 2012
% Too tough 16 Not tough enough 22 About right 34 Don’t know
28 100
PEW RESEARCH CENTER Sept. 13-16, 2012. PEW7. Based on registered voters. Figures may not add to 100% because of rounding.

29
www.people-press.org

30
www.people-press.org
SECTION 4: VIEWS OF VICE PRESIDENTIAL CANDIDATES, CANDIDATE SPOUSES, FORMER PRESIDENTS Voters offer a mixed view of both candidates’ vice-presidential nominees, which stands in contrast to the positive reception most recent running mates have received. In fact, across the seven most recent presidential elections, only one was not viewed favorably on balance in September: Dan Quayle in 1992. Joe Biden’s public image has suffered substantially over the past four years. In September of 2008, 52% held a favorable view of Biden and just 30% viewed him unfavorably. Today, that has slipped to 45% favorable, 44% unfavorable. A recent Pew Research Center/Washington Post poll found a substantial number of people offering negative one-word descriptions of Biden, including idiot, incompetent, clown, and goofy. Paul Ryan’s ratings are similarly low: just 40% have a favorable view of him, while 44% express an unfavorable opinion. This lags behind ratings of Sarah Palin at this point in 2008, though views of Palin turned more negative as the election progressed. In September 2008, most voters viewed Palin favorably by a 55% to 32% margin. By mid-October, the balance had shifted to 44% favorable, 49% unfavorable. As with Biden, a recent Pew Research Center/Washington Post poll found as many people offering negative descriptions of Ryan, such as idiot, extreme and scary as offering positive words such as intelligent, energetic and smart. Independent voters offer tepid ratings of both vice-presidential candidates. Joe Biden is viewed favorably by 42% of independent voters, while 50% view him unfavorably. Views of Paul Ryan are about the same: 40% favorable, 43% unfavorable. Both candidates are
2012 Vice Presidential Candidates Rate Relatively Poorly
Favor-able
Unfavor- able
DK/ Can’t rate
Sept 2012 % % % Joe Biden 45 44 10=100 Paul Ryan 40 44 16=100 Sept 2008 Joe Biden 52 30 18=100 Sarah Palin 55 32 14=100 Sept 2004 John Edwards 54 31 16=100 Dick Cheney 48 42 10=100 Sept 2000* Joe Lieberman 53 18 29=100 Dick Cheney 47 24 30=100 Oct 1996* Al Gore 61 31 8=100 Jack Kemp 47 31 22=100 Sept 1992* Al Gore 56 26 18=100 Dan Quayle 40 51 9=100 Sept 1988* Lloyd Bentsen 50 22 28=100 Dan Quayle 41 32 27=100
PEW RESEARCH CENTER Sept. 12-16, 2012. Based on registered voters; 1996 based on likely voters. Figures may not add to 100% because of rounding. *1992-2000 data from Gallup.

31
www.people-press.org
seen favorably by about three-quarters of their own party, but neither is popular with members of the opposing party. Michelle Obama Viewed Favorably Overall, 66% of voters say they have a favorable view of first lady Michelle Obama, 23% hold an unfavorable view. Michelle Obama is viewed more positively today than she was four years ago; in September 2008, 56% held a favorable view of her and 26% an unfavorable view. While enjoying a strong positive image, Michelle Obama is seen slightly less favorably than Laura Bush in August 2004 (74% favorable, 17% unfavorable). On balance, more voters view Ann Romney favorably (46%) than unfavorably (24%), though 30% are unable to rate her. Views of Ann Romney are comparable to opinions about Cindy McCain in September 2008, but on balance are more positive than those of Teresa Heinz Kerry in August 2004 (45% favorable, 33% unfavorable).
Favorability of Candidate Wives
Favor-
able Unfavor-
able DK/
Can’t rate Sept 2012 % % % Michelle Obama 66 23 10=100 Ann Romney 46 24 30=100 Sept 2008 Michelle Obama 56 26 18=100 Cindy McCain 52 24 25=100 Aug 2004 Teresa Kerry 45 33 23=100 Laura Bush 74 17 9=100 May 2000 Tipper Gore 55 19 26=100 Laura Bush 41 11 48=100
PEW RESEARCH CENTER Sept. 12-16, 2012. Q22e-f. Based on registered voters. Figures may not add to 100% because of rounding.

32
www.people-press.org
Bill Clinton’s Favorable Image Fully seven-in-ten voters (70%) have a favorable view of Bill Clinton; just 26% hold an unfavorable view. Favorability ratings for Clinton have never been higher in Pew Research surveys dating back to 1992. Among independent voters, 69% hold a favorable view of Clinton. Democrats are nearly unanimous in their positive view of the former president (95% favorable). Even among Republicans, 37% have a favorable view of Clinton. And Clinton’s potential value to the Obama campaign is clear: 76% of swing voters hold a favorable view of Clinton, while just 17% view him unfavorably. George W. Bush is seen much less favorably by voters. Overall, more say they have an unfavorable (53%) than favorable (43%) view of the 43rd president. About nine-in-ten Republicans (87%) have a favorable view of Bush. But unlike Clinton, Bush draws mixed reactions from independents and swing voters.
Bill Clinton Very Popular with Swing Voters
Favor-
able Unfavor-
able DK/
Can’t rate Bill Clinton % % % All voters 70 26 4=100 Republican 37 57 6=100 Democrat 95 3 2=100 Independent 69 27 4=100 Swing voters 76 17 8=100 G.W. Bush All voters 43 53 4=100 Republican 87 10 3=100 Democrat 12 85 3=100 Independent 44 50 6=100 Swing voters 45 47 7=100
PEW RESEARCH CENTER Sept. 12-16, 2012. Q22g-h. . Based on registered voters. Figures may not add to 100% because of rounding

33
www.people-press.org
Third Party Candidates Very few voters are hearing much about third party candidates in this year’s election. A quarter of voters have heard of Gary Johnson, presidential candidate for the Libertarian Party, but only 5% have heard a lot about him. Fully 74% have not heard of him at all. Even fewer have heard of the other third party candidates. Just 18% of voters have heard of Jill Stein, presidential candidate for the Green Party (and just 2% have heard a lot) while 81% have not heard of her. Just 9% of voters have heard of Virgil Goode, of the Constitution Party, while 90% have never heard of him. And very few say they are voting for any of these third party candidates. In the current survey, just 2% of registered voters and 1% of likely voters volunteer their support for a candidate other than Obama or Romney. And even when these candidates are offered explicitly as choices to voters, Gallup found just 1% select each of them (with another 1% volunteering some other person’s name).
Few Are Hearing about Third Party Candidates
Heard a
lot Heard a
little Haven’t heard of
% % % Gary Johnson (Libertarian Party)
5 20 74
Jill Stein (Green Party)
2 16 81
Virgil Goode (Constitution Party)
2 8 90
PEW RESEARCH CENTER Sept 13-16, 2012 Omnibus. PEW4. Based on registered voters.

34
www.people-press.org
About the Surveys
Most of the analysis in this report is based on telephone interviews conducted September 12-16, 2012, among a national sample of 3,019 adults, 18 years of age or older, living in all 50 U.S. states and the District of Columbia (1,806 respondents were interviewed on a landline telephone, and 1,213 were interviewed on a cell phone, including 599 who had no landline telephone). Data collection was managed by Princeton Survey Research Associates International and conducted by interviewers at Princeton Data Source and Abt SRBI. A combination of landline and cell phone random digit dial samples were used; both samples were provided by Survey Sampling International. Interviews were conducted in English and Spanish. Respondents in the landline sample were selected by randomly asking for the youngest adult male or female who is now at home. Interviews in the cell sample were conducted with the person who answered the phone, if that person was an adult 18 years of age or older. For detailed information about our survey methodology, see http://people-press.org/methodology/ The combined landline and cell phone sample are weighted using an iterative technique that matches gender, age, education, race, Hispanic origin and nativity and region to parameters from the March 2011 Census Bureau's Current Population Survey and population density to parameters from the Decennial Census. The sample also is weighted to match current patterns of telephone status and relative usage of landline and cell phones (for those with both), based on extrapolations from the 2011 National Health Interview Survey. The weighting procedure also accounts for the fact that respondents with both landline and cell phones have a greater probability of being included in the combined sample and adjusts for household size among respondents with a landline phone. Sampling errors and statistical tests of significance take into account the effect of weighting. The following table shows the unweighted sample sizes and the error attributable to sampling that would be expected at the 95% level of confidence for different groups in the survey:
Group Unweighted sample size Plus or minus…
Total 3,019 2.1 percentage points Registered voters 2,424 2.3 percentage points Likely voters 2,192 2.4 percentage points Among registered voters Republican voters 717 4.3 percentage points Democratic voters 869 3.9 percentage points Independent voters 757 4.1 percentage points Obama supporters 1,188 3.3 percentage points Romney supporters 1,062 3.5 percentage points Form 1 voters 1,161 3.4 percentage points Form 2 voters 1,263 3.2 percentage points
Some of the analysis in this report is based on telephone interviews conducted September 13-16, 2012, among a national sample of 1,001 adults 18 years of age or older living in the continental United States (600 respondents were interviewed on a landline telephone, and 401 were

35
www.people-press.org
interviewed on a cell phone, including 188 who had no landline telephone). The survey was conducted by interviewers at Princeton Data Source and Universal Survey under the direction of Princeton Survey Research Associates International. A combination of landline and cell phone random digit dial samples were used; both samples were provided by Survey Sampling International. Interviews were conducted in English. Respondents in the landline sample were selected by randomly asking for the youngest adult male or female who is now at home. Interviews in the cell sample were conducted with the person who answered the phone, if that person was an adult 18 years of age or older. For detailed information about our survey methodology, see: http://people-press.org/methodology/. The combined landline and cell phone sample are weighted using an iterative technique that matches gender, age, education, race, Hispanic origin and region to parameters from the March 2011 Census Bureau's Current Population Survey and population density to parameters from the Decennial Census. The sample also is weighted to match current patterns of telephone status, based on extrapolations from the 2011 National Health Interview Survey. The weighting procedure also accounts for the fact that respondents with both landline and cell phones have a greater probability of being included in the combined sample and adjusts for household size among respondents with a landline phone. Sampling errors and statistical tests of significance take into account the effect of weighting. The following table shows the unweighted sample sizes and the error attributable to sampling that would be expected at the 95% level of confidence for different groups in the survey:
Group Unweighted sample size Plus or minus…
Total sample 1,001 3.6 percentage points Registered voters 824 4.0 percentage points
Sample sizes and sampling errors for other subgroups are available upon request. In addition to sampling error, one should bear in mind that question wording and practical difficulties in conducting surveys can introduce error or bias into the findings of opinion polls.
© Pew Research Center, 2012
36
PRESIDENTIAL TRIAL HEATPew Research Center for the People and the Press, Sep 12-16, 2012
Other/ Unwgted Other/ UnwgtedObama Romney DK/Ref N Obama Romney DK/Ref N
% % %ALL VOTERS 51 42 7 2424 51 43 6 2192GENDER
Men 46 47 8 1097 46 48 6 984Women 56 37 7 1327 56 38 6 1208
AGE18-49 54 39 7 788 56 39 6 65750+ 48 44 7 1593 48 45 6 1497
DETAILED AGE18-29 59 33 9 190 61 31 8 13330-49 52 41 6 598 54 41 5 52550-64 50 43 7 836 50 44 6 78065+ 46 47 7 757 46 48 6 717
GENDER BY AGEMen 18-49 52 41 7 406 53 41 6 342Men 50+ 40 52 8 675 40 53 7 628Women 18-49 56 37 7 382 59 36 5 316Women 50+ 56 38 7 918 55 39 6 868
RACEWhite, non-Hispanic 43 50 7 1858 44 51 6 1710Black, non-Hispanic 92 2 6 236 93 2 5 213Hispanics 69 24 7 141 72 22 7 108
EDUCATIONCollege grad+ 53 42 5 1124 53 42 4 1066Some college 47 44 9 672 49 44 7 606High school or less 52 40 8 606 52 41 7 504
FAMILY INCOME$75,000+ 49 46 5 836 50 46 4 799$30,000-$74,999 49 43 7 760 50 44 6 698Less than $30,000 60 33 7 526 62 32 6 419
DETAILED INCOME$100,000+ 51 44 5 531 51 45 4 510$75,000-$99,000 47 48 6 305 48 48 4 289$50,000-$74,990 45 49 6 363 45 50 5 340$30,000-$49,999 53 39 8 397 54 39 7 358Less than $30,000 60 33 7 526 62 32 6 419
REGIONNortheast 56 34 10 436 56 36 8 399Midwest 51 42 7 589 53 41 5 534South 48 45 7 898 47 47 6 804West 52 43 6 501 52 42 5 455
PARTY IDRepublican 6 91 3 717 5 92 3 665Democrat 92 6 3 869 93 5 2 803Independent 44 42 13 757 45 44 11 661
IDEOLOGYConservative 27 67 6 979 25 70 5 911Moderate 55 37 7 832 58 36 6 741Liberal 86 8 5 518 90 6 4 470
PARTY AND IDEOLOGYConservative Republican 4 94 2 525 2 95 2 501Mod/Lib Republican 12 83 5 187 14 83 3 159Mod/Cons Democrat 89 7 4 477 89 8 3 435Liberal Democrat 97 3 1 359 99 1 0 338
TEA PARTY (REP/LEAN REP)Agree 1 97 2 503 1 97 2 490Disagree/No opinion 10 84 6 551 9 85 6 481
Q.5 If the presidential election were being held today, would you vote for the Republican ticket of Mitt Romney and Paul Ryan or the Democratic ticket of Barack Obama and Joe Biden?/Q.5a As of today, who do you lean more to?
----REGISTERED VOTERS---- -------LIKELY VOTERS-------
www.people-press.org

37
PRESIDENTIAL TRIAL HEATPew Research Center for the People and the Press, Sep 12-16, 2012
Other/ Unwgted Other/ UnwgtedObama Romney DK/Ref N Obama Romney DK/Ref N
% % %RELIGIOUS PREFERENCE
Total Protestants 43 50 7 1262 43 51 6 1155White NH evang. Prot. 19 74 7 524 18 76 6 482White NH mainline Prot. 45 46 8 437 48 46 6 400Black NH Prot. 95 2 3 183 95 2 3 172
Total Catholic 54 39 7 541 55 40 5 495White NH Cath. 47 46 7 435 49 46 5 405
Unaffiliated 65 27 8 381 67 26 7 329ATTEND RELIGIOUS SERVICES
Weekly or more 42 51 7 1009 42 51 6 937Less than weekly 57 36 7 1369 58 36 5 1218
Q.5 If the presidential election were being held today, would you vote for the Republican ticket of Mitt Romney and Paul Ryan or the Democratic ticket of Barack Obama and Joe Biden?/Q.5a As of today, who do you lean more to?
----REGISTERED VOTERS---- -------LIKELY VOTERS-------
www.people-press.org

38
PRESIDENTIAL TRIAL HEAT AMONG WHITESPew Research Center for the People and the Press, Sep 12-16, 2012
Other/ Unwgted Other/ UnwgtedObama Romney DK/Ref N Obama Romney DK/Ref N
% % %ALL WHITE NON-HISP VOTERS 43 50 7 1858 44 51 6 1710GENDER
Men 37 56 7 826 38 56 6 755Women 47 45 7 1032 49 46 5 955
AGE18-49 45 48 7 547 47 48 5 47050+ 41 52 7 1293 41 53 6 1223
DETAILED AGE18-29 46 44 10 117 8330-49 44 50 6 430 46 50 4 38650-64 44 50 7 649 44 51 5 61065+ 38 55 7 644 38 55 6 613
GENDER BY AGEMen 18-49 42 51 7 280 44 50 6 242Men 50+ 32 60 7 543 33 61 6 509Women 18-49 47 46 7 267 50 45 5 227Women 50+ 48 45 7 750 48 46 6 714
EDUCATIONCollege grad+ 48 48 4 885 49 47 4 851Some college or less 40 51 9 966 40 53 7 852
GENDER BY EDUCATIONCollege grad+ men 42 54 4 433 42 54 4 415College grad+ women 54 42 4 452 55 41 4 436Some coll or less men 34 57 9 390 35 58 7 337Some coll or less women 44 47 9 576 45 49 7 515
FAMILY INCOME$75,000+ 43 52 5 684 44 52 4 663$30,000-$74,999 42 51 7 600 43 52 5 557Less than $30,000 46 46 8 350 47 46 7 282
PARTY IDRepublican 4 93 3 639 4 94 2 598Democrat 89 8 3 558 90 8 2 521Independent 40 48 12 613 41 49 10 550
IDEOLOGYConservative 16 79 5 783 14 81 5 738Moderate 48 44 8 632 51 42 7 570Liberal 86 10 4 388 90 8 3 359
REGIONNortheast 49 42 9 355 51 42 7 332Midwest 44 48 7 488 47 47 6 446South 36 57 7 643 35 60 5 581West 45 50 4 372 47 49 5 352
Q.5 If the presidential election were being held today, would you vote for the Republican ticket of Mitt Romney and Paul Ryan or the Democratic ticket of Barack Obama and Joe Biden?/Q.5a As of today, who do you lean more to?
----REGISTERED VOTERS---- -------LIKELY VOTERS-------
www.people-press.org

39
PRESIDENTIAL TRIAL HEAT BY GENDERPew Research Center for the People and the Press, Sep 12-16, 2012
Other/ Unwgted Other/ UnwgtedObama Romney DK/Ref N Obama Romney DK/Ref N
% % % % % %ALL VOTERS 46 47 8 1097 56 37 7 1327DETAILED AGE
18-29 57 32 10 106 8430-49 50 45 5 300 55 38 7 29850-64 41 52 8 365 58 35 7 47165+ 38 53 9 310 52 42 6 447
EDUCATIONCollege grad+ 46 49 6 552 60 36 4 572Some college or less 46 46 9 534 54 38 8 744
FAMILY INCOME$75,000+ 44 51 6 442 56 40 5 394$30,000-$74,999 45 49 7 349 53 39 8 411Less than $30,000 56 35 9 188 63 31 6 338
PARTY IDRepublican 7 91 2 352 5 91 4 365Democrat 91 8 1 302 92 4 3 567Independent 43 43 14 409 46 41 13 348
IDEOLOGYConservative 21 73 6 473 33 61 5 506Moderate 54 40 6 397 57 34 9 435Liberal 86 6 8 190 86 10 4 328
MARITAL STATUSMarried 39 54 7 703 52 42 6 716Not married 56 35 9 384 60 31 8 593
Other/ Unwgted Other/ UnwgtedObama Romney DK/Ref N Obama Romney DK/Ref N
% % % % % %ALL VOTERS 46 48 6 984 56 38 6 1208DETAILED AGE
18-29 76 5630-49 50 45 5 265 58 37 5 25950-64 41 53 6 335 58 36 6 44565+ 38 54 8 293 51 43 6 424
EDUCATIONCollege grad+ 46 49 5 522 60 36 3 545Some college or less 46 47 7 454 54 39 7 655
FAMILY INCOME$75,000+ 44 52 5 420 58 39 3 379$30,000-$74,999 45 50 5 321 54 39 7 377Less than $30,000 59 34 7 136 63 32 5 283
PARTY IDRepublican 6 91 2 322 4 93 3 343Democrat 92 8 1 276 94 4 3 526Independent 44 45 11 357 46 43 11 304
IDEOLOGYConservative 18 77 6 439 32 63 5 472Moderate 58 37 5 351 59 34 8 390Liberal 90 5 6 167 91 6 3 303
MARITAL STATUSMarried 40 55 6 651 53 44 4 669Not married 58 34 8 325 62 31 8 525
Q.5 If the presidential election were being held today, would you vote for the Republican ticket of Mitt Romney and Paul Ryan or the Democratic ticket of Barack Obama and Joe Biden?/Q.5a As of today, who do you lean more to?
---------AMONG WOMEN-------------------AMONG MEN----------
----------AMONG MEN---------- ---------AMONG WOMEN---------
BASED ON ALL REGISTERED VOTERS
BASED ON LIKELY VOTERS ONLY
www.people-press.org

40
www.people-press.org
PEW RESEARCH CENTER FOR THE PEOPLE & THE PRESS SEPTEMBER 2012 POLITICAL SURVEY
TOPLINE September 12-16, 2012
N=3,019 ASK ALL: THOUGHT How much thought have you given to the coming presidential election . . . Quite a lot or only a
little? BASED ON REGISTERED VOTERS [N=2,424]: Quite (VOL.) Only a (VOL.) (VOL.) 2012 Election a lot Some little None DK/Ref Sep 12-16, 2012 70 4 23 2 1 Jul 16-26, 2012 61 5 28 6 1 Jun 28-Jul 9, 2012 65 3 29 3 * Jun 7-17, 2012 67 1 30 2 1 May 9-Jun 3, 2012 61 2 33 3 1 Apr 4-15, 2012 64 2 30 4 1 Mar 7-11, 2012 66 2 30 1 1 2008 Election November, 2008 81 3 13 2 1 Late October, 2008 81 3 13 2 1 Mid-October, 2008 81 3 13 3 * Early October, 2008 81 2 14 2 1 Late September, 2008 80 3 14 2 1 Mid-September, 2008 78 4 14 3 1 August, 2008 74 6 17 2 1 July, 2008 74 2 20 3 1 June, 2008 72 2 23 2 1 Late May, 2008 75 4 17 3 1 April, 2008 77 7 13 2 1 March, 2008 78 3 15 3 1 Late February, 2008 74 3 19 2 2 2004 Election November, 2004 82 3 12 2 1 Mid-October, 2004 76 5 15 3 1 Early October, 2004 74 4 19 2 1 September, 2004 71 3 22 3 1 August, 2004 69 2 26 2 1 July, 2004 67 2 28 2 1 June, 2004 58 3 36 2 1 May, 2004 59 6 30 4 1 Late March, 2004 60 4 31 4 1 Mid-March, 2004 65 2 31 2 * 2000 Election November, 2000 72 6 19 2 1 Late October, 2000 66 6 24 4 * Mid-October, 2000 67 9 19 4 1 Early October, 2000 60 8 27 4 1 September, 2000 59 8 29 3 1 July, 2000 46 6 45 3 * June, 2000 46 6 43 5 * May, 2000 48 4 42 5 1 April, 2000 45 7 41 7 * 1996 Election November, 1996 67 8 22 3 * October, 1996 65 7 26 1 1 Late September, 1996 61 7 29 2 1 Early September, 1996 56 3 36 4 1 July, 1996 55 3 41 1 *

41
www.people-press.org
THOUGHT CONTINUED… Quite (VOL.) Only a (VOL.) (VOL.) a lot Some little None DK/Ref June, 1996 50 5 41 3 1 1992 Election Early October, 1992 77 5 16 1 1 September, 1992 69 3 26 1 1 August, 1992 72 4 23 1 * June, 1992 63 6 29 1 1 1988 Election Gallup: November, 1988 73 8 17 2 0 Gallup: October, 1988 69 9 20 2 0 Gallup: September, 1988 57 18 23 2 0 Gallup: August, 1988 61 10 27 2 0 ASK ALL: CAMPNII How closely have you been following news about candidates for the 2012 presidential
election… very closely, fairly closely, not too closely, or not at all closely? BASED ON REGISTERED VOTERS [N=2,424]: Very Fairly Not too Not at all (VOL.) closely closely closely closely DK/Ref 2012 Election Sep 12-16, 2012 44 34 15 7 * 2008 Election November, 2008 56 33 8 3 * Late October, 2008 53 33 9 4 1 Mid-October, 2008 54 35 7 4 * Mid-September, 2008 50 38 8 4 * 2004 Election November, 2004 52 36 8 4 * 2000 Election November, 2000 39 44 12 5 * 1996 Election November, 1996 34 45 15 6 * 1992 Election October, 1992 55 36 7 2 0 ASK ALL: REG Which of these statements best describes you? [READ IN ORDER] [INSTRUCTION: IF
RESPONDENT VOLUNTEERS THAT THEY ARE IN NORTH DAKOTA AND DON’T HAVE TO REGISTER, PUNCH 1]
Sep 12-16 2012 72 Are you ABSOLUTELY CERTAIN that you are registered to vote at your current address 5 Are you PROBABLY registered, but there is a chance your registration has lapsed 23 Are you NOT registered to vote at your current address 1 Don't know/Refused (VOL.) ASK ALL REGISTERED VOTERS (REG=1): PRECINCT Have you ever voted in your precinct or election district? BASED ON REGISTERED VOTERS [N=2,424]: Sep 12-16 2012 85 Yes 15 No * Don't know/Refused (VOL.)

42
www.people-press.org
ASK ALL REGISTERED VOTERS (REG=1): FOLGOV Would you say you follow what’s going on in government and public affairs [READ]?
BASED ON REGISTERED VOTERS [N=2,424]: Most of Some of Only now Hardly (VOL.) the time the time and then at all DK/Ref Sep 12-16, 2012 60 26 10 4 * Sep 22-Oct 4, 2011 55 28 11 5 1 Feb 22-Mar 14, 2011 57 28 11 4 * Oct 27-30, 2010 56 29 10 5 1 Oct 13-18, 2010 59 27 10 4 * Aug 25-Sep 6, 20101
January, 2007 61 27 8 4 * 62 25 9 4 *
November, 2006 58 26 10 6 * Late October, 2006 57 30 8 5 * December, 2005 54 29 12 5 0 December, 2004 49 35 12 4 * November, 2004 61 27 9 3 * Mid-October, 2004 63 26 8 3 * June, 2004 49 35 11 4 * August, 2003 56 31 10 3 * November, 2002 57 26 11 6 1 August, 2002 60 29 8 2 0 March, 2001 55 26 11 7 1 Early November, 2000 51 32 12 5 * September, 2000 51 34 10 4 1 June, 2000 45 31 15 8 * Late September, 1999 46 32 17 5 * August, 1999 (GP) 40 35 17 8 * November, 1998 52 27 11 9 * Late October, 1998 57 29 10 4 * Early October, 1998 51 33 11 5 * Early September, 1998 52 33 11 4 * June, 1998 42 33 18 7 * November, 1997 47 34 14 4 * November, 1996 52 32 12 4 * October, 1996 43 37 13 6 1 June, 1996 47 34 14 5 * October, 1995 52 34 11 4 * April, 1995 49 34 13 4 * November, 1994 57 30 10 3 * October, 1994 52 34 10 4 0 July, 1994 51 32 13 4 * May, 1990 43 36 15 6 * February, 1989 (GP) 47 34 14 4 1 October, 1988 52 33 12 3 * May, 1988 (GP) 37 37 17 6 3 January, 1988 42 35 17 5 2 November, 1987 (GP) 49 32 14 4 1 May, 1987 47 35 13 5 1 July, 1985 41 34 18 7 1 NO QUESTIONS 1-4
1 In the Aug. 25-Sept. 6, 2010 survey, a wording experiment was conducted with one half of respondents asked the
question wording shown above, the other half was asked: “Some people seem to follow what’s going on in government and public affairs most of the time, whether there’s an election or not. Others aren’t that interested. Would you say you follow what’s going on in government and public affairs …” No significant differences were found between questions and the combined results are shown above. All survey prior to Sept. 2010 used the longer question wording.

43
www.people-press.org
ASK ALL REGISTERED VOTERS (REG=1): Q.5 If the presidential election were being held TODAY, would you vote [READ AND RANDOMIZE: for
the Democratic ticket of Barack Obama and Joe Biden OR the Republican ticket of Mitt Romney and Paul Ryan]?
ASK IF OTHER OR DK (Q.5=3-9): Q.5a As of TODAY, do you LEAN more to [READ IN SAME ORDER AS Q.5]? ASK IF CHOSE ROMNEY OR OBAMA (Q.5=1,2): Q.5b Do you support [INSERT LAST NAME OF PRESIDENTIAL CANDIDATE CHOSEN IN Q.5; DO
NOT READ VP CHOICE] strongly or only moderately? BASED ON REGISTERED VOTERS [N=2,424]: (VOL.) Only Only Other/ Romney Strongly mod DK Obama Strongly mod DK DK/Ref Sep 12-16, 2012 42 24 18 * 51 35 16 * 7 Jul 16-26, 2012 41 51 7 Jun 28-Jul 9, 2012 43 15 28 1 50 32 18 * 6 Jun 7-17, 2012 46 17 27 1 50 30 20 * 5 May 9-Jun 3, 2012 42 49 9 Apr 4-15, 2012 45 49 6 Mar 7-11, 2012 42 54 4 Feb 8-12, 2012 44 52 4 Jan 11-16, 2012 45 50 6 Nov 9-14, 2011 47 49 4 Sep 22-Oct 4, 2011 48 48 4 TREND FOR COMPARISON: BASED ON REGISTERED VOTERS Only Only Other/ McCain Strongly mod DK Obama Strongly mod DK Nader Barr DK/Ref November, 2008 39 21 18 * 50 35 14 1 1 1 9 Late October, 2008 36 20 15 1 52 39 12 1 3 1 8 Mid-October, 2008 38 21 16 1 52 36 16 * n/a n/a 10 Early October, 2008 40 21 18 1 50 36 14 * n/a n/a 10 Late September, 2008 42 23 19 * 49 33 15 1 n/a n/a 9 Mid-September, 20082
August, 2008 43 17 26 * 46 27 19 * n/a n/a 11 44 25 19 * 46 30 15 1 n/a n/a 10
July, 2008 42 17 24 1 47 24 22 1 n/a n/a 11 June, 2008 40 14 26 * 48 28 19 1 n/a n/a 12 Late May, 2008 44 47 n/a n/a 9 April, 2008 44 50 n/a n/a 6 March, 2008 43 49 n/a n/a 8 Late February, 2008 43 50 n/a n/a 7 Only Only Other/ Bush Strongly mod DK Kerry Strongly mod DK Nader DK/Ref November, 2004 45 34 11 * 46 29 16 1 1 8 Mid-October, 2004 45 32 13 * 45 28 16 1 1 9 Early October, 2004 48 35 12 1 41 24 17 * 2 9 September, 2004 49 33 15 1 43 22 20 1 1 7 August, 2004 45 32 13 * 47 28 19 * 2 6 July, 2004 44 46 3 7 June, 2004 46 42 6 6 May, 2004 43 46 6 5 Late March, 2004 44 43 6 7 Mid-March, 2004 42 49 4 5 Two-way trial heats: June, 2004 48 46 n/a 6 May, 2004 45 50 n/a 5
2 After August 2008, June 2004, July 2000, July 1996, June 1992, and June 1988 the question specified vice presidential
candidates.
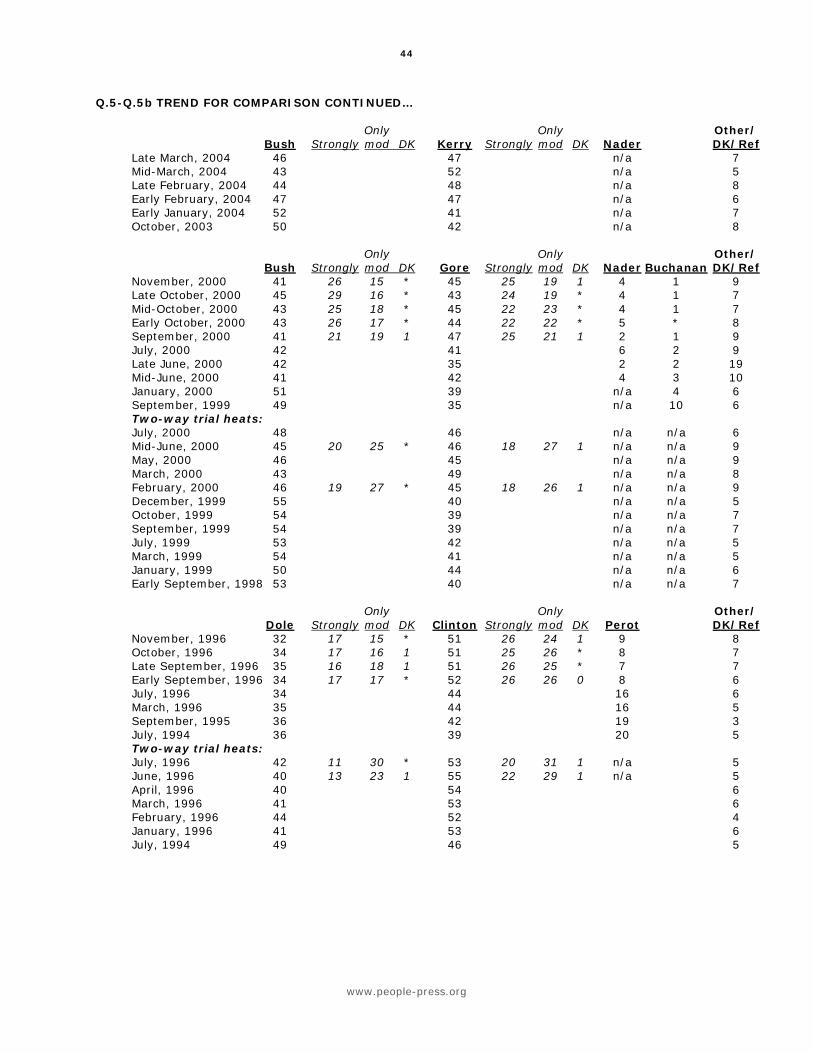
44
www.people-press.org
Q.5-Q.5b TREND FOR COMPARISON CONTINUED… Only Only Other/ Bush Strongly mod DK Kerry Strongly mod DK Nader DK/Ref Late March, 2004 46 47 n/a 7 Mid-March, 2004 43 52 n/a 5 Late February, 2004 44 48 n/a 8 Early February, 2004 47 47 n/a 6 Early January, 2004 52 41 n/a 7 October, 2003 50 42 n/a 8 Only Only Other/ Bush Strongly mod DK Gore Strongly mod DK Nader Buchanan DK/Ref November, 2000 41 26 15 * 45 25 19 1 4 1 9 Late October, 2000 45 29 16 * 43 24 19 * 4 1 7 Mid-October, 2000 43 25 18 * 45 22 23 * 4 1 7 Early October, 2000 43 26 17 * 44 22 22 * 5 * 8 September, 2000 41 21 19 1 47 25 21 1 2 1 9 July, 2000 42 41 6 2 9 Late June, 2000 42 35 2 2 19 Mid-June, 2000 41 42 4 3 10 January, 2000 51 39 n/a 4 6 September, 1999 49 35 n/a 10 6 Two-way trial heats: July, 2000 48 46 n/a n/a 6 Mid-June, 2000 45 20 25 * 46 18 27 1 n/a n/a 9 May, 2000 46 45 n/a n/a 9 March, 2000 43 49 n/a n/a 8 February, 2000 46 19 27 * 45 18 26 1 n/a n/a 9 December, 1999 55 40 n/a n/a 5 October, 1999 54 39 n/a n/a 7 September, 1999 54 39 n/a n/a 7 July, 1999 53 42 n/a n/a 5 March, 1999 54 41 n/a n/a 5 January, 1999 50 44 n/a n/a 6 Early September, 1998 53 40 n/a n/a 7 Only Only Other/ Dole Strongly mod DK Clinton Strongly mod DK Perot DK/Ref November, 1996 32 17 15 * 51 26 24 1 9 8 October, 1996 34 17 16 1 51 25 26 * 8 7 Late September, 1996 35 16 18 1 51 26 25 * 7 7 Early September, 1996 34 17 17 * 52 26 26 0 8 6 July, 1996 34 44 16 6 March, 1996 35 44 16 5 September, 1995 36 42 19 3 July, 1994 36 39 20 5 Two-way trial heats: July, 1996 42 11 30 * 53 20 31 1 n/a 5 June, 1996 40 13 23 1 55 22 29 1 n/a 5 April, 1996 40 54 6 March, 1996 41 53 6 February, 1996 44 52 4 January, 1996 41 53 6 July, 1994 49 46 5

45
www.people-press.org
Q.5-Q.5b TREND FOR COMPARISON CONTINUED… Only Only Other/ Bush Sr. Strongly mod DK Clinton Strongly mod DK Perot DK/Ref Late October, 1992 34 20 14 -- 44 26 18 -- 19 3 Early October, 1992 35 14 21 -- 48 23 25 -- 8 9 June, 1992 31 27 36 6 Two-way trial heats: September, 1992 38 14 21 -- 53 25 28 -- n/a 9 August, 1992 37 14 23 -- 57 24 33 -- n/a 6 June, 1992 46 13 33 -- 41 9 32 -- n/a 13 May, 1992 46 15 31 -- 43 10 33 -- n/a 11 Late March, 1992 50 19 31 -- 43 9 34 -- n/a 7 Only Only Other/ Bush Sr. Strongly mod DK Dukakis Strongly mod DK DK/Ref October, 1988 50 24 26 -- 42 20 22 -- 8 September, 1988 50 26 24 -- 44 19 25 -- 6 May, 1988 40 12 28 -- 53 14 39 -- 7 ASK ALL REGISTERED VOTERS (REG=1): Q.5 If the presidential election were being held TODAY, would you vote [READ AND RANDOMIZE: for
the Democratic ticket of Barack Obama and Joe Biden OR the Republican ticket of Mitt Romney and Paul Ryan]?
ASK IF OTHER OR DK (Q.5=3-9): Q.5a As of TODAY, do you LEAN more to [READ IN SAME ORDER AS Q.5]? ASK IF CHOSE ROMNEY (Q.5=1 OR Q.5a=1): Q.5c Would you say that your choice is more a vote FOR Mitt Romney or more a vote AGAINST Barack
Obama? ASK IF CHOSE OBAMA (Q.5=2 OR Q.5a=2): Q.5d Would you say that your choice is more a vote FOR Barack Obama or more a vote AGAINST Mitt
Romney? BASED ON REGISTERED VOTERS [N=2,424]: Pro- Anti- Pro- Anti- Other/ Romney Romney Obama DK Obama Obama Romney DK DK/Ref Sep 12-16, 2012 42 19 22 1 51 38 11 2 7 Jul 16-26, 2012 41 51 7 Jun 28-Jul 9, 2012 43 50 6 Jun 7-17, 2012 46 50 5 May 9-Jun 3, 2012 42 16 24 2 49 35 11 3 9 Apr 4-15, 2012 45 49 6 Mar 7-11, 2012 42 54 4 Feb 8-12, 2012 44 52 4 Jan 11-16, 2012 45 50 6 Nov 9-14, 2011 47 49 4 Sep 22-Oct 4, 20113
48 15 33 1 48 33 11 3 4
3 Pro- and Anti- percentages for October 2011 may not sum to candidate’s overall percentage, because they were asked only of half-sample.
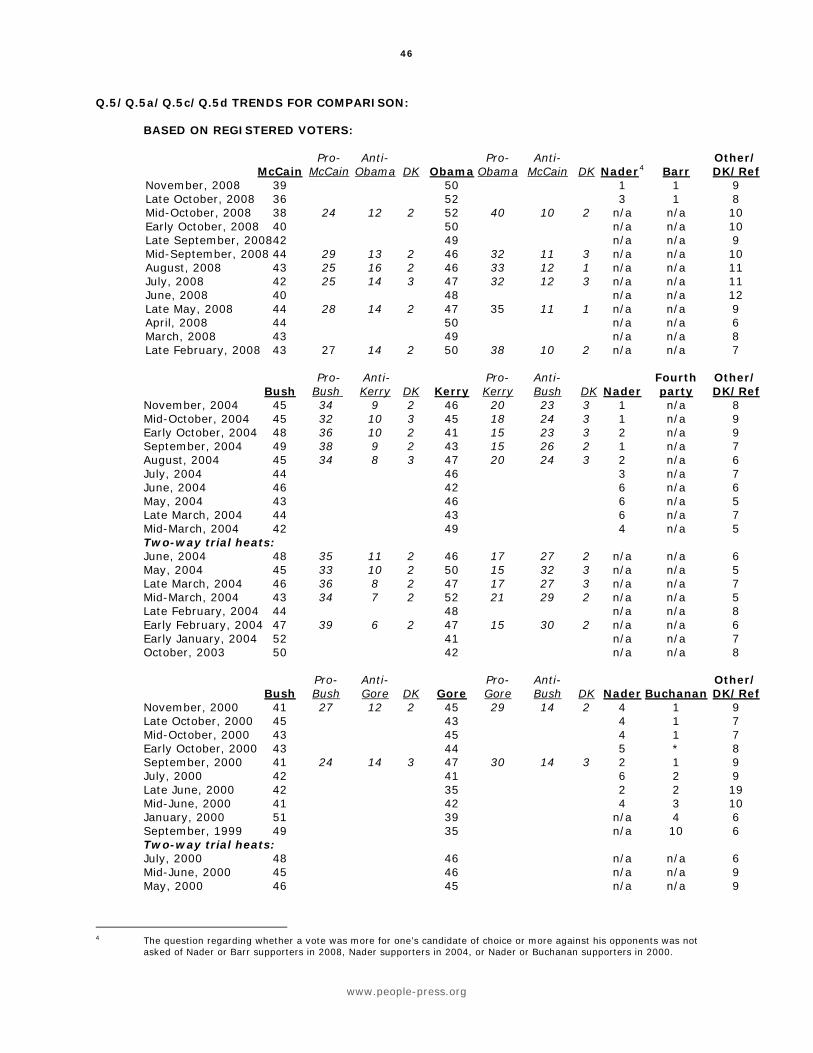
46
www.people-press.org
Q.5/Q.5a/Q.5c/Q.5d TRENDS FOR COMPARISON: BASED ON REGISTERED VOTERS: Pro- Anti- Pro- Anti- Other/ McCain McCain Obama DK Obama Obama McCain DK Nader4
November, 2008 39 50 1 1 9 Barr DK/Ref
Late October, 2008 36 52 3 1 8 Mid-October, 2008 38 24 12 2 52 40 10 2 n/a n/a 10 Early October, 2008 40 50 n/a n/a 10 Late September, 2008 42 49 n/a n/a 9 Mid-September, 2008 44 29 13 2 46 32 11 3 n/a n/a 10 August, 2008 43 25 16 2 46 33 12 1 n/a n/a 11 July, 2008 42 25 14 3 47 32 12 3 n/a n/a 11 June, 2008 40 48 n/a n/a 12 Late May, 2008 44 28 14 2 47 35 11 1 n/a n/a 9 April, 2008 44 50 n/a n/a 6 March, 2008 43 49 n/a n/a 8 Late February, 2008 43 27 14 2 50 38 10 2 n/a n/a 7 Pro- Anti- Pro- Anti- Fourth Other/ Bush Bush Kerry DK Kerry Kerry Bush DK Nader party DK/Ref November, 2004 45 34 9 2 46 20 23 3 1 n/a 8 Mid-October, 2004 45 32 10 3 45 18 24 3 1 n/a 9 Early October, 2004 48 36 10 2 41 15 23 3 2 n/a 9 September, 2004 49 38 9 2 43 15 26 2 1 n/a 7 August, 2004 45 34 8 3 47 20 24 3 2 n/a 6 July, 2004 44 46 3 n/a 7 June, 2004 46 42 6 n/a 6 May, 2004 43 46 6 n/a 5 Late March, 2004 44 43 6 n/a 7 Mid-March, 2004 42 49 4 n/a 5 Two-way trial heats: June, 2004 48 35 11 2 46 17 27 2 n/a n/a 6 May, 2004 45 33 10 2 50 15 32 3 n/a n/a 5 Late March, 2004 46 36 8 2 47 17 27 3 n/a n/a 7 Mid-March, 2004 43 34 7 2 52 21 29 2 n/a n/a 5 Late February, 2004 44 48 n/a n/a 8 Early February, 2004 47 39 6 2 47 15 30 2 n/a n/a 6 Early January, 2004 52 41 n/a n/a 7 October, 2003 50 42 n/a n/a 8 Pro- Anti- Pro- Anti- Other/ Bush Bush Gore DK Gore Gore Bush DK Nader Buchanan DK/Ref November, 2000 41 27 12 2 45 29 14 2 4 1 9 Late October, 2000 45 43 4 1 7 Mid-October, 2000 43 45 4 1 7 Early October, 2000 43 44 5 * 8 September, 2000 41 24 14 3 47 30 14 3 2 1 9 July, 2000 42 41 6 2 9 Late June, 2000 42 35 2 2 19 Mid-June, 2000 41 42 4 3 10 January, 2000 51 39 n/a 4 6 September, 1999 49 35 n/a 10 6 Two-way trial heats: July, 2000 48 46 n/a n/a 6 Mid-June, 2000 45 46 n/a n/a 9 May, 2000 46 45 n/a n/a 9
4 The question regarding whether a vote was more for one’s candidate of choice or more against his opponents was not
asked of Nader or Barr supporters in 2008, Nader supporters in 2004, or Nader or Buchanan supporters in 2000.

47
www.people-press.org
Q.5/Q.5a/Q.5c/Q.5d TRENDS FOR COMPARISON CONTINUED … Pro- Anti- Pro- Anti- Other/ Bush Bush Gore DK Gore Gore Bush DK Nader Buchanan DK/Ref March, 2000 43 49 n/a n/a 8 February, 2000 46 45 n/a n/a 9 December, 1999 55 40 n/a n/a 5 October, 1999 54 39 n/a n/a 7 September, 1999 54 39 n/a n/a 7 July, 1999 53 42 n/a n/a 5 March, 1999 54 41 n/a n/a 5 January, 1999 50 44 n/a n/a 6 September, 1998 53 40 n/a n/a 7 Pro- Anti- Pro- Anti- Pro- Anti- Other/ Dole Dole other DK Clinton Clinton other DK Perot Perot other DK DK/Ref November, 1996 32 15 15 2 51 33 15 3 9 4 5 * 8 October, 1996 34 15 18 1 51 33 16 2 8 4 4 * 7 Late September, 1996 35 51 7 7 Early September, 1996 34 16 17 1 52 35 15 2 8 3 5 0 6 July, 1996 34 44 16 6 March, 1996 35 44 16 5 September, 1995 36 42 19 3 July, 1994 36 39 20 5 Two-way trial heats: July, 1996 42 53 n/a 5 June, 1996 40 55 n/a 5 April, 1996 40 54 n/a 6 March, 1996 41 15 25 1 53 30 20 3 n/a 6 February, 1996 44 52 n/a 4 January, 1996 41 53 n/a 6 July, 1994 49 46 n/a 5 Pro- Anti- Pro- Anti- Pro- Anti- Other/ Bush Sr. Bush other DK Clinton Clinton other DK Perot Perot other DK DK/Ref Late October, 1992 34 19 13 2 44 25 17 2 19 10 7 2 3 Early October, 1992 35 19 13 3 48 23 22 3 8 3 5 * 9 June, 1992 31 27 36 6 Two-way trial heats: September, 1992 38 20 16 2 53 21 29 3 n/a 9 August, 1992 37 20 16 1 57 27 28 2 n/a 6 June, 1992 46 41 n/a 13 May, 1992 46 43 n/a 11 Late March, 1992 50 33 15 2 43 13 28 2 n/a 7 Pro- Anti- Du- Pro- Anti- Third Fourth Other/ Bush Sr. Bush Dukakis DK kakis Dukakis Bush DK party party DK/Ref October, 1988 50 31 16 3 42 23 15 4 n/a n/a 8 September, 1988 50 31 15 4 44 21 19 4 n/a n/a 6 May, 1988 40 26 11 3 53 23 26 4 n/a n/a 7 NO QUESTION 6

48
www.people-press.org
ASK IF DID NOT CHOOSE ROMNEY IN Q.5 OR Q.5a (Q.5=2 OR Q.5a=2,3,8,9): Q.7 Do you think there is a chance that you might vote for Mitt Romney in November, or have you
definitely decided not to vote for him? BASED ON REGISTERED VOTERS [N=2,424]: Chance might Decided not (VOL.) vote for to vote for DK/Ref Romney Sep 12-16, 2012 8 45 5=58% Jun 28-Jul 9, 2012 8 44 4=57% Jun 7-17, 2012 9 42 3=54% Apr 4-15, 2012 10 40 5=55% McCain November, 2008 7 47 7=61% Late October, 2008 7 51 6=64% Mid-October, 2008 9 47 6=62% Early October, 2008 10 45 5=60% Late September, 2008 10 42 6=58% Mid-September, 2008 9 40 7=56% August, 2008 14 37 6=57% July, 2008 13 38 7=58% June, 2008 12 41 7=60% Bush November, 2004 6 44 5=55% Mid-October, 2004 5 43 7=55% Early October, 2004 9 39 4=52% September, 2004 9 38 4=51% August, 2004 10 42 3=55% July, 2004 10 41 5=56% June, 20045
May, 2004 9 42 4=55% 9 41 2=52%
Late March, 2004 11 40 3=54% Mid-March, 2004 11 44 2=57% Late February, 2004 10 43 3=56% Early February, 2004 10 41 2=53% November, 2000 8 44 7=59% Late October, 2000 10 41 4=55% Mid-October, 2000 12 40 5=57% Early October, 2000 11 39 7=57% September, 2000 15 38 6=59% Mid-June, 2000 15 33 6=54% Dole November, 1996 8 54 6=68% October, 1996 11 51 4=66% Late September, 1996 16 44 5=65% Early September, 1996 14 47 5=66% July, 1996 15 40 3=58% Bush Sr. Late October, 1992 11 53 2=66% Early October, 1992 13 46 6=65% September, 1992 12 44 6=62% August, 1992 15 45 4=64% May, 1992 8 40 5=53%
5 In June 2004, May 2004, Late March 2004, Mid-March 2004, Mid-June 2000 and July 1996 the head-to-head match-up
was asked both as a three-way and a two-way trial heat. In those surveys, this question followed the two-way trial heat.

49
www.people-press.org
ASK IF DID NOT CHOOSE OBAMA IN Q.5 OR Q.5a (Q.5=1 OR Q.5a=1,3,8,9): Q.8 Do you think there is a chance that you might vote for Barack Obama in November, or have you
definitely decided not to vote for him? BASED ON REGISTERED VOTERS [N=2,424]: Chance might Decided not (VOL.) vote for to vote for DK/Ref Obama Sep 12-16, 2012 7 39 4=49% Jun 28-Jul 9, 2012 6 41 3=50% Jun 7-17, 2012 6 42 2=50% Apr 4-15, 2012 6 42 3=51% November, 2008 6 38 6=50% Late October, 2008 7 35 6=48% Mid-October, 2008 8 35 5=48% Early October, 2008 7 38 5=50% Late September, 2008 8 37 6=51% Mid-September, 2008 11 38 5=54% August, 2008 12 36 6=54% July, 2008 12 34 7=53% June, 2008 14 32 6=52% Kerry November, 2004 6 43 5=54% Mid-October, 2004 6 42 7=55% Early October, 2004 9 45 5=59% September, 2004 11 42 4=57% August, 2004 11 39 3=53% July, 2004 13 36 5=54% June, 20046
May, 2004 11 35 4=50% 10 41 3=54%
Late March, 2004 13 37 3=53% Mid-March, 2004 13 32 3=48% Late February, 2004 13 36 3=52% Early February, 2004 15 33 5=53% Gore November, 2000 8 41 6=55% Late October, 2000 9 44 4=57% Mid-October, 2000 10 40 5=55% Early October, 2000 11 38 7=56% September, 2000 13 35 5=53% June, 2000 14 34 6=54% Clinton November, 1996 6 37 6=49% October, 1996 10 35 4=49% Late September, 1996 11 35 3=49% Early September, 1996 10 34 4=48% July, 1996 8 36 4=48% Late October, 1992 11 43 2=56% Early October, 1992 14 32 6=52% September, 1992 12 28 6=46% August, 1992 14 26 3=43% May, 1992 11 38 6=55%
6 In June 2004, May 2004, Late March 2004, Mid-March 2004, Mid-June 2000 and July 1996 the head-to-head match-up
was asked both as a three-way and a two-way trial heat. In those surveys, this question followed the two-way trial heat.
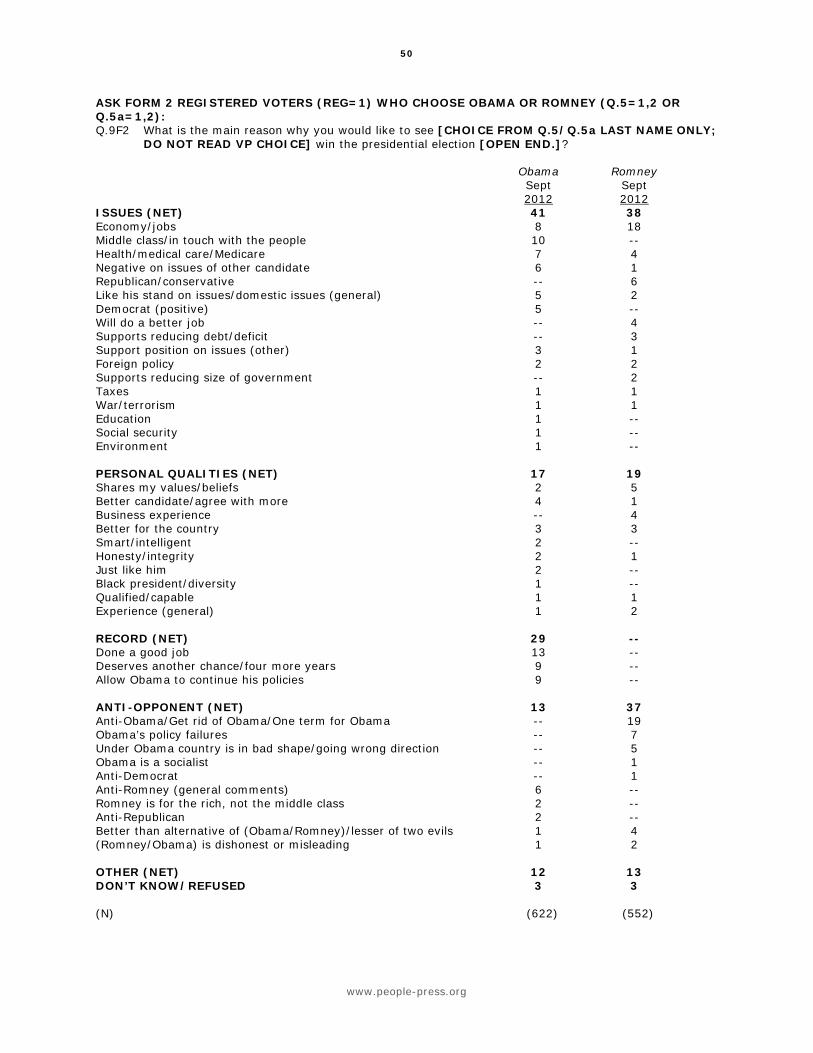
50
www.people-press.org
ASK FORM 2 REGISTERED VOTERS (REG=1) WHO CHOOSE OBAMA OR ROMNEY (Q.5=1,2 OR Q.5a=1,2): Q.9F2 What is the main reason why you would like to see [CHOICE FROM Q.5/Q.5a LAST NAME ONLY;
DO NOT READ VP CHOICE] win the presidential election [OPEN END.]? Obama Romney Sept Sept 2012 2012 ISSUES (NET) 41 38 Economy/jobs 8 18 Middle class/in touch with the people 10 -- Health/medical care/Medicare 7 4 Negative on issues of other candidate 6 1 Republican/conservative -- 6 Like his stand on issues/domestic issues (general) 5 2 Democrat (positive) 5 -- Will do a better job -- 4 Supports reducing debt/deficit -- 3 Support position on issues (other) 3 1 Foreign policy 2 2 Supports reducing size of government -- 2 Taxes 1 1 War/terrorism 1 1 Education 1 -- Social security 1 -- Environment 1 -- PERSONAL QUALITIES (NET) 17 19 Shares my values/beliefs 2 5 Better candidate/agree with more 4 1 Business experience -- 4 Better for the country 3 3 Smart/intelligent 2 -- Honesty/integrity 2 1 Just like him 2 -- Black president/diversity 1 -- Qualified/capable 1 1 Experience (general) 1 2 RECORD (NET) 29 -- Done a good job 13 -- Deserves another chance/four more years 9 -- Allow Obama to continue his policies 9 -- ANTI-OPPONENT (NET) 13 37 Anti-Obama/Get rid of Obama/One term for Obama -- 19 Obama’s policy failures -- 7 Under Obama country is in bad shape/going wrong direction -- 5 Obama is a socialist -- 1 Anti-Democrat -- 1 Anti-Romney (general comments) 6 -- Romney is for the rich, not the middle class 2 -- Anti-Republican 2 -- Better than alternative of (Obama/Romney)/lesser of two evils 1 4 (Romney/Obama) is dishonest or misleading 1 2 OTHER (NET) 12 13 DON’T KNOW/REFUSED 3 3 (N) (622) (552)

51
www.people-press.org
Q.9F2 TRENDS FOR COMPARISON: Obama McCain Sept Sept 2008 2008 ISSUES (NET) 46 46 Iraq/war/military 6 6 Economy/jobs 8 3 Terrorism/security/9-11 -- 4 Like his stand on issues/platform/domestic issues (general) 13 12 Health/medical care/medicare 3 -- Middle class/in touch with the people 5 2 Democrat/liberal (positive) 9 -- Republican/conservative (positive) -- 11 Foreign policy/foreign affairs 2 2 Plan to move forward/will do a better job 7 3 Education 1 -- Negative on issues of other candidate -- 2 Taxes 1 5 Supreme Court appointments -- 1 Abortion/pro-life -- 3 QUALITIES (NET) 16 41 Experience -- 17 Smart/intelligent 3 -- Better man/best candidate 3 3 Honesty/integrity 2 3 Leadership/strong leader/great leader 1 3 Just like him 2 1 Moral/Christian values -- 6 Qualified/capable -- 2 Better for country 1 1 First black president/history/diversity 4 -- Young/age 1 -- Older/age -- 1 Veteran/war hero -- 3 Like Biden/running mate 1 -- Like Palin/running mate -- 6 Shares my beliefs -- 1 Patriotic/patriotism -- 1 ANTI-OPPONENT (NET) 7 13 Anti-Obama (general comments) -- 9 Obama inexperienced/young -- 3 Obama dishonest/misleading -- 1 Anti-McCain 6 -- Anti-Palin 1 -- CHANGE (NET) 38 3 Change (general comments) 26 2 Want Republicans out/Bush did poor job/don’t want repeat of last 8 years 7 -- Country in bad shape/wrong direction 1 -- Anti-Republican 7 -- Anti-Democrat -- 1 OTHER (NET) 9 7 DON’T KNOW/REFUSED 2 3

52
www.people-press.org
Q.9F2 TRENDS FOR COMPARISON CONTINUED… Kerry -- Clinton -- Oct Late Sept July 2004 1996 1996 STANDS ON ISSUES (NET) 59 21 14 Iraq/War/military 18 -- -- Economy/jobs 14 -- -- Like his stand on the issues/platform/domestic issues (general) 8 16 12 Health/medical care/medicare 5 -- -- Middle class/for the little person/in touch with the people 4 -- -- Democrat/liberal (positive) 4 -- -- Foreign policy/foreign affairs 3 -- -- Plan to move forward/will do a better job 3 -- -- Education 3 3 1 Negative on issues of other candidate 2 -- -- Environment 2 -- -- Taxes 2 -- -- Other 7 -- -- NEGATIVE COMMENT ABOUT BUSH, SR/BUSH, JR (NET) 33 27 31 Time for a change/new start 12 -- -- Anti-Bush 10 17 13 Did poor job/made major mistakes/bad president 6 -- -- Dishonest/misleading 3 -- -- Idiot/not smart 2 -- -- Country in bad shape/wrong direction 2 -- -- Other 3 -- -- POSITIVE QUALITIES (NET) 12 16 26
Smart/Intelligent 3 -- -- Best qualified/better man/best candidate 2 3 7 Honesty/Integrity 1 1 * Leadership/strong leader/great leader 1 -- -- Just like him 1 -- -- Moral/Christian values 1 -- -- Capable/qualified 1 -- -- Better for country 1 -- -- Other 1 -- -- RECORD (NET) n/a 31 30 OTHER (NET) 1 3 3 DON’T KNOW/REFUSED 4 6 4

53
www.people-press.org
Q.9F2 TRENDS FOR COMPARISON CONTINUED… Bush Dole Oct Late Sept July 2004 1996 1996 STANDS ON ISSUES (NET) 37 33 22 Terrorism/Security/9-11 10 -- -- Iraq/War/military 7 2 1 Like his stand on the issues/platform/domestic issues 6 18 14 Abortion/Pro-Life 5 4 3 Taxes 4 9 5 Economy/Jobs 3 -- -- Republican/conservative 2 -- -- Foreign policy/foreign affairs 2 -- -- Other 9 -- -- POSITIVE QUALITIES (NET) 33 15 15 Moral/Christian values 12 -- -- Honesty/integrity 5 9 9 Leadership/strong leader/great leader 5 -- -- Keeps promises/man of his word/does what he stands for 3 -- -- Just like him 3 -- -- Best qualified/better man/better candidate 2 -- -- Other 7 -- -- RECORD (NET) 23 n/a n/a
Done a good job/good president/agree with what he is doing 16 -- -- Finish the job/finish the war 3 -- -- He’s been there/done the job/knows what he’s doing 3 -- -- Other 1 -- -- NEGATIVE COMMENT ABOUT KERRY OR CLINTON (NET) 16 47 47 Anti Kerry or Clinton 6 27 22 Wrong time for a change/need continuity 3 -- -- Dishonest/misleading 2 4 6 Other 5 -- -- OTHER (NET) 2 3 -- DON’T KNOW/REFUSED 5 3 -- NO QUESTION 10

54
www.people-press.org
ASK ALL REGISTERED VOTERS (REG=1): Just in general… OFTVOTE How often would you say you vote... [READ] BASED ON REGISTERED VOTERS [N=2,424]:
Always Nearly always
Part of the time Seldom
(VOL.) Never vote
(VOL.) Other
(VOL.) DK/Ref
Sep 12-16, 2012 64 22 7 4 2 1 * Jun 7-17, 2012 64 24 6 4 1 * * Apr 4-15, 2012 57 29 8 4 1 * * Jan 4-8, 2012 60 24 8 6 1 1 * Feb 22-Mar 14, 2011 62 24 8 4 1 * * Oct 27-30, 2010 58 24 11 5 2 1 * Oct 13-18, 2010 57 27 10 4 2 1 * Aug 25-Sep 6, 2010 59 26 9 4 1 * * June 16-20, 2010 52 31 11 5 1 1 1 Mar 31-Apr 6, 2009 62 23 7 5 1 1 1 November, 2008 60 23 8 5 2 2 * Late October, 2008 57 26 8 5 3 1 * Mid-October, 2008 57 27 7 5 3 1 * Early October, 2008 53 27 9 6 3 1 1 Late September, 2008 55 27 9 6 2 1 * Mid-September, 2008 54 28 10 5 2 1 * August, 2008 55 29 9 4 2 1 * July, 2008 53 30 10 4 1 1 1 January, 2007 58 29 9 3 1 * * November, 2006 58 26 8 5 2 1 * Late October, 2006 58 27 9 4 1 1 * Early October, 2006 47 36 10 3 2 1 1 September, 2006 56 28 9 6 1 * * May, 2006 60 26 8 4 1 * 1 December, 2005 60 24 9 4 2 1 1 December, 2004 64 22 8 4 1 * 1 November, 2004 62 21 7 6 3 1 * Mid-October, 2004 63 22 7 5 2 1 * Early October, 2004 58 25 9 4 2 1 1 September, 2004 58 27 9 5 2 1 1 August, 2004 56 28 9 5 2 * 1 July, 2004 54 31 9 4 1 * * June, 2004 57 29 7 5 1 1 1 May, 2004 56 27 10 4 2 1 1 April, 2004 55 29 9 5 1 1 1 Late March, 2004 50 31 11 6 1 * 1 Mid-March, 2004 55 30 9 5 1 * * February, 2004 55 29 12 3 * * * January, 2004 54 30 10 4 2 1 * August, 2003 53 30 10 5 1 * * June, 2003 48 36 11 3 1 * 0 Early November, 2002 52 30 11 6 1 0 1 Early October, 2002 50 33 11 4 * 1 1 Early September, 2002 59 25 11 4 1 * * August, 2002 53 32 10 4 1 * * May, 2002 53 31 9 5 1 * 1

55
www.people-press.org
OFTVOTE CONTINUED… Always
Nearly always
Part of the time Seldom
(VOL.) Never vote
(VOL.) Other
(VOL.) DK/Ref
Early November, 2000 57 26 8 6 2 1 * Late October, 2000 52 30 9 6 1 2 0 Mid-October, 2000 54 27 10 6 * 3 * Early October, 2000 51 29 10 6 3 1 * September, 2000 61 21 9 7 2 * * July, 2000 48 30 13 6 2 1 * June, 2000 58 26 10 4 1 1 * May, 2000 52 29 12 6 1 1 * April, 2000 50 30 12 6 2 1 * March, 2000 49 34 12 4 1 1 0 February, 2000 53 32 10 4 1 0 * January, 2000 50 34 12 4 1 * * October, 1999 39 47 9 2 1 * * Late September, 1999 40 47 9 3 1 * * Late October, 1998 56 28 10 5 1 * * Early October, 1998 50 32 11 5 1 1 * Early September, 1998 53 33 9 4 - 1 * Late August, 1998 48 35 13 4 * 0 * June, 1998 49 33 12 5 - 1 0 May, 1998 52 29 12 6 1 1 * November, 1997 42 44 10 3 1 * * October, 1997 62 26 8 3 1 * * June, 1997 54 30 10 4 1 * * November, 1996 55 28 8 6 2 1 * October, 1996 52 30 9 5 2 2 * Late September, 1996 52 31 10 4 2 1 * Early September, 1996 53 29 12 4 1 * * July, 1996 52 33 8 5 1 1 * June, 1996 52 33 9 4 1 1 * Late April, 1996 44 37 11 5 1 1 1 Early April, 1996 49 35 10 5 1 * * February, 1996 42 41 11 4 1 1 * October, 1995 53 35 7 4 1 * * April, 1995 53 34 9 4 * * * November, 1994 58 28 8 5 * 1 0 Late October, 1994 55 32 10 3 * * * July, 1994 52 34 10 4 * * * May, 1993 57 31 7 4 1 1 * Early October, 1992 54 33 8 4 * 1 * September, 1992 52 33 8 5 1 1 * June, 1992 60 29 7 3 1 * * May, 1992 50 35 10 4 1 * * Early May, 1992 49 35 10 4 1 * * March, 1992 47 36 11 6 * * * February, 1992 50 36 9 4 * -- 2 7January 1992 (GP)8 40 35 11 11 4 -- * November, 1991 46 41 9 4 * * * May, 1990 42 42 11 4 1 * *
7 Trends for January 1992 and January 1989 are based on general public.

56
www.people-press.org
OFTVOTE CONTINUED… Always
Nearly always
Part of the time Seldom
(VOL.) Never vote
(VOL.) Other
(VOL.) DK/Ref
January, 1989 (GP) 45 30 10 8 6 1 * Gallup: November, 1988 57 26 10 4 2 1 * October, 1988 51 37 8 3 1 * * May, 1988 43 41 11 3 2 1 * January, 1988 49 39 9 2 1 * * September, 1988 51 40 6 2 * 1 * May, 1987 43 43 9 3 1 1 *
ASK ALL REGISTERED VOTERS (REG=1): WHERE Do you happen to know where people in your area go to vote? [INTERVIEWER
INSTRUCTION: IF R EXPLAINS VOTING PROCEDURES OR SAYS WHERE SPECIFICALLY THEY GO TO VOTE CODE AS ‘YES’ (1). IF R EXPLAINS A ‘NO’ OR ‘DK’ ANSWER WITH WORDS FROM 3 OR 4, CODE AS 3 OR 4.]
BASED ON REGISTERED VOTERS [N=2,424]: (VOL.) (VOL.) Vote early at a Vote absentee or central polling place (VOL.) Yes No by mail or election office DK/Ref Sep 12-16, 2012 86 10 3 0 1 Oct 27-30, 20109
88 9 2 -- 1
Yes No/DK/Ref November, 2008 85 15 Late October, 2008 83 17 November, 2006 84 16 Late October, 2006 86 14 Early October, 2006 88 12 November, 2004 85 15 November, 2002 88 12 November, 2000 84 16 Late October, 1998 90 10 Early October, 1998 87 13 November, 1996 88 12 October, 1996 85 15 November, 1994 93 7 November, 1988 (Gallup) 89 11 October, 1988 (Gallup) 86 14
9 In October, 2010 half the sample was asked about “people in your neighborhood,” the other half was asked about “people
in your area.” No significant differences were found; combined data is shown here. For November 2008 and earlier, question asked about “people in your neighborhood.”

57
www.people-press.org
ASK ALL: PLANTO1 Do you yourself plan to vote in the election this November? ASK IF PLAN TO VOTE (PLANTO1=1): PLANTO2 How certain are you that you will vote? Are you absolutely certain, fairly certain, or
not certain? BASED ON REGISTERED VOTERS [N=2,424]: Yes, plan Absolutely Fairly Not No, don’t (VOL.) 2012 Election to vote certain certain certain10
Sep 12-16, 2012 97 89 7 1 2 1 plan to DK/Ref
Jun 7-17, 2012 97 86 10 * 2 1 2010 Election Aug 25-Sep 6, 2010 94 -- -- -- 4 3 Jul 21-Aug 5, 201011
Jun 16-20, 2010 90 69 19 2 8 2 91 70 17 3 7 2
Mar 11-21, 2010 91 69 20 2 6 3 2008 Election Mid-October, 200812
Early October, 2008 97 92 4 1 2 1 97 92 5 * 2 1
Late September, 2008 97 91 6 * 2 1 Mid-September, 2008 97 90 6 1 2 1 August, 2008 97 -- -- -- 2 1 July, 2008 97 -- -- -- 2 1 June, 2008 95 85 8 2 2 3 2006 Election November, 2006 90 -- -- -- 8 2 Late October, 2006 94 -- -- -- 3 3 Early October, 2006 93 75 17 1 4 3 Early September, 2006 92 -- -- -- 5 3 2004 Election November, 2004 97 -- -- -- 2 1 Mid-October, 2004 98 -- -- -- 1 1 Early October, 2004 98 91 6 1 1 1 September, 2004 98 91 6 1 1 1 August, 2004 98 89 8 1 2 * June, 2004 96 85 10 1 2 2 2002 Election Early November, 2002 90 -- -- -- 8 2 Early October, 2002 95 -- -- -- 3 2 2000 Election Early November, 2000 96 -- -- -- 3 1 Late October, 2000 97 -- -- -- 2 1 Mid-October, 2000 96 -- -- -- 2 2 Early October, 2000 97 87 9 1 2 1 September, 2000 95 84 10 1 3 2 June, 2000 95 84 10 1 2 3 1998 Election Late October, 1998 91 -- -- -- 6 3 Early October, 1998 92 -- -- -- 4 4 Early September, 1998 95 -- -- -- 2 3 Late August, 1998 93 75 17 1 3 4 June, 1998 95 74 19 2 3 2
1996 Election November, 1996 96 -- -- -- 2 2
10 Don’t know responses to PLANTO2 not shown. 11 From March 11-21, 2010 to July 21-August 5, 2010, question asked “Thinking ahead to November, do you yourself plan to
vote in the Congressional election this November, or not?” 12 In Mid-October 2008 and from Mid-October 2004 to November 2006 and in Early November 2002, the “Yes, Plan to vote”
category also includes people who volunteered that they already voted. In November 2006, Early November 2002, Early November, 2000, Late October 1998, November 1996 and November 1994 the question was worded: “Do you yourself plan to vote in the election this Tuesday, or not?”

58
www.people-press.org
PLANTO1/PLANTO2 CONTINUED… Yes, plan Absolutely Fairly Not No, don’t (VOL.) to vote certain certain certain plan to DK/Ref October, 1996 98 87 10 1 1 1 Late September, 1996 98 89 8 1 1 1 Early September, 1996 96 83 11 2 2 2 July, 1996 95 82 12 1 3 2 June, 1996 96 84 11 1 2 2 1994 Election November, 1994 93 -- -- -- 5 2 October, 1994 95 -- -- -- 3 2 1992 Election October, 1992 98 91 6 1 1 1 September, 1992 98 85 11 2 1 1 August, 1992 97 89 8 * 1 2 June, 1992 97 88 8 1 1 2 1988 Election Gallup: November, 1988 97 87 9 1 2 1 October, 1988 98 -- -- -- 1 1 Q.11 HELD FOR FUTURE RELEASE NO QUESTIONS 12-14 ASK ALL FORM 2 REGISTERED VOTERS (REG=1): Q.15F2 Regardless of who you might support, who do you think is most likely to win the presidential
election? [READ AND RANDOMIZE]? BASED ON FORM 2 REGISTERED VOTERS [N=1,263]: (VOL.) Republican Democrat Other/DK 2012 Election Sep 12-16, 2012 24 Romney 53 Obama 23 Jun 7-17, 2012 34 Romney 52 Obama 15 Mar 7-11, 201213
2008 Election 32 Romney 59 Obama 9
Mid-October, 2008 17 McCain 61 Obama 22 Mid-September, 2008 39 McCain 39 Obama 22 June, 2008 27 McCain 53 Obama 20 April, 200814
March, 2008 38 McCain 50 Obama 12 42 McCain 47 Obama 11
2004 Election November, 2004 48 Bush 27 Kerry 25 Mid-October, 2004 54 Bush 27 Kerry 19 Early October, 2004 61 Bush 27 Kerry 12 September, 2004 60 Bush 22 Kerry 18 August, 2004 44 Bush 37 Kerry 19 July, 2004 42 Bush 38 Kerry 20 June, 2004 51 Bush 35 Kerry 14 May, 2004 52 Bush 31 Kerry 17 Early February, 2004 56 Bush 32 Dem Candidate 12 Mid-January, 2004 61 Bush 21 Dem Candidate 18 September, 2003 47 Bush 34 Dem Candidate 19 June, 2003 66 Bush 22 Dem Candidate 12
13 In March 2012, this question was asked both about Mitt Romney/Barack Obama and Rick Santorum/ Barack Obama, and
read: “Regardless of who you might support, who do you think is most likely to win the presidential election if it is between…”
14 In March and April 2008, this question was asked both about John McCain/Barack Obama and John McCain/Hillary Clinton, and read: “Regardless of who you might support, who do you think is most likely to win the presidential election if it is between…”

59
www.people-press.org
Q.15F2 CONTINUED… Republican Democrat 2000 Election November, 2000 43 Bush 32 Gore 25 Late October, 2000 48 Bush 38 Gore 14 Early October, 2000 33 Bush 46 Gore 21 June, 2000 51 Bush 33 Gore 16 October, 1999 70 Bush 23 Gore 7 1996 Election Late September, 199615
Early September, 1996 16 Dole 75 Clinton 9 12 Dole 79 Clinton 9
July, 1996 19 Dole 72 Clinton 9 1992 Election October, 1992 30 Bush, Sr. 61 Clinton 9 March, 1992 72 Bush, Sr. 20 Dem Candidate 8 February, 1992 66 Bush, Sr. 25 Dem Candidate 9 October, 1991 78 Bush, Sr. 11 Dem Candidate 11 ASK FORM 1 ONLY: Q.16F1 As far as making progress on the important issues facing the country is concerned, does it really
matter who wins the 2012 presidential election, or will things be pretty much the same regardless of who is elected president?
BASED ON FORM 1 REGISTERED VOTERS [N=1,161]: Mid Sep 12-16 Jun 7-17 Oct Mid-Sep Jun Jun Mar Jun Aug 2012 2012 2008 2008 2008 2004 2004 2000 197616
Really matters who wins
76 the 2012 presidential election 63 72 70 63 67 70 50 45 Things will pretty much be 20 the same regardless 34 24 24 32 29 26 44 46 4 Don’t know/Refused (VOL.) 3 4 6 5 4 4 6 9 Q.17 HELD FOR FUTURE RELEASE NO QUESTIONS 18-20
15 In 1996 and October 1992, the question also asked about Ross Perot. Results here are included in the “Other/DK”
category. 16 August 1976 question asked by Opinion Research Corporation, based on general public.
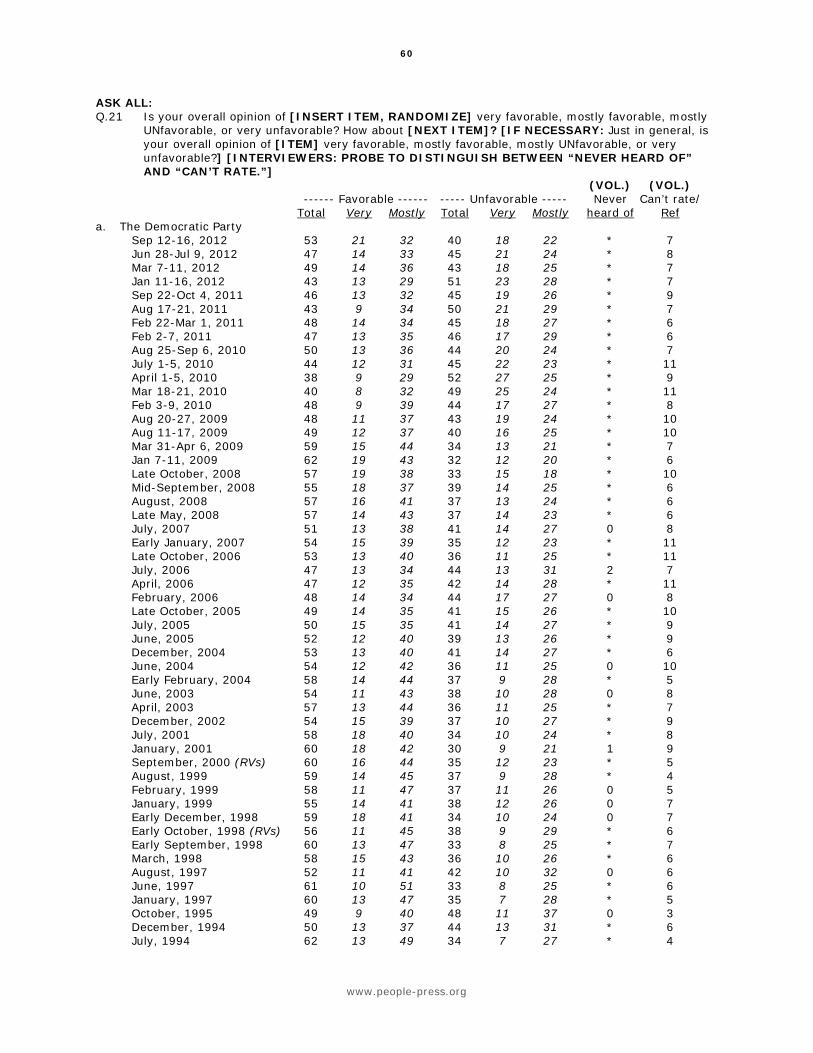
60
www.people-press.org
ASK ALL: Q.21 Is your overall opinion of [INSERT ITEM, RANDOMIZE] very favorable, mostly favorable, mostly
UNfavorable, or very unfavorable? How about [NEXT ITEM]? [IF NECESSARY: Just in general, is your overall opinion of [ITEM] very favorable, mostly favorable, mostly UNfavorable, or very unfavorable?] [INTERVIEWERS: PROBE TO DISTINGUISH BETWEEN “NEVER HEARD OF” AND “CAN’T RATE.”]
(VOL.) (VOL.) ------ Favorable ------ ----- Unfavorable ----- Never Can’t rate/ Total Very Mostly Total Very Mostly heard of Ref a. The Democratic Party Sep 12-16, 2012 53 21 32 40 18 22 * 7 Jun 28-Jul 9, 2012 47 14 33 45 21 24 * 8 Mar 7-11, 2012 49 14 36 43 18 25 * 7 Jan 11-16, 2012 43 13 29 51 23 28 * 7 Sep 22-Oct 4, 2011 46 13 32 45 19 26 * 9 Aug 17-21, 2011 43 9 34 50 21 29 * 7 Feb 22-Mar 1, 2011 48 14 34 45 18 27 * 6 Feb 2-7, 2011 47 13 35 46 17 29 * 6 Aug 25-Sep 6, 2010 50 13 36 44 20 24 * 7 July 1-5, 2010 44 12 31 45 22 23 * 11 April 1-5, 2010 38 9 29 52 27 25 * 9 Mar 18-21, 2010 40 8 32 49 25 24 * 11 Feb 3-9, 2010 48 9 39 44 17 27 * 8 Aug 20-27, 2009 48 11 37 43 19 24 * 10 Aug 11-17, 2009 49 12 37 40 16 25 * 10 Mar 31-Apr 6, 2009 59 15 44 34 13 21 * 7 Jan 7-11, 2009 62 19 43 32 12 20 * 6 Late October, 2008 57 19 38 33 15 18 * 10 Mid-September, 2008 55 18 37 39 14 25 * 6 August, 2008 57 16 41 37 13 24 * 6 Late May, 2008 57 14 43 37 14 23 * 6 July, 2007 51 13 38 41 14 27 0 8 Early January, 2007 54 15 39 35 12 23 * 11 Late October, 2006 53 13 40 36 11 25 * 11 July, 2006 47 13 34 44 13 31 2 7 April, 2006 47 12 35 42 14 28 * 11 February, 2006 48 14 34 44 17 27 0 8 Late October, 2005 49 14 35 41 15 26 * 10 July, 2005 50 15 35 41 14 27 * 9 June, 2005 52 12 40 39 13 26 * 9 December, 2004 53 13 40 41 14 27 * 6 June, 2004 54 12 42 36 11 25 0 10 Early February, 2004 58 14 44 37 9 28 * 5 June, 2003 54 11 43 38 10 28 0 8 April, 2003 57 13 44 36 11 25 * 7 December, 2002 54 15 39 37 10 27 * 9 July, 2001 58 18 40 34 10 24 * 8 January, 2001 60 18 42 30 9 21 1 9 September, 2000 (RVs) 60 16 44 35 12 23 * 5 August, 1999 59 14 45 37 9 28 * 4 February, 1999 58 11 47 37 11 26 0 5 January, 1999 55 14 41 38 12 26 0 7 Early December, 1998 59 18 41 34 10 24 0 7 Early October, 1998 (RVs) 56 11 45 38 9 29 * 6 Early September, 1998 60 13 47 33 8 25 * 7 March, 1998 58 15 43 36 10 26 * 6 August, 1997 52 11 41 42 10 32 0 6 June, 1997 61 10 51 33 8 25 * 6 January, 1997 60 13 47 35 7 28 * 5 October, 1995 49 9 40 48 11 37 0 3 December, 1994 50 13 37 44 13 31 * 6 July, 1994 62 13 49 34 7 27 * 4

61
www.people-press.org
Q.21 CONTINUED… (VOL.) (VOL.) ------ Favorable ------ ----- Unfavorable ----- Never Can’t rate/ Total Very Mostly Total Very Mostly heard of Ref May, 1993 57 14 43 34 9 25 0 9 July, 1992 61 17 44 33 9 24 * 6 b. The Republican Party Sep 12-16, 2012 42 12 30 50 25 26 * 8 Jun 28-Jul 9, 2012 36 9 27 56 28 28 * 8 Mar 7-11, 2012 36 7 30 56 27 29 * 8 Jan 11-16, 2012 35 7 27 58 28 30 * 7 Sep 22-Oct 4, 2011 36 7 29 55 27 28 * 9 Aug 17-21, 2011 34 5 29 59 27 32 * 7 Feb 22-Mar 1, 2011 42 9 32 51 22 28 1 7 Feb 2-7, 2011 43 8 35 48 19 29 * 9 Aug 25-Sep 6, 2010 43 8 35 49 21 28 * 8 July 1-5, 2010 39 10 29 49 24 25 * 12 April 1-5, 2010 37 8 29 53 26 27 * 9 Mar 18-21, 2010 37 5 32 51 20 31 * 12 Feb 3-9, 2010 46 5 41 46 14 32 0 8 Aug 20-27, 2009 40 6 34 50 19 31 * 10 Aug 11-17, 2009 40 7 33 50 18 32 * 10 Mar 31-Apr 6, 2009 40 7 33 51 17 34 0 9 Jan 7-11, 2009 40 5 35 55 21 34 * 5 Late October, 2008 40 10 30 50 23 27 * 10 Mid-September, 2008 47 11 36 46 22 24 * 7 August, 2008 43 9 34 49 18 31 1 7 Late May, 2008 39 7 32 53 20 33 * 8 July, 2007 39 7 32 53 22 31 0 8 Early January, 2007 41 9 32 48 21 27 1 10 Late October, 2006 41 9 32 50 20 30 * 9 July, 2006 40 10 30 52 23 29 1 7 April, 2006 40 10 30 50 21 29 * 10 February, 2006 44 11 33 50 24 26 * 6 Late October, 2005 42 12 30 49 24 25 * 9 July, 2005 48 13 35 43 18 25 * 9 June, 2005 48 11 37 44 20 24 0 8 December, 2004 52 15 37 42 17 25 0 6 June, 2004 51 12 39 40 14 26 0 9 Early February, 2004 52 14 38 42 16 26 * 6 June, 2003 58 14 44 33 10 23 0 9 April, 2003 63 14 49 31 10 21 * 6 December, 2002 59 18 41 33 11 22 * 8 July, 2001 48 11 37 42 15 27 * 10 January, 2001 56 13 43 35 13 22 * 9 September, 2000 (RVs) 53 11 42 40 12 28 0 7 August, 1999 53 8 45 43 12 31 * 4 February, 1999 44 7 37 51 15 36 0 5 January, 1999 44 10 34 50 23 27 0 6 Early December, 1998 46 11 35 47 20 27 * 7 Early October, 1998 (RVs) 52 9 43 42 14 28 0 6 Early September, 1998 56 9 47 37 11 26 * 7 March, 1998 50 10 40 43 12 31 * 7 August, 1997 47 9 38 47 11 36 * 6 June, 1997 51 8 43 42 11 31 1 6 January, 1997 52 8 44 43 10 33 * 5 October, 1995 52 10 42 44 16 28 * 4 December, 1994 67 21 46 27 8 19 * 6 July, 1994 63 12 51 33 8 25 * 4 May, 1993 54 12 42 35 10 25 0 11

62
www.people-press.org
Q.21 CONTINUED… (VOL.) (VOL.) ------ Favorable ------ ----- Unfavorable ----- Never Can’t rate/ Total Very Mostly Total Very Mostly heard of Ref July, 1992 46 9 37 48 17 31 * 6 ASK ALL: Q.22 Is your overall opinion of [INSERT NAME, RANDOMIZE a-b, FOLLOWED BY cF1-fF2,
FOLLOWED BY gF2-hF2; OBSERVE FORM SPLITS] very favorable, mostly favorable, mostly UNfavorable, or very unfavorable? How about [NEXT NAME]? [IF NECESSARY: Just in general, is your overall opinion of [NAME] very favorable, mostly favorable, mostly UNfavorable, or very unfavorable?] [INTERVIEWERS: PROBE TO DISTINGUISH BETWEEN “NEVER HEARD OF” AND “CAN’T RATE.”]
(VOL.) (VOL.) -------Favorable------- ------Unfavorable------ Never Can’t Total Very Mostly Total Very Mostly heard of rate/Ref a. Barack Obama Sep 12-16, 2012 57 27 30 40 23 17 * 4 Jul 16-26, 2012 51 24 26 42 27 15 0 8 Jun 7-17, 2012 53 20 33 44 22 21 0 4 Mar 7-11, 2012 56 24 32 41 25 16 * 3 Feb 8-12, 2012 54 22 32 42 26 16 * 5 Jan 11-16, 2012 51 23 28 45 24 21 0 4 Nov 9-14, 2011 52 21 31 45 24 21 * 3 Mar 8-14, 2011 58 22 36 39 20 19 * 3 Dec 2-5, 2010 54 26 29 43 25 18 * 2 Aug 25-Sep 6, 2010 53 21 32 43 23 20 * 5 Jun 10-13, 2010 56 27 30 39 20 19 0 4 Oct 28-Nov 30, 2009 65 33 32 30 16 14 * 5 Jun 10-14, 2009 72 37 35 25 11 14 * 3 Apr 14-21, 2009 73 38 35 24 10 14 * 3 Jan 7-11, 2009 79 40 39 15 4 11 0 6 Mid-October, 2008 66 33 33 28 13 15 * 6 Late September, 2008 65 33 32 30 11 19 * 5 Mid-September, 2008 62 28 34 34 15 19 * 4 Late May, 2008 51 23 28 40 21 19 * 9 April, 2008 52 21 31 42 21 21 * 6 March, 2008 56 21 35 34 18 16 1 9 Late February, 2008 57 24 33 34 16 18 1 8 Early February, 2008 58 19 39 30 13 17 2 10 January, 2008 56 20 36 33 13 20 3 8 Late December, 2007 54 16 38 30 12 18 5 11 August, 2007 48 14 34 26 10 16 13 13 b. Mitt Romney Sep 12-16, 2012 40 12 28 53 27 26 1 7 Jul 16-26, 2012 34 11 23 50 26 24 3 13 Jun 7-17, 2012 38 7 31 47 21 25 3 12 Mar 7-11, 2012 29 6 23 51 21 30 5 15 Feb 8-12, 2012 32 7 25 49 20 29 6 13 Jan 11-16, 2012 31 7 24 45 17 27 9 14 Nov 9-14, 2011 36 7 29 42 16 26 9 12 Oct 28-Nov 30, 2009 35 11 25 21 9 13 25 18 Jun 10-14, 2009 40 9 31 28 8 20 19 13 Early February, 2008 30 6 24 44 15 29 8 18 January, 2008 31 7 24 43 13 30 8 18 Late December, 2007 29 4 25 35 11 24 17 19 August, 2007 28 5 23 24 7 17 29 19 ASK ITEMS c-d OF FORM 1 ONLY [N=1,455]:

63
www.people-press.org
Q.22 CONTINUED… (VOL.) (VOL.) -------Favorable------- ------Unfavorable------ Never Can’t Total Very Mostly Total Very Mostly heard of rate/Ref c.F1 Joe Biden Sep 12-16, 2012 41 15 26 43 22 21 4 11 Jun 7-17, 2012 40 10 30 37 18 19 6 17 Jan 11-16, 2012 38 10 28 41 18 22 9 12 Oct 28-Nov 30, 2009 50 13 36 29 13 16 8 13 Mid-Apr 2009 51 14 37 28 10 18 8 13 Jan 2009 63 22 41 20 7 13 6 11 Mid-October, 2008 55 20 34 35 10 19 6 10 Early October, 2008 (callback) 61 20 41 30 10 20 1 8 Late September, 2008 49 15 34 30 10 20 8 13 Mid-September, 2008 48 14 34 30 11 19 8 14 April, 2006 28 7 21 20 5 15 38 14 Late October, 2005 21 4 17 20 6 14 43 16 September, 1987 22 4 18 15 4 11 25 38 d.F1 Paul Ryan Sep 12-16, 2012 35 15 20 44 23 21 8 13 ASK ITEMS e-h OF FORM 2 ONLY [N=1,564]: e.F2 Michelle Obama Sep 12-16, 2012 67 39 28 22 11 11 * 10 Jun 7-17, 2012 68 33 35 21 11 10 1 10 Jan 11-16, 2012 66 33 34 21 10 12 * 12 Mar 8-14, 2011 69 30 39 21 9 12 1 9 Dec 2-5, 2010 62 30 31 27 15 12 1 10 Jun 10-13, 2010 69 31 38 22 9 12 1 9 Oct 28-Nov 30, 2009 71 33 38 16 8 8 1 11 Jun 10-14, 2009 76 36 39 14 5 9 1 9 Apr 14-21, 2009 76 36 40 13 4 9 1 10 Jan 7-11, 2009 68 28 40 15 4 11 2 15 Mid-September, 2008 56 23 33 25 11 14 2 17 Late May, 2008 43 14 29 21 8 13 4 32 f.F2 Ann Romney Sep 12-16, 2012 40 16 24 28 12 16 7 25 Jun 7-17, 201217
29 9 19 17 7 9 14 41
g.F2 Bill Clinton Sep 12-16, 2012 68 34 34 26 11 15 * 5 Mar 8-14, 2011 67 27 40 29 10 18 1 3 February, 2008 52 20 32 42 22 20 * 6 Late December, 2007 54 22 32 40 20 20 0 6 December, 2006 63 29 34 33 16 17 1 3 April, 2006 61 27 34 36 18 18 0 3 Late October, 2005 62 26 36 34 18 16 * 4 Late March, 2005 64 24 40 32 13 19 0 4 December, 2002 46 17 29 49 27 22 * 5 July, 2001 50 20 30 46 27 19 0 4 January, 2001 64 23 41 34 17 17 0 2 May, 2000 48 17 31 47 28 19 * 5 March, 1999 55 21 34 42 23 19 * 3 December, 1998 55 23 32 43 24 19 0 2 Early October, 1998 (RVs) 52 15 37 44 24 20 0 4 Early September, 1998 57 18 39 41 23 18 0 2 Late August, 1998 54 18 36 44 24 20 0 2 March, 1998 62 22 40 35 16 19 * 3
17 June 7-17, 2012 survey asked about “Mitt Romney’s wife, Ann Romney.”

64
www.people-press.org
Q.22 CONTINUED… (VOL.) (VOL.) -------Favorable------- ------Unfavorable------ Never Can’t Total Very Mostly Total Very Mostly heard of rate/Ref November, 1997 63 19 44 35 14 21 0 2 October, 1997 62 15 47 36 16 20 * 2 September, 1997 62 18 44 35 14 21 0 3 August, 1997 61 16 45 38 17 21 0 1 April, 1997 61 17 44 37 16 21 * 2 January, 1997 66 17 49 32 14 18 * 2 October, 1996 (RVs) 57 12 45 41 19 22 0 2 June, 1996 61 16 45 37 14 23 * 2 April, 1996 57 16 41 40 16 24 0 3 February, 1996 55 20 35 43 21 22 0 2 January, 1996 56 13 43 42 15 27 0 2 August, 1995 49 13 36 49 20 29 0 2 February, 1995 55 14 41 42 17 25 0 3 December, 1994 51 17 34 46 22 24 0 3 July, 1994 58 15 43 41 16 25 * 1 May, 1993 60 18 42 35 12 23 0 5 July, 1992 59 17 42 34 9 25 0 7 June, 1992 46 10 36 47 14 33 1 6 May, 1992 53 11 42 42 10 32 * 5 March, 1992 53 10 43 40 11 29 1 6 February, 1992 59 15 44 31 7 24 2 8 January, 1992 37 9 28 15 4 11 27 21 November, 1991 30 5 25 10 2 8 39 21 h.F2 George W. Bush Sep 12-16, 2012 41 14 27 53 29 24 * 6 Mar 8-14, 2011 42 12 31 54 27 27 * 4 Aug 25-Sep 6, 2010 37 10 27 57 34 24 * 6 Mid-April, 2009 35 9 26 60 33 27 * 5 January, 2009 37 9 28 60 35 25 0 3 April, 2008 31 9 22 65 42 23 * 4 March, 2008 34 8 26 61 37 24 0 5 Late February, 2008 35 10 25 60 39 21 0 5 Early February, 2008 34 9 25 61 39 22 * 5 January, 2008 36 11 25 60 37 23 0 4 Late December, 2007 33 10 23 63 41 22 0 4 August, 2007 40 12 28 57 34 23 * 3 December, 2006 39 12 27 57 34 23 * 4 April, 2006 40 15 25 57 35 22 * 3 Late October, 2005 46 17 29 51 29 22 * 3 July, 2005 51 22 29 46 25 21 0 3 Late March, 2005 53 23 30 45 27 18 0 2 Mid-October, 2004 (RVs) 56 26 30 42 23 19 * 2 Early October, 2004 (RVs) 57 27 30 40 20 20 0 3 September, 2004 52 25 27 43 24 19 * 5 August, 2004 58 27 31 39 22 17 0 3 June, 2004 52 19 33 45 22 23 * 3 Early February, 2004 53 21 32 44 25 19 0 3 Gallup: Jan 29-Feb 1, 2004 52 -- -- 47 -- -- -- 1 Gallup: Jan 2-5, 2004 65 -- -- 35 -- -- -- * Gallup: Oct 6-8, 2003 60 -- -- 39 -- -- -- 1 Gallup: Jun 9-10, 2003 66 -- -- 33 -- -- -- 1 April, 2003 72 37 35 25 11 14 0 3 January, 2003 70 28 42 28 10 18 0 2 December, 2002 68 35 33 27 11 16 0 5 July, 2001 61 22 39 35 14 21 * 4 January, 2001 60 24 36 33 12 21 0 7 May, 2000 58 18 40 31 12 19 1 10

65
www.people-press.org
Q.22 CONTINUED… (VOL.) (VOL.) -------Favorable------- ------Unfavorable------ Never Can’t Total Very Mostly Total Very Mostly heard of rate/Ref March, 199918
November, 1997 54 13 41 18 6 12 9 19 61 21 40 21 7 14 4 14
ASK FORM 2 REGISTERED VOTERS (REG=1): Q.23 And as I read a list of phrases, tell me if you think each phrase better describes [RANDOMIZE
ORDER OF CANDIDATES: Mitt Romney or Barack Obama]. [INSERT ITEM; RANDOMIZE] – does this better describe [READ IN SAME ORDER: Romney or Obama]? What about [INSERT ITEM]? [REPEAT IF NECESSARY: “Would you say this better describes [READ IN SAME ORDER: Romney or Obama]?
BASED ON FORM 2 REGISTERED VOTERS [N=1,263]: (VOL.) Mitt Barack (VOL.) Both (VOL.) Romney Obama Neither Equally DK/Ref a.F2 Would use good judgment in a crisis 2012 Election Sep 12-16, 2012 37 51 3 3 6 Jun 7-17, 2012 37 50 3 5 6 2008 Election McCain Obama Late September, 2008 45 42 2 6 5 August, 2008 51 36 3 5 5 June, 2008 47 38 3 5 7 2004 Election Bush Kerry Mid-October, 2004 48 41 3 2 6 Early October, 2004 51 37 2 3 7 Mid-September 22-26, 2004 49 36 3 3 9 September, 2004 53 34 2 4 7 August, 2004 50 38 2 3 7 May, 2004 47 35 4 5 9 Late March, 2004 46 36 2 3 13 Mid-March, 2004 48 39 2 5 6 2000 Election Bush Gore Late-October, 2000 43 42 2 5 8 Mid-October, 2000 40 42 5 8 5 Early October, 2000 36 43 4 10 7 September, 2000 38 44 3 8 7 June, 2000 44 37 5 6 8 b.F2 Can get things done 2012 Election Romney Obama Sep 12-16, 2012 41 45 7 1 7 Jun 7-17, 2012 39 41 11 3 7 2008 Election McCain Obama August, 2008 42 40 7 4 7 June, 2008 37 43 5 7 8 2004 Election Bush Kerry Late March, 2004 49 30 4 4 13 Mid-March, 2004 50 34 4 4 8 2000 Election Bush Gore Late October, 2000 43 39 5 6 7 Mid-October, 2000 41 39 6 8 6 Early October, 2000 37 38 5 11 9 September, 2000 40 40 4 8 8 June, 2000 43 33 8 6 10
18 In March 1999 and November 1997 the category was listed: “Texas Governor George W. Bush.”

66
www.people-press.org
Q.23 CONTINUED… c.F2 Willing to take a stand, even if it’s unpopular (VOL.) Mitt Barack (VOL.) Both (VOL.) 2012 Election Romney Obama Neither Equally DK/Ref Sep 12-16, 2012 37 52 3 2 5 Jun 7-17, 2012 35 54 4 3 4 2008 Election McCain Obama Late September, 2008 50 37 2 5 6 August, 2008 49 38 3 5 5 June, 2008 44 41 3 7 5 2004 Election Bush Kerry Mid-October, 2004 63 27 2 4 4 Early October, 2004 68 23 1 3 5 Mid-September 22-26, 2004 63 23 3 3 8 September, 2004 69 23 1 3 4 August, 2004 62 29 1 5 3 May, 2004 65 23 3 4 5 Late March, 2004 59 28 3 3 7 Mid-March, 2004 63 27 1 5 4 2000 Election Bush Gore Late October, 2000 49 35 7 4 5 Mid-October, 2000 49 35 6 5 5 Early October, 2000 43 35 8 6 8 September, 2000 45 37 8 5 5 June, 2000 46 32 9 5 8 d.F2 Shares my values 2012 Election Romney Obama Sep 12-16, 2012 40 50 5 2 3 Jun 7-17, 2012 40 46 8 3 4 2008 Election McCain Obama August, 2008 39 47 6 3 5 June, 2008 38 44 8 4 6 2000 Election Bush Gore June, 2000 40 35 11 5 9

67
www.people-press.org
Q.23 CONTINUED… e.F2 Connects well with ordinary Americans (VOL.) (VOL.) Both (VOL.) 2012 Election Romney Obama Neither Equally DK/Ref Sep 12-16, 2012 23 66 5 2 3 Jun 7-17, 2012 28 59 7 3 4 2008 Election McCain Obama August, 2008 30 57 4 5 4 June, 2008 26 58 4 6 6 2000 Election Bush Gore Late October, 2000 45 42 5 4 4 Mid-October, 2000 45 39 6 7 3 June, 2000 40 39 7 7 7 f.F2 Honest and truthful 2012 Election Romney Obama Sep 12-16, 2012 34 48 9 3 5 Jun 7-17, 2012 32 46 11 4 6 2008 Election McCain Obama August, 2008 39 36 9 10 6 June, 2008 37 36 11 9 7 2004 Election Bush Kerry Mid-October, 2004 40 37 14 3 6 Early October, 2004 47 34 10 3 6 Mid-September 22-26, 2004 41 32 15 3 9 September, 2004 43 35 12 4 6 August, 2004 42 38 12 2 6 May, 2004 34 36 17 4 9 Late March, 2004 37 38 12 3 10 Mid-March, 2004 35 39 16 5 5 2000 Election Bush Gore Late October, 2000 43 32 15 5 5 Mid-October, 2000 38 30 19 6 7 Early October, 2000 36 32 17 8 7 September, 2000 35 37 13 9 6 June, 2000 35 31 19 7 8 g.F2 A strong leader 2012 Election Romney Obama Sep 12-16, 2012 38 51 5 2 4 2008 Election McCain Obama Late September, 2008 43 42 3 7 5 2004 Election Bush Kerry Mid-October, 2004 50 36 5 4 5 Early October, 2004 57 32 3 2 6 Mid-September, 2004 54 28 5 3 10 Early September, 2004 58 30 4 3 5 August, 2004 57 34 2 3 4 May, 2004 50 31 8 4 7 Late March, 2004 51 33 4 2 10 Mid-March, 2004 52 34 4 4 6 2000 Election Bush Gore Late-October, 2000 44 41 6 6 3 Mid-October, 2000 42 39 9 6 4 Early October, 2000 41 38 7 10 4 September, 2000 44 38 7 6 5 h.F2 Takes consistent positions on issues 2012 Election Romney Obama Sep 12-16, 2012 34 50 7 3 6 Jun 7-17, 2012 34 46 10 3 7

68
www.people-press.org
ASK ALL FORM 1 REGISTERED VOTERS (REG=1): Q.24 Regardless of who you support, which one of the presidential candidates [RANDOMIZE ORDER OF
CANDIDATES: Mitt Romney or Barack Obama] do you think would do the best job of [INSERT FIRST ITEM; RANDOMIZE]? And who do you think would do the best job of [INSERT NEXT ITEM]? [IF RESPONDENT MENTIONS ANYONE OTHER THAN ROMENY OR OBAMA PROBE ONCE: “If you had to choose between (READ IN SAME ORDER: Romney or Obama)]?
BASED ON FORM 1 REGISTERED VOTERS [N=1,161]: (VOL.) (VOL.) Romney Obama Neither DK/Ref a.F1 Improving the job situation 2012 Election Sep 12-16, 2012 45 46 4 5 Jun 28-Jul 9, 2012 46 42 6 6 b.F1 Dealing with Medicare 2012 Election Romney Obama Sep 12-16, 2012 38 51 4 6 c.F1 Reducing the federal budget deficit 2012 Election Romney Obama Sep 12-16, 2012 46 43 7 5 Jun 28-Jul 9, 201219
2008 Election McCain Obama 50 36 8 6
Mid-October, 2008 30 50 9 11 1996 Election Dole Clinton September, 1996 41 38 11 10 July, 1996 39 40 11 10 d.F1 Representing your views about abortion 2012 Election Romney Obama Sep 12-16, 2012 35 48 5 12 e.F1 Making wise decisions about
foreign policy 2012 Election Romney Obama Sep 12-16, 2012 38 53 3 6 Jun 28-Jul 9, 2012 40 48 4 8 2008 Election McCain Obama Mid-October, 2008 45 44 1 10 Late September, 2008 49 42 2 7 Mid-September, 2008 51 40 2 7 July, 2008 43 42 2 13 2004 Election Bush Kerry September, 2004 53 37 3 7 August, 2004 43 47 2 8 May, 2004 43 42 4 11 Late March, 2004 44 38 4 14 Mid-March, 2004 44 45 3 8 2000 Election Bush Gore March, 2000 40 46 4 10 1996 Election Dole Clinton Early September, 1996 39 44 7 10 July, 1996 42 42 5 11 TREND FOR COMPARISON Bush Clinton Perot Neither DK/Ref 1992 Election October, 1992 53 27 6 3 11
19 In 2012 the word “federal” was added to the question.

69
www.people-press.org
Q.24 CONTINUED… (VOL.) (VOL.) Romney Obama Neither DK/Ref f.F1 Dealing with taxes 2012 Election Sep 12-16, 2012 42 48 3 6 Jun 28-Jul 9, 2012 40 48 5 7 2008 Election McCain Obama Mid-October, 2008 35 50 5 10 Late-September, 2008 36 49 6 9 Mid-September, 2008 39 44 5 12 June, 2008 36 47 6 11 Late May, 2008 44 39 5 12 2000 Election Bush Gore Late October, 2000 45 41 5 9 Mid-October, 2000 41 42 5 12 Early October, 2000 39 42 6 13 September, 2000 41 41 5 13 June, 2000 41 34 7 18 March, 2000 40 44 5 11 TREND FOR COMPARISON Cutting taxes 1996 Election Dole Clinton Neither DK/Ref September, 1996 42 34 14 10 July, 1996 42 35 12 11 TREND FOR COMPARISON Bush Clinton Perot Neither DK/Ref Not increasing taxes 1992 Election October, 1992 35 25 8 16 16 g.F1 Dealing with health care 2012 Election Romney Obama Sep 12-16, 2012 39 52 4 5 Jun 28-Jul 9, 2012 41 49 5 5 Jun 7-17, 2012 44 45 5 6 TREND FOR COMPARISON Improving the health care system 2008 Election McCain Obama Mid-October, 2008 27 57 6 10 Mid-September, 2008 31 52 7 10 Late May, 2008 32 49 6 13 2004 Election Bush Kerry Early October, 2004 31 49 8 12 September 22-26, 2004 32 48 7 13 Early September, 2004 32 50 8 10 August, 2004 29 55 5 11 May, 2004 29 51 7 13 Late March, 2004 33 46 6 15 Mid-March, 2004 29 57 4 10 2000 Election Bush Gore Neither DK/Ref Late October, 2000 38 47 5 10 Mid-October, 2000 37 48 4 11 Early October, 2000 36 49 5 10 September, 2000 32 51 6 11 June, 2000 31 44 6 19 March, 2000 31 51 6 12 h.F1 Dealing with problems in the Middle East 2012 Election Romney Obama Sep 12-16, 2012 39 50 4 7

70
www.people-press.org
RANDOMIZE Q.25F1 AND Q.27F1 ASK FORM 1 REGISTERED VOTERS (REG=1): Q.25 Please tell me whether you think each of the following describes Barack Obama. First, [INSERT
FIRST ITEM; RANDOMIZE] do you think of Barack Obama as [FIRST ITEM] or not? Do you think of Obama as [NEXT ITEM] or not?
BASED ON FORM 1 REGISTERED VOTERS [N=1,161]: Yes, describes (VOL.) Obama No DK/Ref a.F1 Decisive Sep 12-16, 2012 57 38 5 Mar 10-14, 2010 56 38 7 b.F1 Inspiring Sep 12-16, 2012 64 34 1 Mar 10-14, 2010 59 38 2 November, 200820
Mid-October, 2008 71 26 3 81 18 1
Mid-September, 2008 71 26 3 April, 2008 66 31 3 March, 2008 70 26 4 c.F1 Hard to like Sep 12-16, 2012 24 75 2 April, 2008 25 71 4 March, 2008 17 78 5 RANDOMIZE Q.26F2 AND Q.28F2 ASK FORM 2 REGISTERED VOTERS (REG=1): Q.26 Does Barack Obama make you feel [INSERT FIRST ITEM; RANDOMIZE] or not? Does Obama
make you feel [NEXT ITEM]or not? BASED ON FORM 2 REGISTERED VOTERS [N=1,263]: (VOL.) Yes No DK/Ref a.F2 Hopeful Sep 12-16, 2012 50 48 2 Sep 22-Oct 4, 2011 43 55 2 Mar 10-14, 2010 52 46 2 November, 200821
March, 2008 69 29 2
22
54 43 3
b.F2 Proud Sep 12-16, 2012 51 45 3 Sep 22-Oct 4, 2011 45 52 3 Mar 10-14, 2010 48 48 4 November, 2008 65 32 3 March, 2008 42 53 5 c.F2 Angry Sep 12-16, 2012 31 68 1 Sep 22-Oct 4, 2011 31 68 1 Mar 10-14, 2010 31 67 2 November, 2008 9 91 * March, 2008 26 71 3
20 All November 2008 trends from post-election callback survey of voters. 21 All November 2008 trends from post-election callback survey of voters. 22 For all March 2008 trends, the question was worded “Has Barack Obama ever made you feel [INSERT ITEM] or not?”
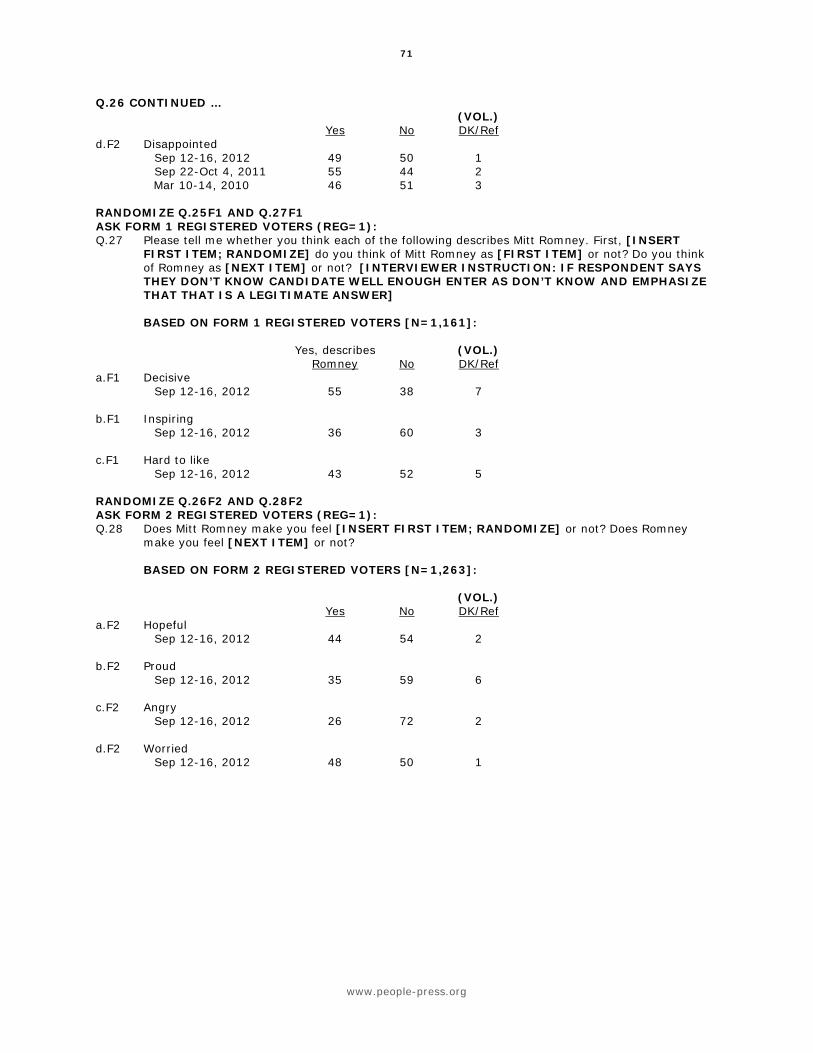
71
www.people-press.org
Q.26 CONTINUED … (VOL.) Yes No DK/Ref d.F2 Disappointed Sep 12-16, 2012 49 50 1 Sep 22-Oct 4, 2011 55 44 2 Mar 10-14, 2010 46 51 3 RANDOMIZE Q.25F1 AND Q.27F1 ASK FORM 1 REGISTERED VOTERS (REG=1): Q.27 Please tell me whether you think each of the following describes Mitt Romney. First, [INSERT
FIRST ITEM; RANDOMIZE] do you think of Mitt Romney as [FIRST ITEM] or not? Do you think of Romney as [NEXT ITEM] or not? [INTERVIEWER INSTRUCTION: IF RESPONDENT SAYS THEY DON’T KNOW CANDIDATE WELL ENOUGH ENTER AS DON’T KNOW AND EMPHASIZE THAT THAT IS A LEGITIMATE ANSWER]
BASED ON FORM 1 REGISTERED VOTERS [N=1,161]: Yes, describes (VOL.) Romney No DK/Ref a.F1 Decisive Sep 12-16, 2012 55 38 7 b.F1 Inspiring Sep 12-16, 2012 36 60 3 c.F1 Hard to like Sep 12-16, 2012 43 52 5 RANDOMIZE Q.26F2 AND Q.28F2 ASK FORM 2 REGISTERED VOTERS (REG=1): Q.28 Does Mitt Romney make you feel [INSERT FIRST ITEM; RANDOMIZE] or not? Does Romney
make you feel [NEXT ITEM] or not? BASED ON FORM 2 REGISTERED VOTERS [N=1,263]: (VOL.) Yes No DK/Ref a.F2 Hopeful Sep 12-16, 2012 44 54 2 b.F2 Proud Sep 12-16, 2012 35 59 6 c.F2 Angry Sep 12-16, 2012 26 72 2 d.F2 Worried Sep 12-16, 2012 48 50 1

72
www.people-press.org
RANDOMIZE Q.29F2 AND Q.30F2 ASK FORM 2 REGISTERED VOTERS (REG=1): Q.29F2 In general, do you think Barack Obama’s positions on the issues are [READ IN ORDER]: BASED ON FORM 2 REGISTERED VOTERS [N=1,263]: Too Not liberal About (VOL.) liberal enough right DK/Ref Sep 12-16, 2012 39 9 47 5 Mar 7-11, 2012 41 12 42 5 February, 2008 33 7 48 12 RANDOMIZE Q.29F2 AND Q.30F2 ASK FORM 2 REGISTERED VOTERS (REG=1): Q.30F2 In general, do you think Mitt Romney’s positions on the issues are [READ IN ORDER]: BASED ON FORM 2 REGISTERED VOTERS [N=1,263]: Too Not conservative About (VOL.) conservative enough right DK/Ref Sep 12-16, 2012 35 19 38 8 Mar 7-11, 2012 29 23 35 14 TREND FOR COMPARISON: Too Not conservative About (VOL.) conservative enough right DK/Ref John McCain February, 2008 26 22 37 15 NO QUESTION 31 RANDOMIZE Q.32 AND Q.33F1/Q.34F2 IN BLOCK WITH Q.35F1 AND Q.36F1 BLOCK ASK ALL: Thinking about the nation’s economy… Q.32 How would you rate economic conditions in this country today… as excellent, good, only fair, or
poor? Only (VOL.) Excellent Good fair Poor DK/Ref Sep 12-16, 2012 1 12 43 44 1 Jun 7-17, 2012 1 9 47 42 1 Mar 7-11, 2012 1 9 38 51 1 Feb 8-12, 2012 1 10 46 43 1 Jan 11-16, 2012 2 9 42 47 1 Dec 7-11, 2011 * 8 38 53 1 Aug 17-21, 2011 1 6 37 56 1 Jun 15-19, 2011 * 8 45 46 1 Mar 30-Apr 3, 2011 1 7 38 53 1 Feb 2-7, 2011 1 11 45 42 1 Dec 1-5, 2010 1 8 44 45 1 Oct 13-18, 2010 1 7 38 54 1 Aug 25-Sep 6, 2010 1 7 43 48 1 Jun 3-6, 2010 1 8 48 43 1 Apr 21-26, 2010 * 11 39 49 1 Mar 10-14, 2010 1 6 39 53 1 Feb 3-9, 2010 1 7 38 53 1 Dec 9-13, 2009 1 7 41 50 1 Oct 28-Nov 8, 2009 * 8 41 50 1 Sep 30-Oct 4, 2009 1 8 43 48 1 Aug 11-17, 2009 * 8 38 52 2 Jun 10-14, 2009 1 8 39 52 1 Mar 9-12, 2009 * 6 25 68 1

73
www.people-press.org
Q.32 CONTINUED … Only (VOL.) Excellent Good fair Poor DK/Ref Feb 4-8, 2009 * 4 24 71 1 December, 2008 * 7 33 59 1 November, 2008 1 6 28 64 1 Late October, 2008 * 7 25 67 1 Early October, 2008 1 8 32 58 1 Late September, 2008 * 7 27 65 1 July, 2008 1 9 39 50 1 April, 2008 1 10 33 56 * March, 2008 1 10 32 56 1 Early February, 2008 1 16 36 45 2 January, 2008 3 23 45 28 1 November, 2007 3 20 44 32 1 September, 2007 3 23 43 29 2 June, 2007 6 27 40 25 2 February, 2007 5 26 45 23 1 December, 2006 6 32 41 19 2 Early November, 2006 (RVs) 9 35 37 17 2 Late October, 2006 6 27 40 25 2 September, 2006 5 32 41 20 2 March, 2006 4 29 44 22 1 January, 2006 4 30 45 19 2 Early October, 2005 2 23 45 29 1 Mid-September, 2005 3 28 44 24 1 Mid-May, 2005 3 29 47 20 1 January, 2005 3 36 45 15 1 December, 2004 3 33 43 20 1 Early November, 2004 (RVs) 5 31 37 26 1 Mid-September, 2004 4 34 40 20 2 August, 2004 3 30 45 21 1 Late April, 2004 4 34 38 22 2 Late February, 200423
2 29 42 26 1
RANDOMIZE Q.32 AND Q.33F1/Q.34F2 IN BLOCK WITH Q.35F1 AND Q.36F1 BLOCK ASK FORM 1 ONLY [N=1,455]: Q.33F1 A year from now, do you expect that economic conditions in the country as a whole will be better
than they are at present, or worse, or just about the same as now? (VOL.) Better Worse Same DK/Ref Sep 12-16, 2012 43 8 42 8 Jun 7-17, 2012 34 11 50 5 Mar 7-11, 2012 44 14 38 4 Feb 8-12, 2012 44 10 42 3 Jan 11-16, 2012 34 16 46 3 Dec 7-11, 2011 28 18 50 4 Aug 17-21, 2011 29 18 50 2 Jun 15-19, 2011 29 23 46 2 Oct 13-18, 2010 35 16 45 4 Apr 21-26, 2010 42 19 36 3 Feb 3-9, 2010 42 16 40 3 Dec 9-13, 2009 42 17 38 3 Oct 28-Nov 8, 2009 39 19 39 2 Sep 30-Oct 4, 2009 45 15 38 3 Aug 11-17, 2009 45 19 33 3 Jun 10-14, 2009 48 16 34 2 Mar 9-12, 2009 41 19 37 3 Feb 4-8, 2009 40 18 38 4
23 Earlier trends available from Gallup.

74
www.people-press.org
Q.33F1 CONTINUED … (VOL.) Better Worse Same DK/Ref December, 2008 43 17 36 4 Early October, 2008 46 16 30 8 July, 2008 30 21 41 8 March, 2008 33 22 39 6 January, 2008 20 26 48 6 September, 2007 19 23 53 5 June, 2007 16 24 55 5 February, 2007 17 20 58 5 December, 2006 22 18 56 4 September, 2006 16 25 55 4 January, 2006 20 22 55 3 Early October, 2005 20 32 45 3 Mid-September, 2005 18 37 43 2 Mid-May, 2005 18 24 55 3 January, 2005 27 18 52 3 August, 2004 36 9 47 8 Late February, 2004 39 12 41 8 September, 2003 37 17 43 3 May, 2003 43 19 35 3 Late March, 2003 33 23 37 7 January, 2003 30 20 44 6 January, 2002 44 17 36 3 Newsweek: January, 2001 18 33 44 5 June, 2000 15 24 55 6 Early October, 1998 (RVs) 16 22 57 5 Early September, 1998 18 17 61 4 May, 1990 18 31 45 6 February, 1989 25 22 49 4 September, 1988 (RVs) 24 16 51 9 May, 1988 24 20 46 10 January, 1988 22 26 45 7 Newsweek: January, 1984 (RVs) 35 13 49 3 RANDOMIZE Q.32 AND Q.33F1/Q.34F2 IN BLOCK WITH Q.35F1 AND Q.36F1 BLOCK ASK FORM 2 ONLY [N=1,564]: Q.34F2 Which of these best describes your opinion: [READ; READ CATEGORIES IN REVERSE ORDER
FOR HALF THE SAMPLE]? The economy is not It will be a long The economy yet recovering time before the (VOL.) is recovering but will recover soon economy recovers DK/Ref Sep 12-16, 2012 25 30 43 1 Feb 8-12, 2012 25 29 44 3 Mar 30-Apr 3, 2011 20 24 54 2 Feb 2-7, 2011 24 33 42 2 Dec 1-5, 2010 17 33 48 2 Aug 25-Sep 6, 201024
Jun 3-6, 2010 13 35 50 2 10 37 52 2
Mar 10-14, 2010 13 37 48 2
24 In September 2010 and earlier, the first answer choice read “The economy is now recovering.”
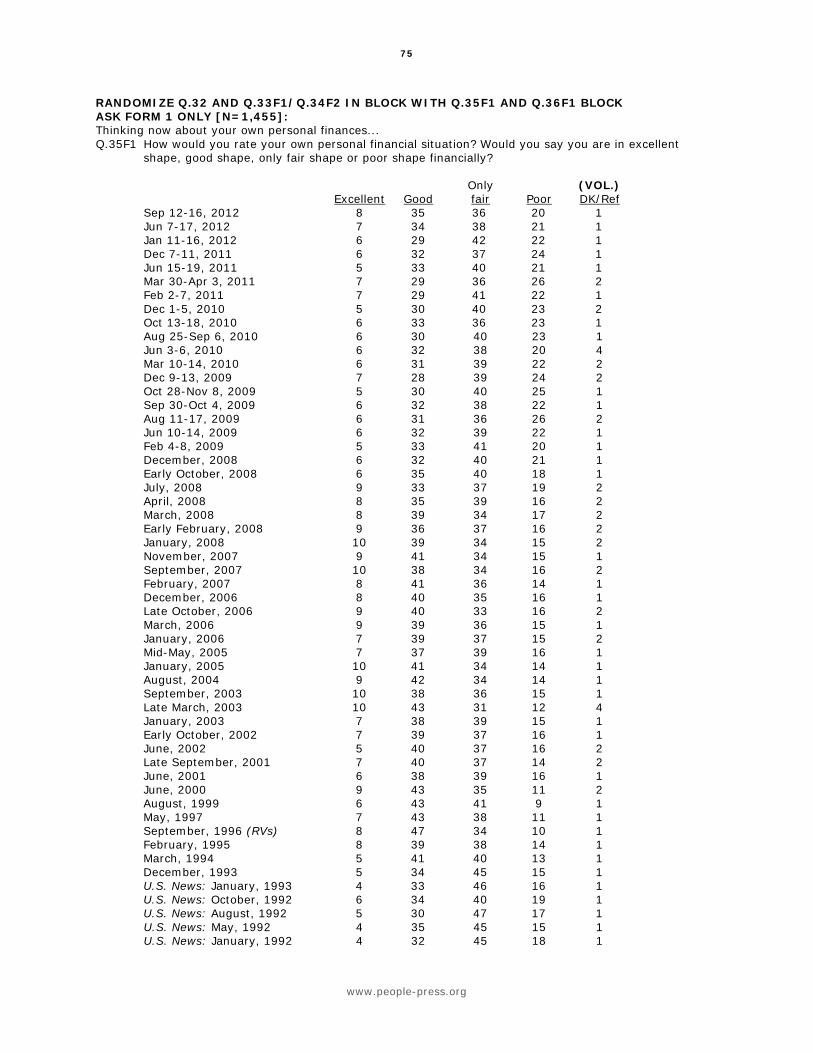
75
www.people-press.org
RANDOMIZE Q.32 AND Q.33F1/Q.34F2 IN BLOCK WITH Q.35F1 AND Q.36F1 BLOCK ASK FORM 1 ONLY [N=1,455]: Thinking now about your own personal finances... Q.35F1 How would you rate your own personal financial situation? Would you say you are in excellent
shape, good shape, only fair shape or poor shape financially? Only (VOL.) Excellent Good fair Poor DK/Ref Sep 12-16, 2012 8 35 36 20 1 Jun 7-17, 2012 7 34 38 21 1 Jan 11-16, 2012 6 29 42 22 1 Dec 7-11, 2011 6 32 37 24 1 Jun 15-19, 2011 5 33 40 21 1 Mar 30-Apr 3, 2011 7 29 36 26 2 Feb 2-7, 2011 7 29 41 22 1 Dec 1-5, 2010 5 30 40 23 2 Oct 13-18, 2010 6 33 36 23 1 Aug 25-Sep 6, 2010 6 30 40 23 1 Jun 3-6, 2010 6 32 38 20 4 Mar 10-14, 2010 6 31 39 22 2 Dec 9-13, 2009 7 28 39 24 2 Oct 28-Nov 8, 2009 5 30 40 25 1 Sep 30-Oct 4, 2009 6 32 38 22 1 Aug 11-17, 2009 6 31 36 26 2 Jun 10-14, 2009 6 32 39 22 1 Feb 4-8, 2009 5 33 41 20 1 December, 2008 6 32 40 21 1 Early October, 2008 6 35 40 18 1 July, 2008 9 33 37 19 2 April, 2008 8 35 39 16 2 March, 2008 8 39 34 17 2 Early February, 2008 9 36 37 16 2 January, 2008 10 39 34 15 2 November, 2007 9 41 34 15 1 September, 2007 10 38 34 16 2 February, 2007 8 41 36 14 1 December, 2006 8 40 35 16 1 Late October, 2006 9 40 33 16 2 March, 2006 9 39 36 15 1 January, 2006 7 39 37 15 2 Mid-May, 2005 7 37 39 16 1 January, 2005 10 41 34 14 1 August, 2004 9 42 34 14 1 September, 2003 10 38 36 15 1 Late March, 2003 10 43 31 12 4 January, 2003 7 38 39 15 1 Early October, 2002 7 39 37 16 1 June, 2002 5 40 37 16 2 Late September, 2001 7 40 37 14 2 June, 2001 6 38 39 16 1 June, 2000 9 43 35 11 2 August, 1999 6 43 41 9 1 May, 1997 7 43 38 11 1 September, 1996 (RVs) 8 47 34 10 1 February, 1995 8 39 38 14 1 March, 1994 5 41 40 13 1 December, 1993 5 34 45 15 1 U.S. News: January, 1993 4 33 46 16 1 U.S. News: October, 1992 6 34 40 19 1 U.S. News: August, 1992 5 30 47 17 1 U.S. News: May, 1992 4 35 45 15 1 U.S. News: January, 1992 4 32 45 18 1

76
www.people-press.org
RANDOMIZE Q.32 AND Q.33F1/Q.34F2 IN BLOCK WITH Q.35F1 AND Q.36F1 BLOCK ASK FORM 1 ONLY [N=1,455]: Q.36F1 Over the course of the next year, do you think the financial situation of you and your family will
improve a lot, improve some, get a little worse or get a lot worse? (VOL.) Improve Improve Get a Get a lot Stay the (VOL.) a lot some little worse worse same DK/Ref Sep 12-16, 2012 12 54 11 4 11 7 Jun 7-17, 2012 10 53 15 5 14 4 Jan 11-16, 2012 10 50 18 7 11 3 Dec 7-11, 2011 9 49 17 5 15 4 Jun 15-19, 2011 7 49 21 7 13 3 Mar 30-Apr 3, 2011 7 44 23 10 13 3 Dec 1-5, 2010 7 49 20 6 14 4 Oct 13-18, 2010 9 48 16 6 17 5 Mar 10-14, 2010 9 52 15 8 12 4 Dec 9-13, 2009 9 44 19 8 15 4 Oct 28-Nov 8, 2009 6 50 19 8 13 4 Sep 30-Oct 4, 2009 10 49 17 6 13 4 Aug 11-17, 2009 8 47 17 8 15 5 Jun 10-14, 2009 9 54 17 7 9 4 Feb 4-8, 2009 7 47 22 7 13 4 December, 2008 7 49 21 6 13 4 Early October, 2008 8 51 20 6 9 6 July, 2008 7 44 21 7 14 7 March, 2008 10 45 20 7 13 5 January, 2008 11 49 16 6 14 4 September, 2007 10 52 14 4 16 4 February, 2007 11 52 12 3 19 3 December, 2006 10 57 13 3 14 3 January, 2006 10 51 14 5 16 4 Mid-May, 2005 10 51 15 5 15 4 January, 2005 10 54 14 4 15 3 August, 2004 13 57 9 3 12 6 September, 2003 11 53 15 4 14 3 Late March, 2003 12 51 15 4 11 7 January, 2003 9 51 18 5 13 4 Early October, 2002 10 54 13 5 12 6 June, 2002 11 55 15 4 11 4 January, 2002 12 53 15 5 11 4 Late September, 2001 9 46 16 4 17 8 June, 2001 11 52 15 4 14 4 January, 2001 11 46 18 9 12 4 January, 1999 17 55 7 3 14 4 May, 1997 12 56 10 2 17 3 February, 1995 11 53 13 3 17 3 March, 1994 10 57 11 3 16 3 U.S. News: October, 1992 9 51 14 3 15 8 U.S. News: August, 1992 6 50 20 5 14 5 U.S. News: May, 1992 8 49 22 4 13 4 U.S. News: January, 1992 9 46 19 5 16 5

77
www.people-press.org
ASK FORM 2 ONLY [N=1,564]: Q.37F2 Which of the following national economic issues worries you most? [READ AND RANDOMIZE]
The job situation
The federal budget deficit
Rising prices
Problems in the financial and housing
markets (VOL.) Other
(VOL.) None/not worried
about any (VOL.) DK/Ref
Sep 12-16, 2012 40 27 19 10 2 1 1 Mar 7-11, 2012 39 24 22 11 2 1 2 Nov 9-14, 2011 47 22 13 12 2 1 2 Sep 1-4, 2011 43 22 17 11 4 2 2 Jul 20-24, 2011 39 29 15 11 3 1 2 May 25-30, 2011 38 28 20 10 2 * 2 Mar 8-14, 2011 34 24 28 10 3 * 1 Feb 2-7, 2011 44 19 23 10 1 1 3 Dec 1-5, 2010 47 19 15 14 1 1 3 Aug 25-Sep 6, 2010 49 19 15 12 2 1 2 Jun 3-6, 2010 41 23 16 13 3 1 2 Mar 10-14, 2010 45 22 17 11 2 * 2 ASK ALL: Q.38 How much confidence do you have in [INSERT ITEM; RANDOMIZE] to do the right thing when it
comes to fixing the economy – a great deal of confidence, a fair amount, not too much, or no confidence at all?
A great A fair Not too No confidence (VOL.) deal amount much at all DK/Ref a. Barack Obama Sep 12-16, 2012 22 32 16 27 2 Dec 9-13, 200925
Sep 30-Oct 4, 2009 21 38 18 21 2 20 32 17 27 4
Mar 31-Apr 6, 200926
Jan 7-11, 2009 33 42 14 7 4 32 38 13 13 4
b. Mitt Romney Sep 12-16, 2012 14 31 26 26 4 Q.39 THROUGH Q.44 HELD FOR FUTURE RELEASE NO QUESTION 45
25 In December, September and January of 2009, economy was asked in a list of issues. 26 Item asked in a list about confidence in Obama, Democratic leaders in Congress, and Republican leaders in Congress.

78
www.people-press.org
ASK IF UNFAVORABLE VIEW OF ROMNEY (Q.22b=3,4) AND NOT TOO MUCH OR NO CONFIDENCE IN OBAMA TO FIX THE ECONOMY (Q.38a=3,4) [N=241]: Q.46 Just one more question about the candidates. Which worries you more - [READ AND
RANDOMIZE] Sep 12-16 2012 38 That Barack Obama may not be able to make progress on the economy 39 That Mitt Romney may not be trustworthy 14 Both (VOL.) 4 Neither (VOL.) 4 Don’t know/Refused (VOL.) NO QUESTION 47-48 ASK ALL: Q.49 Here is a series of statements on some different topics. The first one is … [READ ITEM;
RANDOMIZE.] Do you completely agree, mostly agree, mostly DISagree or completely disagree. Next... [ITEM; RANDOMIZE]. [INTERVIEWER INSTRUCTION: Repeat answer choices as necessary. If respondent indicates only that they agree or disagree, probe “Do you completely (dis)agree or mostly (dis)agree?]
------AGREE------- -----DISAGREE----- Comp- Comp- (VOL.) Net letely Mostly Net letely Mostly DK/Ref a. We have gone too far in pushing equal rights in this country Sep 12-16, 2012 38 14 25 57 31 26 4 Late October, 2008 33 13 20 62 30 32 5 June, 2008 34 15 19 61 34 27 5 March, 2008 34 12 22 61 32 29 5 b. I think it's all right for blacks and whites to date each other Sep 12-16, 2012 86 64 22 10 5 5 4 Late October, 2008 83 59 24 12 7 5 5 June, 2008 81 58 23 14 8 6 5 March, 2008 79 52 27 16 8 8 5 c. The best way to ensure peace is though military strength Sep 12-16, 2012 60 23 37 37 13 24 3 d. The growing number of newcomers from other countries are a threat to traditional American customs and values Sep 12-16, 2012 39 14 25 57 26 31 4 Late October, 2008 37 13 24 57 23 34 6 March, 2008 45 19 26 50 20 30 5 e. It is the responsibility of the government to take care of those who can’t take care of themselves Sep 12-16, 2012 63 22 41 34 10 24 3 f. Government regulation of business usually does more harm than good Sep 12-16, 2012 57 22 35 35 9 27 7

79
www.people-press.org
ASK ALL: PARTY In politics TODAY, do you consider yourself a Republican, Democrat, or independent? ASK IF INDEP/NO PREF/OTHER/DK/REF (PARTY=3,4,5,9): PARTYLN As of today do you lean more to the Republican Party or more to the Democratic Party? BASED ON REGISTERED VOTERS [N=2,424]: (VOL.) (VOL.) No Other (VOL.) Lean Lean Republican Democrat Independent preference party DK/Ref Rep Dem Sep 12-16, 2012 28 37 31 1 * 2 14 13 Jul 16-26, 2012 25 38 33 2 1 2 15 12 Jun 28-Jul 9, 2012 27 36 34 1 * 2 15 15 Jun 7-17, 2012 28 35 35 1 * 1 17 14 May 9-Jun 3, 2012 28 35 31 2 * 3 13 12 Apr 4-15, 2012 28 34 35 1 * 1 16 12 Mar 7-11, 2012 28 38 31 1 1 1 15 14 Feb 8-12, 2012 32 34 31 1 * 1 13 15 Jan 11-16, 2012 24 33 38 2 * 2 17 14 Jan 4-8, 2012 31 32 32 3 * 2 15 12 BASED ON GENERAL PUBLIC: (VOL.) (VOL.) No Other (VOL.) Lean Lean Republican Democrat Independent preference party DK/Ref Rep Dem Sep 12-16, 2012 24 35 36 2 * 2 14 16 Jul 16-26, 2012 22 33 38 4 * 3 14 15 Jun 28-Jul 9, 2012 24 33 37 3 * 3 15 17 Jun 7-17, 2012 24 33 39 2 * 2 17 17 May 9-Jun 3, 2012 24 32 36 4 * 4 13 14 Apr 4-15, 2012 24 31 39 3 * 2 15 15 Mar 7-11, 2012 24 34 36 3 1 2 16 17 Feb 8-12, 2012 26 32 36 4 1 2 13 17 Jan 11-16, 2012 22 31 42 3 * 2 17 16 Jan 4-8, 2012 26 31 35 4 * 4 14 14 Yearly Totals 2011 24.3 32.3 37.4 3.1 .4 2.5 15.7 15.6 2010 25.2 32.7 35.2 3.6 .4 2.8 14.5 14.1 2009 23.9 34.4 35.1 3.4 .4 2.8 13.1 15.7 2008 25.7 36.0 31.5 3.6 .3 3.0 10.6 15.2 2007 25.3 32.9 34.1 4.3 .4 2.9 10.9 17.0 2006 27.8 33.1 30.9 4.4 .3 3.4 10.5 15.1 2005 29.3 32.8 30.2 4.5 .3 2.8 10.3 14.9 2004 30.0 33.5 29.5 3.8 .4 3.0 11.7 13.4 2003 30.3 31.5 30.5 4.8 .5 2.5 12.0 12.6 2002 30.4 31.4 29.8 5.0 .7 2.7 12.4 11.6 2001 29.0 33.2 29.5 5.2 .6 2.6 11.9 11.6 2001 Post-Sept 11 30.9 31.8 27.9 5.2 .6 3.6 11.7 9.4 2001 Pre-Sept 11 27.3 34.4 30.9 5.1 .6 1.7 12.1 13.5 2000 28.0 33.4 29.1 5.5 .5 3.6 11.6 11.7 1999 26.6 33.5 33.7 3.9 .5 1.9 13.0 14.5 1998 27.9 33.7 31.1 4.6 .4 2.3 11.6 13.1 1997 28.0 33.4 32.0 4.0 .4 2.3 12.2 14.1 1996 28.9 33.9 31.8 3.0 .4 2.0 12.1 14.9 1995 31.6 30.0 33.7 2.4 .6 1.3 15.1 13.5 1994 30.1 31.5 33.5 1.3 -- 3.6 13.7 12.2 1993 27.4 33.6 34.2 4.4 1.5 2.9 11.5 14.9 1992 27.6 33.7 34.7 1.5 0 2.5 12.6 16.5 1991 30.9 31.4 33.2 0 1.4 3.0 14.7 10.8 1990 30.9 33.2 29.3 1.2 1.9 3.4 12.4 11.3 1989 33 33 34 -- -- -- -- -- 1987 26 35 39 -- -- -- -- --

80
www.people-press.org
ASK ALL: TEAPARTY2 From what you know, do you agree or disagree with the Tea Party movement, or don’t you
have an opinion either way? (VOL.) Not No opinion Haven’t (VOL.) heard of/ Agree Disagree either way heard of Refused DK Sep 12-16, 2012 18 26 53 2 2 -- Jul 16-26, 2012 16 27 54 2 1 -- Jun 28-Jul 9, 2012 19 27 49 3 2 -- Jun 7-17, 2012 21 25 52 2 1 -- May 9-Jun 3, 2012 16 25 54 2 3 -- Apr 4-15, 2012 20 26 50 3 2 -- Mar 7-11, 2012 19 29 48 2 2 -- Feb 8-12, 2012 18 25 53 2 2 -- Jan 11-16, 2012 20 24 52 2 2 -- Jan 4-8, 2012 18 25 52 2 3 -- Dec 7-11, 2011 19 27 50 2 2 -- Nov 9-14, 2011 20 27 51 1 1 -- Sep 22-Oct 4, 2011 19 27 51 2 1 -- Aug 17-21, 2011 20 27 50 1 1 -- Jul 20-24, 2011 20 24 53 1 1 -- Jun 15-19, 2011 20 26 50 3 2 -- May 25-30, 2011 18 23 54 2 2 -- Mar 30-Apr 3, 2011 22 29 47 1 1 -- Mar 8-14, 2011 19 25 54 1 1 -- Feb 22-Mar 1, 2011 20 25 52 2 2 -- Feb 2-7, 201127
Jan 5-9, 2011 24 22 50 2 1 -- 22 22 53 2 2 --
Dec 1-5, 2010 22 26 49 2 2 -- Nov 4-7, 2010 27 22 49 1 1 -- Oct 27-30, 2010 (RVs) 29 25 32 -- 1 13 Oct 13-18, 2010 (RVs) 28 24 30 -- 1 16 Aug 25-Sep 6, 2010 (RVs) 29 26 32 -- 1 13 Jul 21-Aug 5, 2010 22 18 37 -- 1 21 Jun 16-20, 2010 24 18 30 -- * 27 May 20-23, 2010 25 18 31 -- 1 25 Mar 11-21, 2010 24 14 29 -- 1 31
27 In the February 2-7, 2011 survey and before, question read “…do you strongly agree, agree, disagree or strongly
disagree with the Tea Party movement…” In October 2010 and earlier, question was asked only of those who had heard or read a lot or a little about the Tea Party. In May 2010 through October 2010, it was described as: “the Tea Party movement that has been involved in campaigns and protests in the U.S. over the past year.” In March 2010 it was described as ”the Tea Party protests that have taken place in the U.S. over the past year.”

81
www.people-press.org
ASK ALL: PVOTE08A In the 2008 presidential election between Barack Obama and John McCain, did things come
up that kept you from voting, or did you happen to vote? ASK IF YES (PVOTE08A=1): PVOTE08B Did you vote for Obama, McCain or someone else? BASED ON REGISTERED VOTERS [N=2,424]: (VOL.) Did Don’t Other (VOL.) not remember/ Voted Obama McCain candidate DK/Ref vote Ref Sep 12-16, 2012 86 47 32 4 3 13 1 Jun 7-17, 2012 88 45 33 7 3 11 1 Sep 22-Oct 4, 2011 88 46 32 5 4 12 * Aug 17-21, 2011 89 46 33 6 5 11 1 Mar 8-14, 2011 88 46 32 5 5 12 * Nov 4-7, 2010 89 45 33 6 4 11 1 Oct 27-30, 2010 88 44 35 4 5 10 2 Oct 13-18, 2010 89 45 35 4 4 10 1 Aug 25-Sep 6, 2010 89 46 34 4 4 10 1 Jan 6-10, 2010 92 44 37 4 6 8 * Mar 31-Apr 21, 2009 93 47 34 5 7 7 * Feb 4-8, 2009 93 48 33 4 8 7 * Jan 7-11, 2009 93 48 35 4 6 7 * December, 2008 93 50 32 3 9 7 * ASK IF PLAN TO VOTE AND DID NOT VOTE IN 2008 (PLANTO1=1 AND PVOTE08A=2,8,9): FIRST Will the election this November be the FIRST time that you have voted, or have you voted
before? BASED ON REGISTERED VOTERS [N=2,424]: Mid- Sep 12-16 Oct Nov Oct 2012 2006 2004 200428
5 FIRST time voting 5 13 11
91 Voted before 88 87 89 1 Don’t know/Refused (VOL.) 0 * * -- Already voted * -- -- 3 Don’t plan to vote/Don’t know 7 -- --
TREND FOR COMPARISION:
ASK ALL WHO VOTED (Q.1=1): PVOTE04A In the 2004 presidential election between George W. Bush and John Kerry, did things come up that kept you from voting, or did you happen to vote? ASK IF DID NOT VOTE IN 2004 (PVOTE04A=2-9): FIRST Is this the first year you have ever voted, or have you voted in elections before this
year? Nov Oct Nov Oct 200829 2008 200430
8 7 First time 13 11 2004
92 92 Had voted before 87 89 1 1 Don’t know/Refused (VOL.) * *
28 In Mid-October 2004, the question was asked as part of a series of items about whether they applied to the respondent. 29 In 2008, those who voted in the presidential primary but not in 2004 were asked “Had you ever voted before this year’s
primary, or was this the FIRST time you voted?” Non-primary registered voters were asked “Have you ever voted before, or would this election be your first time voting?” The percentage reported here as first time voters does not include those who said they had first voted in the 2008 primaries.
30 In 2004, the question was worded “Was this election the FIRST time that you have voted, or have you voted before?”
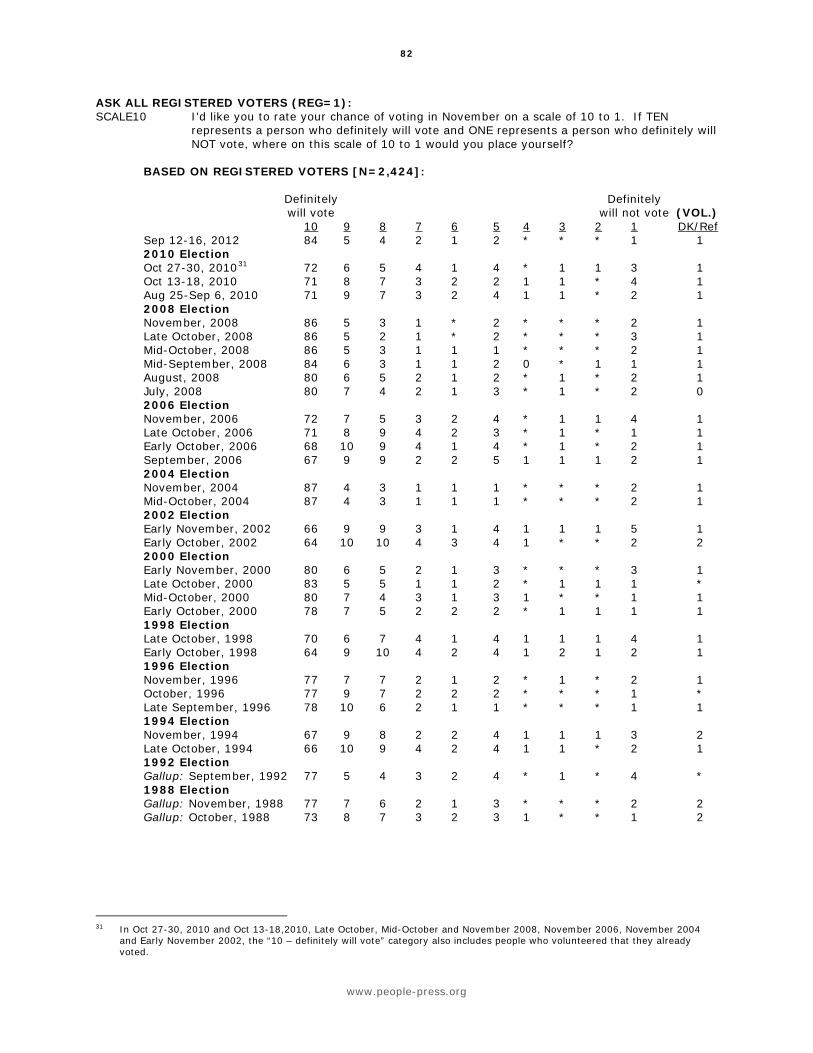
82
www.people-press.org
ASK ALL REGISTERED VOTERS (REG=1): SCALE10 I'd like you to rate your chance of voting in November on a scale of 10 to 1. If TEN
represents a person who definitely will vote and ONE represents a person who definitely will NOT vote, where on this scale of 10 to 1 would you place yourself?
BASED ON REGISTERED VOTERS [N=2,424]: Definitely Definitely will vote will not vote (VOL.) 10 9 8 7 6 5 4 3 2 1 DK/Ref Sep 12-16, 2012 84 5 4 2 1 2 * * * 1 1 2010 Election Oct 27-30, 201031
Oct 13-18, 2010 71 8 7 3 2 2 1 1 * 4 1 72 6 5 4 1 4 * 1 1 3 1
Aug 25-Sep 6, 2010 71 9 7 3 2 4 1 1 * 2 1 2008 Election November, 2008 86 5 3 1 * 2 * * * 2 1 Late October, 2008 86 5 2 1 * 2 * * * 3 1 Mid-October, 2008 86 5 3 1 1 1 * * * 2 1 Mid-September, 2008 84 6 3 1 1 2 0 * 1 1 1 August, 2008 80 6 5 2 1 2 * 1 * 2 1 July, 2008 80 7 4 2 1 3 * 1 * 2 0 2006 Election November, 2006 72 7 5 3 2 4 * 1 1 4 1 Late October, 2006 71 8 9 4 2 3 * 1 * 1 1 Early October, 2006 68 10 9 4 1 4 * 1 * 2 1 September, 2006 67 9 9 2 2 5 1 1 1 2 1 2004 Election November, 2004 87 4 3 1 1 1 * * * 2 1 Mid-October, 2004 87 4 3 1 1 1 * * * 2 1 2002 Election Early November, 2002 66 9 9 3 1 4 1 1 1 5 1 Early October, 2002 64 10 10 4 3 4 1 * * 2 2 2000 Election Early November, 2000 80 6 5 2 1 3 * * * 3 1 Late October, 2000 83 5 5 1 1 2 * 1 1 1 * Mid-October, 2000 80 7 4 3 1 3 1 * * 1 1 Early October, 2000 78 7 5 2 2 2 * 1 1 1 1 1998 Election Late October, 1998 70 6 7 4 1 4 1 1 1 4 1 Early October, 1998 64 9 10 4 2 4 1 2 1 2 1 1996 Election November, 1996 77 7 7 2 1 2 * 1 * 2 1 October, 1996 77 9 7 2 2 2 * * * 1 * Late September, 1996 78 10 6 2 1 1 * * * 1 1 1994 Election November, 1994 67 9 8 2 2 4 1 1 1 3 2 Late October, 1994 66 10 9 4 2 4 1 1 * 2 1 1992 Election Gallup: September, 1992 77 5 4 3 2 4 * 1 * 4 * 1988 Election Gallup: November, 1988 77 7 6 2 1 3 * * * 2 2 Gallup: October, 1988 73 8 7 3 2 3 1 * * 1 2
31 In Oct 27-30, 2010 and Oct 13-18,2010, Late October, Mid-October and November 2008, November 2006, November 2004
and Early November 2002, the “10 – definitely will vote” category also includes people who volunteered that they already voted.

83
www.people-press.org
PEW RESEARCH CENTER September 13-16, 2012 OMNIBUS
FINAL TOPLINE N=1,001
PEW.1-PEW.3 PREVIOUSLY RELEASED ASK ALL: PEW.4 Next, I’m going to name some third party presidential candidates. Not everyone will have heard of
them. Have you heard of [INSERT NAME, RANDOMIZE], or not? [IF HEARD OF: Have you heard a lot or just a little?]
Yes, Yes, No, (VOL.) heard a lot heard a little not heard of DK/Ref a. Gary Johnson of the Libertarian Party September 13-16, 2012 4 17 78 1 b. Jill Stein of the Green Party September 13-16, 2012 2 14 83 1 c. Virgil Goode of the Constitution Party September 13-16, 2012 1 7 91 1 NO QUESTION PEW.5 ASK ALL: Thinking about foreign policy and national security … RANDOMIZE PEW.6 AND PEW.7 ASK ALL: PEW.6 Do you think Barack Obama is too tough, not tough enough or about right in his approach to foreign
policy and national security issues? BASED ON REGISTERED VOTERS [N=824]: Sep 13-16 Apr 21-26 Oct 28-Nov 8 June 10-14 2012 2010 2009 2009 1 Too tough 2 3 2 47 Not tough enough 47 47 38 40 About right 41 43 51 12 Don’t know/Refused (VOL.) 10 7 8 RANDOMIZE PEW.6 AND PEW.7 ASK ALL: PEW.7 Do you think Mitt Romney would be too tough, not tough enough, or about right in his approach to
foreign policy and national security issues? BASED ON REGISTERED VOTERS [N=824]: Sep 13-16 2012 16 Too tough 22 Not tough enough 34 About right 28 Don’t know/Refused (VOL.)
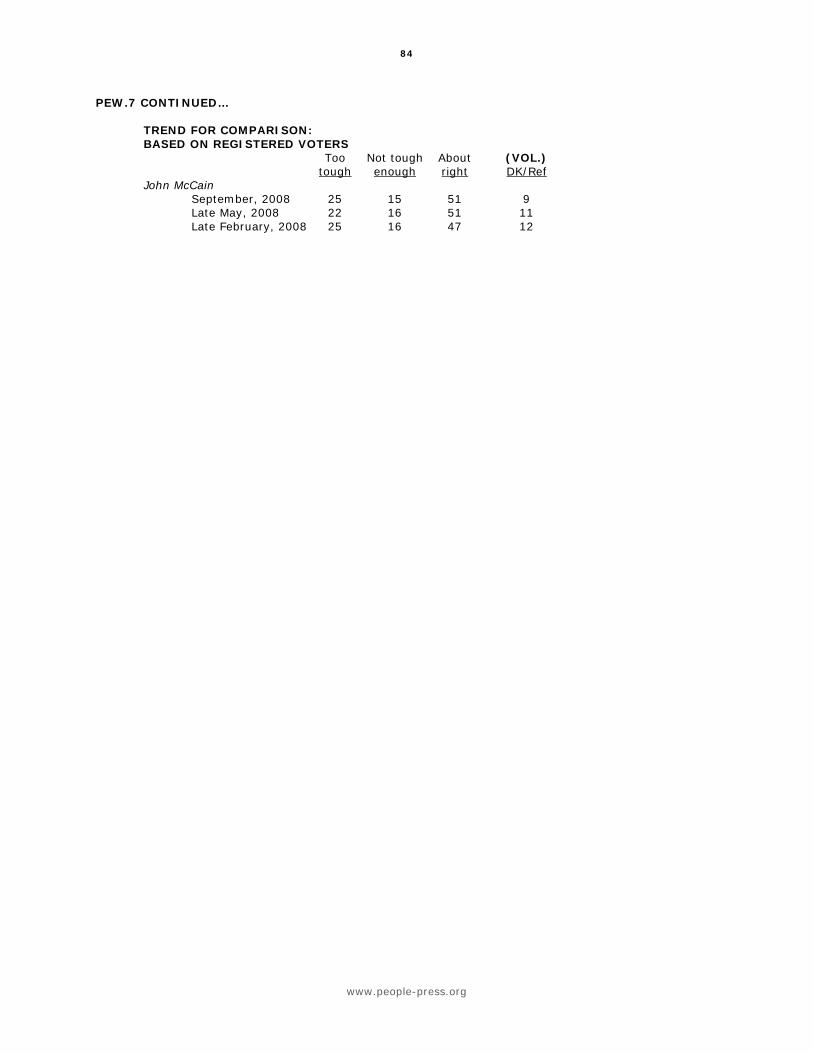
84
www.people-press.org
PEW.7 CONTINUED… TREND FOR COMPARISON: BASED ON REGISTERED VOTERS Too Not tough About (VOL.) tough enough right DK/Ref John McCain September, 2008 25 15 51 9 Late May, 2008 22 16 51 11 Late February, 2008 25 16 47 12
Related Documents


