Your Students, Your Post-School Outcomes: Accessing Your New PSO Reports OAVSNP 2014 Charlotte Alverson, NPSO Pattie Johnson, TRI Sally Simich, ODE 1

OAVSNP 2014 Charlotte Alverson, NPSO Pattie Johnson, TRI Sally Simich, ODE 1.
Dec 25, 2015
Welcome message from author
This document is posted to help you gain knowledge. Please leave a comment to let me know what you think about it! Share it to your friends and learn new things together.
Transcript

Your Students, Your Post-School Outcomes:
Accessing Your New PSO Reports
OAVSNP 2014
Charlotte Alverson, NPSO
Pattie Johnson, TRI
Sally Simich, ODE
1

Q and A about PSO » How many of you called students in the
past for PSO data collection?» How many of you will call students this
spring/summer for PSO data collection?» Share positive strategies for those who may be
new to the process» Tell us about any trouble or concerns you’ve
encountered
» How many of you have seen your district data after they were collected?

PSO Data Collection
» PSO data are collected on youth who the districts report left school the previous year, including graduates, age-outs, dropouts, and excludes youth who were not expected to return, but did.
» All districts are required to participate each year. Student selection is based on a stratified sample designed to generate a representative sample of leavers to ensure generalizable information.
» Districts select who will conduct the interviews, and data entry is open from June through September. Interviews can be completed with young adult or their family members.
3

Response Rate & Representativeness
» Response rate – one measure of the quality of interview data˃ Defined as the number of completed interviews divided
by the number of youth eligible to take the survey
» Representativeness – measure of how similar those who respond to the interview are to the target population ˃ Parameter guidelines set by NPSO, and approved by
OSEP, as +/-3%
4

Have we interviewed the right students?
Year LD ED ID All Others Female Minority Dropout
2010 Yes Yes Yes Yes Yes YesNo
6% low
2011 Yes Yes Yes Yes Yes YesNo
6% low
2012 Yes Yes Yes Yes Yes YesNo
6% low
2013 Yes Yes Yes Yes Yes YesNo
8% low
Completing Interviews with a representative sample of the students who left school the previous year allows Oregon to make statements about all students by disability, gender, race/ ethnicity and dropout.
Interview More Youth who Dropout
How many calls would it take to make a difference?
» Dropouts: ˃ Statewide, dropouts make up around 25% of the leaver population
(1,081 youth). ˃ If each of the districts completed one more interviews with a youth
who dropped out, the percent completed for this very important group of leavers would increase from:
18% to 47%˃ Learning from these youth would have a huge
impact on the quality of transition programs in the districts and throughout the state
» Lets look at some overall data trends over the four years of consistent data collection
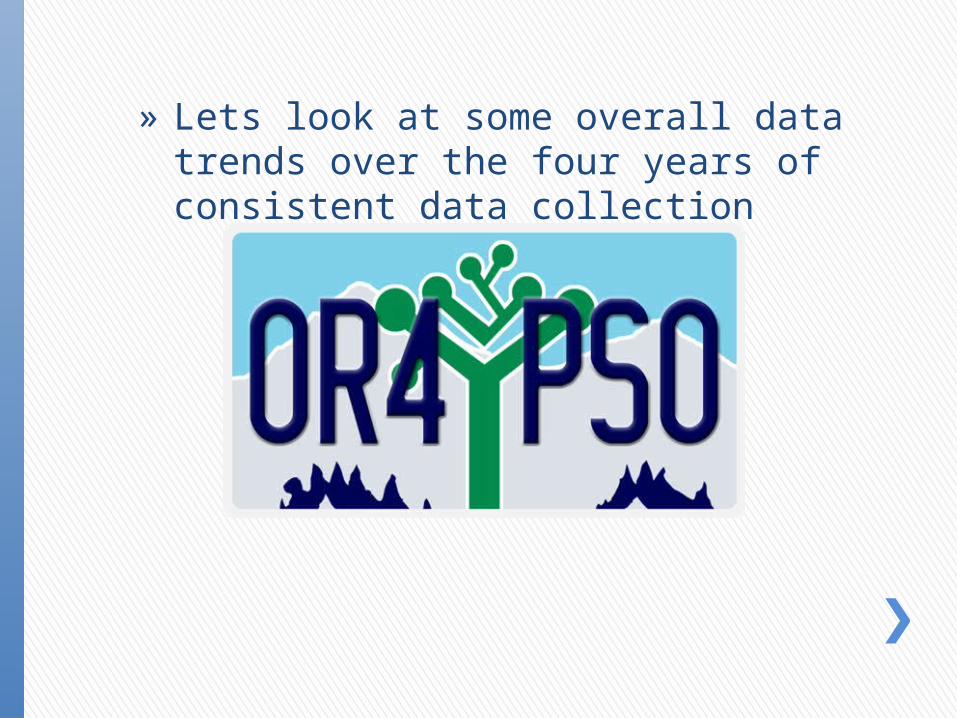
Response Rate2010 2011 2012 2013
0
500
1000
1500
2000
2500
3000
0%
10%
20%
30%
40%
50%
60%
70%
80%
90%
100%
27182779
2714 2660
1,9111,989
1,748
1,914
SampleCompletedResponse Rate
Sample Leavers, Response Rate, and Completed Interviews for Four Years

Response Rate
Very Small Small Medium Large
46%
67%
73% 72%
66%61%
77%
71%
37%
70%
55%
71%
55%57%
77%75%
Response Rate by District Size2010 2011 2012 2013

Engagement Rate
Very Small Small Medium Large
52%
62% 64%69%
52%
62% 64%69%71% 71% 71% 73%
80%
71% 72%67%
Overall Engagement Rate by District Size
2010 2011 2012 2013
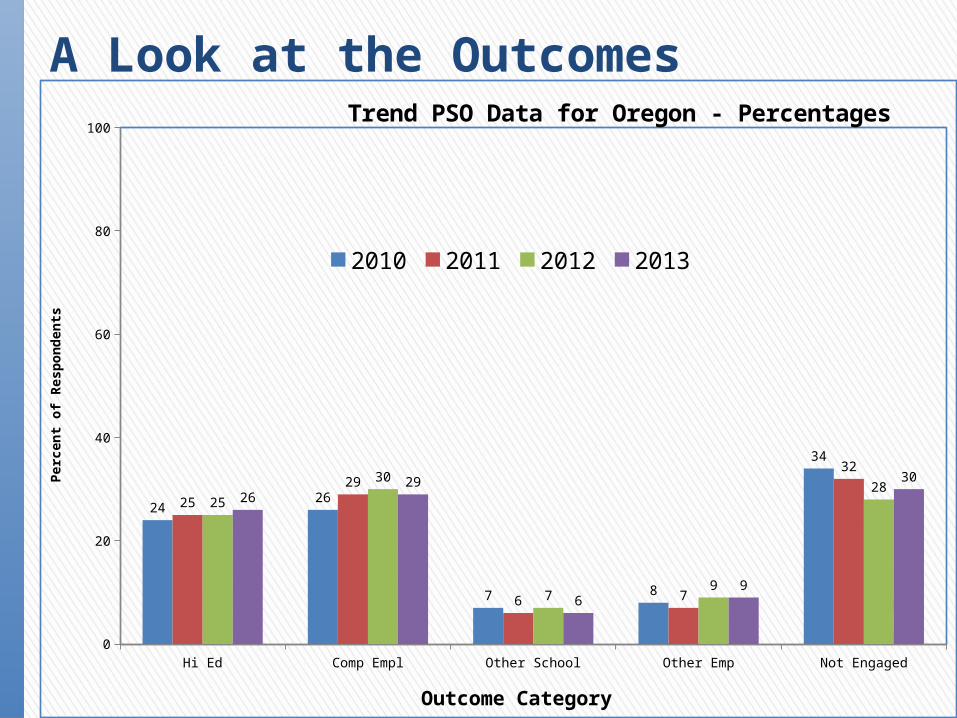
A Look at the Outcomes
Hi Ed Comp Empl Other School Other Emp Not Engaged0
20
40
60
80
100
2426
7 8
34
25
29
6 7
32
25
30
79
2826
29
69
30
Trend PSO Data for Oregon - Percentages
2010 2011 2012 2013
Outcome Category
Per
cen
t o
f R
esp
on
den
ts

Every Student Matters
Districts with 1-50 annual leavers
Every single youth who gets a job, or goes on to get more training has a huge impact on the data, but most important: the district had a huge impact on that youths’ future.
Districts with over 50 annual leavers
If each of the 19 large districts completed 7 additional interviews next year, the response rate would top 80%. Knowing about the outcomes for 4 of 5 leavers will greatly impact the quality and usefulness of the data collection. We need to know how well prepared the youth who leave our districts are for a successful transition to adult life.
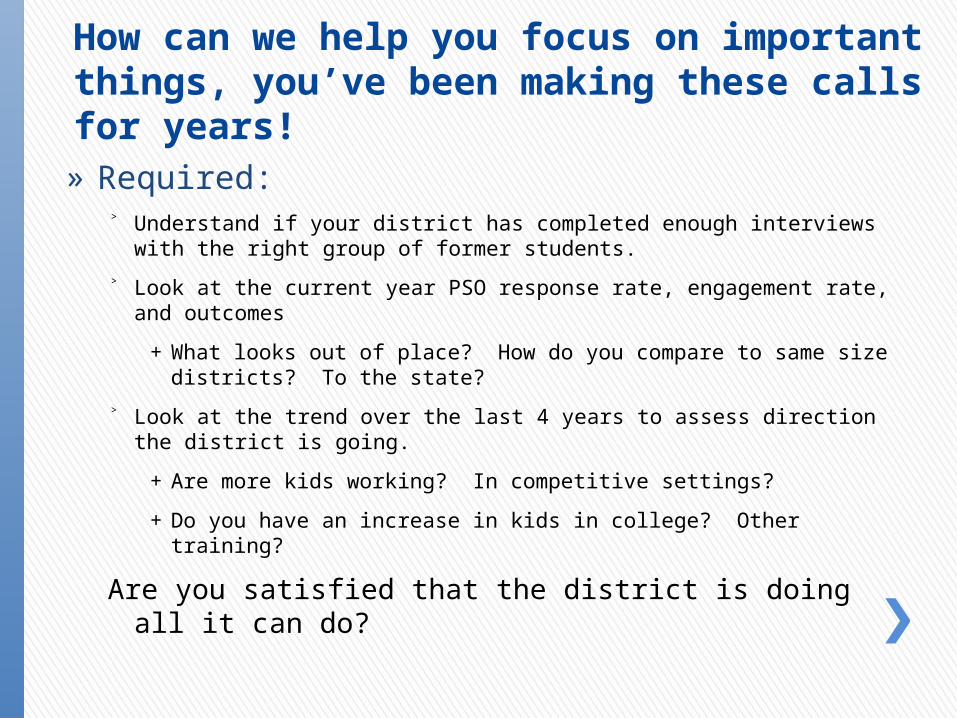
How can we help you focus on important things, you’ve been making these calls for years!
» Required:˃ Understand if your district has completed enough interviews with the
right group of former students.
˃ Look at the current year PSO response rate, engagement rate, and outcomes
+ What looks out of place? How do you compare to same size districts? To the state?
˃ Look at the trend over the last 4 years to assess direction the district is going.
+ Are more kids working? In competitive settings?
+ Do you have an increase in kids in college? Other training?
Are you satisfied that the district is doing all it can do?
Your Students’ Post-School Outcomes?

New Report Format
» There are two new follow up reports on the PSO 2.0 application site https://district.ode.state.or.us/apps/login/default.aspx
» We will show examples of the new report.» Engagement Report includes information on who is
engaged and if your sample matches the total leavers
» Interview Summary Report summarize your interview data, including the open ended responses.
» Comparable reports from 2010, 2011, and 2012 will be available as soon as we make sure everything lines up!
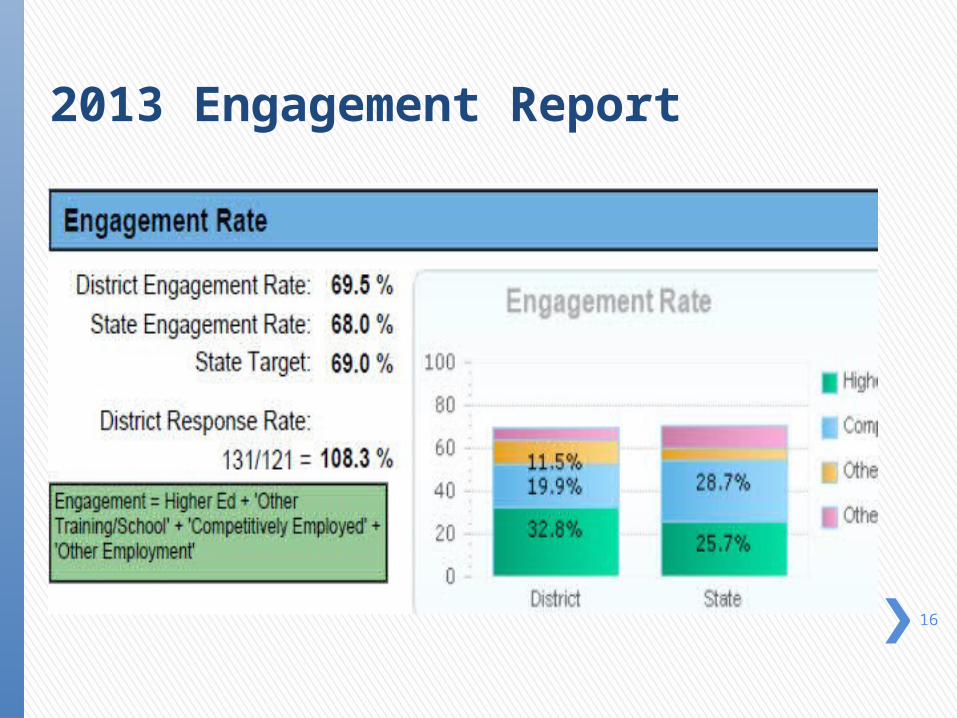
2013 Engagement Report
.
16
Goal
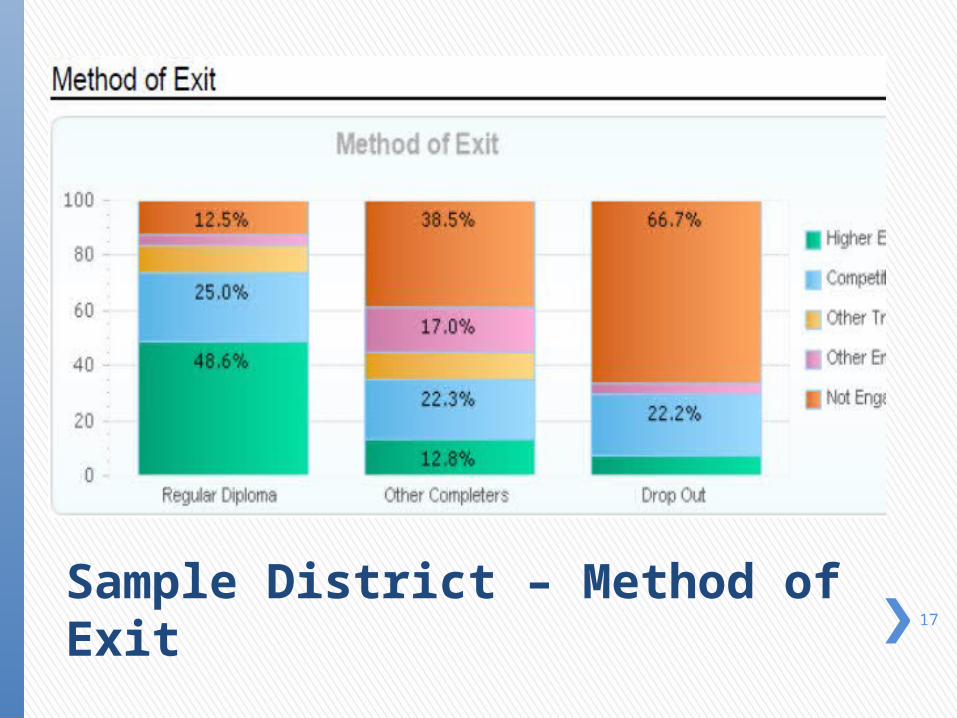
Sample District – Method of Exit 17
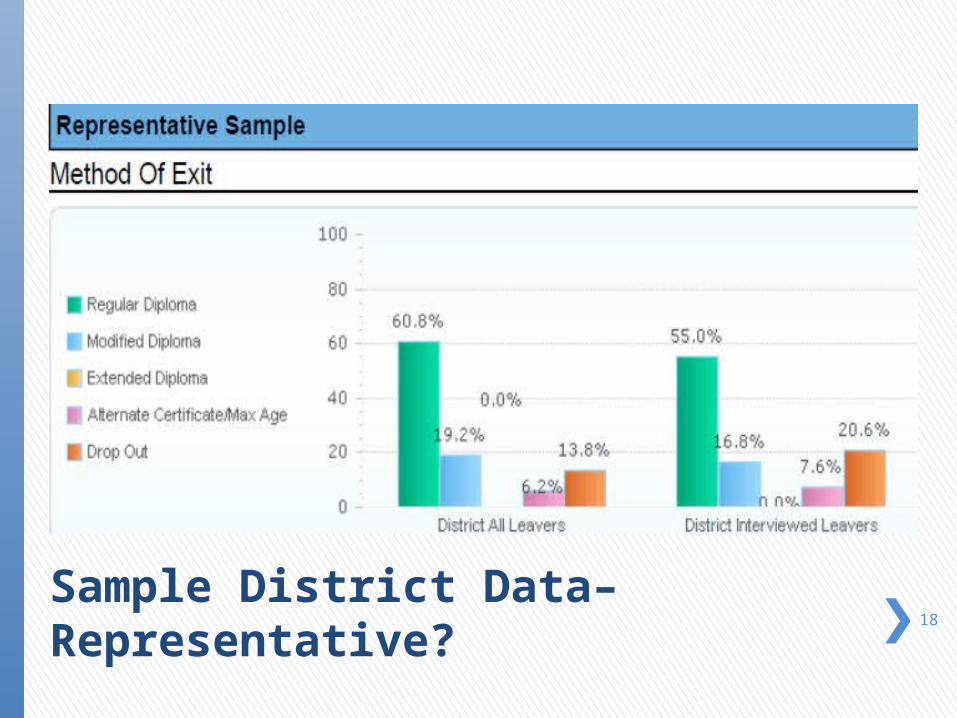
Sample District Data– Representative?18
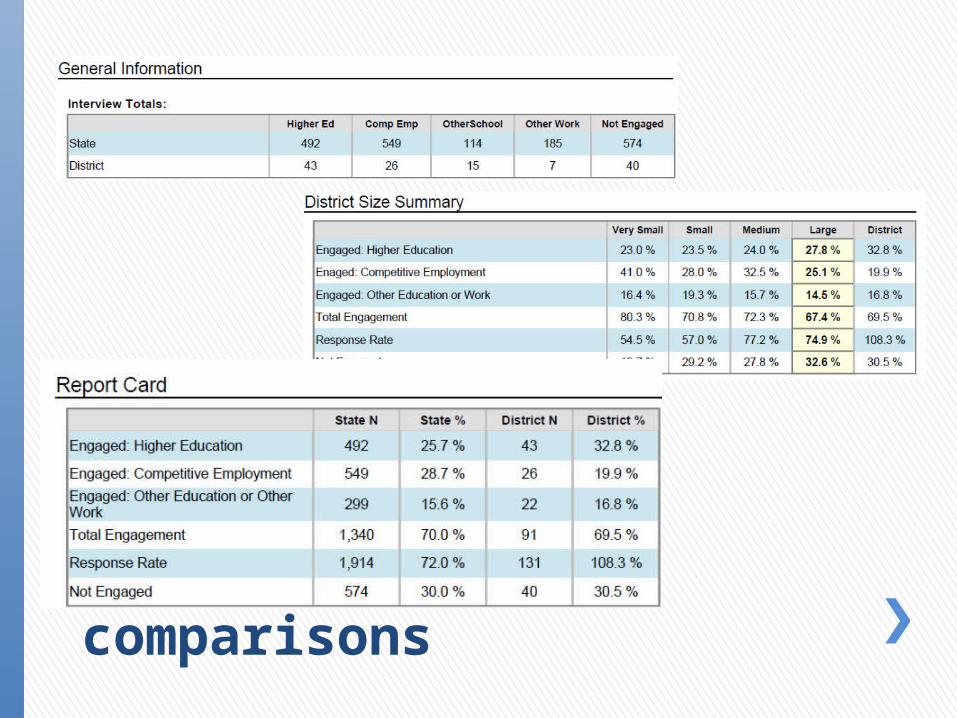
District and State comparisons

Where Do I Get My Data?
» The Post School Outcomes Data Reports are on the PSO 2.0 Application
˃ Access is provided through District Security Administrator˃ District and Building level reports available˃ Exit data entry now open, signed agreement to participate required˃ Follow Up list of leavers to interview will be posted early April˃ Data entry for the Follow Up starts June 1st
˃ Districts must have updated contact information+ Primary Exit and Follow Up contacts, + District staff conducting the follow up interviews, + Secondary transition educators.
˃ The Contact List allows state staff to inform appropriate district representatives of trainings and other transition related information.
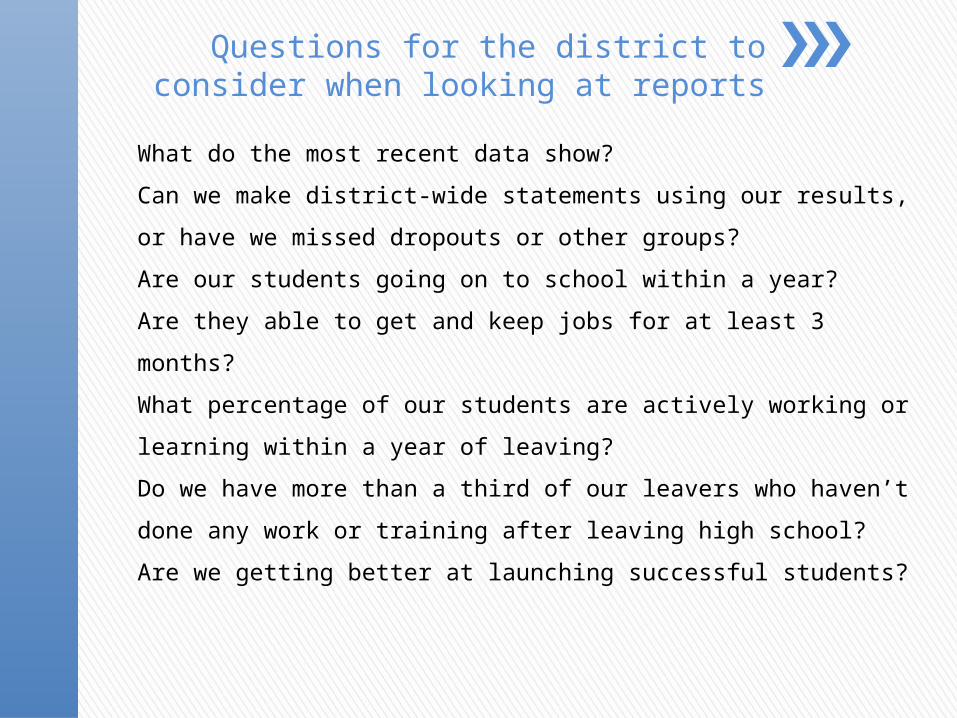
Questions for the district to consider when looking at reports
What do the most recent data show?
Can we make district-wide statements using our results, or
have we missed dropouts or other groups?
Are our students going on to school within a year?
Are they able to get and keep jobs for at least 3 months?
What percentage of our students are actively working or
learning within a year of leaving?
Do we have more than a third of our leavers who haven’t
done any work or training after leaving high school?
Are we getting better at launching successful students?

Next Steps
» Look at the PSO data for your district
» Identify areas of strength and areas for
improvement
» Share and discuss data with stakeholders
» Use data to determine what changes are needed
» Call Sally and Pattie with questions

For more information:
Sally SimichTransition Specialist, Oregon Department of Education
[email protected] 503-947-5639
Pattie JohnsonTeaching Research Institute, Western Oregon University
[email protected] 503-838-8779
Charlotte Y. AlversonNational Post School Outcomes Center, University of Oregon
[email protected] 541-346-1390
Related Documents