Y/SUB/96-KDS15V/2 Y-12 OAK RIDGE Y-12 PLANT LOCKHBMD MAR TIH X OF THIS DOCUMENT MANAGED BY LOCKHEED MARTIN ENERGY SYSTEMS, INC. FOR THE UNITED STATES DEPARTMENT OF ENERGY UCN-13672 (28 6*5) OEC 2 0 13SS CALENDAR YEAR 1995 GROUNDWATER QUALITY REPORT FOR THE CHESTNUT RIDGE HYDROGEOLOGIC REGIME Y-12 PLANT, OAK RIDGE, TENNESSEE Part 2: 1995 Groundwater Quality Data Interpretations and Proposed Program Modifications August 1996 Prepared by AJA TECHNICAL SERVICES, INC. Under Subcontract 70Y-KDS15V for the Y-12 Plant Surveillance and Maintenance Program, Environmental Restoration Division, and the Environmental Management Department Health, Safety, Environment, and Accountability Organization Oak Ridge Y-12 Plant Oak Ridge, Tennessee 37831 S UNLIMITED Managed by LOCKHEED MARTIN ENERGY SYSTEMS, INC. for the U.S. Department of Energy Under Contract No. DE-AC05-84OR21400

Welcome message from author
This document is posted to help you gain knowledge. Please leave a comment to let me know what you think about it! Share it to your friends and learn new things together.
Transcript
Y/SUB/96-KDS15V/2
Y-12OAK RIDGEY-12PLANT
LOCKHBMD MAR TIH
XOF THIS DOCUMENT
MANAGED BYLOCKHEED MARTIN ENERGY SYSTEMS, INC.FOR THE UNITED STATESDEPARTMENT OF ENERGY
UCN-13672 (28 6*5)
OEC 2 0 13SS
CALENDAR YEAR 1995GROUNDWATER QUALITY REPORT
FOR THECHESTNUT RIDGE HYDROGEOLOGIC REGIME
Y-12 PLANT, OAK RIDGE, TENNESSEE
Part 2: 1995 Groundwater Quality DataInterpretations and Proposed Program
Modifications
August 1996
Prepared by
AJA TECHNICAL SERVICES, INC.Under Subcontract 70Y-KDS15V
for the
Y-12 Plant Surveillance and Maintenance Program,Environmental Restoration Division,
and theEnvironmental Management Department
Health, Safety, Environment, and Accountability OrganizationOak Ridge Y-12 Plant
Oak Ridge, Tennessee 37831
S UNLIMITED Managed by
LOCKHEED MARTIN ENERGY SYSTEMS, INC.for the U.S. Department of Energy
Under Contract No. DE-AC05-84OR21400

DISCLAIMER
This report was prepared as an account of work sponsored by an agency of theUnited States Government. Neither the United States Government nor any agencythereof, nor any of their employees, makes any warranty, express or implied, orassumes any legal liability or responsibility for the accuracy, completeness, or use-fulness of any information, apparatus, product, or process disclosed, or representsthat its use would not infringe privately owned rights. Reference herein to anyspecific commercial product, process, or service by trade name, trademark, manu-facturer, or otherwise, does not necessarily constitute or imply its endorsement,recommendation, or favoring by the United States Government or any agencythereof. The views and opinions of authors expressed herein do not necessarilystate or reflect those of the United States Government or any agency thereof.

Y/SUB/96-KDS15V/2
CALENDAR YEAR 1995GROUNDWATER QUALITY REPORT
FOR THECHESTNUT RIDGE HYDROGEOLOGIC REGIME
Y-12 PLANT, OAK RIDGE, TENNESSEE
Part 2: 1995 Groundwater Quality DataInterpretations and Proposed Program
Modifications
August 1996
Prepared by
AJA TECHNICAL SERVICES, INC.Under Subcontract 70Y-KDS15V
for the
Y-12 Plant Surveillance and Maintenance Program,Environmental Restoration Division,
andtheEnvironmental Management Department
Health, Safety, Environment, and Accountability OrganizationOak Ridge Y-12 Plant
Oak Ridge, Tennessee 37831
Managed by
LOCKHEED MARTIN ENERGY SYSTEMS, INC.for the U.S. Department of Energy
Under Contract No. DE-AC05-84OR21400

DISCLAIMER
This report was prepared as an account of work sponsored hy an agency of the UnitedStates Government Neither the United States Government nor any agency thereof, norany of their employees, make any warranty, express or implied, or assumes any legal liabili-ty or responsibility for the accuracy, completeness, or usefulness of any information, appa-ratus, product, or process disclosed, or represents that its use would not infringe privatelyowned rights. Reference herein to any specific commercial product, process, or service bytrade name, trademark, manufacturer, or otherwise does not necessarily constitute orimply its endorsement, recommendation, or favoring by the United States Government orany agency thereof. The views and opinions of authors expressed herein do not necessar-ily state or reflect those of the United States Government or any agency thereof.

DISCLAIMER
Portions of this document may be illegiblein electronic image products. Images areproduced from the best available originaldocument

CONTENTS
Section PageList of Figures iiList of Tables iiiList of Acronyms and Abbreviations iv
1.0 INTRODUCTION 1-12.0 SITE DESCRIPTIONS 2-1
2.1 CERCLA Operable Units and Study Areas 2-12.2 RCRA Treatment, Storage, or Disposal Facilities 2-32.3 Solid Waste Disposal and Storage Facilities 2-4
3.0 HYDROGEOLOGIC FRAMEWORK 3-13.1 Geology 3-13.2 Groundwater System 3-2
3.2.1 StormflowZone 3-33.2.2 Vadose Zone 3-43.2.3 Groundwater Zone 3-53.2.4 Aquiclude 3-6
3.3 Groundwater Flow Directions 3-63.4 Groundwater Geochemistry 3-6
4.0 GROUNDWATER QUALITY MONITORING PROGRAMS 4-14.1 Sampling Locations 4-14.2 Sampling Frequency 4-14.3 Sample Collection 4-34.4 Laboratory Analysis 4-34.5 Quality Assurance/Quality Control Sampling 4-4
5.0 DATA ANALYSIS AND INTERPRETATION 5-15.1 Principal Ions 5-15.2 Trace Metals 5-35.3 Volatile Organic Compounds 5-55.4 Radioactivity 5-9
6.0 CONCLUSIONS AND RECOMMENDATIONS 6-17.0 REFERENCES 7-1
Appendix A: FIGURES A-lAppendixB: TABLES B-lAppendix C: DATA SCREENING AND EVALUATION CRITERIA C-l
List of Figures
Figure Page1 Regional Location of the Y-12 Plant A-l
2 Hydrogeologic Regimes atthe Y-12 Plant A-2
3 Waste-Management Sites and CERCLA Operable Units in the Chestnut RidgeHydrogeologic Regime A-3
4 Topography and Bedrock Geology in the Chestnut RidgeHydrogeologic Regime A-4
5 Schematic Profile of Hydrostratigraphic Units in the Chestnut RidgeHydrogeologic Regime A-5
6 Groundwater Elevations in the Chestnut Ridge Hydrogeologic Regime A-6
7 Groundwater Geochemistry in the Chestnut Ridge Hydrogeologic Regime A-7
8 CY 1995 Groundwater Sampling Locations A-8
9 Nitrate Concentrations in Groundwater at Wells GW-144 and GW-147 A-9
10 Total Boron Concentrations in Groundwater at Wells GW-217 and GW-522 A-10
11 Boron, Strontium, and Uranium Concentrations in Groundwater atKerr Hollow Quarry A-l 1
12 Horizontal Extent of VOCs in Groundwater in the Chestnut Ridge
Hydrogeologic Regime A-12
13 Distribution of VOCs in Groundwater at the Chestnut Ridge Security Pits A-13
14 Vertical Extent of VOCs in Groundwater at the Chestnut Ridge Security Pits A-14
15 Concentrations of Selected VOCs in Groundwater at Wells GW-177 and GW-609 A-15
16 Concentrations of 1,1,1-TCA in Groundwater at Well GW-305 A-16
u

List of Tables
Table Page1 Waste-Management Sites and CERCLA Operable Units in the
Chestnut Ridge Hydrogeologic Regime B-l
2 Monitoring Programs Implemented During CY 1995 B-2
3 Construction Information for Monitoring Wells Sampled During CY 1995 B-6
4 VOCs Detected in CY 1995 QA/QC Samples B-10
5 CY 1995 Median Trace Metal Concentrations that Exceed UTLs or MCLs B-l 1
6 Annual Average VOC Concentrations in CY 1995 Groundwater Samples B-14
7 CY 1995 Gross Alpha and Gross Beta Activities that Exceed MDAs B-l 6
8 CY 1995 Radioisotope Activities that Exceed MDAs B-18
m

List of Acronyms and Abbreviations
ASOBCVbgsCACERCLA
Chestnut Ridge RegimeCYDOEEnergy SystemsEPADNAPLsftft/dGWPPGWQRHSEAK-25MCLMDAfzg/Lmg/LORNLORROUPCEpCi/LppmQA/QCRCRARI/FSRODSecurity PitsSediment Disposal BasinSESDSWDFTDECTDSTSD
Analytical Services OrganizationBear Creek Valleybelow ground surfaceCharacterization AreaComprehensive Environmental Response, Compensation, andLiability ActChestnut Ridge Hydrogeologic Regimecalendar yearU.S. Department of EnergyLockheed Martin Energy Systems, Inc.U.S. Environmental Protection Agencydense, non-aqueous phase liquidsfeetfeet per dayGroundwater Protection ProgramGroundwater Quality ReportHealth, Safety, Environment, and Accountability (Organization)Oak Ridge K-25 Sitemaximum contaminant level (for drinking water)minimum detection activitymicrograms per litermilligrams per literOak Ridge National LaboratoryOak Ridge Reservationoperable unittetrachloroethenepicoCuries per literparts per millionquality assurance/quality controlResource Conservation and Recovery ActRemedial Investigation/Feasibility Studyrecord of decisionChestnut Ridge Security PitsChestnut Ridge Sediment Disposal BasinSampling and Environmental Support Departmentsolid waste disposal facility (non-RCRA)Tennessee Department of Environment and Conservationtotal dissolved solidstreatment, storage, and disposal (unit)
IV
List of Acronyms and Abbreviations (cont'd)
TSS total suspended solidsUTL upper tolerance limitVOC volatile organic compound1,1-DCA 1,1-dichloroethane1,1-DCE 1,1-dichloroethene1,2-DCE 1,2-dichloroethene1,1,1-TCA 1,1,1-trichloroethane

1.0 INTRODUCTION
This groundwater quality report (GWQR) contains an evaluation of the groundwater
monitoring data obtained during calendar year (CY) 1995 from monitoring wells and springs located
at or near several hazardous and non-hazardous waste management facilities associated with the U.S.
Department of Energy (DOE) Y-12 Plant (Figure 1). These sites are within the boundaries of the
Chestnut Ridge Hydrogeologic Regime (Chestnut Ridge Regime), which is one of three
hydrogeologic regimes defined for the purposes of the Y-12 Plant Groundwater Protection Program
(GWPP) (Figure 2). Directed by the Environmental Management Department of the Y-12 Plant
Health, Safety, Environment, and Accountability (HSEA) Organization, the objectives of the GWPP
are to provide the monitoring data necessary for compliance with applicable federal, state, and local
regulations, DOE Orders, and Lockheed Martin Energy Systems, Inc. (Energy Systems) corporate
policy.
The data obtained during CY 1995 for the purposes of the Y-12 Plant GWPP are presented
in: Calendar Year 1995 Groundwater Quality Report for the Chestnut Ridge Hydrogeologic Regime,
Y-12 Plant, Oak Ridge, Tennessee: 1995 Groundwater Quality Data and Calculated Rate of
Contaminant Migration (Lockheed Martin Energy Systems, Inc. 1996), which is hereafter referred
to as the Part 1 GWQR. The following evaluation of the data is organized into background
regulatory information and site descriptions (Section 2.0), an overview of the hydrogeologic
framework (Section 3.0), a summary of the CY 1995 groundwater monitoring programs and
associated sampling and analysis activities (Section 4.0), analysis and interpretation of the data for
inorganic, organic, and radiological analytes (Section 5.0), a summary of conclusions and
recommendations (Section 6.0), and a list of cited references (Section 7.0). Appendix A contains
supporting maps, cross sections, diagrams, and graphs; data tables and summaries are in Appendix
B. Detailed descriptions of the data screening and evaluation criteria are included in Appendix C.
1-1
2.0 SITE DESCRIPTIONS
The Chestnut Ridge Regime lies south of the Y-12 Plant, and is flanked to the north by Bear
Creek Valley (BCV) and to the south by Bethel Valley (unless otherwise noted, directions are in
reference to the Y-12 Plant grid system). The regime encompasses Chestnut Ridge west of Scarboro
Road and east of an unnamed drainage feature southwest of the Y-12 Plant (Figure 3). Groundwater
quality monitoring in the Chestnut Ridge Regime was performed during CY 1995 at three classes
of waste-management facilities (Table 1).
• Operable units (OUs) subject to regulation under the Comprehensive EnvironmentalResponse, Compensation, and Liability Act (CERCLA), or lower priority Study Areasthat may warrant a future CERCLA remedial investigation/feasibility study (RI/FS).
• Resource Conservation and Recovery Act (RCRA) hazardous waste treatment, storage, .and disposal (TSD) units, some of which also are subject to regulation under CERCLA.
• Nonhazardous solid waste disposal facilities (SWDFs).
General descriptions of each site are provided in the following sections; more detailed descriptions,
and discussions of the regulatory status and the groundwater monitoring history of each site, are
included in Section 2.0 of the Part 1 GWQR.
2.1 CERCLA Operable Units and Study Areas
Four sites are designated as CERCLA OUs, including one RCRA TSD unit (the Chestnut
Ridge Security Pits [Security Pits]) and three former RCRA solid waste management units (the Ash
Disposal Basin, the United Nuclear Corporation Site, and Rogers Quarry). Additionally, the
Chestnut Ridge Borrow Area Waste Pile is currently listed as a Study Area to be investigated under
CERCLA (Table 1).
The Security Pits (Chestnut Ridge OU 01) are located on the crest of Chestnut Ridge south
of the central portion of the Y-12 Plant (Figure 3). A closed RCRA TSD unit that began operations
in 1973 and was granted RCRA interim status in 1986, the Security Pits consist of two areas, each
containing a series of east-west oriented trenches that are about 8 to 10 feet (ft) wide, 10 to 18 ft
2-1
deep, and 700 to 800 ft long, that were used for disposal of hazardous waste until December 1984,
and for disposal of nonhazardous waste until November 1988 (Energy Systems 1988). Closure of
the site per RCRA requirements was completed in 1989 and involved installation of a
low-permeability cap over the disposal trenches. Quarterly groundwater quality assessment
monitoring was initiated at the Security Pits in January 1988, and was performed in accordance with
applicable RCRA interim status regulatory requirements through 1995. As specified in the RCRA
post-closure permit issued by the Tennessee Department of Environment and Conservation (TDEC)
on March 8,1996, which incorporated several regulatory-driver agreements between DOE, the U.S.
Environmental Protection Agency (EPA), and the TDEC, semiannual post-closure corrective action
monitoring is currently in progress. Additionally, an RI work plan was submitted for EPA and
TDEC approval in CY 1993 (U.S. Department of Energy 1993a), but no actions under CERCLA
are currently planned.
The Ash Disposal Basin (Chestnut Ridge OU 02), also known as the Filled Coal Ash Pond,
is on the southern flank of Chestnut Ridge about one-half mile south of the Y-12 Plant (Figure 3).
Construction of an earthen dam across a northern tributary of McCoy Branch created the basin in
1955, which by 1967 was filled with fly-ash slurry pumped from the Y-12 Steam Plant (Battelle
Columbus Division 1988). Field activities for the RI were completed in June 1993; the RI report
was issued in August 1994 (U.S. Department of Energy 1994), followed by the FS in January 1995
(U.S. Department of Energy 1995). Corrective actions at the site are ongoing and include dam
stabilization and wetlands construction in accordance with an approved CERCLA record of
decision (ROD). Semiannual groundwater monitoring is performed at the site as a best-
management practice.
The United Nuclear Corporation Site (Chestnut Ridge OU 03) lies on the crest of Chestnut
Ridge southeast of the west end of the Y-12 Plant (Figure 3). The site was used to landfill 11,000
drums (55-gallon) of sludge fixed in cement, 18,000 drums of contaminated soil, and 288 boxes of
contaminated process and demolition materials (U.S. Department of Energy 1993b). Waste
disposal ceased in 1984 (Grutzeck 1987), and the site was capped and closed in CY 1992 in
accordance with a CERCLA ROD (U.S. Department of Energy 1991) and a RCRA closure plan.
Post-closure semiannual groundwater monitoring has been performed (in accordance with the ROD)
2-2

as a service to the Y-12 Plant Environmental Restoration Surveillance and Maintenance Program
(Martin Marietta Energy Systems, Inc. 1992).
Rogers Quarry (Chestnut Ridge OU 04) is in the southwest portion of the Chestnut Ridge
Regime about three miles west of Kerr Hollow Quarry (Figure 3). The site served as a source of
stone construction material from the 1940s through the late-1950s, and was abandoned in the early
1960s when it filled with water. Beginning in 1967, the site received fly-ash slurry from the Y-12
Steam Plant that bypassed the filled Ash Disposal Basin through an emergency spillway and
discharged directly into McCoy Branch (King et al. 1989); disposal of fly ash in Rogers Quarry
ceased in July 1993 per agreement with the TDEC. Semiannual groundwater monitoring is
performed at the site as a best-management practice pending the outcome of the RI/FS process and
the CERCLA ROD. An RI work plan for this OU was submitted for review by the EPA and TDEC
in CY 1993 (U.S. Department of Energy 1993c).
The Chestnut Ridge Borrow Area Waste Pile, also known as the Civic Center Spoil Pile,
is currently listed as a Study Area to be investigated under CERCLA. Located near the eastern end
of the Chestnut Ridge Regime (Figure 3), the site was built as a temporary storage area for low-
level mercury contaminated soils removed from the City of Oak Ridge. Semiannual groundwater
monitoring at this site continued during CY 1995 as a best-management practice of the Y-12 Plant
GWPP.
2.2 RCRA Treatment, Storage, or Disposal Facilities
Three RCRA-regulated hazardous waste TSD facilities not designated as CERCLA OUs
are the Chestnut Ridge Sediment Disposal Basin (Sediment Disposal Basin), Kerr Hollow Quarry,
and East Chestnut Ridge Waste Pile (Table 1). The Sediment Disposal Basin and Kerr Hollow
Quarry are also considered low priority Study Areas under CERCLA.
The Sediment Disposal Basin is located on Chestnut Ridge, southeast of the east end of the
Y-12 Plant (Figure 3). It was used between 1973 and 1988 for the disposal of contaminated soils
and sediments removed from various areas within the Y-12 Plant and dredged from New Hope
Pond. Granted RCRA interim status in CY 1986, the site was closed in CY 1989 in accordance
with an approved RCRA closure plan; the TDEC issued a RCRA post-closure permit for the site
2-3
in September 1995. In October 1995, semiannual post-closure detection monitoring was initiated,
replacing the RCRA interim status detection monitoring program conducted at the site since CY
1987.
Kerr Hollow Quarry is in the southeastern portion of the Chestnut Ridge Regime (Figure 3)
and served as a source of stone construction material until it filled with water and was abandoned
in the late 1940s. From the early-1950s until November 1988, the site was used for the disposal
of reactive materials from the Y-12 Plant and the Oak Ridge National Laboratory (ORNL). Wastes
were removed from the quarry between mid-1990 and late-1993 to obtain certified clean-closure
status from the TDEC, but the site was finally closed with some remaining wastes in place.
Because clean closure of the site was not achieved, an application for a RCRA post-closure permit
was prepared for the site and submitted for review by the TDEC in June 1995; a CERCLA ROD
issued in September 1995 defined administrative controls for the site following waste removal
actions. Detection monitoring per RCRA interim status requirements has been in progress at the
Kerr Hollow Quarry since CY 1988. A RCRA post-closure permit for the site was issued in June
1996; therefore, the site is now under a post-closure detection monitoring program.
The East Chestnut Ridge Waste Pile is a lined, hazardous waste management facility
constructed in CY 1987 as a storage site for contaminated soils from the Y-12 Plant. The site is in
the eastern portion of the Chestnut Ridge Regime near the Sediment Disposal Basin (Figure 3). As
a lined facility, the East Chestnut Ridge Waste Pile is exempt from groundwater monitoring
requirements under RCRA. Nevertheless, groundwater monitoring has been performed at the site
since CY 1987 as a best-management practice of the Y-12 Plant GWPP.
2 3 Solid Waste Disposal and Storage Facilities
Five nonhazardous waste landfills are in the Chestnut Ridge Regime: Industrial Landfills
II, IV, and V, and Construction/Demolition Landfills VI and VII (Table 1). These sites are
classified as either Class II or Class IV facilities, as defined in the TDEC solid waste management
regulations. The facilities have operating permits issued by the TDEC and are currently used for
disposal of either sanitary solid wastes, industrial wastes, or demolition wastes generated at the
Y-12 Plant and elsewhere on the Oak Ridge Reservation (ORR). Semiannual detection monitoring
2-4
is performed at each site in accordance with applicable regulatory requirements and specific permit
conditions.
2-5

3.0 HYDROGEOLOGIC FRAMEWORK
This section contains a general description of the complex hydrogeologic system in the
Chestnut Ridge Regime. In general, the revised description of the hydrogeologic system
incorporates: (1) applicable aspects of the conceptual framework described in Solomon et al.
(1992), (2) hydrologic characteristics evaluated by Moore (1988 and 1989), and (3) findings of the
RI for the BCV characterization area (CA) (Science Applications International Corporation 1996).
3.1 Geology
The geology on the ORR is generally characterized by thrust-faulted sequences of
southeast-dipping, clastic (primarily shale and siltstone) and carbonate (limestone and dolostone)
strata of Lower Cambrian to Lower Ordovician age. In the Y-12 Plant area, the sandstone and
shales of the Rome Formation form Pine Ridge to the north, interbedded limestone and shale
formations of the Conasauga Group directly underlie the plant complex in BCV, primarily
dolostone strata of the Knox Group form Chestnut Ridge to the south, and the argillaceous
limestones and interbedded shales of the Chickamauga Group underlie Bethel Valley (Figure 4).
Strike and dip of bedding in the area is generally N 55°E and 45CSE, respectively (as referenced to
true north).
All sites in the Chestnut Ridge Regime except Kerr Hollow Quarry and Rogers Quarry are
directly underlain by reddish-brown to yellow-orange residuum overlying the Knox Group. The
residuum is characteristically acidic, predominantly composed of clays and iron sesquioxides, and
contains semi-continuous, relict beds of fractured chert and other lithologic inhomogeneities (such
as silt bodies) that provide a weakly connected network through which saturated flow can occur
(Solomon et al. 1992). The residuum is thin or nonexistent near karst features such as dolines (sink
holes), swallets (sinking streams), and solution pan features (Ketelle and Huff 1984). Depth to
bedrock varies throughout the Chestnut Ridge Regime, but is usually less than 100 ft below ground
surface (bgs).
All but the southernmost portion of the Chestnut Ridge Regime is underlain by the Knox
Group. The Knox Group consists of about 2,600 to 3,300 ft of gray to blue-gray, thin- to
3-1
thick-bedded cherty dolostones with interbedded limestones that have been divided into five
formations (listed from oldest to youngest): Copper Ridge Dolomite, Chepultepec Dolomite,
Longview Dolomite, Kingsport Formation, and Mascot Dolomite. Formational boundaries in the
Chestnut Ridge Regime have not been mapped, but topographic and stratigraphic relationships
suggest that the Copper Ridge Dolomite forms the steep northern flank of the ridge, the Longview
Dolomite forms prominent hills about midway down the broad southern flank of the ridge (Hatcher
et al. 1992), and the Mascot Dolomite disconformably underlies the Chickamauga Group along the
southern boundary of the regime (Figure 4). The Chickamauga Group, which is exposed in Rogers
Quarry, generally consists of thin- to medium-bedded argillaceous limestone and interbedded
calcareous shales.
The most pervasive structural features in the Chestnut Ridge Regime are extensional,
hybrid, and shear fractures (Solomon etal. 1992). Three major joint orientations are evident: one
that roughly parallels bedding, one steeply dipping set that parallels geologic strike, and one steeply
dipping set oriented perpendicular to strike (Dreier et al. 1987). Fracture densities ranging from
about 1 to 60 per foot have been observed in rock outcrops near the ORNL (Dreier et al. 1987;
Sledz and Huff 1981). Most fractures are short, ranging from tenths of inches to a few feet in length
(Solomon etal. 1992).
The dissolution of carbonates along fractures has produced many surface karst features on
Chestnut Ridge. Smith et al. (1983) identified a series of sinkholes along the crest of the ridge that
show a prominent alignment parallel to strike. This linear trend may result from dissolution along
a bedding plane or joint set (Ketelle and Huff 1984; Smith et al. 1983).
3.2 Groundwater System
Solomon et al. (1992) divide the groundwater system underlying the ORR into two basic
hydrogeologic units with fundamentally different hydrologic characteristics: the Knox Aquifer and
the ORR Aquitards. Near the Y-12 Plant, the Knox Aquifer consists of the Knox Group and the
underlying Maynardville Limestone Formation of the Conasauga Group. The remaining formations
of the Conasauga Group (collectively referred to in this report as the Conasauga Shales), the
underlying Rome Formation, and the Chickamauga Group comprise the ORR Aquitards.
3-2

In general, both the Knox Aquifer and the ORR Aquitards are divided by Solomon et al.
(1992) into four parts: (1) the stormflow zone, (2) the vadose zone, (3) the groundwater zone and
(4) the aquiclude (Figure 5). The divisions are based on how much water is transmitted by each
subsystem (i.e., flux), which decreases with depth. The flow system is vertically gradational with
no discrete boundaries separating the subsystems. However, the bulk permeability of the Knox
Aquifer is about ten times greater than that of the ORR Aquitards (Solomon et al. 1992).
3.2.1 Stormflow Zone
Investigations in Bethel Valley and Melton Valley near ORNL show that groundwater
occurs intermittently above the water table in the ORR Aquitards in a shallow "stormflow zone"
that extends from ground surface to a depth of about 6 ft (Moore 1989). Channels for lateral flow
in the stormflow zone include macropores and mesopores, which are connected voids created by
various processes, including biochanneling, cracking, and soil particle aggregation (Moore 1989).
The stormflow zone is thicker and more permeable in forested areas than in grassy or brushy areas,
and is more permeable near the ground surface than at deeper intervals (Moore 1989). Lateral flow
in the stormflow zone is intermittent, creating a perched water table lasting only a few days or
weeks after rainfall. Most groundwater within the stormflow zone is either lost to
evapotranspiration or recharge to the water table and the remaining water discharges at nearby
seeps, springs, or streams. Detailed studies of the stormfiow zone have not been conducted in the
Chestnut Ridge Regime. However, as part of the RI/FS in progress for the BCV CA, stormflow
tubes installed at six sites (three along the northern flank of Chestnut Ridge) have all showed brief
periods of soil saturation in response to rainfall (Science Applications International Corporation
1996). These findings suggest that stormflow also occurs in BCV, although capping of the waste
management areas has probably altered the stormflow zone in some areas of the Bear Creek
Regime. Additionally, the significance of groundwater flux and contaminant transport in the
stormflow zone in BCV is not fully understood, and may not be as great as in Bethel Valley and
Melton Valley.
3-3
3.2.2 VadoseZone
The vadose zone occurs between the stormflow zone and the water table. The geometric
mean depth to the water table beneath Chestnut Ridge is about 100 ft. Water is added to the vadose
zone by percolation from the stormflow zone and is removed by transpiration and recharge to the
water table. The vadose zone is unsaturated except in the capillary fringe above the water table and
within wetting fronts during periods of vertical percolation from the stormflow zone (Moore 1989).
Most recharge through the vadose zone is episodic and occurs along discrete permeable fractures
that become saturated, although surrounding micropores remain unsaturated (Solomon et al. 1992).
Results of slug tests in wells at the United Nuclear Corporation Site (Mishu 1982), and in
areas several miles west of the Chestnut Ridge Regime (Woodward-Clyde Consultants, Inc. 1984)
provide estimates of the hydraulic conductivity of the unsaturated residual soils on Chestnut Ridge.
Little variation was observed with depth, but conductivities determined by field and laboratory tests
varied by approximately two orders-of-magnitude for comparable depth intervals. Mean field
conductivities ranged from 0.0057 to 0.49 feet per day (ft/d) and mean laboratory conductivities
ranged from 2.8 x 10"5 to 9.1 x 10"3 ft/d. Results of the slug tests are similar to those obtained from
infiltrometer tests. Moore (1988) reported a geometric mean hydraulic conductivity of about 0.006
ft/d for residuum on Chestnut Ridge based on results of infiltrometer studies near ORNL reported
by Watson and Luxmoore (1986) and Wilson and Luxmoore (1988).
The hydraulic conductivity of the residuum overlying the Knox Group varies with saturation
(Luxmoore 1982; Daniels and Broderick 1983). Luxmoore (1982) showed that hydraulic
conductivity decreases by approximately one order-of-magnitude with a volumetric water content
decrease to 90% of saturation, and two orders-of-magnitude with a volumetric water content
decrease to 75% of saturation. Daniels and Broderick (1983), as summarized in Ketelle and Huff
(1984), reported that hydraulic conductivity decreases by roughly one order-of-magnitude relative
to maximum when saturation is 90%, and three orders-of-magnitude relative to maximum when
saturation is 75%. Ketelle and Huff (1984) also noted that wide variations in soil permeability
occur over short lateral distances. These findings are consistent with observations of permeability
variation in residual soils found in other karst areas (Quinlan and Aley 1987).
3-4

. 3.23 Groundwater Zone
Groundwater below the vadose zone occurs within orthogonal sets of permeable, planar
fractures that form water-producing zones within an essentially impermeable matrix; dissolution
of carbonates has increased the permeability of these zones within the Knox Aquifer.
Water-producing zones commonly develop within a single layer of rock, and have an average
thickness (assuming an average dip of 35°) of two ft or less (Dreier et al. 1987). Because the
frequency, aperture, and connectivity of permeable fractures decrease with depth, the bulk hydraulic
conductivity of the groundwater zone is vertically gradational. Most of the groundwater flux occurs
in a highly permeable zone (the water table interval) within the transitional horizon between
regolith and unweathered bedrock; lower flux (and longer solute residence times) occurs at
successively greater depths in the bedrock. Changes in the geochemistry of the groundwater
suggest that active flow in the Conasauga Shales occurs at depths less than 100 ft bgs, but active
flow occurs at greater depth in the Knox Aquifer (Dreier et al. 1993).
Estimates of the hydraulic conductivity of water producing intervals within the Knox Group
are provided by results of straddle packer tests performed in core holes near the Sediment Disposal
Basin and Industrial Landfill IV (King and Haase 1988), and slug tests performed in wells at
Industrial Landfill II, IV, and V and Construction/Demolitions Landfill VII. The packer tested
intervals were generally less than 600 ft bgs in the Copper Ridge Dolomite, and calculated
hydraulic conductivities ranged from 0.0002 (matrix intervals) to 3.1 ft/d (water-producing
intervals). The slug tested intervals ranged from 36 to 195-ft bgs in the various Knox Group
formations, and calculated hydraulic conductivities ranged from 0.003 to 28 ft/d (personal
communication, S. Jones, August 1996). Dye-tracer tests, however, indicate higher flow rates
comparable to those of typical karst terrains (Quinlan and Ewers 1985). Ketelle and Huff (1984),
for example, determined flow rates of about 490 to 1,250 ft/d from a tracer test on Chestnut Ridge
near ORNL. Results of a dye-tracer test at the Security Pits indicated flow rates of about 100 to 300
fl/d (Geraghty & Miller, Inc. 1990), although a second test using different tracers did not confirm
these findings (Science Applications International Corporation 1993).
3-5
3.2.4 Aquiclude
The aquiclude is generally marked by the presence of saline water with total dissolved solids
(TDS) concentrations of 40,000 to 300,000 milligrams per liter (mg/L) (Solomon et al. 1992).
Information obtained southeast of the Chestnut Ridge Regime in Melton Valley suggests that
sodium-, calcium-, and chloride-rich water chemically similar to brines associated with major
sedimentary basins typically occurs at depths of about 600 to 700 ft bgs (Solomon et al. 1992).
3 3 Groundwater Flow Directions
Directions of groundwater flow in the Chestnut Ridge Regime were evaluated from April
1995 (the seasonally high water table) water level data for 86 monitoring wells, and October 1995
(the seasonally low water table) data for 84 wells; depth-to-water measurements and water-level
elevations are presented in Appendix H of the Part 1 GWQR. These data show that the water table
generally mirrors surface topography (Figure 6), with seasonal water level declines of 10 to 27 ft
along the ridge crest (i.e., recharge areas), and 1 to 7 ft on the ridge flanks (i.e., discharge areas).
Horizontal hydraulic gradients (0.01 to 0.05) are generally toward the east (i.e., parallel with
geologic strike) along the axis of the ridge. Steeper horizontal gradients (0.04 to 0.07) are toward
Upper East Fork Poplar Creek (normal to strike) on the northern ridge flank, and toward surface
drainage features on the southern flank of the ridge. The overall pattern of groundwater flow is
from the recharge areas on the ridge crest toward discharge areas that include the Maynardville
Limestone in BCV, and springs and seeps in the crosscurting tributaries along the northern and
southern flanks of Chestnut Ridge.
3.4 Groundwater Geochemistry
Calcium-magnesium bicarbonate groundwater occurs throughout the Knox Group
formations that comprise the Knox Aquifer in the Chestnut Ridge Regime (Figure 7). Geochemical
characteristics of the groundwater include equal or nearly equal molar concentrations of calcium
and magnesium; pH of 7.5 to 8.0; very low (i.e., <1 mg/L) carbonate alkalinity and nitrate (as N)
concentrations; low proportions (<5%) of chloride, sodium, sulfate, and potassium; and TDS above
150 mg/L. The geochemistry of the groundwater is fairly uniform throughout the Knox Aquifer,
3-6
although groundwater in some wells contains locally enriched chloride (e.g., GW-539) and sulfate
(e.g., GW-339) concentrations, which potentially reflect the geochemical influence of locally
disseminated sulfides (e.g., pyrite) or evaporites (e.g., gypsum). Additionally, groundwater within
low permeability (matrix) intervals in the upper Knox Group (GW-143, GW-145, and GW-146) has
greater proportions of sulfate and potassium, and higher trace metal concentrations (e.g., strontium)
than typical of the groundwater from low yield intervals within the lower Knox Group formations
(e.g., GW-177) (Figure 7). These geochemical differences potentially reflect corresponding
differences between carbonate mineralogies in the upper and lower sections of the Knox Group, or
the types of disseminated secondary minerals.
3-7

4.0 GROUNDWATER QUALITY MONITORING PROGRAMS
Groundwater monitoring during CY 1995 at the sites described in Section 2.0 was
performed in general accordance with the Sampling and Analysis Plan for Groundwater and
Surface Water Monitoring at the Y-12 Plant during Calendar Year 1995 (Sampling and Analysis
Plan) (HSW Environmental Consultants, Inc. 1994a). Deviations from and additions to the
Sampling and Analysis Plan were documented in addenda issued by the Y-12 Plant GWPP Manager
throughout the year. The following sections provide an overview of these sampling and analysis
activities, including information regarding the sampling locations, frequency, and procedures,
analytical parameters, and a discussion of the results of quality assurance/quality control (QA/QC)
sampling.
4.1 Sampling Locations
Groundwater samples were collected from a total 73 monitoring wells and two springs.
Some wells satisfy multiple programmatic drivers. The total number of sampling stations by
program were as follows (Table 2):
• ten wells for RCRA interim status assessment monitoring,• 15 wells for RCRA interim status detection monitoring,• four wells for RCRA post-closure detection monitoring,• six wells for post-closure CERCLA ROD monitoring,• 24 wells and one spring for SWDF detection monitoring,• 18 wells for best-management practice monitoring, and• six wells and one spring for one-time special sampling purposes.
Locations of the monitoring wells and springs are shown on Figure 8. Selected construction
information for the monitoring wells is summarized on Table 3; detailed well construction data are
provided in Appendix C of the Part 1 GWQR.
4.2 Sampling Frequency
Groundwater samples were collected during each quarter of CY 1995. First through fourth
quarter sampling events were performed January 4 - March 24, April 4 - May 16, July 10 - August
4-1

14, and October 6 - November 20, respectively. The number of monitoring wells and springs
included in each sampling- event varied depending on the quarterly or semiannual sampling
requirements of the governing monitoring programs. For planned monitoring purposes,
groundwater samples were collected from 33 wells in the first quarter, 65 wells and one spring
during the second quarter, 33 wells during the third quarter, and 68 wells and one spring during the
fourth quarter (Table 2).
Implementation of the various groundwater monitoring programs resulted in changes to the
planned sampling frequency of some wells. Wells GW-539, GW-709, and GW-757 at Industrial
Landfill II were included in three quarterly sampling events because of a shift from a first
quarter/third quarter to a second quarter/fourth quarter semiannual sampling schedule. Quarterly
sampling of wells GW-158, GW-241, GW-303, and GW-304 for RCRA interim status detection
monitoring at the Sediment Disposal Basin was discontinued after the RCRA post closure permit
was issued for the site in September 1995. Wells designated in the permit for semiannual RCRA
post-closure detection monitoring at the site (GW-156, GW-159, GW-731, and GW-732 ) were
sampled in October 1995 in accordance with the permit-specified protocol requiring sampling over
a four consecutive day period (Table 2).
Six wells and one spring were included in specialized, one-time sampling events performed
in January, March, and August 1995 (Table 2). Groundwater in well GW-321 at the Ash Disposal
Basin was sampled at the request oftheY-12 Plant ER Program on January 10,1995. Groundwater
discharging at spring SCR2.2SP was sampled on March 15,1995 in conjunction with the TDEC
DOE Oversight Division. To confirm elevated total strontium and/or total uranium concentrations
in groundwater at Kerr Hollow Quarry, groundwater samples for isotopic analyses were collected
in March 1995 from wells GW-142, GW-144, GW-145, and GW-146. Similarly, well GW-732 at
the Sediment Disposal Basin was redeveloped and resampled on August 14,1995 to confirm the
elevated uranium concentrations and gross alpha/gross beta activities reported for samples collected
during the first and second quarters of the year.
4-2

4 3 Sample Collection
Personnel from the Oak Ridge K-25 Site (K-25) Sampling and Environmental Support
Department (SESD) collected groundwater samples from the monitoring wells, and personnel from
the Y-12 HSEA Organization assisted with sample collection at springs SCR2.2SP and CBS-1.
Sampling was performed in accordance with the most recent version of the technical procedure for
groundwater sampling (SESD-TP-8204) and surface water sampling approved by the Y-12 Plant
GWPP Manager.
Filtered and unfiltered samples were collected from each location; filtering was performed
in the field with an in-line 0.45 micron filter. To reduce the potential for cross-contamination,
samples were generally collected in sequence from the least contaminated wells to the most
contaminated wells at a site or in a sampling group (a series of monitoring wells grouped for
sampling and data-tracking purposes). In areas where no groundwater contamination is present,
samples were collected from the farthest upgradient wells first.
4.4 Laboratory Analysis
The bulk of the groundwater samples collected during CY 1995 were analyzed for a
standard suite of analytes that included:
principal cations (calcium, magnesium, potassium, and sodium) andanions (carbonate and bicarbonate alkalinity, chloride, fluoride,nitrate, and sulfate);trace metals (the term used to differentiate metals that are typically minorgroundwater constituents, such as cobalt and nickel, from metals that occuras principal ionic constituents, such as magnesium and sodium);target compound list volatile organic compounds (VOCs);gross alpha activity and gross beta activity;total suspended solids (TSS), TDS, and turbidity;field and laboratory determinations of pH and specific conductance, and;field determinations of temperature, dissolved oxygen, and oxidation-reduction potential.
4-3
Unfiltered groundwater samples were analyzed for the entire standard suite of constituents and
parameters; filtered samples were analyzed only for the principal cations and.trace metals.
Unfiltered or filtered samples collected from some wells also were analyzed for other compounds
or parameters required by TDEC regulations or specified in site operating permits. For example,
the groundwater samples collected from wells at Construction/Demolition Landfill VII (and the
associated QA/QC samples) were analyzed for additional organic compounds and other required
parameters specified by the TDEC solid waste management regulations. Samples collected for
special purposes were analyzed for targeted parameters.
Most of the laboratory analyses were performed by the K-25 Analytical Services
Organization (ASO). Selected radiochemical analyses were performed by the ORNL ASO.
Analytical results for all groundwater samples are presented in Appendix E of the Part 1 GWQR.
4.5 Qualify Assurance/Quality Control Sampling
Seventy laboratory blanks, 122 trip blanks, four field blanks, and 33 equipment rinsate
samples were analyzed for the target compound list VOCs. Selected equipment rinsate samples also
were analyzed for trace metals, gross alpha and gross beta activity, and radionuclides. Duplicate
groundwater samples were analyzed for the constituents and parameters specified for the wells from
which they were collected. The analytical results for the duplicate samples are presented in
Appendix F of the Part 1 GWQR; results for the other QA/QC samples are summarized in
Appendix L of the Part 1 GWQR.
One or more often target compound list VOCs were detected in 15 (21%) of the laboratory
blanks, 90 (74%) of the trip blanks, three (75%) of the field blanks, and 16 (48%) of the equipment
rinsate samples analyzed during CY 1995 (Table 4). These compounds included: (1) five common
laboratory reagents (acetone, 2-butanone, 2-hexanone, methylene chloride, and toluene), (2) three
compounds, chloroform, 1,1,1,-trichloroethane (1,1,1-TCA), and 1,2-dichloroethane (1,2-DCA),
that are present in the groundwater in the Chestnut Ridge Regime (VOC plume constituents), and
(3) two compounds (ethylbenzene and xylenes) that are neither common laboratory reagents nor
known or suspected VOC plume constituents in the regime.
4-4

Common laboratory reagents were detected in 15 (21%) of the laboratory blanks, 13 (10%)
of the trip blanks, and five (16%) of the equipment rinsate samples. As in previous years, acetone,
2-butanone, and methylene chloride were detected most frequently (Table 4). However, as
summarized below, the very low percentages of laboratory blanks and trip blanks with methylene
chloride contrast with respective historical results.
CalendarYear
1992199319941995
Percent of Samples with Methylene Chloride
Laboratory Blanks
3343293
Trip Blanks
3036206
Field Blanks
110
Equipment Rinsates
24351012
This may be partially related to the declining number of groundwater samples and associated
laboratory blanks and trip blanks analyzed each year; about 40% more laboratory blanks were
analyzed in CY1993 (115 samples) than in CY1995 (70 samples), and about 35% more trip blanks
were analyzed in CY 1993 (185 samples) than in CY 1995 (122 samples). Nevertheless, the overall
reduction in the percentage of QA/QC samples containing methylene chloride (and other laboratory
reagents) illustrates improved performance of the K-25 ASO with regard to laboratory
contamination of QA/QC samples.
Two VOC plume constituents were detected in the QA/QC samples: 1,1,1-TCA in 86 (70%)
of the trip blanks, three (75%) of the field blanks, and 13 (48%) of the equipment rinsate samples,
and chloroform in one equipment rinsate sample (Table 4). As summarized below, 1,1,1-TCA was
detected in samples analyzed each quarter of CY 1995, including all but four of the trip blanks and
two of the equipment rinsate samples that contained any VOCs, and was the only compound
detected in the field blank samples.
4-5

Type ofQA/QC Sample
Laboratory Blankswith VOCs
with 1,1,1-TCA
Trip Blankswith VOCs:
with 1,1,1-TCA:
Equipment Rinsateswith VOCs:
with 1,1,1-TCA:
Field Blankswith VOCs:
with 1,1,1-TCA:
Number of Samples
1st Qtr.
1530
231919
633
111
2nd Qtr.
2460
422422
1022
111
3rd Qtr.
1010
191313
533
100
4th Qtr.
2150
383431
1073
111
Total
70150
1229086
331513
433
The lack of 1,1,1-TCA in the laboratory blanks discounts the analytical environment as a source
of the contamination in the other QA/QC samples. Relationships between 1,1,1-TCA results for
the groundwater samples and associated trip blanks, field blanks, and equipment rinsates do not
indicate cross contamination during sample handling and transportation, or improper equipment
decontamination. Contamination of the deionized water source used by the K-25 ASO to prepare
the blanks has been determined to be the cause of the widespread detection of 1,1,1-TCA in these
QA/QC samples. Similar source water contamination with chloroform and 1,2-dichloropropane
occurred during CYs 1991 and 1992, and was determined by the K-25 ASO to have resulted from:
(1) an insufficient replacement frequency for the ionization columns, (2) improper flushing of the
deionized water system, and (3) problems with system handling and maintenance (Buckley 1992).
A routine sampling program of the water source used to prepare blanks has been implemented by
the ASO to monitor the quality of deionized water.
Ethylbenzene and xylenes were detected in one laboratory blank, and in the two trip blanks
and two equipment rinsate samples associated with this blank (Table 4). Both compounds also were
detected in the groundwater samples associated with these QA/QC samples. These QA/QC and
groundwater samples were analyzed by the K-25 ASO during October 8-9,1995. None of the waste
4-6
sites in the Chestnut Ridge Regime are sources of these compounds, and all these results were
considered analytical artifacts.
Thirty-four laboratory blanks, 61 trip blanks, and 12 equipment rinsates associated with
selected wells used for SWDF detection monitoring were analyzed for the additional organic
compounds specified by SWDF regulations and operating permits; analytical results for these
samples are summarized in Appendix L of the Part 1 GWQR. Ethanol was the only compound
detected in any of the QA/QC samples, including all of the laboratory blanks, trip blanks, and
equipment rinsates analyzed during the first quarter, and about half of each type of QA/QC sample
analyzed in the second quarter of CY 1995. Ethanol also was detected in the associated
groundwater samples collected each quarter, but all these results were screened as false positives
(see Appendix C). The widespread detection of ethanol clearly indicates laboratory contamination,
which was subsequently corrected. Ethanol was not detected in any of the QA/QC samples or
groundwater samples analyzed after the second quarter of the year.
4-7

5.0 DATA ANALYSIS AND INTERPRETATION
Analysis of the CY1995 groundwater monitoring data for the Chestnut Ridge Regime was
based on the interpretive assumptions associated with the data screening and evaluation processes
described in Appendix C. The following sections present the analysis and interpretation of the data
for principal ions, trace metals, VOCs, and radiological parameters.
5.1 Principal Ions
Concentrations of the principal ions reported for the bulk of the CY 1995 groundwater
samples were consistent with the overall geochemical characteristics described in Section 3.4.
However, data for several wells are conspicuous with regard to extremely high sodium and chloride
levels, and atypical nitrate (as N) concentrations (hereafter synonymous with "nitrate
concentrations"). Also, the data for some sampling locations show unusually low TDS or
geochemical indicators of localized grout contamination.
Sodium (>20 mg/L) and chloride (>5 mg/L) concentrations in groundwater samples from
wells GW-186, GW-187, and GW-188 are substantially higher than in samples from well GW-184
(2 mg/L). The elevated concentrations in the groundwater near these wells, particularly GW-186
and GW-187, have probably resulted from years of seasonal recharge containing dissolved salts
(e.g., NaCl) routinely used to de-ice Bethel Valley Road. Dissolved sodium and chloride both tend
to remain in solution and are readily transported in groundwater, but horizontal hydraulic gradients
near Rogers Quarry are very low (e.g., 0.0001 to 0.0018 between wells GW-184 and GW-186).
Thus, purging these wells before sampling probably induces much greater movement in the
groundwater than occurs under normal hydraulic gradients. Moreover, considering the depth of the
monitored interval for GW-187 (139 - 160 ft bgs), the extreme sodium (140 mg/L) and chloride
(110 mg/L) concentrations characteristic of the groundwater samples from the well may indicate
a failure in the annular grout that allows direct hydraulic communication with the shallow flow
system.
Nitrate concentrations are typically below 1 mg/L in groundwater throughout the Chestnut
Ridge Regime. Groundwater samples from several wells, however, have higher nitrate
5-1

concentrations, although as indicated by the following summary, none collected after CY1990 have
exceeded the 10 mg/L maximum contaminant level (MCL) adopted by TDEC.
MonitoringWell
GW-144GW-147GW-184GW-203GW-231GW-294GW-302GW-609GW-611
Annual Average Nitrate (as N) (mg/L)
1990
0.570.4315.900.88<0203.001.100.953.20
1991
0.760.606.201.00
<0.202.601.000.932.80
1992
0.990.425.501200.462.701.100.942.70
1993
1.200.714.201200.732.801.00 .1.002.90
1994
1.701207.501200.863.101.101.103.60
1995
2.101.305.601.301.102.701201203.30
The nitrate data obtained since CY 1990 also show: (1) increased concentrations in the groundwater
downgradient (GW-144) and upgradient (GW-147 and GW-231) of Kerr Hollow Quarry, (2) fairly
stable or slightly increased concentrations in groundwater along the axis (GW-203, GW-294,
GW-302, and GW-609) and northern flank (GW-611) of Chestnut Ridge, and (3) decreased
concentrations in groundwater upgradient of Rogers Quarry (GW-184). Nitrate is highly mobile
in groundwater, and, as illustrated by data for wells GW-144 and GW-147, concentrations generally
correlate with high and low groundwater flow conditions (Figure 9). The correlation with flow
conditions suggests nitrate is leached from the surficial soils and residuum by recharging
groundwater (note the elevated nitrate concentrations in low TDS groundwater samples from wells
GW-144 and GW-203).
The TDS of groundwater samples from wells and springs in the Chestnut Ridge Regime
typically exceed 150 mg/L (the 25th percentile of the TDS data). Some of the monitoring wells,
however, occasionally yield groundwater samples with lower TDS, including wells GW-144 (104
mg/L), GW-147 (144 mg/L), GW-177 (120 mg/L), GW-217 (108 mg/L), GW-305 (88 mg/L),
GW-514 (142 mg/L), GW-522 (88 mg/L), and GW-796 (78 mg/L). The low TDS of these samples
suggests groundwater with short residence time, which implies active groundwater recharge and
discharge flowpaths, possibly "quickflow" conduits described in Shevenell (1994a). The monitored
5-2

interval in well GW-144, for example, intercepts a fracture at 170 ft bgs that yields 20 gallons per
minute (Jones et aJ. 1994).- Additionally, the low TDS of these samples may be a function of
groundwater inflow at the time of sample collection. Hydrograph recession curves for several wells
in the Knox Aquifer are characterized by three distinct line segments: a steeply sloped segment
representing the dominant effects of drainage from conduits, an intermediately sloped segment
representing drainage from well connected and partially karstified fractures, and a third more gently
sloped line segment representing drainage from the porous (matrix) aquifer intervals (Shevenell
1994b). Samples collected when inflow from conduits is dominant would be expected to have
lower TDS than samples collected when inflow is primarily from matrix intervals.
Localized grout contamination is indicated by the atypical pH (>8.5), carbonate alkalinity
(>1 mg/L), and potassium:sodium ratios (>1:1) for groundwater samples from wells GW-731 and
GW-732 at the Sediment Disposal Basin, and well GW-796 at Industrial Landfill V. This is clearly
illustrated by the results for the series of groundwater detection monitoring samples collected
October 23-26, 1995 from well GW-732. The sample collected the first day was obtained
immediately after purging the stagnant water in the well, and the chemistry of the sample was
typical of groundwater in the Knox Group. Samples collected on the following three successive
days were obtained within 24 hours of each other without repurging the well, and each had the
above characteristics of grout contamination as well as successively increasing ion charge balance
errors (see Section 2.4 in Appendix C).
5.2 Trace Metals
Based on the data screening and evaluation criteria described in Appendix C, median total
concentrations of fourteen trace metals determined from CY 1995 data for the unfiltered
groundwater samples from 29 monitoring wells and one spring exceeded either the MCL adopted
by the TDEC, or an upper tolerance limit (UTL) assumed to be representative of uncontaminated
groundwater at the Y-12 Plant (Table 5). Review and analysis of the body of data for each
sampling location, however, suggests that many of the CY 1995 results were affected by one or
more extraneous factors, including preservation (acidification) of turbid (unfiltered) samples,
laboratory contamination, analytical interferences, corrosion of stainless steel well casing and
5-3

screen, and well construction artifacts/deficiencies. Results most likely representative of
concentrations in the groundwater are described in the following sections.
Industrial Landfill IV
Total boron concentrations are higher in the groundwater downgradient to the east (along
strike) of Industrial Landfill IV, as indicated by the median concentrations for wells GW-217 (0.18
mg/L) and GW-522 (0.047 mg/L), than in the groundwater upgradient (west) of the site, as
indicated by the median concentration (0.013 mg/L) for well GW-521. The boron results for well
GW-217 continue the overall increasing trend evident since a conspicuous concentration "spike"
(0.69 mg/L) in January 1992 (Figure 10), a trend which corresponds with a sodium concentration
increase from 2 mg/L to more than 6 mg/L. As noted in the preceding section, the low TDS
characteristic of the samples from wells GW-217 and GW-522 indicate that both intercept
hydraulically active groundwater flowpaths. The elevated boron (and sodium) concentrations
potentially reflect downgradient transport of inorganic wastes from Industrial Landfill IV, possibly
borax (i.e., hydrated sodium borate) cleaning fluids if these materials were placed into the landfill.
Currently, the GWPP is monitoring trends and examining disposal records in conjunction with the
Y-12 Waste Management Organization to determine if these constituents are a concern.
Kerr Hollow Quarry
Median total boron, strontium, and uranium concentrations in groundwater at several wells
downgradient of Kerr Hollow Quarry exceed the applicable UTLs (Table 5). However, the
following characteristics of the data for these metals suggest that the elevated concentrations are
not a result of past disposal of wastes in the quarry.
• As illustrated by trace metal data for wells GW-143 (boron), GW-145 (uranium), andGW-146 (strontium), increasing concentration trends are not evident in thegroundwater downgradient of the site (Figure 11).
• Similar total (and dissolved) metal concentrations occur in the groundwater up anddowngradient of the site. Total uranium concentrations, for example, are of similar
5-4

magnitude in the groundwater samples from upgradient well GW-147 anddowngradient well GW-144 (Figure 11).
• The highest concentrations occur in the more mineralized (TDS >300 mg/L)groundwater from low-yield (matrix) zones intercepted by wells GW-143, GW-145,and GW-146. For instance, strontium concentrations in sulfate-enriched groundwatersamples collected from well GW-146, which purges dry and recovers very slowly,are two orders-of-magnitude higher than in the low TDS groundwater samples fromwell GW-144, which intercepts a productive water-bearing fracture (Figure 11).
• Strontium (89Sr and90 Sr) and uranium isotope activities reported from thegroundwater samples collected from wells GW-142, GW-144, GW-145, andGW-146 were below the respective minimum detectable activity (MDA) or wereotherwise characterized by large associated counting errors (see Section 5.4).
The high strontium concentrations characteristic of the low-yield wells at Kerr Hollow
Quarry, particularly GW-146, probably reflect hydrochemical processes related to the types of
secondary minerals within the upper Knox Group. Long term dissolution of celestite (SrSO4), for
example, may explain the high strontium (and sulfate) concentrations characteristic of the samples
from these wells. Alternatively, the strontium concentrations may reflect the mineralogy of fine
grained, thick to massive limestone beds in the Mascot Dolomite; strontium ranges from 100 to 900
parts per million (ppm) in limestone (Brownlow 1979).
53 Volatile Organic Compounds
Based on the data screening and evaluation criteria described in Appendix C, results obtained
during CY 1995 are generally consistent with previous monitoring data showing dissolved VOCs
(primarily chloroethanes and chloroethenes) in groundwater at the Security Pits, Industrial Landfills
IV and V, and Kerr Hollow Quarry.
Chestnut Ridge Security Pits
Volatile organic compounds in groundwater at the Security Pits occur in a narrow dissolved
plume extending parallel with geologic strike for at least 2,600 ft downgradient to the east, and
perpendicular to geologic strike for at least 500 ft downgradient to the north and south (Figure 12).
The primary components of the plume are 1,1,1-TCA, 1,1-dichloroethane (1,1-DCA), and
5-5
1,1-dichloroethene (1,1-DCE) in the western trench area, andtetrachloroethene (PCE) and 1,2-DCE
in the eastern trench area (Figure 13). Concentrations within the plume exceed 500 micrograms per
liter (ug/L), as indicated by summed average VOC concentrations determined from July 1992 data
for well GW-322 (532 [M&L), and maximum concentrations of 1,1-DCE, PCE, and 1,1,1-TCA
exceed respective MCLs adopted by the TDEC. Distribution of the plume constituents relative to
the respective source areas, and elongation of the plume along the axis of Chestnut Ridge despite
steeper hydraulic gradients toward the ridge flanks, suggest primarily strike-parallel horizontal
transport (west to east) in the groundwater. The maximum depth of vertical transport has not been
determined, but is at least 150 ft bgs (GW-177) in the western trench area, 250 ft bgs (GW-612) near
the middle of the site, and 270 ft bgs (GW-609) downgradient of the eastern trench area (Figure 14).
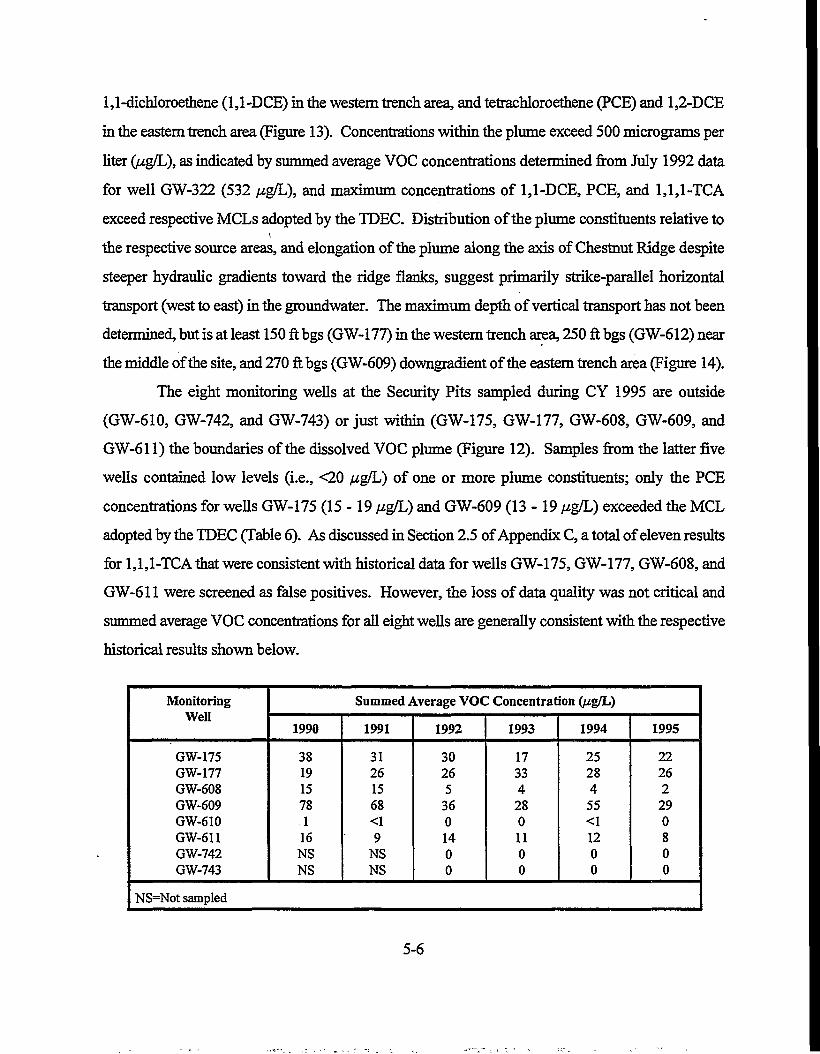
The eight monitoring wells at the Security Pits sampled during CY 1995 are outside
(GW-610, GW-742, and GW-743) or just within (GW-175, GW-177, GW-608, GW-609, and
GW-611) the boundaries of the dissolved VOC plume (Figure 12). Samples from the latter five
wells contained low levels (i.e., <20 /ug/L) of one or more plume constituents; only the PCE
concentrations for wells GW-175 (15-19 fj.g/L) and GW-609 (13 - 19 pgfL) exceeded the MCL
adopted by the TDEC (Table 6). As discussed in Section 2.5 of Appendix C, a total of eleven results
for 1,1,1-TCA that were consistent with historical data for wells GW-175, GW-177, GW-608, and
GW-611 were screened as false positives. However, the loss of data quality was not critical and
summed average VOC concentrations for all eight wells are generally consistent with the respective
historical results shown below.
MonitoringWell
GW-175GW-177GW-608GW-609GW-610GW-611GW-742GW-743
Summed Average VOC Concentration (pigfL)
1990
38191578116NSNS
1991
31261568<19
NSNS
1992
30265
3601400
1993
17334
2801100
1994
2528455<11200
1995
22262
290800
NS=Not sampled
5-6

These data also illustrate the overall decreasing concentration trends evident since the disposal
trenches were closed and capped in 1988 and 1989; the 1,1,1-TCA and 1,1-DCA results for well
GW-177 suggest a decrease to asymptotic levels in the groundwater near the western (upgradient)
disposal trenches (Figure 15).
Besides the decreased VOC concentrations evident since closure of the Security Pits, the data
for some wells show distinctive fluctuations with seasonal groundwater flow conditions. For
example, VOC concentrations and water levels in well GW-177 show an inverse correlation (i.e.,
concentrations are lowest when water levels are highest) indicative of greater dilution during
seasonally high flow conditions (Figure 15). Conversely, VOC results for well GW-609 show a
generally positive correlation with water levels (i.e., concentrations are highest when water levels
are highest) reflecting greater transport during seasonally high flow conditions (Figure 15). In either
case, the seasonal fluctuations coupled with the decreased concentrations after closure of the Security
Pits suggest that the active source of the VOCs is within the residuum and bedrock underlying the
disposal trenches, possibly as residual dense non-aqueous phase liquids (DNAPL). Steady
dissolution of the DNAPL (as well as associated matrix diffusion processes) may explain the
dilution-related concentration fluctuations, and flushing by seasonal recharge and discharge may
explain the transport-related concentration fluctuations.
Ash Disposal Basin and Industrial Landfill V
Data obtained since the early 1990s show low concentrations (1 to 2 £4g/L) of 1,1,1-TCA in
the groundwater at two wells downgradient of the western disposal trenches at the Security Pits
(Figure 12): well GW-796 at Industrial Landfill V (about 400 ft south of the disposal trenches), and
well GW-514 at the Ash Disposal Basin (about 900 ft south of the disposal trenches). Similar
1,1,1-TCA concentrations (1 /wg/L) were detected in samples collected from well GW-796 in April
and October 1995. However, both results were screened as false positives because of 1,1,1-TCA
contamination in the associated trip blanks. No VOCs were detected in the two samples collected
during CY1995 from well GW-514, although low concentrations (1 to 2 ^g/L) of 1,1,1-TCA were
detected in all three samples collected during CY 1994. The repeated detection of 1,1,1-TCA in the
groundwater samples from both wells potentially reflects southward migration from the Security
5-7

Pits, possibly along "quickflow" conduits oriented perpendicular to geologic strike (Shevenell
1994a; HSW Environmental Consultants, Inc. 1995). Moreover, the apparently sporadic detection
of 1,14-TCA may result from occasional volatilization during sampling, and not the absence of the
compound in the groundwater at each well.
Industrial Landfill IV
Groundwater at well GW-305, located on the east (downgradient) side of Industrial Landfill
IV about 4,500 ft west (upgradient) of the Security Pits, also contains low levels of 1,1,1-TCA
(Figure 12). Samples of the groundwater in the well have been collected since early 1988, and
1,1,1-TCA was first detected (0.6 ^g/L) in the sample collected in January 1992. As indicated by
the 6 Mg/L result for the sample collected in July 1995, the concentrations have subsequently
increased by an order-of-magnitude but remain well below the MCL of 200 ,ug/L (Figure 16).
The source of the 1,1,1-TCA in the groundwater at well GW-305 is uncertain. Potential cross
contamination of the well during sampling was indicated by data obtained during CY 1992 (HSW
Environmental Consultants, Inc. 1993), but was not supported by subsequent data (HSW
Environmental Consultants, Inc. 1994b) and nevertheless does not explain the increasing
concentration trend. Transport along strike from the western disposal trenches at the Security Pits
seems unlikely because the water-table elevation near Industrial Landfill IV is more than 20 ft higher
than at the Security Pits during both seasonally high and low groundwater flow conditions (Figure
6). Groundwater transport downgradient from Industrial Landfill IV is possible, assuming the waste
stream has included chlorinated organic solvents, although 1,1,1-TCA has not been detected in any
of the groundwater samples collected from the other downgradient wells at the site (GW-141,
GW-217, and GW-522). However, the detection of 1,1,1-TCA in January 1992 and the subsequent
increasing concentration trend coincides with data for well GW-217 showing a boron concentration
spike in January 1992 and a subsequent increasing concentration trend. Additionally, the
characteristically low TDS of the groundwater samples from well GW-305 suggest that it intercepts
active groundwater flowpaths in the lower Knox Group (Copper Ridge Dolomite). As with boron,
trending of this compound will continue as part of SWDF detection monitoring, and disposal
5-8
inventories for Industrial Landfill IV are being reviewed to determine if the site is a possible source
of VOCs in the groundwater:
Kerr Hollow Quarry
Data obtained during CY1995 are generally consistent with historical results showing low
levels (<5 yug/L) of carbon tetrachloride, chloroform, and PCE in the groundwater downgradient to
the south (GW-144) and southeast (GW-142) of Kerr Hollow Quarry (Figure 12). All three
compounds have been detected in the groundwater at well GW-144, particularly carbon tetrachloride,
which was detected in 12 of the 20 samples collected from the well since March 1991, including
those obtained in January (3 A*g/L), April (3 //g/L), and November 1995 (2 yug/L). Either chloroform
(a degradation product of carbon tetrachloride) or PCE was detected in seven of the 20 groundwater
samples collected from well GW-142 since March 1991, including PCE (1 /zg/L) in the sample
collected in November 1995. As noted previously, however, the sporadic detection of low VOC
concentrations potentially reflects volatilization during sampling, and not the absence of the
compounds in the groundwater. In either case, results for these wells indicate migration of VOCs
both down-dip (GW-144) and along strike (GW-142) of Kerr Hollow Quarry.
5.4 Radioactivity
Gross alpha activity reported for 22 groundwater samples from twelve monitoring wells
exceeded the 4.7 picoCuries per liter (pCi/L) MDA (Table 7). Annual average gross alpha activity
for three of these wells exceeded the 15 pCi/L MCL: GW-160 (23.1 ± 4.4 pCi/L) at the Chestnut
Ridge Borrow Area Waste Pile, GW-562 (50.1 ± 0.89 pCi/L) at Construction Demolition Landfill
VII, and well GW-732 at the Sediment Disposal Basin (43.9 ± 9.6 pCi/L).
Annual average gross alpha activities for wells GW-160 and GW-732 were skewed by results
reported for highly turbid groundwater samples. The unaltered sample collected from well GW-160
in November 1995 had TSS of 5,365 mg/L and gross alpha activity 39.4 ± 7.4. In contrast; TSS
were below 250 mg/L in all of the previous unfiltered samples from the well (including the sample
collected in April 1995), and gross alpha activities for these samples were less than or only slightly
above the MDA. Similarly, the elevated gross alpha activities reported for samples collected from
5-9

well GW-732 in January (34.1 ± 6 pCi/L) and April 1995 (91 ± 28 pCi/L) had respective TSS of 820
and 1,152 mg/L, whereas the unfiltered samples collected later in the year had low TSS (32 to 41
mg/L) and gross alpha activities below or just above the MDA.
Gross beta activity reported for 27 groundwater samples from nine monitoring wells
exceeded the 11 pCi/L MDA (Table 7), but the annual average gross beta activity for each well was
below the 50 pCi/L Safe Drinking Water Act screening level (see Section 3.2 in Appendix C). As
with gross alpha activity, the highest gross beta activities were reported for turbid, unfiltered
groundwater samples collected from well GW-732 (59.8 ± 3 1 pCi/L) in April, and from well
GW-160 (34.2 ± 5.4 pCi/L) in November 1995.
No identifiable patterns or trends are evident among the radionuclide results that exceeded
the respective MDAs, which were characterized by counting errors that typically exceeded 50% of
the reported radionuclide activity (Table 8). None of the results indicate the presence of
radionuclides in the groundwater in the Chestnut Ridge Regime.
5-10

6.0 CONCLUSIONS AND RECOMMENDATIONS
Groundwater quality monitoring data obtained during CY1995 from wells and springs in the
Chestnut Ridge Regime are generally consistent with historical data. Evaluation and interpretation
of the data indicate the following:
• Natural hydrochemical processes may locally enrich chloride and sulfate in the calcium-magnesium-bicarbonate groundwater in the Knox Aquifer, but the extreme concentrations(i.e., >100 mg/L) of chloride and sodium ions typical of the samples from well GW-187 atRogers Quarry probably reflect groundwater contamination related to deicing of BethelValley Road.
• The low TDS (i.e., <150 mg/L) characteristic of the groundwater samples from severalmonitoring wells (e.g., GW-217) suggest short groundwater residence time and hydraulicaUyactive recharge/discharge flowpaths.
• Positive correlations between water levels and atypically high (i.e., >1 mg/L) nitrateconcentrations in several wells (e.g., GW-144) probably reflect recharge of groundwatercontaining nitrate leached from the residuum and-surficial soils overlying the Knox Group.
• Localized grout contamination in the groundwater at several wells in the regime, notablyGW-732 at the Sediment Disposal Basin, is shown by atypical pH (>8.5), carbonatealkalinity (>1 mg/L), and potassium to sodium ratios (>1:1).
• Increasing total boron and sodium concentrations evident in the groundwater at well GW-217since January 1992 potentially indicate downgradient transport of inorganic wastes (possiblyborax cleaning fluids) from Industrial Landfill IV.
• The elevated total boron, strontium, and uranium levels characteristic of the unfilteredgroundwater samples from several wells at Kerr Hollow Quarry probably do not reflectcontamination because: (1) no increasing concentration trends are evident, (2) similarconcentrations occur in groundwater up and downgradient of the quarry, (3) concentrationsare typically highest in the samples from wells (e.g., GW-146) that yield more mineralizedgroundwater samples (TDS >300 mg/L) from low-permeability (matrix) aquifer zones, and(5) results of radiological analyses indicate neither strontium nor uranium isotopes in thegroundwater.
• The performance of the K-25 ASO showed continued improvement with respect to detectionof common laboratory reagents (e.g., methylene chloride) in the QA/QC samples and theassociated groundwater samples. However, problems with operation and/or maintenance of
6-1

the deionized water supply system led to 1,1,1-TCA contamination of the deionized waterused for trip blanks and field blanks, and to decontaminate groundwater sampling equipment.
The known horizontal and vertical extent of dissolved VOCs in groundwater at the SecurityPits remains unchanged from that observed over the past several years. Decreasing VOCconcentrations in the groundwater at the site and correlations with seasonal water levels insome wells indicate that the disposal trenches at the site are no longer active sources ofVOCs. A continued source may now be residual DNAPL in the residuum and bedrockunderlying the disposal trenches.
Although 1,1,1-TCA was not detected in the groundwater samples collected during CY1995from well GW-512, and the 1,1,1-TCA results for well GW-796 were screened as falsepositives, the low (estimated) concentrations repeatedly detected in previous samples fromeach well potentially indicate downgradient transport from the western disposal trenches atthe Security Pits. Additionally, less-than-detection limit results for the samples from thesewells possibly reflect volatilization during sampling and not the absence of 1,1,1-TCA in thegroundwater.
The CY 1995 data for well GW-305 reflect increasing concentrations of 1,1,1-TCA in thegroundwater downgradient (east) of Industrial Landfill IV. Also, the detection of 1,1,1-TCAin the groundwater sample collected from the well in January 1992 and the subsequentconcentration increase corresponds with increasing boron and sodium concentrations in thegroundwater at well GW-217. The only confirmed sources of 1,1,1-TCA in the regime, thewestern disposal trenches at the Security Pits, lie more than 4,000 ft east and 20 fthydraulically downgradient of Industrial Landfill IV. In light of these considerations, the1,1,1-TCA data for well GW-305 potentially indicates migration of chlorinated organicwastes from the landfill.
Low (estimated) concentrations of carbon tetrachloride, chloroform, or PCE sporadicallydetected in samples from wells GW-142 and GW-144 probably reflect downgradienttransport of chlorinated organic wastes from Kerr Hollow Quarry. However, as indicated bythe CY 1995 data, concentrations of these compounds are below applicable MCLs and showno increasing trends; sporadic detection of the VOCs may reflect volatilization duringsampling.
Gross alpha activity and gross beta activity reported for all but a few of the groundwatersamples collected during CY 1995 were less than the respective MDAs. Activities thatexceeded the MDAs were below the 15 pCi/L MCL for gross alpha activity, and the 50pCi/L Safe Drinking Water Act screening level for gross beta activity. Moreover, theseresults were associated with highly turbid (i.e., nonrepresentative) groundwater samples.Additionally, results of isotopic strontium and uranium analyses do not suggest the presenceof these radionuclides in the groundwater.
6-2

Groundwater sampling and analysis activities planned for the Chestnut Ridge Regime during
CY 1997 are specified in the Sampling and Analysis Plan for Groundwater and Surface Water
Monitoring at the Y-12 Plant During Calendar Year 1997 (AJA Technical Services, Inc. 1996).
Besides these planned activities, the following actions are recommended.
• Consecutive daily groundwater samples from wells GW-731 and GW-732 at the SedimentDisposal Basin collected for the purposes of post-closure detection monitoring should becollected only after purging the volumes of water necessary to ensure inflow of freshgroundwater as determined by stabilized field parameters.
• Pressure transducers should be used in wells GW-217 and GW-305 to obtain continuouswater-level hydrographs needed to evaluate the relationship between groundwater flowconditions and respective total boron and 1,1,1-TCA concentrations.
• Analysis for VOCs in the groundwater samples from wells at Rogers Quarry, the EastChestnut Ridge Waste Pile, and the Chestnut Ridge Borrow Area Waste Pile should bediscontinued; aside from common laboratory reagents, no VOCs have been detected insamples collected from the wells over the past several years.
• Low-flow purging and sampling techniques may be needed to avoid volatilization of VOCspotentially present at low concentrations in the groundwater at wells GW-142, GW-144,GW-514,andGW-796.
• Annual sampling of spring stations located along the southern flank of Chestnut Ridge toaugment exit-pathway surveillance monitoring. These stations will include spring SCR2.2SPand potentially other stations of interest.
6-3

7.0 REFERENCES
AJA Technical Services, Inc. 1996. Sampling and Analysis Plan for Groundwater and SurfaceWater Monitoring at the Y-12 Plant during Calendar Year 1997. Prepared for LockheedMartin Energy Systems, Inc. (Y/SUB/96-KDS15V/4).
Battelle Columbus Division. 1988. RCRA Facility Investigation Plan, Filled Coal Ash Pond(D-l 12), Oak Ridge Y-12 Plant, Oak Ridge Tennessee. Prepared for Martin Marietta EnergySystems, Inc. (Y/TS-411).
Blatt, H., G. Middleton, and R. Murray. 1980. Origin of Sedimentary Rocks. ChemicalComposition of Ancient Limestones, Section 14.6, pp 509-510. Prentice-Hall, Inc. NJ .
Brownlow, A.H. 1979. Geochemistry. Compositional Variation of Rocks, Soils, and Plant Ashfrom Various Areas of the United States, Table 7-3, pp 294-295. Prentice-Hall, Inc. N.J.
Buckley, P. 1992. Letter from Mr. Patrick Buckley, Martin Marietta Energy Systems, Inc.Analytical Services Organization, to Ms. Terre Mercier, Paradigm Data Services, Inc.,October 21,1992.
Daniels, D.E., and G. Broderick. 1983. Results of Moisture-Suction and Permeability Tests onUnsaturated Samples. Oak Ridge National Laboratory (ORNL/Sub/83-64764/1).
Dreier, R.B., D.K. Solomon, and CM. Beaudoin. 1987. Fracture Characterization in theUnsaturated Zone of a Shallow Land Burial Facility, in: Flow and Transport throughFractured Rock, American Geophysical Union Monograph 42.
Drier, R.B., T.O. Early, and H.L. King. 1993. Results and Interpretations of Groundwater DataObtained from Multiport-Instrumented Coreholes (GW-131 through GW-135). Fiscal Years1990 and 1991. Martin Marietta Energy Systems, Inc. (Y/TS-803).
Geraghty & Miller, Inc. 1990. A Study of Ground-Water Flow from Chestnut Ridge Security PitsUsing a Fluorescent Dye Tracer. Prepared for Martin Marietta Energy Systems, Inc.(Y/SUB/90-00206C/6).
Grutzeck, M. 1987. United Nuclear Corporation's Y-12 Plant Site: Final Report. PennsylvaniaState University, Materials Research Laboratory. Prepared for Martin Marietta EnergySystems, Inc. (Y/SUB/86-23729/1).
Hatcher, R.D., Jr., P.J. Lemiszki, R.B. Dreier, R.H. Ketelle, R.R. Lee, D.A. Leitzke, W.M.McMaster, J.L. Foreman, and S.Y. Lee, 1992. Status Report on the Geology of the OakRidge Reservation. (ORNL/TM-12074).
7-1
HSW Environmental Consultants, Inc. 1993. Groundwater Quality Assessment Report for theChestnut Ridge Hydrogeologic Regime at the Y-12 Plant: 1992 Groundwater Quality DataInterpretations and Proposed Program Modifications (Y/SUB/93-YP507C/3/P2).
HSW Environmental Consultants, Inc. 1994a. Sampling and Analysis Plan for Groundwater andSurface Water Monitoring at the Y-12 Plant during Calendar Year 1995. Prepared forLockheed Martin Energy Systems, Inc. (Y/SUB/94-EAQ1OC/4).
HSW Environmental Consultants, Inc. 1994b. Calendar Year 1993 Groundwater Quality Reportfor the Chestnut Ridge Hydrogeologic Regime, Y-12 Plant, Oak Ridge, Tennessee: 1993Groundwater Quality Data Interpretations and Proposed Program Modifications(Y/SUB/94-EAQ10C/3/P2).
HSW Environmental Consultants, Inc. 1995. Calendar Year 1994 Groundwater Quality Reportfor the Chestnut Ridge Hydrogeologic Regime, Y-12 Plant, Oak Ridge, Tennessee: 1994Groundwater Quality Data Interpretations and Proposed Program Modifications(Y/SUB/95-EAQ10C/3/P2).
Jones, S.B., B.K. Thompson, and S.M. Field. 1995. Updated Subsurface Data Base for Bear CreekValley, Chestnut Ridge, and Parts of Bethel Valley on the U.S. Department of Energy OakRidge Reservation. Martin Marietta Energy Systems, Inc. (Y/TS-881/R3).
Ketelle, R.H., and D.D. Huff. 1984. Site Characterization of the West Chestnut Ridge Site. OakRidge National Laboratory (ORNL/TM-9229).
King, H.L., and C.S. Haase. 1987. Subsurface-Controlled Geological Maps for the Y-12 Plantand Adjacent Areas of Bear Creek Valley. Oak Ridge National Laboratory (TM-10112).
King, H.L., and C.S. Haase. 1988. Summary of Results and Preliminary Interpretation ofHydrogeologic Packer Testing in Core Holes GW-131 Through GW-135 and CH-157, OakRidge Y-12 Plant. Prepared for Martin Marietta Energy Systems by E.C. Jordan Company.(Y/TS-495).
King, H.L., C.S. Haase, and D.L. LaRue. 1989. Groundwater Investigation Drilling Program forFiscal Years 1986,1987, and 1988 Y-12 Plant, Oak Ridge, Tennessee. Prepared by C-EEnvironmental, Inc. for Martin Marietta Energy Systems, Inc. (Y/SUB/89-E4371V/2).
Lockheed Martin Energy Systems, Inc. 1996. Calendar Year 1995 Groundwater Quality Reportfor the Chestnut Ridge Hydrogeologic Regime, Y-12 Plant, Oak Ridge, Tennessee: 1995Groundwater Quality Data and Calculated Rate of Contaminant Migration. Prepared by theY-12 Plant Environmental Management Department, Health, Safety, Environment, andAccountability Organization. (Y/TS-1435).
7-2

Luxmoore, RJ . 1982. Physical Characteristics of Soils of the Southern Region Fullerton andSequoia Series. Oak Ridge National Laboratory (ORNL-5868). -
Martin Marietta Energy Systems, Inc. 1992. Y-12 Environmental Restoration Remedial ActionSurveillance and Maintenance Program Plan, Oak Ridge Y-12 Plant, Oak Ridge, Tennessee.(Y/ER-50).
Martin Marietta Energy Systems, Inc. 1994. Post-Closure Permit Application for the ChestnutRidge Security Pits at the Y-12 Plant, Oak Ridge, Tennessee. (Y/ER/SUB/91-ALV96/4,Rev. 2. August 1994).
Mishu, L. 1982. Subsurface Analysis of Waste Disposal Facilities at the Y-12 Plant, 81-1020P.Prepared for Martin Marietta Energy Systems, Inc. (Y/SUB/82-24700/2).
Moore, G.K. 1988. Concepts of Groundwater Flow and Occurrence Near Oak Ridge NationalLaboratory, Tennessee. Oak Ridge National Laboratory (ORNL/TM-10969).
Moore, G.K. 1989. Groundwater Parameters and Flow System Near Oak Ridge NationalLaboratory Environmental Sciences Division, Oak Ridge National Laboratory(ORNL/TM-11368).
Quinlan, J.F., and T. Aley. 1987. Discussion of a New Approach to the Disposal of HazardousWaste on Land. Groundwater (Vol. 25, pp. 615-616).
Quinlan, J.F., and R.O. Ewers. 1985. Groundwater Flow in Limestone Terrains: Strategy,Rationale and Procedure for Reliable, Efficient Monitoring of Groundwater Quality in KarstAreas. National Symposium and Exposition on Aquifer Restoration and GroundwaterMonitoring Proceedings, National Water Well Association, Worthington, Ohio (pp.197-234).
Science Applications International Corporation. 1993. Final Report of the Second Dye-Tracer Testat the Chestnut Ridge Security Pits, Y-12 Plant, Oak Ridge, Tennessee. Prepared for MartinMarietta Energy Systems, Inc. (Y/SUB/93-99928C/Y10/1).
Science Applications International Corporation. 1996. Remedial Investigation Report for BearCreek Valley, Draft, Rev. May 1996. Prepared for Lockheed Martin Energy Systems, Inc.
Shevenell, L.A. 1994a. Chemical Characteristics of Water in Karst Formations at the Oak RidgeY-12 Plant. Prepared for Martin Marietta Energy Systems, Inc. (Y/TS-1001).
Shevenell, L.A. 1994b. Analysis of Well Hydrographs in a Karst Aquifer: Estimates of SpecificYield and Continuum Transmissivities. Prepared for Martin Marietta Energy Systems, Inc.(Y/TS-1263).
7-3

Sledz, J.S. and D.D. Huff. 1981. Computer Model for Determining Fracture Porosity andPermeability in the Conasauga Group, Oak Ridge National Laboratory, Tennessee.Environmental Sciences Division Publication No. 1677 (ORNL/TN-7695).
Smith, R.E., NJ . Gilbert, and C.E. Sams. 1983. Stability Analysis of Waste Disposal Facilitiesat the Y-12 Plant Prepared for Martin Marietta Energy Systems, Inc. (Y/SUB/83-49712/1).
Solomon, D.K., G.K. Moore, L.E. Toran, R.B. Dreier, and W.M. McMaster. 1992. Status ReportA Hydrologic Framework for the Oak Ridge Reservation. Oak Ridge National Laboratory(ORNL/TM 12053).
U.S. Department of Energy. 1991. United Nuclear Corporation Record of Decision. IRC No.910704.0092, June 1991.
U.S. Department of Energy. 1993a. Remedial Investigation Work Plan for Chestnut Ridge. Operable Unit 1 (Chestnut Ridge Security Pits) at the Oak Ridge Y-12 Plant, Oak Ridge,
Tennessee. (DOE/OR/01-1173&D1).
U.S. Department of Energy. 1993b. Postconstruction Report for the United Nuclear CorporationSite at the Oak Ridge Y-12 Plant, Oak Ridge, Tennessee. (DOE/OR/01-1128&D1).
U.S. Department of Energy. 1993c. Remedial Investigation Work Plan for Chestnut RidgeOperable Unit 4 (Rogers Quarry/McCoy Branch) at the Oak Ridge Y-12 Plant, Oak Ridge,Tennessee. (DOE/OR-1152&D1).
U.S. Department of Energy. 1994. Remedial Investigation Report on Chestnut Ridge OperableUnit 2 (Filled Coal Ash Pond/Upper McCoy Branch) at the Oak Ridge Y-12 Plant, OakRidge, Tennessee. (DOE/OR-01-1268/V1&D1).
U.S. Department of Energy. 1995. Feasibility Study for the Y-12 Chestnut Ridge Operable Unit 2.(Filled Coal Ash Pond), Oak Ridge, Tennessee. (DOE/OR/02-1259&D2, January 1995).
Watson, K.W. and R.J. Luxmoore. 1986. Estimating Macroporosity in a Forested Watershed byuse of a Tension Infiltrometer. Soil Science Society of America, Journal 50 (pp. 578-582).
Wilson, G.V. and R.J. Luxmoore. 1988. Infiltration, Macroporosity, and MesoporosityDistributions of two Forested Watersheds. Soil Science Society of America, Journal 52 (pp.329-355).
Woodward-Clyde Consultants, Inc. 1984. Subsurface Characterization and Geohydrologic SiteEvaluation, West Chestnut Ridge Site. Oak Ridge National Laboratory(ORNL/SUB/83-647641/IVI2).
7-4
APPENDIX A
FIGURES

OAK RIDGECITY BOUNDARY
OAK RIDGERESERVATION
BOUNDARY
SCALE CMILES>
PREPARED FOR:LOCKHEED MARTINENERGY SYSTEMS, INC.
PREPARED BY:
AJA TECHNICIALSERVICES, INC.
LOCATION:
DOC NUMBER:DWG ID.:
DATE:
Y-12 PLANTOAK RIDGE, TN.
96-D00196-0203-19-96
RGURE 1
REGIONAL LOCATION OF THE Y-12 PLANT
A-1

UPPER EAST FORKPOPLAR CREEKHYDROGEOLOGIC
REGIMEY-12
PLANT
OAK RIDGERESERVATION
BOUNDARY
BEAR CREEKHYDROGEOLOGIC
REGIME
CHESTNUT RIDGEHYDROGEOLOGIC
REGIME
SCALE (MILES)
PREPARED FOR:LOCKHEED MARTINENERGY SYSTEMS, INC.
PREPARED BY:
AJA TECHNICIALSERVICES, INC.
LOCATION:
DOC NUMBER:DWG ID.:
DATE:
Y - 1 2 PLANTOAK RIDGE, TN.
96-D00196-021
3-19-96
RGURE 2
HYDROGEOLOGIC REGIMESAT THE Y-12 PLANT
A-2

66,000
50,000
<<a.x
X QQ.•< LLIEO,f,
o < 5o. o; Eo 3 Q-t- to OT
PREPARED FOR:LOCKHEED MARTINENERGY SYSTEMS, INC.
PREPARED BY:
AJA TECHNICIALSERVICES, INC.
LOCATION:
DOC NUMBER:DWG ID.:
DATE:
Y-12 PLANTOAK RIDGE, TN.
96-D00196-022
3-19-96
RGURE 3
WASTE-MANAGEMENT SITES AND CERCLAOPERABLE UNITS IN THE CHESTNUT RIDGE
HYDROGEOLOGIC REGIME
A-3
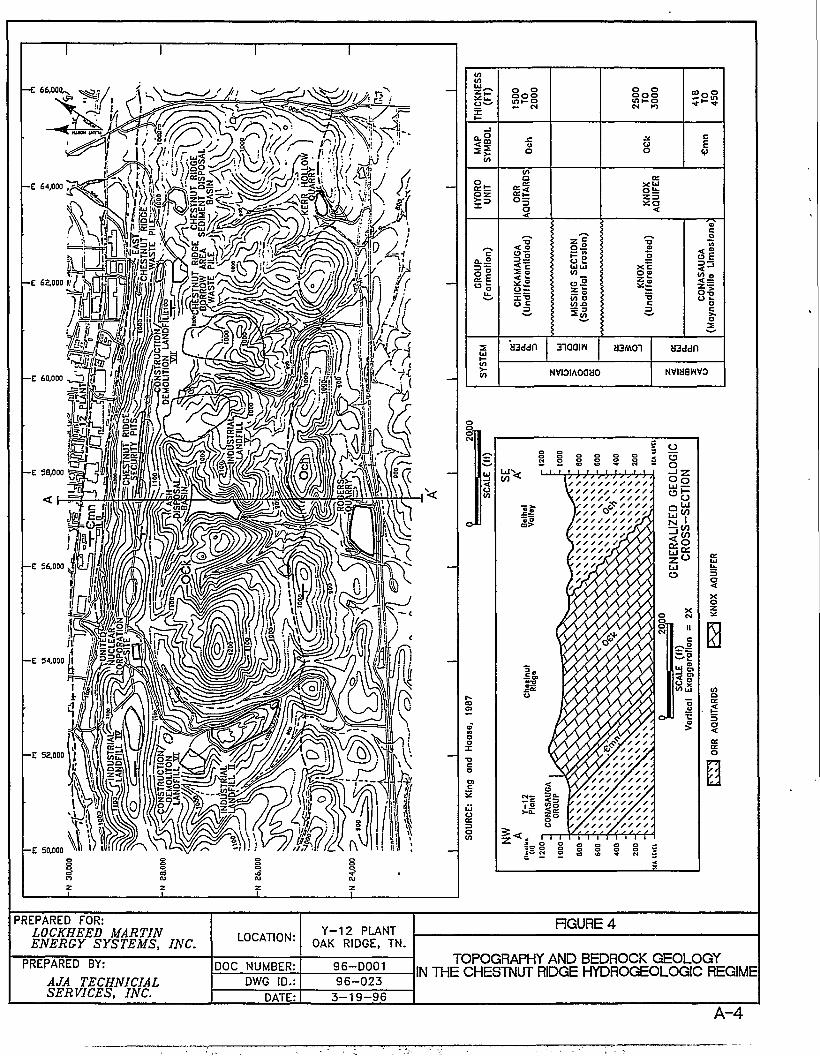
- E 66.000U,
- E 64,000 , *
- E 62,000 (/
—E 60,000
- E 58,000
- E 56,000
- E 54,000
- E 5&000
- E 50,000
THIC
KN
ESS
(FT)
MA
PSY
MB
OL
HYD
RO
UN
ITG
RO
UP
(Fo
rmal
lon
)SY
STEM
1500 TO 2000
.coo
soavunov
aao
CH
ICK
AM
AU
GA
(Un
dllf
oro
nlla
lod
)
mddn
MIS
SIN
G
SEC
TIO
N(S
ub
aorl
al
Ero
sio
n)
3iaam
25
00
TO3
00
0
i
COQO
•Cm
n
KN
OX
AQ
UIF
ER
KN
OX
(Un
dif
fere
nti
ole
d)
a3M01
NvoiAoaao
CO
NA
SAU
GA
(May
no
rdvi
lle L
imes
ton
e)
MBddfl
Nviaawvo
I o
PREPARED FOR:LOCKHEED MARTINENERGY SYSTEMS, INC.
PREPARED BY:
AJA TECHNICIALSERVICES, INC.
LOCATION:
DOC NUMBER:
DWG ID.:
DATE:
Y-12 PLANTOAK RIDGE, TN.
96-D001
96-023
3-19-96
RGURE 4
TOPOGRAPHY AND BEDROCK GEOLOGYIN THE CHESTNUT RIDGE HYDROGEOLOGIC REGIME
A-4
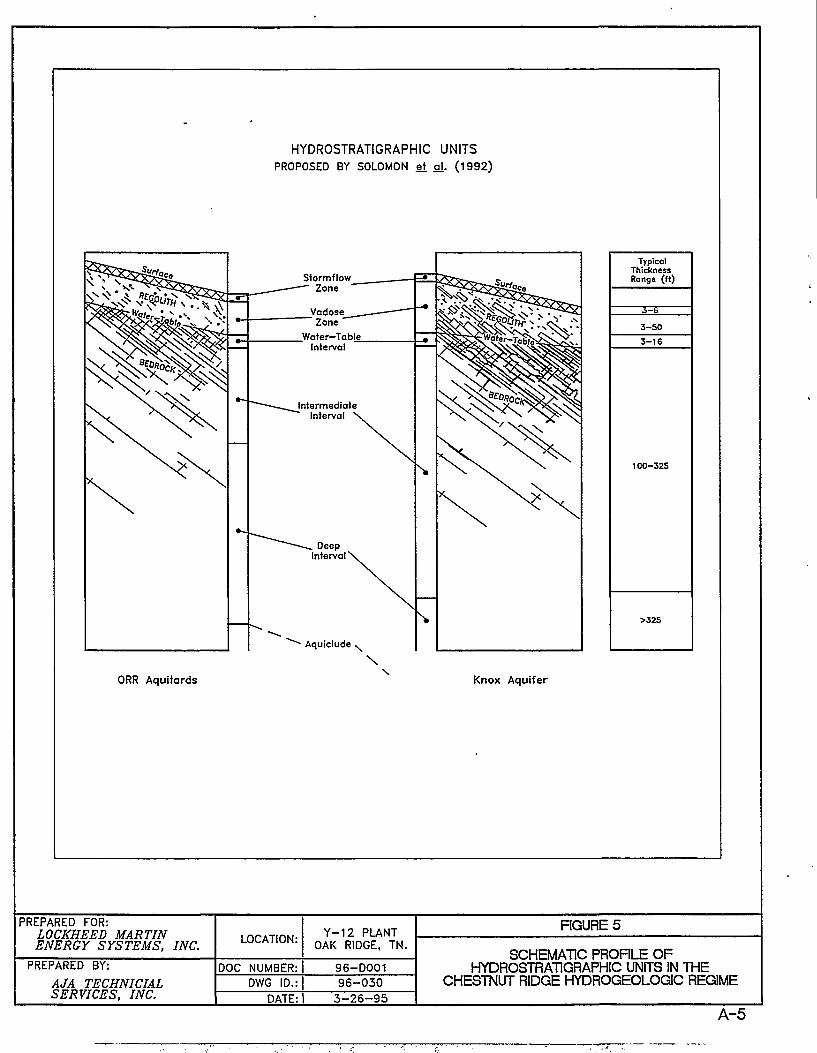
HYDROSTRATIGRAPHIC UNITS
PROPOSED BY SOLOMON et oh (1992)
StormflowZone
_VadoseZone '
_Water-Table_Interval
IntermediateInterval
DeepIntervaP
- Aquiclude N
TypicalThicknessRange (ft)
3-50
3-16
100-325
>325
\
ORR Aquitards Knox Aquifer
PREPARED FOR:LOCKHEED MARTINENERGY SYSTEMS, INC.
PREPARED BY:
AJA TECHNICIALSERVICES, INC.
LOCATION:
DOC NUMBER:
DWG ID.:
DATE:
Y-12 PUNTOAK RIDGE, TN.
96-D001
96-030
3-26-95
RGURE 5
SCHEMATIC PRORLE OFHYDROSTRATIGRAPHIC UNITS IN THE
CHESTNUT RIDGE HYDROGEOLOGIC REGIME
A1!"
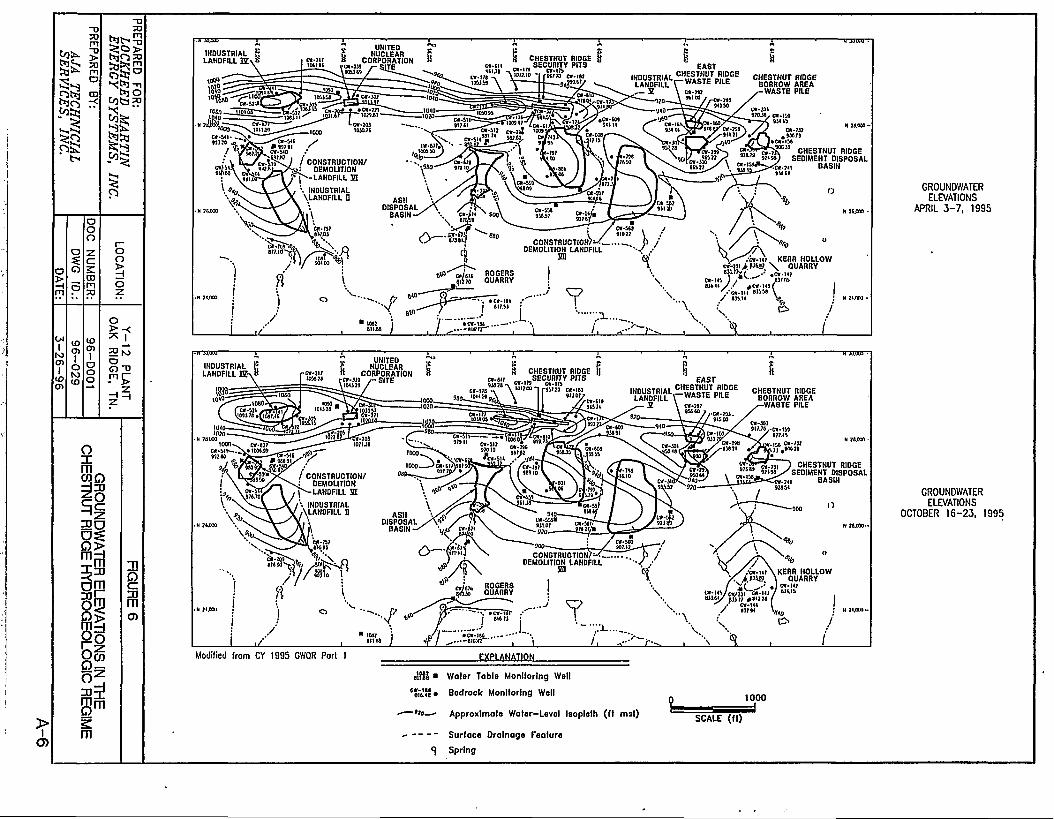
0>
a>
O)
IP•
tqO
oo5
sm
,30
OoBSi§1mD1
m
CHESTNUT RIDGEBORROW AREA
WASTE PILE
/ CONSTRUCTION/DEMOLITION
-LANDFILL S I
CHESTNUT RIDGESEDIMENT DISPOSAL
BASIN
.•w-ili KERR HOLLOW>, \ QUARRY
cw-ni ) <* — ' M;ni
INDUSTRIALLANDFILL E A
UNITEDNUCLEAR
CORPORATION-SITE
CHESTNUT RIDGEBORROW AREA
'A8TE PILE
/ CONSTRUCTION/DEMOLITION
\ ^ - LANDFILL
'•. INDUSTRIAL\LANDFILL D
CHESTNUT RIDGESEDIMENT DISPOSAL
BASIN
KERR HOLLOWQUARRY
Modified from CY 1995 GWQR Port 1 EXPLANATION
elfIS • Water Table Monitoring Well
"ml\\» Bedrock Monitoring Well
—> io -^ Approximate Water-Level Isopleih ( f t msl)
Surface Drainage Feature
<\ Spring
SCALE ( f t )
GROUNDWATER
ELEVATIONS
APRIL 3 - 7 , 1995
GROUNDWATER
ELEVATIONS
OCTOBER 1 6 - 2 3 , 1995
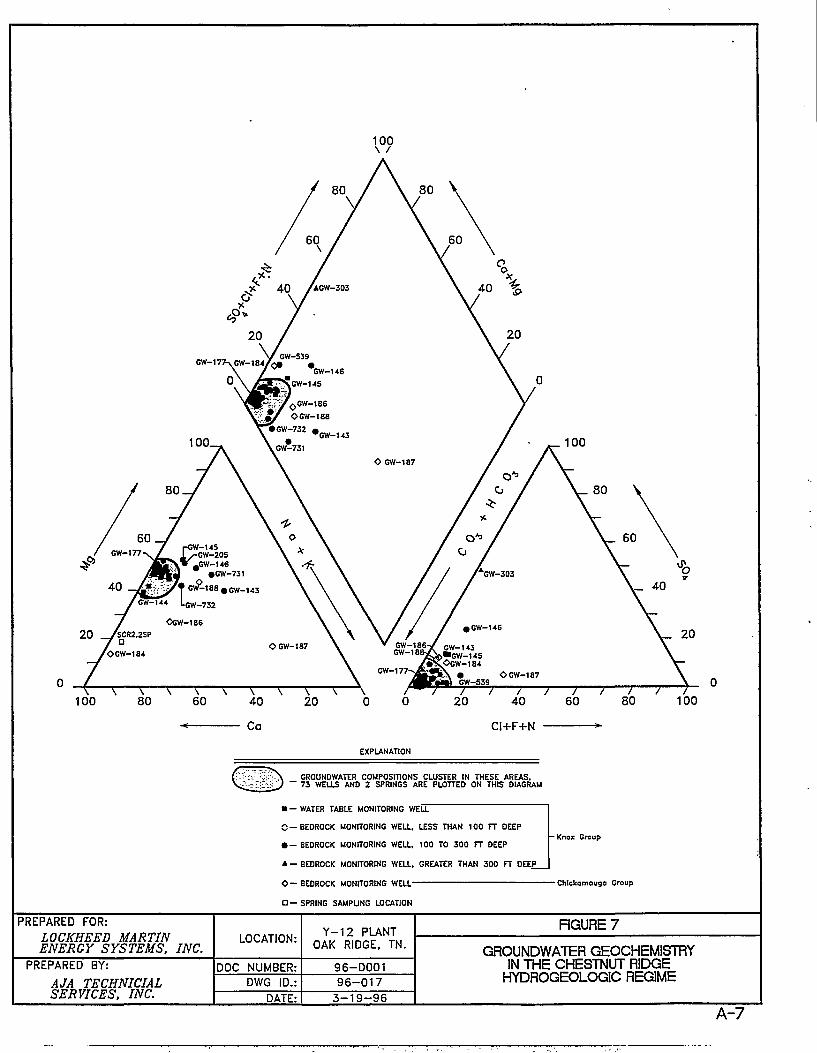
I 8 B « C W - 1 4 3
l-GW-732
OGW-186
100
EXPLANATION
GROUNDWATER COMPOSITIONS CLUSTER IN THESE AREAS.73 WE1XS AND 2 SPRINGS ARE PLOTTED ON THIS DIAGRAM
• - WATER TABLE MONITORING WELL
C — BEDROCK MONITORING WELL. LESS THAN 100 FT DEEP
• - BEDROCK MONITORING WELL, 100 TO 300 FT DEEP
A — BEDROCK MONITORING WELL. GREATER THAN 300 FT DEEP
O - BEDROCK MONITORING WELL
~ Knox Group
•Chlckomauga Group
• — SPRING SAMPLING LOCATION
PREPARED FOR:
LOCKHEED MARTINENERGY SYSTEMS, INC.
PREPARED BY:
AJA TECHNICIALSERVICES, INC.
LOCATION:
DOC NUMBER:DWG ID.:
DATE:
Y - 1 2 PUNTOAK RIDGE, TN.
96-D00196-017
3-19-96
RGURE 7
GROUNDWATER GEOCHEMISTRYIN THE CHESTNUT RIDGE
HYDROGEOLOGIC REGIME
A-7
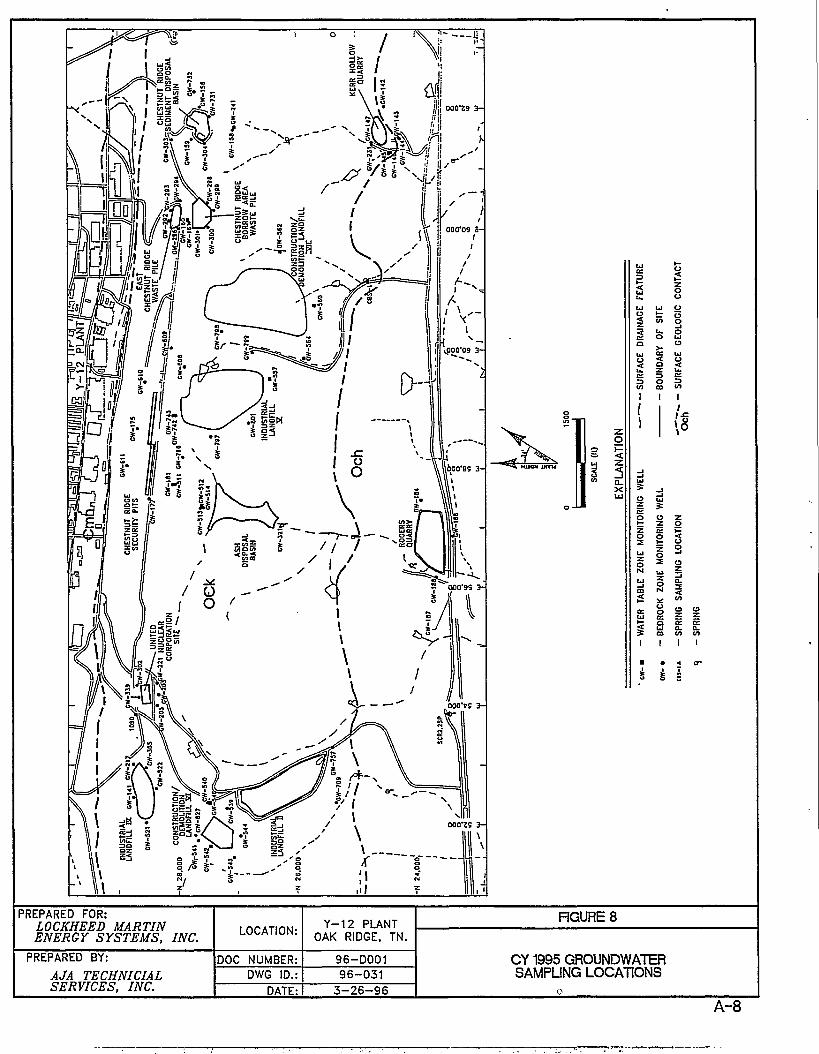
//jl 000*29 3 -
CO
N
NAG
Q
i i i
!FA
CI
MIS
1
SIT
u.oai
BO
UN
DA
1
LOG
I
oU l
oU l
£ft?
SUI
1
o a
o
3ooa.
oi i .o ce ceUJ a . a .en V) v)I I I
s s
PREPARED FOR:LOCKHEED MARTINENERGY SYSTEMS, INC.
PREPARED BY:
AJA TECHNICIALSERVICES, INC.
LOCATION:
DOC NUMBER:DWG ID.:
DATE:
Y-12 PUNTOAK RIDGE, TN.
96-D00196-031
3-26-96
RGURE 8
CY 1995 GROUNDWATERSAMPUNG LOCATIONS
A-8

GW-144Nitrate Concentration (mg/L) Water in Well (ft)
1 I I I I I I I t i l l !
124
122
120
118
116
1 2 3 4 1 2 3 4 1 2 3 4 1 2 3 4 1 2 3 4 1 2 3 4I 1990 I 1991 I 1992 I 1993 I 1994 I 1995
Nitrate Water in Well
114
GW-147
2
1.5
1
0.5
n
Nitrate
',
-\
*
- V\
Concentration
•
; \ * /
' '»/ \ '
(mg/L)
r,
\ 1* »i *
t »
1 1 1
A/ \/ \/ \
i f
Water
/Ai i i t i t
in Well
y
// »
\
i i
(ft)
& -
\
-**
i
1 2 3 4 1 2 3 4 1 2 3 4 1 2 3 4 1 2 3 4 1 2 3 4I 1990 I 1991 I 1992 I 1993 I 1994 I 1995
Nitrate Water in Well
62
60
58
56
54
52
PREPARED FOR:LOCKHEED MARTINENERGY SYSTEMS, INC.
PREPARED BY:AJA TECHNICIALSERVICES, INC.
LOCATION:
DOC NUMBER:DWG ID.:
DATE:
Y - 1 2 PLANTOAK RIDGE, TN.
96-D001HG9
4-28-96
FIGURE 9
NITRATE CONCENTRATIONSIN GROUNDWATER AT WELLS
GW-144 AND GW-147
A-9
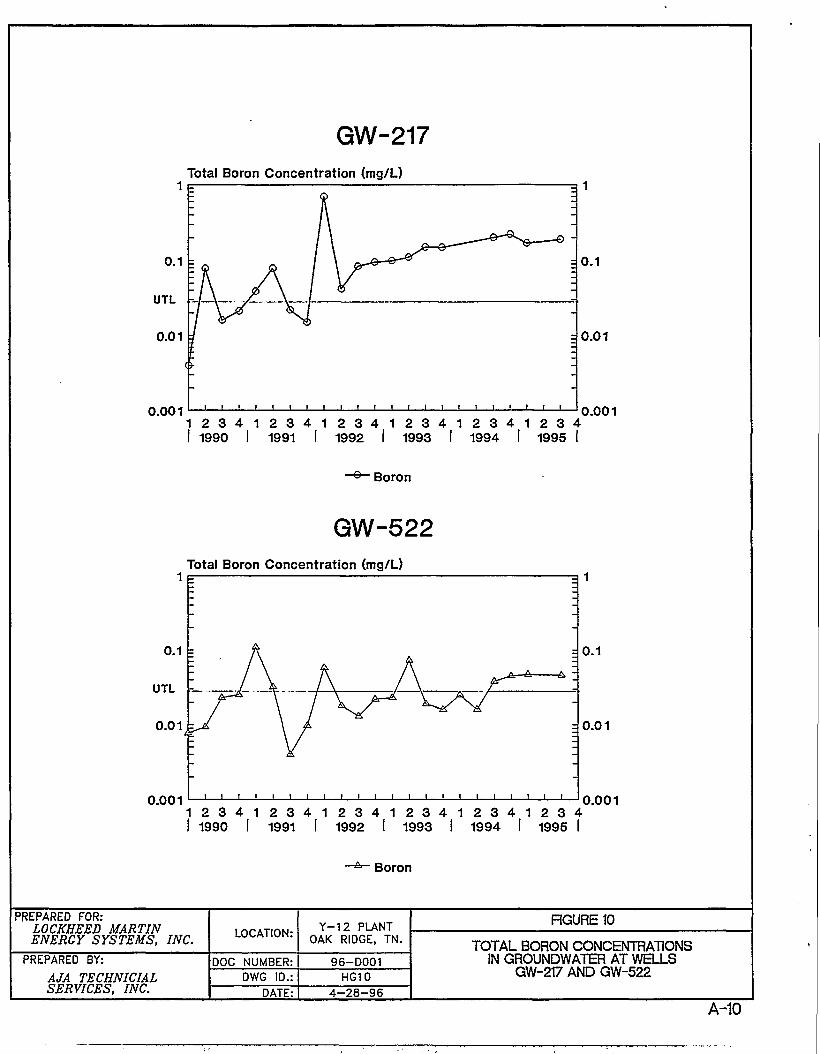
GW-217Total Boron Concentration (mg/L)
1 F
I I I I t I I I I I I I I I I I 1 1 I I I I
1 2 3 4 1 2 3 4 1 2 3 4 1 2 3 4 1 2 3 4 1 2 3 4I 1990 I 1991 I 1992 I 1993 I 1994 I 1995 I
• Boron
GW-522Total Boron Concentration (mg/L)
1 P q 1
K/W r-A "
t i l l i i I I i i i i i i i i i
0.1
0.01
1 2 3 4 1 2 3 4 1 2 3 4 1 2 3 4 1 2 3 4 1 2 3 4I 1990 I 1991 I 1992 I 1993 I 1994 I 1995 I
Boron
PREPARED FOR:LOCKHEED MARTINENERGY SYSTEMS, INC.
PREPARED BY:
AJA TECHNICIALSERVICES, INC.
LOCATION:
DOC NUMBER:DWG ID.:
DATE:
Y-12 PUNTOAK RIDGE, TN.
96-D001HG10
4-28-96
HGURE 10
TOTAL BORON CONCENTRATIONSIN GROUNDWATER AT WELLS
GW-217 AND GW-522
A-10

DowngradientBoron, Uranium (mg/L)
10 EStrontium (mg/L)
= 100
0.001
0.014
1 2 3 4 1 2 3 4 1 2 3 4 1 2 3 4 1 2 3 4 1 2 3 4I 1990 I 1991 I 1992 I 1993 I 1994 I 1995 I
0.008
O.00S
0.004
0.002
- GW-143 (B) -&" GW-14S (U)
UraniumTotal Uranium (mg/L)
• GW-ttB (Sr)
0.008
0.006
- 0.004
0.002
1 2 3 4 1 2 3 4 1 2 3 4 1 2 3 4 1 2 3 4 1 2 3 4I 1990 I 1991 I 1992 I 1993 I 1994 I 1995 I
-GW-147(upgrad.) - GW-144 (downgrad.)
StrontiumTotal Strontium (mg/L) Dissolved Solids (mg/L)
400
1 2 3 4 1 2 3 4 1 2 3 4 1 2 3 4 1 2 3 4 1 2 3 4I 1990 I 1991 I 1992 I 1993 I 1994 I 1995
100
GW-146 (Sr)
GW-144 (Sr)
- * - GW-148(TDS)
• * • QW-144(TDS)
PREPARED FOR:LOCKHEED MARTINENERGY SYSTEMS, INC.
PREPARED BY:
AJA TECHNICIALSERVICES, INC.
LOCATION:
DOC NUMBER:
DWG ID.:
DATE:
Y - 1 2 PUNTOAK RIDGE, TN.
96-D001
HG11
4-28-96
RGURE11
BORON, STRONTIUM, AND URANIUMCONCENTRATIONS IN GROUNDWATER
AT KERR HOLLOW QUARRY
A-11

5to
O)CO
o
go2
o
i2! too
CONSTRUCTION/DEMOLITIONUNDFILL 3ZE
INDUSTRIALLANDFILL E
UNITEDNUCLEAR
CORPORATION
INDUSTRIALLANDFILL E
CHESTNUT RIDGESECURITY PITS
N 24.000
CHESTNUT1 RIDGE rWASTE PILE
? J/CHESTNUT RIDGE£ VSEDIMENT DISPOSA
BASINSAL
GW-292NO G W - 2 9 3
N D GW-303NO
GW-29< •• N D GW-IS9
ND,GU-304
-298-299
CHESTNUT RIDGE //BORROW AREA » i
1 WASTE PILE \ /~ GW-S62 \/GW-S62
ND
, CONSTRUCTION/ 'DEMOLITION LANDFILL '
\
SCALE (FT)
EXPLANATION
Surface Drainage Feature
• — Water Table Monitoring Well
t — Bedrock Monitoring Well
A — Spring Sampling Location
* Historic Data,* Well Not Sampled In CY 1995
ND
4.3 —
Not Detected
Plume DelineationValue (ug/L)
ND0-100 ug/L
>100 ug/L
^JaaaJ — VOC Concentration outsidePlums Boundaries (ug/L)
too —— — Line * ' Equal Concentration

70
AR
E
'HN
ICIAL
S, IN
C.
o
00
o
oo
o
o
22 ro
> 2
O3So
PI
m m
GW-178K
10.00
SCALE
EXPLANATION
TCA — Annual Average 1,1,1-Trichloroethane Concentration (ug/L)
PCE — Annual Average Tetrachloroethene Concentration (ug/L)
TOT — Plume Delineation Value (ug/L)
ND — Not Detected
— PCE > 50% of TOT
* >
TCA > 50% of TOT
[3.0) TCA Concentration From CY 1994,False Positive In CY 1995
• — Bedrock Monitoring Well
« — Well not Sampled in CY 1995

i
ui
t q O
oo
oz
h
W SECTIONB-B '
Elovalion A(fl. msl) A1200 —i
1100 —
1000 —
900 —
800 —
700 —
600'
WESTERN TRENCH EASTERN TRENCH
GW-17725
GW-g178*v ~~GW-322*U\ S38 '
^ GW-174*
5 0 0 -
34 GW-173*
GW-60988
06k
—1200
—1100
—1000
—900
—800
—700
ND VERTICAL EXAGGERATION
SECTION
-600
LOCATION OF SECTIONS
6 0 0 •NO VERTICAL EXAGGERATION
600
•€mn
OGk
HORIZONTALSCALE (FT)
EXPLANATION
GW-322'- HISTORIC DATA
G W - 1 7 7 - W E L L NUMBER AND24-PLUME DELINEATION VALUE\ -TOP OF FRESH BEDROCK• -SCREENED WELL CONSTRUCTIONa -OPEN-HOLE WELL CONSTRUCTION
_ » _ - GROUNDWATER ELEVATION
—100 APPROXIMATE LINE OF EQUAL CONCENTRATION ( u g / L )
— • APPROXIMATE GEOLOGIC CONTACT
06k -KNOX GROUP•Gmn -MAYNARDVILLE LIMESTONE
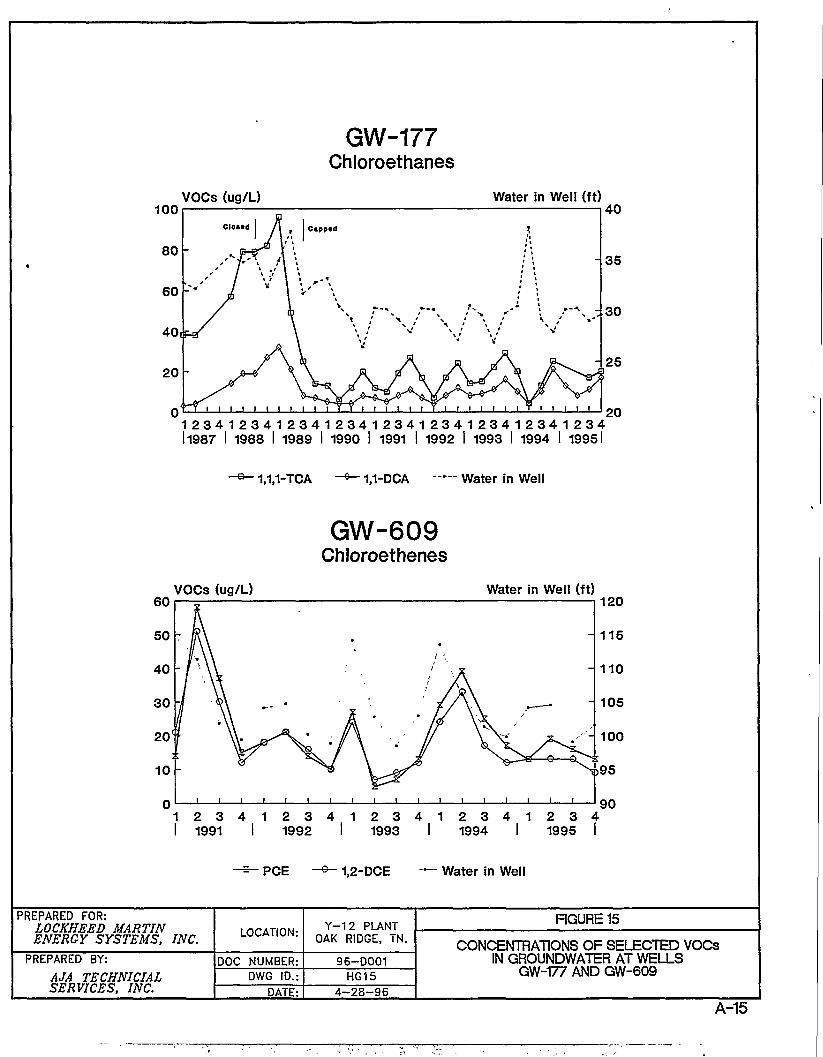
GW-177Chloroethanes
VOCs (ug/L) Water in Well (ft)40
35
1 2 3 4 1 2 3 4 1 2 3 4 1 2 3 4 1 2 3 4 1 2 3 4 1 2 3 4 1 2 3 4 1 2 3 411987 I 1988 I 1989 I 1990 ! 1991 I 1992 I 1993 I 1994 I 19951
1,1,1-TCA - * - 1,1-DCA Water in Well
GW-609Chloroethenes
VOCs (ug/L) Water in Well (ft)120
i i i i i i t i i i i i
1 2 3 4 1 2 3 4 1 2 3 4 1 2 3 4 1 2 3 4I 1991 I 1992 I 1993 I 1994 I 1995 I
1,2-DCE Water in Weil
PREPARED FOR:LOCKHEED MARTINENERGY SYSTEMS, INC.
PREPARED BY:
AJA TECHNICIALSERVICES, INC.
LOCATION:
DOC NUMBER:DWG ID.:
DATE:
Y-12 PUNTOAK RIDGE, TN.
96-D001HG15
4-28-96
RGURE15
CONCENTRATIONS OF SELECTED VOCsIN GROUNDWATER AT WELLS
GW-177 AND GW-609
A-15
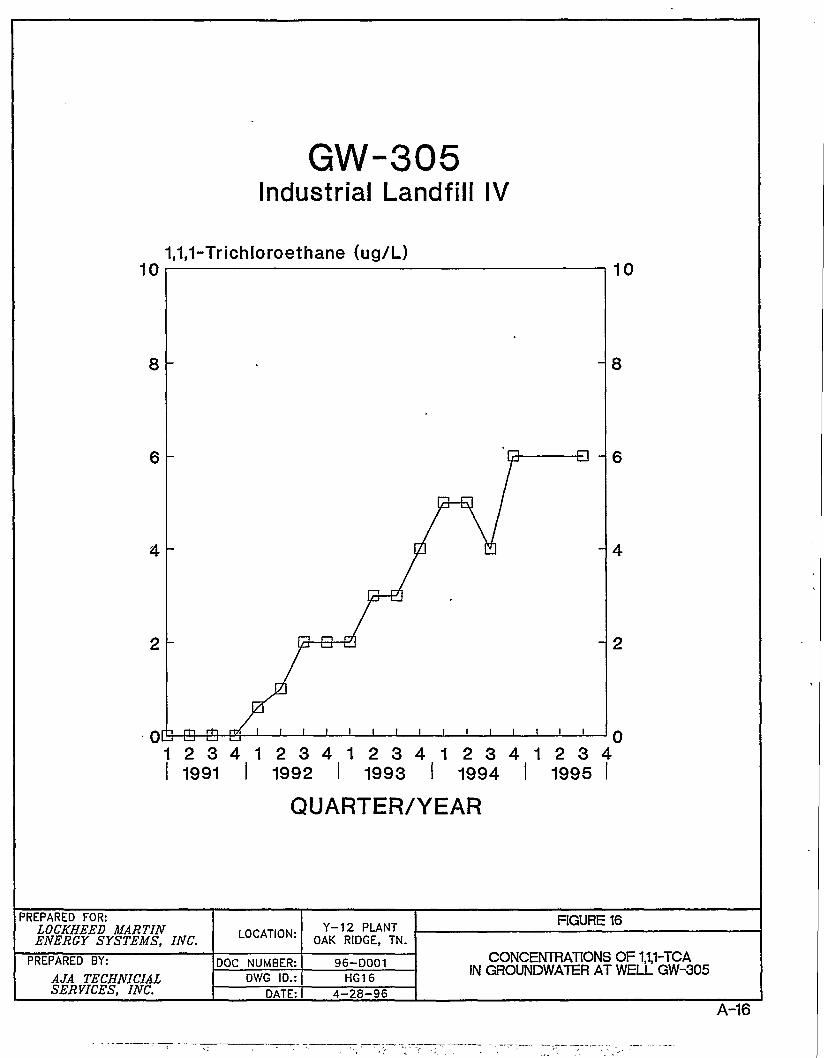
GW-305Industrial Landfill IV
1,1,1-Trichloroethane (ug/L)
- 2
1 2 3 4 1 2 3 4 1 2 3 4 1 2 3 4 1 2 3 4I 1991 i 1992 I 1993 I 1994 I 1995 I
QUARTER/YEAR
PREPARED FOR:LOCKHEED MARTINENERGY SYSTEMS, INC.
PREPARED BY:
AJA TECHNICIALSERVICES, INC.
LOCATION:
DOC NUMBER:DWG ID.:
DATE:
Y-12 PUNTOAK RIDGE, TN.
96-D001HG16
4-28-96
HGURE 16
CONCENTRATIONS OF 1,1,1-TCAGROUNDWATER AT WELL GW-305
A-16
APPENDIX B
TABLES


Table 1. Waste-Management Sites and CERCLA Operable Unitsin the Chestnut Ridge Hydrogeologic Regime
Site
Chestnut Ridge Sediment Disposal Basin
East Chestnut Ridge Waste Pile
Kerr Hollow Quarry
Chestnut Ridge Security Pits
Ash Disposal Basin
United Nuclear Corporation Site
Rogers Quarry
Industrial Landfill II
Industrial Landfill IV
Industrial Landfill V
Construction/Demolition Landfill VI
Construction/Demolition Landfill VII
Chestnut Ridge Borrow Area Waste Pile
Regulatory
Historical1
TSD Unit
TSD Unit
TSD Unit
TSD Unit
SWMU
SWMU
SWMU
SWDF
SWDF
N/A
N/A
N/A
NR
Classification
Current2
Study Area/TSD Unit
Study Area/TSD Unit
Study Area/TSD Unit
CROUOl/TSDUnit
CROU02
CROU03
CROU04
SWDF
SWDF
SWDF
SWDF
SWDF
Study Area
Notes:1 Regulatory classification before the 1992 Federal Facility Agreement.
TSD Unit - RCRA-regulated land-based Treatment, Storage, or Disposal Facility.SWMU - RCRA-regulated Solid Waste Management UnitSWDF - Solid Waste Disposal Facility (non-hazardous waste)
N/A - Not applicable (new facility)NR - Not regulated
2 Modified from: Oak Ridge Reservation Site Management Plan for the EnvironmentalRestoration Program (U.S. Department of Energy 1994)
CR OU 01 - Chestnut Ridge Operable Unit 01 (Source Control and Groundwater OU)CR OU 02 - Chestnut Ridge Operable Unit 02 (Source Control and Groundwater OU)CR OU 03 - Chestnut Ridge Operable Unit 03 (Source Control and Groundwater OU)CR OU 04 - Chestnut Ridge Operable Unit 04 (Source Control and Groundwater OU)
B-l
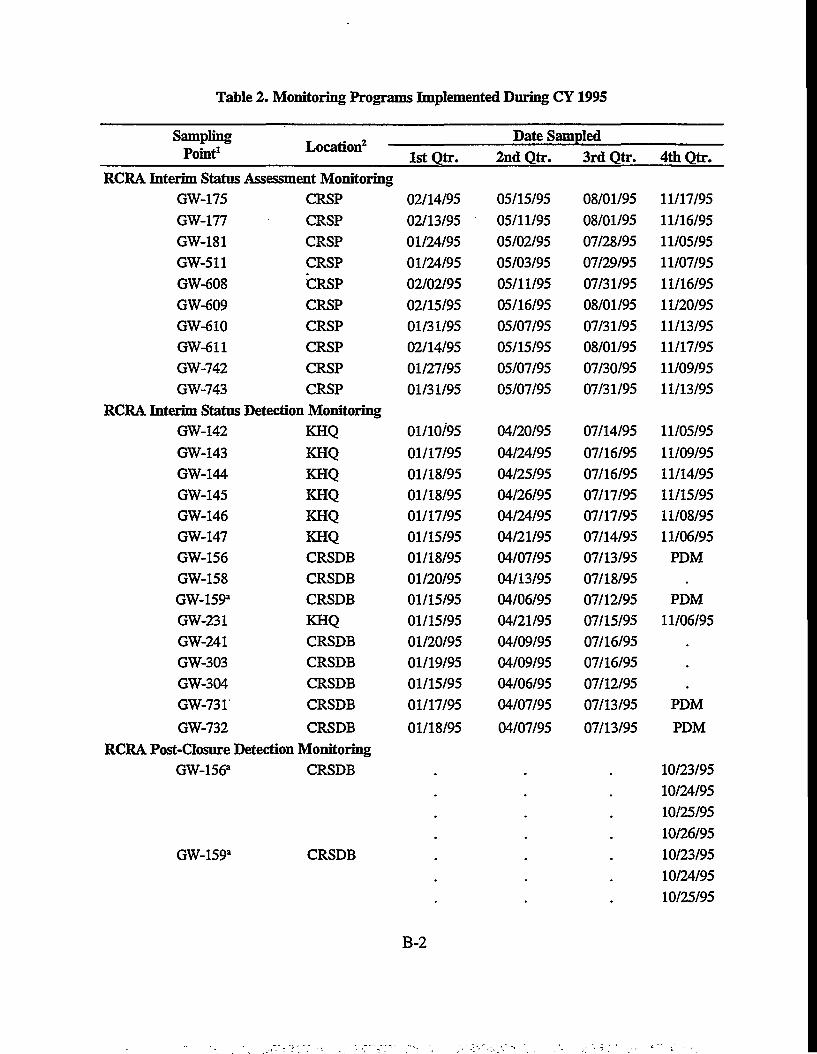
Table 2. Monitoring Programs Implemented During CY 1995
SamplingPoint1 Location lstOtr.
RCRA Interim Status Assessment Monitoring
GW-175
GW-177
GW-181
GW-511
GW-608
GW-609
GW-610
GW-611
GW-742
GW-743
CRSP
CRSP
CRSP
CRSP
CRSP
CRSP
CRSP
CRSP
CRSP
CRSP
RCRA Interim Status Detection Monitoring
GW-142
GW-143
GW-144
GW-145
GW-146
GW-147
GW-156
GW-158
GW-159*
GW-231
GW-241
GW-303
GW-304
GW-731
GW-732
KHQ
KHQ
KHQ
KHQ
KHQ
KHQ
CRSDB
CRSDB
CRSDB
KHQ
CRSDB
CRSDB
CRSDB
CRSDB
CRSDB
RCRA Post-Closure Detection Monitoring
GW-156a
GW-159*
CRSDB
CRSDB
02/14/95
02/13/95
01/24/95
01/24/95
02/02/95
02/15/95
01/31/95
02/14/95
01/27/95
01/31/95
01/10/95
01/17/95
01/18/95
01/18/95
01/17/95
01/15/95
01/18/95
01/20/95
01/15/95
01/15/95
01/20/95
01/19/95
01/15/95
01/17/95
01/18/95
Date Sampled
2nd Qtr.
05/15/95
05/11/95
05/02/95
05/03/95
05/11/95
05/16/95
05/07/95
05/15/95
05/07/95
05/07/95
04/20/95
04/24/95
04/25/95
04/26/95
04/24/95
04/21/95
04/07/95
04/13/95
04/06/95
04/21/95
04/09/95
04/09/95
04/06/95
04/07/95
04/07/95
m
.
3rd Qtr.
08/01/95
08/01/95
07/28/95
07/29/95
07/31/95
08/01/95
07/31/95
08/01/95
07/30/95
07/31/95
07/14/95
07/16/95
07/16/95
07/17/95
07/17/95
07/14/95
07/13/95
07/18/95
07/12/95
07/15/95
07/16/95
07/16/95
07/12/95
07/13/95
07/13/95
m
m
.
4th Qtr.
11/17/95
11/16/95
11/05/95
11/07/95
11/16/95
11/20/95
11/13/95
11/17/95
11/09/95
11/13/95
11/05/95
11/09/95
11/14/95
11/15/95
11/08/95
11/06/95
PDM.
PDM
11/06/95
PDM
PDM
10/23/95
10/24/95
10/25/95
10/26/95
10/23/95
10/24/95
10/25/95
B-2

SamplingPoint1
Table 2 (cont'd)
Location lstQtr.RCRA Post-Closure Detection Monitoring (cont'd)
GW-159*
GW-731
GW-732
CRSDB
CRSDB
CRSDB
CERCLA Record of Decision Monitoring1090
GW-203
GW-205
GW-221
GW-302
GW-339
UNCS
UNCS
UNCS
UNCS
UNCS
UNCS
•
m
m
SWDF Detection and Background MonitoringCBS-lb
GW-141GW-217GW-305GW-521a
GW-522
GW-539a
GW-540GW-541a
• GW-542GW-543GW-544
GW-546GW-557
GW-560
GW-562GW-564
GW-709
CDLVHLIVLIVLIVLIVLIVLUCDLVI
CDLVICDLVICDLVICDLVI
CDLVILVCDLVO
CDLVHCDLVHLH
01/09/95
01/04/9501/10/9501/09/9501/10/9501/04/95
01/09/95
Date Sampled2nd Qtr.
04/20/95
04/18/95
04/18/95
04/19/95
04/19/95
04/19/95
04/17/95
04/04/9504/05/9504/06/9504/06/9504/06/95
04/05/9504/06/95
04/05/95
04/05/9504/06/95
3rd Qtr.
•
07/10/95
07/10/9507/12/9507/11/9507/12/9507/10/95
07/10/95
4th Qtr.
10/26/95
10/23/95
10/24/95
10/25/95
10/26/95
10/23/95
10/24/95
10/25/95
10/26/95
10/09/95
10/07/95
10/07/95
10/08/95
10/08/95
10/08/95
10/11/95
10/06/95
10/11/9510/12/95
10/16/9510/17/9510/17/95
10/11/95
10/07/9510/06/95
10/06/9510/07/95
10/06/95
B-3
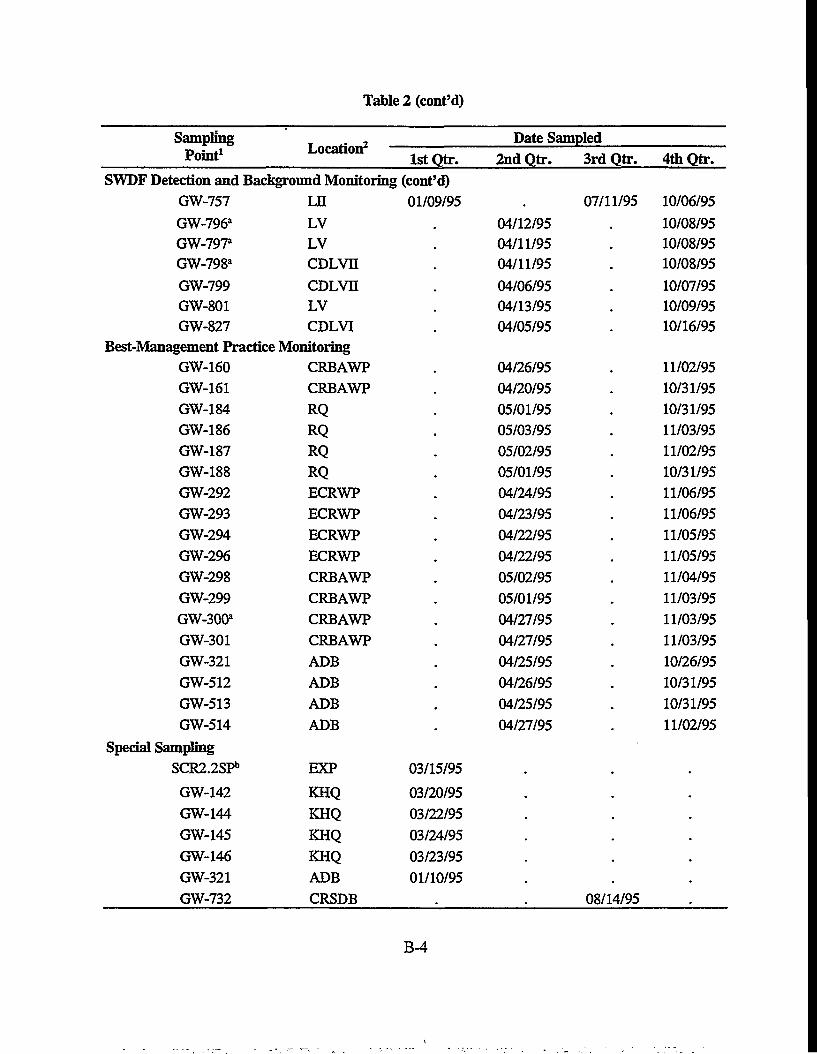
Table 2 (cont'd)
SamplingPoint1 Location lstQtr.
SWDF Detection and Background Monitoring (cont'd)GW-757GW-796*GW-797a
GW-798a
GW-799GW-801GW-827
LHLVLVCDLVH
CDLVnLVCDLVI
Best-Management Practice MonitoringGW-160GW-161GW-184GW-186GW-187GW-188GW-292GW-293GW-294GW-296GW-298GW-299GW-3003
GW-301GW-321GW-512GW-513GW-514
Special SamplingSCR2.2SPb
GW-142GW-144GW-145GW-146GW-321GW-732
CRBAWPCRBAWPRQRQRQRQECRWPECRWPECRWPECRWPCRBAWPCRBAWPCRBAWPCRBAWPADBADBADBADB
EXP
KHQKHQKHQKHQADBCRSDB
01/09/95
m
03/15/95
03/20/9503/22/9503/24/9503/23/9501/10/95
.
Date Sampled2nd Qtr.
.
04/12/9504/11/9504/11/9504/06/9504/13/9504/05/95
04/26/9504/20/9505/01/9505/03/9505/02/9505/01/9504/24/9504/23/9504/22/9504/22/9505/02/9505/01/9504/27/9504/27/9504/25/9504/26/9504/25/9504/27/95
3rd Qtr.
07/11/95
08/14/95
4th Qtr.
10/06/95
10/08/9510/08/9510/08/95
10/07/9510/09/9510/16/95
11/02/9510/31/9510/31/9511/03/9511/02/9510/31/9511/06/9511/06/9511/05/9511/05/9511/04/9511/03/9511/03/9511/03/9510/26/9510/31/9510/31/9511/02/95
.
•
B-4

Table 2 (cont'd)
Notes:1 Some monitoring locations were sampled to meet requirments of more than one
programmatic driver during CY 1995. For example, well GW-156 was sampled for bothRCRA interim status and post-closure detection monitoring programs.
2 ADB - Ash Disposal BasinCDLVI - Construction/Demolition Landfill VI
CDLVH - Construction/Demolition Landfill VIICRBWAP - Chestnut Ridge Borrow Area Waste Pile
CRSDB - Chestnut Ridge Sediment Disposal BasinCRSP - Chestnut Ridge Security Pits
ECRWP - East Chestnut Ridge Waste PileKHQ - Kerr Hollow Quarry
LE - Industrial Landfill HLIV - Industrial Landfill IVLV - Industrial Landfill VRQ - Rogers Quarry
UNCS - United Nuclear Corporation Site
a Designated upgradient monitoring well,
b Spring
PDM - Monitoring Program changed to Post-closure detection
B-5
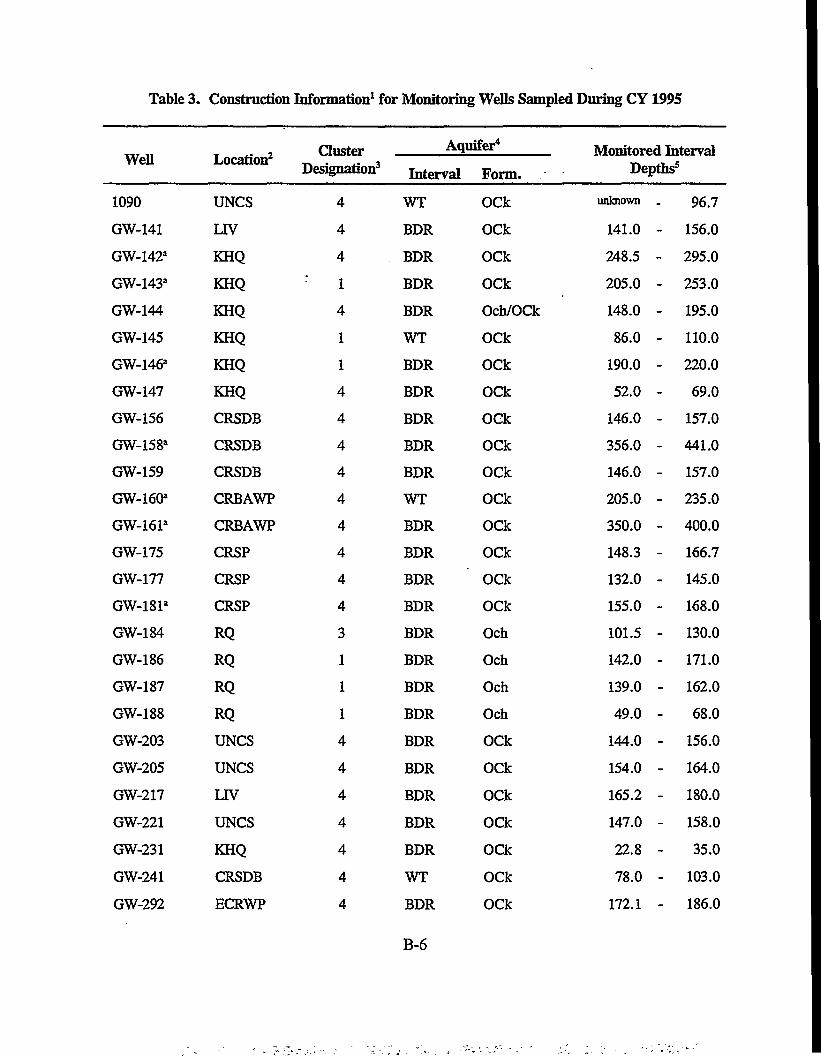
Table 3. Construction Information1 for Monitoring Wells Sampled During CY 1995
Well
1090
GW-141
GW-142*
GW-143*
GW-144
GW-145
GW-146*
GW-147
GW-156
GW-158a
GW-159
GW-160*
GW-161a
GW-175
GW-177
GW-18P
GW-184
GW-186
GW-187
GW-188
GW-203
GW-205
GW-217
GW-221
GW-231
GW-241
GW-292
Location2
UNCS
LIV
KHQ
KHQ
KHQ
KHQ
KHQ
KHQ
CRSDB
CRSDB
CRSDB
CRBAWP
CRBAWP
CRSP
CRSP
CRSP
RQ
RQ
RQ
RQ
UNCS
UNCS
LIV
UNCS
KHQ
CRSDB
ECRWP
ClusterDesignation3
4
4
4: 1
4
1
1
4
4
4
4
4
4
4
4
4
3
1
1
1
4
4
4
4
4
4
4
Aquifer4
Interval
WT
BDR
BDR
BDR
BDR
WT
BDR
BDR
BDR
BDR
BDR
WT
BDR
BDR
BDR
BDR
BDR
BDR
BDR
BDR
BDR
BDR
BDR
BDR
BDR
WT
BDR
I Form.
OCk
OCk
OCk
OCk
Och/OCk
OCk
OCk
OCk
OCk
OCk
OCk
OCk
OCk
OCk
OCk
OCk
Och
Och
Och
Och
OCk
OCk
OCk
OCk
OCk
OCk
OCk
MonitoredDeptl
unknown .
141.0 -
248.5 -
205.0 -
148.0 -
86.0 -
190.0 -
52.0 -
146.0 -
356.0 -
146.0 -
205.0 -
350.0 -
148.3 -
132.0 -
155.0 -
101.5 -
142.0 -
139.0 -
49.0 -
144.0 -
154.0 -
165.2 -
147.0 -
22.8 -
78.0 -
172.1 -
Intervalds5
96.7
156.0
295.0
253.0
195.0
110.0
220.0
69.0
157.0
441.0
157.0
235.0
400.0
166.7
145.0
168.0
130.0
171.0
162.0
68.0
156.0
164.0
180.0
158.0
35.0
103.0
186.0
B-6

Well
GW-293*
GW-294
GW-296
GW-298
GW-299
GW-300
GW-301
GW-302
GW-303a
GW-304
GW-305
GW-321
GW-339
GW-511
GW-512
GW-513
GW-514*
GW-521
GW-522
GW-539
GW-540 '
GW-541
GW-542
GW-543
GW-544
GW-546
GW-557
Location2
ECRWP
ECRWP
ECRWP
CRBAWP
CRBAWP
CRBAWP
CRBAWP
UNCS
CRSDB
CRSDB
LIV
ADB
UNCS
CRSP
ADB
ADB
ADB
LIV
LIV
LH
CDLVI
CDLVI
CDLVI
CDLVI
CDLVI
CDLVI
LV
ClusterDesignation3
4
4
4
4
4
4
4
4
1
3
4
4
4
4
4
4
4
4
4
4
4
4
4
4
4
4
4
Aquifer4
Interval
BDR
BDR
BDR
BDR
BDR
BDR
BDR
BDR
BDR
BDR
BDR
BDR
BDR
BDR
WT
BDR
BDR
BDR
BDR
BDR
BDR
BDR
WT
BDR
BDR
WT
WT
I Form.
OCk
OCk
OCk
OCk
OCk
OCk
OCk
OCk
OCk
OCk
OCk
OCk
OCk
OCk
OCk
OCk
OCk
OCk
OCk
OCk
OCk
OCk
OCk
OCk
OCk
OCk
OCk
MonitoredDeptl
197.0 -
113.0 -
134.4 -
171.1 -
153.0 -
132.0 -
148.5 -
121.5 -
300.0 -
148.5 -
165.3 -
84.0 -
101.0 -
140.0 -
48.0 -
111.0 -
174.0 -
123.2 -
183.0 -
136.4 -
158.5 -
86.7 -
59.0 r
76.2 -
91.0 -
66.2 -
112.9 -
Interval
214.0
128.0
147.0
190.0
168.0
147.0
163.5
134.8
321.0'
167.0
179.6
98.6
114.0
153.7
61.0
125.3
195.0
136.0
195.3
156.0
171.5
104.5
76.5
93.6
109.3
84.4
138.0
B-7

Table3(cont'd)
Well Location2 ClusterDesignation3
Aquifer4
Interval Form.
Monitored IntervalDepths5
GW-560
GW-562
GW-564
GW-608*
GW-609
GW-610
GW-611
GW-709
GW-731
GW-732
GW-742a
GW-743
GW-757
GW-796
GW-797
GW-798
GW-799
GW-801
GW-827
CDLVn
CDLVH
CDLVH
CRSP
CRSP
CRSP
CRSP
LH
CRSDB
CRSDB
CRSP
CRSP
LH
LV
LV
CDLVH
CDLVn
LV
CDLVI
4
4
4
4
4
4
4
4
4
4
4
4
3
4
4
4
4
4
4
WT
WT
WT
BDR
BDR
BDR
BDR
BDR
BDR
BDR
BDR
BDR
BDR
BDR
BDR
BDR
BDR
BDR
BDR
OCk
OCk
OCk
OCk
OCk
OCk
OCk
OCk
OCk
OCk
OCk
OCk
OCk
OCk
OCk
OCk
OCk
OCk
OCk
45.2 -
36.0 -
52.0 -
148.0 -
256.4 -
105.1 -
101.5 -
68.7 -
164.0 -
178.3 -
350.0 -
150.1 -
134.0 -
122.9 -
118.0 -
122.0 -
78.7 -
175.8 -
122.1 -
69.0
60.0
81.0
220.0
269.0
117.4
121.6
80.6
178.7
190.0
420.0
161.1
166.7
136.5
134.1
135.4
92.0
188.9
134.8
B-8

Table3(contfd)
Notes:
1 Well construction information compiled from: Updated Subsurface Data Base for Bear CreekValley, Chestnut Ridge, and Parts of Bethel Valley on the U.S. Department of Energy Oak RidgeReservation (Jones et al. 1994).
2 ADB - Ash Disposal BasinCDLVI - Construction/Demolition Landfill VI
CDLVII - Construction/Demolition Landfill VIICRBAWP - Chestnut Ridge Borrow Area Waste Pile
CRSDB - Chestnut Ridge Sediment Disposal BasinCRSP - Chestnut Ridge Security Pits
ECRWP - East Chestnut Ridge Waste PileKHQ - Kerr Hollow Quarry
LH - Industrial Landfill IILIV - Industrial Landfill IVLV - Industrial Landfill VRQ - Rogers Quarry
UNCS - United Nuclear Corporation Site
3 Cluster designation for trace metal data evaluation purposes (see Table 8).Springs CBS-1 and SCR2.2SP were assigned to clusters 4 and 1, respectively.
4 Interval:WT - Water Table Interval
BDR - Bedrock Interval
Form.: Geologic FormationOch - Chickamauga Group (ORR Aquitard)
OCk - Knox Group (Knox Aquifer)
5 Depth in feet from the ground surface,
a Open borehole well construction.
B-9

Table 4. VOCs Detected in CY1995 QA/QC Samples
Compound
Laboratory Reagents
Acetone
2-Butanone
Methylene Chloride
Toluene
VOC Plume Constituents
1,1,1-Trichloroethane
Chloroform
Miscellaneous Compounds
Ethylbenzene
Xylenes
2-Hexanone
Data Summary
Total Samples1:
Samples with VOCs2:
Percent of Total Sampleswith VOCs:
Number of QA/QC Samples Containing SpecifiedCompound (by Sample Type)
LaboratoryBlanks
: 7
9
2
2
.
1
1
•
70
15
21%
TripBlanks
13
12
7
5
86
.
2
2
1
122
90
74%
FieldBlanks
•
•
3
.
•
•
•
4
3
75%
Equipment.Rinsates
5
2
4
2
13
1
2
2
•
33
16
48%
Total
25
23
13
9
102
1
5
5
1
-
229
124
54%
Notes:1 Only samples analyzed for the target compound list of organic compounds were reviewed.
2 Some.contaminated samples contain more than one compound.
B-10
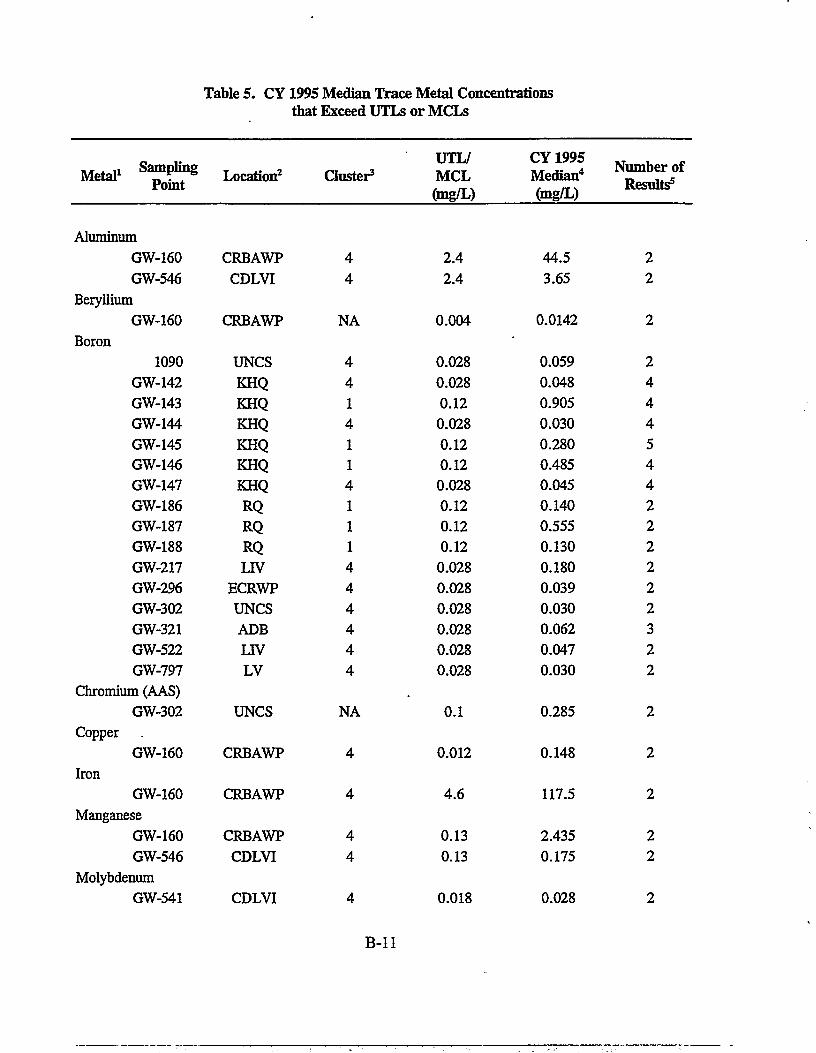
Table 5. CY 1995 Median Trace Metal Concentrationsthat Exceed UTLs or MCLs
Metal1 „ P™SPoint
Aluminum
GW-160
GW-546
Beryllium
GW-160
Boron
1090
GW-142
GW-143
GW-144
GW-145GW-146
GW-147
GW-186
GW-187
GW-188
GW-217
GW-296
GW-302
GW-321
GW-522
GW-797
Chromium (AAS)
GW-302
Copper
GW-160
Iron
GW-160
Manganese
GW-160
GW-546
Molybdenum
GW-541
Location2
CRBAWP
CDLVI
CRBAWP
UNCS
KHQ
KHQ
KHQ
KHQKHQ
KHQ
RQRQRQLIV
ECRWP
UNCS
ADB
LIVLV
UNCS
CRBAWP
CRBAWP
CRBAWP
CDLVI
CDLVI
Cluster3
44
NA
4414114111444444
NA
4
4
44
4
UTL/MCL(mg/L)
2.42.4
0.004
0.028
0.028
0.12
0.028
0.120.12
0.028
0.12
0.12
0.12
0.028
0.028
0.028
0.028
0.028
0.028
0.1
0.012
4.6
0.13
0.13
0.018
CY 1995Median4
(mg/L)
44.5
3.65
0.0142-
0.059
0.048
0.905
0.030
0.2800.485
0.045
0.140
0.555
0.130
0.180
0.039
0.030
0.062
0.047
0.030
0.285
0.148
117.5
2.435
0.175
0.028
Number ofResults5
22
2
2444544222222322
2
2
2
22
2
B- l l

Metal1 _ ?~**Point
Nickel
GW-302
GW-539
Selenium
GW-827
Strontium
CBS-1
GW-142
GW-144
GW-145
GW-146
GW-147
GW-732Uranium (PMS)
GW-142
Vanadium
GW-160
GW-546
Zinc
GW-160GW-177
Location2
UNCS
LH
CDLVI
CDLVH
KHQ
KHQ
KHQ
KHQ
KHQ
CRSDB
KHQ
CRBAWP
CDLVI
CRBAWP
CRSP
Table 5
Cluster3
NANA
NA
4441144
4
44
44
(cont'd)
UTL/MCL
(mg/L)
0.10.1
0.05
0.079
0.079
0.079
4.44.4
0.079
0.079
0.005
0.005
0.005
0.041
0.041
CY1995Median4
(mg/L) *
0.265
0.15
0.058
0.084
0.515
0.089
7.700
7.1000.680
0.240
0.00975
0.268
0.0091
0.85
0.062
Number ofResults5
23
2
2444444
4
22
22
Notes:
Results obtained by ICP spectroscopy unless otherwise noted.AAS - Atomic Absorption SpectrometryPMS - Plasma Mass Spectrometry
CRSDBCDLVI
CDLVHCRBAWP
CRSP
Chestnut Ridge Sediment Disposal BasinConstruction/Demolition Landfill VIConstruction/Demolition Landfill VIIChestnut Ridge Borrow Area Waste PileChestnut Ridge Security Pits
Notes (cont'd'):
B-12

•
ECRWPKHQLIVRQ
UNCS
Table 5 (cont'd)
- East Chestnut Ridge Waste PileKerr Hollow Quarry
- Industrial Landfill IVRogers QuarryUnited Nuclear Corporation Site
3 Cluster designation for trace metal data evaluation purposes (see Appendix C).N/A - Not applicable for metal concentrations compared to MCLs.
4 Concentrations in milligrams per liter.
5 The number of results used to determine median values.
B-13
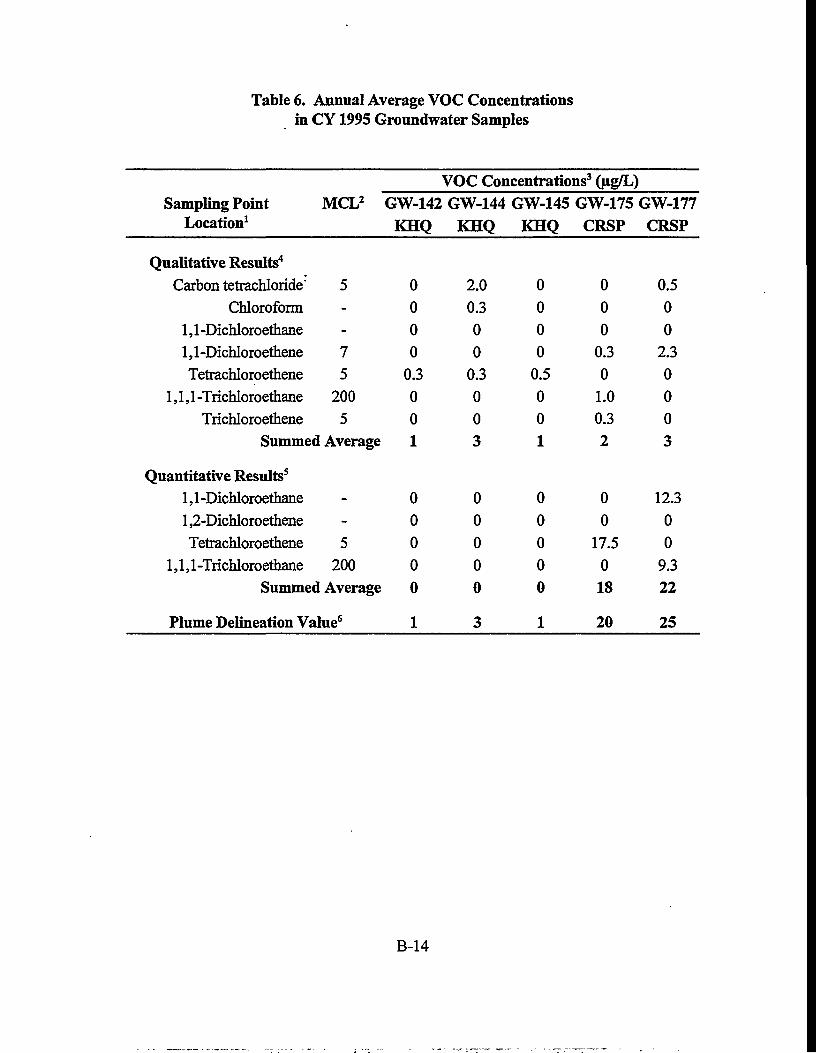
Table 6. Annual Average VOC Concentrationsin CY 1995 Groundwater Samples
Sampling PointLocation1
Qualitative Results4
Carbon tetrachloride"
Chloroform
1,1 -Dichloroethane1,1-Dichloroethene
Tetrachloroethene
1,1,1-Trichloroethane
TrichloroetheneSummed
Quantitative Results5
1,1 -Dichloroethane
1,2-Dichloroethene
Tetrachloroethene
1,1,1-TrichloroethaneSummed
MCL2
5--75
2005
Average
--5
200Average
Plume Delineation Value6
GW-142KHQ
0000
0.3001
00000
1
v*OC Concentrations3 (ngfL)GW-144
KHQ
2.00.300
0.3003
00000
3
GW-145KHQ
0000
0.5001
00000
1
GW-175CRSP
000
0.30
1.00.32
00
17.5018
20
>GW-177
CRSP
0.500
2.30003
12.300
9.322
25
B-14
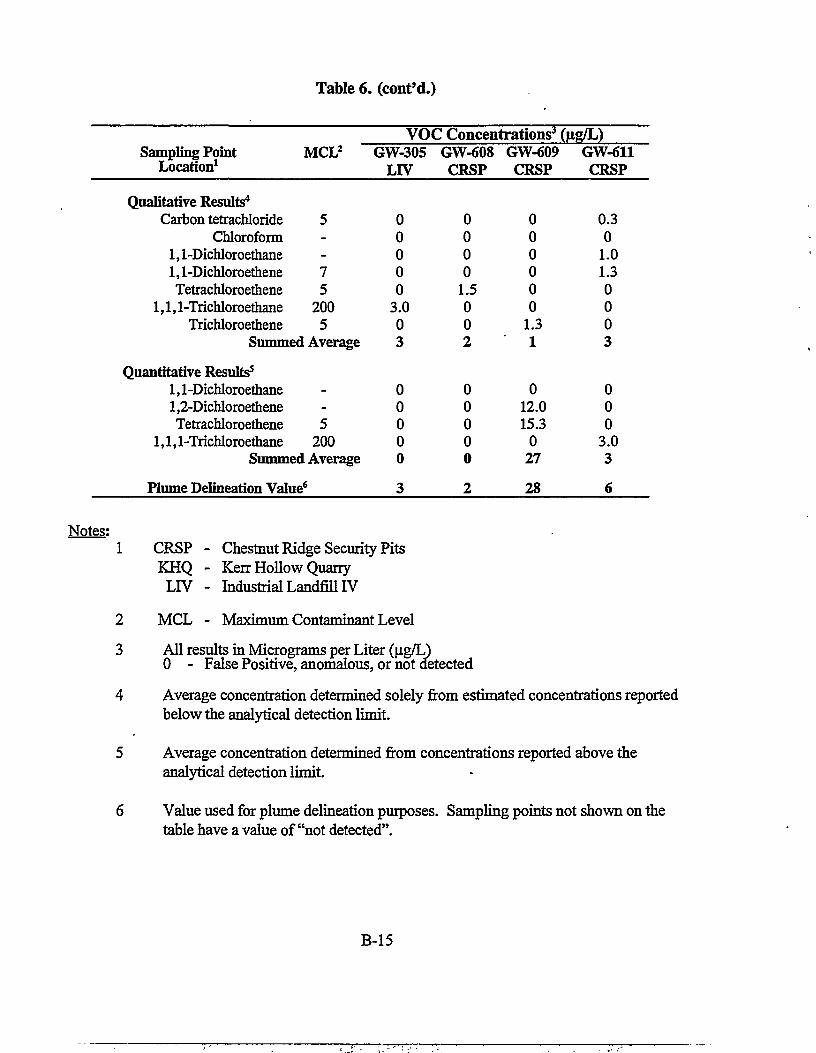
Table 6,
Sampling Point MCL2
Location1
Qualitative Results4
Carbon tetrachloride 5Chloroform
1,1-Dichloroethane1,1-Dichloroethene 7Tetrachloroethene 5
1,1,1-Trichloroethane 200Trichloroethene 5
Summed Average
Quantitative Results5
1,1-Dichloroethane1,2-DichloroetheneTetrachloroethene 5
1,1,1-Trichloroethane 200Summed Average
Plume Delineation Value6
Notes:
. (cont'd.)
vocGW-305
LIV
00000
3.003
00000
3
1 CRSP - Chestnut Ridge Security PitsKHQ - Kerr Hollow Quarry
LIV - Industrial Landfill IV
2 MCL - Maximum Contaminant Level
3 All results in Microerams tier Liter (as/D
Concentrations^GW-608CRSP
0000
1.5002
00000
2
GW-609CRSP
000000
1.31
012.015.3
027
28
(ug/L)GW-611CRSP
0.30
1.01.30003
000
3.03
6
Average concentration determined solely from estimated concentrations reportedbelow the analytical detection limit.
Average concentration determined from concentrations reported above theanalytical detection limit.
Value used for plume delineation purposes. Sampling points not shown on thetable have a value of "not detected".
B-15

Table 7. CY 1995 Gross Alpha and Gross Beta Activities that Exceed MDAs
SamplingPoint
GW-142
GW-143
GW-145
GW-146
GW-159
GW-160
GW-177GW-511GW-544GW-546GW-562GW-731
GW-732
Location1
KHQ
KHQ
KHQ
KHQ
CRSDB
CRBAWP
CRSPCRSP
CDLVICDLVICDLVHCRSDB
CRSDB
DateSampled
01/10/9504/20/9507/14/9501/17/9504/24/9507/16/9511/09/9501/18/9504/26/9507/17/9511/15/9501/17/9504/24/9507/17/9511/08/9504/06/9510/26/9504/26/9511/02/9505/11/9505/03/9510/17/9504/05/9510/06/9501/17/9507/13/9510/24/9510/25/9501/18/9504/07/9507/13/95
Activity2 (pCi/L)
Gross Alpha(MDA = 4.7)
6.086.346.62
14.19.939.7113
5.71
6.7339.4
4.726.816.224.96
50.1
34.1916.48
±±±
+±+±
+
+±±±±±±
±±+
2.52.41.9
3.532.33.2
2.5
4.87.42.42.643.2
0.89
6281.8
Gross Beta(MDA = 11)
18.215.713.714.216.714.716.321.11416.115.916.8
13.112.934.2
11.1
19.814.611.412.527.459.811.7
±±±±±±±±±±±±
±±±
±
±±±±±±±
3.73.52.63.53.63.52.83.83.33.62.83.8
3.66.65.4
3.6
3.92.83.33.34.6312.6
B-16

SamplingPoint
GW-732
(cont'd)
GW-742
GW-743
GW-757
Location1
CRSDB
CRSP
CRSP
LH
Table 7
DateSampled
10/26/95
10/24/95
10/25/95
01/27/95
05/07/95
11/09/95
11/13/95
07/11/95
(cont'd)
Activity2 (pCi/L)
Gross Alpha(MDA = 4.7)
6.426.345.01
6.39
•
± 2.8± 2.6± 2.4
± 2.2
Gross Beta(MDA = 11)
17.5 ±28.4 ±25.1 ±
13.4 ±.
3.94.84.4
3.6
Notes:
CDLVICDLVH
CRBAWPCRSDB
CRSPKHQ
LE
Construction/Demolition Landfill VIConstruction/Demolition Landfill VIIChestnut Ridge Borrow Area Waste PileChestnut Ridge Sediment Disposal BasinChestnut Ridge Security PitsKerr Hollow QuarryIndustrial Landfill H
Activity reported in picoCuries per liter (pCi/L).
results below the MDA (Minimum Detectable Activity)
B-17

Table 8. CY 1995 Radioisotope Activities That Exceed MDAs
Isotope1 MDA2 Sampling Location3 DatePoint Sampled
Activity (pCi/L)
Cesium-137 3.9
Protactinium 700
Radium
Strontium
1.5
33
Uranium-235 14
GW-203
GW-542
GW-540
GW-541
GW-542
GW-544
GW-557
GW-797
GW-221
GW-339
GW-143
GW-144
UNCS
CDLVI
CDLVI
CDLVI
CDLVI
CDLVI
LV
LV
UNCS
UNCS
KHQ
KHQ
04/18/95
10/16/95
04/04/95
10/12/95
10/16/95
10/17/95
10/07/95
04/11/95
10/08/95
10/08/95
.07/16/95
03/22/95
5.3
16.5
1,200
1,490
1,560
2,280
1,090
1,100
2.67
1.92
39.8
96.6
±±
±+
±+
±±
±+
±
±
5
10
910
1,300
1,400
1,500
1,000
840
1.67
1.22
14
91
Notes:
2
3
Protactinium and uranium-235 were "tentatively identified isotopes", as indicated by an" I" qualifier associated with these results (see GWQR Part 1, Appendix E).Radium activity was converted from bequerels to picoCuries.
Minimum Detectable Activity in picoCuries per liter
CDLVILV
KHQUNCS
Construction/Demolition Landfill VIIndustrial Landfill VKerr Hollow QuarryUnited Nuclear Corporation Site
B-18
APPENDIX C
DATA SCREENING AND EVALUATION CRITERIA

CONTENTS
Section
List of Tables C-2
List of Acronyms and Abbreviations C-3
C.I INTRODUCTION C-4
C.2 DATA SCREENING C-4
C.2.1 Less-than-Reporting-Limit Results C-5C.2.2 Original/Duplicate Sample Results C-6C.2.3 Filtered/Unfiltered Sample Results C-6C.2.4 Ion Charge Balance C-7C.2.5 Analytical Methods C-8C.2.6 False Positive Results C-8C.2.7 Counting Errors C-10
C.3 DATA EVALUATION C-llC.3.1 Representative Concentration/Activity Values C-l 1C.3.2 Water Quality Standards C-12C.3.3 Data Corroboration C-14
C.4 REFERENCES C-17
C-l

List of Tables
Table ' Page
C-l Summary of Data Screening Criteria and Surrogate Value Designations C-4
C-2 Radioanalyte MDAs for Y-12 Plant GWPP Monitoring Purposes C-5
C-3 Screened Results for Original/Duplicate Groundwater Samples C-6
C-4 Screened Results for Filtered/Unfiltered Groundwater Samples C-6
C-5 Groundwater Samples with Unacceptable Charge Balance Errors C-7
C-6 Summary of False Positive Results for VOCs C-9
C-7 Screened Results for Radioanalytes C-10
C-8 Methods used to Calculate Representative Concentration/Activity Values C-l 1
C-9 Summary of UTL Well Cluster Characteristics C-13
C-10 UTLs used as Water Quality Standards C-13
C-ll MCLs used as Water Quality Standards C-14
C-12 Anomalous Results for VOCs C-15
C-13 Anomalous Trace Metal Results C-16
C-2
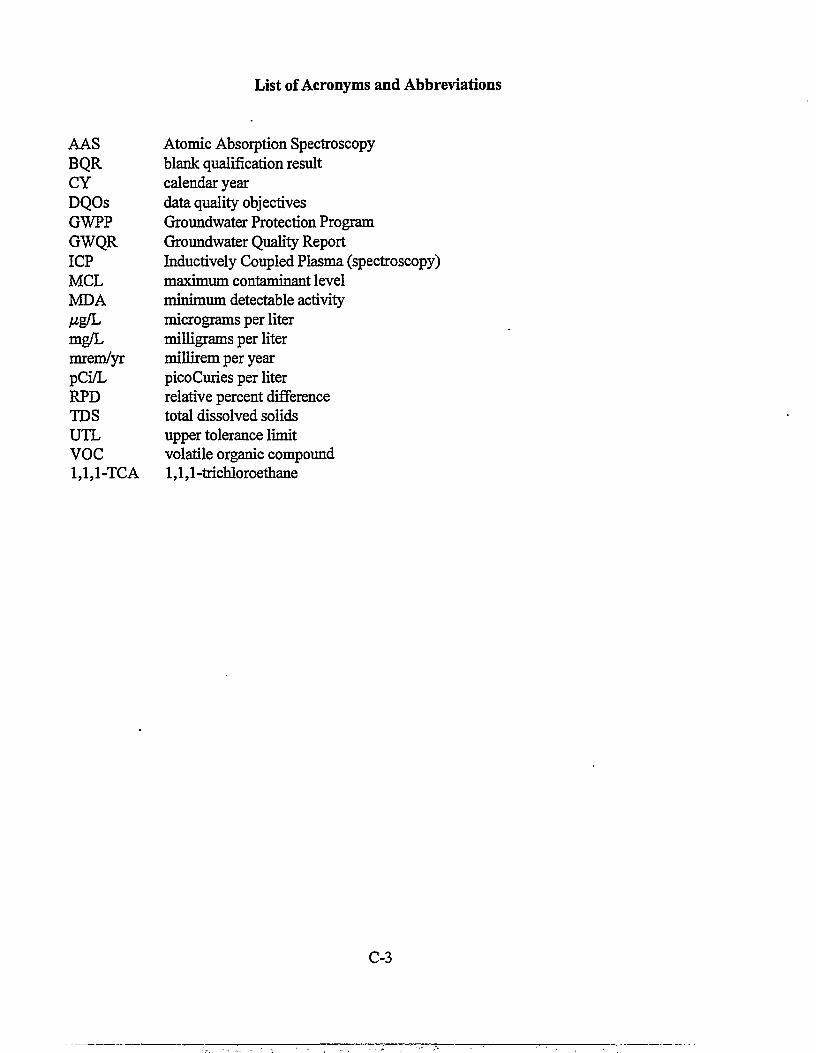
List of Acronyms and Abbreviations
AASBQRCYDQOsGWPPGWQRICPMCLMDA^g/Lmg/Lmrem/yrpCi/LRPDTDSUTLVOC1,1,1-TCA
Atomic Absorption Spectroscopyblank qualification resultcalendar yeardata quality objectivesGroundwater Protection ProgramGroundwater Quality ReportInductively Coupled Plasma (spectroscopy)maximum contaminant levelminimum detectable activitymicrograms per litermilligrams per litermillirem per yearpicoCuries per literrelative percent differencetotal dissolved solidsupper tolerance limitvolatile organic compound1,1,1-trichloroethane
C-3

C.1 INTRODUCTION
Analysis and interpretation of the calendar year (CY) 1995 groundwater and surface water
quality data were based on the standardized data screening and data evaluation process described in
the following sections. Developed and refined over the past several years, this process has
effectively reduced subjective interpretation of contamination in groundwater and surface water at
the Y-12 Plant.
C2 DATA SCREENING
Data screening refers to the process used to format the groundwater and surface water quality
data for quantitative analysis, and exclude from analysis those results that do not meet data quality
objectives (DQOs) of the Y-12 Groundwater Protection Program (GWPP). For both purposes, data
screening assigns one of three surrogate values to applicable results: zero, the analytical reporting
limit (or fraction of it), or a missing value (i.e., no analytical result). Screening criteria and
associated surrogate values for each major group of analytical results are summarized in the
following table.
Table C-l. Summary of Data Screening Criteria and Surrogate Value Designations.
Data ScreeningCriteria
Less-than-Reporting-Limit ResultsOriginal/Duplicate Sample Results
Diluted Sample ResultsFiltered/Unfiltered Sample Results
Ion Charge BalanceAnalytical Methods
False Positive ResultsCounting Errors
Type of Surrogate Value:Zero (Q), Reporting Limit (A), or Missing Value ( • )
Principal Ions
Anions
GAG
•
Cations
GAGA•
TraceMetals
AAGA
•
OrganicCompounds
GGG
G
Radioanalytes
O
•
The following sections provide details regarding the screening criteria and the selection of the
respective surrogate values.
C-4
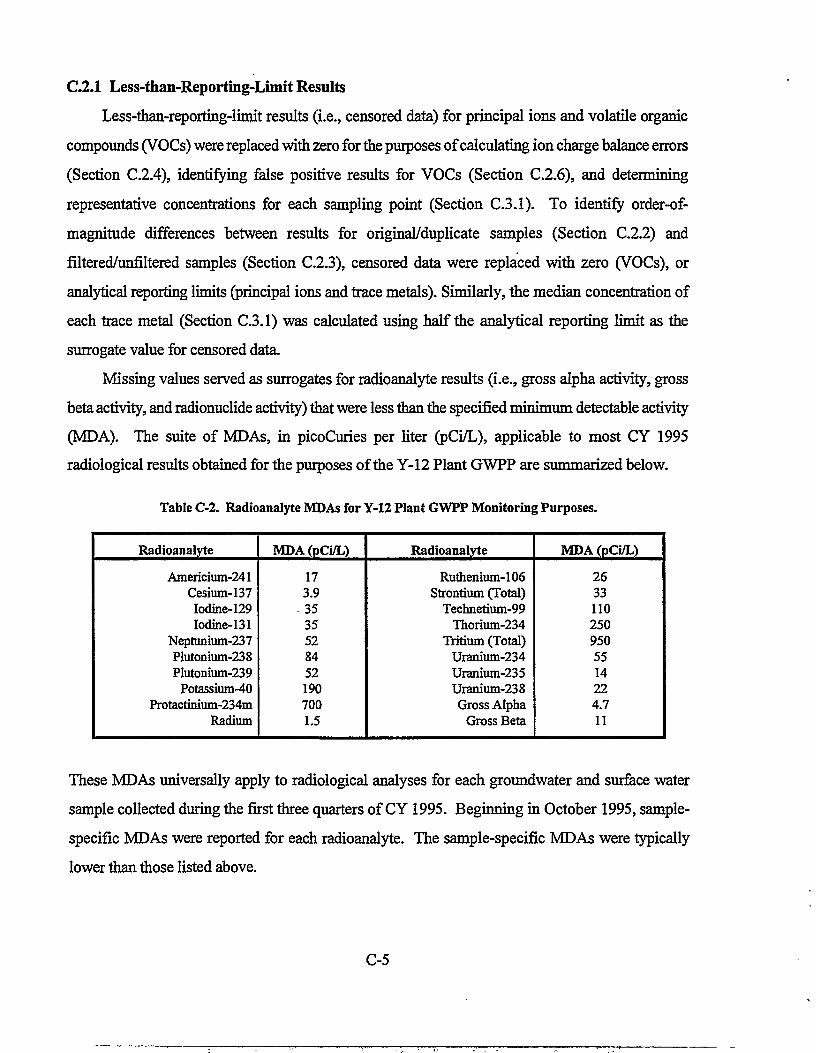
C.2.1 Less-than-Reporting-Limit Results
Less-than-reporting-limit results (i.e., censored data) for principal ions and volatile organic
compounds (VOCs) were replaced with zero for the purposes of calculating ion charge balance errors
(Section C.2.4), identifying false positive results for VOCs (Section C.2.6), and determining
representative concentrations for each sampling point (Section C.3.1). To identify order-of-
magnitude differences between results for original/duplicate samples (Section C.2.2) and
filtered/unfiltered samples (Section C.2.3), censored data were replaced with zero (VOCs), or
analytical reporting limits (principal ions and trace metals). Similarly, the median concentration of
each trace metal (Section C.3.1) was calculated using half the analytical reporting limit as the
surrogate value for censored data.
Missing values served as surrogates for radioanalyte results (i.e., gross alpha activity, gross
beta activity, and radionuclide activity) that were less than the specified minimum detectable activity
(MDA). The suite of MDAs, in picoCuries per liter (pCi/L), applicable to most CY 1995
radiological results obtained for the purposes of the Y-12 Plant GWPP are summarized below.
Table C-2. Radioanalyte MDAs for Y-12 Plant GWPP Monitoring Purposes.
Radioanalyte
Americium-241Cesium-137Iodine-129Iodine-131
Neptunium-237Plutonium-238Plutonium-239
Potassium-40Protactinium-234m
Radium
MDA(pCi/L)
173.9
. 35355284521907001.5
Radioanalyte
Ruthenium-106Strontium (Total)
Technetium-99Thorium-234
Tritium (Total)Uranium-234Uranium-235Uranium-238Gross Alpha
Gross Beta
MDA (pCi/L)
26331102509505514224.711
These MDAs universally apply to radiological analyses for each groundwater and surface water
sample collected during the first three quarters of CY 1995. Beginning in October 1995, sample-
specific MDAs were reported for each radioanalyte. The sample-specific MDAs were typically
lower than those listed above.
C-5

C.22 Original/Duplicate Sample Results
As noted in Section 4.3. of the report, duplicate groundwater samples were collected from 26
monitoring wells. Data for the original/duplicate samples from each well were compared to identify
order-of-magnitude differences between corresponding analytical results. Such differences occurred
between original/duplicate results, in milligrams per liter (mg/L), for the samples listed in the
following summary.
Table C-3. Screened Results for Original/Duplicate Groundwater Samples.
WellNumber
GW-159GW-221GW-522GW-732
DateSampled
04/06/9510/08/9507/12/9510/25/95
Analyte
IronZinc
Alkalinity (carbonate)Total Suspended Solids
Original Sample(mg/L)
0.0050.0057
<132
Duplicate Sample(mg/L)
0.170.1312
701
These results were replaced with missing values.
C.23 Filtered/Unffltered Sample Results
Filtered and unfiltered groundwater and surface water samples were analyzed for the principal
cations (calcium, magnesium, potassium, and sodium) and trace metals. If the dissolved (filtered)
cation or trace metal concentration exceeded the corresponding total (unfiltered) concentration by
an order-of-magnitude or more, both results were replaced with missing values. As shown below
in Table C-4, such differences occurred between the filtered/unfiltered results reported for three
monitoring wells.
Table C-4. Screened Results for Filtered/Unfiltered Groundwater Samples.
SamplingLocation
GW-145GW-146GW-175GW-175GW-205GW-731
DateSampled
07/17/9511/08/9511/17/9511/17/9510/07/9510/26/95
Analyte
UraniumZinc
CopperZinc
AluminumZinc
Unfiltered Sample(mg/L)
O.00050.01
<0.0040.008
<0.0040.014
Filtered Sample(mg/L)
0.0120.410.0450.0920.0740.22
C-6
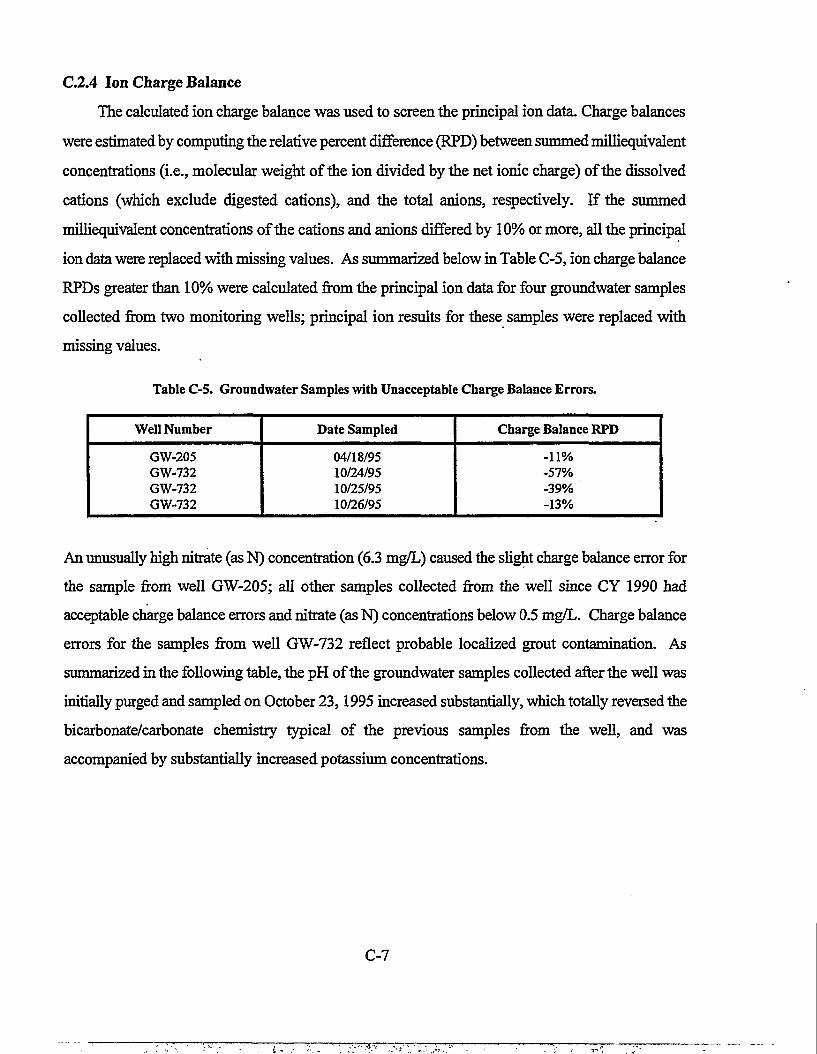
C.2.4 Ion Charge Balance
The calculated ion charge balance was used to screen the principal ion data. Charge balances
were estimated by computing the relative percent difference (RPD) between summed milliequivalent
concentrations (i.e., molecular weight of the ion divided by the net ionic charge) of the dissolved
cations (which exclude digested cations), and the total anions, respectively. If the summed
milliequivalent concentrations of the cations and anions differed by 10% or more, all the principal
ion data were replaced with missing values. As summarized below in Table C-5, ion charge balance
RPDs greater than 10% were calculated from the principal ion data for four groundwater samples
collected from two monitoring wells; principal ion results for these samples were replaced with
missing values.
Table C-5. Groundwater Samples with Unacceptable Charge Balance Errors.
Well Number
GW-205GW-732GW-732GW-732
Date Sampled
04/18/9510/24/9510/25/9510/26/95
Charge Balance RPD
-11%-57%-39%-13%
An unusually high nitrate (as N) concentration (6.3 mg/L) caused the slight charge balance error for
the sample from well GW-205; all other samples collected from the well since CY 1990 had
acceptable charge balance errors and nitrate (as N) concentrations below 0.5 mg/L. Charge balance
errors for the samples from well GW-732 reflect probable localized grout contamination. As
summarized in the following table, the pH of the groundwater samples collected after the well was
initially purged and sampled on October 23,1995 increased substantially, which totally reversed the
bicarbonate/carbonate chemistry typical of the previous samples from the well, and was
accompanied by substantially increased potassium concentrations.
C-7
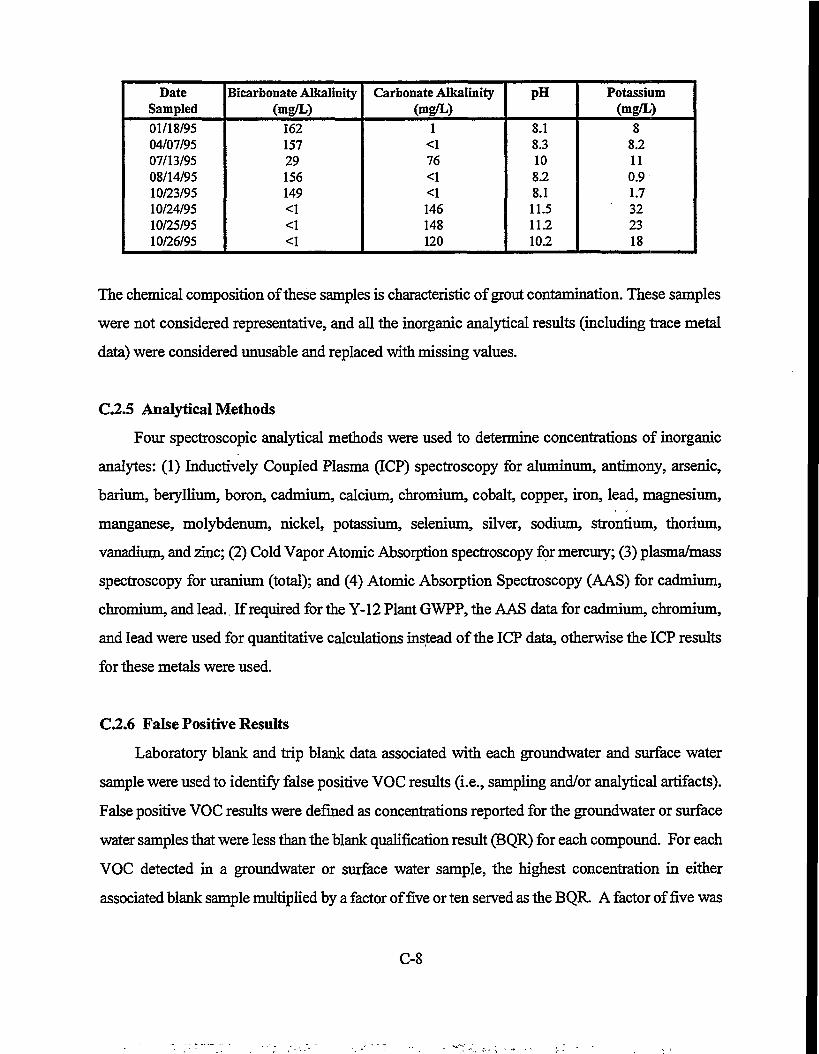
DateSampled01/18/9504/07/9507/13/9508/14/9510/23/9510/24/9510/25/9510/26/95
Bicarbonate Alkalinity(mg/L)
16215729156149<1<1<1
Carbonate Alkalinity(mg/L)
1<176<1<1146148120
PH
8.18.3108.28.111.5112102
Potassium(mg/L)
88.2110.91.7322318
The chemical composition of these samples is characteristic of grout contamination. These samples
were not considered representative, and all the inorganic analytical results (including trace metal
data) were considered unusable and replaced with missing values.
C.2.5 Analytical Methods
Four spectroscopic analytical methods were used to determine concentrations of inorganic
analytes: (1) Inductively Coupled Plasma (ICP) spectroscopy for aluminum, antimony, arsenic,
barium, beryllium, boron, cadmium, calcium, chromium, cobalt, copper, iron, lead, magnesium,
manganese, molybdenum, nickel, potassium, selenium, silver, sodium, strontium, thorium,
vanadium, and zinc; (2) Cold Vapor Atomic Absorption spectroscopy for mercury; (3) plasma/mass
spectroscopy for uranium (total); and (4) Atomic Absorption Spectroscopy (AAS) for cadmium,
chromium, and lead. If required for the Y-12 Plant GWPP, the AAS data for cadmium, chromium,
and lead were used for quantitative calculations instead of the ICP data, otherwise the ICP results
for these metals were used.
C.2.6 False Positive Results
Laboratory blank and trip blank data associated with each groundwater and surface water
sample were used to identify false positive VOC results (i.e., sampling and/or analytical artifacts).
False positive VOC results were defined as concentrations reported for the groundwater or surface
water samples that were less than the blank qualification result (BQR) for each compound. For each
VOC detected in a groundwater or surface water sample, the highest concentration in either
associated blank sample multiplied by a factor of five or ten served as the BQR. A factor of five was
C-8

used for all VOCs except acetone, methylene chloride, toluene, and 2-butanone; BQRs for these
common laboratory reagents were calculated using a factor often (U.S. Environmental Protection
Agency 1988). Zero served as the surrogate value for false positive VOC results.
As summarized below on Table C.6, false positive results were identified for eight of the 17
VOCs detected in the groundwater samples collected during CY1995; results for these groundwater
samples are presented in Appendix M of the Part 1 Groundwater Quality Report.
Table C-6. Summary of False Positive Results for VOCs.
Compound
Laboratory Reagents
2-butanoneMethylene chloride
AcetoneToluene
Plume Constituents1,1,1-trichloroethane
Miscellaneous CompoundsEthylbenzene
XylenesEthanol
Total False Positive Results
Number of False Positive Results:
Identified from Laboratory BQRs
10622
0
1016
37
Identified from Trip BQRs•
2252
14 '
454
38
These compounds included four common laboratory reagents, one of the VOCs known to be present
in groundwater in the regime (plume constituents), and three compounds that are neither common
laboratory reagents nor plume constituents (miscellaneous compounds). False positive results for
each compound except 1,1,1-trichloroethane (1,1,1-TCA) were identified in groundwater samples
collected during each of the past four years. The false positive results for these compounds also are
historically consistent in that most (75%) were estimated concentrations that were less than the 10
micrograms per liter Oug/L) analytical reporting limit for each compound (the maximum false
positive result was 15 jug/L for acetone).
The false positive results for 1,1,1-TCA are in distinct contrast with historical data. They were
identified in the data for seven wells (GW-175, GW-177, GW-305, GW-608, GW-609, GW-611,
and GW-796) with a history of yielding groundwater samples with relatively low (< 25 £ig/L)
C-9

1,1,1-TCA concentrations, none of which were identified in previous GWQRs as false positive
results. The CY 1995 results for this compound were identified as false positives as a direct
consequence of the 1,1,1-TCA contamination of the trip blank samples associated with the
groundwater samples from each of these wells. As discussed in report text Section 4.5, this
compound was detected in 74% of the trip blanks analyzed during CY 1995, which is strongly
suspected to reflect 1,1,1-TCA contamination at the source of the deionized water used to prepare
the trip blanks, and not cross contamination during sample collection, transportation, and laboratory
analysis.
C.2.7 Counting Errors
The degree of analytical uncertainty associated with each gross alpha, gross beta, and
radionuclide result is expressed by the corresponding counting error (defined as twice the sample
standard deviation). Groundwater samples with gross alpha, gross beta, and/or radionuclide
activities that exceeded the respective MDAs, but were less than the associated counting errors, are
listed below; these results were replaced with missing values.
Table C-7. Screened Results for Radioanalytes.
Radioanalyte
Gross Alpha
Gross Beta
Cesium 137
Protactinium
Uranium 235
Well Number
GW-709GW-757
CBS-1GW-709
CBS-1GW-542GW-560GW-564GW-796GW-798
CBS-1GW-539GW-543GW-543GW-546GW-796GW-801GW-827
GW-521
Date Sampled
10/06/9510/06/95
10/11/9510/06/95
04/17/9504/06/9504/05/9504/06/9504/12/9504/11/95
04/17/9510/06/9504/06/9510/17/9510/11/9510/08/9510/09/9510/16/95
01/9/95
Activity ± Counting Error (pCi/L)
5.757.17
1111.3
4.616.017.8213.66.819.22
1670750814
125077793895091118.2
±+±±+±+±++±++±±+±±±
161633281515151415152200110094016001500110010001300
91
C-10

C3 DATA EVALUATION
Data evaluation refers.to the process used to identify CY 1995 monitoring results that
potentially reflect potential groundwater or surface water contamination. As described in the
following sections, this process involved: calculating the representative concentration/activity of the
inorganics, VOCs, and radioanalytes for each sampling point; comparing the representative
concentration/activity values to designated water-quality standards; and reviewing screened
historical data for each applicable analyte and monitored location to corroborate representative
values that exceed the specified water-quality standards.
C.3.1 Representative Concentration/Activity Values
Representative concentration/activity values for each sampling point were: (1) results for
individual samples, or (2) calculated from as many as four results depending on the number of
samples collected and the outcome of the data screening process. Results for individual samples
were the assumed representative values for the springs SCR2.2SP, which was sampled only once
during CY 1995. Singular results also were the assumed representative values if data screening
replaced all other results for the analyte with missing values. Also, field data (e.g., depth-to-water)
and other selected parameters (e.g., turbidity) were evaluated individually regardless of the number
of available results.
For sampling locations with multiple CY 1995 results, representative concentration/activity
values for inorganics (principal ions and trace metals), VOCs, and radioanalytes (gross alpha, gross
beta, and radionuclides) were calculated as specified below, using the designated surrogate values
for censored and screened data.
Table C-8. Methods used to Calculate Representative Concentration/Activity Values.
Analyte
Principal Ions
Trace Metals
VOCs
Radioactivity
Representative Value
Annual average concentration.
Annual median concentration.
Annual average concentration.
Annual average activity.Individual/summed dose equivalents.
Censored Data
Zero
Vz Reporting Limits
Zero/MissingValues
Missing Values
Screened Data
Missing Values
Missing Values
Zero/MissingValue
Missing Values
C-ll

Note that annual average concentrations/activities for principal ions, VOCs, and radioanalytes were
used as representative values, but annual median concentrations were used for trace metals. This
approach ensured comparability with the upper tolerance limits (UTLs) used as water quality
standards for many of the trace metals. Additionally, average counting errors (in pCi/L) associated
with each representative radioanalyte activity were calculated using the following formula:
n2 n2
where EM E2,... are the individual errors reported for each sample, and n is the number of samples
(Evans 1955). Where applicable, dose equivalents were calculated using representative values for
radionuclides, and corresponding dose factors issued by the U.S. Environmental Protection Agency
(Federal Register, Vol. 56No. 138, July 18,1991). Individual dose equivalents for the radionuclides
were summed to determine the cumulative dose for each applicable monitoring well, spring/seep,
and surface water sampling point.
C3.2 Water Quality Standards
Two types of water quality standards were used for comparison to the representative
concentration/activity values for each applicable monitoring well, spring/seep, and surface water
sampling point: statistically derived UTLs assumed to reflect uncontaminated groundwater
concentrations at the Y-12 Plant, or federal maximum contaminant levels (MCLs) for drinking water.
The UTLs presented in HSW Environmental Consultants, Inc. et ah (1996) were used as the
water quality standards for aluminum, antimony, boron, cobalt, copper, iron, manganese,
molybdenum, strontium, thorium, uranium, vanadium, and zinc. Each UTL was statistically derived
from median concentrations calculated from the groundwater quality data for over 400 monitoring
wells at the Y-12 Plant. Based on analysis of the principal sources of geochemical variability, the
data for these wells were classified into ten distinct groups (i.e., clusters) which, as summarized
below, include six clusters of wells that monitor uncontaminated groundwater, and four clusters of
wells that monitor contaminated groundwater.
C-12
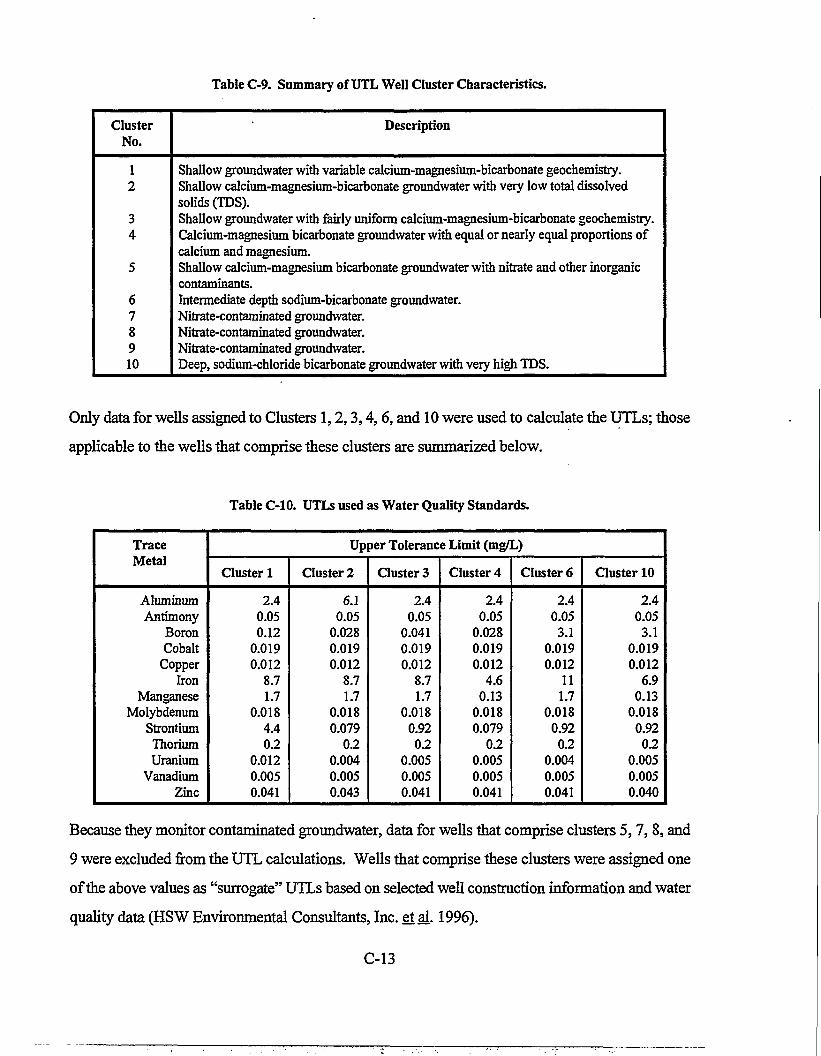
Table C-9. Summary of UTL Well Cluster Characteristics.
ClusterNo.
Description
12
34
678910
Shallow groundwater with variable calcium-magnesium-bicarbonate geochemistry.Shallow calcium-magnesium-bicarbonate groundwater with very low total dissolvedsolids (TDS).Shallow groundwater with fairly unifonn calcium-magnesium-bicarbonate geochemistry.Calcium-magnesium bicarbonate groundwater with equal or nearly equal proportions ofcalcium and magnesium.Shallow calcium-magnesium bicarbonate groundwater with nitrate and other inorganiccontaminants.Intermediate depth sodium-bicarbonate groundwater.Nitrate-contaminated groundwater.Nitrate-contaminated groundwater.Nitrate-contaminated groundwater.Deep, sodium-chloride bicarbonate groundwater with very high TDS.
Only data for wells assigned to Clusters 1,2,3,4,6, and 10 were used to calculate the UTLs; those
applicable to the wells that comprise these clusters are summarized below.
Table C-10. UTLs used as Water Quality Standards.
TraceMetal
AluminumAntimony
BoronCobalt
CopperIron
ManganeseMolybdenum
StrontiumThoriumUranium
VanadiumZinc
Upper Tolerance Limit (mg/L)
Cluster 1
2.40.050.12
0.0190.012
8.71.7
0.0184.40.2
0.0120.0050.041
Cluster 2
6.10.05
0.0280.0190.012
8.71.7
0.0180.079
0.20.0040.0050.043
Cluster 3
2.40.05
0.0410.0190.012
8.71.7
0.0180.9202
0.0050.0050.041
Cluster 4
2.40.05
0.0280.0190.012
4.60.13
0.0180.079
0.20.0050.0050.041
Cluster 6
2.40.053.1
0.0190.012
111.7
0.0180.920.2
0.0040.0050.041
Cluster 10
2.40.053.1
0.0190.012
6.90.13
0.0180.920.2
0.0050.0050.040
Because they monitor contaminated groundwater, data for wells that comprise clusters 5,7,8, and
9 were excluded from the UTL calculations. Wells that comprise these clusters were assigned one
of the above values as "surrogate" UTLs based on selected well construction information and water
quality data (HSW Environmental Consultants, Inc. et al.1996).
C-13
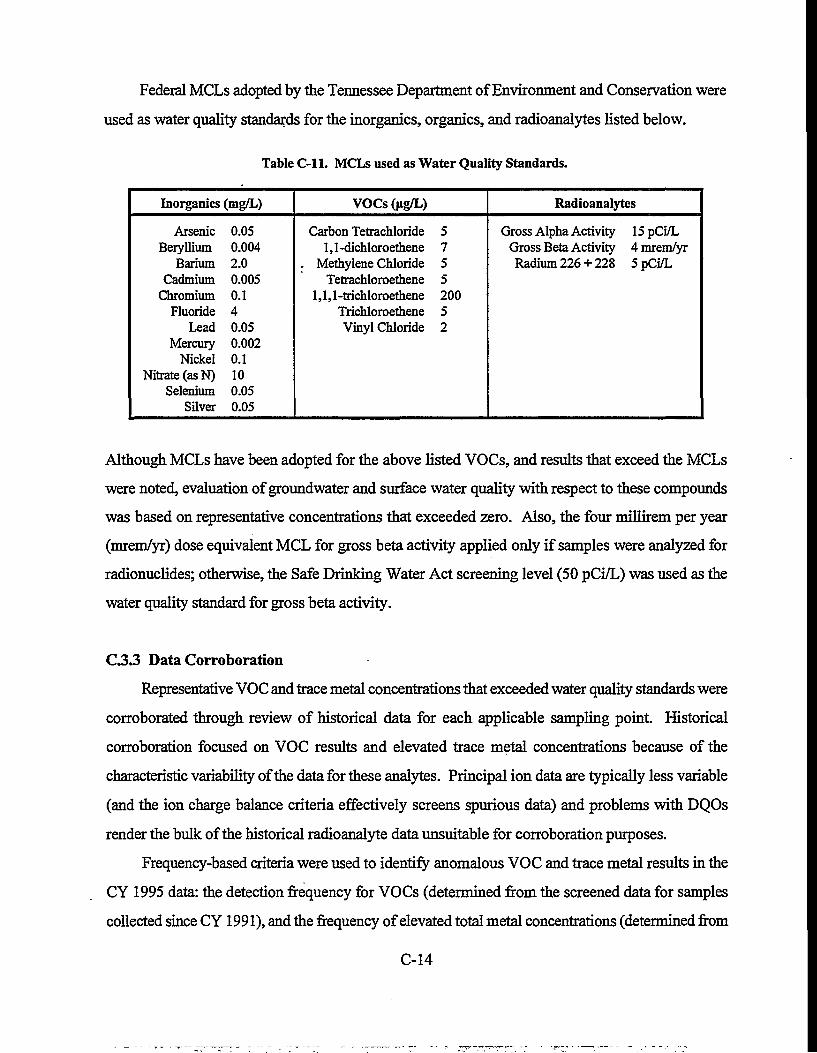
Federal MCLs adopted by the Tennessee Department of Environment and Conservation were
used as water quality standards for the inorganics, organics, and radioanalytes listed below.
Table C-ll. MCLs used as Water Quality Standards.
Inorganics (mg/L)
ArsenicBeryllium
BariumCadmium
ChromiumFluoride
LeadMercury
NickelNitrate (as N)
SeleniumSilver
0.050.0042.00.0050.140.050.0020.1100.050.05
VOCs (fig/L)
Carbon Tetrachloride1,1-dichloroethene
. Methylene ChlorideTetrachloroethene
1,1,1 -trichloroetheneTrichloroetheneVinyl Chloride
575520052
Radioanalytes
Gross Alpha Activity 15 pCi/LGross Beta Activity 4 mrem/yrRadium 226 + 228 5 pCi/L
Although MCLs have been adopted for the above listed VOCs, and results that exceed the MCLs
were noted, evaluation of groundwater and surface water quality with respect to these compounds
was based on representative concentrations that exceeded zero. Also, the four millirem per year
(mrem/yr) dose equivalent MCL for gross beta activity applied only if samples were analyzed for
radionuclides; otherwise, the Safe Drinking Water Act screening level (50 pCi/L) was used as the
water quality standard for gross beta activity.
C33 Data Corroboration
Representative VOC and trace metal concentrations that exceeded water quality standards were
corroborated through review of historical data for each applicable sampling point. Historical
corroboration focused on VOC results and elevated trace metal concentrations because of the
characteristic variability of the data for these analytes. Principal ion data are typically less variable
(and the ion charge balance criteria effectively screens spurious data) and problems with DQOs
render the bulk of the historical radioanalyte data unsuitable for corroboration purposes.
Frequency-based criteria were used to identify anomalous VOC and trace metal results in the
CY 1995 data: the detection frequency for VOCs (determined from the screened data for samples
collected since CY 1991), and the frequency of elevated total metal concentrations (determined from
C-14

screened data for samples collected since CY 1990). Anomalous results were defined as VOC or
elevated total metal concentrations detected in 25% or less of the samples from each monitoring
well, spring, or surface water sampling point. Depending on the location of the sampling point
relative to known or suspected sources of contamination in the Chestnut Ridge Regime, anomalous
results were either replaced with zero (VOCs) or missing values (trace metals), or accepted as
qualitative data.
As shown in the following summary, the CY 1995 data included a total of 14 anomalous
results reported for two laboratory reagents and five compounds that are known components (e.g.,
carbon tetrachloride), or are associated degradation products (e.g., chloroform), of dissolved VOC
plumes in groundwater in the Chestnut Ridge Regime.
Table C-12. Anomalous Results for VOCs.
Compound
Laboratory Reagents
Acetone2-butanone
AcetoneAcetone
2-butanoneAcetone
Plume Constituents
Tetrachloroethene (PCE)Chloroform
PCEPCE
Trichloroethene (TCE)1,1-dichloroethene
Carbon tetrachlorideCarbon tetrachloride
SamplingPoint
GW-175GW-231GW-511GW-743GW-757GW-797
GW-142GW-144GW-144GW-145GW-175GW-175GW-177GW-611
DateSampled
02/14/9511/06/9505/03/9511/13/9510/06/9504/11/95
11/05/9504/25/9501/18/9507/17/9502/14/9502/14/9511/16/9511/17/95
Anomalous Result(ug/L)
101028921
11121121
Anomalous results for acetone and 2-butanone were replaced with zero as a surrogate value; results
for both common laboratory blank contaminants were considered probable analytical artifacts.
Anomalous results for the known plume constituents were considered qualitative. These
results were reported for samples collected from: (1) wells at the Chestnut Ridge Security Pits
(GW-175, GW-177, and GW-611) known to monitor groundwater contaminated with several VOCs
including carbon tetrachloride, TCE, and 1,1-dichloroethene, and (2) wells located at Kerr Hollow
C-15
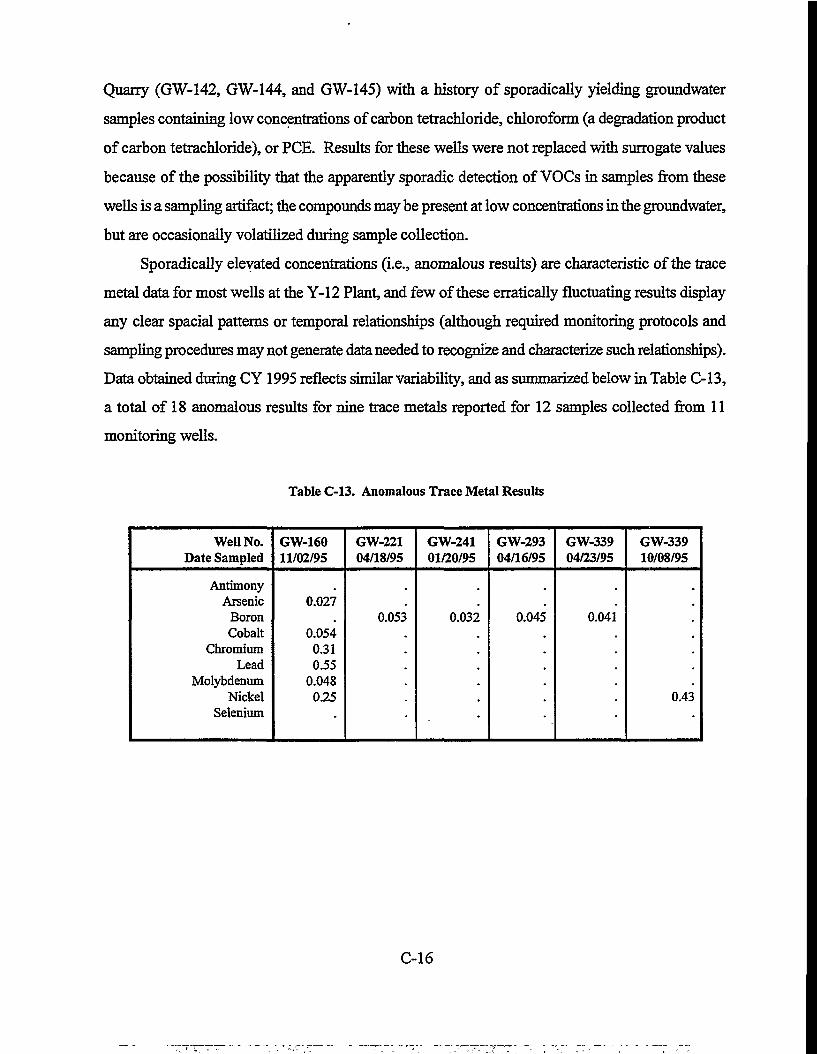
Quarry (GW-142, GW-144, and GW-145) with a history of sporadically yielding groundwater
samples containing low concentrations of carbon tetrachloride, chloroform (a degradation product
of carbon tetrachloride), or PCE. Results for these wells were not replaced with surrogate values
because of the possibility that the apparently sporadic detection of VOCs in samples from these
wells is a sampling artifact; the compounds may be present at low concentrations in the groundwater,
but are occasionally volatilized during sample collection.
Sporadically elevated concentrations (i.e., anomalous results) are characteristic of the trace
metal data for most wells at the Y-12 Plant, and few of these erratically fluctuating results display
any clear spacial patterns or temporal relationships (although required monitoring protocols and
sampling procedures may not generate data needed to recognize and characterize such relationships).
Data obtained during CY1995 reflects similar variability, and as summarized below in Table C-13,
a total of 18 anomalous results for nine trace metals reported for 12 samples collected from 11
monitoring wells.
Table C-13. Anomalous Trace Metal Results
Well No.Date Sampled
AntimonyArsenic
BoronCobalt
ChromiumLead
MolybdenumNickel
Selenium
GW-16011/02/95
0.027
0.0540.310.55
0.0480.25
•
GW-22104/18/95
0.053
•
GW-24101/20/95
0.032
m
GW-29304/16/95
0.045
•
GW-33904/23/95
0.041
•
GW-33910/08/95
0.43•
C-16
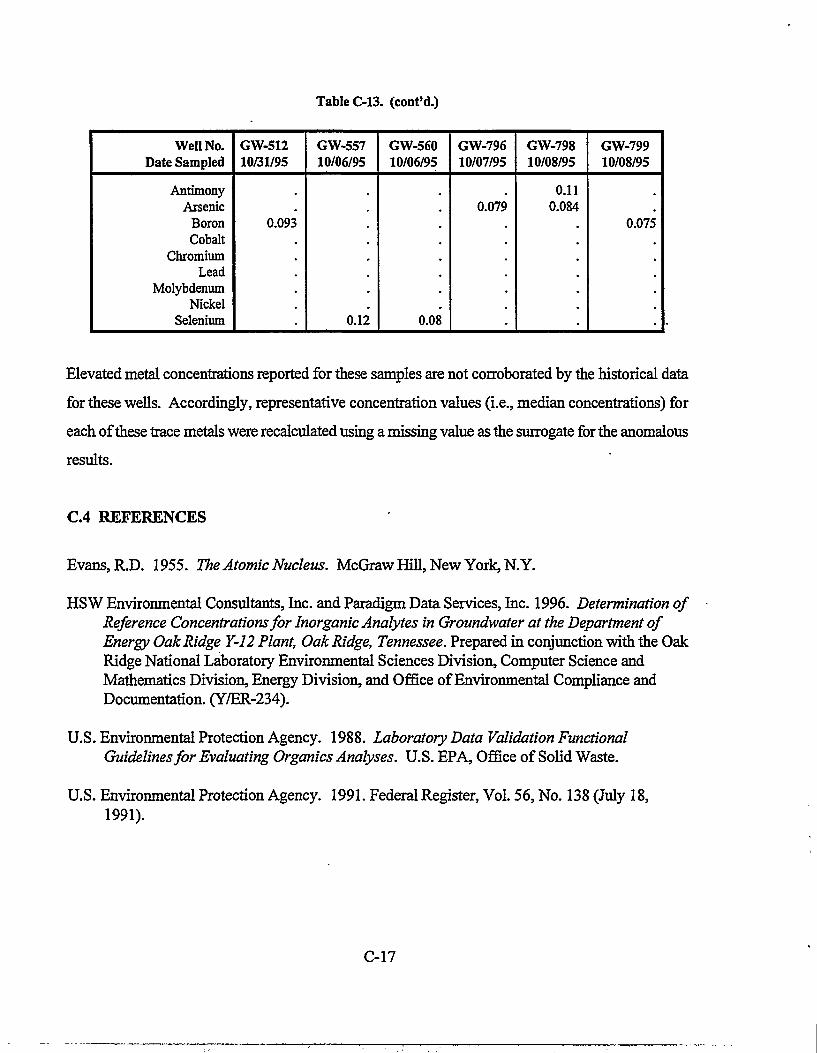
Table C-13. (cont'd.)
Well No.Date Sampled
AntimonyArsenic
BoronCobalt
ChromiumLead
MolybdenumNickel
Selenium
GW-51210/31/95
0.093
m
GW-55710/06/95
.
0.12
GW-56010/06/95
.
0.08
GW-79610/07/95
0.079
•
GW-79810/08/95
0.110.084
•
GW-79910/08/95
0.075
•
Elevated metal concentrations reported for these samples are not corroborated by the historical data
for these wells. Accordingly, representative concentration values (i.e., median concentrations) for
each of these trace metals were recalculated using a missing value as the surrogate for the anomalous
results.
C.4 REFERENCES
Evans, R.D. 1955. The Atomic Nucleus. McGraw Hill, New York, N.Y.
HSW Environmental Consultants, Inc. and Paradigm Data Services, Inc. 1996. Determination ofReference Concentrations for Inorganic Analytes in Ground-water at the Department ofEnergy Oak Ridge Y-12 Plant, Oak Ridge, Tennessee. Prepared in conjunction with the OakRidge National Laboratory Environmental Sciences Division, Computer Science andMathematics Division, Energy Division, and Office of Environmental Compliance andDocumentation. (Y/ER-234).
U.S. Environmental Protection Agency. 1988. Laboratory Data Validation FunctionalGuidelines for Evaluating Organics Analyses. U.S. EPA, Office of Solid Waste.
U.S. Environmental Protection Agency. 1991. Federal Register, Vol. 56, No. 138 (July 18,1991).
C-17
DISTRIBUTION
DEPARTMENT OF ENERGYP.J. GrossP.A. HoffmanL.L. RadcliffeL.M. SparksW.B. Mansel
HEALTH. SAFETY. ENVIRONMENT. ANDACCOUNTABILITY ORGANIZATIONW.P. CarltonC.C. HillW.K.JagoS.B.JonesJ.E. PowellE.B. RundleL.O. VaughanGWPP-File(4)
ENVIRONMENTAL RESTORATION PROGRAMH.L.King(2)C.S. WalkerFile-ERDMC-RC
UNIVERSITY OF TENNESSEEB.W. McMaster
ORISES.M. Field
TENNESSEE DEPARTMENT OFENVIRONMENT AND CONSERVATION -DOE OVERSIGHT DIVISION
R.Benfield(3)
ENVIRONMENTAL SCIENCES DIVISIONR.B. DreierD.D.HuffC.T. RightmireR.R, TurnerD.B. Watson
WASTE MANAGEMENT ORGANIZATIONK.D. DeliusC.W.HutzlerI.W. JeterJ.E. Stone
ENGINEERING ORGANIZATIONW.E. Manrod
K-25 ANALYTICAL SERVICESORGANIZATIONJ.M. LaBauve
SCIENCE APPLICATIONSINTERNATIONAL CORPORATIONS. Selecman/W.P. Kegley
CDM FEDERAL PROGRAMSM. Leslie/C. Lutz
Y-12 Central FilesA.K. Lee/DOE-OSTI (2)
Related Documents