Oak Creek Power Plant Coal Ash Contamination Damage Case, Southeastern Wisconsin: Update Prepared for: Citizens Coal Council 605 Taylor Way Bridgeville, PA 15017 Prepared by: Russell Boulding Boulding Soil-Water Consulting 4664 N Robbs Lane Bloomington, IN 47408 (812) 339-3919 email: [email protected] July 17, 2013

Welcome message from author
This document is posted to help you gain knowledge. Please leave a comment to let me know what you think about it! Share it to your friends and learn new things together.
Transcript

Oak Creek Power Plant Coal Ash Contamination
Damage Case, Southeastern Wisconsin:
Update
Prepared for:
Citizens Coal Council
605 Taylor Way
Bridgeville, PA 15017
Prepared by:
Russell Boulding
Boulding Soil-Water Consulting
4664 N Robbs Lane
Bloomington, IN 47408
(812) 339-3919
email: [email protected]
July 17, 2013

Table of Contents
1.0 Executive Summary 1
2.0 Background: The EIP Oak Creek Caledonia Coal Ash Damage Case 5
3.0 Sources of New Data and Analysis Since EIP Report 6
3.1 Hunts Disposal Landfill RMT Technical Memorandum 7
3.2 WDNR Caledonia Groundwater Molybdenum Investigation 8
3.3 NRT Technical Memoranda and Other Materials Prepared for We Energy 10
4.0 Overall Conceptual Model for Private Well Contamination 11
5.0 Conceptual Model Details: Sources of Molybdenum and Boron 11
5.1 Evidence Implicating Coal Ash as the Main Source 12
5.2 No Evidence for Other Significant Anthropogenic Sources 16
5.3 No Convincing Explanation Pointing to Natural Sources 16
6.0 Conceptual Model Details: Migration Pathways and Geochemical Complexities 18
6.1 Migration Pathways 18
6.2 Geochemical Complexities 25
7.0 Conceptual Model Details: Sources for Specific Private Well Clusters 27
8 .0 References 28
Appendix A. Critique of WDNR Interpretation of Boron and Strontium Isotope Data

1
1.0 Executive Summary
In 2010 the report In Harm’s Way released by the Environmental Integrity Project,
Earthjustice and Sierra Club—hereafter referred to as EIP et al (2010) or EIP Report—
identified coal ash landfills associated with We Energy’s Oak Creek Power Plant in
southeastern Wisconsin as one of thirty-seven new damage cases based on data that had
become recently available (as of mid-2010) on molybdenum and boron contamination in
private wells near the ash landfills. The EIP Report suggested that several other clusters
of private wells with high/elevated molybdenum and boron more distant from the coal
ash landfills at the power plant could be explained by localized placement of coal ash on
roads and fill in low-lying areas (Figure 1).
Figure 1. Location of Oak Creek coal ash landfills and major clusters of contaminated private wells. Map Key: CAL = Caledonia Ash Landfill, OCS = Oak Creek South Ash Landfill, OCN = Oak Creek North Landfill, HLF = Hunts Landfill (Superfund Site), Mo1 = Douglas Avenue private drinking water well cluster, Mo2 = Botting Avenue private drinking water well cluster, Mo3 = Foley Road private drinking water well cluster, Mo4 = County Line Road private drinking water well cluster, ug = upgradient well in Dolomite, w = monitoring wells in dolomite in old ash disposal areas. Mo5 = Michna Road area (new area of contamination identified since EIP Report.
Additional data and a number of reports and technical memoranda have become available
since the EIP Report was published. These include:
A Technical Memorandum prepared for the Hunts Site Remediation Group by
RMT (2011 concluded that Hunts Disposal Landfill was not the source of
molybdenum contamination in the private wells in the vicinity of the landfill and
identified coal ash from the Oak Creek Power Plant as a likely source (Section
3.1).

2
Two private wells on Michna Road about a half mile south of the Oak Creek
Caledonia landfill were identified as having high levels of boron (1,130 to 1,720
ug/L) and one with a high level of molybdenum (44 ug/L) in samples taken by the
Wisconsin Department of Health Services (WHDS).
WDNR released a report titled Caledonia Groundwater Molybdenum
Investigation Southeast Wisconsin in January, 2013 (Lourigan and Phelps, 2013).
This 101-page report includes the results of new samples from 24 private water
wells, 18 groundwater wells and piezometers installed to monitor the Oak Creek
ash landfill, and other wells up to eleven miles to the west. The report concludes:
The data remain inconclusive on whether the We Energies coal ash fill areas are
a significant molybdenum source (Section 3.2).
NRT, the consultant for We Energy has prepared numerous comments and
Technical Memoranda related to the molybdenum contamination issue (Section
3.3).
Analysis of the new data and information sources identified above has not led to any
change in the basic conclusions in the EIP Report. In fact the case for coal ash from the
Oak Creek Power Plant being the main source of high/elevated molybdenum in private
wells is stronger than ever.
The WDNR Report presents valuable data the study generated in a confusing way that
fails to assess the relative significance of the lines of evidence, and makes no effort to
develop a conceptual model for migration pathways to explain the pattern of
molybdenum-contaminated private wells. This report evaluates the new data in a
systematic way, and presents a detailed conceptual model that is able to explain coal ash
as the main source of elevated/high concentration of molybdenum in all private wells in
southeastern Wisconsin. The main elements of the conceptual model that identifies coal
ash as the main source of molybdenum and boron in private wells includes the following:
Sources of Molybdenum and Boron (Section 5). This Section presents multiple
lines of evidence implicating coal ash from the Oak Creek power plant as the
main source of molybdenum and boron in private wells.
Migration Pathways (Section 6.1). Migration pathways for molybdenum in coal
ash leachate from the unlined Oak Creek South ash landfill to wells in the
Douglas Avenue private well cluster (Mo1 on figure 1) about 1,000 feet to the
southwest are discussed in detail. Specific details of migration flow paths to
molybdenum-contaminated private wells both in isolated wells and clusters of
wells may differ. Geochemical complexities contributing to concentration
gradients are discussed in Section 6.2.
Application of Conceptual Model to Specific Areas (Section 7). This Section
applies the source/migration model to specific contaminated well clusters.
In this report lines of evidence supporting coal ash as the primary source of elevated/high
molybdenum and boron in private wells in the WDNR study area are grouped into three
categories:

3
Strong general and site specific evidence that point to coal ash as the primary
source (Section 5.1). The most glaring failure of the WDNR Report is the
assumption that the Oak Creek ash landfills are the only ash source in the study
area. Information is presented in this report that identifies multiple off-site
locations where coal ash has been placed in the vicinity of contaminated private
wells.
Lack of evidence for other significant anthropogenic sources of molybdenum
(Section 5.2). The WDNR Report itself found no other significant anthropogenic
source.
Lack of convincing evidence pointing to significant natural sources of
molybdenum and boron (Section 5.3). The main evidence that WDNR relies upon
to suggest natural sources for the private well contamination are boron and
strontium isotope data. Appendix A provides a detailed critique of the WDNR
interpretation of the boron isotope data and concludes that it is flawed for the
following reasons: 1) boron concentrations in molybdenum-contaminated private
wells in the Town of Caledonia range from 303 to 1,740 ug/L, well above normal
natural background levels in groundwater in the U.S., and 2) the private wells
with the highest δ11Β values (around 29 mils) also have the highest boron
concentrations (1,470 to 1,740 ug/L), with a known source of coal ash fill nearby.
In addition, other clearly ash-affected wells fall within the “unaffected” zone
defined in the WDNR Report.
Key elements of the conceptual model presented in this report for migration pathways
from coal ash to nearby private wells include the following (see Figure 2):
OCS landfill forms a topographic high creating a near surface water table that
flows southwest toward nearby private wells (Figures 5 and 6).
A vertical hydraulic gradient between the ash landfills and the private wells in the
dolomite aquifer allows downward migration (Figure 7).
Fractures in otherwise slowly permeable glacial till allow relatively rapid vertical
flow of coal ash leachate to the permeable Intermediate Sand Layer. The
concentrated leachate (with molybdenum measured as high as 16,700 ug/L)
becomes diluted several order of magnitude in the groundwater to levels that still
exceed the ES of 40 ug/L.
Before 2005 groundwater flow in the Intermediate Sand Layer reflected the
surface topography with flow from the southwest edge of the OCS landfill
southwest toward nearby private wells. A dewatering system that was installed
when a bluff to the east was excavated for an expansion to the Oak Creek power
plant began pumping in May 2005 significantly altered the groundwater flow
regime throughout the Oak Creek Power Plant and shifted flow in the
Intermediate Sand Layer to the northeast (Figure 8). Prior to this shift in flow
direction molybdenum-contaminated leachate flowed to the southwest toward
nearby private wells for a period of about thirty years
The annular space between the borehole and well casing of private wells in the
Dolomite aquifer provides a preferential pathway for migration of coal ash
molybdenum in groundwater in the Intermediate Sand Layer to reach the

4
Dolomite aquifer. The additional downward hydraulic gradient created by
multiple wells pumping groundwater to the surface accelerates the downward
migration along this pathway.
The details of flow direction in the Intermediate Sand Layer may vary, but the
migration pathways described above also apply to private wells in the vicinity of
localized placement of coal ash outside the Oak Creek Power Plant property.
Figure 2. Conceptual model of migration pathways for flow of molybdenum and boron from coal ash landfill and/or localized ash placement to private wells. Geologic cross section from RMT (2011).
The overall conceptual model can be applied more specifically to the clusters of
molybdenum- and boron-contaminated wells as follows:
Douglas Avenue and Botting Avenue Private Well Clusters (Mo1 and Mo2 in
Figures 1 and 5). The unlined Oak Creek South (OCS) ash landfill and areas
where coal ash was deposited in the area of the Caledonia ash landfill prior to
development of the lined landfill are the likely sources.
Foley Road Private Well Cluster (Mo3 on Figures 1 and 5). RMT (2011)
suggested that molybdenum contamination in this cluster might come from the
OCS landfill, but not enough hydrogeologic data were found during the
preparation of this report to make a strong case for the OCS landfill as the main
source. Roads in this area were completed in 1977. If more detailed
hydrogeologic data are not able to confirm OCS landfill as the source, an as yet
undocumented local coal ash source placed prior to 1977 is likely.

5
County Line Road Private Well Cluster (Mo4 on Figure 1). One possible coal ash
source for these wells is the use of coal ash as backfill in the trench for the sewer
line that runs along County Line Road. Other as yet undocumented coal ash
source may be possible as well.
Michna Road Private Well Cluster (Mo5 on Figure 1; see also Figure 4). The
high concentrations of boron (1,130 to 1,720 ug/L) in two wells and high
molybdenum in one of these wells (44 ug/L) on Michna Road can be attributed to
placement of coal ash in a nearby low-lying wetland area in the 1960s.
Other Isolated Private Wells (Figure 3). Other private wells with high
molybdenum levels are scatter throughout the Town of Caledonia within a six
mile radius of Oak Creek Power Plant. The most distant molybdenum-
contaminated well (PW18) also has significantly elevated boron and sulfate
pointing to coal ash as the source. In the absence of convincing evidence that
molybdenum, boron and sulfate come from a natural source, given the very
common association of these three constituents in coal ash leachate, a rebuttable
presumption is that molybdenum in this well and other wells in this category are
coming from as yet undocumented local placement of coal ash.
2.0 Background
In 2010 the report In Harm’s Way released by the Environmental Integrity Project,
Earthjustice and Sierra Club—hereafter referred to as EIP et al (2010) or EIP Report—
identified coal ash landfills associated with We Energy’s Oak Creek Power Plant in
southeastern Wisconsin as one of thirty-seven new damage cases based on data that had
become recently available on molybdenum and boron contamination in private wells near
the ash landfills (see Figure 1, updated from the EIP Report, for locations of ash landfills
and clusters of private wells contaminated by molybdenum):
The following evidence provides strong support for a conclusion that the
molybdenum in the Douglas Avenue and Botting Avenue clusters of contaminated
wells is coming from the Oak Creek Power Plant coal ash landfills [identified as
Mo1 and Mo2 respectively in Figure 1]:
Sampling of leachate at three different locations in the Caledonia Landfill in
2009 and 2010 found concentrations of dissolved molybdenum ranging from
8.8 to 15 mg/L [8,800 to 15,000 ug/L], 220 to 375 times the ES [State
Enforcement Standard].
High concentrations of molybdenum have been measured in groundwater
monitoring wells northeast of the Oak Creek South Landfill (a dissolved
concentration of 0.054 mg/L [54 ug/L] at W39C—the upper “w” on the
satellite photo in Figure 1), and east of the Caledonia Landfill (a dissolved
concentration of 0.094 mg/L [94 ug/L] at MW12D—the lower “w” on the
satellite photo). These groundwater monitoring wells are located in or near
coal ash disposal areas that pre-date We Energy’s permitted CCW [Coal
Combustion Waste] landfills.

6
The groundwater monitoring wells with molybdenum exceedances were in a
highly concentrated area within 1,500 feet of the Oak Creek South and/or
Caledonia landfills.
Maximum boron concentrations in the Douglas Avenue Cluster of residential
wells ranged from 0.44 to 0.72 mg/L [440 to 720 ug/L], up to 3.8 times the
state’s Preventive Action Limit (PAL). Maximum boron in the Botting Avenue
Cluster of residential wells ranged from 0.37 to 0.52 mg/L [370 to 520 ug/L],
up to 2.7 time the PAL. Boron is a major constituent in fly ash and recent
measurements of boron in leachate at the Caledonia Landfill ranged from 3.3
to 41 mg/L [3,300 to 41,000 ug/L], three to 41 times the ES for boron.
A recently installed groundwater monitoring well (W44—marked “ug” on the
satellite photo) in the dolomite aquifer, about 1,500 feet upgradient of the
Douglas Avenue and Botting Avenue Clusters, had a maximum concentration
of 0.014 mg/L [14 ug/L] dissolved molybdenum, and relatively low maximum
concentration of boron (0.28 mg/L) [280 ug/L] which does not support the
hypothesis that there is an upgradient source for the molybdenum. (EIP et al,
2010, p. 262).
Several new clusters of molybdenum more distant from the coal ash landfills at the power
plant were found in private well sampling data that became available shortly before
writing of the Oak Creek Power Plant coal ash damage case was completed. The EIP
Report noted that Wisconsin Department of Natural Resources (WDNR) was in the early
stages of a study of the molybdenum and boron in groundwater in the area but suggested
that contamination in the vicinity of Hunts Disposal Landfill Superfund Site (identified as
Mo4 on Figure 1) is coming from coal ash disposal in the vicinity rather than the other
hazardous wastes that were placed in the Hunts Disposal Landfill. The EIP report also
suggested that the cluster of four wells on Foley Road about halfway between the Hunts
Landfill and the Caledonia Landfill (marked as Mo3 on Figure 1) where the ES for
molybdenum is exceeded (45 to 85 ug/L) as well as the PAL for boron (399 to 574 ug/L)
could best be explained by a localized source of coal ash disposal (EIP et al, 2010, p.
268).
3.0 Sources of New Data and Analysis Since EIP Report
A number of reports and technical memoranda have become available since the Oak
Creek damage case was published. These include:
A Technical Memorandum prepared for the Hunts Site Remediation Group by
RMT (2011). This report concluded that Hunts Disposal Landfill was not the
source of molybdenum contamination in the private wells in the vicinity of the
landfill and identified coal ash from the Oak Creek Power Plant as a likely source
(Section 3.1).
Two private wells on Michna Road about a half mile south of the Oak Creek
power plant and Caledonia ash landfill were identified as having high levels of
Boron (>1,000 ug/L), and one had a high level of Molybdenum (44 ug/L) in

7
samples taken by the Wisconsin Department of Health Services (WHDS). This
area is identified as Mo5 on Figure 1.
WDNR released a report titled Caledonia Groundwater Molybdenum
Investigation Southeast Wisconsin in January, 2013 (Lourigan and Phelps, 2013).
This 101-page report includes the results of new samples from 24 private water
wells, 18 groundwater wells and piezometers installed to monitor the Oak Creek
ash landfill, and other wells up to eleven miles to the west. The area covered by
this sampling is referred to as the WDNR study area in this report. In addition to
analysis for inorganic parameters the groundwater samples were analyzed for
molybdenum, boron, strontium and tritium isotopes. Furthermore a number of
coal ash and coal leachate samples were collected for molybdenum, boron and
strontium isotope analysis. The results of this study paint a complex geochemical
picture of the occurrence of molybdenum and boron in the study area. The report
presents fourteen numbered lines of evidence in support of We Energy’s coal ash
as the source of molybdenum and eleven numbered lines of evidence for
considering a natural source for the molybdenum. The conclusions in the WDNR
Report are discussed in Section 3.2.. The WDNR web page on molybdenum in
groundwater (http://dnr.wi.gov/topic/Groundwater/molybdenum.html) states: A
two-year DNR study was unable to determine the origin of the elevated levels of
molybdenum.
NRT, the consultant for We Energy has prepared numerous comments and
Technical Memoranda related to the molybdenum contamination issue (Section
3.3).
3.1 Hunts Disposal Landfill (HDL) RMT Technical Memorandum. The
Executive Summary in the RMT Technical Memorandum makes a strong case that the
HDL Superfund Site is not a source of the high levels of molybdenum found in private
wells in the vicinity of the landfill (RMT, 2011, pp. 1-2):
There are multiple lines of evidence to demonstrate that the HDL is not the source
of molybdenum in private wells in the area. These multiple lines of evidence
include:
No geologic pathway – The HDL is geologically isolated from the bedrock
aquifer by a thick, competent silty clay unit, and therefore is not a likely
source of impacts to the bedrock aquifer.
No groundwater migration pathway – The primary groundwater flow
direction beneath the HDL is to the Root River. Although there is a
downward gradient from the shallow sand to the deeper sand and bedrock
on the eastern part of the HDL, flow would have to occur across the low
permeability, silty clay unit. The steep groundwater gradient across this
silty clay unit supports the geologic data that it is a competent, continuous
low permeability unit. If a permeable connection existed, the steep
gradient would not be maintained.
Chloride, a HDL tracer constituent, is not present above background in
monitoring wells beneath the silty clay unit. This demonstrates that

8
migration does not occur from HDL in the shallow sand, across the silty
clay unit, to the lower sand or bedrock.
There is no chloride‐molybdenum correlation in private wells – Private
well data show there is no correlation between molybdenum and chloride
which would be expected if HDL was a source of molybdenum.
Furthermore, the hydrogeologists who prepared this report identified coal ash from the
Oak Creek Power Plant as a likely source for high molybdenum levels in private wells:
In addition to the multiple lines of evidence showing that the HDL is not a source
of molybdenum to the bedrock aquifer utilized by the private wells, there are
several observations that indicate potential migration pathways exist from the WE
Energies Landfills to the bedrock aquifer. These include:
The flyash landfills contain significant concentrations of molybdenum in
leachate, up to 3 orders of magnitude higher than the ES.
A continuous intermediate sand unit is shown to be present below and to
the west of the Oak Creek South (OCS) flyash landfill.
This continuous intermediate sand unit is in direct hydraulic connection
with the bedrock in the area of Foley Road and Running Horse Road,
where molybdenum is present in private wells that are cased in bedrock at
concentrations above the NR‐140 Enforcement Standard (ES).
Historic and current groundwater elevations show that there has been a
continuing downward vertical gradient from the water table to the
intermediate sand. Historic groundwater elevations in nested monitoring
wells have shown a downward vertical gradient from the intermediate
sand unit to the bedrock aquifer.
Private well construction reports indicate many wells have no seal below
20 ft. bgs [below ground surface], allowing for the transport of water and
contaminants between these sand units and the bedrock aquifer along the
well casing.
3.2 WDNR Caledonia Groundwater Molybdenum Investigation. It seems
strange that the WDNR Report concludes that the data remain inconclusive on whether
the We Energies coal ash fill areas are a significant molybdenum source when it
identifies more lines of evidence suggesting that the source of high values of
molybdenum in groundwater come from We Energies or “another anthropogenic” source,
than lines of evidence for considering a naturally occurring sources for molybdenum
(Lourigan and Phelps, 2013, pp. 55-58). The fourteen lines of evidence supporting coal
ash as the source and twelve lines of evidence suggesting a natural source (the two items
numbered “2” in the WDNR Report are identified as 2a and 2b in this report) are
presented in a haphazard way and there is no attempt to assess relative significance or
present a conceptual model that is able to explain most of the observed data.
Furthermore, a number of the items contradict each other (low permeable till vs fracture
flow). All of the lines of evidence in the WDNR Report are evaluated in detail below in
the context of the conceptual model that is presented in this report (in Section 4) which

9
identifies coal ash as the primary source of molybdenum and boron in contaminated
private wells (Section 5) and the migration pathways involved (Section 6.1). Lines of
evidence related to geochemistry are discussed in Section 6.2.
The WDNR Report drew five conclusions concerning the likely sources of elevated/high
molybdenum in private wells in the study area (Lourigan and Phelps, 2013, p. 58). These
conclusions are quoted below in italics with brief comments noted. More detailed
discussion follows where the analysis and data presented in this report do not support
these conclusions.
1) The Hunts Landfill does not appear to be a source of the molybdenum in area
private wells.
The evidence presented by RMT (2012) is convincing. Furthermore, the WDNR Report
does not present any evidence for anthropogenic sources other than coal ash (Section 5.2)
2) The data remain inconclusive on whether the We Energies coal ash fill areas
are a significant molybdenum source.
To the contrary, multiple lines of evidence strongly implicate the We Energy’s coal ash
fill areas as a significant molybdenum source in private wells to the west of the landfills.
The high amount of leachable molybdenum and boron in coal ash placed as localized fill
and on roads in the Town of Caledonia provides the only known significant source of
molybdenum and boron in private wells in the study area (Section 5.1).
3) The data appear to be more conclusive regarding boron. While the monitoring
wells may have been affected, the boron isotope data and other evidence appear
to show that the boron in most of the private wells is naturally occurring. Boron
may also be coming from other man-made sources. There is more available boron
data for the area’s groundwater resources than molybdenum data. Boron is
known to occur naturally in area groundwater.
To the contrary, multiple lines of evidence point to coal ash rather than natural sources
for elevated/high levels of boron in private wells (Sections 5.1 and 5.3). This conclusion
relies primarily on boron isotope data, a type of analysis that is still under development
with respect to coal ash. A careful analysis of the boron isotope data in the WDNR
Report shows the results from studies at other locations to not be applicable to the
WDNR study area (Appendix A).
4) The hydrogeological flow path is complex and the affected area is very large
(several miles). The full extent of the affected area is still not known. The elevated
molybdenum concentrations appear to correlate with a natural buried bedrock
valley that is oriented in an east-west direction across northern Racine County,
but a causal relationship between the observed concentrations and the buried
valley could not be determined.

10
It is true that the hydrogeological flow paths from coal ash sources to private wells are
complex (Section 6.1), but they are readily identified. The most glaring failure of the
WDNR Report is the assumption that the Oak Creek ash landfills are the only ash source
in the study area. Eyewitness reports of filling in a wetland area in the vicinity of Michna
Road provides a source for the high molybdenum and boron concentration in private
wells on Michna Road, and reports of ash placed in other areas in the Town of Caledonia
provide evidence of a coal ash source for the private wells more distant from the Oak
Creek ash landfills (Section 5..1). The Oak Creek Power Plant has been generating large
volumes of coal ash since 1950. Any number of undocumented off-site placement and
filling activities using this plants coal ash are a possible source. It is a red herring for
WDNR to suggest that the molybdenum source is a natural bedrock valley for which a
causal relationship between the observed concentrations and the buried valley could not
be determined.
5) Because the primary contaminants of concern, molybdenum and boron, occur
naturally in the area, determining the source(s) of what appear to be elevated
concentrations may not be possible with the data collected to date. Additional
groundwater sampling and analysis of additional samples of the clay till and
shale bedrock could increase the understanding of the extent of the elevated
concentrations and may contribute to determining a cause.
Molybdenum and boron occur naturally in low concentrations in groundwater
everywhere. Occurrence of elevated/high concentrations of molybdenum and boron in
natural groundwater in the geologic settings found in the WDNR study area are
extremely rare (Section 5.3). The data collected to date in the context of the conceptual
model presented in this report clearly identify coal ash as the primary source of high or
elevated molybdenum and boron in private wells.
3.3 NRT Technical Memoranda and Other Materials Prepared for We
Energy. These materials include responses to the EIP Report (NRT, 2010d), the RMT
Report (2011d) and the WDNR Report (NRT, 2013). Several reports relate to the
assessment of the Dolomite Aquifer groundwater quality (NRT, 2010a and 2010b), and
several reports examine groundwater flow in the Intermediate Sand Unit in the vicinity of
Oak Creek South Ash Landfill (NRT, 2012a and 2012b). Various reports address private
well sampling in the Michna Road area (NRT, 2011a, 2011b, 2011c, and 2012a).
The dozen Technical Memoranda and other materials prepared by NRT,
consultants for We Energy can be summarized as saying that coal ash is not responsible
for the high or elevated molybdenum and boron in private wells. Data from these reports
have been evaluated and a number of reinterpretations of NRT groundwater flow maps
are presented in this report.

11
4.0 Overall Conceptual Model for Private Well Contamination
The elements of the conceptual model that identifies coal ash as the main source of
molybdenum and boron in private wells include the following:
Sources of Molybdenum and Boron (Section 5). This Section presents multiple
lines of evidence implicating coal ash from the Oak Creek power plant as the
main source of molybdenum and boron in private wells.
Migration Pathways (Section 6.1). Migration pathways for molybdenum in coal
ash leachate from the Oak Creek South ash landfill to wells in the Douglas
Avenue private well cluster (Mo1) about 1,000 feet to the southwest are discussed
in detail. Specific details of migration flow paths in other isolated wells
contaminated with molybdenum and clusters of molybdenum-contaminated
private wells may differ. Geochemical complexities contributing to
concentrations gradients are discussed in Section 6.2.
Application of Conceptual Model to Specific Areas (Section 7). This Section
applies the source/migration models to specific contaminated private well
clusters.
In the relevant parts of the discussion below, the twenty-six lines of evidence identified in
the WDNR Report related to the source of molybdenum in private wells are quoted
verbatim and evaluated for significance and validity. When a WDNR line-of-evidence is
quoted the number is shown in parentheses. Those listed as implicating ash are identified
as Ash# and those supporting a naturally occurring source as Natural#). When the
WDNR Report is quoted, citations have been changed to reflect reference citation format
in this report. All lines of evidence have been reorganized and grouped according to
major elements of the conceptual model presented in this report. Quotes from the
WDNR Report are in italics and additional comments are interpolated.
5.0 Conceptual Model for Private Well Contamination: Sources of Molybdenum
and Boron
Lines of evidence supporting coal ash as the primary source of elevated/high
molybdenum and boron in private wells in the WDNR study area are grouped into three
categories:
Strong general and site specific evidence that point to coal ash as the primary
source (Section 5.1).
Lack of evidence for other significant anthropogenic sources of molybdenum and
boron (Section 5.2).
Lack of convincing evidence pointing to significant natural sources of
molybdenum and boron (Section 5.3).

12
5.1 Evidence Implicating Coal Ash as the Main Source. Many lines of
evidence support the conclusion that coal ash from the Oak Creek power plant is the
primary source of elevated/high molybdenum and boron concentrations in private wells.
In this report molybdenum levels in groundwater are considered elevated if they exceed 8
ug/L and high if they exceed the WDNR (Enforcement Standard) ES of 40 ug/L.
Similarly levels of boron in groundwater are considered elevated if they exceed 200 ug/L
and high if they exceed the WDNR ES of 1,000 ug/L (the rationale for the cutoffs for
elevated levels of molybdenum and boron are discussed in Section 5.3).
Elevated levels of molybdenum (and boron and sulfate) in groundwater have been
found associated with releases from coal ash landfill sites in WI and in other
parts of the country (e.g. IN, IL, PA). [Refs. Bayless et al (1998), Buszka et al
(2004), Ruhl ( 2012), Ruhl et al (2011), Zillmer and Fauble (nd)—WDNR
Ash#11].
In the absence of strong evidence for other sources of molybdenum and boron, this is a
major point. Nine of the seventy new coal ash damage cases identified by the
EIP/Earthjustice reports (EIP&EJ, 2010 and EIP et al, 2010) identified molybdenum as a
significant contaminant (>40 ug/L). In addition to Oak Creek, other sites included Big
Bend (FL), Joliet 9 (IL—this also happens to involve a dolomite aquifer), Reid (NV),
Cardinal (OH), James Gavin (OH), Hatsfield Ferry (PA), Johnsonville (TN) and Fayette
(TX). Boron is an even more common contaminant at coal ash disposal sites. An
analysis of 121 coal ash disposal sites in the U.S. found that 25.6% had levels of boron in
monitoring wells or private wells that exceeded U.S. EPA’s Long Term Health Advisory
for children of 3,000 ug/L (Boulding, 2010). The percentage of sites deemed
contaminated with boron would be higher if the WDNR ES of 1,000 ug/L for boron had
been used in this analysis.
Sites around the country with molybdenum levels as high as those seen in the area
of investigation have been linked to contamination site releases, not naturally
occurring conditions [WDNR Ash#5].
This point is also highly significant when considered with the evidence in Section 5.2 that
there are no other anthropogenic sources of molybdenum identified in the vicinity of
contaminated private wells.
Site specific lines of evidence that strongly support coal ash as the main source of
molybdenum and boron include:
There are multiple areas of unlined ash fill on the We Energies Oak Creek
property. [WDNR Ash#6].
There are very high levels of molybdenum (boron, sulfate) in site ash landfill
(OCS Landfill and OCN Landfill) leachate head wells. [WDNR Ash#7].

13
The unlined OCS landfill had higher concentrations of molybdenum in leachate than any
other ash fill in WDNR’s sampling (16,700 ug/L—Lourigan and Phelps, 2013, Table 9).
This is also the landfill that is closest to the Douglas Avenue cluster of private wells.
Some glacial till and dolomite bedrock monitoring wells on the We Energies
property show high levels of molybdenum (> 40 ug/L) in addition to boron and
sulfate. [WDNR Ash#8].
Well W28AR in glacial till west of OCS landfill and about 1,000 feet north of the
Douglas Avenue private well cluster (Mo1) has had concentrations of boron as high as
1,600 ug/L (NRT, 2010a, Plate 3B). Well W16AR in glacial till between the OCS and
Caledonia landfills and about 1,000 feet east of the Douglas and Botting Avenue private
wells clusters (Mo1 and Mo2) has had concentrations of molybdenum as high as 78 ug/L
(this well is in the same cluster with W16D in Figure 5).
A bedrock monitoring well (W-44) installed by We Energies at a proposed
“background” location, if groundwater flow in the dolomite is to the east/
northeast, did not show elevated molybdenum concentrations. [WDNR Ash#10].
This is a highly significant line of evidence. The only monitoring well in the area that
was installed specifically to represent natural background levels of molybdenum has
shown slightly elevated levels of molybdenum (16 ug/L) and boron (230 ug/L). This
well is cross gradient from the molybdenum-contaminated wells in the Foley Avenue
private well cluster Mo3 (this cluster and W44 are shown on Figure 5) so the slightly
elevated values in this well may reflect some minor contributions from the hypothesized
coal ash source for this cluster (Section 7).
It is possible that the molybdenum isotope results indicate coal ash as the source
of molybdenum found in groundwater in area of investigation. Literature for
molybdenum isotope values for naturally occurring molybdenum generally
appear to be relatively low (-0.3 to 1.4 per mil) while samples in area of
investigation are generally greater than 1.4 per mil. [Chappaz et al (2012),
Gordon (2012), and Uri et al (2009)—WDNR Ash#12].
All the samples from private wells significantly exceeded 1.4 mil (1.73 to 4.33). The
molybdenum isotope data provide a significant new line of evidence that the
molybdenum in private wells is coming from coal ash. As noted in the discussion of the
boron isotope data in Appendix A, such data should not be relied upon as a primary line
of evidence. However the molybdenum isotope data adds further support to coal ash as
the source of molybdenum in private wells.
There are elevated levels of molybdenum found in monitoring wells and private
well samples located approximately eleven miles west of the We Energies
property. Some of the highest concentrations in the study area are in the western
most sample locations. It appears unlikely that the ash fill areas are the source of
the elevated molybdenum levels found eleven miles to the west. Other man-made

14
sources of these elevated molybdenum levels are not apparent. [WDNR
Natural#1].
Elevated molybdenum concentrations observed in groundwater are widespread,
over a distance of several miles. A single man-made source that could cause
elevated molybdenum levels in multiple directions is not apparent at this time.
(see Fig. 18) [WDNR Natural#2a].
The most glaring failure of the WDNR Report is the assumption that the Oak Creek ash
landfills are the only coal ash source in the study area. An eyewitness report of coal ash
filling in a wetland area in the vicinity of Michna Road in the 1960s provides a source for
the high molybdenum and boron concentrations in private wells on Michna Road
(Personal communication, Frank Michna, July 9, 2013—see Figures 3 and 4).
Figure 3. Location of private wells sampled in the WDNR study (Lourigan and Phelps, 2013, Figure 7). AF = reported area of filling of wetland by coal ash in the Michna Road area. Blue = boundary of Town of Caledonia where coal ash has been placed on county roads.

15
Other eyewitness reports of placement of coal ash outside of on-site landfills include
filling of wetland areas on either side of Rifle Road near the Douglas and Botting Avenue
private well clusters in the 1980s (Personal communication, Frank Michna, July 9,
2013—see Figure 5) and placement of coal ash as backfill for a sewer line(s) along
County Line Road west of Oak Creek Power Plant (Personal communication, Barb
Hugier referring to an account by another individual, July 9, 2013). In the past coal ash
has been placed on snowy/icy roads throughout the Town of Caledonia (Personal
communication, Frank Michna, July 9, 2013). The Oak Creek Power Plant has been
generating coal ash since 1950. Any number of other undocumented locations of off-site
placement or filling of coal ash are possible. Figure 3 shows the location of private wells
that were sampled in the WDNR study, the boundary of the Town of Caledonia (taken
from Google Map) and the location of the reported wetland filling with coal ash in the
Michna Road area (AF). Twenty two of the twenty four private wells sampled in the
WDNR study are near county roads in the Town of Caledonia.
Figure 4 Molybdenum concentrations in private wells south of Oak Creek Power Plant (Modified from NRT 2011b, Figure 1)

16
The boron and strontium isotope data do not appear to support coal ash as a source of
the boron in most of the private wells. Some of the boron that was found in the
monitoring wells, and most of the boron found in private water supply wells appears to
be naturally occurring, based on boron/strontium isotope analysis. [WDNR Natural#2b].
When the boron and strontium stable isotope data are examined more closely, the
assertion that coal ash is not the source for boron in most private wells does not hold up.
The boron/strontium isotope data are examined in detail in Appendix A. The results of
this analysis can be summarized as follows:
Boron concentrations in molybdenum-contaminated private wells in the Town of
Caledonia range from 303 to 1,740 ug/L, well above normal natural background
levels in groundwater in the U.S. (90th
percentile concentration of boron in humid
east of 160 ug/L—Ayotte et al, 2011) and the conclusion of Schleyer et al (1992)
that natural groundwater levels of boron are typically <200 ug/L.
The private wells with the highest δ11Β values (around 29 mils) also have the
highest boron concentrations (1,470 to 1,740 ug/L), with a known source of coal
ash fill nearby. In addition, other clearly ash-affected wells fall within the
“unaffected” zone defined in the WDNR Report as >15 mils) and other highly ash
affected groundwater occurs throughout the hypothetical mixing zone.
5.2 No Evidence for Other Significant Anthropogenic Sources. The WDNR
report evaluated possible evidence for other anthropogenic sources that might be a
significant source of molybdenum and boron in private wells and found none. Possible
industrial sources evaluated included the Hunts Disposal Landfill (HDL) Superfund site
located within two miles of the Oak Creek Power Plant, PP&G industries located within
four miles of the power plant, and the Emerald Park and Future Parkland Landfills about
eleven miles west of power plant. The WDNR Report did not identify any of these
anthropogenic sources as having contaminated private wells.
5.3 No Convincing Explanation Pointing to Natural Sources. The boron and
strontium stable isotope data do not fit the patterns reported from published sources as
shown in Appendix A. In fact, the WDNR Report provides no convincing evidence for
natural sources of molybdenum and boron being a significant source of elevated or high
levels for these metals in private wells. This section provides additional data in support
of the following point in the WDNR Report:
It appears to be unusual to find naturally occurring elevated levels of
molybdenum in groundwater because naturally occurring levels of Mo in
groundwater in Wisconsin glacial aquifers in Mid-West, and in various aquifers
around the country are reported low. [Eisler (1989, pp. 7-8)—WDNR Ash#2].
A comprehensive assessment of natural levels of trace elements in groundwater published
by the U.S. Geological Survey as part of the National Water Quality Assessment Program
(Ayotte et al, 2011) provides even more compelling evidence that natural sources are a

17
minor contribution to molybdenum and boron concentrations in the private wells sampled
in the WDNR study. Key results of this study for molybdenum include:
In more than 1,900 groundwater samples in the humid eastern U.S. analyzed as
part of the National Water-Quality Assessment Program, the 90th
percentile
concentration was 5 ug/L for molybdenum (Ayotte et al, 2011, Table 5).
In glacial aquifers only 2.0% of samples exceeded the benchmark of 40 ug/L for
molybdenum, and none of the samples from carbonate aquifers exceeded 40 ug/L
(Ayotte et al, 2011, Table 10).
The private wells in the WDNR study stand in stark contrast to the low
background levels noted above: 18 of the 24 private wells (75%) exceeded the
Wisconsin ES of 40 ug/L in one or more sampling events.
Significant numbers of private wells in the Town of Caledonia do have low levels
of molybdenum. Figure 4 shows that about two dozen private wells south and
southeast of the Caledonia ash landfill have maximum concentrations of
molybdenum that are <8 ug/L (This value is only slightly higher than the 90th
percentile value of 5 ug/L in the humid eastern U.S.--in this report, 8 ug/L is
considered a reasonable threshold to differentiate natural background levels from
levels that may reflect contributions from coal ash). Given regional flow patterns,
wells in this area would be unlikely to be affected by the Oak Creek ash landfills,
except where off-site ash disposal has taken place (as with the affected wells on
Michna Road. The wells with elevated and high concentrations of molybdenum
(yellow and red dots) in the upper left part of Figure 4 have been contaminated by
the Oak Creek South landfill and other uncontrolled ash fills in the vicinity of
Rifle Road as discussed in Section 6.1.
Key results of this assessment for boron include:
In more than 1,900 groundwater samples in the humid eastern U.S. analyzed as
part of the National Water-Quality Assessment Program, the 90th
percentile
concentration was 160 ug/L for boron (Ayotte et al, 2011, Table 5). This finding
is consistent with the observations by Schleyer et al (1992) that boron
concentrations <200 ug/L are an indication of natural background in groundwater
and concentrations >500 ug/L are a clear indication of groundwater influenced by
leachate.
In glacial aquifers only 1.1% of samples exceeded the benchmark of 1,000 ug/L
(Ayotte ete al, 2011, Table 10). There were no samples in the dataset for boron in
carbonate aquifers.
None of the 24 private wells sampled in the WDNR study had less than 200 ug/L
of boron and eleven (45.6%) had concentrations greater than 500 ug/L, a clear
indication of groundwater affected by leachate.

18
In one place WDNR suggests that shale bedrock might be a natural source for the
elevated/high molybdenum that has been detected in private wells:
Analysis of drill cuttings from two We Energies site wells drilled in 1953 before
significant deposition of coal ash shows the presence of molybdenum and boron
in glacial till and in shale bedrock at this location. [WDNR Natural#5].
However, elsewhere WDNR provides three lines of evidence to the contrary.
Collectively these lines of evidence make a strong case against shale as being a
significant source of molybdenum in the dolomite aquifer where most private wells draw
their water.
One potential source for molybdenum and boron would be shale bedrock (the
Maquoketa Formation), but the Maquoketa Shale lies below dolomite bedrock
and gradients measured at locations where elevated molybdenum found in
monitoring well samples are vertically downward. [WDNR Ash#4].
Naturally occurring molybdenum concentrations in groundwater, potentially
associated with shale bedrock sources (Ohio, Illinois, Alberta CA), are lower than
the concentrations seen in Caledonia/Oak Creek area of investigation, and occur
under reducing redox conditions in groundwater. [Refs. Alberta Health and
Wellness (2000), Bayless et al (1998), Thomas et al (2005), Warner (2001)]
Based on sample results of redox sensitive parameters, it does not appear that
there are reducing redox conditions in groundwater in area of investigation.
[WDNR Ash#3].
Although glacial till and shale bedrock (drill cuttings) sample analysis from two
We Energies site wells drilled in 1953 show the presence of molybdenum in
glacial till and shale bedrock, the levels were not particularly high (2 – 2.4 ppm
in the till and 1.1 – 1.3 ppm in the shale) at that location. These sample results
are below the 3 ppm laboratory limit of quantitation (LOQ), and also below the
4.5 ppm average for shale rock [p. 5, Hem, 298--WDNR Ash#1].
6.0 Conceptual Model for Private Well Contamination: Migration Pathways and
Geochemical Complexities
This Section presents a detailed conceptual model for migration pathways from coal ash
disposal/placement areas (Section 6.1) and also addresses the geochemical complexities
that are involved in interpreting varying concentrations of different coal ash constituents
and concentration gradients of contaminants (Section 6.2).
6.1 Migration Pathways. The discussion here focuses on migration pathways
from the Oak Creek South (OCS) ash landfill to private wells in the Douglas Avenue
well cluster (Mo1) about 1,000 feet southwest of the landfill. Specific details of
migration flow paths in isolated wells contaminated with molybdenum and other clusters
of molybdenum-contaminated private wells may differ.

19
Key elements of the conceptual model for migration pathways from coal ash to nearby
private wells include the following (see Figure 2):
OCS landfill forms a topographic high creating a near surface water table that
flows southwest toward nearby private wells (Figures 5 and 6).
A vertical hydraulic gradient between the ash landfills and the private wells in the
dolomite aquifer allows downward migration (Figure 7).
Fractures in otherwise slowly permeable glacial till allow relatively rapid vertical
flow of coal ash leachate to the permeable Intermediate Sand Layer. The
concentrated leachate (with molybdenum measured as high as 16,700 ug/L)
becomes diluted several order of magnitude in the groundwater to levels that still
exceed the ES of 40 ug/L.
Before 2005 groundwater flow in the Intermediate Sand Layer reflected the
surface topography with flow from the southwest edge of the OCS landfill
southwest toward nearby private wells. A dewatering system that was installed
when a bluff to the east was excavated for an expansion to the Oak Creek power
plant began pumping in May 2005 significantly altered the groundwater flow
regime throughout the Oak Creek Power Plant and shifted flow in the
Intermediate Sand Layer to the northeast (Figure 8). Prior to this shift in flow
direction molybdenum-contaminated leachate flowed to the southwest toward
nearby private wells for a period of about thirty years
The annular space between the borehole and well casing of private wells in the
Dolomite aquifer provides a preferential pathway for migration of coal ash
molybdenum in groundwater in the Intermediate Sand Layer to reach the
Dolomite aquifer. The additional downward hydraulic gradient created by
multiple wells pumping groundwater to the surface accelerates the downward
migration along this pathway.
The details of flow direction in the Intermediate Sand Layer may vary, but the
migration pathways described above also apply to private wells in the vicinity of
localized placement of coal ash outside the Oak Creek Power Plant property.
The following discussion examines key elements of the conceptual model in more detail.
The OCS ash landfill forms a topographic high and the ground surface slopes to the
southwest in the direction of private well cluster Mo1 (Figure 5). The near-surface water
table tends to follow the topography and also flows toward private well cluster Mo1. The
November 2009 water table map in NRT (2010c) failed to take topography into
consideration when contours were drawn. Figure 6 shows an alternative and more
reasonable interpretation of the water table contours to more closely follow the surface
topography.

20
Figure 5. Topography of Oak Creek South Power Plant showing inferred flow to near-surface groundwater. Key: AF = observed filling of wetland with coal ash in the 1980s areas prior to construction of Caledonia ash landfill (CAL), OCS = Oak Creek South ash landfill, CAL = Caledonia ash landfill, Mo1 = Douglas Avenue private well cluster, Mo2 = Botting Avenue private well cluster, Mo3 = Foley Avenue well cluster; monitoring wells are identified with a W.
Figure 6 Redrawn contours of near-surface water table in glacial till, November 2009 to reflect topography (Adapted from NRT, 2010c, Plate 6).

21
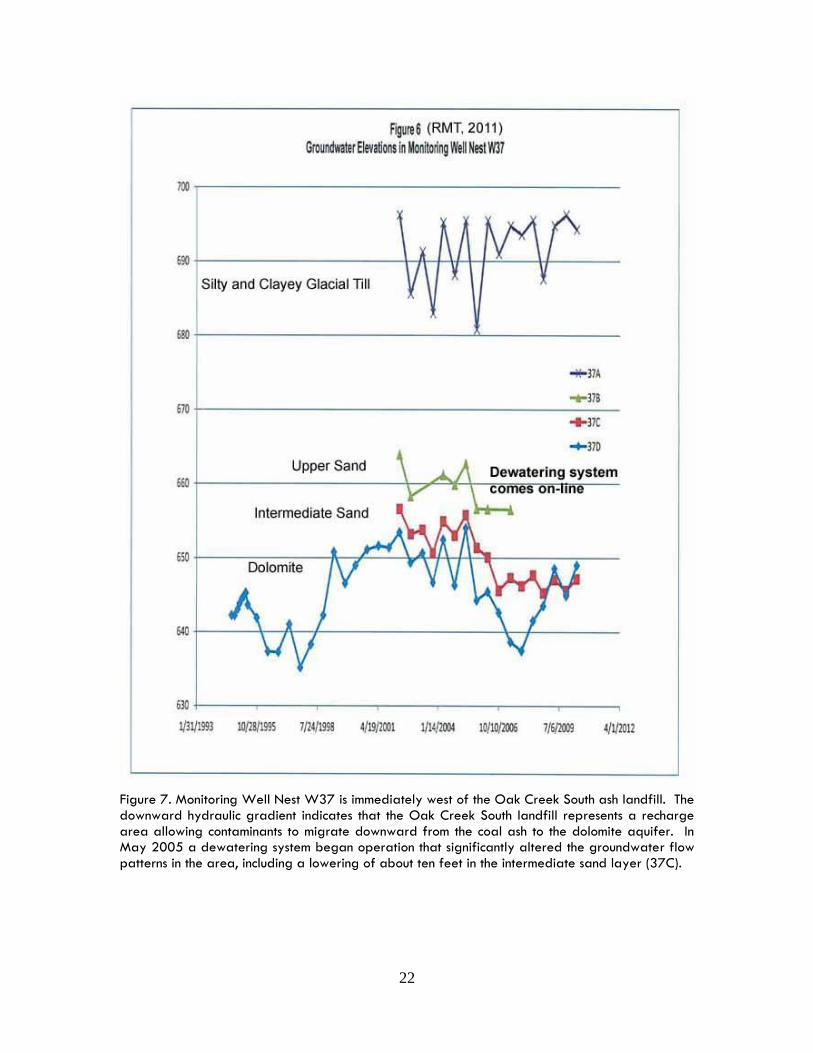
Figure 7 shows that monitoring well nest W37 west of OCS landfill and north of private
well cluster Mo1 has a downward hydraulic gradient from the uppermost water table in
the clayey till to the lowermost water-bearing geologic formation, the Dolomite aquifer
which private wells typically draw from. This is a typical pattern for a groundwater
recharge zone associated with a topographic high. Figure 5 shows the location of this
well and Figure 2 shows the geologic cross section (W37 is the second well from the
right). A number of observations are suggested by Figure 7:
As already noted, there is a vertical hydraulic gradient between leachate in the
OCS landfill and the private wells in cluster Mo1.
A dewatering system that began operating in May 2005 when a bluff to the east
was excavated for an expansion to the Oak Creek power caused a significant drop
in water levels in the Upper and Intermediate Sand Layers and the Dolomite
aquifer. Given that this well nest is one of the most distant monitoring wells from
the dewatering system, it is clear that the ground water flow regime in the entire
area of the Oak Creek Power Plant has been significantly altered. The water level
in the Intermediate Sand Layer dropped about ten feet. It appears that all
potentiometric maps that have been generated since 2005 do not reflect the
groundwater flow regime that existed in the vicinity of the OCS landfill for most
of the thirty years the landfill was in place prior to 2005.
The fact that the water table in the glacial till did not drop after 2005 suggests that
the well screen is placed in the impermeable matrix of the till. If the well screen
included joints or fractures, this water table would probably have dropped as well.
During the approximately four years that water level measurement were made in
the Upper and Intermediate Sand Layers and the Dolomite aquifer the fluctuations
parallel each other, indicating a good hydraulic connection between the three
aquifers.
The combination of downward hydraulic gradient and interconnectedness
suggests that the potentiometric surface of the Intermediate Sand Layer prior to
2005 followed the surface topography and hence leachate with molybdenum from
the OCS landfill that reached the Intermediate Sand Layer flowed southwest from
the landfill toward the Mo1 private well cluster nearby. Continually high
concentrations of molybdenum (as high as 16,700 ug/L in leachate sampling by
WDNR) flowing into the Intermediate Sand Layer since OCS landfill began
operation in 1974 could have left a substantial residual of molybdenum in aquifers
and aquifer solids to contaminate private wells in this cluster after changes in flow
from dewatering occurred in 2005.
As has been noted, the groundwater flow regime at Oak Creek Power Plant no longer
reflects what it was during most of the time the OCS landfill has been in place. However,
water level data from several recently installed wells in the Intermediate Sand Unit
suggest a very low gradient of 0.5 feet to the northeast between private well cluster Mo1
and the southwest corner of OCS landfill (Figure 8). Even under today’s altered flow
regime, flow reversals in response to pumping in private wells might cause migration of
molybdenum from the OCS landfill into private wells.
22
Figure 7. Monitoring Well Nest W37 is immediately west of the Oak Creek South ash landfill. The downward hydraulic gradient indicates that the Oak Creek South landfill represents a recharge area allowing contaminants to migrate downward from the coal ash to the dolomite aquifer. In May 2005 a dewatering system began operation that significantly altered the groundwater flow patterns in the area, including a lowering of about ten feet in the intermediate sand layer (37C).

23
Figure 8 requires some explanation. Monitoring Well nest W45A&B was installed in
Intermediate Sand Layer and the Dolomite in the vicinity of private well cluster Mo1 in
2010. The first potentiometric map of the Intermediate Sand Layer that was developed
with the new well was for April 2010 (NRT, 2010b). Later, another Monitoring Well,
W16D, was installed in the Intermediate Sand Layer south of OCS landfill (see Figure 5
for locations of the wells). The first potentiometric map of the Intermediate Sand Layer
with this new well dates from November, 2012 (NRT, 2012c). Comparison of water
levels in W37 and W45 between the two maps showed the April, 2010 levels to be 3 feet
higher. The April, 2010 water level in the vicinity of W16D was estimated by adding 3
feet to the November, 2012 level, and potentiometric contours redrawn. As noted above,
there is a very low hydraulic gradient between the Mo1 private well cluster and the
southwest part of the OCS landfill. This low gradient, even under the influence of
pumping that has caused a steep gradient of 10 feet from the middle of the OCS landfill
to the northeast corner, is consistent with the suggestion that groundwater in the
Intermediate Sand Layer used to flow from the OCS landfill toward private well cluster
Mo1.
Figure 8. Redrawn potentiometric contours of Intermediate Sand Layer, April 2010 (Adapted from NRT, 2010b Plate 1 with data from NRT 2012c wells W37C and W45A for November 2012 used to estimate elevation of W16D, which had not been installed in April 2010) . Considering that the groundwater levels are about ten feet lower that they were prior to installation of a dewatering system to the east in 2005, and that the unlined Oak Creek South (OCS) ash landfill is a recharge area, it is likely that before 2005 groundwater flowed to west-southwest from the OCS landfill.

24
The remainder of this section addresses points made in the WDNR Report concerning
migration pathways.
The We Energies property is generally underlain by a significant clay till soil
layer that tends to have a very low hydraulic conductivity, thus limiting horizontal
contaminant movement in the till. [WDNR Natural#11].
It is true that the low hydraulic conductivity of the Glacial Till tends to limit
horizontal/lateral contaminant movement, but the next point below is the important one.
It is worth noting that boron in monitoring well W28AR at the southwest edge of OCS
landfill has been measured as high as 1,600 ug/L (NRT, 2010a, Plate 4A) and Well
W16AR in glacial till south of OCS landfill has had concentrations of molybdenum as
high as78 ug/L (NRT, 2010a, Plate 3A).
Fractures documented in glacial clay till (Oak Creek Till) deposits would
promote more mobility for dissolved contaminants than might be expected in a
clay till formation. [WDNR Ash#13].
Oxygen, hydrogen and tritium isotope data discussed below provide strong evidence of
preferential vertical flow of groundwater through fractures in glacial clay till.
Shallow groundwater flow in glacial till across the property is documented to
flow to the west/northwest and to the east, showing evidence of a shallow
groundwater divide. [WDNR Ash#9].
As discussed in more detail earlier, shallow groundwater flow is also likely to flow to the
southwest from the OCS landfill toward private well cluster Mo1 (Figure 6).
Measured 18O/16O and 2H/1H isotope levels at a piezometer installed near the We
Energies property as part of past study conducted by Wisconsin geologists
Simpkins, Bradbury and Mickelson indicated relatively recent recharge of
groundwater. [Simpkins et al (1989)—WDNR Ash#14].
Furthermore, the tritium isotope measurements in private well samples provide evidence
of recharge since the 1950s. Four of the private wells in clusters nearest the Oak Creek
South ash landfill (PW-01 to PW-11) had detectable levels of tritium. This indicates that
precipitation leaching through the Oak Creek South landfill has mixed with groundwater
in the dolomite aquifer in the area of these private wells.
Groundwater flow in glacial till on site calculated by We Energies shows flow
across the We Energies property in the glacial aquifer “intermediate sand layer”
towards the east/northeast and southeast, away from the private wells where
elevated molybdenum concentrations were documented. [WDNR Natural#7].
As discussed in some detail above, the current direction of flow of the Intermediate Sand
Layer is the result of a change in the groundwater flow regime resulting from the

25
dewatering system that began operation in 2005. Prior to 2005 there is good reason to
believe that flow from OCS landfill also flowed to the northwest and southwest (toward
private well cluster Mo1).
Similarly, groundwater flow in the dolomite bedrock, calculated by We Energies
and by the department during the 2011 sampling event, shows groundwater flow
in the bedrock towards the east/northeast, away from the private wells where
elevated molybdenum concentrations were documented. [WDNR Natural#8].
It does appear that the regional direction of groundwater in the dolomite aquifer is to the
east/northeast. Nevertheless, the conceptual model for migration pathways presented
here does not require that there be flow in the Dolomite aquifer from the OCS landfill
toward the contaminated private wells to the southwest.
6.3 Geochemical complexities. The WDNR Report identifies several
geochemical lines of evidence that are interpreted as suggesting a natural rather than coal
ash source for the molybdenum in private wells. Coal ash chemistry and the
hydrogeochemistry of coal ash leachate interactions with aquifer solids and groundwater
are complex. In the absence of clear, consistent correlations between concentrations of
specific coal ash constituents in leachate and groundwater, concentration relationships
and variations in concentration gradients can be attributed to one of more of the following
factors:
Coal ash chemical heterogeneity. Coal ash has been generated at Oak Creek
Power Plant since 1950 from coal from different locations around the United
States with different ash characteristics.
Variations in the behavior of chemical species with respect to mobility in
groundwater and tendency to sorb on aquifer solids caused by changes in pH, eH,
solubility and mineralogy of aquifer solids.
Heterogeneity in the geochemistry of aquifer solids.
Heterogeneity in the hydraulic conductivity of the subsurface.
The following specific geochemical lines of evidence are contained in the WDNR
Report:
Molybdenum concentration gradients seen between We Energies site monitoring
well and molybdenum affected private wells appear very different from
molybdenum concentration gradients seen between monitoring wells and affected
private wells at other ash landfills that are known to be causing groundwater
contamination. [WDNR Natural#3].
The point appears to be referring to the molybdenum-contaminated wells that are more
distant from the Oak Creek ash landfills. As noted in Section 5.1 the contamination in
these wells can be explained by localized placement of coal ash.

26
Two We Energies site monitoring wells with very high boron levels show low
levels of molybdenum. [WDNR Natural#4].
This can be explained by variability in the leachate from different coal ash landfills. For
example, leachate from the Oak Creek North landfill has very high levels of boron
(21,800 ug/L) and relatively low concentrations of molybdenum (1,650 ug/L) compared
to the other ash landfills. In contrast, the Oak Creek South landfill has high
concentrations of both molybdenum and boron (9,750 to 16,700 ug/L and 6,490 to 13,700
ug/L respectively—Lourigan and Phelps, 2013, Table 9).
Groundwater monitoring at known coal ash affected sites typically shows elevated
levels of boron and sulfate associated with elevated molybdenum levels. The
boron and sulfate concentrations in the private wells in the study area, [are]
generally are within background concentrations. [WDNR Natural#6].
Boron concentrations in private wells are discussed in more detail in Section 5.3 and
Appendix A. The highest sulfate concentrations in coal ash leachate (16,700 ug/L) are
from the Oak Creek North landfill, which has not been suggested as a source for the
contaminated private wells. Sulfate concentrations in leachate from the Oak Creek South
landfill are much lower (1,130 to 1,720 ug/L). It is worth noting that sulfate
concentrations in background monitoring well MW16 (We Energy MW44) are only 16.6
ug/L. In contrast private wells in the Douglas Avenue cluster (Mo1, PW07 and PW07-
PW011) range from 49.7 to 222 ug/L suggesting coal ash as a source. The highest
concentrations of sulfate are in PW12 (300 ug/L) in the Michna Avenue cluster which
also has a known local source of coal ash nearby.
There is an absence of vertical concentration reductions in the nested wells that
we would expect from a contaminant with a surface source, and of significant
concentration gradients between the proximal We Energies monitoring wells and
more distal private wells. A private well five miles to the southwest (PW-18) has
the second highest molybdenum concentration found in private wells, while some
closer private wells have a much lower molybdenum concentrations. [WDNR
Natural#9].
There is a high vertical concentration gradient between coal ash leachate in the unlined
Oak Creek South landfill and the Intermediate Sand Layer and Dolomite aquifer in the
vicinity of the Douglas Avenue private well cluster. The overall low permeability of the
clayey glacial till below the ash landfill means that relatively small amounts of the
concentrated leachate migrate through vertical fractures in the till and are diluted in the
groundwater that was present before the ash landfill was created.
PW18 not only has the second highest concentration of molybdenum in the private wells
sampled, but also the second highest concentration of sulfate (255 ug/L—the highest is in
PW12 with a known localized source of coal ash) and 582 ug/L boron, all pointing to a
localized source of coal ash for this well.

27
The close correlation with other coal ash contaminants (boron, sulfate) we would
expect from a coal ash source are absent in this case. [WDNR Natural#10].
To the contrary, as noted above, there appears to be a correlation between elevated boron
and sulfate in private molybdenum-contaminated wells compared to natural background
reflected in monitoring well MW16 (We Energy MW44).
7.0 Conceptual Model for Private Well Contamination: Sources for Specific Private
Well Clusters
The overall conceptual model can be applied more specifically to the clusters of
molybdenum -contaminated wells as follows:
Douglas Avenue and Botting Avenue Private Well Clusters (Mo1 and Mo2 in
Figures 1 and 5). The unlined Oak Creek South (OCS) ash landfill and areas
where coal ash was deposited in the area of the Caledonia ash landfill prior to
development of the lined landfill are the likely sources.
Foley Road Private Well Cluster (Mo3 on Figures 1 and 5). RMT (2011)
suggested that molybdenum contamination in this cluster might come from the
OCS landfill, but not enough hydrogeologic data were found during the
preparation of this report to make a strong case for the OCS landfill as the main
source. Roads in this area were completed in 1977. If more detailed
hydrogeologic data are not able to confirm OCS landfill as the source, an as yet
undocumented local coal ash source placed prior to 1977 is likely.
County Line Road Private Well Cluster (Mo4 on Figure 1). One possible coal ash
source for these wells is the use of coal ash as backfill in the trench for the sewer
line that runs along County Line Road. Other as yet undocumented coal ash
source may be possible as well.
Michna Road Private Well Cluster (Mo5 on Figure 1; see also Figure 4). The
high concentrations of boron (1,130 to 1,720 ug/L) in two wells and high
molybdenum in one of these wells (44 ug/L) on Michna Road can be attributed to
placement of coal ash in a low-lying wetland area in the 1960s.
Other Isolated Private Wells (Figure 3). Other private wells with high
molybdenum levels are scattered throughout the Town of Caledonia within a six
mile radius of Oak Creek Power Plant. The most distant molybdenum-
contaminated well (PW18) also has significantly elevated boron and sulfate
pointing to coal ash as the source. In the absence of convincing evidence that
molybdenum, boron and sulfate come from a natural source, given the very
common association of these three constituents in coal ash leachate, a rebuttable
presumption is that molybdenum in this well and other wells in this category are
coming from as yet undocumented local placement of coal ash.

28
8.0 References
Alberta Health and Wellness. 2000. Arsenic in Groundwater from Domestic Wells in
Three Areas of Northern Alberta, CA. [Lourigan and Phelps (2013) reference 36]
Ayotte, Joseph D. and Gronberg, Jo Ann M., and Apodaca, Lori E. 2011. Trace Elements
and Radon in Groundwater Across the United States, 1992-2003. U.S. Geological
Survey. Scientific Investigations Report 2011-5059. [Lourigan and Phelps (2013)
reference 31]
Bayless, Randall E. and Greeman, Theodore K. and Harvey, Colin. 1998. Hydrology and
Geochmistry of a Slag-Affected Aquifer and Chemical Characteristics of Slag-Affected
Ground Water, Northwestern Indiana and Northeastern Illinois. U.S. Geological Survey
Water Resources Report 97-4198. [Lourigan and Phelps (2013) reference 64]
Buszka, Paul M., Fitzpatrick, John and Watson, Lee R. and Kay, Robert T. 2007.
Evaluation of Ground-Water and Boron Sources by Use of Boron Stable-Isotope Ratios,
Tritium, and Selected Water Chemistry Constituents near Beverly Shores, Northwestern
Indiana, 2004. U.S. Geological Survey Scientific Investigations Report 2007-5166.
[Lourigan and Phelps (2013) reference 9]
Boulding, Russell. 2010. Analysis of EPA and EIP/Earthjustice Damage Cases: The
Extent of Damage from CCR Disposal is Significant, Pervasive and Growing. Appendix
F1 (Tables in Appendix F4] in Comments of Earthustice, Environmental Integrity
Project, Sierra Club, Natural Resources Defense Council, Southern Alliance for Clean
Energy, Southern Environmental Law Center, Physicians for Social Responsibility, Clean
Air Task Force, Kentucky Resources Council, and Environmental Justice Resource
Center dated November 18, 2010 on U.S. EPA Disposal of Coal Combustion Residuals
From Electric Utilities Proposed Rule, Docket ID No. EPA-HQ-RCRA-2009-0640.
Chappaz, Anthony and Lyons, Timothy W. and Gordon, Gwyneth W. and Anbar, Ariel
D. 2012. Isotopic Fingerprints of Anthropogenic Molybdenum in Lake Sediments.
Environmental Science & Technology 46( 20):10934-10940 [Lourigan and Phelps (2013)
reference 29]
Coplen, T. B. , et. al. 2002. Compilation of Minimum and Maximum Isotope ratios of
Selected Elements in Naturally Occurring Terrestrial materials and Reagents. U.S.
Geological Survey Water-Resources Investigations Report 01-4222. [Lourigan and
Phelps (2013) reference 46]
Eisler, Ronald. 1989. Molybdenum Hazards to Fish, Wildlife and Invertebrates: A
synoptic Review. Patuxant Wildlife Research Center, U.S. Department of Interior, Fish
and Wildlife Service. Laurel, MD. [Lourigan and Phelps (2013) reference 30]
Environmental Integrity Project and Earthjustice (EIP&EJ). 2010. Out of Control:
Mounting Damage from Coal Ash Waste Sites. February 24, 2010.

29
Environmental Integrity Project, Earthjustice and Sierra Club (EIP et al). 2010. In
Harm’s Way: lack of Federal Coal Ash Regulations Endangers Americans and Their
Environment-Thirty-nine New Damage Cases of Contamination from Improperly
Disposed Coal Combustion Waste. August 26, 2010.
Gordon, Gwyneth W. 2012. Mo Isotope Analyses of Samples from the Wisconsin
Department of Natural Resources. Technical Report Arizona State Earth and Space
Exploration Laboratory, Tempe, AZ, November, 2012. [Lourigan and Phelps (2013)
reference 51]
Hem, John D. 1989. Investigation Study and Interpretation of the Chemical
Characteristics of Natural Water. United States Geological Survey Water-Supply Paper
2254. Third Edition. [Lourigan and Phelps (2013) reference 11]
Lourigan, Joe and William Phelps. 2013. Caledonia Groundwater Molybdenum
Investigation Southeast Wisconsin. Wisconsin Department of Natural Resources Report
PUB-WA 1625. Available from: http://dnr.wi.gov/topic/Groundwater/molybdenum.html
Natural Resource Technology (NRT). 2010a. Investigation Plan Summary Analysis
Dolomite Aquifer Groundwater Quality Evaluation Oak Creek Power Plant. Prepared for
We Energies March 30, 2010.
Natural Resource Technology (NRT). 2010b. Review of Analytical Results from New
Sample Points: Dolomite Aquifer Groundwater Quality Evaluation, Oak Creek Power
Plant. Technical Memorandum prepared for We Energies. August 11, 2010. [Lourigan
and Phelps (2013) reference 39]
Natural Resource Technology (NRT). 2010c. Oak Creek South Landfill Exceedance
Report, October, 2010 . Letter and Exceedance Table sent to WDNR, November 19,
2010.
Natural Resource Technology (NRT). 2010d. Response to Statements by Environmental
Integrity Project Regarding the Oak Creek Power Plant in the Report “In Harm’s Way:
Lack of Federal Coal Ash Regulations Endangers Americans and Their Environment.
Technical Memorandum. prepared for We Energies, November 30, 2010. [Lourigan and
Phelps (2013) reference 75]
Natural Resource Technology (NRT). 2011a. Sampling Plan for Private Wells on North
Michna Road. Technical Memorandum prepared for We Energies, January 19, 2011.
[Lourigan and Phelps (2013) reference 76—not included in disk of files from WDNR]
Natural Resource Technology (NRT). 2011b. Comments on DNR email of 12.2.2010
Providing Results of Wisconsin Department of Health Services Samples Near the Oak
Creek Power Plant. Technical Memorandum prepared for We Energies, February 8,
2011.

30
Natural Resource Technology (NRT). 2011c. Results of Private Well Sampling and
Recommendations for Additional Groundwater Monitoring South of the Oak Creek
Power Plant in the Vicinity of Michna Road. Technical Memorandum prepared for We
Energies, May 19, 2011. [Lourigan and Phelps (2013) reference 78]
Natural Resource Technology (NRT). 2011d. Commentary and Response to Technical
Memorandum Prepared by RMT, Hunts Site, Dated April 13, 2011.Letter prepared for
We Energies. June 3, 2011. [Lourigan and Phelps (2013) reference 77]
Natural Resource Technology (NRT). 2012a. Results of Residential Well and Monitoring
Well Sampling South of Oak Creek Power Plant in the Vicinity of Michna Road.
Technical Memorandum prepared for We Energies, June 27, 2012. [Lourigan and Phelps
(2013) reference 69]
Natural Resource Technology (NRT). 2012b. Groundwater Elevation and Inferences for
Flow, Intermediate Sand Unit, Oak Creek Power Plant South Landfill. Technical
Memorandum prepared for We Energies, September 20, 2012. [Lourigan and Phelps
(2013) reference 60]
Natural Resource Technology (NRT). 2012c. Fall 2012 Intermediate Sand Field
Investigation and Results, Oak Creek South and Caledonia Ash Landfills, Oak Creek
Power Plant. Technical Memorandum prepared for We Energies,
December 3, 2012. [Not cited in Lourigan and Phelps, 2013]
Natural Resource Technology (NRT). 2013. Technical Review: Caledonia Groundwater
Molybdenum Investigation, Southeast Wisconsin, Wisconsin Department of Natural
Resources Publications WA 1625. Memorandum prepared for We Energies, February 8,
2013.
Ruhl, Laura. 2012. Boron and Strontium Isotopic Characterization of Coal Combustion
Residuals: Validation of Novel Environmental Tracers. Paper No. 30616-208920.
Presented at Geological Society of America Annual Meeting and Expositionm Charlotte,
NC, 4-7 November. [Lourigan and Phelps (2013) reference 45]
Ruhl, Laura S. and Vengosh, Avner and Dwyer, Gary S.and Hsu-Kim, Heileen and
Deonarine, Amrika. 2011. A Twenty-Month Geochemical and Isotopic Investigation into
Environmental Impacts of the 2008 TVA Coal Ash Spill, – May. Presented at World of
Coal Ash (WOCA) Conference, Denver, CO - May 9-12, 2011. [Lourigan and Phelps
(2013) reference 44]
RMT, Inc. 2011. Hunt’s Site (Re: Molybdenum in Groundwater). Technical
Memorandum prepared for the Hunts Site Remediation Group. April 13, 2011. [Lourigan
and Phelps (2013) reference 59]

31
Schleyer, Ruprecht, Helmut Kerndorff, and Gerald Milde. 1992. Detection and
Evaluation of Groundwater Contamination Caused by Waste Sites. In: Suzanne Lesage
and Richard E. Jackson (eds.) Groundwater Contamination and Analysis at Hazardous
Waste Sites, CRC Press, pp 273-291.
Simpkins, William W., Bradbury, Kenneth R. and Mickelson, D.M. 1989. Methods for
Evaluating Large-Scale Heterogeneity in Fine-Grained Glacial Sediment: In: Molz, F.J.,
Melville, J.G., and Guven, O., Proceedings of the Conference on New Field Techniques
for Quantifying the Physical and Chemical Properties of Aquifers., pp. 53-75. [Lourigan
and Phelps (2013) reference 61]
Thomas, Mary Ann and Schuman, Thomas L. and Pletsch, Bruce A. 2005. Arsenic in
Groundwater in Selected Parts of Southwestern Ohio, 2002-03. U.S. Geological Survey,
U.S. Scientific Investigations Report 2005-5138. [Lourigan and Phelps (2013) reference
34]
United States Geological Survey (USGS). 2004. Resources on Isotopes – Periodic
Table-Strontium. [Online] http://wwwrcamnl.wr.usgs.gov/isoig/period/sr_iig.html.
[Lourigan and Phelps (2013) reference 47]
Uri, Ryb, et al. 2009. Large Molybdenum Isotope Variations Trace Subsurface Fluid
Migration Along the Dead Sea Transform. Geology 37(5):463-266. [Lourigan and
Phelps (2013) reference 52]
Warner, Kelly L. 2001. Arsenic in Glacial Drift Aquifers and the Implication for
Drinking Water–Lower Illinois River Basin. Groundwater. 39(3):433-442. [Lourigan and
Phelps (2013) reference 35]
We Energies. 2013. Comments on the January 2013 DNR Report - Caledonia
Groundwater Molybdenum Investigation, Southeast Wisconsin, PUB-WA 1625
Letter to WDNR, February 18, 2013.
Wisconsin Department of Natural Resources. 2006. Second Five-Year Review Report,
Hunts Disposal Landfill, Caledonia, Wisconsin: U.S. EPA ID No. WID980511919.
prepared for U.S. EPA Region 5. September, 2006.
Zillmer, Michael and Fauble, Philip. n.d. Groundwater Impacts from Coal Combustion
Ash Disposal Sites in Wisconsin. Wisconsin Department of Natural Resources Waste and
Materials Management Program. Technical Report. [Lourigan and Phelps (2013)
reference 8]

A-1
Appendix A.
Critique of WDNR Interpretation of Boron and Strontium Isotope Data
This Appendix provides a detailed critique of the following conclusion in the WDNR
report:
The boron and strontium isotope data do not appear to support coal ash as a
source of the boron in most of the private wells. Some of the boron that was found
in the monitoring wells, and most of the boron found in private water supply wells
appears to be naturally occurring, based on boron/strontium isotope analysis.
[WDNR Natural#2b].
Background
The WDNR report summarizes well the rationale for measuring stable boron isotopes to
differentiate boron in coal ash from other sources (Lourigan and Phelps, 2013, p. 30):
Boron has two stable isotopes. They are Boron-10 (10B) and Boron-11 (11B).
Boron-10 has 5 protons and 5 neutrons and Boron-11 has 5 protons and 6
neutrons. The delta value for 11B/10B can be written as δ11Β. The environmental
abundance of 11B is approximately 80.1 % of all boron and the abundance of 10B
is approximately 19.9 %. [Buszka et al (2007)]. The stable isotope ratio of boron
in coal ash and coal ash leachate can vary significantly from the boron ratio
found in naturally occurring groundwater. Stable boron isotope ratios have been
used in previous studies as an indicator of the source of boron found in the
environment around coal ash disposal sites. Published studies have found δ11Β
values between -40 0/00 and +6.6 0/00 in coal ash samples. [Buszka et al (2007),
Ruhl (2012) & Ruhl et al (2011)] Studies have found that most natural waters
have a δ11Β value between +10 and +30 0/00. [Buszka et al (2007), Ruhl (2012) &
Ruhl et al (2011)]. Possible fractionation of boron isotopes by 30 to 40, caused
by preferential adsorption of 10B in dissolved boron to clay minerals, has been
noted in the literature. [Coplen et al (2002)] [Boldface added]
The WDNR report also summarizes the rationale for measuring stable strontium isotopes
to differentiate strontium in coal ash from other sources (Lourigan and Phelps, 2013, p.
30):
Strontium can be found in coal ash and in naturally occurring minerals such as
sphalerite. Strontium has four stable isotopes. They are 84Sr, 86Sr, 87Sr and 88Sr.
The environmental abundance of these strontium isotopes out of all strontium is
as follows: 84Sr (0.56%), 86Sr (9.86%), 87Sr (7.0 %) and 88Sr (82.58%). [USGS,
(2004)] The ratio of 87Sr/86Sr is what is commonly used in geologic investigations.
Past studies have found 87Sr/86Sr values for coal ash in the range of 0.71091 to
0.71169 and 87Sr/86Sr values in naturally occurring groundwater in the range of
0.708 to 0.709. [USGS (2004))]

A-2
General Observations about Other Boron and Strontium Isotope Studies
Use of boron and strontium stable-isotope ratios to differentiate boron contamination
from coal ash and other sources of boron in groundwater is a relatively new method that
has not been widely applied. It was first reported by Buszka et al (2007) for the Beverly
Shores area in northwestern Indiana where the coal-ash contaminated Yard 520
Superfund Site has wells with exceptionally high levels of boron (15,700 to 24,400 ug/L).
Researchers at Duke University have used this approach to assess the impact of the 2008
TVA coal spill on surface water (Ruhl et al, 2011). Ruhl (2012) characterizes the Duke
University research as “novel.” The results of this study are less directly applicable to
assessing boron contamination in private wells in Wisconsin. Before examining the
WDNR data in detail, the following general observations are in order:
The method has not been widely tested, suggesting that this line of evidence
should be considered secondary, rather the primary as WDNR has done.
The internal consistency of the WDNR data is more important than comparing
boron and strontium stable-isotope with values published in the literature.
Detailed Review of the WDNR Boron and Strontium Stable Isotope Data
Figure A.1 shows a plot of strontium vs boron isotope ratios by sampling type. In this
plot WDNR has separated public wells and monitoring wells into two main categories:
Private wells and monitoring wells with δ11Β values above +15 are considered not
affected by coal ash (upper left in Figure A.1)
In the middle of the plot is a hypothetical mixing zone where naturally occurring
boron in groundwater has mixed with boron from coal ash (shaded area on the
plot).
Coal leachate and coal ash samples lie below and to the right of the hypothetical
mixing zone.
Based on published stable isotope values in the literature the above interpretation seems
reasonable. However, a more detailed evaluation of the data calls this interpretation
seriously into question. Figure A.1 has been modified to show the following additional
data: 1) boron concentrations in coal ash leachate (the other values plotted as diamonds
are for samples of coal ash, not leachate), 2) plots of contaminated wells in Yard 520
northwestern Indiana with boron concentrations reported in Buszka et al (2007), 3) boron
concentrations in monitoring wells that exceed 1,000 ug/L, and the location of MW12 on
the plot which is discussed further below.

A-3
Figure A.1 Plot of strontium vs boron isotopes for each sampling type in WDNR study area (modified from Figure 1, Lourigan and Phelps, 2012). All units ug/L.
Before examining the isotope data in more detail it is worth repeating the information on
natural background levels in groundwater in the U.S. (Section 5.3):
In more than 1,900 groundwater samples in the humid eastern U.S. analyzed as
part of the National Water-Quality Assessment Program, the 90th
percentile
concentration was 160 ug/L for boron (Ayotte et al, 2011, Table 5). This finding
is consistent with the observations by Schleyer et al (1992) that boron
concentrations <200 ug/L are an indication of natural background in groundwater
and concentrations >500 ug/L are a clear indication of groundwater influenced by
leachate.
In glacial aquifers only 1.1% of samples exceeded the benchmark of 1,000 ug/L
(Ayotte ete al, 2011, Table 10). There were no samples in the dataset for boron in
carbonate aquifers.
None of the 24 private wells sampled in the WDNR study had less than 200 ug/L
of boron and eleven (45.6%) had concentrations greater than 500 ug/L, a clear
indication of groundwater affected by leachate.
Multiple lines of evidence suggest that the general guidelines for differentiating boron in
coal ash from natural sources in groundwater using boron and strontium stable isotope
ratios are not valid in the study area. These include:
Three of the four highly contaminated wells at the Yard 520 Superfund site in
Indiana plot within the “mixing zone” with concentrations of boron ranging from
15,700 to 24,400 ug/L.

A-4
MW06, which has exceptionally high levels of boron (27,400 ug/L) has a δ11Β of
14.25, only slightly less that the cutoff of 15 for “unaffected” groundwater. This
well is located in Till/Clay just below the ash. The Sr 87/86 ratio is 0.70806
which is in the lower range of published values for naturally occurring
groundwater.
MW12, classified as “unaffected,” has 574 ug/L boron (above the leachate-
affected threshold of 500 ug/L) and a δ11Β of 28.47. This well has high levels of
aluminum (336 ug/L, 1.7 times the Wisconsin ES of 200 ug/L). In contrast,
aluminum was only detected in 2 of the 24 private wells sampled with a
maximum value of 57.9 ug/L well below the ES. Other trace elements commonly
associated with coal ash were detected in this well (selenium at 0.254 ug/L and
vanadium at 1.84 ug/L) whereas these elements were not detected in any of the
private wells sampled.
PW12 and PW13 have both the highest boron concentrations of any private well
(1,470 ug/L and 1,740 ug/L respectively) and the highest measured δ11Β in any
well in the study area (29.22 and 28.97 respectively). It makes no sense to call
these wells “unaffected” when a wetland area near these wells was filled in with
coal ash in the mid-1960s.
In summary two different major lines of evidence support a conclusion that elevated/high
concentrations of boron in private wells in the WDNR study area come primarily from
coal ash:
Boron concentrations in molybdenum-contaminated private wells in the Town of
Caledonia range from 303 to 1,740 ug/L, well above normal natural background
levels in groundwater in the U.S. (90th
percentile concentration in humid east of
160 ug/L—Ayotte et al, 2011) and the conclusion of Schleyer et al (1992) that
natural groundwater levels of boron are typically <200 ug/L.
The private wells with the highest δ11Β values (around 29) also have the highest
boron concentrations (1,470 to 1,740 ug/L), with a known source of coal ash fill
nearby. In addition, other clearly ash-affected wells fall within the “unaffected”
zone on Figure A.1, and other highly ash affected groundwater occurs throughout
the hypothetical mixing zone.
An interesting research question is: Why does ash-affected groundwater have δ11Β values
that are so much higher than coal ash samples collected from the site (< 0.00) and the
one other site where data are available (δ11Β values in Yard 520 ash-contaminated wells
ranged from 0.1 to 6.6)?
Based on the hydrogeology on the general area several processes may be at work to
explain the high δ11Β values in coal-ash-affected private wells:
Fractionation of boron isotopes has been noted through preferential adsorption of 10B in dissolved boron to clay minerals (Coplen et al, (2002). The conceptual
model for migration of molybdenum and boron from coal ash presented in this
report has groundwater that infiltrates through coal ash migrating through

A-5
fractures in clayey glacial till, providing an opportunity for preferential adsorption
on clay minerals of 10B
The highest δ11Β values are associated with boron in wells PW12 and PW13
where the likely source is coal ash that was used to fill in a wetland area. Wetland
areas are characterized by anoxic conditions which tend to favor mobility of
boron in groundwater (Ayotte et al, 2011, Figure 8), providing an explanation for
the exceptionally high boron concentrations compared to other private wells.
Wetland areas also tend to be high in organic matter which may also
preferentially adsorb 10B in dissolved boron.
References
Ayotte, Joseph D. and Gronberg, Jo Ann M., and Apodaca, Lori E. 2011. Trace Elements
and Radon in Groundwater Across the United States, 1992-2003. U.S. Geological
Survey. Scientific Investigations Report 2011-5059. [Lourigan and Phelps (2013)
reference 31]
Bullen, Thomas D. 2012. e-mail to Joseph Lourigan at the Wisconsin Department of
Natural Resources. October 26, 2012. [Lourigan and Phelps (2013) reference 50]
Buszka, Paul M., Fitzpatrick, John and Watson, Lee R. and Kay, Robert T. 2007.
Evaluation of Ground-Water and Boron Sources by Use of Boron Stable-Isotope Ratios,
Tritium, and Selected Water Chemistry Constituents near Beverly Shores, Northwestern
Indiana, 2004. U.S. Geological Survey Scientific Investigations Report 2007-5166.
[Lourigan and Phelps (2013) reference 9]
Coplen, T. B. , et. al. 2002. Compilation of Minimum and Maximum Isotope ratios of
Selected Elements in Naturally Occurring Terrestrial materials and Reagents. U.S.
Geological Survey Water-Resources Investigations Report 01-4222. [Lourigan and
Phelps (2013) reference 46]
Lourigan, Joe and William Phelps. 2013. Caledonia Groundwater Molybdenum
Investigation Southeast Wisconsin. Wisconsin Department of Natural Resources Report
PUB-WA 1625. Available from: http://dnr.wi.gov/topic/Groundwater/molybdenum.html
Ruhl, Laura. 2012. Boron and Strontium Isotopic Characterization of Coal Combustion
Residuals: Validation of Novel Environmental Tracers. Paper No. 30616-208920.
Presented at Geological Society of America Annual Meeting and Expositionm Charlotte,
NC, 4-7 November. [Lourigan and Phelps (2013) reference 45]
Ruhl, Laura S. and Vengosh, Avner and Dwyer, Gary S.and Hsu-Kim, Heileen and
Deonarine, Amrika. 2011. A Twenty-Month Geochemical and Isotopic Investigation into
Environmental Impacts of the 2008 TVA Coal Ash Spill, – May. Presented at World of
Coal Ash (WOCA) Conference, Denver, CO - May 9-12, 2011. [Lourigan and Phelps
(2013) reference 44]
Related Documents


