Cene Bavec • On the creative climate and innovativeness at the country level Zb. rad. Ekon. fak. Rij. • 2009 • vol. 27 • sv. 1 • 9-30 9 Original scientific paper UDC 159.954 : 001.895(061.1) On the creative climate and innovativeness at the country level * Cene Bavec 1 Abstract The paper presents an explorative study on creative climate and innovativeness at the county level in the EU27. We explored a possibility to extend the Ekvall’s con- cept of creative climate for innovativeness from the level of individual organization to the national level. The main research goal was to identify fragments of national creative climate and to prove its relation to innovativeness. As the measurement for national innovativeness we took the Summary Innovation Index. The fragments of national creative climate were identified by 25 questions and answers selected from different public opinion polls published in the Eurobarometers. Using hierar- chical clustering we clustered all EU member states and compared them with the clusters that identify Innovation Leaders, Innovation Followers, Moderate Innova- tors, and Catching-up countries. We found membership of both sets of clusters similar, which means that two essentially different sets of variables arriving from two completely different sources led to comparable result. We also identify top ten variables that contributed the most to distingnishing between Creative climate clusters. Finally, we argued that understanding creative or innovative climate in the EU countries is an important national policy-making tool that could comple- ment hard macro-economic indicators that are focused on innovative performance only, and not also on innovative socio-cultural environment. We wished-for a uni- fied approach in the EU to develop an objective measurement for creative climate at country level. We also discussed some research challenges linked to this idea. Key words: summary innovation index (SII), national innovation performance, creative climate, Ekvall’s dimensions, EU member states JEL classification: A13, C12, O31 * Received: 01-02-2009; accepted: 19-06-2009 1 Associate Professor, University of Primorska, Faculty of Management Koper, Cankarjeva 5, Koper, Slovenia. Scientific affiliation: information technology management, management and organization theory, technology foresights and policies. Phone: +386 5 610 2000. Fax: +386 5 610 2039. E-mail: [email protected]. Personal website: www2.arnes.si/~bavec

Welcome message from author
This document is posted to help you gain knowledge. Please leave a comment to let me know what you think about it! Share it to your friends and learn new things together.
Transcript
Cene Bavec • On the creative climate and innovativeness at the country level Zb. rad. Ekon. fak. Rij. • 2009 • vol. 27 • sv. 1 • 9-30 9
Original scientifi c paperUDC 159.954 : 001.895(061.1)
On the creative climate and innovativeness at the country level*
Cene Bavec1
Abstract
The paper presents an explorative study on creative climate and innovativeness at the county level in the EU27. We explored a possibility to extend the Ekvall’s con-cept of creative climate for innovativeness from the level of individual organization to the national level. The main research goal was to identify fragments of national creative climate and to prove its relation to innovativeness. As the measurement for national innovativeness we took the Summary Innovation Index. The fragments of national creative climate were identifi ed by 25 questions and answers selected from different public opinion polls published in the Eurobarometers. Using hierar-chical clustering we clustered all EU member states and compared them with the clusters that identify Innovation Leaders, Innovation Followers, Moderate Innova-tors, and Catching-up countries. We found membership of both sets of clusters similar, which means that two essentially different sets of variables arriving from two completely different sources led to comparable result. We also identify top ten variables that contributed the most to distingnishing between Creative climate clusters. Finally, we argued that understanding creative or innovative climate in the EU countries is an important national policy-making tool that could comple-ment hard macro-economic indicators that are focused on innovative performance only, and not also on innovative socio-cultural environment. We wished-for a uni-fi ed approach in the EU to develop an objective measurement for creative climate at country level. We also discussed some research challenges linked to this idea.
Key words: summary innovation index (SII), national innovation performance, creative climate, Ekvall’s dimensions, EU member states
JEL classifi cation: A13, C12, O31
* Received: 01-02-2009; accepted: 19-06-20091 Associate Professor, University of Primorska, Faculty of Management Koper, Cankarjeva 5,
Koper, Slovenia. Scientifi c affi liation: information technology management, management and organization theory, technology foresights and policies. Phone: +386 5 610 2000. Fax: +386 5 610 2039. E-mail: [email protected]. Personal website: www2.arnes.si/~bavec
Cene Bavec • On the creative climate and innovativeness at the country level 10 Zb. rad. Ekon. fak. Rij. • 2009 • vol. 27 • sv. 1 • 9-30
1. Introduction
The relation between innovativeness and organizational climate is an attention grabbing issue among practitioners and researchers. Regardless of different methodological approaches and research goals studies proved that encouraging climate signifi cantly infl uence innovativeness in the organization (Danegan at al., 1992, Zain and Rickards, 1996, Hofstede, 1998, Montes at al., 2004, Ismail, 2005). Consequently, there is an interesting question if we can create a positive atmosphere for innovativeness also at national level. We would intuitively accept this idea because national economies or society are just organizations on higher hierarchical level. Many studies focused on different aspects of national social and cultural environment ant its impact on organizations and their economic effi ciency (Pothukuchi at al., 2002, Deshpandé and Farley, 2003, Bavec, 2007). Some indirectly related works are dealing with social capital and its infl uence on economic development (Putnam, 1993, Halman, 2001, Francois and Zabojnik, 2005). However, these concepts are not fully overlapping with the concept of creative climate so they need some further explorations.
Our research interest was focused on two very general questions:
Can we extend already proven and successful concepts of organizational • innovativeness and climate from the level of a single organization to the national or regional level?
Can we identify at least fragments of national creative or innovative climate • that have a positive effect on innovativeness at the national levels?
Innovativeness alone is widely explored topic for decades (Damanpour, 1992, Mumford and Hunter, 2005, Likar at. al, 2008). On the other side the innovative or creative climate has extensively been studied just in the last ten or fi fteen years. Particularly Ekvall’s (1996) work on creative climate initiated lots of research on the innovative environment in the organization (Isaksen at al, 2001b, Susanj, 2000, Mathisen and Einarsen, 2004). Ekvall defi ned the climate as “the observed and recurring patterns of behavior, attitudes, and feeling that characterize life in organization”. He proved that his approach to the climate measurement clearly differentiate the innovative and stagnated organizations. However, these researches and developed models were applied only at the level of an individual organization.
Less attention has been devoted to the related issue of creative climate and innovativeness at national or regional levels. The rationale behind this subject is well known fact that social and cultural environment in which particular organization operates signifi cantly infl uence its organizational culture and consequently its organizational climate. Multinational companies were among the fi rst that met the challenge of innovating in different social and cultural environments (Whitley,
Cene Bavec • On the creative climate and innovativeness at the country level Zb. rad. Ekon. fak. Rij. • 2009 • vol. 27 • sv. 1 • 9-30 11
2000, Lam, 2006), particularly the companies that used their subsidiaries across the globe as an important source of innovation. Quite pragmatically, they realized that they had to employ different managerial and organizational strategies in different environments. For them, it was quite obvious that their management can infl uence and stimulate just a part of organizational climate. The other part is more or less implanted from the environment in which organizations operate.
Illustrative is the study of innovativeness of two subsidiaries of a German multinational company operating in Germany and Malaysia (Mohd Nazri Khan, 2002, Zain at al., 2003). It was based on Ekvall’s (1996) ten dimensions of creative climate and the Creative Climate Questionnaire (Ekvall at al, 1983). Both subsidiaries were part of the same company with the same organizational and managerial rules, so we could rationally expect similar behavior. However, the fact that the subsidiaries operated in different national and cultural environments led to the signifi cantly different results. The subsidiary in Germany was better than Malaysian in all aspects that stimulates creative climate and innovativeness. Research proved that social and cultural surrounding of the companies played the decisive role in their in-house innovativeness. Many other researches led to similar conclusions. Westwood and Low (2003) came to the conclusion that culture can and does have impact on creative and innovation processes. However, the interplay between cultural values and creativity should not be considered universalistically, simplistically or unrefl exively. Societies are much more complex organizations than individual businesses or governments, and hence, the concept of climate has to be signifi cantly more complex and diffi cult to interpret.
The concept of national climates and innovativeness exposes a lot of new research challenges. Just to mention an objective defi nitions and measurement of national innovativeness and national creative climate. For example, Florida and Tinagli (2004) introduced the 3Ts (Technology, Talent and Tolerance) indicator and a single Euro-Creativity Index. They overlap to some extent with the creative climate. However, we cannot interchange these concepts. Some research deals with isolated aspects of national creative climate and innovativeness; however there are no researches at national levels that can be compared with Ekvall’s and other studies of creative climate and innovativeness at the level of individual organization. We can argue that the issue of the creative climate at a national level is just initially touched by researchers.
On the other hand, there are studies on national innovativeness as an independent national attribute. Lee (1990) defi ned national innovativeness by four variables: GNP per capita, literacy rate, the ratio of manufacturing and service sectors to total GNP, and number of scientists and engineers per population. It is obviously oversimplifi ed perception of innovativeness, so others opted for other defi nitions (Kashifa and Hessels, 2007). A similar concept has been developed by Furman at al. (2002). They introduced the National innovation capacity as “the ability of a
Cene Bavec • On the creative climate and innovativeness at the country level 12 Zb. rad. Ekon. fak. Rij. • 2009 • vol. 27 • sv. 1 • 9-30
country to produce and commercialize a fl ow of innovative technology over the long term”. By their defi nition the national innovative capacity depends on the strength of a nation’s common innovation infrastructure, the environment for innovation in a nation’s industrial clusters, and the strength of linkages between these two. The model was tested on the segment of national patenting. However, the concept focuses intensively on industrial innovations with a limited value for more general perception of innovativeness.
Widely accepted and exploited concept of national innovativeness was developed under the patronage of the European Commission. The European Innovation Scoreboard - EIS (European Commission, 2008) publishes annually a comparative assessment of the innovation performance of all EU27 member states, as well as some other countries. The EIS includes the Summary Innovation Index (SII) that gives an overview of aggregate national innovation performance. The SII is a comprehensive index combining 25 indicators grouped into fi ve categories: Innovation Drivers, Knowledge Creation, Innovation & Entrepreneurship, Applications, and Intellectual Property.
In our research we pragmatically used the SII as a measurement for national innovativeness, understanding that this indicator focused on national innovative performance and not on innovativeness as the state of the mind. But, currently this is the only annually updated and comprehensive indication of innovativeness for all EU countries.
2. Research questions and hypothesis
If we accept the relevance of creative climate for innovativeness at the level of an individual organization than we could reasonably imagine something as national creative climate that would power national innovativeness. To elaborate research questions that we presented in the introduction we implemented desk research based on already collected and publicly available data for EU27 countries. To initiate any data collection in EU countries exceeded the potential of our research group. We also believed that available data are suffi cient to prove the hypothesis in the exploratory phase of our research.
The Summary Innovation Index (SII) is an aggregate index based on data from national statistics. It primarily refl ects national performance and structural indicators. As such, it does not indicate national innovation climate. Of course, some would argue that the climate is refl ected in the innovation performance. However, Ekvall (1996) and other authors treated the climate as an independent attribute of organizations that describes behavior and life in organization. Innovativeness is just one of the consequences of the climate.
Cene Bavec • On the creative climate and innovativeness at the country level Zb. rad. Ekon. fak. Rij. • 2009 • vol. 27 • sv. 1 • 9-30 13
Organizational culture and climate are two different concepts; however some of the variables from both set could be equal or similar. It means that the concepts are partially overlapping. To make this distinction clear let’s look closer at the Ekvall’s (1996) ten dimensions of the creative climate:
Challenge (How emotionally involved, and committed are employees to the 1. work).Freedom (How free employees are to decide how to do their job).2. Idea time (The amount of time employees have to elaborate ideas).3. Trust and openness (Do employees feel safe speaking their minds and offering 4. different points of view).Dynamism (The eventfulness of life in the organization).5. Playfulness (How relaxed is the workplace).6. Debates (To what degree do people engage in lively debates about the issues) 7. Confl icts (To what degree do people engage in interpersonal confl icts).8. Risk-taking (The promptness of response to emerging opportunities and fear 9. of failure).Idea support (Are there resources to give new ideas a try).10.
Studying these dimensions we spontaneously concluded that many of them could be implemented also at the national level.
We based our search for fragments of national creative climate on Ekvall’s approach. To characterize the creative climate of the particular country or region we could paraphrase Ekvall’s original defi nition that the climate is “the observed and recurring patterns of behavior, attitudes, and feeling that characterize life in organization” just with changing the word organization with nation or country. With this general defi nition we are still far away from any measurable quantities. To defi ne measurable variables Ekvall and other researchers developed the Creative Climate Questionnaire (Ekvall and Arvonen, 1983) or corresponding questionnaires (Mathisen and Einarsen, 2004). In our explorative phase of the research we didn’t have any intention to develop a comprehensive questionnaire suitable for national level. We focused on identifi cation of limited number of variables that could be in the future a part of such questionnaire.
As we already said, we opted for desk research, so we had to fi nd these fragments in already available EU information sources. To be as close to the Ekvall’s methodology as possible we scanned all public opinion polls published in the European Commission’s Eurobarometers. The main reason that we concentrated on the public opinion polls were methodological similarities with the Creative Climate Questionnaire where members of organizations were asked about their perception of different aspects of organizational climate and innovativeness. In the
Cene Bavec • On the creative climate and innovativeness at the country level 14 Zb. rad. Ekon. fak. Rij. • 2009 • vol. 27 • sv. 1 • 9-30
Eurobarometers we can fi nd many researches with individual questions that refl ect some aspects of creativity and Ekvall’s dimensions. We are well aware that with a limited set of variables we cannot completely cover all Ekvall’s dimensions at the country level because only fragments of possible indicators are already collected. However, we strongly believed that even fragments could give an initial indication of national creative climate. We selected 25 questions (Table 1) and answers from four different public opinion polls and conditionally called them the Creative climate variables.
The next research question was: “Is there any relation between the Summary Innovation Index (SII) representing national innovativeness and the selected Creative climate variables in the EU countries?” Looking closer at the questions in the Table 1, we couldn’t be really confi dent that their joint effect will correspond to the SII, at all. We also have to decide, how to prove or reject their relationship with SII.
A common approach would be a factor analysis, calculations of correlations of individual variables with SII, and related statistical tests. However, we have decided to apply different approach. Using cluster analysis should lead to similar results. The rationale behind this decision is the fact that cluster analysis puts into the focus individual samples, their relationship and their grouping (Figure 1). We were interesting exactly in this issue. On the other side, traditional statistical approach focuses more on variables. The second reason for cluster analysis was the fact that the EIS published clustering of EU members states into four distinctive groups of countries representing:
Innovation Leaders, • Innovation Followers, • Moderate Innovators, • Catching-up countries. •
Clusters were calculated on the basis of the SII scores in the last fi ve years. We wanted to compare our results with these clusters. To avoid terminological ambiguities we introduced the term SII Clusters for the clusters from the EIS Report to distinguish them from the Creative climate clusters that are results of our analysis. To enable comparisons between the SII and the Creative climate clusters we followed this methodological course and clustered EU countries by all 25 Creative climate variables. Then, we statistically compared the membership of both sets of clusters and draw required conclusions.
On the basis of presented research questions we set up the following two hypotheses:
Hypothesis 1 - National innovativeness represented by the Summary Innovation Index (SII) is related to the creative climate in the country which means that the SII clusters have similar country membership as the Creative climate clusters.
Cene Bavec • On the creative climate and innovativeness at the country level Zb. rad. Ekon. fak. Rij. • 2009 • vol. 27 • sv. 1 • 9-30 15
Hypothesis 2 – The means of the Summary Innovation Index (SII) in the Creative climate clusters are statistically signifi cantly different, proving that the Climate clusters are differentiated by the level of the SII.
Rationale behind the fi rst hypothesis is based on the assumption that we have two sets of clusters on the same sample of countries. The SII Clusters are grouping countries with similar innovativeness and the Climate clusters countries with similar climate. Because similar climate stimulate a similar innovativeness these clusters should have a comparable membership. This relationship should never be perfect because there are also some other factors that infl uence innovativeness and climate that we haven’t take into account in our research. However, if we proof that the similarity is high we indirectly proved that the climate plays relevant or even decisive role in innovativeness. Rationale behind the second hypothesis is a purely mathematical proof that an average innovativeness in all climate clusters is signifi cantly different.
3. Input data and research methodology
From the Special Eurobarometers we selected four public opinion polls in EU27 countries:
Public perception of job and working environment (European Commission, 1. 2006);Public perception of Science and Technology (European Commission, 2. 2005b);Public attitude towards some cultural and environmental issues (European 3. Commission, 2007);Personal trust (European Commission, 2005a)4.
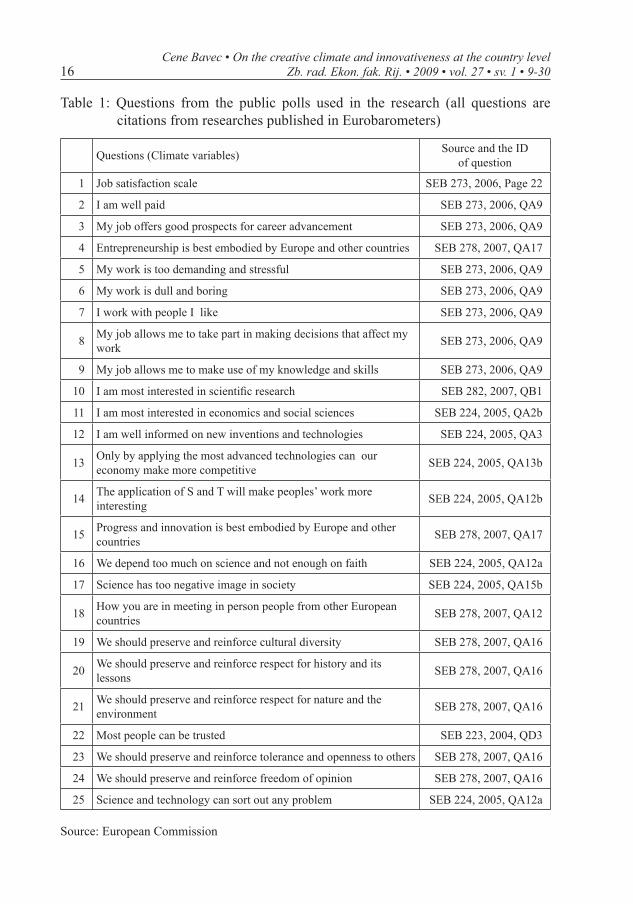
These polls have a large number of questions that are not relevant, or at least not very much by our opinion, for analysis of innovative or creative climate. It means that we had to reduce the number of questions to the total of 25 (Table 1). The selection of these variables was based on purely deductive approach (Ketchen and Shook, 1996). Our main guidance in their selection was anticipation that they are related to Ekvall’s dimensions of creative climate at fi rms’ level, allowing very subjective interpretation of his dimensions at the national level. In the Table 1 we can recognize many Ekvall’s dimensions like Trust and Openness (22 and 23), Freedom (24), Confl icts (19), Dynamism (3 and 4), Challenge (8 and 9), or Playfulness (7). With such a broad interpretation of Ekvall’s dimensions we decided on 25 questions that represented our Climate variables in the further clustering procedures.
Cene Bavec • On the creative climate and innovativeness at the country level 16 Zb. rad. Ekon. fak. Rij. • 2009 • vol. 27 • sv. 1 • 9-30
Table 1: Questions from the public polls used in the research (all questions are citations from researches published in Eurobarometers)
Questions (Climate variables) Source and the ID of question
1 Job satisfaction scale SEB 273, 2006, Page 22
2 I am well paid SEB 273, 2006, QA9
3 My job offers good prospects for career advancement SEB 273, 2006, QA9
4 Entrepreneurship is best embodied by Europe and other countries SEB 278, 2007, QA17
5 My work is too demanding and stressful SEB 273, 2006, QA9
6 My work is dull and boring SEB 273, 2006, QA9
7 I work with people I like SEB 273, 2006, QA9
8 My job allows me to take part in making decisions that affect my work SEB 273, 2006, QA9
9 My job allows me to make use of my knowledge and skills SEB 273, 2006, QA9
10 I am most interested in scientifi c research SEB 282, 2007, QB1
11 I am most interested in economics and social sciences SEB 224, 2005, QA2b
12 I am well informed on new inventions and technologies SEB 224, 2005, QA3
13 Only by applying the most advanced technologies can our economy make more competitive SEB 224, 2005, QA13b
14 The application of S and T will make peoples’ work more interesting SEB 224, 2005, QA12b
15 Progress and innovation is best embodied by Europe and other countries SEB 278, 2007, QA17
16 We depend too much on science and not enough on faith SEB 224, 2005, QA12a
17 Science has too negative image in society SEB 224, 2005, QA15b
18 How you are in meeting in person people from other European countries SEB 278, 2007, QA12
19 We should preserve and reinforce cultural diversity SEB 278, 2007, QA16
20 We should preserve and reinforce respect for history and its lessons SEB 278, 2007, QA16
21 We should preserve and reinforce respect for nature and the environment SEB 278, 2007, QA16
22 Most people can be trusted SEB 223, 2004, QD3
23 We should preserve and reinforce tolerance and openness to others SEB 278, 2007, QA16
24 We should preserve and reinforce freedom of opinion SEB 278, 2007, QA16
25 Science and technology can sort out any problem SEB 224, 2005, QA12a
Source: European Commission
Cene Bavec • On the creative climate and innovativeness at the country level Zb. rad. Ekon. fak. Rij. • 2009 • vol. 27 • sv. 1 • 9-30 17
The EIS shows that the SII clusters have been very stable over the last fi ve years with just few countries transiting from one cluster to another. This stability of the SII clusters justifi es our methodological defi ciency that we used data from public polls in the period from 2005 to 2007 and comparing them with the SII in year 2007. Similar fi ndings are presented in a lot of research on social variables that proved to be quite stable over time. We supposed that the public answers would not noticeably change in the period of three years.
Further research took the following steps:
we clustered EU27 countries into four clusters using Hierarchical and 1. K-Means clustering (in the paper we presented just results of the hierarchical clustering, but it led to very similar results as the K-Mean clustering);
Comparing cluster membership (countries) in the SII clusters with the 2. Creative climate clusters (we calculated the percentage of membership matching between clusters);
Calculating the mean SII for each Creative climate cluster and testing the 3. signifi cance of means differences.
To validate results we used two clustering algorithms Hierarchical and K-Means clustering. On the level of two clusters we got nearly the same result by both methods (cluster membership), yet on the level of four clusters we noticed very similar membership in the clusters 1 and 2 (Figure 1) and some differences in the clusters 3 and 4. When we compared cluster membership of the K-Means clusters with the SII clusters we concluded that they also confi rm both research hypotheses. However, the hierarchical clustering led to statistically more signifi cant proof of the hypothesis. We also preferred to present the hierarchical clustering because the dendrogram (Figure 1) gives us graphical and easy to comprehend presentation of clusters and their sub-clusters. The dendrogram also enable a visual estimation of similarity of individual countries and an insight into their grouping. These characteristics of hierarchical clustering perfectly suited or research intention as we concentrated on samples (countries) rather than variables that describe their properties.
4. Presentation of results
Using the SPSS package we implemented the hierarchical clustering based on the average linkage between groups with the standardized variables (Z-scores) and the Squared Euclidian distance. The result of hierarchical clustering in the form of the dendrogram is presented in the Figure 1.
Cene Bavec • On the creative climate and innovativeness at the country level 18 Zb. rad. Ekon. fak. Rij. • 2009 • vol. 27 • sv. 1 • 9-30
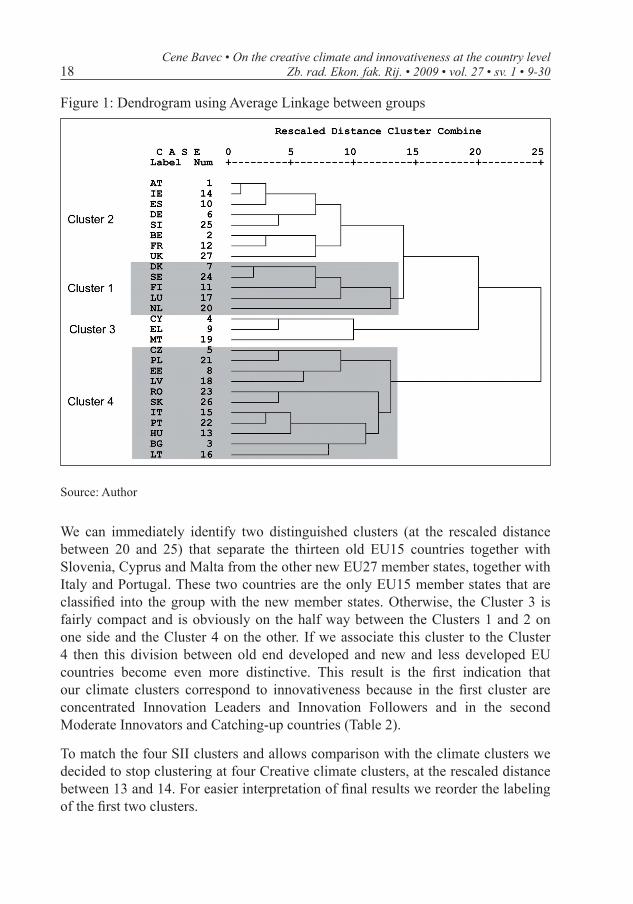
Figure 1: Dendrogram using Average Linkage between groups
Source: Author
We can immediately identify two distinguished clusters (at the rescaled distance between 20 and 25) that separate the thirteen old EU15 countries together with Slovenia, Cyprus and Malta from the other new EU27 member states, together with Italy and Portugal. These two countries are the only EU15 member states that are classifi ed into the group with the new member states. Otherwise, the Cluster 3 is fairly compact and is obviously on the half way between the Clusters 1 and 2 on one side and the Cluster 4 on the other. If we associate this cluster to the Cluster 4 then this division between old end developed and new and less developed EU countries become even more distinctive. This result is the fi rst indication that our climate clusters correspond to innovativeness because in the fi rst cluster are concentrated Innovation Leaders and Innovation Followers and in the second Moderate Innovators and Catching-up countries (Table 2).
To match the four SII clusters and allows comparison with the climate clusters we decided to stop clustering at four Creative climate clusters, at the rescaled distance between 13 and 14. For easier interpretation of fi nal results we reorder the labeling of the fi rst two clusters.
Cene Bavec • On the creative climate and innovativeness at the country level Zb. rad. Ekon. fak. Rij. • 2009 • vol. 27 • sv. 1 • 9-30 19
It is interesting to notice that Nordic countries and Luxembourg are in a separate group (Cluster 1). These countries are also the most innovative European countries showing nearly perfect mach between innovativeness and selected fragments of creative climate. Other most developed and innovative European countries are in the Cluster 2, again indicating strong relation between innovativeness and climate. Surprisingly, Slovenia is the only new EU member state that is classifi ed into this group. Cyprus, Greece and Malta are again group together (Cluster 3) indicating many social and cultural similarities. All other new EU member states are clustered jointly into one group (Cluster 4). Not going into detailed discussion of this cluster we could just bring attention to the sub-cluster with Italy, Portugal and Hungary, again indicating similarities between these countries. Similarly are grouped Czech Republic, Poland and Estonia.
An objective validation of clustering results can be a diffi cult task (Kechen and Shook, 1996), so we use few different methods to assess the results. We have already mentioned two different clustering algorithms: hierarchical and K-means. With Levene’s test we confi rmed the variance homogeneity for all variables, except for the variable 13. It is a precondition for using the ANOVA tests. However, our sample is large enough to anticipate in any case that the sample means will be normally distributed due to the central limit theorem. Results indicated that the model was statistically signifi cant at p<0.05 for all variables except for the variable 15.
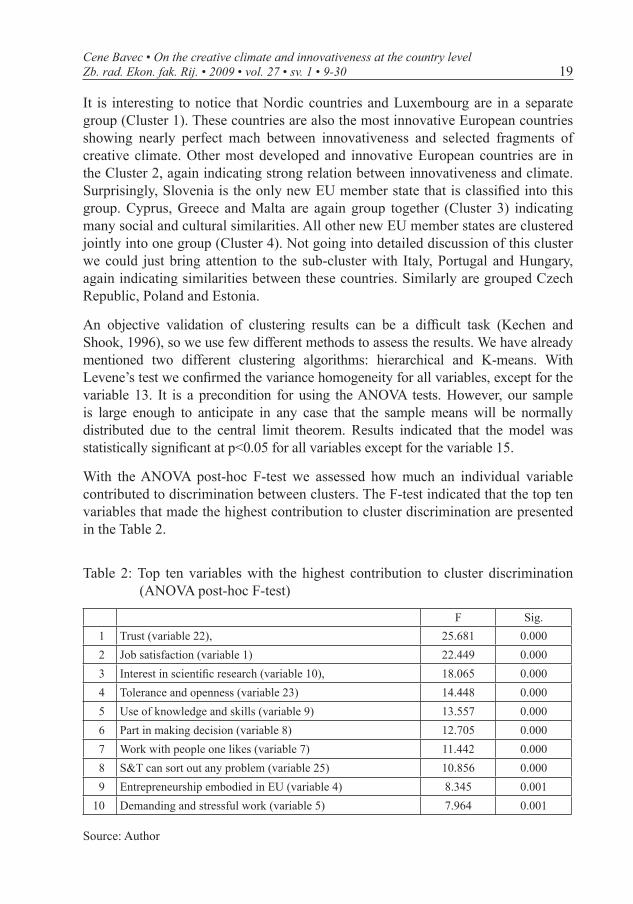
With the ANOVA post-hoc F-test we assessed how much an individual variable contributed to discrimination between clusters. The F-test indicated that the top ten variables that made the highest contribution to cluster discrimination are presented in the Table 2.
Table 2: Top ten variables with the highest contribution to cluster discrimination (ANOVA post-hoc F-test)
F Sig.1 Trust (variable 22), 25.681 0.0002 Job satisfaction (variable 1) 22.449 0.0003 Interest in scientifi c research (variable 10), 18.065 0.0004 Tolerance and openness (variable 23) 14.448 0.0005 Use of knowledge and skills (variable 9) 13.557 0.0006 Part in making decision (variable 8) 12.705 0.0007 Work with people one likes (variable 7) 11.442 0.0008 S&T can sort out any problem (variable 25) 10.856 0.0009 Entrepreneurship embodied in EU (variable 4) 8.345 0.001
10 Demanding and stressful work (variable 5) 7.964 0.001
Source: Author
Cene Bavec • On the creative climate and innovativeness at the country level 20 Zb. rad. Ekon. fak. Rij. • 2009 • vol. 27 • sv. 1 • 9-30
We could claim that these are the most signifi cant Creative climate variables that we analyzed. We experimented further and repeated the clustering procedure only with these top ten variables. It resulted to identical clusters as in the case of all 25 variables. It was an additional confi rmation that these variables are the most relevant.
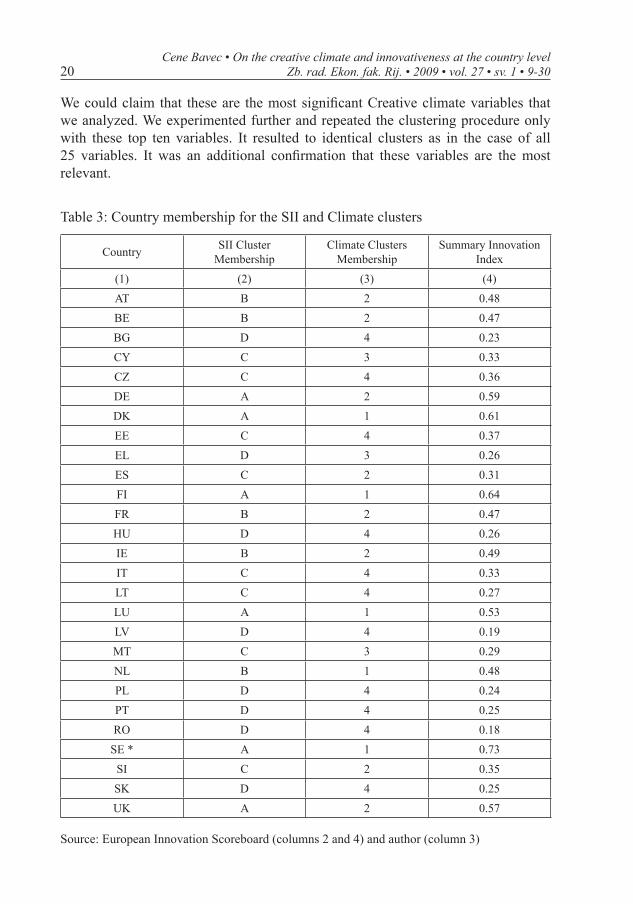
Table 3: Country membership for the SII and Climate clusters
Country SII Cluster Membership
Climate Clusters Membership
Summary Innovation Index
(1) (2) (3) (4)AT B 2 0.48BE B 2 0.47BG D 4 0.23CY C 3 0.33CZ C 4 0.36DE A 2 0.59DK A 1 0.61EE C 4 0.37EL D 3 0.26ES C 2 0.31FI A 1 0.64FR B 2 0.47HU D 4 0.26IE B 2 0.49IT C 4 0.33LT C 4 0.27LU A 1 0.53LV D 4 0.19MT C 3 0.29NL B 1 0.48PL D 4 0.24PT D 4 0.25RO D 4 0.18
SE * A 1 0.73SI C 2 0.35SK D 4 0.25UK A 2 0.57
Source: European Innovation Scoreboard (columns 2 and 4) and author (column 3)
Cene Bavec • On the creative climate and innovativeness at the country level Zb. rad. Ekon. fak. Rij. • 2009 • vol. 27 • sv. 1 • 9-30 21
The next step in analysis was a comparison between four Climate clusters (Figure 1) and the four SII clusters (the membership is seen in the Table 3) which are labeled with capital letters:
A - Innovation Leaders
B - Innovation Followers
C - Moderate Innovators
D - Catching-up countries
Sweden performed better than other Innovation Leaders. In the EIS it forms its own cluster; however we placed it into the SII Cluster A.
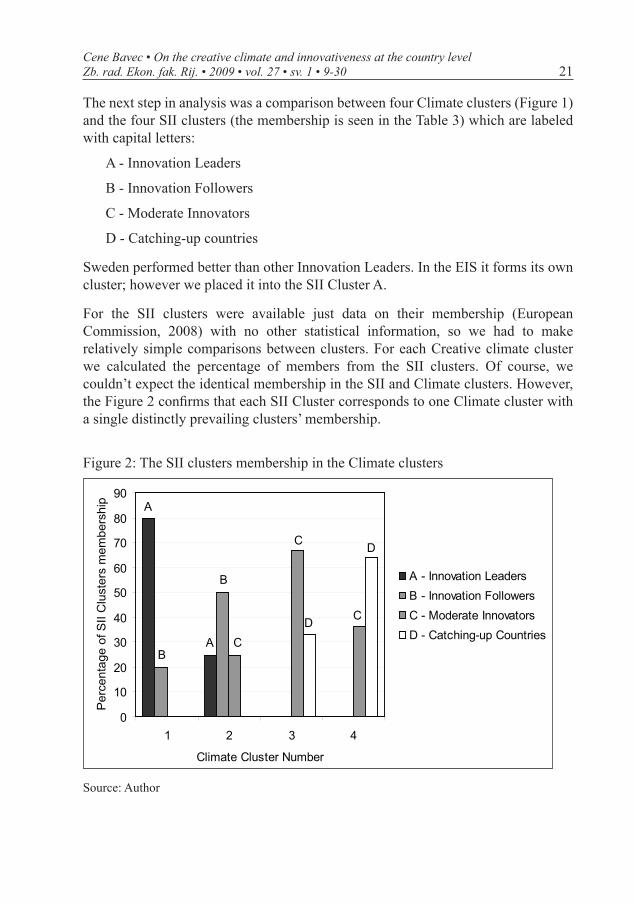
For the SII clusters were available just data on their membership (European Commission, 2008) with no other statistical information, so we had to make relatively simple comparisons between clusters. For each Creative climate cluster we calculated the percentage of members from the SII clusters. Of course, we couldn’t expect the identical membership in the SII and Climate clusters. However, the Figure 2 confi rms that each SII Cluster corresponds to one Climate cluster with a single distinctly prevailing clusters’ membership.
Figure 2: The SII clusters membership in the Climate clusters
0
10
20
30
40
50
60
70
80
90
1 2 3 4
Climate Cluster Number
Per
cent
age
of S
II C
lust
ers
mem
bers
hip
A - Innovation LeadersB - Innovation FollowersC - Moderate InnovatorsD - Catching-up Countries
A
AB
B
C
C
CD
D
Source: Author
Cene Bavec • On the creative climate and innovativeness at the country level 22 Zb. rad. Ekon. fak. Rij. • 2009 • vol. 27 • sv. 1 • 9-30
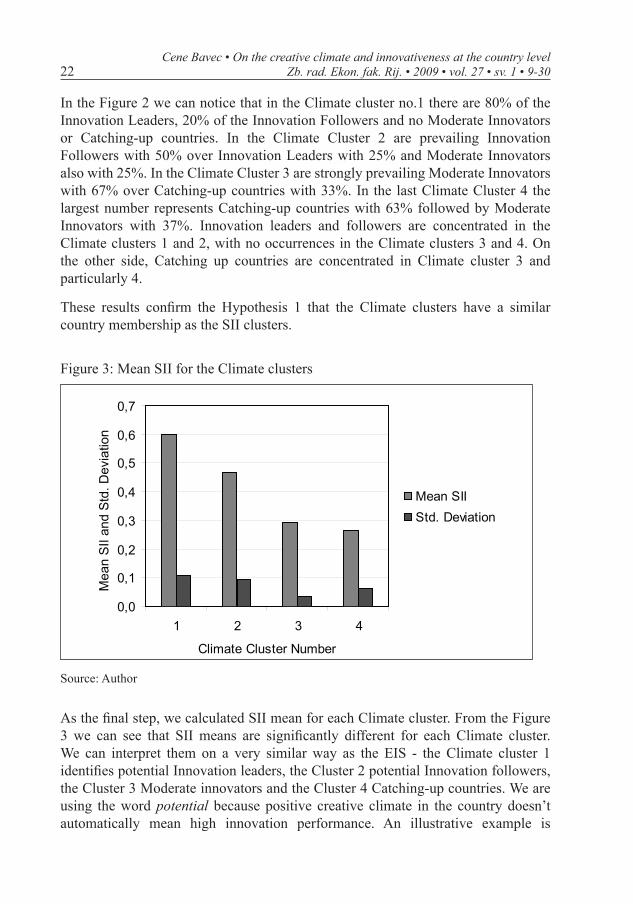
In the Figure 2 we can notice that in the Climate cluster no.1 there are 80% of the Innovation Leaders, 20% of the Innovation Followers and no Moderate Innovators or Catching-up countries. In the Climate Cluster 2 are prevailing Innovation Followers with 50% over Innovation Leaders with 25% and Moderate Innovators also with 25%. In the Climate Cluster 3 are strongly prevailing Moderate Innovators with 67% over Catching-up countries with 33%. In the last Climate Cluster 4 the largest number represents Catching-up countries with 63% followed by Moderate Innovators with 37%. Innovation leaders and followers are concentrated in the Climate clusters 1 and 2, with no occurrences in the Climate clusters 3 and 4. On the other side, Catching up countries are concentrated in Climate cluster 3 and particularly 4.
These results confi rm the Hypothesis 1 that the Climate clusters have a similar country membership as the SII clusters.
Figure 3: Mean SII for the Climate clusters
0,0
0,1
0,2
0,3
0,4
0,5
0,6
0,7
1 2 3 4
Climate Cluster Number
Mea
n S
II an
d S
td. D
evia
tion
Mean SIIStd. Deviation
Source: Author
As the fi nal step, we calculated SII mean for each Climate cluster. From the Figure 3 we can see that SII means are signifi cantly different for each Climate cluster. We can interpret them on a very similar way as the EIS - the Climate cluster 1 identifi es potential Innovation leaders, the Cluster 2 potential Innovation followers, the Cluster 3 Moderate innovators and the Cluster 4 Catching-up countries. We are using the word potential because positive creative climate in the country doesn’t automatically mean high innovation performance. An illustrative example is
Cene Bavec • On the creative climate and innovativeness at the country level Zb. rad. Ekon. fak. Rij. • 2009 • vol. 27 • sv. 1 • 9-30 23
Slovenia, which is grouped with the countries with a very positive creative climate. However, its innovation outcome is signifi cantly lower and is in the range of the Moderate innovators.
To confi rm the Hypothesis 2 that that the means of the Summary Innovation Index (SII) in the Climate clusters are signifi cantly different we used the One-Way ANOVA F-test because the Levene’s test of homogeneity of variances confi rmed its homogeneity. The ANOVA test confi rmed (F=24.34 and Sig.<0.01) that the means of the SII are signifi cantly different, so we confi rmed also the second hypothesis.
5. Issues for further research
The presented research was truly exploratory. When we started to experiment with available data we were not certain that we can prove any correlation between the Summary Innovation Index (SII) and any of public opinions from the Eurobarometers. We speculated from the beginning that some public opinions can tell something about innovative climate on the national level. We are fully aware that our selected fragments of climate at national level are more intuitive than methodologically unambiguous concept. In our research we were limited with availability of data on the EU level. However, we demonstrated that public opinion on selected issues (Table 1) correlates with the SII. Even their composite effect leads to similar clustering as SII undoubtedly differentiating the innovative and stagnated nations: Innovation Leaders, Innovation Followers, Moderate Innovators and Catching-up countries.
We proved that there is possible to fi nd national indicators that refl ect innovative climate on the similar way as we analyze innovative climate at organizational levels. The major limitation of the study is the fact that we studied just opinion polls showing public perception of job and working environment, perception of S&T, and public attitude towards some cultural and environmental issues. Including other questions that will comprehensively cover all ten Ekvall’s dimensions we could come to more objective measurement for creative climate at national level. It is obvious that some of these potential variables are also part of other social indicators. For example, trust is an important part of social capital (Francois and Zabojnik, 2005). It just illustrates that creative climate could overlap with other social or cultural issues, so there is no reason for its separate treatment.
The main challenge that deserves further studies is how far we can go comparing the climate as defi ned by Ekvall with the national climate. It is obvious that the nation is incomparably more complex system than a single organization. We can presume that climate at national level would be equally more complex concept. The fi rst research challenge would be to defi ne the dimensions for the national climate on the similar way
Cene Bavec • On the creative climate and innovativeness at the country level 24 Zb. rad. Ekon. fak. Rij. • 2009 • vol. 27 • sv. 1 • 9-30
as Ekvall and to identify independent variables that describe these dimensions. In the paper, we just indicated possible candidates. The variables should be tested in different countries to prove their relevancy in different economic and social environments. To develop such questionnaire we can use all Ekvall’s dimensions of the creative climate and many of 50 questions in the Situational Outlook Questionnaire (Isaksen at al., 2001a). Not covered by any of current polls are particularly Ekvall’s dimensions like Idea time, Dynamism, Risk-taking, and Confl icts.
The second, much tougher research challenge would be to investigate if we should or could include in the concept of the national climate also individual organizations. Rationale behind this concern is an assumption that national innovativeness is combination of innovativeness of individuals and innovativeness of organizations. However, this is just a refl ection of discussions in our research team.
6. Some policy implications
In the EU we are regularly measuring innovation performance of member states in the form of the SII. We are essentially focusing on the fi nal innovation outcome of many forces that shape innovativeness, not fully considering what these forces are. The variables that defi ne the SII basically measures two groups of indicators:
National efforts and investments into education, ICT, R&D, and venture • capital;
Economic aspects like high-tech exports, employment in medium and high-• tech manufacturing, and patent submissions.
As we see, there is very little in these indicators that directly refer to creative climate at the country level. National policy makers could easily oversimplify this issue. It looks that they can boost national innovativeness just by higher investments into R&D, ICT or education, and by increasing incentives into high-tech industry and services. From the authors’ experience, it is a prevailing political thought, in the new EU member states. It is obvious that such perception ignores many other relevant mechanisms that strengthen innovativeness and absorption ability for new technologies or services (Dyker, 2001, Furman at. al., 2002, Florida and Tinagli, 2004).
We have to emphasize that even the EIS concluded in the Executive Summary that the social capital and knowledge fl ows are potential key factors in innovation performance. However authors didn’t elaborate the issue into more details. They stayed at the conclusion that beyond GDP, differences in social capital and technology fl ows have the greatest power to explain differing levels of innovation performance. In the paper we advocate for creative climate in the country as one of the relevant variables that should be included into national and EU development policies.
Cene Bavec • On the creative climate and innovativeness at the country level Zb. rad. Ekon. fak. Rij. • 2009 • vol. 27 • sv. 1 • 9-30 25
We believe that the European Commission and the EU member states should develop a comprehensive index that would refl ect innovative climate at country levels, as a part of regular statistical researches. Balanced national innovation and development policy should be equally based on the current innovation performance expressed by hard macroeconomic indicators, as well as on the soft indicators showing innovative or creative climate. For example, we showed that public awareness on S&T signifi cantly correlates with innovation performance. Consequently, we can presume that government investments into public awareness and acceptance of S&T would also increase national innovativeness. It could be one of the cheapest government’s supporting mechanisms. In the paper we didn’t investigate which innovation performance and which innovation climate variables are causes and which are consequences. We could just guess that innovation climate stimulates innovation performance, but on the other side the innovation performance also infl uence innovation climate.
7. Conclusions
We argued that understanding creative climate in the EU countries could be an important national policy-making tool that will complement hard macro-economic indicators that are focused on innovative performance and not on creative socio-cultural environment. Such combination of hard and soft indicators is already well proven managerial approach and an effi cient strategic tool at company levels. We would expect similar effects at country or EU levels. That is the reason that we advocate for a unifi ed approach in the EU to develop a objective measurement for creative climate at country level.
We had no intention to propose an all-inclusive set of variables describing creative climate at the country level. In our preliminary research we just pointed to some variables that are supposed to be considered in measuring creative climate. Top ten variables that discriminate our Creative climate clusters are very likely among them.
The study was distinctly exploratory and faced many limitations. Positive results open some interesting research questions. Future research on identifi cation of relevant creative climate variables requires a clear methodological approach. It has to be investigated if we could use Ekvall’s dimensions, or we have to develop new set of dimensions. From our understanding of the problem the answer would be no. Another challenge is how to combine two different worlds. We should focus on individual citizens and their perception and attitudes toward different creative climate issues. This was a pragmatic approach we employed. However, working on our research we gradually came to conclusion that we also have to investigate attitudes of individual companies because they are independent subjects that are relevant in building national creative climate. An important part of citizens’
Cene Bavec • On the creative climate and innovativeness at the country level 26 Zb. rad. Ekon. fak. Rij. • 2009 • vol. 27 • sv. 1 • 9-30
attitudes is in reality born and shaped in organizations where they work. Introducing organizations into this research equation could signifi cantly complicate the problem. In further researches we would suggest a two-level approach because we think that an effi cient model of national creative climate should be based on individual citizens and also on individual organizations.
References
Bavec, C. (2007) “Interdependence between social values and national performance indicators: the case of the enlarged European Union”, Managing global transitions, Vol. 5, No. 2, pp. 213-228.
Damanpour, F. (1992) “Organizational Size and Innovation”, Organization Studies, Vol. 13, No. 3, pp. 375-402.
Deshpandé, R., Farley, J. U. (2003) “Organizational culture, market orientation, innovativeness, and fi rm performance: an international research odyssey”, International Journal of Research in Marketing, Vol. 21, No. 1, pp. 3-22.
Dunegan, K.J.; Tierney, P.; Duchon, D. (1992) “Perceptions of an innovative climate: examining the role of divisional affi liation, work group interaction, and leader/subordinate exchange”, IEEE Transactions on Engineering Management, Vol. 39, No. 3, pp. 227–236.
Dyker D. A. (2001) “The Dynamic Impact on the Central-Eastern European Economies of Accession to the European Union: Social Capability and Technology Absorption”, Europe-Asia Studies, Vol. 53, No. 7, pp. 1001-1021.
European Commission, (2005a) Social Capital, Special Eurobarometer 223, Brussels.
European Commission, (2005b) Europeans, Science and Technology, Special Eurobarometer 224, Brussels.
European Commission, (2006) European Social Reality, Special Eurobarometer 273, Brussels.
European Commission, (2007) European Cultural Values, Special Eurobarometer 278, Brussels.
European Commission, (2008) European Innovation Scoreboard 2007, PRO INNO Europe Paper No. 6, Brussels.
Ekvall, G. (1996) “Organizational Climate for Creativity and Innovation”, European Journal of Work and Organizational Psychology, Vol. 5, No. 1, pp. 105-123.
Ekvall, G., Arvonen, J., Waldenstrom-Lindblad, I. (1983), Creative Organizational Climate. Construction and Validation of a Measuring Instrument, Stockholm., Report 2, the Swedish Council for Management and Work Life Issues.
Florida, R., Tinagli, I. (2004) “Europe in the Creative Age”, Final Report, The Software Industry Center at Carnegie Mellon University, The Alfred P. Sloan
Cene Bavec • On the creative climate and innovativeness at the country level Zb. rad. Ekon. fak. Rij. • 2009 • vol. 27 • sv. 1 • 9-30 27
Foundation and DEMOS, www.demos.co.uk/fi les/ EuropeintheCreativeAge 2004.pdf.
Francois, P., Zabojnik, J. (2005) “Trust as Social Capital and the Process of Economic Development”, Journal of the European Economic Association, Vol. 3, No. 1, pp. 51-94.
Furman, J. L., Porter, M. E., Stern, S. (2002) “The determinants of national innovative capacity”, Research Policy, Vol. 31, No. 6, pp. 899-933.
Halman, L. (2001) The European Values Study: a Third Wave: Source Book of the 1999/2000 European Values Study Survey, Tilburg University, http://www2.warwick .ac.uk/ fac/soc/wbs/conf/olkc/archive/olkc1/papers/512_lam.pdf
Hofstede, G. (1998) “Attitudes, Values and Organizational Culture: Disentangling the Concepts”, Organization Studies, Vol. 19, No. 3, pp. 477-493.
Isaksen S. G., Lauer K. J. (2001a) “Convergent Validity of the Situational Outlook Questionaire: Discriminating Levels of Percived Suport for Creativity”, Journal of Psychology, Vol. 3, No. 1.
Isaksen, S. C., Lauer, K. J., Ekvall, G., Britz, A. (2001b) “Perceptions of the Best and Worst Climates for Creativity: Preliminary Validation Evidence for the Situational Outlook Questionnaire”, Creativity Research Journal, Vol. 13, No. 2, pp. 171 – 184.
Ismail, M. (2005) “Creative climate and learning organization factors: their contribution towards innovation”, Leadership & Organization Development Journal, Vol. 26, No. 8, pp. 639-654.
Kashifa, S., Hessels, J. (2007) “Ambitious Nascent Entrepreneurs and National Innovativeness”, EIM Business and Policy Research in Scales Research Reports, No. H200702, http://ideas.repec.org/p/eim/papers/h200702.html.
Ketchen, D. J. Jr. and Shook, C. L. (1996). »The Application of Cluster Analysis in Strategic Management Research: An Analysis and Critique«, Strategic Management Journal, Vol. 17, No. 6, pp. 441-458
Lam, A. (2006) “The tacit knowledge problem in multinational corporations: a comparative analysis of Japanese and US MNCs’ transnational learning strategies”, Proceedings of the OLKC 2006 Conference at the University of Warwick, Coventry, 20-22 March 2006. http://www2.warwick.ac.uk/fac/soc/wbs/conf/olkc/archive/olkc1/papers/512_lam.pdf
Lee, C. (1990) “Determinants of National Innovativeness and International Market Segmentation”, International Marketing Review, Vol. 7, No. 5.
Likar, B., Kopač, J., Markič, M., Kern, T. (2008) »Infl uencing indicators determination - precondition for successful inovation management in mechanical industry«. Strojarstvo, 2008, Vol. 50, No. 2, pp. 117-126.
Mathisen, G.E., Einarsen, S. (2004) »A Review of Instruments Assessing Creative and Innovative Environments Within Organizations«, Creativity Research Journal, Vol. 16, No.1, pp. 119-140.
Cene Bavec • On the creative climate and innovativeness at the country level 28 Zb. rad. Ekon. fak. Rij. • 2009 • vol. 27 • sv. 1 • 9-30
Mohd Nazri Khan, A. (2002) “Assessing and comparing innovativeness of fi rms: the case of a multinational company operating...”, Global Competitiveness, January 1, 2002, http://www.allbusiness. com/ specialty-businesses/332720-1.html.
Montes, F. J. L., Moreno, A. R., Fernández, L. M. M. (2004) “Assessing the organizational climate and contractual relationship for perceptions of support for innovation”, International Journal of Manpower, Vol. 25, No. 2, pp. 167 – 180.
Mumford, M. D. and Hunter, S. T. (2005) “Innovation in Organizations: A Multi-Level Perspective on Creativity”, Research in Multi-Level Issues, Vol. 4, pp. 9-73.
Pothukuchi, V. K., Damanpour, F., Choi, C. C., Park, S. H. (2002) “National and Organizational Culture Differences and International Joint Venture Performance”, Journal of International Business Studies, Vol. 33, No. 2, pp. 243-265.
Putnam, Robert D. (1993) “The Prosperous Community: Social Capital and Public Life”, The American Prospect, Vol. 4, No. 13, pp. 35-42.
Susanj, Z. (2000) “Innovative climate and culture in manufacturing organizations: differences between some European countries”, Social Information Science, Sage publications, Vol. 39, No. 2, 349-361.
Westwood, R., Low, D. R. (2003) “The Multicultural Muse - Culture, Creativity and Innovation”, International Journal of Cross Cultural Management, Vol. 3, No. 2, pp. 235-259.
Whitley, R. (2000) “The institutional structuring of innovation strategies: business systems, fi rm types and patterns of technical change in different market economies”, Organization Studies, Vol. 21, No. 5, pp. 855-86.
Zain, M. and Rickards, T. (1996) “Assessing and comparing the innovativeness and creative climate of fi rms”, Scandinavian Journal Management, Vol. 12, No.2, pp.109-21.
Zain, M., Richardson, S., Mohd Nazri Khan, A. (2003) “The Implementation of Innovation by a Multinational Operating in Two Different Environments: A Comparative Study”. Creativity and Innovation Management, Vol. 11, No. 2, pp. 98–106.
Cene Bavec • On the creative climate and innovativeness at the country level Zb. rad. Ekon. fak. Rij. • 2009 • vol. 27 • sv. 1 • 9-30 29
O kreativnoj klimi i inovativnosti na razini države
Cene Bavec1
Sažetak
U članku je predstavljena inicijalna studija o kreativnoj klimi i inovativnosti na razni država u Europskoj uniji. Istražili smo mogućnost proširenja Ekvallovog koncepta kreativne klime za inovativnost sa nivoa individualne organizacije na nivo države. Glavni istraživački cilj je bio identifi cirati fragmente nacionalne krea-tivne klime i potvrditi da je u relaciji sa inovativnošću. Kao mjerilo nacionalne inovativnosti uzeli smo sumarni indeks inovativnosti (Summary Innovation Index). Fragmente nacionalne kreativne klime identifi cirali smo pomoću 25 pitanja i od-govora koje smo selektirali iz različitih istraživanja javnog mnijenja u EU objav-ljenih u Eurobarometru. Koristeći hijerarhičnu klaster metodu grupirali smo čla-nice EU i usporedili dobivene klastre s grupama koje identifi ciraju inovacijske vođe, inovacijske sljedbenike, prosječne inovatore i države koje se tek priključuju (klasifi kacija Europske komisije). Rezultat je pokazao da je zastupljenost država slična u obje skupine klastera što znači da su dvije bitno različite skupine varijabla iz dva potpuno različita izvora dovela do vrlo sličnog rezultata. Identifi cirali smo deset najznačajnijih varijabli, koje najviše pridonose distinkciji između klastera. Na kraju smo iznijeli tvrdnju da je razumijevanje inovacijske klime u državama EU značajno oruđe za vođenje nacionalne politike koje je komplementarno tvrdi-ma makroekonomskim indikatorima koji su fokusirani samo na inovacijski učinak a ne i na socijalno i kulturno okruženje. Predložili smo unifi ciran pristup EU ka razvijanju objektivnog mjerila za inovativnu klimu na razini država članica. Iden-tifi cirali smo i nekoliko istraživačkih izazova vezanih za tu ideju.
Ključne riječi: sumarni indeks inovativnosti (SII), nacionalna inovacijska učinkovitost, inovacijska klima, kreativna klima, Ekvallove dimenzije, EU članice
JEL klasifi kacija: A13, C12, O31
1 Izvanredni profesor, Sveučilište Primorska, Fakultet za management Koper, Cankarjeva 5, Koper, Slovenija. Znanstveni interes: menadžment informacijskih tehnologija, mena džer ske i organizacijske teorije, tehnološko predviđanje i tehnološka politika. Tel.: +386 5 610 2000. Fax: +386 5 610 2039. E-mail: [email protected]. Osobna web stranica: www2.arnes.si/~bavec

Related Documents