CONFIDENTIAL DRAFT – NOT FOR CIRCULATION Goal 5 Restore 150 million hectares of degraded landscapes and forestlands by 2020 and significantly increase the rate of global restoration thereafter, which would restore at least an additional 200 million hectares by 2030 Key messages • Progress on the implementation of forest landscape restoration has been mixed • Pledges under the Bonn Challenge totaling 170.6 million hectares indicate significant political will to restore landscapes. However, only a small amount of restoration has been reported, and data limitations make progress difficult to quantify. • A systematic global literature review found that only 18 percent of the 2020 goal (26.7 Mha of forests) are documented to have undergone restoration since 2000. • An in-depth analysis of the Mekong region using satellite data reveals that most restoration in the area since 2010 has taken place outside of forests; tree cover is increasing on croplands, shrublands, and other non-forest land uses at a higher rate (75 percent) than inside forests (25 percent). Furthermore, deforestation in the Mekong region has continued at a higher pace than forest restoration, amounting to an overall net loss of natural forests (-0.3 Mha). • These results indicate that we are not on track to meet the 2020 goals, and greater efforts are needed to protect and restore natural forests and the important forest ecosystem functions they supply (e.g. biodiversity and carbon sequestration). Overview of goal and indicators The New York Declaration on Forests (NYDF) Goal 5 endorses and builds on the Bonn Challenge, a global initiative launched in 2011 with the goal of bringing 150 million hectares (Mha) of the world’s deforested and degraded land into restoration by 2020. In 2014, the NYDF adopted the 150 Mha goal and extended the ambition to restore an additional 200 Mha by 2030. Together, these initiatives represent a ‘goal continuum’ of 350 Mha by 2030. Goal 5 of the NYDF and the Bonn Challenge are in line with and provide a means to deliver on other international commitments to increase forests, including the United Nations Framework Convention on Climate Change UNFCCC’ program on forest, REDD+ (reducing emissions from deforestation and degradation with five modalities including “enhancement of forest carbon stocks”), UN Convention on Biological Diversity (CBD), Aichi Target 15 ("By 2020… restoration of at least 15% of degraded ecosystems"), Sustainable Development Goals 6.6 and 15.2 (“By 2020, protect and restore water-related ecosystems, including mountains, forests, wetlands…,” and “By 2020…restore degraded forests and substantially increase afforestation and reforestation globally”), and for some countries, their nationally Progress on the New York Declaration on Forests Goal 5 Assessment Technical Annex to the Five-Year Assessment Report September 2019 | forestdeclaration.org Note: Draft not copy edited

Welcome message from author
This document is posted to help you gain knowledge. Please leave a comment to let me know what you think about it! Share it to your friends and learn new things together.
Transcript

CONFIDENTIAL DRAFT – NOT FOR CIRCULATION
Go
al
5
Restore 150 million hectares of degraded landscapes and forestlands by 2020 and significantly increase the rate of global restoration thereafter, which would restore at least an additional 200 million hectares by 2030
Key messages • Progress on the implementation of forest landscape restoration has been mixed
• Pledges under the Bonn Challenge totaling 170.6 million hectares indicate significant political will to restore landscapes. However, only a small amount of restoration has been reported, and data limitations make progress difficult to quantify.
• A systematic global literature review found that only 18 percent of the 2020 goal (26.7 Mha of forests) are documented to have undergone restoration since 2000.
• An in-depth analysis of the Mekong region using satellite data reveals that most restoration in the area since 2010 has taken place outside of forests; tree cover is increasing on croplands, shrublands, and other non-forest land uses at a higher rate (75 percent) than inside forests (25 percent). Furthermore, deforestation in the Mekong region has continued at a higher pace than forest restoration, amounting to an overall net loss of natural forests (-0.3 Mha).
• These results indicate that we are not on track to meet the 2020 goals, and greater efforts are needed to protect and restore natural forests and the important forest ecosystem functions they supply (e.g. biodiversity and carbon sequestration).
Overview of goal and indicators The New York Declaration on Forests (NYDF) Goal 5 endorses and builds on the Bonn Challenge, a global initiative launched in 2011 with the goal of bringing 150 million hectares (Mha) of the world’s deforested and degraded land into restoration by 2020. In 2014, the NYDF adopted the 150 Mha goal and extended the ambition to restore an additional 200 Mha by 2030. Together, these initiatives represent a ‘goal continuum’ of 350 Mha by 2030. Goal 5 of the NYDF and the Bonn Challenge are in line with and provide a means to deliver on other international commitments to increase forests, including the United Nations Framework Convention on Climate Change UNFCCC’ program on forest, REDD+ (reducing emissions from deforestation and degradation with five modalities including “enhancement of forest carbon stocks”), UN Convention on Biological Diversity (CBD), Aichi Target 15 ("By 2020… restoration of at least 15% of degraded ecosystems"), Sustainable Development Goals 6.6 and 15.2 (“By 2020, protect and restore water-related ecosystems, including mountains, forests, wetlands…,” and “By 2020…restore degraded forests and substantially increase afforestation and reforestation globally”), and for some countries, their nationally
Progress on the New York Declaration on Forests
Goal 5 Assessment
Technical Annex to the Five-Year Assessment Report
September 2019 | forestdeclaration.org
Note: Draft not copy edited

2
determined contributions (NDC) under the Paris Agreement. On March 1, 2019, the United Nations also declared 2020-2030 a Decade on Ecosystem Restoration to build on regional efforts and accelerate global goals. Defining forest landscape restoration
Restoration has various interpretations due to the different types of degradation that it seeks to remedy, the actions involved, and the different objectives of the land managers promoting restoration.1
In 2000, the term “forest landscape restoration” (FLR) (sometimes referred to as “forest and landscape restoration”) was established to incorporate multiple objectives in landscape mosaics.a The multiple objectives include regaining ecological integrity (e.g., ecological structure and function including biodiversity, water provision, carbon sequestration and soil health) and enhancing human well-being (e.g. improved livelihoods, agriculture production and commercial opportunities, and increased resilience to climate change).2,3,4,5,6,7 In contrast to site-based ecological restoration where the focus is to recover forests back to their reference condition, the FLR approach encompasses a range of activities that balance environmental and socio-economic needs8. The Global Partnership on Forest and Landscape Restoration GPFLR defines FLR as "a process that aims to regain ecological functionality and enhance human well-being in deforested or degraded landscapes. As a process, FLR is not an end in itself, but a means of regaining, improving, and maintaining vital ecological and social functions, in the long-term leading to more resilient and sustainable landscapes"(Box 1).9 In general, FLR activities integrate six guiding principles10:
1. Focus on landscapes 2. Engage stakeholders and support participatory governance 3. Restore multiple functions for multiple benefits 4. Maintain and enhance natural ecosystems within landscapes 5. Tailor to the local context using a variety of approaches 6. Manage adaptively for long-term resilience
While the process and intent of FLR is well-defined, there is no universal set of defined FLR activities and there continues to be various interpretations of what is included in FLR.11 The NYDF does not explicitly define restoration nor specify the types of activities that should be included in the 350 Mha goal; however, given its similar objectives to the Bonn Challenge, which is based on implementation of FLR, we have focused our assessment of the NYDF on those actions that comprise the core of FLR, which is to increase tree cover and/or forest cover. Therefore, for the purposes of this report the “area under restoration” is defined as the area receiving the restoration activity or intervention(s) and “restoration” is defined as an increase in forest and/or tree cover (more detail on why we focus on forest and tree cover gain is provided in the next section “Assessment Approach”). To further describe what activities increase forest and/or tree cover, we have adopted the set of activities and definitions for reforestation and afforestation, recently established and defined by an expert working groupb (see Box 1).
a For the purposes of our assessment of NYDF Goal 5, we focus on “forest landscape restoration efforts” (FLR). “Restoration” and “forest restoration” may be used interchangeably with FLR. b The taxonomy and definitions of reforestation activities (activities that increase tree and/or forest cover) were developed through an expert workshop with 25+ scientists at the University of Oxford in the fall of 2018. The definitions are based on existing definitions from peer-reviewed literature and expert opinion. More detail on the taxonomy and definitions is in Cook-Patton et al. 2019 (in review). The potential for natural reforestation to mitigate climate change.

3
Box 1. Definitions
Forest (from FAO): land spanning greater than 0.05 hectares with tree crown cover of more than 10 percent with trees higher than 5 metres at maturity in situ.
Forest cover gain: an increase in forest area through tree-based forest landscape restoration activities
Forest landscape restoration (FLR): “the long-term process of regaining ecological functionality and enhancing human well-being across deforested or degraded forest landscapes”.12 Degraded landscapes include forests and related landscapes and ecosystems that have lost their structure, function, biodiversity, or experienced other significant damage and overexploitation.13
In this report, forest landscape restoration includes all tree-based interventions such as reforestation and afforestation that result in an increase in tree cover and/or forest cover (what is measurable via satellite-based tools described in “Challenges to monitoring FLR” below). Activities that do not establish new tree and/or forest cover such as forest management and silviculture of existing forests as well as non-forest activities (e.g. soil restoration, rangeland restoration) are excluded. Specific reforestation and afforestation activities and interventions are defined as followsc:
1) Establish natural or semi-natural forest: Natural regeneration involves allowing forest systems to spontaneously regrow without any tree planting or other assisted regeneration practices.14 Assisted natural regeneration aims to accelerate natural regeneration and/or guide successional trajectories through activities that enhance tree growth, such as removing invasive grasses, liana cutting, and/or other practices. We also include enrichment planting and threat exclusion (e.g. fencing and fire control) in this category. Active ecological restoration includes smaller tree configurations as well as large scale tree planting endeavours to restore native forests. Species may be mixed at the stand scale or in patches at the landscape scale. This strategy may also involve extensive natural regeneration following initial planting.
2) Establish new timber plantations: Mixed species plantations include at least two species intermixed on large areas in timbers stands and may involve a mix of native and non-native species, as well as even-aged or uneven-aged stands. Monoculture plantations include plantation forests where the same species is grown on large areas, usually in even-aged stands.15
3) Establish new agroforestry systems: Multistrata systems are those with a mix of under- and overstory species, and include home gardens and shade-grown cropping systems like cacao and coffee combined with shade-, timber- or commercial tree crops.16 Tree intercropping includes agricultural systems where woody species are grown in crop fields, in scattered or systematic arrangements amongst annual crops or herbaceous perennials.17 Silvopastoral systems include grazing land with scattered or planted trees, as well as tree-fodder systems.18
4) Incorporate transitional land use: a strategy that involves incorporating a range of agroforestry and/or plantation approaches in early stages of reforestation, as a transitional phase towards native forest restoration, to overcome socioeconomic and ecological obstacles to restoring these lands.19
Reforestation: is the direct human-induced conversion of non-forested land to forested land through planting,
seeding and/or the human-induced promotion of natural seed sources, on land that was forested but that has been converted to non-forested land.
Afforestation: is the direct human-induced conversion of non-forested land that was naturally not a forest (e.g. croplands that used to be grasslands) to forested land through planting, seeding and/or the human-induced promotion of natural seed sources. Note: The UNFCCC defines afforestation as reforesting land that has not been forested for at least 50 years, which could include croplands and pasture that replaced natural forest ecosystems. For the purposes of this report, we use the first definition, and refer to land that has not been forested for longer than 50 years, but was originally a forest, as reforestation.
Tree cover gain: “Tree cover” is defined as vegetation greater than 5 meters in height, and may take the form of natural forests or plantations across a range of canopy densities. “Gain” is defined as an increase in tree canopy cover or tree canopy height at the Landsat pixel scale . “Tree cover gain” may indicate a number of potential activities, including natural forest growth or the crop rotation cycle of tree plantations.
c See footnote b above.

4
Challenges to monitoring FLR
In the context of reporting progress on the NYDF, Goal 5 will be achieved when landscapes totalling 350 Mha of have successfully increased tree cover through FLR activities. Estimates of progress on FLR has been reported by the Bonn Challenge Barometer in 2018 and 201920, yet only for a small number of pledgers. To date, efforts to monitor restoration in the context of international commitments (including the Bonn Challenge and the Aichi Targets) rely on self-reported information from countries. Current monitoring and reporting efforts have several limitations. Not all countries report, and if they do they follow different definitions and methods that may not be fully consistent and comparable.21
Similarly, efforts to monitor FLR progress through literature reviews can not capture all activities in all countries, may have issues with consistencies on definitions and methods, and tend to have a time lag because studies require time to produce and publish. Data for FLR monitoring that is global, consistent and comparable is not yet available, but work is underway. In contrast to monitoring tree cover loss and deforestation, globally-comprehensive satellite-based data for monitoring FLR progress are difficult to produce (Box 2). A preliminary datset on global tree cover gain22 was developed by University of Maryland GLAD lab and has been publicly available on the Global Forest Watch platform since 2015. However, for the purposes of reporting on NYDF Goal 5, the data set was ultimately determined not to be a reliable estimate of restoration progress for several reasons. One is that the data only report cumulative (not annual) tree cover gain for the period 2001 to 2012, such that it is not possible to detect or disaggregate temporary changes in forest cover (e.g., fire, tree crop cycles); secondly, the last year of reporting is 2012, which is before the NYDF was initiated; and lastly, the data producers acknowledge relatively high incidences of false positives and false negatives23. However, the GLAD data has continued to improve , and recently piloted a more rigorous annual dataset of tree cover gain for the Mekong region. Two other global datasets are being developed and improved, and are able provide additional insight into progress on FLR progress: Collect Earth and Trends.Earth (descriptions of data sets in Box 4).
Box 2. How is monitoring forest restoration different from monitoring deforestation?
Many countries and organizations have years of experience in measuring and monitoring deforestation as part
of Reduced Emissions from Deforestation and forest Degradation and the role of conservation, sustainable
management of forests and enhancement of forest carbon stocks in developing countries (REDD+) that is part
of the Paris Agreement under the United Nations Framework Convention on Climate Change (UNFCCC) and
other initiatives like the FAO Forest Resource Assessment (FAO FRA). Many of the same techniques used in
monitoring deforestation can inform monitoring forest restoration, including satellite remote sensing, inventories,
national statistics, and community-based surveys. However, there are important differences with regard to time
and resolution that need to be considered for monitoring restoration.
Time: While deforestation is a near-instantaneous event and wider landscape degradation often takes place at
a relatively fast rate, restoration typically occurs over much longer time spans on the order of years or decades.
Measuring progress from seedlings to saplings and from young trees to mature trees requires a monitoring
system that is based on a long-term time horizon. Therefore, it is important to determine what can be detected
within the proposed timeframe. A monitoring framework based on the simple presence or absence of trees—
which works for deforestation monitoring—does not capture the nuances of measuring progress on restoration.
Resolution: Deforestation (though not degradation) often occurs over relatively wide swaths of dramatic
change in land cover. Restoration, on the other hand, often widely varies in the extent of the application. Most
often it occurs over smaller, more dispersed plots, such as with small-scale actors planting trees dispersed over

5
a few hectares of their land. But in aggregate it can range from a few hectares to hundreds or even thousands
of hectares. In either case, these restored areas are often characterized by dispersed widely spaced trees that
do not form a uniform block. As a result, high- to very high-resolution satellite images need to be used to detect
these small, dispersed, and subtle changes in the landscape and then measure overall change. Since higher
resolution imagery covers a smaller total area per image, tens of thousands of images are usually needed to
cover even a modest monitoring area. This means monitoring restoration needs to consider cost, volume of
data, and time.
Assessment approach To assess progress on NYDF Goal 5, we developed an assessment framework with two overaching criteria (Table 1):
1) Rate of forest cover and tree cover gain (hectares established over time); 2) Forest landscape restoration efforts (political and socio-economic advancements).
Table 1. Criteria and indicators to track Goal 5 Criterion Indicator Data Sources
1. Rate of forest cover and tree cover gain (hectares established over time)
1.1 Forest cover gain from FLR (ha) 1.2 Tree cover gain inside and outside the forest (ha)
1.1.1 Systematic literature review 1.2.1 Collect Earth 1.2.2 GLAD Canopy Cover and Height Dynamics
2. Forest landscape restoration efforts (political and socio-economic advancements towards)
2.1 High-level pledges 2.2 Planning and implementation steps 2.3 Finance for FLR activities
2.1.1 Bonn Challenge Barometer 2.1.2 NDCs 2.2.1 Bonn Challenge Barometer 2.2.2. Literature review 2.2.1 Bonn Challenge Barometer 2.3.1 Literature review
The first criterion, rate of forest and tree cover gain, provides a global overview of biophysical restoration progress. It includes the findings from two studies : 1.1. a systematic literature review that provides global forest cover gain through tree-based FLR activities (listed in Box 1); and 1.2. A large scale pilot of tree cover gain in the Mekong Region that combines GLAD and Collect Earth Data. The pilot study identifies progress on two types of forest landscape restoration: increase in “trees inside the forest” (i.e. dense and clustered trees, >10 percent tree canopy cover) using GLAD data and increase in “trees outside the forest” (i.e. sparse tree cover on non-forest lands such as cropland and settlements) using Collect Earth data. The pilot study tests an approach we developed that combines best available data in a way that can systematically monitor global tree cover gain in the future. We acknowledge that FLR is more than just increasing tree cover, and we stress the importance of monitoring ecosystem function, ecosystem services and socio-economic outcomes. However, at present, there are no adequate global data sets available to measure progress on forest landscape restoration beyond the biophysical increase in forest and/or tree cover described above.
The second criterion was adapted from the Bonn Challenge Barometer (Box 3),24 and reports on three indicators related to key political and socio-economic conditions necessary to catalyse FLR. As indicator 1 is yet unable to fully capture FLR progress, the second criterion, forest landscape restoration efforts, was established to serve as a proxy for tracking early developments toward restoration and showing

6
directional trends through: 2.1. High-level pledges; 2.2. Planning and implementation steps: 2.3. Financing.
The assessment framework will be updated as data improves and becomes available.
Box 3. The Bonn Challenge Barometer
The Barometer, developed through a participatory stakeholder process in five countries and launched in 2017,
collects information from each pledger (national or subnational government) to track progress toward achieving
the Bonn Challenge. The Barometer is structured into two overarching set of indicators: “success factors”, or
policies and institutional frameworks, financial flows and technical planning that create the enabling conditions
needed for FLR implementation and “results and benefits” which include the results of FLR actions in terms of
the land area brought into restoration (in hectares), and the climate mitigation, biodiversity conservation and job
creation benefits associated with them. As of 2019, the Barometer has developed in-depth reports for five
countries and rapid assessments for 14 countries. Data from the “results and benefits” for the five pilot countries
on the land area under restoration was incorporated into the systematic literature review (Indicator 1.1).
Information from the “success factors” was incorporated into Indicators 2.1, 2.2 and 2.3.
Findings
Criterion 1: Rate of forest cover and tree cover gain Indicator 1.1: Forest cover gain (ha)
For this indicator, a global, systematic literature review was conducted by researchers at the University of Virginia to assess available studies and provide a bottom-up picture of progress on forest cover gain.d Peer reviewed literature, as well as publicly available reports and databases were assessed to build a comprehensive database of areas where forests were restored since 2000, since 2011 (start of the Bonn Challenge) and since 2014 (signing of the NYDF). Literature review methods
The primary literature review was conducted using Web of Science, and evaluated 3,654 total peer-reviewed paperse. Grey literature and publicly available databases were also reviewed per expert recommendations. Of the papers and data sources assessed, only forest landscape restoration activities that increase forest cover since 2000 in the implementation/ongoing or completed phase were considered. Activities that did not provide an additional increase in forest cover such as management or silviculture of existing forests or plantations, good agriculture practices, restoration of soils, restoration of non-forest landscapes (e.g. grasslands and rangelands) and conservation (avoided deforestation) were excluded. Sources were also excluded where trees added were likely short-term, such as unassisted regeneration in existing forests following repeated disturbances (e.g. fire). Afforestation of non-forest landscapes was included. To focus on landscape-scale restoration, sources were excluded that reported forest cover increases of areas less than 100 ha, except for mangrove restoration which
d Forest cover gain is used interchangeably with forest restoration and forest landscape restoration in this section e Additional methods for literature review: Systematic review of primary literature using the Web of Science (Core Collection; Thomson Reuters, New York, New York, USA) database. We searched peer-reviewed literature in the Web of Science database from 2010 to 2019 using the search terms “monitor* OR progress* OR success* OR status AND forest* OR landscape* OR peatland* OR mangrove* OR agroforest* OR plantation* AND restor* OR regenerat* OR afforest* OR reforest* AND *forest* AND area* OR hectare* OR kilom*”. These search terms were chosen to target forest cover increase while excluding methods-centered work. These criteria netted an initial 3,654 papers for further consideration.

7
tends to be smaller scale. Plot-based studies in which the total restored area exceeded 100 ha were included, even if individual plots were <100 ha. Studies in which no new area of forest cover was added after 2000 were excluded. For studies in which restoration began prior to 2000 but additional area of forest cover was added after 2000, only forest area restored after 2000 was included in the analysis. For studies that reported increasing forest cover from a timepoint before 2000 and a timepoint after 2000, linear expansion rates were assumed and only the area restored after 2000 was included based on the linear extrapolation. Finally, for those papers that reported both restoration and degradation within the study area, gross restoration was included and not net restoration. Using these criteria, a total of 101 primary literature papers, two publicly available databases (the Restoration Database for Latin America and the Caribbean from the CIAT/WUR project for USAID25, and the GEF database26), and one grey literature report (Bonn Challenge Barometer27) were included for analysis for a total of 243 data entries (representing forest cover gain in a specific region over a specific time period). With the compiled data, each of the restoration locations per data entry were assessed to identify and remove duplicate initiatives and avoid double counting. In cases of duplicate estimates on the same area and time period, primary data were prioritized, and when both were primary, then the more recent or conservative estimate was included. After excluding double counts, a total of 196 data entries remained. A meta-analysis was then conducted to determine the number of hectares restored by region, restoration type, ecosystem type and motive for restoration in the periods 2000-2011 and 2011-2014 (start of the Bonn Challenge). Results on global forest cover gain
The literature review indicates that the goal of restoring 150 Mha of forest across landscapes by 2020 is not on track. Since 2000, approximately 26.7 million hectares (Mha) of forest landscapes have undergone restoration (20.5 Mha reforestation, 6.2 Mha afforestation), representing 18% of the 2020 goal. Since 2011 (start of the Bonn Challenge), 3.1 Mha have undergone restoration (2.4 Mha reforestation, 0.7 Mha afforestation). After the launch of the Bonn Challenge and NYDF, the average rate of forest landscape restoration decreased from approximately 2 Mha/year between 2000-2010, to less than 1 Mha/year after 2011. The literature review results diverge from the 2019 Bonn Challenge Barometer report28 finding that 43.7 Mha are under FLR since 2011, because the literature review only included six countriesf with more in-depth information on timelines and restoration activities (and not the 13 “rapid assessment” countries), and excluded activities in the Barometer report that did not increase forest cover. Regional results
Regionally, Latin America and East Asia (China) represent the majority of areas under forest restoration (Figure 1). Between 2000-2010, 9.7 Mha were under restoration (99.9 % reforestation) in Latin America, primarily as regeneration (97%) in Brazil. In China, 9.5 Mha were under restoration, with approximately half (47%) occuring as afforestation with timber species. Southeast Asia and the EU also had significant restoration between 2000-2010 (2.5 Mha and 1.3 Mha respectively), primarily as timber plantations (66%) and regeneration (33%) in Vietnam and regeneration in Eastern Europe and Russia (75%). North America, South Asia, and Sub-Saharan Africa had moderate levels of restoration between 2000-2010 (0.4 Mha, 0.13 Mha and 0.04 Mha respectively), mainly through regeneration and ecological restoration in the United States (90%), India (63%) and in West and East Africa (70%). From 2000-2010, the predominant motives for forest landscape restoration were risk mitigation (e.g. soil erosion, flooding) (13%), commercial interests and local employment (12% each), then enhancing soil fertility, carbon sequestration and ecosystem function (8% each) (Figure 2).
f Brazil, El Salvador, Mexico, Rwanda, Sri Lanka, and the United States

8
Figure 1. Increase in forest area through forest landscape restoration (forest cover gain through reforestation and afforestation activities) from 2000–19 in million hectares, and by region, time period, and type of restoration
Since 2011 (start of the Bonn Challenge), a majority of the forest cover gain through FLR activities occured in North America (USA) (1.4 Mha), Latin America (0.75 Mha), and Sub-Saharan Africa (0.70 Mha). Most restoration types since 2011 were active ecological restoration (24%), woodlots (unspecified kinds of timber plantations, 22%), natural and assisted regeneration (20%), agroforestry (16%), and afforestation (15%) (see Figure 1). The primary motives for restoration after 2011 were recovering ecosystem function (19%), biodiversity and local employment (11% each), and carbon sequestration and risk mitigation (9% each) (see Figure 2). Even though the rate of restoration did not increase after 2010, international commitments to restore ecosystems, biodiversity, and carbon sequestration seem to have had

9
a positive effect on promoting the types of restoration that realize those goals (e.g. reforestation through natural regeneration, ecological restoration, and agroforestry).
Figure 2. Primary objectives for forest landscape restoration (forest cover gain through reforestation and afforestation activities), in percent of total area
Afforestation in context
Since 2000, forest landscape restoration occurred primarily in tropical (40%) and temperate (18%) forest biomes. However, a significant portion (30%) also occurred in grasslands (tropical, temperate, montane and flooded), predominantly as afforestation. The large contribution of afforestation (mostly in Asian countries and Russia) to global restoration is of note. Globally, 6.16 Mha was afforested since 2000, with 4.46 Mha (72%) of that reported in China and Mongolia. Most of this afforestation has occurred in grasslands (including montane as well as temperate grasslands) across both countries, and was

10
promoted to mitigate erosion and flooding. Afforesting grasslands and other non-forest ecosystems with timber species may provide some ecosystem services, but it often does not recover the ecological complexity of the landscape, and further, may have negative ecological consequences. While afforestation can increase soil C sequestration and reduce erosion in some instances, the greatest potentials are on reclaimed or severly degraded lands29. A major concern, however, is the effect afforestation poses to resource use and biodiversity. For example, in parts of China, some afforested areas were unforested because they lacked sufficient available water to sustain forests30. Some planting programs failed to consider the ecological constraints of either the targeted areas or the species chosen for planting, resulting in a mismatch in the the transpiration potential of the trees versus the availble precipitation of the region31. As a result, some afforested areas had significantly greater water demand than what was available in the region. Furthermore, a majority of afforested areas were biologicaly undiverse with largely short-statured, sparesly-planted monocultures32. Survival rates for similar plantings have been around 24% with surviving trees only reaching 20% of their natural height33.
Limitations of analysis
As mentioned in the section “Challenges to Monitoring FLR”, literature reviews have some limitations in reporting FLR progress. Literature reviews can not capture all activities in all countries, may have issues with consistencies on definitions and methods within the studies, and tend to have a time lag because studies require time to produce and publish. The results of the literature review show that the majority of forest landscape restoration (88%) occurred in the early 2000s (23.6 Mha between 2000-2010), so while while thorough and systematic, is likely skewed because more time has passed to produce the primary literature from which the data were extracted. Therefore the results of the study likely underestimate or provide conservative estimates on progress. However, the literature review provides the only systematic global assessment of forest restoration progress to date.
Indicator 1.2: Tree cover gain (ha) The findings presented under this indicator come from a systematic approach for satellite-based monitoring of the biophysical progress – specifically vegetation cover – around forest landscape restoration. The analysis was conducted by a team of researchers from the World Resources Institute with data collection support from JD 4Consulting, in collaboration with the NYDF Assessment Partners and Goals 1 & 5 Expert Working Group. They draw on three data resources that are considered the best-available for monitoring biophysical progress on restoration: Collect Earth, University of Maryland GLAD tree canopy cover and height dynamics, and Trends.Earth. While these datasets each have limitations, we demonstrate their complementarity in providing a comprehensive view of progress using the Mekong Region as a case study. Top-down and bottom-up approaches to monitoring
It is important to note that reporting on indicators of tree cover gain as the sole basis for measuring progress on restoration provides a limited amount of information when it comes to measuring success and adaptively managing restoration activities. For example, analysing trends in tree cover gain does not provide many insights into why restoration interventions are (or are not) effective, nor does it help to identify and solve management issues to support efforts to scale up activities. Top-down monitoring tools, such as those derived from remote sensing, need to be complemented with bottom-up

11
Box 4. Tools for monitoring restoration
Collect Earth – Developed by the OpenForis initiative of the Food and Agriculture Organization of the United
Nations (FAO), Collect Earth functions as a survey within Google Earth, accessing high-quality satellite images
from various sources (high resolution, such as DigitalGlobe, as well as Sentinel 2, Landsat 7 and 8 and
MODIS). It uses human interpretation to record biophysical characteristics of a landscape using satellite
imagery. It allows the user to assess land cover, land use and land use change from augmented photo-
interpretation, combining very high spatial resolution images available for visualisation with processed medium
to high resolution satellite images. The premise is that the human eye can more easily detect complex land
cover types, such as agroforest (i.e., trees intermixed with cropland), that are difficult for spectral-interpretation
algorithms to identify consistently. When biophysical measurements are recorded for two points in time, then a
change assessment can be conducted. Three metrics are typically measured using Collect Earth and represent
the best utilization of the program’s capabilities—percentage tree cover or vegetation cover, the number of
trees, and the land-use type. The tool and the associated methodology for land cover and land use assessment
were developed in 2015, detailed in a publication published in 2016.34
To achieve rapid results, Collect Earth “mapathons”-- organized sessions to collect biophysical data for specific
landscapes in a group setting-- can collect a significant volume of data for an area of interest within a relatively
short amount of time (on the order of days or weeks, depending on the size of the area and number of persons
involved), and at relatively low cost. One of the advantages of using human interpretation via Collect Earth is
that it can capitalize on the involvement of local communities, as these groups bring local knowledge from the
landscape. Conversely, human interpretation by inexperienced data collectors can also lead to errors and
inconsistencies in the interpretation of features in the satellite images; however, interpretation made by local
people along with in-field validation of an adequate percentage of the plots as well as double-blind assessments
are approaches that can help to minimize errors..
University of Maryland GLAD – To better estimate net tree cover change and gain dynamics over time, the
University of Maryland’s Global Land Analysis and Discovery (GLAD) Lab recently developed a new algorithm
to map annual tree canopy cover and height. The algorithm uses freely-available Landsat imagery and lidar-
based vegetation structure prediction models.35 The algorithm improves upon the tree cover gain data from
2015,36 generating annual data on tree canopy cover and height to help identify long-term and cyclical changes
in forest cover. A prototype dataset is currently available for the lower Mekong region, which includes annual
data of both percent canopy cover and woody vegetation height in meters for the time period 2000 to 2017.
From this data set, it is possible to identify areas that have experienced changes in canopy structure and
composition over the past 18 years. The data are available for download and online analysis and serve as an
input to the SERVIR-Mekong regional land cover monitoring system.
Trends.Earth – Trends.Earth is a free and open source tool developed by Conservation International for the
assessment of land condition using Earth observation data to evaluate changes in primary productivity, land
cover and soil organic carbon at varying spatial and temporal scales (Conservation International, 2018). The
Productivity module in Trends.Earth was used to compute a land productivity trajectory analysis for the period
2001-2018. Trajectory measures the rate of change in primary productivity over time. Linear regressions at the
pixel level are run on annual integrals of NDVI to identify areas experiencing changes in primary productivity for
the period under analysis. A Mann-Kendall nonparametric significance test is then applied, considering only
significant changes those that show a p-value ≤ 0.05 (Conservation International, 2018). Positive significant
trends in annual integrals of NDVI would indicate increases in vegetation cover and biomass (Sims et al., 2017),
and potentially improvements in land condition, such as those expected under restoration management.
Significantly negative trends would indicate potential land degradation.
approaches that gauge the effectiveness of a given restoration activity with respect to its objectives. In combination, these approaches will catalyze reflection, adaptive management, and multi-scalar thinking. Bottom-up approaches, such as participatory monitoring and collaborative monitoring, provide local

12
perspective on restoration activities. Participatory monitoring, for example, incorporates a “continuum of engagement” from local people to professional researchers to collect and use of information for decision-making.37 Likewise, collaborative monitoring includes multi-party involvement but also embraces cross-scale, multi-level actors and interactions that are networked to share information and influence change.38 The integration of bottom-up and top-down approaches is important for developing a comprehensive monitoring system but is an area of research still being explored, and thus is not part of the restoration monitoring approaches included in this report. Setting a baseline for monitoring restoration
In 2016, the Food and Agriculture Organization of the United Nations (FAO) led a study that identified 467 million hectares of forest in dryland biomes that had not been previously reported, comprising a 9-percent increase in global forest cover estimates.39 This study was conducted via a series of regional Collect Earth mapathons (see Box 3), which generated a global database of nearly 500,000 sample points recording land use/land cover type, tree cover, tree count, and other variables using imagery for approximately the year 2014. While the data collection process was designed to focus on dryland biomes, the mapathons actually collected data for all biomes globally and the resulting database provides one of the few snapshots of the status of land use/land cover and tree cover worldwide, particularly for trees outside the forest. However, this database contains limited information on land use/land cover change from previous years and no information on tree cover change. As such, the data do not provide insight into changes in these statistics over time, which would indicate progress on restoration. Nevertheless, the data set a baseline for the year that the NYDF was implemented, and could be revisited in the future to identify progress on restoration. Table 2. Average percent tree cover per hectare per land use type and geographic region, as aggregated from FAO’s Global Collect Earth database, 2014
Region
No. sample
plots
Average percent tree cover per hectare per land use type
Avg pct tree cover - all land uses
Cropland Grassland
Other land
Settle-ment Wetland
Africa 122,667 6.0 4.1
0.1
7.1
1.7 3.8
Asia
110,373
6.1 2.1
0.0
12.1
1.0 4.3
Europe & Russia
74,257
4.6 2.6
0.4
12.8
1.3 4.3
North America
68,252
3.9 1.8
0.1
16.3
0.8 4.6
Oceania
21,767
2.9 1.8
0.1
10.4
1.9 3.4
South America
79,013
3.2 1.8
0.0
11.4
0.9 3.5
Total
476,329
5.2 2.6
0.1
12.4
1.2 4.3
The results indicate the significance of capturing data on trees outside the forest to provide a comprehensive picture of tree cover and restoration efforts, which include many areas that are not “traditional” forest cover (i.e., areas of land greater than 0.5 hectares, with trees higher than 5 m and canopy cover greater than 10 percent, by UNFCCC and FAO definition), such as tree cover interspersed with croplands and grasslands.40 These baseline data are shown in Table 2, summarized by major geographic region and the average percent tree cover per hectare for the IPCC categories of land use/land cover. The results demonstrate

13
that tree cover can be prevalent on land uses outside of forests. For example, in North America, tree cover on settlements averages more than 16 percent, and tree cover on croplands in Africa and Asia averages more than 6 percent (Figure 3). Figure 3. Average percent tree cover by land use type and region
Changes in land productivity as a possible measure of forest restoration
Using data from Conservation International’s Trends.Earth tool, we aimed to identify recent changes in gross primary productivity (the rate at which plants produce organic compounds) which could potentially be linked to increases in vegetation cover, or “greenness”. As such, we compared the overall long-term trends, in primary productivity (2001-2014) to a short-term analysis for the period 2015-2018 (immediately following the NYDF), using NDVI derived from MODIS satellite imagery. The map in Figure 4 shows the results of this analysis for Africa, as a demonstration of the technology. The shades of green represent areas of recent increase in primary productivity in areas with productivity that has either decreased or been stable between 2001 and 2014. While increases in primary productivity could be related to activities other than restoration (e.g., increased fertilizer application that increased crop production or increased rainfall), this analysis shows areas that indicate potential restoration. Further exploration of this data, such as in matching areas of known restoration activities with increases in primary productivity, is needed to calibrate the data to better distinguish restoration from other types of primary productivity increases. The Trends.Earth tool and output data represent an example of a global dataset that has potential to provide information on restoration progress given additional research and investment.

14
Figure 4. Areas of recent increases in primary productivity, which could be indicative of restoration, using Trends.Earth
Toward a global dataset for restoration using existing tools: Mekong Region pilot
While there are currently no global datasets that can measure progress on forest landscape restoration, a suite of existing tools and methods could be utilized to create such a global monitoring system. To showcase this potential, we developed a pilot-scale analysis for the five countries of the Mekong region – Cambodia, Laos, Myanmar, Thailand, and Vietnam-- to report progress on NYDF Goal 5 and demonstrate how, given additional investment of resources, this analysis could be improved further and scaled up to a global restoration monitoring system. Two key tools and methods form the backbone of this pilot study and are specifically geared toward two separate forms of forest landscape restoration: increase in trees inside the forest (i.e., relatively dense and clustered trees), and increase in trees outside the forest (i.e., sparse tree cover on various land uses). Trees inside the forest: GLAD Tree Canopy Cover and Height Dynamics The University of Maryland GLAD lab’s dataset of tree canopy cover and height dynamics was used to identify progress on tree cover gain inside the forest. To inform progress on restoration in the region, we evaluated the tree canopy cover data for each year from 2010 to 2017 (the year of most recent annual data). These dates were chosen for evaluation because: 1) forest change can happen relatively slowly and the period from 2010 to 2017 represents enough time to allow for significant changes to be detected by remote sensing; and 2) the Bonn Challenge, a major international forest landscape
15
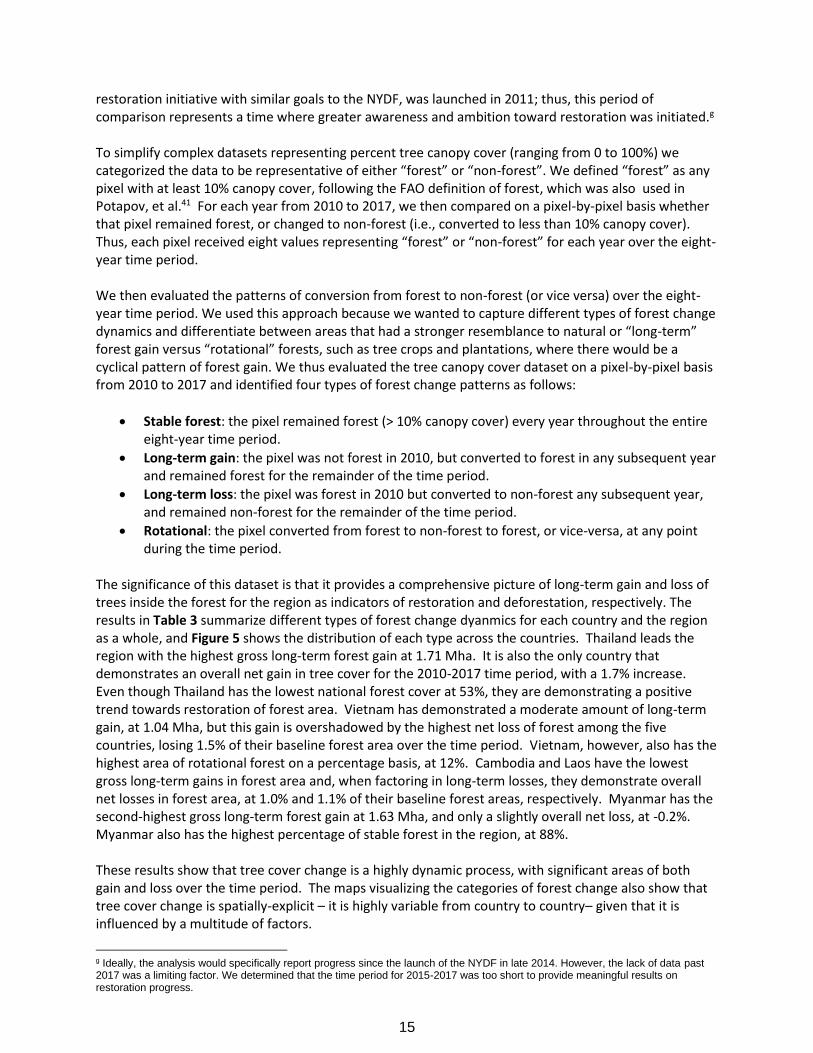
restoration initiative with similar goals to the NYDF, was launched in 2011; thus, this period of comparison represents a time where greater awareness and ambition toward restoration was initiated.g To simplify complex datasets representing percent tree canopy cover (ranging from 0 to 100%) we categorized the data to be representative of either “forest” or “non-forest”. We defined “forest” as any pixel with at least 10% canopy cover, following the FAO definition of forest, which was also used in Potapov, et al.41 For each year from 2010 to 2017, we then compared on a pixel-by-pixel basis whether that pixel remained forest, or changed to non-forest (i.e., converted to less than 10% canopy cover). Thus, each pixel received eight values representing “forest” or “non-forest” for each year over the eight-year time period. We then evaluated the patterns of conversion from forest to non-forest (or vice versa) over the eight-year time period. We used this approach because we wanted to capture different types of forest change dynamics and differentiate between areas that had a stronger resemblance to natural or “long-term” forest gain versus “rotational” forests, such as tree crops and plantations, where there would be a cyclical pattern of forest gain. We thus evaluated the tree canopy cover dataset on a pixel-by-pixel basis from 2010 to 2017 and identified four types of forest change patterns as follows:
• Stable forest: the pixel remained forest (> 10% canopy cover) every year throughout the entire eight-year time period.
• Long-term gain: the pixel was not forest in 2010, but converted to forest in any subsequent year and remained forest for the remainder of the time period.
• Long-term loss: the pixel was forest in 2010 but converted to non-forest any subsequent year, and remained non-forest for the remainder of the time period.
• Rotational: the pixel converted from forest to non-forest to forest, or vice-versa, at any point during the time period.
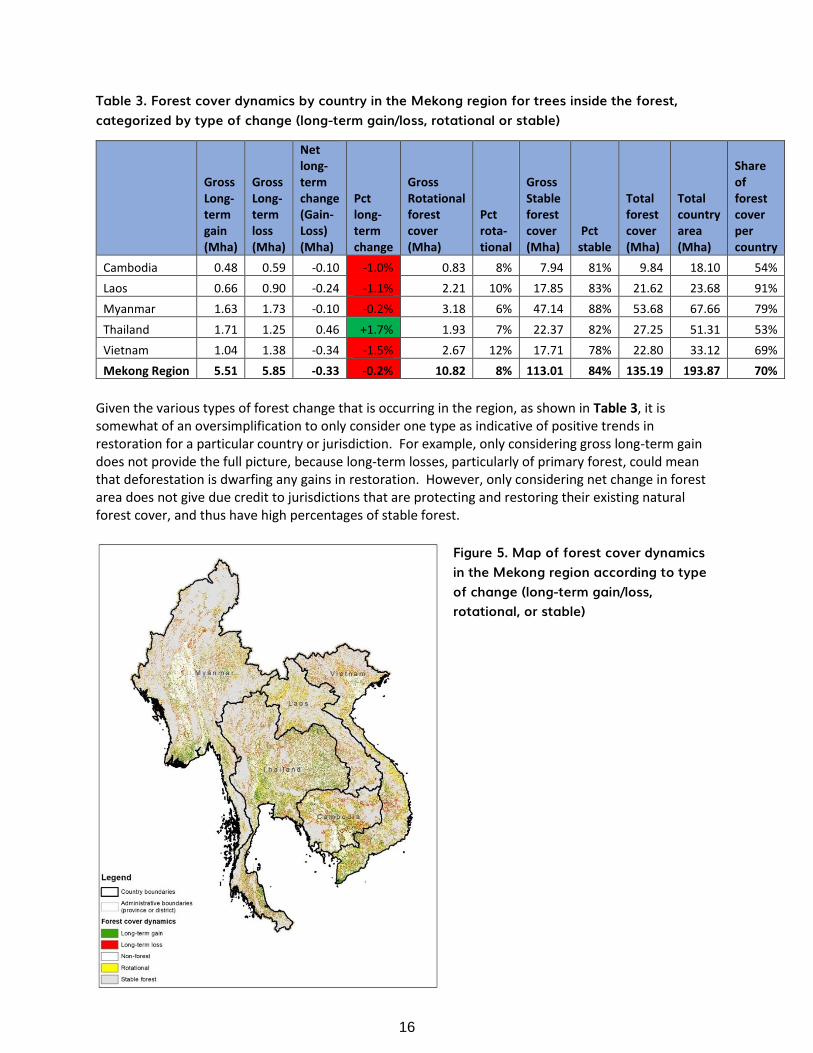
The significance of this dataset is that it provides a comprehensive picture of long-term gain and loss of trees inside the forest for the region as indicators of restoration and deforestation, respectively. The results in Table 3 summarize different types of forest change dyanmics for each country and the region as a whole, and Figure 5 shows the distribution of each type across the countries. Thailand leads the region with the highest gross long-term forest gain at 1.71 Mha. It is also the only country that demonstrates an overall net gain in tree cover for the 2010-2017 time period, with a 1.7% increase. Even though Thailand has the lowest national forest cover at 53%, they are demonstrating a positive trend towards restoration of forest area. Vietnam has demonstrated a moderate amount of long-term gain, at 1.04 Mha, but this gain is overshadowed by the highest net loss of forest among the five countries, losing 1.5% of their baseline forest area over the time period. Vietnam, however, also has the highest area of rotational forest on a percentage basis, at 12%. Cambodia and Laos have the lowest gross long-term gains in forest area and, when factoring in long-term losses, they demonstrate overall net losses in forest area, at 1.0% and 1.1% of their baseline forest areas, respectively. Myanmar has the second-highest gross long-term forest gain at 1.63 Mha, and only a slightly overall net loss, at -0.2%. Myanmar also has the highest percentage of stable forest in the region, at 88%. These results show that tree cover change is a highly dynamic process, with significant areas of both gain and loss over the time period. The maps visualizing the categories of forest change also show that tree cover change is spatially-explicit – it is highly variable from country to country– given that it is influenced by a multitude of factors.
g Ideally, the analysis would specifically report progress since the launch of the NYDF in late 2014. However, the lack of data past 2017 was a limiting factor. We determined that the time period for 2015-2017 was too short to provide meaningful results on restoration progress.
16
Table 3. Forest cover dynamics by country in the Mekong region for trees inside the forest, categorized by type of change (long-term gain/loss, rotational or stable)
Given the various types of forest change that is occurring in the region, as shown in Table 3, it is somewhat of an oversimplification to only consider one type as indicative of positive trends in restoration for a particular country or jurisdiction. For example, only considering gross long-term gain does not provide the full picture, because long-term losses, particularly of primary forest, could mean that deforestation is dwarfing any gains in restoration. However, only considering net change in forest area does not give due credit to jurisdictions that are protecting and restoring their existing natural forest cover, and thus have high percentages of stable forest.
Figure 5. Map of forest cover dynamics in the Mekong region according to type of change (long-term gain/loss, rotational, or stable)
Gross Long-term gain (Mha)
Gross Long-term loss (Mha)
Net long-term change (Gain-Loss) (Mha)
Pct long-term change
Gross Rotational forest cover (Mha)
Pct rota-tional
Gross Stable forest cover (Mha)
Pct stable
Total forest cover (Mha)
Total country area (Mha)
Share of forest cover per country
Cambodia 0.48 0.59 -0.10 -1.0% 0.83 8% 7.94 81% 9.84 18.10 54%
Laos 0.66 0.90 -0.24 -1.1% 2.21 10% 17.85 83% 21.62 23.68 91%
Myanmar 1.63 1.73 -0.10 -0.2% 3.18 6% 47.14 88% 53.68 67.66 79%
Thailand 1.71 1.25 0.46 +1.7% 1.93 7% 22.37 82% 27.25 51.31 53%
Vietnam 1.04 1.38 -0.34 -1.5% 2.67 12% 17.71 78% 22.80 33.12 69%
Mekong Region 5.51 5.85 -0.33 -0.2% 10.82 8% 113.01 84% 135.19 193.87 70%

17
In order to represent the different attributes that can all indicate positive trends in restoration, we developed an index of the different types of forest change to apply on a jurisdictional basis, to better illustrate how these different types of forest change are important. The index combines the following three attributes: percent stable forest, percent long-term gain in forest cover, and percent net change in forest cover. We summarized each of these attributes on a province-by-province basis for each country (or, in the case of Myanmar, by district). We developed a scale ranging from 1 to 10 for each attribute, where 1 is the lowest (worst) score and 10 is the highest (best) and then averaged the scores. Table 4 summarizes the indicators and scoring system. In general, an average score of 6 or greater indicates positive progress on restoration, while a score of 4 to 6 is neutral, and a score of less than 4 indicates negative progress.
Table 4. Indicators and scale for developing index of positive restoration progress for trees inside forest
Score Percent stable forest cover
Percent long-term gain
Percent net change (long term gain – long-term loss)
1 < 77.5% < 4% <-3%
2 77.5 - 80% 4 - 5% -3 - -2%
3 80 - 82.5% 5 - 6% -2 - -1%
4 82.5 - 85% 6 – 7% -1 - 0%
5 85 - 87.5% 7 - 8% 0 - 1%
6 87.5 - 90% 8 - 9% 1 - 2%
7 90 - 92.5% 9 - 10% 2 - 3%
8 92.5 - 95% 10 - 11% 3 - 4%
9 95 - 97.5% 11 - 12% 4 - 5%
10 97.5 - 100% > 12% > 5%
Figure 6 shows the results of the index for each subnational jurisdiction. As expected, Thailand has the most provinces with positive restoration progress particularly in the eastern part of the country. In Laos, the majority of provinces demonstrate negative progress. In Vietnam, the majority of the northern and central provinces are negative, with a concetration of positive progress in the south,and small pocket in the north. Cambodia is mostly negative, with a concentration of positive progress in the south bordering Vietnam. Myanmar is mostly neutral and negative, with positive pgoress in the south and central districts.

18
Figure 6. Index of restoration progress for trees inside the forest by subnational jurisdiction
Trees Outside the Forest: Collect Earth Collect Earth was used to measure tree cover that exists on multiple types of non-forest land uses and for varying densities of tree cover. As a tool, Collect Earth is suited for this type of data collection because it relies on very-high-resolution imagery and human interpretation, which can distinguish subtleties in tree cover and land use that are often undetected using algorithm-based remote sensing techniques. For this pilot study, a Collect Earth mapathon was undertaken that collected data for more than 16,000 survey plots in the Mekong region. The plots spanned each of the five Mekong-region countries at equal intervals of either 10 or 12 km. The survey collected data on land use/land cover, tree count, and percent tree cover for two points in time: 2010 and 2018, so that change could be detected and quantified between these time periods to provide information on restoration progress. Table 5 presents the average change in tree cover for each country in the Mekong region for each type of land use. Vietnam, Thailand and Myanmar had overall increases in average tree cover outside forests, while Cambodia and Laos had overall decreases. In each country, increases in tree cover on grasslands, croplands, and bushlands/shrublands were most prevalent. In terms of the gross area, all countries except Laos had a net gain in tree cover outside of forests, with Myanmar experiencing the highest net gain. In total, 4.68Mha of non-forest lands had an increase in tree cover across the Mekong between 2010 and 2018.
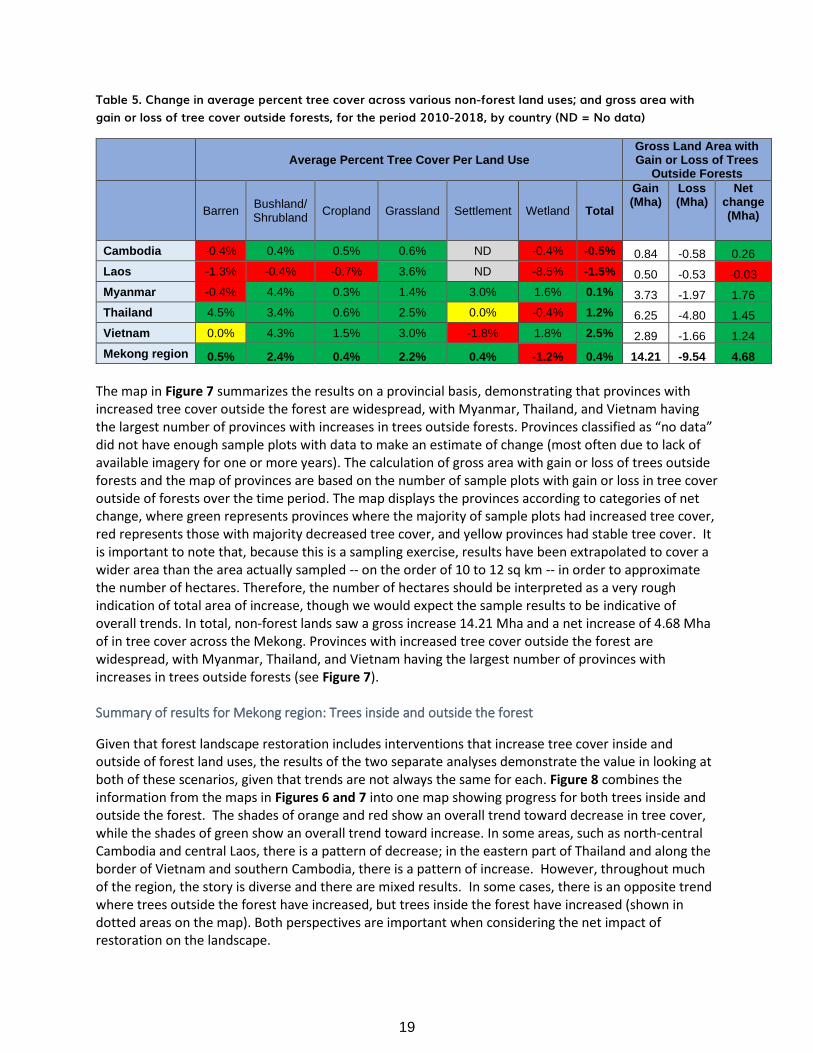
19
Table 5. Change in average percent tree cover across various non-forest land uses; and gross area with gain or loss of tree cover outside forests, for the period 2010-2018, by country (ND = No data)
Average Percent Tree Cover Per Land Use Gross Land Area with Gain or Loss of Trees
Outside Forests
Barren Bushland/ Shrubland
Cropland Grassland Settlement Wetland Total
Gain (Mha)
Loss (Mha)
Net change (Mha)
Cambodia -0.4% 0.4% 0.5% 0.6% ND -0.4% -0.5% 0.84 -0.58 0.26
Laos -1.3% -0.4% -0.7% 3.6% ND -8.5% -1.5% 0.50 -0.53 -0.03
Myanmar -0.4% 4.4% 0.3% 1.4% 3.0% 1.6% 0.1% 3.73 -1.97 1.76
Thailand 4.5% 3.4% 0.6% 2.5% 0.0% -0.4% 1.2% 6.25 -4.80 1.45
Vietnam 0.0% 4.3% 1.5% 3.0% -1.8% 1.8% 2.5% 2.89 -1.66 1.24
Mekong region 0.5% 2.4% 0.4% 2.2% 0.4% -1.2% 0.4% 14.21 -9.54 4.68
The map in Figure 7 summarizes the results on a provincial basis, demonstrating that provinces with increased tree cover outside the forest are widespread, with Myanmar, Thailand, and Vietnam having the largest number of provinces with increases in trees outside forests. Provinces classified as “no data” did not have enough sample plots with data to make an estimate of change (most often due to lack of available imagery for one or more years). The calculation of gross area with gain or loss of trees outside forests and the map of provinces are based on the number of sample plots with gain or loss in tree cover outside of forests over the time period. The map displays the provinces according to categories of net change, where green represents provinces where the majority of sample plots had increased tree cover, red represents those with majority decreased tree cover, and yellow provinces had stable tree cover. It is important to note that, because this is a sampling exercise, results have been extrapolated to cover a wider area than the area actually sampled -- on the order of 10 to 12 sq km -- in order to approximate the number of hectares. Therefore, the number of hectares should be interpreted as a very rough indication of total area of increase, though we would expect the sample results to be indicative of overall trends. In total, non-forest lands saw a gross increase 14.21 Mha and a net increase of 4.68 Mha of in tree cover across the Mekong. Provinces with increased tree cover outside the forest are widespread, with Myanmar, Thailand, and Vietnam having the largest number of provinces with increases in trees outside forests (see Figure 7). Summary of results for Mekong region: Trees inside and outside the forest
Given that forest landscape restoration includes interventions that increase tree cover inside and outside of forest land uses, the results of the two separate analyses demonstrate the value in looking at both of these scenarios, given that trends are not always the same for each. Figure 8 combines the information from the maps in Figures 6 and 7 into one map showing progress for both trees inside and outside the forest. The shades of orange and red show an overall trend toward decrease in tree cover, while the shades of green show an overall trend toward increase. In some areas, such as north-central Cambodia and central Laos, there is a pattern of decrease; in the eastern part of Thailand and along the border of Vietnam and southern Cambodia, there is a pattern of increase. However, throughout much of the region, the story is diverse and there are mixed results. In some cases, there is an opposite trend where trees outside the forest have increased, but trees inside the forest have increased (shown in dotted areas on the map). Both perspectives are important when considering the net impact of restoration on the landscape.

20
Figure 7. Summary of change in tree cover for trees outside the forest by country and subnational jurisdiction
Gross Land Area with Gain or Loss of Trees
Outside Forests
Gain (Mha) Loss (Mha) Net change
(Mha)
Cambodia 0.84 -0.58 0.26
Laos 0.5 -0.53 -0.03
Myanmar 3.73 -1.97 1.76
Thailand 6.25 -4.8 1.45
Vietnam 2.89 -1.66 1.24
Mekong region
14.21 -9.54 4.68
Figure 8. Change in trees inside and outside the forest by subnational jurisdiction

21
Case study of Vu Quang district, Vietnam Vu Quang is a district located on the western edge Han Tinh province along the border of Vietnam and Laos. It is characterized by steep, mountainous terrain and dense rainforest in the western part of the district. A detailed Collect Earth exercise was conducted for this district, where survey plots were distributed at 1 km intervals. For survey plots where there was imagery available for both 2010 and 2018 (490 plots total), changes in land use and average tree cover could be calculated. Table 6 provides a summary of where changes in land use occurred, via a matrix that compares land use in 2010 (rows) to and use in 2018 (columns). While the majority of survey plots remained stable, most of the change that did occur was a shift from forest into other land use types, particularly cropland and wetland, which indicates a net loss in forest cover. For example, 2,300 ha of land that was forest in 2010 was converted to cropland in 2018, and an additional 1,300 ha and 12 ha, respectively, was converted from forest to bushland/shrubland or grassland. However, in terms of restoration, there was also progress of note: a total of 1,400 ha that was either cropland or grassland in 2010 became forest. The map in Figure 9 provides a visualization of this land use change matrix, showing which plots shifted from one land use to another. In the map, the encroachment of cropland, wetlands, and settlements from east to west into previously forested areas is evident. Table 6. Matrix of land use change in Vu Quang district between 2010 and 2018
Land Use 2018 (ha)
Land Use 2010 (ha) Barren Bushland/ Shrubland
Crop-land Forest
Grass-land
Other Land
Settle-ment
Wet-land
Total (2010)
Barren 0 0 0 0 0 0 0 0 0
Bushland/ Shrubland 0 400 400 0 200 0 100 100 1,200
Cropland 0 0 4,900 700 200 0 100 200 6,100
Forest 0 1,300 2,300 32,300 1,000 200 200 1,200 38,500
Grassland 100 0 200 700 500 0 0 0 1,500
Other Land 0 0 0 0 0 0 0 0 0
Settlement 0 0 0 0 0 0 800 100 900
Wetland 0 0 0 0 0 0 0 800 800
Total (2018) 100 1,700 7,800 33,700 1,900 200 1,200 2,400
Change from 2010 to 2018
100 500 1,700 -4,800 400 200 300 1,600
+100% +42% +28% -12% +27% +200% +33% +200% In terms of average tree cover, as shown in Figure 9, bushland/shrubland, cropland and wetlands all demonstrated increases in tree cover, which provides evidence of restoration of trees outside the forest. Settlements, grasslands, and forest indicated declines in tree cover, thus indicating increased degradation of these land use types. The Google Earth images in Figure 10 provide an example of a survey plot where tree cover increased from 2010 to 2018.

22
Figure 9. Change in land use type in Vu Quang district from 2010 to 2018 as evaluated in Collect Earth surveys
Figure 10. Google Earth images of a Collect Earth survey plot showing change in tree cover from 2010 (left) to 2018 (right) in Vu Quang district

23
Figure 11. Average percent tree cover by land use type in 2010 and 2018
Case Study: On-Farm Tree Cover in Malawi In many parts of the developing world, restoration activities are focused on adding trees to mosaic landscapes, such as croplands and village lands, to leverage the benefits that trees provide to people and their livelihoods. In Malawi, a small land-locked country in southeastern Africa, the national government has developed a comprehensive National Forest Landscape Restoration Strategy that prioritizes tree-based restoration of agricultural landscapes. As a country that has a growing population, high incidence of poverty, and high dependence on subsistence farming, one of the main motivations for this restoration approach is to scale-up practices that increase productivity of cropland and reduce dependence on mineral fertilizers. One such approach is farmer-managed natural regeneration (FMNR), where the farmer selects and cultivates trees on his or her cropland at sparse intervals. The trees interspersed with crops stabilize the soils from erosion, and the fodder provides a natural source of fertilization. Over the past several decades, anecdotal evidence has shown that FMNR has increased in many parts of Malawi thanks to the efforts of local non-profit organizations, extension services, and peer-to-peer learning, but there have been limited studies that have quantified the extent of the practice. One such tool that has been used to quantify the extent of on-farm tree cover is the Tree Cover Density Mapping Tool developed by the U.S. Geological Survey as an add-on to ArcGIS software. Similar to Collect Earth, it applies a grid-based sampling approach of tree density visible on high-resolution imagery (e.g., Google Earth) to count the number of the trees touching the calibrating grid for each sample plot. This visual-interpretation approach is best-suited to measure tree density outside of the forest, such as on cropland. The Tree Density Mapping Tool was used to measure on-farm tree cover in two districts in the central region of Malawi: Dowa and Mchinji. The maps in Figure 12 show the percent of on-farm tree cover in 2009 (top) and 2017 (center), and the change in density between the two dates (bottom). The maps show that on-farm tree cover is widespread in the two districts and densities are quite high, particularly in Mchinji district. The map of change shows that, overall, there was widespread stability in tree density, with a slightly a higher incidence of increase than decrease in the two districts collectively. In
0.0
10.0
20.0
30.0
40.0
50.0
60.0
70.0
80.0
90.0
100.0
Average Percent Tree Cover 2010 Average Percent Tree Cover 2018

24
Figure 22. Comparison of on-farm tree cover in the Mchinji and Dowa districts of Malawi, in 2009 (top) and 2017 (middle), in percent, and direction of change between the two periods (bottom)
Note: These maps of on-farm percent tree cover were prepared manually from visual analysis of high resolution imagery from the years 2009 and 2017. The method used area frame samples spaced at 2-kilometer intervals on a regular grid. Percent tree cover was quantitatively measured using a 100-dot calibration grid within each area frame. Only area frames falling on cropland were analyzed for tree cover. Source: U.S. Geological Survey (USGS) and U.S. Agency for International Development (USAID).

25
Mchinji, there was much higher incidence of sample plots with increase, while in Dowa district, there were slightly more plots with a decrease. These results show that there are multiple methods and tools available to measure progress on restoration for trees outside the forest. In order to capture the full picture of restoration progress, it is important to include methods for measuring trees outside forests in the monitoring protocol.
Criterion 2: Political and socio-economic advancements towards forest landscape restoration Bringing large tracts of degraded land into restoration to create diverse and lasting benefits often requires transformative processes including policy change, increasing and leveraging existing financial resources and strengthening national implementation and monitoring capacities. In the following indicators, we provide findings and case studies on FLR efforts, including commitments, uptake, and financial support as a proxy for progress on restoration.42
Indicator 2.1: High-level pledges Forest landscape restoration targets in the public sector
National governments have put forth the majority of restoration pledges since the Bonn Challenge launched in 2011, and they are expected to continue to lead the process of implementing their pledges. As of April 2019, there are 58 Bonn Challenge pledges from government, sub-national governments, and companies totaling 170.47 million hectares of restoration commitments for 2020 and 2030 combined.43 Additionally, an analysis of FLR in countries’ nationally determined contributions under the Paris Agreement found that 49 NDCs (30 percent) have quantitative restoration-aligned targets for mitigation and/or adaptation.44 There are approximately 56.7 million hectares of FLR-aligned activities (i.e. planted forests and woodlots, silviculture, assisted regeneration, watershed mangrove restoration, agroforestry, and improved fallow) under NDCs’ unconditional or conditional targets. On March 1, 2019, the United Nations declared a Decade on Ecosystem Restoration, starting in 2020, to scale up the restoration of degraded and destroyed ecosystems as a proven measure to fight the climate crisis and enhance food security, water supply, and biodiversity. Restoration plans for two thirds of the total pledged area under the Bonn Challenge indicate that about half (45 percent) of commitments will be met by planting monoculture tree plantations, one third (34 percent) of the area will be allowed to naturally regenerate, with agroforestry accounting for the remainder (21 percent).45 While increasing the area of tree plantations may support local economies and should not be downplayed,46 this will not provide the same benefits for the climate as regenerating natural forests. On average, natural forests store 40 times more carbon than plantations and 6 times more than agroforestry.47 Another key aspect when considering public sector restoration targets is whether the country is committed to indigenous peoples and local community (IPLC) tenure rights for natural resources. An analysis conducted by the Rights and Resources Initiative identified 24 countries that made a clear commitment to strengthen or expand indigenous people or local community tenure of natural resource management in the NDCs.48 When IPLCs have full land rights to govern forest territories, these forests and the carbon they store are better protected over time (see Goal 10).49 Of these, half are in the context of restoration-oriented activities. In general, African countries were more likely to recognize a clear role for IPLC tenure and management rights than other regions. The importance of incorporating land tenure issues is critical and often overlooked during FLR planning. The Center for International Forestry Research recently proposed a diagnostic to this end (see Indicator 2.2).

26
Private sector commitments to support forest landscape restoration
As of June 2019, 481 companies had made commitments to address deforestation in their supply chains (see Goal 2). A smaller, but growing, number are also beginning to make pledges that include restoration activities. The nature of the pledges ranges from making explicit restoration commitments to embedding regenerative strategies into their business models, supply chains, or sustainability commitments. “Net-zero deforestation” commitments may also involve the use of reforestation as a means of offsetting deforestation taking place throughout supply chains. However, it is important to note that net-zero commitments and restoration can not compensate for the irreplaceable forest loss that is taking place because of agricultural expansion (see Goal 1). Based on consultations with experts and desk research, we identified a sample of 16 major companies that include elements of forest landscape restoration in their plans to transition to sustainable supply chains.h Of the 16 companies analyzed, only a third had explicit, quantified commitments (e.g. hectares, number of trees, or amount of money to be invested or donated) related to FLR activities. In most cases, these commitments were not overarching targets, rather pledges of support to individual FLR projects. An additional seven companies did not have specific commitments, but mentioned using FLR activities to implement their sustainability strategies. Some companies such as, Olam and Marks & Spencer, are currently assessing their sustainability frameworks and plan to share more concrete plans by 2020, which may include quantified FLR commitments. This, however, is not reflective of progress toward implementation.
Box 5. Planning tools for FLR The Restoration Opportunities Assessment Methodology (ROAM) was developed jointly by IUCN and the World Resource Institute. The ROAM methodology serves as an assessment tool to identify restoration potential and supports the development of restoration programmes as well as landscape strategies. At the stage of identifying and analysing areas applicable for FLR, ROAM assists to define priority areas and provides a shortlist of relevant and feasible restoration intervention types. In addition, the tool provides information about finance and investment options for restoration, estimates carbon sequestered and breaks down costs and benefits for each intervention type. Hence, the tool serves as a supporting framework throughout the project design and implementation for restoration activities. ROAM comes with complementary guidelines, focusing on different sub-aspects of restoration. The biodiversity guideline (for forest landscape restoration opportunities assessment) accompanies the main assessment by providing more context, resouces and perspectives on the interface of biodiversity conservation and FLR. To support communication of the importance of ecosystem services to decision makers, the Restoration Opportunities Optimization Tool (ROOT) was developed while the Gender-responsive ROAM guidelines assists in a gender analysis, addressing potential impacts and risks of gender-based exclusion throughout the planning process. The Restoration Diagnostic was developed as part of the ROAM. IUCN and WRI looked back on historical landscape restoration to identify key success factors for FLR. The assessment tool analyses conditions within landscapes and determines which factors for successful FLR are in place and which ones are missing. The method supports stakeholders and decision makers in identifying gaps and focusing their efforts on promising measures to maximize the success of FLR projects. The Collaborative Forest Landscape Restoration Monitoring Diagnostic developed by CIFOR provides a systematic way for planners to assess their FLR initiatives against a checklist of success factors in order to determine if they are ready for collaborative monitoring and identify what elements need to be strengthened.
h The companies assessed were: Coca-Cola, International Paper, Kimberly Clark, H&M, Procter & Gamble, Natura – The Body
Shop, Olam, Kingfischer, Taylor Guitars, Marks & Spencer, IKEA, 3M, Apple, Komatsu, Travelers Companies Inc., Michelin.

27
Collaborative monitoring brings landholders, indigenous groups, government entities, NGOs or other crucial actors toward common FLR goals while tracking progress towards those goals. The diagnostic can be applied in at least two scales: it includes factors to be used at a specific FLR site and it outlines the factors that are intrinsic to a multi-level collaborative monitoring system. It consists of a core matrix of 42 success factors, plus suggestions for performing the assessment. CIFOR has also proposed a tenure diagnostic for assessing restoration opportunities.50
Indicator 2.2: Planning and implementation steps for restoring forests The importance of planning for FLR
Successfully implementing FLR requires planning that includes systematic site identification, identifying and developing appropriate activities for specific contexts, enacting new policies (and leveraging existing policies), committing finance (and leveraging existing existing finance), and improving monitoring capacities. Tools such as the Restoration Opportunities Assessment Methodology and The Restoration Diagnostic (Box 5) can help to facilitate and support these processes. Embedding FLR commitments into national plans is also an important way to support FLR implementation. National plans are often used as a roadmap for delivering on international commitments and may be embedded into international initiatives such as AFR 100 and Initative 20 x 20 (Box 6). Decision support tools for FLR51 can help to identify important trade-offs and synergies between different restoration objectives and potential outcomes, as well as to evaluate the cost-effectiveness of restoration interventions at different spatial scales. Decision support tools can be used to prioritize regions and specific sites for restoration, based on single or multiple criteria, including provision of particular types of ecosystem services.
Box 6: Examples of forest landscape restoration initiatives AFR 100. The African Forest Landscape Restoration Initiative targets the restoration of 100 million hectares by 2030. Twenty-six countries have pledged to tackle 9152 million hectares so far, which shall be funded by USD 1 billion from the African Climate Business Plan by the World Bank and USD 500 million from private investors. Initiative 20x20. Aims to restore at least 20 million hectares by 2020 within Latin America and the Caribbean. Under this approach, more than USD 2 billion have been raised from investors and in 2019, government partners committed to restore 50.1 million hectares of land while projects underway cover at least 14 million hectares. Mediterranean Agadir commitment. Endorsed in 2017 by nine countries in south Europe and the Sahel region, aims to restore at least 8 million hectares by 2030. Astana Resolution. In 2018, Armenia, Georgia, Kazakhstan, Kyrgyzstan, Tajikistan and Uzbekistan committed to bring above 2.5 million hectares into restoration by 2030. Bilateral funding programs will most likely provide funding for restoration interventions and all countries of the Caucasus and Central Asia have access to allocations from the GEF, which will expand support for restoration in GEF-7 cycle. 53 Argentina: ForestAR 2030. A concerted initiative of the Argentine government that The Nature Conservancy led by Argentina’s Secretary of Environment and Sustainable Development, in collaboration with different federal ministries (AgroIndustry, Science and Technology, Production and Education) and private actors (including universities, communities and NGOs). ForestAR 2030 is developing a broad stakeholder vision and strategy to both conserve natural forests and create a new sustainable forest economy, recognised as the most significant means through which to deliver on the country’s commitment to reducing climate change. ForestAR seeks to support Argentina’s restoration and reforestation goals that, according to the National Plan for Forests and Climate Change, have an important mitigation potential after sustainable forest management and avoided deforestation. Efforts, initially applied in the Atlantic Forest, in Selva Misionera, include the development of a restoration protocol to monitor forest restoration projects, evaluate their success, identify best practices and implement corrective actions.

28
Green Climate Fund (GCF) and Global Environment Facility (GEF). More than 14.3 million hectares of conservation and restoration around the world are planned through GCF and GEF projects.54 Activities include improved management, forest and landscape restoration, agroforestry, sustainable agriculture and pasture management, and others. However, so far only 4 percent of this has moved beyond the approval phase. The majority of these projects are in tropical regions in Latin America, West Africa and Southeast Asia. GEF6 invested USD 300 million in restoration. GEF7 will add to that when they add USD 95 million to drylands sustainable forest management.
Insights from the Bonn Challenge: Success factors for implementing FLR
Since 2017, the International Union for Conservation of Nature (IUCN)-led Bonn Challenge Barometer has worked with government officials, implementing agencies and practitioners in various countries to define parameters of FLR success, identify appropriate progress indicators, and develop appropriate reporting structures with quality control measures. “Success factors” for FLR are identified as policies and institutional frameworks, financial flows and technical planning that create the enabling conditions needed for FLR implementation . To date the Barometer is obtained though data collection led by by IUCN staff or consultants, through in country consultations and multisectoral expert meetings, document analysis and mining publically available databases maintained by government agencies. This process entails adhering to the systematic framework, using a consistent dataform database and guidelines found in the Barometer Protocol. To indicate the degree accuracy and specificity of data, and thereby support transparency and flexibility in the use of differing data sources across countries, a three tier system of data categorization was used by pledgers reporting on quantitative indicators. In some cases, data collection was also conducted by IUCN staff and consultants. In 2018, a total of 19 countries out of 51 Bonn Challenge pledgers provided data to IUCN in the Second Bonn Challenge Progress Report.55 Detailed, in-depth application and information, however information, however, currently remains limited to six countries. In this section, we highlight “success factors,” or developments from those countries to provide an example of how FLR is unfolding in different countries and contexts.56 United States
In the United States, the implementation of FLR activities was achieved through policy changes that provided guidance for restoration and joint implementation efforts within Federal Agencies responsible for federal land management. Much of the restoration undertaken in the US was to resolve forest management issues concerning fire and pests, and to restore and protect watersheds. These commercial, safety, and water security issues helped the US justify its 8 billion USD public-spending on restoration. The USA’s Bonn Challenge commitment was made possible by the USFS’s dedication to FLR which was supported and realized by a broad range of actors consisting of NGOs as well as private and public organisations. The official Forest Service Manual “Chapter 2020: Ecosystem Restoration” and the Agricultural Act of 2014 sustain the USFS’s progress towards it’s restoration targets. Brazil Brazil reported large areas of regeneration in the Amazon, established through improved land governance that allowed coordination and implementation of restoration efforts across public and private sectors.57 Contributions to the Bonn Challenge serve two vegetation-recovery related targets of the Brazilian government: NDC and PROVEG. Several policies and instruments support FLR implementation such as the National Policy on Climate Change, the Native Vegetation Protection law as

29
well as the National Conservation Areas System and National Biodiversity Strategy. These policy developments are accompanied by community engagement of a strong social and environmental movement, including for example, the Brazilian Coalition on Climate, Forests and and Agriculture as well as the Atlantic Forest Restoration Pact. The Atlantic Forest Restoration Pact, which pledged 1 million hectares to the Bonn Challenge, documents the restoration of estimated 673,510–740,555 ha of native forests from 2011 to 2015 (included in the literature review in indicator 1.1)58. The government’s planning for restoration included both ecological and financial criteria to select priority areas, and Brazil used ROAM in five states and remote sensing (TerraClass) estimate the restoration potential and map it across their landscapes. These planning efforts were bolstered by cross-ministry coordination in policy design and implementation, which is instrumental in restoration implementation across different biomes. The government also provided support to private landowners to meet their legal requirements under the Forest Code, which in turn enabled restoration on additional lands. The sustainability of these efforts is uncertain in the light of the change in government in Brazil and the policy priorities of the new government.59
Rwanda
Rwanda has incorporated forest restoration into its sustainable development agenda, and critical to its success thus far is the strong policy framework that encompasses the multitude of FLR-aligned policies enacted in 2018 and a commitment of public expenditure toward FLR actions. Further strengthening, especially of forest and environment related policies, as a response to new conventions by the government and prevailing concerns such as climate change point to the importance of a low-carbon development approach to the country. The planning in Rwanda began with ROAM in 2014 and the results identified agroforestry and other restoration types as priorities, which led to the adoption of an Agroforestry Strategy and Action Plan for 2018-2027, among other long-term policies, demonstrating the country’s intentions through committed public expenditures, the share of this going into supporting FLR, and attracting international donor support. El Salvador
In central America, El Salvador set an example with the El Salvador’s National Ecosystem and Landscape Restoration Program (PREP in Spanish) developed and facilitated by the Ministry of Environment and Natural Resources (MARN) in 2013. PREP has evolved into an operational action plan and includes a monitoring system with a main FLR activity database. Building on PREP, MARN implemented ROAM in cooperation with IUCN and other national parties in 2016 and 2017. As a result the national restoration action plan and strategy for 2018-22 was refined and MARN pledged to take responsibility for the restoration of 400,000 ha. PREP is complemented by the National Forest Policy with sustainable water and soil management goals as well as a series of actions to restore ecosystems and increase forest cover, led by the Ministry of Agriculture and Livestock (MAG). A large portion of FLR interventions that have been applied are dominated by agroforestry and silviculture. Sri Lanka and Quintana Roo, Mexico to be added.
Despite the differences between these national contexts, common success factors include: 1. Coherent policies and institutional support for FLR; 2. Technical planning and prioritization methods that incorporated a multidisciplinary approach and involved multi-sectoral agencies and land use stakeholders to account for multiplevarious objectives; and 3. Directing significant

30
financial flows to restoration activities60. On the otherhand, intersectoral coordination in planning and implementation still require strengthening in order to have a greater return on investment and increase the efficiency and impact of FLR actions. Improved cross-sectoral coordination is needed, for example, between the agricultural and environmental sectors on planning and budgeting for FLR actions that fall under diverse sectoral portfolios. Under-estimation of financial flows already supporting FLR is quite likely, as informal and in-kind contributions made to support FLR implementation are not being factored into the financial flows estimates across the suite of pledgers applying the Barometer. This is an intrinsic challenge in obtaining comprehensive data on one of the key enabling conditions – financial flows - affecting FLR implementation, yet an important gap to close to understand differences in restoration implementation rates, impacts, and identify needs to direct support to. A third area of continued work is to clarify what “under restoration” and the area accounted as under FLR implementation effectively means. Within the Barometer framework the measure of on-the ground implementation is the area under restoration indicator measured in hectares. Clearly a multiciplity of FLR approaches have been used in countries, and it is important that distinctions between these are clearly considered and articulated61. Reporting on area under restoration for the in-depth countries was restricted to the land area receiving treatment (planting, silviculture, etc), while the ecosystem service flows from halting and reversing degradation could extend to a larger area. Measuring and monitoring restoration approaches adhering to the FLR principles should consider ways to meet these gaps. Advances in Argentina: Lessons from ForestAR 2030
Another example of progress where the enabling environment conditions for FLR activities are being developed is in Argentina. Through ForestAR 2030, dedicated work has taken place over the past year across a number of fronts including science and conservation, public policy, markets, finance, innovation, communication, mobilization, and leadership. While all of these are equally important ion their own right, leadership was seen as critical into ensuring alignment and ownership for the transformation being proposed. Through a cooperative engagement process, the following vision was defined for the program: “Argentina recognises the potential of its forests, and values the ecosystem services they deliver, most significantly in their role to mitigate climate change. By 2030, forests will be used sustainably, generating opportunities which strengthen the regional economies. In the international arena, Argentina is a trusted and competitive player in the global markets of forest based products.” This is now being developed into a Strategic Plan through 2030, by those same actors.
A review of the main pieces of federal legislation related to forests shows that Argentina has been introducing the concept of sustainable development in line with International Conventions, both at the national and provincial levels, seeking to balance a productive approach with one of protection and conservation. There is, however, no centralized record keeping system nor enforcement mechanisms to foster forest protection. By offering mechanisms for transparency of information, through innovative technology-based information systems, such as the Integrated Restoration system (IRS), the carbon calculator and Agroideal, ForestAR 2030 offers a consolidated, unique monitoring and control system, where obligations and standards are clearly presented, facilitating enforcement and incentivizing producers to protect and manage lands in sustainable ways. The IRS offers a dashboard that stores and manages information related to National Restoration Program at the national level, allowing the visualization of the amount of reforested area, the carbon stored, the jobs generated and the investments in different projects. The aspiration is to apply this system to also include commercial plantations. The

31
carbon calculator also allows for providing information to estimate the amount of carbon stored throughout the country, including lands subject to the conservation categories of the Forest Law. Agroideal, a computer tool used by soy and meat traders to make strategic decisions that comply with different socio-environmental commitments, will be adapted to enable the planning strategy for the expansion of commercial plantations.
Scientific work has been focused on addressing these gaps through the development of an integrated information platform composed of a registry of restoration efforts, a cadastre, and a dashboard and the capability to deliver both conservation and social metrics.
Indicator 2.3: Finance for forest landscape restoration activities
The availability and access to finance is essential to the achievement of FLR commitments (Box 7). According to the Bonn Challenge Barometer, USD 9.5 billion has been commited for FLR activities in the United States, and a cumulative of USD 1 billion in Brazil, El Salvador, Mexico, and Rwanda.62 While all the finance in the United States comes from domestic sources, the finance in the other countries consists of domestic public expenditures and philanthropic and non-profit contributions, international donor support, and private investment.
Box 7. Financing needs for forest landscape restoration
If FLR activities are to be scaled up to meet global goals, the expected costs of FLR projects must be clearly
communicated to investors, donors, and other financiers. According to estimates produced by The Economics
of Ecosystems and Biodiversity, global cost-per-hectare estimate of FLR range from USD 2,390 to USD 3,450
(Table 7), depending on the activity and type of restoration.63
The cost estimates were derived from 95 peer-reviewed studies on FLR projects and consider factors such as
the forest biome.64 Opportunity costs of forgoing alternate land uses are not included within these cost
estimates. Additionally, the costs of individual projects will vary from site to site according to degree of
degradation and specific social, political, and biophysical characteristics and circumstances. Another limitation
to estimating the financial need for FLR activities is the lack of detailed reporting of observed costs in academic
literature. A larger body of reliable cost reporting is needed for more accurate global estimates of the cost of
FLR projects.65 It should also be noted that much tree planting to date has been conducted by the private sector
as a for-profit investment.
Domestic public finance in support of FLR
Countries are mobilizing or reallocating domestic funding for restoration in a number of ways. In some countries, National Forest Funds (NFFs) are used to directly finance FLR projects (Box 8). They can relieve financial and social barriers for rural communities, small and medium-enterprises, and smallholders when trying to secure financing from other sources while promoting FLR projects on the
Table 7. Estimated cost to implement forest landscape restoration targets Initiative/target Land area
(million ha)
Time frame Estimated budget required
(billion USD)
Total Annual
Bonn Challenge 150 2011-2020 359 - 518 36 - 52
NYDF 350 2014-2030 837 – 1,208 49 - 71
Source: Adaptation of FAO and Global Mechanism of the UNCCD, 2015 following TEEB, 2009b

32
ground. Their position allows them to draw financing from multiple sources while encouraging private investment. Domestic sources include general and special taxes, international sources can be bilateral and multilateral DFIs, as well as global climate funds participating in REDD+ funding and payment schemes. Similarly, ecological fiscal transfer schemes are a mechanism through which results-based finance for restoration activities can be accessed and allocated.
Box 8. Examples of domestic finance in support of FLR
National Forest Funds
Costa Rica’s National Forestry Finance Fund (FONAFIFO), one of the first of its kind, takes on a more
decentralized structure. It operates as a trust fund independently administered by an appointed governing
board that transfers ownership and rights of projects to trustees. FONAFIFO’s primary source of funding is a
special fuel tax, and other sources include the GEF and PES contributions from hydropower companies. The
Fund disperses financial services through intermediary NGOs like Fundación para el Desarrollo de la Cordillera
Volcánica Central (FUNDECOR), who provide technical support to improve the impact of financing. The
monitoring, reporting and verification is then outsourced to the private sector.66
The National Climate and Environment Fund of Rwanda (FONERWA), takes on a more centralized structure of
national forest funds. The Government of Rwanda consolidated their pre-existing institutional infrastructure with
FONERWA absorbing the forest fund and instead operates with one funding window alongside other climate
windows. The Fund’s capital sources include environmental fines and fees, forestry and water funds, seed
financing from stakeholders, and inspection fees. Funds are dispersed through two primary channels. The
public sector goes through the Environmental Management Authority, and the private sector receives funds
from the Rwanda Development Bank.67
Ecological fiscal transfers
In India, the National Finance Commission (NFC) committed in 2014 to allocating between USD 6.9-12 billion
per year in tax revenue to incentivise forest cover among Indian states. This reform saw the NFC add forest
cover to the formula for calculating horizontal distribution of transfers between states, with 7.5 percent of
funding based on level of forest cover relative to levels measured by India’s 2013 forest survey, alongside
measures of population, fiscal capacity and area.
In Brazil, a federal program aims to create a consensus-based, decentralized arrangement for accessing and
allocating results-based finance. The ICMS-Ecologicó (ICMS-E) is an ecological fiscal transfer scheme that
redistributes a portion of the broad consumption-based value-added tax revenue from the sale of goods and
services, from state governments to municipal governments based on ecological indicators. It was first
implemented in the state of Parana in the year 1991, and has since been implemented in 17 out of 26 states in
Brazil. The first scheme was designed to compensate municipalities in Parana for lost opportunity costs due to
forest land being protected from development.
In Costa Rica, work towards launching one of the first nationalised PES services began in 1996 and ultimately
formed Costa Rica’s national forest fund, FONAFIFO. The PES approach has received some criticism and
impact evaluations have yet to show that there has been positive impact on ecosystem services and halting of
deforestation from PES itself, yet forest cover has increased since implementation, with progress attributed to a
mixture of ecological policies in the country.68 Forest cover has gone from 26% of land area in 1983, to over
51% by 2013.69
The role of markets and innovation in financing restoration
Deforestation is often the result of economic development and incentives with a short payback period.70 A successful forest economy and sustainable market for forest products would provide positive

33
economic incentives for landowners to encourage natural regrowth, enable forests to become more valuable and competitive with other land uses, increase demand for sustainable wood-based materials, and allow for responsible forest management. Research led by The Nature Conservancy has highlighted the enormous importance of Natural Climate Solutions in sequestering carbon, mitigating greenhouse gas emissions and meeting internationally agreed climate goals.71 Two thirds of the total mitigation opportunity in the land sector in 2030 lies in conservation, restoration and better management of the planet’s forests. Recent work has also identified the potential of forest products to deliver climate change mitigation benefits by (i) storing carbon in long-lived wood products, (ii) substituting for carbon-intensive materials like concrete, steel, and plastics, and (iii) incentivizing commercial investment in responsibly managed forests.72 Of these factors, substitution can be the most important in determining net greenhouse gas reduction owing to the large range of possible outcomes: substitution factors for wood range from -0.6 to +5.1 kilograms of carbon per kilogram of carbon in products. However, substitution is highly sensitive to context and assumptions about the type, footprint and amount of displaced materials, as well as the potential for re-use, recycling and cascading use of products. The evidence base is strongest for the benefits of using wood in construction, given the high carbon intensity of cement, steel and other building materials. High-performance materials such as mass timber, as well as emerging textiles, plastics and chemicals from woody feedstocks, also hold great promise in reducing fossil emissions. Additionally, innovative financing platforms such as the Tropical Finance Facility use a combination of public grants along with concessional and non-concessional loans to unlock private finance in forests, land use, agriculture and other areas. The platform itself is managed by ADM Capital, and the long-term debt products are arranged by BNP Paribas.73 The facility’s first transaction was a USD 95 million sustainability bond to provide initial finance for a project developing a sustainable natural rubber plantation while conducting FLR activities on heavily degraded land. The plantation areas are designed to serve as a buffer zone to protect the Bukit Tiga Puluh national park from further encroachment and degradation.74 Similarly, the East Africa Tree Fund is an example of an innovative financial mechanism which has the potential to scale up approaches to restoration. The Tree Fund addresses the need to accelerate smallholder reforestation to meet Africa’s chronic wood shortages and achieve land restoration and climate goals. Sustainably managed commercial plantations established on degraded lands can increase carbon sequestration and productivity, while protecting and restoring wetlands, streams, and other areas of high conservation value.

34
Endnotes 1 Mansourian, S. (2018). In the eye of the beholder: Reconciling interpretations of forest landscape restoration. Land degradation & development, 29(9), 2888-2898.; Stanturf, J., Lamb, D., & Madsen, P. (Eds.). (2012). Forest landscape restoration: Integrating natural and social sciences (Vol. 15). Springer Science & Business Media. 2 IISD (2002). Summary of the International Expert Meeting on Forest Landscape Restoration, February 2002. In: Sustainable Developments; IISD:Winnipeg, MB, Canada, 2002; Volume 71, pp. 1–8. 3 Laestadius, L., K. Buckingham, S. Maginnis, and C. Saint-Laurent.(2015). Back to Bonn and beyond: A history of forest landscape restoration and an outlook for the future. Unasylva 245 66:11-18. 4 Mansourian, S. (2018). In the eye of the beholder: Reconciling interpretations of forest landscape restoration. Land degradation & development, 29(9), 2888-2898. 5 Maginnis S, Jackson W (2005) What is FLR and how does it differ from current approaches. Restoring forest landscape: an introduction to the art and science of forest landscape restoration. ITTO, Yokohama, Japan 6 Sabogal, C., C. Besacier, and D. McGuire. (2015). Forest and landscape restoration: concepts, approaches and challenges for implementation. Unasylva 245 66:3-10. 7 Chazdon, R.L., Gutierrez, V., Brancalion, P., Laestadius, L., Guariguata, M.R. (2019). Co-creating Conceptual and Working Forest and Landscape Restoration Frameworks Based on Core Principles. A white paper for the Forest and Landscape Restoration Standards Taskforce (FLoRES). 8 Stanturf, J., & Mansourian, S. (2017). Implementing forest landscape restoration, a practitioner's guide. International Union of Forest Research Organizations, 2017, 1-128. Vienna, Austria. 9 Besseau, P., S. Graham, and T. Christophersen, editors. 2018. Restoring forests and landscapes: The key to a sustainable future. IUFRO on behalf of the Global Partnership on Forest and Landscape Restoration, Vienna, Austria. 10 Besseau, P., S. Graham, and T. Christophersen, editors. 2018. Restoring forests and landscapes: The key to a sustainable future. IUFRO on behalf of the Global Partnership on Forest and Landscape Restoration, Vienna, Austria. 11 Mansourian, S. 2018. In the eye of the beholder: Reconciling Interpretations of Forest Landscape Restoration. Land Degradation & Development. 12 The Global Partnership on Forest and Landscape Restoratation/ Bonn Challenge 13 The Global Partnership on Forest and Landscape Restoratation/ Bonn Challenge 14 Shono, K., Cadaweng, E. A. & Durst, P. B. Application of assisted natural regeneration to restore degraded tropical forestlands. Restor. Ecol. 15, 620–626 (2007).; Chazdon, R. L. et al. Carbon sequestration potential of second-growth forest regeneration in the Latin American tropics. Sci. Adv. 2, e1501639–e1501639 (2016). 15 IUFRO. FAO Language Resources Project. IUFRO World Ser. 9-en, (2005). 16 Winrock. AFOLU Carbon Calculator. The Agroforestry Tool: Underlying Data and Methods. Prepared by Winrock International under the Cooperative Agreement No. EEM-A-00-06- 00024-00. (2014). 17 Winrock. AFOLU Carbon Calculator. The Agroforestry Tool: Underlying Data and Methods. Prepared by Winrock International under the Cooperative Agreement No. EEM-A-00-06- 00024-00. (2014). 18 Winrock. AFOLU Carbon Calculator. The Agroforestry Tool: Underlying Data and Methods. Prepared by Winrock International under the Cooperative Agreement No. EEM-A-00-06- 00024-00. (2014). 19 Vieira, D. L. M., Holl, K. D. & Peneireiro, F. M. Agro-successional restoration as a strategy to facilitate tropical forest recovery. Restor. Ecol. 17, 451–459 (2009). 20 Dave, R., Saint-Laurent, C., Murray, L., Antunes Daldegan, G., Brouwer, R., de Mattos Scaramuzza, C.A., Raes, L., Simonit, S., Catapan, M., Garcia Contreras, G., Ndoli, A., Karangwa, C., Perera, N., Hingorani, S. and Pearson, T. (2019). Second Bonn Challenge progress report. Application of the Barometer in 2018. Gland, Switzerland: IUCN. xii + 80pp. 21 Sexton, J. O., Noojipady, P., Song, X. P., Feng, M., Song, D. X., Kim, D. H. & Townshend, J. R. (2016). Conservation policy and the measurement of forests. Nature Climate Change, 6(2), 192.; Watson, C. (2012). Defining climate-related forest activities, finance and expenditure in national budgetary systems. UK: ODI.; Dickens, S. J. M., & Suding, K. N. (2013). Spanning the science-practice divide: Why restoration scientists need to be more involved with practice. Ecological Restoration, 31(2), 134-140. 22 University of Maryland GLAD lab and published on Global Forest Watch in 2015 23 Weiss, M. and Petersen, R. (2015). How accurate is accurate enough? Examining the GLAD tree cover change data (Part 1). https://blog.globalforestwatch.org/data-and-research/how-accurate-is-accurate-enough-examining-the-glad-global-tree-cover-change-data-part-1 24 IUCN (2018). Bonn Challenge Barometer – Progress Tracking Protocol. https://infoflr.org/bonn-challenge-barometer 25 Romijn, J. E., & Coppus, R. (2019). Replication Data for: Restoration Database for Latin America and the Caribbean. Comparative Research Project on Landscape Restoration for Emissions Reductions, CIAT/WUR project for USAID. 26 GEF Forest and Landscape Restoration,https://www.thegef.org/topics/forest-and-landscape-restoration, 27 Dave, R., Saint-Laurent, C., Murray, L., Antunes Daldegan, G., Brouwer, R., de Mattos Scaramuzza, C.A., Raes, L., Simonit, S., Catapan, M., Garcia Contreras, G., Ndoli, A., Karangwa, C., Perera, N., Hingorani, S. and Pearson, T. (2019). Second Bonn Challenge progress report. Application of the Barometer in 2018. Gland, Switzerland: IUCN. xii + 80pp. 28 Dave, R., Saint-Laurent, C., Murray, L., Antunes Daldegan, G., Brouwer, R., de Mattos Scaramuzza, C.A., Raes, L., Simonit, S., Catapan, M., Garcia Contreras, G., Ndoli, A., Karangwa, C., Perera, N., Hingorani, S. and Pearson, T. (2019). Second Bonn Challenge progress report. Application of the Barometer in 2018. Gland, Switzerland: IUCN. xii + 80pp. 29 Nave, L. E., Swanston, C. W., Mishra, U., & Nadelhoffer, K. J. (2013). Afforestation effects on soil carbon storage in the United
States: a synthesis. Soil Science Society of America Journal, 77(3), 1035-1047. 30 Lu, C., Zhao, T., Shi, X., & Cao, S. (2018). Ecological restoration by afforestation may increase groundwater depth and create
potentially large ecological and water opportunity costs in arid and semiarid China. Journal of cleaner production, 176, 1213-1222. 31 Lu, C., Zhao, T., Shi, X., & Cao, S. (2018). Ecological restoration by afforestation may increase groundwater depth and create
potentially large ecological and water opportunity costs in arid and semiarid China. Journal of cleaner production, 176, 1213-1222.

35
32 Ahrends, A., Hollingsworth, P. M., Beckschäfer, P., Chen, H., Zomer, R. J., Zhang, L., ... & Xu, J. (2017). China's fight to halt tree
cover loss. Proceedings of the Royal Society B: Biological Sciences, 284(1854), 20162559. 33 Cao, S. Why large-scale afforestation efforts in China have failed to solve the desertification problem. Environ. Sci. Technol. 42,
8165 (2008). 34 Bey, A., Sánchez-Paus Díaz, A., Maniatis, D., Marchi, G., Mollicone, D., Ricci, S. & Patriarca, C. (2016). Collect earth: Land use and land cover assessment through augmented visual interpretation. Remote Sensing, 8(10), 807. 35 Potapov, P., Tyukavina, A., Turubanova, S., Talero, Y., Hernandez-Serna, A., Hansen, M. C., et al. (2019). Annual continuous fields of woody vegetation structure in the Lower Mekong region from 2000‐2017 Landsat time-series. Remote Sensing of Environment, 232, 111278. http://www.sciencedirect.com/science/article/pii/S0034425719302974 36 Hansen, M. C., Potapov, P. V., Moore, R., Hancher, M., Turubanova, S. A., Tyukavina, A., et al. (2013). High-Resolution Global Maps of 21st-Century Forest Cover Change. Science, 342(6160), 850–853. https://science.sciencemag.org/content/342/6160/850 37 Evans, K.A., Guariguata, M. R. 2016. Success from the ground up: participatory monitoring and forest restoration. Occasional Paper no. 159. CIFOR, Bogor, Indonesia 38 Evans, K., Guariguata, M. R. 2019. A diagnostic for collaborative monitoring in forest landscape restoration. Ocassional Paper no. 193. CIFOR, Bogor, Indonesia 39 Bastin, J. F., Berrahmouni, N., Grainger, A., Maniatis, D., Mollicone, D., Moore, R. & Aloui, K. (2017). The extent of forest in dryland biomes. Science, 356(6338), 635-638. 40 FAO, 2015. Global Forest Resources Assessment 2015. FAO Forestry Paper No.1. The Food and Agricultural Organization of the United Nations (FAO). Rome. 41 Potapov, P., Tyukavina, A., Turubanova, S., Talero, Y., Hernandez-Serna, A., Hansen, M. C., et al. (2019). Annual continuous fields of woody vegetation structure in the Lower Mekong region from 2000‐2017 Landsat time-series. Remote Sensing of Environment, 232, 111278. http://www.sciencedirect.com/science/article/pii/S0034425719302974 42 Dave, R., Saint-Laurent, C., Murray, L., Antunes Daldegan, G., Brouwer, R., de Mattos Scaramuzza, C.A., Raes, L., Simonit, S., Catapan, M., García Contreras, G., Ndoli, A., Karangwa, C., Perera, N., Hingorani, S. and Pearson, T. (2019). Second Bonn Challenge progress report. Application of the Barometer in 2018. Gland, Switzerland: IUCN. 43 Bonn Challenge, http://www.bonnchallenge.org/ 44 IUCN and Climate Focus. (2018). Forest landscape restoration in NDCs - Methodological framework for the analysis and resulting database. 45 Lewis, S. L., Wheeler, C. E., Mitchard, E. T., & Koch, A. (2019). Regenerate natural forests to store carbon. Nature, 568(7750), 25–28. 46 Dave, R., Maginnis, S., & Crouzeilles, R. (2019). Forests: many benefits of the Bonn Challenge. Nature, 570, 164–164. http://www.nature.com/articles/d41586-019-01817-z. 47 Lewis, S. L. et al. (2019). 48 Rights and Resources Initative analysis of NDCs 49 Blackman, A., & Veit, P. (2018). Titled Amazon indigenous communities cut forest carbon emissions. Ecological Economics, 153, 56–67.; Ding, H., Veit, P. G., Blackman, A., Gray, E., Reytar, K., Altamirano, J. C., et al. (2016). Climate Benefits Tenure Costs: The Economic Case for Securing Indigenous Land Rights in the Amazon. https://www.issuelab.org/resource/climate-benefits-tenure-costs-the-economic-case-for-securing-indigenous-land-rights-in-the-amazon.html . 50 McLain, R., Lawry, S., Guariguata, M. R., Reed, J. 2018. Toward a tenure-responsive approach to forest landscape restoration: a proposed tenure diagnostic for assessing restoration opportunities. Land Use Policy. https://doi.org/10.1016/j.landusepol.2018.11.053 51 Chazdon, R. L., Guariguata, M. R. 2018. Decision support tools for forest and landscape restoration: current status and future outlook. Ocassional Paper 183, CIFOR, Bogor, Indonesia 52 Mollins, J. (2018, September 6). Despite obstacles, GLF delegates see progress on AFR100 forest targets. Landscape News. https://news.globallandscapesforum.org/29707/despite-obstacles-glf-delegates-see-progress-on-afr100-forest-targets/; Scaling African Forest Landscape Restoration. (2018, August). Presented at the The Third AFR100 Annual Partnership Meeting, Nairobi, Kenya. https://afr100.org/sites/default/files/3rd%20AFR100%20APM%20Report.pdf 53Summary Report. (2018, June). Presented at the Ministerial Roundtable on Forest Landscape Restoration in the Caucasus and Central Asia, Astana, Kazakhstan. https://www.unece.org/fileadmin/DAM/timber/meetings/2018/20180621/Astana_Roundtable_Summary_Report_ENG.pdf 54 Climate Focus analysis based on data from GCF and GEF project documents. 55 Dave, R., Saint-Laurent, C., Murray, L., Antunes Daldegan, G., Brouwer, R., de Mattos Scaramuzza, C.A., Raes, L., Simonit, S., Catapan, M., Garcia Contreras, G., Ndoli, A., Karangwa, C., Perera, N., Hingorani, S. and Pearson, T. (2019). Second Bonn Challenge progress report. Application of the Barometer in 2018. Gland, Switzerland: IUCN. xii + 80pp. 56 Ibid. 57 Dave, R., Saint-Laurent, C., Murray, L., Antunes Daldegan, G., Brouwer, R., de Mattos Scaramuzza, C.A., Raes, L., Simonit, S., Catapan, M., Garcia Contreras, G., Ndoli, A., Karangwa, C., Perera, N., Hingorani, S. and Pearson, T. (2019). Second Bonn Challenge progress report. Application of the Barometer in 2018. Gland, Switzerland: IUCN. xii + 80pp. 58 Crouzeilles, R., Santiami, E., Rosa, M., Pugliese, L., Brancalion, P. H., Rodrigues, R. R., ... & Padovezi, A. (2019). There is hope for achieving ambitious Atlantic Forest restoration commitments. Perspectives in Ecology and Conservation. 59 Dismantling of Brazilian environmental protections gains pace. (2019, May 8). Mongabay Environmental News. https://news.mongabay.com/2019/05/dismantling-of-brazilian-environmental-protections-gains-pace/. 60 Dave, R., Saint-Laurent, C., Murray, L., Antunes Daldegan, G., Brouwer, R., de Mattos Scaramuzza, C.A., Raes, L., Simonit, S., Catapan, M., Garcia Contreras, G., Ndoli, A., Karangwa, C., Perera, N., Hingorani, S. and Pearson, T. (2019). Second Bonn Challenge progress report. Application of the Barometer in 2018. Gland, Switzerland: IUCN. xii + 80pp. 61 Dave, R., Saint-Laurent, C., Murray, L., Antunes Daldegan, G., Brouwer, R., de Mattos Scaramuzza, C.A., Raes, L., Simonit, S., Catapan, M., Garcia Contreras, G., Ndoli, A., Karangwa, C., Perera, N., Hingorani, S. and Pearson, T. (2019). Second Bonn Challenge progress report. Application of the Barometer in 2018. Gland, Switzerland: IUCN. xii + 80pp. 62 Bonn Challenge Progress Report. (2018). Application of the Barometer in 19 Bonn Challenge pledging entities.

36
63 FAO and Global Mechanism of the UNCCD. (2015). Sustainable financing for forest and landscape restoration: Opportunities, challenge FAO & Global Mechanism of the UNCCD (2015).Sustainable financing for forest and landscape restoration: Opportunities, challenges and the way forward. Discussion paper. Rome, Italy. 64 TEEB. (2009b). Climate Issues Update September 2009. 65 TEEB. (2009a). Chapter 9 Investing in ecological infrastructure. In The economics of ecosystems and biodiversity for national and international policy makers. 66 Matta, R. (2015). Towards effective national forest funds. In FAO Forestry Paper: Vol. 174. ; 67 FONERWA. (2012). Final Report. Government of Rwanda Environment and Climate Change Fund (FONERWA) Design Project. 68 Parker, C., Cranford, M., Oakes, N., & Leggett, M. (2012). The Little Biodiversity Finance Book: A guide to proactive investment in natural capital. 69 Banco Central de Costa Rica, & WAVES Partnership. (2016). 2011-2013 Forest Accounts. 70 Bain & Company. (2019). Bain and The Nature Conservancy. Bain Social Impact Report. http://www.socialimpactatbain.com/environment/environment-spotlight 71 Griscom, B. W., Adams, J., Ellis, P. W., Houghton, R. A., Lomax, G., Miteva, D. A., et al. (2017). Natural climate solutions. Proceedings of the National Academy of Sciences, 114(44), 11645–11650. https://www.pnas.org/content/114/44/11645 72 Lippe, M., Ferrer, R., Köthke, M., Günter, S. (2017). Sub-national Forest Transitions: A matter of scale and regional drivers? In: International Union of Forest Research Organizations (ed). IUFRO 125th anniversary congress. Freiburg, Germany. 73 Tropical Landscape Finance Facility. (n.d.-b). Lending Platform. Tropical Landscapes Finance Facility. from http://tlffindonesia.org/lending-platform/ 74 Mulder, I. (2018). World’s first ‘sustainable landscape bond’ supports Indonesia’s economic development. UN-REDD Programme. https://www.un-redd.org/single-post/2018/03/01/World%E2%80%99s-first-%E2%80%98sustainable-landscape-bond%E2%80%99-supports-Indonesia%E2%80%99s-economic-development
Related Documents