City of New York DEPARTMENT OF ENVIRONMENTAL PROTECTION Bureau of Wastewater Treatment US EPA 40 CFR Part 503 Use or Disposal of Sewage Sludge 2008 Annual Report (Revised) Prepared for UNITED STATES ENVIRONMENTAL PROTECTION AGENCY Prepared by City of New York, Department of Environmental Protection Bureau of Wastewater Treatment Biosolids Management Section 96-05 Horace Harding Expressway Corona, New York 11368 (718) 595-6571 August 2009

Welcome message from author
This document is posted to help you gain knowledge. Please leave a comment to let me know what you think about it! Share it to your friends and learn new things together.
Transcript
City of New York DEPARTMENT OF ENVIRONMENTAL PROTECTION Bureau of Wastewater Treatment
US EPA 40 CFR Part 503 Use or Disposal of Sewage Sludge
2008 Annual Report (Revised)
Prepared for
UNITED STATES ENVIRONMENTAL PROTECTION AGENCY
Prepared by
City of New York, Department of Environmental Protection Bureau of Wastewater Treatment Biosolids Management Section
96-05 Horace Harding Expressway Corona, New York 11368
(718) 595-6571
August 2009

City of New York DEPARTMENT OF ENVIRONMENTAL PROTECTION
Bureau of Wastewater Treatment
INTRODUCTION
US EPA 40 CFR Part 503 Use or Disposal of Sewage Sludge
2008 Annual Report (Revised)
Prepared for
UNITED STATES ENVIRONMENTAL PROTECTION AGENCY
Prepared by
City of New York, Department of Environmental Protection Bureau of Wastewater Treatment
Biosolids Management Section 96-05 Horace Harding Expressway
Corona, New York 11368
(718) 595-6571
August 2009
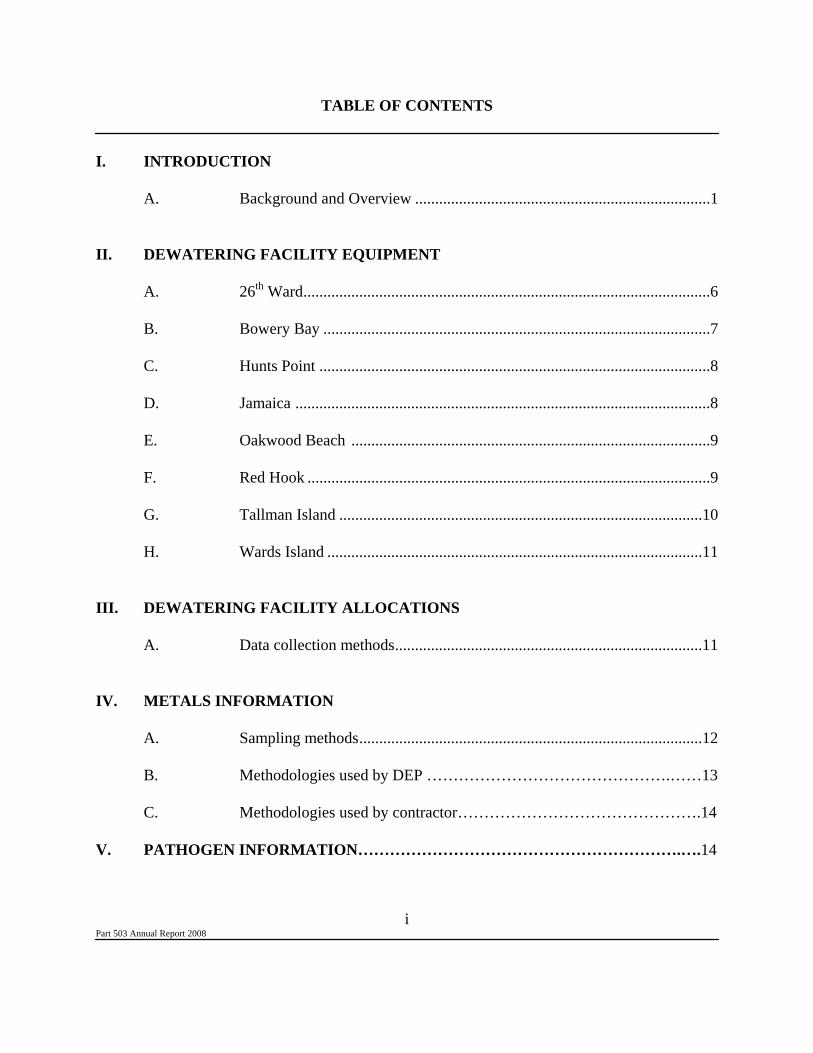
TABLE OF CONTENTS
Part 503 Annual Report 2008
i
I. INTRODUCTION
A. Background and Overview ..........................................................................1 II. DEWATERING FACILITY EQUIPMENT
A. 26th Ward......................................................................................................6 B. Bowery Bay .................................................................................................7 C. Hunts Point ..................................................................................................8 D. Jamaica ........................................................................................................8 E. Oakwood Beach ..........................................................................................9 F. Red Hook .....................................................................................................9 G. Tallman Island ...........................................................................................10 H. Wards Island ..............................................................................................11
III. DEWATERING FACILITY ALLOCATIONS
A. Data collection methods.............................................................................11 IV. METALS INFORMATION
A. Sampling methods......................................................................................12
B. Methodologies used by DEP ……………………………………….……13 C. Methodologies used by contractor……………………………………….14 V. PATHOGEN INFORMATION…………………………………………………….….14
TABLE OF CONTENTS
Part 503 Annual Report 2008
ii
VI. VECTOR ATTRACTION REDUCTION
A. Sampling methods......................................................................................16
VII. SLUDGE MANAGEMENT CONTRACTORS………………..…………..…………17 VIII. NOTES…………………………………………………………………………………..17
Part 503 Annual Report 2008
1
INTRODUCTION
BACKGROUND AND OVERVIEW
The City of New York, under the direction of the Department of Environmental Protection (DEP), owns and operates fourteen Water Pollution Control Plants (WPCPs) and eight sludge dewatering facilities located throughout the five boroughs of New York City. These dewatering facilities are equipped with solid bowl type centrifuges that remove a portion of the water from the liquid sludge to reduce its volume, thereby facilitating a more efficient and cost effective land-based Sludge Management Program. Dewatered sludge is a nutrient rich, semi-solid material that is generated during the wastewater treatment process and can be beneficially applied to the land as a soil conditioner and fertilizing agent.
DEP contracts out the removal of biosolids. All contractors are allocated biosolids to further process biosolids regardless if it meets PSRP or not. All biosolids were forwarded to EPIC 1 (contract 947ADM1) (see processing details below), EPIC 2 (contract 1131-BIO) (see processing details below) (contract completion date May 31, 2008), Tully Environmental (contract 947ADM3) (see processing details below), WeCare Organics, LLC (contract 1181-BIO) (see processing details below), NYOFCO (contract 947ADM4) which further treats biosolids to the PFRP (Process to Further Reduce Pathogens) (see processing details below), and Passaic Valley Sewerage Commissioners (contract 1141) (see processing details below).
The six active service contracts under the Sludge Management Plan during this reporting period (January 1, 2008 - December 1, 2008) include the following:
1. Application of dewatered sludge (lime stabilized) to farmland in Lamar,
Colorado or farmland on Patton Island, Lauderdale County in Florence, Alabama by the Environmental Protection & Improvement Company (EPIC 1, contract 947ADM1) which is a Synagro Technologies Inc. company (a Carlyle Group Company). Synagro Technologies Inc. uses a proprietary alkaline stabilization process called Bio*Fix. This process uses quicklime (CaO) to treat biosolids prior to beneficial use. The Bio*Fix Class B process is characterized by an increase in pH and temperature that meets environmental standards established by the U.S. EPA 40 CFR Part 503 Regulations and state, local requirements associated with the end product use. The process effectively controls odors, inactivates pathogenic microorganisms and prevents vector
Part 503 Annual Report 2008
2
attraction.
The Class B Bio*Fix process achieves pathogen and vector attraction reduction requirements by elevating the pH to at least 12 and maintaining pH > for two (2) hours and holding pH >11.5 for 22 or more hours.
2. Application of dewatered sludge (lime stabilized) to farmland in Lamar, Colorado or application of dewatered sludge (lime stabilized) to farmland on Patton Island, Lauderdale County in Florence, Alabama by the Environmental Protection & Improvement Company (EPIC 2, contract 1131-BIO) which is a Synagro Technology Inc. company.
Synagro uses a proprietary alkaline stabilization process called Bio*Fix. This process uses quicklime (CaO) to treat biosolids prior to beneficial use. The Bio*Fix Class B process is characterized by an increase in pH and temperature that meets environmental standards established by the U.S. EPA 40 CFR Part 503 Regulations and state, local requirements associated with the end product use. The process effectively controls odors, inactivates pathogenic microorganisms and prevents vector attraction.
The Class B Bio*Fix process achieves pathogen and vector attraction reduction requirements by elevating the pH to at least 12 and maintaining pH > for two (2) hours and holding pH >11.5 for 22 or more hours.
3. The New York Organic Fertilizer Company (NYOFCO, contract
947ADM4) transports the City’s dewatered sludge in dump trailers to the NYOFCO (contract 947ADM4) thermal drying facility located in the Hunts Point section of the Bronx. The dump trailers deposit the material into storage hoppers where the material is conveyed to pin mixers via “shaftless screw” type conveyors. In the pin mixers, the dewatered sludge is mixed with pre-thermally dried or “pelletized” sludge allowing optimum solids content and material texture to be achieved before entering the direct-thermal dryers. After thermal drying, the sludge pellets are transferred via a pneumatic conveyance system to several large storage silos, from which the material is loaded directly into rail cars for marketing and distribution. The pellets were applied in Florida on feed crops for cattle, pine trees, citrus groves as well as fertilizer blender. The pellets were applied in Georgia on pine trees and in New York State as fertilizer. Pellets have been applied in New Jersey on feed crops such as corn as well as on sod.

Part 503 Annual Report 2008
3
NYOFCO (contract 947ADM4) also has shipped 319.26 dry metric tons of pellets to Oman, UA, Via US Amerigo, Inc. for use on vegetable crops such as beans, squash and cucumbers as well as desert reclamation and landscaping. The pellets enrich the desert sand. NYOFCO (contract 947ADM4) shipped pellets to the Lehigh Cement Company in Pennsylvania. It was utilized as an alternative fuel source to coal. At the end of the study and demonstration project, NYOFCO conducted an air quality study. The results of the study indicated that burning biosolids as a fuel source had no negative impact on the air quality. A total of 5,432.22 dry metric tons of pellets was shipped to the Cement factory until October 27, 2008. The pelletized sludge produced at the NYOFCO facility consistently met the following “Exceptional Quality Sludge” criteria; therefore, only limited monitoring and tracking of the material was required:
The Pollutant Concentration Limits for those metals listed in Table 1 of 40 CFR Part 503.13(b)(1)
One of the Class A Pathogen Reduction alternatives in 40 CFR Part 503.32(a) Sewage sludge, Class A
One of the Vector Attraction Reduction options in 40 CFR Part 503.33(b)(1) through (8)
Typically, the pellets are used in Florida for citrus and vegetable crops, in
Massachusetts for blending, Ohio for corn and soybean crops, Pennsylvania for land reclamation and New Jersey. NYOFCO (contract 947ADM4) is a Synagro Technologies Inc. company.
Throughout 2008, NYOFCO (contract 947ADM4) made significant upgrades to their process. For a detailed description of the upgrades, please review NYOFCO’s 2008 503 report.
4. Tully/JV (contract 947ADM3) has sub-contracted to WeCare Organics, LLC. to process NYCDEP biosolids at Kyler Blackwood and Kyler Stoltzfus facilities. These facilities use the alkaline stabilization (lime treatment- Class A certified) PFRP (Process to Further Reduce Pathogen) process for mine reclamation at the Bernice site in Sullivan County, PA

Part 503 Annual Report 2008
4
and the Pottersdale site in Stoltzfus, PA.
The Alkaline Stabilization process is similar to other methods involving mixing biosolids with alkaline materials such as lime. The process is a type of chemical stabilization, described by Commonwealth of Pennsylvania Department of Environmental Protection (PA DEP) as follows:
Chemical stabilization is a process in which chemicals are mixed with sludge to achieve a Class A level of treatment. Alkaline materials, such as lime or cement kiln dust, are added to dewatered biosolids. The chemicals react with the biosolids and generate heat and increase the pH of the biosolids. The combination of heat and high pH serves to eliminate viable pathogenic organisms. Due to the lime addition, the resultant product is used primarily as a lime substitute in agriculture. These facilities are relatively simple, consisting of storage facilities, mixing equipment, and an area where the material is allowed to cure.
(The Alkaline Stabilization process is a PA DEP approved Class A biosolids processing cited in 25 Pa. Code § 271.932 (a) (4) or (6).)
The Alkaline Stabilization method to be applied at the WeCare Organics LLC. biosolids Processing Facility has been approved specifically by the U.S. Environmental Protection Agency (EPA) as an Alternative 6 method to achieve Process to Further Reduce Pathogens (PFRP), producing Class A biosolids (see 40 CFR 503.32). This method is described by EPA (1999) as follows:
Fine alkaline materials (cement kiln dust, lime kiln dust, quicklime fines, pulverized lime, or hydrated lime) are uniformly mixed by mechanical or aeration mixing into liquid or dewatered sludge to raise the pH to > 12 for ≥ to 72 hours. If the resulting sludge is liquid, it is dewatered. The sludge cake is then heated, while the pH > 12, using exothermic reactions or other thermal processes to achieve temperatures ≥ 52oC (126oF) throughout the sludge for ≥ 12 hours. The stabilized sludge is then air dried (while pH > 12 for ≥ 3 days) to ≥ 50% solids.
In summary, at the WeCare Organics LLC. Biosolids Processing Facility, alkaline materials are added to biosolids to keep the pH above 12 for at least 72 hours. All sludge received is dewatered, such that no dewatering will be required at the facility. During the 72 hour period, the temperature of the mixture must be at least 52oC for at least 12 hours. (The exothermic

Part 503 Annual Report 2008
5
reaction results from mixing the alkaline material with the biosolids. External heat sources are not required.) Admixture is added during processing to result in a final mixture with a total solids concentration of at least 50%.
As discussed above, the combination of high pH and elevated temperatures over sufficient time inactivates pathogens to below-detectable levels. However, the process is reported to permit survival of microflora, important for long-term odor control and soil fertility, and helps prevent odor production after product pH values decline.
Alkaline Stabilization processing to meet PFRP requirements as detailed above simultaneously meets EPA Vector Attraction Reduction (VAR) requirements under Option 6, Addition of Alkali, in 40 CFR 503.33, which states:
The pH of sewage sludge shall be raised to 12 or higher by alkali addition and, without the addition of more alkali, shall remain at 12 or higher for two hours and then at 11.5 or higher for an additional 22 hours.
5. The Passaic Valley Sewerage Commissioners (PVSC, contract 1141) is
a 330 MGD (million gallons a day) wastewater treatment plant located in Newark, New Jersey. An Inter-Governmental Agreement was extended until 2008. NYC DEP liquid sludge is mixed with liquid sludge from other municipalities at PVSC. The dewatered sludge is used for alternate daily landfill cover for the NJ Meadowlands Commission, Lyndhurst, NJ (NJMC) and EnCap Golf Holdings, LLC, East Rutherford, NJ (as of May 7, 2008 NYC biosolids are no longer being sent to this location). Due to the closure of EnCap Golf Holdings, LLC, PVSC sent material to the Amelia County Lanfill in Virginia for post closure landfill cover which is deemed beneficial reuse. All NYC liquid sludge received by PVSC is dewatered and then sent to the New Jersey Meadowlands Commission (NJMC). NJMC is a regional zoning, planning and regulatory agency established by an Act of the New Jersey Legislature in 1969. Its founding mandates are to protect the delicate balance of nature, provide for orderly development, and manage solid waste activities in the New Jersey Meadowlands District.
6. Composting dewatered sludge at the Natural Soils Products composting
facility in Good Springs, Pennsylvania (WeCare Organics, LLC, contract 1181-BIO). This facility is owned by Tully Environmental who

Part 503 Annual Report 2008
6
is a. sub-contractor to WeCare Organics, LLC. WeCare Organics, LLC, began operating on December 17, 2007. The compost utilization sites are construction projects. WeCare Organics, LLC sells compost to many contractors who use the product as a soil amendment for athletic field construction, golf courses and parks. It is also sold to topsoil manufacturers who sell topsoil and need compost to increase the organic matter in the soil.
II. DEWATERING FACILITY EQUIPMENT
A. 26th Ward Dewatering Facility ▸ thirteen (13) centrifuges; solid bowl type - rated @ 240 gpm ▸ ten (10) storage bins - working capacity 2,570 ft3 each ▸ two (2) truck loading bays; pass through type ▸ two (2) truck loading scales (1 per bay) - 100 ton capacity each ▸ twenty (20) truck loading slide gates (10 per bay) - 3' L x 2' W ▸ one (1) scale room; automated ▸ four (4) thickeners; gravity type, circular - 70' diameter each –not all are
necessarily used but are available. ▸ three (3) digesters; fixed cover type (primary) - 86' diameter, 2 @ 191,500 ft3
each; 1 @ 186,000 ft3 ▸ one (1) digester; fixed cover type (secondary) - 86' diameter, 186,000 ft3 Regarding the above description: 26W has two primary and two
Primary/secondary digesters. Current operations utilize 3 as primary and 1 as secondary. The volume of the swing digester is determined by its use. Therefore, if 26W is using it as a primary digester its volume is the same as the other two primaries (191,500 cubic feet each). If a tank is used as a secondary its volume is 186,000 cubic feet. However, these volumes are listed in the O&M but 26W uses more conservative values to calculate the detention time.
▸ four (4) heat exchangers ▸ six (6) mixing units; gas compressor type mixers (1 per digester) (none working) ▸ three (3) storage tanks; 86' diameter, 188,000 ft3 each In addition to the primary equipment listed above, the City operates various ancillary facilities and equipment at 26th Ward that include; a docking facility which can accommodate each of the three (3) liquid sludge vessels used by the City to transport liquid sludge from the “guest” WPCPs (without dewatering facilities) to the “host” WPCPs (with dewatering facilities) and three (3) liquid sludge storage tanks.

Part 503 Annual Report 2008
7
Additionally, there are two force mains that are used to pump liquid sludge from Jamaica and Coney Island to 26 Ward. B. Bowery Bay Dewatering Facility ▸ four (4) centrifuges; solid bowl type - rated @ 240 gpm ▸ two (2) storage bins - working capacity 4,325 ft3 each ▸ one (1) truck loading bays; single entry type ▸ one (1) truck loading scale - 100 ton capacity each ▸ four (4) truck loading slide gates - 3' L x 2' W ▸ one (1) scale room; automated ▸ eight.(8) thickeners; gravity type, circular - 70' diameter, 48,760 ft3 each ▸ four (4) digesters; fixed cover type (primary) - 81' diameter, 197,710 ft3 each ▸ four (4) heat exchangers; (1 per digester) - 2.6 Mbtu/hr ▸ six (6) storage tanks, two with fixed cover, four open tanks --- 2 @ 81' diameter,
2 @ 70' diameter, 2@ 64.75’ diameter
C. Hunts Point Dewatering Facility
▸ thirteen (13) centrifuges; solid bowl type - rated @ 240 gpm ▸ ten (10) storage bins - working capacity 2,570 ft3 each ▸ two (2) truck loading bays; pass through type ▸ two (2) truck loading scales (1 per bay) - 100 ton capacity each ▸ twenty (20) truck loading slide gates (10 per bay) - 3' L x 2' W ▸ one (1) scale room; automated ▸ twelve (12) thickeners; gravity type, circular - 65' diameter, 33,300 ft3 each(6
utilized) ▸ four (4) digesters; fixed cover type (primary) - 118' diameter, 369,000 ft3 each (3
utilized) ▸ four (4) heat exchangers ▸ five (5) storage tanks; varying capacities 115,000 to 373,000 ft3 each
In addition to the primary equipment listed above, the City operates various ancillary facilities and equipment at Hunts Point that include; a docking facility which can accommodate each of the three (3) liquid sludge vessels used by the City to transport liquid sludge from the “guest” WPCPs (without dewatering facilities) to the “host” WPCPs (with dewatering facilities) and three (3) liquid sludge storage tanks.
D. Jamaica Dewatering Facility

Part 503 Annual Report 2008
8
▸ four (4) centrifuges; solid bowl type - rated @ 240 gpm ▸ two (2) storage bins - working capacity 4,325 ft3 each ▸ one (1) truck loading bays; single entry type ▸ one (1) truck loading scale - 100 ton capacity each ▸ four (4) truck loading slide gates - 3' L x 2' W ▸ one (1) scale room; automated ▸ five (5) thickeners; gravity type, circular - 2 @ 55' diameter, 28,512 ft3 each and
3@ 70' diameter, 48,743 ft3 each ▸ four (4) digesters; fixed cover type (primary) - 80' diameter, 132,000 ft3 each ▸ two (2) digesters; fixed cover type (secondary) - 80' diameter, 117,000 ft3 each ▸ six (6) sludge heaters; jacket water type - (1 per digester) ▸ four (4) mixing units; compressed gas recirculation type - (1 per primary
digester)(out of service) ▸ five (5) storage tanks - 80' diameter 140,000 ft3 each
E. Oakwood Beach Dewatering Facility
▸ four (4) centrifuges; solid bowl type - rated @ 240 gpm ▸ two (2) storage bins - working capacity 4,325 ft3 each ▸ one (1) truck loading bays; single entry type ▸ one (1) truck loading scale - 100 ton capacity each ▸ four (4) truck loading slide gates - 3' L x 2' W ▸ one (1) scale room; automated ▸ two (2) thickeners; gravity type, circular - 70' diameter, 47,340 ft3 each ▸ three (3) digesters; fixed cover type (primary) - 60' x 60' square 122,400 ft3 each ▸ four (4) heat exchangers; external jacket type (1 per digester & 1 on standby) - 1.8
Mbtu/hr ▸ six (6) mixing pumps - (2 per primary digester)
▸ three (3) mixing units; gas compressor type - (1 per primary digester) ▸ three (3) storage tanks; - 2 @ 50' diameter, 53,800 ft3 each; 1 @ 75' diameter,
185,000 ft3 In addition to the primary equipment listed above, the City operates various ancillary facilities and equipment at Oakwood Beach that include a force main that are used to pump liquid sludge from Port Richmond to Oakwood Beach.
F. Red Hook Dewatering Facility
Part 503 Annual Report 2008
9
▸ two (2) centrifuges; solid bowl type - rated @ 120 gpm ▸ two (2) storage bins - working capacity 1,750 ft3 each ▸ one (1) truck loading bays; pass through type ▸ one (1) truck loading scale - 100 ton capacity each ▸ four (4) truck loading slide gates - 3' L x 2' W ▸ one (1) scale room; automated ▸ four (4) thickeners; gravity type, circular - 60' diameter each ▸ three (3) digesters; fixed cover type (primary) - 60' diameter, 90,000 ft3 each ▸ three (3) digesters; fixed cover type (secondary) - 60' diameter, 90,000 ft3 each ▸ thirty-six (36) sludge heaters; (6 per digester) - 320,000 btu/hr heating capacity
for mesophilic operation ▸ twelve (12) mixing pumps; (2 per digester) - 50 hp, 4,900 gpm each
▸ two (2) storage tanks - 70' diameter 125,000 ft3 each
In addition to the primary equipment listed above the City operates various ancillary facilities and equipment at Red Hook that include; a docking facility which can accommodate each of the liquid sludge vessels used by the City to transport liquid sludge from the “guest” WPCPs (without dewatering facilities) to the “host” WPCPs (with dewatering facilities) and liquid sludge storage tanks.
G. Tallman Island Dewatering Facility
▸ two (2) centrifuges; solid bowl type - rated @ 240 gpm ▸ two (2) storage bins - working capacity 1,960 ft3 each ▸ one (1) truck loading bays; single entry type ▸ one (1) truck loading scale - 100 ton capacity each ▸ four (4) truck loading slide gates - 3' L x 2' W ▸ one (1) scale room; automated ▸ eight (8) thickeners; gravity type, circular - 4 @ 50' diameter, 21,293 ft3 each and
4@ 60' diameter, 32,228 ft3 each ▸ three (3) digesters; fixed cover type (primary) - 83' diameter, 176,000 ft3 each ▸ one (1) digesters; fixed cover type (secondary) - 83' diameter, 176,000 ft3 each ▸ four (4) heat exchangers; (1 per digester) - 2.5 Mbtu/hr ▸ twelve (12) mixing units; draft tube type - (3 per digester)(not functioning)
▸ three (3) storage tanks - 1 @ 70' diameter 125,000 ft3 each
In addition to the primary equipment listed above the City operates various ancillary facilities and equipment at Tallman Island that include; a docking facility which can

Part 503 Annual Report 2008
10
accommodate each of the liquid sludge vessels used by the City to transport liquid sludge from the “guest” WPCPs (without dewatering facilities) to the “host” WPCPs (with dewatering facilities) and liquid sludge storage tanks.
H. Wards Island Dewatering Facility
▸ thirteen (13) centrifuges; solid bowl type - rated @ 240 gpm ▸ ten (10) storage bins - working capacity 2,570 ft3 each ▸ two (2) truck loading bays; pass through type ▸ two (2) truck loading scales (1 per bay) - 100 ton capacity each ▸ twenty (20) truck loading slide gates (10 per bay) - 3' L x 2' W ▸ one (1) scale room; automated ▸ twelve (12) thickeners; gravity type, circular - 70' diameter, 47,300 ft3 each ▸ six (6) digesters; fixed cover type (primary) - 88' diameter, 253,000 ft3 each ▸ two (2) digesters; fixed cover type (secondary) - 88' diameter, 253,000 ft3 each ▸ fourteen (14) heat exchangers; water process type “E”- 2.5Mbtu/hr (2 per primary
digester, 1 per secondary digester) ▸ eight (8) mixing units - gas compressor type (1 per digester)(not functioning)
▸ two (2) storage tanks - 81' diameter, 261,000 ft3 each
In addition to the primary equipment listed above, the City operates various ancillary facilities and equipment at Wards Island that include; a docking facility which can accommodate each of the liquid sludge vessels used by the City to transport liquid sludge from the “guest” WPCPs (without dewatering facilities) to the “host” WPCPs (with dewatering facilities) and liquid sludge storage tanks.
III. DEWATERING FACILITY ALLOCATIONS
Table 3 of Appendix A contains the monthly liquid sludge production (and allocations) figures in dry metric tons for this reporting period (January 1, 2008 – December 31, 2008)
The dewatered sludge production figures in Table 4 for (Bowery Bay, Hunts Point, Jamaica, Tallman Island, Wards Island, Red Hook and Oakwood Beach dewatering facilities) were determined from the weight receipts generated at the sludge dewatering facilities for each load of dewatered sludge removed by the contractors. Total solids in the dewatered sludge is measured daily at each dewatering facility from grab samples of the material.

Part 503 Annual Report 2008
11
For the figures on Table 3, there may be a larger standard deviation of the liquid sludge production in dry metric tons (compare to the figures in Table 4) during to the conversion process. The production rates of liquid sludge are very large figures; when multiplied by the total solid percentage to convert to the dry metric ton, the result may have a large difference. Therefore, the figures in Table 4 are more realistic and more accurate.
IV. METALS INFORMATION The concentration of each of the nine (9) metals listed in Table 1 of 40 CFR Part 503.13(b)(1) was measured in all dewatered sludge generated at 26th Ward, Bowery Bay, Hunts Point, Tallman Island, Red Hook, Jamaica and Wards Island. The DEP maintains an extensive database that contains metals data from the analyses performed at the ELAP certified DEP metals laboratories and the outside contract laboratories utilized by the contractors. Tables 1 and 1A contain the analytical methods utilized by DEP and the contractors respectively, for determining the concentrations of the metals in dewatered sludge. The following protocol is employed by DEP for samples of dewatered sludge taken for metals analyses:
A grab sample of dewatered sludge is taken from the conveyor belts that transport the material from the centrifuges to the dewatered sludge storage hoppers, placed in a clean sampling container once per 8-hour shift and composited daily (3 grab samples per day). Although not regularly practiced, grab samples may also be taken from the sampling ports on the centrifuges, the dewatered sludge storage hoppers and/or while the material is being discharged into a contractor’s vehicle in the truck loading bays. Samples are labeled with the date, time and, where applicable, the train of centrifuges from which the sample was retrieved.
Each daily composite taken during the monitoring period (one month) is then refrigerated
at 39°F (4°C) and, at the end of the monitoring period, is composited into a single sample that is analyzed monthly at one of the DEP metals laboratories.
At the 26th Ward, Hunts Point, Wards Island and Oakwood Beach sludge dewatering facilities, liquid sludge from a “host” and one or more “guest” WPCPs is dewatered. At a “host” facility, the dewatered sludge may be of various origins warranting slightly different sampling conventions as provided below:
a. Liquid sludge from two or more WPCPs is mixed in the liquid sludge storage tank at the host WPCP. When this occurs, the liquid sludge mixture is dewatered and grab samples of that dewatered sludge “mixture” are taken for the daily composite. Numerous combinations of liquid sludge with varying origins may pass through a liquid sludge storage tank in any one monitoring
Part 503 Annual Report 2008
12
period. The metals analyses results of the sample for that monitoring period, contains the origin of each sludge comprising the sample and is reported with that information.
b. Dewatered sludge from two or more WPCPs are deposited into a
common dewatered sludge storage hopper from which grab samples are taken. When this occurs, the metals analyses results of the composite sample for that monitoring period contains the origin of each sludge comprising the sample and is reported with that information.
c. Liquid sludge from each “host” and “guest” WPCP may be stored
in separate liquid sludge storage tanks, dewatered by separate trains of centrifuges and stored in separate storage hoppers. When this occurs, separate grab samples of dewatered sludge from each, the “host” and “guest” WPCP are taken, analyzed separately and reported as two distinct sludge. Whenever possible DEP has made its best effort to keep sludge of different origins separated.

Part 503 Annual Report 2008
13
Table 1
Analytical Methods for Metals Concentrations NYC DEP Laboratories
Metals
Sample Preparation and Analytical Methodologies USEPA SW-846 & US EPA 600/4-79-020
Arsenic EPA Numbers 3050 + 206.3 Cadmium EPA Numbers 3050 + 200.7 & 200.9 Chromium EPA Numbers 3050 + 200.7 Copper EPA Numbers 3050 + 200.7 Lead EPA Numbers 3050 + 200.7 Mercury EPA Number 7471 Molybdenum EPA Numbers 3050 + 200.7 & 200.9 Nickel EPA Numbers 3050 + 200.7 Selenium EPA Numbers 3050 + 270.3 Zinc EPA Numbers 3050 + 200.7
Table 1A Analytical Methods for Metals Concentrations
Contractor Laboratories
Metals
Sample Preparation and Analytical Methodologies USEPA SW-846
Arsenic EPA Methods 7060/7061 Cadmium EPA Methods 6010/7130 Chromium EPA Methods 6010/7190 Copper EPA Methods 6010/7210 Lead EPA Methods 6010/7420 Mercury EPA Methods 7470/7471 Molybdenum EPA Methods 6010/7480 Nickel EPA Methods 6010/7520 Selenium EPA Methods 7740/7520 Zinc EPA Methods 6010/7950

Part 503 Annual Report 2008
14
V. PATHOGEN INFORMATION
To satisfy Class B Pathogen Reduction requirements for sewage sludge generated at the treatment plants, liquid sludge was anaerobically digested at a minimum temperature of 95°F (35°C) for a minimum 15-day mean cell residence time, which, by definition, qualified the anaerobic digestion process used at this plant as a Process to Significantly Reduce Pathogens (PSRP) in accordance with 40 CFR Part 503.32(b) Sewage sludge - Class B, Alternative (3).
Typically, NYCDEP operates its digesters at elevations slightly below the full capacity of each digester. Therefore, the total digester volume reported on the PSRP sheets listed in Appendix C may be equal to or slightly below the total digester volume as specified in the above equipment list. The temperature of digested sludge and the digested sludge production were measured using temperature gauges. Thickened sludge produced is estimated using tachometers and an empirical factor to determine sludge volume. Readings of each are taken once per day. From the treatment sheets the process engineer reviews the information which is recorded daily on a monthly “PSRP sheet”. The monthly PSRP sheets contain the following information:
1. Reported daily
1. sludge production (cubic feet) 2. digester temperature (°F) 3. percent volatile solids reduction (%) 4. digester detention time (days) 5. percent solids thickened sludge (%) 6. percent volatile solids thickened sludge (%) 7. total digester volume (cubic feet)
2. Reported as a 15-day running average
8. sludge production (cubic feet) 9. digester detention time (days) 10. percent volatile solids reduction (%) 11. digester temperature (°F) 12. was PSRP met?
3. Reported as a monthly average
13. sludge production (cubic feet)
Part 503 Annual Report 2008
15
14. digester detention time (days) 15. percent volatile solids reduction (%) 16. digester temperature (°F) 17. was PSRP met?
VI. VECTOR ATTRACTION REDUCTION
To satisfy Vector Attraction Reduction requirements for sewage sludge generated at all the wastewater treatment plants, the mass of volatile solids was reduced to a minimum of thirty-eight percent (38%) using anaerobic digestion in accordance with 40 CFR Part 503.33 Vector attraction reduction (b) (1). Determining the level of volatile solids reduction in the sewage sludge required that samples of the material be taken and analyzed. The following protocol is employed by DEP for samples of liquid sludge taken for measuring volatile solids reduction:
1. A grab sample of each, thickened sludge (entering digesters) and digested
sludge (exiting digesters) is taken daily and placed into a clean sampling container and refrigerated at 39°F (4°C). At the time of sampling, the sample date, sample time, sample number and sampling location are recorded.
2. Samples are transported to various DEP process laboratories where they
are analyzed daily for total percent solids and volatile percent solids. The results are subsequently used in the “Mass Balance Method” to calculate the volatile solids reduction.
Percent volatile solids reduction figures were recorded daily on the “treatment sheets”. From the treatment sheets the process engineers review the information that is recorded daily on the monthly “PSRP” sheet.
NYCDEP uses a 15-day running average of volatile solids reduction in the digested sludge to determine whether or not vector attraction reduction requirements have been satisfied. The 15-day running average yields an accurate portrayal of digester performance trends and affords DEP ample time to schedule dewatered sludge distribution with the contractors.

Part 503 Annual Report 2008
16
Table 2
Sludge Management Contractor Information
Contractor Address Contact End Use Site Locations EPIC 1, contract 947ADM1 100 Stierli
Court, Suite 103 Mt. Arlington, NJ 07856
Mr. Pete Sarin Vice President of Rail Services Project Manager (973)601-9212 Ext. 208
Land Application
Lime Stabilization Lime Stabilization
Prince Edward, Charlotte, Buckingham Counties Lamar, Colorado, Alabama Patton Island, Lauderdale County, Florence, Alabama
EPIC 2, contract 1131BIO 100 Stierli Court, Suite 103 Mt. Arlington, NJ 07856
Mr. Pete Sarin Vice President of Rail Services Project Manager (973)601-9212 Ext. 208
Lime Stabilization Lime Stabilization
Lamar, Colorado Patton Island, Lauderdale County, Florence, Alabama
New York Organic Fertilizer Company (NYOFCO), contract 947ADM4
1108 Oak Point Avenue Bronx, NY 10474
John Kopec Project Manager (718)991-7417 Ext. 223
Land Application Alternative fuel
source
Florida, Ohio, Pennsylvania Lehigh, PA, Study &
Demonstration
Passaic Valley Sewerage Commissioners(PVSC), contract 1141
600 Wilson Avenue Newark, NJ 07105
Gary Burns Project Manager (973)817-5981
Land Application Landfill cover
New Jersey Meadowlands, EnCap
Amelia County Lanfill, VA
We Care Organics, LLC, contract 1181BIO
9289 Bonta Bridge Rd. Jordan, NY 13080
Jason Fleury Project Manager (315)689-1937
Composting GoodSprings, PA
Tully Environmental, contract 947ADM3
127-50 Northern Blvd. Flushing, NY 11368
Dean Devoe Project Manager (718)446-7000 Ext. 298
Lime Treatment Land Application
Pottersdale, Pennsylvania Bernice, Pennsylvania Lisbon, Ohio
NOTES
All numbers have been calculated and therefore, tables in this report may not add up due to variations in calculations such as basing data on liquid sludge production as opposed to calculated weights from biosolids hauling contractors.

City of New York DEPARTMENT OF ENVIRONMENTAL PROTECTION Bureau of Wastewater Treatment
26TH WARD WATER POLLUTION CONTROL PLANT
US EPA 40 CFR Part 503 Use or Disposal of Sewage Sludge
2008 Annual Report (Revised)
Prepared for
UNITED STATES ENVIRONMENTAL PROTECTION AGENCY
Prepared by
City of New York, Department of Environmental Protection Bureau of Wastewater Treatment Biosolids Management Section
96-05 Horace Harding Expressway Corona, New York 11368
(718) 595-6571
August 2009

i
TABLE OF CONTENTS I. 26TH WARD DEWATERED SLUDGE QUANTITIES
A. Dewatering Facility Allocations ..............................................................................1 II. 26TH WARD DEWATERED SLUDGE QUALITY
A. Metals Analyses .......................................................................................................1 III. 26TH WARD DEWATERED SLUDGE END USE
A. EPIC, contract 947ADM1........................................................................................3
B. EPIC, contract 1131BIO ..........................................................................................3 C. NYOFCO, contract 947ADM4................................................................................3
D. Tully Environmental, contract 947ADM3...............................................................3
E. We Care Organics, LLC, contract 1181 BIO...........................................................3
ii
LIST OF APPENDICES Appendix A - Table 3, Monthly Liquid Sludge Allocation Table 4, Monthly Dewatered Sludge Allocations to Contractors Appendix B - Table 5, Monthly Average Metals Data

26th Ward WPCP Part 503 Annual Report 2008
2
Requisite information, specific to the 26th Ward WPCP is provided below.
FACILITY NAME
LOCATION
DEWATERING FACILITY
SPDES PERMIT #
CONTACT PERSON
PROCESS ENGINEER
26th Ward Water Pollution Control Plant
122-66 Flatlands Avenue Brooklyn, NY 11207
Yes
NY0026212
Superintendent Joseph Garibaldi
(718) 642-7705
Peter Navas
Additional Permits
Facility Name Location Permit Name Permit # Type Of Permit (Federal, State)
26th Ward Water Pollution Control Plant
122-66 Flatlands Ave. Brooklyn, NY 11207 Air State Facility permit 261050000902003 State
I. 26TH WARD DEWATERED SLUDGE QUANTITIES
A. DEWATERING FACILITY ALLOCATIONS
For the reporting period of January 1 through December 31, 2008 all anaerobically digested, thickened sewage sludge generated at 26th Ward was dewatered at the 26th Ward sludge dewatering facility. Approximately 8,816 dry metric tons of 26th Ward dewatered sludge was generated and processed at the 26th Ward dewatering facility. The 26th Ward sludge dewatering facility received liquid sludge from Coney Island WPCP, Jamaica WPCP, Newtown Creek WPCP, Owls Head WPCP, and Rockaway WPCP during this reporting period. Table 3 of Appendix A contains the monthly liquid sludge allocation production figures in dry metric tons for this reporting period. The dewatered sludge production figures in Table 4 were determined from the dewatered sludge allocation measured at each dewatering facility.
26th Ward WPCP Part 503 Annual Report 2008
3
II. 26TH WARD DEWATERED SLUDGE QUALITY A. METALS ANALYSES
The metal analyses results of dewatered sludge samples taken by the contractors EPIC 1 (contract 947ADM1) and EPIC 2 (contract 1131-BIO) and Tully Environmental (contract 947ADM3) were entered into the database maintained by the DEP. Table 5 of Appendix B summarizes the average monthly metals concentrations for the 26th Ward WPCP. The monthly metals concentrations represent an arithmetic average of the results from the analyses of all samples of 26th Ward dewatered sewage sludge generated each month.
During this reporting period, 26th Ward dewatered sludge contained concentrations of metals that always met the Ceiling Concentration Limits for twelve (12) months (January, February, March, April, May, June, July, August, September, October, November, December) as listed in Table 1 of 40 CFR Part 503.13(b)(1). Further, during all twelve(12) months (January, February, March, April, May, July, August, September, October, November, December) in 2008, 26th Ward dewatered sludge contained concentrations of metals that met the Pollutant Concentration Limits as listed in Table 3 of 40 CFR Part 503.13(b)(1).

26th Ward WPCP Part 503 Annual Report 2008
4
III. 26TH WARD DEWATERED SLUDGE DEWATERED SLUDGE FROM THE 26TH WARD, ROCKAWAY, CONEY
ISLAND, JAMAICA, OWLS HEAD, NEWTOWN CREEK, AND BOWERY BAY WATER POLLUTION CONTROL PLANTS DISTRIBUTED TO SLUDGE MANAGEMENT CONTRACTORS AT THE 26TH WARD DEWATERING FACILITY.
A. EPIC 1 (contract 947ADM1)
Approximately 7,115.46 dry metric tons of the dewatered sludge mix above was distributed to EPIC 1 (contract 947ADM1) (see introduction for processing details) from the 26th Ward Dewatering Facility during this reporting period.
B. EPIC 2 (contract 1131-BIO)
Approximately 2,738.22 dry metric tons of the dewatered sludge mix above was distributed to EPIC 2 (contract 1131 BIO) (see introduction for processing details) from the 26th Ward Dewatering Facility during this reporting period.
C. NYOFCO (contract 947ADM4)
During this reporting period, no biosolids from the 26th Ward dewatering facility was distributed to NYOFCO (contract 947ADM4) (see introduction for processing details).
D. Tully Environmental (contract 947ADM3)
Approximately 5,224.51 dry metric tons of the dewatered sludge mix above was distributed to Tully Environmental (contract 947ADM3) (see introduction for processing details).
E. WeCare Organics, LLC (contract 1181 BIO)
During this reporting period, no biosolids from the 26th Ward dewatering facility was distributed to WeCare Organics, LLC (contract 1181-BIO) (see introduction for processing details).
Table 2 in the introduction contains requisite information specific to each of the five sludge management contractors.

APPENDICES

APPENDIX - A
Table 3.................................Monthly Liquid Sludge AllocationTable 4.................................Monthly Dewatered SludgeAllocations to
Contractors

Table 3Monthly Liquid Sludge Allocation
26th Ward WPCP
Dewatering
Facility Bowery Hunts Jamaica Oakwood Red Tallman 26th Wards TOTALS
Month Bay Point Beach Hook Island Ward Island
Jan-08 909.00 909.00
Feb-08 688.00 688.00
Mar-08 658.00 658.00
Apr-08 644.00 644.00
May-08 559.00 559.00
Jun-08 691.00 691.00
Jul-08 842.00 842.00
Aug-08 783.00 783.00
Sep-08 659.00 659.00
Oct-08 816.00 816.00
Nov-08 803.00 803.00
Dec-08 764.00 764.00
TOTALS 0.00 0.00 0.00 0.00 0.00 0.00 8,816.00 0.00 8,816.00
Notes:1. Dewatered sludge production is expressed in dry metric tons which was "calculated" using liquid sludge production data from the plant.
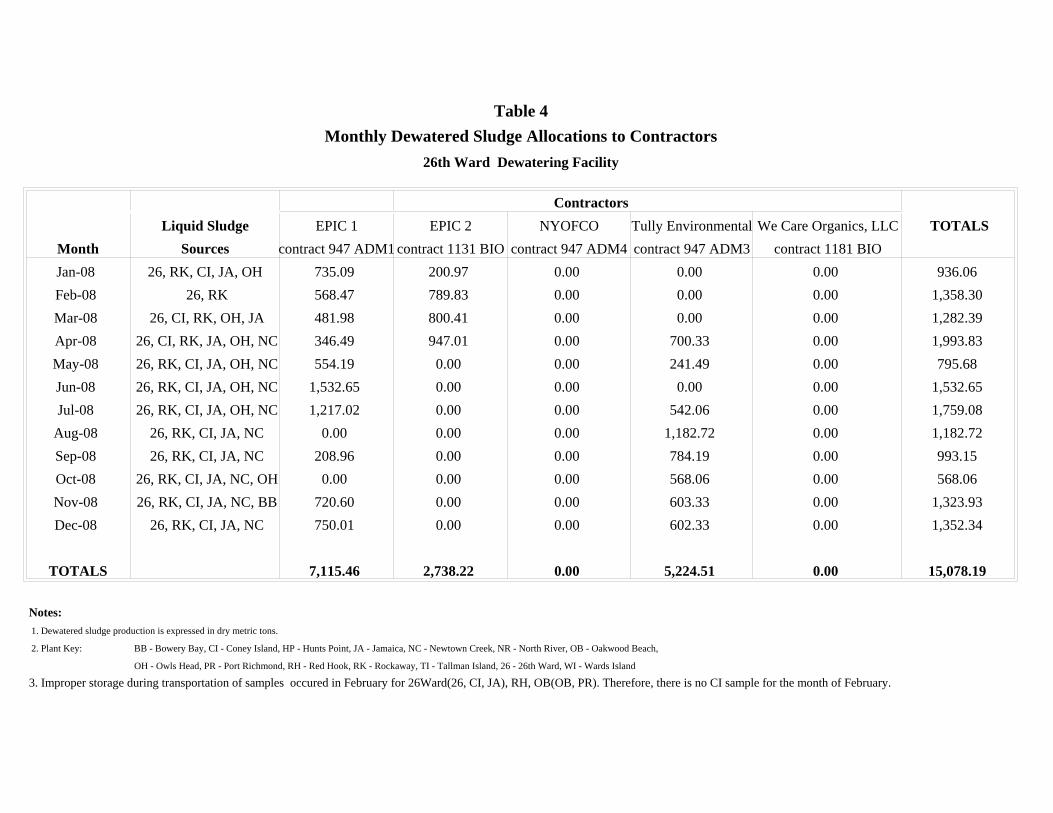
Table 4Monthly Dewatered Sludge Allocations to Contractors
26th Ward Dewatering Facility
ContractorsLiquid Sludge EPIC 1 EPIC 2 NYOFCO Tully Environmental We Care Organics, LLC TOTALS
Month Sources contract 947 ADM1 contract 1131 BIO contract 947 ADM4 contract 947 ADM3 contract 1181 BIOJan-08 26, RK, CI, JA, OH 735.09 200.97 0.00 0.00 0.00 936.06Feb-08 26, RK 568.47 789.83 0.00 0.00 0.00 1,358.30Mar-08 26, CI, RK, OH, JA 481.98 800.41 0.00 0.00 0.00 1,282.39Apr-08 26, CI, RK, JA, OH, NC 346.49 947.01 0.00 700.33 0.00 1,993.83May-08 26, RK, CI, JA, OH, NC 554.19 0.00 0.00 241.49 0.00 795.68Jun-08 26, RK, CI, JA, OH, NC 1,532.65 0.00 0.00 0.00 0.00 1,532.65Jul-08 26, RK, CI, JA, OH, NC 1,217.02 0.00 0.00 542.06 0.00 1,759.08
Aug-08 26, RK, CI, JA, NC 0.00 0.00 0.00 1,182.72 0.00 1,182.72Sep-08 26, RK, CI, JA, NC 208.96 0.00 0.00 784.19 0.00 993.15Oct-08 26, RK, CI, JA, NC, OH 0.00 0.00 0.00 568.06 0.00 568.06Nov-08 26, RK, CI, JA, NC, BB 720.60 0.00 0.00 603.33 0.00 1,323.93Dec-08 26, RK, CI, JA, NC 750.01 0.00 0.00 602.33 0.00 1,352.34
TOTALS 7,115.46 2,738.22 0.00 5,224.51 0.00 15,078.19
Notes: 1. Dewatered sludge production is expressed in dry metric tons.
2. Plant Key: BB - Bowery Bay, CI - Coney Island, HP - Hunts Point, JA - Jamaica, NC - Newtown Creek, NR - North River, OB - Oakwood Beach,
OH - Owls Head, PR - Port Richmond, RH - Red Hook, RK - Rockaway, TI - Tallman Island, 26 - 26th Ward, WI - Wards Island
3. Improper storage during transportation of samples occured in February for 26Ward(26, CI, JA), RH, OB(OB, PR). Therefore, there is no CI sample for the month of February.

APPENDIX - B
Table 5...................... Monthly Average Metals Data
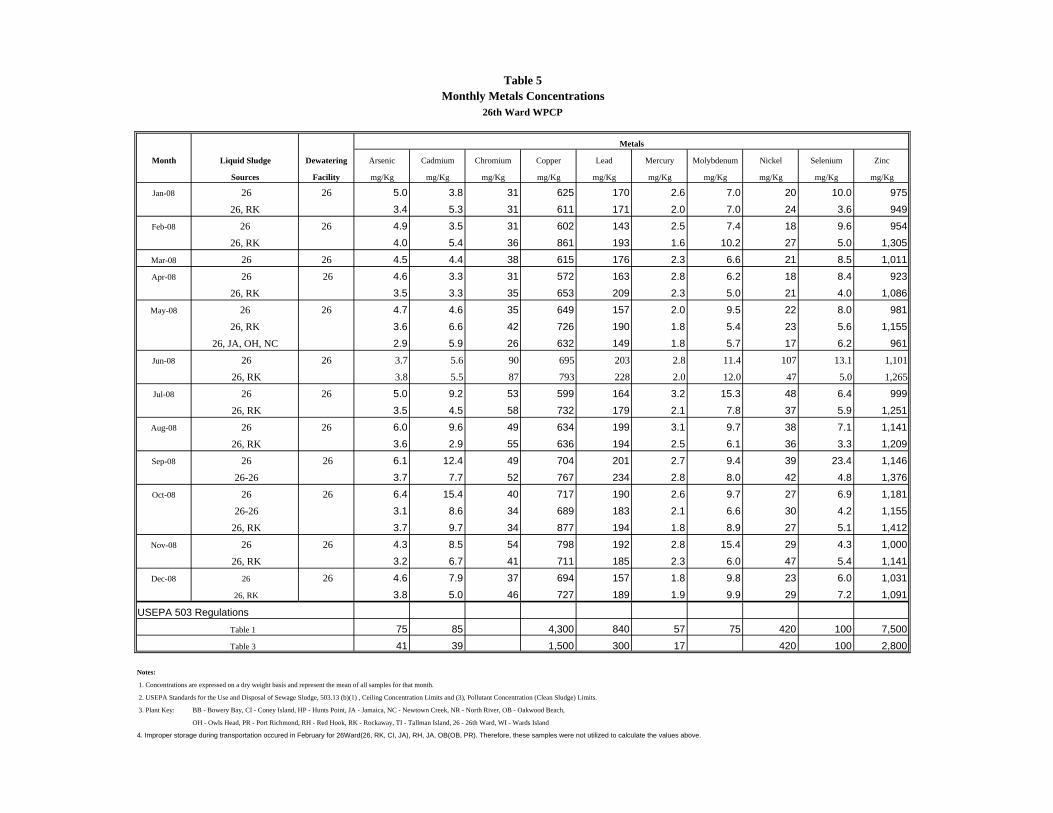
Table 5Monthly Metals Concentrations
26th Ward WPCP
Metals
Month Liquid Sludge Dewatering Arsenic Cadmium Chromium Copper Lead Mercury Molybdenum Nickel Selenium Zinc
Sources Facility mg/Kg mg/Kg mg/Kg mg/Kg mg/Kg mg/Kg mg/Kg mg/Kg mg/Kg mg/Kg
Jan-08 26 26 5.0 3.8 31 625 170 2.6 7.0 20 10.0 97526, RK 3.4 5.3 31 611 171 2.0 7.0 24 3.6 949
Feb-08 26 26 4.9 3.5 31 602 143 2.5 7.4 18 9.6 95426, RK 4.0 5.4 36 861 193 1.6 10.2 27 5.0 1,305
Mar-08 26 26 4.5 4.4 38 615 176 2.3 6.6 21 8.5 1,011Apr-08 26 26 4.6 3.3 31 572 163 2.8 6.2 18 8.4 923
26, RK 3.5 3.3 35 653 209 2.3 5.0 21 4.0 1,086May-08 26 26 4.7 4.6 35 649 157 2.0 9.5 22 8.0 981
26, RK 3.6 6.6 42 726 190 1.8 5.4 23 5.6 1,15526, JA, OH, NC 2.9 5.9 26 632 149 1.8 5.7 17 6.2 961
Jun-08 26 26 3.7 5.6 90 695 203 2.8 11.4 107 13.1 1,101
26, RK 3.8 5.5 87 793 228 2.0 12.0 47 5.0 1,265
Jul-08 26 26 5.0 9.2 53 599 164 3.2 15.3 48 6.4 999 26, RK 3.5 4.5 58 732 179 2.1 7.8 37 5.9 1,251
Aug-08 26 26 6.0 9.6 49 634 199 3.1 9.7 38 7.1 1,141 26, RK 3.6 2.9 55 636 194 2.5 6.1 36 3.3 1,209
Sep-08 26 26 6.1 12.4 49 704 201 2.7 9.4 39 23.4 1,146 26-26 3.7 7.7 52 767 234 2.8 8.0 42 4.8 1,376
Oct-08 26 26 6.4 15.4 40 717 190 2.6 9.7 27 6.9 1,181 26-26 3.1 8.6 34 689 183 2.1 6.6 30 4.2 1,155
26, RK 3.7 9.7 34 877 194 1.8 8.9 27 5.1 1,412Nov-08 26 26 4.3 8.5 54 798 192 2.8 15.4 29 4.3 1,000
26, RK 3.2 6.7 41 711 185 2.3 6.0 47 5.4 1,141Dec-08 26 26 4.6 7.9 37 694 157 1.8 9.8 23 6.0 1,031
26, RK 3.8 5.0 46 727 189 1.9 9.9 29 7.2 1,091
USEPA 503 RegulationsTable 1 75 85 4,300 840 57 75 420 100 7,500Table 3 41 39 1,500 300 17 420 100 2,800
Notes:
1. Concentrations are expressed on a dry weight basis and represent the mean of all samples for that month.
2. USEPA Standards for the Use and Disposal of Sewage Sludge, 503.13 (b)(1) , Ceiling Concentration Limits and (3), Pollutant Concentration (Clean Sludge) Limits.
3. Plant Key: BB - Bowery Bay, CI - Coney Island, HP - Hunts Point, JA - Jamaica, NC - Newtown Creek, NR - North River, OB - Oakwood Beach,
OH - Owls Head, PR - Port Richmond, RH - Red Hook, RK - Rockaway, TI - Tallman Island, 26 - 26th Ward, WI - Wards Island
4. Improper storage during transportation occured in February for 26Ward(26, RK, CI, JA), RH, JA, OB(OB, PR). Therefore, these samples were not utilized to calculate the values above.

City of New York DEPARTMENT OF ENVIRONMENTAL PROTECTION Bureau of Wastewater Treatment
BOWERY BAY WATER POLLUTION CONTROL PLANT
US EPA 40 CFR Part 503 Use or Disposal of Sewage Sludge
2008 Annual Report (Revised)
Prepared for
UNITED STATES ENVIRONMENTAL PROTECTION AGENCY
Prepared by
City of New York, Department of Environmental Protection Bureau of Wastewater Treatment Biosolids Management Section
96-05 Horace Harding Expressway Corona, New York 11368
(718) 595-6571
August 2009

TABLE OF CONTENTS
Bowery Bay WPCP Part 503 Annual Report 2008
i
I. BOWERY BAY DEWATERED SLUDGE QUANTITIES
A. Dewatering Facility Allocations ..............................................................................1 II. BOWERY BAY DEWATERED SLUDGE QUALITY
A. Metals Analyses .......................................................................................................1 III. BOWERY BAY DEWATERED SLUDGE END USE A. EPIC, contract 947ADM1........................................................................................6
B. EPIC, contract 1131-BIO.........................................................................................6 C. NYOFCO, contract 947ADM4................................................................................6
D. Tully/Environmental, contract 947ADM3...............................................................6 E. We Care Organics, LLC, contract 1181-BIO ..........................................................6

TABLE OF CONTENTS
Bowery Bay WPCP Part 503 Annual Report 2008
ii
LIST OF APPENDICES Appendix A - Table 3, Monthly Liquid Sludge Allocation Table 4, Monthly Dewatered Sludge Allocations to Contractors Appendix B - Table 5, Monthly Average Metals Data
Bowery Bay WPCP Part 503 Annual Report 2008
1
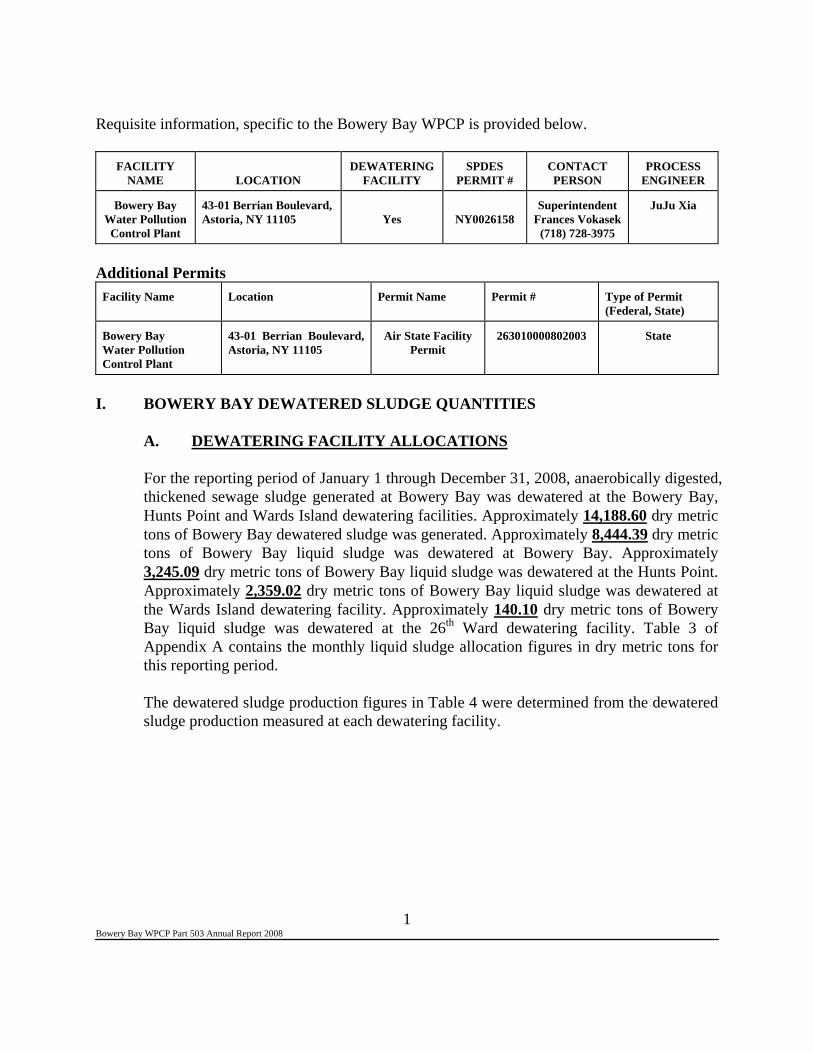
Requisite information, specific to the Bowery Bay WPCP is provided below.
FACILITY NAME
LOCATION
DEWATERING FACILITY
SPDES PERMIT #
CONTACT PERSON
PROCESS ENGINEER
Bowery Bay Water Pollution
Control Plant
43-01 Berrian Boulevard, Astoria, NY 11105
Yes
NY0026158
Superintendent Frances Vokasek
(718) 728-3975
JuJu Xia
Additional Permits
Facility Name Location Permit Name Permit # Type of Permit (Federal, State)
Bowery Bay Water Pollution Control Plant
43-01 Berrian Boulevard, Astoria, NY 11105
Air State Facility Permit
263010000802003 State
I. BOWERY BAY DEWATERED SLUDGE QUANTITIES
A. DEWATERING FACILITY ALLOCATIONS
For the reporting period of January 1 through December 31, 2008, anaerobically digested, thickened sewage sludge generated at Bowery Bay was dewatered at the Bowery Bay, Hunts Point and Wards Island dewatering facilities. Approximately 14,188.60 dry metric tons of Bowery Bay dewatered sludge was generated. Approximately 8,444.39 dry metric tons of Bowery Bay liquid sludge was dewatered at Bowery Bay. Approximately 3,245.09 dry metric tons of Bowery Bay liquid sludge was dewatered at the Hunts Point. Approximately 2,359.02 dry metric tons of Bowery Bay liquid sludge was dewatered at the Wards Island dewatering facility. Approximately 140.10 dry metric tons of Bowery Bay liquid sludge was dewatered at the 26th Ward dewatering facility. Table 3 of Appendix A contains the monthly liquid sludge allocation figures in dry metric tons for this reporting period.
The dewatered sludge production figures in Table 4 were determined from the dewatered sludge production measured at each dewatering facility.
Bowery Bay WPCP Part 503 Annual Report 2008
2
II. BOWERY BAY DEWATERED SLUDGE QUALITY
A. METALS ANALYSES
The metals analyses results of dewatered sludge samples taken by the contractors Tully Environmental (contract 947ADM3) and NYOFCO (contract 947ADM4), and EPIC 1 (contract 947ADM1) were also entered into the database maintained by the DEP. Table 5 of Appendix B summarizes the average monthly metals concentrations for the Bowery Bay WPCP. The monthly metals concentrations represent an arithmetic average of the results from the analyses of all samples of Bowery Bay dewatered sewage sludge generated each month.
During this reporting period, Bowery Bay dewatered sludge contained concentrations of metals that met the Ceiling Concentration Limits for twelve (12) months (January, February, March, April, May, June, July, August, September, October, November, December) as listed in Table 1 of 40 CFR Part 503.13(b)(1) in 2008. Further, during twelve (12) months (January, February, March, April, May, June, July, August, September, October, November, December) Bowery Bay dewatered sludge contained concentrations of metals that met the Pollutant Concentration Limits as listed in Table 3 of 40 CFR Part 503.13(b)(1).
Bowery Bay WPCP Part 503 Annual Report 2008
3
III. BOWERY BAY DEWATERED SLUDGE DEWATERED SLUDGE FROM THE BOWERY BAY WATER POLLUTION CONTROL PLANT DISTRIBUTED TO SLUDGE MANAGEMENT CONTRACTORS (DEWATERING FACILITY SHUT DOWN AUGUST, 2008) AT BOWERY BAY, HUNTS POINT, 26TH WARD, AND WARDS ISLAND DEWATERING FACILITIES.
A. EPIC 1 (contract 947ADM1)
During this reporting period no tonnage of Bowery Bay dewatered sludge was distributed to EPIC 1 (contract 947ADM1) (see introduction processing details) at the Bowery Bay dewatering facility.
B. EPIC 2 (contract 1131-BIO)
During this reporting period no tonnage of Bowery Bay dewatered sludge was distributed to EPIC 2 (contract 1131-BIO) (see introduction for processing details).
C. NYOFCO(contract 947ADM4)
Approximately 6,428.69 dry metric tons of Bowery Bay dewatered sludge was distributed to NYOFCO (contract 947ADM4) from the Bowery Bay dewatering facility during this reporting period (see Bowery Bay introduction for processing details).
D. Tully Environmental (contract 947ADM3)
Approximately 314.00 dry metric tons of Bowery Bay dewatered sludge was distributed to Tully Environmental (contract 947ADM3) (see introduction for processing details) from the Bowery Bay dewatering facility during this reporting period.

Bowery Bay WPCP Part 503 Annual Report 2008
4
E. WeCare Organics, LLC (contract 1181-BIO) During this reporting period no tonnage of Bowery Bay dewatered sludge was
distributed to WeCare Organics, LLC (contract 1181-BIO) (see introduction for processing details).
Table 2 in the introduction contains requisite information specific to each of the five sludge management contractors.

APPENDICES

APPENDIX - A
Table 3.................................Monthly Liquid Sludge AllocationTable 4.................................Monthly Dewatered SludgeAllocations to
Contractors

Table 3Monthly Liquid Sludge Allocation
Bowery Bay WPCP
Dewatering
Facility Bowery Hunts Jamaica Oakwood Red Tallman 26th Wards TOTALS
Month Bay Point Beach Hook Island Ward Island
Jan-08 1,265.30 1.48 31.22 1,298.00
Feb-08 944.19 2.27 1.54 948.00
Mar-08 1,270.10 100.20 23.70 1,394.00
Apr-08 1,159.80 101.90 29.30 1,291.00
May-08 1,305.00 0.60 1,305.60
Jun-08 1,321.00 1.00 1,322.00
Jul-08 1,179.00 1,179.00
Aug-08 664.20 319.80 984.00
Sep-08 555.50 555.50 1,111.00
Oct-08 569.50 569.50 1,139.00
Nov-08 554.20 140.10 363.70 1,058.00
Dec-08 694.24 464.76 1,159.00
TOTALS 8,444.39 3,245.09 0.00 0.00 0.00 0.00 140.10 2,359.02 14,188.60
Notes:1. Dewatered sludge production is expressed in dry metric tons which was "calculated" using liquid sludge production data from the plant.
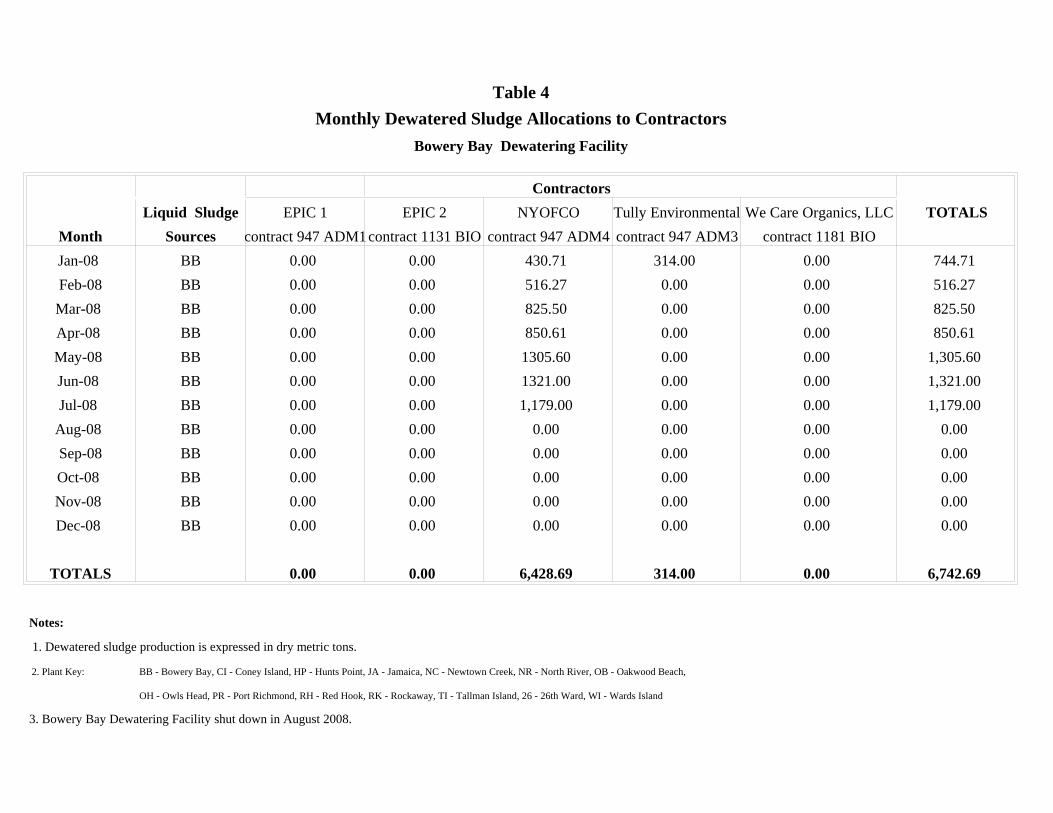
Table 4Monthly Dewatered Sludge Allocations to Contractors
Bowery Bay Dewatering Facility
ContractorsLiquid Sludge EPIC 1 EPIC 2 NYOFCO Tully Environmental We Care Organics, LLC TOTALS
Month Sources contract 947 ADM1contract 1131 BIO contract 947 ADM4 contract 947 ADM3 contract 1181 BIOJan-08 BB 0.00 0.00 430.71 314.00 0.00 744.71Feb-08 BB 0.00 0.00 516.27 0.00 0.00 516.27Mar-08 BB 0.00 0.00 825.50 0.00 0.00 825.50Apr-08 BB 0.00 0.00 850.61 0.00 0.00 850.61May-08 BB 0.00 0.00 1305.60 0.00 0.00 1,305.60Jun-08 BB 0.00 0.00 1321.00 0.00 0.00 1,321.00Jul-08 BB 0.00 0.00 1,179.00 0.00 0.00 1,179.00
Aug-08 BB 0.00 0.00 0.00 0.00 0.00 0.00Sep-08 BB 0.00 0.00 0.00 0.00 0.00 0.00Oct-08 BB 0.00 0.00 0.00 0.00 0.00 0.00Nov-08 BB 0.00 0.00 0.00 0.00 0.00 0.00Dec-08 BB 0.00 0.00 0.00 0.00 0.00 0.00
TOTALS 0.00 0.00 6,428.69 314.00 0.00 6,742.69
Notes:
1. Dewatered sludge production is expressed in dry metric tons.
2. Plant Key: BB - Bowery Bay, CI - Coney Island, HP - Hunts Point, JA - Jamaica, NC - Newtown Creek, NR - North River, OB - Oakwood Beach,
OH - Owls Head, PR - Port Richmond, RH - Red Hook, RK - Rockaway, TI - Tallman Island, 26 - 26th Ward, WI - Wards Island
3. Bowery Bay Dewatering Facility shut down in August 2008.

APPENDIX - B
Table 5...................... Monthly Average Metals Data

Table 5Monthly Metals Concentrations
Bowery Bay WPCP
Metals
Month Liquid Sludge Dewatering Arsenic Cadmium Chromium Copper Lead Mercury Molybdenum Nickel Selenium Zinc
Sources Facility mg/Kg mg/Kg mg/Kg mg/Kg mg/Kg mg/Kg mg/Kg mg/Kg mg/Kg mg/Kg
Jan-08 BB BB 2.8 3.0 110 505 117 0.9 8.7 30 4.7 840HP, NC, OH, NR, TI, PR, BB HP 3.3 7.3 48 529 192 2.0 10.9 30 2.7 1,020
WI, NC, OH, NR, BB WI 3.2 6.9 41 662 188 2.0 10.5 29 3.2 978Feb-08 BB BB 3.8 4.7 76 620 161 1.6 8.2 32 7.1 1,030
HP, OH, NC, NR, BB HP 3.1 7.3 63 664 196 1.9 10.0 35 3.5 1,093WI, NC, PR, NR, OH, BB WI 2.9 6.4 48 671 195 1.7 9.5 29 3.4 1,085
Mar-08 BB BB 6.5 2.4 3 60 228 1.5 6.3 28 3.8 1,102BB, TI, HP, OH, NC, NR HP 2.7 6.5 47 710 199 1.7 10.1 30 3.9 1,113BB, TI, WI, OH, NC, NR WI 2.9 6.4 48 657 192 2.3 9.1 29 3.1 1,058
Apr-08 BB BB 4.0 3.2 46 548 131 1.7 7.4 25 7.9 885HP, NC, NR, BB, TI, OH HP 3.1 5.2 47 674 167 1.9 8.6 26 3.3 1,083
WI, NC, NR, BB, TI WI 3.0 5.5 44 751 195 2.2 10.6 27 3.6 1,128May-08 BB BB 3.7 4.6 50 590 132 1.9 10.0 22 7.4 968
HP, BB, OH, NR, TI, NC HP 3.1 8.0 45 718 177 1.7 11 32 5.0 1,130WI, BB, NR, NC, OH WI 3.2 8.5 41 738 183 1.6 10 27 4.4 1,174
Jun-08 BB BB 4.1 6.1 66 684 166 2.1 12.3 28 4.7 1,182HP, BB, OH, NC, NR HP 3.5 7.5 55 827 242 2.1 16.2 36 4.0 1,299
Jul-08 BB BB 6.5 11.7 47 452 119 1.6 7.8 26 7.8 860HP, NC, NR, TI, OH, PR, BB HP 3.5 5.9 65 845 249 1.9 17.3 35 4.5 1,348
WI, NC, PR, NR, BB WI 3.2 6.2 51 931 280 2.1 21.2 32 3.6 1,376Aug-08 HP. NR, OH, NC, BB, TI, PR HP 3.7 2.9 77 715 183 1.7 6.9 30 3.9 1,138
WI, NR, OH, NC, BB WI 3.4 2.9 40 732 218 2.1 11.9 27 3.8 1,248Sep-08 HP, NR, BB, NC HP 4.1 9.5 78 795 235 2.0 10.3 33 4.3 1,254
WI, NR, BB, NC, OH WI 3.6 9.3 48 830 251 2.2 12.9 27 3.8 1,343Oct-08 HP, NR, BB, NC, OH HP 3.3 8.7 68 845 201 1.9 9.1 33 4.1 1,239Nov-08 JA, BB 26 2.8 5.0 32 671 167 2.3 6.8 21 5.6 1,123
HP, BB, NC, OH, NR HP 3.5 6.7 65 822 219 2.0 9.3 36 4.3 1,177WI, BB, NC, OH, NR WI 2.7 5.0 45 832 205 2.3 13.1 26 4.0 1,154
Dec-08 HP, NR, NC, BB HP 4.0 7.1 67 858 209 2.0 16.6 39 6.6 1,149WI, BB, NR, NC, OH WI 4.2 5.3 55 915 198 1.9 14.8 31 6.0 1,116
US EPA 503 RegulationsTable 1 75 85 4,300 840 57 75 420 100 7,500Table 3 41 39 1,500 300 17 420 100 2,800
Notes:
1. Concentrations are expressed on a dry weight basis and represent the mean of all samples for that month.
2. US EPA Standards for the Use and Disposal of Sewage Sludge, 503.13 (b)(1) , Ceiling Concentration Limits and (3), Pollutant Concentration (Clean Sludge) Limits.
3. Plant Key: BB - Bowery Bay, CI - Coney Island, HP - Hunts Point, JA - Jamaica, NC - Newtown Creek, NR - North River, OB - Oakwood Beach,
OH - Owls Head, PR - Port Richmond, RH - Red Hook, RK - Rockaway, TI - Tallman Island, 26 - 26th Ward, WI - Wards Island
4. Bowery Bay dewatering shut down in July 2008 .
City of New York DEPARTMENT OF ENVIRONMENTAL PROTECTION Bureau of Wastewater Treatment
CONEY ISLAND WATER POLLUTION CONTROL PLANT
US EPA 40 CFR Part 503 Use or Disposal of Sewage Sludge
2008 Annual Report (Revised)
Prepared for
UNITED STATES ENVIRONMENTAL PROTECTION AGENCY
Prepared by
City of New York, Department of Environmental Protection Bureau of Wastewater Treatment Biosolids Management Section
96-05 Horace Harding Expressway Corona, New York 11368
(718) 595-6571
August 2009

TABLE OF CONTENTS
Coney Island WPCP Part 503 Annual Report 2008
i
I. CONEY ISLAND DEWATERED SLUDGE QUANTITIES
A. Dewatering Facility Allocations ..............................................................................1 II. CONEY ISLAND DEWATERED SLUDGE QUALITY
A. Metals Analyses .......................................................................................................1

TABLE OF CONTENTS
Coney Island WPCP Part 503 Annual Report 2008
ii
LIST OF APPENDICES Appendix A - Table 3, Monthly Liquid Sludge Allocation Table 4, Monthly Dewatered Sludge Allocations to Contractors (N/A) Appendix B - Table 5, Monthly Average Metals Data

Coney Island WPCP Part 503 Annual Report 2008
1
Requisite information, specific to the Coney Island WPCP is provided below.
FACILITY NAME
LOCATION
DEWATERING FACILITY
SPDES PERMIT #
CONTACT PERSON
PROCESS ENGINEER
Coney Island Water Pollution
Control Plant
Avenue Z & Knapp Street Brooklyn, NY 11235
No
NY0026182
Acting Superintendent Ojpal Auluck (718) 743-0540
Milagros Soriano
Additional Permits
Facility Name Location Permit Name Permit # Type of Permit (Federal, State)
Coney Island Water Pollution Control Plant
Avenue Z & Knapp Street Brooklyn, NY 11235
Title V 261070000400017 Federal
I. CONEY ISLAND DEWATERED SLUDGE QUANTITIES
A. DEWATERING FACILITY ALLOCATIONS
The Coney Island WPCP is not furnished with a sludge dewatering facility. Liquid sludge from Coney Island is pumped approximately 7-miles through a 12-inch force main to the 26th Ward WPCP where the liquid sludge is dewatered.
For the reporting period of January 1 through December 31, 2008 approximately 9,096.33 dry metric tons of Coney Island liquid sludge generated was dewatered. Approximately 9,096.33 dry metric tons of Coney Island liquid sludge was dewatered at the 26th Ward dewatering facility. Table 3 of Appendix A contains the monthly dewatered liquid sludge production figures in dry metric tons for this reporting period.
Coney Island WPCP Part 503 Annual Report 2008
2
II. CONEY ISLAND DEWATERED SLUDGE QUALITY
B. METALS ANALYSES
The metals analyses results of dewatered sludge samples taken by the contractors, EPIC 1 (contract 947ADM1), EPIC 2 (contract 1131-BIO) and Tully Environmental (contract 947ADM3) were also entered into the database maintained by the DEP. Table 5 of Appendix B summarizes the average monthly metals concentrations for the Coney Island WPCP. The monthly metals concentrations represent an arithmetic average of the results from the analyses of all samples of Coney Island dewatered sewage sludge generated each month.
During this reporting period, Coney Island dewatered sludge contained concentrations of metals that always met the Ceiling Concentration Limits for twelve (12) months (January, March, April, May, June, July, August, September, October, November, December) as listed in Table 1 of 40 CFR Part 503.13(b)(1). Further during twelve (12) months (January, February, March, April, May, June, July, August, September, October, November, December) in 2008 Coney Island dewatered sludge contained concentrations of metals that met the Pollutant Concentration Limits as listed in Table 3 of 40 CFR Part 503.13(b)(1)
APPENDICES

APPENDIX - A
Table 3.................................Monthly Liquid Sludge AllocationTable 4.................................Monthly Dewatered SludgeAllocations to
Contractors (Not Applicable)
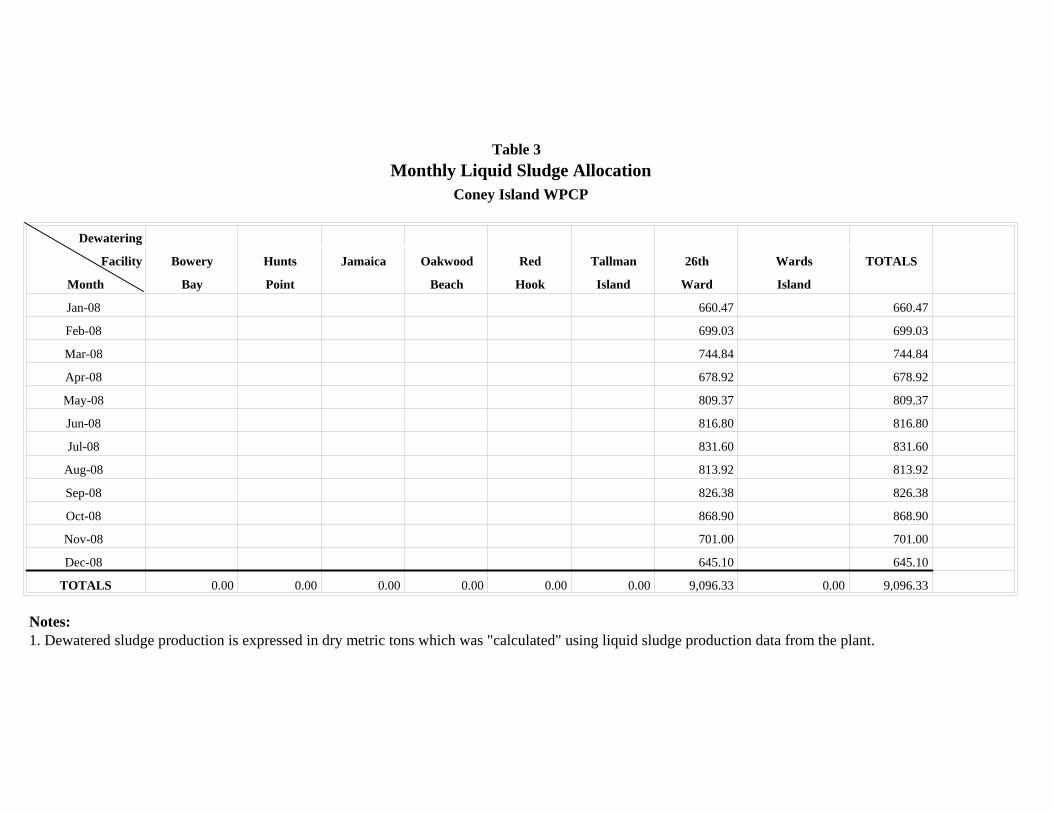
Table 3Monthly Liquid Sludge Allocation
Coney Island WPCP
Dewatering
Facility Bowery Hunts Jamaica Oakwood Red Tallman 26th Wards TOTALS
Month Bay Point Beach Hook Island Ward Island
Jan-08 660.47 660.47
Feb-08 699.03 699.03
Mar-08 744.84 744.84
Apr-08 678.92 678.92
May-08 809.37 809.37
Jun-08 816.80 816.80
Jul-08 831.60 831.60
Aug-08 813.92 813.92
Sep-08 826.38 826.38
Oct-08 868.90 868.90
Nov-08 701.00 701.00
Dec-08 645.10 645.10
TOTALS 0.00 0.00 0.00 0.00 0.00 0.00 9,096.33 0.00 9,096.33
Notes:1. Dewatered sludge production is expressed in dry metric tons which was "calculated" using liquid sludge production data from the plant.

APPENDIX - B
Table 5...................... Monthly Average Metals Data

Table 5Monthly Metals Concentrations
Coney Island WPCP
Metals
Month Liquid Sludge Dewatering Arsenic Cadmium Chromium Copper Lead Mercury Molybdenum Nickel Selenium Zinc
Sources Facility mg/Kg mg/Kg mg/Kg mg/Kg mg/Kg mg/Kg mg/Kg mg/Kg mg/Kg mg/Kg
Jan-08 CI 26 3 4.4 23 661 155 2.1 6.9 20 4.1 991
Feb-08 26
Mar-08 CI 26 2.7 3.3 27 749 191 1.9 5.7 24 4.3 1,177Apr-08 CI 26 2.9 2.9 27 739 183 2.2 4.6 22 3.9 1,150May-08 CI 26 3.4 5.4 49 829 191 2.3 6.1 57 5.9 1,194Jun-08 CI 26 3.7 4.2 130 962 300 3.5 12.6 186 5.1 1,456Jul-08 CI 26 2.4 3.8 106 879 235 6.3 7.8 160 5.1 1,418
Aug-08 CI 26 2.7 1.6 44 749 188 5.2 6.8 61 4.6 1,238Sep-08 CI 26 3.2 6.4 46 820 222 3.9 8.9 51 4.8 1,326Oct-08 CI 26 2.6 5.5 24 766 164 2.8 6.5 29 4.1 1,171Nov-08 CI 26 2.5 2.9 24 761 170 2.6 5.0 27 5.4 1,192Dec-08 CI 26 3.2 3.3 32 743 174 2.1 8.1 26 8.7 1,134
US EPA 503 RegulationsTable 1 75 85 4,300 840 57 75 420 100 7,500Table 3 41 39 1,500 300 17 420 100 2,800
Notes:
1. Concentrations are expressed on a dry weight basis and represent the mean of all samples for that month.
2. US EPA Standards for the Use and Disposal of Sewage Sludge, 503.13 (b)(1) , Ceiling Concentration Limits and (3), Pollutant Concentration (Clean Sludge) Limits.
3. Plant Key: BB - Bowery Bay, CI - Coney Island, HP - Hunts Point, JA - Jamaica, NC - Newtown Creek, NR - North River, OB - Oakwood Beach,
OH - Owls Head, PR - Port Richmond, RH - Red Hook, RK - Rockaway, TI - Tallman Island, 26 - 26th Ward, WI - Wards Island
4. Improper storage during transportation occured in February for 26Ward(26, RK, CI, JA), RH, JA, OB(OB, PR). Therefore, there is no CI sample for the month of February.

City of New York DEPARTMENT OF ENVIRONMENTAL PROTECTION Bureau of Wastewater Treatment
HUNTS POINT WATER POLLUTION CONTROL PLANT
US EPA 40 CFR Part 503 Use or Disposal of Sewage Sludge
2008 Annual Report (Revised)
Prepared for
UNITED STATES ENVIRONMENTAL PROTECTION AGENCY
Prepared by
City of New York, Department of Environmental Protection Bureau of Wastewater Treatment Biosolids Management Section
96-05 Horace Harding Expressway Corona, New York 11368
(718) 595-6571
August 2009
TABLE OF CONTENTS
Hunts Point WPCP Part 503 Annual Report 2008
i
I. HUNTS POINT DEWATERED SLUDGE QUANTITIES
A. Dewatering Facility Allocations ..............................................................................1 II. HUNTS POINT DEWATERED SLUDGE QUALITY
A. Metals Analyses .......................................................................................................1
III. HUNTS POINT DEWATERED SLUDGE END USE
A. EPIC, contract 947ADM 1.......................................................................................3 B. EPIC, contract 1131-BIO.........................................................................................3 C. NYOFCO, contract 947ADM4................................................................................3 D. Tully Environmental, contract 947ADM3...............................................................3
E. WeCare Organics, LLC, contract 1181-BIO ...........................................................3

TABLE OF CONTENTS
Hunts Point WPCP Part 503 Annual Report 2008
ii
LIST OF APPENDICES Appendix A - Table 3, Monthly Liquid Sludge Allocation Table 4, Monthly Dewatered Sludge Allocations to Contractors Appendix B - Table 5, Monthly Average Metals Data

Hunts Point WPCP Part 503 Annual Report 2008
1
Requisite information, specific to the Hunts Point WPCP is provided below.
FACILITY NAME
LOCATION
DEWATERING FACILITY
SPDES PERMIT #
CONTACT PERSON
PROCESS ENGINEER
Hunts Point Water Pollution Control Plant
Coster St. & Ryawa Avenue Bronx, NY 10454
Yes
NY0026191
Superintendent Robert Durbin (718) 589-1120
Robert Bruno
Additional Permits
Facility Name Location Permit Name Permit # Type of Permit (Federal, State)
Hunts Point Water Pollution Control Plant
Coster St. & Ryawa Avenue Bronx, NY 10454
Air State Facility Permit
260070002502005 State
I. HUNTS POINT DEWATERED SLUDGE QUANTITIES
A. DEWATERING FACILITY ALLOCATIONS
For the reporting period of January 1 through December 31, 2008 all anaerobically digested, thickened sewage sludge generated at Hunts Point was dewatered at the Hunts Point sludge dewatering facility. Approximately 14,085.00 dry metric tons of Hunts Point liquid sludge generated was dewatered. All the Hunts Point liquid sludge generated at Hunts Point was dewatered at the Hunts Point dewatering facility. The Hunts Point sludge dewatering facility received liquid sludge from the Bowery Bay WPCP, the Newtown Creek WPCP, the North River WPCP, the Owls Head WPCP, the Port Richmond WPCP, and the Tallman Island WPCP during this reporting period. Table 3 of Appendix A contains the monthly dewatered sludge allocation figures in dry metric tons for this reporting period.
The dewatered sludge production figures in Table 4 were determined from the dewatered sludge allocation measured at each dewatering facility.
Hunts Point WPCP Part 503 Annual Report 2008
2
II. HUNTS POINT DEWATERED SLUDGE QUALITY
A. METALS ANALYSES
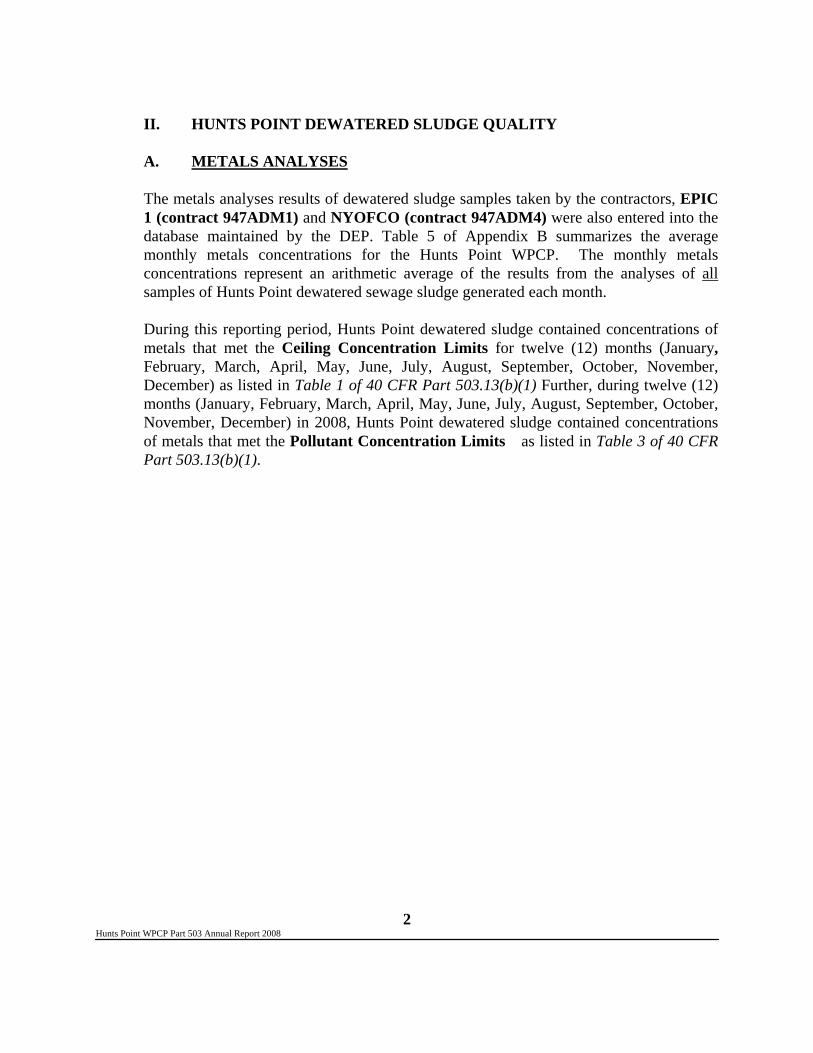
The metals analyses results of dewatered sludge samples taken by the contractors, EPIC 1 (contract 947ADM1) and NYOFCO (contract 947ADM4) were also entered into the database maintained by the DEP. Table 5 of Appendix B summarizes the average monthly metals concentrations for the Hunts Point WPCP. The monthly metals concentrations represent an arithmetic average of the results from the analyses of all samples of Hunts Point dewatered sewage sludge generated each month.
During this reporting period, Hunts Point dewatered sludge contained concentrations of metals that met the Ceiling Concentration Limits for twelve (12) months (January, February, March, April, May, June, July, August, September, October, November, December) as listed in Table 1 of 40 CFR Part 503.13(b)(1) Further, during twelve (12) months (January, February, March, April, May, June, July, August, September, October, November, December) in 2008, Hunts Point dewatered sludge contained concentrations of metals that met the Pollutant Concentration Limits as listed in Table 3 of 40 CFR Part 503.13(b)(1).
Hunts Point WPCP Part 503 Annual Report 2008
3
III. HUNTS POINT DEWATERED SLUDGE DEWATERED SLUDGE FROM HUNTS POINT, BOWERY BAY, NEWTOWN
CREEK, NORTH RIVER, OWLS HEAD, PORT RICHMOND, TALLMAN ISLAND WATER POLLUTION CONTROL PLANTS DISTRIBUTED TO SLUDGE MANAGEMENT CONTRACTORS AT THE HUNTS POINT DEWATERING FACILITY.
A. EPIC 1 (contract 947ADM1)
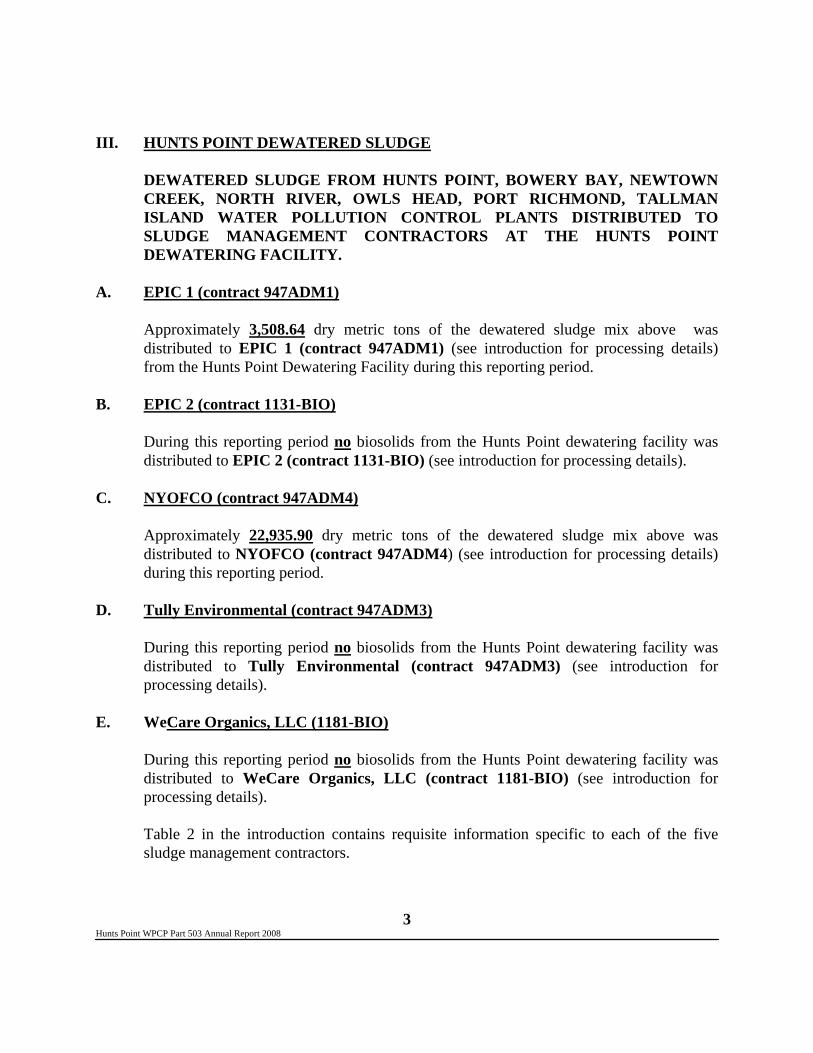
Approximately 3,508.64 dry metric tons of the dewatered sludge mix above was distributed to EPIC 1 (contract 947ADM1) (see introduction for processing details) from the Hunts Point Dewatering Facility during this reporting period.
B. EPIC 2 (contract 1131-BIO)
During this reporting period no biosolids from the Hunts Point dewatering facility was distributed to EPIC 2 (contract 1131-BIO) (see introduction for processing details).
C. NYOFCO (contract 947ADM4)
Approximately 22,935.90 dry metric tons of the dewatered sludge mix above was distributed to NYOFCO (contract 947ADM4) (see introduction for processing details) during this reporting period.
D. Tully Environmental (contract 947ADM3)
During this reporting period no biosolids from the Hunts Point dewatering facility was distributed to Tully Environmental (contract 947ADM3) (see introduction for processing details).
E. WeCare Organics, LLC (1181-BIO)
During this reporting period no biosolids from the Hunts Point dewatering facility was distributed to WeCare Organics, LLC (contract 1181-BIO) (see introduction for processing details).
Table 2 in the introduction contains requisite information specific to each of the five sludge management contractors.

APPENDICES
APPENDIX - A
Table 3.................................Monthly Liquid Sludge AllocationTable 4.................................Monthly Dewatered SludgeAllocations to
Contractors

Table 3Monthly Liquid Sludge Allocation
Hunts Point WPCP
Dewatering
Facility Bowery Hunts Jamaica Oakwood Red Tallman 26th Wards TOTALS
Month Bay Point Beach Hook Island Ward Island
Jan-08 1,237.00 1,237.00
Feb-08 1,204.00 1,204.00
Mar-08 1,314.00 1,314.00
Apr-08 1,244.00 1,244.00
May-08 1,279.00 1,279.00
Jun-08 1,254.00 1,254.00
Jul-08 1,076.00 1,076.00
Aug-08 1,117.00 1,117.00
Sep-08 938.00 938.00
Oct-08 1,169.00 1,169.00
Nov-08 958.00 958.00
Dec-08 1,295.00 1,295.00
TOTALS 0.00 14,085.00 0.00 0.00 0.00 0.00 0.00 0.00 14,085.00
Notes:1. Dewatered sludge production is expressed in dry metric tons which was "calculated" using liquid sludge production data from the plant.
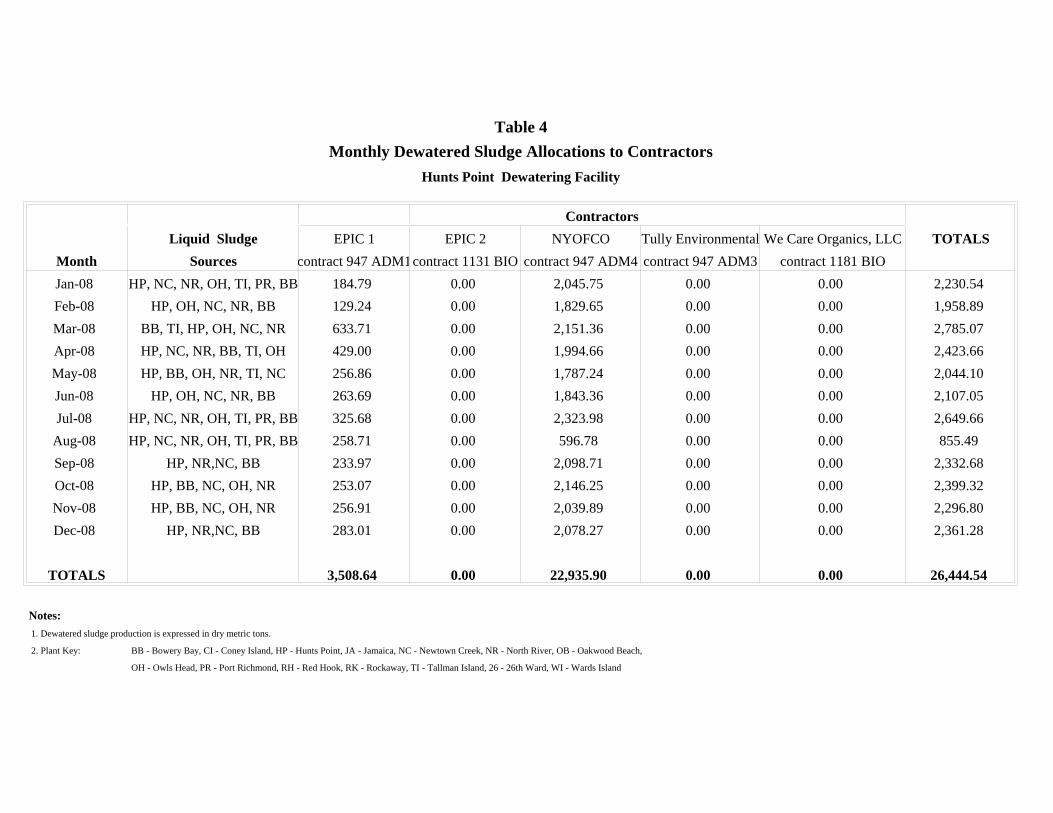
Table 4Monthly Dewatered Sludge Allocations to Contractors
Hunts Point Dewatering Facility
ContractorsLiquid Sludge EPIC 1 EPIC 2 NYOFCO Tully Environmental We Care Organics, LLC TOTALS
Month Sources contract 947 ADM1contract 1131 BIO contract 947 ADM4 contract 947 ADM3 contract 1181 BIOJan-08 HP, NC, NR, OH, TI, PR, BB 184.79 0.00 2,045.75 0.00 0.00 2,230.54Feb-08 HP, OH, NC, NR, BB 129.24 0.00 1,829.65 0.00 0.00 1,958.89Mar-08 BB, TI, HP, OH, NC, NR 633.71 0.00 2,151.36 0.00 0.00 2,785.07Apr-08 HP, NC, NR, BB, TI, OH 429.00 0.00 1,994.66 0.00 0.00 2,423.66May-08 HP, BB, OH, NR, TI, NC 256.86 0.00 1,787.24 0.00 0.00 2,044.10Jun-08 HP, OH, NC, NR, BB 263.69 0.00 1,843.36 0.00 0.00 2,107.05Jul-08 HP, NC, NR, OH, TI, PR, BB 325.68 0.00 2,323.98 0.00 0.00 2,649.66
Aug-08 HP, NC, NR, OH, TI, PR, BB 258.71 0.00 596.78 0.00 0.00 855.49Sep-08 HP, NR,NC, BB 233.97 0.00 2,098.71 0.00 0.00 2,332.68Oct-08 HP, BB, NC, OH, NR 253.07 0.00 2,146.25 0.00 0.00 2,399.32Nov-08 HP, BB, NC, OH, NR 256.91 0.00 2,039.89 0.00 0.00 2,296.80Dec-08 HP, NR,NC, BB 283.01 0.00 2,078.27 0.00 0.00 2,361.28
TOTALS 3,508.64 0.00 22,935.90 0.00 0.00 26,444.54
Notes: 1. Dewatered sludge production is expressed in dry metric tons.
2. Plant Key: BB - Bowery Bay, CI - Coney Island, HP - Hunts Point, JA - Jamaica, NC - Newtown Creek, NR - North River, OB - Oakwood Beach,
OH - Owls Head, PR - Port Richmond, RH - Red Hook, RK - Rockaway, TI - Tallman Island, 26 - 26th Ward, WI - Wards Island

APPENDIX - B
Table 5...................... Monthly Average Metals Data

Table 5Monthly Metals Concentrations
Hunts Point WPCP
Metals
Month Liquid Sludge Dewatering Arsenic Cadmium Chromium Copper Lead Mercury Molybdenum Nickel Selenium Zinc
Sources Facility mg/Kg mg/Kg mg/Kg mg/Kg mg/Kg mg/Kg mg/Kg mg/Kg mg/Kg mg/Kg
Jan-08 HP HP 4.7 5.5 72 624 178 2.0 9 32 8.1 987HP, NC, OH, NR, TI, PR, BB 3.3 7.3 48 529 192 2.0 10.9 30 2.7 1,030
Feb-08 HP HP 4.7 5.3 70 614 174 2.1 9.4 35 8.4 972HP, OH, NC, NR, BB 3.1 7.3 63 664 196 1.9 10 35 3.5 1,093
Mar-08 HP HP 4.5 5.7 58 639 185 1.9 9 30 7.9 1,006BB, TI, HP, OH, NC, NR 2.7 6.5 47 710 199 1.7 10.1 30 3.9 1,113
Apr-08 HP HP 4.7 4.6 66 616 165 2.5 11 31 8.6 933HP, NC, NR, BB, TI, OH 3.1 5.2 47 674 167 1.9 8.6 26 3.3 1,083
May-08 HP HP 4.5 5.8 63 659 165 2.6 11 75 10.4 974HP, BB, OH, NR, TI, NC 3.1 8.0 45 718 177 1.7 11 32 5.0 1,130
Jun-08 HP HP 4.1 5.6 55 639 193 2.3 13 30 4.1 1,027HP, BB, OH, NC, NR 3.5 7.5 55 827 242 2.1 16 36 4.0 1,299
Jul-08 HP HP 7.0 12.5 56 590 185 2.7 23 25 6.7 916HP, NC, NR, TI, OH, PR, BB 3.5 5.9 65 845 249 1.9 17 35 4.5 1,348
Aug-08 HP HP 7.2 10.3 63 662 212 2.4 11 34 7.8 1,125HP, NR, OH, NC, BB, TI, PR 3.7 2.9 77 715 183 1.7 7 30 3.9 1,138
Sep-08 HP HP 9.2 18.3 73 736 228 1.9 10.2 31 9.1 1,176HP, NR, BB, NC 4.1 9.5 78 795 235 2.0 10 33 4.3 1,254
Oct-08 HP HP 9.2 18.6 72 770 196 2.1 12 33 9.2 1,019HP, NR, BB, NC, OH 3.3 8.7 68 845 201 1.9 9 33 4.1 1,239
Nov-08 HP HP 6.8 12.2 69 852 213 2.2 9 36 5.3 1,181HP, BB, NC, OH, NR 3.5 6.7 65 822 219 2.0 9 36 4.3 1,177
Dec-08 HP HP 4.8 9.3 62 714 192 2.2 12 33 5.2 950HP, NR, NC, BB 4.0 7.1 67 858 209 2.0 17 39 6.6 1,149
US EPA 503 RegulationsTable 1 75 85 4,300 840 57 75 420 100 7,500Table 3 41 39 1,500 300 17 420 100 2,800
Notes:
1. Concentrations are expressed on a dry weight basis and represent the mean of all samples for that month.
2. US EPA Standards for the Use and Disposal of Sewage Sludge, 503.13 (b)(1) , Ceiling Concentration Limits and (3), Pollutant Concentration (Clean Sludge) Limits.
3. Plant Key: BB - Bowery Bay, CI - Coney Island, HP - Hunts Point, JA - Jamaica, NC - Newtown Creek, NR - North River, OB - Oakwood Beach,
OH - Owls Head, PR - Port Richmond, RH - Red Hook, RK - Rockaway, TI - Tallman Island, 26 - 26th Ward, WI - Wards Island

City of New York DEPARTMENT OF ENVIRONMENTAL PROTECTION Bureau of Wastewater Treatment
JAMAICA WATER POLLUTION CONTROL PLANT
US EPA 40 CFR Part 503 Use or Disposal of Sewage Sludge
2008 Annual Report (Revised)
Prepared for
UNITED STATES ENVIRONMENTAL PROTECTION AGENCY
Prepared by
City of New York, Department of Environmental Protection Bureau of Wastewater Treatment Biosolids Management Section
96-05 Horace Harding Expressway Corona, New York 11368
(718) 595-6571
August 2009

TABLE OF CONTENTS
Jamaica WPCP Part 503 Annual Report 2008
I. JAMAICA DEWATERED SLUDGE QUANTITIES
A. Dewatering Facility Allocations ..............................................................................1 II. JAMAICA DEWATERED SLUDGE QUALITY
A. Metals Analyses .......................................................................................................2 III. JAMAICA DEWATERED SLUDGE END USE
A. EPIC, contract 947ADM1........................................................................................5 B. EPIC, contract 1131-BIO.........................................................................................5 C. NYOFCO, contract 947ADM4................................................................................5 D. Tully Environmental, contract 947ADM3...............................................................5 E. WeCare Organics, LLC, contract 1181-BIO ...........................................................5

Jamaica WPCP Part 503 Annual Report 2008
2
LIST OF APPENDICES Appendix A - Table 3, Monthly Liquid Sludge Allocation Table 4, Monthly Dewatered Sludge Allocations to Contractors Appendix B - Table 5, Monthly Average Metals Data

Jamaica WPCP Part 503 Annual Report 2008
3
Requisite information, specific to the Jamaica WPCP is provided below.
FACILITY NAME
LOCATION
DEWATERING FACILITY
SPDES PERMIT #
CONTACT PERSON
PROCESS ENGINEER
Jamaica Water Pollution Control Plant
150 Ave. & 134 Street Jamaica, NY 11430
Yes
NYOO26115
Superintendent Lawrence
Brincat (718) 529-3549
Don Akamnonu
Additional Permits
Facility Name Location Permit Name Permit # Type of Permit (Federal, State)
Jamaica Water Pollution Control Plant
150 Ave. & 134 Street Jamaica, NY 11430
Air State Facility Permit
263080002102002 State
I. JAMAICA DEWATERED SLUDGE QUANTITIES
A. DEWATERING FACILITY ALLOCATIONS
For the reporting period of January 1 through December 31, 2008 all anaerobically digested, thickened sewage sludge generated at Jamaica was dewatered at the Jamaica sludge dewatering facility or the 26th Ward dewatering facility. Approximately 9,024.31 dry metric tons of Jamaica dewatered sludge was generated during this time period. Approximately 6,138.81 dry metric tons of Jamaica dewatered sludge was dewatered at the 26th Ward dewatering facility. Approximately 2,885.50 dry metric tons of Jamaica dewatered sludge was dewatered at the Jamaica dewatering facility. Table 3 of Appendix A contains the monthly dewatered sludge allocation figures in dry metric tons for this reporting period. The dewatered sludge production figures in Table 4 were determined from the dewatered sludge allocation measured at each dewatering facility.

Jamaica WPCP Part 503 Annual Report 2008
4
II. JAMAICA DEWATERED SLUDGE QUALITY
A. METALS ANALYSES
The metals analyses results of dewatered sludge samples taken by the contractor, Tully Environmental (contract 947ADM3), EPIC 1(contract 947ADM1), and EPIC 2 (contract 1131-BIO) were also entered into the database maintained by the DEP. Table 5 of Appendix B summarizes the average monthly metals concentrations for the Jamaica WPCP. The monthly metals concentrations represent an arithmetic average of the results from the analyses of all samples of Jamaica dewatered sewage sludge generated each month. During this reporting period, Jamaica dewatered sludge contained concentrations of metals that met the Ceiling Concentration Limits for twelve (12) months (January, February, March, April, May, June, July, August, September, October, November, December) as listed in Table 1 of 40 CFR Part 503.13(b)(1). Further, during twelve(12) months (January, February, March, April, May, June, July, August, September, October, November, December) in 2008, Jamaica dewatered sludge contained concentrations of metals that met the Pollutant Concentration Limits as listed in Table 3 of 40 CFR Part 503.13(b)(1).

Jamaica WPCP Part 503 Annual Report 2008
5
III. JAMAICA DEWATERED SLUDGE
DEWATERED SLUDGE FROM THE JAMAICA WATER POLLUTION CONTROL PLANT DISTRIBUTED TO SLUDGE MANAGEMENT CONTRACTORS AT THE JAMAICA AND 26TH WARD DEWATERING FACILITIES.
A. EPIC 1 (contract 947ADM1)
During this reporting period, approximately 535.29 dry metric tons of dewatered biosolids from the Jamaica Dewatering Facility was distributed to EPIC 1 (contract 947ADM1) (see introduction for processing details).
B. EPIC 2 (contract 1131-BIO)
During this reporting period, no biosolids from the Jamaica Dewatering Facility was distributed to EPIC 2 (contract 1131-BIO) (see introduction for processing details).
C. NYOFCO (contract 947ADM4)
During this reporting period there was no biosolids from the Jamaica Dewatering Facility was distributed to NYOFCO (contract 947ADM4) (see introduction for processing details).
D. Tully Environmental (contract 947ADM3)
Approximately 1,532.96 dry metric tons of the Jamaica Dewatering Facility dewatered sludge was distributed to Tully Environmental (contract 947ADM3) (see introduction for processing details).
E. WeCare Organics, LLC (contract 1181-BIO)
During this reporting period there was no biosolids from the Jamaica Dewatering Facility was distributed to WeCare Organics, LLC (contract 1181-BIO)(see introduction for processing details).
Table 2 in the introduction contains requisite information specific to each of the five sludge management contractors.

APPENDICES

APPENDIX - A
Table 3.................................Monthly Liquid Sludge AllocationTable 4.................................Monthly Dewatered SludgeAllocations to
Contractors
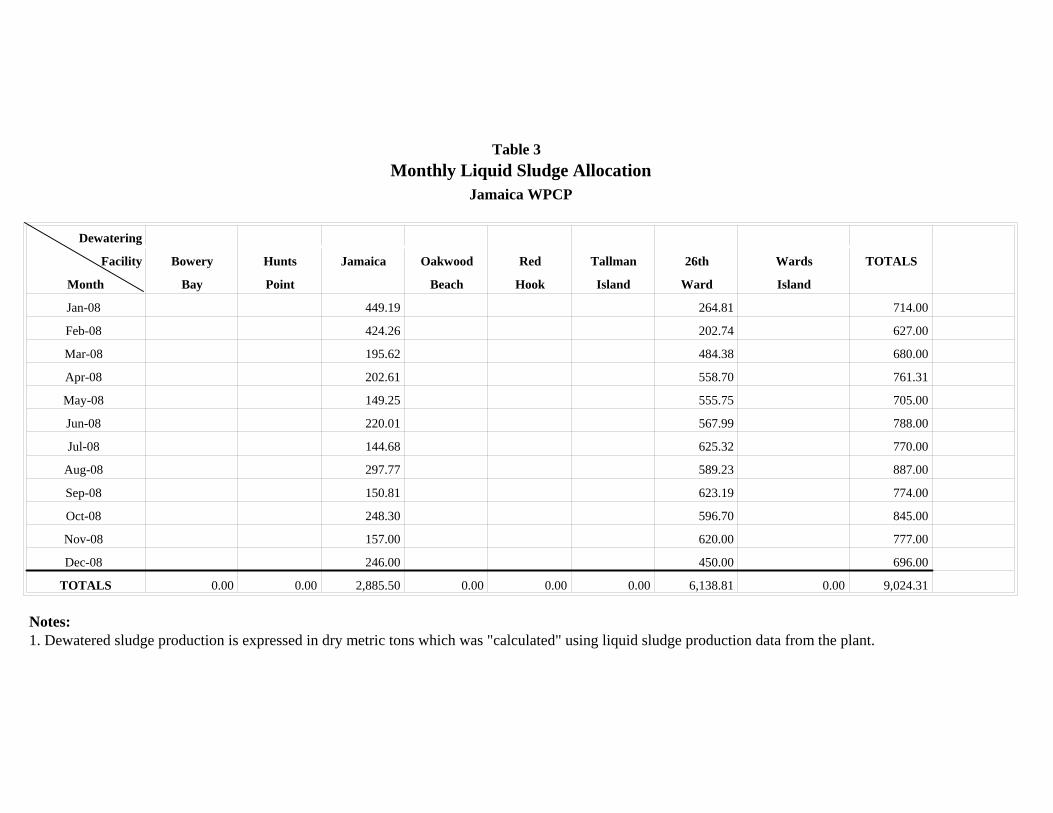
Table 3Monthly Liquid Sludge Allocation
Jamaica WPCP
Dewatering
Facility Bowery Hunts Jamaica Oakwood Red Tallman 26th Wards TOTALS
Month Bay Point Beach Hook Island Ward Island
Jan-08 449.19 264.81 714.00
Feb-08 424.26 202.74 627.00
Mar-08 195.62 484.38 680.00
Apr-08 202.61 558.70 761.31
May-08 149.25 555.75 705.00
Jun-08 220.01 567.99 788.00
Jul-08 144.68 625.32 770.00
Aug-08 297.77 589.23 887.00
Sep-08 150.81 623.19 774.00
Oct-08 248.30 596.70 845.00
Nov-08 157.00 620.00 777.00
Dec-08 246.00 450.00 696.00
TOTALS 0.00 0.00 2,885.50 0.00 0.00 0.00 6,138.81 0.00 9,024.31
Notes:1. Dewatered sludge production is expressed in dry metric tons which was "calculated" using liquid sludge production data from the plant.
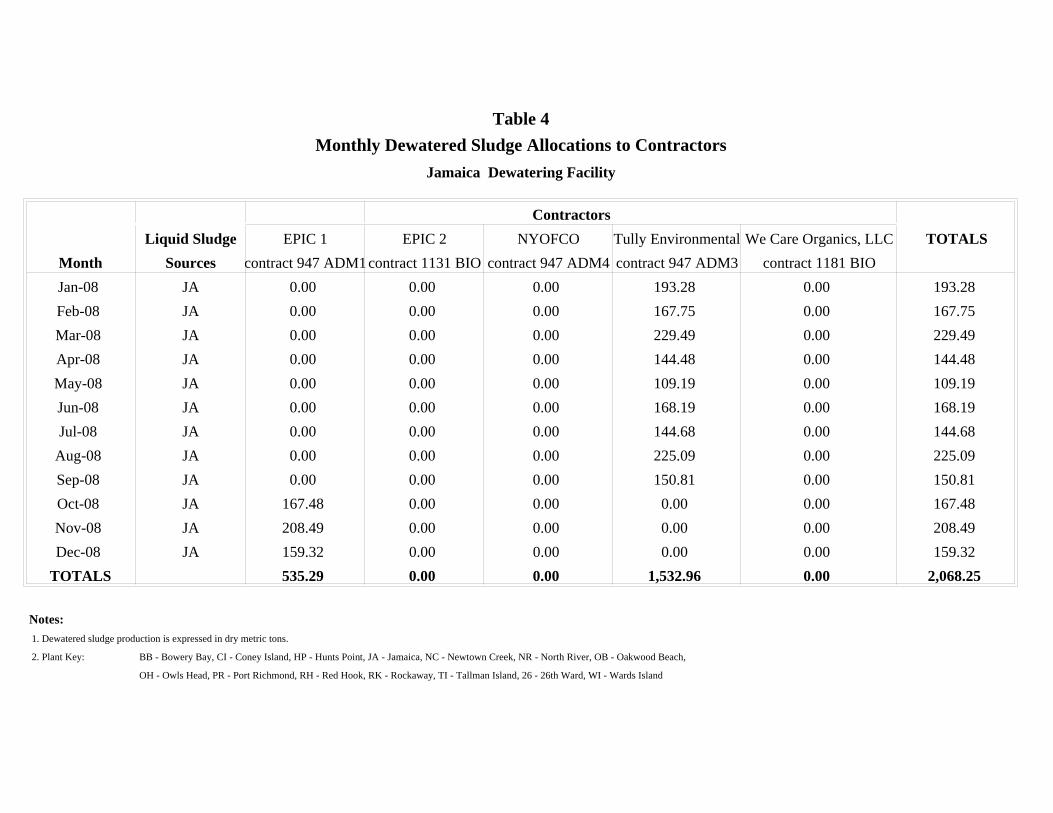
Table 4Monthly Dewatered Sludge Allocations to Contractors
Jamaica Dewatering Facility
ContractorsLiquid Sludge EPIC 1 EPIC 2 NYOFCO Tully Environmental We Care Organics, LLC TOTALS
Month Sources contract 947 ADM1contract 1131 BIO contract 947 ADM4 contract 947 ADM3 contract 1181 BIOJan-08 JA 0.00 0.00 0.00 193.28 0.00 193.28Feb-08 JA 0.00 0.00 0.00 167.75 0.00 167.75Mar-08 JA 0.00 0.00 0.00 229.49 0.00 229.49Apr-08 JA 0.00 0.00 0.00 144.48 0.00 144.48May-08 JA 0.00 0.00 0.00 109.19 0.00 109.19Jun-08 JA 0.00 0.00 0.00 168.19 0.00 168.19Jul-08 JA 0.00 0.00 0.00 144.68 0.00 144.68
Aug-08 JA 0.00 0.00 0.00 225.09 0.00 225.09Sep-08 JA 0.00 0.00 0.00 150.81 0.00 150.81Oct-08 JA 167.48 0.00 0.00 0.00 0.00 167.48Nov-08 JA 208.49 0.00 0.00 0.00 0.00 208.49Dec-08 JA 159.32 0.00 0.00 0.00 0.00 159.32
TOTALS 535.29 0.00 0.00 1,532.96 0.00 2,068.25
Notes: 1. Dewatered sludge production is expressed in dry metric tons.
2. Plant Key: BB - Bowery Bay, CI - Coney Island, HP - Hunts Point, JA - Jamaica, NC - Newtown Creek, NR - North River, OB - Oakwood Beach,
OH - Owls Head, PR - Port Richmond, RH - Red Hook, RK - Rockaway, TI - Tallman Island, 26 - 26th Ward, WI - Wards Island

APPENDIX - B
Table 5...................... Monthly Average Metals Data

Table 5Monthly Metals Concentrations
Jamaica WPCP
Metals
Month Liquid Sludge Dewatering Arsenic Cadmium Chromium Copper Lead Mercury Molybdenum Nickel Selenium Zinc
Sources Facility mg/Kg mg/Kg mg/Kg mg/Kg mg/Kg mg/Kg mg/Kg mg/Kg mg/Kg mg/Kg
Jan-08 JA JA 3.3 4.0 25 551 133 1.6 10.0 19 5.8 868JA 26 3.0 5.3 27 601 160 1.9 7.7 22 4.2 1,023
Feb-08 JA JA 2.5 1.5 19 370 74 0.7 14.4 13 5.9 552Mar-08 JA JA 2.4 3.0 21 452 107 1.3 6.6 15 4.5 761
JA 26 2.7 4.2 30 611 167 1.7 6.6 19 5.1 1,075Apr-08 JA JA 2.9 2.4 25 582 121 1.5 8.0 16 7.5 877
JA, OH, NC 26 3.6 3.1 29 642 150 2.0 5.7 18 5.1 1,070May-08 JA JA 3.0 4.0 26 573 114 1.3 8.8 16 5.8 888
26, JA, OH 26 2.9 5.9 26 632 149 1.8 5.7 17 6.2 961Jun-08 JA JA 2.9 2.9 25 604 127 1.5 13.1 20 6.8 962
JA, NC 26 2.7 4.4 43 693 167 2.1 19.4 33 4.2 1,119Jul-08 JA JA 3.5 3.1 28 582 128 1.6 9.6 24 7.8 985
JA 26 3.1 4.2 40 682 158 2.3 7.1 38 7.7 1,189Aug-08 JA JA 3.4 1.7 26 552 132 1.5 10.1 17 5.8 1,037
JA 26 3.2 2.8 39 695 202 3.4 8.0 36 4.4 1,247Sep-08 JA JA 5.7 10.1 29 557 136 1.6 10.0 17 7.8 1,031
JA 26 3.1 7.5 36 741 195 2.8 8.9 33 3.9 1,272Oct-08 JA JA 9.0 18.1 27 568 133 1.9 7.7 16 9.3 1,078
JA 26 2.6 8.2 28 653 157 2.0 6.8 24 3.8 1,126Nov-08 JA JA 6.5 10.3 26 597 113 1.9 6.6 16 4.9 1,060
JA, BB 26 2.8 5.0 32 671 167 2.3 6.8 21 5.6 1,123Dec-08 JA JA 4.6 8.8 28 592 121 1.9 6.7 16 54.0 975
JA, NC 26 4.0 5.1 39 775 181 1.9 9.5 24 7.2 1,140US EPA 503 Regulations
Table 1 75 85 4,300 840 57 75 420 100 7,500Table 3 41 39 1,500 300 17 420 100 2,800
Notes:
1. Concentrations are expressed on a dry weight basis and represent the mean of all samples for that month.
2. US EPA Standards for the Use and Disposal of Sewage Sludge, 503.13 (b)(1) , Ceiling Concentration Limits and (3), Pollutant Concentration (Clean Sludge) Limits.
3. Plant Key: BB - Bowery Bay, CI - Coney Island, HP - Hunts Point, JA - Jamaica, NC - Newtown Creek, NR - North River, OB - Oakwood Beach,
OH - Owls Head, PR - Port Richmond, RH - Red Hook, RK - Rockaway, TI - Tallman Island, 26 - 26th Ward, WI - Wards Island
4. Improper storage during transportation occured in February for 26Ward(26, RK, CI, JA), RH, JA, OB(OB, PR). Therefore, these samples were not utilized to calculate the values above.

City of New York DEPARTMENT OF ENVIRONMENTAL PROTECTION Bureau of Wastewater Treatment
NEWTOWN CREEK WATER POLLUTION CONTROL PLANT
US EPA 40 CFR Part 503 Use or Disposal of Sewage Sludge
2008 Annual Report (Revised)
Prepared for
UNITED STATES ENVIRONMENTAL PROTECTION AGENCY
Prepared by
City of New York, Department of Environmental Protection Bureau of Wastewater Treatment Biosolids Management Section
96-05 Horace Harding Expressway Corona, New York 11368
(718) 595-6571
August 2009

TABLE OF CONTENTS
Newtown Creek WPCP Part 503 Annual Report 2008
i
I. NEWTOWN CREEK DEWATERED SLUDGE QUANTITIES
A. Dewatering Facility Allocations ..............................................................................1 II. NEWTOWN CREEK DEWATERED SLUDGE QUALITY
A. Metals Analyses .......................................................................................................1

TABLE OF CONTENTS
Newtown Creek WPCP Part 503 Annual Report 2008
ii
LIST OF APPENDICES Appendix A - Table 3, Monthly Liquid Sludge Allocation Table 4, Monthly Dewatered Sludge Allocations to Contractors - N/A Appendix B - Table 5, Monthly Average Metals Data
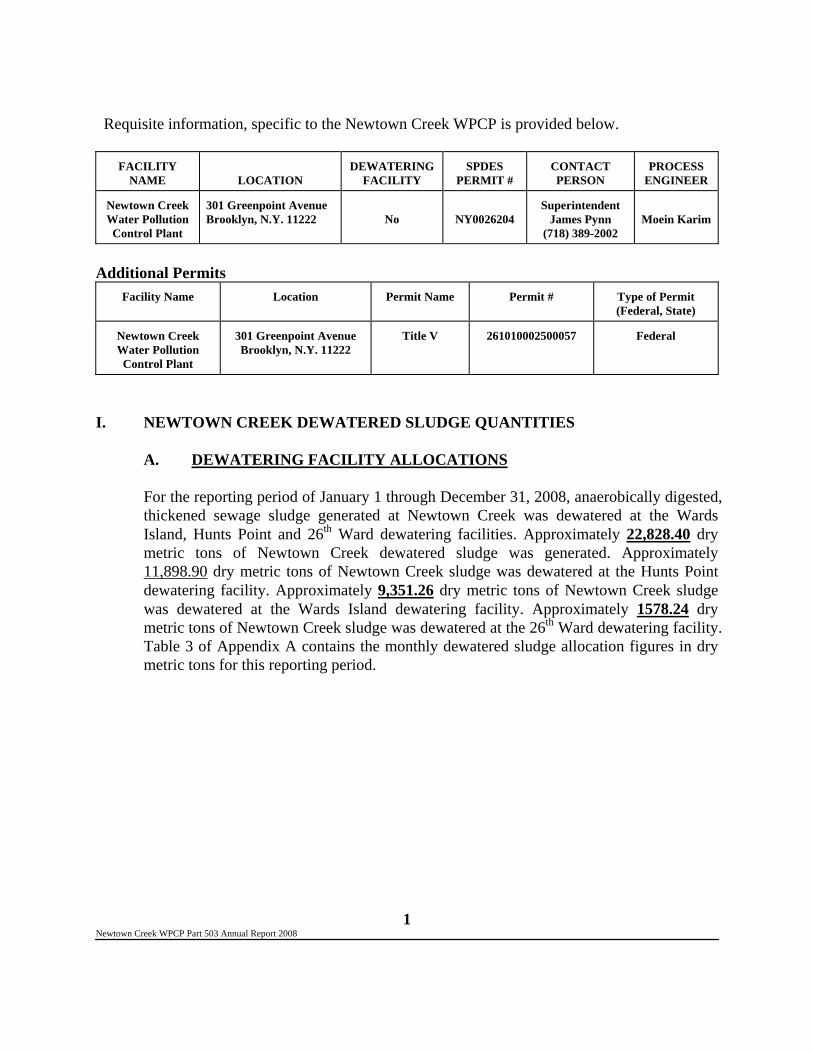
Newtown Creek WPCP Part 503 Annual Report 2008
1
Requisite information, specific to the Newtown Creek WPCP is provided below.
FACILITY NAME
LOCATION
DEWATERING FACILITY
SPDES PERMIT #
CONTACT PERSON
PROCESS ENGINEER
Newtown Creek Water Pollution Control Plant
301 Greenpoint Avenue Brooklyn, N.Y. 11222
No
NY0026204
Superintendent James Pynn
(718) 389-2002
Moein Karim
Additional Permits
Facility Name Location Permit Name
Permit # Type of Permit (Federal, State)
Newtown Creek Water Pollution Control Plant
301 Greenpoint Avenue Brooklyn, N.Y. 11222
Title V 261010002500057 Federal
I. NEWTOWN CREEK DEWATERED SLUDGE QUANTITIES
A. DEWATERING FACILITY ALLOCATIONS
For the reporting period of January 1 through December 31, 2008, anaerobically digested, thickened sewage sludge generated at Newtown Creek was dewatered at the Wards Island, Hunts Point and 26th Ward dewatering facilities. Approximately 22,828.40 dry metric tons of Newtown Creek dewatered sludge was generated. Approximately 11,898.90 dry metric tons of Newtown Creek sludge was dewatered at the Hunts Point dewatering facility. Approximately 9,351.26 dry metric tons of Newtown Creek sludge was dewatered at the Wards Island dewatering facility. Approximately 1578.24 dry metric tons of Newtown Creek sludge was dewatered at the 26th Ward dewatering facility. Table 3 of Appendix A contains the monthly dewatered sludge allocation figures in dry metric tons for this reporting period.
Newtown Creek WPCP Part 503 Annual Report 2008
2
II. NEWTOWN CREEK DEWATERED SLUDGE QUALITY
A. METALS ANALYSES
The metals analyses results of dewatered sludge samples taken by the contractors, NYOFCO (contract 947ADM4), EPIC 1 (contract 947ADM1), EPIC 2 (contract 1131-BIO), and Tully Environmental (contract 947ADM3) were also entered into the database maintained by the DEP. Table 5 of Appendix B summarizes the average monthly metals concentrations for the Newtown Creek WPCP. The monthly metals concentrations represent an arithmetic average of the results from the analyses of all samples of Newtown Creek dewatered sewage sludge generated each month.
During this reporting period, Newtown Creek dewatered sludge contained concentrations of metals that met the Ceiling Concentration Limits for twelve (12) months (January, February, March, April, May, June, July, August, September, October, November, December) as listed in Table 1 of 40 CFR Part 503.13(b)(1). Further, during twelve (12) months (January, February, March, April, May, June, July, August, September, October, November, December) in 2008, Newtown Creek dewatered sludge contained concentrations of metals that met the Pollutant Concentration as listed in Table 3 of 40 CFR Part 503.13 (b)(1).

APPENDICES

APPENDIX - A
Table 3.................................Monthly Liquid Sludge AllocationTable 4.................................Monthly Dewatered SludgeAllocations to
Contractors (Not Applicable)
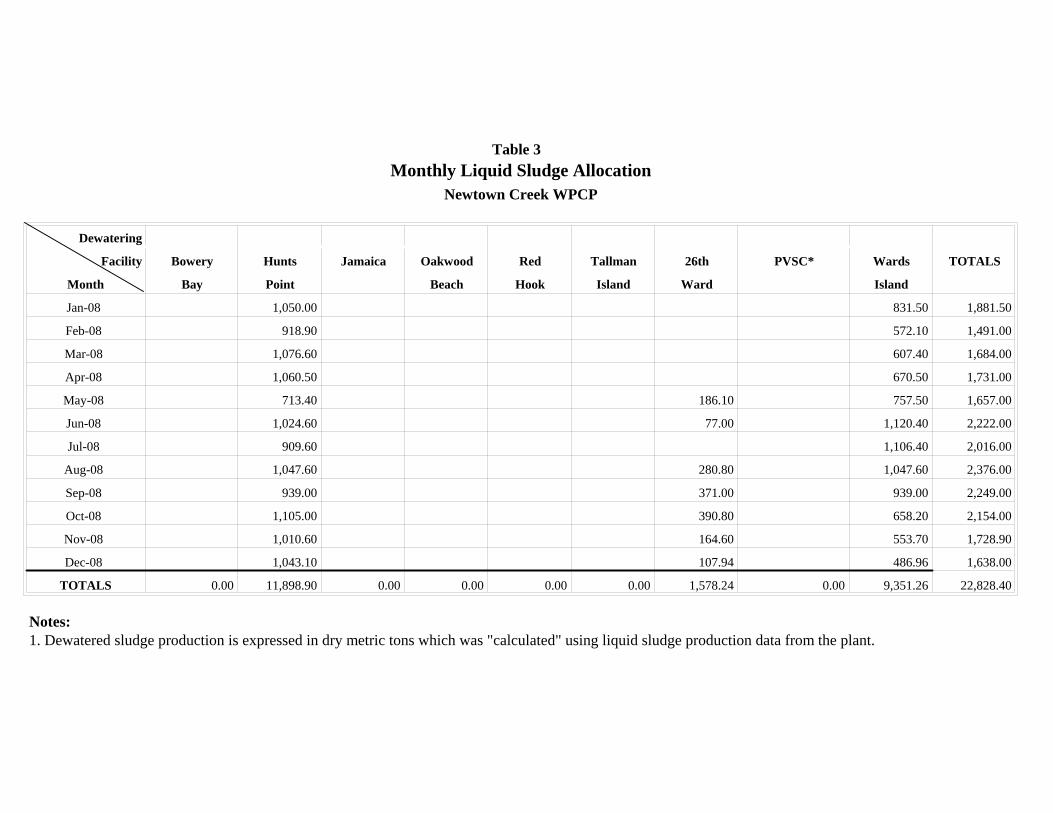
Table 3Monthly Liquid Sludge Allocation
Newtown Creek WPCP
Dewatering
Facility Bowery Hunts Jamaica Oakwood Red Tallman 26th PVSC* Wards TOTALS
Month Bay Point Beach Hook Island Ward Island
Jan-08 1,050.00 831.50 1,881.50
Feb-08 918.90 572.10 1,491.00
Mar-08 1,076.60 607.40 1,684.00
Apr-08 1,060.50 670.50 1,731.00
May-08 713.40 186.10 757.50 1,657.00
Jun-08 1,024.60 77.00 1,120.40 2,222.00
Jul-08 909.60 1,106.40 2,016.00
Aug-08 1,047.60 280.80 1,047.60 2,376.00
Sep-08 939.00 371.00 939.00 2,249.00
Oct-08 1,105.00 390.80 658.20 2,154.00
Nov-08 1,010.60 164.60 553.70 1,728.90
Dec-08 1,043.10 107.94 486.96 1,638.00
TOTALS 0.00 11,898.90 0.00 0.00 0.00 0.00 1,578.24 0.00 9,351.26 22,828.40
Notes:1. Dewatered sludge production is expressed in dry metric tons which was "calculated" using liquid sludge production data from the plant.

APPENDIX - B
Table 5...................... Monthly Average Metals Data
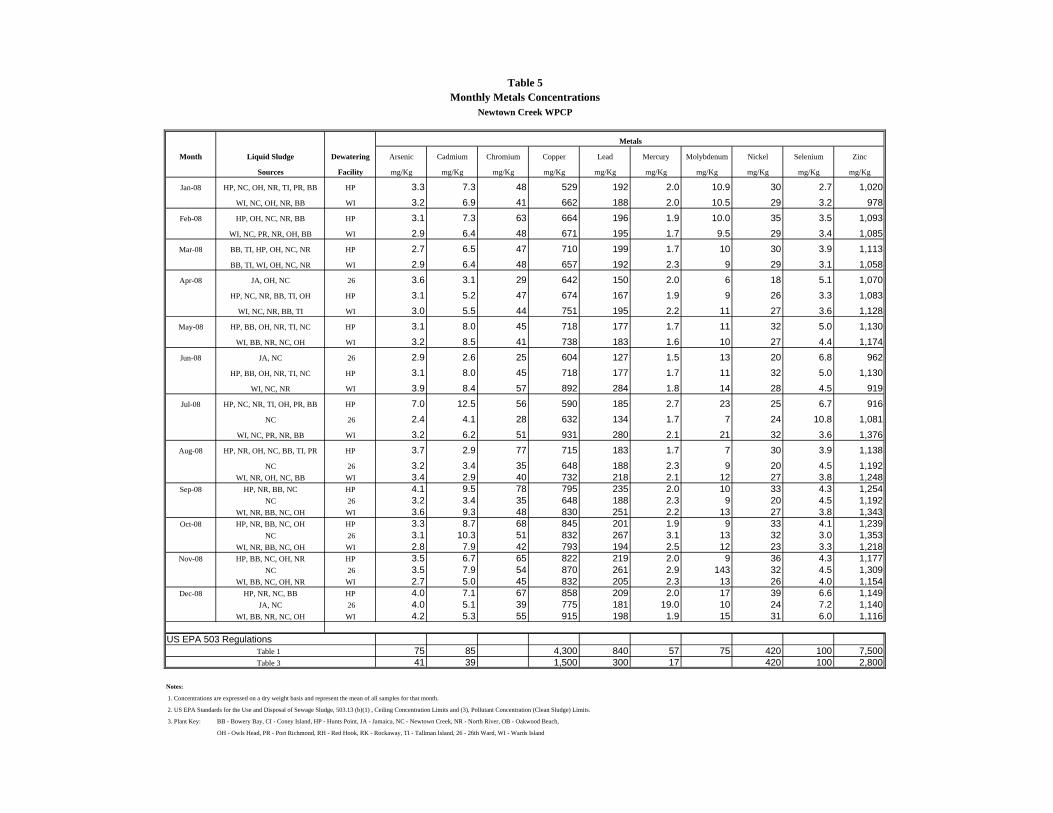
Table 5Monthly Metals Concentrations
Newtown Creek WPCP
Metals
Month Liquid Sludge Dewatering Arsenic Cadmium Chromium Copper Lead Mercury Molybdenum Nickel Selenium Zinc
Sources Facility mg/Kg mg/Kg mg/Kg mg/Kg mg/Kg mg/Kg mg/Kg mg/Kg mg/Kg mg/Kg
Jan-08 HP, NC, OH, NR, TI, PR, BB HP 3.3 7.3 48 529 192 2.0 10.9 30 2.7 1,020WI, NC, OH, NR, BB WI 3.2 6.9 41 662 188 2.0 10.5 29 3.2 978
Feb-08 HP, OH, NC, NR, BB HP 3.1 7.3 63 664 196 1.9 10.0 35 3.5 1,093WI, NC, PR, NR, OH, BB WI 2.9 6.4 48 671 195 1.7 9.5 29 3.4 1,085
Mar-08 BB, TI, HP, OH, NC, NR HP 2.7 6.5 47 710 199 1.7 10 30 3.9 1,113BB, TI, WI, OH, NC, NR WI 2.9 6.4 48 657 192 2.3 9 29 3.1 1,058
Apr-08 JA, OH, NC 26 3.6 3.1 29 642 150 2.0 6 18 5.1 1,070HP, NC, NR, BB, TI, OH HP 3.1 5.2 47 674 167 1.9 9 26 3.3 1,083
WI, NC, NR, BB, TI WI 3.0 5.5 44 751 195 2.2 11 27 3.6 1,128May-08 HP, BB, OH, NR, TI, NC HP 3.1 8.0 45 718 177 1.7 11 32 5.0 1,130
WI, BB, NR, NC, OH WI 3.2 8.5 41 738 183 1.6 10 27 4.4 1,174Jun-08 JA, NC 26 2.9 2.6 25 604 127 1.5 13 20 6.8 962
HP, BB, OH, NR, TI, NC HP 3.1 8.0 45 718 177 1.7 11 32 5.0 1,130WI, NC, NR WI 3.9 8.4 57 892 284 1.8 14 28 4.5 919
Jul-08 HP, NC, NR, TI, OH, PR, BB HP 7.0 12.5 56 590 185 2.7 23 25 6.7 916NC 26 2.4 4.1 28 632 134 1.7 7 24 10.8 1,081
WI, NC, PR, NR, BB WI 3.2 6.2 51 931 280 2.1 21 32 3.6 1,376Aug-08 HP, NR, OH, NC, BB, TI, PR HP 3.7 2.9 77 715 183 1.7 7 30 3.9 1,138
NC 26 3.2 3.4 35 648 188 2.3 9 20 4.5 1,192WI, NR, OH, NC, BB WI 3.4 2.9 40 732 218 2.1 12 27 3.8 1,248
Sep-08 HP, NR, BB, NC HP 4.1 9.5 78 795 235 2.0 10 33 4.3 1,254NC 26 3.2 3.4 35 648 188 2.3 9 20 4.5 1,192
WI, NR, BB, NC, OH WI 3.6 9.3 48 830 251 2.2 13 27 3.8 1,343Oct-08 HP, NR, BB, NC, OH HP 3.3 8.7 68 845 201 1.9 9 33 4.1 1,239
NC 26 3.1 10.3 51 832 267 3.1 13 32 3.0 1,353WI, NR, BB, NC, OH WI 2.8 7.9 42 793 194 2.5 12 23 3.3 1,218
Nov-08 HP, BB, NC, OH, NR HP 3.5 6.7 65 822 219 2.0 9 36 4.3 1,177NC 26 3.5 7.9 54 870 261 2.9 143 32 4.5 1,309
WI, BB, NC, OH, NR WI 2.7 5.0 45 832 205 2.3 13 26 4.0 1,154Dec-08 HP, NR, NC, BB HP 4.0 7.1 67 858 209 2.0 17 39 6.6 1,149
JA, NC 26 4.0 5.1 39 775 181 19.0 10 24 7.2 1,140WI, BB, NR, NC, OH WI 4.2 5.3 55 915 198 1.9 15 31 6.0 1,116
US EPA 503 RegulationsTable 1 75 85 4,300 840 57 75 420 100 7,500Table 3 41 39 1,500 300 17 420 100 2,800
Notes:
1. Concentrations are expressed on a dry weight basis and represent the mean of all samples for that month.
2. US EPA Standards for the Use and Disposal of Sewage Sludge, 503.13 (b)(1) , Ceiling Concentration Limits and (3), Pollutant Concentration (Clean Sludge) Limits.
3. Plant Key: BB - Bowery Bay, CI - Coney Island, HP - Hunts Point, JA - Jamaica, NC - Newtown Creek, NR - North River, OB - Oakwood Beach,
OH - Owls Head, PR - Port Richmond, RH - Red Hook, RK - Rockaway, TI - Tallman Island, 26 - 26th Ward, WI - Wards Island

City of New York DEPARTMENT OF ENVIRONMENTAL PROTECTION Bureau of Wastewater Treatment
NORTH RIVER WATER POLLUTION CONTROL PLANT
US EPA 40 CFR Part 503 Use or Disposal of Sewage Sludge
2008 Annual Report (Revised)
Prepared for
UNITED STATES ENVIRONMENTAL PROTECTION AGENCY
Prepared by
City of New York, Department of Environmental Protection Bureau of Wastewater Treatment Biosolids Management Section
96-05 Horace Harding Expressway Corona, New York 11368
(718) 595-6571
August 2009

TABLE OF CONTENTS
North River WPCP Part 503 Annual Report 2008
I. NORTH RIVER DEWATERED SLUDGE QUANTITIES
A. Dewatering Facility Allocations ..............................................................................1 II. NORTH RIVER DEWATERED SLUDGE QUALITY
A. Metals Analyses .......................................................................................................1

TABLE OF CONTENTS
North River WPCP Part 503 Annual Report 2008
ii
LIST OF APPENDICES Appendix A - Table 3, Monthly Liquid Sludge Allocation Table 4, Monthly Dewatered Sludge Allocations to Contractors – (N/A) Appendix B - Table 5, Monthly Average Metals Data

North River WPCP Part 503 Annual Report 2008
1
Requisite information, specific to the North River WPCP is provided below. FACILITY
NAME
LOCATION DEWATERING
FACILITY SPDES
PERMIT # CONTACT PERSON
PROCESS ENGINEER
North River Water Pollution Control Plant
Hudson River between 138 & West 145 St. New York, NY
No
NY0026247
Superintendent Steven Askew (212) 491-5050
George
Sarkissian
Additional Permits
Facility Name Location Permit Name Permit # Type of Permit (Federal, State)
North River Water Pollution Control Plant
Hudson River between 138 & West 145 St.
New York, NY
Title V 262020000700015 Federal
North River Water Pollution Control Plant
Hudson River between 138 & West 145 St.
New York, NY
Air State Facility Permit for 1
emergency engine generator
262020000700019
State
I. NORTH RIVER DEWATERED SLUDGE QUANTITIES
A. DEWATERING FACILITY ALLOCATIONS
For the reporting period of January 1 through December 31, 2008, anaerobically digested, thickened sewage sludge generated at North River was dewatered at the Wards Island, and Hunts Point sludge dewatering facilities. Approximately 12,635.20 dry metric tons of dewatered sludge from North River was generated. Approximately 7,837.42 dry metric tons of North River sludge was dewatered at the Wards Island sludge dewatering facility. Approximately 4,797.78 dry metric tons of North River sludge was dewatered at the Hunts Point dewatering facility. Table 3 of Appendix A contains the monthly dewatered sludge production figures in dry metric tons for this reporting period.
North River WPCP Part 503 Annual Report 2008
2
II. NORTH RIVER DEWATERED SLUDGE QUALITY
A. METALS ANALYSES
The metals analyses results of dewatered sludge samples taken by the contractors, NYOFCO (contract 947ADM4), and EPIC 1 (contract 947ADM1) was also entered into the database maintained by the DEP. Table 5 of Appendix B summarizes the average monthly metals concentrations for the North River WPCP. The monthly metals concentrations represent an arithmetic average of the results from the analyses of all samples of North River dewatered sewage sludge generated each month.
During this reporting period, North River dewatered sludge contained concentrations of metals that met the Ceiling Concentration Limits for twelve (12) months (January, February, March, April, May, June, July, August, September, October, November, December) as listed in Table 1 of 40 CFR Part 503.13(b)(1). Further, for twelve (12) months (January, February, March, April, May, June, July, August. September, October, November, December) in 2008, North River contained concentrations of metals that met the Pollutant Concentration Limits as listed in Table 3 of 40 CFR Part 503.13(b)(1).

APPENDICES

APPENDIX - A
Table 3.................................Monthly Liquid Sludge AllocationTable 4.................................Monthly Dewatered SludgeAllocations to
Contractors (Not Applicable)
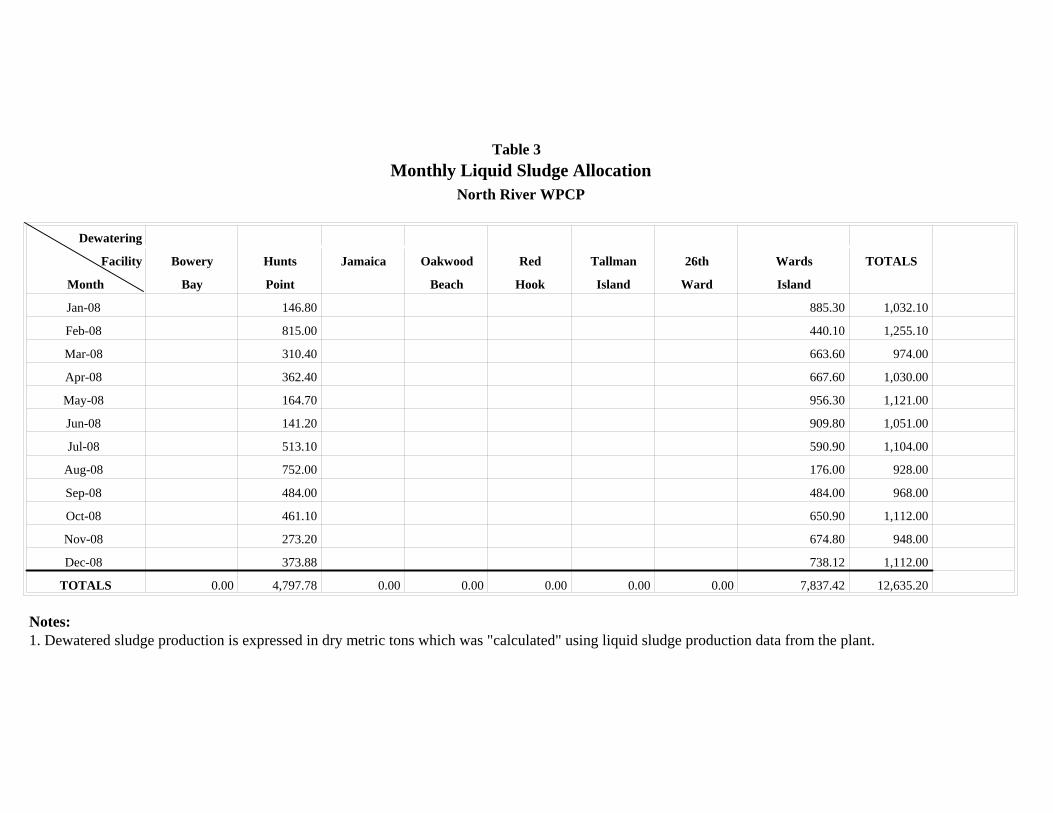
Table 3Monthly Liquid Sludge Allocation
North River WPCP
Dewatering
Facility Bowery Hunts Jamaica Oakwood Red Tallman 26th Wards TOTALS
Month Bay Point Beach Hook Island Ward Island
Jan-08 146.80 885.30 1,032.10
Feb-08 815.00 440.10 1,255.10
Mar-08 310.40 663.60 974.00
Apr-08 362.40 667.60 1,030.00
May-08 164.70 956.30 1,121.00
Jun-08 141.20 909.80 1,051.00
Jul-08 513.10 590.90 1,104.00
Aug-08 752.00 176.00 928.00
Sep-08 484.00 484.00 968.00
Oct-08 461.10 650.90 1,112.00
Nov-08 273.20 674.80 948.00
Dec-08 373.88 738.12 1,112.00
TOTALS 0.00 4,797.78 0.00 0.00 0.00 0.00 0.00 7,837.42 12,635.20
Notes:1. Dewatered sludge production is expressed in dry metric tons which was "calculated" using liquid sludge production data from the plant.

APPENDIX - B
Table 5...................... Monthly Average Metals Data

Table 5Monthly Metals Concentrations
North River WPCP
Metals
Month Liquid Sludge Dewatering Arsenic Cadmium Chromium Copper Lead Mercury Molybdenum Nickel Selenium Zinc
Sources Facility mg/Kg mg/Kg mg/Kg mg/Kg mg/Kg mg/Kg mg/Kg mg/Kg mg/Kg mg/Kg
Jan-08 HP, NC, OH, NR, TI, PR, BB HP 3.3 7.3 48 529 192 2.0 10.9 30 2.7 1,020WI, NC, OH, NR, BB WI 3.2 6.9 41 662 188 2.0 10.5 29 3.2 978
Feb-08 HP, OH, NC, NR, BB HP 3.1 7.3 63 664 196 1.9 10.0 34 3.5 1,093WI, NC, PR, NR, OH, BB WI 2.9 6.4 48 671 195 1.7 9.5 29 3.4 1,085
Mar-08 BB, TI, HP, OH, NC, NR HP 2.7 6.5 47 710 199 1.7 10.1 30 3.9 1,113BB, TI, WI, OH, NC, NR WI 2.9 6.4 48 657 192 2.3 9.1 29 3.1 1,058
Apr-08 HP, NC, NR, BB, TI, OH HP 3.1 5.2 47 674 167 1.9 8.6 26 3.3 1,083WI, NC, NR, BB, TI WI 3.0 5.5 44 751 195 2.2 10.6 27 3.6 1,128
May-08 HP, BB, OH, NR, TI, NC HP 3.1 8.0 45 718 177 1.7 11 32 5.0 1,130WI, BB, NR, NC, OH WI 3.2 8.5 41 738 183 1.6 10 27 4.4 1,174
Jun-08 HP, BB, OH, NC, NR HP 4.1 5.6 56 637 194 2.3 13 30 4.2 1,030WI, NC, NR WI 3.9 8.4 57 892 284 1.8 14 35 4.2 1,323
Jul-08 HP, NC, NR, TI, OH, PR, BB HP 3.5 5.9 65 845 249 1.9 17 35 4.5 1,348WI, NC, PR, NR, BB WI 3.2 6.2 51 931 280 2.1 21 32 3.6 1,376
Aug-08 HP, NR, OH, NC, BB, TI, PR HP 3.7 2.9 77 715 183 1.7 6.9 30 3.9 1,138WI, NR, OH, NC, BB WI 3.4 2.9 40 732 218 2.1 11.9 27 3.8 1,248
Sep-08 HP, NR, BB, NC HP 4.1 9.5 78 795 235 2.0 10.3 33 4.3 1,254NR, WI, BB, NC, OH WI 3.6 9.3 48 830 251 2.2 12.9 27 3.8 1,343
Oct-08 HP, NR, BB, NC, OH HP 3.3 8.7 68 845 201 1.9 9.1 33 4.1 1,239NC, NR, OH, PR, WI WI 2.8 7.9 42 793 194 2.5 11.9 23 3.3 1,218
Nov-08 HP, BB, NC, OH, NR HP 3.5 6.7 65 822 219 2.0 9 36 4.3 1,177WI, BB, NC, OH, NR WI 2.7 5.0 45 832 205 2.3 13 26 4.0 1,154
Dec-08 HP, NR, NC, BB HP 4.0 7.1 67 858 209 2.0 16.6 39 6.6 1,149WI, BB, NR, NC, OH WI 4.2 5.3 55 915 198 1.9 14.8 31 6.0 1,116
US EPA 503 RegulationsTable 1 75 85 4,300 840 57 75 420 100 7,500Table 3 41 39 1,500 300 17 420 100 2,800
Notes:
1. Concentrations are expressed on a dry weight basis and represent the mean of all samples for that month.
2. US EPA Standards for the Use and Disposal of Sewage Sludge, 503.13 (b)(1) , Ceiling Concentration Limits and (3), Pollutant Concentration (Clean Sludge) Limits.
3. Plant Key: BB - Bowery Bay, CI - Coney Island, HP - Hunts Point, JA - Jamaica, NC - Newtown Creek, NR - North River, OB - Oakwood Beach,
OH - Owls Head, PR - Port Richmond, RH - Red Hook, RK - Rockaway, TI - Tallman Island, 26 - 26th Ward, WI - Wards Island

City of New York DEPARTMENT OF ENVIRONMENTAL PROTECTION Bureau of Wastewater Treatment
OAKWOOD BEACH WATER POLLUTION CONTROL PLANT
US EPA 40 CFR Part 503 Use or Disposal of Sewage Sludge
2008 Annual Report (Revised)
Prepared for
UNITED STATES ENVIRONMENTAL PROTECTION AGENCY
Prepared by
City of New York, Department of Environmental Protection Bureau of Wastewater Treatment Biosolids Management Section
96-05 Horace Harding Expressway Corona, New York 11368
(718) 595-6571
August 2009

TABLE OF CONTENTS
Oakwood Beach WPCP Part 503 Annual Report 2008
i
I. OAKWOOD BEACH DEWATERED SLUDGE QUANTITIES
A. Dewatering Facility Allocations ..............................................................................1 II. OAKWOOD BEACH DEWATERED SLUDGE QUALITY
A. Metals Analyses .......................................................................................................1 III. OAKWOOD BEACH DEWATERED SLUDGE END USE A. EPIC, contract 947ADM1........................................................................................3 B. EPIC, contract 1131-BIO.........................................................................................3
C. NYOFCO, contract 947ADM4................................................................................3 D. Tully Environmental, contract 947ADM3...............................................................3 E. WeCare Organics, LLC, contract 1181-BIO ...........................................................3

TABLE OF CONTENTS
Oakwood Beach WPCP Part 503 Annual Report 2008
ii
LIST OF APPENDICES Appendix A - Table 3, Monthly Liquid Sludge Production Table 4, Monthly Dewatered Sludge Allocations to Contractors Appendix B - Table 5, Monthly Average Metals Data

Oakwood Beach WPCP Part 503 Annual Report 2008
1
Requisite information, specific to the Oakwood Beach WPCP is provided below.
FACILITY NAME
LOCATION
DEWATERING FACILITY
SPDES PERMIT #
CONTACT PERSON
PROCESS ENGINEER
Oakwood Beach Water Pollution Control Plant
751 Mill Road Staten Island, N.Y. 10306
Yes
NY0026174
Superintendent Thomas Amese (718) 351-8882
Barbara Sallusto
Additional Permits
Facility Name Facility Location Permit Name Permit # Type of Permit (Federal, State)
Oakwood Beach Water Pollution Control Plant
751 Mill Road Staten Island, N.Y.
10306
Registration 261070000400017 State
I. OAKWOOD BEACH DEWATERED SLUDGE QUANTITIES
A. DEWATERING FACILITY ALLOCATIONS
For the reporting period of January 1 through December 31, 2008, all anaerobically digested, thickened sewage sludge generated at Oakwood Beach was dewatered at the Oakwood Beach sludge dewatering facility. Approximately 3,423 dry metric tons of Oakwood Beach dewatered sludge was generated. Approximately 3,423 dry metric tons of Oakwood Beach sludge was dewatered at the Oakwood Beach dewatering facility. The Oakwood Beach sludge dewatering facility received liquid sludge from the Port Richmond WPCP during this reporting period. Table 3 of Appendix A contains the monthly dewatered sludge production figures in dry metric tons for this reporting period.
The dewatered sludge production figures in Table 4 were determined from the dewatered sludge allocation measured at each dewatering facility.

Oakwood Beach WPCP Part 503 Annual Report 2008
2
II. OAKWOOD BEACH DEWATERED SLUDGE QUALITY
A. METALS ANALYSES
The metals analyses results of dewatered sludge samples taken by the contractors, WeCare Organics, LLC (contract 1181-BIO) was also entered into the database maintained by the DEP (the liquid sludge analyses for Oakwood Beach is entered separately). Table 5 of Appendix B summarizes the average monthly metals concentrations for the Oakwood Beach WPCP. The monthly metals concentrations represent an arithmetic average of the results from the analyses of all samples of Oakwood Beach dewatered sewage sludge generated each month.
During this reporting period, Oakwood Beach dewatered sludge contained concentrations of metals that met the Ceiling Concentration Limits for twelve (12) months (January, February, March, April, May, June, July, August, September, October, November, December) as listed in Table 1 of 40 CFR Part 503.13(b)(1). Further, during twelve (12) months (January, February, March, April, May, June, July, August, September, October, November, December) in 2008, Oakwood Beach dewatered sludge contained concentrations of metals that met the Pollutant Concentration Limits as listed in Table 3 of 40 CFR Part 503.13(b)(1).

Oakwood Beach WPCP Part 503 Annual Report 2008
3
III. OAKWOOD BEACH DEWATERED SLUDGE
DEWATERED SLUDGE FROM THE OAKWOOD BEACH AND PORT RICHMOND WATER POLLUTION CONTROL PLANTS DISTRIBUTED TO SLUDGE MANAGEMENT CONTRACTORS AT THE OAKWOOD BEACH DEWATERING FACILITY.
A. EPIC 1 (contract 947ADM1)
During this reporting period, no biosolids from the Oakwood Beach Dewatering Facility was distributed to EPIC 1 (contract 947ADM1) (see introduction for processing details).
B. EPIC 2 (contract 1131-BIO)
During this reporting period, no biosolids from the Oakwood Beach Dewatering Facility was distributed to EPIC 2 (contract 1131-BIO) (see introduction for processing details).
C. NYOFCO (contract 947ADM4)
During this reporting period, no biosolids from the Oakwood Beach Dewatering Facility was distributed to NYOFCO (contract 947ADM4) (see introduction for processing details).
D. Tully Environmental (contract 947ADM3)
During this reporting period, no biosolids from the Oakwood Beach Dewatering Facility was distributed to Tully Environmental (contract 947ADM3) (see introduction for processing details).
E. WeCare Organics, LLC (contract 1181-BIO)
Approximately 6,633.76 dry metric tons of Oakwood Beach and Port Richmond dewatered sludge was distributed to WeCare Organics, LLC (contract 1181-BIO) (see introduction for processing details) from the Oakwood Beach Dewatering Facility during this reporting period.
Table 2 in the introduction contains requisite information specific to each of the five sludge management contractors.

APPENDICES

APPENDIX - A
Table 3.................................Monthly Liquid Sludge AllocationTable 4.................................Monthly Dewatered SludgeAllocations to
Contractors
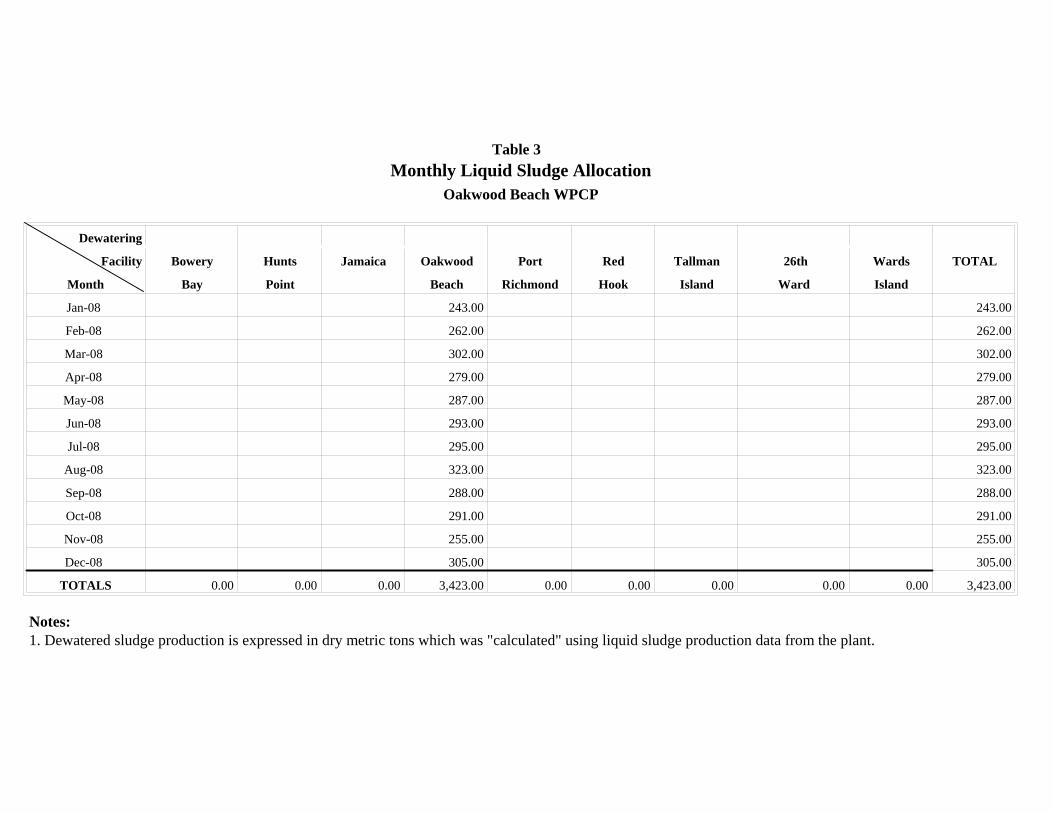
Table 3Monthly Liquid Sludge Allocation
Oakwood Beach WPCP
Dewatering
Facility Bowery Hunts Jamaica Oakwood Port Red Tallman 26th Wards TOTAL
Month Bay Point Beach Richmond Hook Island Ward Island
Jan-08 243.00 243.00
Feb-08 262.00 262.00
Mar-08 302.00 302.00
Apr-08 279.00 279.00
May-08 287.00 287.00
Jun-08 293.00 293.00
Jul-08 295.00 295.00
Aug-08 323.00 323.00
Sep-08 288.00 288.00
Oct-08 291.00 291.00
Nov-08 255.00 255.00
Dec-08 305.00 305.00
TOTALS 0.00 0.00 0.00 3,423.00 0.00 0.00 0.00 0.00 0.00 3,423.00
Notes:1. Dewatered sludge production is expressed in dry metric tons which was "calculated" using liquid sludge production data from the plant.

Table 4Monthly Dewatered Sludge Allocations to Contractors
Oakwood Beach Dewatering Facility
ContractorsLiquid Sludge EPIC 1 EPIC 2 NYOFCO Tully Environmental Passaic Valley Sewerage We Care Organics, LLC TOTALS
Month Sources contract 947 ADM1contract 1131 BIO contract 947 ADM4 contract 947 ADM3Commissioners, contract 1141 contract 1181 BIOJan-08 OB, PR 0.00 0.00 0.00 0.00 0.00 507.35 507.35Feb-08 OB 0.00 0.00 0.00 0.00 0.00 722.31 722.31Mar-08 OB, PR 0.00 0.00 0.00 0.00 0.00 573.82 573.82Apr-08 OB, PR 0.00 0.00 0.00 0.00 0.00 585.33 585.33May-08 OB, PR 0.00 0.00 0.00 0.00 0.00 512.76 512.76Jun-08 OB, PR 0.00 0.00 0.00 0.00 0.00 545.28 545.28July-08 OB, PR 0.00 0.00 0.00 0.00 0.00 424.05 424.05Aug-08 OB, PR 0.00 0.00 0.00 0.00 0.00 613.68 613.68Sep-08 OB, PR 0.00 0.00 0.00 0.00 0.00 532.77 532.77Oct-08 OB, PR 0.00 0.00 0.00 0.00 0.00 549.68 549.68Nov-08 OB, PR 0.00 0.00 0.00 0.00 0.00 522.73 522.73Dec-08 OB, PR 0.00 0.00 0.00 0.00 0.00 544.00 544.00
TOTALS 0.00 0.00 0.00 0.00 0.00 6,633.76 6,633.76
Notes: 1. Dewatered sludge production is expressed in dry metric tons.
2. Plant Key: BB - Bowery Bay, CI - Coney Island, HP - Hunts Point, JA - Jamaica, NC - Newtown Creek, NR - North River, OB - Oakwood Beach,
OH - Owls Head, PR - Port Richmond, RH - Red Hook, RK - Rockaway, TI - Tallman Island, 26 - 26th Ward, WI - Wards Island
3. Tully/JV (contract 947 ADM3) was suspended April 12, 2005 for failure to fulfill contractual obligations and resumed operation on July 2, 2007.4. Improper storage during transportation of samples occured in February for 26Ward(26, RK, CI, JA), RH, JA, OB(OB, PR). Therefore, there is no CI and PR samples for the month of February.
APPENDIX - B
Table 5...................... Monthly Average Metals Data

Table 5Monthly Metals Concentrations
Oakwood Beach WPCP
Metals
Month Liquid Sludge Dewatering Arsenic Cadmium Chromium Copper Lead Mercury Molybdenum Nickel Selenium Zinc
Sources Facility mg/Kg mg/Kg mg/Kg mg/Kg mg/Kg mg/Kg mg/Kg mg/Kg mg/Kg mg/Kg
Jan-08 OB OB 4.8 2.6 25 458 88 1.1 9.5 41 4.1 721OB, PR 5.1 3.9 27 507 101 1.3 8.9 47 3.0 927
Feb-08 OB OB 2.8 0.8 16 234 41 0.4 10.6 22 3.6 345Mar-08 OB OB 3.8 2.0 27 571 80 1.3 7.2 45 4.5 800
OB, PR 3.8 3.1 34 686 104 1.6 6.0 57 4.3 1,108Apr-08 OB OB 3.9 1.6 33 494 80 1.3 7.2 41 5.1 723
OB, PR 3.5 2.1 34 579 93 1.7 5.5 46 4.4 874May-08 OB OB 4.7 3.2 31 537 78 1.2 8.4 40 4.9 773
OB, PR 4.0 5.2 33 585 89 1.6 4.9 44 4.4 860Jun-08 OB OB 4.8 2.2 37 611 108 1.2 15.9 42 5.3 920
OB, PR 4.4 2.5 37 645 104 1.4 18.6 50 4.1 1,024Jul-08 OB OB 4.3 2.0 32 558 94 1.1 9.1 44 5.6 936
OB, PR 4.1 2.6 37 597 102 1.3 6.6 50 4.9 1,082Aug-08 OB OB 4.0 1.1 32 493 83 1.3 11.0 39 4.7 881
OB, PR 4.4 5.6 43 551 106 1.4 7.1 48 4.6 1,031Sep-08 OB OB 4.4 3.3 36 454 93 1.1 10.2 39 4.5 828
OB, PR 4.4 5.6 43 551 106 1.4 7.1 48 4.6 1,031Oct-08 OB OB 3.6 3.7 30 490 78 1.1 9.0 37 4.0 808
OB, PR 2.7 6.2 28 545 78 1.3 5.3 39 3.4 957Nov-08 OB OB 3.3 2.1 37 456 85 0.9 9.0 39 5.0 783
OB, PR 2.8 3.0 43 493 97 1.2 4.5 46 4.4 938Dec-08 OB OB 4.2 1.8 33 402 77 0.8 7.6 43 4.6 641
OB, PR 4.5 2.6 36 478 86 1.2 4.6 53 4.7 741US EPA 503 Regulations
Table 1 75 85 4,300 840 57 75 420 100 7,500Table 3 41 39 1,500 300 17 420 100 2,800
Notes:
1. Concentrations are expressed on a dry weight basis and represent the mean of all samples for that month.
2. US EPA Standards for the Use and Disposal of Sewage Sludge, 503.13 (b)(1) , Ceiling Concentration Limits and (3), Pollutant Concentration (Clean Sludge) Limits.
3. Plant Key: BB - Bowery Bay, CI - Coney Island, HP - Hunts Point, JA - Jamaica, NC - Newtown Creek, NR - North River, OB - Oakwood Beach,
OH - Owls Head, PR - Port Richmond, RH - Red Hook, RK - Rockaway, TI - Tallman Island, 26 - 26th Ward, WI - Wards Island
4. Improper storage during transportation occured in February for 26Ward(26, RK, CI, JA), RH, JA, OB(OB, PR). Therefore, these samples were not utilized to calculate the values above.

City of New York DEPARTMENT OF ENVIRONMENTAL PROTECTION Bureau of Wastewater Treatment
OWLS HEAD WATER POLLUTION CONTROL PLANT
US EPA 40 CFR Part 503 Use or Disposal of Sewage Sludge
2008 Annual Report (Revised)
Prepared for
UNITED STATES ENVIRONMENTAL PROTECTION AGENCY
Prepared by
City of New York, Department of Environmental Protection Bureau of Wastewater Treatment Biosolids Management Section
96-05 Horace Harding Expressway Corona, New York 11368
(718) 595-6571
August 2009

Owls Head WPCP Part 503 Annual Report 2008
1
TABLE OF CONTENTS I. OWLS HEAD DEWATERED SLUDGE QUANTITIES
A. Dewatering Facility Allocations.............................................................................1 II. OWLS HEAD DEWATERED SLUDGE QUALITY
A. Metals Analyses .....................................................................................................1

Owls Head WPCP Part 503 Annual Report 2008
2
LIST OF APPENDICES Appendix A - Table 3, Monthly Liquid Sludge Allocation Table 4, Monthly Dewatered Sludge Allocations to Contractors – (N/A) Appendix B - Table 5, Monthly Average Metals Data

Owls Head WPCP Part 503 Annual Report 2008
3
Requisite information, specific to the Owls Head WPCP is provided below.
FACILITY NAME
LOCATION
DEWATERING FACILITY
SPDES PERMIT #
CONTACT PERSON
PROCESS ENGINEER
Owls Head Water Pollution Control Plant
Foot of 69 Street Bridge & the Narrows Brooklyn, N.Y. 11220
No
NY0026166
Superintendent William
Grandner (718) 743-3177
Lewis
Duvalsaint
Additional Permits
Facility Name Location Permit Name Permit # Type of Permit Owls Head
Water Pollution Control Plant
Foot of 69 Street Bridge & the
Narrows Brooklyn, N.Y. 11220
Title V 261020000500017 Federal
Owls Head Water Pollution Control
Plant
Foot of 69 Street Bridge & the
Narrows Brooklyn, NY
11220
Air State Facility Permit for 3 Stirling
engines
261020000500020 State
I. OWLS HEAD DEWATERED SLUDGE QUANTITIES
A. DEWATERING FACILITY ALLOCATIONS
For the reporting period of January 1 through December 31, 2008, anaerobically digested, thickened sewage sludge generated at Owls Head was dewatered at the Wards Island and Hunts Point, dewatering facilities. Approximately 13,859 dry metric tons of Owls Head dewatered sludge was generated. Approximately 3,034.36 dry metric tons of Owls Head sludge was dewatered at the Hunts Point dewatering facility. Approximately 1,746.79 dry metric tons of Owls Head sludge was dewatered at the Wards Island dewatering facility. Approximately 606.30 dry metric tons of Owls Head sludge was dewatered at the 26th Ward dewatering facility. Approximately 8,471.55 dry metric tons of Owls Head liquid sludge was barged to Passaic Valley Sewerage Commissioners and then dewatered. Table 3 of Appendix A contains the monthly dewatered sludge allocation figures in dry metric tons for this reporting period.
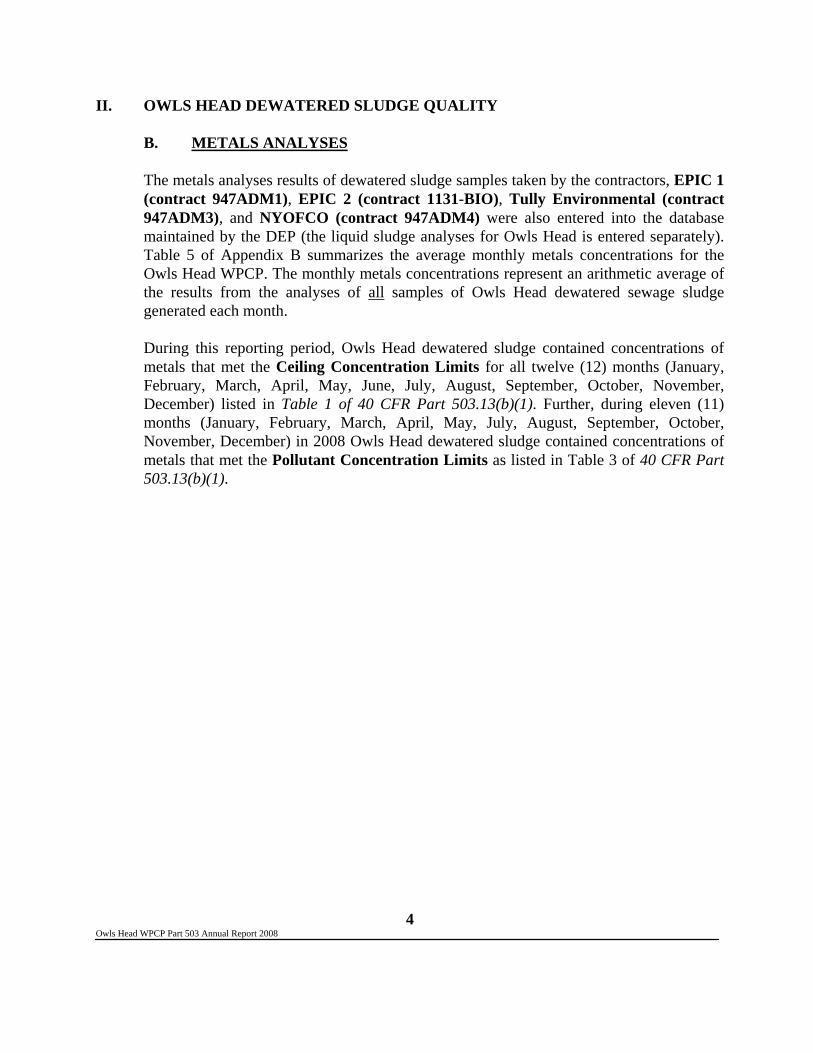
Owls Head WPCP Part 503 Annual Report 2008
4
II. OWLS HEAD DEWATERED SLUDGE QUALITY
B. METALS ANALYSES
The metals analyses results of dewatered sludge samples taken by the contractors, EPIC 1 (contract 947ADM1), EPIC 2 (contract 1131-BIO), Tully Environmental (contract 947ADM3), and NYOFCO (contract 947ADM4) were also entered into the database maintained by the DEP (the liquid sludge analyses for Owls Head is entered separately). Table 5 of Appendix B summarizes the average monthly metals concentrations for the Owls Head WPCP. The monthly metals concentrations represent an arithmetic average of the results from the analyses of all samples of Owls Head dewatered sewage sludge generated each month.
During this reporting period, Owls Head dewatered sludge contained concentrations of metals that met the Ceiling Concentration Limits for all twelve (12) months (January, February, March, April, May, June, July, August, September, October, November, December) listed in Table 1 of 40 CFR Part 503.13(b)(1). Further, during eleven (11) months (January, February, March, April, May, July, August, September, October, November, December) in 2008 Owls Head dewatered sludge contained concentrations of metals that met the Pollutant Concentration Limits as listed in Table 3 of 40 CFR Part 503.13(b)(1).

APPENDICES

APPENDIX - A
Table 3.................................Monthly Liquid Sludge AllocationTable 4.................................Monthly Dewatered SludgeAllocations to
Contractors

Table 3Monthly Liquid Sludge Allocation
Owls Head WPCP
Dewatering
Facility Bowery Hunts Jamaica Oakwood Red Tallman 26th PVSC* Wards TOTAL
Month Bay Point Beach Hook Island Ward Island
Jan-08 407.50 81.60 359.80 248.10 1,097.00
Feb-08 414.60 70.80 395.40 321.20 1,202.00
Mar-08 465.45 163.70 542.55 88.30 1,260.00
Apr-08 60.30 44.90 955.60 119.20 1,180.00
May-08 280.20 72.10 907.70 1,260.00
Jun-08 753.10 69.30 345.60 1,168.00
Jul-08 43.10 1,003.90 1,047.00
Aug-08 135.50 801.00 25.50 962.00
Sep-08 822.00 241.00 1,063.00
Oct-08 207.70 103.90 623.20 219.20 1,154.00
Nov-08 128.20 972.00 208.80 1,309.00
Dec-08 138.71 742.80 275.49 1,157.00
TOTALS 0.00 3,034.36 0.00 0.00 0.00 0.00 606.30 8,471.55 1,746.79 13,859.00
Notes:1. Dewatered sludge production is expressed in dry metric tons which was "calculated" using liquid sludge production data from the plant.2. Note: PVSC receives liquid sludge from OH. PVSC = Passaic Valley Sewerage Commissioners.

Table 4Monthly Dewatered Sludge Allocations to Contractors
Passaic Valley Sewereage Commissioners (PVSC)
Liquid Sludge Tonnage TOTALSMonth Sources (Dry Metric Tons)Jan-08 OH 359.80 359.80Feb-08 OH 395.40 395.40Mar-08 OH 542.55 542.55Apr-08 OH 955.60 955.60May-08 OH 907.7 907.70Jun-08 OH 345.6 345.60Jul-08 OH 1003.9 1003.90
Aug-08 OH 801 801.00Sep-08 OH 822 822.00Oct-08 OH 623.2 623.20Nov-08 OH 972 972.00Dec-08 OH 742.8 742.80
TOTALS 8,471.55
Notes: 1. Dewatered sludge production is expressed in dry metric tons.
2. Plant Key: BB - Bowery Bay, CI - Coney Island, HP - Hunts Point, JA - Jamaica, NC - Newtown Creek, NR - North River, OB - Oakwood Beach,
OH - Owls Head, PR - Port Richmond, RH - Red Hook, RK - Rockaway, TI - Tallman Island, 26 - 26th Ward, WI - Wards Island

APPENDIX - B
Table 5...................... Monthly Average Metals Data

Table 5Monthly Metals Concentrations
Owls Head WPCP
Metals
Month Liquid Sludge Dewatering Arsenic Cadmium Chromium Copper Lead Mercury Molybdenum Nickel Selenium Zinc
Sources Facility mg/Kg mg/Kg mg/Kg mg/Kg mg/Kg mg/Kg mg/Kg mg/Kg mg/Kg mg/Kg
Jan-08 OH 26 3 5.2 28 619 159 2.1 7.4 21 3.5 978HP, NC, OH, NR, TI, PR, BB HP 3.3 7.3 48 529 192 2.0 10.9 30 2.7 1,020
WI, NC, OH, NR, BB WI 3.2 6.9 41 662 188 2.0 10.5 29 3.2 978Feb-08 HP, OH, NC, NR, BB HP 3.1 7.3 63 664 196 1.9 10.0 35 3.5 1,093
WI, NC, PR, NR, OH, BB WI 2.9 6.4 48 671 195 1.7 9.5 29 3.4 1,085Mar-08 OH 26 2.7 4.1 34 655 184 1.6 6.4 25 4.2 1,086
BB, TI, HP, OH, NC, NR HP 2.7 6.5 47 710 199 1.7 10.1 30 3.9 1,113BB, TI, WI, OH, NC, NR WI 2.9 6.4 48 657 192 2.3 9.1 29 3.1 1,058
Apr-08 JA, OH, NC 26 3.6 3.1 29 642 150 2.0 5.7 18 5.1 1,070HP, NC, NR, BB, TI, OH HP 3.1 5.2 47 674 167 1.9 8.6 26 3.3 1,083
May-08 26, JA, OH 26 2.9 5.9 26 632 149 1.8 5.7 17 6.2 961HP, BB, OH, NR, TI, NC HP 3.1 8.0 45 718 177 1.7 11 32 5.0 1,130
WI, BB, NR, NC, OH WI 3.2 8.5 41 738 183 1.6 10 27 4.4 1,174Jun-08 OH 26 4.1 4.3 155 1,008 312 3.7 15.0 234 5.5 1,529
HP, BB, OH, NC, NR HP 3.5 7.5 55 827 242 2.1 16.2 36 4.0 1,299
US EPA 503 RegulationsTable 1 75 85 4,300 840 57 75 420 100 7,500Table 3 41 39 1,500 300 17 420 100 2,800
Notes:
1. Concentrations are expressed on a dry weight basis and represent the mean of all samples for that month.
2. US EPA Standards for the Use and Disposal of Sewage Sludge, 503.13 (b)(1) , Ceiling Concentration Limits and (3), Pollutant Concentration (Clean Sludge) Limits.
3. Plant Key: BB - Bowery Bay, CI - Coney Island, HP - Hunts Point, JA - Jamaica, NC - Newtown Creek, NR - North River, OB - Oakwood Beach,
OH - Owls Head, PR - Port Richmond, RH - Red Hook, RK - Rockaway, TI - Tallman Island, 26 - 26th Ward, WI - Wards Island
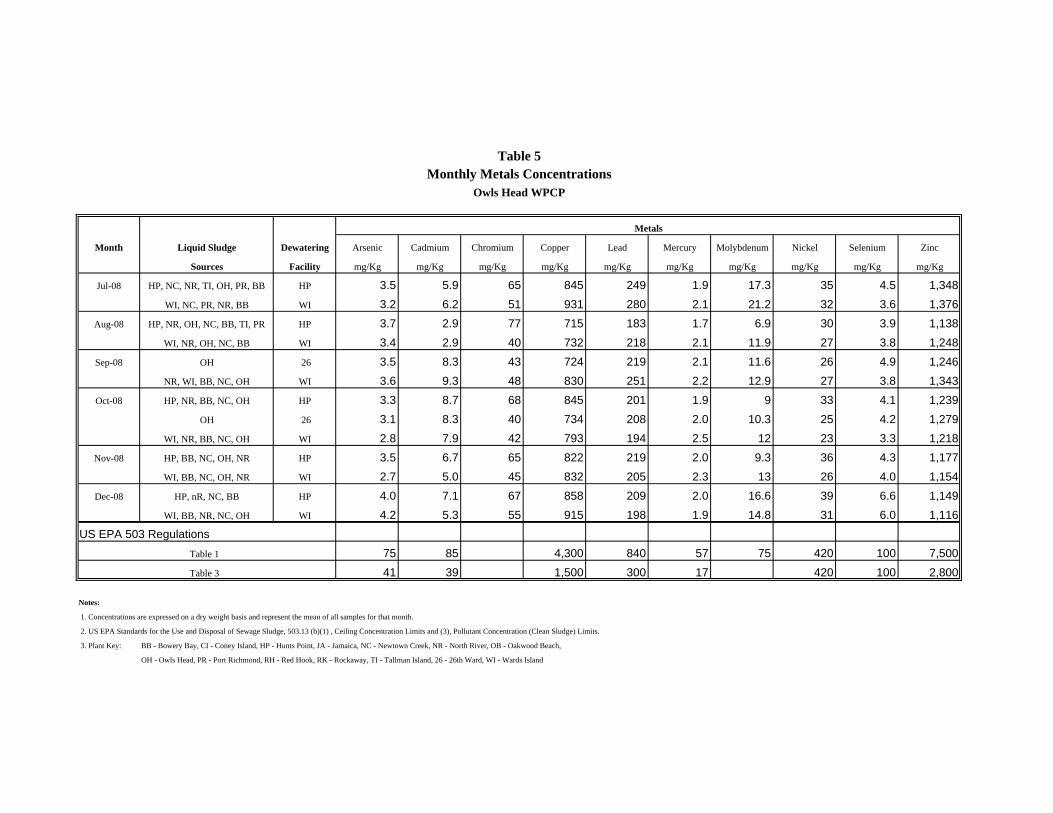
Table 5Monthly Metals Concentrations
Owls Head WPCP
Metals
Month Liquid Sludge Dewatering Arsenic Cadmium Chromium Copper Lead Mercury Molybdenum Nickel Selenium Zinc
Sources Facility mg/Kg mg/Kg mg/Kg mg/Kg mg/Kg mg/Kg mg/Kg mg/Kg mg/Kg mg/Kg
Jul-08 HP, NC, NR, TI, OH, PR, BB HP 3.5 5.9 65 845 249 1.9 17.3 35 4.5 1,348WI, NC, PR, NR, BB WI 3.2 6.2 51 931 280 2.1 21.2 32 3.6 1,376
Aug-08 HP, NR, OH, NC, BB, TI, PR HP 3.7 2.9 77 715 183 1.7 6.9 30 3.9 1,138WI, NR, OH, NC, BB WI 3.4 2.9 40 732 218 2.1 11.9 27 3.8 1,248
Sep-08 OH 26 3.5 8.3 43 724 219 2.1 11.6 26 4.9 1,246NR, WI, BB, NC, OH WI 3.6 9.3 48 830 251 2.2 12.9 27 3.8 1,343
Oct-08 HP, NR, BB, NC, OH HP 3.3 8.7 68 845 201 1.9 9 33 4.1 1,239OH 26 3.1 8.3 40 734 208 2.0 10.3 25 4.2 1,279
WI, NR, BB, NC, OH WI 2.8 7.9 42 793 194 2.5 12 23 3.3 1,218Nov-08 HP, BB, NC, OH, NR HP 3.5 6.7 65 822 219 2.0 9.3 36 4.3 1,177
WI, BB, NC, OH, NR WI 2.7 5.0 45 832 205 2.3 13 26 4.0 1,154Dec-08 HP, nR, NC, BB HP 4.0 7.1 67 858 209 2.0 16.6 39 6.6 1,149
WI, BB, NR, NC, OH WI 4.2 5.3 55 915 198 1.9 14.8 31 6.0 1,116US EPA 503 Regulations
Table 1 75 85 4,300 840 57 75 420 100 7,500Table 3 41 39 1,500 300 17 420 100 2,800
Notes:
1. Concentrations are expressed on a dry weight basis and represent the mean of all samples for that month.
2. US EPA Standards for the Use and Disposal of Sewage Sludge, 503.13 (b)(1) , Ceiling Concentration Limits and (3), Pollutant Concentration (Clean Sludge) Limits.
3. Plant Key: BB - Bowery Bay, CI - Coney Island, HP - Hunts Point, JA - Jamaica, NC - Newtown Creek, NR - North River, OB - Oakwood Beach,
OH - Owls Head, PR - Port Richmond, RH - Red Hook, RK - Rockaway, TI - Tallman Island, 26 - 26th Ward, WI - Wards Island

City of New York DEPARTMENT OF ENVIRONMENTAL PROTECTION Bureau of Wastewater Treatment
PORT RICHMOND WATER POLLUTION CONTROL PLANT
US EPA 40 CFR Part 503 Use or Disposal of Sewage Sludge
2008 Annual Report (Revised)
Prepared for
UNITED STATES ENVIRONMENTAL PROTECTION AGENCY
Prepared by
City of New York, Department of Environmental Protection Bureau of Wastewater Treatment Biosolids Management Section
96-05 Horace Harding Expressway Corona, New York 11368
(718) 595-6571
August 2009
TABLE OF CONTENTS
Port Richmond WPCP Part 503 Annual Report 2008
i
I. PORT RICHMOND DEWATERED SLUDGE QUANTITIES
A. Dewatering Facility Allocations ..............................................................................1 II. PORT RICHMOND DEWATERED SLUDGE QUALITY2
A. Metals Analyses .......................................................................................................1
Port Richmond WPCP Part 503 Annual Report 2007
3
LIST OF APPENDICES
Appendix A - Table 3, Monthly Liquid Sludge Allocation Table 4, Monthly Dewatered Sludge Allocations to Contractors – (N/A) Appendix B - Table 5, Monthly Average Metals Data
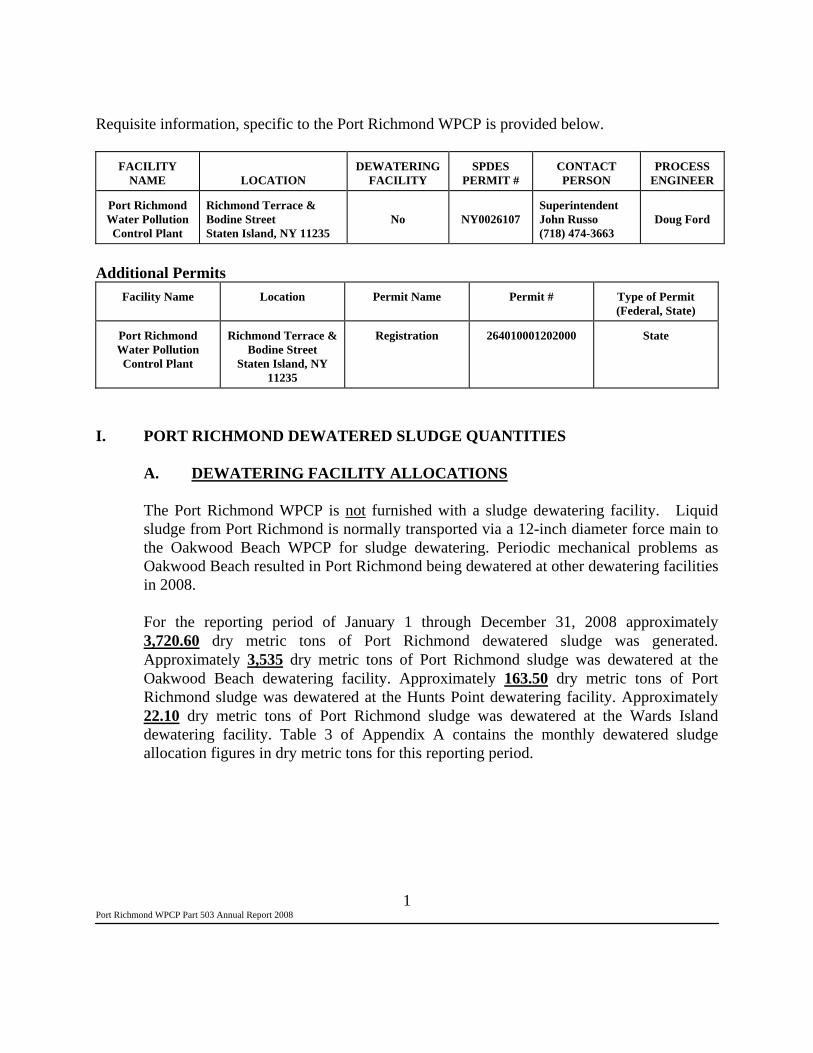
Port Richmond WPCP Part 503 Annual Report 2008
1
Requisite information, specific to the Port Richmond WPCP is provided below.
FACILITY NAME
LOCATION
DEWATERING FACILITY
SPDES PERMIT #
CONTACT PERSON
PROCESS ENGINEER
Port Richmond Water Pollution Control Plant
Richmond Terrace & Bodine Street Staten Island, NY 11235
No
NY0026107
Superintendent John Russo (718) 474-3663
Doug Ford
Additional Permits
Facility Name Location Permit Name Permit # Type of Permit (Federal, State)
Port Richmond Water Pollution Control Plant
Richmond Terrace & Bodine Street
Staten Island, NY 11235
Registration 264010001202000 State
I. PORT RICHMOND DEWATERED SLUDGE QUANTITIES
A. DEWATERING FACILITY ALLOCATIONS
The Port Richmond WPCP is not furnished with a sludge dewatering facility. Liquid sludge from Port Richmond is normally transported via a 12-inch diameter force main to the Oakwood Beach WPCP for sludge dewatering. Periodic mechanical problems as Oakwood Beach resulted in Port Richmond being dewatered at other dewatering facilities in 2008.
For the reporting period of January 1 through December 31, 2008 approximately 3,720.60 dry metric tons of Port Richmond dewatered sludge was generated. Approximately 3,535 dry metric tons of Port Richmond sludge was dewatered at the Oakwood Beach dewatering facility. Approximately 163.50 dry metric tons of Port Richmond sludge was dewatered at the Hunts Point dewatering facility. Approximately 22.10 dry metric tons of Port Richmond sludge was dewatered at the Wards Island dewatering facility. Table 3 of Appendix A contains the monthly dewatered sludge allocation figures in dry metric tons for this reporting period.

Port Richmond WPCP Part 503 Annual Report 2008
2
II. PORT RICHMOND DEWATERED SLUDGE QUALITY
A. METALS ANALYSES
The metals analyses results of dewatered sludge samples taken by the contractors EPIC 1 (contract 947ADM1), NYOFCO (contract 947ADM4), and WeCare Organics, LLC (contract 1181-BIO) were entered into the database maintained by the DEP (the liquid sludge analyses for Port Richmond is entered separately). Table 5 of Appendix B summarizes the average monthly metals concentrations for the Port Richmond WPCP. The monthly metals concentrations represent an arithmetic average of the results from the analyses of all samples of Port Richmond dewatered sludge generated each month.
During this reporting period, Port Richmond dewatered sludge contained concentrations of metals that met the Ceiling Concentration Limits for all twelve (12) months (January, February, March, April, May, June, July, August, September, October, November, December) as listed in Table 1 of 40 CFR Part 503.13(b)(1). Further, during twelve (12) months in 2008 (January, February, March, April, May, June, July, August, September, October, November, December), Port Richmond dewatered sludge contained concentrations of metals that met the Pollutant Concentration Limits as listed in Table 3 of 40 CFR Part 503.13(b)(1).

APPENDICES

APPENDIX - A
Table 3.................................Monthly Liquid Sludge AllocationTable 4.................................Monthly Dewatered SludgeAllocations to
Contractors (Not Applicable)

Table 3Monthly Liquid Sludge Allocation
Port Richmond WPCP
Dewatering
Facility Bowery Hunts Jamaica Oakwood Red Tallman 26th PVSC* Wards TOTAL
Month Bay Point Beach Hook Island Ward Island
Jan-08 22.10 315.90 338.00
Feb-08 280.90 22.10 303.00
Mar-08 272.00 272.00
Apr-08 339.00 339.00
May-08 296.00 296.00
Jun-08 317.70 317.70
Jul-08 86.50 311.50 398.00
Aug-08 54.90 256.10 311.00
Sep-08 310.00 310.00
Oct-08 279.00 279.00
Nov-08 270.90 270.90
Dec-08 286.00 286.00
TOTALS 0.00 163.50 0.00 3,535.00 0.00 0.00 0.00 0.00 22.10 3,720.60
Notes:1. Dewatered sludge production is expressed in dry metric tons which was "calculated" using liquid sludge production data from the plant.

APPENDIX - B
Table 5...................... Monthly Average Metals Data

Table 5Monthly Metals Concentrations
Port Richmond WPCP
Metals
Month Liquid Sludge Dewatering Arsenic Cadmium Chromium Copper Lead Mercury Molybdenum Nickel Selenium Zinc
Sources Facility mg/Kg mg/Kg mg/Kg mg/Kg mg/Kg mg/Kg mg/Kg mg/Kg mg/Kg mg/Kg
Jan-08 HP, NC, OH, NR, TI, PR, BB HP 3.3 7.3 48 529 192 2.0 10.9 30 2.7 1,020OB, PR OB 5.1 3.9 27 507 101 1.3 8.9 47 2.95 927
Feb-08 WI, NC, PR, NR, OH, BB WI 2.9 6.4 48 671 195 1.7 9.5 29 3.4 1,085Mar-08 OB, PR OB 3.8 3.1 34 686 104 1.6 6.0 57 4.3 1,108Apr-08 OB, PR OB 3.5 2.1 34 579 93 1.7 5.5 46 4.4 874May-08 OB, PR OB 4.0 5.2 33 585 89 1.6 4.9 44 4.4 860Jun-08 OB, PR OB 4.4 2.5 37 645 104 1.4 18.6 50 4.1 1,024Jul-08 HP, NC, NR, TI, OH, PR, BB HP 3.5 5.9 65 845 249 1.9 17.3 35 4.5 1,348
OB, PR OB 4.1 2.6 37 597 102 1.3 6.6 50 4.9 1,082WI, NC, PR, NR, BB WI 3.2 6.2 51 931 280 2.1 21.2 32 3.6 1,376
Aug-08 OB, PR OB 4.2 0.9 34 481 93 1.3 6.1 40 3.2 926Sep-08 OB, PR OB 4.4 5.6 43 551 106 1.4 7.1 48 4.6 1,031Oct-08 OB, PR OB 4.4 5.6 43 551 106 1.4 7.1 48 4.6 1,031Nov-08 OB, PR OB 2.8 3.0 43 493 97 1.2 4.5 46 4.4 938Dec-08 OB, PR OB 4.5 2.6 36 478 86 1.2 4.6 53 4.7 741
US EPA 503 RegulationsTable 1 75 85 4,300 840 57 75 420 100 7,500Table 3 41 39 1,500 300 17 420 100 2,800
Notes:
1. Concentrations are expressed on a dry weight basis and represent the mean of all samples for that month.
2. US EPA Standards for the Use and Disposal of Sewage Sludge, 503.13 (b)(1) , Ceiling Concentration Limits and (3), Pollutant Concentration (Clean Sludge) Limits.
3. Plant Key: BB - Bowery Bay, CI - Coney Island, HP - Hunts Point, JA - Jamaica, NC - Newtown Creek, NR - North River, OB - Oakwood Beach,
OH - Owls Head, PR - Port Richmond, RH - Red Hook, RK - Rockaway, TI - Tallman Island, 26 - 26th Ward, WI - Wards Island
4. Improper storage during transportation occured in February for 26Ward(26, RK, CI, JA), RH, JA, OB(OB, PR). Therefore, these samples were not utilized to calculate the values above.

City of New York DEPARTMENT OF ENVIRONMENTAL PROTECTION Bureau of Wastewater Treatment
RED HOOK WATER POLLUTION CONTROL PLANT
US EPA 40 CFR Part 503 Use or Disposal of Sewage Sludge
2008 Annual Report (Revised)
Prepared for
UNITED STATES ENVIRONMENTAL PROTECTION AGENCY
Prepared by
City of New York, Department of Environmental Protection Bureau of Wastewater Treatment Biosolids Management Section
96-05 Horace Harding Expressway Corona, New York 11368
(718) 595-6571
August 2009

TABLE OF CONTENTS
Red Hook WPCP Part 503 Annual Report 2008
i
I. RED HOOK DEWATERED SLUDGE QUANTITIES
A. Dewatering Facility Allocations ..............................................................................1 II. RED HOOK DEWATERED SLUDGE QUALITY
A. Metals Analyses .......................................................................................................1 III. RED HOOK DEWATERED SLUDGE END USE A. EPIC, contract 947ADM1........................................................................................6 B. EPIC, contract 1131-BIO.........................................................................................6 C. NYOFCO, contract 947ADM4................................................................................6
D. Tully Environmental, contract 947ADM3...............................................................6
E. WeCare Organics, LLC, contract 1181-BIO ...........................................................6

TABLE OF CONTENTS
Red Hook WPCP Part 503 Annual Report 2008
ii
LIST OF APPENDICES Appendix A - Table 3, Monthly Liquid Sludge Allocation Table 4, Monthly Dewatered Sludge Allocations to Contractors Appendix B - Table 5, Monthly Average Metals Data

Red Hook WPCP Part 503 Annual Report 2008
1
Requisite information, specific to the Red Hook WPCP is provided below.
FACILITY NAME
LOCATION
DEWATERING FACILITY
SPDES PERMIT #
CONTACT PERSON
PROCESS ENGINEER
Red Hook Water Pollution
Control Plant
63 Flushing Ave., Unit 101 Brooklyn, N.Y. 11205-1069
Yes
NYOO27073
Superintendent Robert Rickey (718) 935-1597
William Sedutto
Additional Permits
Facility Name
Location Permit Name Permit # Type of Permit (Federal, State)
Red Hook Water Pollution Control
Plant
63 Flushing Ave., Unit 101
Brooklyn, NY 11205-1069
Registration 261010002302000 State
I. RED HOOK DEWATERED SLUDGE QUANTITIES
A. DEWATERING FACILITY ALLOCATIONS
For the reporting period of January 1 through December 31, 2008 anaerobically digested, thickened sewage sludge generated at Red Hook was dewatered at the Red Hook, and Wards Island dewatering facilities. Approximately 3,746.17 dry metric tons of Red Hook dewatered sludge was generated. Approximately 3,746.17 dry metric tons of Red Hook sludge was dewatered at the Red Hook dewatering facility. Table 3 of Appendix A contains the monthly dewatered sludge allocation figures in dry metric tons for this reporting period. The dewatered sludge production figures in Table 4 were determined from the dewatered sludge allocation measured at each dewatering facility.

Red Hook WPCP Part 503 Annual Report 2008
2
II. RED HOOK DEWATERED SLUDGE QUALITY
A. METALS ANALYSES
The metals analyses results of dewatered sludge samples taken by the contractors, EPIC 1 (contract 947ADM1), Tully Environmental (contract 947ADM3), and WeCare Organics, LLC (contract 1181-BIO) were also entered into the database maintained by the DEP. Table 5 of Appendix B summarizes the average monthly metals concentrations for the Red Hook WPCP. The monthly metals concentrations represent an arithmetic average of the results from the analyses of all samples of Red Hook dewatered sewage sludge generated each month.
During this reporting period, Red Hook dewatered sludge contained concentrations of metals that met the Ceiling Concentration Limits for twelve (12) months (January, February, March, April, May, June, July, August, September, October, November, December) as listed in Table 1 of 40 CFR Part 503.13(b)(1). Further, during twelve (12) months (January, February, March, April, May, June, July, August, September, October, November, December) in 2008, the Red Hook dewatered sludge contained concentrations of metals that met the Pollutant Concentration Limits as listed in Table 3 of 40 CFR Part 503.13(b)(1).
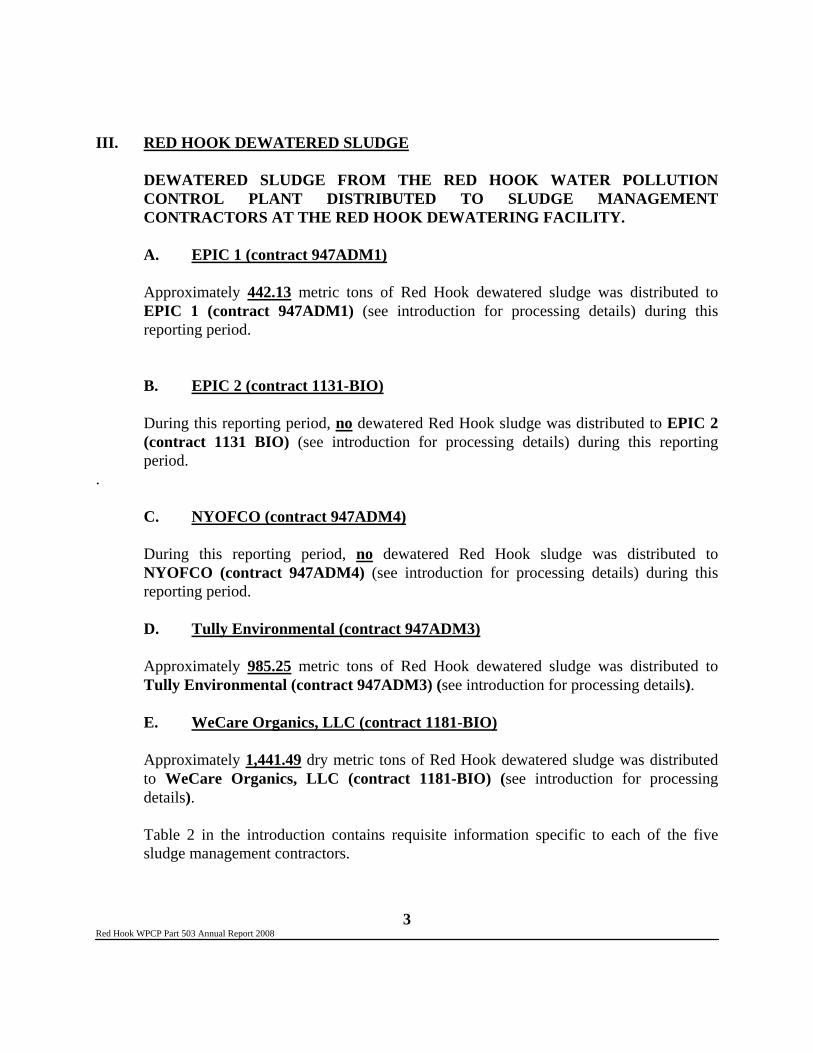
Red Hook WPCP Part 503 Annual Report 2008
3
III. RED HOOK DEWATERED SLUDGE
DEWATERED SLUDGE FROM THE RED HOOK WATER POLLUTION CONTROL PLANT DISTRIBUTED TO SLUDGE MANAGEMENT CONTRACTORS AT THE RED HOOK DEWATERING FACILITY.
A. EPIC 1 (contract 947ADM1)
Approximately 442.13 metric tons of Red Hook dewatered sludge was distributed to EPIC 1 (contract 947ADM1) (see introduction for processing details) during this reporting period.
B. EPIC 2 (contract 1131-BIO)
During this reporting period, no dewatered Red Hook sludge was distributed to EPIC 2 (contract 1131 BIO) (see introduction for processing details) during this reporting period.
.
C. NYOFCO (contract 947ADM4)
During this reporting period, no dewatered Red Hook sludge was distributed to NYOFCO (contract 947ADM4) (see introduction for processing details) during this reporting period.
D. Tully Environmental (contract 947ADM3)
Approximately 985.25 metric tons of Red Hook dewatered sludge was distributed to Tully Environmental (contract 947ADM3) (see introduction for processing details).
E. WeCare Organics, LLC (contract 1181-BIO)
Approximately 1,441.49 dry metric tons of Red Hook dewatered sludge was distributed to WeCare Organics, LLC (contract 1181-BIO) (see introduction for processing details).
Table 2 in the introduction contains requisite information specific to each of the five sludge management contractors.

APPENDICES

APPENDIX - A
Table 3.................................Monthly Liquid Sludge AllocationTable 4.................................Monthly Dewatered SludgeAllocations to
Contractors

Table 3Monthly Liquid Sludge Allocation
Red Hook WPCP
Dewatering
Facility Bowery Hunts Jamaica Oakwood Red Tallman 26th Wards TOTALS
Month Bay Point Beach Hook Island Ward Island
Jan-08 289.00 289.00
Feb-08 239.00 239.00
Mar-08 349.00 349.00
Apr-08 295.00 295.00
May-08 231.17 231.17
Jun-08 404.00 404.00
Jul-08 446.00 446.00
Aug-08 520.00 520.00
Sep-08 372.00 372.00
Oct-08 170.00 170.00
Nov-08 199.00 199.00
Dec-08 232.00 232.00
TOTALS 0.00 0.00 0.00 0.00 3,746.17 0.00 0.00 0.00 3,746.17
Notes:1. Dewatered sludge production is expressed in dry metric tons which was "calculated" using liquid sludge production data from the plant.

Table 4Monthly Dewatered Sludge Allocations to Contractors
Red Hook Dewatering Facility
ContractorsLiquid Sludge EPIC 1 EPIC 2 NYOFCO Tully Environmental We Care Organics, LLC TOTALS
Month Sources contract 947 ADM1contract 1131 BIO contract 947 ADM4 contract 947 ADM3 contract 1181 BIOJan-08 RH 59.21 0.00 0.00 0.00 149.52 208.73Feb-08 RH 229.52 0.00 0.00 0.00 0.00 229.52Mar-08 RH 153.40 0.00 0.00 0.00 104.72 258.12Apr-08 RH 0.00 0.00 0.00 102.11 90.78 192.89May-08 RH 0.00 0.00 0.00 201.62 29.55 231.17Jun-08 RH 0.00 0.00 0.00 0.00 235.79 235.79Jul-08 RH 0.00 0.00 0.00 0.00 446.00 446.00
Aug-08 RH 0.00 0.00 0.00 0.00 248.40 248.40Sep-08 RH 0.00 0.00 0.00 70.07 136.73 206.80Oct-08 RH 0.00 0.00 0.00 155.56 0.00 155.56Nov-08 RH 0.00 0.00 0.00 195.28 0.00 195.28Dec-08 RH 0.00 0.00 0.00 260.61 0.00 260.61
TOTALS 442.13 0.00 0.00 985.25 1,441.49 2,868.87
Notes: 1. Dewatered sludge production is expressed in dry metric tons.
2. Plant Key: BB - Bowery Bay, CI - Coney Island, HP - Hunts Point, JA - Jamaica, NC - Newtown Creek, NR - North River, OB - Oakwood Beach,
OH - Owls Head, PR - Port Richmond, RH - Red Hook, RK - Rockaway, TI - Tallman Island, 26 - 26th Ward, WI - Wards Island

APPENDIX - B
Table 5...................... Monthly Average Metals Data

Table 5Monthly Metals Concentrations
Red Hook WPCP
Metals
Month Liquid Sludge Dewatering Arsenic Cadmium Chromium Copper Lead Mercury Molybdenum Nickel Selenium Zinc
Sources Facility mg/Kg mg/Kg mg/Kg mg/Kg mg/Kg mg/Kg mg/Kg mg/Kg mg/Kg mg/Kg
Jan-08 RH RH 7.6 4.7 43 755 284 1.8 15 26 4.7 1,033Feb-08 RH RH 5.2 4.3 40 702 222 2.7 10 22 10.0 976Mar-08 RH RH 5.3 4.4 42 683 202 2.2 11 23 8.0 994Apr-08 RH RH 5.8 3.3 45 656 188 1.5 13 24 4.6 882May-08 RH RH 5.0 4.1 36 639 169 1.2 14 20 2.9 501Jun-08 RH RH 6.0 4.8 44 899 256 2.1 24 26 3.7 1,206Jul-08 RH RH 6.5 4.0 44 820 251 1.6 17 29 5.0 1,150
Aug-08 RH RH 5.7 2.7 40 754 218 1.5 19 24 4.7 1,079Sep-08 RH RH 5.4 4.2 41 723 192 1.7 21 24 5.3 1,044Oct-08 RH RH 5.7 5.2 36 751 191 1.4 16 21 4.4 1,028Nov-08 RH RH 4.9 3.7 38 774 191 1.9 17 24 5.6 1,063Dec-08 RH RH 5.9 3.6 42 731 242 1.7 13 22 5.6 899
US EPA 503 RegulationsTable 1 75 85 4,300 840 57 75 420 100 7,500Table 3 41 39 1,500 300 17 420 100 2,800
Notes:
1. Concentrations are expressed on a dry weight basis and represent the mean of all samples for that month.
2. US EPA Standards for the Use and Disposal of Sewage Sludge, 503.13 (b)(1) , Ceiling Concentration Limits and (3), Pollutant Concentration (Clean Sludge) Limits.
3. Plant Key: BB - Bowery Bay, CI - Coney Island, HP - Hunts Point, JA - Jamaica, NC - Newtown Creek, NR - North River, OB - Oakwood Beach,
OH - Owls Head, PR - Port Richmond, RH - Red Hook, RK - Rockaway, TI - Tallman Island, 26 - 26th Ward, WI - Wards Island
4. Improper storage during transportation occured in February for 26Ward(26, RK, CI, JA), RH, JA, OB(OB, PR). Therefore, these samples were not utilized to calculate the values above.

City of New York DEPARTMENT OF ENVIRONMENTAL PROTECTION Bureau of Wastewater Treatment
ROCKAWAY WATER POLLUTION CONTROL PLANT
US EPA 40 CFR Part 503 Use or Disposal of Sewage Sludge
2008 Annual Report (Revised)
Prepared for
UNITED STATES ENVIRONMENTAL PROTECTION AGENCY
Prepared by
City of New York, Department of Environmental Protection Bureau of Wastewater Treatment Biosolids Management Section
96-05 Horace Harding Expressway Corona, New York 11368
(718) 595-6571
August 2009

TABLE OF CONTENTS
Rockaway WPCP Part 503 Annual Report 2008
i
I. ROCKAWAY DEWATERED SLUDGE QUANTITIES
A. Dewatering Facility Allocations ..............................................................................1 II. ROCKAWAY DEWATERED SLUDGE QUALITY
A. Metals Analyses .......................................................................................................1

TABLE OF CONTENTS
Rockaway WPCP Part 503 Annual Report 2008
ii
LIST OF APPENDICES Appendix A - Table 3, Monthly Liquid Sludge Allocation Table 4, Monthly Dewatered Sludge Allocations to Contractors – (N/A) Appendix B - Table 5, Monthly Average Metals Data
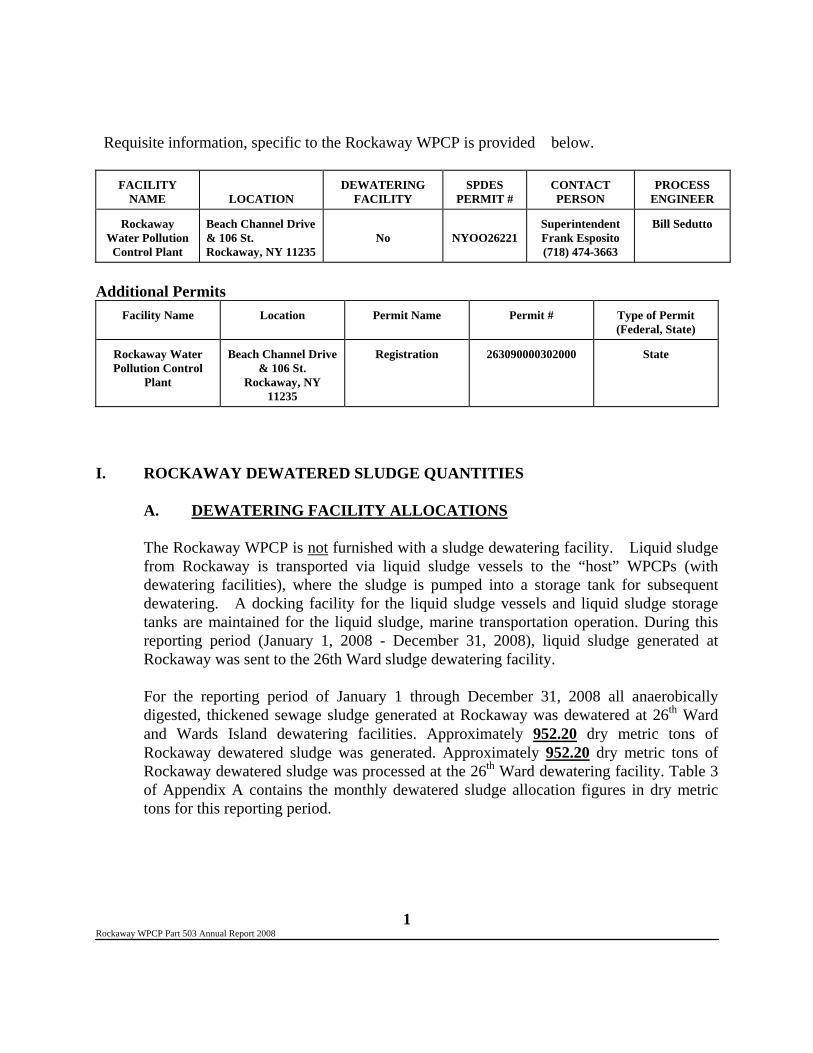
Rockaway WPCP Part 503 Annual Report 2008
1
Requisite information, specific to the Rockaway WPCP is provided below.
FACILITY NAME
LOCATION
DEWATERING FACILITY
SPDES PERMIT #
CONTACT PERSON
PROCESS ENGINEER
Rockaway Water Pollution Control Plant
Beach Channel Drive & 106 St. Rockaway, NY 11235
No
NYOO26221
Superintendent Frank Esposito (718) 474-3663
Bill Sedutto
Additional Permits
Facility Name Location Permit Name Permit # Type of Permit (Federal, State)
Rockaway Water Pollution Control
Plant
Beach Channel Drive & 106 St.
Rockaway, NY 11235
Registration 263090000302000 State
I. ROCKAWAY DEWATERED SLUDGE QUANTITIES
A. DEWATERING FACILITY ALLOCATIONS
The Rockaway WPCP is not furnished with a sludge dewatering facility. Liquid sludge from Rockaway is transported via liquid sludge vessels to the “host” WPCPs (with dewatering facilities), where the sludge is pumped into a storage tank for subsequent dewatering. A docking facility for the liquid sludge vessels and liquid sludge storage tanks are maintained for the liquid sludge, marine transportation operation. During this reporting period (January 1, 2008 - December 31, 2008), liquid sludge generated at Rockaway was sent to the 26th Ward sludge dewatering facility.
For the reporting period of January 1 through December 31, 2008 all anaerobically digested, thickened sewage sludge generated at Rockaway was dewatered at 26th Ward and Wards Island dewatering facilities. Approximately 952.20 dry metric tons of Rockaway dewatered sludge was generated. Approximately 952.20 dry metric tons of Rockaway dewatered sludge was processed at the 26th Ward dewatering facility. Table 3 of Appendix A contains the monthly dewatered sludge allocation figures in dry metric tons for this reporting period.

Rockaway WPCP Part 503 Annual Report 2008
2
II. ROCKAWAY DEWATERED SLUDGE QUALITY
A. METALS ANALYSES
The metals analyses results of dewatered sludge samples taken by the contractors EPIC 1 (contract 947ADM1), Tully Environmental (contract 947 ADM3), and EPIC 2 (contract 1131-BIO) were entered into the database maintained by the DEP. Table 5 of Appendix B summarizes the average monthly metals concentrations for the Rockaway WPCP. The monthly metals concentrations represent an arithmetic average of the results from the analyses of all samples of Rockaway dewatered sewage sludge generated each month.
During this reporting period, Rockaway dewatered sludge contained concentrations of metals that met the Ceiling Concentration Limits for twelve (12) months (January, February, March, April, May, June, July, August, September, October, November, December) as listed in Table 1 of 40 CFR Part 503.13(b)(1). Further, during twelve (12) months (January, February, March, April, May, June, July, August, September, October, November, December), Rockaway dewatered sludge contained concentrations of metals that met the Pollutant Concentration Limits as listed in Table 3 of 40 CFR Part 503.13(b)(1).

APPENDICES

APPENDIX - A
Table 3.................................Monthly Liquid Sludge AllocationTable 4.................................Monthly Dewatered SludgeAllocations to
Contractors (Not Applicable)

Table 3Monthly Liquid Sludge Allocation
Rockaway WPCP
Dewatering
Facility Bowery Hunts Jamaica Oakwood Red Tallman 26th Wards TOTALS
Month Bay Point Beach Hook Island Ward Island
Jan-08 67.50 67.50
Feb-08 75.80 75.80
Mar-08 63.30 63.30
Apr-08 125.90 125.90
May-08 95.50 95.50
Jun-08 82.00 82.00
Jul-08 123.20 123.20
Aug-08 0.00 0.00
Sep-08 68.00 68.00
Oct-08 77.00 77.00
Nov-08 84.00 84.00
Dec-08 90.00 90.00
TOTALS 0.00 0.00 0.00 0.00 0.00 0.00 952.20 0.00 952.20
Notes:1. Dewatered sludge production is expressed in dry metric tons which was "calculated" using liquid sludge production data from the plant.2. There was no sludge transfer to 26th Ward in August because Digester #2 went back into service on 8/08/08. It was taken out of service for cleaning on 7/08/08

APPENDIX - B
Table 5...................... Monthly Average Metals Data

Table 5Monthly Metals Concentrations
Rockaway WPCP
Metals
Month Liquid Sludge Dewatering Arsenic Cadmium Chromium Copper Lead Mercury Molybdenum Nickel Selenium Zinc
Sources Facility mg/Kg mg/Kg mg/Kg mg/Kg mg/Kg mg/Kg mg/Kg mg/Kg mg/Kg mg/Kg
Jan-08 26, RK 26 3.4 5.3 31 611 171 2.0 7.0 24 3.6 949Feb-08 26, RK 26 4.0 5.4 36 861 193 1.6 10.2 27 5.0 1,305Mar-08 RK 26 3.5 6.2 30 650 203 1.6 5.6 55 4.0 1,139Apr-08 26, RK 26 3.5 3.3 35 653 209 2.3 5.0 21 4.0 1,086May-08 26, RK 26 3.6 6.6 42 726 190 1.8 5.4 23 5.6 1,155Jun-08 26, RK 26 3.8 5.5 87 793 228 2.0 12.0 47 5.0 1,265
Jul-08 26, RK 26 3.5 4.5 58 732 179 2.1 7.8 37 5.9 1,251Aug-08 26, RK 26 3.6 2.9 55 636 194 2.5 6.1 36 3.3 1,209Sep-08 26, RK 26 4.1 8.4 55 820 222 2.2 10.1 33 5.7 1,438Oct-08 26, RK 26 3.7 9.7 34 877 194 1.8 8.9 27 5.1 1,412Nov-08 26, RK 26 3.2 6.7 41 711 185 2.3 6.0 47 5.4 1,141Dec-08 26, RK 26 3.8 5.0 46 727 189 1.9 9.9 29 7.2 1,091
US EPA 503 RegulationsTable 1 75 85 4,300 840 57 75 420 100 7,500Table 3 41 39 1,500 300 17 420 100 2,800
Notes:
1. Concentrations are expressed on a dry weight basis and represent the mean of all samples for that month.
2. US EPA Standards for the Use and Disposal of Sewage Sludge, 503.13 (b)(1) , Ceiling Concentration Limits and (3), Pollutant Concentration (Clean Sludge) Limits.
3. Plant Key: BB - Bowery Bay, CI - Coney Island, HP - Hunts Point, JA - Jamaica, NC - Newtown Creek, NR - North River, OB - Oakwood Beach,
OH - Owls Head, PR - Port Richmond, RH - Red Hook, RK - Rockaway, TI - Tallman Island, 26 - 26th Ward, WI - Wards Island
4. Improper storage during transportation occured in February for 26Ward(26, RK, CI, JA), RH, JA, OB(OB, PR). Therefore, these samples were not utilized to calculate the values above.

City of New York DEPARTMENT OF ENVIRONMENTAL PROTECTION Bureau of Wastewater Treatment
TALLMAN ISLAND WATER POLLUTION CONTROL PLANT
US EPA 40 CFR Part 503 Use or Disposal of Sewage Sludge
2008 Annual Report (Revised)
Prepared for
UNITED STATES ENVIRONMENTAL PROTECTION AGENCY
Prepared by
City of New York, Department of Environmental Protection Bureau of Wastewater Treatment Biosolids Management Section
96-05 Horace Harding Expressway Corona, New York 11368
(718) 595-6571
August 2009

TABLE OF CONTENTS
Tallman Island WPCP Part 503 Annual Report 2008
i
I. TALLMAN ISLAND DEWATERED SLUDGE QUANTITIES
A. Dewatering Facility Allocations ..............................................................................1 II. TALLMAN ISLAND DEWATERED SLUDGE QUALITY
A. Metals Analyses .......................................................................................................1 III. TALLMAN ISLAND DEWATERED SLUDGE END USE A. EPIC, contract 947ADM1........................................................................................3 B. EPIC, contract 1131-BIO.........................................................................................3
C. NYOFCO, contract 947ADM4................................................................................3
D. Tully Environmental, contract 947ADM3...............................................................3
E. WeCare Organics, LLC, contract 1181-BIO ...........................................................3

TABLE OF CONTENTS
Tallman Island WPCP Part 503 Annual Report 2008
ii
LIST OF APPENDICES Appendix A - Table 3, Monthly Liquid Sludge Allocation Table 4, Monthly Dewatered Sludge Allocations to Contractors Appendix B - Table 5, Monthly Average Metals Data

Tallman Island WPCP Part 503 Annual Report 2008
1
Requisite information, specific to the Tallman Island WPCP is provided below.
FACILITY NAME
LOCATION
DEWATERING FACILITY
SPDES PERMIT #
CONTACT PERSON
PROCESS ENGINEER
Tallman Island Water Pollution
Control Plant
127 Street & East River College Pt., N.Y. 11430
Yes
NY006239
Superintendent Joseph Massaro (718) 353-5124
Carmelo Giorlandino
Additional Permits
Facility Name Location Permit Name Permit # Type of Permit (Federal, State)
Tallman Island Water Pollution Control Plant
127 Street & East River College Pt., N.Y. 11430
Title V 263020001200013 Federal
Tallman Island Water Pollution Control Plant
127 Street & East River College Pt., NY 11430
Air State Facility Permit for 2 stage II
generators
263020001200020 State
I. TALLMAN ISLAND DEWATERED SLUDGE QUANTITIES
A. DEWATERING FACILITY ALLOCATIONS
For the reporting period of January 1 through December 31, 2008, all anaerobically digested, thickened sewage sludge generated at Tallman Island was dewatered at Tallman Island, Hunts Point and Wards Island sludge dewatering facilities. Approximately 8,579.32 dry metric tons of Tallman Island dewatered sludge was generated. Approximately 7,870.93 dry metric tons was dewatered at the Tallman Island sludge dewatering facility. Approximately 614.59 dry metric tons of Tallman Island sludge was dewatered at the Hunts Point dewatering facility. Approximately 93.80 dry metric tons of Tallman Island sludge was dewatered at the Wards Island dewatering facility. Table 3 of Appendix A contains the monthly dewatered sludge allocation figures in dry metric tons for this reporting period. The dewatered sludge production figures in Table 4 were determined from the dewatered sludge allocation measured at each dewatering facility.

Tallman Island WPCP Part 503 Annual Report 2008
2
II. TALLMAN ISLAND DEWATERED SLUDGE QUALITY
A. METALS ANALYSES
The metals analyses results of dewatered sludge samples taken by the contractors, EPIC 1 (contract 947ADM1), NYOFCO (contract 947ADM4), and Tully Environmental (contract 947ADM3) were also entered into the database maintained by the DEP. Table 5 of Appendix B summarizes the average monthly metals concentrations for the Tallman Island WPCP. The monthly metals concentrations represent an arithmetic average of the results from the analyses of all samples of Tallman Island dewatered sewage sludge generated each month.
During this reporting period, Tallman Island dewatered sludge contained concentrations of metals that met the Ceiling Concentration Limits for twelve (12) months (January, February, March, April, May, June, July, August, September, October, November, December) as listed in Table 1 of 40 CFR Part 503.13(b)(1. Further during twelve (12) months (January, February, March, April, May, June, July, August, September, October, November, December) in 2008, Tallman Island dewatered sludge contained concentrations of metals that met the Pollutant Concentration Limits as listed in Table 3 of 40 CFR Part 503.13(b)(1).
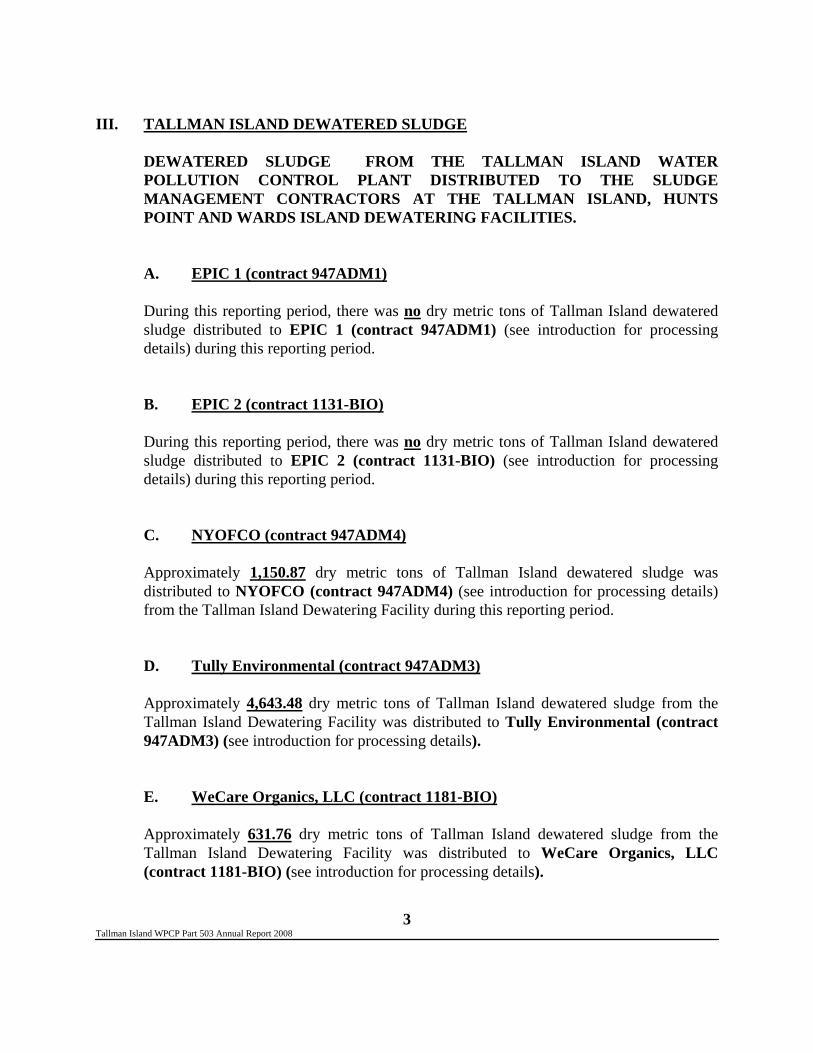
Tallman Island WPCP Part 503 Annual Report 2008
3
III. TALLMAN ISLAND DEWATERED SLUDGE DEWATERED SLUDGE FROM THE TALLMAN ISLAND WATER POLLUTION CONTROL PLANT DISTRIBUTED TO THE SLUDGE MANAGEMENT CONTRACTORS AT THE TALLMAN ISLAND, HUNTS POINT AND WARDS ISLAND DEWATERING FACILITIES.
A. EPIC 1 (contract 947ADM1)
During this reporting period, there was no dry metric tons of Tallman Island dewatered sludge distributed to EPIC 1 (contract 947ADM1) (see introduction for processing details) during this reporting period.
B. EPIC 2 (contract 1131-BIO)
During this reporting period, there was no dry metric tons of Tallman Island dewatered sludge distributed to EPIC 2 (contract 1131-BIO) (see introduction for processing details) during this reporting period.
C. NYOFCO (contract 947ADM4)
Approximately 1,150.87 dry metric tons of Tallman Island dewatered sludge was distributed to NYOFCO (contract 947ADM4) (see introduction for processing details) from the Tallman Island Dewatering Facility during this reporting period.
D. Tully Environmental (contract 947ADM3)
Approximately 4,643.48 dry metric tons of Tallman Island dewatered sludge from the Tallman Island Dewatering Facility was distributed to Tully Environmental (contract 947ADM3) (see introduction for processing details).
E. WeCare Organics, LLC (contract 1181-BIO)
Approximately 631.76 dry metric tons of Tallman Island dewatered sludge from the Tallman Island Dewatering Facility was distributed to WeCare Organics, LLC (contract 1181-BIO) (see introduction for processing details).
Tallman Island WPCP Part 503 Annual Report 2008
4
Table 2 in the introduction contains requisite information specific to each of the five sludge management contractors.

APPENDICES

APPENDIX - A
Table 3.................................Monthly Liquid Sludge AllocationTable 4.................................Monthly Dewatered SludgeAllocations to
Contractors

Table 3Monthly Liquid Sludge Allocation
Tallman Island WPCP
Dewatering
Facility Bowery Hunts Jamaica Oakwood Red Tallman 26th Wards TOTALS
Month Bay Point Beach Hook Island Ward Island
Jan-08 22.59 897.30 919.89
Feb-08 909.00 909.00
Mar-08 201.50 712.90 38.60 953.00
Apr-08 183.50 452.30 55.20 691.00
May-08 526.43 526.43
Jun-08 737.00 737.00
Jul-08 136.70 525.30 662.00
Aug-08 70.30 629.70 700.00
Sep-08 738.00 738.00
Oct-08 701.00 701.00
Nov-08 521.00 521.00
Dec-08 521.00 521.00
TOTALS 0.00 614.59 0.00 0.00 0.00 7,870.93 0.00 93.80 8,579.32
Notes:1. Dewatered sludge production is expressed in dry metric tons which was "calculated" using liquid sludge production data from the plant.
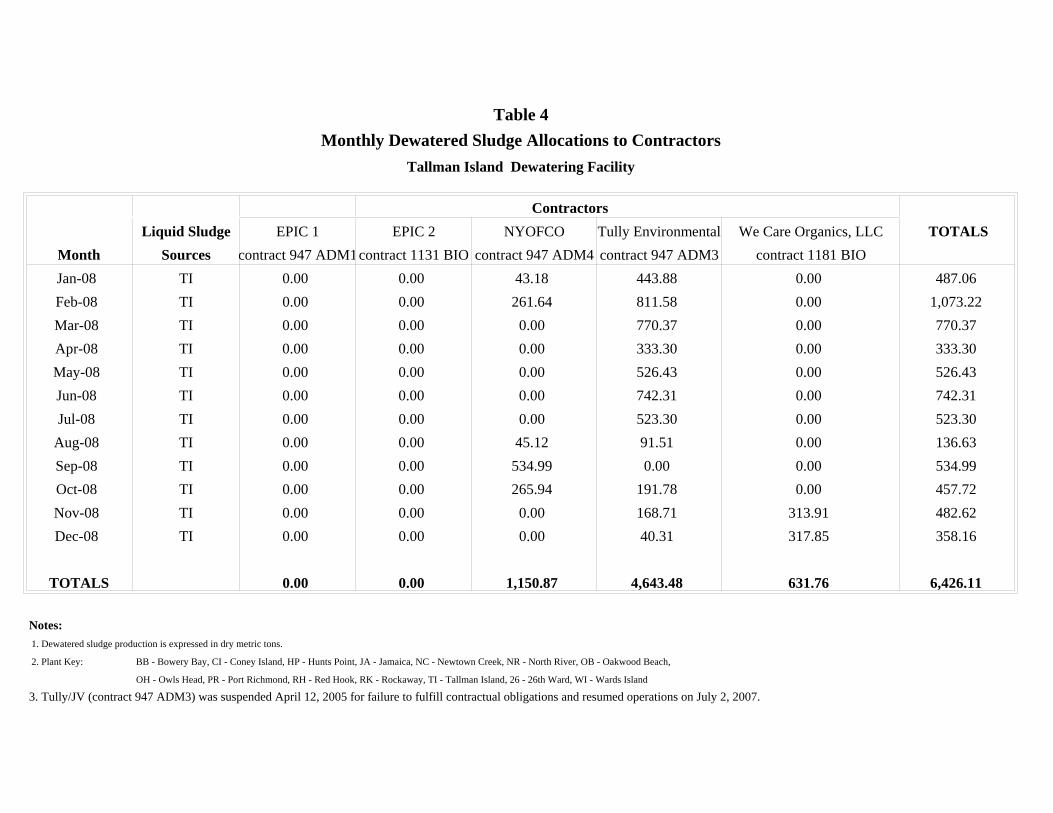
Table 4Monthly Dewatered Sludge Allocations to Contractors
Tallman Island Dewatering Facility
ContractorsLiquid Sludge EPIC 1 EPIC 2 NYOFCO Tully Environmental We Care Organics, LLC TOTALS
Month Sources contract 947 ADM1contract 1131 BIO contract 947 ADM4 contract 947 ADM3 contract 1181 BIOJan-08 TI 0.00 0.00 43.18 443.88 0.00 487.06Feb-08 TI 0.00 0.00 261.64 811.58 0.00 1,073.22Mar-08 TI 0.00 0.00 0.00 770.37 0.00 770.37Apr-08 TI 0.00 0.00 0.00 333.30 0.00 333.30May-08 TI 0.00 0.00 0.00 526.43 0.00 526.43Jun-08 TI 0.00 0.00 0.00 742.31 0.00 742.31Jul-08 TI 0.00 0.00 0.00 523.30 0.00 523.30
Aug-08 TI 0.00 0.00 45.12 91.51 0.00 136.63Sep-08 TI 0.00 0.00 534.99 0.00 0.00 534.99Oct-08 TI 0.00 0.00 265.94 191.78 0.00 457.72Nov-08 TI 0.00 0.00 0.00 168.71 313.91 482.62Dec-08 TI 0.00 0.00 0.00 40.31 317.85 358.16
TOTALS 0.00 0.00 1,150.87 4,643.48 631.76 6,426.11
Notes: 1. Dewatered sludge production is expressed in dry metric tons.
2. Plant Key: BB - Bowery Bay, CI - Coney Island, HP - Hunts Point, JA - Jamaica, NC - Newtown Creek, NR - North River, OB - Oakwood Beach,
OH - Owls Head, PR - Port Richmond, RH - Red Hook, RK - Rockaway, TI - Tallman Island, 26 - 26th Ward, WI - Wards Island
3. Tully/JV (contract 947 ADM3) was suspended April 12, 2005 for failure to fulfill contractual obligations and resumed operations on July 2, 2007.

APPENDIX - B
Table 5...................... Monthly Average Metals Data

Table 5Monthly Metals Concentrations
Tallman Island WPCP
Metals
Month Liquid Sludge Dewatering Arsenic Cadmium Chromium Copper Lead Mercury Molybdenum Nickel Selenium Zinc
Sources Facility mg/Kg mg/Kg mg/Kg mg/Kg mg/Kg mg/Kg mg/Kg mg/Kg mg/Kg mg/Kg
Jan-08 TI TI 4.2 3.6 32 460 121 1.8 5.7 20 6.4 758HP, NC, OH, NR, TI, PR, BB HP 3.3 7.3 48 529 192 2.0 10.9 30 2.7 1,030
Feb-08 TI TI 2.8 2.7 28 370 82 0.7 6.5 17 2.4 610Mar-08 TI TI 2.9 2.7 32 370 94 1.0 5.0 17 2.5 668
BB, TI, HP, OH, NC, NR HP 2.7 6.5 47 710 199 1.7 10.1 30 3.9 1,113BB, TI, WI, OH, NC, NR WI 2.9 6.4 48 657 192 2.3 9.1 29 3.1 1,058
Apr-08 TI TI 3.6 3.0 39 492 101 1.2 5.9 26 3.4 814HP, NC, NR, BB, TI, OH HP 3.1 5.2 47 674 167 1.9 8.6 26 3.3 1,083
WI, NC, NR, BB, TI WI 3.0 5.5 44 751 195 2.2 10.6 27 3.6 1,128May-08 TI TI 3.9 4.9 40 588 123 1.4 8.2 23 5.3 931
HP, BB, OH, NR, TI, NC HP 3.1 8.0 45 718 177 1.7 11 32 5.0 1,130Jun-08 TI TI 3.7 2.8 41 524 127 1.4 10.7 15 3.9 897Jul-08 TI TI 4.5 2.9 42 590 134 1.4 7.9 28 4.3 1,038
HP, NC, NR, TI, OH, PR, BB HP 3.5 5.9 65 845 249 1.9 17.3 35 4.5 1,348Aug-08 TI TI 6.4 8.2 43 384 138 1.7 13.4 26 6.5 1,043
HP, NR, OH, NC, BB, TI, PR HP 3.7 2.9 77 715 183 1.7 6.9 30 3.9 1,138Sep-08 TI TI 7.4 13.8 52 599 163 1.6 7.4 32 6.6 1,229Oct-08 TI TI 4.5 4.9 42 539 125 1.2 7.0 29 3.5 993Nov-08 TI TI 4.3 2.7 42 550 116 1.4 9.8 30 5.4 961Dec-08 TI TI 4.6 2.6 39 511 111 1.1 7.7 25 4.8 805
US EPA 503 RegulationsTable 1 75 85 4,300 840 57 75 420 100 7,500Table 3 41 39 1,500 300 17 420 100 2,800
Notes:
1. Concentrations are expressed on a dry weight basis and represent the mean of all samples for that month.
2. US EPA Standards for the Use and Disposal of Sewage Sludge, 503.13 (b)(1) , Ceiling Concentration Limits and (3), Pollutant Concentration (Clean Sludge) Limits.
3. Plant Key: BB - Bowery Bay, CI - Coney Island, HP - Hunts Point, JA - Jamaica, NC - Newtown Creek, NR - North River, OB - Oakwood Beach,
OH - Owls Head, PR - Port Richmond, RH - Red Hook, RK - Rockaway, TI - Tallman Island, 26 - 26th Ward, WI - Wards Island

City of New York DEPARTMENT OF ENVIRONMENTAL PROTECTION Bureau of Wastewater Treatment
WARDS ISLAND WATER POLLUTION CONTROL PLANT
US EPA 40 CFR Part 503 Use or Disposal of Sewage Sludge
2008 Annual Report (Revised)
Prepared for
UNITED STATES ENVIRONMENTAL PROTECTION AGENCY
Prepared by
City of New York, Department of Environmental Protection Bureau of Wastewater Treatment Biosolids Management Section
96-05 Horace Harding Expressway Corona, New York 11368
(718) 595-6571
August 2009

TABLE OF CONTENTS
Wards Island WPCP Part 503 Annual Report 2008
i
I. WARDS ISLAND DEWATERED SLUDGE QUANTITIES
A. Dewatering Facility Allocations ..............................................................................1 II. WARDS ISLAND DEWATERED SLUDGE QUALITY
A. Metals Analyses .......................................................................................................1
III. WARDS ISLAND DEWATERED SLUDGE END USE
A. EPIC, contract 947ADM1........................................................................................6 B. EPIC, contract 1131-BIO.........................................................................................6 C. NYOFCO, contract 947ADM4................................................................................6 D. Tully Environmental, contract 947ADM3...............................................................6 E. WeCare Organics, LLC, contract 1181-BIO ...........................................................6

TABLE OF CONTENTS
Wards Island WPCP Part 503 Annual Report 2008
ii
LIST OF APPENDICES Appendix A - Table 3, Monthly Liquid Sludge Allocation Table 4, Monthly Dewatered Sludge Production Appendix B - Table 5, Monthly Average Metals Data
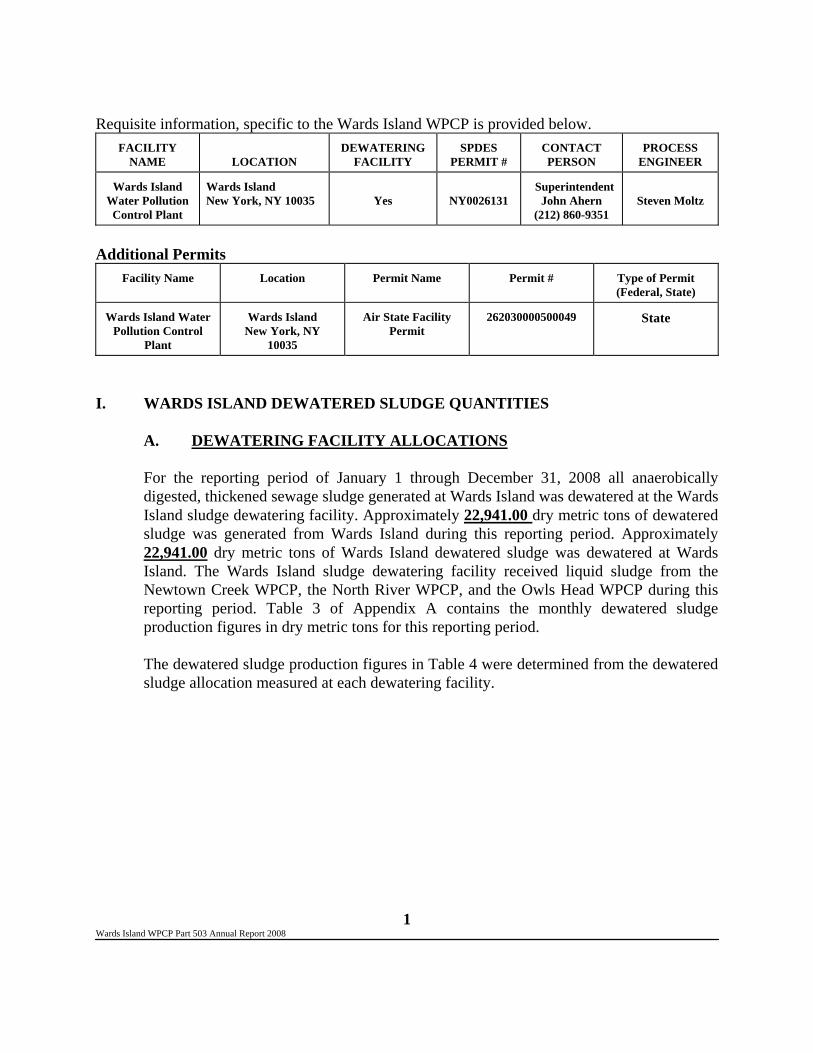
Wards Island WPCP Part 503 Annual Report 2008
1
Requisite information, specific to the Wards Island WPCP is provided below. FACILITY
NAME
LOCATION DEWATERING
FACILITY SPDES
PERMIT # CONTACT PERSON
PROCESS ENGINEER
Wards Island Water Pollution Control Plant
Wards Island New York, NY 10035
Yes
NY0026131
Superintendent John Ahern
(212) 860-9351
Steven Moltz
Additional Permits
Facility Name Location Permit Name Permit # Type of Permit (Federal, State)
Wards Island Water Pollution Control
Plant
Wards Island New York, NY
10035
Air State Facility Permit
262030000500049 State
I. WARDS ISLAND DEWATERED SLUDGE QUANTITIES A. DEWATERING FACILITY ALLOCATIONS
For the reporting period of January 1 through December 31, 2008 all anaerobically digested, thickened sewage sludge generated at Wards Island was dewatered at the Wards Island sludge dewatering facility. Approximately 22,941.00 dry metric tons of dewatered sludge was generated from Wards Island during this reporting period. Approximately 22,941.00 dry metric tons of Wards Island dewatered sludge was dewatered at Wards Island. The Wards Island sludge dewatering facility received liquid sludge from the Newtown Creek WPCP, the North River WPCP, and the Owls Head WPCP during this reporting period. Table 3 of Appendix A contains the monthly dewatered sludge production figures in dry metric tons for this reporting period.
The dewatered sludge production figures in Table 4 were determined from the dewatered sludge allocation measured at each dewatering facility.

Wards Island WPCP Part 503 Annual Report 2008
2
II. WARDS ISLAND DEWATERED SLUDGE QUALITY A. METALS ANALYSES
The metals analyses results of dewatered sludge samples taken by the contractor, NYOFCO (contract 947ADM4), and EPIC 1 (contract 947ADM1) were entered into the database maintained by the DEP. Table 5 of Appendix B summarizes the average monthly metals concentrations for the Wards Island WPCP. The monthly metals concentrations represent an arithmetic average of the results from the analyses of all samples of Wards Island dewatered sewage sludge generated each month.
During this reporting period, Wards Island dewatered sludge contained concentrations of
metals that met the Ceiling Concentration Limits for twelve (12) months (January, February, March, April, May, June, July, August, September, October, November, December) as listed in Table 1 of 40 CFR Part 503.13(b)(1). Further, during twelve (12) months (January, February, March, April, May, June, July, August, September, October, November, December) in 2008 Wards Island dewatered sludge contained metals at levels that were below the Pollutant Concentration Limits as listed in Table 3 of 40 CFR Part 503.13(b)(1).

Wards Island WPCP Part 503 Annual Report 2008
3
III. WARDS ISLAND DEWATERED SLUDGE DEWATERED SLUDGE FROM THE WARDS ISLAND, NORTH RIVER, NEWTOWN CREEK, OWLS HEAD, BOWERY BAY, TALLMAN ISLAND, AND PORT RICHMOND WATER POLLUTION CONTROL PLANTS DISTRIBUTED TO SLUDGE MANAGEMENT CONTRACTORS AT THE WARDS ISLAND DEWATERING FACILITY.
A. EPIC 1 (contract 947ADM1)
Approximately 8,726.09 dry metric tons of Wards Island dewatered sludge mix listed above, was distributed to EPIC 1 (contract 947ADM1) (see introduction for processing details) during this reporting period.
B. EPIC 2 (contract 1131-BIO)
During this reporting period, no Wards Island dewatered sludge mix listed above, was distributed to EPIC 2 (contract 1131-BIO) (see introduction for processing details).
C. NYOFCO (contract 947ADM4)
Approximately 20,007.39 dry metric tons of Wards Island dewatered sludge mix listed above, was distributed to NYOFCO (contract 947ADM4) (see introduction for processing details) during this reporting period.
D. Tully Environmental (contract 947ADM3)
During this reporting period, no Wards Island dewatered sludge mix listed above, was distributed to Tully Environmental (contract 947ADM3) (see introduction for processing details).
E. WeCare Organics, LLC (contract 1181-BIO)
During this reporting period, no Wards Island dewatered sludge mix listed above, was distributed to WeCare Organics, LLC (contract 1181-BIO) (see introduction for processing details).
Table 2 in the introduction contains requisite information specific to each of the five sludge management contractors.

APPENDICES

APPENDIX - A
Table 3.................................Monthly Liquid Sludge AllocationTable 4.................................Monthly Dewatered SludgeAllocations to
Contractors
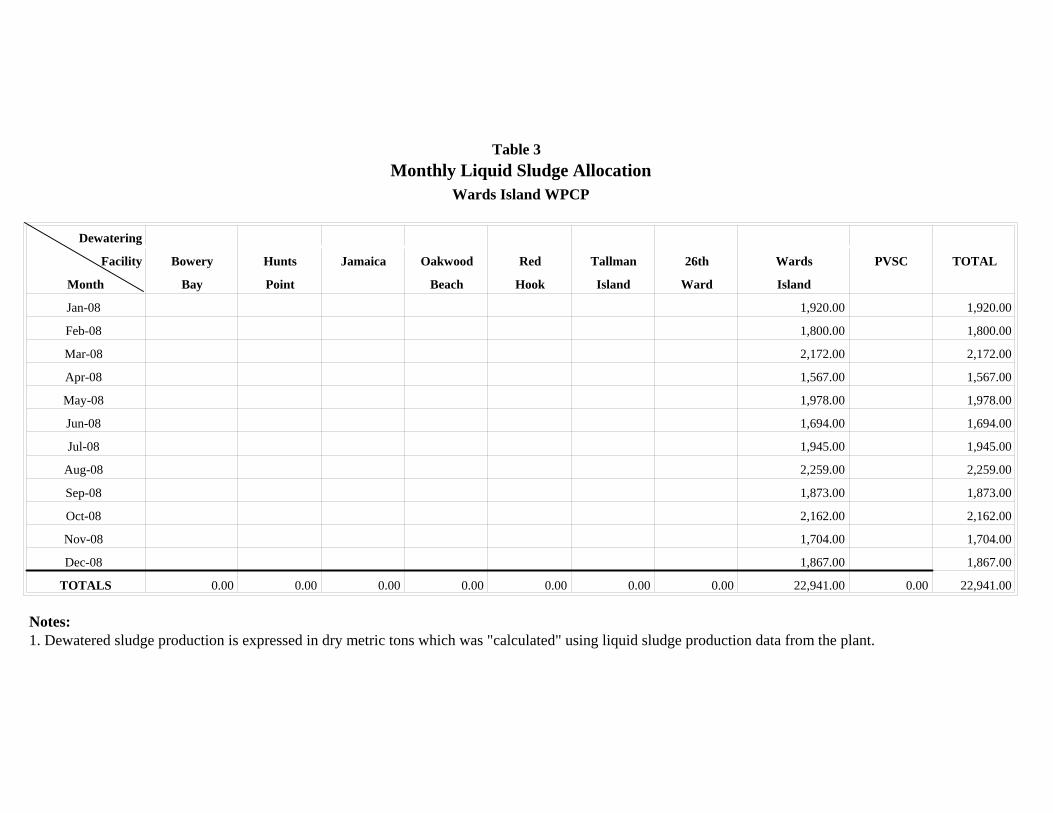
Table 3Monthly Liquid Sludge Allocation
Wards Island WPCP
Dewatering
Facility Bowery Hunts Jamaica Oakwood Red Tallman 26th Wards PVSC TOTAL
Month Bay Point Beach Hook Island Ward Island
Jan-08 1,920.00 1,920.00
Feb-08 1,800.00 1,800.00
Mar-08 2,172.00 2,172.00
Apr-08 1,567.00 1,567.00
May-08 1,978.00 1,978.00
Jun-08 1,694.00 1,694.00
Jul-08 1,945.00 1,945.00
Aug-08 2,259.00 2,259.00
Sep-08 1,873.00 1,873.00
Oct-08 2,162.00 2,162.00
Nov-08 1,704.00 1,704.00
Dec-08 1,867.00 1,867.00
TOTALS 0.00 0.00 0.00 0.00 0.00 0.00 0.00 22,941.00 0.00 22,941.00
Notes:1. Dewatered sludge production is expressed in dry metric tons which was "calculated" using liquid sludge production data from the plant.

Table 4Monthly Dewatered Sludge Allocations to Contractors
Wards Island Dewatering Facility
ContractorsLiquid Sludge EPIC 1 EPIC 2 NYOFCO Tully Environmental We Care Organics, LLC TOTALS
Month Sources contract 947 ADM1contract 1131 BIO contract 947 ADM4 contract 947 ADM3 contract 1181 BIOJan-08 WI, NC, OH, NR, BB 490.23 0.00 1,803.41 0.00 0.00 2,293.64Feb-08 WI, NC, PR, NR, OH, BB 388.01 0.00 1,736.78 0.00 0.00 2,124.79Mar-08 BB, TI, WI, OH, NC, NR 927.89 0.00 1,771.92 0.00 0.00 2,699.81Apr-08 WI, NC, NR, BB, TI 779.55 0.00 1,666.29 0.00 0.00 2,445.84May-08 WI, BB, NR, NC, OH 580.42 0.00 1,396.59 0.00 0.00 1,977.01Jun-08 WI, NC, NR 756.19 0.00 1,486.89 0.00 0.00 2,243.08Jul-08 WI, BB, NR, NC, OH 801.26 0.00 1,835.36 0.00 0.00 2,636.62
Aug-08 WI, BB, NR, NC, OH 996.13 0.00 1,726.43 0.00 0.00 2,722.56Sep-08 WI, BB, NR, NC, OH 775.54 0.00 1,630.20 0.00 0.00 2,405.74Oct-08 WI, BB, NC, OH, NR 714.71 0.00 1,590.01 0.00 0.00 2,304.72Nov-08 WI, BB, NC, OH, NR 739.73 0.00 1,672.63 0.00 0.00 2,412.36Dec-08 WI, BB, NC, OH, NR 776.43 0.00 1,690.88 0.00 0.00 2,467.31
TOTALS 8,726.09 0.00 20,007.39 0.00 0.00 28,733.48
Notes: 1. Dewatered sludge production is expressed in dry metric tons.
2. Plant Key: BB - Bowery Bay, CI - Coney Island, HP - Hunts Point, JA - Jamaica, NC - Newtown Creek, NR - North River, OB - Oakwood Beach,
OH - Owls Head, PR - Port Richmond, RH - Red Hook, RK - Rockaway, TI - Tallman Island, 26 - 26th Ward, WI - Wards Island

APPENDIX - B
Table 5...................... Monthly Average Metals Data

Table 5Monthly Metals Concentrations
Wards Island WPCP
Metals
Month Liquid Sludge Dewatering Arsenic Cadmium Chromium Copper Lead Mercury Molybdenum Nickel Selenium Zinc
Sources Facility mg/Kg mg/Kg mg/Kg mg/Kg mg/Kg mg/Kg mg/Kg mg/Kg mg/Kg mg/Kg
Jan-08 WI WI 4.6 5.2 37 635 168 2.4 11 25 8.3 1,003WI, NC, OH, NR, BB 3.2 6.9 41 662 188 2.0 10.5 29 3.2 978
Feb-08 WI WI 4.6 5.1 41 632 172 2.1 9.6 25 8.6 1,001WI, NC, PR, NR, OH, BB 2.9 6.4 48 671 195 1.7 9.5 29 3.4 1,085
Mar-08 WI WI 4.5 5.0 42 598 170 2.2 9 25 7.3 986BB, TI, WI, OH, NC, NR 2.9 6.4 48 657 192 2.3 9.1 29 3.1 1,058
Apr-08 WI WI 4.6 4.5 37 552 151 2.2 11 21 8.6 933WI, NC, NR, BB, TI 3.0 5.5 44 751 195 2.2 10.6 27 3.6 1,128
May-08 WI WI 4.5 5.6 35 652 142 1.8 14 22 8.3 987WI, BB, NR, NC, OH WI 3.2 8.5 41 738 183 1.6 10 27 4.4 1,174
Jun-08 WI WI 4.2 6.4 42 691 203 2.3 15 27 4.3 942WI, NC, NR 3.9 8.4 57 892 284 1.8 14 35 4.2 1,323
Jul-08 WI WI 6.2 12.5 38 601 195 2.2 23 12 6.4 960WI, NC, PR, NR, BB 3.2 6.2 51 931 280 2.1 21 32 3.6 1,376
Aug-08 WI WI 7.3 13.7 46 716 232 2.6 15 29 8.8 1,205WI, NR, OH, NC, BB 3.4 2.9 40 732 218 2.1 12 27 3.8 1,248
Sep-08 WI WI 9.1 18.5 52 760 232 3.5 14 27 9.1 1,235WI, NR, BB, NC, OH 3.6 9.3 48 830 251 2.2 13 27 3.8 1,343
Oct-08 WI WI 9.1 18.5 49 755 199 2.0 14 26 9.2 1,165WI, NR, BB, NC, OH 2.8 7.9 42 793 194 2.5 12 23 3.3 1,218
Nov-08 WI WI 6.1 11.4 48 746 193 2.8 12 25 5.0 1,080WI, BB, NC, OH, NR 2.7 5.0 45 832 205 2.3 13 26 4.0 1,154
Dec-08 WI WI 4.2 9.1 45 783 168 2.1 10 26 5.1 1,073WI, BB, NR, NC, OH 2.7 5.0 45 832 205 2.3 13 26 4.0 1,154
US EPA 503 RegulationsTable 1 75 85 4,300 840 57 75 420 100 7,500Table 3 41 39 1,500 300 17 420 100 2,800
Notes:
1. Concentrations are expressed on a dry weight basis and represent the mean of all samples for that month.
2. US EPA Standards for the Use and Disposal of Sewage Sludge, 503.13 (b)(1) , Ceiling Concentration Limits and (3), Pollutant Concentration (Clean Sludge) Limits.
3. Plant Key: BB - Bowery Bay, CI - Coney Island, HP - Hunts Point, JA - Jamaica, NC - Newtown Creek, NR - North River, OB - Oakwood Beach,
OH - Owls Head, PR - Port Richmond, RH - Red Hook, RK - Rockaway, TI - Tallman Island, 26 - 26th Ward, WI - Wards Island

City of New York DEPARTMENT OF ENVIRONMENTAL PROTECTION
Bureau of Wastewater Treatment
LABORATORY ISSUES
US EPA 40 CFR Part 503 Use or Disposal of Sewage Sludge
2008 Annual Report (Revised)
Prepared for
UNITED STATES ENVIRONMENTAL PROTECTION AGENCY
Prepared by
City of New York, Department of Environmental Protection Bureau of Wastewater Treatment
Biosolids Management 96-05 Horace Harding Expressway
Corona, New York 11368
(718) 595-6571
August 2009
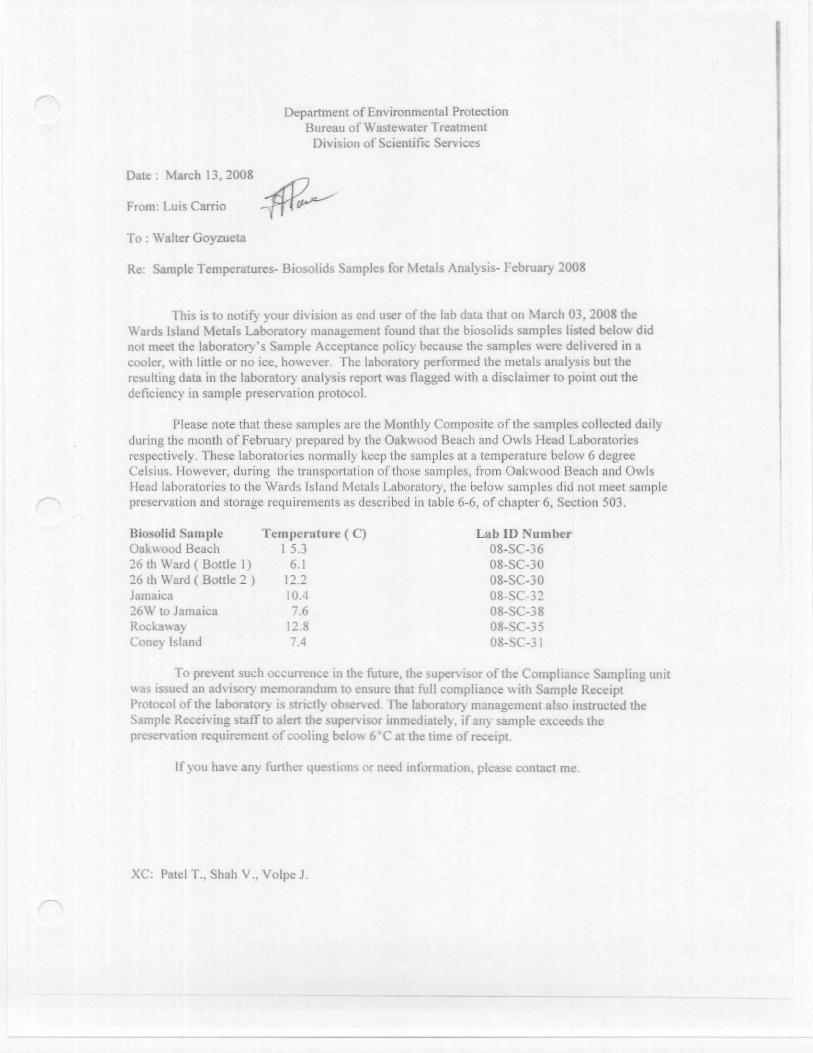


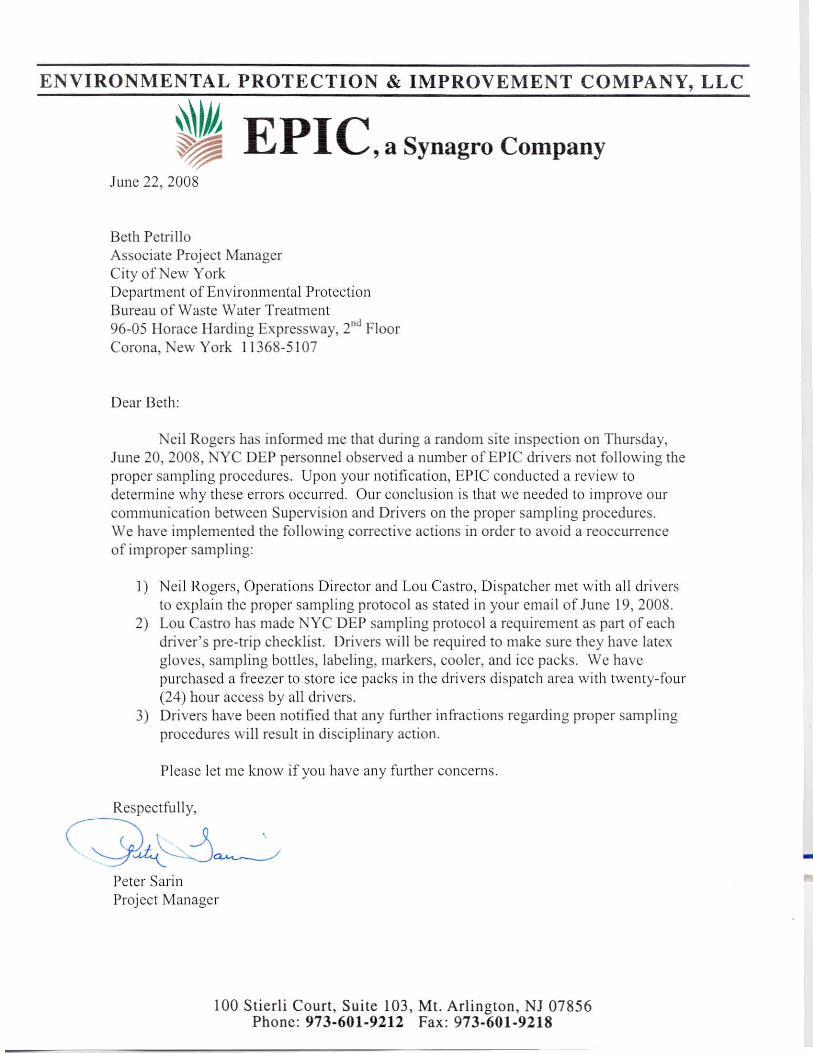

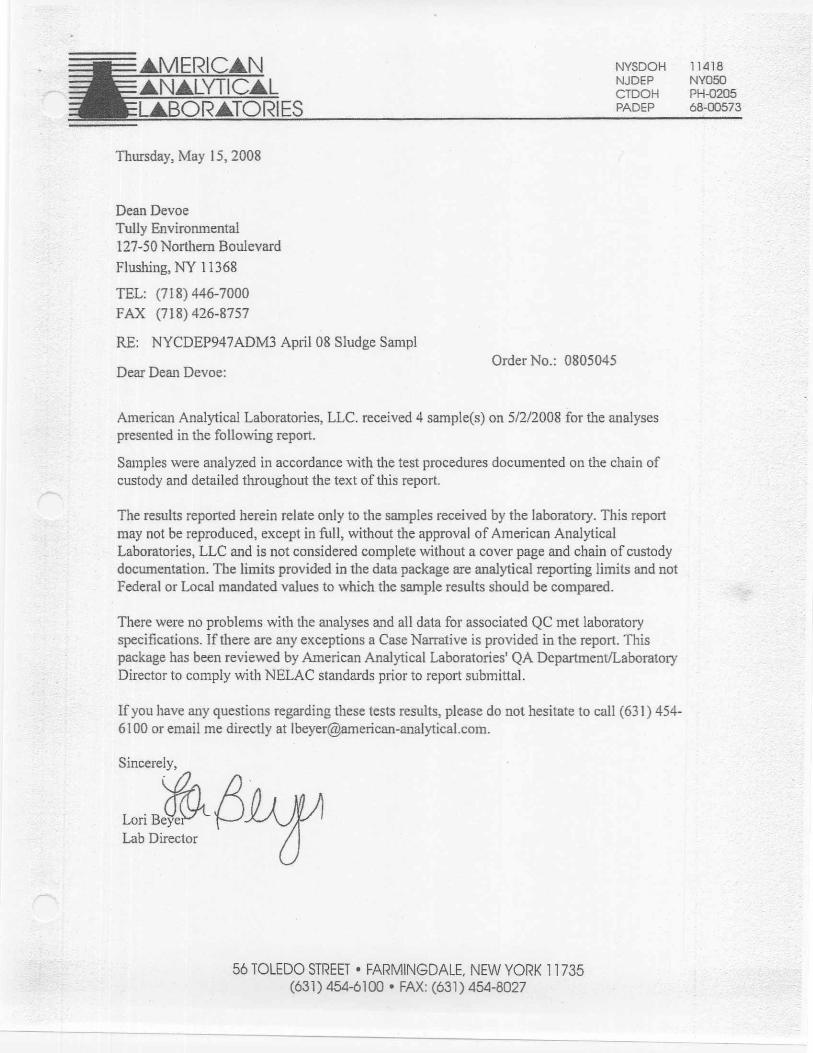
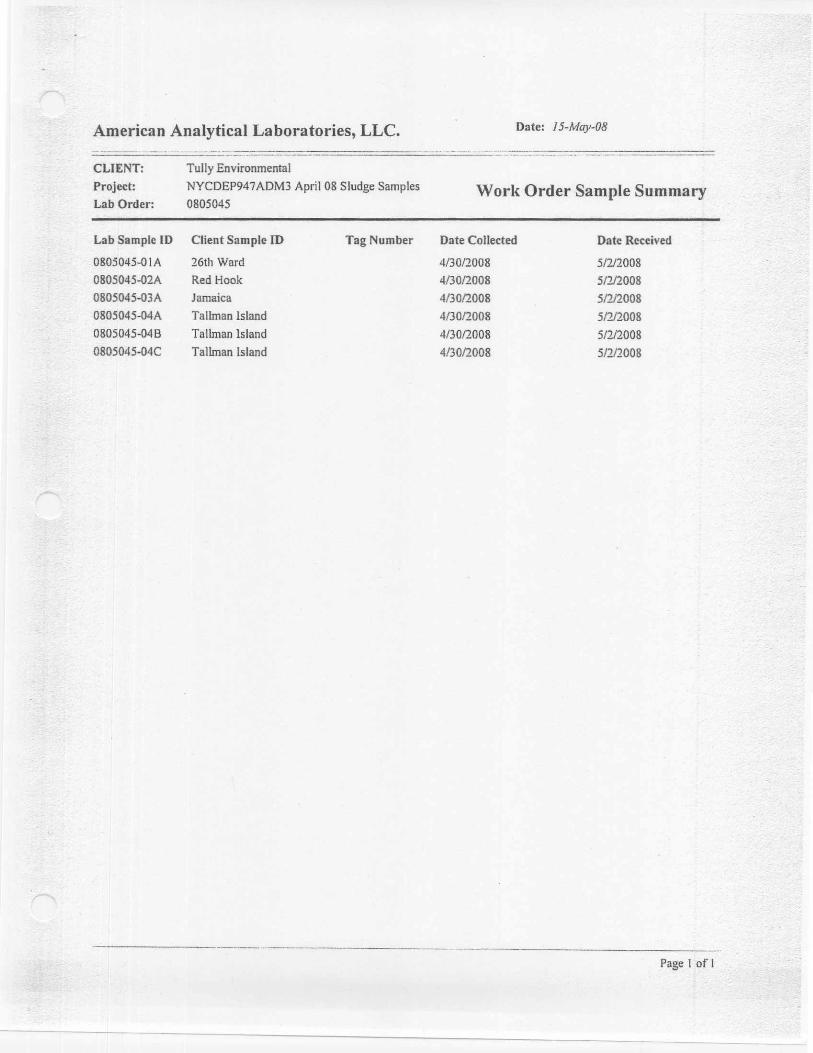
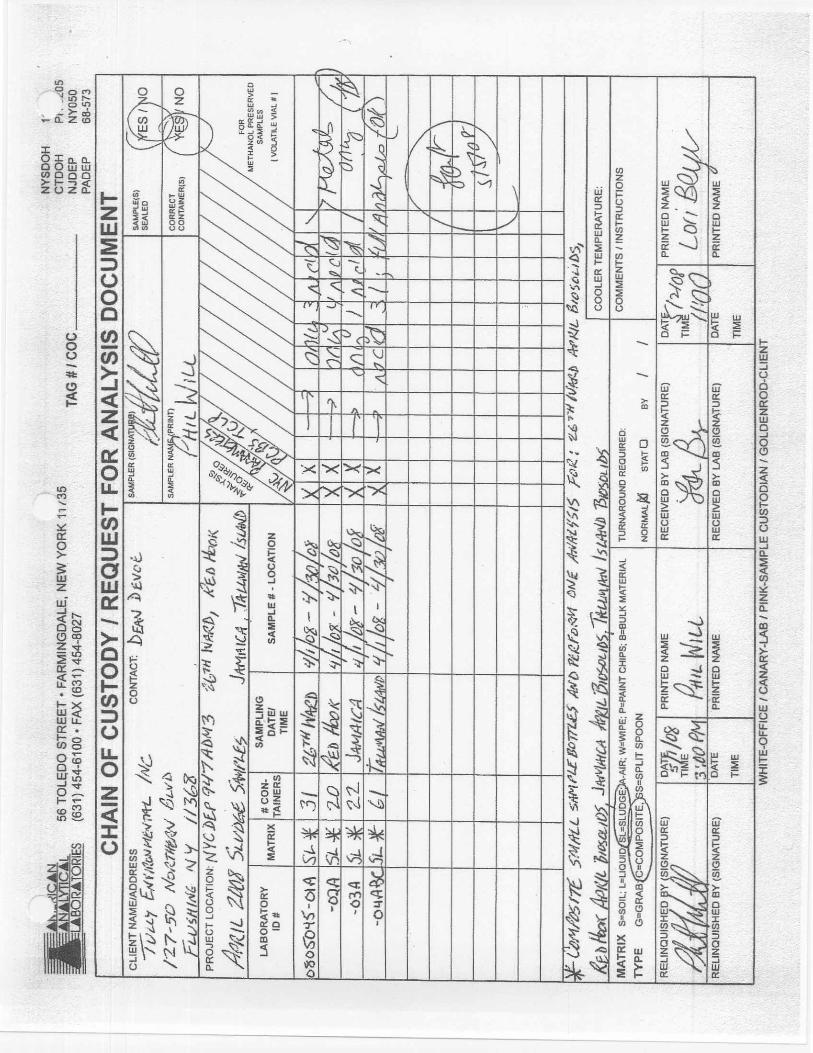


Related Documents


![[XLS]test.nhb.org.intest.nhb.org.in/Urban_Housing/4041 statutory Towns.xlsx · Web view502 802681 27 502 802682 27 503 802683 27 503 802684 27 503 802685 27 503 802686 27 503 802687](https://static.cupdf.com/doc/110x72/5ab1742b7f8b9abc2f8cb599/xlstestnhborg-statutory-townsxlsxweb-view502-802681-27-502-802682-27-503-802683.jpg)