NYC3DCars: A Dataset of 3D Vehicles in Geographic Context Kevin Matzen Cornell University Noah Snavely Cornell University Abstract Geometry and geography can play an important role in recognition tasks in computer vision. To aid in study- ing connections between geometry and recognition, we in- troduce NYC3DCars, a rich dataset for vehicle detection in urban scenes built from Internet photos drawn from the wild, focused on densely trafficked areas of New York City. Our dataset is augmented with detailed geometric and ge- ographic information, including full camera poses derived from structure from motion, 3D vehicle annotations, and geographic information from open resources, including road segmentations and directions of travel. NYC3DCars can be used to study new questions about using geometric in- formation in detection tasks, and to explore applications of Internet photos in understanding cities. To demonstrate the utility of our data, we evaluate the use of the geographic in- formation in our dataset to enhance a parts- based detection method, and suggest other avenues for future exploration. 1. Introduction Methods for 3D reconstruction and for object recognition have each, separately, seen significant advances in recent years. Yet there has been relatively little recent work explor- ing the intersection of these two areas despite evidence that explicit 3D reasoning can aid in recognition tasks [15]. We believe that new datasets that combine structure from motion (SfM)- style models with recognition methods can result in fruitful new approaches to scene understanding that lever- age detailed camera and scene geometry. Towards this end, we present a new vehicle recognition dataset, NYC3DCars, comprised of challenging urban photos from the wild, and augmented with rich geometric and geographic information. Our dataset enables the study of new questions about the use of rich geometric data in recognition tasks, and for new applications in geography- aware vision, where image under- standing is grounded in a geographic setting. In particular, NYC3DCars consists of over two thou- sand annotated Internet photos from New York City, from a wide range of viewpoints, times of day, and camera mod- els. The dataset includes (1) camera viewpoints for the Figure 1. NYC3DCars images and geometry. (a) An overhead view showing the 3D SfM model overlaid on a map. Black points represent 3D scene points, and a red heat map shows the distribution of reconstructed camera positions (note that they tend to appear on sidewalks). The map is color- coded according to our geographic data. (b) A view of the SfM model from the perspective of one of the reconstructed images. The point cloud, and other camera frusta, are visible outside the frame of the central photo. (c) Several other reconstructed photos, illustrating the diversity in our data. Each image has a red horizon line, obtained from the camera extrinsics, overlaid, as well as axes specifying global east (red), north (green), and up (blue). Please zoom in for best results. photo collection solved for using SfM, anchored in a geo- graphic coordinate system; (2) detailed ground truth 3D vehicle annotations, including 3D pose and vehicle type; and (3) geographic data associated with roads, sidewalks, and buildings in the surrounding scene, drawn from online resources. This data is illustrated in Figures 1, 2, and 4. Compared to existing datasets with vehicle pose information, ours has a richer variety of photos, and comes with detailed geographic data. Our dataset can serve as a benchmark for pose- sensitive vehicle detection in the wild, a problem we evaluate in Section 6. Moreover, our data, with its rich anno- tations and geometric information, can be used to explore a range of research questions in computer vision: New methods. Given multiple images of the same scene from different viewpoints and times, can we improve detec- tion methods using information estimated from SfM? SfM can immediately provide information such as horizons and 1

Welcome message from author
This document is posted to help you gain knowledge. Please leave a comment to let me know what you think about it! Share it to your friends and learn new things together.
Transcript
NYC3DCars: A Dataset of 3D Vehicles in Geographic Context
Kevin MatzenCornell University
Noah SnavelyCornell University
Abstract
Geometry and geography can play an important rolein recognition tasks in computer vision. To aid in study-ing connections between geometry and recognition, we in-troduce NYC3DCars, a rich dataset for vehicle detectionin urban scenes built from Internet photos drawn from thewild, focused on densely trafficked areas of New York City.Our dataset is augmented with detailed geometric and ge-ographic information, including full camera poses derivedfrom structure from motion, 3D vehicle annotations, andgeographic information from open resources, including roadsegmentations and directions of travel. NYC3DCars canbe used to study new questions about using geometric in-formation in detection tasks, and to explore applications ofInternet photos in understanding cities. To demonstrate theutility of our data, we evaluate the use of the geographic in-formation in our dataset to enhance a parts- based detectionmethod, and suggest other avenues for future exploration.
1. Introduction
Methods for 3D reconstruction and for object recognitionhave each, separately, seen significant advances in recentyears. Yet there has been relatively little recent work explor-ing the intersection of these two areas despite evidence thatexplicit 3D reasoning can aid in recognition tasks [15]. Webelieve that new datasets that combine structure from motion(SfM)- style models with recognition methods can result infruitful new approaches to scene understanding that lever-age detailed camera and scene geometry. Towards this end,we present a new vehicle recognition dataset, NYC3DCars,comprised of challenging urban photos from the wild, andaugmented with rich geometric and geographic information.Our dataset enables the study of new questions about theuse of rich geometric data in recognition tasks, and for newapplications in geography- aware vision, where image under-standing is grounded in a geographic setting.
In particular, NYC3DCars consists of over two thou-sand annotated Internet photos from New York City, froma wide range of viewpoints, times of day, and camera mod-els. The dataset includes (1) camera viewpoints for the
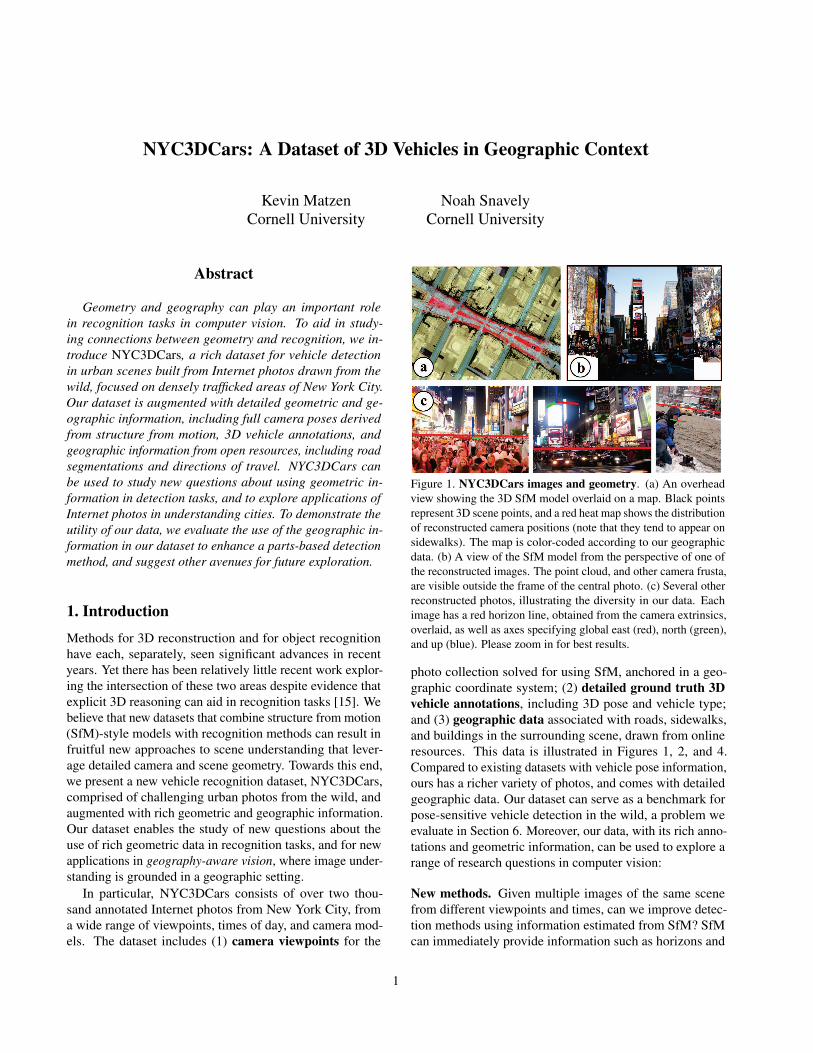
Figure 1. NYC3DCars images and geometry. (a) An overheadview showing the 3D SfM model overlaid on a map. Black pointsrepresent 3D scene points, and a red heat map shows the distributionof reconstructed camera positions (note that they tend to appear onsidewalks). The map is color- coded according to our geographicdata. (b) A view of the SfM model from the perspective of one ofthe reconstructed images. The point cloud, and other camera frusta,are visible outside the frame of the central photo. (c) Several otherreconstructed photos, illustrating the diversity in our data. Eachimage has a red horizon line, obtained from the camera extrinsics,overlaid, as well as axes specifying global east (red), north (green),and up (blue). Please zoom in for best results.
photo collection solved for using SfM, anchored in a geo-graphic coordinate system; (2) detailed ground truth 3Dvehicle annotations, including 3D pose and vehicle type;and (3) geographic data associated with roads, sidewalks,and buildings in the surrounding scene, drawn from onlineresources. This data is illustrated in Figures 1, 2, and 4.Compared to existing datasets with vehicle pose information,ours has a richer variety of photos, and comes with detailedgeographic data. Our dataset can serve as a benchmark forpose- sensitive vehicle detection in the wild, a problem weevaluate in Section 6. Moreover, our data, with its rich anno-tations and geometric information, can be used to explore arange of research questions in computer vision:
New methods. Given multiple images of the same scenefrom different viewpoints and times, can we improve detec-tion methods using information estimated from SfM? SfMcan immediately provide information such as horizons and
1

focal lengths useful in geometric reasoning, as well as ad-ditional information in the form of 3D scene structure. Atthe same time, open geographic data is proliferating onlinewith sources such as OpenStreetMap. How useful is this rich3D data for recognition problems? Our dataset provides atestbed for studying such questions.
New applications in urban scene understanding. Visionmethods are largely unplugged from the real world, in thatgeographic information about the world is largely untappedin vision, and, conversely, vision methods estimate propertiesof images, but generally do not tie these back to observationsabout the world. Because our data is georeferenced, ourdataset can be used to explore new applications of geography-aware vision, in which image observations can be relatedto real-world coordinates. For instance, a vehicle detectedin an image can be placed at a real position on a street,and detections aggregated across many Internet photos canpotentially be used to study traffic patterns or other large-scale phenomena, leveraging Internet photos as a new sourceof data for understanding cities.
We perform an initial study of how aspects of our data canbe used to improve object detection, namely by incorporatinggeographic data (such as roadbed polygons and directions oftravel) into a detection pipeline. We show promising resultsfor this task, but believe the true power of our dataset willbe in enabling the study of a range of geometric approaches.
In summary, our paper makes two main contributions:first, the NYC3DCars dataset itself, and the methodology forcreating it, including a new online 3D annotation toolkit1;and second, a study of how the information in our datasetcan be used within a detection framework. We close with adiscussion of biases and other limitations of our dataset, aswell as directions for its future applications.
2. Related Work
Detection datasets. Several datasets and benchmarks havebeen influential in vision in recent years. Notably, the PAS-CAL VOC benchmarks, with their wide variety of images,have driven work in recognition [4]. Our work incorpo-rates much more detailed geometry than PASCAL, includ-ing 3D vehicle poses, as in related datasets [23, 19, 10].Among these, perhaps the most closely related is the re-cent KITTI dataset [7]. However, KITTI is focused on thegoal of autonomous driving, and so the images are all cap-tured from the top of a vehicle with the same camera. Wealso provide vehicles with precise 3D pose, but for muchmore unconstrained imagery drawn from the Web, with thewide variety in viewpoint, illumination, image resolution,and other factors more typical of benchmarks such as VOC.Others have also presented 3D annotated vehicle datasets
1Dataset and tools available at nyc3d.cs.cornell.edu.
(e.g., [23, 19, 10]), but these generally contain carefully cap-tured images that lack the variety of our own data. Ourdataset also incorporates new types of geographic informa-tion, such as road data.
Geometry and recognition. Our dataset provides a frame-work for exploring new ways to combine explicit 3D reason-ing with recognition methods. Our geographic data—with itsroads, sidewalks, etc.—can be considered a “stage” withinwhich one can reason about objects and their placement inthe scene. This idea is related to prior methods that infer geo-metric properties and use them in image understanding tasks,for both outdoor [14, 15, 24] and indoor [12, 6] scenes. Ourwork allows for similar reasoning, but leverages much richerinformation derived from SfM and from geographic datasources. Hays and Efros augment images with coarse geo-graphic data, such as elevation and population density [11],based on a rough global position. Our work is based onprecise camera viewpoints, and allows for reasoning basedon much more specific, pixel-level information, such as roadsegment polygons (see Figure 4). Hejrati and Ramanan pro-pose a 3D detection approach [13], but the models are trainedentirely with 2D annotations. Finally, other work combinesmulti-view reasoning with object recognition [3, 2], gener-ally for images taken at the same time. In contrast, we buildmodels from photos taken from widely varying times, andso individual objects will differ from photo to photo.
3. The NYC3DCars Dataset
In creating NYC3DCars, we decided to start from a vi-brant urban area—Times Square in New York City—andcreate a dataset of photos in the wild for which we have bothdetailed ground truth 3D vehicle annotations, as well as geo-graphic data describing streets and other static elements ofthe city. To our knowledge, ours is the first detection datasetof real-world Internet imagery along with camera poses anddetailed 3D annotations. Beyond the dataset itself, a keycontribution is a Web-based 3D labeling interface, availableonline. NYC3DCars consists of three components:
1. A set of Flickr photos of NYC and 3D structure frommotion (SfM) models reconstructed from these photosand georegistered to the world. These photos span a va-riety of viewpoints, camera models, illuminations, andtimes of year. Each photograph has computed extrinsicsand intrinsics in a geographic coordinate system.
2. 3D ground truth vehicles labeled in a set of photos, witheach vehicle annotated with a geolocation, orientation,vehicle type, and level of occlusion.
3. Geographic data describing roads, sidewalks, medi-ans, elevation, etc., obtained from www.nyc.gov andwww.openstreetmap.org.
We now describe each of these components in turn.
2
3.1. Input Photos and SfM Model
To begin, we downloaded 14,000 geotagged photos takenaround Times Square from Flickr; these photos were takenbetween the years 2000 and 2008, by over 1,000 distinctphotographers. Using these photos as input, we ran an SfMpipeline to reconstruct 3D camera geometry and a 3D pointcloud [1]. Of the 14,000 input photos, 5,186 images werereconstructed, along with 567K 3D points. This 3D modelwas georegistered by downloading geotagged Google StreetView photos from the same area, adding these to the SfMreconstruction [16], then using these photos as anchors toroughly align the model to the world via absolute orienta-tions. Finally, we ran the Iterated Closest Point algorithm(ICP) between the 3D SfM point cloud and a publicly avail-able aerial LIDAR scan of Manhattan to refine the alignment.The reconstruction is shown in Figure 1, along with sev-eral images from the dataset. This dataset can also serve asan index for georegistering new photos, through 2D- to- 3Dmatching techniques [16].
For each photo, the SfM reconstruction (or a later regis-tration to the SfM model) gives us its extrinsics—its positionand orientation, in a geographic coordinate system—as wellas intrinsics including focal length and radial distortion pa-rameters. This information is already very useful in detectionproblems, e.g., in determining the horizon, or in detailed rea-soning involving depth or perspective. Moreover, the factthat the data is georegistered allows us to draw on additionalsources of geographic data for detection, as described below.
3.2. Annotated 3D Vehicles
Our goal is to provide a richly annotated set of groundtruth vehicles that can be used for detection tasks, but alsofor recovering and evaluating the 3D position and pose ofdetected cars. To create such ground truth, we designed anew Web- based tool for 3D vehicle annotation.
We considered several existing annotation tools, butfound that none met our specific goals. Many, such as La-belMe [22], provide for labeling of 2D regions, but not 3Dobjects. Little et al. provide an interface in which a user isasked to pose wireframe car renderings to annotate webcamimages [17]. We tested this interface, but found that forour highly varied images it was difficult to adjust all of thedegrees of freedom necessary to accurately place a vehiclein each photo; in particular, the three orientation angles weredifficult to set. For these reasons, we created a new interfacethat restricts the number of free parameters in posing a caras much as possible, using the extra information from theestimated camera pose of the photo. This makes the task ofannotating an image simpler and more efficient.
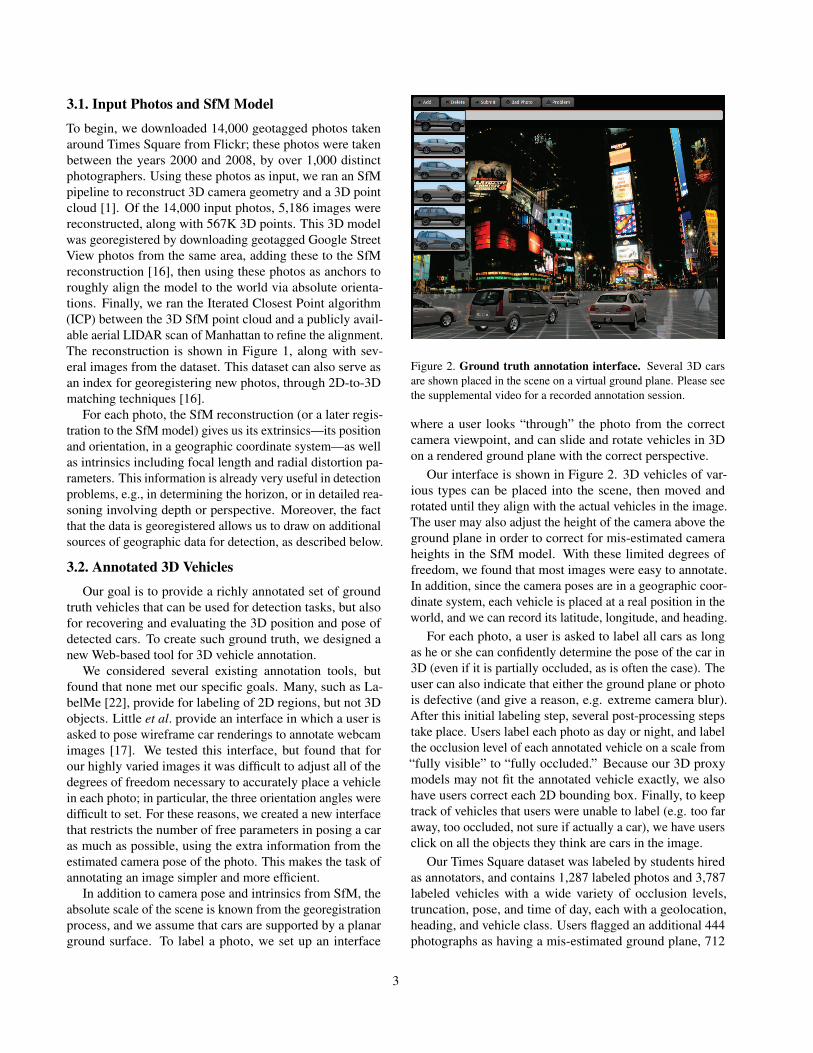
In addition to camera pose and intrinsics from SfM, theabsolute scale of the scene is known from the georegistrationprocess, and we assume that cars are supported by a planarground surface. To label a photo, we set up an interface
Figure 2. Ground truth annotation interface. Several 3D carsare shown placed in the scene on a virtual ground plane. Please seethe supplemental video for a recorded annotation session.
where a user looks “through” the photo from the correctcamera viewpoint, and can slide and rotate vehicles in 3Don a rendered ground plane with the correct perspective.
Our interface is shown in Figure 2. 3D vehicles of var-ious types can be placed into the scene, then moved androtated until they align with the actual vehicles in the image.The user may also adjust the height of the camera above theground plane in order to correct for mis- estimated cameraheights in the SfM model. With these limited degrees offreedom, we found that most images were easy to annotate.In addition, since the camera poses are in a geographic coor-dinate system, each vehicle is placed at a real position in theworld, and we can record its latitude, longitude, and heading.
For each photo, a user is asked to label all cars as longas he or she can confidently determine the pose of the car in3D (even if it is partially occluded, as is often the case). Theuser can also indicate that either the ground plane or photois defective (and give a reason, e.g. extreme camera blur).After this initial labeling step, several post- processing stepstake place. Users label each photo as day or night, and labelthe occlusion level of each annotated vehicle on a scale from“fully visible” to “fully occluded.” Because our 3D proxymodels may not fit the annotated vehicle exactly, we alsohave users correct each 2D bounding box. Finally, to keeptrack of vehicles that users were unable to label (e.g. too faraway, too occluded, not sure if actually a car), we have usersclick on all the objects they think are cars in the image.
Our Times Square dataset was labeled by students hiredas annotators, and contains 1,287 labeled photos and 3,787labeled vehicles with a wide variety of occlusion levels,truncation, pose, and time of day, each with a geolocation,heading, and vehicle class. Users flagged an additional 444photographs as having a mis- estimated ground plane, 712
3

0
500
1000
1500
0 100 200 300
Height (pixels)
Vehi
cles
0200400600800
10001200
0 25 50 75 100
Percent OccludedVe
hicl
es
0
200
400
600
L F R B
Viewpoint
Vehi
cles
0
1000
2000
3000
MPVPick
upJe
epSed
anSUV
Hatchb
ack
Vehi
cles
0200400600800
10001200
Day Night
Time of Day
Pho
tos
Figure 3. NYC3DCars dataset statistics. Several statistics over our dataset, including (left to right): histograms of (1) the height of eachvehicle as measured in pixels, (2) the level of occlusion for each vehicle, (3) viewpoints (i.e. which side is visible to the camera), (4) vehicletypes, and (5) the approximate time of day each photo was taken.
photographs as having no visible ground (i.e., pedestrians orother occluders cover the entire ground and obscure any po-tential vehicles), and 257 photographs as having some otherdefect such as extreme motion blur. Figure 3 highlights sev-eral key statistics of the data. To increase the generality ofour dataset, we also gathered data for two other locations inNYC, Herald Square (130 images) and the area around theApple Store on Fifth Avenue (489 images). These two loca-tions are visually distinct from Times Square, but also offermany challenging instances of pedestrian and car occlusion.In the remainder of the paper, we focus on the Times Squaredataset. For evaluating detection, we divide the images intoequal- sized training and test sets.
3.3. Geographic Data
One reason we selected NYC as the location of our datasetwas to leverage high- fidelity geographic data made freelyavailable online. Every four years (most recently in 2009),NYC releases a free, updated set of polygons spanning thecity, representing roadbeds, sidewalks, building footprints,medians, and road centerlines. We incorporate this datainto our dataset, and augment roadbed polygons with roadorientation information (i.e., the expected direction of traffic)from OpenStreetMap. While such comprehensive data iscurrently available for a small number of cities, adding suchgeographic information to our dataset allows researchers tostudy how this data can be used, so as to guide its use inother locations as more data becomes available.
The geographic data used in our dataset is illustrated inFigure 4. As shown in the figure, the fact that our photos aregeoregistered allows us to project this data into each photo.This results in pixel- level segmentations of surface types(e.g., road, sidewalk) and 3D buildings. We explore the useof such data for vehicle detection in Section 5.
Discussion. We were initially unsure how well SfM meth-ods could be applied to photos of Times Square, due to itsdynamic nature (with moving objects, such as cars and peo-ple, and changes in the scenery itself, e.g. through electronicdisplays and billboards). However, as the visualization inFigure 1 suggests, the reconstructed cameras largely alignwith sidewalks and other areas where one would expect pho-tos to be captured. Despite the dynamic elements, enough
of the background stays the same for many (but not all) im-ages to be registered together correctly. The images thatwere incorrectly registered were generally photos with onlya few matches to 3D points in the scene, but occasionallycontained street signs or other confusing features.
Our dataset has inherent bias in that all photos are from acommon geographic area; one way this bias manifests itselfis in the skewed distributions of vehicle poses and typesevident in Figure 3. We discuss bias in Section 7.
4. Viewpoint-Aware Vehicle DetectionIn the following sections, we propose several methods and
experiments that we apply to the NYC3DCars dataset. Herewe discuss how we run existing learning methods on our data,and adapt them to build a set of baseline viewpoint- aware cardetectors. As baselines, we consider several detector vari-ants, and several types of data for training (including our owndata, as well as non- viewpoint- annotated data from PASCALVOC). Broadly speaking, our detectors start by training astate- of- the- art vehicle detector in a viewpoint- aware way,then apply these to new images with a non- maxima suppres-sion step to produce a set of candidate detections.
Viewpoint-aware detector. Our detector is based on thesuccessful Deformable Part Model (DPM) [5]. We firstdivide our viewpoint- annotated training examples into 16uniformly spaced bins based on viewpoint azimuthal angle,and train a detector for each (as in [7]). For each bin, we traina linear SVM on HOG features, using unoccluded vehiclesas positives, and negative examples mined from images thatdo not contain cars. Following the work of Girshick et al. [9],we use these linear SVMs as the initial filter coefficients ina car detection DPM mixture model. In particular, eachviewpoint bin becomes a component in the mixture model.
In order to train this mixture model, we use the Weak-Label Structural SVM (WL- SSVM) framework proposedin [9]. The WL- SSVM is a generalization of the LatentSSVM where a structured loss can be applied between (1)a set of labels and (2) a set of predictions when the twosets might not be the same. Let y = (yl, yb, yv) be anannotation with class label yl ∈ {�1,+1}, 2D bounding boxyb, and viewpoint bin yv ∈ {1, . . . ,K,∅} (where K is thenumber of viewpoint bins, and ∅ indicates that a viewpoint
4

Figure 4. 3D visualization of geographic data. By exploiting georegistration, we can obtain pixel-level labels. Left: Input image. Center:Image with vector data: roads (blue), medians (violet), and sidewalks (green). Right: Image with a 3D model of Times Square.
is unavailable, e.g. with VOC data). Similarly, let s =(sl, sb, sv) be a prediction with class label sl, 2D boundingbox sb, and viewpoint sv. We use the WL-SSVM over themore traditional latent SVM in order to penalize true positiveclass detections with incorrect viewpoint classification aswell as to handle training examples without a viewpointannotation (e.g., if we include VOC data for training).
The WL-SSVM requires two loss functions to be defined,Lmargin(y, s) which is used to push bad prediction scoresdown and Loutput(y, s) which is used to push good predic-tion scores up. (We provide a review of [9] with more detailsin the supplemental material.) We define our viewpoint-aware structured loss function, Lview,l,τ (y, s), as
Ll,τ (y, s) =
l yl = −1 ∧ sl = +1
0 yl = −1 ∧ sl = −1
l yl = +1 ∧ overlap(yb, sb) < τ
0 yl = +1 ∧ overlap(yb, sb) ≥ τ(1)
Lview,l,τ (y, s) =
12 [l + Ll,τ (y, s)] yv 6= sv ∧ yv 6= ∅12Ll,τ (y, s) yv = sv ∧ yv 6= ∅Ll,τ (y, s) yv = ∅
(2)
where overlap(yb, sb) = ‖yb∩sb‖‖yb∪sb‖ . We use Lmargin(y, s) =
Lview,1,0.5(y, s) and Loutput(y, s) = Lview,∞,0.7(y, s).This formulation is similar in spirit to a model proposedby [20], but differs in that we do not encode the precisebounding box overlap in the loss function.
An alternative approach to training this viewpoint modelis to use a latent SVM (LSVM) as formulated in [5]. In orderto accommodate the viewpoint annotations, it is desirable toonly choose compatible latent variable assignments in the“relabel positive examples” step of the coordinate descentapproach. However, unlike the WL-SSVM formulation,this fails to apply a loss to true positive car detections withincorrect viewpoint classifications.
Non-maxima Suppression (NMS). We run the trained de-tector as a sliding window and threshold. We now take these
(possibly overlapping) detections, and create a final set ofdetections via NMS. As in [18], we greedily select the topscoring detection not yet selected or removed, then removeall other detections whose overlap with the selected detec-tion is greater than a threshold (we use a threshold of 0.3 onthe ratio of bounding box intersection area over union area).
5. Geographic Context Rescoring
Given that our dataset contains geographic context, suchas road boundaries and sidewalks, a natural question is howuseful this kind of geographic information is for recognitiontasks (e.g., in reducing false positive detections, or in improv-ing detected 3D vehicle pose estimates). We now describe amethod for utilizing this data as a “stage” on which we canreason about positions and orientations of objects.
Let (φ, λ) denote a (latitude, longitude) position on theEarth’s surface. We reason about both the world and detectedvehicles in this coordinate system. We define we(φ, λ) as theterrain elevation at (φ, λ); Wri as a single roadbed polygonwith traffic-direction vectors ~wdi(φ, λ) defined at each pointin the polygon (we model road intersections as overlappingpolygons, each with its own direction of travel); and Wr =∪iWri as the set of all roadbed surfaces.
For each 2D detection produced by our baseline detec-tor, we reason about its plausibility given the provided geo-graphic data. To do so, we convert the 2D detection into a setof hypothesis 3D car poses, each placed inside the physicalscene so as to fit the 2D bounding box. We parameterize a3D vehicle hypothesis as ~v = (vφ, vλ, vθ, ve) where (vφ, vλ)is the 2D ground position of the vehicle’s centroid, vθ is thevehicle heading, and ve is the elevation of the bottom of thevehicle. Let ~vf be the 2D vehicle footprint on the ground.We assume that the car is rotated only about the scene upvector, but do not assume the car is strictly resting on theground, in order to account for 2D localization error.
To generate a set of 3D hypotheses from a 2D detection,we begin with a small database of example 3D vehicle CADmodels of different types (e.g., sedans, SUVs, etc.), to ac-count for different possible shapes and sizes of the detectedvehicle. For each example 3D model, we place it in the scene
5
so that it matches (1) the viewpoint predicted by the detector,and (2) the 2D bounding box of the detection. The result isa set of 3D hypotheses, V = {~vk}. More details about thisplacement step are provided in the supplemental material.
For each 3D hypothesis ~v ∈ V , we rescore the detectionusing three geographic cues: an elevation score, an orienta-tion score, and a road coverage score. The elevation scorefavors detections that are close to the ground, the orientationscore encourages detections that have a plausible orientationgiven where it is on the road network (e.g., going the correctdirection down a one-way street), and the road coveragescore encourages detections that lie on the road. This ideais related to the scene-based reasoning of Hoiem, et al. [15],but using known geographic data.
The elevation score SE is defined in terms the height ofthe 3D car’s wheels above the ground:
SE(~v) = exp
[− (ve − we(vφ, vλ))2
2σ2e
](3)
We use σe = 0.5 in our work.Next, using roadbed polygons from our geographic data,
we compute the percentage of the car’s footprint ~vf thatintersects the roadbed. This is our road coverage score, SC .
SC(~v) =‖~vf ∩Wr‖‖~vf‖
(4)
Finally, we find the roadbed polygons that the car’s foot-print intersects, along with their associated directions oftravel. (The car might overlap with multiple road polygonsif it is in an intersection.) Among these possible local di-rections of travel, we find the one that most closely agreeswith the car’s predicted orientation and penalize deviationsfrom this orientation. Because our detector produces dis-cretized orientations, we penalize based on whether the road-predicted orientation falls within the same bin as the vehicle:
∆d = mindi
arccos(~vd · ~wdi(vφ, vλ)) (5)
SO(~v) =
1.0 ∆d <
w2
0.5 w2 ≤ ∆d <
3w2
0.0 3w2 ≤ ∆d
(6)
where w is the viewpoint bin width (22.5 degrees in the caseof our 16 bin detector). This is the orientation score.
In order to calibrate the DPM detector output to be com-patible with the rest of our pipeline, we turn raw detec-tion scores into scores between 0 and 1 using Platt calibra-tion [21] with VOC2007 test as the validation set. The finaldetection score, S(~v) is defined as
S(~v) = SE(~v)SC(~v)SO(~v)SV (~v) (7)
where the visual score, SV (~v), is the posterior of the DPMdetection. These rescored detections are then fed into theNMS procedure to produce a set of output detections.
6. Experiments and Results
In our experiments we use the widely employed VOCoverlap criterion to evaluate detections. A detection is con-sidered a true positive if ‖sb∩gtb‖
‖sb∪gtb‖ ≥ 0.5 where sb is thepredicted bounding box as in Section 4 and gtb is the groundtruth 2D bounding box. Only the first overlapping boundingbox is considered a true positive. We also evaluate accu-racy in recognizing viewpoint; we use orientation-similarity(OS), presented in [7] as a way to evaluate orientation esti-mation. OS can be thought of as a precision weighted by anormalized cosine similarity between detection and annota-tion poses, and is therefore bounded above by precision.
6.1. Baseline Detectors
To get a sense for how NYC3DCars compares to es-tablished datasets in terms of difficulty, we begin by eval-uating a set of DPM training methods applied to differ-ent combinations of datasets, including NYC3DCars train-TimesSquare, KITTI train, and VOC2007 train+val. Weextended voc-release5 [8] software package for all experi-ments. We compare three models: (a) a 6-component, un-supervised mixture model with left-right mirroring, (b) a16-component viewpoint-aware detector using the LSVMwith Loutput(y, s) to restrict the set of valid latent variableassignments, and (c) a 16-component viewpoint-aware detec-tor using the WL-SSVM with both Lmargin and Loutput. For(a), we provide all positive examples during initialization,but for the viewpoint-aware DPMs ((b) and (c)) we provideonly viewpoint-annotated examples during initialization andthen introduce other examples, if applicable, after the mix-ture model has been built. The same negative training set isused for all models, VOC2007 train+val car-free images, soas to focus on comparing positive training sets and models.
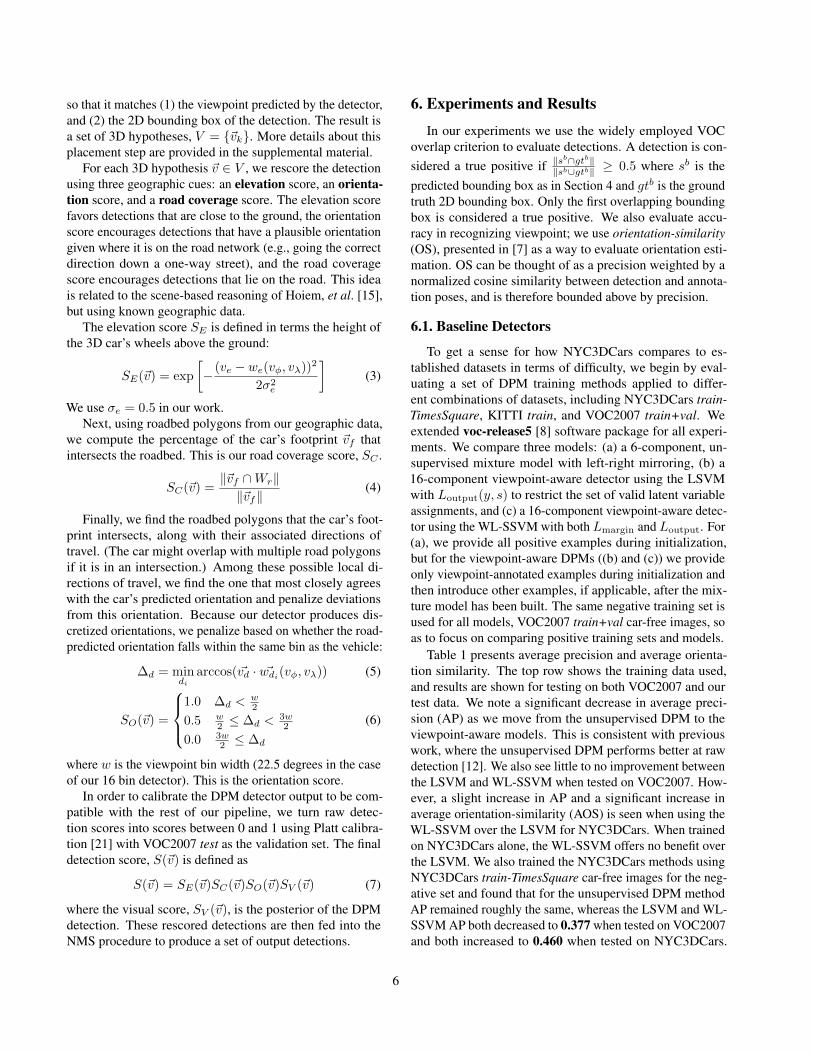
Table 1 presents average precision and average orienta-tion similarity. The top row shows the training data used,and results are shown for testing on both VOC2007 and ourtest data. We note a significant decrease in average preci-sion (AP) as we move from the unsupervised DPM to theviewpoint-aware models. This is consistent with previouswork, where the unsupervised DPM performs better at rawdetection [12]. We also see little to no improvement betweenthe LSVM and WL-SSVM when tested on VOC2007. How-ever, a slight increase in AP and a significant increase inaverage orientation-similarity (AOS) is seen when using theWL-SSVM over the LSVM for NYC3DCars. When trainedon NYC3DCars alone, the WL-SSVM offers no benefit overthe LSVM. We also trained the NYC3DCars methods usingNYC3DCars train-TimesSquare car-free images for the neg-ative set and found that for the unsupervised DPM methodAP remained roughly the same, whereas the LSVM and WL-SSVM AP both decreased to 0.377 when tested on VOC2007and both increased to 0.460 when tested on NYC3DCars.
6
KITTI VOC2007+KITTI NYC3DCars VOC2007+KITTI+NYC3DCars[5] VP LSVM VP WL- SSVM [5] VP LSVM VP WL- SSVM [5] VP LSVM VP WL- SSVM [5] VP LSVM VP WL- SSVM
VOC2007 0.420 0.404 0.406 0.532 0.474 0.481 0.426 0.381 0.381 0.516 0.482 0.487NYC3DCars 0.395 0.371/0.302 0.378/0.338 0.456 0.406/0.324 0.413/0.372 0.511 0.450/0.416 0.450/0.417 0.513 0.448/0.389 0.455/0.426
Table 1. Average precision (AP) and average orientation similarity (AOS) for several training methods and positive training sets (top)evaluated on two test sets (left). For methods or test sets that do not provide viewpoint predictions, only AP is shown. Otherwise, both APand AOS are shown (as AP/AOS).
0.0 0.1 0.2 0.3 0.4 0.5 0.6 0.7 0.8 0.9 1.00.0
0.1
0.2
0.3
0.4
0.5
0.6
0.7
0.8
0.9
1.0
Pre
cisi
on
Recall
SESV 0.485
SCSV 0.457
0.455SCSOSESV
SOSV
SV
0.487
0.465
0.0 0.1 0.2 0.3 0.4 0.5 0.6 0.7 0.8 0.9 1.00.0
0.1
0.2
0.3
0.4
0.5
0.6
0.7
0.8
0.9
1.0
Orie
ntat
ion
Sim
ilarit
y
Recall
SESV 0.446
SCSV 0.427
0.426SCSOSESV
SOSV
SV
0.483
0.461
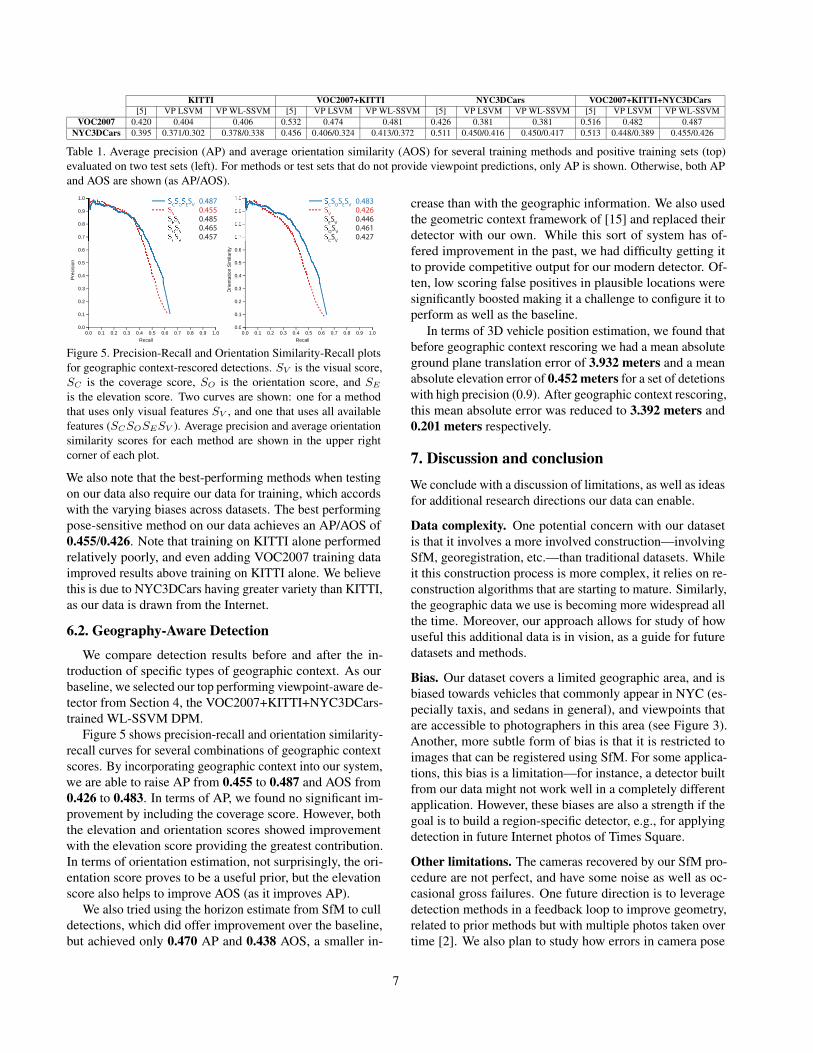
Figure 5. Precision- Recall and Orientation Similarity- Recall plotsfor geographic context- rescored detections. SV is the visual score,SC is the coverage score, SO is the orientation score, and SE
is the elevation score. Two curves are shown: one for a methodthat uses only visual features SV , and one that uses all availablefeatures (SCSOSESV ). Average precision and average orientationsimilarity scores for each method are shown in the upper rightcorner of each plot.
We also note that the best- performing methods when testingon our data also require our data for training, which accordswith the varying biases across datasets. The best performingpose- sensitive method on our data achieves an AP/AOS of0.455/0.426. Note that training on KITTI alone performedrelatively poorly, and even adding VOC2007 training dataimproved results above training on KITTI alone. We believethis is due to NYC3DCars having greater variety than KITTI,as our data is drawn from the Internet.
6.2. Geography-Aware Detection
We compare detection results before and after the in-troduction of specific types of geographic context. As ourbaseline, we selected our top performing viewpoint- aware de-tector from Section 4, the VOC2007+KITTI+NYC3DCars-trained WL- SSVM DPM.
Figure 5 shows precision- recall and orientation similarity-recall curves for several combinations of geographic contextscores. By incorporating geographic context into our system,we are able to raise AP from 0.455 to 0.487 and AOS from0.426 to 0.483. In terms of AP, we found no significant im-provement by including the coverage score. However, boththe elevation and orientation scores showed improvementwith the elevation score providing the greatest contribution.In terms of orientation estimation, not surprisingly, the ori-entation score proves to be a useful prior, but the elevationscore also helps to improve AOS (as it improves AP).
We also tried using the horizon estimate from SfM to culldetections, which did offer improvement over the baseline,but achieved only 0.470 AP and 0.438 AOS, a smaller in-
crease than with the geographic information. We also usedthe geometric context framework of [15] and replaced theirdetector with our own. While this sort of system has of-fered improvement in the past, we had difficulty getting itto provide competitive output for our modern detector. Of-ten, low scoring false positives in plausible locations weresignificantly boosted making it a challenge to configure it toperform as well as the baseline.
In terms of 3D vehicle position estimation, we found thatbefore geographic context rescoring we had a mean absoluteground plane translation error of 3.932 meters and a meanabsolute elevation error of 0.452 meters for a set of detetionswith high precision (0.9). After geographic context rescoring,this mean absolute error was reduced to 3.392 meters and0.201 meters respectively.
7. Discussion and conclusionWe conclude with a discussion of limitations, as well as ideasfor additional research directions our data can enable.
Data complexity. One potential concern with our datasetis that it involves a more involved construction—involvingSfM, georegistration, etc.—than traditional datasets. Whileit this construction process is more complex, it relies on re-construction algorithms that are starting to mature. Similarly,the geographic data we use is becoming more widespread allthe time. Moreover, our approach allows for study of howuseful this additional data is in vision, as a guide for futuredatasets and methods.
Bias. Our dataset covers a limited geographic area, and isbiased towards vehicles that commonly appear in NYC (es-pecially taxis, and sedans in general), and viewpoints thatare accessible to photographers in this area (see Figure 3).Another, more subtle form of bias is that it is restricted toimages that can be registered using SfM. For some applica-tions, this bias is a limitation—for instance, a detector builtfrom our data might not work well in a completely differentapplication. However, these biases are also a strength if thegoal is to build a region- specific detector, e.g., for applyingdetection in future Internet photos of Times Square.
Other limitations. The cameras recovered by our SfM pro-cedure are not perfect, and have some noise as well as oc-casional gross failures. One future direction is to leveragedetection methods in a feedback loop to improve geometry,related to prior methods but with multiple photos taken overtime [2]. We also plan to study how errors in camera pose
7

Figure 6. Vehicle-vehicle occlusions. Left: User annotations.Right: Visibility masks. Inset: Occlusion map for one annota-tion (red: unoccluded; white: occluded.)
affect detection results. Currently, our dataset only containscars; in the future, we plan to also annotate pedestrians andservice vehicles (e.g., firetrucks). Finally, our annotationtool assumes that objects are supported by a ground plane.This assumption could be relaxed (so that it could handlehilly areas) by incorporating open source terrain models.
Future directions. We present initial experiments thatleverage our data for pose- sensitive vehicle detection, withpromising results. However, we believe that our dataset en-ables rich areas for future study; we describe a few ideashere. First, one could use our data, along with multi- viewstereo methods, to build a detailed model of the background,and use this in a detection method to predict backgroundappearance. Second, because our dataset is inherently 3D, itallows for reasoning about 3D relationships of objects. Forinstance, it could drive new non- maxima suppression meth-ods that reason about object overlap in 3D (world- space)rather than 2D (image- space), or methods that explicitly rea-son about occlusions between 3D objects placed in the scene.Our data also can be used to created detailed vehicle- vehicleocclusion maps as shown in Figure 6. These maps could beused to learn common patterns for occlusion, for instanceby extending mixture models to model occluded parts [9].Finally, a longer- term application of our method is in usingInternet photos as a source of data for traffic prediction andother problems in urban understanding. For instance, onecould imagine tracking taxis through NYC by applying ourmethods continuously to Internet photos uploaded over time.
Acknowledgements. This work was supported in part by theNational Science Foundation under grant NSF- 0931686, andby grants from the Intel Science and Technology Center forVisual Computing and Amazon Web Services in Education.
References[1] S. Agarwal, N. Snavely, I. Simon, S. M. Seitz, and R. Szeliski.
Building Rome in a day. In ICCV, 2009.[2] S. Bao, M. Bagra, Y.- W. Chao, and S. Savarese. Semantic
structure from motion with points, regions, and objects. InCVPR, 2012.
[3] N. Cornelis, B. Leibe, K. Cornelis, and L. J. V. Gool. 3D urbanscene modeling integrating recognition and reconstruction.IJCV, 78(2- 3):121–141, 2008.
[4] M. Everingham, L. Van Gool, C. K. I. Williams, J. Winn,and A. Zisserman. The pascal visual object classes (VOC)challenge. IJCV, 88(2):303–338, June 2010.
[5] P. F. Felzenszwalb, R. B. Girshick, D. McAllester, and D. Ra-manan. Object detection with discriminatively trained part-based models. PAMI, 32, 2010.
[6] D. F. Fouhey, V. Delaitre, A. Gupta, A. A. Efros, I. Laptev,and J. Sivic. People watching: Human actions as a cue forsingle- view geometry. In ECCV, 2012.
[7] A. Geiger, P. Lenz, and R. Urtasun. Are we ready for au-tonomous driving? the KITTI vision benchmark suite. InCVPR, 2012.
[8] R. B. Girshick, P. F. Felzenszwalb, and D. McAllester. Dis-criminatively trained deformable part models, release 5.http://people.cs.uchicago.edu/˜rbg/latent- release5/.
[9] R. B. Girshick, P. F. Felzenszwalb, and D. A. McAllester.Object detection with grammar models. In NIPS, 2011.
[10] D. Glasner, M. Galun, S. Alpert, R. Basri, andG. Shakhnarovich. Viewpoint- aware object detection andpose estimation. In ICCV, 2011.
[11] J. Hays and A. Efros. IM2GPS: Estimating geographic infor-mation from a single image. In CVPR, 2008.
[12] V. Hedau, D. Hoiem, and D. A. Forsyth. Thinking inside thebox: Using appearance models and context based on roomgeometry. In CVPR, 2010.
[13] M. Hejrati and D. Ramanan. Analyzing 3d objects in clutteredimages. In NIPS, 2012.
[14] D. Hoiem, A. Efros, and M. Hebert. Geometric context froma single image. In ICCV, 2005.
[15] D. Hoiem, A. Efros, and M. Hebert. Putting objects in per-spective. In CVPR, 2006.
[16] Y. Li, N. Snavely, D. Huttenlocher, and P. Fua. Worldwidepose estimation using 3D point clouds. In ECCV, 2012.
[17] J. Little, A. Abrams, and R. Pless. Tools for richer crowdsource image annotations. In WACV, 2012.
[18] T. Malisiewicz, A. Gupta, and A. Efros. Ensemble ofexemplar- SVMs for object detection and beyond. In ICCV,2011.
[19] M. Ozuysal, V. Lepetit, and P. Fua. Pose estimation forcategory specific multiview object localization. In CVPR,2009.
[20] B. Pepik, M. Stark, P. Gehler, and B. Schiele. Teaching 3Dgeometry to deformable part models. In CVPR, 2012.
[21] J. C. Platt. Probabilistic outputs for support vector machinesand comparisons to regularized likelihood methods. In Ad-vances in Large Margin Classifiers. MIT Press, 1999.
[22] B. C. Russell, A. Torralba, K. P. Murphy, and W. T. Free-man. LabelMe: A database and web- based tool for imageannotation. IJCV, 77(1- 3), 2008.
[23] S. Savarese and L. Fei- Fei. 3D generic object categorization,localization and pose estimation. In ICCV, 2007.
[24] M. Sun, S. Y.- Z. Bao, and S. Savarese. Object detection usinggeometrical context feedback. IJCV, 100(2), 2012.
8
Related Documents