Understanding Child Injury Deaths from the New York City Child Fatality Review Advisory Team 2013 Report

Welcome message from author
This document is posted to help you gain knowledge. Please leave a comment to let me know what you think about it! Share it to your friends and learn new things together.
Transcript
Understanding Child Injury Deaths
from theNew York City Child Fatality Review Advisory Team
2013
Rep
ort
NEW YORK CITY CHILD FATALITY REVIEW ADVISORY TEAM
AppointeesGary Butts, MD — Icahn School of Medicine at Mount SinaiTosan Oruwariye, MD — Morris Heights Health CenterMary Pulido, PhD — The New York Society for the
Prevention of Cruelty to ChildrenLisa White, LMSW — Bronx Lebanon Hospital CenterMark Woltman, MSW — New Alternatives for Children
Acknowledgments
Joan M. Bush, MS, Lorraine Boyd, MD, Tracy Chu, PhD,
MPH, Arthur Cooper, MD, Gretchen Culp, MS, Lawrence
Fung, MPH, Danielle Greene, DrPH, MPH, Tamisha F.
Johnson, MD, MPH, Joseph Kennedy, MPH, Ann Madsen,
PhD, MPH, Catherine Stayton, DrPH, MPH
Suggested Citation
Spira-Cohen A, Marcum J, Seil K, Fortin P, Caffarelli A. 2013
Report From the New York City Fatality Review Advisory
Team: Understanding Child Injury Deaths. New York City
Department of Health and Mental Hygiene: February 2014.
Summary of Key Findings ................................................................................................................................................................. 1
Glossary ..................................................................................................................................................................................................... 3
Introduction ............................................................................................................................................................................................ 4
Methods .................................................................................................................................................................................................... 5
Results ....................................................................................................................................................................................................... 6
Children and Youth Aged 0 to 17 ......................................................................................................................................... 6
Injury Deaths by Age Group ................................................................................................................................................... 10
Infants ................................................................................................................................................................................ 10
Children Aged 1 to 4 .................................................................................................................................................... 13
Children Aged 5 to 9 .................................................................................................................................................... 16
Children Aged 10 to 14 ............................................................................................................................................... 18
Youth Aged 15 to 17 .................................................................................................................................................... 20
Recommendations ................................................................................................................................................................................ 24
Appendix of Supplemental Data .................................................................................................................................................... 26
Technical Appendix ............................................................................................................................................................................. 30
Table of Contents
Cover photos (clockwise from top right): ©iStock.com/mocker_bat; ©iStock.com/andipantz; ©iStock.com/AlterYourReality; ©iStock.com/LindaYolanda; ©iStock.com/kali9
City Agency Representatives
Department of Health and Mental HygieneNancy Clark, MA, CIH, CSP (Acting Chair)
Staff: Ariel Spira-Cohen, PhD
Jennifer Marcum, DrPH, MS
Kacie Seil, MPH
Princess Fortin, MPH
Anna Caffarelli, MHS
Administration for Children’s Services Noreen Mulvanerty
Department of EducationCheryl Hall
Department of Homeless ServicesDova Marder, MD
Department of TransportationMarjorie Marciano
Office of Chief Medical ExaminerMonica Smiddy, MD, MPH
Kristen Landi, MD
Leze Nicaj, MPH
New York City Police DepartmentMichael Osgood
2013 New York City Child Fatality Report | 1
Summary of Key Findings
Children and Youth Aged 0 to 17
In New York City (NYC), injury is the second leading cause of death among children and youth aged
0 to 17, following perinatal conditions, and the leading cause of death among children and youth
aged 1 to 17.
• From 2002 through 2011, an annual average of 161 injury deaths occurred among children
and youth aged 0 to 17.
• A total of 1,613 children and youth aged 0 to 17 died from an injury-related cause during
this ten-year time period.
• Infants less than one year old and youth aged 15 to 17 bore the highest burden of injury
deaths among children and youth aged 0 to 17 (50.3 deaths per 100,000 infants; 16.1 deaths
per 100,000 youth).
• Though injury is the second leading cause of death among children and youth aged 0 to 17 in
NYC, the City’s child injury death rate is 39% lower than that of the United States (US)
(8.9 deaths per 100,000 NYC children vs 14.6 deaths per 100,000 US children).
Infants
The majority of infant injury deaths in NYC were sleep-related, defined as deaths in which the infant
was asleep when last seen alive (80%, n=386 out of 480 infant injury deaths, 2004 to 2011).
• Between 2004 and 2011, an average of 48 infants died every year from a sleep-related injury
at a rate of 38.5 deaths per 100,000 live births.
• Infants between 28 days and 4 months old, black non-Hispanic infants, babies born pre-term,
and babies born to adolescent mothers were at higher risk for sleep-related death than other
infants.
• Common environmental factors found in sleep-related infant deaths included: sleeping in an
adult bed, excessive bedding, sharing a bed with another sleeper, and sleep positions other
than on the infant’s back.
• Overall infant injury death rates were highest for black non-Hispanic infants, infants living in
the Bronx, and infants living in very-high-poverty neighborhoods.
Children Aged 1 to 4
Fire/flame injury was the leading cause of injury death among NYC children aged 1 to 4. NYC’s
fire/flame injury death rate for children aged 1 to 4 was 23% lower than the national rate (1.0 vs
1.3 per 100,000).
• From 2002 through 2011, 40 NYC children aged 1 to 4 died from a fire/flame injury at a rate
of 1.0 death per 100,000.
• Most of the child fire/flame deaths in this age group were among children 1 and 2 years old,
and three-quarters (75%) of these deaths were unintentional.
• Ninety-three percent of fire/flame deaths among this age group from 2001 through 2010
occurred in the home of the child.
• In more than half of fire deaths in 2001-2010 (53%), a smoke detector was not present, or
was present but was not operational.
2 | 2013 New York City Child Fatality Report
• Overall child injury death rates in this age group were highest for boys, black non-Hispanic
children, children living in Staten Island and Brooklyn, and children living in high- and very-
high-poverty neighborhoods.
Children Aged 5 to 9
Motor vehicle-related injury was the leading cause of injury death among children aged 5 to 9 both
nationally and in NYC. The rate for NYC was 64% lower than the national rate (0.9 vs 2.5 per
100,000).
• From 2002 through 2011, 44 NYC children aged 5 to 9 died from a motor vehicle-related
injury, at a rate of 0.9 deaths per 100,000.
• Four out of every five (80%) NYC children fatally injured in a motor vehicle incident among
this age group were pedestrians.
• Emerging from between parked vehicles was a key contributing factor in child pedestrian
deaths.
• Overall child injury death rates in this age group were highest for boys, black non-Hispanic
children, children living in Brooklyn, and children living in high- and very-high-poverty
neighborhoods.
Children Aged 10 to 14
The leading cause of injury death among children aged 10 to 14 was motor vehicle-related injury
both nationally and in NYC. The rate for NYC was 68% lower than the national rate (1.1 vs 3.4 per
100,000).
• From 2002 through 2011, 57 NYC children aged 10 to 14 died as a result of a motor vehicle-
related injury.
• Two-thirds (68%) of NYC children fatally injured in a motor vehicle incident in this age
group were pedestrians.
• Emerging from between parked vehicles and crossing against the light were key contributing
factors to child pedestrian deaths among this age group.
• Overall injury death rates in this age group were highest for boys, black non-Hispanic
children, children living in Brooklyn and Staten Island, and children living in very-high-
poverty neighborhoods.
Youth Aged 15 to 17
Firearm-related injury was the leading cause of injury death among NYC youth aged 15 to 17; the
NYC rate was 20% lower than the national rate (6.5 vs 8.1 per 100,000).
• From 2002 through 2011, 200 NYC youth aged 15 to 17 died from a firearm-related injury.
• Nine out of every ten firearm-related youth deaths in NYC (91%) were homicides, compared
with 64% nationwide.
• The NYC youth firearm homicide rate was higher than the national rate (5.9 vs 5.2 deaths
per 100,000 youth), but was less than half the average rate among other populous urban
areas (5.9 vs 12.4 deaths per 100,000 youth).
• Overall injury death rates in this age group were highest for male youth, black non-Hispanic
youth, youth living in the Bronx, and youth from very-high-poverty neighborhoods.

2013 New York City Child Fatality Report | 3
Cause of death – The illness, disease or injury responsible for the death. Examples of natural
causes include heart defects, asthma and cancer. Examples of injury-related causes include
blunt impact, burns and drowning. In this report, cause of death is used interchangeably with
“mechanism.”
Firearm-related death – Death caused by an injury resulting from the penetrating force of a
bullet or other projectile shot from a powder-charged gun.
Fire/flame death – Death caused by injury from severe exposure to flames or heat that leads
to tissue damage or from smoke inhalation to the upper airway, lower airway, or lungs.
Homicide – Death resulting from injuries inflicted by another person with the intent to cause
fear, harm, or death.
Infant – A child younger than one year (from birth up to 12 months).
Intentional injury – Injury resulting from the intentional use of force or purposeful action
against oneself or others. Intentional injuries include interpersonal acts of violence intended to
cause harm, criminal negligence or neglect (eg, homicide), and self-directed behavior with an
intent to kill oneself (eg, suicide).
Manner of death – The circumstances of the death as determined by postmortem examination,
death scene investigation, police reports, medical records, or other reports. Manner of death
categories include: natural, accident (eg, unintentional), homicide (eg, intentional), suicide (eg,
intentional), therapeutic complication, and undetermined. In this report, manner is used
interchangeably with “intent” or “type.”
Motor vehicle-related death – Death caused by injuries from a motor-vehicle incident,
including injuries to motor vehicle occupant(s), pedestrian(s), pedal cyclist(s), or other person.
Sleep-related injury death – A unique grouping of infant injury deaths inclusive of select
injury causes (unintentional suffocation in bed, unspecified threat to breathing, and
undetermined causes) in which the infant was last known to be asleep when last seen alive (see
Technical Appendix).
Suffocation death – Death resulting from inhalation, aspiration, or ingestion of food or other
object that blocks the airway or causes suffocation; intentional or accidental mechanical
suffocation, including hanging, strangulation or lack of air in a closed place.
Suicide – Death from intentional, self-directed behavior with an intent to die as a result of that
behavior.
Undetermined – The classification of a death when all available information is insufficient to
determine manner of death. In some cases, both cause and manner of death may remain
undetermined.
Unintentional injury – Injury that occurred without intent to harm or cause death; an injury
not intended to happen. Also called an “accident.”
Glossary

4 | 2013 New York City Child Fatality Report
Introduction
Injuries are a leading cause of death among children in New York City (NYC) and in
the United States (US). Injuries are often inaccurately seen as a result of incidents that
cannot be anticipated or avoided. However, most injuries follow patterns, many
related to age, sex, and other factors, that can be predicted and prevented. Raising
awareness of the patterns, educating communities about the risks, and enacting
policies designed to protect children can influence the circumstances that lead to fatal
injuries and reduce their occurrence.
The New York City Child Fatality Review Advisory Team (CFRAT) – a
multidisciplinary committee of representatives from city agencies as well as child
welfare and medical experts appointed by the Mayor, the City Council Speaker, and
the Public Advocate – was formed in 2006 by Local Law 115 to review and report on
injuries as preventable causes of death among NYC children under the age of 13.
This report presents data from a CFRAT ten-year retrospective review of fatal injuries
among children and youth aged 0 through 17. It examines a broad age range in order
to more fully describe the impact of fatal injuries on children and youth in New York
City. The report describes unintentional (“accidental”) injuries, intentional injuries
(homicide and suicide), and injuries of undetermined intent, and focuses on the injury
mechanisms (or causes) that are most common in each age group, such as motor
vehicle-related or fire-related injuries. For most of this report, the causes of injury are
described regardless of intent. Many injuries can be prevented through environmental
interventions that lower injury risk regardless of the intent of the incident. The report
also offers recommendations to help prevent future child injuries.

2013 New York City Child Fatality Report | 5
Methods
Death certificates maintained by the NYC Department of Health and Mental Hygiene’s
(DOHMH’s) Bureau of Vital Statistics were the primary data source used to identify and
describe fatal injuries among children and youth aged 0 to 17 years. Deaths were
identified using the International Classification of Disease Code, Version 10 (ICD-10),
which divides natural and unnatural causes of death. This report uses the following
overarching nomenclature to describe the intent of actions that lead to injury deaths:
• Unintentional – Injury death that occurred without intent to harm or cause death, also
called “accident.”
• Homicide – Intentional injury death resulting from injuries sustained through an act of
violence committed by another person with the intent to cause fear, harm, or death.
• Suicide – Intentional injury death resulting from self-directed behavior with an intent to
die as a result of that behavior.
• Undetermined – Injury death of unknown intent.
Data were abstracted from the death certificates for New York City residents aged 0 to
17 who died from 2002 through 2011. To augment death certificate information for
some leading causes of death, information from previously matched files from the NYC
Office of Chief Medical Examiner (OCME) for similar time periods were also included:
2004-2011 for infant deaths and 2001-2010 for children aged 1 to 4. OCME files contain
autopsy or external examination reports, toxicology and other postmortem special
studies, and police reports. Abstraction, using a form adapted from the National Center
for Child Death Review Case Report, and data analysis were conducted by members of
DOHMH's Bureau of Environmental Disease and Injury Prevention. Infant sleep-related
death information obtained from OCME files was abstracted by DOHMH’s Bureau of
Maternal, Infant and Reproductive Health for a subset of the years included in this report
(2004-2011) and includes a small proportion of non-resident infants who died in NYC.
Some OCME files could not be reviewed due to pending legal investigations and court
cases. Data regarding contributing factors for child pedestrian deaths were obtained
from the NYC Department of Transportation’s (DOT’s) Traffic Fatality Database.
Deaths due to therapeutic complications (death resulting from a medical or surgical
intervention while treating disease) are excluded in the main section of the report, but
are included in the Appendix of Supplemental Data. For all deaths, only de-identified
narrative and aggregate data were presented and discussed at quarterly CFRAT
meetings.
Lastly, the Technical Appendix contains more detailed information on terms and
calculation methods used throughout this report, as well as ICD-10 codes for specific
types of injuries.
6 | 2013 New York City Child Fatality Report
Children and Youth Aged 0 to 17
Injury Deaths Among Children and Youth Aged 0 to 17
From 2002 through 2011, a total of 9,007 deaths occurred among NYC children and
youth aged 0 to 17. Of these, 18% (n=1,613) were due to injuries, including from
incidents that were unintentional (“accidents”), intentional (suicide and homicide),
and of undetermined intent. Among all the causes of death in children and youth,
injury is the second leading cause among those aged 0 to 17, following perinatal
conditions, and the leading cause among those aged 1 to 17. At both the city and
national level, child injury death rates are higher than rates of other causes of death
such as cancer, congenital malformations, influenza/pneumonia/chronic respiratory
disease, and heart/cerebrovascular disease. The overall injury death rate in NYC for
children and youth aged 0 to 17 is 39% lower than the national average (8.9 vs 14.6
deaths per 100,000). Most of this difference can be attributed to NYC’s lower rates of
motor vehicle-related (1.19 vs 5.13 per 100,000 in NYC vs US), suffocation (1.19 vs
2.39 per 100,000 in NYC vs US), firearm (1.26 vs 1.94 per 100,000 in NYC vs US), and
drowning (0.23 vs 1.33 per 100,000 in NYC vs US) fatal injuries.
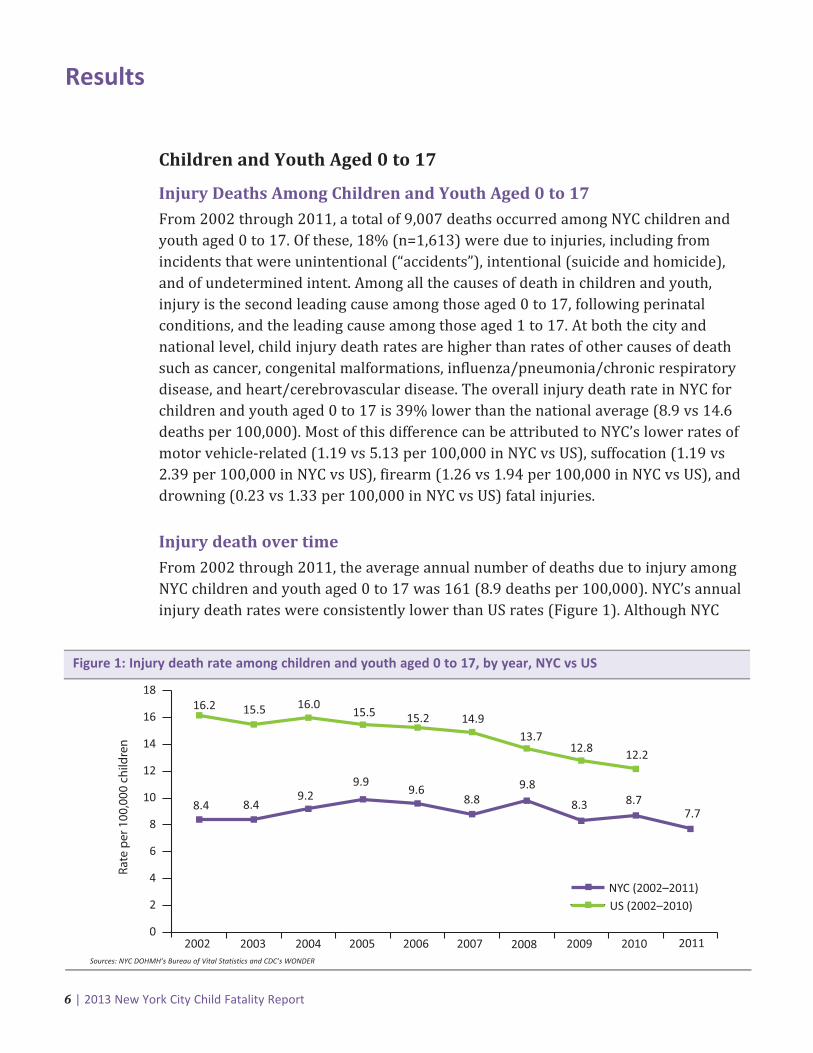
Injury death over time
From 2002 through 2011, the average annual number of deaths due to injury among
NYC children and youth aged 0 to 17 was 161 (8.9 deaths per 100,000). NYC’s annual
injury death rates were consistently lower than US rates (Figure 1). Although NYC
Results
NYC (2002–2011)US (2002–2010)
0
2
4
6
8
10
12
14
16
18
2002 2003 2004 2005 2006 2007 2008 2009 2010 2011
16.2 15.5 16.015.5 15.2 14.9
13.7
8.4 8.49.2
9.99.6
8.89.8
12.8 12.2
8.3 8.77.7
Rate
per
100
,000
chi
ldre
n
Sources: NYC DOHMH’s Bureau of Vital Statistics and CDC’s WONDER
Figure 1: Injury death rate among children and youth aged 0 to 17, by year, NYC vs US

2013 New York City Child Fatality Report | 7
fatal injuries among children and youth show a relatively stable trend, overall fatal
injury rates and cause-specific rates vary by age group. Differences by age and
mechanism (cause) of fatal injury are discussed in the following sections. While NYC’s
child injury death rate remains relatively stable and lower than the decreasing
national rate, it is of note that in 2011, NYC also experienced the lowest rate of child
injury deaths during the ten-year period covered in this report.
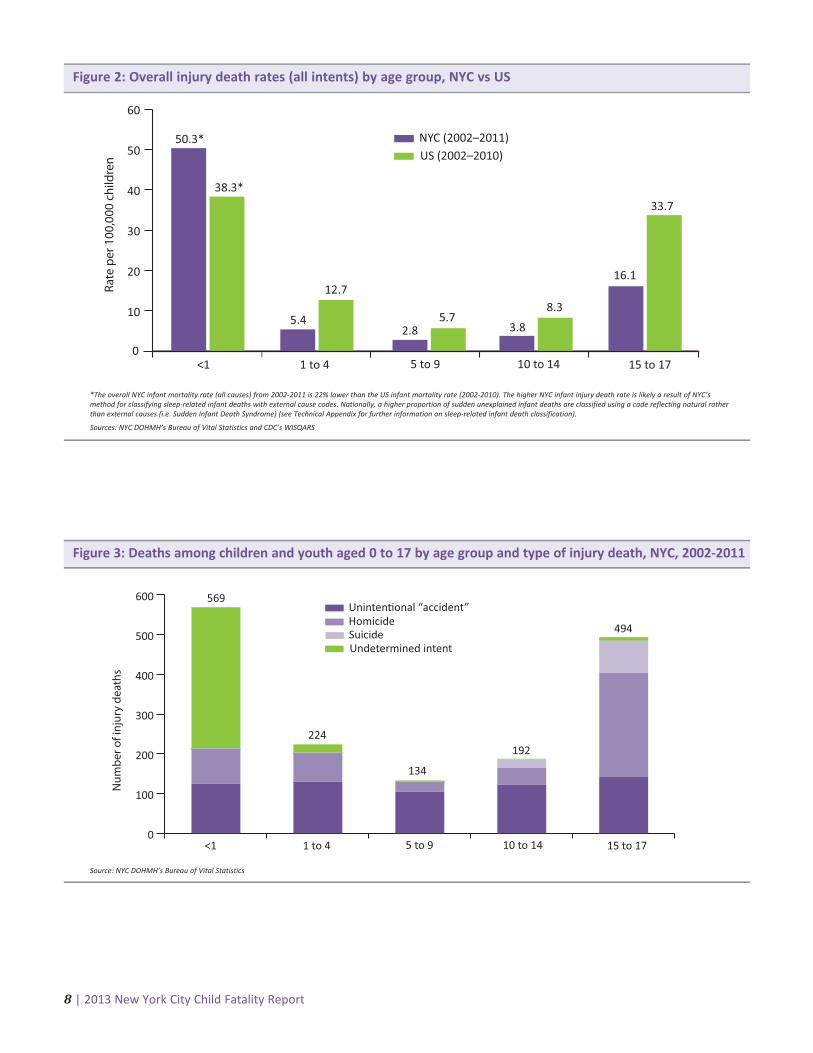
Injury deaths by age group
Rates of injury deaths among children vary by age group. Infants bore the highest
burden of injury deaths among all NYC children aged 17 years and younger, with a
total of 569 deaths during 2002-2011. The infant injury death rate in NYC was 30%
higher than the national rate (50.3 vs 38.8 deaths per 100,000 infants). In NYC, 224
children aged 1 to 4; 134 children aged 5 to 9; 192 children aged 10 to 14; and 494
youth aged 15 to 17 died from an injury during 2002-2011. Rates of injury deaths
nationally were at least double the NYC rate in each child age group, except among
infants (Figure 2). Differences in infant injury death rates in NYC and nationally may
be a function of how these deaths are classified (see Technical Appendix for how NYC
classifies sudden infant deaths).
The distribution of type of NYC child injury death varies by age group. Nearly two-
thirds (63%, n=356) of injury deaths among infants were of undetermined intent,
whereas unintentional injury made up the larger portion of deaths for children
between ages 1 and 14 years, ranging from 58% (n=130) to 78% (n=105) of injury
deaths (Figure 3). Data also show that youth aged 15 to 17 experienced a higher
burden of homicide deaths (53%, n=262) compared with other age groups.
Child injury deaths are declining
The injury death rate among US children and youth aged 0 to 17 steadily declined between2002−2010. This trend is largely driven by a reduction in motor vehicle-related deaths, whichmake up a large proportion of US child injury deaths; approximately one in every four US childinjury deaths is motor vehicle-related. The rate of motor vehicle-related deaths among USchildren and youth decreased 50% between 2002 (6.6 per 100,000) and 2010 (3.3 per 100,000).Similarly, the rate of motor vehicle-related deaths in NYC declined 56% between 2002 (1.6 per100,000) and 2011 (0.7 per 100,000). This decrease is not apparent in the overall injury deathtrend as motor vehicle-related deaths are a small proportion of child injury deaths in NYC.Approximately one in ten child injury deaths in NYC is motor vehicle-related.
8 | 2013 New York City Child Fatality Report8 | 2013 New York City Child Fatality Report
0
10
20
30
40
50
60
NYC (2002–2011)US (2002–2010)
50.3*
<1 1 to 4 5 to 9 10 to 14 15 to 17
38.3*
5.4
12.7
2.85.7
3.8
8.3
16.1
33.7
Rate
per
100
,000
chi
ldre
n
*The overall NYC infant mortality rate (all causes) from 2002-2011 is 22% lower than the US infant mortality rate (2002-2010). The higher NYC infant injury death rate is likely a result of NYC’smethod for classifying sleep-related infant deaths with external cause codes. Nationally, a higher proportion of sudden unexplained infant deaths are classified using a code reflecting natural ratherthan external causes (i.e. Sudden Infant Death Syndrome) (see Technical Appendix for further information on sleep-related infant death classification).
Sources: NYC DOHMH’s Bureau of Vital Statistics and CDC’s WISQARS
Figure 2: Overall injury death rates (all intents) by age group, NYC vs US
Uninten�onal “accident”
Undetermined intent
0
100
200
300
400
500
600
HomicideSuicide
<1 1 to 4 5 to 9 10 to 14 15 to 17
Num
ber o
f inj
ury
deat
hs
569
224
134
192
494
Source: NYC DOHMH’s Bureau of Vital Statistics
Figure 3: Deaths among children and youth aged 0 to 17 by age group and type of injury death, NYC, 2002-2011
2013 New York City Child Fatality Report | 9
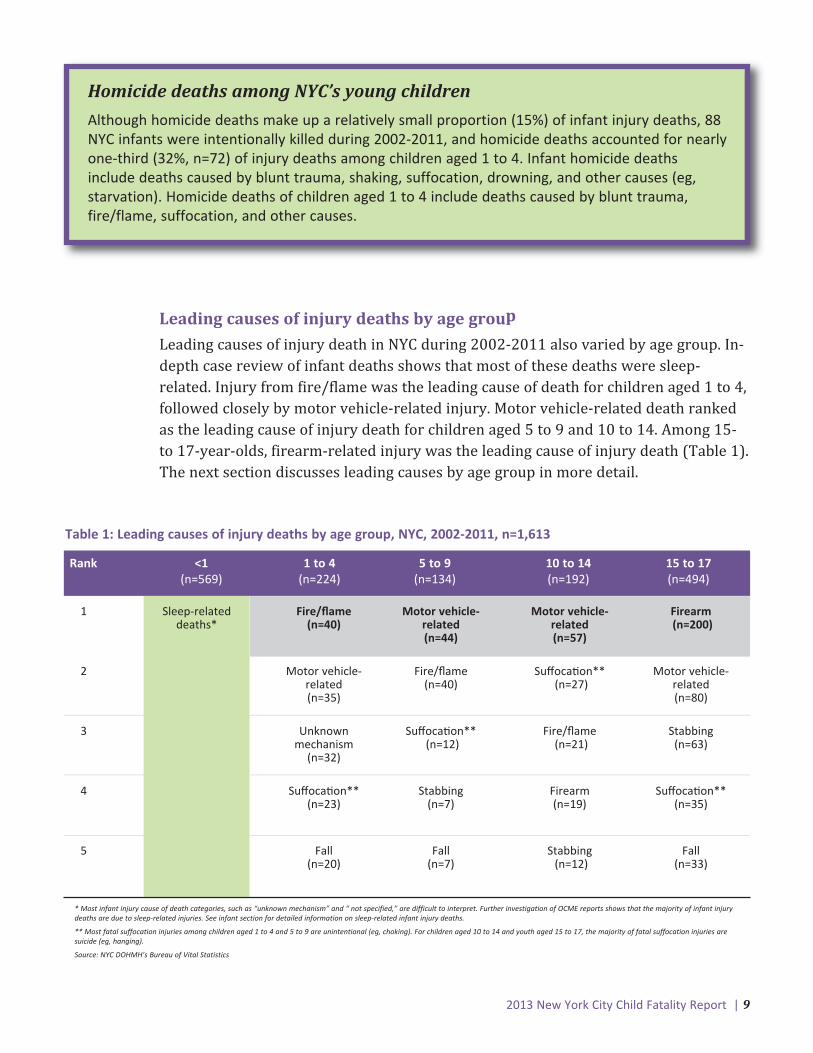
Homicide deaths among NYC’s young children
Although homicide deaths make up a relatively small proportion (15%) of infant injury deaths, 88NYC infants were intentionally killed during 2002-2011, and homicide deaths accounted for nearlyone-third (32%, n=72) of injury deaths among children aged 1 to 4. Infant homicide deathsinclude deaths caused by blunt trauma, shaking, suffocation, drowning, and other causes (eg,starvation). Homicide deaths of children aged 1 to 4 include deaths caused by blunt trauma,fire/flame, suffocation, and other causes.
Leading causes of injury deaths by age group
Leading causes of injury death in NYC during 2002-2011 also varied by age group. In-
depth case review of infant deaths shows that most of these deaths were sleep-
related. Injury from fire/flame was the leading cause of death for children aged 1 to 4,
followed closely by motor vehicle-related injury. Motor vehicle-related death ranked
as the leading cause of injury death for children aged 5 to 9 and 10 to 14. Among 15-
to 17-year-olds, firearm-related injury was the leading cause of injury death (Table 1).
The next section discusses leading causes by age group in more detail.
Table 1: Leading causes of injury deaths by age group, NYC, 2002-2011, n=1,613
* Most infant injury cause of death categories, such as “unknown mechanism” and “ not specified,” are difficult to interpret. Further investigation of OCME reports shows that the majority of infant injurydeaths are due to sleep-related injuries. See infant section for detailed information on sleep-related infant injury deaths.
** Most fatal suffocation injuries among children aged 1 to 4 and 5 to 9 are unintentional (eg, choking). For children aged 10 to 14 and youth aged 15 to 17, the majority of fatal suffocation injuries aresuicide (eg, hanging).
Source: NYC DOHMH’s Bureau of Vital Statistics
(see infantsection for
details)
Rank <1 1 to 4 5 to 9 10 to 14 15 to 17(n=569) (n=224) (n=134) (n=192) (n=494)
1 Sleep-related Fire/flame Motor vehicle- Motor vehicle- Firearmdeaths* (n=40) related related (n=200)
(n=44) (n=57)
2 Motor vehicle- Fire/flame Suffoca�on** Motor vehicle-related (n=40) (n=27) related(n=35) (n=80)
3 Unknown Suffoca�on** Fire/flame Stabbing mechanism (n=12) (n=21) (n=63)
(n=32)
4 Suffoca�on** Stabbing Firearm Suffoca�on** (n=23) (n=7) (n=19) (n=35)
5 Fall Fall Stabbing Fall(n=20) (n=7) (n=12) (n=33)

10 | 2013 New York City Child Fatality Report10 | 2013 New York City Child Fatality Report
Injury Deaths by Age Group
Infants
Demographics of injury deaths among infants
Male infants were at a slightly higher risk of injury death than females (56.4 vs 43.8
per 100,000). Black non-Hispanic infants were at greatest risk of injury death: the
rate for black non-Hispanic infants was more than triple the rate for infants of any
other racial or ethnic group (127.6 vs 35.2, 26.0, and 16.6 per 100,000 among
Hispanic, white non-Hispanic, and Asian and Pacific Islander infants, respectively).
Risk of injury death was greatest for infants living in the Bronx (70.3 per 100,000), as
well as for infants living in the highest poverty neighborhoods (72.4 per 100,000).
The death rate among infants living in NYC neighborhoods with very-high-poverty
(≥30% of the population below 100% of the Federal Poverty Level) was more than
three times the rate among infants in NYC neighborhoods with low-poverty (<10% of
the population below 100% of the Federal Poverty Level). The rate of injury death
among NYC infants increased with increasing neighborhood poverty level. (See
Technical Appendix for neighborhood poverty definitions.)
Sleep-related infant injury deaths, 2004-2011An in-depth case file review of OCME reports revealed that the majority (80%, n=386)
of the 480 infant injury deaths occurring during 2004-2011 were due to injuries
occurring in situations in which the infant was asleep when last seen alive. These
sleep-related deaths included accidental suffocation deaths, or cases of undetermined
cause and intent following exhaustive review by the medical examiner’s office (see
Technical Appendix for information on NYC’s inclusion criteria for sleep-related
infant injury deaths). During 2004-2011, the average annual number of sleep-related
infant injury deaths in NYC was 48, translating to a rate of 38.5 deaths per 100,000
live births. By comparison, infant deaths due to other types of injury combined (eg,
falling, drowning, poisoning) occurred at a rate of 10.8 deaths per 100,000 live births.

2013 New York City Child Fatality Report | 11
<28 days; 9%
28 days–4 months; 73%
5–12 months; 17%
Source: NYC DOHMH’s Bureau of Vital Statistics
Figure 4: Sleep-related infant injury deaths by age, NYC, 2004-2011, n=386
* Information on infant’s sleep position in the case file is based on reported information from the caregiver.� Moon, R. Y. (2011). SIDS and other sleep-related infant deaths: expansion of recommendations for a safe infant sleeping
environment. Pediatrics, 128(5), e1341-e1367.
Demographics of sleep-related infant injury deathsAlmost three-quarters (73%, n=283) of sleep-related infant injury deaths occurring
from 2004-2011 were among infants aged 28 days to 4 months (Figure 4). Death
rates from sleep-related injury were highest among black non-Hispanic infants,
followed by Hispanic, white non-Hispanic, and Asian and Pacific Islander infants
(95.3, 28.9, 16.0, and 10.5 deaths per 100,000 live births, respectively). Infants who
were delivered preterm (less than 37 weeks gestation) comprised 23% (n=89) of all
sleep-related injury deaths while pre-term deliveries accounted for only 9.7% of all
live births from 2004 through 2011. Infants born to adolescent mothers (less than 20
years old) were also disproportionately represented among the sleep-related infant
injury deaths: 15% (n=58) of these infants were born to adolescent mothers, as
compared with only 6.4% of all live births from 2004 through 2011. Selected
demographic characteristics are presented in detail in Table 7 of the Appendix.
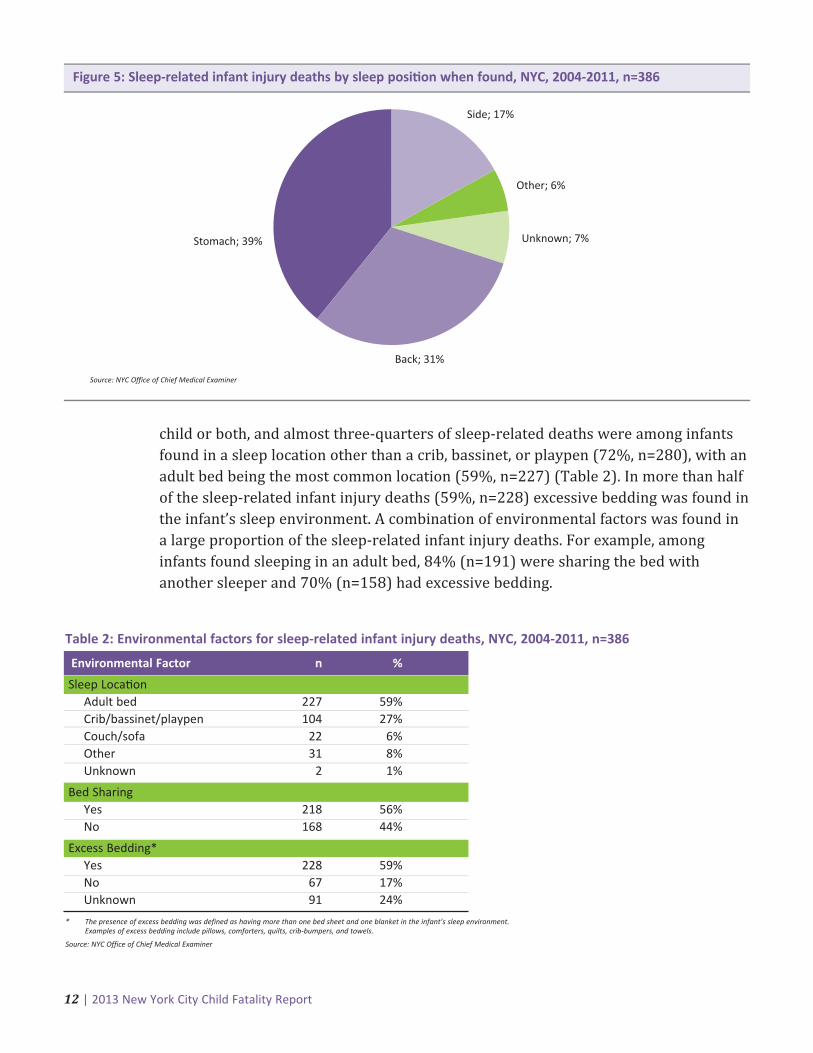
Sleep environmentUnsafe circumstances in which an infant died during sleep were revealed from the
case file review of these deaths. Of the 386 infant sleep-related injury deaths
occurring from 2004 through 2011 in NYC, less than one-third of these infants were
found lying on their backs (31%, n=119), the recommended sleep position for infants
(Figure 5).*,� More than half (56%, n=218) of the infants who died from a sleep-
related injury were sharing a bed (or other sleep surface) with an adult or another
12 | 2013 New York City Child Fatality Report
child or both, and almost three-quarters of sleep-related deaths were among infants
found in a sleep location other than a crib, bassinet, or playpen (72%, n=280), with an
adult bed being the most common location (59%, n=227) (Table 2). In more than half
of the sleep-related infant injury deaths (59%, n=228) excessive bedding was found in
the infant’s sleep environment. A combination of environmental factors was found in
a large proportion of the sleep-related infant injury deaths. For example, among
infants found sleeping in an adult bed, 84% (n=191) were sharing the bed with
another sleeper and 70% (n=158) had excessive bedding.
Unknown; 7%Stomach; 39%
Back; 31%
Other; 6%
Side; 17%
Source: NYC Office of Chief Medical Examiner
Figure 5: Sleep-related infant injury deaths by sleep posi�on when found, NYC, 2004-2011, n=386
Table 2: Environmental factors for sleep-related infant injury deaths, NYC, 2004-2011, n=386
* The presence of excess bedding was defined as having more than one bed sheet and one blanket in the infant’s sleep environment. Examples of excess bedding include pillows, comforters, quilts, crib-bumpers, and towels.
Source: NYC Office of Chief Medical Examiner
Environmental Factor n %
Sleep Loca�onAdult bed 227 59%Crib/bassinet/playpen 104 27%Couch/sofa 22 6%Other 31 8%Unknown 2 1%
Bed SharingYes 218 56%No 168 44%
Excess Bedding*Yes 228 59%No 67 17%Unknown 91 24%

2013 New York City Child Fatality Report | 13
Demographics of injury deaths among children aged 1 to 4Among children aged 1 to 4, black non-Hispanic children had the highest injury death
rate compared to NYC children of other racial and ethnic groups (Figure 6). Boys
were slightly more at risk for injury death than girls (6.0 vs 4.8 per 100,000). Children
living in Staten Island and in Brooklyn were more at risk (7.5 and 7.2 per 100,000,
respectively) than children living in other NYC boroughs. Approximately one-third
(34%) of NYC’s children aged 1 to 4 live in Brooklyn, while Brooklyn residents
comprise 45% (n=101) of injury deaths among NYC children in this age group. The
injury death rate among children living in high- and very-high-poverty neighborhoods
was more than double the rate among children living in low-poverty neighborhoods.
0
2
4
6
8
10
12
Rate
per
100
,000
chi
ldre
n ag
ed 1
-4
Male
4.8
Sex Race/Ethnicity Borough Neighborhood Poverty
6.0
10.9
2.6
7.5 7.2
2.9
6.4
5.1
2.8
4.03.7
6.0
3.6
6.4
Female
Black n
on-Hisp
anic
Hispan
icAsia
n
State
n Islan
d
Brookly
nBro
nx
Queens
Man
ha�an
Very High High
Medium Lo
w
White
non-Hisp
anic
Source: NYC DOHMH’s Bureau of Vital Statistics
Figure 6: Overall injury death rates among children aged 1 to 4 by sex, race/ethnicity, borough, andneighborhood poverty, NYC, 2002-2011, n=224
Children Aged 1 to 4

14 | 2013 New York City Child Fatality Report
Leading causes of injury deaths among children aged 1 to 4Injuries from fire/flame incidents and motor vehicle-related incidents were the
leading causes of injury death among NYC children aged 1 to 4. From 2002 through
2011, there were 40 fire/flame deaths among NYC children aged 1 to 4, translating to
a rate of 1.0 death per 100,000. NYC’s death rate from fire/flame injuries was 23%
lower than the national rate for this age group (1.0 vs 1.3 deaths per 100,000).
Nationally, fire/flame deaths ranked third after drowning and motor vehicle-related
deaths (3.0 and 2.8 deaths per 100,000, respectively).
From 2002 through 2011, there were 35 motor vehicle-related injury deaths resulting
in a rate of 0.8 deaths per 100,000 children aged 1 to 4. The rate of motor vehicle-
related death in NYC among those aged 1 to 4 was 71% lower than the national rate
(0.8 vs 2.8 deaths per 100,000).
Fire/flame deathsChildren 1 to 2 years old were at greatest risk of death caused by injuries from fire or
flame, and represented nearly three-quarters (73%, n=29) of all fire/flame deaths
among NYC children aged 1 to 4 during 2002-2011 (Figure 7). Three-quarters (75%,
n=30) of deaths caused by fire/flame injuries among NYC children aged 1 to 4 were
unintentional.
0
3
6
9
12
15
18
Num
ber
of d
eath
s
16
Age 1 Age 2 Age 3 Age 4
13
7
4
Source: NYC DOHMH’s Bureau of Vital Statistics
Figure 7: Fire deaths among children aged 1 to 4 by age, NYC, 2002-2011, n=40
2013 New York City Child Fatality Report | 15
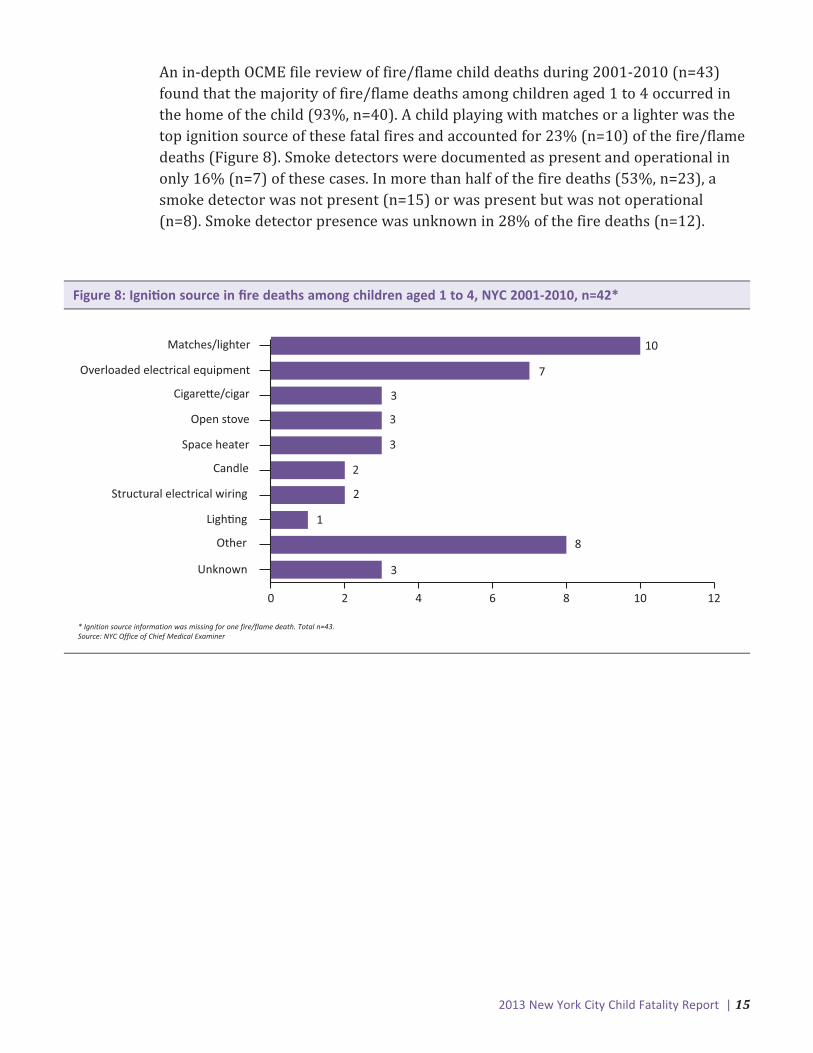
An in-depth OCME file review of fire/flame child deaths during 2001-2010 (n=43)
found that the majority of fire/flame deaths among children aged 1 to 4 occurred in
the home of the child (93%, n=40). A child playing with matches or a lighter was the
top ignition source of these fatal fires and accounted for 23% (n=10) of the fire/flame
deaths (Figure 8). Smoke detectors were documented as present and operational in
only 16% (n=7) of these cases. In more than half of the fire deaths (53%, n=23), a
smoke detector was not present (n=15) or was present but was not operational
(n=8). Smoke detector presence was unknown in 28% of the fire deaths (n=12).
0 2 4 6 8 10 12
Matches/lighter
Overloaded electrical equipment
Cigare�e/cigar
Open stove
Space heater
Candle
Structural electrical wiring
Ligh�ng
Other
Unknown
10
7
3
3
3
2
2
1
8
3
* Ignition source information was missing for one fire/flame death. Total n=43.Source: NYC Office of Chief Medical Examiner
Figure 8: Igni�on source in fire deaths among children aged 1 to 4, NYC 2001-2010, n=42*

16 | 2013 New York City Child Fatality Report
Demographics of injury deaths among children aged 5 to 9Among children aged 5 to 9, boys were more at risk of injury death than girls (3.2 vs
2.3 per 100,000, respectively). Black non-Hispanic children had the highest rate of
injury death in this age group (4.1 per 100,000), followed by white non-Hispanic (2.8
per 100,000), Hispanic (2.0 per 100,000), and Asian or Pacific Islander (1.9 per
100,000) children (Figure 9). Children living in Brooklyn were at higher risk (3.8 per
100,000) than children living in other NYC boroughs. The injury death rate among
children living in NYC’s high- and very-high-poverty neighborhoods was higher than
among children from medium- and low-poverty neighborhoods.
Children Aged 5 to 9
0.0
0.5
1.0
1.5
2.0
2.5
3.0
3.5
4.0
4.5
Rate
per
100
,000
chi
ldre
n ag
ed 5
-9
Male
2.3
Sex Race/Ethnicity Borough
3.2
4.1
1.9
3.8
3.0
1.6
3.1
2.4
1.8
2.8
2.0
2.9
2.0
3.6
Female
Brookly
n
State
n Islan
dBro
nx
Queens
Man
ha�an
Very High High
Medium Lo
w
Black n
on-Hisp
anic
Hispan
icAsia
n
White
non-Hisp
anic
Neighborhood Poverty
Source: NYC DOHMH’s Bureau of Vital Statistics
Figure 9: Overall injury death rates among children aged 5 to 9 by sex, race/ethnicity, borough, andneighborhood poverty, NYC, 2002-2011, n=134
2013 New York City Child Fatality Report | 17
Leading causes of injury deaths among children aged 5 to 9From 2002 through 2011, motor vehicle-related injury was the leading cause of injury
death among children aged 5 to 9 nationally and in NYC. The NYC rate (0.9 deaths per
100,000) was 64% lower than the national rate (2.5 per 100,000). Injury death
caused by a fire/flame ranked second among NYC children aged 5 to 9 (0.8 per
100,000), and was similar to the national rate (0.7 per 100,000). During 2002-2011,
motor vehicle-related deaths accounted for a total of 44 deaths of NYC children aged
5 to 9, and fire/flame incidents caused 40 deaths among NYC children of the same
age.
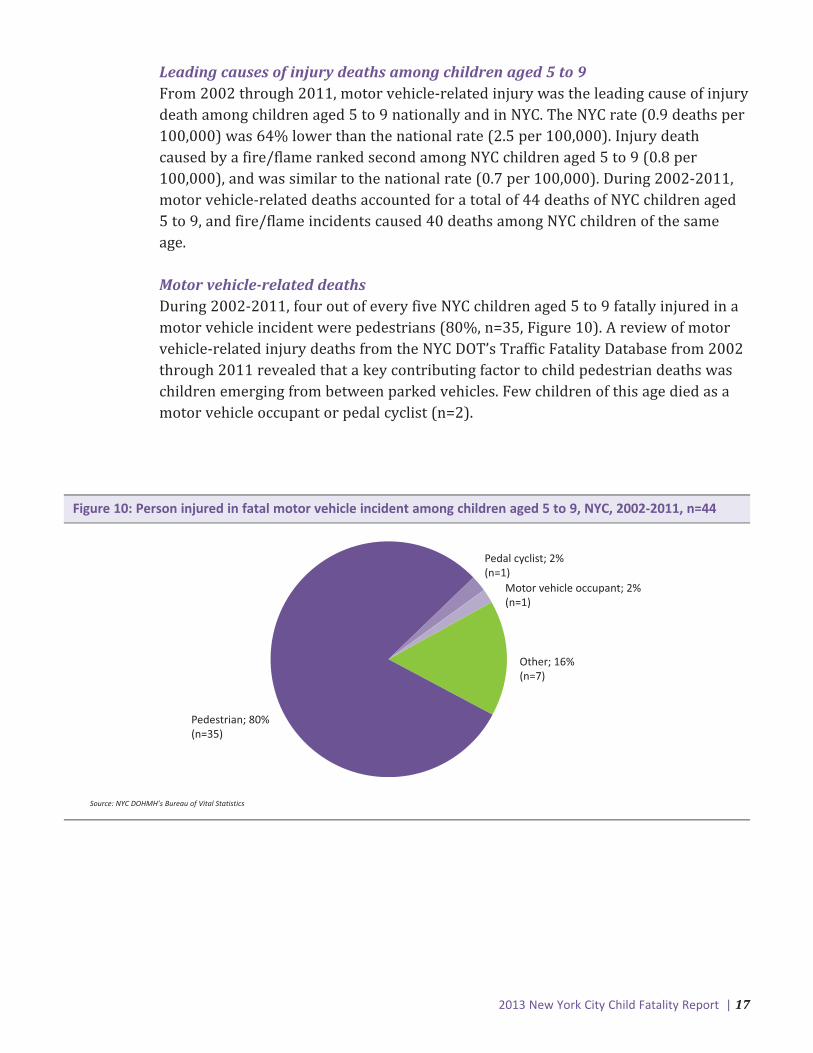
Motor vehicle-related deathsDuring 2002-2011, four out of every five NYC children aged 5 to 9 fatally injured in a
motor vehicle incident were pedestrians (80%, n=35, Figure 10). A review of motor
vehicle-related injury deaths from the NYC DOT’s Traffic Fatality Database from 2002
through 2011 revealed that a key contributing factor to child pedestrian deaths was
children emerging from between parked vehicles. Few children of this age died as a
motor vehicle occupant or pedal cyclist (n=2).
Pedestrian; 80%(n=35)
Other; 16%(n=7)
Pedal cyclist; 2% (n=1)
Motor vehicle occupant; 2%(n=1)
Source: NYC DOHMH’s Bureau of Vital Statistics
Figure 10: Person injured in fatal motor vehicle incident among children aged 5 to 9, NYC, 2002-2011, n=44

18 | 2013 New York City Child Fatality Report
Demographics of injury deaths among children aged 10 to 14From 2002 through 2011, the risk of injury death for boys aged 10 to 14 was nearly
two-thirds higher than the risk for girls (4.7 vs 2.9 per 100,000) of the same age. The
highest injury death rate was among black non-Hispanic children (6.4 per 100,000),
and was more than double the rate for any other racial or ethnic group (Figure 11).
Children living in Brooklyn had the highest rate of injury death (4.5 per 100,000) as
compared with children living in other NYC boroughs. The injury death rate among
children living in high- and very-high-poverty neighborhoods was higher than among
children living in medium- and low-poverty neighborhoods.
Children Aged 10 to 14
0
1
2
3
4
5
6
7
Rate
per
100
,000
chi
ldre
n ag
ed 1
0-14
Male
2.9
Sex Race/Ethnicity Borough
4.7
6.4
2.0
4.54.3
3.12.9 2.8
3.7
3.2
Female
Brookly
n
State
n Islan
dBro
nx
Queens
Man
ha�an
Very High High
Medium Lo
w
4.54.2
3.7
2.9
Black n
on-Hisp
anic
Hispan
icAsia
n
White
non-Hisp
anic
Neighborhood Poverty
Source: NYC DOHMH’s Bureau of Vital Statistics
Figure 11: Overall injury death rates among children aged 10 to 14 by sex, race/ethnicity, borough, andneighborhood poverty, NYC, 2002-2011, n=192
2013 New York City Child Fatality Report | 19
Leading causes of injury deaths among children aged 10 to 14From 2002 through 2011, motor vehicle-related injury was the leading cause of injury
death among children aged 10 to 14 nationally and in NYC. The rate in NYC was 68%
lower than the national rate (1.1 vs 3.4 per 100,000). During 2002-2011, motor
vehicle-related deaths accounted for 57 deaths of NYC children aged 10 to 14. The
second leading cause of injury death among this age group in NYC was suffocation
(n=27; most suffocation deaths were suicide by hanging), and NYC’s rate was 58%
lower than the national rate (0.5 vs 1.2 per 100,000). Nationally, firearm injury was
the second leading cause of injury death among this age group.
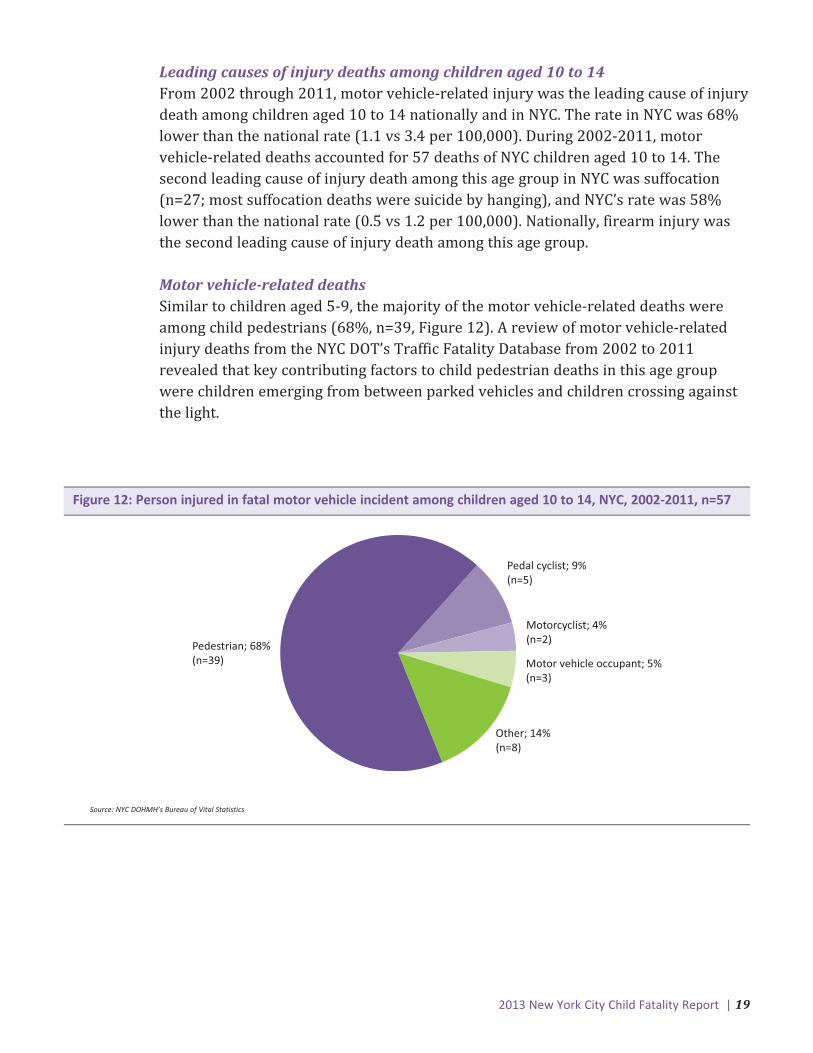
Motor vehicle-related deathsSimilar to children aged 5-9, the majority of the motor vehicle-related deaths were
among child pedestrians (68%, n=39, Figure 12). A review of motor vehicle-related
injury deaths from the NYC DOT’s Traffic Fatality Database from 2002 to 2011
revealed that key contributing factors to child pedestrian deaths in this age group
were children emerging from between parked vehicles and children crossing against
the light.
Pedestrian; 68%(n=39)
Pedal cyclist; 9%(n=5)
Motor vehicle occupant; 5%(n=3)
Other; 14%(n=8)
Motorcyclist; 4%(n=2)
Source: NYC DOHMH’s Bureau of Vital Statistics
Figure 12: Person injured in fatal motor vehicle incident among children aged 10 to 14, NYC, 2002-2011, n=57

20 | 2013 New York City Child Fatality Report
Demographics of injury deaths among youth aged 15 to 17From 2002 through 2011, males represented 80% of all injury deaths among youth
aged 15 to 17. Black non-Hispanic youth had the highest injury death rate (26.2 per
100,000) among NYC youth, followed by Hispanic (12.7 per 100,000), white non-
Hispanic (12.3 per 100,000), and Asian and Pacific Islander youth (6.6 per 100,000)
(Figure 13). Youth living in the Bronx and Brooklyn had higher rates of injury death
compared with youth living in other NYC boroughs. Youth living in NYC’s high- and
very-high-poverty neighborhoods had higher rates of injury death than youth living in
medium- and low-poverty neighborhoods.
Youth Aged 15 to 17
0
5
10
15
20
25
30
Rate
per
100
,000
chi
ldre
n ag
ed 1
5-17
Male
6.6
Sex Race/Ethnicity Borough
25.226.2
6.6
20.7
16.5
13.212.7 12.314.413.7
Female
Brookly
n
State
n Islan
dBro
nx
Queens
Man
ha�an
Very High High
Medium Lo
w
20.3
16.9
13.313.3
Black n
on-Hisp
anic
Hispan
icAsia
n
White
non-Hisp
anic
Neighborhood Poverty
Source: NYC DOHMH’s Bureau of Vital Statistics
Figure 13: Overall injury death rates among youth aged 15 to 17 by sex, race/ethnicity, borough, andneighborhood poverty, NYC, 2002-2011, n=494
2013 New York City Child Fatality Report | 21
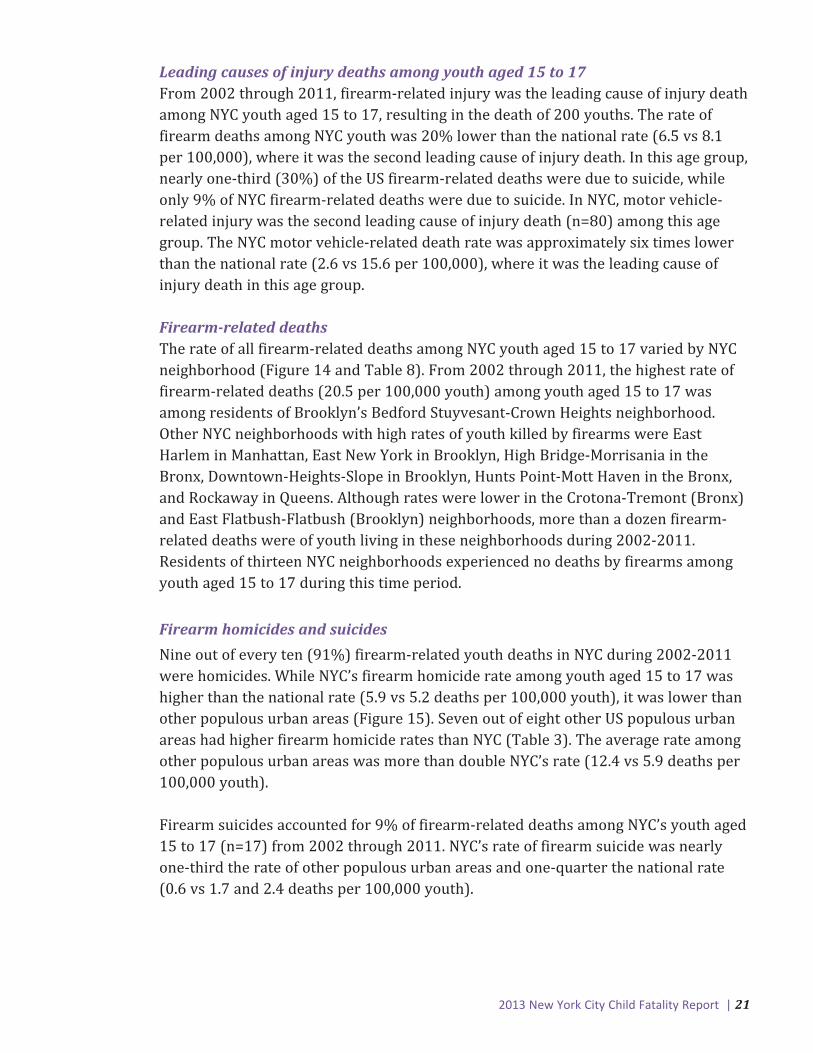
Leading causes of injury deaths among youth aged 15 to 17From 2002 through 2011, firearm-related injury was the leading cause of injury death
among NYC youth aged 15 to 17, resulting in the death of 200 youths. The rate of
firearm deaths among NYC youth was 20% lower than the national rate (6.5 vs 8.1
per 100,000), where it was the second leading cause of injury death. In this age group,
nearly one-third (30%) of the US firearm-related deaths were due to suicide, while
only 9% of NYC firearm-related deaths were due to suicide. In NYC, motor vehicle-
related injury was the second leading cause of injury death (n=80) among this age
group. The NYC motor vehicle-related death rate was approximately six times lower
than the national rate (2.6 vs 15.6 per 100,000), where it was the leading cause of
injury death in this age group.
Firearm-related deathsThe rate of all firearm-related deaths among NYC youth aged 15 to 17 varied by NYC
neighborhood (Figure 14 and Table 8). From 2002 through 2011, the highest rate of
firearm-related deaths (20.5 per 100,000 youth) among youth aged 15 to 17 was
among residents of Brooklyn’s Bedford Stuyvesant-Crown Heights neighborhood.
Other NYC neighborhoods with high rates of youth killed by firearms were East
Harlem in Manhattan, East New York in Brooklyn, High Bridge-Morrisania in the
Bronx, Downtown-Heights-Slope in Brooklyn, Hunts Point-Mott Haven in the Bronx,
and Rockaway in Queens. Although rates were lower in the Crotona-Tremont (Bronx)
and East Flatbush-Flatbush (Brooklyn) neighborhoods, more than a dozen firearm-
related deaths were of youth living in these neighborhoods during 2002-2011.
Residents of thirteen NYC neighborhoods experienced no deaths by firearms among
youth aged 15 to 17 during this time period.
Firearm homicides and suicides
Nine out of every ten (91%) firearm-related youth deaths in NYC during 2002-2011
were homicides. While NYC’s firearm homicide rate among youth aged 15 to 17 was
higher than the national rate (5.9 vs 5.2 deaths per 100,000 youth), it was lower than
other populous urban areas (Figure 15). Seven out of eight other US populous urban
areas had higher firearm homicide rates than NYC (Table 3). The average rate among
other populous urban areas was more than double NYC’s rate (12.4 vs 5.9 deaths per
100,000 youth).
Firearm suicides accounted for 9% of firearm-related deaths among NYC’s youth aged
15 to 17 (n=17) from 2002 through 2011. NYC’s rate of firearm suicide was nearly
one-third the rate of other populous urban areas and one-quarter the national rate
(0.6 vs 1.7 and 2.4 deaths per 100,000 youth).

22 | 2013 New York City Child Fatality Report
Fatality Rate per 100,000
0.00
0.1 - 3.6
3.7 - 6.8
6.9 - 11.9
12.0 - 20.5
East Harlem
High Bridge-Morrisania
Hunts Point-Mo� Haven
East New York
Rockaway
Bedford Stuyvesant-Crown Heights
Downtown-Heights-
Slope
Figure 14: Firearm-related deaths, by neighborhood of residence, youth aged 15 to 17, NYC, 2002-2011,n=200
Sources: NYC DOHMH’s Bureau of Vital Statistics and United Hospital Fund

2013 New York City Child Fatality Report | 23
0
2
4
6
8
10
12
14
Rate
per
100
,000
chi
ldre
n ag
ed 1
5-17
5.9
Homicide Suicide
5.2
12.4
0.6
2.41.7
NYC (2002–2011)US (2002–2010)Other Populous Urban Areas* (2002-2010)
*Average of US counties containing cities with more than one million residents (see Technical Appendix)Sources: NYC DOHMH’s Bureau of Vital Statistics and CDC’s WONDER
Figure 15: Firearm-related deaths by intent among youth aged 15 to 17 in NYC (2002-2011), US (2002-2010)and other populous urban areas (2002-2010)
Table 3: Firearm deaths among youth aged 15 to 17 by populous urban area, 2002-2010
Sources: NYC DOHMH’s Bureau of Vital Statistics and CDC’s WONDER
City/County All Intents Homicide Suicide
Philadelphia, PA (Philadelphia) 22.8 21.1 --Chicago, IL (Cook) 20.3 19.1 1.0Los Angeles, CA (Los Angeles) 16.0 14.9 0.7Phoenix, AZ (Maricopa) 12.9 7.9 4.1Houston, TX (Harris) 11.9 8.9 3.8San Antonio, TX (Bexar) 11.6 7.0 4.7Dallas, TX (Dallas) 10.5 8.1 2.3NYC (5 Coun�es) 6.7 5.9 0.6
San Diego, CA (San Diego) 6.4 5.0 --
24 | 2013 New York City Child Fatality Report
Recommendations
For parents and caregivers
• Always place a baby on his or her back to sleep, for naps and at night. Keep all
objects, including toys and loose bedding, out of a baby’s sleep area, especially for
infants under 6 months old.
• Babies are safest sleeping alone, on a firm mattress, in a safety-approved crib.
Sleeping with another person puts a baby at risk of being suffocated.
• Teach children to cross the street at crosswalks or at the corner instead of in mid-
block. Also teach children to observe pedestrian and traffic signals and other traffic
signs, to look both ways and listen before crossing the street, and to keep looking as
they cross.
• Drive safely: pay attention while driving, obey the speed limit, never drink and drive,
text and drive, or talk on a cell phone while driving; be aware of children that may
emerge from between parked cars.
• Keep matches and lighters out of the reach of children. Check your smoke alarms
once a month and change batteries every spring and fall when you change your
clocks for daylight savings time.
• Seek medical and mental health counseling for youth who appear depressed or
express thoughts of suicide. 1-800-LIFENET is available 24 hours a day for
assistance.
• Do not keep firearms in the home. If there must be a gun or any kind of weapon in
your home, put it where children cannot touch it. Keep guns unloaded and locked
away.
• Teach children nonviolent approaches to conflict resolution and that the
consequences of violence can be severe; become familiar with anti-violence activities
in your community and your child’s school.
For health care providers
• Counsel expectant and new parents on infant safe-sleep practices and utilize every
opportunity to visually demonstrate safe-sleep practices for parents and other
caregivers. Some families may qualify for free cribs through the Cribs for Kids
program. Direct parents to call 311 for more information.
• Counsel parents about the need for appropriate supervision based on child’s age,
development, and exposure to possible hazards. Provide information on choosing
appropriate caregivers.
2013 New York City Child Fatality Report | 25
• Discuss traffic and fire safety with parents. Counsel parents to teach children about
traffic rules and to maintain a working smoke alarm in the home.
• Ask youth about their emotional/psychological health. Conduct a brief mental health
screening and make referrals for counseling and services where appropriate.
• Counsel parents not to keep firearms in the home or, if they do, to store them safely.
• Direct parents to resources on teaching children nonviolent approaches to conflict
resolution.
For community-based organizations and schools
• Counsel expectant and new parents on infant safe-sleep practices and utilize every
opportunity to visually demonstrate safe-sleep practices for parents and other care
givers, such as siblings and grandparents.
• Distribute traffic and fire safety information to families. Incorporate traffic and fire
safety workshops or lessons into existing programs for children and families.
• Advocate for infrastructure and engineering improvements that promote safer
streets. Measures may include pedestrian islands, bicycle lanes, or new traffic
patterns.
• Offer programs that keep youth engaged in positive activities and away from
potentially violent situations.
For policy-makers
• Promote proposals focused on increasing infant safety, such as asking hospitals to
provide education to new parents on infant safe-sleep, prohibiting the sale of crib
bumpers, and helping parents obtain resources, such as providing cribs to families in
need.
• Implement infrastructure and engineering efforts that promote safer streets and
advocate for state legislation authorizing the expanded use of speed-enforcement
cameras and red-light enforcement cameras.
• Maintain and expand proven violence prevention programs and other youth
development services into high-violence communities in NYC.
• Endorse, develop, and implement policy efforts to reduce access to illegal guns such
as improving background checks and closing purchasing loopholes, to better prevent
crime and violence caused by illegal guns.
26 | 2013 New York City Child Fatality Report
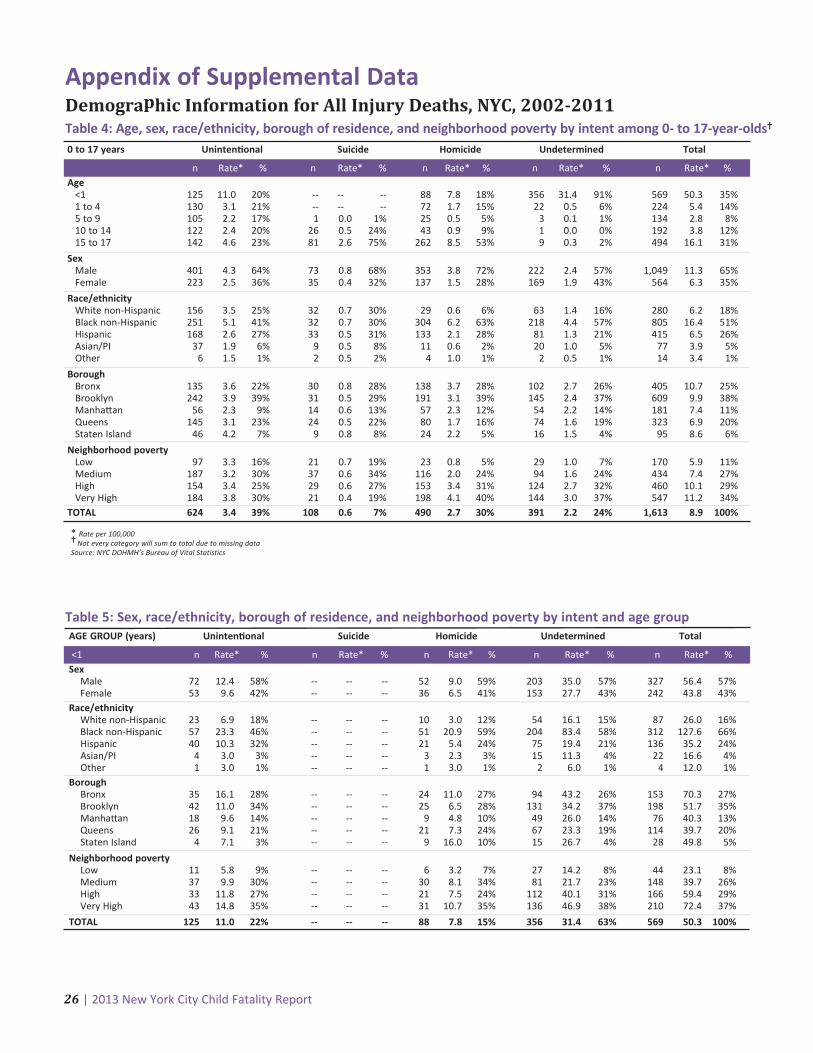
Appendix of Supplemental DataDemographic Information for All Injury Deaths, NYC, 2002-2011Table 4: Age, sex, race/ethnicity, borough of residence, and neighborhood poverty by intent among 0- to 17-year-olds�
0 to 17 years Uninten�onal Suicide Homicide Undetermined Total
n Rate* % n Rate* % n Rate* % n Rate* % n Rate* %Age
<1 125 11.0 20% -- -- -- 88 7.8 18% 356 31.4 91% 569 50.3 35%1 to 4 130 3.1 21% -- -- -- 72 1.7 15% 22 0.5 6% 224 5.4 14%5 to 9 105 2.2 17% 1 0.0 1% 25 0.5 5% 3 0.1 1% 134 2.8 8%10 to 14 122 2.4 20% 26 0.5 24% 43 0.9 9% 1 0.0 0% 192 3.8 12%15 to 17 142 4.6 23% 81 2.6 75% 262 8.5 53% 9 0.3 2% 494 16.1 31%
SexMale 401 4.3 64% 73 0.8 68% 353 3.8 72% 222 2.4 57% 1,049 11.3 65%Female 223 2.5 36% 35 0.4 32% 137 1.5 28% 169 1.9 43% 564 6.3 35%
Race/ethnicityWhite non-Hispanic 156 3.5 25% 32 0.7 30% 29 0.6 6% 63 1.4 16% 280 6.2 18%Black non-Hispanic 251 5.1 41% 32 0.7 30% 304 6.2 63% 218 4.4 57% 805 16.4 51%Hispanic 168 2.6 27% 33 0.5 31% 133 2.1 28% 81 1.3 21% 415 6.5 26%Asian/PI 37 1.9 6% 9 0.5 8% 11 0.6 2% 20 1.0 5% 77 3.9 5%Other 6 1.5 1% 2 0.5 2% 4 1.0 1% 2 0.5 1% 14 3.4 1%
BoroughBronx 135 3.6 22% 30 0.8 28% 138 3.7 28% 102 2.7 26% 405 10.7 25%Brooklyn 242 3.9 39% 31 0.5 29% 191 3.1 39% 145 2.4 37% 609 9.9 38%Manha�an 56 2.3 9% 14 0.6 13% 57 2.3 12% 54 2.2 14% 181 7.4 11%Queens 145 3.1 23% 24 0.5 22% 80 1.7 16% 74 1.6 19% 323 6.9 20%Staten Island 46 4.2 7% 9 0.8 8% 24 2.2 5% 16 1.5 4% 95 8.6 6%
Neighborhood poverty Low 97 3.3 16% 21 0.7 19% 23 0.8 5% 29 1.0 7% 170 5.9 11%Medium 187 3.2 30% 37 0.6 34% 116 2.0 24% 94 1.6 24% 434 7.4 27%High 154 3.4 25% 29 0.6 27% 153 3.4 31% 124 2.7 32% 460 10.1 29%Very High 184 3.8 30% 21 0.4 19% 198 4.1 40% 144 3.0 37% 547 11.2 34%
TOTAL 624 3.4 39% 108 0.6 7% 490 2.7 30% 391 2.2 24% 1,613 8.9 100%
* Rate per 100,000� Not every category will sum to total due to missing dataSource: NYC DOHMH’s Bureau of Vital Statistics
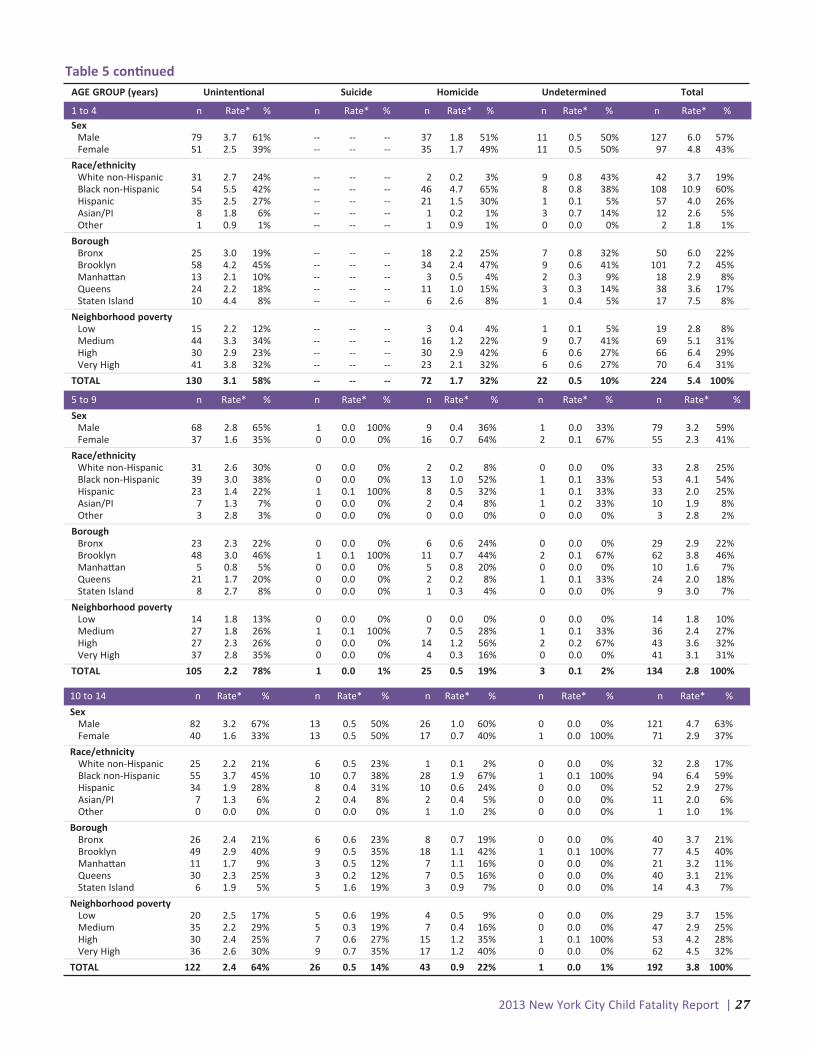
Table 5: Sex, race/ethnicity, borough of residence, and neighborhood poverty by intent and age groupAGE GROUP (years) Uninten�onal Suicide Homicide Undetermined Total
<1 n Rate* % n Rate* % n Rate* % n Rate* % n Rate* %Sex
Male 72 12.4 58% -- -- -- 52 9.0 59% 203 35.0 57% 327 56.4 57%Female 53 9.6 42% -- -- -- 36 6.5 41% 153 27.7 43% 242 43.8 43%
Race/ethnicityWhite non-Hispanic 23 6.9 18% -- -- -- 10 3.0 12% 54 16.1 15% 87 26.0 16%Black non-Hispanic 57 23.3 46% -- -- -- 51 20.9 59% 204 83.4 58% 312 127.6 66%Hispanic 40 10.3 32% -- -- -- 21 5.4 24% 75 19.4 21% 136 35.2 24%Asian/PI 4 3.0 3% -- -- -- 3 2.3 3% 15 11.3 4% 22 16.6 4%Other 1 3.0 1% -- -- -- 1 3.0 1% 2 6.0 1% 4 12.0 1%
BoroughBronx 35 16.1 28% -- -- -- 24 11.0 27% 94 43.2 26% 153 70.3 27%Brooklyn 42 11.0 34% -- -- -- 25 6.5 28% 131 34.2 37% 198 51.7 35%Manha�an 18 9.6 14% -- -- -- 9 4.8 10% 49 26.0 14% 76 40.3 13%Queens 26 9.1 21% -- -- -- 21 7.3 24% 67 23.3 19% 114 39.7 20%Staten Island 4 7.1 3% -- -- -- 9 16.0 10% 15 26.7 4% 28 49.8 5%
Neighborhood poverty Low 11 5.8 9% -- -- -- 6 3.2 7% 27 14.2 8% 44 23.1 8%Medium 37 9.9 30% -- -- -- 30 8.1 34% 81 21.7 23% 148 39.7 26%High 33 11.8 27% -- -- -- 21 7.5 24% 112 40.1 31% 166 59.4 29%Very High 43 14.8 35% -- -- -- 31 10.7 35% 136 46.9 38% 210 72.4 37%
TOTAL 125 11.0 22% -- -- -- 88 7.8 15% 356 31.4 63% 569 50.3 100%
2013 New York City Child Fatality Report | 27
Table 5 con�nued
5 to 9 n Rate* % n Rate* % n Rate* % n Rate* % n Rate* %
SexMale 68 2.8 65% 1 0.0 100% 9 0.4 36% 1 0.0 33% 79 3.2 59%Female 37 1.6 35% 0 0.0 0% 16 0.7 64% 2 0.1 67% 55 2.3 41%
Race/ethnicityWhite non-Hispanic 31 2.6 30% 0 0.0 0% 2 0.2 8% 0 0.0 0% 33 2.8 25%Black non-Hispanic 39 3.0 38% 0 0.0 0% 13 1.0 52% 1 0.1 33% 53 4.1 54%Hispanic 23 1.4 22% 1 0.1 100% 8 0.5 32% 1 0.1 33% 33 2.0 25%Asian/PI 7 1.3 7% 0 0.0 0% 2 0.4 8% 1 0.2 33% 10 1.9 8%Other 3 2.8 3% 0 0.0 0% 0 0.0 0% 0 0.0 0% 3 2.8 2%
BoroughBronx 23 2.3 22% 0 0.0 0% 6 0.6 24% 0 0.0 0% 29 2.9 22%Brooklyn 48 3.0 46% 1 0.1 100% 11 0.7 44% 2 0.1 67% 62 3.8 46%Manha�an 5 0.8 5% 0 0.0 0% 5 0.8 20% 0 0.0 0% 10 1.6 7%Queens 21 1.7 20% 0 0.0 0% 2 0.2 8% 1 0.1 33% 24 2.0 18%Staten Island 8 2.7 8% 0 0.0 0% 1 0.3 4% 0 0.0 0% 9 3.0 7%
Neighborhood povertyLow 14 1.8 13% 0 0.0 0% 0 0.0 0% 0 0.0 0% 14 1.8 10%Medium 27 1.8 26% 1 0.1 100% 7 0.5 28% 1 0.1 33% 36 2.4 27%High 27 2.3 26% 0 0.0 0% 14 1.2 56% 2 0.2 67% 43 3.6 32%Very High 37 2.8 35% 0 0.0 0% 4 0.3 16% 0 0.0 0% 41 3.1 31%
TOTAL 105 2.2 78% 1 0.0 1% 25 0.5 19% 3 0.1 2% 134 2.8 100%
10 to 14 n Rate* % n Rate* % n Rate* % n Rate* % n Rate* %
SexMale 82 3.2 67% 13 0.5 50% 26 1.0 60% 0 0.0 0% 121 4.7 63%Female 40 1.6 33% 13 0.5 50% 17 0.7 40% 1 0.0 100% 71 2.9 37%
Race/ethnicityWhite non-Hispanic 25 2.2 21% 6 0.5 23% 1 0.1 2% 0 0.0 0% 32 2.8 17%Black non-Hispanic 55 3.7 45% 10 0.7 38% 28 1.9 67% 1 0.1 100% 94 6.4 59%Hispanic 34 1.9 28% 8 0.4 31% 10 0.6 24% 0 0.0 0% 52 2.9 27%Asian/PI 7 1.3 6% 2 0.4 8% 2 0.4 5% 0 0.0 0% 11 2.0 6%Other 0 0.0 0% 0 0.0 0% 1 1.0 2% 0 0.0 0% 1 1.0 1%
BoroughBronx 26 2.4 21% 6 0.6 23% 8 0.7 19% 0 0.0 0% 40 3.7 21%Brooklyn 49 2.9 40% 9 0.5 35% 18 1.1 42% 1 0.1 100% 77 4.5 40%Manha�an 11 1.7 9% 3 0.5 12% 7 1.1 16% 0 0.0 0% 21 3.2 11%Queens 30 2.3 25% 3 0.2 12% 7 0.5 16% 0 0.0 0% 40 3.1 21%Staten Island 6 1.9 5% 5 1.6 19% 3 0.9 7% 0 0.0 0% 14 4.3 7%
Neighborhood poverty Low 20 2.5 17% 5 0.6 19% 4 0.5 9% 0 0.0 0% 29 3.7 15%Medium 35 2.2 29% 5 0.3 19% 7 0.4 16% 0 0.0 0% 47 2.9 25%High 30 2.4 25% 7 0.6 27% 15 1.2 35% 1 0.1 100% 53 4.2 28%Very High 36 2.6 30% 9 0.7 35% 17 1.2 40% 0 0.0 0% 62 4.5 32%
TOTAL 122 2.4 64% 26 0.5 14% 43 0.9 22% 1 0.0 1% 192 3.8 100%
AGE GROUP (years) Uninten�onal Suicide Homicide Undetermined Total
1 to 4 n Rate* % n Rate* % n Rate* % n Rate* % n Rate* %Sex
Male 79 3.7 61% -- -- -- 37 1.8 51% 11 0.5 50% 127 6.0 57%Female 51 2.5 39% -- -- -- 35 1.7 49% 11 0.5 50% 97 4.8 43%
Race/ethnicityWhite non-Hispanic 31 2.7 24% -- -- -- 2 0.2 3% 9 0.8 43% 42 3.7 19%Black non-Hispanic 54 5.5 42% -- -- -- 46 4.7 65% 8 0.8 38% 108 10.9 60%Hispanic 35 2.5 27% -- -- -- 21 1.5 30% 1 0.1 5% 57 4.0 26%Asian/PI 8 1.8 6% -- -- -- 1 0.2 1% 3 0.7 14% 12 2.6 5%Other 1 0.9 1% -- -- -- 1 0.9 1% 0 0.0 0% 2 1.8 1%
BoroughBronx 25 3.0 19% -- -- -- 18 2.2 25% 7 0.8 32% 50 6.0 22%Brooklyn 58 4.2 45% -- -- -- 34 2.4 47% 9 0.6 41% 101 7.2 45%Manha�an 13 2.1 10% -- -- -- 3 0.5 4% 2 0.3 9% 18 2.9 8%Queens 24 2.2 18% -- -- -- 11 1.0 15% 3 0.3 14% 38 3.6 17%Staten Island 10 4.4 8% -- -- -- 6 2.6 8% 1 0.4 5% 17 7.5 8%
Neighborhood povertyLow 15 2.2 12% -- -- -- 3 0.4 4% 1 0.1 5% 19 2.8 8%Medium 44 3.3 34% -- -- -- 16 1.2 22% 9 0.7 41% 69 5.1 31%High 30 2.9 23% -- -- -- 30 2.9 42% 6 0.6 27% 66 6.4 29%Very High 41 3.8 32% -- -- -- 23 2.1 32% 6 0.6 27% 70 6.4 31%
TOTAL 130 3.1 58% -- -- -- 72 1.7 32% 22 0.5 10% 224 5.4 100%
28 | 2013 New York City Child Fatality Report
Table 5 con�nuedAGE GROUP (years) Uninten�onal Suicide Homicide Undetermined Total
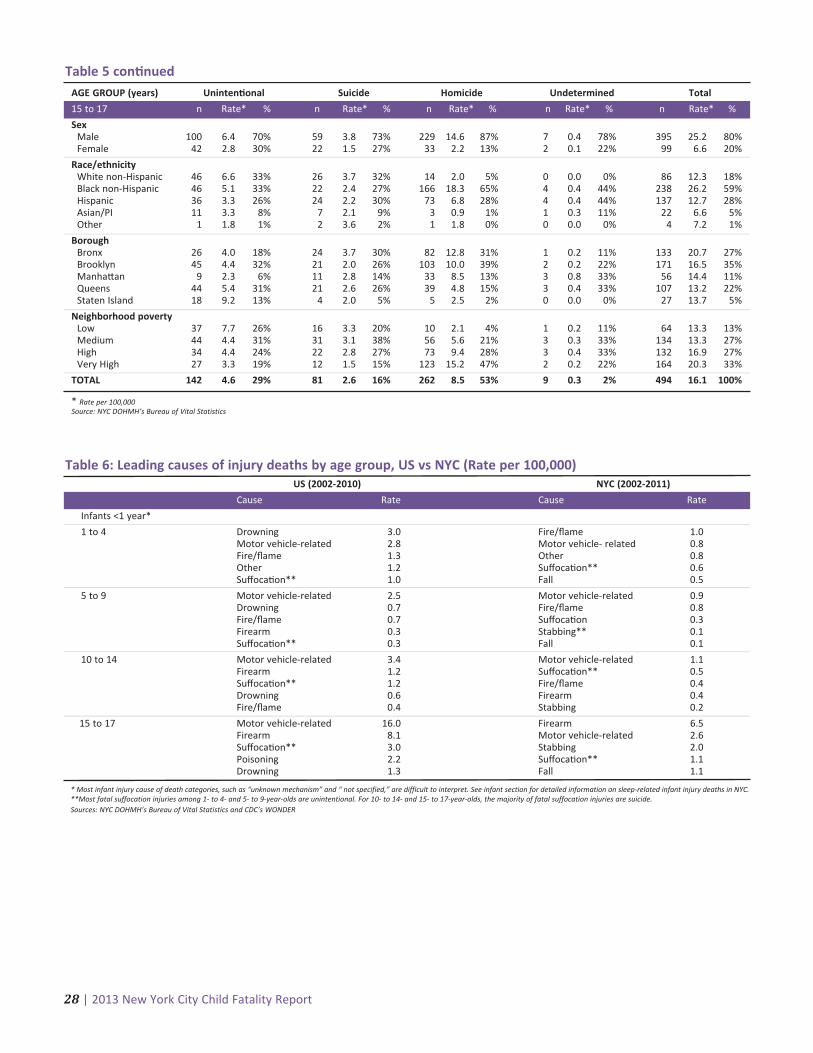
15 to 17 n Rate* % n Rate* % n Rate* % n Rate* % n Rate* %
SexMale 100 6.4 70% 59 3.8 73% 229 14.6 87% 7 0.4 78% 395 25.2 80%Female 42 2.8 30% 22 1.5 27% 33 2.2 13% 2 0.1 22% 99 6.6 20%
Race/ethnicityWhite non-Hispanic 46 6.6 33% 26 3.7 32% 14 2.0 5% 0 0.0 0% 86 12.3 18%Black non-Hispanic 46 5.1 33% 22 2.4 27% 166 18.3 65% 4 0.4 44% 238 26.2 59%Hispanic 36 3.3 26% 24 2.2 30% 73 6.8 28% 4 0.4 44% 137 12.7 28%Asian/PI 11 3.3 8% 7 2.1 9% 3 0.9 1% 1 0.3 11% 22 6.6 5%Other 1 1.8 1% 2 3.6 2% 1 1.8 0% 0 0.0 0% 4 7.2 1%
BoroughBronx 26 4.0 18% 24 3.7 30% 82 12.8 31% 1 0.2 11% 133 20.7 27%Brooklyn 45 4.4 32% 21 2.0 26% 103 10.0 39% 2 0.2 22% 171 16.5 35%Manha�an 9 2.3 6% 11 2.8 14% 33 8.5 13% 3 0.8 33% 56 14.4 11%Queens 44 5.4 31% 21 2.6 26% 39 4.8 15% 3 0.4 33% 107 13.2 22%Staten Island 18 9.2 13% 4 2.0 5% 5 2.5 2% 0 0.0 0% 27 13.7 5%
Neighborhood poverty Low 37 7.7 26% 16 3.3 20% 10 2.1 4% 1 0.2 11% 64 13.3 13%Medium 44 4.4 31% 31 3.1 38% 56 5.6 21% 3 0.3 33% 134 13.3 27%High 34 4.4 24% 22 2.8 27% 73 9.4 28% 3 0.4 33% 132 16.9 27%Very High 27 3.3 19% 12 1.5 15% 123 15.2 47% 2 0.2 22% 164 20.3 33%
TOTAL 142 4.6 29% 81 2.6 16% 262 8.5 53% 9 0.3 2% 494 16.1 100%
* Rate per 100,000Source: NYC DOHMH’s Bureau of Vital Statistics
US (2002-2010) NYC (2002-2011)
Cause Rate Cause Rate
Infants <1 year*
1 to 4 Drowning 3.0 Fire/flame 1.0Motor vehicle-related 2.8 Motor vehicle- related 0.8Fire/flame 1.3 Other 0.8Other 1.2 Suffoca�on** 0.6Suffoca�on** 1.0 Fall 0.5
5 to 9 Motor vehicle-related 2.5 Motor vehicle-related 0.9Drowning 0.7 Fire/flame 0.8Fire/flame 0.7 Suffoca�on 0.3Firearm 0.3 Stabbing** 0.1Suffoca�on** 0.3 Fall 0.1
10 to 14 Motor vehicle-related 3.4 Motor vehicle-related 1.1Firearm 1.2 Suffoca�on** 0.5Suffoca�on** 1.2 Fire/flame 0.4Drowning 0.6 Firearm 0.4Fire/flame 0.4 Stabbing 0.2
15 to 17 Motor vehicle-related 16.0 Firearm 6.5Firearm 8.1 Motor vehicle-related 2.6Suffoca�on** 3.0 Stabbing 2.0Poisoning 2.2 Suffoca�on** 1.1Drowning 1.3 Fall 1.1
Table 6: Leading causes of injury deaths by age group, US vs NYC (Rate per 100,000)
* Most infant injury cause of death categories, such as “unknown mechanism” and “ not specified,” are difficult to interpret. See infant section for detailed information on sleep-related infant injury deaths in NYC.**Most fatal suffocation injuries among 1- to 4- and 5- to 9-year-olds are unintentional. For 10- to 14- and 15- to 17-year-olds, the majority of fatal suffocation injuries are suicide.Sources: NYC DOHMH’s Bureau of Vital Statistics and CDC’s WONDER

2013 New York City Child Fatality Report | 29
n* % Rate�
Age at death < 28 days 36 9.3 --28 days to 4 months 283 73.3 --5 to 12 months 67 17.4 --
Gesta�onal age < 37 weeks (pre-term) 89 23.1 91.3> 37 weeks (term) 286 74.1 31.6
Gender Male 215 55.7 41.8Female 171 44.3 34.7
Race/ethnicity of infant Black non-Hispanic 214 55.4 95.3Hispanic 92 23.8 28.9White non-Hispanic 49 12.7 16.0Asian/Pacific Islander 15 3.9 10.5
Infant borough of residence# Brooklyn 131 33.9 40.2Bronx 99 25.6 58.3Queens 73 18.9 33.3Manha�an 55 14.2 34.3Staten Island 16 4.1 35.1
Maternal age Under 20 years 58 15.0 89.8> 20 years 323 83.7 34.4
Maternal na�vity US-born 276 71.5 56.9Foreign-born 87 22.5 16.8
Maternal educa�on Less than high school 156 40.4 68.6High school or more 214 55.4 27.7
Table 7: Demographics for sleep-related infant injury deaths, NYC, 2004-2011, n=386
* Missing/unknown/other excluded from count and percent categories.� Rates per 100,000 live births in the selected population.# Excluded are a small proportion (3%, n=12) of sleep-related injury deaths in NYC, which occurred among infants residing outside of NYC.Sources: NYC DOHMH’s Bureau of Vital Statistics and NYC Office of Chief Medical Examiner
Table 8: Firearm-related deaths by neighborhood of residence, youth aged 15 to 17, NYC, 2002-2011, n=200
* Rate per 100,000 youthSources: NYC DOHMH’s Bureau of Vital Statistics and United Hospital Fund
Neighborhood Rate* n
BronxHigh Bridge-Morrisania 15.0 16Hunts Point-Mo� Haven 13.9 11Crotona-Tremont 11.9 13Fordham-Bronx Park 9.5 11Pelham-Throgs Neck 7.9 10Northeast Bronx 7.2 6Kingsbridge-Riverdale 6.8 2
BrooklynBedford Stuyvesant-Crown Heights 20.5 31East New York 16.2 16Downtown-Heights-Slope 14.1 8East Flatbush-Flatbush 9.6 13Williamsburg-Bushwick 7.3 7Greenpoint 4.3 2Canarsie-Flatlands 3.4 3Coney Island-Sheepshead Bay 0.9 1Borough Park 0.7 1Bensonhurst-Bay Ridge 0.0 0Sunset Park 0.0 0
Manha�anEast Harlem 18.2 9Central Harlem-Morningside Heights 9.7 6Washington Heights-Inwood 5.9 6
Neighborhood Rate* n
Union Square-Lower East Side 2.2 7Chelsea-Clinton 0.0 0Gramercy Park-Murray Hill 0.0 0Greenwich Village-Soho 0.0 0Lower Manha�an 0.0 0Upper East Side 0.0 0Upper West Side 0.0 0
QueensRockaway 13.8 7Southeast Queens 4.8 4Jamaica 4.0 5Flushing-Clearview 3.8 3Southwest Queens 3.6 4Ridgewood-Forest Hills 2.6 2West Queens 0.6 1Bayside-Li�le Neck 0.0 0Fresh Meadows 0.0 0Long Island City-Astoria 0.0 0
Staten IslandStapleton-St.George 4.0 2South Beach-To�enville 1.3 1Port Richmond 0.0 0Willowbrook 0.0 0
US (2002-2010) NYC (2002-2011)
Age group, years n Rate* n Rate*
<1 173 0.5 9 0.81 to 4 169 0.1 1 0.05 to 9 85 0.0 0 0.010 to 14 82 0.0 1 0.015 to 17 82 0.1 5 0.2
Table 9: Unnatural deaths due to therapeu�c complica�on
* Rate per 100,000Sources: NYC DOHMH’s Bureau of Vital Statistics and CDC’s WONDER

30 | 2013 New York City Child Fatality Report
Injury deaths. Death certificates of all persons who died in NYC are collected and maintained by the NYC
DOHMH’s Bureau of Vital Statistics (BVS). For the years 2002 through 2011, injury deaths of NYC residents aged 0
to 17 were identified by underlying cause of death with International Classification of Disease codes, Version 10
(ICD-10; http://www.who.int/classifications/icd/en/). DOHMH staff abstracted demographic, accident, and injury
information from death certificates among children and youth aged 0 to 17 for the purpose of aggregate data
analysis. To categorize injury intent and mechanism, we followed the National Center for Health Statistics ICD-10
external cause of injury matrix (except injuries caused by legal intervention were excluded) available at:
/nchs/injry/injury_matrices.htm. Deaths due to injuries with a known intent were identified using the following
definitions and ICD-10 codes:
Unintentional injury. Injury or poisoning death that occurred without intent to harm or cause death, also called
accident. Unintentional injury deaths were identified using ICD-10 codes V01-X59.
Homicide. Intentional injury death resulting from injuries sustained through an act of violence committed by
another person aimed at causing fear, harm, or death. Homicide deaths were identified using ICD-10 codes X85-
Y09. Deaths from legal intervention are excluded from homicide counts. The New York Police Department (NYPD)
monitors homicides as well, with different reporting definitions and regulations. As a result, homicide counts may
differ between agencies. For more information on homicide designation by both agencies, please see Appendix B,
page 10, of the NYC DOHMH Summary of Vital Statistics, 2011 Report at: http://www.nyc.gov/html/doh/
downloads/pdf/vs/vs-appendix-b-2011.pdf.
Suicide. Intentional injury death resulting from self-directed behavior with an intent to die as a result of the
behavior. Suicides were identified using ICD-10 codes X60-X84.
Undetermined injury death. Injury death in which information is insufficient to determine manner of death.
Undetermined injury deaths were identified using ICD-10 codes Y10–Y34.
Classification of infant sleep-related deathsNYC: In NYC, all sudden unexpected infant deaths are certified using a standard protocol developed by OCME in
2000. According to these certification guidelines, if unsafe environmental factors are present at the time of death,
the death is classified as:
(1) suffocation or asphyxia with an accidental or intentional manner of death, if sufficient evidence is present;
(2) suffocation with an undetermined manner of death, if insufficient evidence on the manner of death is
present; or
(3) undetermined cause and manner, if there are no findings from the autopsy or post mortem studies that
point to a cause of death, but the death scene investigation reveals an environment that may have caused an
injury like suffocation.
Sleep-related injury deaths in this report were derived by reviewing all cases with ICD-10 codes of W75, W84
(suffocation injuries) and Y33, Y34 (injuries of undetermined cause and intent). An injury was considered to be
sleep-related if the infant was last known to be asleep when last seen alive.
US: National data are based on vital statistics from local jurisdictions. Local jurisdictions may or may not have
protocols in place for certifying sudden unexpected infant deaths, and local resources may vary. Factors that
impact infant death certification include death scene investigation by trained medico-legal investigators and local
law enforcement, comprehensive infant autopsy protocol with the availability of post-mortem studies, and final
death certification by a forensic pathologist or medical examiner. Thus, there may be differences in cause and
manner of death certification of infant fatalities depending upon the jurisdiction. US data show that half of sudden
unexpected infant deaths are attributed to natural causes (ie, Sudden Infant Death Syndrome (SIDS)),* while NYC
data show a much lower proportion of SIDS deaths among all sleep-related infant deaths.�
Technical Appendix
* Centers for Disease Control and Prevention. Sudden Unexpected Infant Death (SUID) http://www.cdc.gov/SIDS/. Accessed11/29/2013.
� Fortin P, Stayton C, DiGrande L, Yau R, Hackett M, and New York City Child Fatality Review Team. Report from the New York CityChild Fatality Review Team: Understanding Child Injury Deaths. New York City Department of Health and Mental Hygiene: June2011.

2013 New York City Child Fatality Report | 31
Other causes of death. Per the CFRAT mandate, non-injury causes of death were excluded from descriptive
analyses, except when placing injury deaths in the context of other leading causes of death among children. These
comprise natural causes (ICD-10 codes A00-R99), legal intervention (ICD-10 codes Y35-Y36), complications of
medical and surgical care (ICD-10 codes Y40-Y84), and sequelae of external causes (ICD 10 codes Y85-Y89).
Medical Examiner files. Based on a unique identifier found on the death certificate, NYC OCME files were
matched and reviewed using a standardized data abstraction form. Documents examined in OCME records
included autopsy, external examination, toxicology and other post-mortem studies, and investigative, police, and
hospital reports. Cases that were subjects of any investigation/criminal/family court proceedings were restricted
from case review as per Local Law 115.
US comparison data. National data come from the CDC’s Wide-ranging Online Data for Epidemiologic Research
(WONDER) detailed mortality files and the CDC's National Center for Injury Prevention and Control Web-based
Injury Statistics Query and Reporting System (WISQARS). Data were accessed Sept 2013 at:
http://wonder.cdc.gov/ and http://www.cdc.gov/injury/wisqars/index.html. Data through 2010 were available at
the time of data access.
US urban area comparison data. No comparable city-level homicide data for youth aged 15 to 17 were available.
Comparison areas chosen in the analysis were the eight US counties containing cities with populations greater
than 1 million, excluding NYC. City population size was assessed based on US Census Bureau data, which were
accessed September 2013 at: http://www.census.gov/popest/data/index.html. Comparison data come from the
CDC’s WONDER detailed mortality files.
Neighborhood poverty definitions. Neighborhood poverty level is defined in this report as percent of residents
(based on zip code) with incomes below 100% of the Federal Poverty Level. Levels of neighborhood poverty were
defined as: Low neighborhood poverty (<10% below poverty), Medium neighborhood poverty (10 to <20%), High
neighborhood poverty (20 to <30%), and Very high neighborhood poverty (>=30%).
Motor vehicle-related deaths. Data regarding contributing factors for child pedestrian deaths were obtained
from the NYC Department of Transportation’s (DOT) Traffic Fatality Database. Data are compiled from MV-104AN
reports prepared by NYPD precincts, the Collision Investigation Squad of the NYPD (eg, police reports), and DOT’s
investigation/analysis team reports.
Data analysis and mapping. Rate calculations were conducted using intercensal population estimates provided
by the NYC DOHMH Bureau of Epidemiology Services. Population denominators used for age-specific rate
calculations were produced by NYC DOHMH based on US Census Bureau Population Estimate Program and
housing unit data from the NYC Department of City Planning. Analyses were performed with SAS 9.2. Analyses of
sleep-related infant deaths were performed using Excel 2010 and SPSS v18 and v20. Mapping of firearm-related
deaths was performed with ArcGIS 10.1, and data were classed by quartiles.
Limitations of the data. This CFRAT report has some important limitations. The limited number of injury-related
deaths in NYC's children and youth, while encouraging and lower than the national average, reduced our ability to
examine their commonalities and trends in detail. Small numbers also reduced our ability to make statements
about statistically significant differences or inferences concerning causal associations. Several descriptive
variables of child injury deaths are collected by witness- or caregiver-report. Factors such as child sleep position
and child pedestrian behavior prior to a death may be subject to reporting bias. In addition, several characteristics
that may influence injury risk are not formally captured by death certificates or information contained in OCME
files (including other agency data sources, eg, DOT, police). These characteristics may include level of parental or
guardian supervision, use of safety devices, certain environmental hazards, family conditions or stressors, history
of depression or mental health conditions, and so on. These factors may play a critical role in mitigating injury
outcomes. Understanding homicide injury deaths is further limited by lack of information on the perpetrator.
CFRAT meetings. Meetings are closed to the public. All team members must sign a confidentiality statement
before participating in the review process. The confidentiality statement specifically defines the conditions of
participation and assures that members will not divulge information discussed in team meetings. To further
maintain confidentiality, identifying information in data and research reports has been omitted.

32 | 2013 New York City Child Fatality Report

Related Documents