Consulting Actuaries CARRIER TREND REPORT JULY 2014 ANALYSIS

Welcome message from author
This document is posted to help you gain knowledge. Please leave a comment to let me know what you think about it! Share it to your friends and learn new things together.
Transcript
Consulting Actuaries
CARRIER TREND REPORTJULY 2014 ANALYSIS

1. REPORT OVERVIEW 1
2. EXECUTIVE SUMMARY 2
3. RESULTS FOR JULY 2014 3
4. HISTORICAL EXPERIENCE 12
5. PARTICIPATING PROVIDERS 18
6. EXPOSURES BY LINE OF BUSINESS 19
7. ABOUT US 20
CONTENTS
Karen K. Bender, FCA, ASA, MAAA
Beth R. Fritchen, FSA, MAAA
We help you evaluate and manage risk.
Oliver Wyman Actuarial Consulting, Inc.
411 East Wisconsin AvenueSuite 1300Milwaukee, WI 53202-4419414 223 7989
155 North Wacker DriveSuite 1500Chicago, IL 60606312 345 3378
www.oliverwyman.com

1. REPORT OVERVIEW
Oliver Wyman Actuarial Consulting, Inc. developed the Carrier Trend Survey in order to conduct market research in
the health insurance and HMO industry. Specific individual carrier or HMO responses are held in strict confidence.
This report summarizes the July 2014 trends from the survey
that Oliver Wyman sent to healthcare carriers in April 2014.
A summary of the median trends is shown in the table to the right.
The coverage specific results are discussed in the Executive
Summary. We intend this report to be of use to carriers, brokers,
state insurance agencies and other interested parties who are
affected by the trends in the cost of healthcare.
This report presents pricing trends used by the participating
companies in the development of their rates for July 20141.
These trends are used to develop premiums for approximately
103.9 million group members as reported by the participating
companies. (We have made no attempt to eliminate the effects
that dual coverage may have on these trends.) In addition, this
edition of the report reflects pricing trends for about 4.5 million
members with individual health policies, about 7.3 million
Medicare members and 2.4 million Medicaid members.
Note that the survey results shown in Section 3 of this report are
aggregated and stratified by percentile. The intent is to show
the range of trends currently being employed by the insurance
community as of July 2014. The 100th percentile represents the
highest trend reported. The 0th percentile represents the lowest
trend reported.
To a limited extent, we asked respondents to provide trends
for specific benefit designs. We have not made adjustments to
the reported trends if respondents provided trends for benefit
designs other than those specified.
Section 4 of this report contains the historical median trends.
1 There are some categories that experienced a significant change in membership from the January 2014 report. Some of the changes in trends may be attributable to a different mix in respondents.
CATEGORY MEDIAN TREND
Group Medical Indemnity 9.25%
Group Medical PPO 7.80%
Group Medical POS 7.99%
Group Medical HMO 6.40%
Prescription Drug 9.25%
Group Dental Indemnity 5.00%
Group Dental PPO 5.00%
Group Dental DHMO 5.00%
Group Vision Indemnity 4.00%
Group Vision PPO 2.50%
Group Vision Prepaid 2.00%
Medicare Supplement with Drug 4.40%
Medicare Supplement without Drug 3.40%
Medicare Advantage with Drug 3.70%
Medicare Advantage without Drug 3.20%
Medicare Part D Standard Plan 3.60%
Individual Medical Indemnity 8.86%
Individual Medical PPO 6.50%
Individual Medical POS 8.40%
Individual Medical HMO 8.30%
Group Medical HSA with Drug 9.40%
Group Medical HSA without Drug 7.30%
Individual Medical HSA with Drug 9.50%
Individual Medical HSA without Drug 7.30%
Specific Stop Loss $50,000 12.65%
Specific Stop Loss $150,000 15.04%
ASO Fees 3.00%
Medicaid 2.55%
Copyright © 2014 Oliver Wyman 1

2. EXECUTIVE SUMMARY
The median trend, weighted average, and sample
average decreased from the January 2014 survey for
all categories of the group medical products. While
PPO products experienced the largest decrease, HMO
products continue to have the lowest median trend
at 6.40%. Group indemnity products are showing the
highest median trend at 9.25%.
The prescription drug median trend increased from
January 2014 levels. This is the second consecutive
survey that the median has increased nearly half a
percentage point. The median drug trend is at 9.25%.
The median trend for dental DHMO increased from
January 2014 levels, while group dental indemnity and
PPO products remained unchanged. The group dental
median trends have converged to 5.00%.
The median trend remained at January 2014 levels for
group vision indemnity and prepaid products, while the
median trend for group vision PPO products decreased.
Indemnity products have the highest median trend
among group vision products at 4.00%.
Medicare Supplement products with prescription drug
coverage experienced an increase in the median trend
of 1.90 percentage points from January 2014 levels,
while products without drug coverage experienced a
decrease of 0.60 percentage points. The median trends
for Medicare supplement products have been trending
downward for several surveys.
The median trends remained relatively flat for Medicare
Advantage (MA) products and Medicare Part D, while the
sample average decreased half a percentage point for
MA products and increased over a percentage point for
Medicare Part D. The median trend for MA products with
drug coverage continues to show a higher median trend
than MA products without drug coverage.
The median trend increased from the January 2014
survey for individual medical HSA plans with drug
coverage. The median trends for individual medical HSA
plans without drug coverage and group medical HSA
products remained the same as the January 2014 trends.
HSA products with drug coverage have median trends
that are roughly two percentage points higher than HSA
products not offering drug coverage.
The median trend for individual medical HMO and PPO
products decreased from the January 2014 survey, while
the median trend for individual medical indemnity and
POS products increased from the January 2014 survey.
The highest median trend is among the individual
medical indemnity products at 8.86%.
The median trend for $50,000 Specific Stop Loss
decreased from the January 2014 survey by 1.30
percentage points to 12.65%. The median trend for
$150,000 Specific Stop Loss decreased from the January
2014 survey by 2.26 percentage points to 15.04%.
The Medicaid weighted average decreased from
the January 2014 survey, while the sample average
and median trend increased. The median trend is
currently 2.55%.
ASO fees median trend remained the same as the
January 2014 survey trend at 3.00%.
Copyright © 2014 Oliver Wyman 2

3. RESULTS FOR JULY 2014
The following charts show trends for:
• Group Medical
• Prescription Drug and Dental
• Group Vision
• Medicare Supplement Products
• Medicare Advantage Products
• High Deductible Health Plans
• Individual Medical
• Stop Loss, ASO Fees and Medicaid
Copyright © 2014 Oliver Wyman 3

EXHIBIT 1: GROUP MEDICAL PRICING TRENDS
5%
10%
15%
20%
25%
Group MedicalIndemnity
# of Responses
Exposures1*
75th Percentile
Median
25th Percentile
0th Percentile
Group MedicalPPO
Group MedicalPOS2*
Group MedicalHMO
ANNUAL TREND
12.25%
9.25%
8.05%
4.00%
42
2,386,696
8.53%
7.80%
6.80%
2.50%
66
56,009,459
9.39%
7.99%
6.29%
4.30%
41
18,644,264
64
16,000,949
100th Percentile 16.79% 13.60% 13.00% 12.43%
8.30%
6.40%
5.50%
0.40%
Sample Average
Weighted Average
9.28%
9.94%
7.95%
7.99%
7.91%
9.42%
7.35%
6.81%
0%
1* Based on member count
2* Percentiles for Group Medical POS are based on the number of respondents, as opposed to members
Copyright © 2014 Oliver Wyman 4

EXHIBIT 2: PRESCRIPTION DRUG AND DENTAL PRICING TRENDS
5%
10%
15%
20%
25%
# of Responses
Exposures1*
75th Percentile
Median
25th Percentile
0th Percentile
ANNUAL TREND
10.20%
9.25%
9.00%
3.00%
79
59,803,301
5.94%
5.00%
4.06%
2.50%
35
4,892,862
5.75%
5.00%
4.00%
0.00%
44
39,436,608
15
4,322,568
100th Percentile 22.10% 7.50% 7.50% 6.00%
5.00%
5.00%
4.38%
3.00%
Sample Average
Weighted Average
8.63%
8.88%
5.07%
5.04%
4.47%
5.17%
4.68%
4.42%
0%
Group DentalPPO2*,3*
Group DentalDHMO2*,4*
Group DentalIndemnity2*
PrescriptionDrug
1* Based on member count
2* Percentiles for all dental products are based on the number of respondents, as opposed to members
3* The zero trend is not an error; at least one carrier reported a zero or negative trend
4* The 75th percentile and the 50th percentile are the same for Group Dental DHMO. These reflect trends from multiple carriers
Copyright © 2014 Oliver Wyman 5
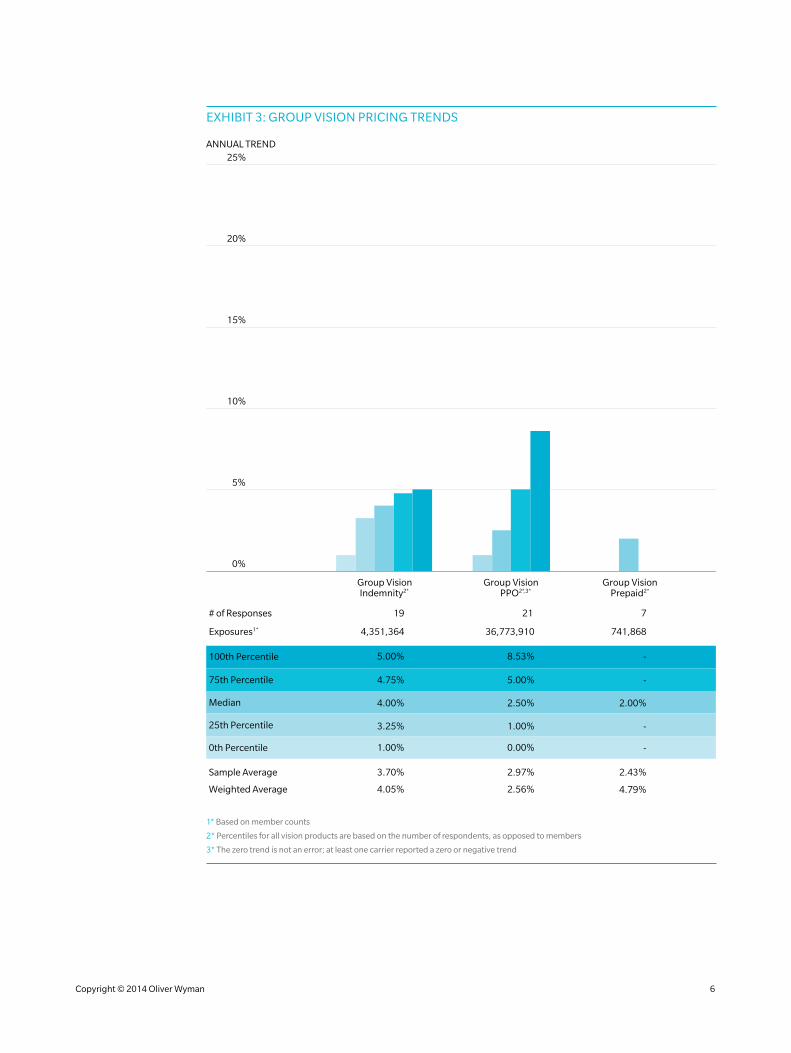
EXHIBIT 3: GROUP VISION PRICING TRENDS
5%
10%
15%
20%
25%
Group VisionIndemnity2*
# of Responses
Exposures1*
75th Percentile
Median
25th Percentile
0th Percentile
Group Vision PPO2*,3*
Group VisionPrepaid2*
ANNUAL TREND
100th Percentile
Sample Average
Weighted Average
5.00%
2.50%
1.00%
0.00%
21
36,773,910
8.53%
2.97%
2.56%
-
2.00%
-
-
2.43%
4.79%
7
741,868
-
4.75%
4.00%
3.25%
1.00%
19
4,351,364
5.00%
3.70%
4.05%
0%
1* Based on member counts
2* Percentiles for all vision products are based on the number of respondents, as opposed to members
3* The zero trend is not an error; at least one carrier reported a zero or negative trend
Copyright © 2014 Oliver Wyman 6
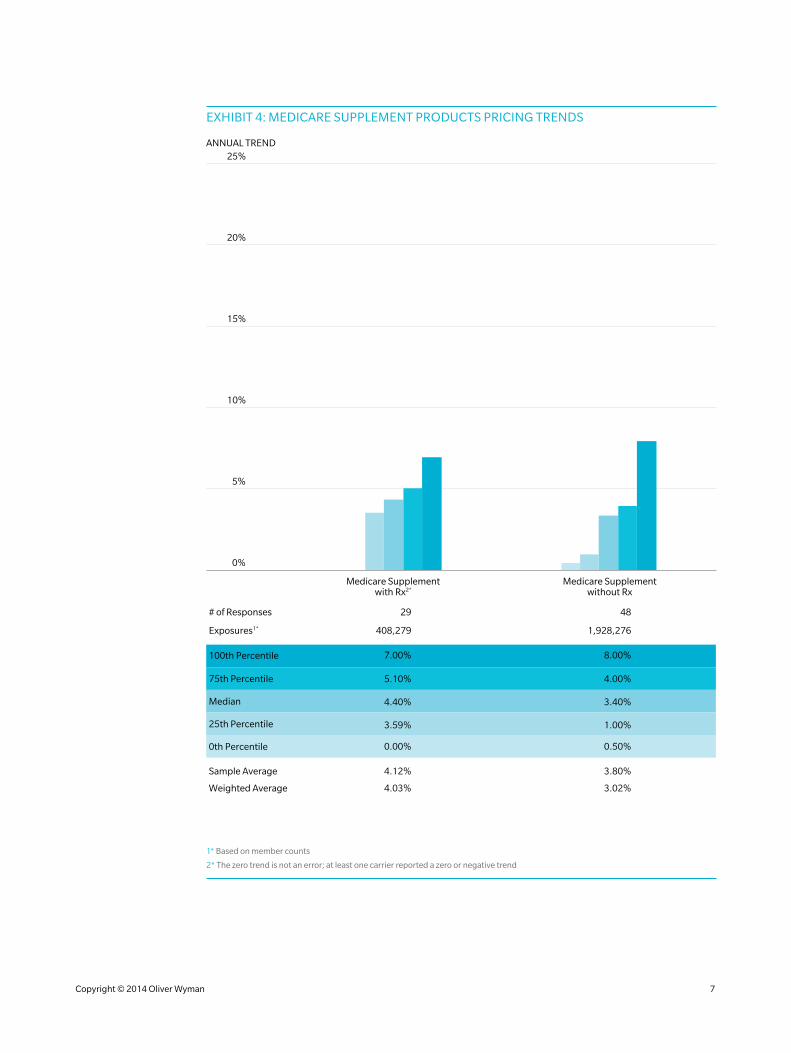
EXHIBIT 4: MEDICARE SUPPLEMENT PRODUCTS PRICING TRENDS
5%
10%
15%
20%
25%
Medicare Supplementwith Rx2*
# of Responses
Exposures1*
75th Percentile
Median
25th Percentile
0th Percentile
Medicare Supplementwithout Rx
ANNUAL TREND
100th Percentile
Sample Average
Weighted Average
5.10%
4.40%
3.59%
0.00%
29
408,279
7.00%
4.12%
4.03%
4.00%
3.40%
1.00%
0.50%
48
1,928,276
8.00%
3.80%
3.02%
0%
1* Based on member counts
2* The zero trend is not an error; at least one carrier reported a zero or negative trend
Copyright © 2014 Oliver Wyman 7
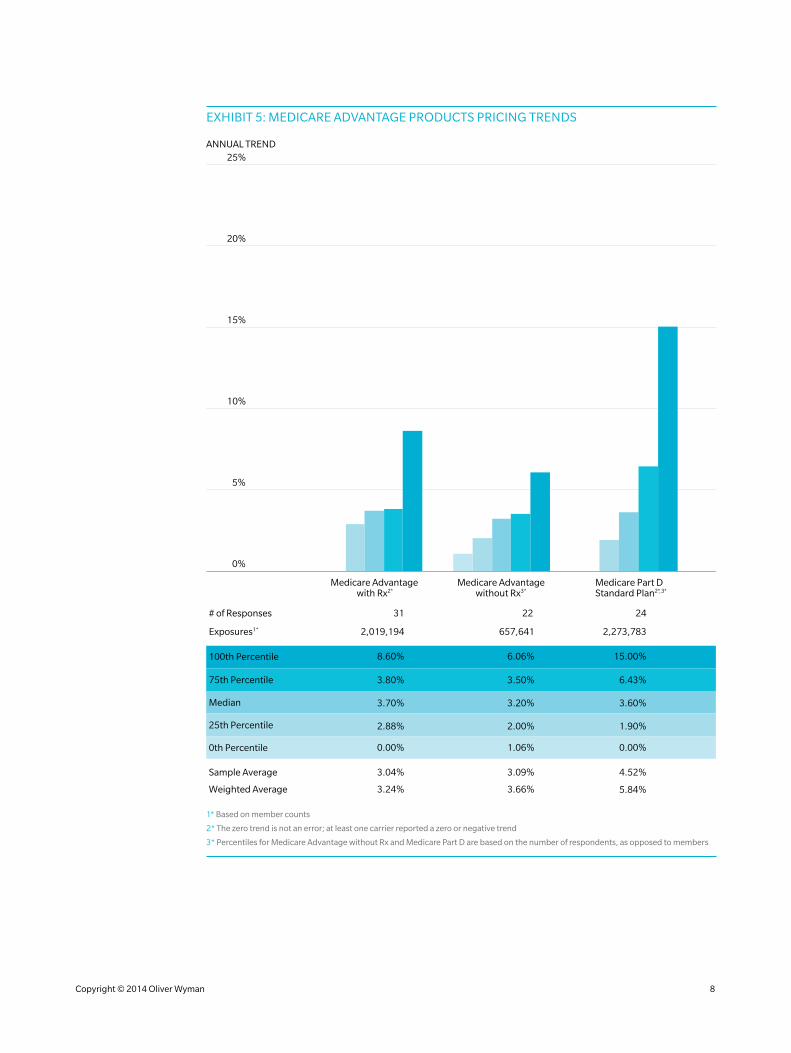
EXHIBIT 5: MEDICARE ADVANTAGE PRODUCTS PRICING TRENDS
5%
10%
15%
20%
25%
# of Responses
Exposures1*
75th Percentile
Median
25th Percentile
0th Percentile
ANNUAL TREND
100th Percentile
Sample Average
Weighted Average
3.50%
3.20%
2.00%
1.06%
22
657,641
6.06%
3.09%
3.66%
6.43%
3.60%
1.90%
0.00%
4.52%
5.84%
24
2,273,783
15.00%
3.80%
3.70%
2.88%
0.00%
31
2,019,194
8.60%
3.04%
3.24%
0%
Medicare Advantagewith Rx2*
Medicare Advantagewithout Rx3*
Medicare Part D Standard Plan2*,3*
1* Based on member counts
2* The zero trend is not an error; at least one carrier reported a zero or negative trend
3* Percentiles for Medicare Advantage without Rx and Medicare Part D are based on the number of respondents, as opposed to members
Copyright © 2014 Oliver Wyman 8

EXHIBIT 6: HIGH DEDUCTIBLE HEALTH PLANS PRICING TRENDS
5%
10%
15%
20%
25%
# of Responses
Exposures1*
75th Percentile
Median
25th Percentile
0th Percentile
ANNUAL TREND
9.50%
9.40%
7.80%
2.20%
54
6,113,365
9.40%
7.30%
7.00%
1.90%
23
4,760,340
10.00%
9.50%
8.01%
4.00%
40
527,885
13
266,260
100th Percentile 13.60% 10.60% 12.25% 9.52%
8.01%
7.30%
5.60%
5.04%
Sample Average
Weighted Average
8.62%
8.63%
7.92%
8.04%
8.05%
8.64%
7.46%
7.32%
0%
Group MedicalHSA with Rx
Group MedicalHSA without Rx
Individual MedicalHSA with Rx
Individual MedicalHSA without Rx
1* Based on member counts
Copyright © 2014 Oliver Wyman 9

EXHIBIT 7: INDIVIDUAL MEDICAL PRICING TRENDS
5%
10%
15%
20%
25%
# of Responses
Exposures1*
75th Percentile
Median
25th Percentile
0th Percentile
ANNUAL TREND
10.83%
8.86%
8.00%
4.00%
22
87,848
9.52%
6.50%
5.60%
4.00%
41
2,937,888
9.20%
8.40%
7.00%
5.04%
9
230,302
30
458,906
100th Percentile 16.79% 18.00% 10.00% 11.75%
9.52%
8.30%
7.00%
0.00%
Sample Average
Weighted Average
9.47%
12.07%
7.82%
7.68%
8.03%
8.90%
7.53%
8.00%
0%
Individual MedicalIndemnity2*
Individual MedicalPPO
Individual MedicalPOS2*
Individual MedicalHMO3*
1* Based on member counts
2* Percentiles for Individual Medical Indemnity and Individual Medical POS are based on the number of respondents, as opposed to members
3* The zero trend is not an error; at least one carrier reported a zero or negative trend
Copyright © 2014 Oliver Wyman 10

EXHIBIT 8: STOP LOSS, ASO FEES AND MEDICAID PRICING TRENDS
5%
10%
15%
20%
25%
# of Responses
Exposures1*
75th Percentile
Median
25th Percentile
0th Percentile
ANNUAL TREND
14.15%
12.65%
9.49%
4.94%
15
1,595,062
17.38%
15.04%
8.57%
8.00%
16
2,011,888
4.15%
3.00%
2.59%
0.00%
32
18,755,967
14
2,413,483
100th Percentile 16.13% 21.70% 11.09% 7.40%
3.45%
2.55%
1.30%
0.85%
Sample Average
Weighted Average
11.60%
11.80%
14.04%
14.96%
3.95%
8.35%
3.05%
2.27%
0%
$50,000 SpecificStop Loss2*
$150,000 SpecificStop Loss2*
ASO Fees2*,3* Medicaid2*
1* Based on member counts
2* Percentiles for Stop Loss products, ASO fees, and Medicaid are based on the number of respondents, as opposed to members
3* The zero trend is not an error; at least one carrier reported a zero or negative trend
Copyright © 2014 Oliver Wyman 11
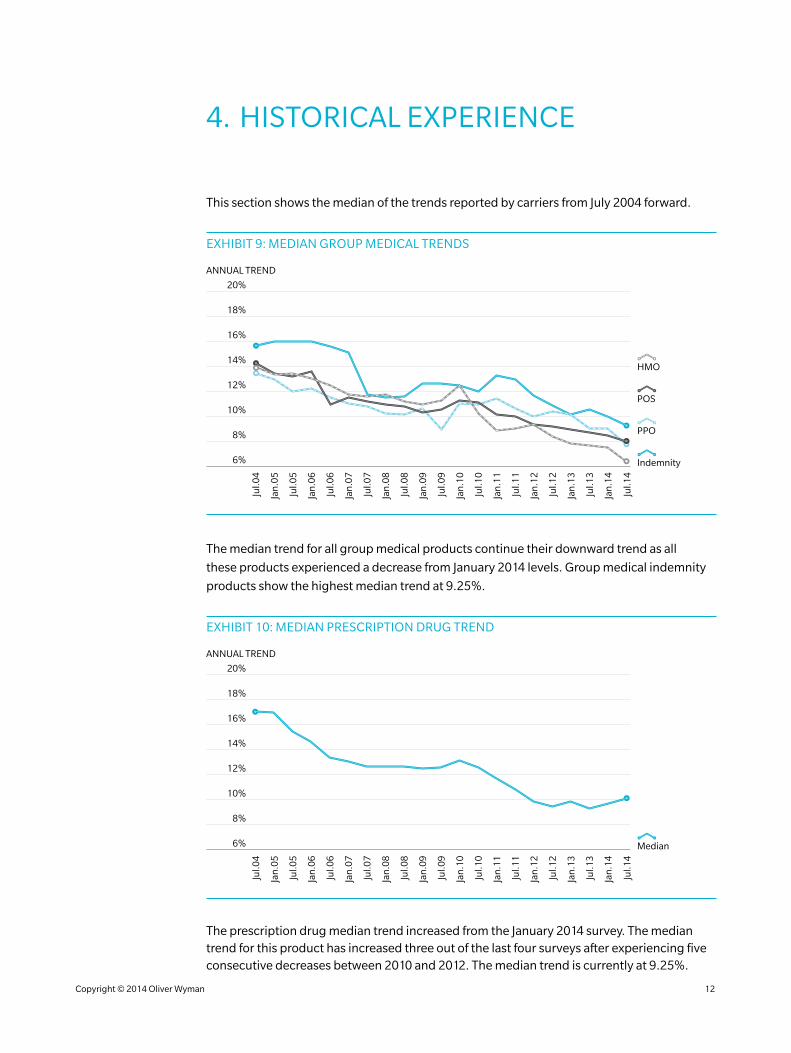
4. HISTORICAL EXPERIENCE
This section shows the median of the trends reported by carriers from July 2004 forward.
EXHIBIT 9: MEDIAN GROUP MEDICAL TRENDS
14%
18%
16%
10%
8%
12%
6%
20%
Indemnity
PPO
POS
HMO
Jul.1
4
Jul.0
4
Jan
.05
Jul.0
5
Jan
.06
Jul.0
6
Jan
.07
Jul.0
7
Jan
.08
Jul.0
8
Jan
.09
Jul.0
9
Jan
.10
Jul.1
0
Jan
.11
Jul.1
1
Jan
.12
Jul.1
2
Jan
.13
Jul.1
3
Jan
.14
ANNUAL TREND
The median trend for all group medical products continue their downward trend as all
these products experienced a decrease from January 2014 levels. Group medical indemnity
products show the highest median trend at 9.25%.
EXHIBIT 10: MEDIAN PRESCRIPTION DRUG TREND
14%
18%
16%
10%
8%
12%
6%
20%
Median
ANNUAL TREND
Jul.1
4
Jul.0
4
Jan
.05
Jul.0
5
Jan
.06
Jul.0
6
Jan
.07
Jul.0
7
Jan
.08
Jul.0
8
Jan
.09
Jul.0
9
Jan
.10
Jul.1
0
Jan
.11
Jul.1
1
Jan
.12
Jul.1
2
Jan
.13
Jul.1
3
Jan
.14
The prescription drug median trend increased from the January 2014 survey. The median trend for this product has increased three out of the last four surveys after experiencing five consecutive decreases between 2010 and 2012. The median trend is currently at 9.25%.
Copyright © 2014 Oliver Wyman 12
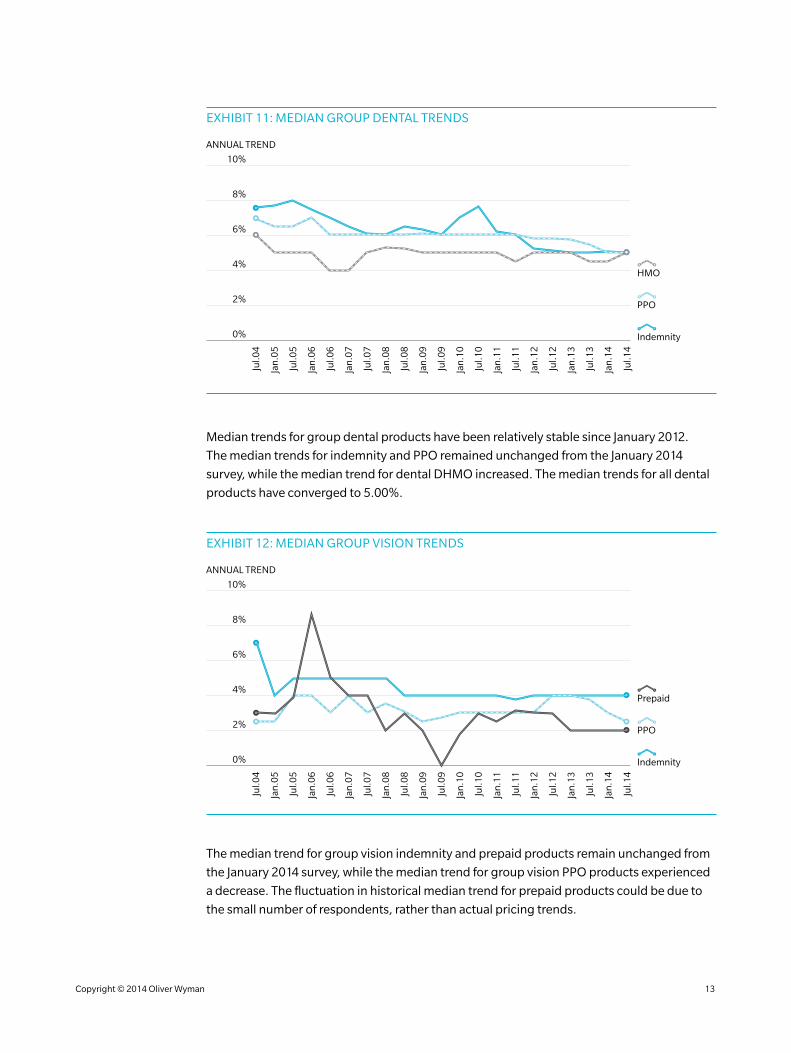
EXHIBIT 11: MEDIAN GROUP DENTAL TRENDS
8%
4%
2%
6%
0%
10%
Indemnity
PPO
HMO
ANNUAL TREND
Jul.1
4
Jul.0
4
Jan
.05
Jul.0
5
Jan
.06
Jul.0
6
Jan
.07
Jul.0
7
Jan
.08
Jul.0
8
Jan
.09
Jul.0
9
Jan
.10
Jul.1
0
Jan
.11
Jul.1
1
Jan
.12
Jul.1
2
Jan
.13
Jul.1
3
Jan
.14
Median trends for group dental products have been relatively stable since January 2012.
The median trends for indemnity and PPO remained unchanged from the January 2014
survey, while the median trend for dental DHMO increased. The median trends for all dental
products have converged to 5.00%.
EXHIBIT 12: MEDIAN GROUP VISION TRENDS
8%
4%
2%
6%
0%
10%
Indemnity
PPO
Prepaid
ANNUAL TREND
Jul.1
4
Jul.0
4
Jan
.05
Jul.0
5
Jan
.06
Jul.0
6
Jan
.07
Jul.0
7
Jan
.08
Jul.0
8
Jan
.09
Jul.0
9
Jan
.10
Jul.1
0
Jan
.11
Jul.1
1
Jan
.12
Jul.1
2
Jan
.13
Jul.1
3
Jan
.14
The median trend for group vision indemnity and prepaid products remain unchanged from
the January 2014 survey, while the median trend for group vision PPO products experienced
a decrease. The fluctuation in historical median trend for prepaid products could be due to
the small number of respondents, rather than actual pricing trends.
Copyright © 2014 Oliver Wyman 13
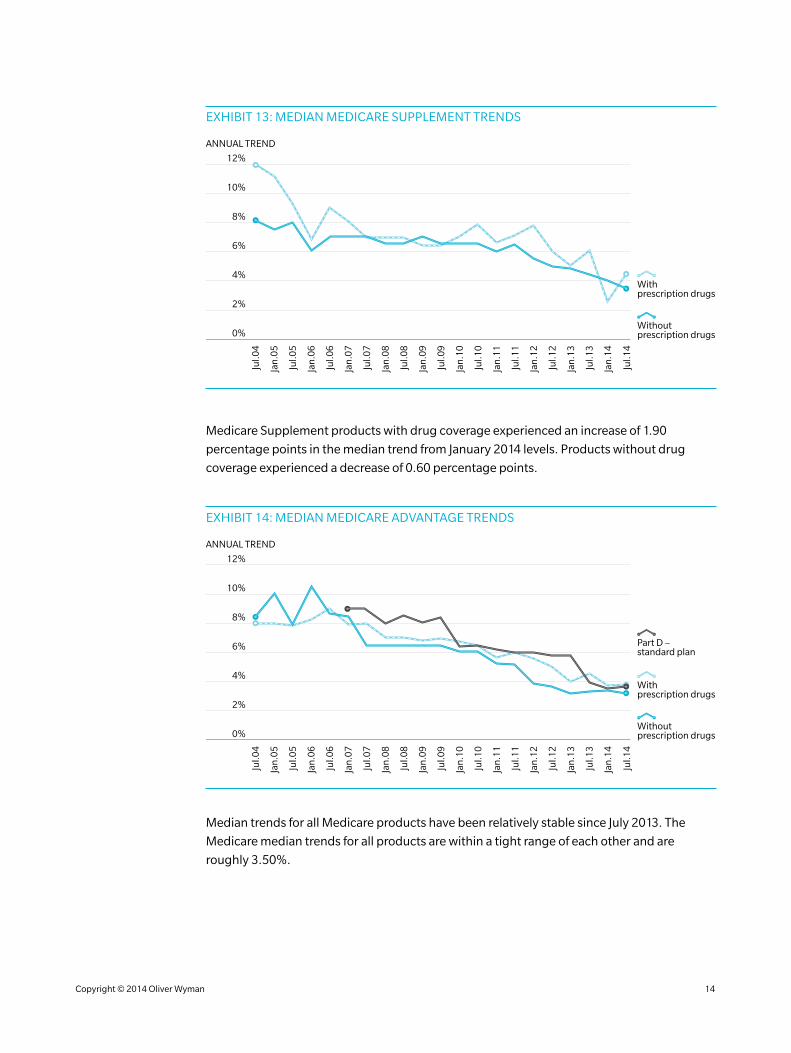
EXHIBIT 13: MEDIAN MEDICARE SUPPLEMENT TRENDS
8%
4%
2%
6%
0%
12%
10%
ANNUAL TREND
Withoutprescription drugs
Withprescription drugs
Jul.1
4
Jul.0
4
Jan
.05
Jul.0
5
Jan
.06
Jul.0
6
Jan
.07
Jul.0
7
Jan
.08
Jul.0
8
Jan
.09
Jul.0
9
Jan
.10
Jul.1
0
Jan
.11
Jul.1
1
Jan
.12
Jul.1
2
Jan
.13
Jul.1
3
Jan
.14
Medicare Supplement products with drug coverage experienced an increase of 1.90
percentage points in the median trend from January 2014 levels. Products without drug
coverage experienced a decrease of 0.60 percentage points.
EXHIBIT 14: MEDIAN MEDICARE ADVANTAGE TRENDS
8%
4%
2%
6%
0%
12%
10%
ANNUAL TREND
Withoutprescription drugs
Part D –standard plan
Withprescription drugs
Jul.1
4
Jul.0
4
Jan
.05
Jul.0
5
Jan
.06
Jul.0
6
Jan
.07
Jul.0
7
Jan
.08
Jul.0
8
Jan
.09
Jul.0
9
Jan
.10
Jul.1
0
Jan
.11
Jul.1
1
Jan
.12
Jul.1
2
Jan
.13
Jul.1
3
Jan
.14
Median trends for all Medicare products have been relatively stable since July 2013. The
Medicare median trends for all products are within a tight range of each other and are
roughly 3.50%.
Copyright © 2014 Oliver Wyman 14

EXHIBIT 15: MEDIAN HIGH DEDUCTIBLE HEALTH PLAN TRENDS
16%
10%
8%
12%
14%
6%
18%
Jul.1
4
Jan
.05
Jul.0
5
Jan
.06
Jul.0
6
Jan
.07
Jul.0
7
Jan
.08
Jul.0
8
Jan
.09
Jul.0
9
Jan
.10
Jul.1
0
Jan
.11
Jul.1
1
Jan
.12
Jul.1
2
Jan
.13
Jul.1
3
Jan
.14
ANNUAL TREND
Individual Medicalwithout Rx
Group Medicalwithout Rx
Individual Medicalwith Rx
Group Medicalwith Rx
The median trend increased from the January 2014 survey for individual medical HSA plans
with drug coverage, while the median trends for all other HSA products remained the same as
the January 2014 trends. The median trends for HSA products with drug coverage are roughly
two percentage points higher than HSA products not offering drug coverage.
EXHIBIT 16: MEDIAN INDIVIDUAL MEDICAL TRENDS
14%
18%
16%
10%
8%
12%
6%
20%
Indemnity
PPO
HMO
POS
ANNUAL TREND
Jul.1
4
Jul.0
4
Jan
.05
Jul.0
5
Jan
.06
Jul.0
6
Jan
.07
Jul.0
7
Jan
.08
Jul.0
8
Jan
.09
Jul.0
9
Jan
.10
Jul.1
0
Jan
.11
Jul.1
1
Jan
.12
Jul.1
2
Jan
.13
Jul.1
3
Jan
.14
The median trend for individual medical HMO and PPO products decreased from the January
2014 survey, while the median trend for individual medical indemnity and POS products
increased from the January 2014 survey. The highest median trend is among the individual
medical indemnity products at 8.86%.
Copyright © 2014 Oliver Wyman 15
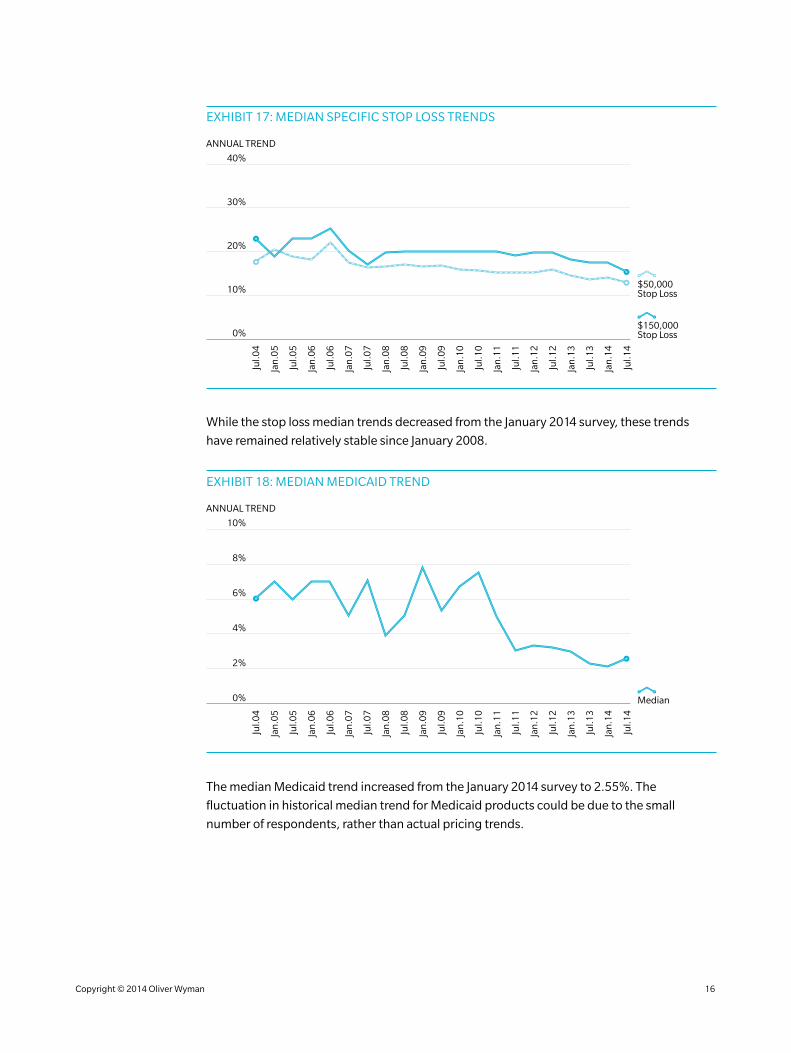
EXHIBIT 17: MEDIAN SPECIFIC STOP LOSS TRENDS
20%
10%
0%
40%
30%
ANNUAL TREND
$150,000Stop Loss
$50,000Stop Loss
Jul.1
4
Jul.0
4
Jan
.05
Jul.0
5
Jan
.06
Jul.0
6
Jan
.07
Jul.0
7
Jan
.08
Jul.0
8
Jan
.09
Jul.0
9
Jan
.10
Jul.1
0
Jan
.11
Jul.1
1
Jan
.12
Jul.1
2
Jan
.13
Jul.1
3
Jan
.14
While the stop loss median trends decreased from the January 2014 survey, these trends
have remained relatively stable since January 2008.
EXHIBIT 18: MEDIAN MEDICAID TREND
6%
4%
2%
0%
10%
8%
ANNUAL TREND
Median
Jul.1
4
Jul.0
4
Jan
.05
Jul.0
5
Jan
.06
Jul.0
6
Jan
.07
Jul.0
7
Jan
.08
Jul.0
8
Jan
.09
Jul.0
9
Jan
.10
Jul.1
0
Jan
.11
Jul.1
1
Jan
.12
Jul.1
2
Jan
.13
Jul.1
3
Jan
.14
The median Medicaid trend increased from the January 2014 survey to 2.55%. The
fluctuation in historical median trend for Medicaid products could be due to the small
number of respondents, rather than actual pricing trends.
Copyright © 2014 Oliver Wyman 16

EXHIBIT 19: MEDIAN ASO FEES TREND
6%
4%
2%
0%
10%
8%
ANNUAL TREND
Median
Jul.1
4
Jul.0
4
Jan
.05
Jul.0
5
Jan
.06
Jul.0
6
Jan
.07
Jul.0
7
Jan
.08
Jul.0
8
Jan
.09
Jul.0
9
Jan
.10
Jul.1
0
Jan
.11
Jul.1
1
Jan
.12
Jul.1
2
Jan
.13
Jul.1
3
Jan
.14
The median trend for ASO is 3.00%, which is unchanged from the January 2014 survey. The
median trend has been relatively stable since July 2009.
Copyright © 2014 Oliver Wyman 17

5. PARTICIPATING PROVIDERS
Aetna Guarantee Trust Life Insurance Company
Altius Health Plans Harvard Pilgrim Health Care
American Enterprise Health America
Ameritas Life Insurance Corp. Health Care Service Corporation
Anthem Blue Cross and Blue Shield (Colorado) Health Net of California, Inc.
Anthem Blue Cross and Blue Shield (Connecticut) HealthAmerica Pennsylvania, Inc.
Anthem Blue Cross and Blue Shield (Maine) Highmark Blue Cross Blue Shield
Anthem Blue Cross and Blue Shield (Nevada) Highmark Blue Cross Blue Shield of Delaware
Anthem Blue Cross and Blue Shield (New Hampshire) Highmark Blue Cross Blue Shield of West Virginia
Anthem Blue Cross and Blue Shield of Indiana Highmark Blue Shield
Anthem Blue Cross and Blue Shield of Kentucky HM Insurance Group
Anthem Blue Cross and Blue Shield of Missouri Horizon Blue Cross Blue Shield New Jersey
Anthem Blue Cross and Blue Shield of Ohio Humana
Anthem Blue Cross and Blue Shield of Virginia HumanaOne
Anthem Blue Cross and Blue Shield United of Wisconsin Humana Specialty Benefits
Blue Care Network of Michigan Independence Blue Cross
Blue Cross and Blue Shield of Kansas City ING Reliastar
Blue Cross and Blue Shield of Nebraska Kaiser Permanente
Blue Cross and Blue Shield of North Carolina Medical Mutual of Ohio
Blue Cross Blue Shield of Arizona Moda Health
Blue Cross Blue Shield of Illinois Network Health Plan
Blue Cross Blue Shield of Louisiana Nippon Life Insurance Company of America
Blue Cross Blue Shield of Massachusetts Northeast Delta Dental
Blue Cross Blue Shield of Michigan Optima Health
Blue Cross Blue Shield of Minnesota Paramount Health Care
Blue Cross Blue Shield of New Mexico Personal Care
Blue Cross Blue Shield of Oklahoma Physicians Health Plan of Northern Indiana, Inc.
Blue Cross Blue Shield of Texas Preferred Health Systems
BlueCross BlueShield of Tennessee Premera Blue Cross of Alaska
Blue Cross and Blue Shield of Georgia Premera Blue Cross of Washington
Blue Cross of California Priority Health
Blue Cross of Idaho Providence Health Plan
Capital Blue Cross Regence Blue Cross Blue Shield of Oregon
CareFirst BlueCross BlueShield Regence Blue Cross Blue Shield of Utah
Carefirst BCBS Maryland Regence Blue Shield of Idaho
Carelink Regence Blue Shield of Washington
CIGNA Health Care Security Health
Coventry SelectHealth
Davis Vision, Inc. Sentry Life Insurance Company
Dean Health Plan Southern Health
Delta Dental of Iowa The Health Plan of the Upper Ohio Valley/THP Insurance
Delta Dental of Kansas Transamerica Life Insurance Company
Empire Blue Cross and Blue Shield (New York) Trustmark Life Insurance Company
EPIC Life Insurance Company Tufts Health Plan
Everence United Concordia Dental
Excellus BlueCross BlueShield (Central New York) UnitedHealthcare
Excellus BlueCross BlueShield (Rochester) Unity Health Plans Insurance Corporation
Excellus BlueCross BlueShield (Utica) Universal American
Florida Blue WEA Insurance Corporation
Group Health Cooperative Wellmark Blue Cross and Blue Shield of Iowa
Group Health Options, Incorporated Wellmark Blue Cross and Blue Shield of South Dakota
Copyright © 2014 Oliver Wyman 18

6. EXPOSURES BY LINE OF BUSINESS
NUMBER OF CARRIERS RESPONDING NUMBER OF RESPONSES
TOTAL REPORTED EXPOSURE
GROUP MEDICAL
IndemnityPPOPOSHMO
31473441
42664164
2,386,69656,009,45918,644,26416,000,949
93,041,368
INDIVIDUAL MEDICAL
IndemnityPPOPOSHMO
1827
924
2241
930
87,8482,937,888
230,302458,906
3,714,944
HIGH DEDUCTIBLE HEALTH PLANS
Group Medical HSA with RxGroup Medical HSA without RxIndividual Medical HSA with RxIndividual Medical HSA without Rx
381727
6
54234013
6,113,3654,760,340
527,885266,260
11,667,850
PRESCRIPTION DRUG 49 79 59,803,301
MEDICARE SUPPLEMENT
Products with Rx benefitsProducts without Rx benefits
2337
2948
408,2791,928,276
2,336,555
MEDICARE ADVANTAGE
Products with Rx benefitsProducts without Rx benefits
2216
3122
2,019,194657,641
2,676,835
MEDICARE PART D STANDARD PLAN 18 24 2,273,783
MEDICAID 11 14 2,413,483
GROUP DENTAL
IndemnityPPODHMO
233415
354415
4,892,86239,436,608
4,322,56848,652,038
GROUP VISION
IndemnityPPOPrepaid
1219
3
1921
7
4,351,36436,773,910
741,86841,867,142
SPECIFIC STOP-LOSS
$50,000$150,000
1314
1516
1,595,0622,011,888
3,606,950
ASO FEES 23 32 18,755,967
This table shows the number of responses and the exposure by type of coverage. Not all carriers provide the entire range of products surveyed. Some carriers returned more than one response to distinguish trends by region.
The “Number of Responses” and “Total Reported Exposure” columns match the first and second summary rows of the graphs named “# of Responses” and “Exposures” found in Section 3 of the report. The exposure numbers shown are those reported. No attempt has been made to account for any “double counting” resulting from dual coverage.
Copyright © 2014 Oliver Wyman 19

7. ABOUT US
Oliver Wyman is an international management consulting firm. With more than
3,000 professionals in over 50 cities around the globe, Oliver Wyman combines deep
industry knowledge with specialized expertise in strategy, operations, risk management,
organizational transformation leadership development. The firm helps clients optimize their
businesses, improve their operations and risk profile, and accelerate their organizational
performance to seize the most attractive opportunities. As part of Marsh & McLennan
Companies (NYSE: MMC), Oliver Wyman is also able to draw on experts from our sister
companies in the areas of brand and identity management, microeconomics, human capital
strategies, insurance security.
The actuarial consulting practice of Oliver Wyman employs over 90 credentialed actuaries
in North America across 13 offices. The firm’s actuaries provide independent, objective
advice by combining a broad range of expertise with specialized knowledge of specific
risks. Oliver Wyman is committed to unparalleled mastery in actuarial and risk sciences,
continually renewed by the breadth of each consultant’s experiences and independent
research. The actuarial practice continuously researches methods for evaluating, measuring
reporting on risk and provides clear, timely communications in the three primary areas of risk
for organizations: property and casualty, life and annuities, and healthcare.
Oliver Wyman’s team of health actuaries are the leaders in innovative solutions to the ever
changing healthcare environment. As the trusted advisors to insurers, healthcare providers,
government agencies, law firms and regulators, clients turn to Oliver Wyman for high-level
strategic advice, and the ability to model proposed reforms and respond to changes in
regulations on both the state and federal levels. In addition to traditional actuarial services,
such as the estimation of premium rates and claim liabilities, Oliver Wyman’s health actuarial
services include product pricing, rating models, annual statement certification, product
feasibility, due diligence, reserve certifications, Medicare Advantage and Medicare Part D
pricing and attestations, expert witness testimony and provider contracting models.
Copyright © 2014 Oliver Wyman 20

DISCLAIMERThe trends and exposures in the Carrier Trend Report are the trends and exposures that carriers provided in the Carrier Trend Survey. No audit was performed on the trends and exposures reported to ensure accuracy. We did follow up with a few carriers that had responses outside the normal range of replies.
Oliver Wyman is providing this Carrier Trend Report as a sample of current carrier pricing trends without endorsing, certifying, or recommending these trends for specific application.

www.oliverwyman.com
For more information about this report or if you would like to participate in future surveys, please contact Karen K. Bender, FCA, ASA, MAAA or Beth R. Fritchen, FSA, MAAA.
Karen K. Bender FCA, ASA, MAAA
+1 920 826 2422 [email protected]
Beth R. Fritchen FSA, MAAA
+1 312 345 3378 [email protected]
Related Documents