Z NXP Semiconductors Investor Presentation January 2013

Welcome message from author
This document is posted to help you gain knowledge. Please leave a comment to let me know what you think about it! Share it to your friends and learn new things together.
Transcript

Z
NXP Semiconductors Investor Presentation January 2013

This document includes forward-looking statements which include statements regarding our business strategy, financial condition, results of
operations, and market data, as well as any other statements which are not historical facts. By their nature, forward- looking statements are subject
to numerous factors, risks and uncertainties that could cause actual outcomes and results to be materially different from those projected. These
factors, risks and uncertainties include the following: market demand and semiconductor industry conditions, our ability to successfully introduce
new technologies and products, the demand for the goods into which our products are incorporated, our ability to generate sufficient cash, raise
sufficient capital or refinance our debt at or before maturity to meet both our debt service and research and development and capital investment
requirements, our ability to accurately estimate demand and match our production capacity accordingly or obtain supplies from third-party
producers, our access to production from third-party outsourcing partners, and any events that might affect their business or our relationship with
them, our ability to secure adequate and timely supply of equipment and materials from suppliers, our ability to avoid operational problems and
product defects and, if such issues were to arise, to rectify them quickly, our ability to form strategic partnerships and joint ventures and successfully
cooperate with our alliance partners, our ability to win competitive bid selection processes to develop products for use in our customers’ equipment
and products, our ability to successfully establish a brand identity, our ability to successfully hire and retain key management and senior product
architects; and, our ability to maintain good relationships with our suppliers. In addition, this document contains information concerning the
semiconductor industry and our business segments generally, which is forward-looking in nature and is based on a variety of assumptions regarding
the ways in which the semiconductor industry, our market segments and product areas will develop. We have based these assumptions on
information currently available to us, if any one or more of these assumptions turn out to be incorrect, actual market results may differ from those
predicted. While we do not know what impact any such differences may have on our business, if there are such differences, our future results of
operations and financial condition, and the market price of the notes, could be materially adversely affected. Readers are cautioned not to place
undue reliance on these forward-looking statements, which speak to results only as of the date the statements were made; and, except for any
ongoing obligation to disclose material information as required by the United States federal securities laws, we do not have any intention or
obligation to publicly update or revise any forward-looking statements after we distribute this document, whether to reflect any future events or
circumstances or otherwise. For a discussion of potential risks and uncertainties, please refer to the risk factors listed in our SEC filings. Copies of
our filings are available from our Investor Relations department or from the SEC website, www.sec.gov.
Forward Looking Statement

Leverage unique HPMS capabilities to power new product engine
Margin expansion into long-term model
Focused on high growth application segments fueled by key mega-trends
Multiple growth drivers across a range of target applications
Capital structure de-leveraging
Business Strategy
Above-market Sales Growth
Unparalleled Earnings Leverage
1
2
3
4
5
Key Mega-Trends (>$1,100 billion spend1)
Highest Growth Segments in 8 Priority Application Areas
Application-optimized analog and digital solutions that help our customers to truly differentiate their products in terms of features, cost and time to market
4
Energy Efficiency
Connected Devices
Security
Focused on Growth from Key Mega Trends
Health
Automotive Identification Wireless
Infrastructure Industrial Mobile Lighting Computing Consumer
1. Represents estimated market size of the sectors shown
High-Performance Mixed-Signal Solutions
require
to address
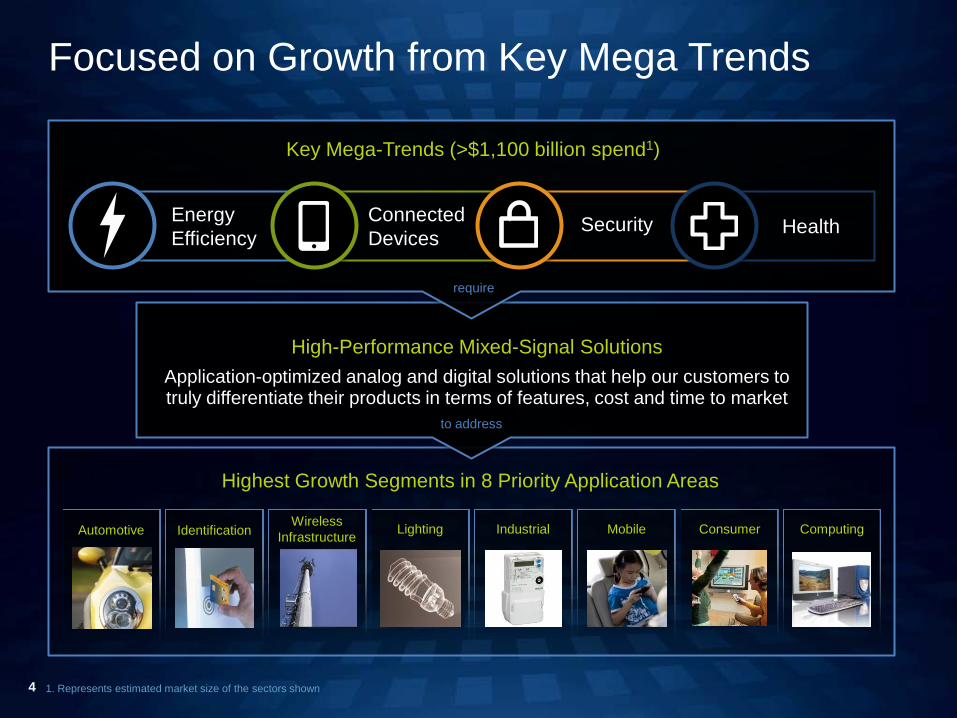
Competitive HPMS Product Franchises
• Large and fast growing
• Broad and diverse customer base
• High barriers to entry
• “Sticky” customer relationships
• Long product life cycles
• Greater price stability
• Sustainable and higher margins
Characteristics of HPMS Market
5
2012 Product Segment Contribution ($M)
Automotive $939M
+1% Y-Y 23% of Total
Identification $986
+41% Y-Y 24% of Total Infrastructure
& Industrial $604M
(2%) Y-Y 15% of Total
Portable & Computing
$753M +14% Y-Y
18% of Total
Standard Products $832M
(10%) Y-Y 20% of Total
• Deep IP and patent portfolio
• Leading RF, cryptography, mixed-signal, power and system design capabilities
• Broad mixed signal product portfolio
• Differentiated process technology
• World-class mixed-signal and packaging manufacturing assets
Competitive Advantages

Revenue ($M) Non-GAAP Gross Margin
NXP Business Trends
Non-GAAP Operating Margin Adj. EBITDA Margin
$1,082 $1,121 $1,060 $931 $978
$1,094 $1,170 $1,116
Q1 11 Q2 11 Q3 11 Q4 11 Q1 12 Q2 12 Q3 12 Q4 12
47.8% 47.8% 48.3% 45.4% 44.3%
46.2% 46.3% 46.1%
Q1 11 Q2 11 Q3 11 Q4 11 Q1 12 Q2 12 Q3 12 Q4 12
20.6% 20.4% 19.8%
15.9% 14.4%
18.6% 19.8% 18.7%
Q1 11 Q2 11 Q3 11 Q4 11 Q1 12 Q2 12 Q3 12 Q4 12
27.3% 26.7% 26.3% 23.7%
21.0% 24.6% 25.1% 24.6%
Q1 11 Q2 11 Q3 11 Q4 11 Q1 12 Q2 12 Q3 12 Q4 12
6
7
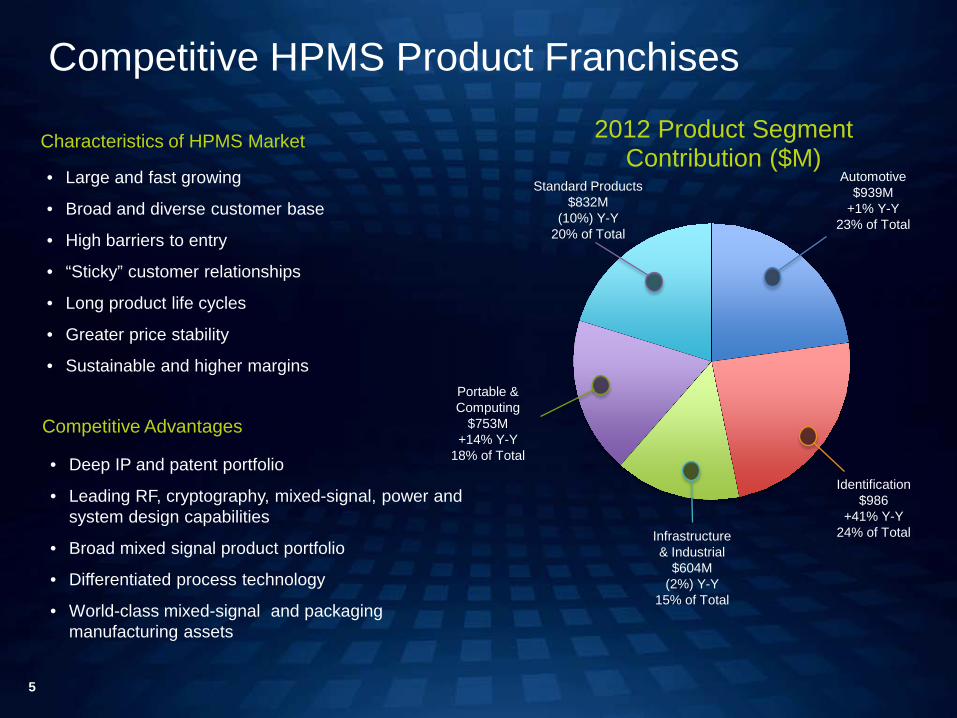
HPMS Revenue and Gross Margin HPMS Operating Income and Margin
Business Segment Revenue and Margin Trends
STDP Revenue and Gross Margin STDP Operating Income and Margin
$742 $779 $726 $659 $710 $803 $901 $868
57.0%
55.6% 56.5%
52.4% 51.5%
53.3%
51.6% 52.4%
Q1 11 Q2 11 Q3 11 Q4 11 Q1 12 Q2 12 Q3 12 Q4 12
HPMS Revenue($M) Non-GAAP HPMS Gross Margin
$175 $166 $149 $111 $123 $176 $208 $196
23.6%
21.3% 20.5%
16.8% 17.3%
21.9% 23.1% 22.6%
Q1 11 Q2 11 Q3 11 Q4 11 Q1 12 Q2 12 Q3 12 Q4 12
HPMS Operating Income($M) Non-GAAP HPMS Operating Margin
$49 $63 $55 $37 $22 $32 $33 $20
20.7%
25.6% 22.5%
18.7%
10.9%
14.6% 15.5%
10.1%
Q1 11 Q2 11 Q3 11 Q4 11 Q1 12 Q2 12 Q3 12 Q4 12
STDP Operating Income($M) Non-GAAP STDP Operating Margin
$237 $246 $244 $198 $202 $219 $213 $198
36.7% 37.8%
36.9% 36.4%
29.2% 30.6%
34.3%
28.3%
Q1 11 Q2 11 Q3 11 Q4 11 Q1 12 Q2 12 Q3 12 Q4 12
STDP Revenue($M) Non-GAAP STDP Gross Margin

$177 $177 $170 $137
$157 $179
$222 $195
Q1 11 Q2 11 Q3 11 Q4 11 Q1 12 Q2 12 Q3 12 Q4 12
$138 $157
$173 $149 $137 $146
$165 $156
Q1 11 Q2 11 Q3 11 Q4 11 Q1 12 Q2 12 Q3 12 Q4 12
$189 $194 $160 $155
$187 $234
$275 $290
Q1 11 Q2 11 Q3 11 Q4 11 Q1 12 Q2 12 Q3 12 Q4 12
$238 $251 $223 $218 $229 $244 $239 $227
Q1 11 Q2 11 Q3 11 Q4 11 Q1 12 Q2 12 Q3 12 Q4 12
8
Automotive Identification
HPMS Revenue Business Trends(1) ($M)
Note: 1. As of 2Q12, prior end market definitions for “Wireless Infrastructure, Lighting and Industrial” and “Mobile, Consumer and Computing” have been redefined to align internal management organization. All prior periods have
been realigned to conform with new end market definitions
5% Q-Q
(5%) Q-Q
(12%) Q-Q (5%) Q-Q
Infrastructure and Industrial Portable and Computing

9
Secular market trends and solutions Electronic Mobile Payments SmartMXTM
Security & Trusted Access Smart@IDTM
Secure Connected Mobility MIFARETM
Counterfeit prevention Market leader and innovator in identification market
Co-inventor of NFC with broad IP patent portfolio Leader in field proven contactless interoperability Proven vendor with complete NFC solution Strategic collaboration with Google
Recent innovations to drive growth NXP is driving broad-based NFC ecosystem adoption Authentication / Product tagging for inventory control New opportunities: e-metering, car control, telematics
Highlights Key Positions
# 1 eGov #1 Transport & Access
# 1 RFID
# 1 Infrastructure
#1 NFC
Aligned with Market Leaders
>1B contactless
touch points
The Connectivity Revolution
Identification 2012 Revenue = $986M, 24% Product Revenue
Authentication
Emerging Growth Engines
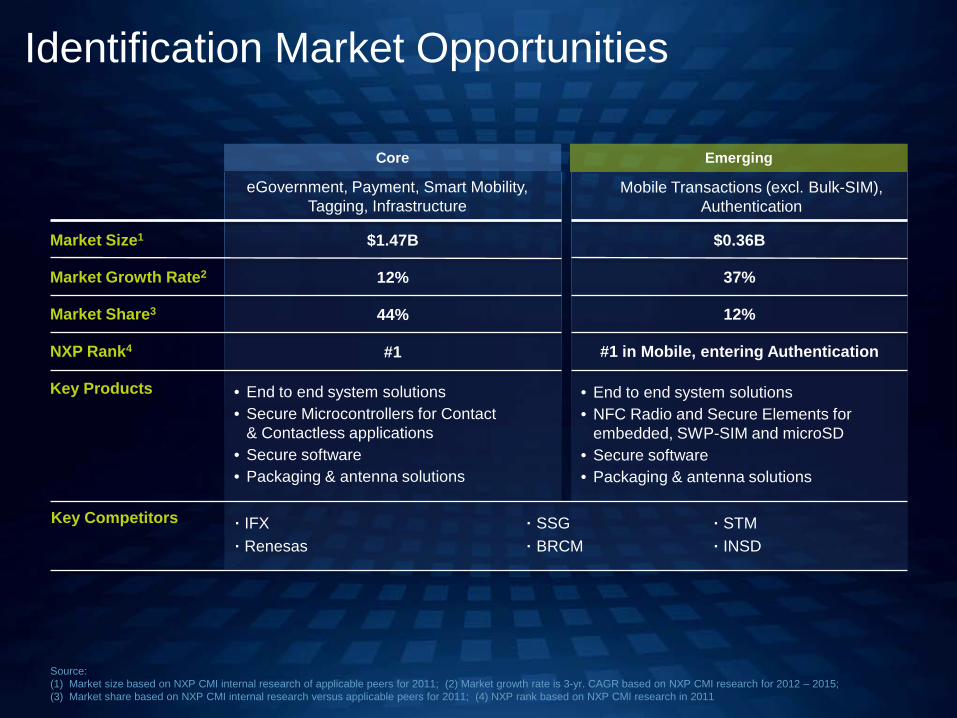
Emerging Core
Identification Market Opportunities
Market Size1
Market Growth Rate2
Market Share3
NXP Rank4
Key Products
• End to end system solutions • Secure Microcontrollers for Contact
& Contactless applications • Secure software • Packaging & antenna solutions
Mobile Transactions (excl. Bulk-SIM), Authentication
eGovernment, Payment, Smart Mobility, Tagging, Infrastructure
• End to end system solutions • NFC Radio and Secure Elements for
embedded, SWP-SIM and microSD • Secure software • Packaging & antenna solutions
$1.47B
12%
44%
#1
$0.36B
37%
12%
#1 in Mobile, entering Authentication
Key Competitors · IFX · SSG · STM · Renesas · BRCM · INSD
Source: (1) Market size based on NXP CMI internal research of applicable peers for 2011; (2) Market growth rate is 3-yr. CAGR based on NXP CMI research for 2012 – 2015; (3) Market share based on NXP CMI internal research versus applicable peers for 2011; (4) NXP rank based on NXP CMI research in 2011
11
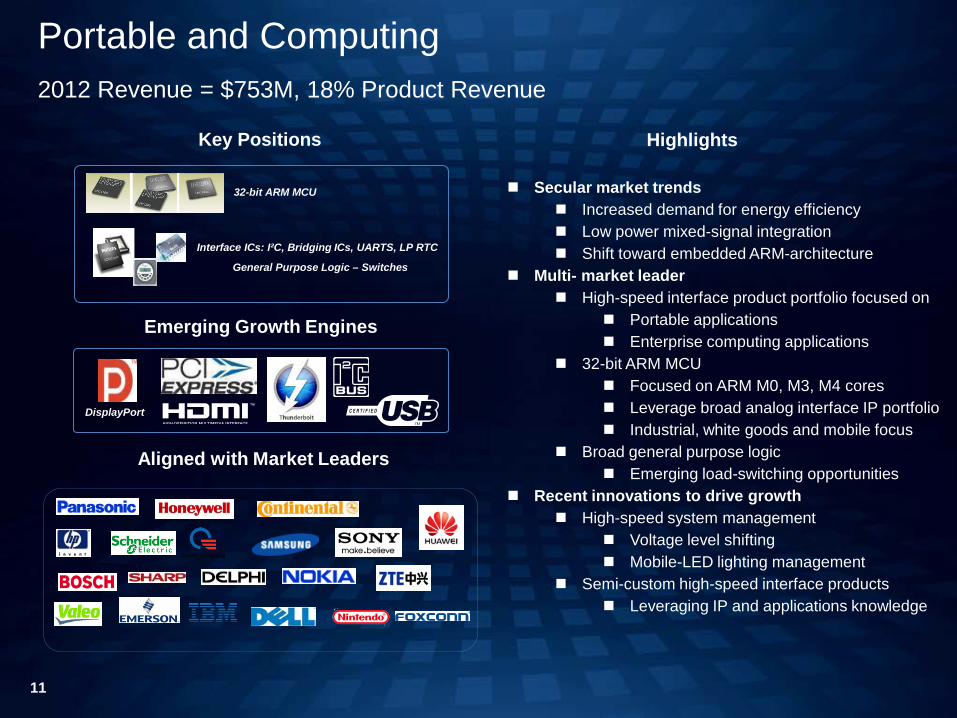
Secular market trends Increased demand for energy efficiency Low power mixed-signal integration Shift toward embedded ARM-architecture
Multi- market leader High-speed interface product portfolio focused on
Portable applications Enterprise computing applications
32-bit ARM MCU Focused on ARM M0, M3, M4 cores Leverage broad analog interface IP portfolio Industrial, white goods and mobile focus
Broad general purpose logic Emerging load-switching opportunities
Recent innovations to drive growth High-speed system management
Voltage level shifting Mobile-LED lighting management
Semi-custom high-speed interface products Leveraging IP and applications knowledge
Portable and Computing 2012 Revenue = $753M, 18% Product Revenue
Highlights
DisplayPort
Key Positions
Interface ICs: I²C, Bridging ICs, UARTS, LP RTC
Aligned with Market Leaders
Emerging Growth Engines
32-bit ARM MCU
General Purpose Logic – Switches

Portable & Computing Market Opportunities
Market Size1
Market Growth Rate2
Market Share3
NXP Rank4 Key Products
Key Competitors
Interface Products MCU Logic
$2.1B
4%
11%
#1 I2C, Multiprotocol
• Auto Display Drivers • Display Port • Thunderbolt • GPIO • UART • Level Shifters
$3B
4%
7%
#11 MCU
• Industrial Control • Building Automation • Consumer
$1.5B
2%
22%
#1 Volume, Auto, Mobile
• Voltage Translators • Data Mux • Logic Gates
$5B
10%
0%
N/A
• Smart Power • High Speed Smart Switches • Connector Hub • Sensor Hub
• TXN • ADI • STM
• STM • FSL • Renesas
• TXN • ONNN
• TXN • STM • MXIM
Mobility
Emerging Core
Source: (1) Market size based on NXP CMI internal research of applicable peers for 2011; (2) Market growth rate is 3-yr. CAGR based on NXP CMI research for 2012 – 2015; (3) Market share based on NXP CMI internal research versus applicable peers for 2011; (4) NXP rank based on NXP CMI research in 2011
13
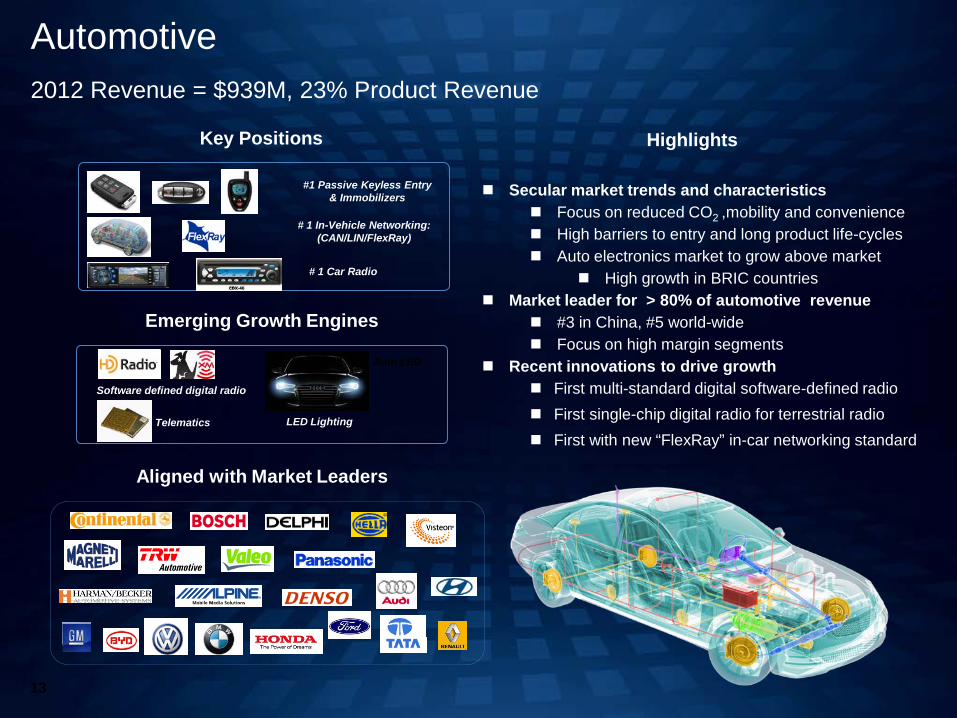
Secular market trends and characteristics Focus on reduced CO2 ,mobility and convenience High barriers to entry and long product life-cycles Auto electronics market to grow above market
High growth in BRIC countries Market leader for > 80% of automotive revenue
#3 in China, #5 world-wide Focus on high margin segments
Recent innovations to drive growth First multi-standard digital software-defined radio First single-chip digital radio for terrestrial radio First with new “FlexRay” in-car networking standard
Automotive 2012 Revenue = $939M, 23% Product Revenue
Highlights
# 1 Car Radio
#1 Passive Keyless Entry & Immobilizers
# 1 In-Vehicle Networking: (CAN/LIN/FlexRay)
Key Positions
Aligned with Market Leaders
Auto LED
Telematics
Software defined digital radio
Emerging Growth Engines
LED Lighting

Automotive Market Opportunities
Car Entertainment In-Vehicle Networking Car Access Magnetic
Sensors
Emerging
Market Size1
Market Growth Rate2
Market Share3
NXP Rank4
RMS5
Key Products
$1.2B
6%
35%
#1
1.5
$0.5B
6%
52%
#1
2.3
$0.4B
6%
41%
#1
2.6
$0.8B
5%
12%
#3
0.4
$0.2B
40%
0%
N/A
N/A
Key Competitors • STM • TXN • SLAB
• IFX • ATML • TXN
• TXN • ATML
• IFX • Allegro • MELE
• LLTC • TXN
Source: (1) Market size based on NXP CMI internal research of applicable peers for 2011; (2) Market growth rate is 3-yr. CAGR based on NXP CMI research for 2012 – 2015; (3) Market share based on NXP CMI internal research versus applicable peers for 2011; (4) NXP rank 2011; (5) Relative Market Share 2011
Core
Business
• Tuners • DSPs • Audio Amps
• CAN/LIN • FlexRay • Ethernet
• Immobilization • Keyless Entry/Go • SmartKey
• ABS Sensors • Angular
Sensors • Temp. Sensors
• LED Drivers • Intelligent
Traffic Management
15
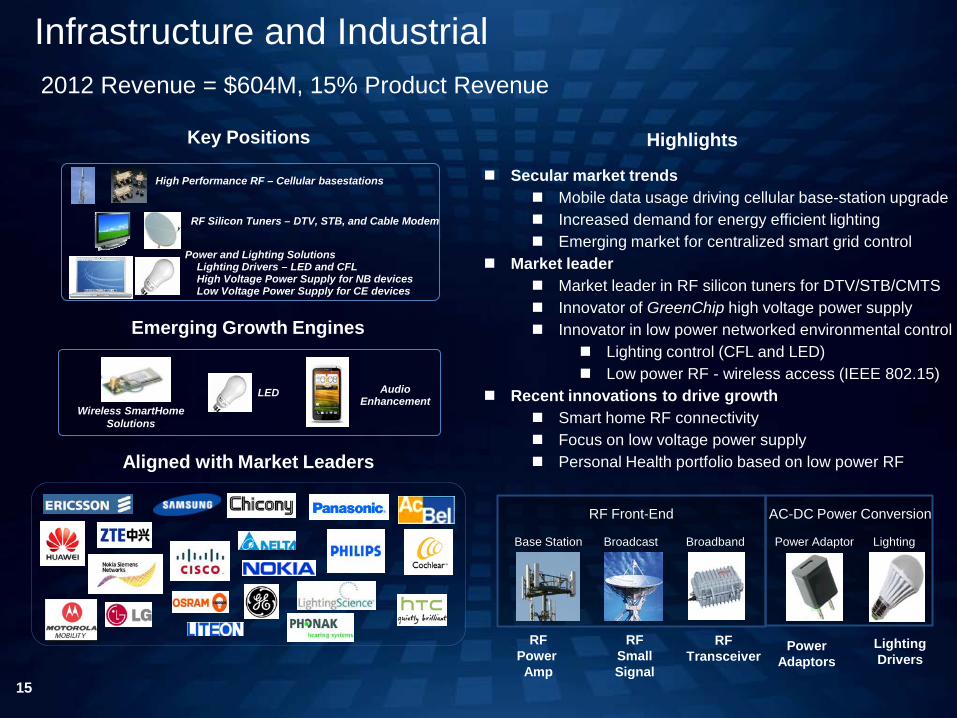
Secular market trends Mobile data usage driving cellular base-station upgrade Increased demand for energy efficient lighting Emerging market for centralized smart grid control
Market leader Market leader in RF silicon tuners for DTV/STB/CMTS Innovator of GreenChip high voltage power supply Innovator in low power networked environmental control
Lighting control (CFL and LED) Low power RF - wireless access (IEEE 802.15)
Recent innovations to drive growth Smart home RF connectivity Focus on low voltage power supply Personal Health portfolio based on low power RF
Infrastructure and Industrial 2012 Revenue = $604M, 15% Product Revenue
Highlights Key Positions
High Performance RF – Cellular basestations
Aligned with Market Leaders
Emerging Growth Engines
LED Wireless SmartHome
Solutions
Power and Lighting Solutions Lighting Drivers – LED and CFL High Voltage Power Supply for NB devices Low Voltage Power Supply for CE devices
RF Silicon Tuners – DTV, STB, and Cable Modem
Audio Enhancement
AC-DC Power Conversion RF Front-End
RF Power Amp
RF Small Signal
RF Transceiver
Base Station Broadcast Broadband
Power Adaptors
Lighting Drivers
Power Adaptor Lighting
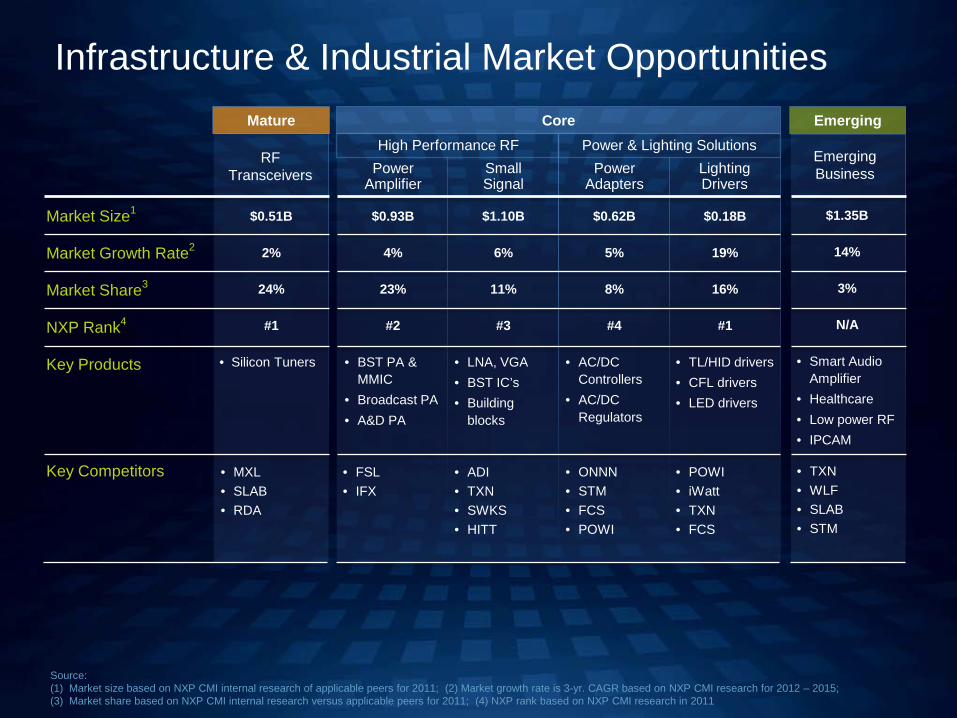
Infrastructure & Industrial Market Opportunities
Power Amplifier
Small Signal
Power Adapters
Lighting Drivers
Market Size1
Market Growth Rate2
Market Share3
NXP Rank4
Key Products
$0.93B
4%
23%
#2
• BST PA & MMIC
• Broadcast PA • A&D PA
$1.10B
6%
11%
#3
• LNA, VGA • BST IC’s • Building
blocks
$0.62B
5%
8%
#4
• AC/DC Controllers
• AC/DC Regulators
$0.18B
19%
16%
#1
• TL/HID drivers • CFL drivers • LED drivers
$1.35B
14%
3%
N/A
• Smart Audio Amplifier
• Healthcare • Low power RF • IPCAM
Key Competitors • FSL • IFX
• ADI • TXN • SWKS • HITT
• ONNN • STM • FCS • POWI
• POWI • iWatt • TXN • FCS
• TXN • WLF • SLAB • STM
Core
Emerging Business
High Performance RF Power & Lighting Solutions RF
Transceivers
$0.51B
2%
24%
#1
• Silicon Tuners
• MXL • SLAB • RDA
Mature Emerging
Source: (1) Market size based on NXP CMI internal research of applicable peers for 2011; (2) Market growth rate is 3-yr. CAGR based on NXP CMI research for 2012 – 2015; (3) Market share based on NXP CMI internal research versus applicable peers for 2011; (4) NXP rank based on NXP CMI research in 2011

China-based manufacturer of rectifiers & thyristors
Bipolar Power PowerMOS
Low voltage power MOSFETs for automotive &
high speed switching applications
Voltage regulators for the mobile, computing & consumer markets
Standard Linear Discretes
#2 worldwide in small signal diodes & transistors, #1 in
pure ESD Protection devices
LFPak, the toughest PowerSO8
Solutions for energy efficiency and system protection leveraging integration and packaging leadership
Commitment to quality – product failure rate measured in parts per billion (ppb)
Broad Portfolio - Approximately 45% of all Standard Products are “designed-in”
Benefits of Standard Products to HPMS segment
Market Reach: Strong distribution footprint (#2 worldwide)
Industry Scale: Vast in-house back-end manufacturing output (>70B units/yr)
Sources:#2 WW distribution based on Lively Report, #2 Small Signal from WSTS market size, #1 in Pure ESD from IMS Research Apr-2011
17
Standard Products 2012 Revenue = $832M, 20% Product Revenue
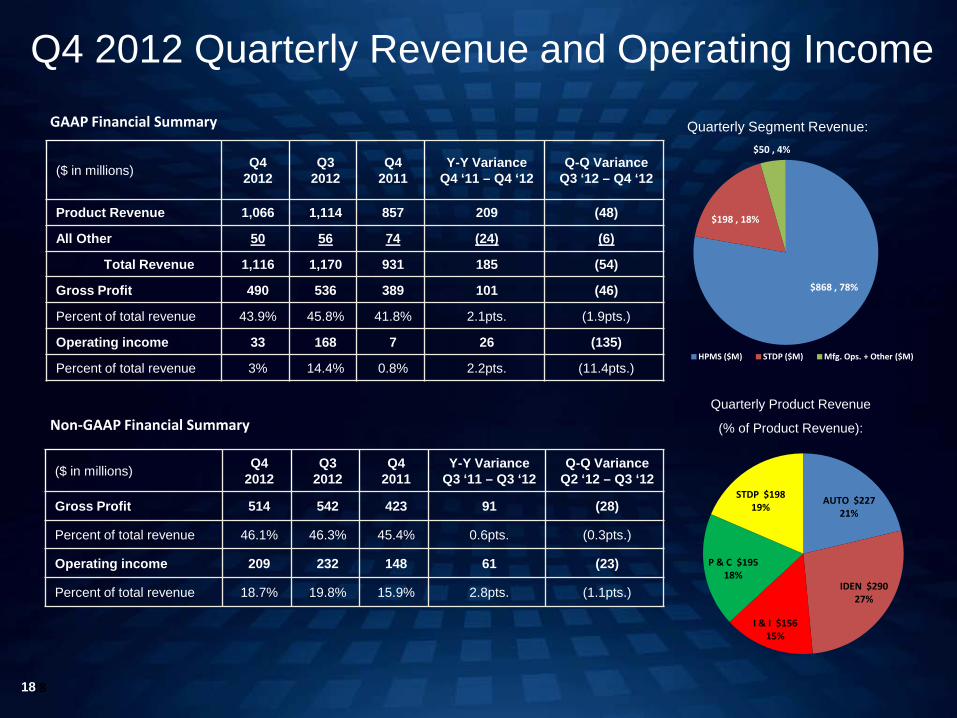
Q4 2012 Quarterly Revenue and Operating Income
($ in millions) Q4 2012
Q3 2012
Q4 2011
Y-Y Variance Q4 ‘11 – Q4 ‘12
Q-Q Variance Q3 ‘12 – Q4 ‘12
Product Revenue 1,066 1,114 857 209 (48)
All Other 50 56 74 (24) (6)
Total Revenue 1,116 1,170 931 185 (54)
Gross Profit 490 536 389 101 (46)
Percent of total revenue 43.9% 45.8% 41.8% 2.1pts. (1.9pts.)
Operating income 33 168 7 26 (135)
Percent of total revenue 3% 14.4% 0.8% 2.2pts. (11.4pts.)
($ in millions) Q4 2012
Q3 2012
Q4 2011
Y-Y Variance Q3 ‘11 – Q3 ‘12
Q-Q Variance Q2 ‘12 – Q3 ‘12
Gross Profit 514 542 423 91 (28)
Percent of total revenue 46.1% 46.3% 45.4% 0.6pts. (0.3pts.)
Operating income 209 232 148 61 (23)
Percent of total revenue 18.7% 19.8% 15.9% 2.8pts. (1.1pts.)
GAAP Financial Summary
Non-GAAP Financial Summary
Quarterly Segment Revenue:
18
Quarterly Product Revenue
(% of Product Revenue):
$868 , 78%
$198 , 18%
$50 , 4%
HPMS ($M) STDP ($M) Mfg. Ops. + Other ($M)
AUTO $227 21%
IDEN $290 27%
I & I $156 15%
P & C $195 18%
STDP $198 19%
18

HPMS ($ in millions)
Q4 2012
Q3 2012
Q4 2011 Y-Y Q-Q
Revenue 868 901 659 209 (33)
Gross Profit 453 463 321 132 (10)
Gross Margin 52.2% 51.4% 48.7% 3.5pts. 0.8pts.
Operating income 119 178 20 99 (59)
Operating Margin 13.7% 19.8% 3.0% 10.7pts. (6.1pts.)
HPMS ($ in millions)
Q4 2012
Q3 2012
Q4 2011 Y-Y Q-Q
Gross Profit 455 465 345 110 (10)
Gross Margin 52.4% 51.6% 52.4% 0.0pts. 0.8pts.
Operating income 196 208 111 85 (12)
Operating Margin 22.6% 23.1% 16.8% 5.8pts. (0.5pts.)
STDP ($ in millions)
Q4 2012
Q3 2012
Q4 2011 Y-Y Q-Q
Revenue 198 213 198 - (15)
Gross Profit 41 73 67 (26) (32)
Gross Margin 20.7% 34.3% 33.8% (13.1pts.) (13.6pts.)
Operating income (12) 22 17 (29) (34)
Operating Margin (6.1%) 10.3% 8.6% (14.7pts.) (16.4pts.)
STDP ($ in millions)
Q4 2012
Q3 2012
Q4 2011 Y-Y Q-Q
Gross Profit 56 73 72 (16) (17)
Gross Margin 28.3% 34.3% 36.4% (8.1pts.) (6.0pts.)
Operating income 20 33 37 (17) (13)
Operating Margin 10.1% 15.5% 18.7% (8.6pts.) (5.4pts.)
GAAP Financial Summary
Non-GAAP Financial Summary
Q4 2012 Business Segment Performance
19

2012 Annual Revenue and Operating Income
($ in millions) 2012 2011 2010 2009 Y-Y Variance 2012 – 2011
Product Revenue 4,114 3,831 3,694 2,578 283
All Other 244 363 708 941 (119)
Total Revenue 4,358 4,194 4.402 3,519 164
Gross Profit 1,988 1,906 1,823 898 82
Percent of total revenue 45.6% 45.4% 41.4% 25.5% 0.2pts.
Operating income 412 357 273 (931) 55
Percent of total revenue 9.5% 8.5% 6.2% (26.5%) 1.0pts.
($ in millions) 2012 2011 2010 2009 Y-Y Variance 2012 – 2011
Gross Profit 1,994 1,988 1,875 1,125 6
Percent of total revenue 45.8% 47.4% 42.6% 32.0% (1.6pts.)
Operating income 786 810 685 (147) (24)
Percent of total revenue 18.0% 19.3% 15.6% (4.2%) (1.3pts.)
GAAP Financial Summary
Non-GAAP Financial Summary
Annual Segment Revenue:
20
Annual Product Revenue
(% of Product Revenue):
$3,282 , 75%
$832 , 19%
$244 , 6%
HPMS ($M) STDP ($M) Mfg. Ops. + Other ($M)
AUTO $939 23%
IDEN $986 24%
I & I $604 15%
P & C $753 18%
STDP $832 20%
20
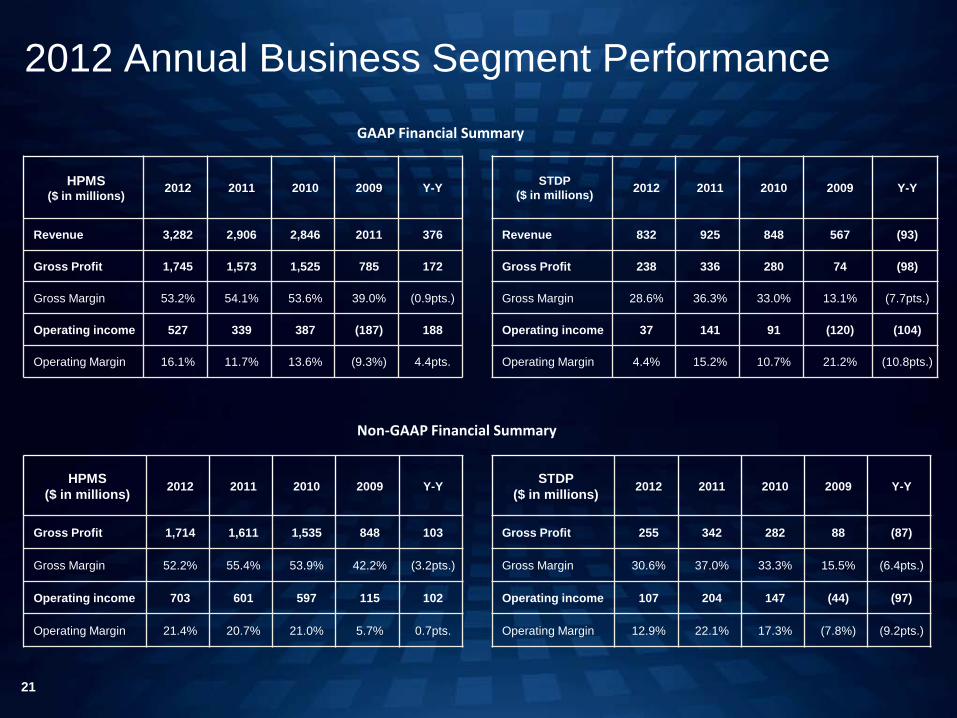
HPMS ($ in millions) 2012 2011 2010 2009 Y-Y
Revenue 3,282 2,906 2,846 2011 376
Gross Profit 1,745 1,573 1,525 785 172
Gross Margin 53.2% 54.1% 53.6% 39.0% (0.9pts.)
Operating income 527 339 387 (187) 188
Operating Margin 16.1% 11.7% 13.6% (9.3%) 4.4pts.
HPMS ($ in millions) 2012 2011 2010 2009 Y-Y
Gross Profit 1,714 1,611 1,535 848 103
Gross Margin 52.2% 55.4% 53.9% 42.2% (3.2pts.)
Operating income 703 601 597 115 102
Operating Margin 21.4% 20.7% 21.0% 5.7% 0.7pts.
STDP ($ in millions) 2012 2011 2010 2009 Y-Y
Revenue 832 925 848 567 (93)
Gross Profit 238 336 280 74 (98)
Gross Margin 28.6% 36.3% 33.0% 13.1% (7.7pts.)
Operating income 37 141 91 (120) (104)
Operating Margin 4.4% 15.2% 10.7% 21.2% (10.8pts.)
STDP ($ in millions) 2012 2011 2010 2009 Y-Y
Gross Profit 255 342 282 88 (87)
Gross Margin 30.6% 37.0% 33.3% 15.5% (6.4pts.)
Operating income 107 204 147 (44) (97)
Operating Margin 12.9% 22.1% 17.3% (7.8%) (9.2pts.)
GAAP Financial Summary
Non-GAAP Financial Summary
2012 Annual Business Segment Performance
21
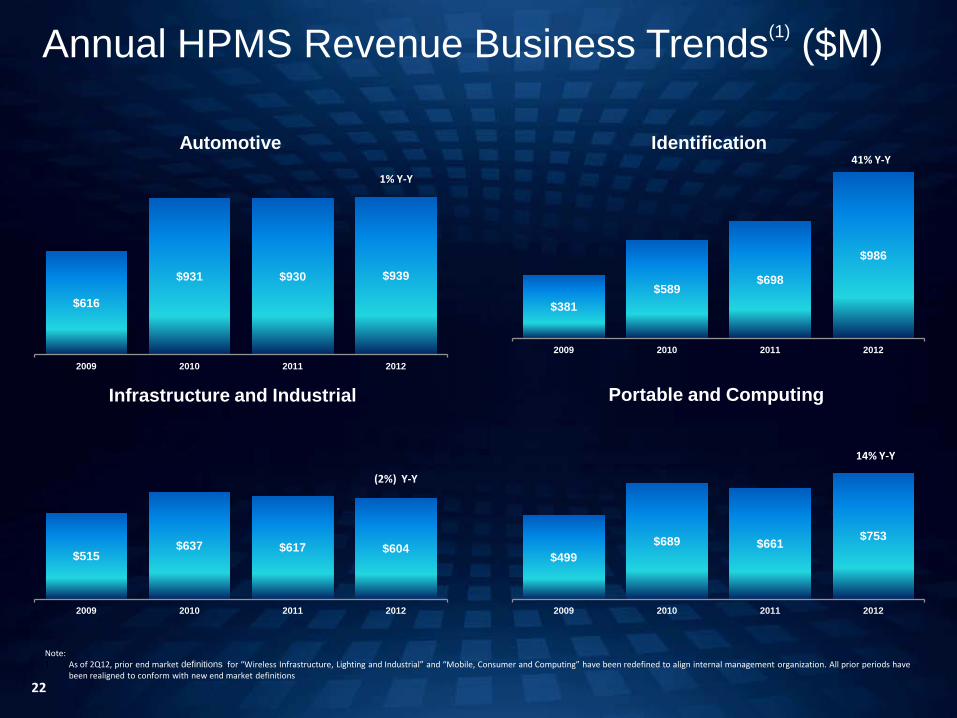
$381 $589
$698
$986
2009 2010 2011 2012
$616
$931 $930 $939
2009 2010 2011 2012
$499 $689 $661 $753
2009 2010 2011 2012
$515 $637 $617 $604
2009 2010 2011 2012
22
Automotive Identification
Annual HPMS Revenue Business Trends(1) ($M)
Note: 1. As of 2Q12, prior end market definitions for “Wireless Infrastructure, Lighting and Industrial” and “Mobile, Consumer and Computing” have been redefined to align internal management organization. All prior periods have
been realigned to conform with new end market definitions
41% Y-Y
1% Y-Y
14% Y-Y
(2%) Y-Y
Infrastructure and Industrial Portable and Computing
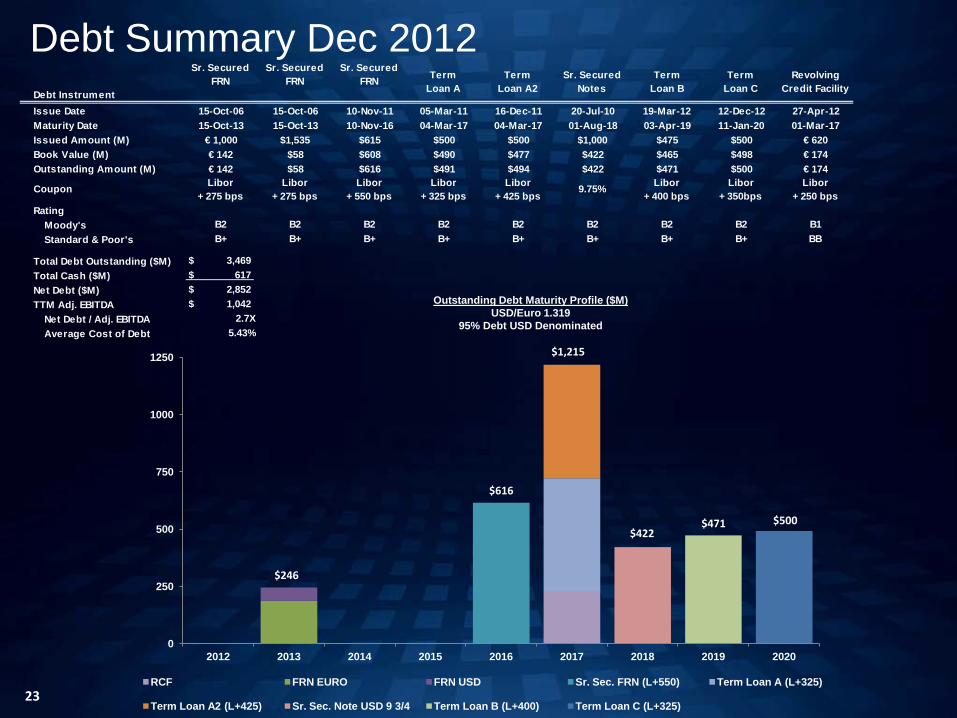
Debt Instrument
Sr. SecuredFRN
Sr. SecuredFRN
Sr. SecuredFRN Term
Loan ATerm
Loan A2Sr. Secured
NotesTerm
Loan BTerm
Loan CRevolving
Credit Facility
Issue Date 15-Oct-06 15-Oct-06 10-Nov-11 05-Mar-11 16-Dec-11 20-Jul-10 19-Mar-12 12-Dec-12 27-Apr-12Maturity Date 15-Oct-13 15-Oct-13 10-Nov-16 04-Mar-17 04-Mar-17 01-Aug-18 03-Apr-19 11-Jan-20 01-Mar-17Issued Amount (M) € 1,000 $1,535 $615 $500 $500 $1,000 $475 $500 € 620Book Value (M) € 142 $58 $608 $490 $477 $422 $465 $498 € 174Outstanding Amount (M) € 142 $58 $616 $491 $494 $422 $471 $500 € 174
Coupon Libor+ 275 bps
Libor+ 275 bps
Libor+ 550 bps
Libor+ 325 bps
Libor+ 425 bps
9.75% Libor+ 400 bps
Libor+ 350bps
Libor+ 250 bps
RatingMoody's B2 B2 B2 B2 B2 B2 B2 B2 B1Standard & Poor's B+ B+ B+ B+ B+ B+ B+ B+ BB
Total Debt Outstanding ($M) $ 3,469 Total Cash ($M) $ 617 Net Debt ($M) $ 2,852 TTM Adj. EBITDA $ 1,042
Net Debt / Adj. EBITDA 2.7XAverage Cost of Debt 5.43%
23
Debt Summary Dec 2012
Outstanding Debt Maturity Profile ($M) USD/Euro 1.319
95% Debt USD Denominated
0
250
500
750
1000
1250
2012 2013 2014 2015 2016 2017 2018 2019 2020
RCF FRN EURO FRN USD Sr. Sec. FRN (L+550) Term Loan A (L+325)
Term Loan A2 (L+425) Sr. Sec. Note USD 9 3/4 Term Loan B (L+400) Term Loan C (L+325)
$500 $471 $422
$1,215
$616
$246
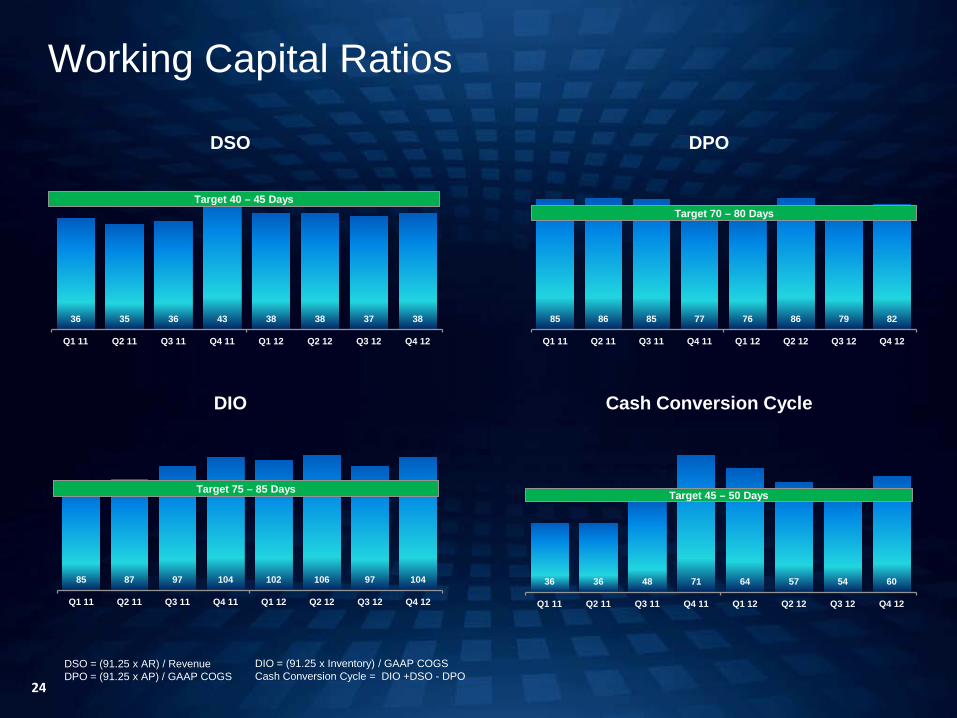
36 35 36 43 38 38 37 38
Q1 11 Q2 11 Q3 11 Q4 11 Q1 12 Q2 12 Q3 12 Q4 12
85 86 85 77 76 86 79 82
Q1 11 Q2 11 Q3 11 Q4 11 Q1 12 Q2 12 Q3 12 Q4 12
36 36 48 71 64 57 54 60
Q1 11 Q2 11 Q3 11 Q4 11 Q1 12 Q2 12 Q3 12 Q4 12
85 87 97 104 102 106 97 104
Q1 11 Q2 11 Q3 11 Q4 11 Q1 12 Q2 12 Q3 12 Q4 12
Working Capital Ratios
24
DSO = (91.25 x AR) / Revenue DPO = (91.25 x AP) / GAAP COGS
DIO = (91.25 x Inventory) / GAAP COGS Cash Conversion Cycle = DIO +DSO - DPO
DSO DPO
DIO Cash Conversion Cycle
Target 40 – 45 Days Target 70 – 80 Days
Target 75 – 85 Days Target 45 – 50 Days

Guidance for the First Quarter of 2013(1)
25
Product Revenue trends at the mid-point of 1Q13 guidance: 1. Automotive is expected to be down low single digit
range Q-Q;
2. Identification is expected to be down low single digit range Q-Q;
3. Infrastructure and Industrial is expected to be down low single digit range Q-Q;
4. Portable and Computing is expected to be down about 10% Q-Q;
5. Standard Products is expected to be up low single digit range Q-Q
Note (1): NXP has based the guidance included in our earnings press release issued on January 31, 2013 on judgments and estimates that management believes are reasonable given its assessment of historical trends and other information reasonably available as of the date of this earnings press release. The guidance included in this release consists of predictions only, and is subject to a wide range of known and unknown risks and uncertainties, many of which are beyond NXP’s control. The guidance included in this release should not be regarded as representations by NXP that the estimated results will be achieved. Actual results may vary materially from the guidance we provided in our earnings press release issued on January 31, 2013 . In relation to the use of non-GAAP financial information see the note regarding “Use of Non-GAAP Financial Information” included in our earning press release issued on January 31, 2013 . For the factors, risks and uncertainties to which judgments, estimates and forward-looking statements generally are subject see the note regarding “Forward-looking Statements.” We undertake no obligation to publicly update or revise any forward-looking statements, including the guidance set forth in our earnings press release issued on January 31, 2013 , to reflect future events or circumstances. Considering the uncertain magnitude and variability of the foreign exchange consequences upon “PPA effects”, “restructuring costs”, “other incidental items” and any interest expense or taxes in future periods, management believes that GAAP financial measures are not available for NXP on a forward looking basis.
Guidance RangeLow Mid High
Product Revenue 1,027$ 1,043$ 1,058$ Q-Q -4% -2% -1%
Mfg. & Other Revenue 24$ 24$ 24$
Total Revenue 1,051$ 1,067$ 1,082$ Q-Q -6% -4% -3%
Non-GAAP Gross Profit 497$ 504$ 511$ Non-GAAP Gross Margin 47% 47% 47%
Non-GAAP Operating Income 193$ 198$ 202$ Non-GAAP Operating Margin 18% 19% 19%Interest Expense 50$ 50$ 50$ Cash Taxes 9$ 9$ 9$
Non-controlling Interest 13$ 13$ 13$
Non-GAAP Net Income 121$ 126$ 130$ Ave. Diluted Shares 255 255 255
Non - GAAP EPS 0.47$ 0.49$ 0.51$
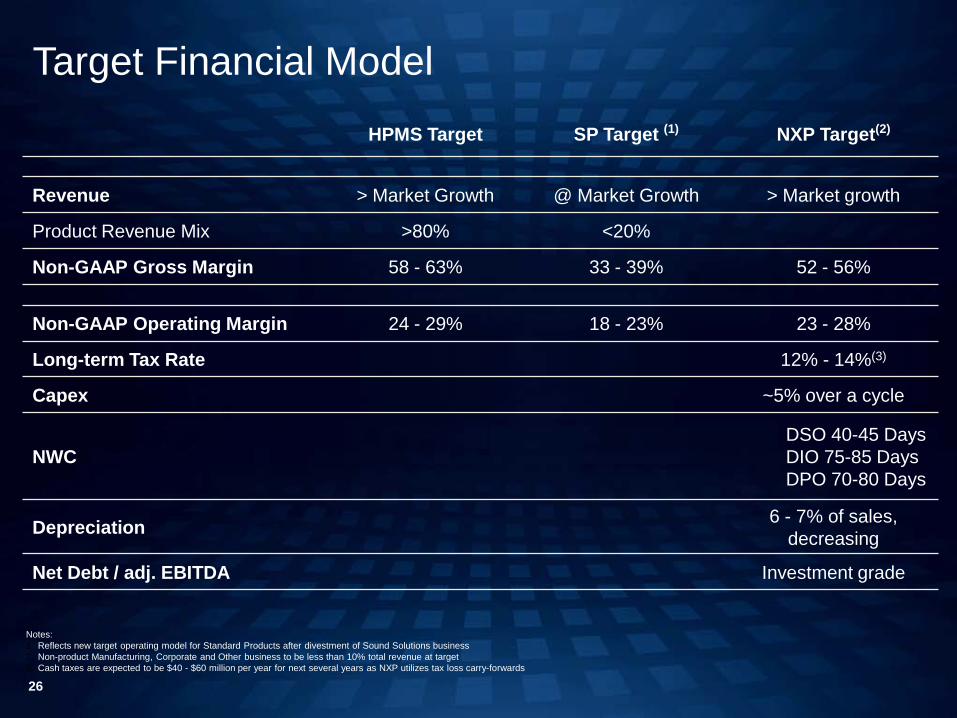
Target Financial Model HPMS Target SP Target (1) NXP Target(2)
Revenue > Market Growth @ Market Growth > Market growth
Product Revenue Mix >80% <20%
Non-GAAP Gross Margin 58 - 63% 33 - 39% 52 - 56%
Non-GAAP Operating Margin 24 - 29% 18 - 23% 23 - 28%
Long-term Tax Rate 12% - 14%(3)
Capex ~5% over a cycle
NWC DSO 40-45 Days DIO 75-85 Days DPO 70-80 Days
Depreciation 6 - 7% of sales, decreasing
Net Debt / adj. EBITDA Investment grade
Notes: 1. Reflects new target operating model for Standard Products after divestment of Sound Solutions business 2. Non-product Manufacturing, Corporate and Other business to be less than 10% total revenue at target 3. Cash taxes are expected to be $40 - $60 million per year for next several years as NXP utilizes tax loss carry-forwards
26

Q4 2012 Financial Reconciliation (GAAP to non-GAAP) ($ in millions, unless otherwise stated) Q4 2012 Q3 2012 Q4 2011
Total Revenue 1,116 1,170 931
GAAP Gross Profit 490 536 389
Gross profit adjustments (24) (6) (34)
Non - GAAP Gross Profit 514 542 423
GAAP Gross Margin 43.9% 45.8% 41.8%
Non-GAAP Gross Margin 46.1% 46.3% 45.4%
GAAP Operating income (loss) 33 168 7
Operating income adjustments (176) (64) (141)
Non - GAAP Operating income (loss) 209 232 148
GAAP Operating Margin 3.0% 14.4% 0.8%
Non-GAAP Operating Margin 18.7% 19.8% 15.9%
GAAP Financial income (expense) (153) (33) (165)
Financial income adjustments (98) 32 (91)
Non - GAAP Financial income (expense) (55) (65) (74)
GAAP Income tax benefit (expense) 7 (6) (2)
Adjustments 17 3 4
Non - GAAP Cash tax (expense)(1) (10) (9) (6)
GAAP Net income (loss) attributable to shareholders (116) 115 (182)
Net income (loss) adjustments (242)(2) (27) (241)
Non - GAAP Net income (loss) attributable to shareholders 126(3) 142 59
GAAP Diluted net income (loss) per share attributable to shareholders (0.47) 0.45 (0.73)
Non - GAAP Diluted net income (loss) per share attributable to shareholders 0.50 0.56 0.24
1. Cash income taxes paid during the period 2. Includes:
• PPA effects: ($66M); • Restructuring: ($98M); • Other incidentals: ($12M); • Foreign exchange gain (loss) on debt:
$31M; • Loss on extinguishment of LT debt:
($114M) • Other financial expense: ($15M); • Results relating to equity-accounted
investees: $15M; • Difference between book and cash
income taxes: $17M 3. Includes:
• Stock-based compensation expense: $16M
27 27

2012 Financial Reconciliation (GAAP to non-GAAP) ($ in millions, unless otherwise stated) 2012 2011 2010 2009
Total Revenue 4,358 4,194 4,402 3,519
GAAP Gross Profit 1,988 1,906 1,823 898
Gross profit adjustments (6) (82) (52) (227)
Non - GAAP Gross Profit 1,994 1,988 1,875 1,125
GAAP Gross Margin 45.6% 45.4% 41.4% 25.5%
Non-GAAP Gross Margin 45.8% 47.4% 42.6% 32.0%
GAAP Operating income (loss) 412 357 273 (931)
Operating income adjustments (374) (453) (412) (784)
Non - GAAP Operating income (loss) 786 810 685 (147)
GAAP Operating Margin 9.5% 8.5% 6.2% (26.5%)
Non-GAAP Operating Margin 18.0% 19.3% 15.6% (4.2%)
GAAP Financial income (expense) (437) (257) (628) 682
Financial income adjustments (171) 50 (310) 1,041
Non - GAAP Financial income (expense) (266) (307) (318) (359)
GAAP Income tax benefit (expense) (1) (21) (24) (10)
Adjustments 27 4 (5) 40
Non - GAAP Cash tax (expense)(1) (28) (25) (19) (50)
GAAP Net income (loss) attributable to shareholders (115) 390 (456) (167)
Net income (loss) adjustments (544)(2) (42) (754) 403
Non - GAAP Net income (loss) attributable to shareholders 429(3) 432 298 (570)
GAAP Diluted net income (loss) per share attributable to shareholders (0.46) 1.57 (1.99) (0.78)
Non - GAAP Diluted net income (loss) per share attributable to shareholders 1.70 1.71 1.28 (2.65)
28 28
1. Cash income taxes paid during the period 2. Includes:
• PPA effects: ($273M); • Restructuring: ($111M); • Other incidentals: ($36M); • Other adjustments to Cost of
Revenue: $46M; • Foreign exchange gain (loss)
on debt: $28M; • Loss on extinguishment of LT
debt: ($161M) • Other financial expense:
($38M); • Results relating to equity-
accounted investees: ($27M); • Difference between book and
cash income taxes: $27M 3. Includes:
• Stock-based compensation expense: $48M

Quarterly Cash Flow Overview ($M)
Q4 2012
Q3 2012
Q4 2011
Net cash provided by (used for) operating activities 164 192 (34)
Net cash provided by (used for) investing activities (45) (71) (33)
Net cash provided by (used for) financing activities (209) (258) (12)
Net cash provided by (used for) continuing operations (90) (137) (79)
Net cash provided by (used for) discontinued operations - - (31)
Effects of changes in exchange rates on cash position 5 2 (12)
Increase (decrease) in cash and cash equivalents (85) (135) (122)
Cash and cash equivalents at beginning of the period 702 837 865
Cash and cash equivalents at end of period 617 702 743
Less cash – discontinued operations - - -
Cash and cash equivalents at end of period – continuing operations 617 702 743
29

Annual Cash Flow Overview ($M)
2012 2011 2010 2009
Net cash provided by (used for) operating activities 722 175 361 (701)
Net cash provided by (used for) investing activities (243) (202) (269) 63
Net cash provided by (used for) financing activities (574) (926) (157) (109)
Net cash provided by (used for) continuing operations (95) (953) (65) (747)
Net cash provided by (used for) discontinued operations (45) 809 (5) -
Effects of changes in exchange rates on cash position 14 (21) (63) (8)
Increase (decrease) in cash and cash equivalents (126) (165) (133) (755)
Cash and cash equivalents at beginning of the period 743 908 1,041 1,796
Cash and cash equivalents at end of period 617 743 908 1,041
Less cash – discontinued operations - - 10 15
Cash and cash equivalents at end of period – continuing operations 617 743 898 1,026
30
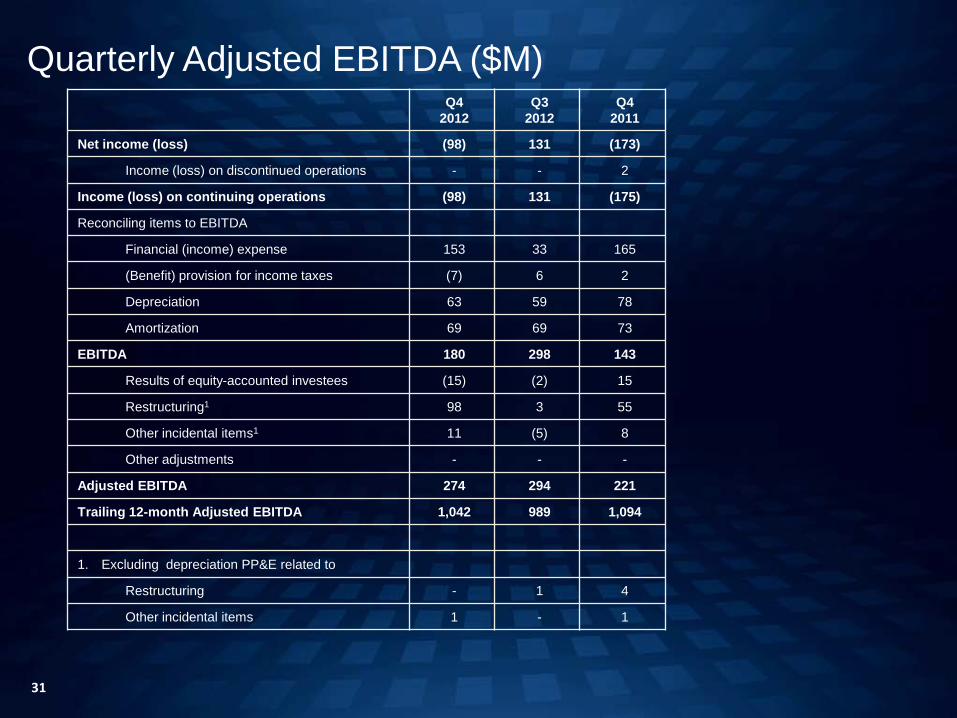
Quarterly Adjusted EBITDA ($M) Q4
2012 Q3
2012 Q4
2011
Net income (loss) (98) 131 (173)
Income (loss) on discontinued operations - - 2
Income (loss) on continuing operations (98) 131 (175)
Reconciling items to EBITDA
Financial (income) expense 153 33 165
(Benefit) provision for income taxes (7) 6 2
Depreciation 63 59 78
Amortization 69 69 73
EBITDA 180 298 143
Results of equity-accounted investees (15) (2) 15
Restructuring1 98 3 55
Other incidental items1 11 (5) 8
Other adjustments - - -
Adjusted EBITDA 274 294 221
Trailing 12-month Adjusted EBITDA 1,042 989 1,094
1. Excluding depreciation PP&E related to
Restructuring - 1 4
Other incidental items 1 - 1
31

Annual Adjusted EBITDA ($M) 2012 2011 2010 2009
Net income (loss) (52) 436 (406) (153)
Income (loss) on discontinued operations 1 434 59 32
Income (loss) on continuing operations (53) 2 (465) (185)
Reconciling items to EBITDA
Financial (income) expense 437 257 628 (682)
(Benefit) provision for income taxes 1 21 24 10
Depreciation 247 290 389 490
Amortization 286 301 295 397
EBITDA 918 871 871 30
Results of equity-accounted investees 27 77 86 (74)
Restructuring1 109 85 (20) 99
Other incidental items1 34 61 84 199
Other adjustments (46) - - -
Adjusted EBITDA 1,042 1,094 1,021 254
Trailing 12-month Adjusted EBITDA 1,042 1,094 1,021 254
1. Excluding depreciation PP&E related to
Restructuring 2 5 40 4
Other incidental items 2 1 6 42
32

-
1,500
3,000
4,500
6,000
7,500
$ MM
2,011
NXP HPMS Growth >50% Faster Than Market
>1.5x Industry Growth
Positioned to Deliver Industry Leading Growth
CORE Product Revenue EMERGING Product Revenue
Internet of Things
2010
NFC
Cyber Security
Car – 2 - X
HPRF
HPMS Solutions
AUTO
Healthcare
Mobile
High Speed Interface
33
Related Documents