Advances in Swell Prediction for Australia’s North West Shelf Presented by: Greg Williams and Steve Buchan RPS MetOcean Pty Ltd

Welcome message from author
This document is posted to help you gain knowledge. Please leave a comment to let me know what you think about it! Share it to your friends and learn new things together.
Transcript

Advances in Swell Prediction for Australia’s North West Shelf
Presented by: Greg Williams and Steve Buchan RPS MetOcean Pty Ltd

Some Acknowledgements
Colleagues – Greg Williams – Doing it! – Emma Foster – TC wind field blending – Mark Szyszka – Making everything work – Matt McGowan – Keeping computers competent
Ex-Colleagues – Henrique Alves – Concept grounding – Dave Duncalf – Holland 2010 !! – Jessica Sweeney – TC wind field parameterization
2

Presentation Outline
The Prompt NWS Setting Swell Affected Operations Concept – Key Elements Performance Potential Products and Services
3

Remote Offshore Warning System
Initiated in 1993 to provide tropical cyclone swell forecasts in Mermaid Sound for Woodside’s LNG operations.
Designed to give at least 4 hours forewarning of swell arrival (to allow termination of loading and safe exit of the shipping channel).
Based on real-time swell measurements from an array of offshore buoys
Measurements fed into a reverse ray wave refraction model to propagate swell energy into Mermaid Sound and the LNG loading berth.
Planned new LNG carriers may need longer lead-times .
4

The Opportunity
Longer lead times cannot be provided by measurements alone (buoys can be beyond region of cyclogenisis).
Tropical cyclone track forecasting is improving Wave models are vastly improved. There is a burgeoning requirement for accurate,
reliable, continuous swell forecasting over the entire North West Shelf region.
Measurements remain key to sustained accuracy.
5

North West Shelf - Setting
Industrial Setting – Global leader in Iron Ore export ($75B per annum) – Emerging leader in LNG ($25B per annum) – Globally remote
Oceanographic Setting – Mega Tides – Severe tropical cyclones – Long-travelled (ultra long period) swell
6

North West Shelf – Industrial Setting
7

Spring Tide Range – Peter Harris , GA

Australian TC Spatial Distribution

Swell Windows to the NWS

Global Mean Significant Wave Heights
11

Swell Affected Operations
Coastal – LNG Loading – Iron Ore Shipping Channel Transit – Port Operability (infragravity waves)
Offshore – Shipping – Drilling – Installation – Materials Transfer – Riser Disconnect/Reconnect – FLNG Unloading – Post-storm ROV Inspections
12

Iron Ore Loading
13

LNG Carrier Operations
14
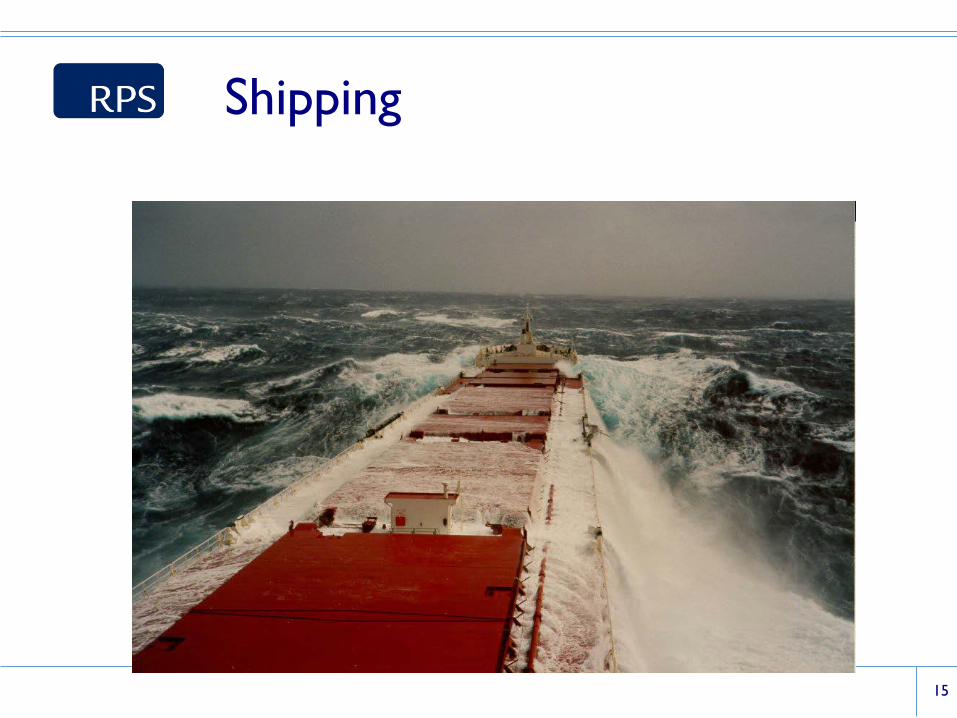
Shipping
15

Oops!
16

Drilling
17

Installation
18
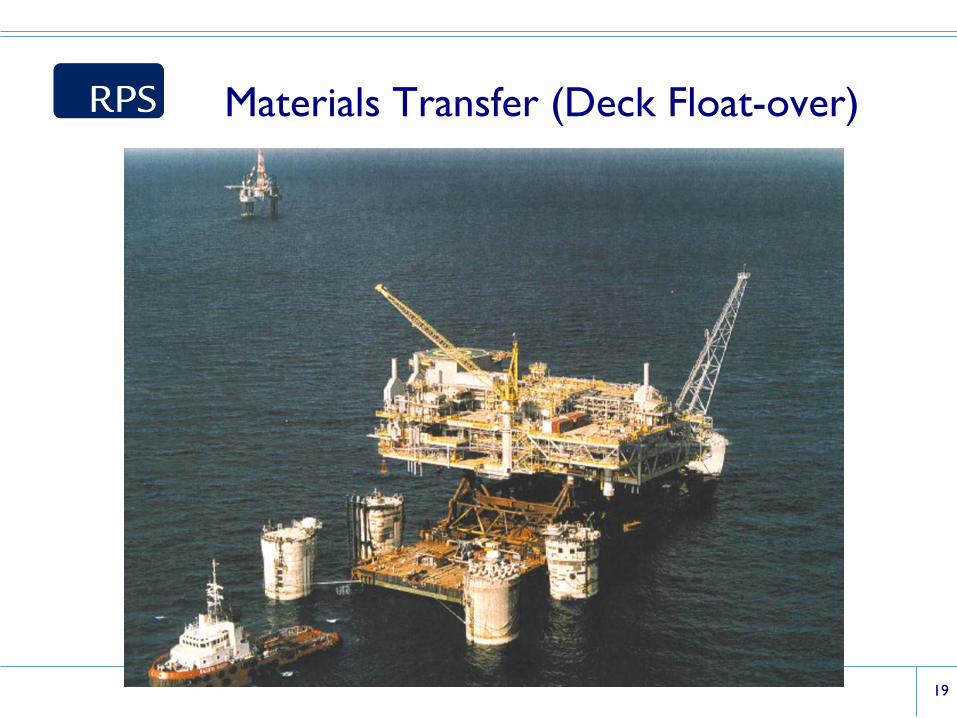
Materials Transfer (Deck Float-over)
19

Riser Disconnect/Reconnect
20
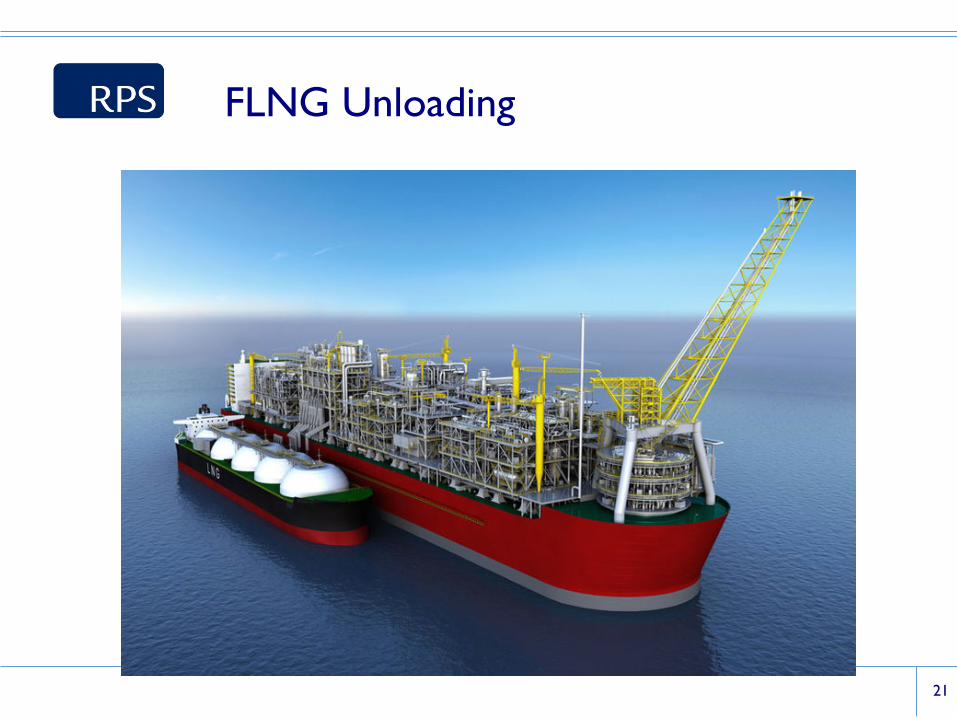
FLNG Unloading
21

Post Storm ROV Inspections
22
Why is RPS MetOcean doing this?
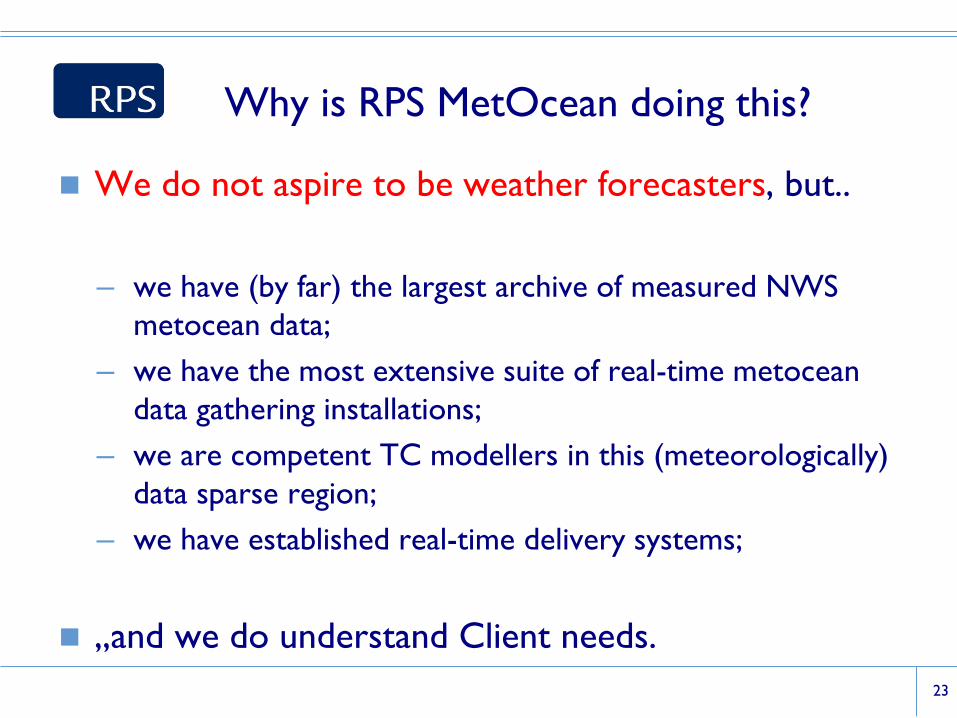
We do not aspire to be weather forecasters, but.. – we have (by far) the largest archive of measured NWS
metocean data; – we have the most extensive suite of real-time metocean
data gathering installations; – we are competent TC modellers in this (meteorologically)
data sparse region; – we have established real-time delivery systems;
,,and we do understand Client needs. 23

The History
Started with a ROWS review over a decade ago Originally conceived to:
– assimilate satellite data to enhance wind fields – ingest measured data to improve wave modelling – collaborate with BoM to obtain TC forecasts – deploy an array of wave/met buoys
But since then: – global wind field providers do all the assimilation (better
than we could) – wave models generally do not benefit from wave data
assimilation. 24

Present Focus
Limited regional ‘bulk correction’ of global winds Localized adjustment of winds via RT measurements Automatic ingestion of BoM TC track forecasts Parametric TC wind field modelling Automated TC wind field blending Reliance on WaveWatchIII Post-calibration of swell predictions via measurements
Measurements remain the key to improved prediction.
25

Concept – Key Elements
Winds – NCEP global model input – BoM tropical cyclone track forecasts – RPS storm vortex parameterization – RPS vortex blending into synoptic fields
Waves – WaveWatchIII
Measurements – Bulk windfield correction (nudging) – Wave model tuning – Forecast post-calibration
Tailored Products 26
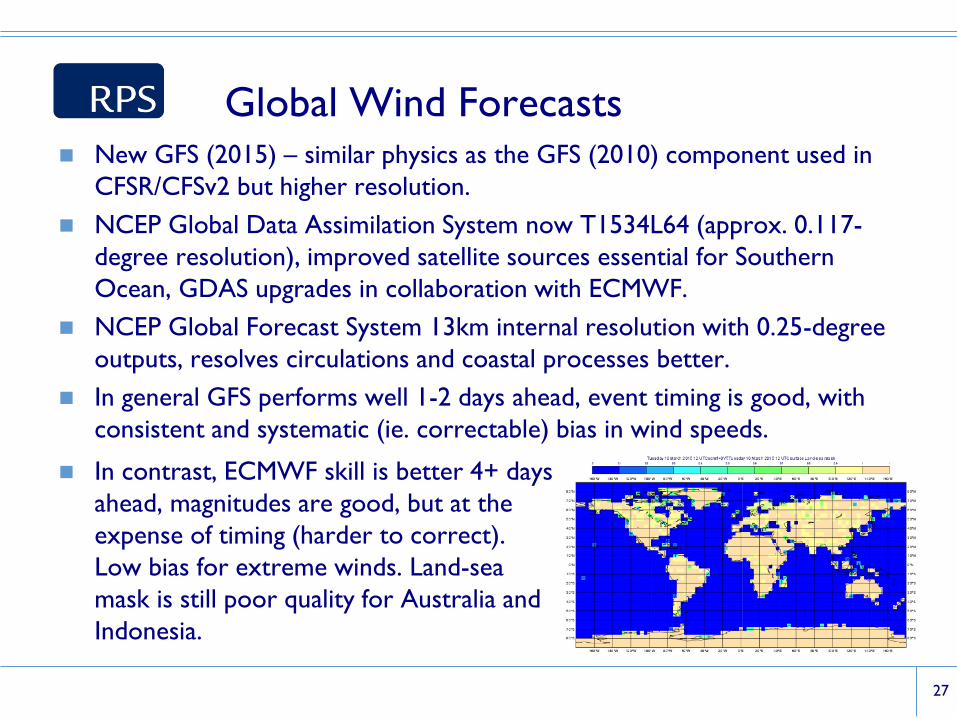
Global Wind Forecasts New GFS (2015) – similar physics as the GFS (2010) component used in
CFSR/CFSv2 but higher resolution. NCEP Global Data Assimilation System now T1534L64 (approx. 0.117-
degree resolution), improved satellite sources essential for Southern Ocean, GDAS upgrades in collaboration with ECMWF.
NCEP Global Forecast System 13km internal resolution with 0.25-degree outputs, resolves circulations and coastal processes better.
In general GFS performs well 1-2 days ahead, event timing is good, with consistent and systematic (ie. correctable) bias in wind speeds.
27
In contrast, ECMWF skill is better 4+ days ahead, magnitudes are good, but at the expense of timing (harder to correct). Low bias for extreme winds. Land-sea mask is still poor quality for Australia and Indonesia.
BoM Analysis and Forecast Tracks
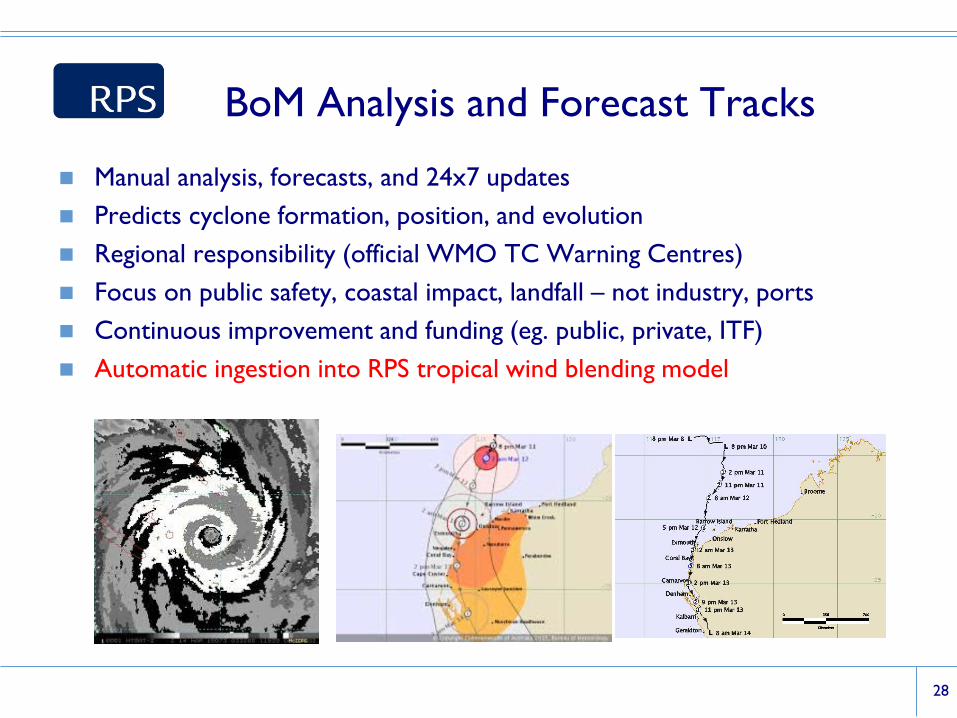
Manual analysis, forecasts, and 24x7 updates Predicts cyclone formation, position, and evolution Regional responsibility (official WMO TC Warning Centres) Focus on public safety, coastal impact, landfall – not industry, ports Continuous improvement and funding (eg. public, private, ITF) Automatic ingestion into RPS tropical wind blending model
28

Tropical Cyclone Modelling
RECENT REVIEW: – Parameterisation depends on choices of PWR, Vmax, Pc, Pe, Rmax, R34, Vt,
θmax, B, profile, gust factors, ... – We tested approximately 12,000 model combinations. – Validated against 30 years of offshore measurements on the NW Shelf. – A significant amount of work.

RPS Wind Model Performance
30
RPS wind blending performance. Peak-to-peak comparisons against 30 years of Australian tropical cyclones. For fixed model configuration for all storms.

Need for Tropical Wind Blending Forecasting cyclone formation,
position, and intensity is difficult for models. Experienced meteorologists can produce better results.
Storm proximity and timing are key factors for coastal, port, and inshore operations affected by wind and swell.
Wave model predictions are only as good as the wind inputs.
Foster et al. 2009 (11th IWWHF).
31

Tropical Cyclone Modelling
32
Global wind field
TC Olwyn 2015

Tropical Cyclone Modelling
33
High resolution parameterized
vortex
TC Olwyn 2015

Tropical Cyclone Modelling
34
High resolution parameterized
vortex
Global wind field
BLEND
TC Olwyn 2015

TC Olwyn BoM Track
35

Tropical Cyclone Modelling
Comparisons with measurements are good eg. Barrow Island
36
TC Olwyn 2015

Tropical Cyclone Modelling
Comparisons with measurements are good eg. Learmonth
37
TC Olwyn 2015

Wind Blending – TC Quang
38
NCEP GFS:
RPS WPS:
2015/04/28 12Z 2015/04/29 12Z 2015/04/30 12Z 2015/05/01 12Z
2015/04/28 12Z 2015/04/29 12Z 2015/04/30 12Z 2015/05/01 12Z

Wave Modelling
Based on latest WW3 release with features relevant to NWS Comprehensive calibration and tuning options Driven by RPS modified wind fields. Able to ingest spectral measurement data (eg. buoy and satellite) Supports data assimilation of measurements and coefficients Support for moving TC nests and wave-system tracking Output spectra suitable for vessel motion/response/port systems
39

Wave Model Results – Tropical Cyclones
40
RPS wave model performance. Wave height comparisons against 30 years of Australian tropical cyclones. For fixed model configuration.

Swell Prediction - TC Quang
41
NCEP GFS forcings:
RPS SPS:
2015/04/28 12Z 2015/04/29 12Z 2015/04/30 12Z 2015/05/01 12Z
2015/04/28 12Z 2015/04/29 12Z 2015/04/30 12Z 2015/05/01 12Z

Measurements
42

Archived Long-Term Wind Measurements

Archived Long-Term Wave Measurements

Purpose-built RPS Wave & Met. Buoy
45

Available Real-time Data Ingestion Sites
46

Prospective Measurement Locations
47

Windfield Improvement Systems
RPS obswind – based on Objective Analysis concepts introduced by Cressman (1959)
Uses marine and terrestrial met observations to create improved wind fields and predictions.
48

Effect of a single wind measurement
49
Using an objective analysis technique, the influence of a single site measurement (right) into a gridded wind field (left) used in model forcing improves local wind-sea and swell propagating to adjacent sites.
Multiple wind measurements
50
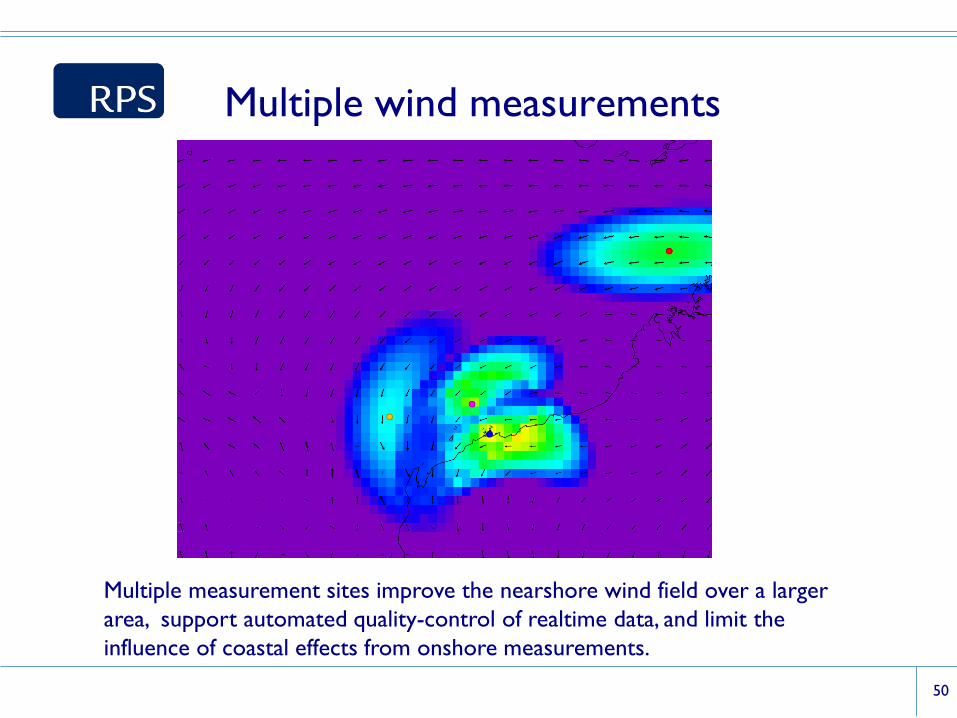
Multiple measurement sites improve the nearshore wind field over a larger area, support automated quality-control of realtime data, and limit the influence of coastal effects from onshore measurements.

Wave Data Assimilation Systems RPS ww3da – can use remote wave heights derived from satellite
altimeters to adjust swell fields during model data-assimilation, improving long-period swell arriving on the NWS of Australia.
51

Illustration of Swell Prediction Improvement
Onset of strong ESE Gales over Pilbara coast Gales not strong enough in global winds.
52

Map of Locations
53

Model Tuning – TEST451f performance
eg. North Rankin = Fairly good
54

Model Tuning – TEST451f performance
eg. Gorgon Location = Good
55

Model Tuning – TEST451f performance
eg. Jansz = Poor
56

Model + Measurement
eg. Jansz = Better (hourly winds from Angel, NRA)
57
Products and Services
Tropical cyclone swell alerts Berth operability assessments Swell input to Under Keel Clearance predictions Vessel motion forecasts (via RAOs) Installation and Materials Transfer operability FPSO riser disconnect/reconnect forecasting FLNG side-by-side operability forecasting Fatigue monitoring and ROV inspection assessments
58
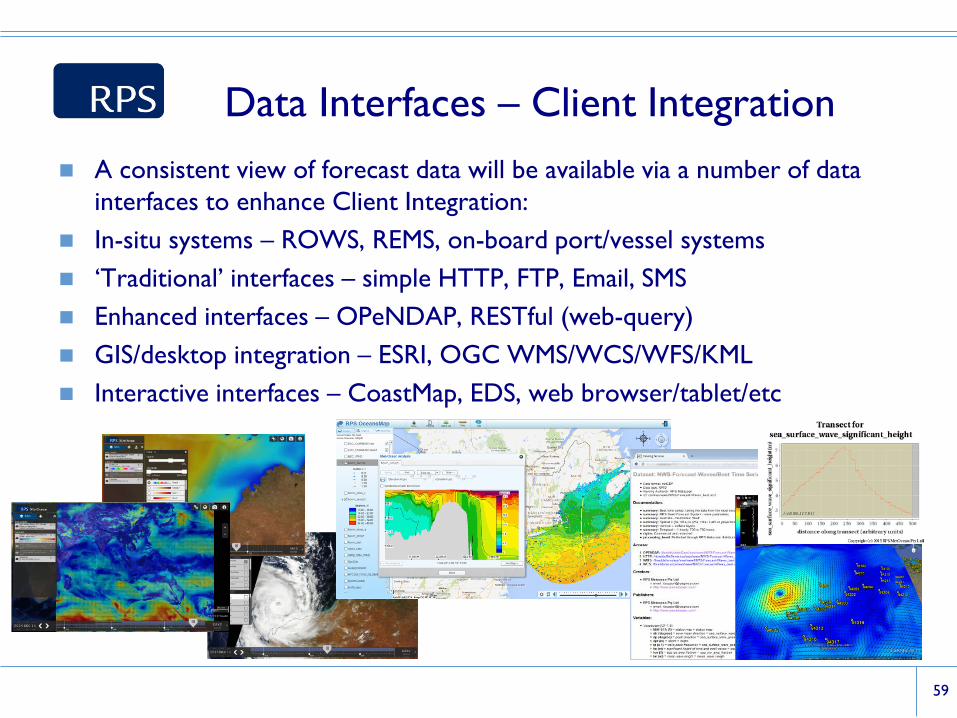
Data Interfaces – Client Integration A consistent view of forecast data will be available via a number of data
interfaces to enhance Client Integration: In-situ systems – ROWS, REMS, on-board port/vessel systems ‘Traditional’ interfaces – simple HTTP, FTP, Email, SMS Enhanced interfaces – OPeNDAP, RESTful (web-query) GIS/desktop integration – ESRI, OGC WMS/WCS/WFS/KML Interactive interfaces – CoastMap, EDS, web browser/tablet/etc
59

60
Related Documents