British Journal of Nufririon (1 992), 68, 543-563 543 Nutritional intake, height and weight of 1 l-12-year-old Northumbrian children in 1990 compared with information obtained in 1980 BY ASHLEY ADAMSON, ANDREW RUGG-GUNN*, TIMOTHY BUTLER, DAVID APPLETON AND ALLAN HACKETT Dental School, Medical Faculty, University of Newcastle upon Tyne, Frarnlington Place, Newcastle upon Tyne NE2 4B W (Received 16 May 1991 -Accepted 29 October 1991) There is little age-specific information on changes in dietary intake over time in this country, yet this is valuable in assessing the effectiveness of health education programmes particularly in vulnerable groups such as adolescents. In 1990, 379 children aged 12 years completed two 3 d dietary records. They were interviewed by one dietitian on the day after completion of each diary to verify and enlarge on the information provided and, with the aid of food models, obtain a quantitative record of food intake. Nutrient intake was calculated using computerized food tables. These children attended the same seven Middle schools in Northumberland as 405 children of the same age who recorded their diet using the same method, 10 years previously. Heights and weights were also recorded in both studies in the same manner. Comparing the nutrient intakes in 1990 with 1980, energy intake fell in the boys (to 8.6 MJ) but not in the girls (8.3 MJ). The contribution of fat to energy intake was unchanged at about 40% (about 90 g/d). Likewise, intake of sugars was unchanged at about 22% of energy (about 118 g/d). Calcium intake remained the same in the girls (763 mg/d in 1990) but fell in the boys (786 mg/d in 1990). Iron, vitamin C and unavailable carbohydrate intakes increased in both sexes, and the nutrient density of the diet improved in all sex and social-class groups. However, a social trend evident in 1980 still existed in 1990 with low social groups having the poorest-quality diet. It is concluded that there is tittle evidence of substantial progress towards improving the diet of adolescents in this country. Nutrition survey : Children : Dietary changes Nutrition is an important determinant of health or disease at any age, particularly during adolescence, a time of growth and development. This can also be a time of change in dietary habits. With the beginning of independence comes increased consumption of foods away from home and snacking. The 1980s was a decade of intense activity in health education, as well as increased interest in diet and health by the public and the media. Three major high-profile reports have been published by : the National Advisory Committee on Nutrition Education (1983); the COMA panel on Diet in Relation to Cardiovascular Disease (Department of Health and Social Security, 1984); and the COMA panel on Dietary Sugars and Human Disease (Department of Health, 1989b). The predominant advice has been to reduce intakes of fat and sugar. The food industry has been similarly active; product ranges have increased to meet new public demands, and sophisticated marketing techniques encourage us to buy. Advertising aimed at adolescents is frequently for products high in fat or sugar, or both, a message contrary to that of health education. Only by monitoring change in diet over time is it possible to assess the effectiveness of health education and so decide future priorities. Durnin et al. (1974) conducted a * For reprints. 20-2

Welcome message from author
This document is posted to help you gain knowledge. Please leave a comment to let me know what you think about it! Share it to your friends and learn new things together.
Transcript
British Journal of Nufririon (1 992), 68, 543-563 543
Nutritional intake, height and weight of 1 l-12-year-old Northumbrian children in 1990 compared with information
obtained in 1980 B Y ASHLEY ADAMSON, ANDREW RUGG-GUNN*, TIMOTHY BUTLER,
DAVID APPLETON A N D ALLAN HACKETT Dental School, Medical Faculty, University of Newcastle upon Tyne, Frarnlington Place,
Newcastle upon Tyne NE2 4B W
(Received 16 May 1991 -Accepted 29 October 1991)
There is little age-specific information on changes in dietary intake over time in this country, yet this is valuable in assessing the effectiveness of health education programmes particularly in vulnerable groups such as adolescents. In 1990, 379 children aged 12 years completed two 3 d dietary records. They were interviewed by one dietitian on the day after completion of each diary to verify and enlarge on the information provided and, with the aid of food models, obtain a quantitative record of food intake. Nutrient intake was calculated using computerized food tables. These children attended the same seven Middle schools in Northumberland as 405 children of the same age who recorded their diet using the same method, 10 years previously. Heights and weights were also recorded in both studies in the same manner. Comparing the nutrient intakes in 1990 with 1980, energy intake fell in the boys (to 8.6 MJ) but not in the girls (8.3 MJ). The contribution of fat to energy intake was unchanged a t about 40% (about 90 g/d). Likewise, intake of sugars was unchanged at about 22% of energy (about 118 g/d). Calcium intake remained the same in the girls (763 mg/d in 1990) but fell in the boys (786 mg/d in 1990). Iron, vitamin C and unavailable carbohydrate intakes increased in both sexes, and the nutrient density of the diet improved in all sex and social-class groups. However, a social trend evident in 1980 still existed in 1990 with low social groups having the poorest-quality diet. It is concluded that there is tittle evidence of substantial progress towards improving the diet of adolescents in this country.
Nutrition survey : Children : Dietary changes
Nutrition is an important determinant of health or disease at any age, particularly during adolescence, a time of growth and development. This can also be a time of change in dietary habits. With the beginning of independence comes increased consumption of foods away from home and snacking. The 1980s was a decade of intense activity in health education, as well as increased interest in diet and health by the public and the media. Three major high-profile reports have been published by : the National Advisory Committee on Nutrition Education (1983); the COMA panel on Diet in Relation to Cardiovascular Disease (Department of Health and Social Security, 1984); and the COMA panel on Dietary Sugars and Human Disease (Department of Health, 1989b). The predominant advice has been to reduce intakes of fat and sugar. The food industry has been similarly active; product ranges have increased to meet new public demands, and sophisticated marketing techniques encourage us to buy. Advertising aimed at adolescents is frequently for products high in fat or sugar, or both, a message contrary to that of health education.
Only by monitoring change in diet over time is it possible to assess the effectiveness of health education and so decide future priorities. Durnin et al. (1974) conducted a
* For reprints.
20-2
544 A. ADAMSON A N D OTHERS
nutritional study of 14-year-old adolescents in Glasgow in which change was measured over 7 years. This, the only repeated cross-sectional nutritional study of adolescents to date, was conducted nearly 20 years ago, 19641971; similar information on changes in the diet of the modern adolescent is desirable. The National Food Survey has been conducted annually since 1940 (e.g. Ministry of Agriculture, Fisheries and Food, 1988), and is valuable in showing changes in the diet of the population. However, this is a household survey and as such gives no indication of the extent to which individuals or age-specific groups within the population vary in food intake (Bingham, 1987).
During 1979-1981 a nutritional study of 405 1 1-12-year-old adolescents was conducted in Northumberland (Hackett et al. 1984~) . In 1990 this study was repeated, and the results of these studies on adolescents in 1980 and 1990 are reported here.
Thus, our aims were: first, to record the nutritional intake of 11-12-year-old children in south Northumberland in 1990; second, to compare nutritional intakes between social- class groupings within each sex; third, to compare the nutritional intake of these young adolescents with that of subjects of the same age who attended the same schools, recorded in a similar study in 1980.
S U B J E C T S A N D METHODS
The location of the study was the Morpeth, Ashington, Newbiggin area of south Northumberland, chosen to give a representative range of social classes. All children in year seven (ages 11-12 years) attending seven Middle schools in this locality were invited to participate, and a letter describing the study was sent to parents who were thereby asked to consent to their child taking part. Those who did not consent were not approached further. Ethical approval for the study was obtained from the Northumberland Health Authority.
The method of collecting information on nutritional intake was the same as that described by Hackett et al. (1983, 1984a). On two occasions between January and July 1990, each child recorded, in a specially-designed diary, all foods and drinks taken for three consecutive days. Full instructions were given both in groups and to each child individually. The children recorded the time of consumption, estimates in household measures of the quantities eaten, and their bedtimes. Each child was then interviewed on the fourth day by one nutritionist to verify and enlarge on the information provided and to determine the place of purchase of each food item. By questioning, and with the aid of food models, a quantitative record of food intake was obtained (Hackett et al. 1983); colour photographs of food brands were also available. As many different days of the week as possible were recorded for each child. The order in which the schools were visited was reversed in the second survey in order to compensate for any systematic inter-school differences.
All information collected was stored in a computer using dBase 111 and intake of nutrients was calculated using purpose-written programs and SPSSx (1 986) in conjunction with computerized food tables. The food tables used were McCance and Widdowson’s ‘ The Composition of Foods’ (Paul & Southgate, 1978) as modified and supplemented by Hackett et (11. (1984a), Imnzigrant Foods (Tan et al. 1985), Cereal and Cereal Products (Holland et al. 1988), Milk Products and Eggs (Holland et al. 1989) supplements, and information supplied by the Dunn Nutrition Unit, Cambridge, including non-starch polysaccharide values for fruit and vegetables (A. E. Black, personal communication). In addition, some nutritional information was obtained from manufacturers. Unavailable carbohydrate (expressed throughout as actual weight not monosaccharide equivalent) was as defined by the Southgate method (Wenlock et al. 1985), and non-starch polysaccharides were as defined by Englyst et al. (1989). The proportion of subjects falling below the current
N U T R I T I O N A L INTAKE OF N O R T H U M B R I A N C H I L D R E N 545
recommended daily amounts of nutrients (RDA) were calculated using data for two appropriate age-bands as the children fell between these two standards (Department of Health and Social Security, 1979).
The height and weight of each child were measured in November-December 1989 in school, height using a sliding headpiece and weight using a Seca scale, with jacket and shoes removed, as described by Hackett et al. (19846). Height was measured to the nearest 25 mm and weight to the nearest 0.5 kg. In July 1990 the occupation of the head of household was obtained by questionnaire and coded as social class (Registrar General, 1980). Social classes I and I1 were labelled high, social class 111 as middle, social classes IV and V as low, and classes VI, VII and VIII as unclassified.
The study conducted 10 years previously in children of the same age attending the same seven Middle schools in south Northumberland has been described previously (Hackett et al. 1983, 1984~) . This involved each child completing five dietary records over 2 years and, for the purposes of comparison with the present study, only data from the first two of the five dietary records have been used so as to ensure comparability of age of the subjects. These data from the earlier study were not given separately in the previous publication (Hackett et al. 1984~) . The two dietary records were obtained between September 1979 and July 1980, by one dietitian (A. H.). The dietitian in the 1990 study (A. A.) was trained for 1 week by A. H. in November 1989 in order to promote uniformity of methods. The training included instruction in interviewing technique, construction of food models and duplicate examinations of twelve children aged 11-1 2 years. In the previous study (the 1980 study) heights and weights of the children were measured in November-December 1979 (using the same equipment as in the 1990 survey) and social class was coded using the classification of the Registrar General (1970). The food tables used in the 1980 surveys were McCance and Widdowson’s ‘The Composition of Foods’ (Paul & Southgate, 1978) modified and supplemented as necessary (Hackett et al. 1984~) . As noted previously (Hackett et al. 1986) the fibre content of chips (as defined by Southgate) was not given in the tables, but was taken to be 3.0 g/100 g. Values for non-starch polysaccharides (Englyst et al. 1989) were not available for the 1980 study. It was not possible to determine the fatty acid composition of fat consumed in either study.
Differences in mean intake between the sexes, social groups and studies were tested for statistical significance by analysis of variance, details of which are given in the Appendix; P values are given in the Appendix.
RESULTS
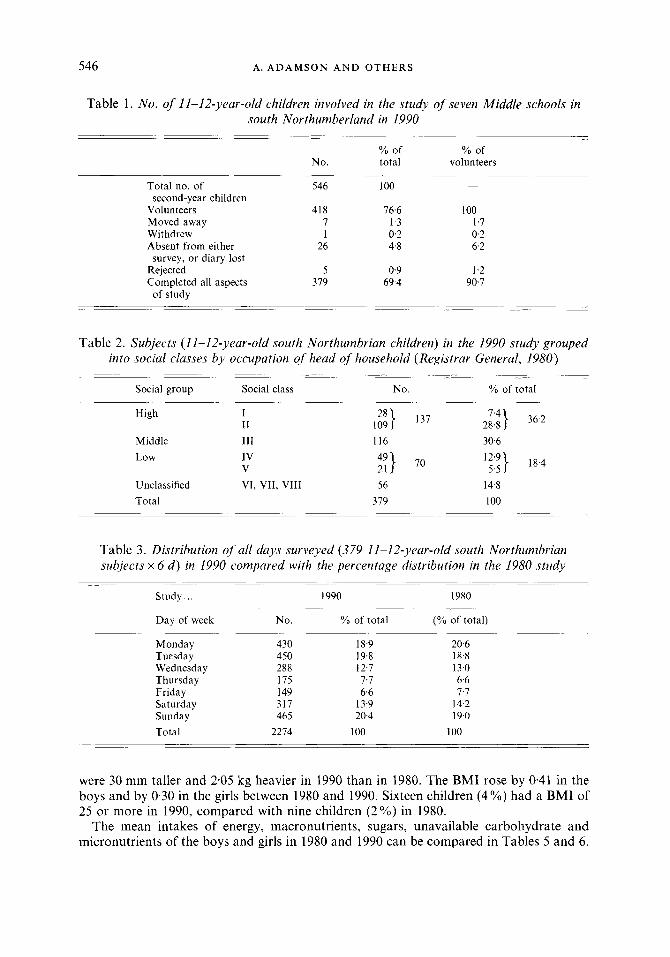
Of the 546 children invited to participate, 418 (77 YO) volunteered. This high volunteer rate was accompanied by a low withdrawal rate (0.2 YO), thirty-eight children (9 O h ) of volunteers were lost for other reasons so that 379 children (91 YO of volunteers) completed all aspects of the study (Table 1). The volunteer rate in 1980 was 59%.
Of the children, 36 YO were within the high social group, 3 1 YO in the middle and 18 % in the low social group (Table 2). These can be compared with 21, 43 and 29 YO respectively, in the 1980 study. Only three of the subjects were non-Caucasian in 1990, and one in 1980. The proportions of males in the children completing all aspects of the study was 48 % in 1980 and 49 YO in 1990 (Table 4).
Interviews could only be conducted on schooldays, therefore fewer Thursdays and Fridays, compared with other days, were included (Table 3), but the proportions of each day surveyed in 1990 were very similar to those in 1980. Of the days surveyed in 1990,62 Yo were schooldays, 36 YO holidays or weekends, and 2 % sickdays.
The mean age, height, weight and body mass index (BMI; kg/m2) recorded at each study for each sex are given in Table 4. Ages of the children in both studies were similar. The girls
546 A. A D A M S O N A N D O T H E R S
Table 1. No. of 11-12-year-old children involved in the study of seven Middle schools in south Northumberland in 1990
9'0 of % of No. total volunteers
- Total no. of 546 100
Volun teen 418 76.6 100 Moved away 7 1.3 1.7 Withdrew 1 0.2 0.2 Absent from either 26 4.8 6.2
second-year children
survey, or diary lost Rejected 5 0.9 1.2 Completed all aspects 379 69.4 90.7
of study
Table 2. Subjects (11-12-year-old south Northumbrian children) in the 1990 study grouped into social classes by occupation of head of household (Registrar General, 1980)
Social group Social class No. % of total
High I1 I 109 28} 137 2i:i} 36.2
Middle 111 116 30.6 Low 1v
V 49} 21 70
Unclassified VI, VII, VIII 56 Total 379
12'9} 5.5 18.4
14.8 I00
Table 3. Distribution of all days surveyed (379 11-12-year-old south Northumbrian subjects x 6 d ) in 1990 compared with the percentage distribution in the 1980 study
-.-
Study.. . 1990 1980
Day of week No. % of total (% of total)
Monday 430 18.9 20.6 Tuesday 450 19.8 18.8 Wednesday 288 12.7 13.0 Thursday 175 7.7 6.6
Saturday 317 13.9 14.2 Sunday 465 20.4 19.0 Total 2274 100 100
Friday 149 6.6 7.7
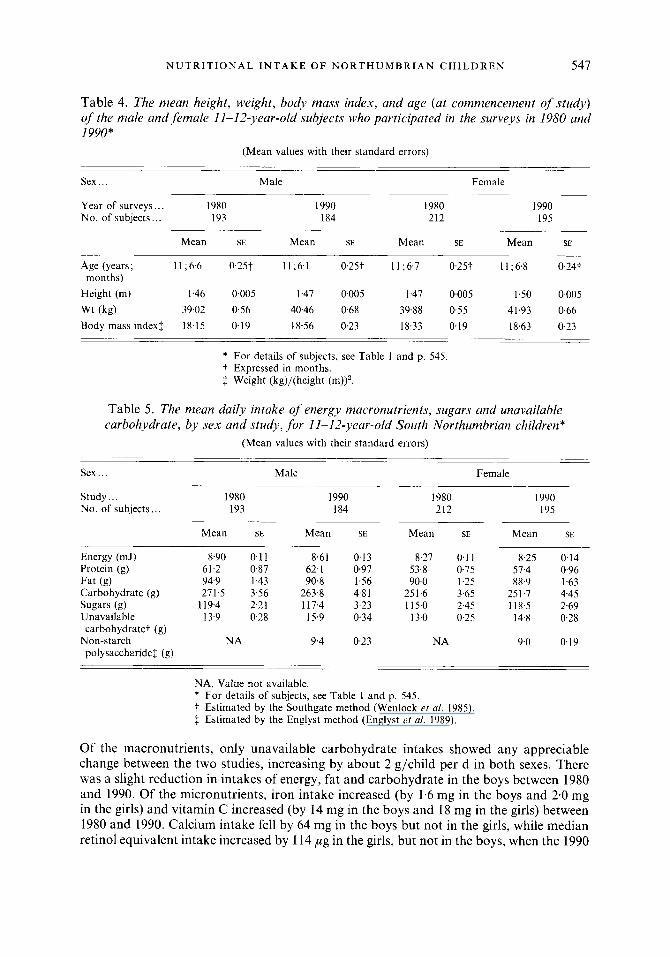
were 30 mm taller and 2.05 kg heavier in 1990 than in 1980. The BMI rose by 0-41 in the boys and by 0.30 in the girls between 1980 and 1990. Sixteen children (4%) had a BMI of 25 or more in 1990, compared with nine children (2%) in 1980.
The mean intakes of energy, macronutrients, sugars, unavailable carbohydrate and micronutrients of the boys and girls in 1980 and 1990 can be compared in Tables 5 and 6 .
N U T R I T I O N A L I N T A K E O F N O R T H U M B R I A N C H I L D R E N 547
Table 4. The mean height, weight, body mass index, and age (at commencement of study) of the male and female 11-12-year-old subjects who participated in the surveys in 1980 and 1990"
(Mean values with their standard errors)
Sex . . . Male Female
Year of surveys.. . 1980 I990 1980 1990 No. of subjects,, . 193 184 212 195
Mean SE Mean SE Mean SE Mean SE
Age (years; 11 ;6.6 0.25t 11;6.1 0.25t I1 ;6,7 0.25t 1 1 ;6.8 0.24t
Height (m) 1.46 0.005 1.47 0005 1.47 0.005 1.50 0-005 Wt (kg) 39.02 0.56 40.46 0.68 39.88 0.55 41.93 0.66 Body mass indexf 18.15 0.19 18.56 0.23 18.33 0.19 18.63 0.23
months)
* For details of subjects, see Table 1 and p. 545. t Expressed in months. $ Weight (kg)/(height (m))'.
Table 5. The mean daily intake of energy macronutrients, sugars and unavailable carbohydrate, by sex and study, for 11-12-year-old South Northumbrian children"
(Mean values with their standard errors)
Sex . . . Male Female
Study ... 1980 1990 I980 1990 No. of subjects,, , 193 184 212 I95
Mean SE Mean SE Mean SE Mean SE
Energy (mJ) 8.90 0.1 1 8.61 Protein (g) 61.2 0.87 62. I Fat (8) 94.9 1.43 90.8 Carbohydrate (9) 271.5 3.56 263.8 Sugars (8) 119.4 2.21 117.4 Unavailable 13.9 028 15.9
Non-starch NA 9.4 carbohydrate? (g)
polysaccharide$ (g)
0.13 8.27 0.1 1 8.25 0.14 0.97 53.8 0.75 57.4 0.96 1.56 90.0 1.25 88.9 1.63 4.8 1 251.6 3.65 251.7 4.45 3.23 115.0 2.45 118.5 2-59 034 13.0 0.25 14.8 0.28
023 NA 9.0 0.19
NA, Value not available. * For details of subjects, see Table 1 and p. 545. t Estimated by the Southgate method (Wenlock et al. 1985) f Estimated by the Englyst method (Englyst et al. 1989).
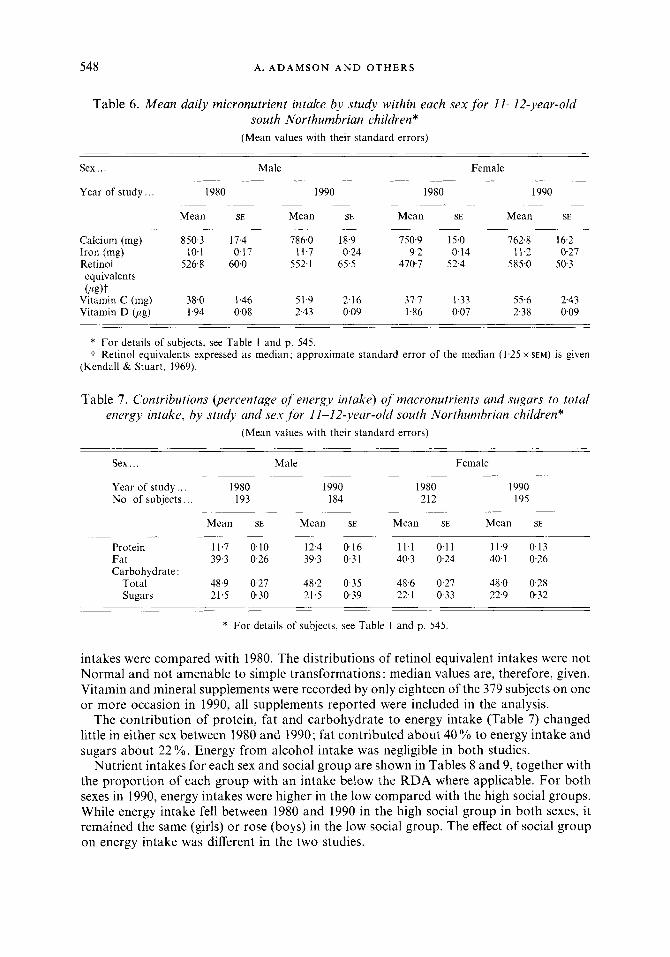
Of the macronutrients, only unavailable carbohydrate intakes showed any appreciable change between the two studies, increasing by about 2 g/child per d in both sexes. There was a slight reduction in intakes of energy, fat and carbohydrate in the boys between 1980 and 1990. Of the micronutrients, iron intake increased (by 1.6 mg in the boys and 2.0 mg in the girls) and vitamin C increased (by 14 mg in the boys and 18 mg in the girls) between 1980 and 1990. Calcium intake fell by 64 mg in the boys but not in the girls, while median retinol equivalent intake increased by 114 ,ug in the girls, but not in the boys, when the 1990
548 A. A D A M S O N A N D O T H E R S
Table 6 . Mean daily micronutrient intake by study within each sex for 11-12-year-old south Northumbrian children*
(Mean values with their standard errors)
Sex ... Male Female
Year of study.. . 1980 1990 1980 1990
Mean SE Mean SE Mean SE Mean SE
Calcium (mg) 850.3 17.4 786.0 18.9 750.9 15.0 762.8 16.2
Retinol 526.8 60.0 552.1 65.5 470.7 52.4 585.0 50.3 Iron (mg) 10.1 0.17 11.7 024 9.2 0.14 11.2 0.27
equivalents O%)t
Vitamin C (mg) 38.0 1.46 51.9 216 37.7 1.33 55.6 243 Vitamin D (pg) 1.94 0.08 2.43 0.09 1.86 0.07 2.38 0.09
* For details of subjects, see Table 1 and p. 545. 7 Retinol equivalents expressed as median; approximate standard error of the median (1.25 x SEM) is given
(Kendall & Stuart, 1969).
Table 7. Contributions (percentage of energy intake) of macronutrients and sugars to total energy intake, by study and sex ,for 1 I-12-year-old south Northumbrian children"
(Mean values with their standard errors)
Sex ... Male Female
Year of study.. . 1980 I990 1980 1990 No. of subjects .. . I93 184 212 195
Mean SE Mean SE Mean SE Mean SE
Protein 11.7 0.10 12.4 0.16 11.1 0.1 1 11.9 0.13 Fat 39.3 0.26 39.3 0.31 40.3 024 40.1 0.26
Total 48.9 0.27 48.2 0.35 48.6 0.27 48.0 0.28 Sugars 21.5 0.30 21.5 0.39 22.1 0.33 22.9 0.32
Carbohydrate :
* For details of subjects, see Table I and p. 545
intakes were compared with 1980. The distributions of retinol equivalent intakes were not Normal and not amenable to simple transformations : median values are, therefore, given. Vitamin and mineral supplements were recorded by only eighteen of the 379 subjects on one or more occasion in 1990, all supplements reported were included in the analysis.
The contribution of protein, fat and carbohydrate to energy intake (Table 7) changed little in either sex between 1980 and 1990; fat contributed about 40% to energy intake and sugars about 22 YO. Energy from alcohol intake was negligible in both studies.
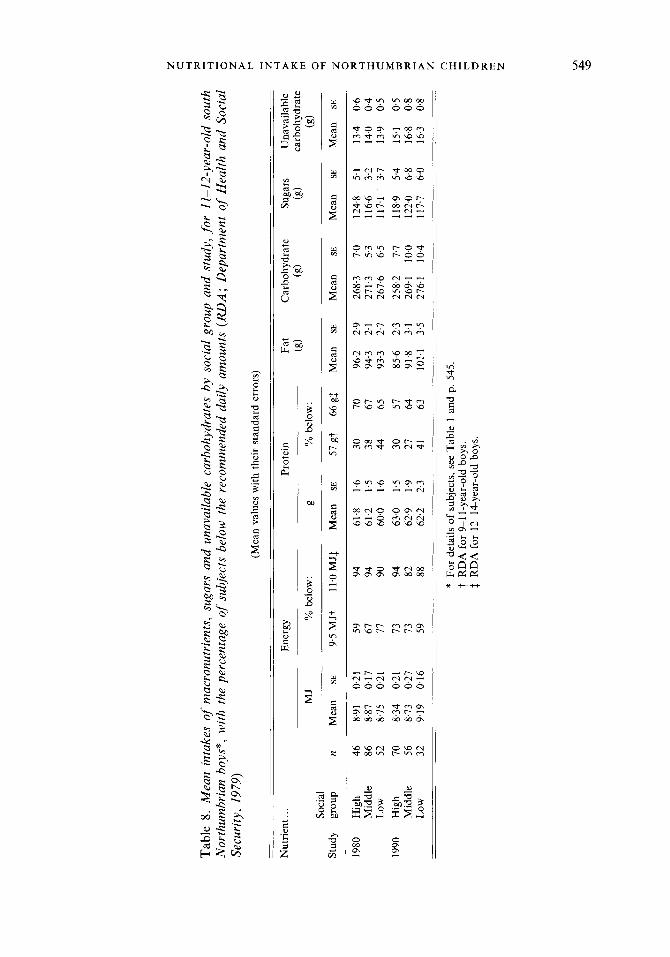
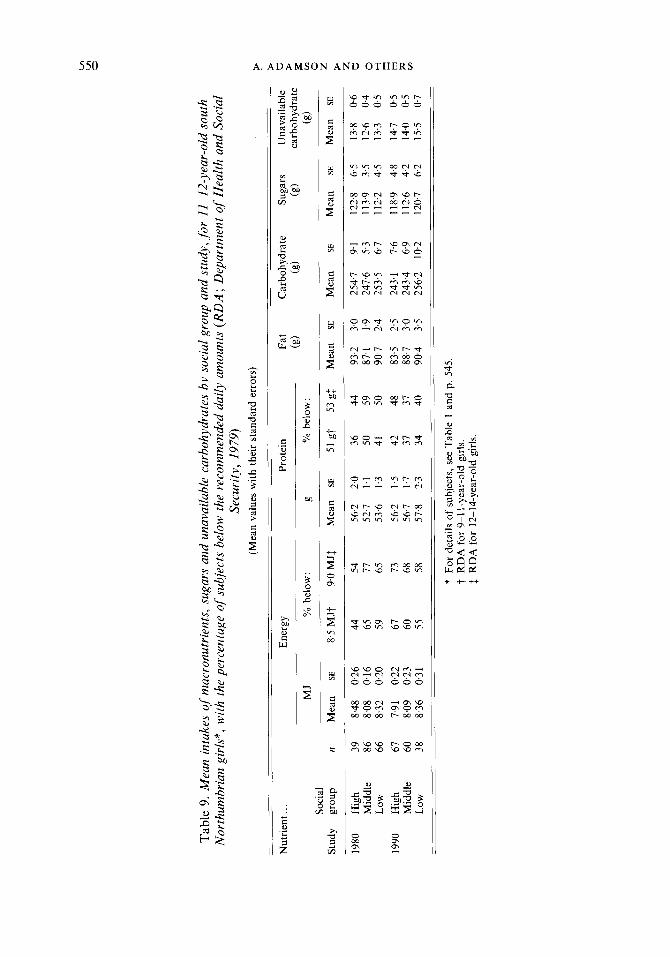
Nutrient intakes for each sex and social group are shown in Tables 8 and 9, together with the proportion of each group with an intake below the RDA where applicable. For both sexes in 1990, energy intakes were higher in the low compared with the high social groups. While energy intake fell between 1980 and 1990 in the high social group in both sexes, it remained the same (girls) or rose (boys) in the low social group. The effect of social group on energy intake was different in the two studies.
Tabl
e 8.
Mea
n in
take
s of
N
orth
umbr
ian
boys
*, w
ith
Secu
rity
, 197
9)
mac
ronu
trie
nts,
sug
ars
and
unav
aila
ble
carb
ohyd
rate
s by
soc
ial
grou
p an
d st
udy,
for
11-1
2-ye
ar-o
ld
sout
h th
e pe
rcen
tage
of
subj
ects
bel
ow t
he r
ecom
men
ded
daily
am
ount
s (R
DA
; Dep
artm
ent
of H
ealth
and
Soc
ial
(Mea
n va
lues
with
the
ir s
tand
ard
erro
rs)
Nut
rien
t.. .
Ener
gy
Prot
ein
Fat
Car
bohy
drat
e Su
gars
U
nava
ilabl
e (g
) (8
) (8
) ca
rboh
ydra
te
MJ
% b
elow
: g
% b
elow
: (g
) So
cial
St
udy
grou
p n
Mea
n SE
9.
5 M
JT
11.O
MJf
M
ean
SE
57gy
66
gl
Mea
n SE
M
ean
SE
Mea
n SE
M
ean
SE
1980
H
igh
46
8.91
0.
21
59
94
61.8
1.
6 30
70
96
.2
2.9
268.
3 7.
0 12
4.8
5.1
13.4
0
6
Mid
dle
86
8.87
0.
17
67
94
61.2
1.
5 38
67
94
.3
2.1
271.
3 5.
3 11
6.6
3.2
14.0
0.
4 Lo
w
52
8.75
02
1 77
90
60
.0
1.6
44
65
93.3
2.
7 26
7.6
6.5
117.
1 3.
7 13
.9
0.5
1990
H
igh
70
8.34
0.
21
73
94
63.0
1.
5 30
57
85
.6
2.3
258.
2 7.
7 11
8.9
5.4
15.1
0
5
Mid
dle
56
8.73
0.
27
73
82
62.9
1.
9 27
64
91
.8
3.1
269.
1 10
.0
122.
0 6.
8 16
.8
0.8
Low
32
9.
19
0.16
59
88
62
.2
2.3
41
63
101.
1 3.
5 27
6.1
10.4
11
7.7
6.0
16.3
0.
8
* Fo
r de
tails
of
subj
ects
, see
Tab
le 1
and
p. 5
45
RD
A fo
r 9-
1 1-
year
-old
boy
s.
1 R
DA
for
12-1
4-ye
ar-o
ld b
oys.
0
a z 0
0
4 z C z m TI
wl
wl
0
Tabl
e 9.
Mea
n in
take
s of
mac
ronu
trie
nts,
sug
ars
and
unav
aila
ble
carb
ohyd
rate
s by
soc
ial g
roup
and
stu
dy, f
or 1
1-12
-yea
r-ol
d so
uth
Nor
thum
bria
n gi
rls*
, with
the
per
cent
age
of s
ubje
cts
belo
w t
he r
ecom
men
ded
daily
am
ount
s (R
DA
; Dep
artm
ent o
f Hea
lth a
nd S
ocia
l Se
curi
ty, 1
979)
? (M
ean
valu
es w
ith t
heir
stan
dard
err
ors)
* N
utri
ent..
. En
ergy
Pr
otei
n Fa
t C
arbo
hydr
ate
Suga
rs
Una
vaila
ble
0
carb
ohyd
rate
!2
(g)
(g)
(g)
0 z P z
1980
H
igh
39
8.48
02
6 44
54
56
.2
2.0
36
44
93.2
3.
0 25
4.7
9.1
122.
8 6.
5 13
.8
0.6
0
Mid
dle
86
8.08
0.
16
65
77
52.7
1.
1 50
59
87
.1
1.9
247.
6 5.
3 11
3.9
3.5
12.6
0.
4 0
Lo
w
66
8.32
0.
20
59
65
53.6
1.
3 41
50
90
.7
2.4
253.
5 6.
7 11
2.2
4.5
13.3
0.
5 cl
MJ
Yn b
elow
: g
'/n be
low
: (g
) So
cial
St
udy
grou
p n
Mea
n SE
8.
5 M
Jt
9.0
MJf
M
ean
SE
51 g
t 53
g$
Mea
n SE
M
ean
SE
Mea
n SE
M
ean
SE
1990
H
igh
67
7.91
0.
22
67
73
56.2
1.
5 42
48
83
.5
2.5
243.
1 7.
6 11
8.9
4.8
14.7
0.
5 M
iddl
e 60
8.
09
0.23
60
68
56
.7
1.7
37
37
88.7
3.
0 24
3.4
6.9
112.
6 4.
2 14
.0
0.5
Low
38
8.
36
0.31
55
58
57
.8
2.3
34
40
90.4
3.
5 25
6.2
10.2
12
0.7
6.2
15.5
0.
7
* Fo
r de
tails
of
subj
ects
, see
Tab
le 1
and
p.
545
t R
DA
for
9-1
1-ye
ar-o
ld g
irls.
f
RD
A f
or 1
2-14
-yea
r-ol
d gi
rls.
N U T R I T I O N A L I N T A K E O F N O R T H U M B R I A N C H I L D R E N 551
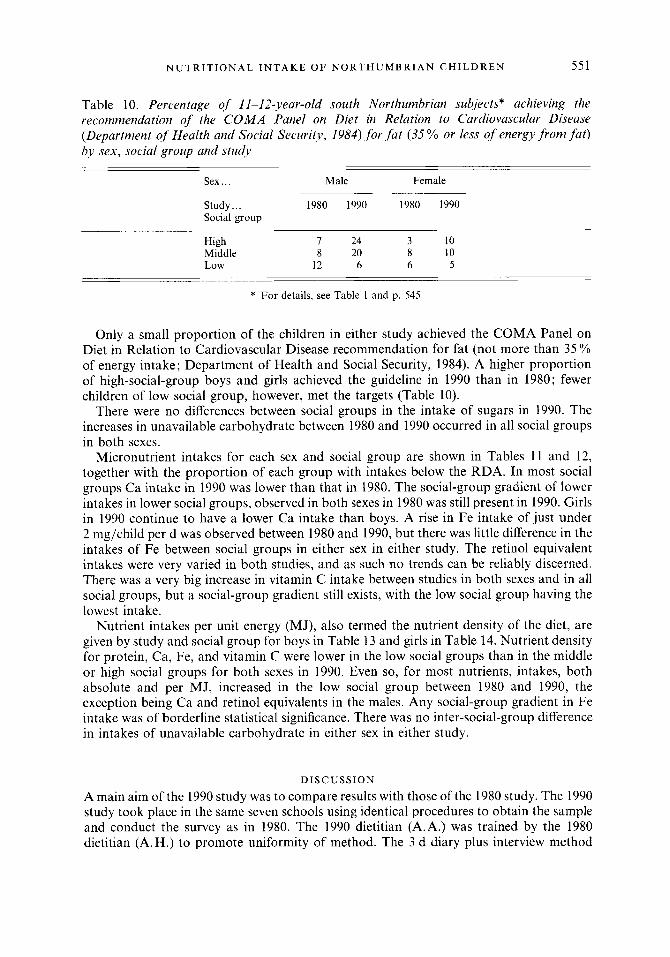
Table 10. Percentage of 11-12-year-old south Northumbrian subjects* achieving the recommendation of the C O M A Panel on Diet in Relation to Cardiovascular Disease (Department of Health and Social Security, 1984) fo r f a t (35% or less of energy f rom f a t ) by sex, social group and study
Sex ... Male Female
Study.. . 1980 1990 1980 1990 Social group
High I 24 3 10 Middle 8 20 8 10 Low 12 6 6 5
* For details, see Table 1 and p. 545.
Only a small proportion of the children in either study achieved the COMA Panel on Diet in Relation to Cardiovascular Disease recommendation for fat (not more than 35 'YO of energy intake; Department of Health and Social Security, 1984). A higher proportion of high-social-group boys and girls achieved the guideline in 1990 than in 1980; fewer children of low social group, however, met the targets (Table lo).
There were no differences between social groups in the intake of sugars in 1990. The increases in unavailable carbohydrate between 1980 and 1990 occurred in all social groups in both sexes.
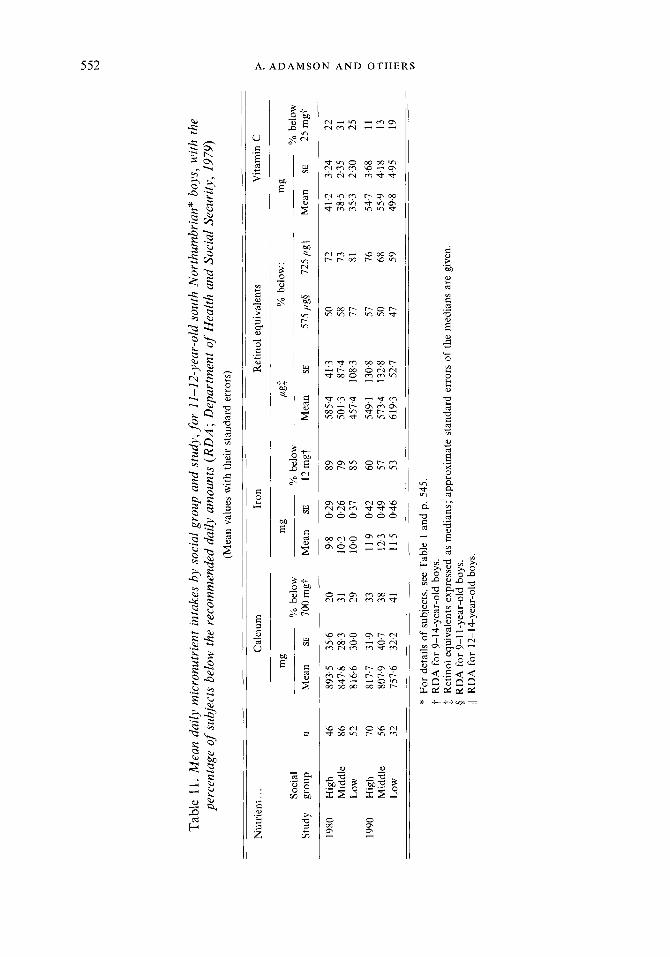
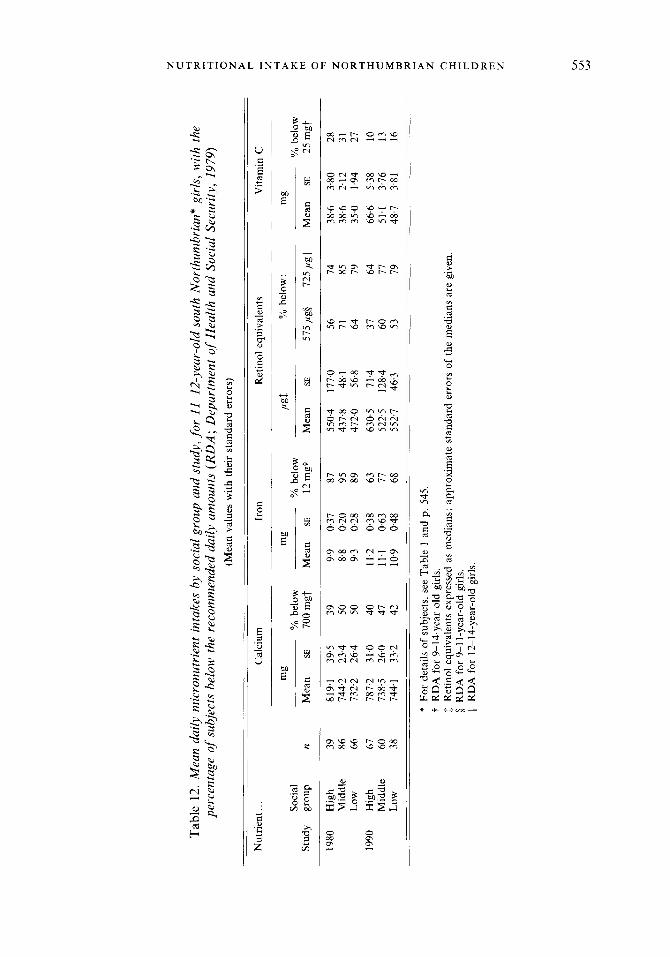
Micronutrient intakes for each sex and social group are shown in Tables 11 and 12, together with the proportion of each group with intakes below the RDA. In most social groups Ca intake in 1990 was lower than that in 1980. The social-group gradient of lower intakes in lower social groups, observed in both sexes in 1980 was still present in 1990. Girls in 1990 continue to have a lower Ca intake than boys. A rise in Fe intake of just under 2 mg/child per d was observed between 1980 and 1990, but there was little difference in the intakes of Fe between social groups in either sex in either study. The retinol equivalent intakes were very varied in both studies, and as such no trends can be reliably discerned. There was a very big increase in vitamin C intake between studies in both sexes and in all social groups, but a social-group gradient still exists, with the low social group having the lowest intake.
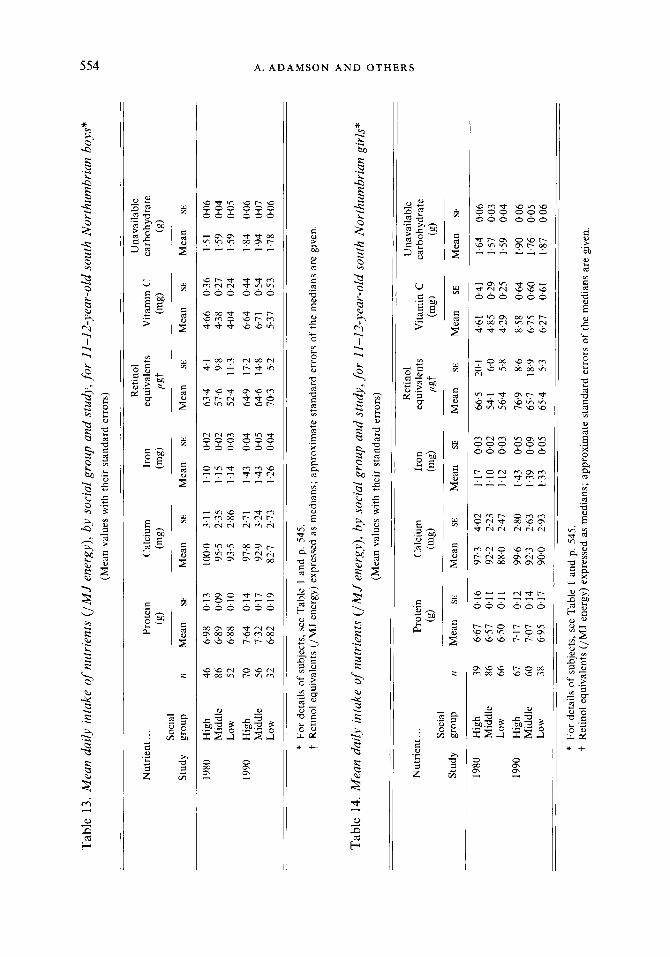
Nutrient intakes per unit energy (MJ), also termed the nutrient density of the diet, are given by study and social group for boys in Table 13 and girls in Table 14. Nutrient density for protein, Ca, Fe, and vitamin C were lower in the low social groups than in the middle or high social groups for both sexes in 1990. Even so, for most nutrients, intakes, both absolute and per MJ, increased in the low social group between 1980 and 1990, the exception being Ca and retinol equivalents in the males. Any social-group gradient in Fe intake was of borderline statistical significance. There was no inter-social-group difference in intakes of unavailable carbohydrate in either sex in either study.
D I S C U S S I O N
A main aim of the 1990 study was to compare results with those of the 1980 study. The 1990 study took place in the same seven schools using identical procedures to obtain the sample and conduct the survey as in 1980. The 1990 dietitian (A.A.) was trained by the 1980 dietitian (A.H.) to promote uniformity of method. The 3 d diary plus interview method
Tab
le 1
1. M
ean
daily
mic
ronu
trie
nt in
take
s by
soci
al g
roup
and
stu
dy, f
or 1
1-12
-yea
r-ol
d so
uth
Nor
thum
bria
n" b
oys,
with
the
perc
enta
ge of
su
bjec
ts b
elow
the
rec
omm
ende
d da
ily a
mou
nts
(RD
A ; D
epar
tmen
t of
Hea
lth a
nd S
ocia
l Sec
urity
, 19
79)
(Mea
n va
lues
with
the
ir s
tand
ard
erro
rs)
Vita
min
C
Nut
rien
t.. .
Cal
cium
Ir
on
Ret
inol
equ
ival
ents
mg
YO be
low
: m
g m
g CL
gf So
cial
%
bel
ow
YO be
low
YO
belo
w
Stud
y gr
oup
n M
ean
SE
700m
gt
Mea
n SE
12
mgt
M
ean
SE
575,
iigS
725p
gI/
Mea
n SE
25
mgt
1980
H
igh
46
893.
5 35
.6
20
9.8
0.29
89
58
5.4
41.3
50
72
41
.2
3.24
22
M
iddl
e 86
84
7.8
28.3
31
10
.2
0.26
79
50
1.3
87.4
58
73
38
.5
235
31
35.3
2.
30
25
Low
52
81
6.6
30.0
29
10
.0
0.37
85
45
7.4
108.
3 77
81
19
90
Hig
h 70
81
7.7
31.9
33
11
.9
0.42
60
54
9.1
130.
8 57
76
54
.7
3.68
11
M
iddl
e 56
80
7.9
40.7
38
12
.3
0.49
57
57
3.4
132.
8 50
68
55
9 4.
18
13
Low
32
75
7.6
322
41
11.5
0.
46
53
619.
3 52
.7
47
59
49.8
4.
95
19
* Fo
r de
tails
of
subj
ects
, see
Tab
le 1
and
p. 5
45.
t R
DA
for
9-1
4-ye
ar-o
ld b
oys.
b
Ret
inol
equ
ival
ents
expr
esse
d as
med
ians
; app
roxi
mat
e st
anda
rd e
rror
s of
the
med
ians
are
giv
en
0 R
DA
for
9-1
1-y
ear-
old
boys
. 11
RD
A f
or 1
2-14
-yea
r-old
bo
ys.
Tabl
e 12
. Mea
n da
ily m
icro
nutr
ient
int
akes
by
soci
al g
roup
and
stu
dy, f
or 1
1-12
-yea
r-ol
d so
uth
Nor
thum
brid
gir
ls,
with
the
pe
rcen
tage
of s
ubje
cts
belo
w t
he r
ecom
men
ded
daily
am
ount
s (R
DA
; Dep
artm
ent o
f H
ealth
and
Soc
ial
Secu
rity
, 19
79)
(Mea
n va
lues
with
thei
r st
anda
rd e
rror
s)
Vita
min
C
Nut
rien
t.. .
C a 1
c i u m
Ir
on
Ret
inol
equ
ival
ents
mg
YO be
low
: m
g m
g P
gI
Soci
al
YO be
low
YO
belo
w
YO be
low
St
udy
grou
p n
Mea
n SE
70
0mgt
M
ean
SE
12m
gt
Mea
n SE
57
5pgS
72
5pgI
l M
ean
SE
25m
gt
1980
H
igh
39
819.
1 39
.5
39
9.9
0.37
87
55
0.4
177.
0 56
74
38
.6
3.80
28
M
iddl
e 86
74
4.2
23.4
50
8.8
0.
20
95
437.
8 48
.1
71
85
38.6
2.
12
31
Low
66
73
2.2
26.4
SO
9.
3 0.
28
89
472.
0 56
.8
64
79
35.0
1.
94
27
1990
H
igh
67
787.
2 31
.0
40
11.2
0.
38
63
630.
5 71
.4
37
64
66
6
5.38
10
M
iddl
e 60
73
8.5
26.0
47
11
.1
0.63
77
52
2.5
128.
4 60
77
51
.1
3.76
13
Lo
w
38
744.
1 33
.2
42
109
0.48
68
55
2.7
46.3
53
79
48
.7
3.81
16
* Fo
r de
tails
of
subj
ects
, see
Tab
le 1
and
p. 5
45.
t R
DA
for
9-1
4-ye
ar-o
ld g
irls.
1
Ret
inol
equ
ival
ents
expr
esse
d as
med
ians
; app
roxi
mat
e st
anda
rd e
rror
s of
the
med
ians
are
giv
en.
5 R
DA
for
9-1
1-y
ear-
old
girls
. 11
RD
A f
or 1
2-14
-yea
r-ol
d gi
rls.
m
P I
P z n
(A
(A
P
Tab
le 1
3. M
ean
daily
int
ake
of nu
trie
nts
(lM
J en
ergy
), b
y so
cial
gro
up a
nd s
tudy
, for
11-
12-y
ear-
old
sout
h N
orth
umbr
ian
boys
* (M
ean
valu
es w
ith t
heir
sta
ndar
d er
rors
) Ret
inol
U
nava
ilabl
e N
utri
ent..
. Pr
otei
n C
alci
um
Iron
eq
uiva
lent
s V
itam
in C
ca
rboh
ydra
te
(g)
(mg)
(m
s)
lGt
(mg)
(g
) So
cial
St
udy
grou
p n
Mea
n SE
M
ean
SE
Mea
n SE
M
ean
SE
Mea
n SE
M
ean
SE
1980
H
igh
46
6.98
0.
13
100.
0 3.
11
1.10
00
2 63
.4
4.1
4.66
03
6 1.
51
0.06
M
iddl
e 86
6.
89
0.09
95
.5
2.35
1.
15
0.02
57
.6
9.8
4.38
0.
27
1.59
00
4 Lo
w
52
688
0.10
93
.5
2.86
1.
14
0.03
52
.4
11.3
4.
04
0.24
1.
59
0.05
19
90
Hig
h 70
7.
64
0.14
97
.8
2.71
1.
43
0.04
64
.9
17.2
6.
64
0.44
1.
84
0.06
M
iddl
e 56
7.
32
0.17
92
.9
3.24
1.
43
0.05
64
.6
14.8
6.
71
0.54
1.
94
0.07
?
Lo
w
32
6.82
0.
19
82.7
2.
73
1.26
0.
04
703
5.2
5.37
0.
53
1.78
0.
06
P
U
9
0 z P z U
0
4 w 5
* Fo
r de
tails
of
subj
ects
, see
Tab
le I
and
p. 5
45.
t R
etin
ol e
quiv
alen
ts (/
MJ
ener
gy)
expr
esse
d as
med
ians
; ap
prox
imat
e st
anda
rd e
rror
s of
the
med
ians
are
giv
en.
Tab
le 1
4. M
ean
daily
int
ake
of n
utri
ents
(IM
J en
ergy
), b
y so
cial
gro
up a
nd s
tudy
, for
11-
12-y
ear-
old
sout
h N
orth
umbr
ian
girl
s*
(Mea
n va
lues
with
the
ir st
anda
rd e
rror
s)
E R
etin
ol
Una
vaila
ble
v,
Nut
rien
t.. .
Prot
ein
Cal
cium
Ir
on
equi
vale
nts
Vita
min
C
carb
ohyd
rate
Stud
y gr
oup
n M
ean
SE
Mea
n SE
M
ean
SE
Mea
n SE
M
ean
SE
Mea
n SE
(9)
(mg)
(m
s)
lLst
(mg)
(g
) So
cial
1980
H
igh
39
6.67
0.
16
97.3
4.
02
1.17
0.
03
66.5
20
.1
4.61
0.
41
1.64
0.
06
Low
66
6.
50
0.11
88
.0
2.47
1.
12
0.03
56
.4
5.8
4.29
0.
25
1.59
0.
04
1990
H
igh
67
7.17
0.
12
99.6
2.
80
1.43
0.
05
76.9
8.
6 8.
58
0.64
1.
90
0.06
M
iddl
e 60
7.
07
0.14
92
.3
2.63
1.
39
0.09
65
.7
18.9
6.
75
0.60
1.
76
0-05
Lo
w
38
6.95
0.
17
90.0
2.
93
1.33
0.
05
65.4
5.
3 6.
27
0.61
1.
87
0.06
Mid
dle
86
6.57
0.
11
92.2
2.
23
1.10
0.
02
54.1
6.
0 4.
85
0.29
1.
57
0.03
* Fo
r de
tails
of
subj
ects
, see
Tab
le 1
and
p. 5
45.
t R
etin
ol e
quiv
alen
ts (/
MJ
ener
gy) e
xpre
ssed
as
med
ians
; app
roxi
mat
e st
anda
rd e
rror
s of
the
med
ians
are
giv
en.
N U T R I T I O N A L INTAKE O F N O R T H U M B R I A N C H I L D R E N 555
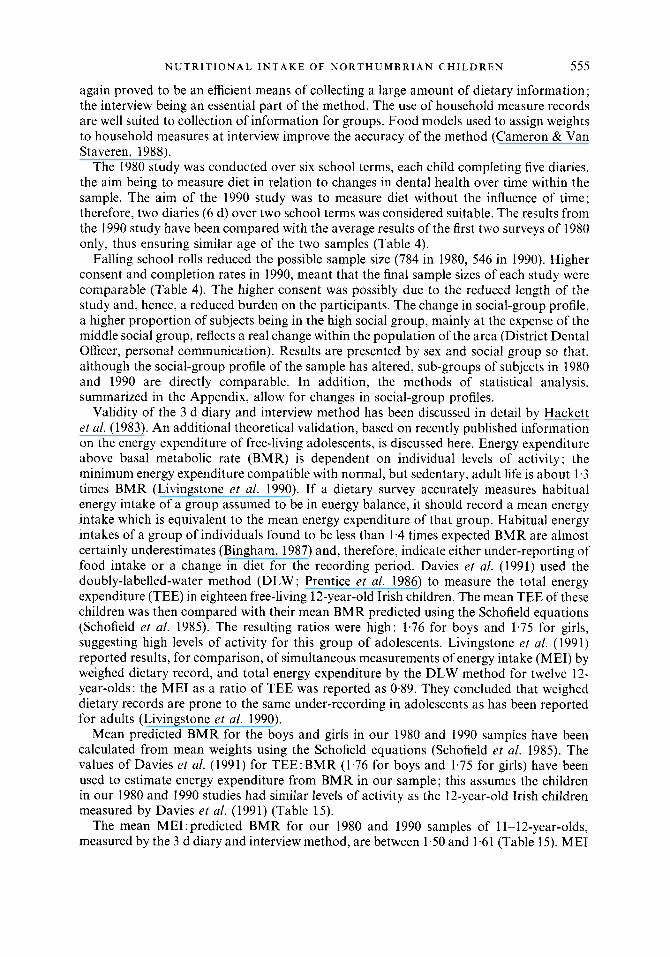
again proved to be an efficient means of collecting a large amount of dietary information; the interview being an essential part of the method. The use of household measure records are well suited to collection of information for groups. Food models used to assign weights to household measures at interview improve the accuracy of the method (Cameron & Van Staveren, 1988).
The 1980 study was conducted over six school terms, each child completing five diaries, the aim being to measure diet in relation to changes in dental health over time within the sample. The aim of the 1990 study was to measure diet without the influence of time; therefore, two diaries (6 d) over two school terms was considered suitable. The results from the 1990 study have been compared with the average results of the first two surveys of 1980 only, thus ensuring similar age of the two samples (Table 4).
Falling school rolls reduced the possible sample size (784 in 1980, 546 in 1990). Higher consent and completion rates in 1990, meant that the final sample sizes of each study were comparable (Table 4). The higher consent was possibly due to the reduced length of the study and, hence, a reduced burden on the participants. The change in social-group profile, a higher proportion of subjects being in the high social group, mainly at the expense of the middle social group, reflects a real change within the population of the area (District Dental Officer, personal communication). Results are presented by sex and social group so that, although the social-group profile of the sample has altered, sub-groups of subjects in 1980 and 1990 are directly comparable. In addition, the methods of statistical analysis, summarized in the Appendix, allow for changes in social-group profiles.
Validity of the 3 d diary and interview method has been discussed in detail by Hackett et al. (1983). An additional theoretical validation, based on recently published information on the energy expenditure of free-living adolescents, is discussed here. Energy expenditure above basal metabolic rate (BMR) is dependent on individual levels of activity; the minimum energy expenditure compatible with normal, but sedentary, adult life is about 1.3 times BMR (Livingstone et al. 1990). If a dietary survey accurately measures habitual energy intake of a group assumed to be in energy balance, it should record a mean energy intake which is equivalent to the mean energy expenditure of that group. Habitual energy intakes of a group of individuals found to be less than 1.4 times expected BMR are almost certainly underestimates (Bingham, 1987) and, therefore, indicate either under-reporting of food intake or a change in diet for the recording period. Davies et al. (1991) used the doubly-labelled-water method (DLW; Prentice et al. 1986) to measure the total energy expenditure (TEE) in eighteen free-living 12-year-old Irish children. The mean TEE of these children was then compared with their mean BMR predicted using the Schofield equations (Schofield et al. 1985). The resulting ratios were high: 1.76 for boys and 1.75 for girls, suggesting high levels of activity for this group of adolescents. Livingstone et al. (1991) reported results, for comparison, of simultaneous measurements of energy intake (MEI) by weighed dietary record, and total energy expenditure by the DLW method for twelve 12- year-olds: the ME1 as a ratio of TEE was reported as 0.89. They concluded that weighed dietary records are prone to the same under-recording in adolescents as has been reported for adults (Livingstone et al. 1990).
Mean predicted BMR for the boys and girls in our 1980 and 1990 samples have been calculated from mean weights using the Schofield equations (Schofield et al. 1985). The values of Davies et al. (1991) for TEE:BMR (1.76 for boys and 1.75 for girls) have been used to estimate energy expenditure from BMR in our sample; this assumes the children in our 1980 and 1990 studies had similar levels of activity as the 12-year-old Irish children measured by Davies et al. (1991) (Table 15).
The mean ME1:predicted BMR for our 1980 and 1990 samples of 11-12-year-olds, measured by the 3 d diary and interview method, are between 1.50 and 1.61 (Table 15). ME1
556 A. ADAMSON A N D OTHERS
Table 15. The measured energy intake (MEI):predicted basal metabolic rate ( B M R ) and MEI: estimated energy expenditure (EEE) of I I-12-year-old south Northumbrian children* in the 1980 and the 1990 studies
Predicted? Wt BMR EEEt ME1 (kg) (MJ) (MJ) (MJ) ME1:BMR ME1:EEE
Male 1980 193 39.0 5.64 9.93 8.90 1.58 0.90 1990 184 40.5 5.75 10.12 8.61 1.50 0.85
1980 212 39.9 5.13 8.98 8.27 1.61 0.92 1990 195 41.9 5.24 9.17 8.25 1.57 0.90
Female
* For details of subjects, see Table 1 and p. 545. t Predicted from body-weight; Schofield equations for males and females of 10-18 years (Schofield et al. 1985). 3 Estimated from total energy expenditure (determined by the doubly-labelled-water method) : predicted BMR;
boys aged 12 years 1.76, girls aged 12 years 1.75 (Davies et al. 1991).
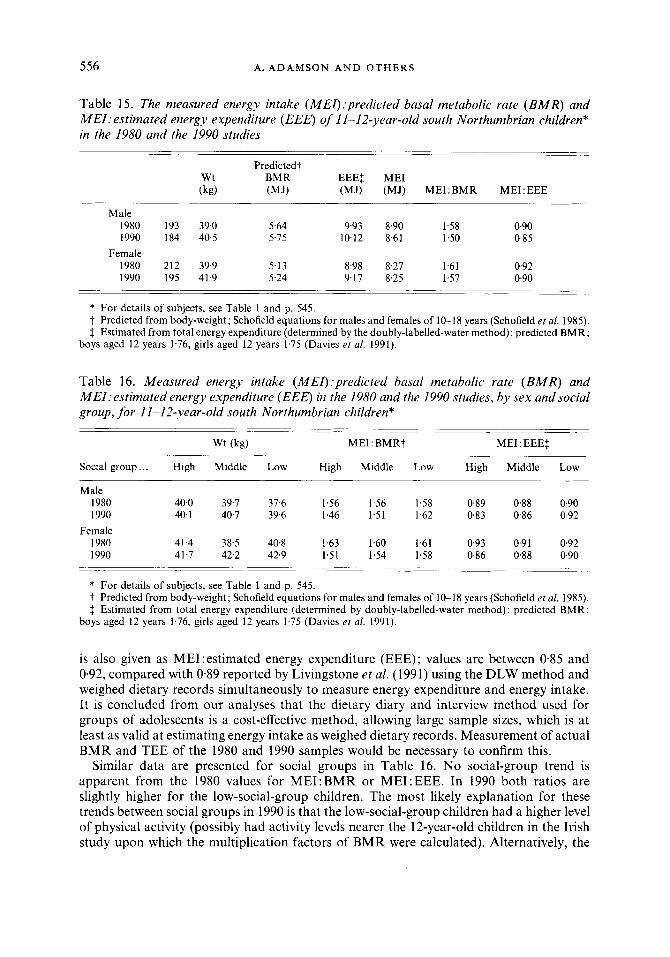
Table 16. Measured energy inlake (MEI):predicted basal metabolic rate ( B M R ) and MEI:estimated energy expenditure (EEE) in the 1980 and the 1990 studies, by sex and social group, for 11-12-year-old south Northumbrian children*
Wt (kg) ME1 : BMRt ME1 : EEEt
Social group ... High Middle Low High Middle Low High Middle Low
Male 1980 40.0 39.7 37.6 1.56 1.56 1.58 0.89 0.88 0.90 1990 40.1 40.7 39.6 1.46 1.51 1.62 0.83 0.86 0.92
Female 1980 41.4 38.5 40.8 1.63 1.60 1.61 093 0.91 0.92 1990 41.7 42.2 42.9 1.51 1.54 1.58 0.86 0.88 0.90
* For details of subjects, see Table 1 and p. 545. t Predicted from body-weight; Schofield equations for males and females of 10-18 years (Schofield et al. 1985). f Estimated from total energy expenditure (determined by doubly-labelled-water method) : predicted BMR;
boys aged 12 years 1.76, girls aged 12 years 1.75 (Davies et al. 1991).
is also given as ME1:estimated energy expenditure (EEE); values are between 0.85 and 0.92, compared with 0.89 reported by Livingstone et al. (1991) using the DLW method and weighed dietary records simultaneously to measure energy expenditure and energy intake. It is concluded from our analyses that the dietary diary and interview method used for groups of adolescents is a cost-effective method, allowing large sample sizes, which is at least as valid at estimating energy intake as weighed dietary records. Measurement of actual BMR and TEE of the 1980 and 1990 samples would be necessary to confirm this.
Similar data are presented for social groups in Table 16. No social-group trend is apparent from the 1980 values for ME1:BMR or ME1:EEE. In 1990 both ratios are slightly higher for the low-social-group children. The most likely explanation for these trends between social groups in 1990 is that the low-social-group children had a higher level of physical activity (possibly had activity levels nearer the 12-year-old children in the Irish study upon which the multiplication factors of BMR were calculated). Alternatively, the
N U T R I T I O N A L INTAKE O F N O R T H U M B R I A N C H I L D R E N 557
dietary records of the low-social-group children may be more complete. A less likely explanation could be that BMR differs slightly between social groups. The difference from the 1980 results could be explained by a reduction in the physical activity levels of the high- social-group children.
The fall in average energy intake between 1980 and 1990, particularly for boys, agrees with the thesis of Whitehead et al. (1982) of a long-term decrease, but the contributions of fat, protein and carbohydrate to energy intake and the mean intakes of fat and sugars were unchanged despite the enormous amount of attention paid to diet in recent years by the media and health educators.
A diet with the same percentage of energy from fat (40%) was reported for Glasgow adolescents in 1964 and 1971 (Durnin et al. 1974). Our results indicate there has been no change in contribution of fat to energy intake in this age-group in 27 years. The 1990 results, obtained 7 years after the National Advisory Committee on Nutrition Education (1983) report, are disappointing; they suggest that health education methods are ineffective at reducing fat intake in this group, and that other factors exert greater influence over food choice. More children in 1990 than in 1980 achieved the COMA panel on Diet in Relation to Cardiovascular Disease (Department of Health and Social Security, 1984) recom- mendation that energy from fat should not exceed 35 YO of total energy, but they are still a minority who are found mainly in the high and middle social groups (Table 10). The fatty acid composition of the diet was not determined. It is possible that this has altered whilst total fat intake is static.
The UK diet has 15-20% of energy contributed from sugar (Department of Health, 1989b). Our results show that in 1990 sugar continues to contribute over 20 % to the total energy intake of this age-group, identifying them as among the highest consumers of sugar as a proportion of energy in the UK. Sugar intake remains at approximately 120 g/d despite the increased range of sugar-free products available and the efforts of health education to encourage reduction. Sources of sugar and amount of intrinsic and extrinsic sugars will be reported elsewhere.
Ca intake remained the same in girls at just above RDA, but fell for boys, between 1980 and 1990. Some improvements in diet seem to have occurred: Fe, vitamin C and unavailable carbohydrate intakes increased and nutrient density of the diet improved in all sex and social groups. However, as in 1980, the low social groups consumed the poorest- quality diets.
The average nutrient intakes recorded in 1990 are in broad agreement with those of other recent surveys of this age-group. The Department of Health in its publication Diets of British Schoolchildren (Department of Health, 1989 a) reported intakes of 1723 10-1 l-year- olds in 1983, while Nelson et al. (1990) reported intakes of 143 11-12-year-olds in 1989. Both these studies used weighed dietary records. These authors reported energy intakes for boys as 8.67 and 7.74 MJ respectively (compared with 8.61 MJ in our 1990 study). Ca intakes of 833 and 768 mg (compared with 786 mg in our 1990 study), Fe intakes of 10.0 and 11.2 mg (1 1.7 mg in our 1990 study) and vitamin C intakes of 49.3 and 68.4 mg (66.6 mg in our 1990 study). For girls the same authors reported energy intakes of 7.57 and 7.45MJ respectively (8.25 MJ in our 1990 study); this higher energy intake is reflected by higher intakes of other nutrients: Ca 702 and 701 mg (763 mg in our 1990 study), Fe 8.6 and 10.0 mg (1 1.2 mg in our 1990 study), and vitamin C 49.0 and 68.4 mg (55.6 mg in our 1990 study). Jenner et al. (1989), in a survey of 118 11-12-year-old Australian children, using fourteen 24-h diet records, reported results for boys and girls together as: energy 8.0 MJ and Ca 800 mg, which compares with 8.42 MJ and 774 mg Ca for both sexes, in our present study. The contributions to energy intake of fat, protein and carbohydrate reported here are similar to those of other studies previously quoted, although the contribution of fat
558 A. ADAMSON A N D O T H E R S
(40 YO of energy) is marginally higher than values of approximately 38 YO reported by the Department of Health (1989a), Nelson et al. (1990) and Jenner et al. (1989). Dietary vitamin D intake was 2.3,ug, slightly higher than previously reported in other British studies. Lamberg-Allardt et al. (1984) reported an average vitamin D intake of 2.1 ,ug in 324 12-year-old Finnish children.
The fall in energy intake is coupled with an increase in BMI in both sexes and also an increase in the proportion of adolescents considered to be obese (BMI greater than 25). These results suggest adolescents are becoming less active. If so, this is a matter of considerable concern which warrants further investigation.
Although unavailable carbohydrate intake has increased by approximately 2 g/person per d to about 15 g/person per d, this is still below the 1980 average UK daily intake of 20 g/d (Bingham & Cummings, 1980) or the recommendation by the National Advisory Committee on Nutrition Education (1983) of a daily intake of 30 g. The food sources of unavailable carbohydrate along with energy, protein and fat will be the subject of a separate publication. Present unavailable carbohydrate intake per unit energy is approximately 1.9 g/MJ ; assuming no change in energy intake an unavailable carbohydrate intake of 3.6 g/MJ would be required to meet National Advisory Committee on Nutrition Education (1983) recommendations. This would suggest that the National Advisory Committee on Nutrition Education (1 983) recommendation is an unrealistic target for this group.
Comparable survey data for dietary fibre intakes are sparse. The Diets of British Schoolchildren Survey (Department of Health, 1989a) did not investigate dietary fibre. The Dietary and Nutritional Survey of British Adults (Ministry of Agriculture, Fisheries and Food and the Department of Health, 1990) reports mean daily dietary fibre intakes of 24.9 g for men and 18.6 g for women. This compares with 15.9 and 14.8 g unavailable carbohydrate for boys and girls respectively in our 1990 survey. The National Food Survey of 1989 (Ministry of Agriculture, Fisheries and Food and the Department of Health, 1990) estimates, from household purchases, the population average daily intake of non-starch polysaccharides as 12.4 g, which compares with 9.4 and 9.0 g for boys and girls in our 1990 study. The food table database used by the Ministry of Agriculture, Fisheries and Food and Department of Health differs from that used in the present study. Whilst every effort was made to make our database complete, values for unavailable carbohydrate and non-starch polysaccharides were absent for some foods, in particular some meat and fish products. This may have resulted in a small underestimation of the dietary fibre intake of these children.
Ca intakes exceed the RDA in both sexes. However, only in the low-social-group girls was the Ca intake higher in 1990 than in 1980; in all other groups it was lower in 1990. Approximately 45% of the adult skeletal mass is formed during adolescence, and the largest gains are made in early adolescence: 10-14 years in girls and 12-16 years in boys (Greenwood & Richardson, 1979). Osteoporosis is a significant cause of disability in the elderly, especially elderly women, and one of the main approaches to osteoporosis prevention is to maximize peak bone mass. Recent studies indicate both nutritional and genetic factors influence bone growth in teenage girls, and, therefore, teenage girls may be at risk of skeletal inadequacy if their Ca needs of puberty are not met by an adequate Ca intake (Matkovic et al. 1990).
Deficiency of dietary Fe, and hence anaemia, is recognized as a worldwide nutritional problem. Adolescents are particularly susceptible to Fe-deficiency anaemia due to increased erythropoiesis during this time of growth (Greenwood & Richardson, 1979). Thus, the increase in Fe intake between 1980 and 1990 is encouraging. The average diet in 1990 provided 1.4 mg Fe/MJ compared with 1.1 mg Fe/MJ in 1980; an important increase,
N U T R I T I O N A L I N T A K E O F N O R T H U M B R I A N C H I L D R E N 559
as anaemia is usually prevented by an intake of 1.3 mg Fe/MJ (Department of Health and Social Security, 1979). However, a substantial proportion of subjects still fall below the RDA for Fe. Any values for Fe intake must be considered with caution as the use of food tables can give rise to poor estimates of Fe intake (Marr, 1971) and the bioavailability of Fe intake was not considered.
The energy intakes reported are considerably lower than the RDA with large proportions of the children, particularly boys, falling below the RDA. This could reflect under- reporting of intake, but comparison with other recent surveys and with estimated energy expenditure suggests that the Department of Health and Social Security (1979) RDA may be too high for this age group with their current levels of activity. Armstrong et al. (1990) recently found low levels of habitual physical activity in 266 British children aged 11-16 years.
Whilst average energy intakes have fallen, the nutrient density has risen for many nutrients. This is true from our 1980 v. 1990 comparisons, but also longer term when compared with calculations from results reported by Widdowson (1947) of a study conducted in 1935-1939 on 12- and 13-year-olds. Intakes for boys and girls respectively were: protein (g/MJ) 6.8, 6.9, (7.2, 6.9 in 1990); Ca (mg/MJ) 65, 65 (91, 93 in 1990); Fe (mg/MJ) 1.2, 1.2 (1.4, 1.4 in 1990); vitamin C (mg/MJ) 5.1, 4.4 (6.0, 6.7 in 1990). These comparisons indicate some long-term improvement in the nutrient density of the diets of adolescents in Britain, which is in agreement with the statement of Truswell & Darnton-Hill (1981) that ‘the diet of the modern adolescent is not as bad as is commonly thought’. However, an aspect of some concern is that a social-class gradient still exists, the lowest social group having the diet with the lowest nutrient density. The higher energy intake reported for the low social groups is not a reflection of a better quality of diet (Tables 13, 14), rather a reflection of higher fat intakes (low-social-group boys) or higher sugar intakes (low-social-group girls). This finding is in agreement with the results of Cook et al. (1973) who found that children of high social class had higher intakes per unit energy of all nutrients, with the exception of carbohydrate and added sugar, than children of low social class. Despite improvements in Fe and retinol equivalent intakes between 1980 and 1990, more than 50% of boys and girls still failed to achieve the RDA (Department of Health and Social Security, 1979) for these nutrients in 1990. The RDA (Department of Health and Social Security, 1979) for Ca is achieved by at least 50 YO of all the sub-groups studied. However, the proportion of boys failing to meet the RDA (Department of Health and Social Security, 1979) has increased between 1980 and 1990.
This repeated cross-sectional study has resulted in findings which are relevant at this time on the diets of 11-12-year-olds in south Northumberland in 1990 and changes which have occurred since 1980. The results are in agreement with other national and regional surveys, and so there is no reason to suspect adolescents in this region are unusual in their dietary habits. There is a need for other repeat cross-sectional studies for different age-groups.
The present paper has highlighted areas of concern for those involved in health education policy formation and delivery. Although there is a welcome increase in intakes of fibre and Fe, these adolescents were consuming less energy but eating no less sugars or fat (as a proportion of energy) than adolescents 10 years ago. If energy intake continues to fall the nutrient density of the diet becomes increasingly important. Reduction of the proportion of energy derived from sugar and replacement with nutrient-dense foods would be a valuable step in achieving recommended intakes, particularly for the low social groups. Adolescents should be targeted in the promotion of food alternatives which contain less fat and less non-milk extrinsic sugars. The nutritional quality of snack foods at affordable prices, during this time of emerging independence when personal food choice begins to make a significant contribution to the total diet, should be given careful consideration.
560 A. A D A M S O N A N D O T H E R S
These studies were supported by the MRC and Newcastle Health Authority. The authors thank the Northumberland Health and Education Authorities, the schools, the children and their families for their considerable assistance. They also thank Miss A. E. Black for her advice and nutritional information on foods.
R E F E R E N C E S Armstrong, N., Balding, J., Gentle, P. & Kirby, B. (1990). Patterns of physical activity among 11 to 16 year old
British children. British Medical Journal301, 203-205. Bingham, S. A. (1987). The dietary assessment of individuals, methods, accuracy, new techniques and
recommendations. Nutriiion Abstracts and Reviews 57, 705-742. Bingham, S. A. & Cummings, J. H. (1980). In Medical Aspects ofDietary Fibre, pp. 261-284 [G. A. Spiller and
R. M. Kay, editors]. New York: Plenum Press. Cameron, M. E. & Van Staveren, W. A. (1988). Manual on Methodology for Food Consumpiion Siudies. Oxford:
Oxford University Press. Cook, J., Altman, D. G., Moore, D. M. C., Topp, S. G., Holland, W. W. & Elliot, A. (1973). A survey of the
nutritional status of schoolchildren : relation between nutrient intake and socio-economic factors. British Journal of Preveniive and Social Medicine 27, 91-99.
Davies, P. S. W., Livingstone, M. B. E., Prentice, A. M., Coward, W. A,, Jagger, S. E., Stewart, C., Strain, J. J. & Whitehead, R. G. (1991). Total energy expenditure during childhood and adolescence. Proceedings of the Nutrition Society SO, 14A.
Department of Health (1989~). The Diets qf British Schoolchildren. Repori on Healih and Social Subjects no. 36. London: H.M. Stationery Office.
Department of Health (19896). Dieiarji Sugars and Human Disease. Report on Health and Social Subjecis no. 37. London: H.M. Stationery Office.
Department of Health and Social Security (1979). Recommended Daily Amounis of Foodand Energy and Nutrients for Groups of People in the United Kingdom. Report on Healih and Social Subjecis no. 15. London: H.M. Stationery Office.
Department of Health and Social Security (1984). Diet and Cardiovascular Disease. Report on Healih and Social Subjecis no. 28. London: H.M. Stationery Office.
Durnin, J. V. G. A., Lonergan, M. E., Good, J. & Ewan, A. (1974). A cross-sectional and anthropometric study, with an interval of 7 years, on 61 1 young adolescent schoolchildren. Briiish Journal of Nutrition 32, 169-179.
Englyst, H. N., Bingham, S., Collinson, E., Ruswick, S. & Curnrnings, J. H. (1989). Dietary fibre (non-starch polysaccharides) in cereal products. Journal of Human Nutriiion and Dietetics 2, 253-271.
Greenwood, C. T. & Richardson, D. P. (1979). Nutrition during adolescence. World Review of Nutrition and Dieteiics 33, 1 4 1.
Hackett, A. F., Rugg-Gum, A. J. & Appleton, D. R. (1983). The use of a dietary diary and interview to estimate the food intake of children. Human Nutrition: Applied Nutrition 37A, 293-300.
Hackett, A. F., Rugg-Gunn, A. J., Appleton, D. R. & Coombs, A. (1986). Dietary sources ofenergy, protein, fat and fibre in 375 English adolescents. Human Nutrition: Applied Nutrition 40A, 176184.
Hackett, A. F., Rugg-Gunn, A. J., Appleton, D. R., Eastoe, J. E. &Jenkins, G. N. (1984~). A 2-year longitudinal nutritional survey of 405 Northumberland children initially aged 11.5 years. Brifish Journal of Nutrition 51,
Hackett, A. F., Rugg-Gunn, A. J., Appleton, D. R., Parkin, J. M. & Eastoe, J. E. (1984b). A 2-year longitudinal study of dietary intake in relation to the growth of 405 English children initially aged 11-12 years. Annuls of Human Biology 11, 545-553.
Holland, B., Unwin, I. D. & Buss, D. H. (1988). Cereals and Cereal Products. The Third Supplement to McCance and Widdowson’s ‘The Composition of Foods’, 4th ed. London: The Royal Society of Chemistry and Ministry of Agriculture, Fisheries and Food.
Holland, B., Unwin, I. D. & Buss, D. H. (1989). Milk Products and Eggs. The Fourth Supplement fo McCance and Widdowson’s ‘The Cornposition ofFoods’, 4th ed. London: The Royal Society of Chemistry and Ministry of Agriculture, Fisheries and Food.
Jenner, D. A,, Neylon, K., Croft, S., Beilin, L. J. & Vandongen, R. (1989). A comparison of methods of dietary assessment in Australian children aged 11-12 years. European Journal of Clinical Nutrition 43, 663-673.
Kendall, M. G. & Stuart, A. (1969). The Advanced Theory of Siaiistics, 3rd ed., vol. 1, p. 243. London: Griffin. Lamberg-Alldardt, C., Ojaniemi, R., Ahola, M. & Rasanen, L. (1984). The vitamin D intake of children and
adolescents in Finland. Human Nuirition: Applied Nutrition 38A, 377-382. Livingstone, M. B. E., Davies, P. S. W., Prentice, A. M., Coward, W. A., Black, A. E., Strain, J. J. & McKenna,
P. G. (1991). Comparison of simultaneous measures of energy intake and expenditure in children and adolescents. Proceedings of the Nuirition Society SO, 15A.
Livingstone, M. B. E., Prentice, A. M., Strain, J. J., Coward, W. A., Black, A. E., Barker, M. E., McKenna, P. G. & Whitehead, R. G. (1990). Accuracy of weighed dietary records in studies of diet and health. Briiish Medical Journal 300, 708-712.
61-15.
NUTRITIONAL INTAKE O F NORTHUMBRIAN CHILDREN 56 1 Marr, J. W. (1971). Individual dietary surveys: purposes and methods. World Review of Nutrition and Dietetics
Matkovic, V., Fontana, D., Tominac, C., Goel, P. & Chesnut, C. H. (1990). Factors that influence peak bone mass formation: a study of calcium balance and the inheritance of bone mass in adolescent females. American Journal of Clinical Nutrition 52, 878-888.
Ministry of Agriculture, Fisheries and Food (1988). Household Food Consumption and Expenditure 1988; Annual Reports of the National Food Survev Committee. London: H.M. Stationery Office.
Ministry of Agriculture, Fisheries and Food and the Department of Health (1990). The Dietary and Nutritional Survey of British Adults. London: H.M. Stationery Office.
National Advisory Committee on Nutrition Education (1983). A Discussion Paper on Proposals for Nutritional Guidelines for Health Education in Britain. London: Health Education Council.
Nelson, M., Naismith, D. J., Burley, V., Gatenby, S. & Geddes, N. (1990). Nutrient intakes, vitamin-mineral supplementation, and intelligence in British schoolchildren. British Journal of Nutrition 64, 13-22.
Paul, A. A. & Southgate, D. A. T. (1978). McCance and Widdowson’s ‘The Composition of Foods’, 4th ed. London: H.M. Stationery Office.
Prentice, A. M., Black, A. E., Coward, W. A,, Davies, H. L., Goldberg, G. R., Murgatroyd, P. R., Ashford, J., Sawyer, M. & Whitehead, R. G. (1986). High levels of energy expenditure in obese women. British Medical Journal 292, 983-987.
Registrar General (1970). Classification of Occupations 1970. Ofice of Populations Censuses and Surveys. London: H.M. Stationery Office.
Registrar General (1980). CIassiJication ofoccupations 1980. Office of Populations Censuses and Surveys. London : H.M. Stationery Office.
Schofield, W. N., Schofield, C. & James, W. P. T. (1985). Predicting basal metabolic rate, new standards and a review of previous work. Human Nutrition: Clinical Nutrition 39C, 5 4 1 .
SPSSx. (1986). SPSSx User’s Guide, 2nd ed. Chicago. Tan, S. P., Wenlock, R. W. & Buss, D. H. (1985). Immigrant Foods. Second Supplement to McCance and
Truswell, A. S. & Darnton-Hill, I. (1981). Food habits of adolescents. Nutrition Reviews 39, 73-88. Wenlock, R. W., Sivell, L. M. & Agater, I. B. (1985). Dietary fibre fractions in cereal and cereal-containing
Whitehead, R. G., Paul, A. A. &Cole, T. J. (1982). Trends in food energy intakes throughout childhood from one
Widdowson, E. M. (1947). A Study of Individual Children’s Diets. Medical Research Council, Special Report Series
13, 105-163.
Widdowxm’s ‘ The Composition of Foods’. London: H.M. Stationery Office.
products in Britain. Journal of the Science of Food and Agriculture 36, 113-121.
to 18 years. Human Nutrition: Applied Nutrition 36, 57-62.
no. 257, pp. 64-81. London: H.M. Stationery Office.
APPENDIX
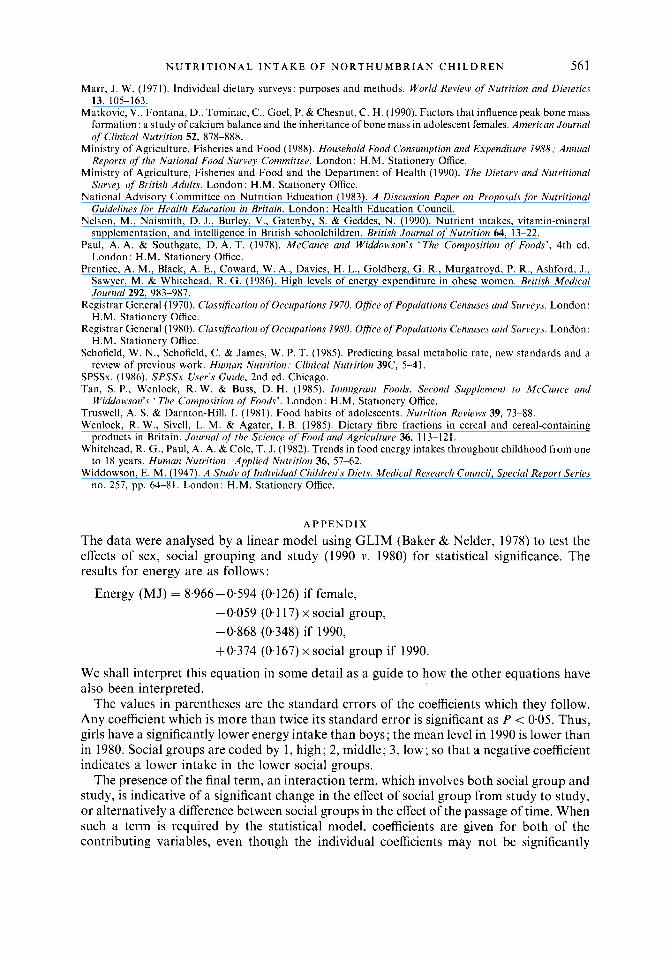
The data were analysed by a linear model using GLIM (Baker & Nelder, 1978) to test the effects of sex, social grouping and study (1990 v. 1980) for statistical significance. The results for energy are as follows:
Energy (MJ) = 8.966-0.594 (0.126) if female, - 0.059 (0.1 17) x social group, -0.868 (0.348) if 1990, +0.374 (0.167) x social group if 1990.
We shall interpret this equation in some detail as a guide to how the other equations have also been interpreted.
The values in parentheses are the standard errors of the coefficients which they follow. Any coefficient which is more than twice its standard error is significant as P < 0.05. Thus, girls have a significantly lower energy intake than boys; the mean level in 1990 is lower than in 1980. Social groups are coded by 1, high; 2, middle; 3, low; so that a negative coefficient indicates a lower intake in the lower social groups.
The presence of the final term, an interaction term, which involves both social group and study, is indicative of a significant change in the effect of social group from study to study, or alternatively a difference between social groups in the effect of the passage of time. When such a term is required by the statistical model, coefficients are given for both of the contributing variables, even though the individual coefficients may not be significantly
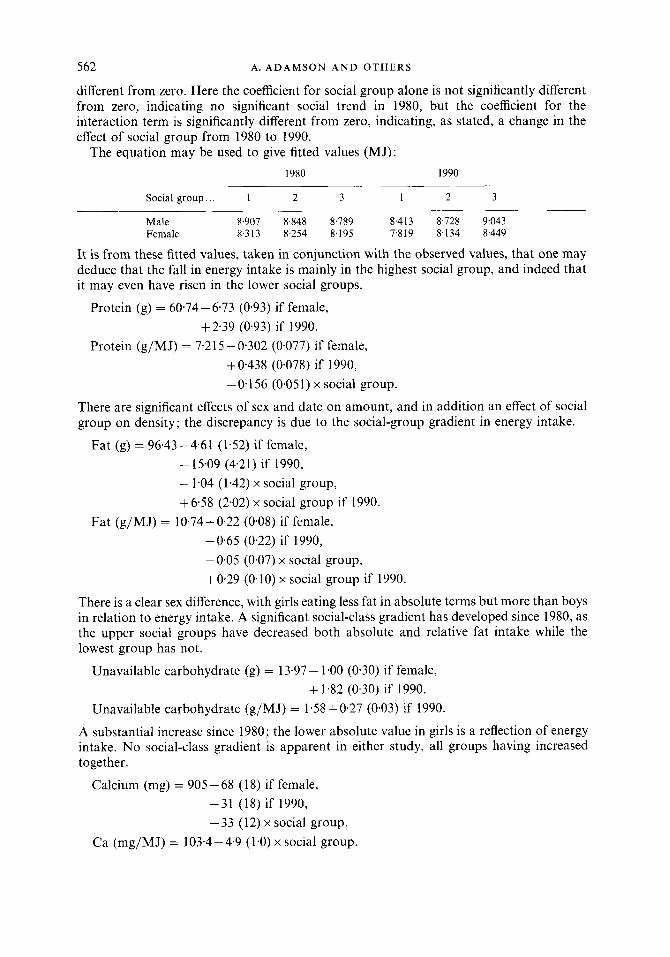
562 A. ADAMSON A N D OTHERS
different from zero. Here the coefficient for social group alone is not significantly different from zero, indicating no significant social trend in 1980, but the coefficient for the interaction term is significantly different from zero, indicating, as stated, a change in the effect of social group from 1980 to 1990.
The equation may be used to give fitted values (MJ): 1980 1990
Social group.. . 1 2 3 1 2 3
Male 8.907 8.848 8.789 8.413 8.728 9043 Female 8.313 8,254 8.195 7.819 8,134 8,449
It is from these fitted values, taken in conjunction with the observed values, that one may deduce that the fall in energy intake is mainly in the highest social group, and indeed that it may even have risen in the lower social groups.
Protein (g) = 60.74 - 6.73 (0.93) if female,
Protein (g/MJ) = 7-215-0.302 (0.077) if female, +2.39 (0.93) if 1990.
+0.438 (0.078) if 1990, -0.156 (0.051) x social group.
There are significant effects of sex and date on amount, and in addition an effect of social group on density; the discrepancy is due to the social-group gradient in energy intake.
Fat (g) = 96.43 -4.61 (1.52) if female, - 15-09 (4.21) if 1990, - 1-04 (1.42) x social group, + 6.58 (2.02) x social group if 1990.
Fat (g/MJ) = 10.74+0.22 (0.08) if female, -0.65 (0.22) if 1990, - 0.05 (0.07) x social group, +0.29 (0.10) x social group if 1990.
There is a clear sex difference, with girls eating less fat in absolute terms but more than boys in relation to energy intake. A significant social-class gradient has developed since 1980, as the upper social groups have decreased both absolute and relative fat intake while the lowest group has not.
Unavailable carbohydrate (8) = 13.97- 1.00 (0.30) if female,
Unavailable carbohydrate (g/MJ) = 1.58 + 0.27 (0.03) if 1990. + 1.82 (0.30) if 1990.
A substantial increase since 1980; the lower absolute value in girls is a reflection of energy intake. No social-class gradient is apparent in either study, all groups having increased together.
Calcium (mg) = 905 - 68 (1 8) if female, -31 (18) if 1990, -33 (12) x social group.
Ca (mg/MJ) = 103.4-4.9 (1.0) x social group.
N U T R I T I O N A L I N T A K E O F N O R T H U M B R I A N C H I L D R E N 563
Although neither the mean difference between studies nor its interaction with sex is significant, it is possible that there is now less of a sex difference than there was in 1980, with the boys reducing their intake more than the girls in absolute terms. If this is so, it is probably only a reflection of different energy intakes. The social-class gradient, showing a less nutrient-dense diet in the lower groups, remains clear.
Iron (mg) = 10.06-086 (0.22) if female,
Fe (mg/MJ) = 1.20+0.26 (0.03) if 1990, + 1.86 (0.22) if 1990.
- 0.03 (0.01 7) x social group.
The sex effect apparent in the absolute intake is taken care of by differential energy intake, but the rise between 1980 and 1990 is just as clear after correcting for energy. What evidence there is for a social-class gradient is small, though it is in the direction to be expected from the evidence of other nutrients.
Vitamin C (mg) = 46.64+ 16.35 (2.07) if 1990, -4.22 (1.35) x social group.
Vitamin C (mg/MJ) = 5.36+0.64 (0.26) if female, + 2.25 (0.26) if 1990, -0.57 (0.17) x social group.
Although the absolute amount is not significantly different between the sexes, the boys have a lower density of vitamin C than the girls. There has been a very big increase in both sexes and a11 social classes since 1980, but a social class gradient still exists.
Retinol equivalents (pg) = 659. Retinol equivalents (Lcg/MJ) = 72.2+ 13.9 (5.6) if 1990.
The density appears to have increased, although there is no evidence of a change in absolute amount. However, because of the distribution of this variable all results (positive and negative) must be treated with suspicion.
R E F E R E N C E Baker, R. J. & Nelder, J. A. (1978). The GLIM Svstem (Release 3 ) Manual. Oxford: Numerical Algorithms Group
for the Royal Statistical Society.
Printed in Great Britain
Related Documents