Public Health Nutrition: page 1 of 12 doi:10.1017/S1368980013001158 Review Article Nutritional contribution of street foods to the diet of people in developing countries: a systematic review Nelia Patricia Steyn 1, *, Zandile Mchiza 2 , Jillian Hill 2 , Yul Derek Davids 3 , Irma Venter 4 , Enid Hinrichsen 4 , Maretha Opperman 5 , Julien Rumbelow 6 and Peter Jacobs 7 1 Centre for the Study of Social and Environmental Determinants of Nutrition, Population Health, Health Systems and Innovation, Human Sciences Research Council, PO Bag X9182, Cape Town 8000, South Africa: 2 Chronic Diseases of Lifestyle Unit, Medical Research Council, Cape Town, South Africa: 3 Democracy, Governance and Service Delivery, Human Sciences Research Council, Cape Town, South Africa: 4 Department of Agricultural and Food Sciences, Faculty of Applied Sciences, Cape Peninsula University of Technology, Cape Town, South Africa: 5 Functional Foods Research Unit, Cape Peninsula University of Technology, Bellville, South Africa: 6 Centre for Science, Technology and Innovation Indicators (CeSTII), Human Sciences Research Council, Cape Town, South Africa: 7 Economic Performance and Development, Human Sciences Research Council, Cape Town, South Africa Submitted 31 July 2012: Final revision received 28 February 2013: Accepted 28 February 2013 Abstract Objective: To review studies examining the nutritional value of street foods and their contribution to the diet of consumers in developing countries. Design: The electronic databases PubMed/MEDLINE, Web of Science, Cochrane Library, Proquest Health and Science Direct were searched for articles on street foods in developing countries that included findings on nutritional value. Results: From a total of 639 articles, twenty-three studies were retained since they met the inclusion criteria. In summary, daily energy intake from street foods in adults ranged from 13 % to 50 % of energy and in children from 13 % to 40 % of energy. Although the amounts differed from place to place, even at the lowest values of the percentage of energy intake range, energy from street foods made a significant contribution to the diet. Furthermore, the majority of studies suggest that street foods contributed significantly to the daily intake of protein, often at 50 % of the RDA. The data on fat and carbohydrate intakes are of some concern because of the assumed high contribution of street foods to the total intakes of fat, trans-fat, salt and sugar in numerous studies and their possible role in the development of obesity and non-communicable diseases. Few studies have provided data on the intake of micronutrients, but these tended to be high for Fe and vitamin A while low for Ca and thiamin. Conclusions: Street foods make a significant contribution to energy and protein intakes of people in developing countries and their use should be encouraged if they are healthy traditional foods. Keywords Street foods Developing countries Dietary intake Nutritional value Traditional foods ‘The potential of street foods for improving the food security and nutritional status of urban populations remains almost totally unexplored.’ (Draper, 1996) (1) Globalization is affecting food systems around the world by means of urbanization, increasing incomes, foreign investment and market liberalization (2) . Due to rapid urbanization taking place in many developing countries, street foods have become increasingly important as an income-generating strategy and as a fast and economical meal option. Since entry into the field is largely unregu- lated and does not cost much upfront investment, it has become an increasingly popular way for families, and specifically women, to earn a living (2) . Street foods have been defined as: ‘ready-to-eat foods and beverages prepared and/or sold by vendors and hawkers especially in streets and other similar places’ (3) . This includes foods sold within and around schools which are not from school canteens or restaurants. Mwangani et al. define street foods as: ‘ready-to-eat foods and beverages, processed or fresh, which are sold at stationary locations or by mobile vendors in streets and open places as opposed to stores and licensed establishments’ (4) . To differentiate street food vendors from formal sector food establishments, such Public Health Nutrition *Corresponding author: Email [email protected] r The Authors 2013

Welcome message from author
This document is posted to help you gain knowledge. Please leave a comment to let me know what you think about it! Share it to your friends and learn new things together.
Transcript
Public Health Nutrition: page 1 of 12 doi:10.1017/S1368980013001158
Review Article
Nutritional contribution of street foods to the diet of people indeveloping countries: a systematic review
Nelia Patricia Steyn1,*, Zandile Mchiza2, Jillian Hill2, Yul Derek Davids3, Irma Venter4,Enid Hinrichsen4, Maretha Opperman5, Julien Rumbelow6 and Peter Jacobs7
1Centre for the Study of Social and Environmental Determinants of Nutrition, Population Health, Health Systems andInnovation, Human Sciences Research Council, PO Bag X9182, Cape Town 8000, South Africa: 2Chronic Diseasesof Lifestyle Unit, Medical Research Council, Cape Town, South Africa: 3Democracy, Governance and ServiceDelivery, Human Sciences Research Council, Cape Town, South Africa: 4Department of Agricultural and FoodSciences, Faculty of Applied Sciences, Cape Peninsula University of Technology, Cape Town, South Africa:5Functional Foods Research Unit, Cape Peninsula University of Technology, Bellville, South Africa: 6Centre forScience, Technology and Innovation Indicators (CeSTII), Human Sciences Research Council, Cape Town, SouthAfrica: 7Economic Performance and Development, Human Sciences Research Council, Cape Town, South Africa
Submitted 31 July 2012: Final revision received 28 February 2013: Accepted 28 February 2013
Abstract
Objective: To review studies examining the nutritional value of street foods andtheir contribution to the diet of consumers in developing countries.Design: The electronic databases PubMed/MEDLINE, Web of Science, CochraneLibrary, Proquest Health and Science Direct were searched for articles on streetfoods in developing countries that included findings on nutritional value.Results: From a total of 639 articles, twenty-three studies were retained since theymet the inclusion criteria. In summary, daily energy intake from street foods inadults ranged from 13 % to 50 % of energy and in children from 13 % to 40 % ofenergy. Although the amounts differed from place to place, even at the lowestvalues of the percentage of energy intake range, energy from street foods made asignificant contribution to the diet. Furthermore, the majority of studies suggestthat street foods contributed significantly to the daily intake of protein, often at50 % of the RDA. The data on fat and carbohydrate intakes are of some concernbecause of the assumed high contribution of street foods to the total intakes offat, trans-fat, salt and sugar in numerous studies and their possible role in thedevelopment of obesity and non-communicable diseases. Few studies haveprovided data on the intake of micronutrients, but these tended to be high for Feand vitamin A while low for Ca and thiamin.Conclusions: Street foods make a significant contribution to energy and proteinintakes of people in developing countries and their use should be encouraged ifthey are healthy traditional foods.
KeywordsStreet foods
Developing countriesDietary intake
Nutritional valueTraditional foods
‘The potential of street foods for improving the food
security and nutritional status of urban populations
remains almost totally unexplored.’ (Draper, 1996)(1)
Globalization is affecting food systems around the world
by means of urbanization, increasing incomes, foreign
investment and market liberalization(2). Due to rapid
urbanization taking place in many developing countries,
street foods have become increasingly important as an
income-generating strategy and as a fast and economical
meal option. Since entry into the field is largely unregu-
lated and does not cost much upfront investment, it has
become an increasingly popular way for families, and
specifically women, to earn a living(2).
Street foods have been defined as: ‘ready-to-eat foods
and beverages prepared and/or sold by vendors and
hawkers especially in streets and other similar places’(3).
This includes foods sold within and around schools which
are not from school canteens or restaurants. Mwangani et al.
define street foods as: ‘ready-to-eat foods and beverages,
processed or fresh, which are sold at stationary locations or
by mobile vendors in streets and open places as opposed to
stores and licensed establishments’(4). To differentiate street
food vendors from formal sector food establishments, such
Public
Hea
lth
Nutr
itio
n
*Corresponding author: Email [email protected] r The Authors 2013
as restaurants, a further qualification is added that street
foods are sold on the street from ‘pushcarts or baskets or
balance poles or from stalls or shops having fewer than four
permanent walls’(5). In the present study we also included
kiosks which did not include permanent walls.
Chakravarty and Canet(6) classified street food vending
into three general groups. These include: (i) an operation
where the vendor prepares food at home and brings it to
the food stall to sell; (ii) foods prepared and sold at the food
stall; and (iii) foods prepared in a cottage type of factory and
brought to the stall for sale. Foods processed and packaged
by industrial factories provide a further and usually more
recently vended group of street foods (e.g. packets of crisps,
candy, biscuits and soft drinks). Selling generally takes place
at a fixed location. However, many vendors move around
with their equipment and wares, frequenting places where
consumers are concentrated such as bus terminals, stations
and garages(6). Outdoor foods sold by vendors are either
eaten on the spot or taken home.
Despite the fact that street foods have been sold for
numerous decades and provide a source of income to many
families, there is a dearth of data regarding the contribution
of street foods to the nutritional value of the diet. It is
essential for policy makers and nutrition educators to have a
good understanding of the type and nutritional value of
street foods since their consumption in many countries has
become entrenched in habitual eating patterns and may
influence the development of non-communicable diseases
and other nutrition-related conditions in the population. This
is especially important in terms of the increase in the pre-
valence of obesity in many developing countries, particularly
the increase in children and adolescents(7,8). The objective
of the present review was hence to obtain street food
surveys in the peer-reviewed literature that have docu-
mented the contribution of street foods to dietary intake and
to determine the significance of street foods in the diet.
Methods
The review was undertaken to obtain and examine studies
on street foods in developing countries that included data
on the nutritional value of street foods.
Types of studies
To be eligible for inclusion in the review, studies had to:
1. describe the nutritional contribution of street foods
to the diet in terms of (i) nutritional value of foods or
(ii) types of food groups consumed;
2. study foods sold by vendors in developing countries
(as defined by the World Bank)(9); and
3. be published in peer-reviewed journals up to and
including March 2012.
Information on the types of food items sold, freque-
ncy of street food consumption and association with
socio-economic status (SES) is presented when available
in the articles eligible for inclusion.
Studies were excluded when they:
1. were not in the peer-reviewed literature (e.g. reports
and workshop proceedings);
2. focused on street foods consumed in developed
countries;
3. focused on foods consumed in traditional venues such
as restaurants and canteens;
4. included food items purchased from licensed fast-food
outlets; and
5. included foods consumed by institutionalized adults.
Outcome measures
The purpose of the review was to elicit data on street
foods and their contribution to the nutritional value of the
diet. Nutritional data included any of the following:
energy intake; percentage contribution to daily energy
intake (%EI); macronutrient intake; micronutrient intake;
dietary diversity; and food groups.
Types of participants
Studies that had a general population approach were
included in the review.
Search strategy
The research team searched the electronic databases
PubMed/MEDLINE, Web of Science, Cochrane Library,
Proquest Health and Science Direct. The search term used
in all databases was ‘street food’. This broad term ‘street
food’ [All Fields] was used in an attempt to cover all
articles on street foods due to the scarcity of peer-
reviewed literature in this field. Manual searching of
abstracts was then done to find those which included data
on nutritional value of street foods.
Identification of relevant studies
Three reviewers (N.P.S., J.H. and Z.M.) independently
assessed the retrieved titles (step 1) and abstracts of
selected titles (step 2) by assessing the relevant articles for
inclusion against the criteria described earlier. Full-text
articles were obtained of those studies that were eligible for
inclusion in the review based on the abstract. Data from
studies that met the inclusion criteria and did not meet any
exclusion criteria after reading the full article were extracted
by one reviewer (N.P.S.) into structured summary tables
(step 3) and checked by two reviewers (Z.M. and J.H.;
step 4). Studies that were published as separate papers
were included as being one study when the sample size,
authors and geographic areas were the same.
Data synthesis
Each study was summarized and described with regard
to: (i) the nutritional contribution of street foods to the
Public
Hea
lth
Nutr
itio
n2 NP Steyn et al.
diet in terms of %EI and/or percentage of the RDA
of macro- or micronutrients provided; (ii) the types of
food groups supplied by street foods; (iii) the frequency
of street food consumption; (iv) the type of street foods
consumed; and (iv) data on SES associated with street
food intake. These data are presented in Tables 1–3.
Results and discussion
The search of peer-reviewed literature was undertaken in
January–March 2012 according to the process described
in Fig. 1. After removing studies which did not meet
the inclusion criteria and duplicates, we were left with
twenty-three studies. These were classified into nineteen
studies from sub-Saharan Africa and four from other
developing countries. All studies found were descriptive
cross-sectional studies.
Nutritional contribution of street foods
The majority of studies demonstrated that street foods
contributed significantly to the diet of children and adults
in developing countries, both in terms of energy, protein
and micronutrient intakes and in terms of food groups
consumed (Table 1)(3,4,6,10–29).
Energy and nutrient intakes
In terms of nutrient contributions from street foods,
the highest contributions of street foods to daily energy
intakes in adults were found in Abeokuta in Nigeria
(50?3 %EI in males; 48?3 %EI in females)(13), Ougadougou
in Burkino Faso (46 %EI)(26), Nairobi in Kenya (27–36%EI
in males; 13–22%EI in females)(22), Uganda (22?4–25?6 %
EI)(29) and Bamako in Mali (18?3 %EI)(15–17). In children,
numerous studies including those in Cotonou in
Benin (40 %EI)(3), Nairobi in Kenya (13?4–22?4 %EI)(22),
Port-au-Prince in Haiti (25 %EI)(10), Bamako in Mali
(18?3 %EI)(15–17), Hyderabad in India (19 %E)(11) and rural
areas of Kenya (13?5–20?8 %EI in males; 12?8–17?3 %EI in
females)(25) have demonstrated the contribution of street
foods to daily energy intake. Moreover, it is important to
realize that the energy supplied by street foods usually
serves as a replacement for home meals(30). Furthermore,
it needs to be recognized that should the energy from
street foods be added to that from regular meals taken at
home there may be an increase in energy intake which in
the long run will impact detrimentally on weight status.
In terms of protein intake there are fewer data available.
In Haiti, street foods contributed 16% of the protein RDA
in secondary-school children(10). In Nigerian adolescents,
average daily protein intake (62 g) from street foods
provided more than 50% of the RDA(12). In Nigerian adults,
street foods contributed 53?2% of males’ and 50?7% of
females’ total daily protein intake(13). Similarly, in Nairobi,
meals sold to workers provided more than 50% of the RDA
for protein(14). A study in Mali found that street foods
provided 41%, 19% and 9% of daily protein intake in
persons of high, middle and low SES, respectively(16); while
a study in Uganda found that street foods contributed
38?6–44?9% to daily total protein intake(29). In Calcutta
a typical street meal comprised 20–30g of protein as
measured by proximate analyses(6). Overall, the majority of
studies suggest that street foods contribute significantly
to the daily intake of protein, often as much as 50% of
the RDA.
Fewer data are available on fat and carbohydrates. In
Cotonou, more than 40 % of fat and carbohydrates came
from street foods(3). Daily fat intake from street foods was
higher in the affluent group, 20–30 %, compared with
15 % in the low-SES group(3). In Nigerian adults street
foods provided 37?9 % and 54?0 % of total daily intake
of fat and carbohydrates, respectively(13). In Nigerian
adolescents street foods provided 70?8 % and 24?8 % of
total daily fat and carbohydrate intakes(12). In Burkina
Faso, a study reported on the adequacy of women’s diet.
Findings were that ready-to-eat foods bought outside the
home provided 52 % of daily fat intake and 72 % of sugar
intake(26). In adults in Uganda, street foods accounted for
70?1–93?4 % of daily energy intake and fat contributed
21?9–26?3 %EI(29). In Calcutta, an average street food meal
of 500 g comprised 12–15 g of fat(6). The data on fat and
carbohydrate intakes are of some concern in terms of the
high contribution of street foods to the total intakes of fat
and sugar and their role in the development of obesity
and non-communicable diseases.
A few studies have provided limited data on the intakes
of micronutrients. Among adults in Abeokuta, street foods
contributed 35?2 % of Fe intake, 46?2 % of Ca, 55?3 % of
vitamin A, 57?3 % of vitamin C and 47?5 % of thiamine
intake (total daily intakes)(13). In adolescents, street foods
contributed 64 % of calcium intake, 50 % of Fe, 60 % of
vitamin A, 5?5 % of thiamin and 5?5 % of vitamin C intake
(total daily intakes)(12). However, a study in Bamako
found that Ca (2?7–8?7 %) from street foods made only a
small contribution while vitamin A from street foods
made a large contribution (70–278 %)(15–17). Few studies
on street foods have actually analysed their nutrient
content by proximate chemical analyses. Similarly, there
is a dearth of information on the micronutrient content of
street foods.
Despite not having nutrient intake data for saturated
fat, trans-fat, sugar (mentioned by a few studies) and salt,
there are sufficient data on the types of food and their
preparation to realize that these nutrients are found in
many popular items purchased from street vendors. Street
foods such as candy, chocolates, soft drinks, sweetened
tea, cookies and pastries, fried fish and meat, fried bread
dough and doughnuts, and crisps are items having one or
more of the following: high sugar, high saturated fat, high
trans-fat and/or high salt (Table 2). Yet, it should be
acknowledged that healthy food items are also sold by
many vendors; the most common ones being fruit,
Public
Hea
lth
Nutr
itio
nStreet foods in developing countries 3

Public Health Nutrition
Table 1 Studies which met the inclusion criteria for the review
Reference Place No. of participants Age (years) Gender Methods
Webb and Hyatt (1988)(10) Port-au-Prince, Haiti 174 from 15 secondaryschools
Secondary-schoolchildren
M, F FFQ
Chakravarty and Canet (1996)(6) Calcutta, West Bengal 911 19–48 M, F InterviewsSujatha et al. (1997)(11) Hyderabad, India 51 households 23–52 M 3 3 24 h recallsOguntona and Kanye (1995)(12) Abeokuta, Nigeria 142 at 12 schools Adolescents M, F 3 3 24 h recalls & weighed food
intake on sub-sample over 3 dOguntona et al. (1998)(13) Abeokuta, Nigeria 116 18–30 M, F 4 3 24 h recallsKorir et al. (1998)(14) Nairobi, Kenya 12 vending sites Adults N/A Analyses of meal samples from
vendorsAg Bendech et al. (1998, 1999,
2000)(15–17)Bamako, Mali 74 households &
367 personsAll ages M, F 24 h recall; qualitative interviews
Levin et al. (1999)(18) Accra, Ghana 559 households & 2835 persons All ages M, F QuestionnaireOguntona and Tella (1999)(19) Abeokuta and Odeda, Nigeria 197 market women Adults F 3 3 24 h recalls & structured
questionnaireMwangi et al. (2001, 2002)(4,20) Korogocho (slum), Dandora
(low–middle income) andindustrial area; Nairobi, Kenya
580 vendors in3 locations
Adults M, F Questionnaire & focus groups
Van ‘t Riet et al. (2001)(21) Korogocho (slum) and Dandora(low–middle income); Nairobi Kenya
1011 households;sub-sample 73
All ages M, F Structured questionnaires
Van ‘t Riet et al. (2002)(22) Korogocho (slum) & Dandora(low–middle income); Nairobi, Kenya
641 Adults; children9–14
M, F 3 3 24 h recalls
Van ‘t Riet et al. (2003)(23) Korogocho (slum) & Dandora(middle income); Nairobi, Kenya
495 Adults M, F 3 3 24 h recalls
Badrie et al. (2005)(24) Trinidad, West Indies 200 consumers & 6 sites selling‘doubles’
Adults M, F Nutrient analyses of ‘doubles’ &questionnaire completed byconsumers
Gewa et al. (2007)(25) Rural areas, Kenya 150 Schoolchildren M, F 2 3 24 h recalls in 2 seasonsNago et al. (2010)(3) Cotonou, Benin 656 at 12 secondary schools 13–19 M, F 2 3 24 h recallsBecquey and Martin-Prevel (2010)(26) Ougadougou, Burkina Faso 182 19–69 F 3 3 24 h recallsSteyn and Labadarios (2011)(27);
Steyn et al. (2011)(28)South Africa (national study) 3827 .16 M, F 1 3 24 h recall
Namugumya and Muyanja (2012)(29) Kampala, Jinja & Masaka; Uganda 225 street vendors 21–59 M, F 24 h recall & FFQ
M, males; F, females; N/A, not applicable.
4N
PSte
yn
eta
l.

Public Health Nutrition
Table 2 Nutritional value of street foods, frequency of consumption and types of foods consumed
Reference Nutritional value of SF Type of food groups consumed Frequency of consumption Types of food items consumed
Webb and Hyatt(1988)(10)
Mean energy intake 1928 kJ/d (401 kcal/d) andprotein intake 5?8 g/d per person from SF;25 % of energy and 16 % of protein RDA wereprovided by SF intake
Cereal food group accounted for28?0 % of SF products; followedby fruit group at 18?5 % ofproducts; sugars and syrups at16?4 % of products
Not given 146 different food items of which 35 % werecommercially produced; items included breads,fruits, home-made sweets, cooked foods,sugarcane, frozen ices, desserts, fried chips,beverages, commercial cookies, candies, bakeditems, peanuts
Chakravarty and Canet(1996)(6)
An average 500 g SF meal contained 20–30 g ofprotein, 12–15 g of fat and 174–183 g ofcarbohydrate and had an energy value of4184 kJ (1000 kcal)
Not given About 33 % of consumerspurchased SF on a daily basiswhile 23 % patronized the stalls1–4 times/week. In areas whereoffice workers operated, SF waseaten about 5 times/week
Lassi (flavoured buttermilk); idi (rice and black gramflour dumplings); dosa (fermented rice & black gramflour pancake); vegetable curry; alu kabli (boiledpotato with sour preparation)
Sujatha et al. (1997)(11) Mean intake of foods eaten outside the homewas 1975 (SD 238) kJ/d (472 (SD 57) kcal/d),corresponding to 19 %EI
Not given Not given These included beverages, sweetened tea, toddies(liquor), snacks (gram flour fried), meals (rice andpulses)
Oguntona and Kanye(1995)(12)
Mean energy intake was 10?85 MJ of which 25 %came from SF (29?4 % in males, 22?0 % infemales). Over 50 % of total protein intake and50 % of vitamins and minerals came from SF;64 % of Ca came from SF
40–70 % of all food groups camefrom SF. The highest intake wascereals (mean 408 g/d); 50 % ofmeat & fish group and 60 % oflegumes were from SF. Highestproportion of dairy group camefrom SF
Not given Meat and fish fried with sauces on rice. Major legumeswere cowpeas, bean cakes and roasted groundnuts.Fruit, yoghurt and chocolate milk-based drinks werealso popular as snacks
Oguntona et al.(1998)(13)
SF contributed 50?3 % to males’ and 48?3 % tofemales’ energy intake. Intakes ofmicronutrients were generally ,RDA exceptfor Ca and vitamin A. Females hadsignificantly higher Fe, thiamin and vitamin Aintakes than males. Overall contribution of SFranged from 23 % for Fe (males) to 80 % forvitamin A (males)
42–66 % of all major food groupscame from SF with cerealsbeing highest (261 g/d 5 66 %)followed by roots & tubers(157 g/d 5 51 %). Dairy foodcontributed 55 % and legumes63 % of foods sold
Not given Popcorn, roasted corn, bread, rice and doughnuts.Nearly 49 % of meat & fish came from SF in form offried or stewed meat/fish served with vegetablestews or boiled rice, eba or fufu (fermentedcassava) or amala (yam flour cooked to a paste).Legumes included akara (bean cake), moin-moin(bean pudding) and groundnuts. Also seasonal fruitsand juices
Korir et al. (1998)(14) Meals provided diverse energy content rangingfrom 16?8 to 36?7% of RDA for age 18–30 yearsand from 17?8 to 38?3 % of RDA for 30–60years. Except for chapatti and stewedvegetables, all meals provided more than 50 %of RDA for protein. Githeri-based meals had thehighest mean energy per meal. The lowestenergy per meal was for chapatti and stewedvegetables. Githeri and matumbo provided themost protein per meal
Not given Not given Githeri (maize & beans), chapatti (flat unleavened friedbread), uji (porridge from cereal flours such as fingermillet and sorghum), kienyeji (maize & beans withpotatoes, bananas and green leafy vegetables,stewed vegetables), bean stew (boiled kidneybeans), mandazi (fried bread dough), ugali (stiffmaize porridge), matumbo (fried intestines), rice,potato/beef stew, green gram stew
Ag Bendech et al.(1998, 1999,2000)(15–17)
SF provided 18?3 % of energy intake, 4?9 % ofprotein intake. Only a small contribution wasmade to Ca (2?7–8?7 %) but a largecontribution to vitamin A (70–278 %).SF provided 561–1745 kJ/d (134–417 kcal/d)per person
Not given Almost all persons had SF on adaily basis; 95?4 % of children,7 years, 91?6 % of 7–15 yearolds and 73?3 % of adults ate SFat least once daily
Single dish with a base ingredient with a sauce at eachmeal (sauces provide heterogeneity of meals); freshfruit in season such as mangoes; beverages; icecream; groundnuts; cooked meals
Streetfo
ods
indevelo
pin
gco
untrie
s5

Public Health Nutrition
Table 2 Continued
Reference Nutritional value of SF Type of food groups consumed Frequency of consumption Types of food items consumed
Levin et al. (1999)(18) Mean energy available per adult equivalent was11 046 kJ/d (2640 kcal/d). Energy in female-headed households was almost 10 % higherthan in male-headed households (included SFconsumption)
Not given Not given Maize, cassava, yams, plantains, rice, wheat,tomatoes, fish; 80 % of SF consumed in the form ofstaples
Oguntona and Tella(1999)(19)
Contribution of SF was 59 %EI. SF contributed58–59 % to protein intake. Ca supplied by SFwas 79–81 %. SF contribution to Fe intakewas 57 %. Contribution of SF to vitaminintakes were above 50 % of RDA except forthiamin in the younger group (,49 years) andvitamin A in the older group (.49 years)
Legume-based foods were popularand was the highest food groupconsumed daily (520 g/d),followed by roots & tubers(450 g/d), then cereals (380 g/d)
63 % of daily food intake was fromSF
Legumes: cowpeas, fried bean cake (akara), steamedcowpea paste (moin-moin), roasted groundnuts.Tubers: cassava, yams, coc-yams. Cereals: rice,maize, wheat. Wheat consumed as bead, pies,doughnuts and biscuits. Fruit in season – bananas,guavas, citrus, pawpaw. Vegetables, mainly okraand green leafy ones. Chicken, meat mainly offal,fish and milk drinks
Mwangi et al. (2001,2002)(4,20)
Difficult to determine the nutritive contribution ofSF. However a large variety of cooked foodsand snack foods appeared to be available, soit is likely that SF makes a significantcontribution to the energy intake of manyadults and children. Findings were that fillingmeals were mostly associated with the low-income area, which is also indicative of betternutritional value where needed most
Just over half (53 %) of vendorssold food from only one group;44 % sold cereals; 36 % (mostlymen) sold only carbohydrateproducts. More vendors soldfoods from different groups inthe working area (53 %) than inthe slum area (43 %).Micronutrient-rich products weresold mainly by women
Not given Working areas: githeri, uji, chapatti, meat & vegetablestews, vegetables, fruits, peanuts, boiled maize,pastries, cookies, tea, bread, mandazi, ugali, sodas,cakes, sugar cane
Schools: sweet snacks & goodiesResidential area: upper middle, fried fish and roasted
maizeLower middle: fried fish, pastries, chapatti, cooked
maize, fried & roasted meat, soupLow-income area: githeri, kienyeji (maize, beans,
potatoes, vegetables) chips, ugali (stiff maize meal)also as for lower–middle income group
Van ‘t Riet et al.(2001)(21)
Energy from SF ranged from 13 %EI forschoolchildren in Korogocho to 36 %EI formen in Dandora
Not given SF consumption 3?6 d/week inKorogocho and 2 d/week inDandora. 78 % of households inKorogocho and 53 % in Dandoraconsumed SF at least onceweekly. SF consumed by allages and both sexes (exceptinfants ,1 year). In both areaslarge households (.8 members)consumed SF more frequentlythan small ones (,3)
Mandazi (deep fried dough) most commonly eatenfor breakfast; maize- or flour-based products;githeri (maize with beans)
Van ‘t Riet et al.(2002)(22)
Daily energy contribution from SF in men was27?1 %EI in Korogocho and 36?2 %EI inDandora. In women it was 15?4 %EI and20?1 %EI in Korogocho and Dandora,respectively. In children it ranged from13?4 %EI to 22?4 %EI, respectively. InKorogocho, SF contributed 15?2 % to protein,27?1 % to fat, 14?6 % to vitamin A, 7?1 % to Feand 18?2 % to Ca intakes. Intakes in childrenwere similar. Higher intakes were found inmen for each nutrient
Not given In Korogocho, 71?2 % of men and73?2 % of women were regularconsumers of SF. In Dandora86?6 % of men and 76?7 % ofwomen consumed SF. Menconsumed more SF overweekends while women andchildren did not
Not given
6N
PSte
yn
eta
l.

Public Health Nutrition
Table 2 Continued
Reference Nutritional value of SF Type of food groups consumed Frequency of consumption Types of food items consumed
Van ‘t Riet et al.(2003)(23)
Men had a higher proportion of daily energy fromSF than did women (26 %EI v. 16 %EI,respectively). Contribution of SF to dailyenergy intake was higher in the slum areathan the low–middle income area
Not given Not given Not given
Badrie et al. (2005)(24) Based on a 8368 kJ/d (2000 kcal/d) diet, a‘double’ provided 17 % of fat, 12 % of Na, 12 %of carbohydrate, 20 % of dietary fibre and25 % of Fe intake
Not given 89?5 % of respondents ate‘doubles’ (usually two at a time);44 % because of cheap price,32 % due to convenience and24 % due to desirable taste
‘Double’ is a sandwich made of fried dough (baras)with a chickpea filling (channa)
Gewa et al. (2007)(25) Total energy intake from SF foods wassignificantly higher in boys (13?5–20?8 %EI)than girls (12?8–17?3 %EI). Intake of 987 and1540 kJ/d in dry and harvest seasons,respectively. SF contributed substantially tovitamin C (65 %) and vitamin A requirements(30–65 %)
Not given Children reported consuming amedian of 2 SF items daily,mostly single items
Fruit and starchy foods were most commonlyconsumed during both seasons. During shortageseason wild fruits and avocadoes were mostcommon, also sugarcane and hard candies. Duringharvest season ripe mangoes and corn-on-the-cobwere most common
Nago et al. (2010)(3) On average 40 % of energy, fat, protein,carbohydrate and fibre in the diet came fromSF. SF were mostly consumed at breakfastand as afternoon snacks. Consumers had alow intake of fruits and vegetables and a highfat intake
Cereals and cereal products werethe most consumed food group(734 g/d); followed by sweetfoods (304 g/d), other beverages(176 g/d), then roots & tubers(174 g/d), fruits & vegetables(97 g/d), eggs & dairy (60 g/d),meat (53 g/d), fish (44 g/d),legumes (42 g/d). SF accountedfor only 26 % of daily fruit &vegetable intake
Not given Cereal group: wheat bread, maize-based dough andporridges, rice & pasta. Sweet foods consisted ofenergy-dense foods such as sweet beverages,candies, chocolate and lollipops. Starchy roots &tubers comprised yam- or cassava-based dough,boiled or fried yam, cassava, potatoes, sweetpotatoes and bananas. Fruit included pineapples,apples and oranges, while green leafy vegetableswere consumed in sauces. Eggs, milk & milkproducts were also popular
Becquey and Martin-Prevel (2010)(26)
Ready-to-eat foods provided 46 % of energy,52 % of fat and 72 % of sugar intake.Micronutrients were inadequate for vitaminsB12, riboflavin, B6, thiamin, folate, Fe, Zn andCa. SF were not associated with micronutrientinadequacy. Mango and organ meatconsumption significantly reduced the risk ofmicronutrient deficiencies
Consumption of certain foodgroups was associated with alower mean probability of risk,namely organ meats, vitamin A-rich fruits & vegetables, legumes& nuts, and flesh foods
Not given To (paste made from cereal flour of maize, millet orother) with okra; rice with peanut sauce; soft drinks– mainly zoom-koom (pearl millet flour with sugar);peanuts; buns/cookies; bread; alcoholic beverages;fruit – mainly mangoes
Steyn and Labadarios(2011)(27); Steynet al. (2011)(28)
Since fruit was most commonly consumed as aSF one can speculate that it would contributeto micronutrient intakes of those in highcategory of consumers, namely Africans.Frequent purchasers of SF had a significantlylower dietary diversity score (4?69) comparedwith lower consumers (3?81)
Not given At national level 11?3% of adultsbought from street vendors atleast twice weekly. Africans werethe most common consumers with19% consuming SF at least twiceweekly while whites had thelowest (2?9%). The highestconsumption took place in urbanslums (19?4%) and in urbanformal areas (16?7%). The lowestconsumers were in rural areas(4?7 %). Frequent consumption ofan item was defined as eating it$ 2 times/week
Fruits, soft drinks, savoury snacks (e.g. potato crisps),biscuits, cooked food (e.g. maize porridge or ricewith or without meat)
Streetfo
ods
indevelo
pin
gco
untrie
s7
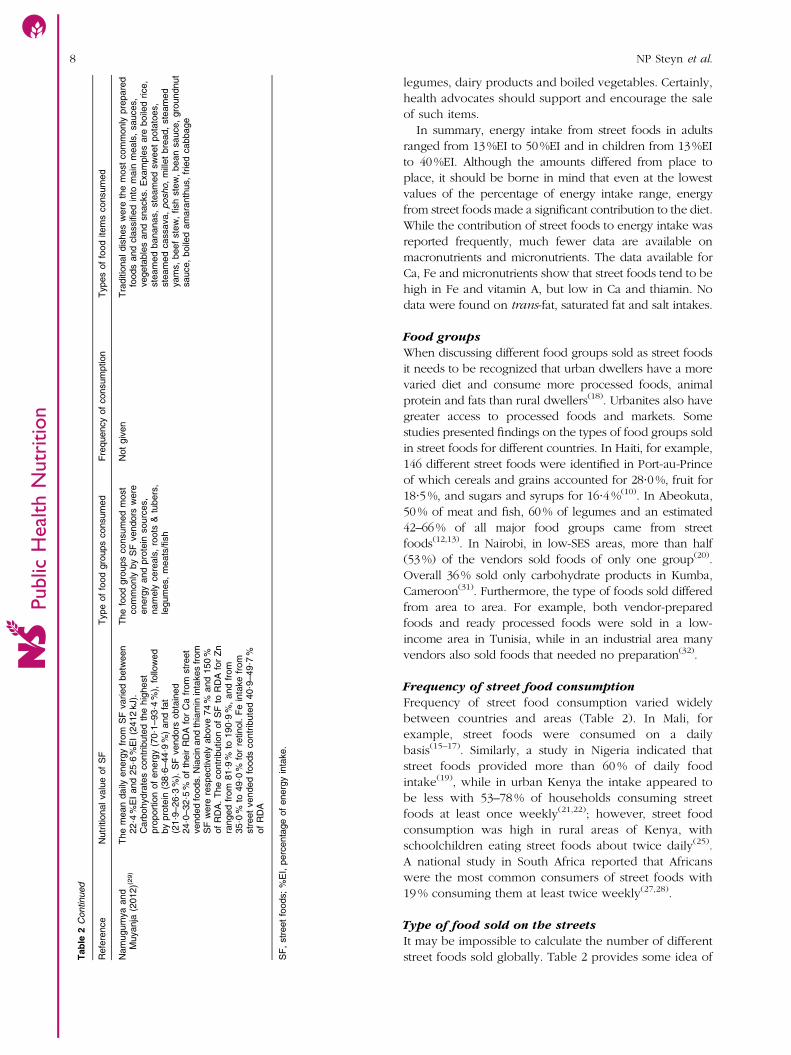
legumes, dairy products and boiled vegetables. Certainly,
health advocates should support and encourage the sale
of such items.
In summary, energy intake from street foods in adults
ranged from 13%EI to 50%EI and in children from 13%EI
to 40%EI. Although the amounts differed from place to
place, it should be borne in mind that even at the lowest
values of the percentage of energy intake range, energy
from street foods made a significant contribution to the diet.
While the contribution of street foods to energy intake was
reported frequently, much fewer data are available on
macronutrients and micronutrients. The data available for
Ca, Fe and micronutrients show that street foods tend to be
high in Fe and vitamin A, but low in Ca and thiamin. No
data were found on trans-fat, saturated fat and salt intakes.
Food groups
When discussing different food groups sold as street foods
it needs to be recognized that urban dwellers have a more
varied diet and consume more processed foods, animal
protein and fats than rural dwellers(18). Urbanites also have
greater access to processed foods and markets. Some
studies presented findings on the types of food groups sold
in street foods for different countries. In Haiti, for example,
146 different street foods were identified in Port-au-Prince
of which cereals and grains accounted for 28?0%, fruit for
18?5%, and sugars and syrups for 16?4%(10). In Abeokuta,
50% of meat and fish, 60% of legumes and an estimated
42–66% of all major food groups came from street
foods(12,13). In Nairobi, in low-SES areas, more than half
(53%) of the vendors sold foods of only one group(20).
Overall 36% sold only carbohydrate products in Kumba,
Cameroon(31). Furthermore, the type of foods sold differed
from area to area. For example, both vendor-prepared
foods and ready processed foods were sold in a low-
income area in Tunisia, while in an industrial area many
vendors also sold foods that needed no preparation(32).
Frequency of street food consumption
Frequency of street food consumption varied widely
between countries and areas (Table 2). In Mali, for
example, street foods were consumed on a daily
basis(15–17). Similarly, a study in Nigeria indicated that
street foods provided more than 60 % of daily food
intake(19), while in urban Kenya the intake appeared to
be less with 53–78 % of households consuming street
foods at least once weekly(21,22); however, street food
consumption was high in rural areas of Kenya, with
schoolchildren eating street foods about twice daily(25).
A national study in South Africa reported that Africans
were the most common consumers of street foods with
19 % consuming them at least twice weekly(27,28).
Type of food sold on the streets
It may be impossible to calculate the number of different
street foods sold globally. Table 2 provides some idea of
Public
Hea
lth
Nutr
itio
n
Tab
le2
Continued
Refe
rence
Nutr
itio
nal
valu
eof
SF
Type
of
food
gro
ups
consum
ed
Fre
quency
of
consum
ption
Types
of
food
item
sconsum
ed
Nam
ugum
ya
and
Muyanja
(2012)(2
9)
The
mean
daily
energ
yfr
om
SF
varied
betw
een
22
?4%
EI
and
25
?6%
EI
(2412
kJ).
Carb
ohydra
tes
contr
ibute
dth
ehig
hest
pro
port
ion
of
energ
y(7
0?1
–93
?4%
),fo
llow
ed
by
pro
tein
(38
?6–44
?9%
)and
fat
(21
?9–26
?3%
).S
Fvendors
obta
ined
24
?0–32
?5%
of
their
RD
Afo
rC
afr
om
str
eet
vended
foods.N
iacin
and
thia
min
inta
kes
from
SF
were
respectively
above
74
%and
150
%of
RD
A.
The
contr
ibution
of
SF
toR
DA
for
Zn
ranged
from
81
?9%
to190
?9%
,and
from
35
?0%
to49
?0%
for
retinol.
Fe
inta
ke
from
str
eet
vended
foods
contr
ibute
d40
?9–49
?7%
of
RD
A
The
food
gro
ups
consum
ed
most
com
monly
by
SF
vendors
were
energ
yand
pro
tein
sourc
es,
nam
ely
cere
als
,ro
ots
&tu
bers
,le
gum
es,
meats
/fish
Not
giv
en
Tra
ditio
nal
dis
hes
were
the
most
com
monly
pre
pare
dfo
ods
and
cla
ssifi
ed
into
main
meals
,sauces,
vegeta
ble
sand
snacks.
Exam
ple
sare
boile
drice,
ste
am
ed
bananas,
ste
am
ed
sw
eet
pota
toes,
ste
am
ed
cassava,
posho,
mill
et
bre
ad,
ste
am
ed
yam
s,
beef
ste
w,
fish
ste
w,
bean
sauce,
gro
undnut
sauce,
boile
dam
ara
nth
us,
frie
dcabbage
SF
,str
eet
foods;
%E
I,perc
enta
ge
of
energ
yin
take.
8 NP Steyn et al.
the wide variety of street foods available in different
countries. Not only do they differ from country to country,
but also by city and by vendors themselves. It appears that
the bulk of items are based on traditional and cultural foods
although foods processed by large-scale manufacturers are
also an important category of items sold, particularly with
regard to snack foods such as candies, chocolates, biscuits
and crisps. Generally, vendors sell more than one kind of
product although some specialize in one type only, such as
bread with different fillings(1) or different soft drinks. Street
foods can be grouped in various ways: by meal (with
various constituents); by single food items or beverages; by
level of processing; and by method of cooking (e.g. fried,
boiled, baked, steamed or raw)(1).
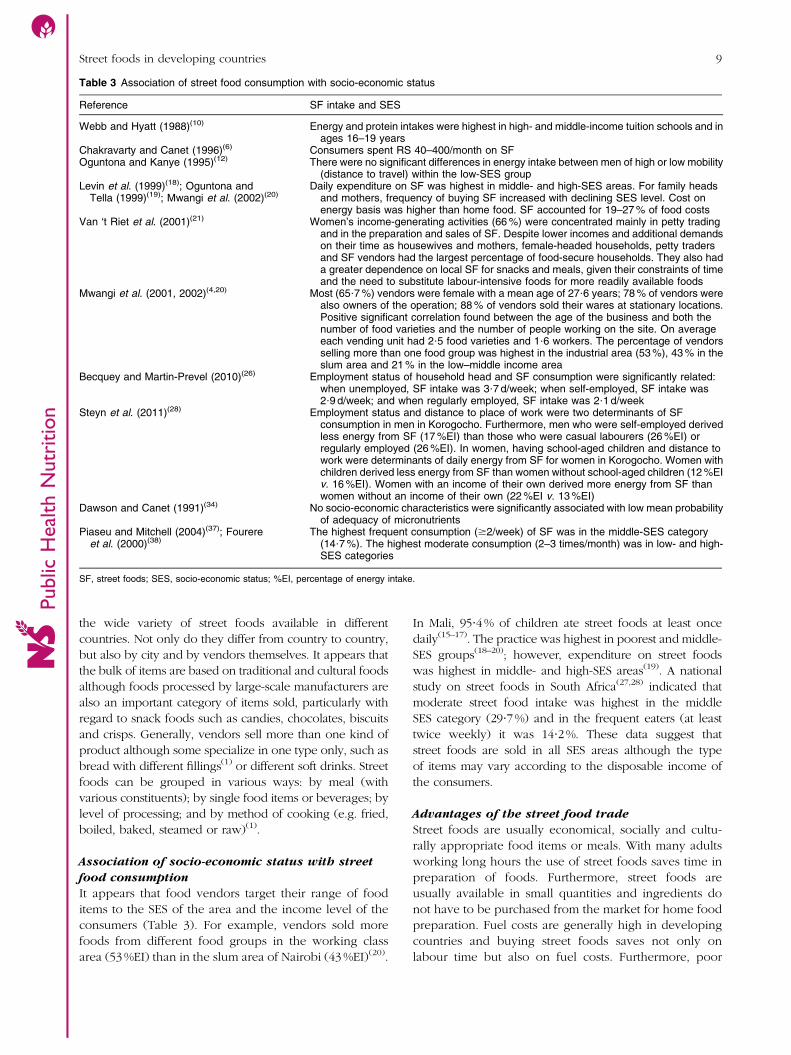
Association of socio-economic status with street
food consumption
It appears that food vendors target their range of food
items to the SES of the area and the income level of the
consumers (Table 3). For example, vendors sold more
foods from different food groups in the working class
area (53 %EI) than in the slum area of Nairobi (43 %EI)(20).
In Mali, 95?4% of children ate street foods at least once
daily(15–17). The practice was highest in poorest and middle-
SES groups(18–20); however, expenditure on street foods
was highest in middle- and high-SES areas(19). A national
study on street foods in South Africa(27,28) indicated that
moderate street food intake was highest in the middle
SES category (29?7%) and in the frequent eaters (at least
twice weekly) it was 14?2%. These data suggest that
street foods are sold in all SES areas although the type
of items may vary according to the disposable income of
the consumers.
Advantages of the street food trade
Street foods are usually economical, socially and cultu-
rally appropriate food items or meals. With many adults
working long hours the use of street foods saves time in
preparation of foods. Furthermore, street foods are
usually available in small quantities and ingredients do
not have to be purchased from the market for home food
preparation. Fuel costs are generally high in developing
countries and buying street foods saves not only on
labour time but also on fuel costs. Furthermore, poor
Public
Hea
lth
Nutr
itio
n
Table 3 Association of street food consumption with socio-economic status
Reference SF intake and SES
Webb and Hyatt (1988)(10) Energy and protein intakes were highest in high- and middle-income tuition schools and inages 16–19 years
Chakravarty and Canet (1996)(6) Consumers spent RS 40–400/month on SFOguntona and Kanye (1995)(12) There were no significant differences in energy intake between men of high or low mobility
(distance to travel) within the low-SES groupLevin et al. (1999)(18); Oguntona and
Tella (1999)(19); Mwangi et al. (2002)(20)Daily expenditure on SF was highest in middle- and high-SES areas. For family heads
and mothers, frequency of buying SF increased with declining SES level. Cost onenergy basis was higher than home food. SF accounted for 19–27 % of food costs
Van ‘t Riet et al. (2001)(21) Women’s income-generating activities (66 %) were concentrated mainly in petty tradingand in the preparation and sales of SF. Despite lower incomes and additional demandson their time as housewives and mothers, female-headed households, petty tradersand SF vendors had the largest percentage of food-secure households. They also hada greater dependence on local SF for snacks and meals, given their constraints of timeand the need to substitute labour-intensive foods for more readily available foods
Mwangi et al. (2001, 2002)(4,20) Most (65?7 %) vendors were female with a mean age of 27?6 years; 78 % of vendors werealso owners of the operation; 88 % of vendors sold their wares at stationary locations.Positive significant correlation found between the age of the business and both thenumber of food varieties and the number of people working on the site. On averageeach vending unit had 2?5 food varieties and 1?6 workers. The percentage of vendorsselling more than one food group was highest in the industrial area (53 %), 43 % in theslum area and 21 % in the low–middle income area
Becquey and Martin-Prevel (2010)(26) Employment status of household head and SF consumption were significantly related:when unemployed, SF intake was 3?7 d/week; when self-employed, SF intake was2?9 d/week; and when regularly employed, SF intake was 2?1 d/week
Steyn et al. (2011)(28) Employment status and distance to place of work were two determinants of SFconsumption in men in Korogocho. Furthermore, men who were self-employed derivedless energy from SF (17 %EI) than those who were casual labourers (26 %EI) orregularly employed (26 %EI). In women, having school-aged children and distance towork were determinants of daily energy from SF for women in Korogocho. Women withchildren derived less energy from SF than women without school-aged children (12 %EIv. 16 %EI). Women with an income of their own derived more energy from SF thanwomen without an income of their own (22 %EI v. 13 %EI)
Dawson and Canet (1991)(34) No socio-economic characteristics were significantly associated with low mean probabilityof adequacy of micronutrients
Piaseu and Mitchell (2004)(37); Fourereet al. (2000)(38)
The highest frequent consumption ($2/week) of SF was in the middle-SES category(14?7 %). The highest moderate consumption (2–3 times/month) was in low- and high-SES categories
SF, street foods; SES, socio-economic status; %EI, percentage of energy intake.
Street foods in developing countries 9

people often do not have adequate cooking facilities
and space, hence purchasing ready-to-eat food is an
advantage(4,33).
Another important advantage of the street food trade is
that of income generation. Many illiterate and unemployed
people, frequently women, find this a simple way to earn
some money with little capital investment required.
According to Dawson and Canet(34), among lower-income
groups in many developing countries 50–70% of house-
hold earnings are spent on street foods. This also applies to
schoolchildren, who may be given money to buy breakfast
and/or lunch instead of being given cooked food or
snacks(17). Hence street foods also potentially contribute
significantly to the diet of schoolchildren. Because of their
widespread use, Draper(1) further recommends studying
the feasibility of using street foods as vehicles for micro-
nutrient fortification.
It appears that cooked foods (cuisines, in particular)
have become tourist attractions in certain countries
and are often hailed as being authentic and unique
dimensions of culture, lifestyle and even heritage(35). For
example, in a study in Singapore, 65 % of tourists agreed
that street food centres had an appealing uniqueness
and cultural significance(35). Moreover, 58 % of tourists
indicated that street food centres/areas were their means
of learning about Singapore heritage.
Negative connotations of the street food trade
Unfortunately the use of street foods has many negative
connotations with regard to hygienic and safety issues,
and in many countries this trade is not regulated, which
means that bacterial contamination of such foods is of
concern to many who buy these products. Numerous
studies have documented these effects and certainly one
would need to pay attention to addressing these issues
before encouraging the sale of street foods(1).
An important concern that requires cognition when
discussing street foods in developing countries is the
westernization of diet, which has led to increased intakes
of saturated fat, trans-fat, sugar and salt(3,36). Women
studied in Burkina Faso(26) showed some of these trends
since food bought outside the home by them accounted
for 52 % of fat intake and 72 % of sugar intake. In Tunisia
more than 70 % of children studied used 75 % of their
pocket money to buy street foods. Items bought most
frequently were candy (27?2 %), pastries (23?9 %), sand-
wiches (23?9 %), sunflower seeds and peanuts (21?0 %),
and either chocolate, pizza or cheese (20?0 %)(32). The
largest proportion of money was spent on candy, pastries
and sandwiches. The main motivation for buying street
foods was to replace a meal at home. With the exception
of peanuts and sunflower seeds, the other items did not
reflect a traditional Tunisian diet and are typical examples
of ‘western foods’.
Conclusions
Street foods contribute significantly to the diet of many
living in developing countries. Furthermore, street foods
are convenient, cheap, easily accessible and a source of
income to many poor people who would otherwise not
Public
Hea
lth
Nutr
itio
n
Search engine
Search terms 1 1 1 1
Hits
Total
Total
Countries Other developing sub-Saharan Africa
Search term: “street food” OR “food sold by vendors”
MEDLINE/PubMed Web of Science Proquest Health Science Direct
62 88 161 292
603 articles including duplicates and irrelevant articles 580 articles excluded
18 5
23
4 19
Hand-searched articlesRelevant articles
Fig. 1 Number of studies retrieved during the screening process
10 NP Steyn et al.

find employment. Health policy makers and educators
should encourage and promote the sale of healthy,
traditional street foods and ensure that regulation efforts
are in place to prevent health problems arising. This may
also include centres or areas where street foods are sold
and which encourage tourists to sample local cuisine in a
safe environment.
Acknowledgements
Sources of funding: The study was supported by the
Human Sciences Research Council, Medical Research
Council, Cape Peninsula University of Technology and the
National Research Foundation. Conflicts of interest: None
declared. Ethics: Ethical approval was not required.
Authors’ contributions: N.P.S., Z.M. and J.H. undertook
the literature search; Y.D.D., I.V., E.H., M.O., J.R. and P.J.
provided expertise and writing inputs. Acknowledgements:
The authors thank Laetitia Louw and Tsakani Mathebula for
library assistance.
References
1. Draper A (1996) Street Foods in Developing Countries: ThePotential for Micronutrient Fortification. London: LondonSchool of Hygiene and Tropical Medicine.
2. Levin CE, Ruel M & Morris SS (1999) Working women in anurban setting: traders, vendors and food security in Accra.World Dev 27, 1977–1991.
3. Nago ES, Lachat CK, Huybregts L et al. (2010) Food, energyand macronutrient contribution of out-of-home foods inschool-going adolescents in Cotonou, Benin. Br J Nutr 103,281–288.
4. Mwangi AM, den Hartog AP, Foeken DWJ et al. (2001) Theecology of street foods in Nairobi. Ecol Food Nutr 40,497–523.
5. Tinker I (1987) Street foods. Curr Sociol 35, 1–110.6. Chakravarty I & Canet C (1996) Street Foods in Calcutta.
Rome: Agriculture and Consumer Protection Division, FAO.7. Haslam DW & James WP (2005) Obesity. Lancet 366,
1197–1209.8. Lobstein T, Baur L & Uauy R (2006) Obesity in children
and young people: a crisis in public health. Obes Rev 5,Suppl. 1, S4–S104.
9. The World Bank (2005) Country Classification. http://www.worldbank.org/data/countryclass/classgroups.htm (accessedNovember 2012).
10. Webb RE & Hyatt SA (1988) Haitian street foods and theirnutritional contribution to dietary intake. Ecol Food Nutr21, 199–208.
11. Sujatha T, Shatrugna V, Narasimha GV et al. (1997) Streetfood: an important source of energy for the urban worker.Food Nutr Bull 18, issue 4, 102 Abstr.
12. Oguntona CR & Kanye O (1995) Contribution of streetfoods to nutrient intakes by Nigerian adolescents. NutrHealth 10, 165–171.
13. Oguntona CR, Razaq MA & Tolulope T (1998) Pattern ofdietary intake and consumption of street foods amongNigerian students. Nutr Health 12, 247–256.
14. Korir SCR, Imungi JK & Muroki M (1998) Proximatechemical composition of street foods and their energyand protein contribution to the nutrition of manual workersin Nairobi. Ecol Food Nutr 37, 123–133.
15. Ag Bendech MA, Chauliac M & Malvy DJM (1998)Assessment of dietary intake at home and outsidethe home in Bamako (Mali). Ecol Food Nutr 37,135–162.
16. Ag Bendech M, Chauliac M, Gerbouin-Rerolle P et al.(1999) Home and outside home food complementarity inBamako (Mali): nutritional and economic aspects. What isthe rationality behind consumers’ choices? Rev EpidemiolSante Publique 47, 151–164.
17. Ag Bendech M, Chauliac M, Gerbouin-Rerolle P et al.(2000) Food consumption patterns in the urban milieu ofBamako. Sante Publique 12, 45–63.
18. Levin CE, Ruel MT & Morris SS (1999) Working women inan urban setting: traders, vendors and food security inAccra. World Dev 27, 1977–1991.
19. Oguntona CRB & Tella TO (1999) Street foods and dietaryintakes of Nigerian urban market women. Int J Food SciNutr 50, 383–390.
20. Mwangi AM, den Hartog AP, Mwadime RKN et al. (2002)Do street food vendors sell a sufficient variety of foods for ahealthful diet? The case of Nairobi. Food Nutr Bull 23,48–56.
21. Van ‘t Riet H, den Hartog AP, Mwangi AM et al. (2001)The role of street foods in the dietary pattern of twolow-income groups in Nairobi. Eur J Clin Nutr 55,562–570.
22. Van ‘t Riet H, den Hartog AP & Mwangi AM (2002) None-home prepared foods: contributing to energy and nutrientintake of consumers living in two low income areas inNairobi. Public Health Nutr 4, 515–522.
23. Van ‘t Riet H, den Hartog AP & Mwangi AM (2003)Determinants of non-home food prepared food consump-tion in two low income areas in Nairobi. Nutrition 19,1006–1012.
24. Badrie N, Joseph M & Darbasie N (2005) Nutritivecomposition of a street food ‘doubles’ channa (Cicerarietinum) burger and its components sold in Trinidad,West Indies. J Food Compost Anal 8, 171–179.
25. Gewa CA, Murphy SP & Neumann CG (2007) Out-of-homefood intake is often omitted from mothers’ recallsof schoolchildren’s intake in rural Kenya. J Nutr 137,2154–2159.
26. Becquey E & Martin-Prevel YM (2010) Micronutrientadequacy of women’s diet in urban Burkina Faso is low.J Nutr 140, issue 11, 2079S–2085S.
27. Steyn NP & Labadarios D (2011) Street foods and fast foods:how much do South Africans of different ethnic groupsconsume? Ethn Dis 21, 462–466.
28. Steyn NP, Labadarios D & Nel JH (2011) Factorswhich influence the consumption of street foods andfast foods in South Africa – a national survey. Nutr J10, 104.
29. Namugumya BS & Muyanja C (2012) Contribution of streetfoods to the dietary needs of street food vendors inKampala, Jinja and Masaka districts, Uganda. Public HealthNutr 15, 1503–1511.
30. Chauliac M, Bricas N & Ategbo E (1998) Food habitsoutside the home by school children in Cotonou (Benin).Sante 8, 101–108.
31. Acho-Chi C (2002) The mobile street food service practicein the urban economy of Kumba, Cameroon. Singapore JTrop Geogr 23, 131–148.
32. Neffati L, Ridha H, Kolsteren P et al. (2004) Streetfood among children: a study in north Tunisia. Sante 14,43–48.
33. Drabo KM, Toe LP, Savadogo LG et al. (2009) Maincharacteristics of the street food sector in Bobo-Dioulasso,Burkina Faso. Bull Soc Pathol Exot 102, 36–40.
34. Dawson RJ & Canet C (1991) International activities instreet foods. Food Control 2, 135.
Public
Hea
lth
Nutr
itio
nStreet foods in developing countries 11

35. Henderson JC, Si Yun O, Poon P et al. (2012) Hawkercentres as tourist attractions: the case of Singapore. Int JHospitality Manage 31, 849–855.
36. Macias C, Pita GM, Basabe B et al. (2009) Food habits,attitudes and preferences in secondary school adolescentsin Havana. Spanish J Community Nutr 15, 13–22.
37. Piaseu N & Mitchell P (2004) Household food insecurityamong urban poor in Thailand. J Nurs Scholarsh 36, 115–121.
38. Fourere T, Maire B, Delpeuch F et al. (2000) Dietarychanges in Africa urban households in response tocurrency devaluation: foreseeable risks for health andnutrition. Public Health Nutr 3, 93–301.
Public
Hea
lth
Nutr
itio
n12 NP Steyn et al.
Related Documents
![Nutritional Ketosis Condition and Specific Ketogenic Diet ... · Ketosis can be induced when a ketogenic diet is followed for more than 3 days. This induced nutritional ketosis [23].](https://static.cupdf.com/doc/110x72/5fc6fb73d71b24630f77a027/nutritional-ketosis-condition-and-specific-ketogenic-diet-ketosis-can-be-induced.jpg)