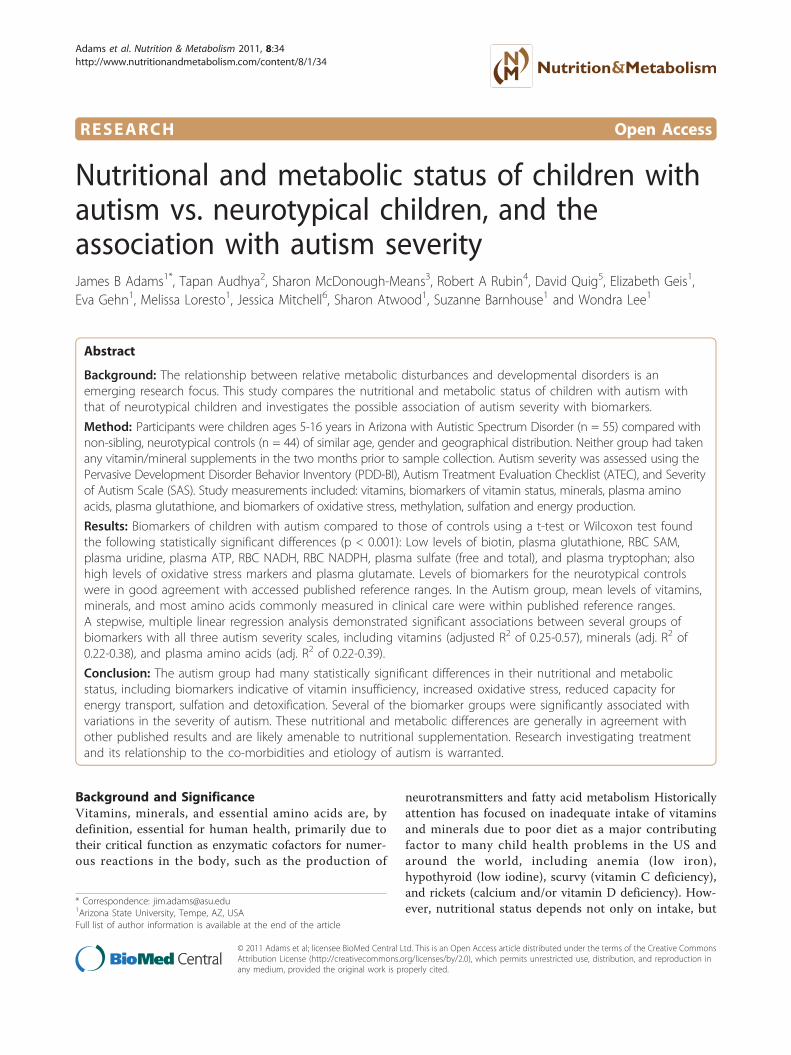
RESEARCH Open Access Nutritional and metabolic status of children with autism vs. neurotypical children, and the association with autism severity James B Adams 1* , Tapan Audhya 2 , Sharon McDonough-Means 3 , Robert A Rubin 4 , David Quig 5 , Elizabeth Geis 1 , Eva Gehn 1 , Melissa Loresto 1 , Jessica Mitchell 6 , Sharon Atwood 1 , Suzanne Barnhouse 1 and Wondra Lee 1 Abstract Background: The relationship between relative metabolic disturbances and developmental disorders is an emerging research focus. This study compares the nutritional and metabolic status of children with autism with that of neurotypical children and investigates the possible association of autism severity with biomarkers. Method: Participants were children ages 5-16 years in Arizona with Autistic Spectrum Disorder (n = 55) compared with non-sibling, neurotypical controls (n = 44) of similar age, gender and geographical distribution. Neither group had taken any vitamin/mineral supplements in the two months prior to sample collection. Autism severity was assessed using the Pervasive Development Disorder Behavior Inventory (PDD-BI), Autism Treatment Evaluation Checklist (ATEC), and Severity of Autism Scale (SAS). Study measurements included: vitamins, biomarkers of vitamin status, minerals, plasma amino acids, plasma glutathione, and biomarkers of oxidative stress, methylation, sulfation and energy production. Results: Biomarkers of children with autism compared to those of controls using a t-test or Wilcoxon test found the following statistically significant differences (p < 0.001): Low levels of biotin, plasma glutathione, RBC SAM, plasma uridine, plasma ATP, RBC NADH, RBC NADPH, plasma sulfate (free and total), and plasma tryptophan; also high levels of oxidative stress markers and plasma glutamate. Levels of biomarkers for the neurotypical controls were in good agreement with accessed published reference ranges. In the Autism group, mean levels of vitamins, minerals, and most amino acids commonly measured in clinical care were within published reference ranges. A stepwise, multiple linear regression analysis demonstrated significant associations between several groups of biomarkers with all three autism severity scales, including vitamins (adjusted R 2 of 0.25-0.57), minerals (adj. R 2 of 0.22-0.38), and plasma amino acids (adj. R 2 of 0.22-0.39). Conclusion: The autism group had many statistically significant differences in their nutritional and metabolic status, including biomarkers indicative of vitamin insufficiency, increased oxidative stress, reduced capacity for energy transport, sulfation and detoxification. Several of the biomarker groups were significantly associated with variations in the severity of autism. These nutritional and metabolic differences are generally in agreement with other published results and are likely amenable to nutritional supplementation. Research investigating treatment and its relationship to the co-morbidities and etiology of autism is warranted. Background and Significance Vitamins, minerals, and essential amino acids are, by definition, essential for human health, primarily due to their critical function as enzymatic cofactors for numer- ous reactions in the body, such as the production of neurotransmitters and fatty acid metabolism Historically attention has focused on inadequate intake of vitamins and minerals due to poor diet as a major contributing factor to many child health problems in the US and around the world, including anemia (low iron), hypothyroid (low iodine), scurvy (vitamin C deficiency), and rickets (calcium and/or vitamin D deficiency). How- ever, nutritional status depends not only on intake, but * Correspondence: [email protected] 1 Arizona State University, Tempe, AZ, USA Full list of author information is available at the end of the article Adams et al. Nutrition & Metabolism 2011, 8:34 http://www.nutritionandmetabolism.com/content/8/1/34 © 2011 Adams et al; licensee BioMed Central Ltd. This is an Open Access article distributed under the terms of the Creative Commons Attribution License (http://creativecommons.org/licenses/by/2.0), which permits unrestricted use, distribution, and reproduction in any medium, provided the original work is properly cited.

Welcome message from author
This document is posted to help you gain knowledge. Please leave a comment to let me know what you think about it! Share it to your friends and learn new things together.
Transcript
RESEARCH Open Access
Nutritional and metabolic status of children withautism vs. neurotypical children, and theassociation with autism severityJames B Adams1*, Tapan Audhya2, Sharon McDonough-Means3, Robert A Rubin4, David Quig5, Elizabeth Geis1,Eva Gehn1, Melissa Loresto1, Jessica Mitchell6, Sharon Atwood1, Suzanne Barnhouse1 and Wondra Lee1
Abstract
Background: The relationship between relative metabolic disturbances and developmental disorders is anemerging research focus. This study compares the nutritional and metabolic status of children with autism withthat of neurotypical children and investigates the possible association of autism severity with biomarkers.
Method: Participants were children ages 5-16 years in Arizona with Autistic Spectrum Disorder (n = 55) compared withnon-sibling, neurotypical controls (n = 44) of similar age, gender and geographical distribution. Neither group had takenany vitamin/mineral supplements in the two months prior to sample collection. Autism severity was assessed using thePervasive Development Disorder Behavior Inventory (PDD-BI), Autism Treatment Evaluation Checklist (ATEC), and Severityof Autism Scale (SAS). Study measurements included: vitamins, biomarkers of vitamin status, minerals, plasma aminoacids, plasma glutathione, and biomarkers of oxidative stress, methylation, sulfation and energy production.
Results: Biomarkers of children with autism compared to those of controls using a t-test or Wilcoxon test foundthe following statistically significant differences (p < 0.001): Low levels of biotin, plasma glutathione, RBC SAM,plasma uridine, plasma ATP, RBC NADH, RBC NADPH, plasma sulfate (free and total), and plasma tryptophan; alsohigh levels of oxidative stress markers and plasma glutamate. Levels of biomarkers for the neurotypical controlswere in good agreement with accessed published reference ranges. In the Autism group, mean levels of vitamins,minerals, and most amino acids commonly measured in clinical care were within published reference ranges.A stepwise, multiple linear regression analysis demonstrated significant associations between several groups ofbiomarkers with all three autism severity scales, including vitamins (adjusted R2 of 0.25-0.57), minerals (adj. R2 of0.22-0.38), and plasma amino acids (adj. R2 of 0.22-0.39).
Conclusion: The autism group had many statistically significant differences in their nutritional and metabolicstatus, including biomarkers indicative of vitamin insufficiency, increased oxidative stress, reduced capacity forenergy transport, sulfation and detoxification. Several of the biomarker groups were significantly associated withvariations in the severity of autism. These nutritional and metabolic differences are generally in agreement withother published results and are likely amenable to nutritional supplementation. Research investigating treatmentand its relationship to the co-morbidities and etiology of autism is warranted.
Background and SignificanceVitamins, minerals, and essential amino acids are, bydefinition, essential for human health, primarily due totheir critical function as enzymatic cofactors for numer-ous reactions in the body, such as the production of
neurotransmitters and fatty acid metabolism Historicallyattention has focused on inadequate intake of vitaminsand minerals due to poor diet as a major contributingfactor to many child health problems in the US andaround the world, including anemia (low iron),hypothyroid (low iodine), scurvy (vitamin C deficiency),and rickets (calcium and/or vitamin D deficiency). How-ever, nutritional status depends not only on intake, but
* Correspondence: [email protected] State University, Tempe, AZ, USAFull list of author information is available at the end of the article
Adams et al. Nutrition & Metabolism 2011, 8:34http://www.nutritionandmetabolism.com/content/8/1/34
© 2011 Adams et al; licensee BioMed Central Ltd. This is an Open Access article distributed under the terms of the Creative CommonsAttribution License (http://creativecommons.org/licenses/by/2.0), which permits unrestricted use, distribution, and reproduction inany medium, provided the original work is properly cited.
also on digestion, absorption, metabolic processing, andmetabolic demand. More recently the focus has shiftedto the relationship between relative metabolic distur-bances and developmental disorders, for example thoseassociated with Attention Deficit Disorder [1-5], learn-ing disorders [6], and intellectual development [7]. Wehypothesize that nutritional insufficiency and metabolicimbalances may play a role in autism spectrum disor-ders (ASD).There have been several studies of the nutritional and
metabolic status of children with autism, but eachfocused on study of only a few biomarkers. Three studieshave demonstrated that children with autism haveimpaired methylation, decreased glutathione, and oxida-tive stress [8-10], and those studies demonstrated thatnutritional supplementation (with vitamin methyl-B12,folinic acid, and trimethylglycine) is beneficial. One studyin Romania found normal levels of vitamin B12 andfolate in children with autism compared to controls, butlow levels of plasma glutathione [11]. Several other stu-dies have also demonstrated increased oxidative stress[12-15]. One study [16] found that children with autismhad high levels of plasma vitamin B6 pre-supplementa-tion, and this finding was confirmed in a follow-up study[17], suggesting a metabolic imbalance in B6. One studyof dietary intake of 111 autistic children in China foundthat most had inadequate intake of folic acid, vitamin B6,vitamin A, Vitamin C, and zinc [18]. One study of vita-min D status in Egypt found that young children withautism had lower levels of vitamin D, both 25(OH)D and1,25(OH)(2)D compared to age-matched controls [19].One study in Slovakia found that children with autismhad significantly higher levels of vitamin C and beta-car-otene, but normal levels of vitamin A and vitamin E,compared to older teen controls [20].There are several studies of minerals in children with
autism. One study found that young US children withautism and their mothers had unusually low levels oflithium compared to neurotypical children and theirmothers; lithium is receiving increasing recognition asbeing an essential mineral [21]. Two large studies ofiron status found that US and Canadian children withautism had anemia in 8% and 16% of cases, respec-tively [22,23]. One small study of minerals in redblood cells found that young Canadian children withautism (n = 20) had lower levels of RBC selenium andRBC molybdenum than neurotypical children (n = 15)of the same age [24], but similar levels of most otherminerals. A small study of zinc and copper in plasmafound that British children with autism (n = 20) hadsimilar levels to neurotypical children (n = 30) [25]. Incontrast, a study of Turkish children with autism (n =45) found that they had lower levels of zinc in plasmaand RBC compared to neurotypical children (n = 41)
[26]. One study [27] reported low levels of plasma zincand high levels of serum copper in young childrenwith autism as compared to published referenceranges, but.the lack of in-study controls is a weaknessof this study.There have been several studies of essential amino
acids in autism with conflicting results. Increased levelswere found by Aldred et al 2003 [28], both increasedand decreased levels by Moreno et al 1996 [29], anddecreased levels by Rolf et al 1993 [30] and Arnold et al2003 [31]; the latter found only decreased methionine inthe autism group on a standard diet. One limitation ofthe studies was their small population size (less than 25participants in each arm). Another very important lim-itation is that fasting status was unclear in two of thestudies [29,30] or only involved a limited (2-4 hours)fast in another study [31]. Only one of the studies [28]involved overnight fasting; this is important as aminoacid values are not comparable unless all are done in afasting state. One of the studies [28] involved very dif-ferent age ranges for the controls and the autistic groupwhich is important as pediatric reference ranges forsome plasma amino acids vary substantially with age[32]. Thus, larger, more rigorous studies are needed.The purpose of this study is to investigate the nutri-
tional and metabolic status of children with autismcompared to neurotypical children of similar age andgender, and to determine if some nutritional and meta-bolic biomarkers may be associated with the severity ofautism. This study includes a broad array of biomarkersbecause that helps provide a more complete understand-ing of nutritional status, including vitamins, minerals,amino acids, and other metabolic biomarkers. The chil-dren with autism who participated in this study thencontinued into a randomized, double-blind, placebo-controlled study of the effect of a vitamin/mineral sup-plement, and the details of that follow-on investigationare reported in two companion papers [Adams et al,Effect of a Vitamin/Mineral Supplement on Childrenwith Autism: Part A Nutritional and Metabolic Results,submitted, and Adams et al, Effect of a Vitamin/MineralSupplement on Children with Autism: Part B. Effect onSymptoms.]. A strength of this study is the use of neu-rotypical controls of similar age, gender and geographicdistribution, tested concurrently under identical condi-tions to the autism group, with blinded evaluation ofsamples by the laboratories.
MethodologyThis paper reports on the baseline levels of childrenwith autism compared to neurotypical children. Neithergroup of children had taken any vitamin/mineral supple-ments in the two months prior to the study. This studywas conducted with the approval of the Human Subjects
Adams et al. Nutrition & Metabolism 2011, 8:34http://www.nutritionandmetabolism.com/content/8/1/34
Page 2 of 32
Institutional Review Board of Arizona State University,study protocol number 0801002499.ParticipantsParticipants were recruited during May to December2008 from Arizona with the help of the Autism Societyof Greater Phoenix and the Arizona Division of Devel-opmental Disabilities. All parents and children, whereappropriate for age and developmental ability, signedparent consent/child assent forms.
Enrollment criteria1) age 5-16 years old;2) no usage of a vitamin/mineral supplement in the
last 2 months3) no current use of any chelation treatment4) Autism Group: prior diagnosis of autism, PDD/
NOS, or Asperger’s by a psychiatrist or similar profes-sional, with written verification (no additional assess-ment was done in this study)5) Control Group: in good mental and physical health,
and no siblings with autism spectrum disorders, and noevidence of Attention Deficit Disorder by parent report(no additional assessment was done in this study)
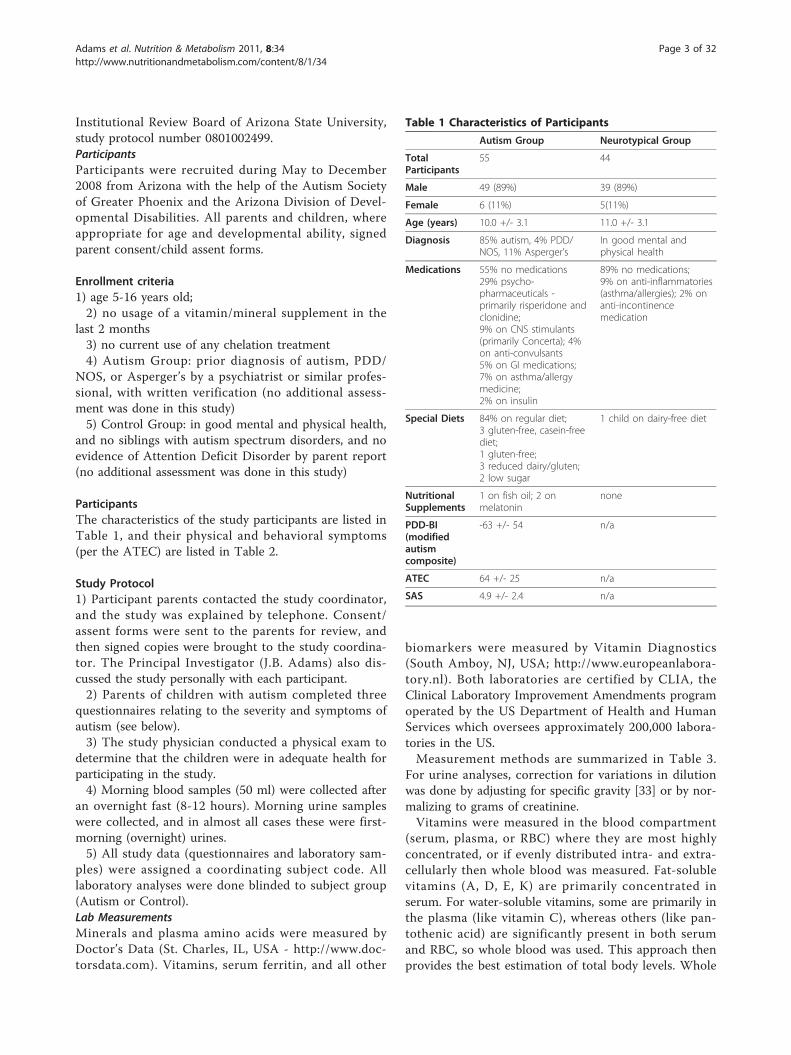
ParticipantsThe characteristics of the study participants are listed inTable 1, and their physical and behavioral symptoms(per the ATEC) are listed in Table 2.
Study Protocol1) Participant parents contacted the study coordinator,and the study was explained by telephone. Consent/assent forms were sent to the parents for review, andthen signed copies were brought to the study coordina-tor. The Principal Investigator (J.B. Adams) also dis-cussed the study personally with each participant.2) Parents of children with autism completed three
questionnaires relating to the severity and symptoms ofautism (see below).3) The study physician conducted a physical exam to
determine that the children were in adequate health forparticipating in the study.4) Morning blood samples (50 ml) were collected after
an overnight fast (8-12 hours). Morning urine sampleswere collected, and in almost all cases these were first-morning (overnight) urines.5) All study data (questionnaires and laboratory sam-
ples) were assigned a coordinating subject code. Alllaboratory analyses were done blinded to subject group(Autism or Control).Lab MeasurementsMinerals and plasma amino acids were measured byDoctor’s Data (St. Charles, IL, USA - http://www.doc-torsdata.com). Vitamins, serum ferritin, and all other
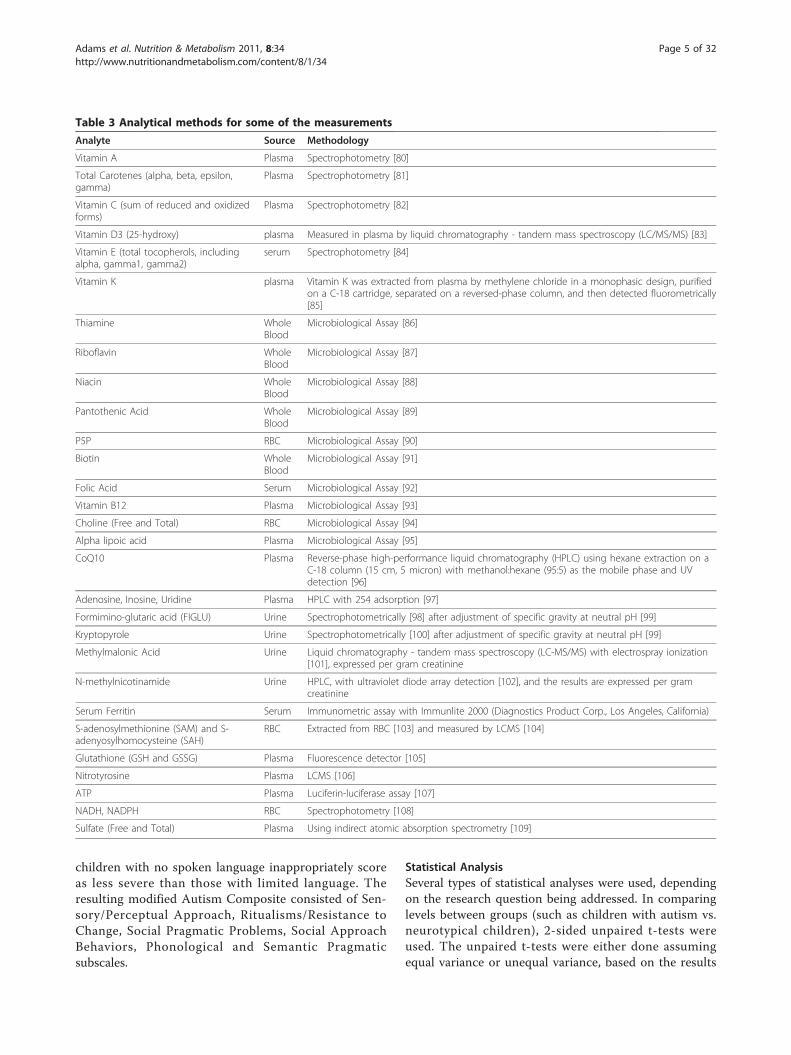
biomarkers were measured by Vitamin Diagnostics(South Amboy, NJ, USA; http://www.europeanlabora-tory.nl). Both laboratories are certified by CLIA, theClinical Laboratory Improvement Amendments programoperated by the US Department of Health and HumanServices which oversees approximately 200,000 labora-tories in the US.Measurement methods are summarized in Table 3.
For urine analyses, correction for variations in dilutionwas done by adjusting for specific gravity [33] or by nor-malizing to grams of creatinine.Vitamins were measured in the blood compartment
(serum, plasma, or RBC) where they are most highlyconcentrated, or if evenly distributed intra- and extra-cellularly then whole blood was measured. Fat-solublevitamins (A, D, E, K) are primarily concentrated inserum. For water-soluble vitamins, some are primarily inthe plasma (like vitamin C), whereas others (like pan-tothenic acid) are significantly present in both serumand RBC, so whole blood was used. This approach thenprovides the best estimation of total body levels. Whole
Table 1 Characteristics of Participants
Autism Group Neurotypical Group
TotalParticipants
55 44
Male 49 (89%) 39 (89%)
Female 6 (11%) 5(11%)
Age (years) 10.0 +/- 3.1 11.0 +/- 3.1
Diagnosis 85% autism, 4% PDD/NOS, 11% Asperger’s
In good mental andphysical health
Medications 55% no medications29% psycho-pharmaceuticals -primarily risperidone andclonidine;9% on CNS stimulants(primarily Concerta); 4%on anti-convulsants5% on GI medications;7% on asthma/allergymedicine;2% on insulin
89% no medications;9% on anti-inflammatories(asthma/allergies); 2% onanti-incontinencemedication
Special Diets 84% on regular diet;3 gluten-free, casein-freediet;1 gluten-free;3 reduced dairy/gluten;2 low sugar
1 child on dairy-free diet
NutritionalSupplements
1 on fish oil; 2 onmelatonin
none
PDD-BI(modifiedautismcomposite)
-63 +/- 54 n/a
ATEC 64 +/- 25 n/a
SAS 4.9 +/- 2.4 n/a
Adams et al. Nutrition & Metabolism 2011, 8:34http://www.nutritionandmetabolism.com/content/8/1/34
Page 3 of 32
blood measurements are not commonly used for labora-tory assessments because of challenges in processing thesamples. However, by the use of vitamin-specific micro-biological organisms as done in this study, whole bloodlevels are measured with a high degree of reliability.Essential minerals were measured in RBC, serum,
whole blood, and (for iodine) in urine. In most cases,serum reflects an average of the last several days, RBCreflects an average of the last several months, andwhole blood is an average of both. Serum Na, K, Mg,Ca, P, Fe were analyzed on an automated clinical chem-istry analyzer (Olympus AU680, Olympus America Inc.;Centerville, Pa., USA) using commercial assays. Essentialminerals were measured in RBC in all cases except forsodium, lithium, and iodine; most were also measuredin whole blood and/or serum depending upon whichcompartment is known to have the higher concentrationfor that mineral. Lithium was only measured in whole
blood because it is more detectable there. Iodine wasmeasured in urine (see below) because it is moredetectable and reliably measured in urine than in blood.Whole blood and packed red blood cells were collectedin a potassium EDTA trace metal free (royal blue top;BD Vacutainer, Franklin Lakes, NJ). Packed red bloodcells were spun for 15 minutes in a centrifuge at 1500 g(g-force), the plasma and buffy coat were removed andthe remaining packed red blood cells were submittedfor testing. Elemental analysis was performed afterdigesting an aliquot of sample using a temperature con-trolled microwave digestion system1 (Mars5; CEM Corp;Matthews, SC), following the same procedure for nitricacid microwave digestion and sample procedure as usedpreviously for hair [34]. The digested sample was ana-lyzed by Inductively Coupled Plasma - Mass Spectrome-try (ICP-MS) (Elan DRCII; Perkin Elmer Corp; Shelton,CT). Results were verified for precision and accuracyusing controls from Doctor’s Data and Seronorm wholeblood controls (Sero; Billingstad, Norway).Urine iodine was analyzed by ICP-MS using a modifi-
cation of the methods reported in the Analytical sectionof the report by the Agency for Toxic Substances andDisease Registry (ATSDR 2004). Urine results areexpressed per gram creatinine.Amino Acids After an overnight fast blood sampleswere collected into purple top (EDTA) tubes. Bloodwas centrifuged within 30 minutes, and plasma wasmixed with 5-sulfosalicylic acid to precipitate proteinsprior to freezing for 24 hours prior to shipping. Plasmaamino acids were analyzed by a reversed phase highperformance liquid chromatography (HPLC) tandemmass spectrometry (MS/MS) technique (Prostar 420HPLC autosampler, Prostar 210 solvent delivery mod-ule, 1200 L mass spectrophotometer, Varian, Inc.; PaloAlto, CA) using a method developed at Doctor’s Data.Results were verified for precision and accuracy usingin-house controls and a Native (Physiological) SampleStandard (Pickering Laboratories). Note that the mea-surement process results in oxidation of any cysteine,so that the measurement of “cysteine + cystine” isactually a measure of the combination of cysteine andcystine. The same is true of homocysteine andhomocystine.
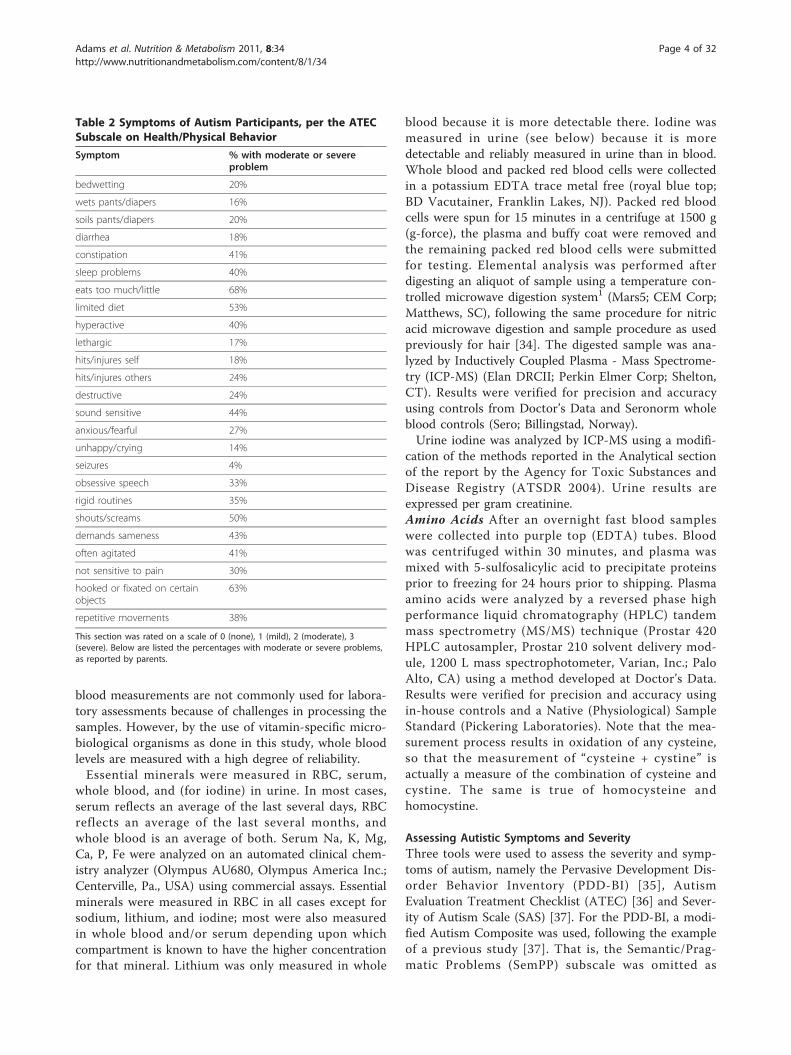
Assessing Autistic Symptoms and SeverityThree tools were used to assess the severity and symp-toms of autism, namely the Pervasive Development Dis-order Behavior Inventory (PDD-BI) [35], AutismEvaluation Treatment Checklist (ATEC) [36] and Sever-ity of Autism Scale (SAS) [37]. For the PDD-BI, a modi-fied Autism Composite was used, following the exampleof a previous study [37]. That is, the Semantic/Prag-matic Problems (SemPP) subscale was omitted as
Table 2 Symptoms of Autism Participants, per the ATECSubscale on Health/Physical Behavior
Symptom % with moderate or severeproblem
bedwetting 20%
wets pants/diapers 16%
soils pants/diapers 20%
diarrhea 18%
constipation 41%
sleep problems 40%
eats too much/little 68%
limited diet 53%
hyperactive 40%
lethargic 17%
hits/injures self 18%
hits/injures others 24%
destructive 24%
sound sensitive 44%
anxious/fearful 27%
unhappy/crying 14%
seizures 4%
obsessive speech 33%
rigid routines 35%
shouts/screams 50%
demands sameness 43%
often agitated 41%
not sensitive to pain 30%
hooked or fixated on certainobjects
63%
repetitive movements 38%
This section was rated on a scale of 0 (none), 1 (mild), 2 (moderate), 3(severe). Below are listed the percentages with moderate or severe problems,as reported by parents.
Adams et al. Nutrition & Metabolism 2011, 8:34http://www.nutritionandmetabolism.com/content/8/1/34
Page 4 of 32
children with no spoken language inappropriately scoreas less severe than those with limited language. Theresulting modified Autism Composite consisted of Sen-sory/Perceptual Approach, Ritualisms/Resistance toChange, Social Pragmatic Problems, Social ApproachBehaviors, Phonological and Semantic Pragmaticsubscales.
Statistical AnalysisSeveral types of statistical analyses were used, dependingon the research question being addressed. In comparinglevels between groups (such as children with autism vs.neurotypical children), 2-sided unpaired t-tests wereused. The unpaired t-tests were either done assumingequal variance or unequal variance, based on the results
Table 3 Analytical methods for some of the measurements
Analyte Source Methodology
Vitamin A Plasma Spectrophotometry [80]
Total Carotenes (alpha, beta, epsilon,gamma)
Plasma Spectrophotometry [81]
Vitamin C (sum of reduced and oxidizedforms)
Plasma Spectrophotometry [82]
Vitamin D3 (25-hydroxy) plasma Measured in plasma by liquid chromatography - tandem mass spectroscopy (LC/MS/MS) [83]
Vitamin E (total tocopherols, includingalpha, gamma1, gamma2)
serum Spectrophotometry [84]
Vitamin K plasma Vitamin K was extracted from plasma by methylene chloride in a monophasic design, purifiedon a C-18 cartridge, separated on a reversed-phase column, and then detected fluorometrically[85]
Thiamine WholeBlood
Microbiological Assay [86]
Riboflavin WholeBlood
Microbiological Assay [87]
Niacin WholeBlood
Microbiological Assay [88]
Pantothenic Acid WholeBlood
Microbiological Assay [89]
P5P RBC Microbiological Assay [90]
Biotin WholeBlood
Microbiological Assay [91]
Folic Acid Serum Microbiological Assay [92]
Vitamin B12 Plasma Microbiological Assay [93]
Choline (Free and Total) RBC Microbiological Assay [94]
Alpha lipoic acid Plasma Microbiological Assay [95]
CoQ10 Plasma Reverse-phase high-performance liquid chromatography (HPLC) using hexane extraction on aC-18 column (15 cm, 5 micron) with methanol:hexane (95:5) as the mobile phase and UVdetection [96]
Adenosine, Inosine, Uridine Plasma HPLC with 254 adsorption [97]
Formimino-glutaric acid (FIGLU) Urine Spectrophotometrically [98] after adjustment of specific gravity at neutral pH [99]
Kryptopyrole Urine Spectrophotometrically [100] after adjustment of specific gravity at neutral pH [99]
Methylmalonic Acid Urine Liquid chromatography - tandem mass spectroscopy (LC-MS/MS) with electrospray ionization[101], expressed per gram creatinine
N-methylnicotinamide Urine HPLC, with ultraviolet diode array detection [102], and the results are expressed per gramcreatinine
Serum Ferritin Serum Immunometric assay with Immunlite 2000 (Diagnostics Product Corp., Los Angeles, California)
S-adenosylmethionine (SAM) and S-adenyosylhomocysteine (SAH)
RBC Extracted from RBC [103] and measured by LCMS [104]
Glutathione (GSH and GSSG) Plasma Fluorescence detector [105]
Nitrotyrosine Plasma LCMS [106]
ATP Plasma Luciferin-luciferase assay [107]
NADH, NADPH RBC Spectrophotometry [108]
Sulfate (Free and Total) Plasma Using indirect atomic absorption spectrometry [109]
Adams et al. Nutrition & Metabolism 2011, 8:34http://www.nutritionandmetabolism.com/content/8/1/34
Page 5 of 32
of a test for equal variance. For individual comparisons ap value of 0.05 or lower was assumed significant. How-ever, in order to maintain an overall significance of 5%when multiple comparisons were considered, a smallerper-test p-value was considered significant based on aBonferroni analysis, and this p-value is specified at thebeginning of each of the result sections. For example, ifmaking 5 comparisons, then an overall significance of5% is achieved if the p-value is set at 0.05/(5 compari-sons) = 0.01. We use the term “marginally significant” ifthe p value is less than 0.1/(number of comparisons).We use the term “possibly significant” if the p-value isless than 0.05 but not low enough to be marginally sig-nificant; this means that the result would be significantif only one comparison were made, but could be a sta-tistical fluke due to the making of many comparisons,so further studies are needed to confirm or invalidatethe result.Some of the data for essential minerals were not nor-
mally distributed, so in those cases a non-parametricWilcoxon test was used instead of a t-test. Pearson cor-relation coefficients were obtained to determine thestrengths of linear relationships among the variablesinvolved in the analyses.Note that for a few measurements there was some
data below the detection limit. In those cases the valueof the detection limit was substituted for the data point;so, for cases where some samples were below detectionlimit, our reported measured values are an upper boundto the true value.Correlation and regression analysis was employed to
examine the relationship between the severity of autism(assessed by the ATEC, PDD-BI, and SAS) and the bio-markers of nutritional and metabolic status. For theselected dependent and independent variables, step-wiselinear regression analyses were conducted: initially allindependent variables were included in the regression;then at each step, the variable with the highest p-valuewas eliminated, and this process was continued until theadjusted R2 value began declining. Thus, the goal was todetermine the best fit to the sample data for the selectedmodel, taking into account the correlation among theindependent variables. Since the data had several miss-ing values (due to missing lab or behavioral data), theregression analyses were conducted by restricting theanalysis to “complete cases” only (i.e., where there wereno missing values for any of the variables in the initialanalysis step). Due to the large number of biomarkerscompared to the number of participants, the regressionanalyses were first conducted by category; for example,vitamins vs. the PDD-BI as the dependent variable.After determining, for each category, the few within-category biomarkers that had the greatest associationwith autism severity, an “overall” step-wise regression
was performed on those biomarkers with the greatestassociation with autism severity. Since that “overall”analysis involved a large number of variables comparedto the number of participants, the overall analysis needsto be interpreted cautiously.
ResultsCorrelation Of Autism Severity ScalesAs shown in Table 4, the PDD-BI, ATEC, and SASscales were strongly correlated with one another, R =0.75-0.81, similar to the findings of a previous study[37].
Comparison of Neurotypical and Autism Groups withPublished Reference RangesReference ranges for the neurotypical children in thisstudy were calculated based on the 10th and 90th per-centiles of their distribution. This is more exact thanusing +/- two standard deviations if the data is not nor-mally distributed, which sometimes was the case. Thesecalculated reference ranges were compared with pub-lished reference ranges for vitamins (Table 5), minerals(Table 6), primary amino acids, and secondary aminoacids. Two primary sources were used for vitamins andminerals: 1) the National Health and Nutrition Examina-tion Survey (NHANES) National Report on BiochemicalIndicators of Diet and Nutrition in the US Population1999-2002 [38], and 2) the Tietz Textbook of ClinicalChemistry [39]; both are generally viewed as highlycredible sources for the US population. In some casesonly adult reference ranges are available from thosesources. Despite the differences in techniques and meth-odologies, the agreement with the NHANES referenceranges is very good, and the agreement with the Tietzreference ranges is reasonable, especially when compar-ing to pediatric values. The agreement with publishedreference ranges is a validation of our methodology andof our calculated reference range for neurotypical chil-dren, which we will compare with the autism group inthe next section. The advantage of having our ownreference range for neurotypical children is that it clo-sely matches the age, gender, and geographical area(Arizona) of our autism group.The amino acid reference ranges (10th and 90th per-
centiles) for the neurotypical group (present study) were
Table 4 Correlations of autism severity scales
Modified PDD-BI-Autism
ATEC SAS
Modified PDD-BI-AutismComposite
1
ATEC 0.81 1
SAS 0.78 0.75 1
Adams et al. Nutrition & Metabolism 2011, 8:34http://www.nutritionandmetabolism.com/content/8/1/34
Page 6 of 32
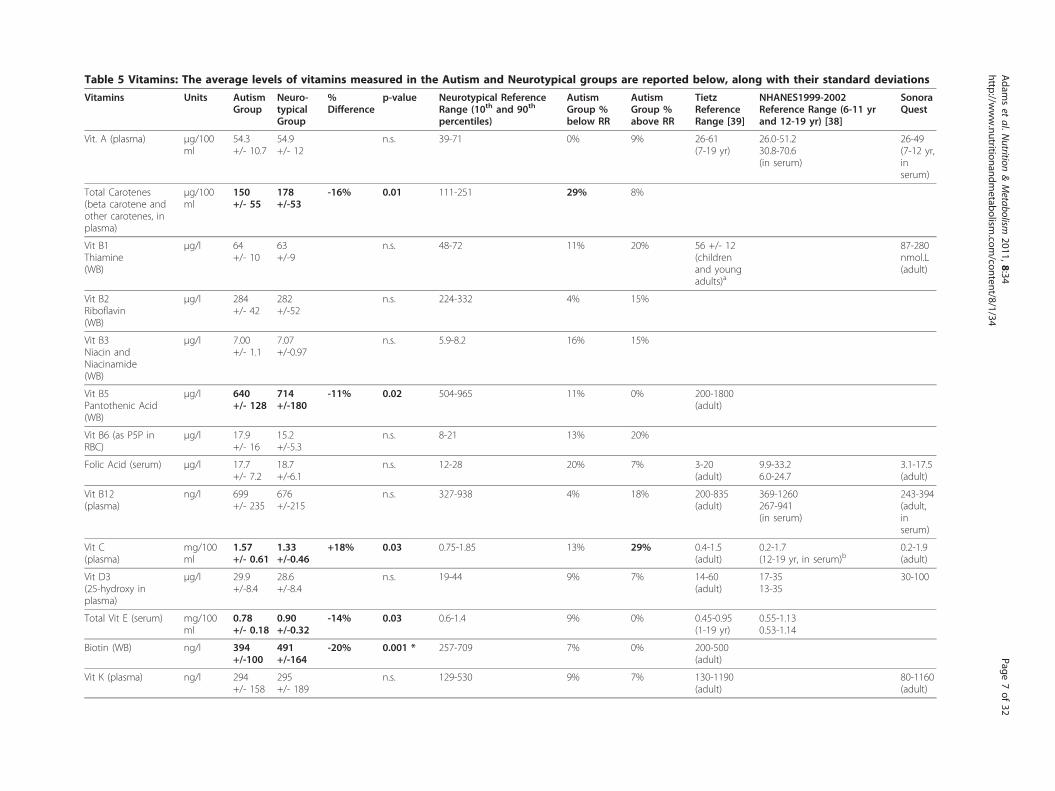
Table 5 Vitamins: The average levels of vitamins measured in the Autism and Neurotypical groups are reported below, along with their standard deviations
Vitamins Units AutismGroup
Neuro-typicalGroup
%Difference
p-value Neurotypical ReferenceRange (10th and 90th
percentiles)
AutismGroup %below RR
AutismGroup %above RR
TietzReferenceRange [39]
NHANES1999-2002Reference Range (6-11 yrand 12-19 yr) [38]
SonoraQuest
Vit. A (plasma) μg/100ml
54.3+/- 10.7
54.9+/- 12
n.s. 39-71 0% 9% 26-61(7-19 yr)
26.0-51.230.8-70.6(in serum)
26-49(7-12 yr,inserum)
Total Carotenes(beta carotene andother carotenes, inplasma)
μg/100ml
150+/- 55
178+/-53
-16% 0.01 111-251 29% 8%
Vit B1Thiamine(WB)
μg/l 64+/- 10
63+/-9
n.s. 48-72 11% 20% 56 +/- 12(childrenand youngadults)a
87-280nmol.L(adult)
Vit B2Riboflavin(WB)
μg/l 284+/- 42
282+/-52
n.s. 224-332 4% 15%
Vit B3Niacin andNiacinamide(WB)
μg/l 7.00+/- 1.1
7.07+/-0.97
n.s. 5.9-8.2 16% 15%
Vit B5Pantothenic Acid(WB)
μg/l 640+/- 128
714+/-180
-11% 0.02 504-965 11% 0% 200-1800(adult)
Vit B6 (as P5P inRBC)
μg/l 17.9+/- 16
15.2+/-5.3
n.s. 8-21 13% 20%
Folic Acid (serum) μg/l 17.7+/- 7.2
18.7+/-6.1
n.s. 12-28 20% 7% 3-20(adult)
9.9-33.26.0-24.7
3.1-17.5(adult)
Vit B12(plasma)
ng/l 699+/- 235
676+/-215
n.s. 327-938 4% 18% 200-835(adult)
369-1260267-941(in serum)
243-394(adult,inserum)
Vit C(plasma)
mg/100ml
1.57+/- 0.61
1.33+/-0.46
+18% 0.03 0.75-1.85 13% 29% 0.4-1.5(adult)
0.2-1.7(12-19 yr, in serum)b
0.2-1.9(adult)
Vit D3(25-hydroxy inplasma)
μg/l 29.9+/-8.4
28.6+/-8.4
n.s. 19-44 9% 7% 14-60(adult)
17-3513-35
30-100
Total Vit E (serum) mg/100ml
0.78+/- 0.18
0.90+/-0.32
-14% 0.03 0.6-1.4 9% 0% 0.45-0.95(1-19 yr)
0.55-1.130.53-1.14
Biotin (WB) ng/l 394+/-100
491+/-164
-20% 0.001 * 257-709 7% 0% 200-500(adult)
Vit K (plasma) ng/l 294+/- 158
295+/- 189
n.s. 129-530 9% 7% 130-1190(adult)
80-1160(adult)
Adam
set
al.Nutrition
&Metabolism
2011,8:34http://w
ww.nutritionandm
etabolism.com
/content/8/1/34Page
7of
32
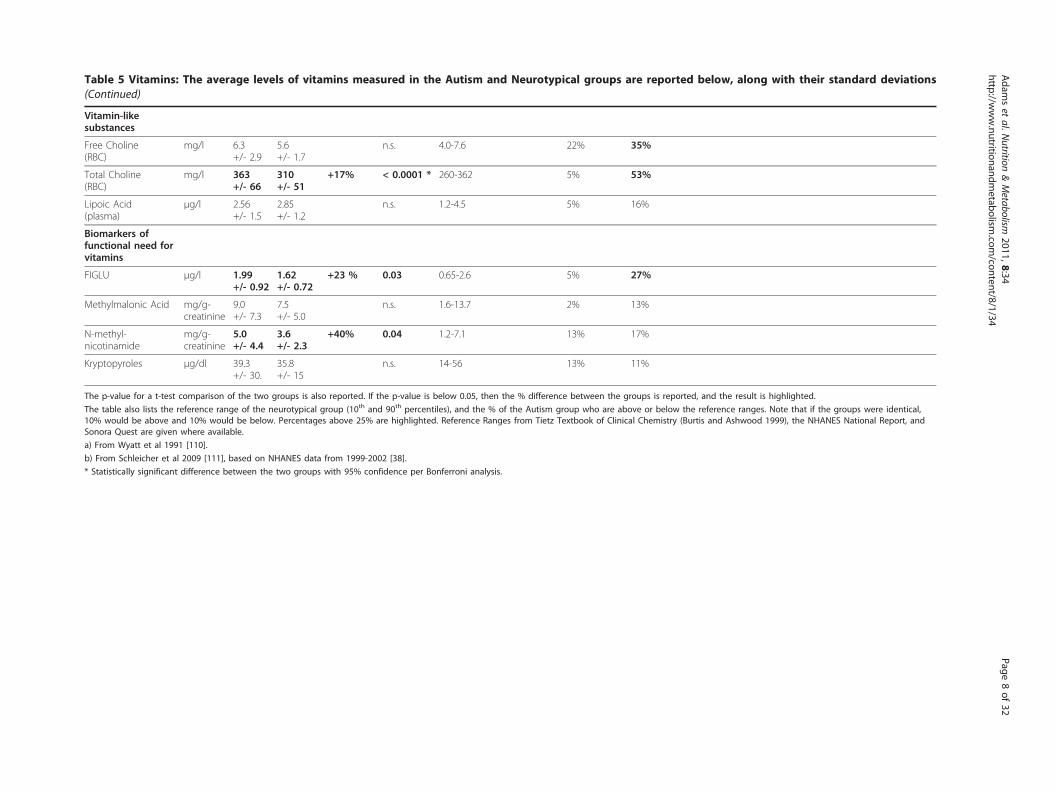
Table 5 Vitamins: The average levels of vitamins measured in the Autism and Neurotypical groups are reported below, along with their standard deviations(Continued)
Vitamin-likesubstances
Free Choline(RBC)
mg/l 6.3+/- 2.9
5.6+/- 1.7
n.s. 4.0-7.6 22% 35%
Total Choline(RBC)
mg/l 363+/- 66
310+/- 51
+17% < 0.0001 * 260-362 5% 53%
Lipoic Acid(plasma)
μg/l 2.56+/- 1.5
2.85+/- 1.2
n.s. 1.2-4.5 5% 16%
Biomarkers offunctional need forvitamins
FIGLU μg/l 1.99+/- 0.92
1.62+/- 0.72
+23 % 0.03 0.65-2.6 5% 27%
Methylmalonic Acid mg/g-creatinine
9.0+/- 7.3
7.5+/- 5.0
n.s. 1.6-13.7 2% 13%
N-methyl-nicotinamide
mg/g-creatinine
5.0+/- 4.4
3.6+/- 2.3
+40% 0.04 1.2-7.1 13% 17%
Kryptopyroles μg/dl 39.3+/- 30.
35.8+/- 15
n.s. 14-56 13% 11%
The p-value for a t-test comparison of the two groups is also reported. If the p-value is below 0.05, then the % difference between the groups is reported, and the result is highlighted.
The table also lists the reference range of the neurotypical group (10th and 90th percentiles), and the % of the Autism group who are above or below the reference ranges. Note that if the groups were identical,10% would be above and 10% would be below. Percentages above 25% are highlighted. Reference Ranges from Tietz Textbook of Clinical Chemistry (Burtis and Ashwood 1999), the NHANES National Report, andSonora Quest are given where available.
a) From Wyatt et al 1991 [110].
b) From Schleicher et al 2009 [111], based on NHANES data from 1999-2002 [38].
* Statistically significant difference between the two groups with 95% confidence per Bonferroni analysis.
Adam
set
al.Nutrition
&Metabolism
2011,8:34http://w
ww.nutritionandm
etabolism.com
/content/8/1/34Page
8of
32
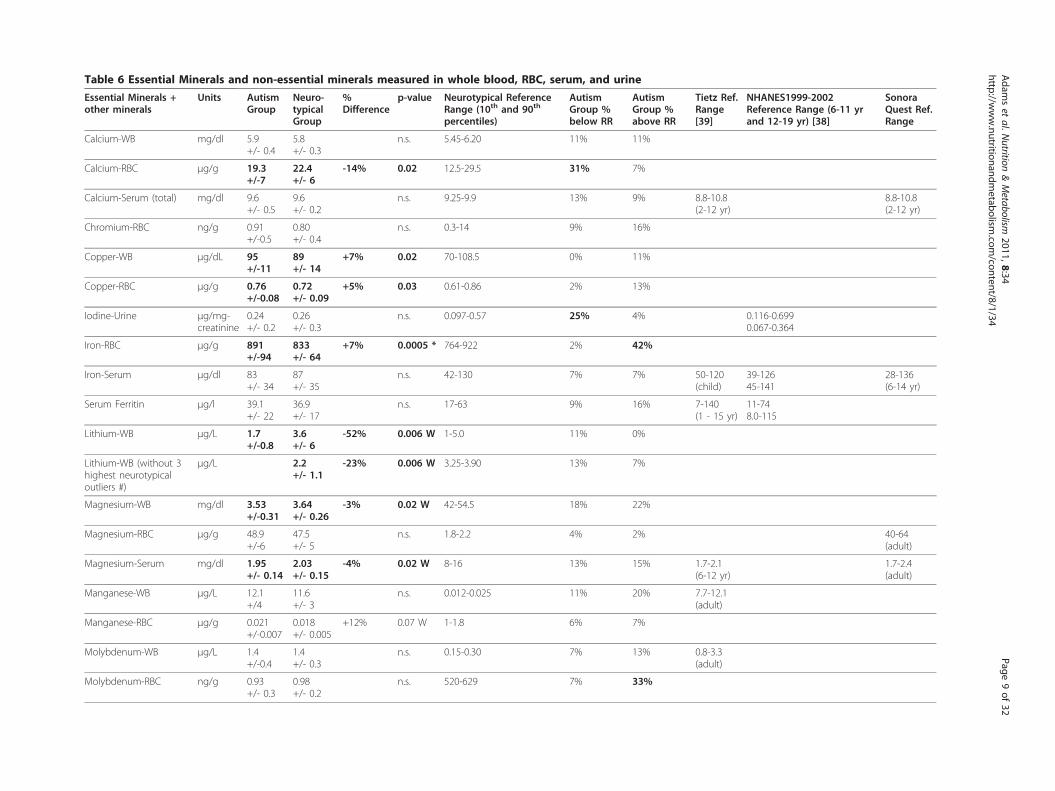
Table 6 Essential Minerals and non-essential minerals measured in whole blood, RBC, serum, and urine
Essential Minerals +other minerals
Units AutismGroup
Neuro-typicalGroup
%Difference
p-value Neurotypical ReferenceRange (10th and 90th
percentiles)
AutismGroup %below RR
AutismGroup %above RR
Tietz Ref.Range[39]
NHANES1999-2002Reference Range (6-11 yrand 12-19 yr) [38]
SonoraQuest Ref.Range
Calcium-WB mg/dl 5.9+/- 0.4
5.8+/- 0.3
n.s. 5.45-6.20 11% 11%
Calcium-RBC μg/g 19.3+/-7
22.4+/- 6
-14% 0.02 12.5-29.5 31% 7%
Calcium-Serum (total) mg/dl 9.6+/- 0.5
9.6+/- 0.2
n.s. 9.25-9.9 13% 9% 8.8-10.8(2-12 yr)
8.8-10.8(2-12 yr)
Chromium-RBC ng/g 0.91+/-0.5
0.80+/- 0.4
n.s. 0.3-14 9% 16%
Copper-WB μg/dL 95+/-11
89+/- 14
+7% 0.02 70-108.5 0% 11%
Copper-RBC μg/g 0.76+/-0.08
0.72+/- 0.09
+5% 0.03 0.61-0.86 2% 13%
Iodine-Urine μg/mg-creatinine
0.24+/- 0.2
0.26+/- 0.3
n.s. 0.097-0.57 25% 4% 0.116-0.6990.067-0.364
Iron-RBC μg/g 891+/-94
833+/- 64
+7% 0.0005 * 764-922 2% 42%
Iron-Serum μg/dl 83+/- 34
87+/- 35
n.s. 42-130 7% 7% 50-120(child)
39-12645-141
28-136(6-14 yr)
Serum Ferritin μg/l 39.1+/- 22
36.9+/- 17
n.s. 17-63 9% 16% 7-140(1 - 15 yr)
11-748.0-115
Lithium-WB μg/L 1.7+/-0.8
3.6+/- 6
-52% 0.006 W 1-5.0 11% 0%
Lithium-WB (without 3highest neurotypicaloutliers #)
μg/L 2.2+/- 1.1
-23% 0.006 W 3.25-3.90 13% 7%
Magnesium-WB mg/dl 3.53+/-0.31
3.64+/- 0.26
-3% 0.02 W 42-54.5 18% 22%
Magnesium-RBC μg/g 48.9+/-6
47.5+/- 5
n.s. 1.8-2.2 4% 2% 40-64(adult)
Magnesium-Serum mg/dl 1.95+/- 0.14
2.03+/- 0.15
-4% 0.02 W 8-16 13% 15% 1.7-2.1(6-12 yr)
1.7-2.4(adult)
Manganese-WB μg/L 12.1+/4
11.6+/- 3
n.s. 0.012-0.025 11% 20% 7.7-12.1(adult)
Manganese-RBC μg/g 0.021+/-0.007
0.018+/- 0.005
+12% 0.07 W 1-1.8 6% 7%
Molybdenum-WB μg/L 1.4+/-0.4
1.4+/- 0.3
n.s. 0.15-0.30 7% 13% 0.8-3.3(adult)
Molybdenum-RBC ng/g 0.93+/- 0.3
0.98+/- 0.2
n.s. 520-629 7% 33%
Adam
set
al.Nutrition
&Metabolism
2011,8:34http://w
ww.nutritionandm
etabolism.com
/content/8/1/34Page
9of
32
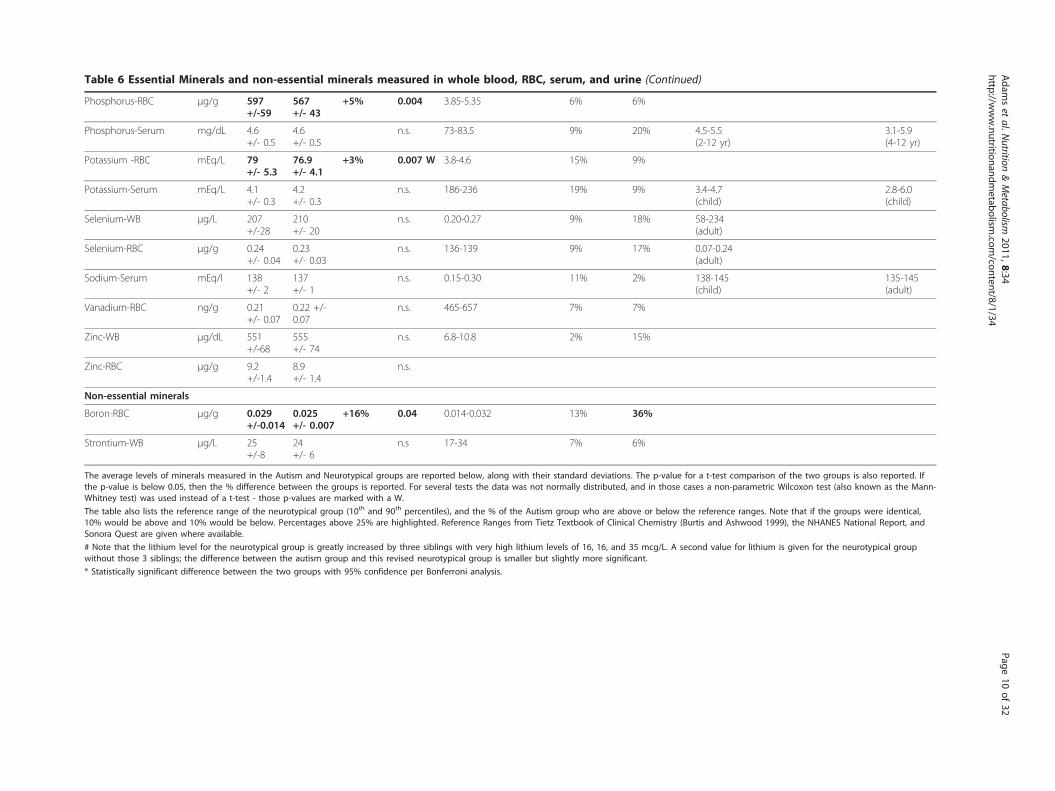
Table 6 Essential Minerals and non-essential minerals measured in whole blood, RBC, serum, and urine (Continued)
Phosphorus-RBC μg/g 597+/-59
567+/- 43
+5% 0.004 3.85-5.35 6% 6%
Phosphorus-Serum mg/dL 4.6+/- 0.5
4.6+/- 0.5
n.s. 73-83.5 9% 20% 4.5-5.5(2-12 yr)
3.1-5.9(4-12 yr)
Potassium -RBC mEq/L 79+/- 5.3
76.9+/- 4.1
+3% 0.007 W 3.8-4.6 15% 9%
Potassium-Serum mEq/L 4.1+/- 0.3
4.2+/- 0.3
n.s. 186-236 19% 9% 3.4-4.7(child)
2.8-6.0(child)
Selenium-WB μg/L 207+/-28
210+/- 20
n.s. 0.20-0.27 9% 18% 58-234(adult)
Selenium-RBC μg/g 0.24+/- 0.04
0.23+/- 0.03
n.s. 136-139 9% 17% 0.07-0.24(adult)
Sodium-Serum mEq/l 138+/- 2
137+/- 1
n.s. 0.15-0.30 11% 2% 138-145(child)
135-145(adult)
Vanadium-RBC ng/g 0.21+/- 0.07
0.22 +/-0.07
n.s. 465-657 7% 7%
Zinc-WB μg/dL 551+/-68
555+/- 74
n.s. 6.8-10.8 2% 15%
Zinc-RBC μg/g 9.2+/-1.4
8.9+/- 1.4
n.s.
Non-essential minerals
Boron-RBC μg/g 0.029+/-0.014
0.025+/- 0.007
+16% 0.04 0.014-0.032 13% 36%
Strontium-WB μg/L 25+/-8
24+/- 6
n.s 17-34 7% 6%
The average levels of minerals measured in the Autism and Neurotypical groups are reported below, along with their standard deviations. The p-value for a t-test comparison of the two groups is also reported. Ifthe p-value is below 0.05, then the % difference between the groups is reported. For several tests the data was not normally distributed, and in those cases a non-parametric Wilcoxon test (also known as the Mann-Whitney test) was used instead of a t-test - those p-values are marked with a W.
The table also lists the reference range of the neurotypical group (10th and 90th percentiles), and the % of the Autism group who are above or below the reference ranges. Note that if the groups were identical,10% would be above and 10% would be below. Percentages above 25% are highlighted. Reference Ranges from Tietz Textbook of Clinical Chemistry (Burtis and Ashwood 1999), the NHANES National Report, andSonora Quest are given where available.
# Note that the lithium level for the neurotypical group is greatly increased by three siblings with very high lithium levels of 16, 16, and 35 mcg/L. A second value for lithium is given for the neurotypical groupwithout those 3 siblings; the difference between the autism group and this revised neurotypical group is smaller but slightly more significant.
* Statistically significant difference between the two groups with 95% confidence per Bonferroni analysis.
Adam
set
al.Nutrition
&Metabolism
2011,8:34http://w
ww.nutritionandm
etabolism.com
/content/8/1/34Page
10of
32
compared with pediatric reference ranges by Lepage etal [33] and (where available) with values from the TietzTextbook of Clinical Chemistry [39]. For Lepage et al[33], two reference ranges are listed, one for 6 year oldsand one for 16 year olds. In most cases the values fromthe present study are in reasonable agreement with thepublished values.For the autism group, the average (mean) levels of
their vitamins, minerals, and most amino acids werewithin the published reference ranges (where available).However, as will be discussed below, a t-test comparisonof the levels of vitamins, minerals, amino acids, andother biomarkers in the autism group and the neuroty-pical group revealed many significant differences.
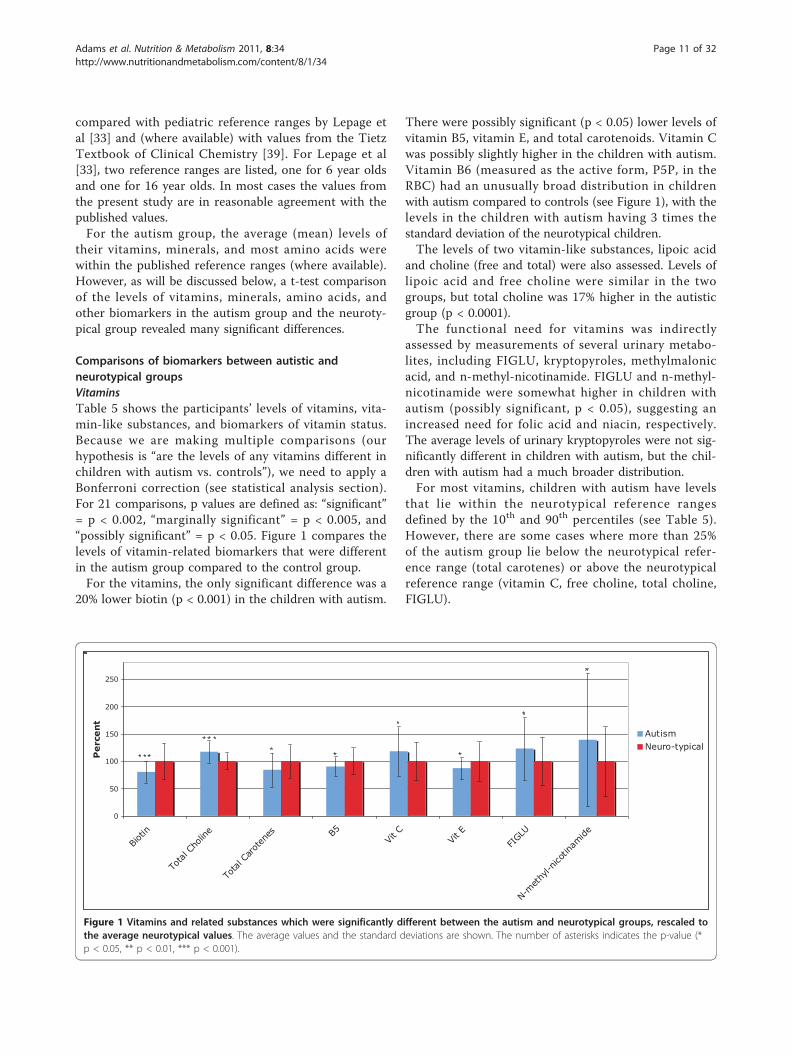
Comparisons of biomarkers between autistic andneurotypical groupsVitaminsTable 5 shows the participants’ levels of vitamins, vita-min-like substances, and biomarkers of vitamin status.Because we are making multiple comparisons (ourhypothesis is “are the levels of any vitamins different inchildren with autism vs. controls”), we need to apply aBonferroni correction (see statistical analysis section).For 21 comparisons, p values are defined as: “significant”= p < 0.002, “marginally significant” = p < 0.005, and“possibly significant” = p < 0.05. Figure 1 compares thelevels of vitamin-related biomarkers that were differentin the autism group compared to the control group.For the vitamins, the only significant difference was a
20% lower biotin (p < 0.001) in the children with autism.
There were possibly significant (p < 0.05) lower levels ofvitamin B5, vitamin E, and total carotenoids. Vitamin Cwas possibly slightly higher in the children with autism.Vitamin B6 (measured as the active form, P5P, in theRBC) had an unusually broad distribution in childrenwith autism compared to controls (see Figure 1), with thelevels in the children with autism having 3 times thestandard deviation of the neurotypical children.The levels of two vitamin-like substances, lipoic acid
and choline (free and total) were also assessed. Levels oflipoic acid and free choline were similar in the twogroups, but total choline was 17% higher in the autisticgroup (p < 0.0001).The functional need for vitamins was indirectly
assessed by measurements of several urinary metabo-lites, including FIGLU, kryptopyroles, methylmalonicacid, and n-methyl-nicotinamide. FIGLU and n-methyl-nicotinamide were somewhat higher in children withautism (possibly significant, p < 0.05), suggesting anincreased need for folic acid and niacin, respectively.The average levels of urinary kryptopyroles were not sig-nificantly different in children with autism, but the chil-dren with autism had a much broader distribution.For most vitamins, children with autism have levels
that lie within the neurotypical reference rangesdefined by the 10th and 90th percentiles (see Table 5).However, there are some cases where more than 25%of the autism group lie below the neurotypical refer-ence range (total carotenes) or above the neurotypicalreference range (vitamin C, free choline, total choline,FIGLU).
0
50
100
150
200
250
Biotin
Tota
l Cho
line
Tota
l Car
oten
es B5Vit
CVit
EFI
GLU
N-met
hyl-n
icotin
amide
Perce
nt AutismNeuro-typical
Figure 1 Vitamins and related substances which were significantly different between the autism and neurotypical groups, rescaled tothe average neurotypical values. The average values and the standard deviations are shown. The number of asterisks indicates the p-value (*p < 0.05, ** p < 0.01, *** p < 0.001).
Adams et al. Nutrition & Metabolism 2011, 8:34http://www.nutritionandmetabolism.com/content/8/1/34
Page 11 of 32
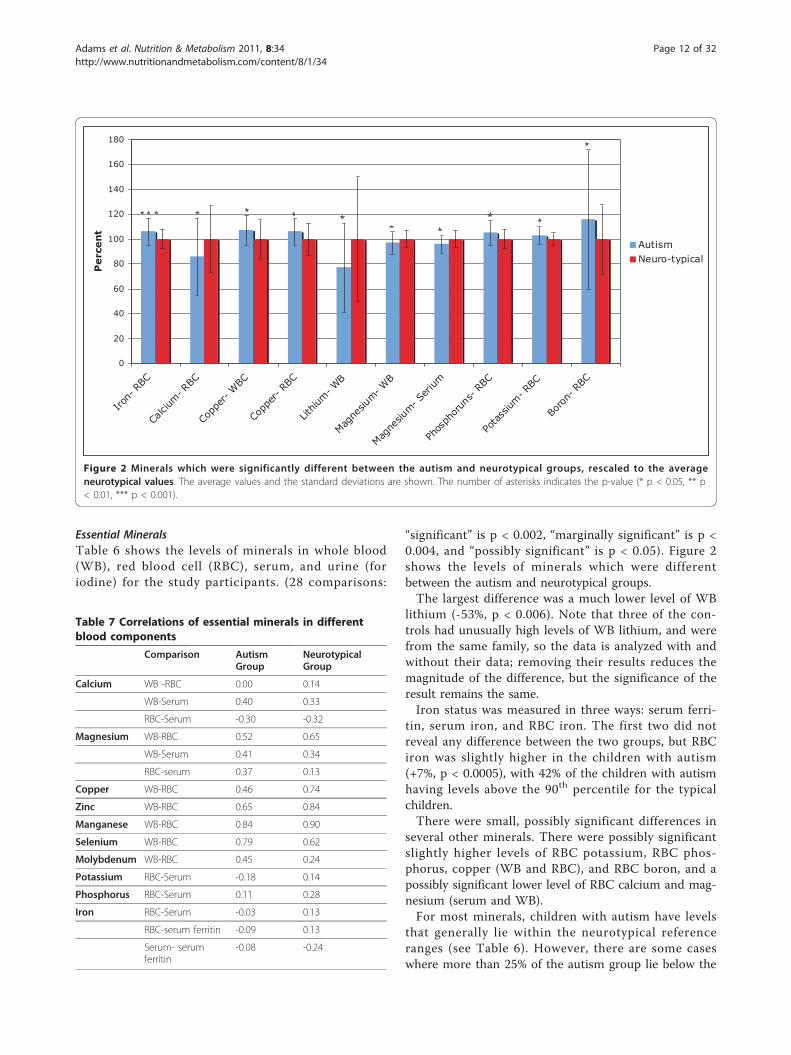
Essential MineralsTable 6 shows the levels of minerals in whole blood(WB), red blood cell (RBC), serum, and urine (foriodine) for the study participants. (28 comparisons:
“significant” is p < 0.002, “marginally significant” is p <0.004, and “possibly significant” is p < 0.05). Figure 2shows the levels of minerals which were differentbetween the autism and neurotypical groups.The largest difference was a much lower level of WB
lithium (-53%, p < 0.006). Note that three of the con-trols had unusually high levels of WB lithium, and werefrom the same family, so the data is analyzed with andwithout their data; removing their results reduces themagnitude of the difference, but the significance of theresult remains the same.Iron status was measured in three ways: serum ferri-
tin, serum iron, and RBC iron. The first two did notreveal any difference between the two groups, but RBCiron was slightly higher in the children with autism(+7%, p < 0.0005), with 42% of the children with autismhaving levels above the 90th percentile for the typicalchildren.There were small, possibly significant differences in
several other minerals. There were possibly significantslightly higher levels of RBC potassium, RBC phos-phorus, copper (WB and RBC), and RBC boron, and apossibly significant lower level of RBC calcium and mag-nesium (serum and WB).For most minerals, children with autism have levels
that generally lie within the neurotypical referenceranges (see Table 6). However, there are some caseswhere more than 25% of the autism group lie below the
0
20
40
60
80
100
120
140
160
180
Iron-
RBC
Calci
um- R
BC
Copp
er- W
BC
Copp
er- R
BC
Lithiu
m- W
B
Magne
sium- W
B
Magne
sium- S
erium
Phos
phor
uns-
RBC
Pota
ssium
- RBC
Boro
n- R
BC
Perce
nt
AutismNeuro-typical
Figure 2 Minerals which were significantly different between the autism and neurotypical groups, rescaled to the averageneurotypical values. The average values and the standard deviations are shown. The number of asterisks indicates the p-value (* p < 0.05, ** p< 0.01, *** p < 0.001).
Table 7 Correlations of essential minerals in differentblood components
Comparison AutismGroup
NeurotypicalGroup
Calcium WB -RBC 0.00 0.14
WB-Serum 0.40 0.33
RBC-Serum -0.30 -0.32
Magnesium WB-RBC 0.52 0.65
WB-Serum 0.41 0.34
RBC-serum 0.37 0.13
Copper WB-RBC 0.46 0.74
Zinc WB-RBC 0.65 0.84
Manganese WB-RBC 0.84 0.90
Selenium WB-RBC 0.79 0.62
Molybdenum WB-RBC 0.45 0.24
Potassium RBC-Serum -0.18 0.14
Phosphorus RBC-Serum 0.11 0.28
Iron RBC-Serum -0.03 0.13
RBC-serum ferritin -0.09 0.13
Serum- serumferritin
-0.08 -0.24
Adams et al. Nutrition & Metabolism 2011, 8:34http://www.nutritionandmetabolism.com/content/8/1/34
Page 12 of 32
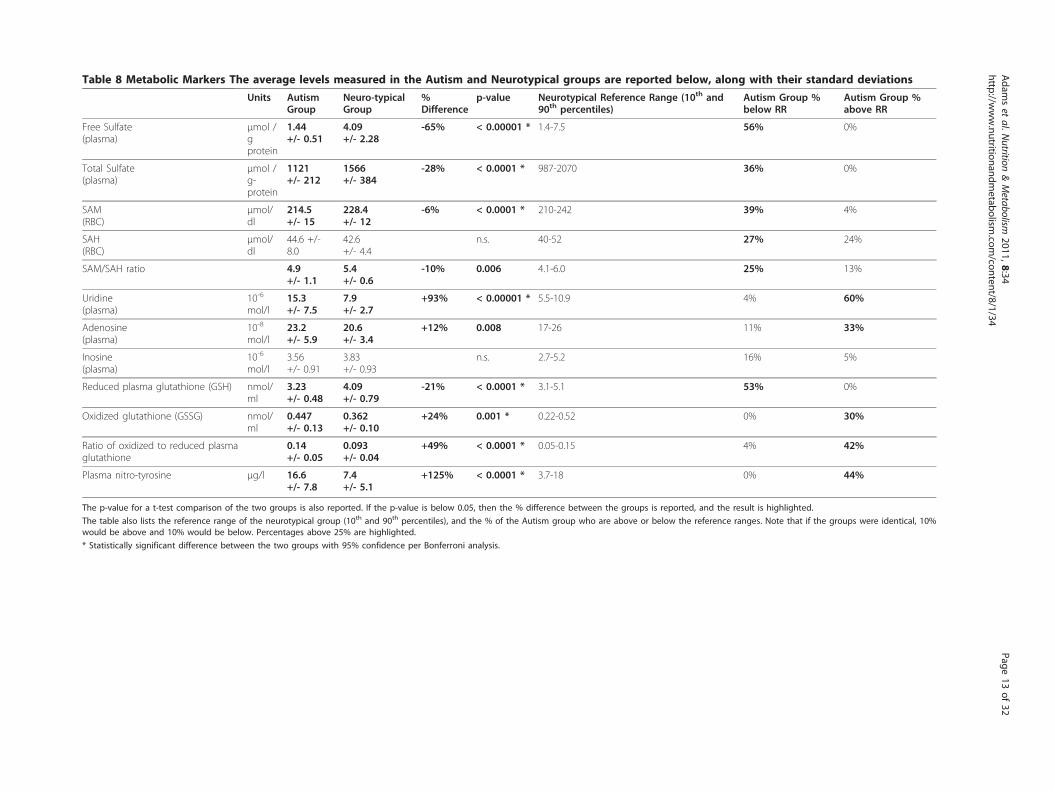
Table 8 Metabolic Markers The average levels measured in the Autism and Neurotypical groups are reported below, along with their standard deviations
Units AutismGroup
Neuro-typicalGroup
%Difference
p-value Neurotypical Reference Range (10th and90th percentiles)
Autism Group %below RR
Autism Group %above RR
Free Sulfate(plasma)
μmol /gprotein
1.44+/- 0.51
4.09+/- 2.28
-65% < 0.00001 * 1.4-7.5 56% 0%
Total Sulfate(plasma)
μmol /g-protein
1121+/- 212
1566+/- 384
-28% < 0.0001 * 987-2070 36% 0%
SAM(RBC)
μmol/dl
214.5+/- 15
228.4+/- 12
-6% < 0.0001 * 210-242 39% 4%
SAH(RBC)
μmol/dl
44.6 +/-8.0
42.6+/- 4.4
n.s. 40-52 27% 24%
SAM/SAH ratio 4.9+/- 1.1
5.4+/- 0.6
-10% 0.006 4.1-6.0 25% 13%
Uridine(plasma)
10-6
mol/l15.3+/- 7.5
7.9+/- 2.7
+93% < 0.00001 * 5.5-10.9 4% 60%
Adenosine(plasma)
10-8
mol/l23.2+/- 5.9
20.6+/- 3.4
+12% 0.008 17-26 11% 33%
Inosine(plasma)
10-6
mol/l3.56+/- 0.91
3.83+/- 0.93
n.s. 2.7-5.2 16% 5%
Reduced plasma glutathione (GSH) nmol/ml
3.23+/- 0.48
4.09+/- 0.79
-21% < 0.0001 * 3.1-5.1 53% 0%
Oxidized glutathione (GSSG) nmol/ml
0.447+/- 0.13
0.362+/- 0.10
+24% 0.001 * 0.22-0.52 0% 30%
Ratio of oxidized to reduced plasmaglutathione
0.14+/- 0.05
0.093+/- 0.04
+49% < 0.0001 * 0.05-0.15 4% 42%
Plasma nitro-tyrosine μg/l 16.6+/- 7.8
7.4+/- 5.1
+125% < 0.0001 * 3.7-18 0% 44%
The p-value for a t-test comparison of the two groups is also reported. If the p-value is below 0.05, then the % difference between the groups is reported, and the result is highlighted.
The table also lists the reference range of the neurotypical group (10th and 90th percentiles), and the % of the Autism group who are above or below the reference ranges. Note that if the groups were identical, 10%would be above and 10% would be below. Percentages above 25% are highlighted.
* Statistically significant difference between the two groups with 95% confidence per Bonferroni analysis.
Adam
set
al.Nutrition
&Metabolism
2011,8:34http://w
ww.nutritionandm
etabolism.com
/content/8/1/34Page
13of
32
neurotypical reference range (urinary iodine, RBC cal-cium) or above the neurotypical reference range (RBCiron, RBC phosphorus, RBC boron).We also investigated the correlations of levels of
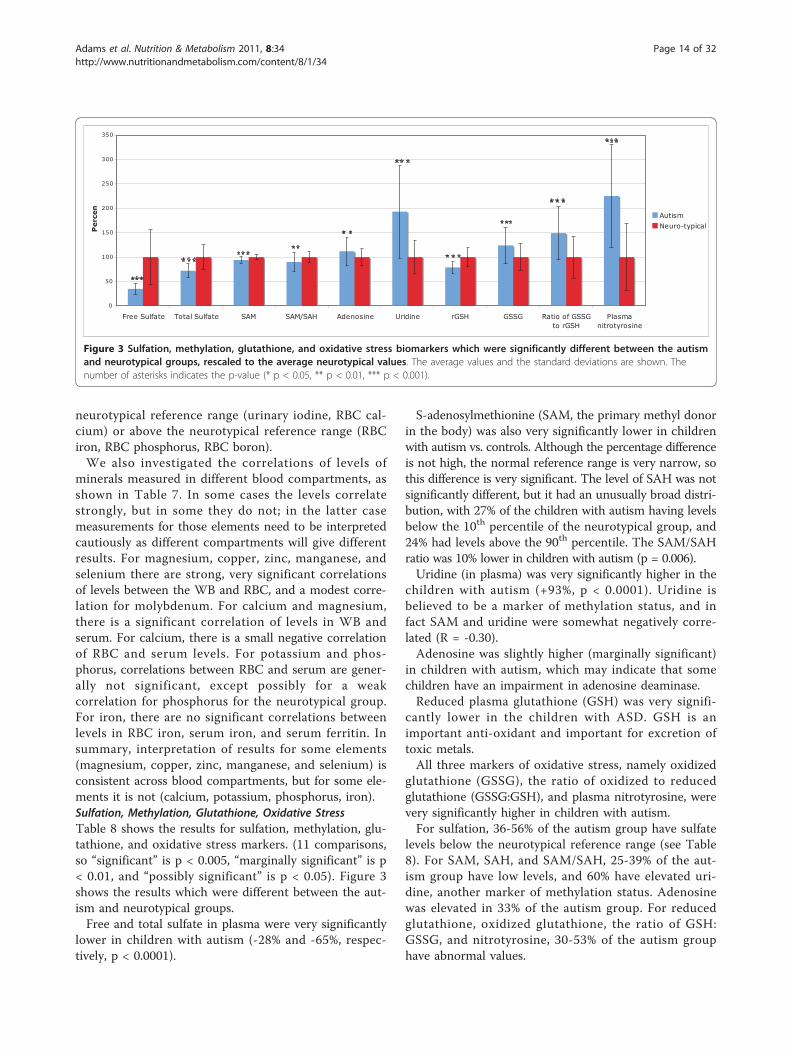
minerals measured in different blood compartments, asshown in Table 7. In some cases the levels correlatestrongly, but in some they do not; in the latter casemeasurements for those elements need to be interpretedcautiously as different compartments will give differentresults. For magnesium, copper, zinc, manganese, andselenium there are strong, very significant correlationsof levels between the WB and RBC, and a modest corre-lation for molybdenum. For calcium and magnesium,there is a significant correlation of levels in WB andserum. For calcium, there is a small negative correlationof RBC and serum levels. For potassium and phos-phorus, correlations between RBC and serum are gener-ally not significant, except possibly for a weakcorrelation for phosphorus for the neurotypical group.For iron, there are no significant correlations betweenlevels in RBC iron, serum iron, and serum ferritin. Insummary, interpretation of results for some elements(magnesium, copper, zinc, manganese, and selenium) isconsistent across blood compartments, but for some ele-ments it is not (calcium, potassium, phosphorus, iron).Sulfation, Methylation, Glutathione, Oxidative StressTable 8 shows the results for sulfation, methylation, glu-tathione, and oxidative stress markers. (11 comparisons,so “significant” is p < 0.005, “marginally significant” is p< 0.01, and “possibly significant” is p < 0.05). Figure 3shows the results which were different between the aut-ism and neurotypical groups.Free and total sulfate in plasma were very significantly
lower in children with autism (-28% and -65%, respec-tively, p < 0.0001).
S-adenosylmethionine (SAM, the primary methyl donorin the body) was also very significantly lower in childrenwith autism vs. controls. Although the percentage differenceis not high, the normal reference range is very narrow, sothis difference is very significant. The level of SAH was notsignificantly different, but it had an unusually broad distri-bution, with 27% of the children with autism having levelsbelow the 10th percentile of the neurotypical group, and24% had levels above the 90th percentile. The SAM/SAHratio was 10% lower in children with autism (p = 0.006).Uridine (in plasma) was very significantly higher in the
children with autism (+93%, p < 0.0001). Uridine isbelieved to be a marker of methylation status, and infact SAM and uridine were somewhat negatively corre-lated (R = -0.30).Adenosine was slightly higher (marginally significant)
in children with autism, which may indicate that somechildren have an impairment in adenosine deaminase.Reduced plasma glutathione (GSH) was very signifi-
cantly lower in the children with ASD. GSH is animportant anti-oxidant and important for excretion oftoxic metals.All three markers of oxidative stress, namely oxidized
glutathione (GSSG), the ratio of oxidized to reducedglutathione (GSSG:GSH), and plasma nitrotyrosine, werevery significantly higher in children with autism.For sulfation, 36-56% of the autism group have sulfate
levels below the neurotypical reference range (see Table8). For SAM, SAH, and SAM/SAH, 25-39% of the aut-ism group have low levels, and 60% have elevated uri-dine, another marker of methylation status. Adenosinewas elevated in 33% of the autism group. For reducedglutathione, oxidized glutathione, the ratio of GSH:GSSG, and nitrotyrosine, 30-53% of the autism grouphave abnormal values.
0
50
100
150
200
250
300
350
Free Sulfate Total Sulfate SAM SAM/SAH Adenosine Uridine rGSH GSSG Ratio of GSSGto rGSH
Plasmanitrotyrosine
Percen
AutismNeuro-typical
Figure 3 Sulfation, methylation, glutathione, and oxidative stress biomarkers which were significantly different between the autismand neurotypical groups, rescaled to the average neurotypical values. The average values and the standard deviations are shown. Thenumber of asterisks indicates the p-value (* p < 0.05, ** p < 0.01, *** p < 0.001).
Adams et al. Nutrition & Metabolism 2011, 8:34http://www.nutritionandmetabolism.com/content/8/1/34
Page 14 of 32
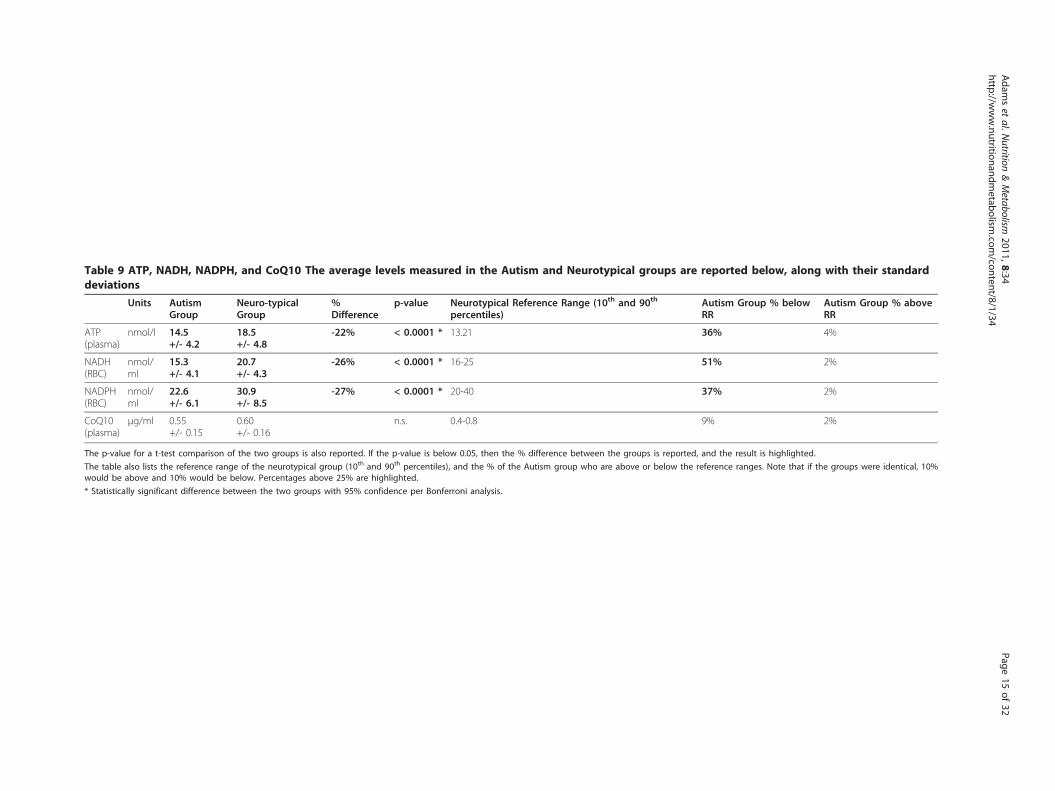
Table 9 ATP, NADH, NADPH, and CoQ10 The average levels measured in the Autism and Neurotypical groups are reported below, along with their standarddeviations
Units AutismGroup
Neuro-typicalGroup
%Difference
p-value Neurotypical Reference Range (10th and 90th
percentiles)Autism Group % belowRR
Autism Group % aboveRR
ATP(plasma)
nmol/l 14.5+/- 4.2
18.5+/- 4.8
-22% < 0.0001 * 13.21 36% 4%
NADH(RBC)
nmol/ml
15.3+/- 4.1
20.7+/- 4.3
-26% < 0.0001 * 16-25 51% 2%
NADPH(RBC)
nmol/ml
22.6+/- 6.1
30.9+/- 8.5
-27% < 0.0001 * 20-40 37% 2%
CoQ10(plasma)
μg/ml 0.55+/- 0.15
0.60+/- 0.16
n.s. 0.4-0.8 9% 2%
The p-value for a t-test comparison of the two groups is also reported. If the p-value is below 0.05, then the % difference between the groups is reported, and the result is highlighted.
The table also lists the reference range of the neurotypical group (10th and 90th percentiles), and the % of the Autism group who are above or below the reference ranges. Note that if the groups were identical, 10%would be above and 10% would be below. Percentages above 25% are highlighted.
* Statistically significant difference between the two groups with 95% confidence per Bonferroni analysis.
Adam
set
al.Nutrition
&Metabolism
2011,8:34http://w
ww.nutritionandm
etabolism.com
/content/8/1/34Page
15of
32
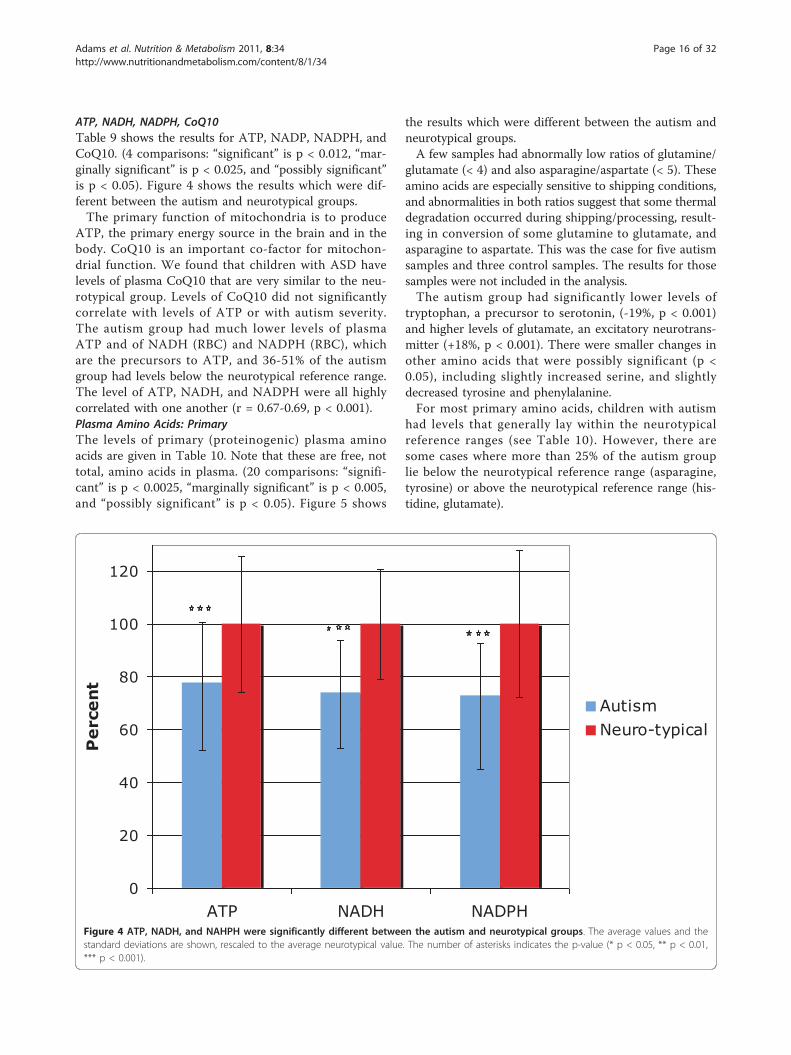
ATP, NADH, NADPH, CoQ10Table 9 shows the results for ATP, NADP, NADPH, andCoQ10. (4 comparisons: “significant” is p < 0.012, “mar-ginally significant” is p < 0.025, and “possibly significant”is p < 0.05). Figure 4 shows the results which were dif-ferent between the autism and neurotypical groups.The primary function of mitochondria is to produce
ATP, the primary energy source in the brain and in thebody. CoQ10 is an important co-factor for mitochon-drial function. We found that children with ASD havelevels of plasma CoQ10 that are very similar to the neu-rotypical group. Levels of CoQ10 did not significantlycorrelate with levels of ATP or with autism severity.The autism group had much lower levels of plasmaATP and of NADH (RBC) and NADPH (RBC), whichare the precursors to ATP, and 36-51% of the autismgroup had levels below the neurotypical reference range.The level of ATP, NADH, and NADPH were all highlycorrelated with one another (r = 0.67-0.69, p < 0.001).Plasma Amino Acids: PrimaryThe levels of primary (proteinogenic) plasma aminoacids are given in Table 10. Note that these are free, nottotal, amino acids in plasma. (20 comparisons: “signifi-cant” is p < 0.0025, “marginally significant” is p < 0.005,and “possibly significant” is p < 0.05). Figure 5 shows
the results which were different between the autism andneurotypical groups.A few samples had abnormally low ratios of glutamine/
glutamate (< 4) and also asparagine/aspartate (< 5). Theseamino acids are especially sensitive to shipping conditions,and abnormalities in both ratios suggest that some thermaldegradation occurred during shipping/processing, result-ing in conversion of some glutamine to glutamate, andasparagine to aspartate. This was the case for five autismsamples and three control samples. The results for thosesamples were not included in the analysis.The autism group had significantly lower levels of
tryptophan, a precursor to serotonin, (-19%, p < 0.001)and higher levels of glutamate, an excitatory neurotrans-mitter (+18%, p < 0.001). There were smaller changes inother amino acids that were possibly significant (p <0.05), including slightly increased serine, and slightlydecreased tyrosine and phenylalanine.For most primary amino acids, children with autism
had levels that generally lay within the neurotypicalreference ranges (see Table 10). However, there aresome cases where more than 25% of the autism grouplie below the neurotypical reference range (asparagine,tyrosine) or above the neurotypical reference range (his-tidine, glutamate).
0
20
40
60
80
100
120
ATP NADH NADPH
Perce
nt
AutismNeuro-typical
Figure 4 ATP, NADH, and NAHPH were significantly different between the autism and neurotypical groups. The average values and thestandard deviations are shown, rescaled to the average neurotypical value. The number of asterisks indicates the p-value (* p < 0.05, ** p < 0.01,*** p < 0.001).
Adams et al. Nutrition & Metabolism 2011, 8:34http://www.nutritionandmetabolism.com/content/8/1/34
Page 16 of 32
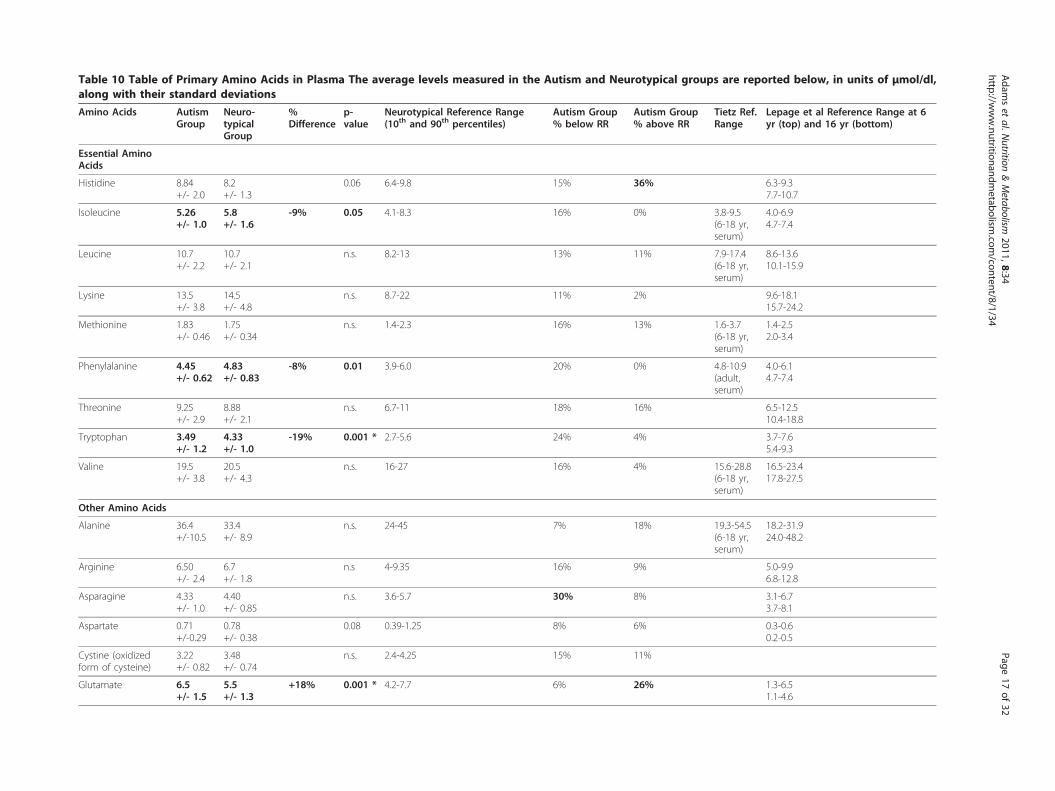
Table 10 Table of Primary Amino Acids in Plasma The average levels measured in the Autism and Neurotypical groups are reported below, in units of μmol/dl,along with their standard deviations
Amino Acids AutismGroup
Neuro-typicalGroup
%Difference
p-value
Neurotypical Reference Range(10th and 90th percentiles)
Autism Group% below RR
Autism Group% above RR
Tietz Ref.Range
Lepage et al Reference Range at 6yr (top) and 16 yr (bottom)
Essential AminoAcids
Histidine 8.84+/- 2.0
8.2+/- 1.3
0.06 6.4-9.8 15% 36% 6.3-9.37.7-10.7
Isoleucine 5.26+/- 1.0
5.8+/- 1.6
-9% 0.05 4.1-8.3 16% 0% 3.8-9.5(6-18 yr,serum)
4.0-6.94.7-7.4
Leucine 10.7+/- 2.2
10.7+/- 2.1
n.s. 8.2-13 13% 11% 7.9-17.4(6-18 yr,serum)
8.6-13.610.1-15.9
Lysine 13.5+/- 3.8
14.5+/- 4.8
n.s. 8.7-22 11% 2% 9.6-18.115.7-24.2
Methionine 1.83+/- 0.46
1.75+/- 0.34
n.s. 1.4-2.3 16% 13% 1.6-3.7(6-18 yr,serum)
1.4-2.52.0-3.4
Phenylalanine 4.45+/- 0.62
4.83+/- 0.83
-8% 0.01 3.9-6.0 20% 0% 4.8-10.9(adult,serum)
4.0-6.14.7-7.4
Threonine 9.25+/- 2.9
8.88+/- 2.1
n.s. 6.7-11 18% 16% 6.5-12.510.4-18.8
Tryptophan 3.49+/- 1.2
4.33+/- 1.0
-19% 0.001 * 2.7-5.6 24% 4% 3.7-7.65.4-9.3
Valine 19.5+/- 3.8
20.5+/- 4.3
n.s. 16-27 16% 4% 15.6-28.8(6-18 yr,serum)
16.5-23.417.8-27.5
Other Amino Acids
Alanine 36.4+/-10.5
33.4+/- 8.9
n.s. 24-45 7% 18% 19.3-54.5(6-18 yr,serum)
18.2-31.924.0-48.2
Arginine 6.50+/- 2.4
6.7+/- 1.8
n.s 4-9.35 16% 9% 5.0-9.96.8-12.8
Asparagine 4.33+/- 1.0
4.40+/- 0.85
n.s. 3.6-5.7 30% 8% 3.1-6.73.7-8.1
Aspartate 0.71+/-0.29
0.78+/- 0.38
0.08 0.39-1.25 8% 6% 0.3-0.60.2-0.5
Cystine (oxidizedform of cysteine)
3.22+/- 0.82
3.48+/- 0.74
n.s. 2.4-4.25 15% 11%
Glutamate 6.5+/- 1.5
5.5+/- 1.3
+18% 0.001 * 4.2-7.7 6% 26% 1.3-6.51.1-4.6
Adam
set
al.Nutrition
&Metabolism
2011,8:34http://w
ww.nutritionandm
etabolism.com
/content/8/1/34Page
17of
32
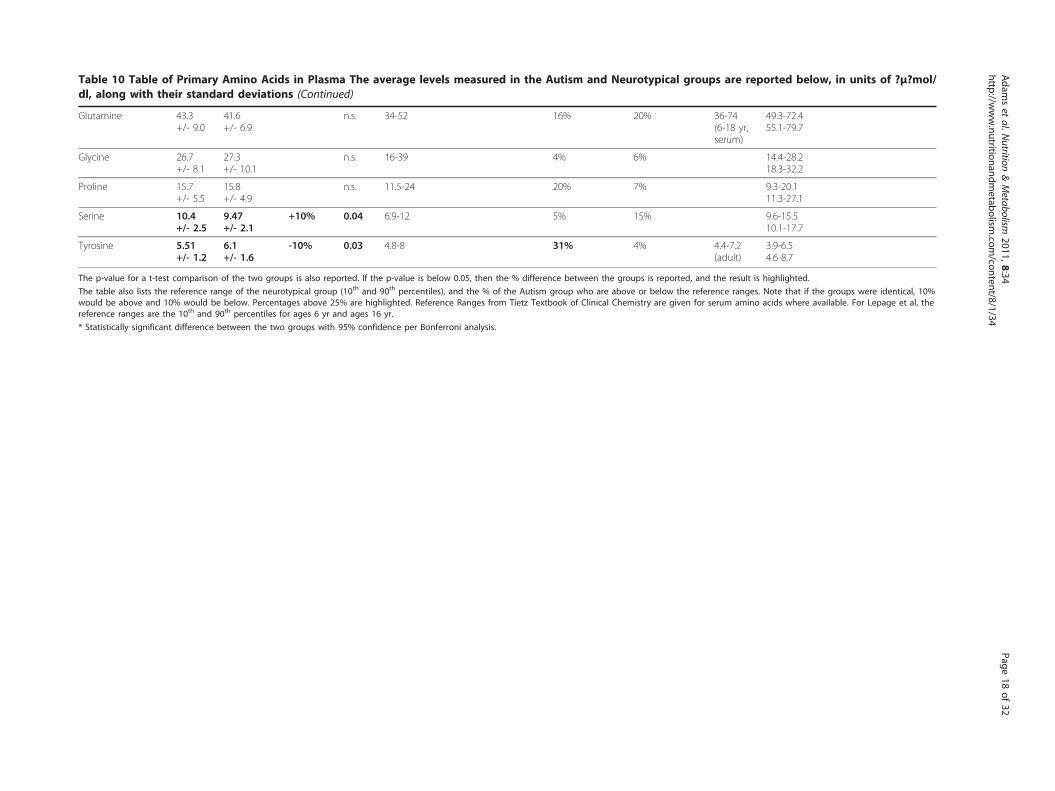
Table 10 Table of Primary Amino Acids in Plasma The average levels measured in the Autism and Neurotypical groups are reported below, in units of ?μ?mol/dl, along with their standard deviations (Continued)
Glutamine 43.3+/- 9.0
41.6+/- 6.9
n.s. 34-52 16% 20% 36-74(6-18 yr,serum)
49.3-72.455.1-79.7
Glycine 26.7+/- 8.1
27.3+/- 10.1
n.s. 16-39 4% 6% 14.4-28.218.3-32.2
Proline 15.7+/- 5.5
15.8+/- 4.9
n.s. 11.5-24 20% 7% 9.3-20.111.3-27.1
Serine 10.4+/- 2.5
9.47+/- 2.1
+10% 0.04 6.9-12 5% 15% 9.6-15.510.1-17.7
Tyrosine 5.51+/- 1.2
6.1+/- 1.6
-10% 0.03 4.8-8 31% 4% 4.4-7.2(adult)
3.9-6.54.6-8.7
The p-value for a t-test comparison of the two groups is also reported. If the p-value is below 0.05, then the % difference between the groups is reported, and the result is highlighted.
The table also lists the reference range of the neurotypical group (10th and 90th percentiles), and the % of the Autism group who are above or below the reference ranges. Note that if the groups were identical, 10%would be above and 10% would be below. Percentages above 25% are highlighted. Reference Ranges from Tietz Textbook of Clinical Chemistry are given for serum amino acids where available. For Lepage et al, thereference ranges are the 10th and 90th percentiles for ages 6 yr and ages 16 yr.
* Statistically significant difference between the two groups with 95% confidence per Bonferroni analysis.
Adam
set
al.Nutrition
&Metabolism
2011,8:34http://w
ww.nutritionandm
etabolism.com
/content/8/1/34Page
18of
32
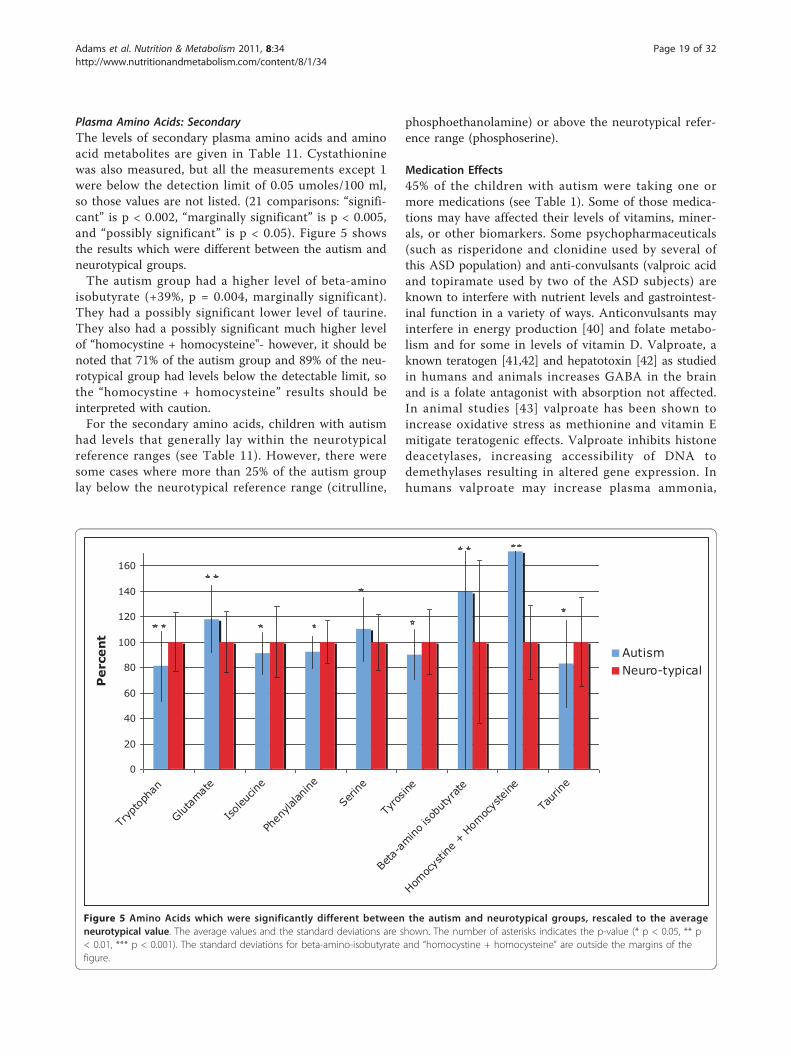
Plasma Amino Acids: SecondaryThe levels of secondary plasma amino acids and aminoacid metabolites are given in Table 11. Cystathioninewas also measured, but all the measurements except 1were below the detection limit of 0.05 umoles/100 ml,so those values are not listed. (21 comparisons: “signifi-cant” is p < 0.002, “marginally significant” is p < 0.005,and “possibly significant” is p < 0.05). Figure 5 showsthe results which were different between the autism andneurotypical groups.The autism group had a higher level of beta-amino
isobutyrate (+39%, p = 0.004, marginally significant).They had a possibly significant lower level of taurine.They also had a possibly significant much higher levelof “homocystine + homocysteine"- however, it should benoted that 71% of the autism group and 89% of the neu-rotypical group had levels below the detectable limit, sothe “homocystine + homocysteine” results should beinterpreted with caution.For the secondary amino acids, children with autism
had levels that generally lay within the neurotypicalreference ranges (see Table 11). However, there weresome cases where more than 25% of the autism grouplay below the neurotypical reference range (citrulline,
phosphoethanolamine) or above the neurotypical refer-ence range (phosphoserine).
Medication Effects45% of the children with autism were taking one ormore medications (see Table 1). Some of those medica-tions may have affected their levels of vitamins, miner-als, or other biomarkers. Some psychopharmaceuticals(such as risperidone and clonidine used by several ofthis ASD population) and anti-convulsants (valproic acidand topiramate used by two of the ASD subjects) areknown to interfere with nutrient levels and gastrointest-inal function in a variety of ways. Anticonvulsants mayinterfere in energy production [40] and folate metabo-lism and for some in levels of vitamin D. Valproate, aknown teratogen [41,42] and hepatotoxin [42] as studiedin humans and animals increases GABA in the brainand is a folate antagonist with absorption not affected.In animal studies [43] valproate has been shown toincrease oxidative stress as methionine and vitamin Emitigate teratogenic effects. Valproate inhibits histonedeacetylases, increasing accessibility of DNA todemethylases resulting in altered gene expression. Inhumans valproate may increase plasma ammonia,
0
20
40
60
80
100
120
140
160
Tryp
toph
an
Glutam
ate
Isoleu
cine
Phen
ylalan
ine
Serin
e
Tyro
sine
Beta
-amino
isob
utyr
ate
Homoc
ystin
e + H
omoc
yste
ine
Taur
ine
Perce
nt
AutismNeuro-typical
Figure 5 Amino Acids which were significantly different between the autism and neurotypical groups, rescaled to the averageneurotypical value. The average values and the standard deviations are shown. The number of asterisks indicates the p-value (* p < 0.05, ** p< 0.01, *** p < 0.001). The standard deviations for beta-amino-isobutyrate and “homocystine + homocysteine” are outside the margins of thefigure.
Adams et al. Nutrition & Metabolism 2011, 8:34http://www.nutritionandmetabolism.com/content/8/1/34
Page 19 of 32
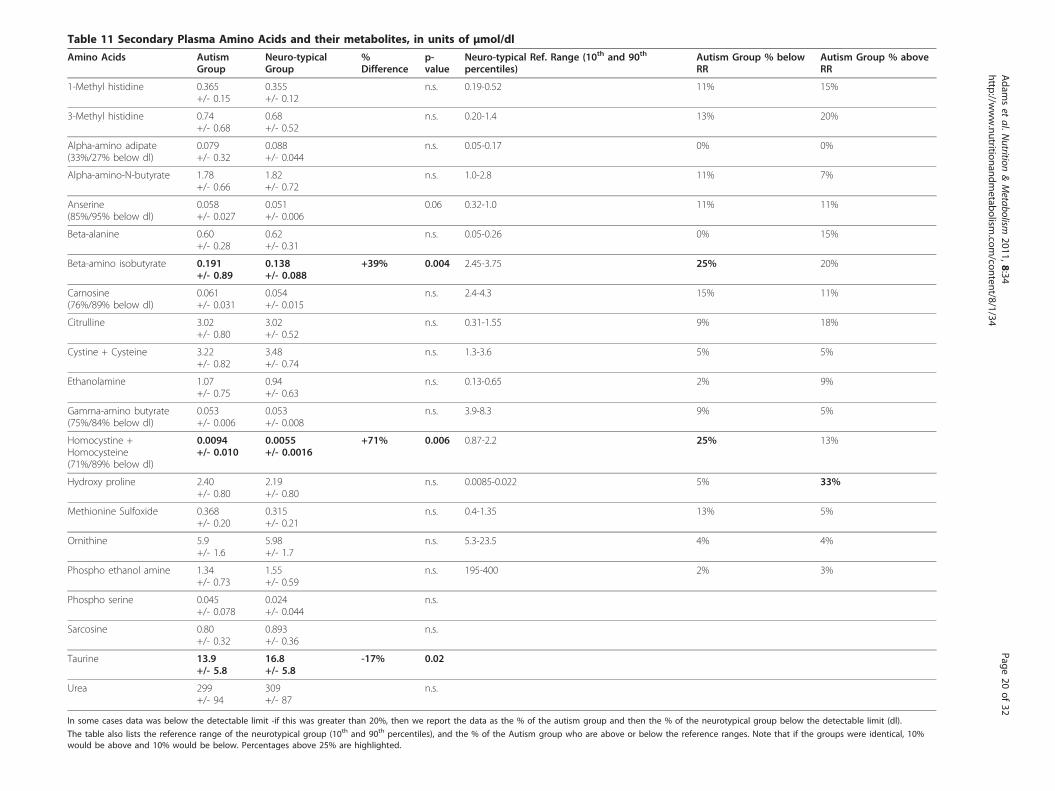
Table 11 Secondary Plasma Amino Acids and their metabolites, in units of μmol/dl
Amino Acids AutismGroup
Neuro-typicalGroup
%Difference
p-value
Neuro-typical Ref. Range (10th and 90th
percentiles)Autism Group % belowRR
Autism Group % aboveRR
1-Methyl histidine 0.365+/- 0.15
0.355+/- 0.12
n.s. 0.19-0.52 11% 15%
3-Methyl histidine 0.74+/- 0.68
0.68+/- 0.52
n.s. 0.20-1.4 13% 20%
Alpha-amino adipate(33%/27% below dl)
0.079+/- 0.32
0.088+/- 0.044
n.s. 0.05-0.17 0% 0%
Alpha-amino-N-butyrate 1.78+/- 0.66
1.82+/- 0.72
n.s. 1.0-2.8 11% 7%
Anserine(85%/95% below dl)
0.058+/- 0.027
0.051+/- 0.006
0.06 0.32-1.0 11% 11%
Beta-alanine 0.60+/- 0.28
0.62+/- 0.31
n.s. 0.05-0.26 0% 15%
Beta-amino isobutyrate 0.191+/- 0.89
0.138+/- 0.088
+39% 0.004 2.45-3.75 25% 20%
Carnosine(76%/89% below dl)
0.061+/- 0.031
0.054+/- 0.015
n.s. 2.4-4.3 15% 11%
Citrulline 3.02+/- 0.80
3.02+/- 0.52
n.s. 0.31-1.55 9% 18%
Cystine + Cysteine 3.22+/- 0.82
3.48+/- 0.74
n.s. 1.3-3.6 5% 5%
Ethanolamine 1.07+/- 0.75
0.94+/- 0.63
n.s. 0.13-0.65 2% 9%
Gamma-amino butyrate(75%/84% below dl)
0.053+/- 0.006
0.053+/- 0.008
n.s. 3.9-8.3 9% 5%
Homocystine +Homocysteine(71%/89% below dl)
0.0094+/- 0.010
0.0055+/- 0.0016
+71% 0.006 0.87-2.2 25% 13%
Hydroxy proline 2.40+/- 0.80
2.19+/- 0.80
n.s. 0.0085-0.022 5% 33%
Methionine Sulfoxide 0.368+/- 0.20
0.315+/- 0.21
n.s. 0.4-1.35 13% 5%
Ornithine 5.9+/- 1.6
5.98+/- 1.7
n.s. 5.3-23.5 4% 4%
Phospho ethanol amine 1.34+/- 0.73
1.55+/- 0.59
n.s. 195-400 2% 3%
Phospho serine 0.045+/- 0.078
0.024+/- 0.044
n.s.
Sarcosine 0.80+/- 0.32
0.893+/- 0.36
n.s.
Taurine 13.9+/- 5.8
16.8+/- 5.8
-17% 0.02
Urea 299+/- 94
309+/- 87
n.s.
In some cases data was below the detectable limit -if this was greater than 20%, then we report the data as the % of the autism group and then the % of the neurotypical group below the detectable limit (dl).
The table also lists the reference range of the neurotypical group (10th and 90th percentiles), and the % of the Autism group who are above or below the reference ranges. Note that if the groups were identical, 10%would be above and 10% would be below. Percentages above 25% are highlighted.
Adam
set
al.Nutrition
&Metabolism
2011,8:34http://w
ww.nutritionandm
etabolism.com
/content/8/1/34Page
20of
32

homocysteine and glutamine and decrease carnitine [42].Topiramate may create metabolic acidosis, decrease glu-tamate and increase GABA. The effect upon specificnutrients has not been as well studied for the psycho-pharmaceuticals [44].To investigate if medication use had a significant
effect on results, a t-test comparison was made betweenthe autism group taking medications (45%) vs. the aut-ism group not taking any medications (55%). The onlydifferences with a p-value less then 0.01 were lowerRBC copper (-9% lower, p = 0.001) and higher plasmamethionine sulfoxide (+35% higher, p = 0.002) for theautism medication group compared to the autism no-medication group. So, aside from those two differences,it appears that medication use had little effect on theresults.
Correlations with Autism SeverityThe correlations of each biomarker with each of thethree autism severity scales were calculated. Table 12lists the biomarkers which had the highest correlationwith autism severity (r > 0.34 in absolute magnitude,corresponding to a p value of 0.01 or lower). The bio-markers had p < 0.01 for only one autism severity scaleat most. Given multiple biomarkers, the cut-off for sig-nificance is below p = 0.001. So, none of the results aresignificant, but some have p < 0.01 and are worthfurther investigation.
Regression AnalysesRegression analysis develops an equation that relatesone or more “independent” variables (such as metabolicbiomarkers) to a single “dependent” variable (such asseverity of autism). The regression equation has coeffi-cients that minimize the differences between observedvalues of the dependent variable and those predicted bythe equation. The standard measure of how well aregression performs is R2, which is the proportion of thevariation in the dependent variable that can beexplained by the regression. (If R2 = 1, the regression
equation fits the dependent variable perfectly; if R2 = 0the independent variables provide no useful informationabout the dependent variable).VitaminsThe regression analysis yielded a significant result for allthree autism severity scales (adj. R2 of 0.25-0.57), withthe highest adjusted R2 for the PDD-BI. Vitamin B6,Vitamin C, N-methyl-nicotinamide, and Vitamin K werethe most consistently significant variables.MineralsThe regression analysis yielded a significant result for allthree scales (adj. R2 of 0.22-0.38), with the highestadjusted R2 for the PDD-BI. Calcium (RBC), Iron (RBC),Zinc (WB and RBC), and Potassium (RBC) were themost consistently significant variables. Note that almostall of the most consistently significant variables were inRBC; ie, it is the RBC levels that seem to be moststrongly associated with autism severity.Sulfation, Methylation, Glutathione, Oxidative StressThe regression analysis yielded significant results for allthree scales, with all three severity scales having modestadjusted R2 (0.15-0.24). Free Sulfate was the most con-sistently significant variable, followed by Oxidized Glu-tathione and SAM.ATP, NADH, NADPH, CoQ10The regression analysis yielded significant results foronly one severity scale (the ATEC), with only a modestadjusted R2 (0.15). NADH and ATP were the two signif-icant variables.Primary Amino AcidsThe regression analysis yielded significant results for allthree scales (adj. R2 of 0.22-0.39), with the PDD-BI hav-ing the highest adjusted R2. Proline and Serine were themost consistently significant variables.Secondary Amino AcidsThe regression analysis yielded significant results for allthree scales, with modest adjusted R2 (0.18-0.26). Etha-nolamine and Beta-amino-isobutyrate were the mostconsistently significant variables.Overall AnalysisThis analysis involved starting with all variables fromthe previous analyses that were significant in one ormore of the subgroup analyses (p < 0.01), determinedindividually for each autism severity scale. The Overallregression analysis yielded highly significant results forall three scales (p < 0.002 or better for all cases), withthe highest adjusted R2 for the PDD-BI, followed by theSAS and then the ATEC. Different markers were signifi-cant for different autism severity scales.
DiscussionOverviewThe general agreement of the present neurotypical refer-ence ranges of many vitamins, minerals, and primary
Table 12 Correlation of Biomarkers with the modifiedPDD-BI Autism Composite, ATEC, and SAS, with thecorrelation coefficient followed by the p-value inparentheses
PDDBI ATEC SAS
Plasma Free Sulfate -0.19 (n.s.) -0.25 (n.s.) -0.38 (0.006)
RBC Iron 0.36 (0.009) 0.27 (0.05) 0.12 (n.s.)
Serum Phosphorus 0.38 (0.006) 0.11(n.s.) 0.12 (n.s.)
Plasma Phenylalanine -0.22 (n.s.) -0.29 (0.03) -0.43 (0.002)
Only biomarkers with values of R = 0.34 or greater are listed, correspondingto a p-value of 0.01 or lower. Note that since many correlations wereinvestigated, these results are not highly significant, and are at most possiblysignificant.
Adams et al. Nutrition & Metabolism 2011, 8:34http://www.nutritionandmetabolism.com/content/8/1/34
Page 21 of 32
amino acids with published reference ranges from stan-dard sources provides validation of the methodologyused. Children with autism have mean levels of vita-mins, minerals, and most primary amino acids that gen-erally lie within published reference ranges. In the careof children with autism, the practitioner is thereforeunable to discern emerging metabolic dysfunction orutilize measured values of these standard analytes as thebasis for clinical decision-making regarding supplemen-tation in most cases. More reliable and of greater clini-cal significance are levels of sulfation, SAM, uridine,glutathione, oxidative stress, and ATP/NADH/NADPHwhich are very likely to be abnormal.In the sections below we provide a detailed discussion
of each of the categories of measurements. However,some of the results are inter-related, so we wish to firstdiscuss some of the major results.Sulfation and ATPChildren with autism had significantly lower levels ofplasma sulfate, including both free and total sulfate,consistent with several previous studies. ATP is requiredin the kidney to resorb sulphate (recycling of sulphate isimportant because sulphate is poorly absorbed from thegut, and conversion from cysteine is slow). This studyfound a significant correlation of ATP with free andtotal plasma sulphate (r = 0.32 and 0.44, respectively),suggesting that decreased ATP is a significant contribu-tor to decreased sulphate levels in children with autism.Methylation and ATPChildren with autism had significantly impaired methy-lation, as evidenced by low levels of SAM (the primarymethyl donor) and high levels of plasma uridine (whichrequires methylation to be converted to thymidine).SAM is formed from methionine by methionine adenyo-syl transferase, which requires ATP. Methionine levelswere similar in the autism and neurotypical groups, butATP levels were very significantly lower in the autismgroup, suggesting that low levels of ATP are at leastpart of the reason for decreased levels of SAM. Methio-nine in the body comes partially from the diet (it is anessential amino acid) and partially by the recycling ofhomocysteine to methionine (via methionine synthaseor methyl transferase). Methionine synthase requiresmethyl-B12 and 5-methyl-tetrahydrofolate, a derivativeof folic acid. Both vitamin B12 and folic acid were simi-lar in the autism and control groups, consistent withnormal levels of methionine. Normal levels of methio-nine are consistent with one previous study [10] whichinvolved the use of age-matched controls with no intakeof vitamins/minerals; previous studies of methioninelevels had reported significant differences, but those stu-dies involved either children with autism taking a vita-min/mineral supplement [8] or significant agedifferences [9].
Oxidative StressChildren with autism had significantly elevated oxidativestress, as indicated by increased GSSG/GSH ratio (glu-tathione is the primary anti-oxidant in the body), andincreased plasma nitrotyrosine. GSSG is reduced toGSH by glutathione reductase, which requires NADPH.NADPH levels were substantially lower in children withautism, which would explain why they also had adecreased GSH/GSSG ratio. These results are consistentwith several previous studies discussed in theIntroduction.
VitaminsThe data show that, on average, children with autismhave lower levels of biotin, and trend toward lowerlevels of vitamin B5, vitamin E, and total carotenoids.Those nutrients were also more likely to be below thereference range of the neurotypical group. The autismgroup had somewhat higher levels of vitamin C.The broad distribution of vitamin B6 (measured as the
active form, P5P, inside the RBC) is very interesting.Two previous studies [45,46] found high levels of totalB6 in the plasma, and in those papers it was hypothe-sized that it might be due to an impaired conversion ofB6 to the active form, P5P. That hypothesis may bevalid for the subset of children with low RBC P5P, butthere also appears to be a subset with high RBC P5P.Overall, the broad distribution of RBC P5P suggests thatthere is a subset of children who need more vitamin B6,and a subset who have high levels of B6. This is consis-tent with 11 double-blind, placebo-controlled studieswhich mostly found that about half of children or adultswith autism benefit from mega-doses of vitamin B6(500-1000 mg, or 250-500× the RDA) [45]. This studysuggests that there may be a subgroup (those with lowRBC P5P) who would likely benefit from B6 supplemen-tation. However, since B6 levels are not dramaticallylow, it is possible that high doses (20-40× RDA) insteadof mega-doses (100-250× the RDA) might be sufficient,unless P5P-dependent enzymes are highly defective andrequire very high levels of P5P to function normally.The higher level of total choline in the children with
autism is interesting, and may suggest an impairment inconversion of choline to acetylcholine.There is current interest in the role of Vitamin D in
not only bone metabolism but also immune systemfunction [47]. D3, synthesized in the skin on exposureto sunlight, and D2, supplied in plant and fungi basedfoods, are both prohormones for 25-OH-D which wasmeasured in this study. The role of vitamin D in autism[48,49] has begun to receive attention. In this currentstudy there was no difference in plasma vitamin D levelsin children with autism versus controls. Measured levelsfor the neurotypical children were consistent with the
Adams et al. Nutrition & Metabolism 2011, 8:34http://www.nutritionandmetabolism.com/content/8/1/34
Page 22 of 32

results of the NHANES US population study. In bothstudy groups there is a subgroup, which is borderline orbelow published RR, even in a geographic location (Ari-zona) with potential for high sun exposure. The causefor the decreased vitamin D levels in the general popula-tion is not well understood; it is likely multifactorial.One known factor is the change in modern lifestyleswhich have resulted in less exposure to direct sunlight.Thus, the “average” level of the general population maynot be “optimal.” So, it may be that most children,including children with ASD, may benefit from morevitamin D. The present results somewhat differ with astudy in Egypt [19], which found that young childrenwith autism (5.3 +/- 2.8 yr) had significantly lower levelsof 25 (OH)D (28.5 +/- 16.4 mcg/l) than did controls(40.1 +/- 11.8 mcg/l) of similar age. The levels for theautism group for the Egyptian and the present study arein close agreement; however the Egyptian normativecontrol levels are much higher than for the presentstudy. To determine if the difference with the presentresults was partially due to differences in study age, thepresent data for children ages 5-10 years was analyzed,but found no difference between the autism and controlgroups. So, the difference appears to be due to differ-ences in the control groups and may reflect differencesin entire population reference ranges, perhaps due to avariety of factors, such as sun exposure, dietary intakeor factors interfering in vitamin D metabolism.It is interesting to compare the results of this study
with other studies. The following findings for childrenwith autism relative to controls are consistent withother studies: lower vitamin E [15,20]; normal levels ofvitamin B12 [11,50], serum folate [11,50] and vitamin A[20]. The present finding of increased vitamin C is con-sistent with one study [20], but inconsistent withanother study that found normal levels of vitamin C[15]. The present finding of slightly lower levels of totalcarotenes is in contrast to a study [15] in Saudi Arabiawhich found greatly increased levels of beta carotene;the reason for that difference is unclear (typically 80% oftotal carotene is beta-carotene, but may be due to differ-ences in which nation the study was conducted in, dueto differences in ethnicity, diet, and other factors. Fast-ing status is also important, as food intake rapidlyaffects levels of most vitamins.
Functional testsFIGLU is an intermediate in the deamination of histi-dine. Conversion of FIGLU to glutamic acid is the 4th
step in this process and requires the enzyme formimino-transferase and the co-factor folic acid. The elevatedurinary FIGLU suggests deficiency in either the enzymeor in folic acid. Plasma folic acid was slightly lower inthe autistic group but the difference was not significant.
Plasma folic acid did not significantly correlate withFIGLU levels. As a water soluble vitamin, folic acid var-ies daily with intake. FIGLU excretion may be represen-tative of a longer metabolic period. FIGLU may be amore sensitive indicator of need for folic acid than mea-surements of plasma folic acid.N-methyl-nicotinamide is a metabolite of vitamin B3
(niacin). The finding of higher levels of urinary n-methyl-nicotinamide in the autism group (possibly sig-nificant) is consistent with another study [51] whichfound elevated urinary n-methyl-nicotinamide in chil-dren with autism compared to neurotypical children.Whole blood niacin levels were very similar in the aut-ism and neurotypical groups, and whole blood niacinlevels did not significantly correlate with n-methyl-nico-tinamide levels, which suggests that n-methyl-nicotina-mide is a more sensitive assay.Children with autism had normal levels of kryptopyr-
oles in urine, although a few outliers raised their stan-dard deviation. The measurements of kryptopyrolesshould not be confused with measurements of the“mauve factor” which was once thought to be kryptopyr-ole but is actually hydroxyhemopyrrolin-2-one (HPL)[52].
MineralsThe much lower level of WB lithium is consistent witha previous study [21], which found lower levels oflithium in younger children with autism and theirmothers, but not in the older children. Those measure-ments were done in hair, which appears to be a moresensitive measure than blood, based on a study oflithium-deficient animals [53]. Animals fed a lithium-deficient diet had decreased immune function and suf-fered from more chronic infections, which may partiallyexplain why several studies have found that childrenwith autism have significantly more ear infections thantypical children [54-57]. Lithium-deficient animals alsohad decreased activity of monoamine oxidase, which cangreatly affect neurotransmitter levels. Low levels oflithium are associated with a wide range of psychiatricdisorders [58]. The primary biochemical effect of lithiumis that it regulates two enzymes, glycogen synthasekinase 3-beta and phosphatidylinositol phosphatase,both of which have been linked to autism [59,60]. Bothenzymes are involved in the growth factor signalingpathway (PI3-kinase). Low levels of lithium are of con-cern and these results suggest that low-level lithiumsupplementation may be beneficial for mood stabiliza-tion in this group. Along with other studied nutrients,the role lithium plays in the etiology of autism warrantsfurther study.Serum iron and serum ferritin were similar in the aut-
ism and neurotypical groups. A previous study [22]
Adams et al. Nutrition & Metabolism 2011, 8:34http://www.nutritionandmetabolism.com/content/8/1/34
Page 23 of 32
found that 8 of 96 American children with ASD wereanemic (haemoglobin < 110 g/l). In that study, the agerange of the general group was 3-13 yr, but 7 of the 8autism cases were in children under age 5. Anotherstudy [23] found that 16% of 96 Canadian children withASD ages 1-10 yr had low serum ferritin (< 10-12 mcg/L), with little effect of age. The present study of olderchildren with ASD (ages 5-16 yr) found only 2% of thechildren had serum ferritin levels below 12 mcg/L,which is roughly consistent with the results for olderchildren in the study by Latif et al [22], but somewhatlower than the rate found in the study by Dosman et al2006 [23]. Combining the results of all three studies,anemia seems to be a common problem in young chil-dren with autism (below age 5), but perhaps less com-mon in older children with autism, likely consistentwith the general population.There was a slightly higher, but statistically significant,
RBC iron in the autism group. The clinical significanceof elevated RBC iron is unclear, but it did correlate withautism severity (for the PDD-BI), so elevated RBC ironmay be problematic. This finding did not correlate withoxidative stress in this study; further research iswarranted.Most other minerals were only slightly different in the
autism group compared to the control group. Theslightly higher level of copper (WB and RBC) suggestsmost children with autism do not need copper supple-mentation. The slightly lower (possibly significant) levelof magnesium in serum and WB suggests that modestmagnesium supplementation might be beneficial, butRBC magnesium was normal, so at most this suggestsonly a minor need. The possibly significant slightlyhigher levels of RBC potassium, RBC phosphorus, andRBC boron seem to be minor fluctuations, and may bea statistical artifact.The autism group had an average level of urinary
iodine that was similar to the average level of the neuro-typical group, but 25% of the autism group had urinaryiodine levels that were below the 10th percentile of theneurotypical group. 14% of the autism group and 11% ofthe control group had insufficient iodine (< 100 ng/ml)based on the WHO 2007 criteria, although this needs tobe interpreted cautiously since those children also hadlower creatinine levels (more dilute urine) and theWHO criteria is based on volume, not normalized bycreatinine, since they are focused on population ana-lyses, not individual analyses. A previous study [21]found significantly lower levels of iodine in hair of chil-dren with autism compared to controls. It is unknown ifhair levels are indicative of iodine status, whereas urin-ary levels are accepted as the best measure of iodine sta-tus, as most iodine is excreted in the urine [61]. Overall,it does appear that there is a significant subset of
children with autism with low levels of iodine, which isone of the leading causes of mental retardation world-wide [61], and we believe that further investigation ofiodine status and thyroid status is warranted.It is interesting to compare our results with a smaller
study of RBC minerals in young Canadian children withautism (n = 20) compared to neurotypical children (n =15), both with average ages of 3.9 years [24]. That studyfound lower levels of RBC selenium (p = 0.0006), higherlevels of RBC molybdenum (p = 0.01), and possiblylower levels of RBC zinc (p = 0.08). They found similarlevels of chromium, copper, magnesium, and manganesein RBC in the two groups. This smaller study partiallyagrees with the present study (normal levels of RBCchromium, magnesium, manganese), but partially dis-agrees in that the present study did not find a differencein RBC selenium, molybdenum, or zinc, and possiblyfound slightly higher RBC copper. Part of the differencein study results may be due to differences in ages(averages of 4 yr vs. 10 yr), geographic/dietary issues(Canada vs. Arizona), and study size.A study [25] of copper and zinc levels of 20 British
older children with autism compared to 30 British olderneurotypical children did not find any significant differ-ence in zinc or copper levels in plasma, although theautism group did have a 10% higher level of copper,similar to the present results for WB zinc (no differ-ence) and WB copper (7% higher, p = 0.02).A study of zinc levels in 45 children with ASD age 4-
12 years compared to 41 neurotypical controls of similarage in Turkey found lower levels of zinc in WB andRBC [26]. This disagrees with the British study [25] andthe present US study, possibly due to difference in cul-ture/diet/geographical area.
Sulfation, Methylation, Glutathione and Oxidative StressSulfate is the third most abundant essential mineral inthe body. Roughly 80% of sulfate is produced in vivo byoxidation of methionine or cysteine, both sulphur-con-taining amino acids which are provided from dietaryproteins. Sulfation is important for many reactionsincluding detoxification, inactivation of catecholamines,synthesis of brain tissue, sulfation of mucin proteinswhich line the gastrointestinal tract, and more. Themeasurement of total plasma sulfate involves many sub-stances in the plasma, including neurotransmitters, ster-oids, glycosaminoglycans, phenols, amino acids,peptides, and other molecules. The findings of very lowfree and total plasma sulfate are consistent with two stu-dies, which found decreased plasma sulfate compared toneurotypical controls [62,63]. Low sulfate in the plasmais also consistent with four studies [62,64-66] whichfound that children with ASD had a significantlydecreased sulfation capacity compared to controls, based
Adams et al. Nutrition & Metabolism 2011, 8:34http://www.nutritionandmetabolism.com/content/8/1/34
Page 24 of 32
on low levels of the paracetamol-sulfate/paracetamol-glucuronide (PS/PG) ratio in urine following administra-tion of paracetamol (acetaminophen, trade name ofTylenol). The finding of low plasma sulfate is also con-sistent with a large study that found high sulfate in theurine of children with autism [67], as sulfate wasting inthe urine partly explains low levels in the plasma. ATPis required for the kidneys to resorb sulfate, and in thisstudy ATP was correlated with levels of free and totalplasma sulfate (r = 0.32 and 0.44, respectively), so thissuggests that low levels of ATP are a significant contri-butor to decreased sulfate in children with autism. Thatpaper also reported high levels of urinary sulfite, sug-gesting that there was a problem of converting sulfite tosulfate in the mitochondria. In 38% of cases (14/38)urinary sulfite and sulfate levels improved by giving 50mcg of molybdenum, presumably since the enzyme forconverting sulfite to sulfate (sulfite oxidase) containsmolybdenum. In this study there was a weak correlation(r = 0.24) of RBC molybdenum with plasma free sulfate,but no significant correlation with plasma total sulfate.The findings of decreased reduced glutathione (GSH),
increased oxidized glutathione (GSSH), and increasedratio of oxidized:reduced glutathione are consistent withfour previous studies [8-10,63]. The finding of decreasedSAM in RBC is consistent with three studies of SAM inplasma [8-10]. Our finding of an unusually broad distri-bution of SAH in RBC only slightly higher (+5%, n.s.)than that of controls is similar to that of one study [10]which also found a slightly higher level of SAH inplasma (+6%, n.s.), but different from two other studieswhich found higher levels of SAH in plasma [8,9]. Itshould be noted that we measured SAM and SAH inRBC, whereas the other studies [8-10] measured SAMand SAH in plasma; RBC levels are far greater thanplasma levels, but seem to provide similar results forchildren with autism vs. controls.SAM is converted to SAH by the transfer of a
methyl group, so the ratio of SAM/SAM is a measureof the body’s methylation capacity. The finding of aslightly decreased SAM/SAH ratio (-10%, p = 0.006) issimilar to one study [10] which found a slightlydecreased level (-17%, n.s.), and similar to two otherstudies [8,9] which also found decreased levels ofSAM/SAH; however, those two studies found a largerdecrease (-44% and -27%, respectively) in the SAM/SAH ratio than in this study, due to lower levels ofSAM.The finding of very elevated plasma uridine suggests
impaired methylation (methylation is required for con-version of uridine to thymidine), consistent with thedecreased level of SAM.The finding of elevated plasma adenosine in 33% of
the autism group is consistent with two previous studies
[8,9] and suggests an impairment in adenosine deami-nase since adenosine levels are normal. Adenosine bindsto the active site of SAH hydrolase and inactivates it[68,69] so elevated adenosine would block conversion ofSAH to homocysteine, and hence may partially explainthe decreased SAM/SAH ratio.The finding of increased nitrotyrosine shows that this
is also a good marker for oxidative stress in childrenwith autism, and is consistent with the other measure-ments of oxidative stress (oxidized glutathione and ratioof oxidized:reduced glutathione).Overall, the problems with SAM, glutathione, and oxi-
dative stress suggest that children with autism needincreased anti-oxidant support, folinic acid (not folic)and vitamin B12 to support the methionine cycle. (Folicacid is not sufficient in most cases. In the James et al2004 [8] study 16 of the 20 children with autism weretaking a multivitamin and mineral supplement contain-ing 400 ug folic acid and 3 ug vitamin B-12 but still hadabnormal methylation; folinic acid, not folic acid, wasneeded to normalize methylation).
ATP, NADH, NADPH, CoQ10The finding of decreased plasma ATP, NADH, andNADPH, but normal levels of their precursor (vitaminB3- niacin) may suggest an impairment in the formationof NADH from niacin. The clinical significance ofdecreased levels of ATP in the plasma is unclear, sincemost ATP is intracellular. Impaired transport of ATPthroughout the body is suggested. ATP is the primaryenergy source for many metabolic reactions, anddecreased levels of plasma ATP may be related todecreased muscle tone and decreased endurance com-monly observed in children with autism [21,70] NADHis mainly involved in catabolic reactions (energy meta-bolism and mitochondrial function) whereas NADPH isinvolved in anabolic reactions (antioxidation and reduc-tive biosynthesis) [71]. Decreased plasma ATP andNADH may also relate to impaired mitochondrial func-tion, which has been reported in some children withautism [72-75].The reason for the decreased ATP, NADH, and
NADPH is unclear. ATP, NADH, and NADPH were allstrongly correlated with one another (r = 0.67 = 0.69),and all had a significant correlation with ratio of GSSH:GSG (r = -0.34 to -0.52), and plasma nitrotyrosine (r =-0.24 to -0.51) indicating that increased oxidative stressis associated with low ATP, NADH, and NADPH.Increased oxidatative stress would result in a significantconversion of NADH to NAD+ (which was not mea-sured in this study). This could also be true to a limitedextent for NADPH, but usually NADP+ is only a verysmall fraction of NADPH. It also may be due toimpaired function and/or amount of translocator protein
Adams et al. Nutrition & Metabolism 2011, 8:34http://www.nutritionandmetabolism.com/content/8/1/34
Page 25 of 32
in the mitochondrial membrane, which would impairtransport of ATP from the mitochondria into the cyto-plasm [76] and into the plasma.
Primary Amino AcidsOne significant abnormality in the plasma amino acidswas elevated glutamate in the ASD group. Glutamate isthe most prominent neurotransmitter. It is ubiquitousthroughout the central nervous system where it modu-lates synaptic plasticity, vital to memory, learning andregulation and modulates gene expression, functioningin post-synaptic excitation as well as some inhibition.Overstimulation leads to excitotoxicity, creating oxida-tive stress, mitochondrial damage and ultimately mayplay a role in neurodegeneration. Peripherally it plays arole in taste, skin pain sensation and pancreatic exocrinefunction. Increased glutamate may be linked to some ofthe behavioral problems and features commonly asso-ciated with autism. It may indicate an increased needfor vitamin B6, needed for conversion of glutamate toglutamine.Another significant abnormality was decreased trypto-
phan in the ASD group. This may be due to decreasedprotein intake, and/or impaired digestion of protein intoamino acids; the latter seems more likely since most ofthe essential amino acids were normal. Tryptophan is aprecursor to the synthesis of serotonin, so decreasedtryptophan is likely to impair serotonin synthesis(important in neurogenesis and neurotransmission). Theimportance of low tryptophan in autism was demon-strated by a randomized, double-blind, placebo-con-trolled crossover study that found that a 24-hour-dietlow in tryptophan followed by a tryptophan-deficientamino acid drink led to a significant worsening in beha-vior in adults with autism [77].There were several other differences which were only
possibly significant (p < 0.05). The ASD group also hadslightly increased serine, and slightly decreased phenyla-lanine and tyrosine. The low tyrosine is presumably dueto the low phenylalanine, since tyrosine is derived fromphenylalanine, and they were highly correlated with oneanother (r = 0.74). The low phenylalanine could be dueto decreased protein intake and/or impaired digestion ofprotein into those amino acids.Our results suggest that some children with autism
(those with low tryptophan and phenylalanine) wouldbenefit from either increased protein intake, use ofdigestive enzymes containing proteases, and/or supple-ments of tryptophan (or 5-HTP) and phenylalanine.Two previous studies by James et al [8,9] found
decreased plasma methionine in children with autism vs.controls, but their most recent study [10] did not; thelatter is consistent with the present study, which did notfind a significant difference in plasma methionine.
Although there have been several other studies ofplasma amino acids in children with autism, they suf-fered from one or more limitations, including smallsample size, no fasting requirement, lack of neurotypicalcontrols, and/or age differences between the autism andcontrol groups, and thus have not surprisingly yieldedcontradictory results to one another, and to the presentresults.Overall, the present data on plasma amino acids
appears to be more reliable than most of the other stu-dies of plasma amino acids, due to its larger size, over-night fast, use of neurotypical controls, use of controlsof similar age, and simultaneous testing of autism andcontrol groups. The present results suggest that childrenwith autism, on average, have lower levels of plasmatryptophan, increased plasma glutamate, and possiblylower levels of several other amino acids.
Secondary Amino AcidsThe only significant abnormality in the secondary aminoacids was increased beta-aminoisobutyrate (also knownas 3-aminoisobutyric acid) in the autism group. Beta-aminoisobutyrate is a product formed by the catabolismof thymine, one of the four nucleobases in the nucleicacid of DNA. So, elevated beta-aminoisobutyrate mayindicate an increased rate of DNA turnover, and/or itmay indicate an inhibition of the conversion of beta-aminoisobutyrate into the intermediates that eventuallylead to the citric acid cycle.There was also a possibly significant lower level of
taurine, which could be due to an impairment of theconversion of methionine to cysteine to taurine, but itcould also be due in part to increased wasting of taurinein the urine, which has also been reported [78]. This isconsistent with another study [63], which also foundlow plasma taurine in children with autism, althoughthat study found a greater difference.For “homocystine + homocysteine”, it was undetect-
able in most cases, but it was detectable in a higherfraction of the autism group (29%) vs. the control group(11%), suggesting a possible abnormality in metabolismof homocystine and/or homocysteine in some children,but due to measurement limitations this requires inves-tigation with more sensitive techniques that do not oxi-dize the homocysteine.
Potential Confounding Factors: Medication,Gastrointestinal and Dietary Issues45% of the autism group were taking medications, andsome of those can affect nutritional status, metabolism,and gastrointestinal function. However, a t-test com-parison of the two groups revealed only two small dif-ferences between the autism groups taking and nottaking medications, so medication use appeared to
Adams et al. Nutrition & Metabolism 2011, 8:34http://www.nutritionandmetabolism.com/content/8/1/34
Page 26 of 32
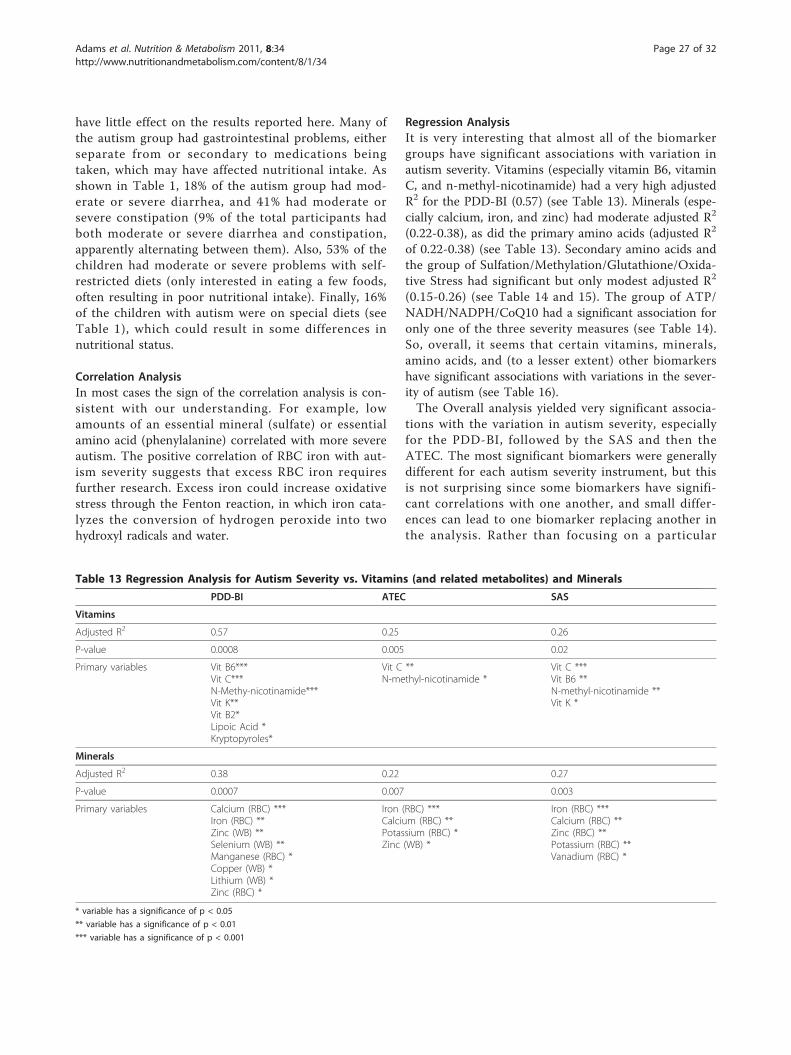
have little effect on the results reported here. Many ofthe autism group had gastrointestinal problems, eitherseparate from or secondary to medications beingtaken, which may have affected nutritional intake. Asshown in Table 1, 18% of the autism group had mod-erate or severe diarrhea, and 41% had moderate orsevere constipation (9% of the total participants hadboth moderate or severe diarrhea and constipation,apparently alternating between them). Also, 53% of thechildren had moderate or severe problems with self-restricted diets (only interested in eating a few foods,often resulting in poor nutritional intake). Finally, 16%of the children with autism were on special diets (seeTable 1), which could result in some differences innutritional status.
Correlation AnalysisIn most cases the sign of the correlation analysis is con-sistent with our understanding. For example, lowamounts of an essential mineral (sulfate) or essentialamino acid (phenylalanine) correlated with more severeautism. The positive correlation of RBC iron with aut-ism severity suggests that excess RBC iron requiresfurther research. Excess iron could increase oxidativestress through the Fenton reaction, in which iron cata-lyzes the conversion of hydrogen peroxide into twohydroxyl radicals and water.
Regression AnalysisIt is very interesting that almost all of the biomarkergroups have significant associations with variation inautism severity. Vitamins (especially vitamin B6, vitaminC, and n-methyl-nicotinamide) had a very high adjustedR2 for the PDD-BI (0.57) (see Table 13). Minerals (espe-cially calcium, iron, and zinc) had moderate adjusted R2
(0.22-0.38), as did the primary amino acids (adjusted R2
of 0.22-0.38) (see Table 13). Secondary amino acids andthe group of Sulfation/Methylation/Glutathione/Oxida-tive Stress had significant but only modest adjusted R2
(0.15-0.26) (see Table 14 and 15). The group of ATP/NADH/NADPH/CoQ10 had a significant association foronly one of the three severity measures (see Table 14).So, overall, it seems that certain vitamins, minerals,amino acids, and (to a lesser extent) other biomarkershave significant associations with variations in the sever-ity of autism (see Table 16).The Overall analysis yielded very significant associa-
tions with the variation in autism severity, especiallyfor the PDD-BI, followed by the SAS and then theATEC. The most significant biomarkers were generallydifferent for each autism severity instrument, but thisis not surprising since some biomarkers have signifi-cant correlations with one another, and small differ-ences can lead to one biomarker replacing another inthe analysis. Rather than focusing on a particular
Table 13 Regression Analysis for Autism Severity vs. Vitamins (and related metabolites) and Minerals
PDD-BI ATEC SAS
Vitamins
Adjusted R2 0.57 0.25 0.26
P-value 0.0008 0.005 0.02
Primary variables Vit B6***Vit C***N-Methy-nicotinamide***Vit K**Vit B2*Lipoic Acid *Kryptopyroles*
Vit C **N-methyl-nicotinamide *
Vit C ***Vit B6 **N-methyl-nicotinamide **Vit K *
Minerals
Adjusted R2 0.38 0.22 0.27
P-value 0.0007 0.007 0.003
Primary variables Calcium (RBC) ***Iron (RBC) **Zinc (WB) **Selenium (WB) **Manganese (RBC) *Copper (WB) *Lithium (WB) *Zinc (RBC) *
Iron (RBC) ***Calcium (RBC) **Potassium (RBC) *Zinc (WB) *
Iron (RBC) ***Calcium (RBC) **Zinc (RBC) **Potassium (RBC) **Vanadium (RBC) *
* variable has a significance of p < 0.05
** variable has a significance of p < 0.01
*** variable has a significance of p < 0.001
Adams et al. Nutrition & Metabolism 2011, 8:34http://www.nutritionandmetabolism.com/content/8/1/34
Page 27 of 32
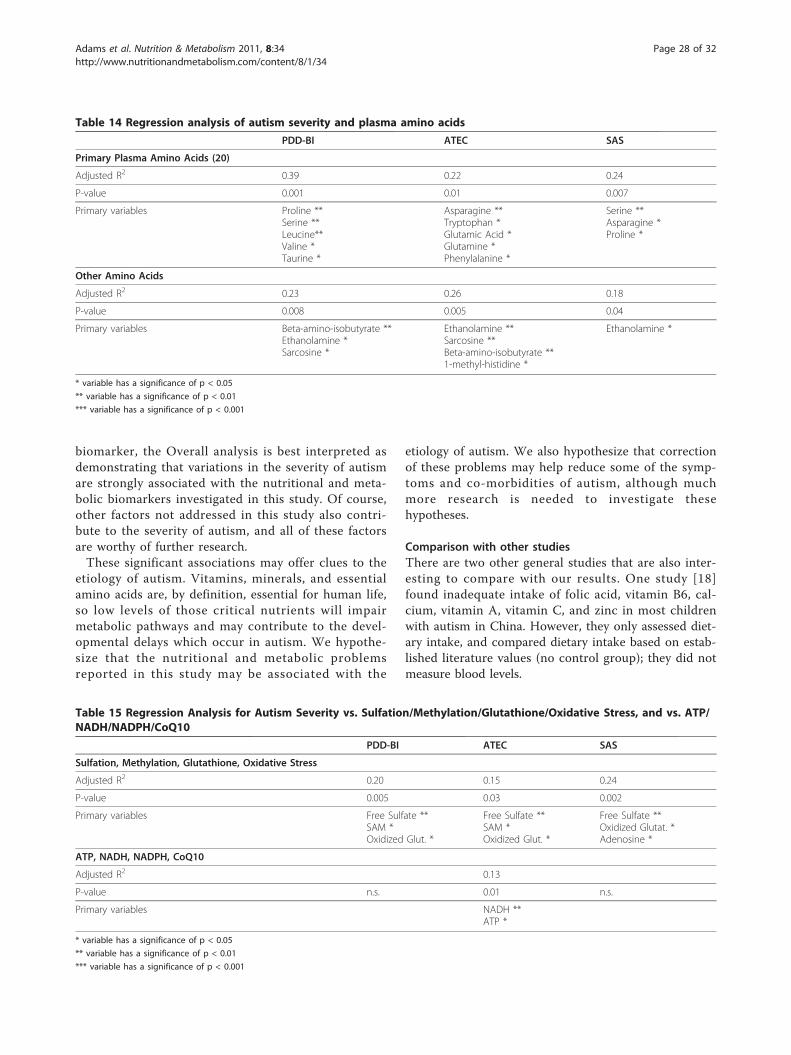
biomarker, the Overall analysis is best interpreted asdemonstrating that variations in the severity of autismare strongly associated with the nutritional and meta-bolic biomarkers investigated in this study. Of course,other factors not addressed in this study also contri-bute to the severity of autism, and all of these factorsare worthy of further research.These significant associations may offer clues to the
etiology of autism. Vitamins, minerals, and essentialamino acids are, by definition, essential for human life,so low levels of those critical nutrients will impairmetabolic pathways and may contribute to the devel-opmental delays which occur in autism. We hypothe-size that the nutritional and metabolic problemsreported in this study may be associated with the
etiology of autism. We also hypothesize that correctionof these problems may help reduce some of the symp-toms and co-morbidities of autism, although muchmore research is needed to investigate thesehypotheses.
Comparison with other studiesThere are two other general studies that are also inter-esting to compare with our results. One study [18]found inadequate intake of folic acid, vitamin B6, cal-cium, vitamin A, vitamin C, and zinc in most childrenwith autism in China. However, they only assessed diet-ary intake, and compared dietary intake based on estab-lished literature values (no control group); they did notmeasure blood levels.
Table 14 Regression analysis of autism severity and plasma amino acids
PDD-BI ATEC SAS
Primary Plasma Amino Acids (20)
Adjusted R2 0.39 0.22 0.24
P-value 0.001 0.01 0.007
Primary variables Proline **Serine **Leucine**Valine *Taurine *
Asparagine **Tryptophan *Glutamic Acid *Glutamine *Phenylalanine *
Serine **Asparagine *Proline *
Other Amino Acids
Adjusted R2 0.23 0.26 0.18
P-value 0.008 0.005 0.04
Primary variables Beta-amino-isobutyrate **Ethanolamine *Sarcosine *
Ethanolamine **Sarcosine **Beta-amino-isobutyrate **1-methyl-histidine *
Ethanolamine *
* variable has a significance of p < 0.05
** variable has a significance of p < 0.01
*** variable has a significance of p < 0.001
Table 15 Regression Analysis for Autism Severity vs. Sulfation/Methylation/Glutathione/Oxidative Stress, and vs. ATP/NADH/NADPH/CoQ10
PDD-BI ATEC SAS
Sulfation, Methylation, Glutathione, Oxidative Stress
Adjusted R2 0.20 0.15 0.24
P-value 0.005 0.03 0.002
Primary variables Free Sulfate **SAM *Oxidized Glut. *
Free Sulfate **SAM *Oxidized Glut. *
Free Sulfate **Oxidized Glutat. *Adenosine *
ATP, NADH, NADPH, CoQ10
Adjusted R2 0.13
P-value n.s. 0.01 n.s.
Primary variables NADH **ATP *
* variable has a significance of p < 0.05
** variable has a significance of p < 0.01
*** variable has a significance of p < 0.001
Adams et al. Nutrition & Metabolism 2011, 8:34http://www.nutritionandmetabolism.com/content/8/1/34
Page 28 of 32
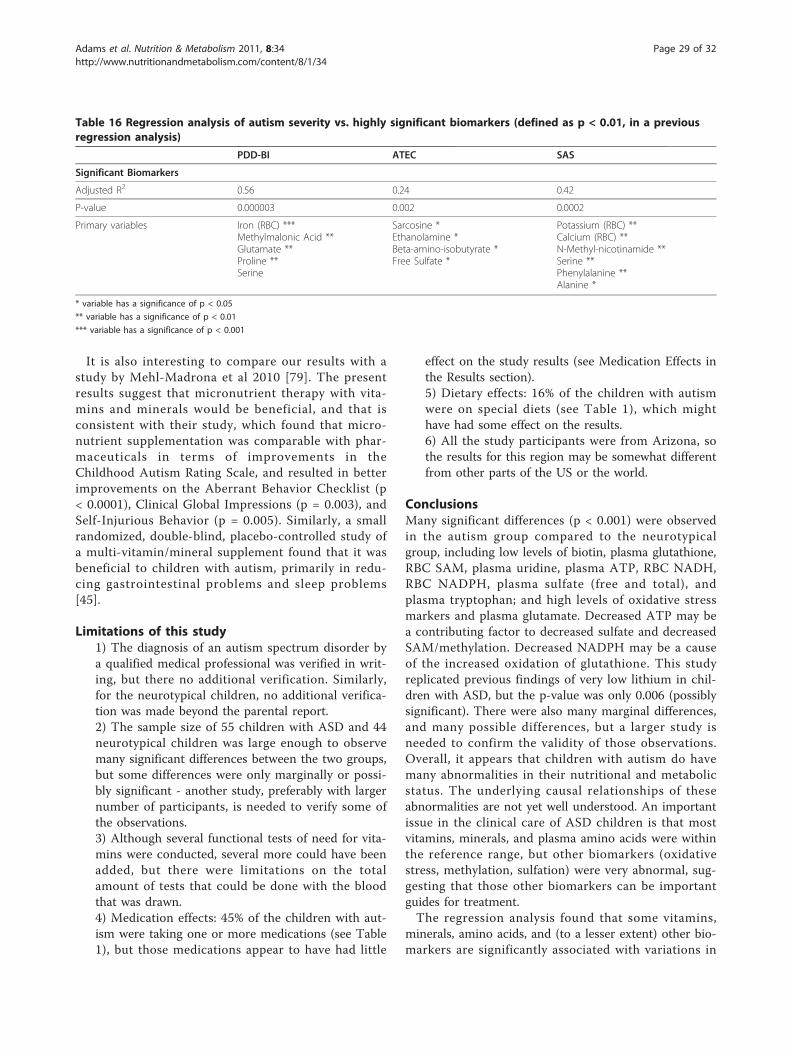
It is also interesting to compare our results with astudy by Mehl-Madrona et al 2010 [79]. The presentresults suggest that micronutrient therapy with vita-mins and minerals would be beneficial, and that isconsistent with their study, which found that micro-nutrient supplementation was comparable with phar-maceuticals in terms of improvements in theChildhood Autism Rating Scale, and resulted in betterimprovements on the Aberrant Behavior Checklist (p< 0.0001), Clinical Global Impressions (p = 0.003), andSelf-Injurious Behavior (p = 0.005). Similarly, a smallrandomized, double-blind, placebo-controlled study ofa multi-vitamin/mineral supplement found that it wasbeneficial to children with autism, primarily in redu-cing gastrointestinal problems and sleep problems[45].
Limitations of this study1) The diagnosis of an autism spectrum disorder bya qualified medical professional was verified in writ-ing, but there no additional verification. Similarly,for the neurotypical children, no additional verifica-tion was made beyond the parental report.2) The sample size of 55 children with ASD and 44neurotypical children was large enough to observemany significant differences between the two groups,but some differences were only marginally or possi-bly significant - another study, preferably with largernumber of participants, is needed to verify some ofthe observations.3) Although several functional tests of need for vita-mins were conducted, several more could have beenadded, but there were limitations on the totalamount of tests that could be done with the bloodthat was drawn.4) Medication effects: 45% of the children with aut-ism were taking one or more medications (see Table1), but those medications appear to have had little
effect on the study results (see Medication Effects inthe Results section).5) Dietary effects: 16% of the children with autismwere on special diets (see Table 1), which mighthave had some effect on the results.6) All the study participants were from Arizona, sothe results for this region may be somewhat differentfrom other parts of the US or the world.
ConclusionsMany significant differences (p < 0.001) were observedin the autism group compared to the neurotypicalgroup, including low levels of biotin, plasma glutathione,RBC SAM, plasma uridine, plasma ATP, RBC NADH,RBC NADPH, plasma sulfate (free and total), andplasma tryptophan; and high levels of oxidative stressmarkers and plasma glutamate. Decreased ATP may bea contributing factor to decreased sulfate and decreasedSAM/methylation. Decreased NADPH may be a causeof the increased oxidation of glutathione. This studyreplicated previous findings of very low lithium in chil-dren with ASD, but the p-value was only 0.006 (possiblysignificant). There were also many marginal differences,and many possible differences, but a larger study isneeded to confirm the validity of those observations.Overall, it appears that children with autism do havemany abnormalities in their nutritional and metabolicstatus. The underlying causal relationships of theseabnormalities are not yet well understood. An importantissue in the clinical care of ASD children is that mostvitamins, minerals, and plasma amino acids were withinthe reference range, but other biomarkers (oxidativestress, methylation, sulfation) were very abnormal, sug-gesting that those other biomarkers can be importantguides for treatment.The regression analysis found that some vitamins,
minerals, amino acids, and (to a lesser extent) other bio-markers are significantly associated with variations in
Table 16 Regression analysis of autism severity vs. highly significant biomarkers (defined as p < 0.01, in a previousregression analysis)
PDD-BI ATEC SAS
Significant Biomarkers
Adjusted R2 0.56 0.24 0.42
P-value 0.000003 0.002 0.0002
Primary variables Iron (RBC) ***Methylmalonic Acid **Glutamate **Proline **Serine
Sarcosine *Ethanolamine *Beta-amino-isobutyrate *Free Sulfate *
Potassium (RBC) **Calcium (RBC) **N-Methyl-nicotinamide **Serine **Phenylalanine **Alanine *
* variable has a significance of p < 0.05
** variable has a significance of p < 0.01
*** variable has a significance of p < 0.001
Adams et al. Nutrition & Metabolism 2011, 8:34http://www.nutritionandmetabolism.com/content/8/1/34
Page 29 of 32
the severity of autism, with vitamins being especiallyimportant.We hypothesize that support for these nutritional and
metabolic problems by increasing nutrient intake mayreduce the symptoms and co-morbidities that are asso-ciated with autism. These nutritional and metabolic dys-functions may be related to the etiology of autism.Certainly much more research is needed to investigatethese hypotheses.
AcknowledgementsFirst and foremost, we thank the many autism families and their friends whovolunteered as participants in this research study. We thank the AutismResearch Institute and the Legacy Foundation for financial support of thisstudy. We thank the Autism Society of Greater Phoenix and the ArizonaDivision of Developmental Disabilities for assistance with advertising thisstudy. We thank the staff of the Southwest College of NaturopathicMedicine (N. Foster, M. Harland, B. Peterson, N. Tkacenko) for help withphlebotomy, and we thank ICDRC for providing use of their offices forparticipant evaluations. We thank Vitamin Diagnostics and Doctor’s Data forproviding testing for this study. We thank Gus Papas for assistance withstudy design and discussions of the results. We thank Jon Pangborn forcommenting on the manuscript, and we thank Rosemary Waring for helpfuldiscussions. We thank Leah Johansen for help with manuscript preparation.
Author details1Arizona State University, Tempe, AZ, USA. 2Health Diagnostics, SouthAmboy, NJ, USA. 3Integrative Developmental Pediatrics, Tucson AZ, USA.4Department of Mathematics, Whittier College, Whittier, CA, USA. 5Doctor’sData, St. Charles, IL, USA. 6Southwest College of Naturopathic Medicine,Tempe, AZ, USA.
Authors’ contributionsJBA was the principal investigator, oversaw the study design, conductedmost of the data analysis, and wrote most of the paper. TA oversaw thelaboratory measurements at Health Diagnostics, and assisted withinterpreting the results and editing the paper. SMM was the study physician,oversaw patient care, and assisted with interpreting the results and editingthe paper. RAR assisted with statistical analysis and editing the paper. DQoversaw the laboratory measurements at Doctors Data, and assisted withinterpreting the results and editing the paper. EG was the lead study nurse,and supervised many of the study participants. EG was the studycoordinator, and assisted with participant recruitment and study oversight.ML, JM, SA, and SB were study nurses and supervised study participants. WLassisted with data entry and analysis. All authors read and approved the finalversion of the paper.
Competing interestsThe authors declare that they have no competing interests.
Received: 8 December 2010 Accepted: 8 June 2011Published: 8 June 2011
References1. Breakey J: The role of diet and behavior in childhood. J Paediatr Child
Health 1997, 33:190-194.2. Van Oudheusden LJ, Scholte HR: Efficacy of carnitine in the treatment of
children with attention-deficit hyperactivity disorder. Prostaglandins,Leukotrienes and Essential Fatty Acids 2002, 67(1):33-38.
3. Harding KL, Judah RD, Gant CE: Outcome-based comparison of Ritalinversus food-supplement treated children with AD/HD. AlternativeMedicine Review 2003, 8(3):319-330.
4. Nogovitsina OR, Levitina EV: Diagnostic value of examination of themagnesium homeostasis in children with attention deficit syndromewith hyperactivity. Klinicheskaia Laboratornaia Diagnostika 2005, 5:17-19.
5. Mousain-Bosc M, Roche M, Rapin J, Bali J-P: Magnesium vit B6 intakereduces central nervous system hyperexcitability in children. J AmericanCollege of Nutrition 2004, 23(5):545S-548S.
6. Carlton RM, Ente G, Blum L, Heyman N, Davis W, Ambrosino S: Rationaldosages of nutrients have a prolonged effect on learning disabilities. AltTherapies 2000, 6(3):85-91.
7. Schoenthaler SJ, Bier ID: The effect of vitamin-mineral supplementationon the intelligence of American schoolchildren: a randomized, double-blind placebo-controlled trial. J of Altern and Comple Med 2000, 6(1):19-29.
8. James SJ, Cutler P, Melnyk S, Jernigan S, Janak L, Gaylor DW,Neubrander JA: Metabolic biomarkers of increased oxidative stress andimpaired methylation capacity in children with autism. Am J Clin Nutr2004, 80(6):1611-7.
9. James SJ, Melnyk S, Jernigan S, Cleves MA, Halsted CH, Wong DH, Cutler P,Bock K, Boris M, Bradstreet JJ, Baker SM, Gaylor DW: Metabolicendophenotype and related genotypes are associated with oxidativestress in children with autism. Am J Med Genet B Neuropsychiatr Genet2006, 141:947-956.
10. James SJ, Melnyk S, Fuchs G, Reid T, Jernigan S, Pavliv O, Hubanks A,Gaylor DW: Efficacy of methylcobalamin and folinic acid treatment onglutathione redox status in children with autism. Am J Clin Nutr 2009,89(1):425-30.
11. Paşca SP, Dronca E, Kaucsár T, Cřaciun EC, Endreffy E, Ferencz BK, Iftene F,Benga I, Cornean R, Banerjee R, Dronca M: One carbon metabolismdisturbances and the C677T MTHFR gene polymorphism in childrenwith autism spectrum disorders. J Cell Mol Med 2009, 13(10):4229-4238.
12. Chauhan A, Chauhan V, Brown WT, Cohen IL: Oxidative stress in autism:Increased lipid peroxidation and reduced serum levels of ceruloplasminand transferrin - the antioxidant proteins. Life Sci 2004, 75:2539-2549.
13. Chauhan A, Chauhan V: Oxidative stress in autism. Pathophysiology 2006,13(3):171-81.
14. El-Ansary A, Al-Daihan S, Al-Dbass A, Al-Ayadhi L: Measurements ofselected ions related to oxidative stress and energy metabolism in Saudiautistic children. Clin Biochem 2010, 43(1-2):63-70.
15. Al-Gadani Y, El-Ansary A, Attas O, Al-Ayadhi L: Metabolic biomarkersrelated to oxidative stress and antioxidant status in Saudi autisticchildren. Clin Biochem 2009, 42(10-11):1032-40.
16. Adams JB, Holloway CJ: Pilot study of a moderate dose multivitamin/mineral supplement for children with autistic spectrum disorder. AlternComplement Med 2004, 10(6):1033-9.
17. Adams JB, George F, Audhya T: Abnormally high plasma levels of vitaminB6 in children with autism not taking supplements compared tocontrols not taking supplements. J Altern Complement Med 2006,12(1):59-63.
18. Xia W, Zhou Y, Sun C, Wang J, Wu L: A preliminary study on nutritionalstatus and intake in Chinese children with autism. Eur J Pediatr 2010,69(10):1201-6.
19. Meguid NA, Hashish AF, Anwar M, Sidhom G: Reduced serum levels of 25-hydroxy and 1,25-dihydroxy vitamin D in Egyptian children with autism.J Altern Complement Med 2010, 16(6):641-5.
20. Krajkovicova-Kudlackova M, Valachovicova M, Mislanova C, Hudecova Z,Sudstrova M, Ostatnikova D: Plasma concentration of selectedantioxidants in autistic children and adolescents. Bratisl Lek Listy 2009,110(4):247-250.
21. Adams JB, Holloway CE, George F, Quig D: Analyses of toxic metals andessential minerals in the hair of Arizona children with autism andassociated conditions, and their mothers. Biol Trace Elem Res 2006,110(3):193-209.
22. Latif A, Heinz P, Cook R: Iron Deficiency in Autism and AspergerSyndrome. Autism 2002, 6:103.
23. Dosman CF, Drmic IE, Brian JA, Senthilselvan A, Harford M, Smith R,Roberts SW: Ferritin as an indicator of suspected iron deficiency inchildren with autism spectrum disorder: prevalence of low serum ferritinconcentration. Dev Med Child Neurol 2006, 48(12):1008-9.
24. Jory J, McGinnis W: Red-Cell Trace Minerals in Children with Autism.American Journal of Biochemistry and Biotechnology 2008, 4(2):101-104.
25. Jackson MJ, Gerard PJ: Plasma Zinc, Copper, and Amino Acid Levels inthe Blood of Autistic Children. J Autism Childhood Schizophrenia 1978,8(2):203-208.
26. Yorbik O, Akay C, Sayal A, Cansever A, Sohmen T, Cavdar AO: Zinc Status inAutistic Children. J Trace Elements Experimental Medicine 2004, 17:101-107.
Adams et al. Nutrition & Metabolism 2011, 8:34http://www.nutritionandmetabolism.com/content/8/1/34
Page 30 of 32
27. Faber S, Zinn GM, Kern JC, Kingston HM: The plasma zinc/serum copperratio as a biomarker in children with autism spectrum disorders.Biomarkers 2009, 14(3):171-180.
28. Aldred S, Moore KM, Fitzgerald M, Waring RH: Plasma amino acid levels inchildren with autism and their families. J Autism Dev Disord 2003,33(1):93-7.
29. Morena-Fuenmayor J, Borjas I, Arrieta A, Balera V, Socorro-Candanoza I:Plasma excitatory amino acids in autism. Investigacion Clinica 1996,37:113-128.
30. Rolf LH, Haarmann FY, Grotemeyer KH, Kehrer H: Serotonin and aminoacid content in platelets of autistic children. Acta Psychiatr Scand 1993,87(5):312-6.
31. Arnold GL, Hyman SL, Mooney RA, Kirby RS: Plasma amino acids profilesin children with autism: potential risk of nutritional deficiencies. J AutismDev Disord 2003, 33(4):449-54.
32. Lepage N, McDonald N, Dallaire L, Lambert M: Age-specific distribution ofplasma amino acid concentrations in a healthy pediatric population. ClinChem 1997, 43(12):2397-402.
33. Miller RC, Brindle E, Holman DJ, Shofer J, Klein NA, Soules MR, O’Connor KA:Comparison of specific gravity and creatinine for normalizing urinaryreproductive hormone concentrations. Clin Chem 2004, 50(5):924-32.
34. Puchyr RF, Bass DA, Gajewski R, Calvin M, Marquardt W, Urek K, Druyan ME,Quig D: Preparation of hair for measurement of elements by inductivelycoupled plasma-mass spectrometry (ICP-MS). Biol Trace Elem Res 1998,62(3):167-82.
35. Cohen IL, Schmidt-Lackner S, Romanczyk R, Sudhalter V: The PDD BehaviorInventory: a rating scale for assessing response to intervention inchildren with pervasive developmental disorder. J Autism Dev Disord2003, 33(1):31-45.
36. Rimland B, Edelson S: Autism Treatment Evaluation Checklist: StatisticalAnalyses. Autism Research Institute 2000.
37. Adams JB, Baral M, Geis E, Mitchell J, Ingram J, Hensley A, Zappia I,Newmark S, Gehn E, Rubin RA, Mitchell K, Bradstreet J, El-Dahr JM: Theseverity of autism is associated with toxic metal body burden and redblood cell glutathione levels. J Toxicol 2009, 2009:532640.
38. U.S Centers for Disease Control and Prevention: National Report onBiochemical Indicators of Diet and Nutrition in the U.S. Population 1999-2002. Atlanta (GA): National Center for Environmental Health; 2008.
39. Burtis CA, Ashwood ER: Tietz Textbook of Clinical Chemistry. Philadelphia:W.B. Saunders Company;, 3 1999.
40. Bertoli S, Cardinali S, Veggiotti P, Trentani C, Testolin G, Tagliabue A:Evaluation of nutritional status in children with refreactory epilepsy.Nutrition Journal 2006, 5:14.
41. Harden CL, Pennell PB, Koppel BS, Hovinga CA, Gidal B, Meador KJ, Hopp J,Ting TY, Hauser WA, Thurman D, Kaplan PW, Robinson JN, French JA,Wiebe S, Wilner AN, Vazquez B, Holmes L, Krumholz A, Finnell R, Shafer PO,Le Guen C: Practice Parameter Update: Management issues for womenwith epilepsy–focus on pregnancy (an evidence-based review): VitaminK, folic acid, blood levels, and breastfeeding. Neurology 2009,73(2):126-132.
42. Gökçe S, Durmaz Ö, Çeltik C, Aydoğan A, Güllüoğlu M, Sökücü S: ValproicAcid–Associated Vanishing Bile Duct Syndrome. Journal of Child Neurology2010, 25(7):909-911.
43. Ornoy A: Valproic acid in pregnancy: How much are we endangering theembryo and fetus? Reproductive Toxicology 2009, 28:1-10.
44. Pronsky ZM, Crowe JP, Elbe D, et al: Food Medication Interactions.Birchrunville PA;, 15 2008.
45. Adams JB, Holloway C: Pilot study of a moderate dose multivitamin/mineral supplement for children with autistic spectrum disorder. J AlternComplement Med 2004, 10(6):1033-9.
46. Adams JB, George F, Audhya T: Abnormally high plasma levels of vitaminB6 in children with autism not taking supplements compared tocontrols not taking supplements. J Altern Complement Med 2006,12(1):59-63.
47. Thurnham DI: Micronutrients and immune function: some recentdevelopments. J Clin Pathol 1997, 50:887-91.
48. Cannell JJ: Autism and vitamin D. Med Hypothesis 2008, 70(4):750-9.49. Molloy CA, Kalkwarf HJ, Manning-Courtney P, Mills JL, Hediger ML: Plasma
25(OH)D concentration in children with autism spectrum disorder. DevMed Child Neurol 2010, 52(10):969-71, Epub 2010 May 24.
50. Adams M, Lucock M, Stuart J, Fardell S, Baker K, Ng X: Preliminaryevidence for involvement of the folate gene polymorphism 19 bpdeletion-DHFR in occurrence of autism. Neurosci Lett 2007, 422(1):24-9.
51. Yap IK, Angley M, Veselkov KA, Holmes E, Lindon JC, Nicholson JK: UrinaryMetabolic Phenotyping Differentiates Children with Autism from TheirUnaffected Siblings and Age-Matched Controls. J Proteome Res 2010,9(6):2996-3004.
52. McGinnis WR, Audhya T, Walsh WJ, Jackson JA, McLaren-Howard J, Lewis A,Lauda PH, Bibus DM, Jurnak F, Lietha R, Hoffer A: Discerning the MauveFactor, Part 1. Altern Ther Health Med 2008, 14(2):40-50.
53. Anke M, Arhnold W, Groppel B, Krause U: The Biological Importance ofLithium. In Lithium in Biology and Medicine. Edited by: Schrauzer GN,Klippel, KF. Weinheim: VCH Verlag; 1991:149-167.
54. Konstantareas MM, Homatidis S: Ear infections in autistic and normalchildren. J Autism Dev Disord 1987, 17:585-594.
55. Adams JB, Holloway CE, George F, Quig D: Analyses of toxic metals andessential minerals in the hair of Arizona children with autism andassociated conditions, and their mothers. Biol Trace Elem Res 2006,10(3):193-209.
56. Adams JB, Romdalvik J, Ramanujam VMS, Legator MS: Mercury, lead, andzinc in baby teeth of children with autism vs. controls. J. ToxicologyEnviron. Health A 2007, 70:1046-1051.
57. Adams JB, Romdalvik J, Levine KE, Hu L-W: Mercury in First-Cut Baby Hairof Children with Autism vs. Typically-Developing Children. Toxicologicaland Environmental Chemistry 2008, 90(4):739-753.
58. Schrauzer GN, Shrestha KP: Lithium in drinking water and the incidencesof crimes, suicides, and arrests related to drug addictions. Biol Trace El.Res 1990, 25:105-113.
59. Yuskaitis CJ, Mines MA, King MK, Sweatt JD, Miller CA, Jope RS: Lithiumameliorates altered glycogen synthase kinase-3 and behavior in a mousemodel of fragile X syndrome. Biochem Pharmacol 2010, 79(4):632-46.
60. Serajee FJ, Nabi R, Zhong H, Mahbubul Huq AH: Association of INPP1,PIK3CG, and TSC2 gene variants with autistic disorder: implications forphosphatidylinositol signalling in autism. J Med Genet 2003, 40(11):e119.
61. World Health Organization: Assessment of iodine deficiency disorders andmonitoring their elimination: a guide for programme managers. WorldHealth Organization: Geneva (Switzerland);, 3 2007 [http://whqlibdoc.who.int/publications/2007/9789241595827_eng.pdf], accessed May 2011.
62. Waring RH, Ngong JM, Klovsra L, Green S, Sharp H: BiochemicalParameters in Autistic Children. Dev Brain Dysfunct 1997, 10:40-43.
63. Geier DA, Kern JK, Garver CR, Adams JB, Audhya T, Geier MR: A prospectivestudy of transsulfuration biomarkers in autistic disorders. Neurochem Res2009, 34(2):386-93, Erratum in: Neurochem Res. 2009, 34(2):394.
64. O’Reilly BA, Warning RH: Enzyme and Sulphur Oxidation Deficiencies inAutistic Children with Known Food/Chemical Sensitivities. JOrthomolecular Medicine 1993, 8(4):198-200.
65. Alberti A, Pirrone P, Elia M, Waring RH, Romano C, Alberti A, Pirrone P,Elia M, Waring RH, Romano C: Sulphation deficit in “low-functioning”autistic children: a pilot study. Biol Psychiatry 1999, 46(3):420-4.
66. Horvath K, Perman JA: Autistic disorder and gastrointestinal disease. CurrOpin Pediatr 2002, 14:583-587.
67. Waring RH, Klovrsa LV: Sulfur Metabolism in Autism. J Nutritional &Environmental Medicine 2000, 10:25-32.
68. Kloor D, Lüdtke A, Stoeva S, Osswald H: Adenosine binding sites at S-adenosylhomocysteine hydrolase are controlled by the NAD+/NADHratio of the enzyme. Biochem Pharmacol 2003, 66:2117-23.
69. Kloor D, Osswald H: S-adenosylhomocysteine hydrolase as a target forintracellular adenosine action. Trends Pharmacol Sci 2004, 25:294-7.
70. Ming X, Brimacombe M, Wagner GC: Prevalence of motor impairment inautism spectrum disorders. Brain Dev 2007, 29(9):565-70.
71. Belenky P, Bogan KL, Brenner C: NAD+ metabolism in health and disease.Trends Biochem Sci 2007, 32(1):12-9, Erratum in: Trends Biochem Sci. 2008,33(1):1.
72. Weissman JR, Kelley RI, Bauman ML, Cohen BH, Murray KF, Mitchell RL,Kern RL, Natowicz MR: Mitochondrial disease in autism spectrum disorderpatients: a cohort analysis. PLoS One 2008, 3(11):e3815.
73. Oliveira G, Ataíde A, Marques C, Miguel TS, Coutinho AM, Mota-Vieira L,Gonçalves E, Lopes NM, Rodrigues V, Carmona da Mota H, Vicente AM:Epidemiology of autism spectrum disorder in Portugal: prevalence,clinical characterization, and medical conditions. Dev Med Child Neurol2007, 49(10):726-33.
Adams et al. Nutrition & Metabolism 2011, 8:34http://www.nutritionandmetabolism.com/content/8/1/34
Page 31 of 32
74. Oliveira G, Diogo L, Grazina M, Garcia P, Ataíde A, Marques C, Miguel T,Borges L, Vicente AM, Oliveira CR: Mitochondrial dysfunction in autismspectrum disorders: a population-based study. Dev Med Child Neurol 2005,47(3):185-9.
75. Correia C, Coutinho AM, Diogo L, Grazina M, Marques C, Miguel T, Ataíde A,Almeida J, Borges L, Oliveira C, Oliveira G, Vicente AM: Brief report: Highfrequency of biochemical markers for mitochondrial dysfunction inautism: no association with the mitochondrial aspartate/glutamatecarrier SLC25A12 gene. J Autism Dev Disord 2006, 36(8):1137-40.
76. Pebay-Peyroula E, Dahout-Gonzalez C, Kahn R, Trézéguet V, Lauquin GJ,Brandolin G: Structure of mitochondrial ADP/ATP carrier in complex withcarboxyatractyloside. Nature. Nature 2003, 426:39-44.
77. McDougle CJ, Naylor ST, Cohen DJ, Aghajanian GK, Heninger GR, Price LH:Effects of tryptophan depletion in drug-free adults with autistic disorder.Arch Gen Psychiarty 1996, 53(11):993-1000.
78. Pangborn J: Detection of Metabolic Disorders in People with Autism.Proceedings of the 1984 Annual Conference of the National Society forChildren and Adults with Autism San Antonio, Texas; 1984, 32-51.
79. Mehl-Madrona L, Leung B, Kennedy C, Paul S, Kaplan BJ: Micronutrientsversus standard medication management in autism: a naturalistic case-control study. J Child Adolesc Psychopharmacol 2010, 20(2):95-103.
80. Selvaraj RJ, Susheela TP: Estimation of serum vitamin A by amicrofluorometric procedure. Clin Chim Acta 1970, 27(1):165-70.
81. Stevens RD, Hillman SL, Worthy S, Sanders D, Millington DS: Assay for freeand total carnitine in human plasma using tandem mass spectrometry.Clin Chem 2000, 46(5):727-9.
82. Pearson WN: Biochemical appraisal of nutritional status in man. Am J ClinNutr 1962, 11:462-76.
83. Vogeser M, Kyriatsoulis A, Huber E, Kobold U: Candidate reference methodfor the quantification of circulating 25-hydroxyvitamin D3 by liquidchromatography-tandem mass spectrometry. Clin Chem 2004,50(8):1415-7.
84. Quaife ML, Scrimshaw NS, Lowry OH: A micromethod for assay of totaltocopherols in blood serum. J Biol Chem 1949, 180(3):1229-35.
85. Van Haard PM, Engel R, Pietersma-de Bruyn AL: Quantitation of trans-vitamin K1 in small serum samples by off-line multidimensional liquidchromatography. Clin Chim Acta 1986, 157(3):221-30.
86. Baker H, Frank O, Fennelly JJ, Leevy CM: A Method for Assaying ThiamineStatus in Man and Animals. Am J Clin Nutr 1964, 14:197-201.
87. Baker H, Frank O, Feingold S, Gellene RA, Leevy CM, Hutner SH: A riboflavinassay suitable for clinical use and nutritional surveys. Am J Clin Nutr1966, 19(1):17-26.
88. Baker H, Frank O, Pasher I, Hutner SH, Sobotka H: Nicotinic acid assay inblood and urine. Clin Chem 1960, 6:572-7.
89. Baker H, Frank O, Pasher I, Dinnerstein A, Sobotka H: An assay forpantothenic acid in biologic fluids. Clin Chem 1960, 6:36-42.
90. Baker H, Frank O, Ning M, Gellene RA, Hutner SH, Leevy CM: Aprotozoological method for detecting clinical vitamin B6 deficiency. AmJ Clin Nutr 1966, 18(2):123-33.
91. Baker H, Frank O, Matovitch VB, Pasher I, Aaronson S, Hutner SH, Sobotka H:A new assay method for biotin in blood, serum, urine, and tissues. AnalBiochem 1962, 3:31-9.
92. Herbert V, Baker H, Frank O, Pasher I, Sobotka H, Wasserman LR: Themeasurement of folic acid activity in serum: a diagnostic aid in thedifferentiation of the megaloblastic anemias. Blood 1960, 15:228-35.
93. Sobotka H, Baker H, Ziffer H: Distribution of vitamin B12 between plasmaand cells. Am J Clin Nutr 1960, 8:283-4.
94. Baker H, Frank O, Tuma DJ, Barak AJ, Sorrell MF, Hutner SH: Assay for freeand total choline activity in biological fluids and tissues of rats and manwith Torulopsis pintolopessi. Am J Clin Nutr 1978, 31(3):532-40.
95. Baker H, Deangelis B, Baker ER, Hutner SH: A practical assay of lipoate inbiologic fluids and liver in Health and disease. Free Radic Biol Med 1998,25(4-5):473-9.
96. Okamoto T, Fukunaga Y, Ida Y, Kishi T: Determination of reduced andtotal ubiquinones in biological materials by liquid chromatography withelectrochemical detection. J Chromatogr 1988, 430(1):11-9.
97. Harmsen E, de Jong JW, Serruys PW: Hypoxanthine production byischemic heart demonstrated by high pressure liquid chromatographyof blood purine nucleosides and oxypurines. Clin Chim Acta 1981,115(1):73-84.
98. Tabor H, Wyngarden LA: Method for the Determination ofFormiminoglutamic Acid in Urine. J Clin Invest 1958, 37:824-828.
99. Miller RC, Brindle E, Holman DJ, Shofer J, Klein NA, Soules MR, O’Connor KA:Comparison of specific gravity and creatinine for normalizing urinaryreproductive hormone concentrations. Clin Chem 2004, 50(5):924-32.
100. Sohler A, Holsztyimska E, Pfeiffer CC: A Rapid Screening Test for Pyroluria;Useful in Distinguishing a Schizophrenic Subpopulation. OrthomolecularPsych 1978, 3:273-279.
101. Magera MJ, Helgeson JK, Matern D, Rinaldo P: Methylmalonic acidmeasured in plasma and urine by stable-isotope dilution andelectrospray tandem mass spectrometry. Clin Chem 2000, 46(11):1804-10.
102. Creeke PI, Seal AJ: Quantitation of the niacin metabolites 1-methylnicotinamide and l-methyl-2-pyridone-5-carboxamide in randomspot urine samples, by ion-pairing reverse-phase HPLC with UVdetection, and the implications for the use of spot urine samples in theassessment of niacin status. J Chromatogr B Analyt Technol Biomed Life Sci2005, 817(2):247-53.
103. Melnyk S, Pogribna M, Pogribny IP, Yi P, James SJ: Measurement of plasmaand intracellular S-adenosylmethionine and S-adenosylhomocysteineutilizing coulometric electrochemical detection: alterations with plasmahomocysteine and pyridoxal 5’-phosphate concentrations. Clin Chem2000, 46(2):265-72.
104. Stabler SP, Allen RH: Quantification of Serum and Urinary S-Adenosylmethionine and S-Adenosylhomocysteine by Stable-Isotope-Dilution Liquid Chromatography-Mass Spectrometry. Clinical Chemistry2004, 50:365-372.
105. Michelet F, Gueguen R, Leroy P, Wellman M, Nicolas A, Siest G: Blood andplasma glutathione measured in healthy subjects by HPLC: relation tosex, aging, biological variables, and life habits. Clin Chem 1995,41(10):1509-17.
106. Ahmed N, Thornalley PJ: Quantitative screening of protein biomarkers ofearly glycation, advanced glycation, oxidation and nitrosation in cellularand extracellular proteins by tandem mass spectrometry multiplereaction monitoring. Biochemical Society Transactions 2003, 31:1417-1422.
107. Gorman MW, Feigl EO, Buffington CW: Human plasma ATP concentration.Clin Chem 2007, 53(2):318-25.
108. Klemm A, Klemm A, Steiner T, Flötgen U, Cumme GA, Horn A:Determination, purification, and characterization of alpha-NADH andalpha-NADPH. Methods Enzymol 1997, 280:171-86.
109. Chattaraj S, Das AK: Indirect atomic absorption spectrometricdetermination of sulfate in human blood serum. Analyst 1992,117(3):413-6.
110. Wyatt DT, Nelson D, Hillman RE: Age-dependent changes in thiaminconcentrations in whole blood and cerebrospinal fluid in infants andchildren. Am J Clin Nutr 1991, 53(2):530-6.
111. Schleicher RL, Carroll MD, Ford ES, Lacher DA: Serum vitamin C and theprevalence of vitamin C deficiency in the United States: 2003-2004National Health and Nutrition Examination Survey (NHANES). Am J ClinNutr 2009, 90(5):1252-63.
doi:10.1186/1743-7075-8-34Cite this article as: Adams et al.: Nutritional and metabolic status ofchildren with autism vs. neurotypical children, and the association withautism severity. Nutrition & Metabolism 2011 8:34.
Submit your next manuscript to BioMed Centraland take full advantage of:
• Convenient online submission
• Thorough peer review
• No space constraints or color figure charges
• Immediate publication on acceptance
• Inclusion in PubMed, CAS, Scopus and Google Scholar
• Research which is freely available for redistribution
Submit your manuscript at www.biomedcentral.com/submit
Adams et al. Nutrition & Metabolism 2011, 8:34http://www.nutritionandmetabolism.com/content/8/1/34
Page 32 of 32
Related Documents