This Provisional PDF corresponds to the article as it appeared upon acceptance. Fully formatted PDF and full text (HTML) versions will be made available soon. Bio F1B hamster: a unique animal model with reduced lipoprotein lipase activity to investigate nutrient mediated regulation of lipoprotein metabolism Nutrition & Metabolism 2007, 4:27 doi:10.1186/1743-7075-4-27 Sukhinder K Cheema ([email protected]) Marion L Cornish ([email protected]) ISSN 1743-7075 Article type Research Submission date 4 July 2007 Acceptance date 10 December 2007 Publication date 10 December 2007 Article URL http://www.nutritionandmetabolism.com/content/4/1/27 This peer-reviewed article was published immediately upon acceptance. It can be downloaded, printed and distributed freely for any purposes (see copyright notice below). Articles in Nutrition & Metabolism are listed in PubMed and archived at PubMed Central. For information about publishing your research in Nutrition & Metabolism or any BioMed Central journal, go to http://www.nutritionandmetabolism.com/info/instructions/ For information about other BioMed Central publications go to http://www.biomedcentral.com/ Nutrition & Metabolism © 2007 Cheema and Cornish, licensee BioMed Central Ltd. This is an open access article distributed under the terms of the Creative Commons Attribution License ( http://creativecommons.org/licenses/by/2.0), which permits unrestricted use, distribution, and reproduction in any medium, provided the original work is properly cited.

Welcome message from author
This document is posted to help you gain knowledge. Please leave a comment to let me know what you think about it! Share it to your friends and learn new things together.
Transcript
This Provisional PDF corresponds to the article as it appeared upon acceptance. Fully formattedPDF and full text (HTML) versions will be made available soon.
Bio F1B hamster: a unique animal model with reduced lipoprotein lipase activityto investigate nutrient mediated regulation of lipoprotein metabolism
Nutrition & Metabolism 2007, 4:27 doi:10.1186/1743-7075-4-27
Sukhinder K Cheema ([email protected])Marion L Cornish ([email protected])
ISSN 1743-7075
Article type Research
Submission date 4 July 2007
Acceptance date 10 December 2007
Publication date 10 December 2007
Article URL http://www.nutritionandmetabolism.com/content/4/1/27
This peer-reviewed article was published immediately upon acceptance. It can be downloaded,printed and distributed freely for any purposes (see copyright notice below).
Articles in Nutrition & Metabolism are listed in PubMed and archived at PubMed Central.
For information about publishing your research in Nutrition & Metabolism or any BioMed Centraljournal, go to
http://www.nutritionandmetabolism.com/info/instructions/
For information about other BioMed Central publications go to
http://www.biomedcentral.com/
Nutrition & Metabolism
© 2007 Cheema and Cornish, licensee BioMed Central Ltd.This is an open access article distributed under the terms of the Creative Commons Attribution License (http://creativecommons.org/licenses/by/2.0),
which permits unrestricted use, distribution, and reproduction in any medium, provided the original work is properly cited.

1
Bio F1B hamster: a unique animal model with reduced lipoprotein lipase activity to investigate nutrient mediated regulation of lipoprotein metabolism
Sukhinder Kaur Cheema§ and Marion L. Cornish
Department of Biochemistry, Memorial University
St. John’s, NL, A1B 3X9 Canada
§Corresponding author
Email addresses:
SKC: [email protected]
MLC: [email protected]
2
Abstract
Background
Bio F1B hamster is an inbred hybrid strain that is highly susceptible to diet-induced atherosclerosis.
We previously reported that feeding a high fat fish oil diet to Bio F1B hamster caused severe
hyperlipidaemia. In this study we compared the effects of various diets in the Bio F1B hamster and
the Golden Syrian hamster, which is an outbred hamster strain to investigate whether genetic
background plays an important role in dietary fat mediated regulation of lipoprotein metabolism.
We further investigated the mechanisms behind diet-induced hyperlipidaemia in F1B hamster.
Methods
The Bio F1B and Golden Syrian hamsters, 8 weeks old, were fed high fat diets rich in either
monounsaturated fatty acids, an n-6: n-3 ratio of 5 or a fish oil diet for 4 weeks. Animals were
fasted overnight and blood and tissue samples were collected. Plasma was fractionated into various
lipoprotein fractions and assayed for triacylglycerol and cholesterol concentrations. Plasma
lipoprotein lipase activity was measured using radioisotope method. Microsomal triglyceride
transfer protein activity was measured in the liver and intestine. Plasma apolipoproteinB48, –B100
and apolipoprotein E was measured using Western blots. Two-way ANOVA was used to determine
the effect of diet type and animal strain.
Results
The fish oil fed F1B hamsters showed milky plasma after a 14-hour fast. Fish oil feeding caused
accumulation of apolipoproteinB48 containing lipoprotein particles suggesting hindrance of
triglyceride-rich lipoprotein clearance. There was no significant effect of diet or strain on hepatic or
intestinal microsomal triglyceride transfer protein activity indicating that hyperlipidaemia is not due
to an increase in the assembly or secretion of lipoprotein particles. F1B hamsters showed
significantly reduced levels of lipoprotein lipase activity, which was inhibited by fish oil feeding.
Conclusions
Evidence is presented for the first time that alterations in lipoprotein lipase activity and mRNA
levels contribute to varied response of these hamsters to dietary fat, highlighting the importance of
genetic background in the regulation of lipid and lipoprotein metabolism by dietary fats. Bio F1B

3
hamster may prove to be an important animal model to investigate nutrient mediated regulation of
metabolic parameters under lipoprotein lipase deficiency.
Background
High levels of plasma triglycerides (TG) are considered to be an independent risk factor for
the development of cardiovascular disease (CVD) [1]. Hypertriglyceridaemia is representative of
abnormal postprandial lipemia, and is defined as elevated postprandial TG concentrations above
2.26 mmol/L, and commonly accompanies the development of Type II Diabetes and obesity [2].
Hypertriglyceridaemia arises mainly from alterations in lipid and lipoprotein metabolism that affect
the clearance of TG-rich lipoproteins, namely very-low density lipoproteins (VLDL) and
chylomicrons. This increase can be due to several factors; i.e. increased production and secretion of
VLDL and chylomicrons from the liver and intestine respectively, a decrease in their hydrolysis by
lipoprotein lipase (LPL) or hepatic uptake by the low-density lipoprotein (LDL) receptor. The
subsequent development of hypertriglyceridaemia is detrimental to cardiovascular health as it
promotes a decrease in high-density lipoprotein (HDL) concentrations, a simultaneous increase in
LDL, and an increase in the prevalence of small, dense LDL particles. These factors are
characteristic of an atherogenic lipoprotein phenotype that increases the risk for the onset of CVD
[3-4].
Dietary fat intake has the most influence on both the development and demise of
hypertriglyceridaemia. Saturated fatty acids (SFA) are known to increase LDL-cholesterol and
promote the formation of atherosclerotic lesions, while unsaturated fatty acids, particularly omega-3
(n-3) fatty acids are known to decrease TG concentrations [5]. The marine derived n-3 fatty acids;
eicosapentaenoic acid and docosahexaenoic acid, found in fish oil, are suggested to be one of the
most successful dietary interventions for reducing hypertriglyceridaemia [6]. These fatty acids have
been shown to maintain a positive lipoprotein phenotype by decreasing plasma TG concentrations,
decreasing VLDL synthesis and secretion, decreasing the production of apolipoproteinB100
(apoB100), and increasing the clearance of TG-rich lipoproteins [7]. However, the effect of fish oil
on LDL levels and lipoprotein lipase activity is less consistent. Fish oil has been shown to increase,
decrease, or have no effect on plasma LDL-cholesterol [8-9], and LPL activity [10-13].
We previously used F1B hamster to investigate the regulation of lipid and lipoprotein
metabolism by fish oil [14]. Surprisingly, we found that high levels of fish oil induced severe

4
hyperlipidaemia in F1B hamsters. The presence of severe hyperlipidaemia in fish oil fed F1B
hamsters indicated either an enhanced synthesis of TG-rich lipoproteins or inhibited clearance of
TG-rich lipoproteins. In this study, we compared the effects of various diets, including high fat fish
oil diet, in the Bio F1B hamster and the Golden Syrian (GS) hamster. We further investigated the
mechanisms behind hyperlipidaemia in the F1B hamsters. The Bio F1B is derived from two highly
inbred lines, by crossbreeding between Bio 87.20 female with a Bio 1.5 male. The Bio F1B hamster
was initially used as a genetic defined control for cardiomyopathy. However, it has recently
become an exciting animal model for hyperlipidemic-related applications. The Golden Syrian
hamster, on the other hand, is an outbred hamster strain which is used as a control. Our findings
highlight the importance of genetic background in regulating plasma lipid and lipoprotein levels.
Methods
Animals and Diets
Seven week old, male Bio F1B and Golden Syrian (GS) hamsters were obtained from
Biobreeders Inc. (Maryland, USA) and Charles River Labs (Kingston, NY, USA) respectively. The
animals were kept on a chow diet for one week prior to feeding the specified diets. After this
equilibration period, animals in each strain were divided into one of three groups (n = 12, F1B; n =
12, GS) and fed one of the three specified diets for a period of four weeks. These specified diets
consisted of fat-free semi-purified diet (ICN biomedicals, Ohio, USA) supplemented with 200g/kg
(20% w/w) of either fish oil (FO) (Menhaden oil, Sigma-Aldrich, Ontario, Canada), high
monounsaturated fatty acid (MUFA) safflower oil obtained from a local supermarket (MUFA), or a
diet designed to give the animals an n-6:n-3 fatty acid ratio of ~5 (n6:n3). Due to the presence of
2.5g/kg cholesterol in the fish oil diet, cholesterol was added to the MUFA and n6:n3 diets in
appropriate proportions. The diets were kept at –20 °C and fresh diets were given daily ad libitum.
The composition of all three experimental diets is given in Table 1. Lipids were extracted from all
diets and analyzed via gas liquid chromatography [15], the fatty acid composition of which is given
in Table 2. Food intake was measured daily and animal body weight was measured weekly. There
was no significant effect of diet on food intake or body weight in F1B and GS hamsters (data not
shown). The animals were housed in individual cages in a single room. The room was lit from 0700
hrs to 1900 hrs with the temperature maintained at 21°C and humidity at 35 ± 5%. All procedures

5
were approved by Memorial University’s Institutional Animal Care Committee in accordance with
the guidelines of the Canadian Council for Animal Care.
Plasma Lipid and Lipoprotein Profile
After the four-week feeding period, the animals were fasted for 14 hours prior to sacrifice.
The hamsters were anaesthetized by halothane sniffing, heart was punctured and fasting blood
samples were collected in tubes containing EDTA (n=6, F1B; n=6, GS). The remaining animals
were used for post-heparin injections for the LPL assay. The plasma was separated by
centrifugation at 3000g for ten minutes and stored on ice at 4°C until further analysis. The F1B
hamsters fed the fish oil diet had milky plasma containing chylomicron-like particles. These
particles were then isolated by centrifugation at 15 500g for 20 minutes at 12°C. Individual
lipoprotein fractions were isolated by sequential density gradient ultracentrifugation on a TL100
fixed angle rotor as described previously [14]. The plasma and individual lipoprotein fractions were
analyzed using enzymatic kit methods for total cholesterol (Cholesterol Liquicolor Kit, Stanbio,
Texas, USA), TG (Triglyceride Enzymatic Kit, Stanbio Labs, Texas, USA), and free cholesterol
(FC) concentrations (Wako Chemicals, Virginia, USA). Cholesterol ester (CE) concentrations were
calculated by subtracting free cholesterol concentrations from total cholesterol concentrations. All
measurements were performed within one week of plasma collection.
Hepatic Lipid Profile
Livers were obtained from each hamster, freeze-clamped in liquid nitrogen, and stored at -
70°C until further use. Liver lipids were extracted as described previously [16]. The liver lipids
were analyzed using enzymatic kit methods for total cholesterol (Cholesterol Liquicolor Kit,
Stanbio, Texas, USA), TG (Triglyceride Enzymatic Kit, Stanbio Labs, Texas, USA), and FC (Wako
Chemicals, Virginia, USA) concentrations. CE concentrations were calculated by subtracting free
cholesterol concentrations from total cholesterol concentrations.
FPLC Separation of Plasma
Pooled plasma samples (equal volumes from each hamster) were separated by FPLC on a
Superose 6 chromatography column (Amersham Biosciences, Quebec, Canada). The plasma
cholesterol profile was determined by using an online enzymatic assay reagent (Cholesterol
Liquicolor Kit, Stanbio, Texas, USA) as per previously described methods [17].

6
Lipoprotein lipase (LPL) activity and LPL mRNA levels
Post-heparin LPL activity was measured using previously described methods [18]. Briefly,
after the four-week feeding period and 14 hour fast, F1B and GS hamsters (n = 6) on all three diets
were anaesthetized and 200µL of heparin (7500 units/kg body weight) was directly injected into the
heart. To allow the LPL enzyme to be released into the plasma, the heparin was allowed to circulate
for five minutes. Upon sacrifice, blood was collected by cardiac puncture and separated by
centrifugation at 3000g for ten minutes and stored on ice at 4°C. A separate group of hamsters fed
all 3 dietary groups and not injected with heparin were used for pre-heparin LPL activity. LPL
activity was assayed using Tri [9, 10-3H] oleoyl glycerol (Amersham Biosciences, NJ, USA). A
0.15M NaCl solution was used in order to measure total lipase activity, while a 3.55M NaCl
solution was used for hepatic lipase activity [18]. LPL activity was calculated by subtracting hepatic
lipase activity from total lipase activity, and expressed in nmol/min/ml.
Adipose tissue RNA was extracted using TRIZOL reagent (Invitrogen Life Technologies
Inc., Gaithersburg, MD, USA) and LPL mRNA levels were determined by reverse transcription and
in vitro DNA amplification. cDNA was synthesized from total liver RNA (2 µg) using Superscript
reverse transcriptase (Life Technologies, Burlington, ON, Canada) and used as templates for in
vitro DNA amplification reactions. LPL and β-actin mRNA sequences were simultaneously
amplified using specific primers. The primer sequence for LPL mRNA amplification was: sense
5’CATTCACCAGAGGGTCACCT3’ and anti-sense 5’TTCTTCGTTCAGCAGGGAGT3’. No
amplification products were detectable in the absence of reverse transcriptase. The total number of
cycles for each PCR reaction was chosen to remain within the exponential phase of the reaction.
All PCR reactions were performed in triplicate, and the products were resolved on 1.2 % agarose
gel. The representative bands were quantitated using gel documentation system. The amount of
LPL mRNA was normalized to β-actin mRNA content and expressed as relative units.
Western blot analysis of Apolipoprotein B (apoB) and Apolipoprotein E (apoE)
The western blot analysis was conducted by the modification of previously published
methods [19]. Plasma samples containing 60µg and 30µg of protein were used for the
immunoblotting of apoB and apoE respectively. Proteins were separated on a 6% (apoB) or 10%
(apoE) SDS polyacrylamide gel and transferred to a nitrocellulose membrane. ApoB blots were
incubated with goat polyclonal antibody at a dilution of 1:1000 (Calbiochem, California, USA).

7
ApoB was visualized using a secondary bovine anti-goat IgG conjugated to horseradish peroxidase
(Santa Cruz, California, USA). ApoE blots were incubated with rabbit polyclonal antibody at a
dilution of 1:2000 (Dako, Germany). ApoE was visualized using anti-rabbit-HRP-linked antibody
(Calbiochem, California, USA). Both apoB and apoE were detected using an enhanced Luminol
chemiluminescence reagent system (Santa Cruz, California, USA). A biotinylated protein ladder
(Calbiochem, California, USA) was run with each gel.
Microsomal triglyceride transfer protein (MTTP) activity assay
Upon sacrifice, the livers and intestine were obtained and freeze-clamped in liquid nitrogen
and stored at -70°C. MTTP activity was measured using 150µg protein from hepatic and intestinal
samples from F1B and GS hamsters on all three diets using kit methods from Roar Biomedical Inc.
(New York, USA). MTTP activity was measured at an excitation wavelength of 465nm and an
emission wavelength of 535nm. MTTP mediated transfer is observed by the increase in
fluorescence intensity as the fluorescent neutral lipid is removed from the self quenched donor to
the acceptor. MTTP activity is expressed in nmol/mg/hour.
Statistical Analysis
The effect of both diet type (D) and animal strain (S) was determined using two-way
ANOVA. A Newman-Keuls post-hoc test was used to test significant differences revealed by
ANOVA. Values are group means (n = 6, F1B; n = 6, GS) and standard error of the mean (SEM).
Differences were considered statistically significant when P < 0.05.
Results
Plasma Lipid Profile
The plasma from fish oil fed F1B hamsters was milky and packed with chylomicron-like
particles (Figure 1), however milky plasma was not present in fish oil fed GS hamsters. Plasma
total cholesterol (A), triglyceride (B), free cholesterol (C), and cholesterol ester (d) concentrations
for F1B and GS hamsters on all three diets are shown in Figure 2. All lipid parameters were
influenced by both diet and animal strain with a significant interaction between the two (P < 0.001).
F1B hamsters on the fish oil diet had dramatically higher total plasma cholesterol concentrations (P
< 0.001), TG concentrations (P < 0.001), FC concentrations (P < 0.001) and CE concentrations (P <
0.001) compared to F1B hamsters on the MUFA and n6:n3 diets. Fish oil fed GS hamsters had

8
significantly higher total plasma cholesterol concentrations (P < 0.001) and plasma FC
concentrations (P < 0.01) than the GS hamsters on the MUFA and n6:n3 diets. There was no
significant effect of fish oil feeding however, on total plasma TG concentration or CE concentration
in GS hamsters. While fish oil feeding significantly increased total plasma cholesterol and FC
concentrations in both hamster strains, fish oil fed F1B hamsters had significantly higher
concentrations of all lipid parameters (P < 0.001) than fish oil fed GS hamsters. Plasma cholesterol
concentrations in F1B hamsters on the fish oil diet were 3 times that of fish oil fed GS hamsters.
Similarly, plasma TG concentrations were 5 times greater in fish oil fed F1B hamsters when
compared to GS hamsters. There was no significant difference between the MUFA and n6:n3 diets
for plasma cholesterol, TG, FC, or CE concentrations in either F1B or GS hamsters.
FPLC profile was carried out to determine the distribution of lipoproteins in fasting plasma
samples from both F1B and GS hamsters on all three diets (Figure 3). F1B hamsters fed the fish oil
diet had a significant portion of their plasma cholesterol present in the lower density fractions in
comparison to those hamsters on the MUFA and n6:n3 diets (Figure 3A). Fish oil fed GS hamsters
also had higher levels of lower density lipoprotein fractions compared to GS hamsters on the
MUFA and n6:n3 diets (Figure 3B). This increase however, was dramatically higher for F1B
hamsters compared to GS hamsters. Both F1B and GS hamsters on the MUFA and n6:n3 diets had a
comparable amount of their plasma cholesterol in all of the lipoprotein fractions. Due to variations
in the lipoprotein profile, individual lipoprotein fractions were separated by ultracentrifugation to
measure the concentrations of various lipids.
Plasma VLDL Profile
There was a marked difference in VLDL composition between F1B and GS hamsters (Table
3). VLDL-cholesterol, - TG, and -FC were all influenced by both diet and animal strain, with a
significant interaction between the two (P = 0.007, P = 0.0015, and P < 0.0001 respectively). Fish
oil feeding to F1B hamsters increased VLDL-cholesterol, - TG, -FC, and -CE concentrations in
comparison to the MUFA and n6:n3 diets. In GS hamsters, the dramatic effect of fish oil feeding
was not as apparent. The VLDL-TG concentrations in fish oil fed F1B hamsters in particular, were
25 times that of the GS hamsters. F1B and GS hamsters on the n6:n3 diet showed elevated VLDL-
cholesterol, -TG, -FC, and -CE compared to respective hamsters strains on the MUFA diet.

9
Plasma LDL Profile
Table 4 shows the LDL lipid profile for F1B and GS hamsters. LDL-cholesterol, -TG, and -
FC were all independently influenced by both diet (P < 0.02) and animal strain (P < 0.04). Only
LDL-TG however showed an interactive effect of both diet and animal strain (P = 0.0118). Fish oil
feeding was associated with an increase in LDL-cholesterol, -TG, and -FC concentrations in F1B
hamsters compared to the F1B hamsters fed the MUFA or n6:n3 diet. Fish oil fed GS hamsters also
had elevated levels of LDL-cholesterol, -TG, and -FC concentrations compared to those on the
MUFA and n6:n3 diets. Comparison of the two strains however, shows that this increase was much
more pronounced in F1B than GS hamsters. The LDL-cholesterol, TG, and CE concentrations in
F1B hamsters on the n6:n3 diet were two-fold higher than the F1B hamsters fed the MUFA diet.
LDL-TG, -FC, and -CE concentrations in GS hamsters were two-fold higher on the n6:n3 diet than
GS hamsters fed the MUFA diet.
Plasma HDL profile
The analysis of HDL fractions showed a significant effect of strain (P < 0.02) on HDL-
cholesterol and -FC concentrations (Table 5). In general, HDL-cholesterol concentrations were
higher in F1B hamsters than in GS hamsters, but were unaffected by diet. HDL-FC and -TG
concentrations were also independently influenced by diet. Fish oil feeding tended to increase HDL-
TG and -FC in both F1B and GS hamsters compared to the hamsters fed the MUFA and n6:n3 diets.
The n6:n3 diet also increased HDL lipid concentrations. Hamsters on the n6:n3 diet had higher
HDL-TG concentrations than those on the MUFA diet. N6:N3 feeding resulted in a six-fold
increase in HDL-TG in F1B hamsters, and a three-fold increase in GS hamsters compared to
hamsters fed the MUFA diet.
Hepatic Lipid Profile
Liver is the main site to regulate the metabolism of lipids and cholesterol. Table 6 represents
the hepatic lipid concentrations for F1B and GS hamsters under all three dietary conditions. Hepatic
cholesterol and CE concentrations were independently influenced by diet (P < 0.0001), while there
was a significant influence of both diet (P < 0.0001) and strain (P < 0.0001) on hepatic TG
concentrations. GS hamsters had higher hepatic TG concentrations than F1B hamsters on all three
diets. Fish oil feeding however, increased hepatic TG concentrations in both F1B and GS hamsters
compared to hamsters fed the MUFA and n6:n3 diets. The n6:n3 diet also elevated hepatic lipid

10
concentrations in comparison to the MUFA diet. Liver total cholesterol and CE were approximately
1.5 times higher in F1B and GS hamsters on the n6:n3 diet compared to the MUFA diet.
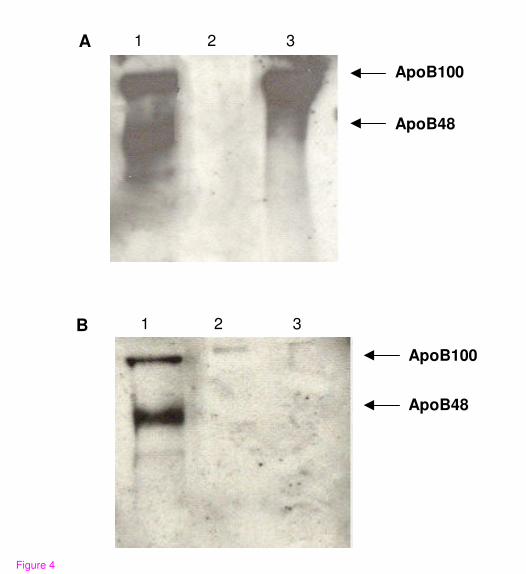
Apolipoprotein B protein
To determine the origin of various lipoproteins, western blot analysis was performed for
apoB48 and apoB100. Figure 4 shows apoB100 and apoB48 in plasma from F1B (A) and GS (B)
hamsters fed fish oil (lane 1), MUFA (lane 2), and n6:n3 (lane 3) diets. Using 60µg of total plasma
protein, apoB100 was undetectable in F1B hamsters fed a MUFA rich diet, however F1B hamsters
on the fish oil and n6:n3 diets had markedly higher plasma apoB100 protein when 60µg of plasma
total protein was used for the Western blots. Surprisingly, after a 14-hour fast, plasma apoB48 was
also very high in F1B hamsters fed fish oil diets. Fish oil feeding to GS hamsters had a similar effect
as seen in F1B hamsters however the effect was not as dramatic. Both apoB100 and apoB48 were
higher in fish oil fed GS hamsters, whereas apoB48 was not detectable in the plasma of GS
hamsters fed the MUFA or n6:n3 diets. Fish oil fed F1B hamsters had markedly higher apoB100
and apoB48 than GS hamsters on the fish oil diet.
Microsomal triglyceride transfer protein (MTTP) activity
MTTP plays an important role in the assembly of lipoproteins originating from the liver
(VLDL) and the intestine (chylomicrons). Thus, hepatic and intestinal MTTP activity was
measured in F1B and GS hamsters fed various diets. There was no significant effect of diet (P =
0.15) or strain (P = 0.77) on hepatic MTTP activity (Figure 5A). Similarly, there was no significant
effect of diet (P = 0.74) or strain (P = 0.31) on intestinal MTTP activity (Figure 5B). We also
measured MTTP mRNA and protein levels however there was no significant effect of diet (data not
given).
Lipoprotein lipase (LPL) activity and mRNA levels
Lipoprotein lipase plays a significant role in the hydrolysis of VLDL and chylomicrons.
Since the plasma from F1B hamsters fed fish oil was milky and also contained very high levels of
VLDL, the activity of LPL was measured in F1B and GS hamsters fed various diets (Figure 6A).
There was a significant effect of strain (P<0.001) on lipoprotein lipase activity, where F1B hamsters
had markedly lower post-heparin LPL activity compared to GS hamsters on all three diets. Both fish
oil and n6:n3 feeding reduced LPL activity in F1B hamsters, where fish oil feeding had a greater

11
effect. Fish oil fed GS hamsters also showed reduced LPL activity. There was, however no effect
of diet or hamster strain on pre-heparin LPL activity (data not shown). We also measured LPL
mRNA levels in adipose tissue of F1B and GS hamsters fed various diets (Figure 6B). The F1B
hamsters showed significantly lower LPL mRNA levels as compared to the GS hamsters. There
was no effect of diet on LPL mRNA levels in F1B hamsters, however fish oil feeding reduced LPL
mRNA levels in GS hamsters as compared to GS hamsters fed MUFA or n6:n3 diet.
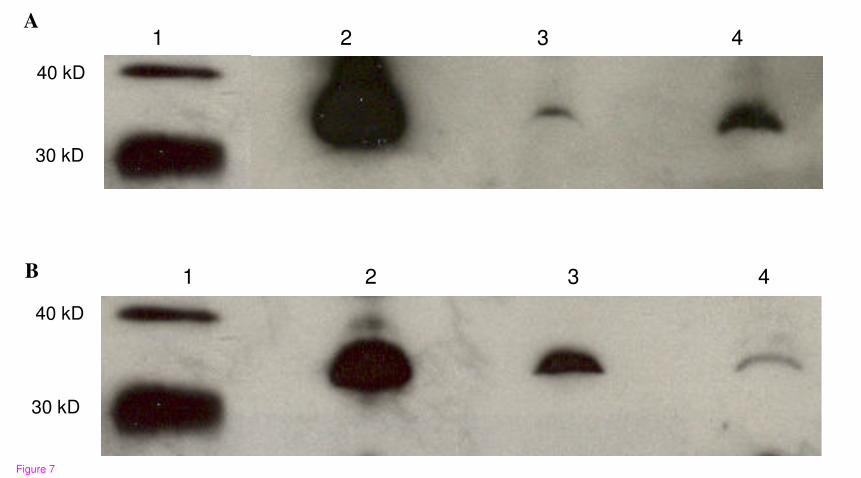
Plasma apolipoprotein E protein
Figure 7 shows plasma apoE in F1B (A) and GS (B) hamsters on the fish oil (lane 2), MUFA
(lane 3), and n6:n3 (lane 4) diets. All three diets had varying effects on plasma apoE in F1B and GS
hamsters. F1B hamsters on the fish oil diet had markedly higher plasma apoE than F1B hamsters on
the MUFA and n6:n3 diets. F1B hamsters on the n6:n3 diet had much higher plasma apoE than
those on the MUFA diet. The levels of plasma apoE in GS hamsters in response to fish oil feeding
were similar to that seen in the F1B hamsters. Fish oil fed GS hamsters had markedly higher plasma
apoE than GS hamsters on the MUFA and n6:n3 diets. In addition, GS hamsters on the MUFA diet
had higher apoE compared to those hamsters on the n6:n3 diet.
There is an apparent difference in apoE between F1B and GS hamsters on all three diets. F1B
hamsters on the fish oil diet showed an increase in apoE compared to fish oil fed GS hamsters. In
addition, the effects of the MUFA and n6:n3 diets in F1B hamsters are reversed in GS hamsters.
MUFA fed F1B hamsters show a decrease in apoE compared to MUFA fed GS hamsters, while F1B
hamsters on the n6:n3 diet have markedly higher apoE than GS hamsters on the n6:n3 diets.
Discussion
Fish oil has typically been shown to reduce plasma TG concentrations and to promote the
presence of a healthy lipoprotein profile. However there are controversial reports on the effect of
fish oil on plasma total cholesterol and LDL-cholesterol levels. Since the plasma lipoprotein profile
of hamsters is similar to human lipoprotein profile, we used hamster as an animal model to
investigate the regulation of plasma cholesterol levels by dietary fish oil. The F1B hamster is a
hybrid strain that develops severe hyperlipidaemia and atherosclerosis at much lower dietary
cholesterol concentrations compared to the GS hamsters [20]. However the mechanisms behind
severe hyperlipidaemia in F1B hamsters are unknown. Our previous findings have shown that
increasing the quantity of fat in the diet, especially from fish oil, caused severe hyperlipidaemia in

12
F1B hamsters [14]. To clarify the controversies associated with fish oil mediated regulation of
plasma cholesterol levels we used high fat fish oil diet and compared the inbred F1B hamsters to the
normal outbred GS hamsters for alterations in lipoprotein metabolism. Higher than normal levels of
fish oil were used to observe an exaggerated effect of fish oil on plasma lipid and lipoprotein levels
to be able to understand the mechanisms involved. The response of F1B and GS hamsters to various
diets was different where F1B hamsters showed severe hyperlipidaemia when fed a high fat fish oil
diet compared to GS hamsters, highlighting the possibility of heterogeneity between genetic
background [20-21]. GS hamsters typically have increases in both LDL- and HDL-cholesterol in
response to an atherogenic diet [22]. In contrast, F1B hamsters have highly elevated LDL-
cholesterol concentrations without appreciable effects on HDL-cholesterol, further suggesting
genotypic differences between hamster strains [20].
Differences in dietary response were apparent upon separation of the plasma from F1B and
GS hamsters. F1B hamsters on the high fat fish oil diet had milky plasma, packed with chylomicron-
like particles even after subjection to a 14-hour fast. This effect was not observed in GS hamsters on
the fish oil diet. Fish oil supplementation has typically been shown to decrease apoB protein, and
VLDL secretion from hamster hepatocytes [7], a quality that is characteristic of the
hypotriglyceridaemic properties of fish oil. However, fish oil can significantly elevate apoB levels
in hypertriglyceridaemic subjects [23].
In addition to milky plasma, F1B hamsters on the fish oil diet had markedly higher plasma
cholesterol, TG, FC, and CE concentrations in comparison to GS hamsters, which are consistent
with other studies [18, 20-21, 24-25]. The response of these two strains to a diet rich in n6:n3 was
also different. We noted an increase in LDL-cholesterol concentrations in F1B hamsters on the
n6:n3 diet than LDL-cholesterol concentrations in the GS hamster. Previously we observed that fish
oil feeding to F1B hamsters inhibited the mRNA expression of LDL-receptor [14]. We did not
measure the expression of LDL-receptor in the current study however it is likely that n-3 fatty acids
inhibited LDL-receptor expression under the current dietary conditions in F1B hamsters causing an
increase in plasma LDL levels. Fish oil feeding to both F1B and GS hamsters showed an increase
in HDL-triglyceride concentrations as compared to hamsters fed diets rich in n6:n3 or MUFA.
There was however no significant change in HDL-cholesterol concentrations. An increase in HDL-
triglycerides might suggest enhanced clearance of HDL in the fish oil fed hamsters, which deserves
future investigations. The hepatic lipid profile also showed a significant increase in triglyceride
levels in fish oil fed F1B hamsters, however the increase was not as dramatic compared to plasma.

13
This could be due to several factors, i.e. lipids not delivered to the liver, low lipoprotein lipase
activity and/or inhibition of hepatic triglyceride synthesis.
The FPLC lipoprotein profile indicates that different responses to a high fat fish oil diet
occur between the two hamster strains, where fish oil fed F1B hamsters have a significant portion of
their plasma cholesterol in the lower density lipoproteins compared to GS hamsters. In an attempt
to locate the lipoprotein source of the over-abundance of plasma TG, a western blot analysis for
apoB48 and apoB100 was conducted. The detection of apoB48 and apoB100 indicate the presence
of intestinally and hepatically derived lipoproteins respectively. We observed that F1B and GS
hamsters on fish oil diet had markedly higher plasma apoB48 and apoB100 protein than hamsters
on the MUFA and n6:n3 diets. Fish oil has been shown to decrease apoB secretion and suppress
apoB protein expression specifically by increasing the intracellular degradation of apoB [7, 26].
However, there are reports showing an increase in apoB concentrations HepG2 cells treated with
fish oil [27]. Furthermore, it has been shown that the presence of apoB48 in F1B hamsters on a high
fat coconut diet is responsible for elevated plasma total cholesterol and TG concentrations [18].
In addition to dietary induced variation in apoB protein, the effect of hamster strain is also
apparent. While apoB48 and apoB100 were elevated in both F1B and GS hamsters on the fish oil
diet, this effect was more obvious in F1B hamsters. Similarly, apoB100 was elevated in F1B
hamsters on the n6:n3 diet, but not in GS hamsters on the same diet. The apoB protein levels
parallels their differences in plasma lipid and lipoprotein concentrations, where F1B hamsters had
significantly greater concentrations of apoB-containing lipoproteins than GS hamsters. There are
two plausible explanations for the variation in apoB: a) enhanced synthesis and secretion of apoB-
containing lipoproteins, or b) a decrease in the clearance of these lipoproteins from the plasma.
We investigated the effects of diet and strain on MTTP activity, which is involved in the
formation of VLDL and chylomicrons from the liver and intestine respectively. MTTP is involved
in the synthesis and secretion of TG-rich lipoproteins, and transfers lipid from the endoplasmic
reticulum membrane to apoB48 or apoB100 for the subsequent formation of chylomicrons or VLDL
respectively. We expected to see an increase in MTTP activity in hamsters on the fish oil diet;
however no effects of dietary fat or hamster strain were observed. The lack of effect of dietary fat or
animal strain on both hepatic and intestinal MTTP activity, in addition to the abundance of evidence
suggesting that fish oils decrease VLDL-secretion, indicate that it is not the secretion of TG-rich
lipoproteins that is affected, but the clearance of these lipoproteins and their remnants from the
plasma.

14
LPL is the rate-limiting determinant for the hydrolysis of chylomicrons and VLDL within
the plasma. The presence of apoB48 in F1B and GS hamsters after an extended fast indicate the
presence of chylomicrons in the plasma, in addition to severe postprandial dyslipidemia in fish oil
fed hamsters. We found a significant effect of animal strain and diet on post-heparin LPL activity.
F1B hamsters had significantly lower post-heparin LPL activity than GS hamsters, further
reiterating variation in genetic background between hamster strain. Similar results have been found
in F1B hamsters, where this strain had significantly lower post-heparin LPL activity compared to
DSNI hamsters [18]. This response however, was dependent on dietary cholesterol intake. Previous
reports using other animal models has shown that n-3 fatty acids do not significantly influence post-
heparin LPL [10-13, 28-31]. However, we observed a significant decrease in LPL activity on a high
fat fish oil diet in F1B hamsters. Thus, it is likely that fish oil mediated hyperlipidaemic effect is
partially due to a decrease in LPL activity. The F1B hamsters also showed significantly lower
adipocyte LPL mRNA levels as compared to the GS hamsters. LPL mutations are found in human
populations at a frequency of 1:1000 [32]. LPL deficiency leads to hyperlipidaemia, which is
characterized by the pathological presence of chylomicrons, together with elevated VLDL after a
12-14 hour fast similar to what we observed in F1B hamsters. A decrease in LPL activity however
should cause a decrease in plasma LDL levels due to inhibition of VLDL conversion to LDL. We
observed an increase in plasma LDL concentrations in fish oil fed F1B hamsters. This is likely due
to inhibition of LDL-receptor gene expression by fish oil in F1B hamsters [14].
The presence of apolipoprotein E is another factor that has a critical role in the hepatic
clearance of TG-rich lipoproteins from the plasma. In an apoE knockout mouse for example, severe
hypertriglyceridaemia similar to our phenotype, was seen when these mice were fed a high fat fish
oil diet [33]. It was determined by these authors that apoE was required for fish oil to exert its
hypotriglyceridaemic effects. In the present study however, F1B and GS hamsters on the fish oil diet
had dramatically higher apoE than those hamsters on the MUFA and N6:N3 diets. In addition, the
presence of apoE was much greater in fish oil fed F1B hamsters than GS hamsters further
highlighting strain-specific differences in these hamsters. While we are the first to demonstrate this
effect in hamsters, other investigators have previously shown that the overexpression of apoE can
also induce hypertriglyceridaemia [34]. Overexpression of human apoE in the rabbit at increasing
concentrations of apoE results in a net increase in circulating TG levels [34]. While plasma apoE
concentrations were not established in this study, it can be speculated that higher levels of apoE in
fish oil fed hamsters may partially contribute to the observed hyperlipidaemia. Moreover, it has

15
been shown that elevated levels of apoE can inhibit LPL-mediated hydrolysis of TG-rich
lipoproteins [35]. Thus the elevated apoE protein expression in fish oil fed F1B hamsters may
partially explain the decline in LPL activity in this strain.
Conclusions
The comparison of the inbred F1B hamster to the outbred, normal GS hamsters, allowed us to
attribute fish oil induced hyperlipidaemia to diversity in animal strain. The F1B hamsters show a
dramatic hyperlipidaemic response to fish oil compared to GS hamsters. The observed
dyslipidaemia induced by fish oil was a result of the hindrance of TG-rich lipoprotein clearance.
Decreased LPL concentrations in F1B hamsters elude to heterogeneity within genetic background
that contributes to the varied response of these hamsters to dietary fat. Investigation into the
regulation of lipoprotein metabolism in these strains will provide insight into the nutrient-gene
relationship and the controversial effects of dietary fats on cardiovascular health. Further,
identification of polymorphisms within each animal strain in response to various unsaturated fats
may provide insight into the diverse and controversial effects of fish oil on cholesterol and
lipoprotein metabolism in humans.
Abbreviations
ApoB, apolipoprotein B; apoE, apolipoprotein E; CVD, cardiovascular disease; CE, cholesterol
esters; D, diet type; FC, free cholesterol; GS, Golden Syrian; HDL, high-density lipoprotein; LDL,
low-density lipoprotein; LPL, lipoprotein lipase; MTTP, microsomal triglyceride transfer protein;
MUFA, monounsaturated fatty acids; N6:N3, diet with an omega-6 to omega-3 ratio of 5; S, animal
strain; SFA, saturated fatty acids; TG, triglycerides; VLDL, very-low density lipoprotein.
Competing interests
The author(s) declare that they have no competing interests.
Authors' contributions
SKC designed the study, provided interpretation of data and drafted the final manuscript. MLC
made contributions to acquisition of data and analysis.

16
Acknowledgements
This research was supported by a grant from the Heart and Stroke Foundation of Canada. S.K.C.
holds a New Investigator Award from the Canadian Institutes of Health Research. We thank Adam
Byrne and Suresh Belkhode for technical support.
References
1. Miller M: Current perspectives on the management of hypertriglyceridaemia. Am
Heart J 2000, 140: 232-240.
2. Austin M: Plasma triglyceride and coronary heart disease. Arterioscler Thromb 1991,
11: 2-14.
3. Khan S, Minihane A, Talmud P, Wright J, Murphy M, Williams C, Griffin B: Dietary
long-chain n-3 PUFAs increase LPL gene expression in adipose tissue of subjects with
an atherogenic lipoprotein phenotype. J Lipid Res 2002, 43: 979-985.
4. Packard C, Shepherd J: Lipoprotein heterogenity and apolipoprotein B metabolism.
Arterioscler Thromb Vasc Biol 1997, 17: 3542-3556.
5. Harris W: Fish oil and plasma lipid and lipoprotein metabolism in humans: a critical
review. J Lipid Res 1989, 30: 785-807.
6. Wilkinson T, Higgins J, Fitzimmons C, Bowyer D: Dietary fish oils modify the assembly
of VLDL and expression of the LDL receptor in rabbit liver. Arterioscler Thromb Vasc
Biol 1998, 18: 1490-1497.
7. Kendrick J, Higgins J: Dietary fish oils inhibit early events in the assembly of very low
density lipoproteins and target apoB for degradation within the rough endoplasmic
reticulum of hamster hepatocytes. J Lipid Res 1999, 40: 504-514.
8. Hsu H, Lee Y, Chen M: Effect of n-3 fatty acids on the composition and binding
properties of lipoproteins in hypertriglyceridaemic patients. Am J Clin Nutr 2000, 71,
139-146.
9. Kestin M, Clifton P, Belling G, Nestel P: n-3 Fatty acids of marine origin lower systolic
blood pressure and triglycerides but raise LDL cholesterol compared with n-3 and n-6
fatty acids from plants. Am J Clin Nutr 1990, 51: 1028-1034.

17
10. Desager J, Dricot J, Harvengt C: Hypotriglyceridaemic action of omega-3 fatty acids in
healthy subjects does not occur by enhanced lipoprotein lipase and hepatic lipase
activities. Res Commun Chem Pathol Pharmacol 1989, 65: 269-272.
11. Harris W, Lu G, Rambjor G, Walen AL, Ontko JA, Cheng O, Windsor SL: Influence of n-
3 fatty acid supplementation on the endogenous activities of plasma lipases. Am J Clin
Nutr 1997, 66: 254-260.
12. Nozaki S, Garg A, Vega G, Grundy S: Postheparin lipolytic activity and plasma
lipoprotein response to n-3 polyunsaturated fatty acids in patients with primary
hypertriglyceridaemia. Am J Clin Nutr 1991, 53: 638-642.
13. Weintraub M, Zechner R, Brown A, Eisenberg S, Breslow J: Dietary polyunsaturated fats
of the n-6 and n-3 series reduce postprandial lipoprotein levels. J Clin Invest 1988, 82:
1884-1893.
14. de Silva P, Davis PJ, Cheema SK: Hyperlipidaemic effect of fish oil in Bio F1B
hamsters. Br J Nutr 2004, 91: 341-349.
15. Keough K, Davis P: Gel to liquid-crystalline transitions in water dispersions of
saturated mixed-acid phosphatidylcholines. Biochemistry 1979, 18: 1453-1459.
16. Yokode M, Hammer R, Ishibashi S, Brown M, Goldstein J: Diet induced
hypercholesterolaemia in mice: prevention of overexpression of LDL receptors. Science
1990, 250: 1273-1275.
17. Cheema SK, Agellon LB: Metabolism of cholesterol is altered in the liver of C3H mice
fed fats enriched with different c-18 fatty acids. J Nutr 1999, 129: 1718-1724.
18. McAteer MD, Grimsditch M, Vidgeon-Hart G, Benson, Salter A: Dietary cholesterol
reduces lipoprotein lipase activity in the atherosclerosis-susceptible Bio F(1)B hamster.
Br J Nutr 2003, 89: 341-350.
19. Burnette W: "Western Blotting": Electrophoretic transfer of proteins from sodium
dodecyl sulfate-polyacrylamide gels to in modified nitrocellulose and radiographic
detection with antibody and radioiodinated protein A. Anal Biochem 1989, 112: 195.
20. Kowala M, Nunnari J, Durham S, Nicolosi R: Doxazosin and cholestyramine similarly
decrease fatty streak formation in the aortic arch of hyperlipidemic hamsters.
Atheroslcerosis 1991, 91: 35-49.
18
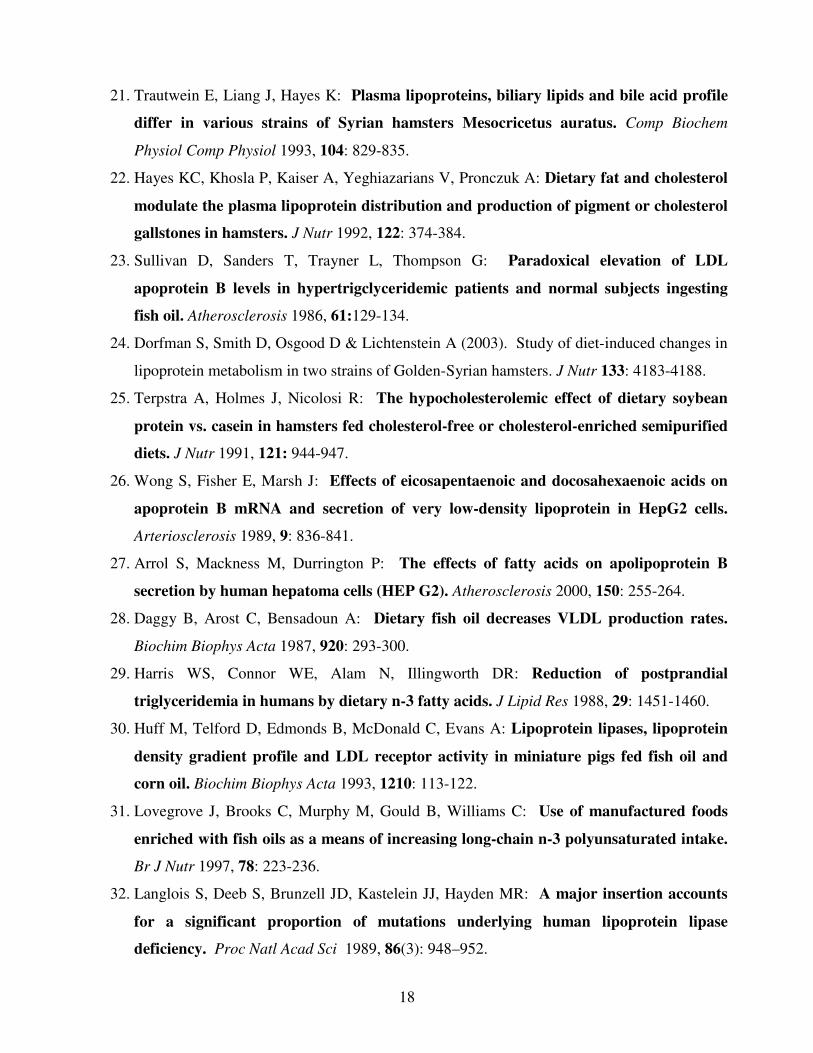
21. Trautwein E, Liang J, Hayes K: Plasma lipoproteins, biliary lipids and bile acid profile
differ in various strains of Syrian hamsters Mesocricetus auratus. Comp Biochem
Physiol Comp Physiol 1993, 104: 829-835.
22. Hayes KC, Khosla P, Kaiser A, Yeghiazarians V, Pronczuk A: Dietary fat and cholesterol
modulate the plasma lipoprotein distribution and production of pigment or cholesterol
gallstones in hamsters. J Nutr 1992, 122: 374-384.
23. Sullivan D, Sanders T, Trayner L, Thompson G: Paradoxical elevation of LDL
apoprotein B levels in hypertrigclyceridemic patients and normal subjects ingesting
fish oil. Atherosclerosis 1986, 61:129-134.
24. Dorfman S, Smith D, Osgood D & Lichtenstein A (2003). Study of diet-induced changes in
lipoprotein metabolism in two strains of Golden-Syrian hamsters. J Nutr 133: 4183-4188.
25. Terpstra A, Holmes J, Nicolosi R: The hypocholesterolemic effect of dietary soybean
protein vs. casein in hamsters fed cholesterol-free or cholesterol-enriched semipurified
diets. J Nutr 1991, 121: 944-947.
26. Wong S, Fisher E, Marsh J: Effects of eicosapentaenoic and docosahexaenoic acids on
apoprotein B mRNA and secretion of very low-density lipoprotein in HepG2 cells.
Arteriosclerosis 1989, 9: 836-841.
27. Arrol S, Mackness M, Durrington P: The effects of fatty acids on apolipoprotein B
secretion by human hepatoma cells (HEP G2). Atherosclerosis 2000, 150: 255-264.
28. Daggy B, Arost C, Bensadoun A: Dietary fish oil decreases VLDL production rates.
Biochim Biophys Acta 1987, 920: 293-300.
29. Harris WS, Connor WE, Alam N, Illingworth DR: Reduction of postprandial
triglyceridemia in humans by dietary n-3 fatty acids. J Lipid Res 1988, 29: 1451-1460.
30. Huff M, Telford D, Edmonds B, McDonald C, Evans A: Lipoprotein lipases, lipoprotein
density gradient profile and LDL receptor activity in miniature pigs fed fish oil and
corn oil. Biochim Biophys Acta 1993, 1210: 113-122.
31. Lovegrove J, Brooks C, Murphy M, Gould B, Williams C: Use of manufactured foods
enriched with fish oils as a means of increasing long-chain n-3 polyunsaturated intake.
Br J Nutr 1997, 78: 223-236.
32. Langlois S, Deeb S, Brunzell JD, Kastelein JJ, Hayden MR: A major insertion accounts
for a significant proportion of mutations underlying human lipoprotein lipase
deficiency. Proc Natl Acad Sci 1989, 86(3): 948–952.

19
33. Asset G, Bauge E, Fruchart J, Dallongeville J: Lack of triglyceride-lowering properties
of fish oil in apolipoprotein e-deficient mice. Arterioscler Thromb Vasc Biol 2001, 21:
401-406.
34. Huang Y, Schwendner S, Rall JS, Sanan D, Mahley R: Apolipoprotein E2 transgenic
rabbits-Modulation of the type II hyerlipoproteinemic phenotype by estrogen and
occurrence of spontaneous atherosclerosis. J Biol Chem 1997, 272: 22685-22694.
35. McConathy W, Wang C: Inhibition of lipoprotein lipase by the receptor-binding
domain of apolipoprotein E. FEBS Lett 1989, 251: 250-252.

20
Figures
Figure 1 - Fish oil fed F1B hamsters showed milky plasma.
Fasting plasma samples of F1B hamsters fed the monounsaturated fatty acid rich (MUFA) and fish
oil (FO) diets for four weeks.
Figure 2 - The plasma lipid profile of F1B (solid) and Golden Syrian (GS) (shaded) hamsters.
Hamsters were fed fish oil (FO), monounsaturated fatty acid rich (MUFA), and N6:N3 diets. The
specified diets were fed for a period of four weeks. Fasting plasma samples were collected and
analyzed for total plasma cholesterol (A), triglycerides (B), free cholesterol (C), and cholesterol
esters (D) as described in the material and methods section. Values are means ± SEM (n = 6, F1B; n
= 6, GS). Means for a variable with a different letter are significantly different (p ≤ 0.05) by one-
way ANOVA, and the Newman-Keuls post-hoc test after a significant interaction between diet and
strain was found by two-way ANOVA.
Figure 3 - FPLC profile of fasted plasma samples from F1B (A) and Golden Syrian (B)
hamsters.
Hamsters were fed the fish oil (FO) (–), monounsaturated fatty acid rich (MUFA) (---), and N6:N3
(···) diets. Plasma samples were pooled from six animals in each group, filtered and analyzed on a
Superose column as described in the material and methods section.
Figure 4 - Apolipoprotein B (apoB) in F1B (A) and Golden Syrian (B) hamsters.
Hamsters fed the fish oil, monounsaturated fatty acid rich, and N6:N3 diets are represented in lanes
1, 2, and 3 respectively. Proteins were separated on a 6% SDS polyacrylamide gel and transferred to
a nitrocellulose membrane. ApoB proteins were detected by western blotting as described in the
materials and methods section.
Figure 5 - Hepatic (panel A) and intestinal (panel B) microsomal triglyceride transfer protein
(MTTP) activity.
The F1B (solid) and Golden Syrian (shaded) hamsters were fed fish oil (FO), monounsaturated fatty
acid rich (MUFA) or N6:N3 diets. Animals were fed the specified diets for four weeks. Upon
sacrifice, the liver and intestine were removed and snap frozen in liquid nitrogen and stored at –70º.
Tissues were then analyzed for MTTP activity as described in the materials and methods section.

21
Means for a variable with a different letter are significantly different (p<0.05) by two-way ANOVA
and the Newman-Keuls post-hoc test.
Figure 6 - Lipoprotein lipase (LPL) activity (panel A) and LPL mRNA levels (panel B).
The F1B (solid) and Golden Syrian (shaded) hamsters were fed fish oil (FO), monounsaturated fatty
acid rich (MUFA), and N6:N3 diets. The specified diets were fed for a period of four weeks. After a
14-hour fast, heparin was injected directly into the heart; blood was collected and assayed for LPL
activity (panel A) as described in the materials and methods section. Total RNA was extracted from
adipose tissue and LPL mRNA levels were measured (panel B) using specific primers as described
under the materials and methods section. Means for a variable with a different letter are
significantly different (p < 0.05) by two-way ANOVA and the Newman-Keuls post-hoc test.
Figure 7 - Apolipoprotein E (apoE) in F1B (A) and Golden Syrian (B).
Lane 1 shows the molecular weight marker. Hamsters fed the fish oil, monounsaturated fatty acid
rich, and N6:N3 diets are represented in lanes 2, 3, and 4 respectively. Proteins were separated on a
10% SDS polyacrylamide gel and transferred to a nitrocellulose membrane. ApoE proteins were
detected by western blotting as described in the materials and methods section.

22
Tables
Table 1 - Nutrient composition of the high fat* semi-purified diets† (g/kg)
* Semi-purified diet designed for a 200g/kg fat level † Diet ingredients from ICN Biomedicals, Aurora, OH, USA ŦSupplied in quantities adequate to meet nutritional requirements (National Research Council, 1995) § Supplied as Alphacel non-nutritive bulk (ICN Biomedicals, Aurora, OH, USA) MUFA, monounsaturated fatty acid rich diet
Diet Fish Oil MUFA N6:N3
Casein 200 200 200 DL-Methionine 3 3 3 Sucrose 305 305 305 Maize Starch 190 190 190 Vitamin mixŦ 11 11 11 Mineral mixŦ 40 40 40 Fibre§ 50 50 50 Fat 200 200 200 Cholesterol 2.5 2.5 2.5
23
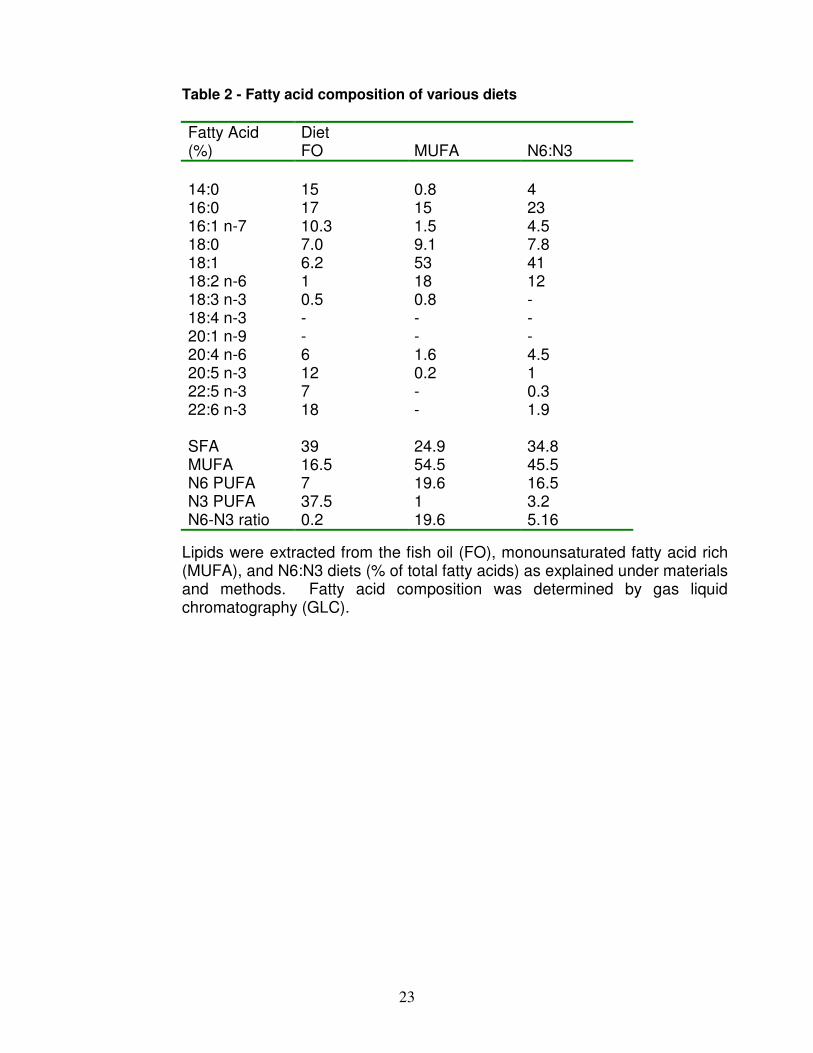
Table 2 - Fatty acid composition of various diets
Fatty Acid Diet (%) FO MUFA N6:N3
14:0 15 0.8 4 16:0 17 15 23 16:1 n-7 10.3 1.5 4.5 18:0 7.0 9.1 7.8 18:1 6.2 53 41 18:2 n-6 1 18 12 18:3 n-3 0.5 0.8 - 18:4 n-3 - - - 20:1 n-9 - - - 20:4 n-6 6 1.6 4.5 20:5 n-3 12 0.2 1 22:5 n-3 7 - 0.3 22:6 n-3 18 - 1.9 SFA 39 24.9 34.8 MUFA 16.5 54.5 45.5 N6 PUFA 7 19.6 16.5 N3 PUFA 37.5 1 3.2 N6-N3 ratio 0.2 19.6 5.16
Lipids were extracted from the fish oil (FO), monounsaturated fatty acid rich (MUFA), and N6:N3 diets (% of total fatty acids) as explained under materials and methods. Fatty acid composition was determined by gas liquid chromatography (GLC).
24
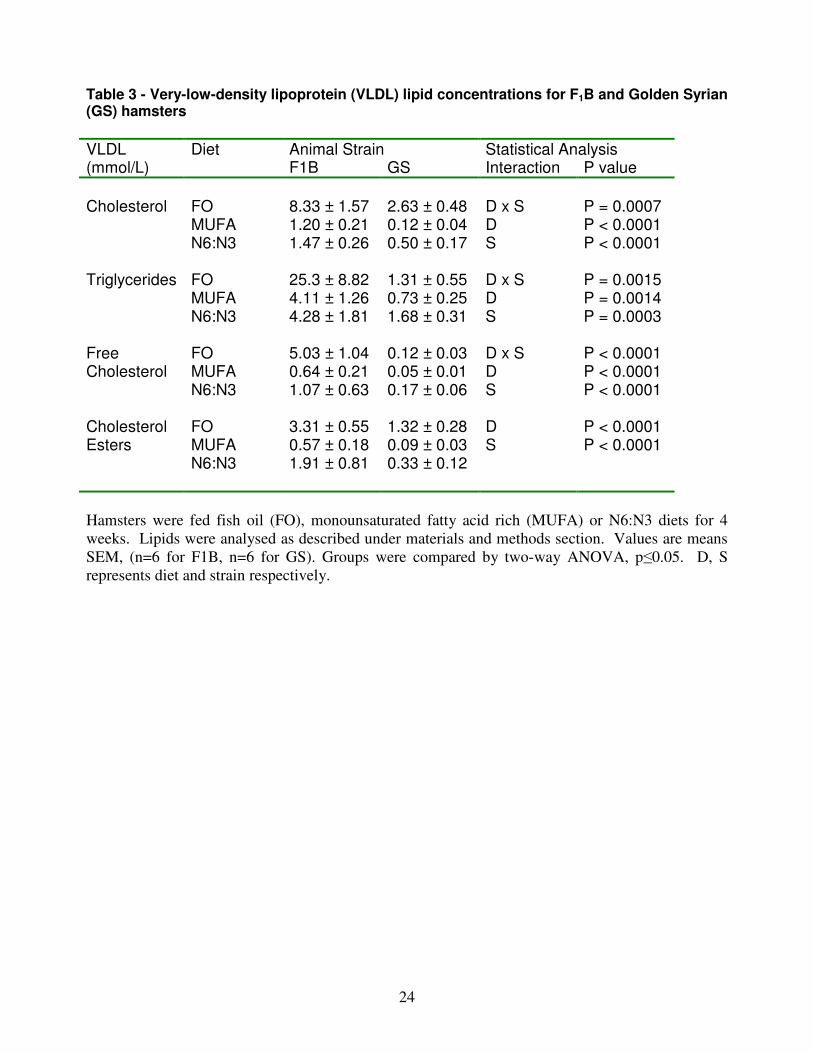
Table 3 - Very-low-density lipoprotein (VLDL) lipid concentrations for F1B and Golden Syrian (GS) hamsters
VLDL Diet Animal Strain Statistical Analysis (mmol/L) F1B GS Interaction P value
FO 8.33 ± 1.57 2.63 ± 0.48 MUFA 1.20 ± 0.21 0.12 ± 0.04 N6:N3 1.47 ± 0.26 0.50 ± 0.17
D x S D S
P = 0.0007 P < 0.0001 P < 0.0001
Cholesterol
FO 25.3 ± 8.82 1.31 ± 0.55 MUFA 4.11 ± 1.26 0.73 ± 0.25 N6:N3 4.28 ± 1.81 1.68 ± 0.31
D x S D S
P = 0.0015 P = 0.0014 P = 0.0003
Triglycerides
FO 5.03 ± 1.04 0.12 ± 0.03 MUFA 0.64 ± 0.21 0.05 ± 0.01 N6:N3 1.07 ± 0.63 0.17 ± 0.06
D x S D S
P < 0.0001 P < 0.0001 P < 0.0001
Free Cholesterol
FO 3.31 ± 0.55 1.32 ± 0.28 MUFA 0.57 ± 0.18 0.09 ± 0.03 N6:N3 1.91 ± 0.81 0.33 ± 0.12
D S
P < 0.0001 P < 0.0001
Cholesterol Esters
Hamsters were fed fish oil (FO), monounsaturated fatty acid rich (MUFA) or N6:N3 diets for 4
weeks. Lipids were analysed as described under materials and methods section. Values are means
SEM, (n=6 for F1B, n=6 for GS). Groups were compared by two-way ANOVA, p≤0.05. D, S
represents diet and strain respectively.

25
Table 4 - Low-density lipoprotein (LDL) lipid concentrations for F1B and Golden Syrian (GS) hamsters
LDL Diet Animal Strain Statistical Analysis (mmol/L) F1B GS Interaction P value
FO 7.18 ± 2.39 2.54 ± 0.10 MUFA 1.55 ± 0.19 0.67 ± 0.07 N6:N3 3.92 ± 0.56 0.95 ± 0.10
D S
P = 0.0006 P = 0.0004
Cholesterol
FO 12.1 ± 4.58 3.06 ± 0.44 MUFA 0.19 ± 0.05 0.24 ± 0.08 N6:N3 0.44 ± 0.23 0.58 ± 0.14
D x S D S
P = 0.0118 P < 0.0001 P = 0.0348
Triglycerides
FO 1.71 ± 0.28 1.10 ± 0.04 MUFA 0.76 ± 0.24 0.23 ± 0.02 N6:N3 0.98 ± 0.36 0.41 ± 0.02
D S
P < 0.0001 P = 0.0005
Free Cholesterol
FO 1.64 ± 0.30 1.10 ± 0.04 MUFA 1.15 ± 0.26 0.23 ± 0.02 N6:N3 2.93 ± 0.35 0.41 ± 0.02
Cholesterol Esters
D x S D S
P = 0.0005 P = 0.001 P = 0.0003
Hamsters were fed fish oil (FO), monounsaturated fatty acid rich (MUFA) or N6:N3 diets for 4
weeks. Lipids were analysed as described under materials and methods section. Values are means
SEM, (n=6 for F1B, n=6 for GS). Groups were compared by two-way ANOVA, p≤0.05. D, S
represents diet and strain respectively.
26
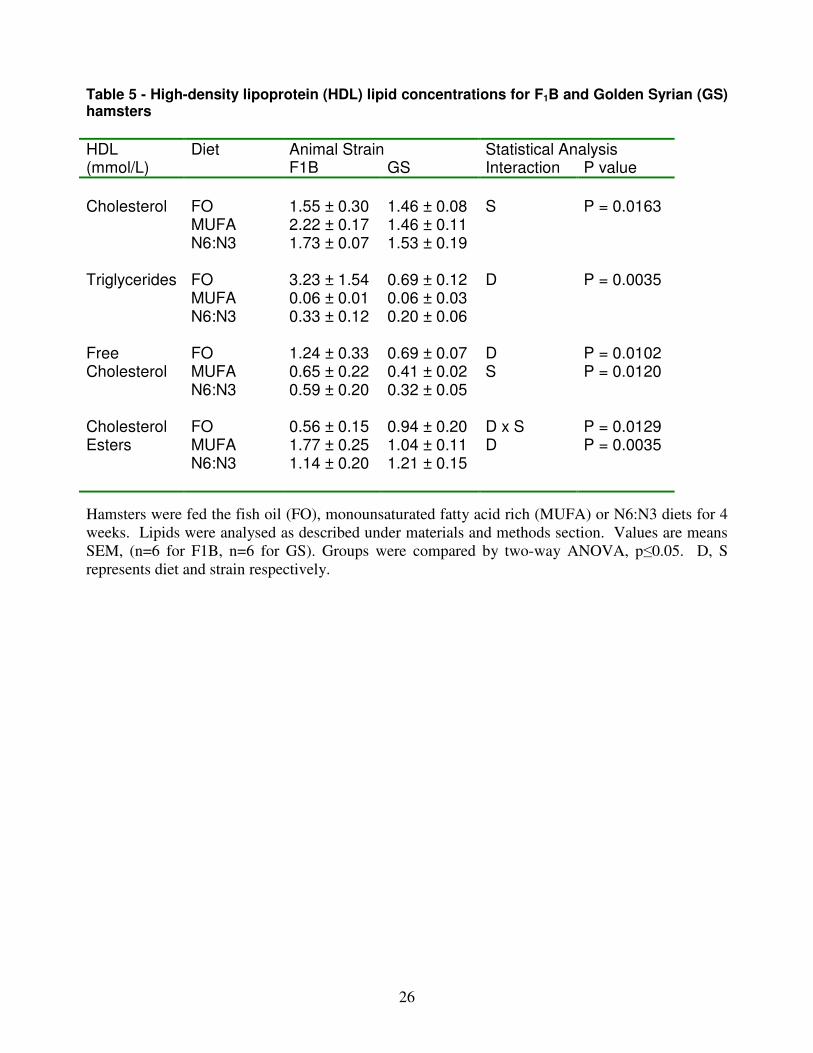
Table 5 - High-density lipoprotein (HDL) lipid concentrations for F1B and Golden Syrian (GS) hamsters
HDL Diet Animal Strain Statistical Analysis (mmol/L) F1B GS Interaction P value
FO 1.55 ± 0.30 1.46 ± 0.08 MUFA 2.22 ± 0.17 1.46 ± 0.11 N6:N3 1.73 ± 0.07 1.53 ± 0.19
S P = 0.0163 Cholesterol
FO 3.23 ± 1.54 0.69 ± 0.12 MUFA 0.06 ± 0.01 0.06 ± 0.03 N6:N3 0.33 ± 0.12 0.20 ± 0.06
D P = 0.0035 Triglycerides
FO 1.24 ± 0.33 0.69 ± 0.07 MUFA 0.65 ± 0.22 0.41 ± 0.02 N6:N3 0.59 ± 0.20 0.32 ± 0.05
D S
P = 0.0102 P = 0.0120
Free Cholesterol
FO 0.56 ± 0.15 0.94 ± 0.20 MUFA 1.77 ± 0.25 1.04 ± 0.11 N6:N3 1.14 ± 0.20 1.21 ± 0.15
Cholesterol Esters
D x S D
P = 0.0129 P = 0.0035
Hamsters were fed the fish oil (FO), monounsaturated fatty acid rich (MUFA) or N6:N3 diets for 4
weeks. Lipids were analysed as described under materials and methods section. Values are means
SEM, (n=6 for F1B, n=6 for GS). Groups were compared by two-way ANOVA, p≤0.05. D, S
represents diet and strain respectively.

27
Table 6 - Hepatic lipid concentrations for F1B and Golden Syrian (GS) hamsters
Hepatic lipids Diet Animal Strain Statistical Analysis (mg/g liver) F1B GS Interaction P value
FO 6.86 ± 1.14 7.54 ± 0.43 D P < 0.0001 MUFA 3.36 ± 0.29 2.79 ± 0.33 N6:N3 5.20 ± 0.89 4.48 ± 0.42
Total Cholesterol
FO 3.44 ± 0.57 6.13 ± 0.72 D, S P < 0.0001 MUFA 1.35 ± 0.35 3.12 ± 0.40 N6:N3 1.89 ± 0.29 3.22 ± 0.24
Triglycerides
FO 0.65 ± 0.10 0.45 ± 0.02 ___ ___ MUFA 0.52 ± 0.08 0.53 ± 0.05 N6:N3 0.71 ± 0.13 0.66 ± 0.05
Free Cholesterol
FO 5.75 ± 0.95 7.10 ± 0.43 D P < 0.0001 MUFA 3.01 ± 0.36 2.26 ± 0.41 N6:N3 4.50 ± 0.77 3.82 ± 0.43
Cholesterol Esters
Hamsters were fed fish oil (FO), monounsaturated fatty acid rich (MUFA) or N6:N3 diets for 4
weeks. Lipids were analysed as described under materials and methods section. Values are means
SEM, (n=6 for F1B, n=6 for GS). Groups were compared by two-way ANOVA, p≤0.05. D, S
represents diet and strain respectively.

Figure 1

Figure 2
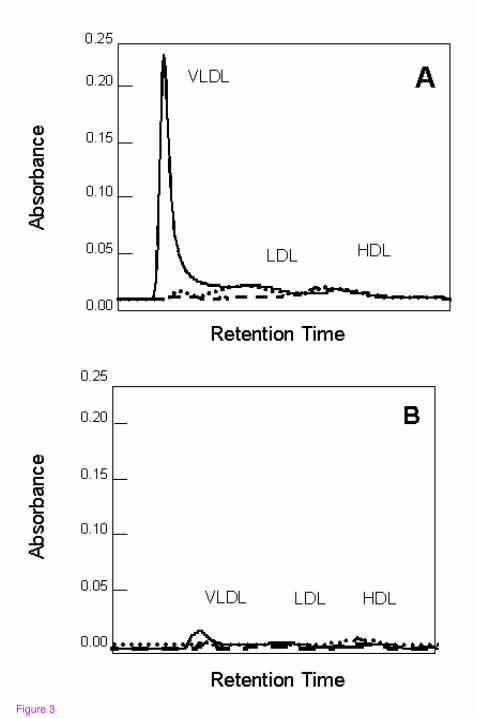
Figure 3
ApoB100
ApoB48
ApoB100
ApoB48
A
B
1 2 3
1 2 3
Figure 4

FO MUFA N6:N3
0.0
2.5
5.0
7.5
AH
ep
ati
c M
TT
P A
cti
vit
y(n
mo
l/m
g/h
r)
FO MUFA N6:N3
0
2
4
6
B
Inte
sti
nal
MT
TP
Acti
vit
y(n
mo
l/m
g/h
r)
Figure 5

FO MUFA N6:N30.0
10
20L
PL
Act
ivit
y (
nm
ol/
min
/ml)
b
a
a
d
c
d
15
5
FO MUFA N6:N30.0
0.4
0.8
LP
L m
RN
A (
Arb
itra
ry u
nit
s)
b
aa
c
c c
0.6
0.2
A B
Figure 6
A30 kD
30 kD
40 kD
40 kD
2 3 41
1 2 3 4
A
B
Figure 7
Related Documents