1/24/2012 1 Nutrition Management John Freeborn Virginia Tech Floriculture Nutrition Management: What do we monitor? Why do we monitor? How do we monitor? Pour thru technique for monitoring Nutrition Management: Monitoring pH and the EC of the substrate Nutrition Management: Monitoring pH and the EC of the substrate pH—Concentration of Hydrogen Ions Based on a 14 point scale Scale is logarithmic (10x per number) Controls nutrient availability pH: pH: C. Jones and J. Jacobsen, 2001, Plant Nutrition and Soil Fertility, Montana State University Extension Service. Document can be downloaded from: http://www.montana.edu/wwwpb/pubs/mt4449.html.

Welcome message from author
This document is posted to help you gain knowledge. Please leave a comment to let me know what you think about it! Share it to your friends and learn new things together.
Transcript
1/24/2012
1
Nutrition
Management
John Freeborn
Virginia Tech Floriculture
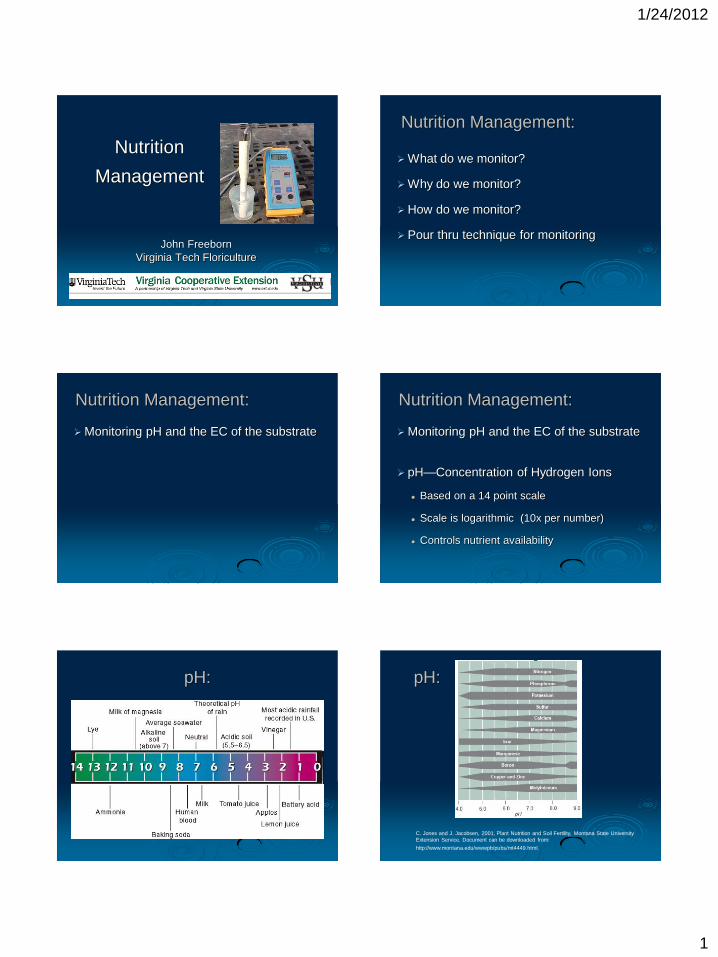
Nutrition Management:
What do we monitor?
Why do we monitor?
How do we monitor?
Pour thru technique for monitoring
Nutrition Management:
Monitoring pH and the EC of the substrate
Nutrition Management:
Monitoring pH and the EC of the substrate
pH—Concentration of Hydrogen Ions
Based on a 14 point scale
Scale is logarithmic (10x per number)
Controls nutrient availability
pH: pH:
C. Jones and J. Jacobsen, 2001, Plant Nutrition and Soil Fertility, Montana State University
Extension Service. Document can be downloaded from:
http://www.montana.edu/wwwpb/pubs/mt4449.html.
1/24/2012
2
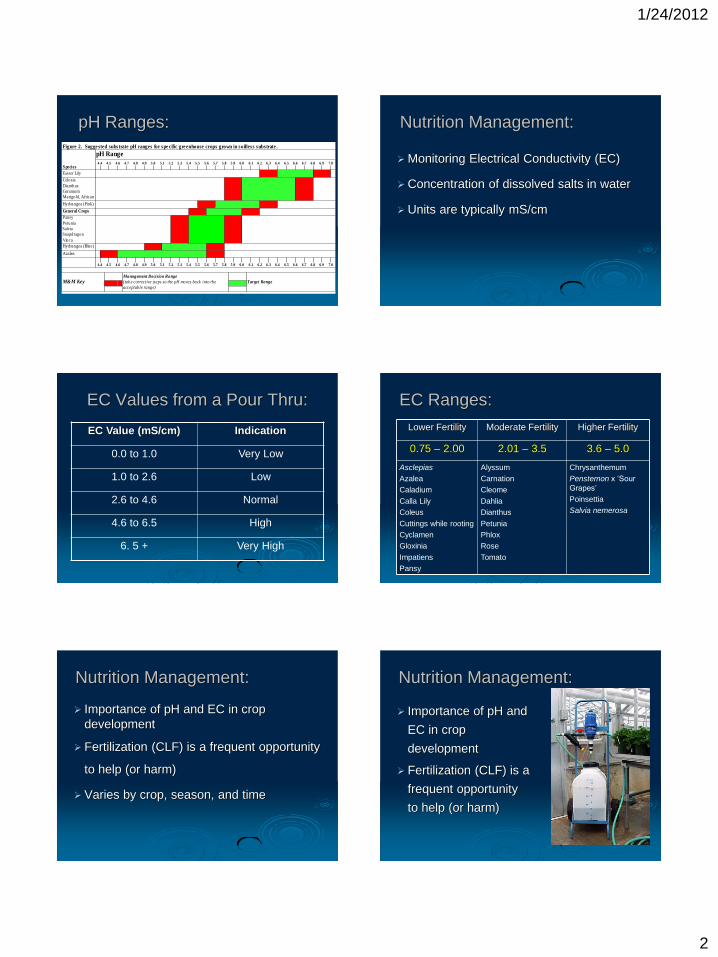
pH Ranges:
Figure 2. Sugge sted substrate pH ranges for spe cific gre enhouse crops grown in soilless substrate .
Species
pH Range
4.4 4.5 4.6 4.7 4.8 4.9 5.0 5.1 5.2 5.3 5.4 5.5 5.6 5.7 5.8 5.9 6.0 6.1 6.2 6.3 6.4 6.5 6.6 6.7 6.8 6.9 7.0
Easter Lily
Celosia
Dianthus
Geranium
Marigold, African
Hydrangea (Pink)
General Crops
Pansy
Petunia
Salvia
Snapdragon
Vinca
Hydrangea (Blue)
Azalea
4.4 4.5 4.6 4.7 4.8 4.9 5.0 5.1 5.2 5.3 5.4 5.5 5.6 5.7 5.8 5.9 6.0 6.1 6.2 6.3 6.4 6.5 6.6 6.7 6.8 6.9 7.0
M&M KeyManagement Decision Range
(tak e corrective steps so the pH moves back into the
acceptable range)
Target Range
Nutrition Management:
Monitoring Electrical Conductivity (EC)
Concentration of dissolved salts in water
Units are typically mS/cm
EC Values from a Pour Thru:
EC Value (mS/cm) Indication
0.0 to 1.0 Very Low
1.0 to 2.6 Low
2.6 to 4.6 Normal
4.6 to 6.5 High
6. 5 + Very High
EC Ranges:
Lower Fertility Moderate Fertility Higher Fertility
0.75 – 2.00 2.01 – 3.5 3.6 – 5.0
Asclepias
Azalea
Caladium
Calla Lily
Coleus
Cuttings while rooting
Cyclamen
Gloxinia
Impatiens
Pansy
Alyssum
Carnation
Cleome
Dahlia
Dianthus
Petunia
Phlox
Rose
Tomato
Chrysanthemum
Penstemon x ‘Sour
Grapes’
Poinsettia
Salvia nemerosa
Nutrition Management:
Importance of pH and EC in crop
development
Fertilization (CLF) is a frequent opportunity
to help (or harm)
Varies by crop, season, and time
Nutrition Management:
Importance of pH and
EC in crop
development
Fertilization (CLF) is a
frequent opportunity
to help (or harm)
1/24/2012
3
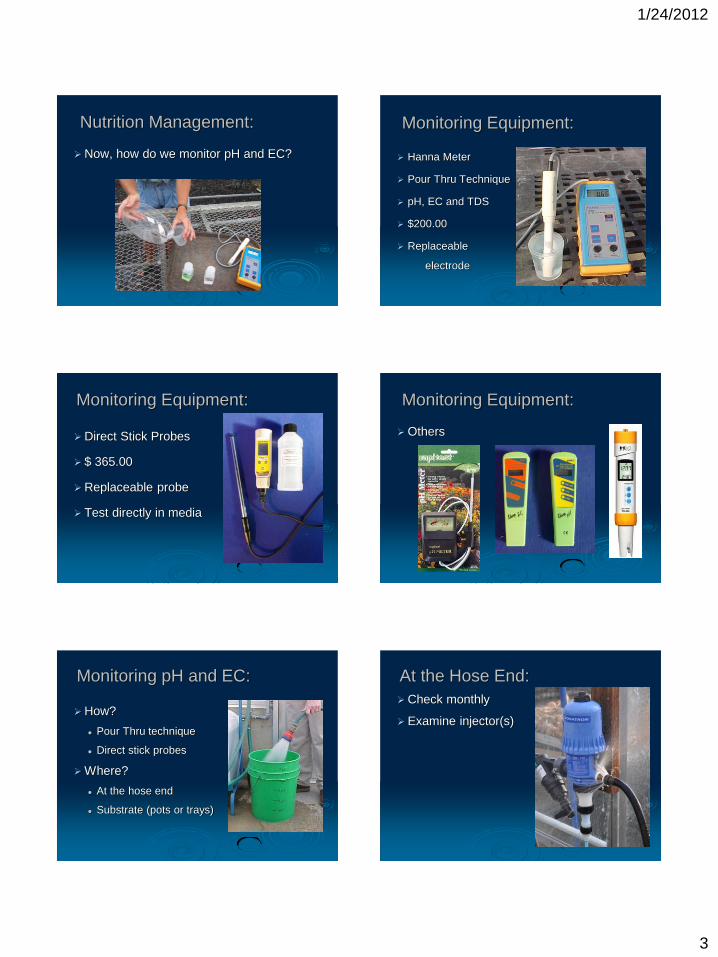
Nutrition Management:
Now, how do we monitor pH and EC?
Monitoring Equipment:
Hanna Meter
Pour Thru Technique
pH, EC and TDS
$200.00
Replaceable
electrode
Monitoring Equipment:
Direct Stick Probes
$ 365.00
Replaceable probe
Test directly in media
Monitoring Equipment:
Others
Monitoring pH and EC:
How?
Pour Thru technique
Direct stick probes
Where?
At the hose end
Substrate (pots or trays)
At the Hose End:
Check monthly
Examine injector(s)
1/24/2012
4
At the Hose End:
Check monthly
Examine injector(s)
Injection rate
Final product
Volume
EC (pH?)
Verify on Fertilizer Bag
Example: Peter’s Professional 20-10-20 GP
200 ppm N
concentration (desired)
Injector ratio of 1:100
Target EC in final
solution = 1.32 mS/cm
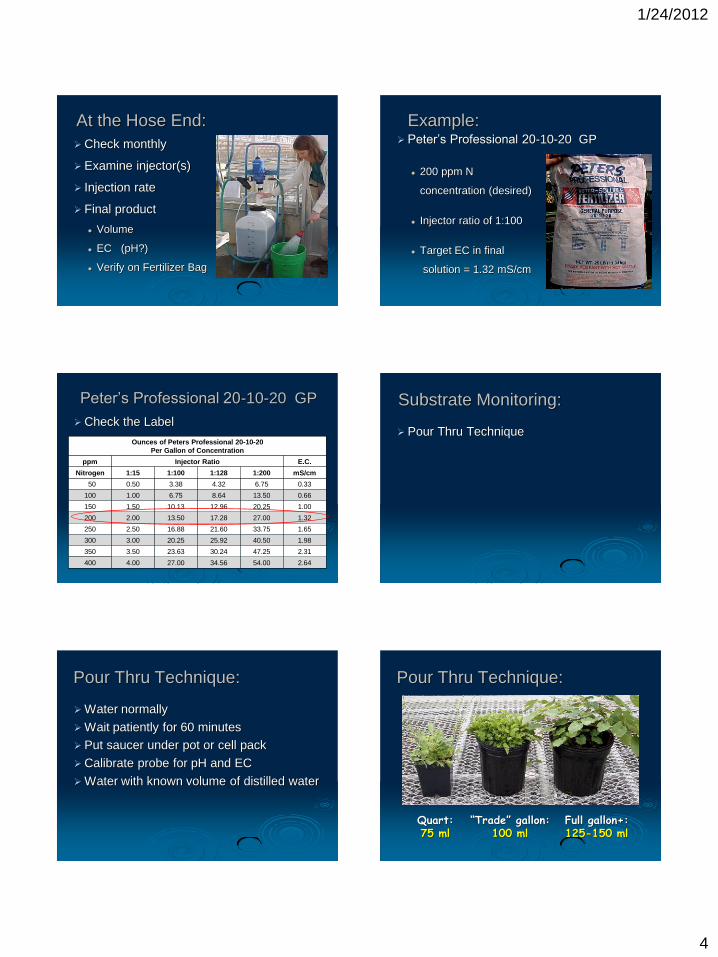
Peter’s Professional 20-10-20 GP
Check the Label
Ounces of Peters Professional 20-10-20
Per Gallon of Concentration
ppm Injector Ratio E.C.
Nitrogen 1:15 1:100 1:128 1:200 mS/cm
50 0.50 3.38 4.32 6.75 0.33
100 1.00 6.75 8.64 13.50 0.66
150 1.50 10.13 12.96 20.25 1.00
200 2.00 13.50 17.28 27.00 1.32
250 2.50 16.88 21.60 33.75 1.65
300 3.00 20.25 25.92 40.50 1.98
350 3.50 23.63 30.24 47.25 2.31
400 4.00 27.00 34.56 54.00 2.64
Substrate Monitoring:
Pour Thru Technique
Pour Thru Technique:
Water normally
Wait patiently for 60 minutes
Put saucer under pot or cell pack
Calibrate probe for pH and EC
Water with known volume of distilled water
Pour Thru Technique:
“Trade” gallon: 100 ml
Full gallon+: 125-150 ml
Quart: 75 ml
1/24/2012
5
Pour Thru Technique:
Water normally
Wait patiently for 60 minutes
Put saucer under pot or cell pack
Calibrate probe for pH and EC
Water with known volume of distilled water
Collect leachate with saucer
Sample leachate
Record EC and pH
Tips:
Be consistent with irrigation
Using distilled water and rinsing probe
between measurements
Do at least five different pots from the
same crop and chart
Testing either weekly or biweekly
Do not allow electrode to dry out
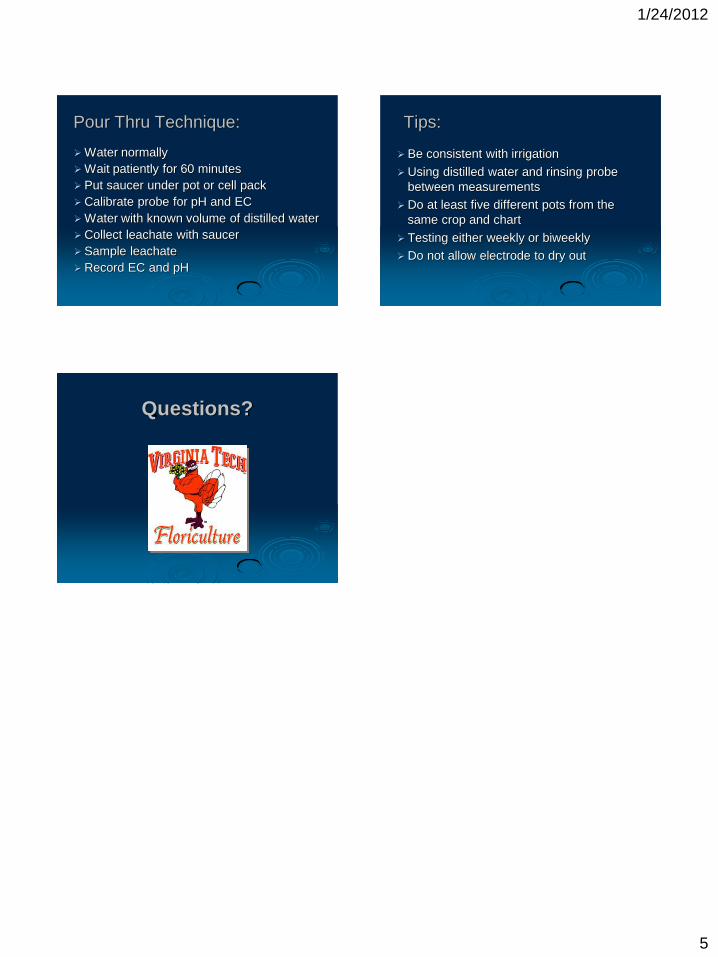
Questions?
Related Documents