Nutrition and Sport Topic 37 Module 37.1 Substrate utilization Katarina Melzer Learning objectives • Calculate energy expenditure during resting state; • Identify the size of the intramuscular ATP-CP pool for high intensity exercise; • Explain the influence of exercise intensity and duration on substrate utilization; • Describe the effect of training on substrate utilization. Contents 1. Substrate utilization during resting state 2. Anaerobic pathway for energy production 3. Aerobic pathway for energy production 4. Exercise intensity and substrate utilization 5. Exercise duration and substrate utilization 6. Effect of training on substrate utilization 7. Exercise mode and fat utilization 8. Summary Key messages • In a rested state, average person consumes about 3.5 ml of O 2 per kilogram body weight per minute or 1 kcal per kg body weight per hour; • Physical activity is one of the means of significantly increasing the total energy expenditure above the resting metabolic rate in healthy subjects; • During light exercise, the required energy is provided almost exclusively by the aerobic system. As the intensity of exercise increases, the role of the anaerobic systems becomes more important; • During low intensity exercise, fat predominates as energy substrate, whereas during high intensity exercise, carbohydrate presents the major fuel for utilization; • The pattern of substrate utilization changes with time, even when the exercise intensity remains constant. The longer the time spent exercising, the higher the contribution of fat as an energy substrate.

Welcome message from author
This document is posted to help you gain knowledge. Please leave a comment to let me know what you think about it! Share it to your friends and learn new things together.
Transcript

Nutrition and Sport Topic 37 Module 37.1 Substrate utilization
Katarina Melzer
Learning objectives • Calculate energy expenditure during resting state; • Identify the size of the intramuscular ATP-CP pool for high intensity exercise; • Explain the influence of exercise intensity and duration on substrate utilization; • Describe the effect of training on substrate utilization. Contents
1. Substrate utilization during resting state 2. Anaerobic pathway for energy production 3. Aerobic pathway for energy production 4. Exercise intensity and substrate utilization 5. Exercise duration and substrate utilization 6. Effect of training on substrate utilization 7. Exercise mode and fat utilization 8. Summary Key messages • In a rested state, average person consumes about 3.5 ml of O2 per kilogram body
weight per minute or 1 kcal per kg body weight per hour; • Physical activity is one of the means of significantly increasing the total energy
expenditure above the resting metabolic rate in healthy subjects; • During light exercise, the required energy is provided almost exclusively by the
aerobic system. As the intensity of exercise increases, the role of the anaerobic systems becomes more important;
• During low intensity exercise, fat predominates as energy substrate, whereas during high intensity exercise, carbohydrate presents the major fuel for utilization;
• The pattern of substrate utilization changes with time, even when the exercise intensity remains constant. The longer the time spent exercising, the higher the contribution of fat as an energy substrate.
2
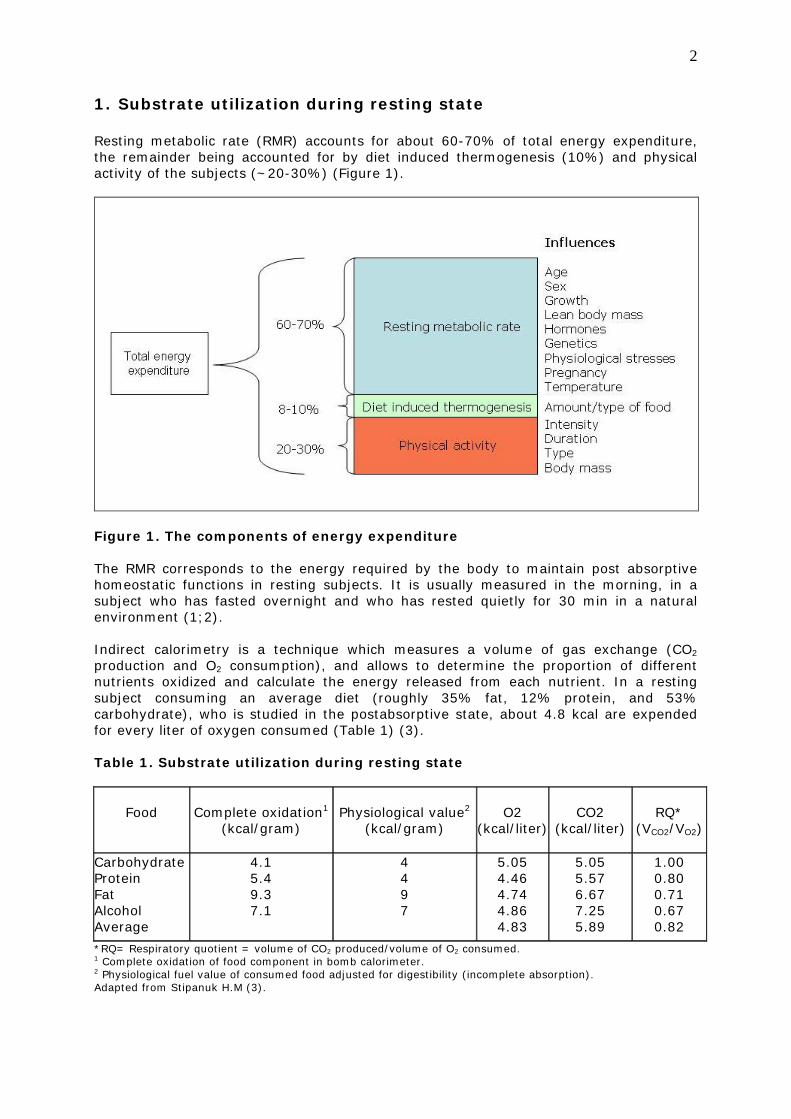
1. Substrate utilization during resting state Resting metabolic rate (RMR) accounts for about 60-70% of total energy expenditure, the remainder being accounted for by diet induced thermogenesis (10%) and physical activity of the subjects (~20-30%) (Figure 1).
Figure 1. The components of energy expenditure The RMR corresponds to the energy required by the body to maintain post absorptive homeostatic functions in resting subjects. It is usually measured in the morning, in a subject who has fasted overnight and who has rested quietly for 30 min in a natural environment (1;2). Indirect calorimetry is a technique which measures a volume of gas exchange (CO2 production and O2 consumption), and allows to determine the proportion of different nutrients oxidized and calculate the energy released from each nutrient. In a resting subject consuming an average diet (roughly 35% fat, 12% protein, and 53% carbohydrate), who is studied in the postabsorptive state, about 4.8 kcal are expended for every liter of oxygen consumed (Table 1) (3). Table 1. Substrate utilization during resting state
Food
Complete oxidation1
(kcal/gram)
Physiological value2
(kcal/gram)
O2
(kcal/liter)
CO2
(kcal/liter)
RQ*
(VCO2/VO2)
Carbohydrate Protein Fat Alcohol Average
4.1 5.4 9.3 7.1
4 4 9 7
5.05 4.46 4.74 4.86 4.83
5.05 5.57 6.67 7.25 5.89
1.00 0.80 0.71 0.67 0.82
*RQ= Respiratory quotient = volume of CO2 produced/volume of O2 consumed. 1 Complete oxidation of food component in bomb calorimeter. 2 Physiological fuel value of consumed food adjusted for digestibility (incomplete absorption). Adapted from Stipanuk H.M (3).

3
In other terms, in a rested state, an average person consumes about 3.5 ml of O2 per kilogram body weight per minute or expends about 1 kcal∗ per kg body weight per hour. This rate of energy expenditure is expressed as 1 metabolic equivalent (MET) (4). Using these common values, it can be calculated that a resting 70 kg man expends around 1680 kcal per day. The resting respiratory quotient (RQ) is a quotient between O2 consumption and CO2 production. An RQ of 1 indicates 100% carbohydrate oxidation, while the value of 0.7 indicates 100% fat oxidation (Table 1). The average resting RQ of 0.82 (Table 1) thus shows that the human body derives more than half of its energy from fat (fatty-acids), and most of the rest from carbohydrate (glucose). The body stores of energy fuels are presented in a Table 2. Table 2. Body stores of energy fuels
Body stores (grams)*
kcal
Carbohydrates Liver glycogen Muscle glycogen Glucose in body fluids
110 500 15
451 2050 62
Fat Subcutaneous and visceral Intramuscular
7800 161
72540 1497
*These estimates are based on an average body weight of 65kg with 12% body fat. Adapted from Wilmore JH, Costill DL (5). Most of the overall RMR of the body (~60 %) arises from four organs: liver, kidney, heart and brain, which account for ~5 % of body weight (Table 3)(6). Their metabolic rates are 15-40 times greater than that of the equivalent weight of muscle mass (~10-15 kcal/kg/day) and 50-100 times greater than that of adipose tissue (~4.5 kcal/kg/day). When summed up, the RMR per kg of these organs remains remarkably stable during growth and development, in contrast to the changes in metabolic rate per kg body weight. Table 3. Contribution of different organs and tissues to resting metabolic rate
Organ
Metabolic rate (kcal/kg/day)
Weight (kg)
Organ metabolic rate
(kcal/day)
% BMR
1) Brain 2) Liver 3) Heart 4) Kidney Total (1-4)
240 200 440 440 330
1.4 1.8 0.3 0.3 3.8
336 360 132 132 960
20 21 8 8
57
5) Muscle 13 28 500 21
Total (1-5) 70 kg man
32 1460 1680
78 100.0
Adapted from Kinney JM and Tucker NH (6).
∗ By definition, 1 cal equals the amount of energy needed to heat 1 gram of water from 14,5 °C to 15,5 °C at standard atmospheric pressure (101.325 kPa). This means that, for example, 20 cal/gram or 20 kcal/liter is needed to increase the water temperature from 15 to 35°C.

4
The higher metabolic rate of infants and children compared to adults can be largely explained by the increased proportion of metabolically active tissues. For example, the brain, which account for almost 50% of total energy expenditure of the infant, decreases in proportion to body weight during growth and development (6). On the other hand, skeletal muscle, which is less metabolically active than the brain and other organs, increases in proportion to body weight during growth and development. In adult life, the muscle mass presents the largest tissue of the whole body and accounts for about 40% to 50% in an ordinary lean mean. As such, it has a major effect on RMR, energy expenditure, and nutritional requirements. Other factors influence RMR as well. Among them are the following:
• Age: RMR decreases with age due to decrease in muscle mass. • Sex: RMR is higher in men than in women, independent of differences in body
composition, fitness level, menopausal status or age (7). • Growth: RMR is increased during growth due to the synthesis of growing tissues
and the energy deposited in those tissues (8). • Hormones: Thyroid and epinephrine hormones increase the RMR. • Genetic: RMR is correlated higher in monozygotic than in dizygotic twins, whether
expressed per kg of body weight or muscle mass (9). • Physiological stresses: Injury, fever, surgery, renal failure, burns, infections
increase RMR (3). • Pregnancy: RMR increases in late pregnancy by approximately 20% mainly due to
increase of maternal body mass (10). • Temperature: During extreme cold, shivering increases energy expenditure and
heat production. Fat provides most of the heat during low-intensity shivering, whereas CHO become dominant during intense cold exposure (11).
After the body’s needs during rest are met, additional energy is needed for diet induced thermogenesis and physical activity. Diet induced thermogenesis increases energy expenditure following the food intake and is associated with the digestion, absorption and metabolism of food and nutrients. It accounts for 5-10% of total energy expenditure and is influenced by the amount and type of food ingested. Diet induced thermogenesis increases linearly with caloric intake (12). The measured thermogeneses of nutrients are 0-3% for fat, 5-10% for carbohydrates, and 20-30% for proteins (13), indicating that a high protein and/or carbohydrate diet induces a greater thermic response compared to a high fat diet. Physical activity presents one of the means of significantly increasing the total energy expenditure above the resting metabolic rate and is of major importance to achieving energy balance. Energy expended on physical activity may be very low or high depending on the activity level of a subject. For the general population, it usually accounts for approximately 20 to 30% of total energy expended. 2. Anaerobic and lactic acid pathway for energy production As the body shifts from rest to exercise, an individual’s energy demands increase. The extra energy required can be supplied through anaerobic (independent on oxygen) and aerobic metabolism (dependent on oxygen). Which metabolic system will be used depends on the intensity, duration, and type of physical activity imposed. During light exercise, the required energy is provided almost exclusively by the aerobic system. As the intensity of exercise increases, the role of the anaerobic systems becomes more important. The energy required for work is not derived directly from the macronutrients eaten. Instead, this energy becomes released and funneled through an energy rich compound adenosine-triphosphate (ATP) to power cellular need. The ATP molecule consists of adenosine (a molecule of adenine joined to a molecule of ribose) combined with three

5
inorganic phosphate (Pi) groups. Adenine is a nitrogenous base and ribose is a five-carbon sugar. When ATP is combined with water (hydrolyses of ATP to ADP (adenosine-diphosphate)) and acted on by the enzyme ATPase, the last phosphate group splits away releasing approximately 7.3 kcal of free energy (i.e. energy available for work):
As this reaction generates a considerable amount of energy, ATP is referred to as a high-energy phosphate compound. The ATP breakdown generates energy for rapid use and does not require oxygen. Energy transfer increases about four-fold in the transition from sitting in a chair to walking. However, the transition from walking to an all-out sprint almost immediately accelerates the energy transfer rate about 120 times within active muscle (14). Generating significant energy output almost instantaneously demands ATP availability and a means for its rapid resynthesis. Although energy rich, only a small amount of ATP is present within the muscle cells, amounting to about 5mmol per kg or 3.4 grams per kg. An average person with 20 kg muscle mass thus contains not more than around 70g of ATP in total (15). The rate of turnover of ATP in a sprinting human is approximately 2.7 mmol per kg per second; in a high jump it may be as high as 7 mmol per kg per second (16). With only 5mmol per kg of ATP available, it has to be quickly resynthesized in order to support exercise that lasts for more than a few seconds. The second source of readily available energy is present in the form of creatine phosphate (CP), also known as phospho-creatine. The CP, present within the muscle cell at a concentration about 3-4 times that of ATPs (~17 mmol per kg muscle cells), can be considered as a “reservoir” of high-energy phosphate bonds. Unlike ATP, energy released by the breakdown of CP is not used directly to accomplish cellular work. Instead, it rebuilds ATP to maintain a relatively constant supply. The resynthesis of ATP from ADP by transfer of a phosphate group from CP is catalysed by the enzyme creatine kinase.
This reaction is extremely rapid, does not require oxygen, can supply energy at a very high rate and produce metabolic power above 4000W (16). During the first few seconds of intense muscular activity, such as sprinting, tennis serve or weight lift, ATP is maintained at a relatively constant level, but the CP level declines steadily as it is used to replenish the depleted ATP. After around 5-10 seconds of intense exercise activity, CP storage is exhausted and an alternative fuel must be used. The ATP concentration is 5mmol per kg muscle mass, and the one of CP is 17 mmol per kg. Their potential total energy yield for a 20 kg muscle man is approximately 4.3kcal (16). It has been estimated, however, that the energy cost of a 100 m sprint is about 8 kcal, and if the duration of the sprint is 10s, the power is 3300 W (14). So even if the ATP and CP of the entire muscle mass could be used for the sprint, there would be a remaining deficit in energy which has to be provided by glycolysis with the formation of lactic acid. Carbohydrates (blood glucose and glycogen from muscle or liver) are the only macronutrients whose potential energy can generate ATP anaerobically as well as aerobically (14). The anaerobic process of glucose/glycogen utilization occurs within the cell’s cytoplasm, outside of the mitochondrion, and is called “anaerobic glycolysis” or “lactic acid pathway for energy production”.
6
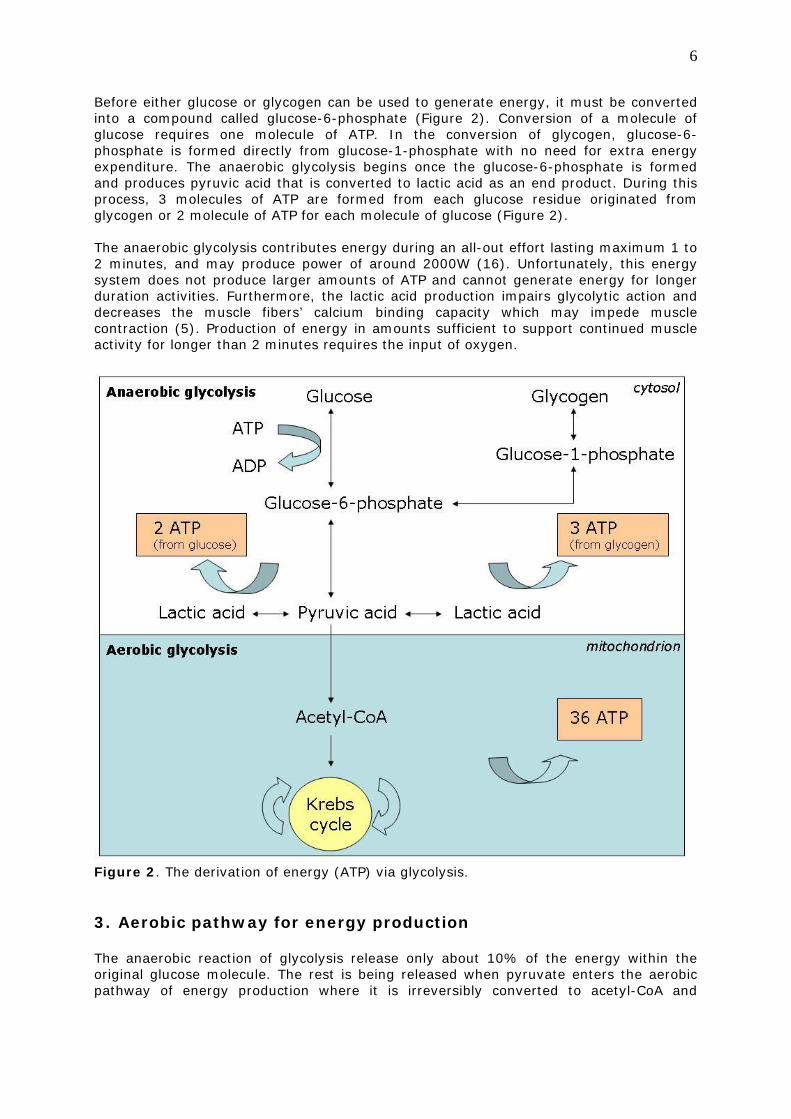
Before either glucose or glycogen can be used to generate energy, it must be converted into a compound called glucose-6-phosphate (Figure 2). Conversion of a molecule of glucose requires one molecule of ATP. In the conversion of glycogen, glucose-6-phosphate is formed directly from glucose-1-phosphate with no need for extra energy expenditure. The anaerobic glycolysis begins once the glucose-6-phosphate is formed and produces pyruvic acid that is converted to lactic acid as an end product. During this process, 3 molecules of ATP are formed from each glucose residue originated from glycogen or 2 molecule of ATP for each molecule of glucose (Figure 2). The anaerobic glycolysis contributes energy during an all-out effort lasting maximum 1 to 2 minutes, and may produce power of around 2000W (16). Unfortunately, this energy system does not produce larger amounts of ATP and cannot generate energy for longer duration activities. Furthermore, the lactic acid production impairs glycolytic action and decreases the muscle fibers’ calcium binding capacity which may impede muscle contraction (5). Production of energy in amounts sufficient to support continued muscle activity for longer than 2 minutes requires the input of oxygen.
Figure 2. The derivation of energy (ATP) via glycolysis. 3. Aerobic pathway for energy production The anaerobic reaction of glycolysis release only about 10% of the energy within the original glucose molecule. The rest is being released when pyruvate enters the aerobic pathway of energy production where it is irreversibly converted to acetyl-CoA and
7
degraded within mitocondria in the Krebs cycle (Figure 2). The complete oxidation of 1 mole of glucose produces 36 moles of ATP. The aerobic pathway can also provide ATP by metabolizing fats and proteins. Fat energy reserves are stored in the human body as triglycerides. To release energy, triglycerides must be hydrolyzed (lipolysis) to fatty acids and glycerol as follows:
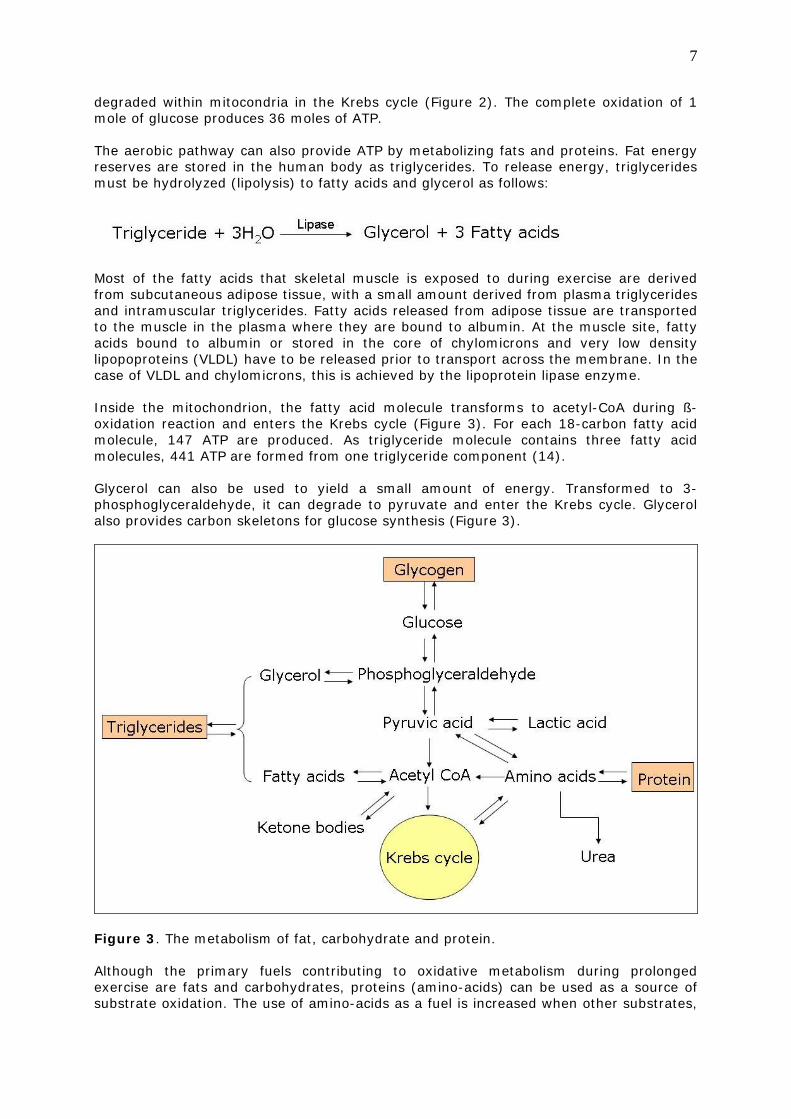
Most of the fatty acids that skeletal muscle is exposed to during exercise are derived from subcutaneous adipose tissue, with a small amount derived from plasma triglycerides and intramuscular triglycerides. Fatty acids released from adipose tissue are transported to the muscle in the plasma where they are bound to albumin. At the muscle site, fatty acids bound to albumin or stored in the core of chylomicrons and very low density lipopoproteins (VLDL) have to be released prior to transport across the membrane. In the case of VLDL and chylomicrons, this is achieved by the lipoprotein lipase enzyme. Inside the mitochondrion, the fatty acid molecule transforms to acetyl-CoA during ß-oxidation reaction and enters the Krebs cycle (Figure 3). For each 18-carbon fatty acid molecule, 147 ATP are produced. As triglyceride molecule contains three fatty acid molecules, 441 ATP are formed from one triglyceride component (14). Glycerol can also be used to yield a small amount of energy. Transformed to 3-phosphoglyceraldehyde, it can degrade to pyruvate and enter the Krebs cycle. Glycerol also provides carbon skeletons for glucose synthesis (Figure 3).
Figure 3. The metabolism of fat, carbohydrate and protein. Although the primary fuels contributing to oxidative metabolism during prolonged exercise are fats and carbohydrates, proteins (amino-acids) can be used as a source of substrate oxidation. The use of amino-acids as a fuel is increased when other substrates,

8
especially carbohydrate, are not available. Under normal conditions, nevertheless, protein oxidation accounts for not more than 5% of the energy requirements during prolonged exercise (14). Amino acids can be converted to acetyl-CoA or Krebs cycle metabolites to enter the oxidative process, or be synthesized to glucose when glycogen reserves run low (Figure 3). In order to enter the pathways of energy production, amino acids are converted to Krebs cycle metabolites. This conversion requires transamination or deamination of amino acid and consecutive incorporation of nitrogen into urea molecule. Because some energy is spent in this process, the metabolized protein yields 4.1 kcal/g, which is less than the energy released from the complete protein oxidation in the laboratory calorimetry bomb (5.6 kcal/g)(Table 1). 4. Exercise intensity and substrate utilization Carbohydrates (muscle glycogen and plasma glucose) and fats (plasma fatty acids and intramuscular triglyceride) are thus the primary energy sources during exercise. The proportion of their contribution to energy expenditure is determined largely by the intensity and duration of substrate utilization. During low intensity exercise (25% of maximal oxygen uptake (VO2max)), which corresponds to walking at 4-5km/h, most of the energy need is provided by oxidation of fatty acids of which more than 85% is derived from plasma (17). At this intensity, the rate of appearance of fatty acids in plasma is very similar to the rate of fatty acid oxidation (i.e. lipolysis from adipocytes) (~26µmol/kg/min). The rate of fatty acid oxidation is determined from direct measures of the rate of appearance (Ra) of glycerol, which is an index of lipolysis (defined as 3 x glycerol Ra, as 3 fatty acids and 1 glycerol molecule are released from 1 triglyceride during lipolysis). As the exercise intensity increases to a moderate level (65% VO2max), availability of plasma fatty acids decrease while the intramuscular triglycerides oxidation increases (Figure 4). At this level, plasma fatty acids and intramuscular triglycerides contribute equally to total fat oxidation. Although the total fat oxidation is highest at this exercise level (>40µmol/kg/min), fat can not be oxidized at sufficiently high rates to provide all the energy required. Consequently, about one-half of the total energy is simultaneously derived from carbohydrate oxidation (muscle glycogen and blood glucose) (18).

9
Figure 4. Substrate contribution to energy expenditure at different exercise intensities (16). At high exercise intensities level (85% of VO2max), the rate of plasma fatty acid oxidation is decreased below the value at 65% of VO2max, and intramuscular triglycerides become the major source of fatty acids for oxidation. It appears that fatty acids become trapped in adipose tissue as exercise intensity increases because of insufficient blood flow and albumin delivery to carry fatty acids from adipose tissue into the systemic circulation (19). For this reason, the availability of plasma fatty acids reduces despite a maintained high rate of lipolysis from adipocytes. When the intensity of exercise reaches 85% VO2max, the absolute rate of fat oxidation decreases (from >40µmol/kg/min to 30µmol/kg/min), and the carbohydrate oxidation provides more than two-thirds of the energy required. The advantage of carbohydrate metabolism during high intensity exercise lies in its two times more rapid energy transfer capacity compared with fatty acids (14). Therefore, during low intensity exercise, fat predominates as energy substrate, whereas during high intensity exercise, carbohydrate presents the major fuel for utilization. These data have been collected in endurance trained subjects after 10-12 hours fast and 30 minutes exercise. 5. Exercise duration and substrate utilization The pattern of substrate utilization changes with time, even when the exercise intensity remains constant. The longer the time spent exercising, the higher the contribution of fat as an energy substrate. During low intensity exercise lasting longer than 2 hours, the substrate utilization is not significantly altered as compared to those utilized during shorter bouts of exercise. On the other hand, during higher intensity levels, there is a progressive increase in reliance on plasma fatty acids (18). In prolonged exercise, plasma fatty acid oxidation increases in parallel with the depletion of glycogen storage in the working muscle (15). The increased rate of fat oxidation is due to an increase in circulating level of catecholamine (adrenalin and noradrenalin), and a decrease in the circulating level of insulin. The catecholamines play a role in stimulating, and the insulin, in inhibiting the process of lipolysis.
10
Once the glycogen stores become depleted, blood glucose becomes the primary source of the limited carbohydrate energy and is unable to support the required rate of energy production. The inability to maintain a desired level of performance (fatigue) is usually referred to as “hitting the wall”, where liver and muscle glycogen levels decrease severely, even with sufficient oxygen available to the muscles and almost unlimited potential energy from stored fat. 6. Effect of training on substrate utilization Repeated episodes of physical activity performed over a longer period of time cause adaptations in the pulmonary, cardiovascular and neuromuscular systems that improve the delivery of oxygen to the mitochondria and enhance the control of metabolism within the muscle cells. These changes enable physically trained persons to exercise for longer at a given absolute exercise intensity, or to exercise at a higher exercise intensity for a given duration (20). The adaptations in metabolic and physiologic systems depend on the type of exercise overload imposed. Activities that demand a high level of anaerobic metabolism improve the immediate and short-term energy systems, with little impact on the aerobic system. The adaptation of the anaerobic training include increased intramuscular levels of anaerobic substrates (adenosine triphosphate (ATP), phosphocreatine, glycogen), increased quantity and activity of enzymes that control the anaerobic phase of glucose breakdown (phosphofructokinase, lactate dehydrogenase) and increased capacity to generate high blood lactate levels during maximal exercise (14). Likewise, regular aerobic training elicits specific endurance-training adaptations. For many years, it was thought that increased exercise capacities are exclusively the result of cardiovascular adaptations to exercise (enlarged left ventricular cavity of the heart, enhanced blood and stroke volume, increased cardiac output and decreased resting and submaximal exercise heart rate (21)), and thus improved oxygen delivery to the working muscles. However, there is an increasing body of evidence, showing that endurance-training adaptations also involve an increase in mitochondrial size and number in aerobically-trained skeletal muscles (which improves their capacity to generate ATP by oxidative phosphorylation) (22), an increase in the level of aerobic system enzymes (which enables lower lactate accumulation during exercise), improved ability to oxidize triglycerides stored within active muscle, and proportional decrease in muscle glycogen and blood glucose utilization (14;23). 7. Exercise mode and fat utilization Recent studies showed that fat oxidation during exercise can be influenced by the type of exercise performed. Maximal fat oxidation rates are shown to be significantly higher during running compared to the same intensity of cycling (24;25). Women oxidize more fat than men at around 40% of VO2 max (26;27), although gender difference does not seem to occur at higher intensities (26). Fat oxidation was also shown to be augmented in exercise that combines aerobic and resistance training. Performing a higher intensity resistance exercise augment fat utilization during subsequent aerobic exercise (28). 8. Summary Carbohydrates and fats are oxidized simultaneously, but the relative contribution of these two substrates depends on a variety of factors. In healthy subjects, substrate utilization during rest is highly dependent on carbohydrate availability. During exercise, changes in

11
substrate utilization are highly influenced by exercise duration and intensity. The longer the time spent exercising, the higher the contribution of fat as an energy substrate. With increasing intensity, the contribution of carbohydrates to energy expenditure increases and the contribution of fatty acids to energy expenditure decreases. Substrate utilization under the same exercise intensity is affected by the exercise mode, with fat oxidation being higher in running compared to cycling. Utilization of carbohydrates and fats during rest and exercise remains an important object of further investigation.
9. References 1. Wang Z, Heshka S, Zhang K, Boozer CN, Heymsfield SB. Resting energy
expenditure: systematic organization and critique of prediction methods. Obes Res 2001;9:331-6.
2. Benedict FG, Crofts EE. The Fixity of Basal Metabolism. Proc Natl Acad Sci U S A 1925;11:585-8.
3. Stipanuk H.M. Biochemical and Physiological Aspects of Human Nutrition. W.B.Saunders Company, 2000.
4. Ainsworth BE, Haskell WL, Leon AS et al. Compendium of physical activities: classification of energy costs of human physical activities. Med Sci Sports Exerc 1993;25:71-80.
5. Wilmore JH, Costill DL. Physiology of sport and exercise. 3rd edition. Human Kinetics, 2004.
6. Kinney JM, Tucker HN. Energy metabolism. Tissue determinants and cellular corollaries. Ravan Press, 1992.
7. Arciero PJ, Goran MI, Poehlman ET. Resting metabolic rate is lower in women than in men. J Appl Physiol 1993;75:2514-20.
8. FAO. Food and Nutrition Technical Report Series. Human Energy Requirements. Report of a Joint FAO/WHO/UNU Expert Consultation. Rome. 2004.
9. Bouchard C, Tremblay A, Nadeau A et al. Genetic effect in resting and exercise metabolic rates. Metabolism 1989;38:364-70.
10. Melzer K, Schutz Y, Boulvain M, Kayser B. Pregnancy related changes in activity energy expenditure and resting metabolic rate in Switzerland. Eur J Clin Nutr 2009;(accepted for publication).
11. Weber JM, Haman F. Fuel selection in shivering humans. Acta Physiol Scand 2005;184:319-29.
12. D'Alessio DA, Kavle EC, Mozzoli MA et al. Thermic effect of food in lean and obese men. J Clin Invest 1988;81:1781-9.
13. Tappy L. Thermic effect of food and sympathetic nervous system activity in humans. Reprod Nutr Dev 1996;36:391-7.
14. McArdle W, Katch FKV. Essentials of Exercise Physiology. Lippincott Williams & Wilkins, 2000.
15. Maughan RJ, Burke LM. Sports Nutrition. Handbook of Sports Medicine and Science. Blackwell Science, 2002.
16. Astrand PO, Rodahl K, Dahl HASSB. Textbook of Work Physiology. Physiological Bases of Exercise. 4th edition. Human Kinetics, 2003.
17. van Baak MA. Physical activity and energy balance. Public Health Nutr 1999;2:335-9.
18. Romijn JA, Coyle EF, Sidossis LS et al. Regulation of endogenous fat and carbohydrate metabolism in relation to exercise intensity and duration. Am J Physiol 1993;265:E380-E391.
19. Hodgetts V, Coppack SW, Frayn KN, Hockaday TD. Factors controlling fat mobilization from human subcutaneous adipose tissue during exercise. J Appl Physiol 1991;71:445-51.
20. Jones AM, Carter H. The effect of endurance training on parameters of aerobic fitness. Sports Med 2000;29:373-86.
12
21. Jones AM, Carter H. The effect of endurance training on parameters of aerobic fitness. Sports Med 2000;29:373-86.
22. Wibom R, Hultman E, Johansson M, Matherei K, Constantin-Teodosiu D, Schantz PG. Adaptation of mitochondrial ATP production in human skeletal muscle to endurance training and detraining. J Appl Physiol 1992;73:2004-10.
23. Fujimoto T, Kemppainen J, Kalliokoski KK, Nuutila P, Ito M, Knuuti J. Skeletal muscle glucose uptake response to exercise in trained and untrained men. Med Sci Sports Exerc 2003;35:777-83.
24. Achten J, Venables MC, Jeukendrup AE. Fat oxidation rates are higher during running compared with cycling over a wide range of intensities. Metabolism 2003;52:747-52.
25. Knechtle B, Muller G, Willmann F, Kotteck K, Eser P, Knecht H. Fat oxidation in men and women endurance athletes in running and cycling. Int J Sports Med 2004;25:38-44.
26. Kang J, Hoffman JR, Ratamess NA, Faigenbaum AD, Falvo M, Wendell M. Effect of exercise intensity on fat utilization in males and females. Res Sports Med 2007;15:175-88.
27. Venables MC, Achten J, Jeukendrup AE. Determinants of fat oxidation during exercise in healthy men and women: a cross-sectional study. J Appl Physiol 2005;98:160-7.
28. Kang J, Rashti SL, Tranchina CP, Ratamess NA, Faigenbaum AD, Hoffman JR. Effect of preceding resistance exercise on metabolism during subsequent aerobic session. Eur J Appl Physiol 2009;107:43-50.
Related Documents