NutrientStar : Elevating New Research Standards and Transparency on Performance of Fertilizer Management Tools and Models Jim Schepers Retired USDA-ARS Soil Scientist Emeritus University of Nebraska

Welcome message from author
This document is posted to help you gain knowledge. Please leave a comment to let me know what you think about it! Share it to your friends and learn new things together.
Transcript

NutrientStar : Elevating New Research Standards and Transparency on Performance of Fertilizer Management Tools and Models
Jim Schepers
Retired USDA-ARS Soil ScientistEmeritus University of Nebraska

An Objective, Science-based Assessment & Education
Program for Nutrient-Use Efficiency Tools & Products
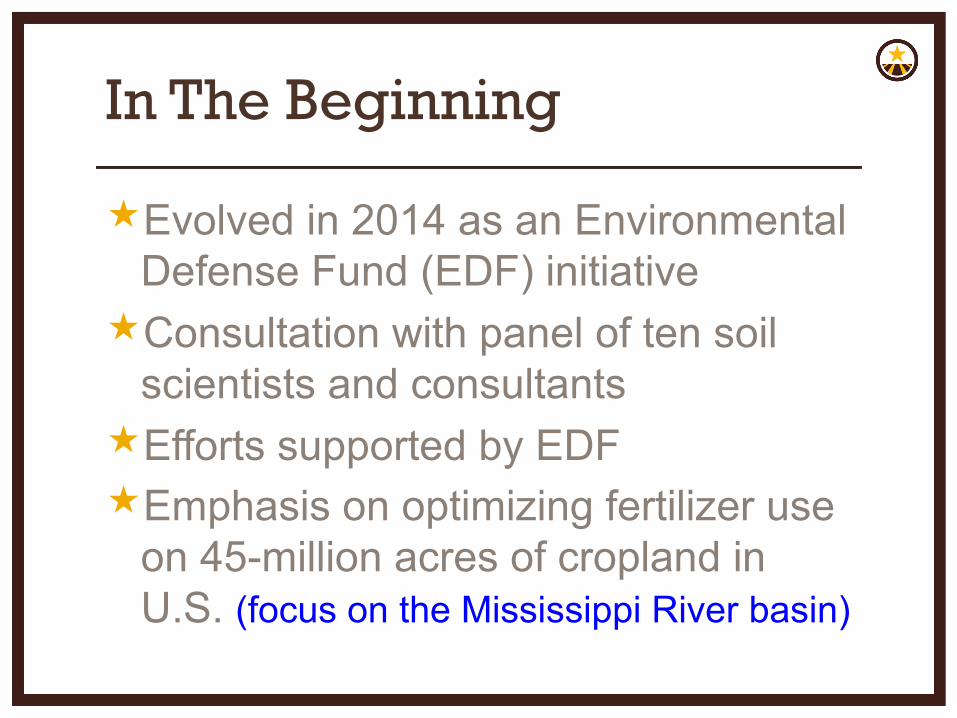
In The Beginning
Evolved in 2014 as an Environmental Defense Fund (EDF) initiative
Consultation with panel of ten soil scientists and consultants
Efforts supported by EDFEmphasis on optimizing fertilizer use
on 45-million acres of cropland in U.S. (focus on the Mississippi River basin)

Why NutrientStar?
Food Supply Chain Companies:Consumers are requesting documentation about the origin of food source, production practices, and growing conditions (perceived
quality and sustainability)
Food Supply Chain Companies:Consumers are requesting documentation about the origin of food source, production practices, and growing conditions (perceived
quality and sustainability)
Today’s Farmers:Over-whelmed with information about tools and products on the market that claim to maximize yields and imply greater profitability while minimizing nutrient loss.Are not sure which ones will work best for their operation.
Today’s Farmers:Over-whelmed with information about tools and products on the market that claim to maximize yields and imply greater profitability while minimizing nutrient loss.Are not sure which ones will work best for their operation.

Measure NUE performance of tools and products
Measure NUE performance of tools and products
Goals of NutrientStar
Educate farmers, advisors, and supply chain partners
Educate farmers, advisors, and supply chain partners
Highlight importance of science-based research and data
Highlight importance of science-based research and data
Increase transparency and progress in delivering fertilizer optimization tools to farmers
Increase transparency and progress in delivering fertilizer optimization tools to farmers

Envisioned to be analogous to Consumer’s Reports in terms of testing and rating N management tools and products
Envisioned to be analogous to Consumer’s Reports in terms of testing and rating N management tools and products
NutrientStar IS NOT
Intended to convey to producers and consumers a level of confidence similar to Underwriters Laboratories
Intended to convey to producers and consumers a level of confidence similar to Underwriters Laboratories
An accreditation service for nutrient management tools or products
An accreditation service for nutrient management tools or products
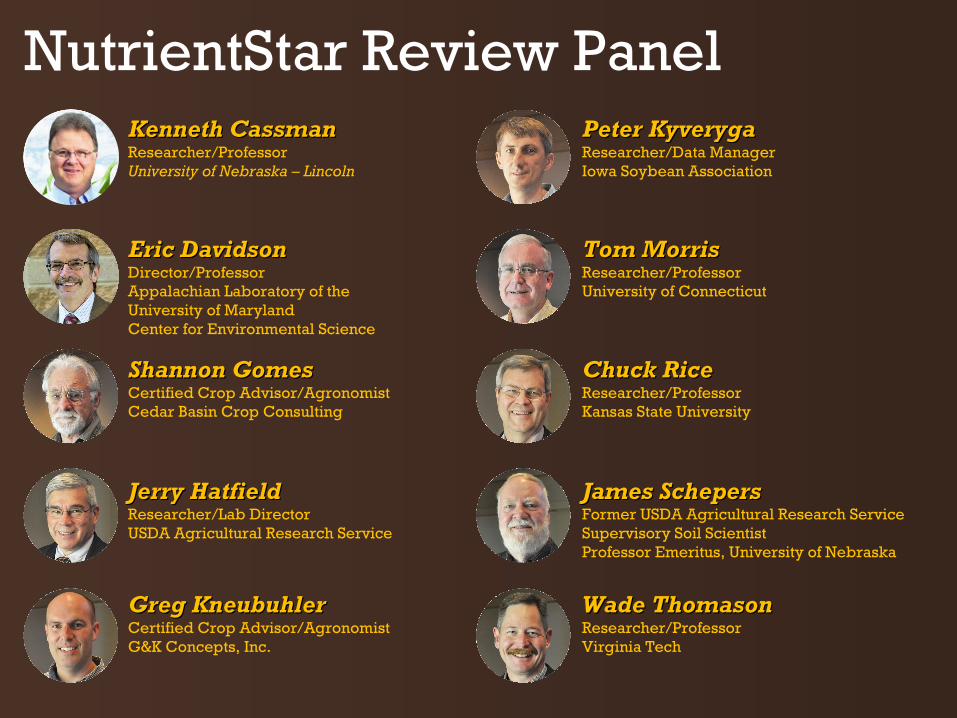
Kenneth CassmanKenneth CassmanResearcher/ProfessorUniversity of Nebraska – Lincoln
Peter KyverygaPeter KyverygaResearcher/Data ManagerIowa Soybean Association
Eric DavidsonEric DavidsonDirector/Professor Appalachian Laboratory of the University of Maryland Center for Environmental Science
Tom MorrisTom MorrisResearcher/ProfessorUniversity of Connecticut
Shannon GomesShannon GomesCertified Crop Advisor/AgronomistCedar Basin Crop Consulting
Chuck RiceChuck RiceResearcher/ProfessorKansas State University
Jerry HatfieldJerry HatfieldResearcher/Lab DirectorUSDA Agricultural Research Service
James SchepersJames SchepersFormer USDA Agricultural Research Service Supervisory Soil ScientistProfessor Emeritus, University of Nebraska
Greg KneubuhlerGreg KneubuhlerCertified Crop Advisor/AgronomistG&K Concepts, Inc.
Wade ThomasonWade ThomasonResearcher/ProfessorVirginia Tech
NutrientStar Review Panel
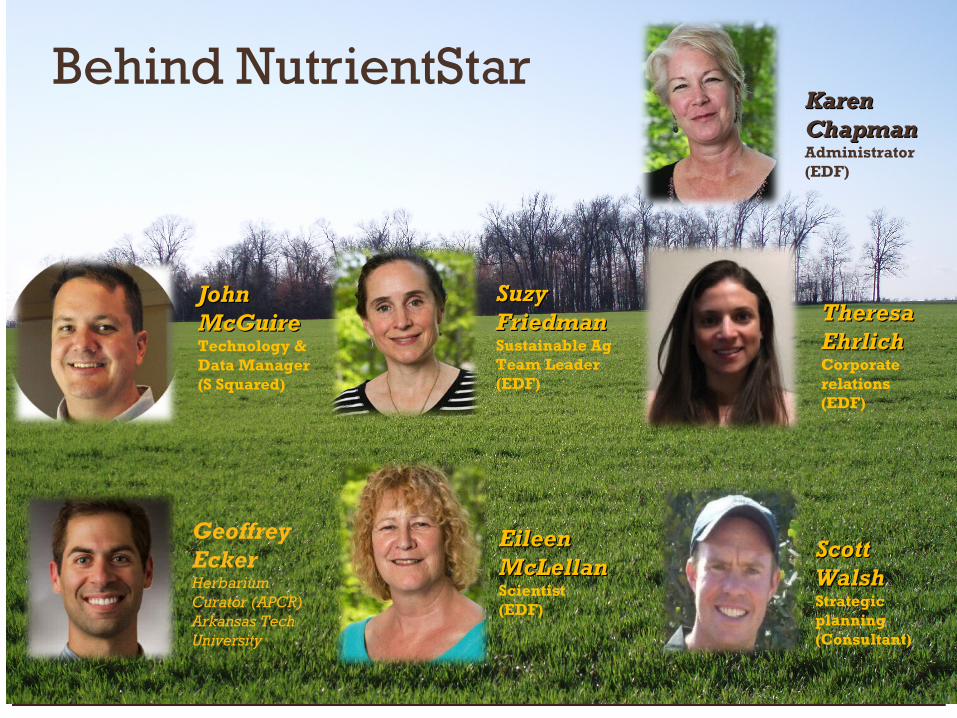
Behind NutrientStar
John John McGuireMcGuireTechnology & Data Manager (S Squared)
Karen Karen ChapmanChapman Administrator (EDF)
Suzy Suzy FriedmanFriedmanSustainable Ag Team Leader (EDF)
Eileen Eileen McLellanMcLellanScientist(EDF)
Theresa Theresa EhrlichEhrlichCorporate relations(EDF)
Scott Scott WalshWalshStrategic planning(Consultant)
Geoffrey EckerHerbarium Curator (APCR) Arkansas Tech University

NutrientStar’s Current Focus: Assessment of tools or products marketed as able to increase NUE and optimize profitabilityTechnologies modeling climate, soil & other conditions (decision support tools that enable 4R management)
In-season and optical sensor technologies
Enhanced efficiency products
GIS tool for regional adaptability

Example of Literature Review Findings
http://nutrientstar.org/tool-finder/
Authors Location Years # Plot Yield Trials Size Change
bu/A %
Information could compliment
various NRCS Programs
Information could compliment
various NRCS Programs

Nitrogen Mangement Tool Evaluation
Adapt – N 2011 - present
FieldView current
Encirca 2015-2016
Limited replicated strips
Many strip trials
Small plots
2016NutrientStar Trials (47 locations)
N-rates (lb/A)100, 150, 200, 250
4 Replications
Monsanto / ClimateCorp
Pioneer / DuPont / Dow
1/3 non-responsive1/3 non-
responsive
Agronomic Technology Corp
~20% had noplateau
~20% had noplateau

Adapt – N . . . N Rate vs. Yield Differences
NOTE : Calculations were referenced to “producer” practices Good ------- Not so good
NOTE : Calculations were referenced to “producer” practices Good ------- Not so good

6060
3333 1818
22Yield
N Rate+
+
-
-
Adapt – N … relative to producer practices
2011 - 2014n = 113
Iowa & New York
82% had lower N rates
45% had higher yields
53% that reduced N rate
had lower yields

77
2121 7070
1313NUE
Partial Profit+
+
-
-
Adapt – N … relative to producer practices
2011 – 2014n = 111
New York and Iowa
bushels_________________________
lb N
bushels_________________________
lb N
$/bu : $/lb N9 : 1
$/bu : $/lb N9 : 1
25% had lower N profits

Adapt – N . . . Partial Profitability
2011-2014
~5 bu/A~5 bu/A

2015 Encirca Nitrogen Innovation Trials
124 LocationsApplication Timing
2015 EncircaSM Nitrogen Innovation Trials

74% Wins(92/124 locs)
2015 Results: Win RatioEncircaSM improved return on N fertilizer investment in 74 % of trials
Return on N = [(Encirca yield x price) – (Encirca N rate x price)] – [(Grower yield x price) – (Grower N rate x price)]
2015

2015 Encirca Nitrogen Innovation Trials2016 EncircaSM Nitrogen Innovation Trials
300 Locations

2016 Results: Win RatioEncircaSM improved return on N fertilizer investment in 60% of trials
Return on N = [(Encirca yield x price) – (Encirca N rate x price)] – [(Grower yield x price) – (Grower N rate x price)]
60% Wins(180/300 locs)
2016

Managing Variability with EncircaSM Nitrogen Service
Good Mineralization / High N Loss
Good Mineralization / Low N Loss

Encirca Field Strip Trials
2016
2015

Technology Extrapolation Domains (TEDs)
Geographically referenced data included in delineation of TEDs:
Zones based partly on ideas in: (Van Wart et al., 2013. Field Crops Research 143:44-55). Use of agro-climatic zones to upscale simulated crop yield potential.
Climate Zonation1. Growing Degree Days 2. Temperature Seasonality3. Annual Aridity Index

Major Land Resource Areas (MLRA)
CriteriaClimateSoilLand Use

Soil Fragile Index
“Aridity”
Soil Fragile Index - - - - - - - - - - TEDs - - - - - - - - - -
0 30 100
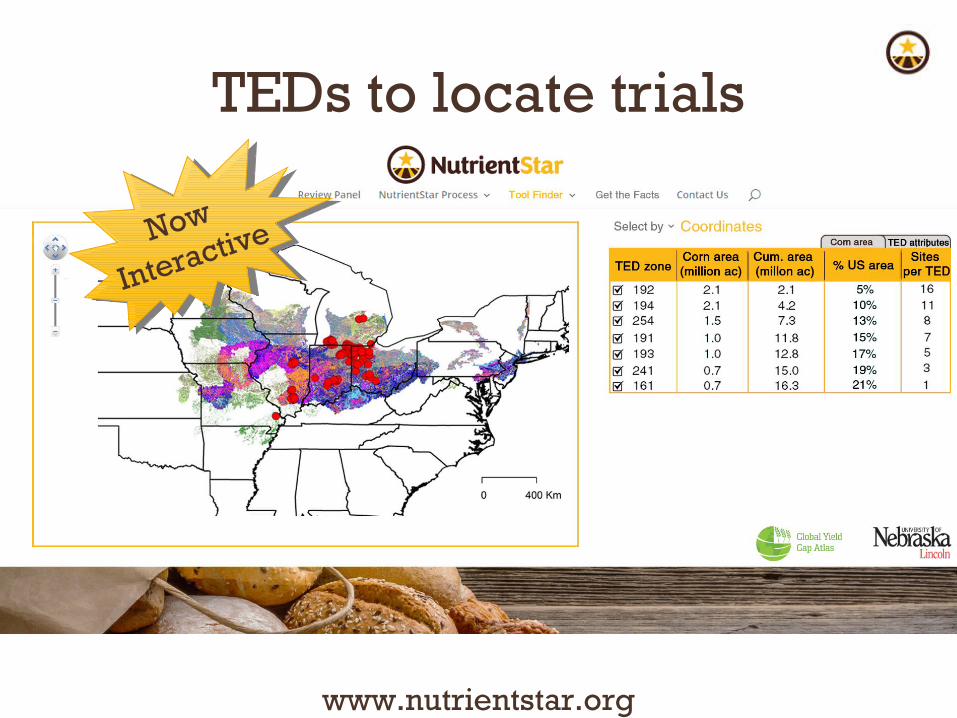
www.nutrientstar.org
TEDs to locate trials
Now
Interactive

Midwest / Corn Belt TEDs Number of Adapt-N test site at each location in 2017

Thanks to our funders
For more information: www.nutrientstar.org
Karen Chapman, EDF
John McGuire, S2
QUESTIONS COMMENTS FEEDBACK
Related Documents


