Nutrients 2015, 7, 4875-4896; doi:10.3390/nu7064875 nutrients ISSN 2072-6643 www.mdpi.com/journal/nutrients Review Metabolomics to Explore Impact of Dairy Intake Hong Zheng 1 , Morten R. Clausen 1 , Trine K. Dalsgaard 2 and Hanne C. Bertram 1, * 1 Department of Food Science, Aarhus University, Kirstinebjergvej 10, Aarslev DK-5792, Denmark; E-Mails: [email protected] (H.Z.); [email protected] (M.R.C.) 2 Department of Food Science, Aarhus University, Blichers Allé 20, Tjele DK-8830, Denmark; E-Mail: [email protected] * Author to whom correspondence should be addressed; E-Mail: [email protected]; Tel.: +45-8715-8353; Fax: +45-8999-1564. Received: 13 April 2015 / Accepted: 4 June 2015 / Published: 17 June 2015 Abstract: Dairy products are an important component in the Western diet and represent a valuable source of nutrients for humans. However, a reliable dairy intake assessment in nutrition research is crucial to correctly elucidate the link between dairy intake and human health. Metabolomics is considered a potential tool for assessment of dietary intake instead of traditional methods, such as food frequency questionnaires, food records, and 24-h recalls. Metabolomics has been successfully applied to discriminate between consumption of different dairy products under different experimental conditions. Moreover, potential metabolites related to dairy intake were identified, although these metabolites need to be further validated in other intervention studies before they can be used as valid biomarkers of dairy consumption. Therefore, this review provides an overview of metabolomics for assessment of dairy intake in order to better clarify the role of dairy products in human nutrition and health. Keywords: dairy product; casein; whey; cheese; biomarkers; compliance 1. Introduction Cow’s milk is a good source of nutrients for humans and its health benefits have been appreciated since the Middle Ages [1]. Currently, cow’s milk plays an important role in human nutrition, spanning the entire age range from infants to elderly, especially in Western countries but also increasingly in Asia and Africa. Cow’s milk can be processed into different types of dairy products, such as butter, OPEN ACCESS

Welcome message from author
This document is posted to help you gain knowledge. Please leave a comment to let me know what you think about it! Share it to your friends and learn new things together.
Transcript
Nutrients 2015, 7, 4875-4896; doi:10.3390/nu7064875
nutrients ISSN 2072-6643
www.mdpi.com/journal/nutrients Review
Metabolomics to Explore Impact of Dairy Intake
Hong Zheng 1, Morten R. Clausen 1, Trine K. Dalsgaard 2 and Hanne C. Bertram 1,*
1 Department of Food Science, Aarhus University, Kirstinebjergvej 10, Aarslev DK-5792, Denmark; E-Mails: [email protected] (H.Z.); [email protected] (M.R.C.)
2 Department of Food Science, Aarhus University, Blichers Allé 20, Tjele DK-8830, Denmark; E-Mail: [email protected]
* Author to whom correspondence should be addressed; E-Mail: [email protected]; Tel.: +45-8715-8353; Fax: +45-8999-1564.
Received: 13 April 2015 / Accepted: 4 June 2015 / Published: 17 June 2015
Abstract: Dairy products are an important component in the Western diet and represent a valuable source of nutrients for humans. However, a reliable dairy intake assessment in nutrition research is crucial to correctly elucidate the link between dairy intake and human health. Metabolomics is considered a potential tool for assessment of dietary intake instead of traditional methods, such as food frequency questionnaires, food records, and 24-h recalls. Metabolomics has been successfully applied to discriminate between consumption of different dairy products under different experimental conditions. Moreover, potential metabolites related to dairy intake were identified, although these metabolites need to be further validated in other intervention studies before they can be used as valid biomarkers of dairy consumption. Therefore, this review provides an overview of metabolomics for assessment of dairy intake in order to better clarify the role of dairy products in human nutrition and health.
Keywords: dairy product; casein; whey; cheese; biomarkers; compliance
1. Introduction
Cow’s milk is a good source of nutrients for humans and its health benefits have been appreciated since the Middle Ages [1]. Currently, cow’s milk plays an important role in human nutrition, spanning the entire age range from infants to elderly, especially in Western countries but also increasingly in Asia and Africa. Cow’s milk can be processed into different types of dairy products, such as butter,
OPEN ACCESS
Nutrients 2015, 7 4876 cheese, cream, and yogurt. Due to the different dairy processes, nutritional characteristics may differ among dairy products, which results in different impacts on human health [2]. Therefore, it is of great importance to qualitatively and quantitatively evaluate consumption of different dairy products in order to better correlate the effect of dairy intake to human health. Metabolomics aims at profiling all low-molecular-weight metabolites in a biological system and has been used as a promising tool to discriminate different dietary patterns [3], and also to identify dietary biomarkers [4]. Therefore, metabolomics could potentially be used as tool to assess dietary intake of specific food items in an unbiased way and thereby reduce human error and subjective bias, such as misremembering, under-reporting and misclassification of a specific diet, from traditional dietary assessment methods [5]. However, application of metabolomics for assessment of dairy intake is still in its infancy and solid markers for dairy intake still need to be identified and models that can quantify dairy intake based on analysis of bio fluids, such as urine, are still warranted.
Therefore, the main aim of this review is to emphasize state-of-the-art assessment of dairy intake using metabolomics and encourage its application in this area. The present review consists of (i) a short introduction of dairy processing and nutrients; (ii) a brief description on the association between dairy intake and human health; (iii) a mini review of the application of metabolomics for assessment of dairy consumption; and (iv) concluding remarks and future perspectives.
2. Dairy Products and Composition
Cow’s milk is a liquid formed in the mammary glands of dairy cows during lactation and it is composed of water, protein (approximately 80% casein and 20% whey), fat (approximately 98% triglycerides), lactose, vitamins, and minerals [6]. Milk is often consumed after minimal processing including removal of varying amounts of fat and heat treatment, but milk is also to a large extent processed to other dairy products. Figure 1 displays an overview of the main dairy product categories. The milk fat can be concentrated from raw milk (4.0% fat) by centrifugation to obtain cream (up to 48% fat) and low-fat (1.0%–2.0% fat) or skim milk (< 0.5% fat) [6]. Thus, fat-soluble vitamins (e.g., vitamins A and D) in low-fat or skim milk are reduced or removed with the fat. In order to be compensated for this vitamin reduction, low-fat milk can be fortified with the fat-soluble vitamins, especially vitamin D. Butter is produced by churning cream to achieve a phase inversion from oil-in-water to water-in-oil emulsion [6]. In addition, fermented milk represents a large proportion of dairy products. Cheese, as a popular fermented product, is formed after coagulation of casein micelles using the enzyme chymosin, starter bacteria or heat treatment [7]. Numerous different varieties of cheese exist and their nutrients differ with the cheese type. In general, cheese consists of casein, saturated fat, fat-soluble vitamins, calcium, and bioactive peptides [7]. Yogurt is also a fermented dairy product obtained from a fermentation process by lactic acid bacteria, which produces lactic acid from lactose. The composition of yogurt is comparable to the original milk, while many nutrients in yogurt are more concentrated [8]. Whey protein can be concentrated as a by-product from cheese production and used as an additive in food to enhance specific physical properties or improve its nutritional value. Moreover, water can be removed from milk or other dairy products by evaporation to produce dry dairy products.

Nutrients 2015, 7 4877
Figure 1. Overview of milk and various dairy products obtained from different processing schemes: (1) coagulation; (2) separation; (3) churning; (4) fermentation; (5) evaporation.
3. Dairy Intake and Human Health
Dairy products as nutrient-rich sources have been recommended as an important component in human nutrition and associated with potential health benefits.
3.1. Overweight and Obesity
Overweight and obesity are becoming more and more common health issues and their prevalence is rapidly growing in the world [9]. Many studies have examined the relationship between dairy consumption and body weight regulation. A systematic review based on prospective cohort studies revealed that the weight-lowering effect of dairy intake is suggestive but not consistent [10]. A meta-analysis from Abargouei et al. [11] reported that the effect of dairy intake on body weight depended on the energy intake; without energy restriction no effect of dairy intake was observed, but with energy restriction a beneficial effect of dairy intake on body weight was observed. Similarly, Chen et al. [12] found that dairy intake only attenuated body weight gain in the short-term or in energy-restricted studies, but not in the long-term or in non-energy-restricted studies. Dairy products have traditionally been considered to have an undesirable effect with respect to overweight and obesity due to a high content of saturated fat. Yet, in a recent systematic review the intake of high-fat dairy products was inversely linked with adiposity in 11 of 16 studies and adverse effects of high intake of dairy fat [13] could not be supported. Mechanisms explaining the potential weight-lowering effects of dairy intake have been suggested. The high calcium content in dairy products may facilitate a weight loss: firstly, calcium can suppress lipogenesis and stimulate lipolysis [14]; secondly, calcium can increase fecal fat excretion by combining with fatty acids and thereby forming insoluble soaps in the gut [15]; thirdly, calcium may increase fat oxidation [16]. Recently, milk and primary its medium chain fatty acids showed an up-regulating effect of the ANGPTL4-gene [17,18]. The ANGPTL4-gene increases the production of the ANGPTL4 protein, which has great impact on the uptake of fat from the blood stream to the adipose tissue by inhibition of lipoprotein lipase, but which recently also was shown to inhibit the pancreatic lipase in the gut [19], thus potentially also reducing the uptake of dietary fat. In addition, milk
Yogurt
Skim milk powder
Cheese Butter
Cream
Low-fat/skim milk
Casein
Whey
Milk powderWhey powder
(4)
(5)(5)
(1)
(4)
(5)
(3)
Raw milk (2)
Nutrients 2015, 7 4878 protein, especially whey, may regulate body weight: firstly, whey increases satiety and reduces energy intake [20]; secondly, whey enhances the thermic effect of food, resulting in higher post-meal energy expenditure [21]; thirdly, whey suppresses lipogenic enzyme in the adipose tissue [22]. In addition, fermented dairy products have been shown to result in increased gut bacterial content in humans [23], which must be considered an intriguing finding as there is increasing attention to the role of gut microbiota on the development of obesity [24].
3.2. Diabetes
Diabetes is a growing challenge for human health. Interestingly, an inverse correlation between dairy intake and the incidence of type 2 diabetes (T2D) has been established. In a meta-analysis performed by Pittas et al. [25], a lower T2D risk was found in the highest dairy intake group (3–5 servings/day) compared with the lowest dairy intake group (1.5 servings/day). Elwood et al. [26] also reported that the relative risk of T2D is almost 10% lower after high milk intake. Moreover, several meta-analyses found that low-fat or fermented dairy products protect against T2D [27–30]. Yet, a recent systematic review based on short- and long-term intervention studies did not show a consistent association between dairy intake and insulin sensitivity [31]. The mechanism behind the impact of dairy consumption on T2D can likely be explained partly by the weight-lowering effect of dairy intake (Section 3.1). In addition, several components in dairy products are suggested to protect against T2D. Dairy minerals, such as calcium and magnesium, have a potential for improving insulin sensitivity [32,33]. Intake of vitamin D has been associated with a lower risk of T2D by reducing insulin resistance [34]. Insulinotropic and glucose-lowering properties of whey protein have been reported in healthy subjects and patients with T2D [35]. Free fatty acids have been shown to increase insulin secretion from pancreatic β cells by activating G-protein-coupled receptor, GPR40 [36]. trans-Palmitoleate, primarily from dairy fat, may also reduce insulin resistance and incident diabetes [37].
3.3. Hypertension
Intake of milk and low-fat dairy products has been reported to hold an inverse correlation with hypertension risk [38,39]. A meta-analysis based on randomized controlled trials revealed that probiotic fermented milk protects against hypertension [40]. Several mechanisms behind the association between dairy intake and hypertension have been proposed. Firstly, the weight-lowering effect of dairy consumption is responsible for a lower risk of hypertension according to a meta-analysis performed by Neter et al. [41], where they found that systolic and diastolic blood pressure decreased by 1.1 and 0.9 mm Hg, respectively, with a decrease in body weight of 1 kg. Secondly, calcium intake from dairy products can maintain smooth muscle tone in blood vessels [42,43]. Other dairy minerals including magnesium [44], calcium [45], and potassium [46] may also contribute to a hypotensive effect. Thirdly, casein hydrolysates containing Val-Pro-Pro and Ile-Pro-Pro peptides have been observed to lower blood pressure in intervention studies [47–49], which is attributed to an inhibition of angiotensin converting enzyme (ACE). Several other possible peptide inhibitors of ACE have also been identified from milk, such as casokinins [50], C12 peptide [51], lactotripeptides [52], and lactokinins [53].
Nutrients 2015, 7 4879 Moreover, milk peptides, such as lactokinin, may also regulate the release of endothelin-1, which can raise blood pressure by constricting blood vessels [54,55].
3.4. Cancer
Meta-analyses show an inverse correlation between dairy intake and colorectal cancer [56], a direct correlation between dairy ingestion and prostate cancer [57], while the correlations between dairy consumption and breast cancer [58], pancreatic cancer [59] and ovarian cancer [60] are inconclusive. For bladder cancer, the link varied with different types of dairy products [61,62]. The risk of cancer has been associated with obesity and T2D, which may be attributed to a high IGF-I level, insulin resistance and hyperinsulinemia [63,64]. Therefore, the effect of dairy intake on obesity and T2D may partly have contributed to the link between dairy consumption and cancer risk (Sections 3.1 and 3.2). Yet, milk consumption may increase the IGF-I level, indicating an adverse effect of milk intake on cancer development [65]. An inadequate intake of calcium and vitamin D is associated with an increased risk of cancer [66]. Whey protein exerts anticancer properties by increasing the level of glutathione, which can reduce reactive oxygen species and carcinogens [67]. Bovine lactoferrin also plays a role in cancer prevention by induction of apoptosis and regulation of carcinogen-metabolizing enzymes [68]. Dairy fat like conjugated linoleic acid may also protect against cancer [69]. In addition, Lampe [70] suggested that the associations between fermented dairy products, gut microbiota, and cancer risk needs further exploration. Overall, due to the complexity of cancer, the mechanisms behind the effect of dairy intake on cancer risk remain unresolved.
3.5. Stroke
A recent meta-analysis revealed that low-fat or fermented dairy products were significantly related to low risk of stroke [71]. Moreover, a non-linear dose dependency was established between milk intake and relative stroke risk, in which the highest protective effect was found at approx. 200 mL/day and such an effect remained up to 700 mL/day. The correlation between dairy intake and stroke can most likely be attributed to the weight-lowering effect of dairy consumption [72]. Another possible mechanism might be that dairy consumption can reduce platelet aggregation and insulin resistance [73]. In addition, dairy minerals such as K, Ca, and Mg potentially contribute to reduce stroke risk [73].
3.6. Bone Health
Dairy product intake plays an important role in bone development during childhood and adolescence and prevention of bone loss in the elderly, which is attributed to the high contents of calcium, vitamin D, potassium, and phosphorus in dairy products [74,75].
Nutrients 2015, 7 4880 4. Dairy Intake Assessment
4.1. Significance of Dairy Intake Assessment
Epidemiological evidence for a role of dairy products on human health has been comprehensively reported, yet their correlations differed with different types of dairy products, human diseases, and dietary regime (Section 3). A possible explanation for this discrepancy sometimes observed could be the different compositions of various dairy products. In addition, a poor or incorrect assessment of dairy intake may be another reason for this discrepancy. Thus, one of the greatest challenges for achieving a better understanding of dairy health in humans relies on the ability to obtain trustworthy information on dairy intake. Dietary assessment can be classified into two levels; qualitative and quantitative assessment. The former aims at discriminating between different diet groups, while the latter attempts to evaluate the amount of dietary intake. Food frequency questionnaires (FFQ), food records, and 24-h recalls are traditionally used to quantitatively assess dietary intake. However, these methods have several limitations, such as misremembering, under-reporting, and misclassification of the specific food items [76], which may mask important or make incorrect links between dietary intake and human health. Therefore, finding a reliable assessment method, such as biomarker utilization, is of great importance. Biomarkers, as measurable indicators of biological features, are categorized into exogenous and endogenous markers based on their origin [77]. Exogenous biomarkers can be applied to evaluate potential exposure to a specific diet, while endogenous markers are directly associated with metabolic changes in response to dietary ingestion. Thus, using exogenous biomarkers to evaluate dairy consumption may reduce the limitations of traditional assessment methods, improve the reliability and accuracy of dairy intake data, and thereby better elucidate the impact of dairy intake on human health.
4.2. Assessment of Dairy Fat Intake
By correlating the level of fatty acids in biological samples with the dietary data from traditional methods, several biomarkers for assessment of dairy fat intake have been identified. Wolk et al. [78] found that pentadecanoic (15:0) and heptadecanoic (17:0) acids in adipose tissue might be validated as exogenous biomarkers of long-term milk fat intake. The content of 15:0 in serum was also identified as a marker of dairy fat intake [79–81]. Wolk et al. [80] identified a new marker, myristic acid (14:0), in adipose tissue for dairy fat intake. Biong et al. [82] confirmed that the levels of 14:0, 15:0, and 17:0 in adipose tissue can be regarded as valid biomarkers of dairy fat intake. Moreover, 14:1 and 17:1 could be two new potential markers and serum 15:0 cholesteryl esters is the best alternative if adipose tissue is not obtainable [82]. Moreover, plasma and erythrocyte levels of 15:0 and trans-16:1n-7 might be indicators to assess dairy fat consumption [83].
Furthermore, there have been attempts to associate these biomarkers with human diseases for exploring the health benefits of dairy intake. A higher plasma level of 15:0 was linked to a higher risk of ischemic heart disease in women [83]. Warensjö et al. [84] established an inverse correlation between the level of milk fat biomarkers (15:0 and 17:0) in plasma and risk of developing a first myocardial infarction. Yet, the levels of 15:0 and 17:0 in adipose tissue were not associated with myocardial infarction risk, probably due to the influence of other nutrients [85]. The plasma
Nutrients 2015, 7 4881 trans-16:1n-7 level was inversely correlated with blood pressure and T2D incidence [37]. The content of 15:0 but not 14:0 and trans-16:1n-7 in plasma was observed to have an inverse correlation with cardiovascular disease and coronary heart disease [86]. Moreover, Santaren et al. [87] found that the serum 15:0 level was inversely correlated with T2D risk. Plasma 14:0, 15:0, 17:0, and trans-16:1n-7 levels were not significantly associated with stroke risk [88].
However, recently Ratnayake [89] raised concern in relation to the use of these fatty acids as biomarkers of dairy fat intake. This concern is related to the fact that the fatty acids 15:0, 17:0, and trans-16:1n-7 may also be derived from other food sources than dairy fat, and trans-16:1n-7 may also be endogenously synthesized from β-oxidation of dietary vaccenic acid. In addition, analytical challenges exist as these fatty acids need to be identified carefully due to small amounts in samples and co-elution with other fatty acids during GC analysis. Lankinen & Schwab [90] also suggested that 15:0 and 17:0 might be used as valid biomarkers of dairy fat intake if subjects consume a high amount of dairy fat and a low amount of fish. Overall, care must be taken to use these fatty acids in dietary assessment studies of dairy intake, and dietary origin and the analytical method should be taken into account.
Dairy fat in different matrices may possess different health effects. For instance, cheese fat lowers LDL-cholesterol level more than butter fat [91,92]. Therefore, the discrimination between consumption of different types of dairy products is also of great interest and important for elucidating the impact of dairy fat on human health.
4.3. Principle in Assessment of Dairy Intake by Metabolomics
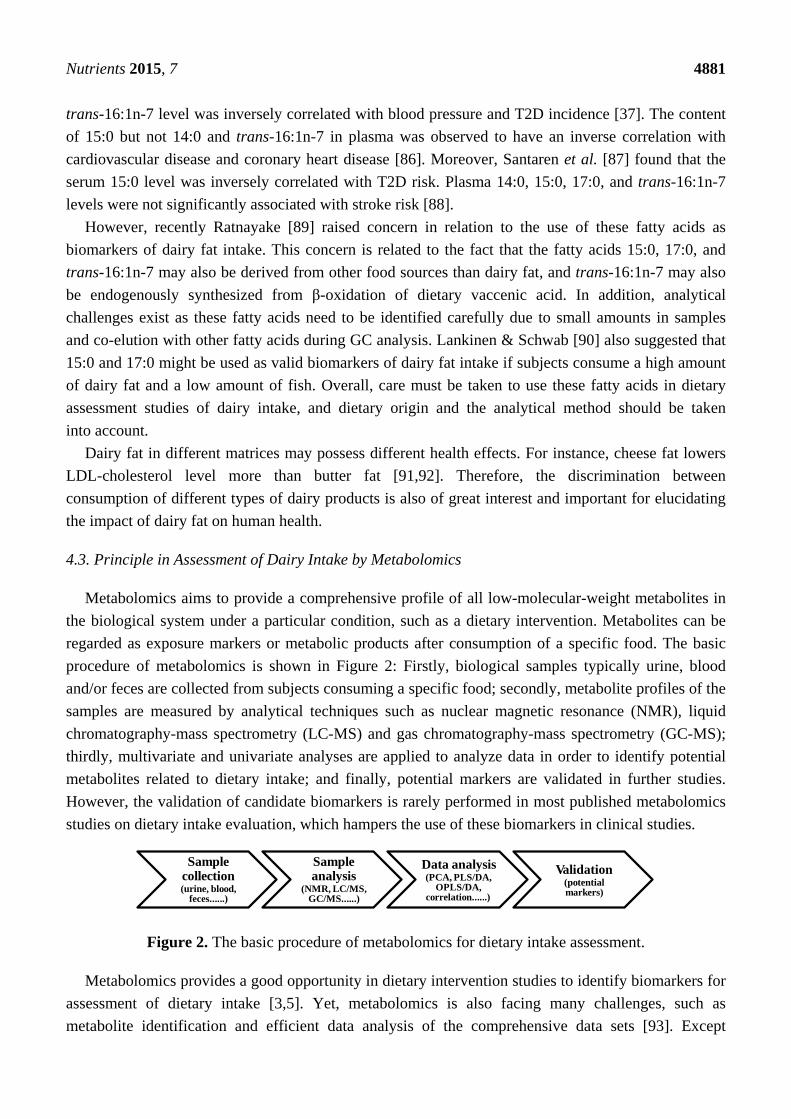
Metabolomics aims to provide a comprehensive profile of all low-molecular-weight metabolites in the biological system under a particular condition, such as a dietary intervention. Metabolites can be regarded as exposure markers or metabolic products after consumption of a specific food. The basic procedure of metabolomics is shown in Figure 2: Firstly, biological samples typically urine, blood and/or feces are collected from subjects consuming a specific food; secondly, metabolite profiles of the samples are measured by analytical techniques such as nuclear magnetic resonance (NMR), liquid chromatography-mass spectrometry (LC-MS) and gas chromatography-mass spectrometry (GC-MS); thirdly, multivariate and univariate analyses are applied to analyze data in order to identify potential metabolites related to dietary intake; and finally, potential markers are validated in further studies. However, the validation of candidate biomarkers is rarely performed in most published metabolomics studies on dietary intake evaluation, which hampers the use of these biomarkers in clinical studies.
Figure 2. The basic procedure of metabolomics for dietary intake assessment.
Metabolomics provides a good opportunity in dietary intervention studies to identify biomarkers for assessment of dietary intake [3,5]. Yet, metabolomics is also facing many challenges, such as metabolite identification and efficient data analysis of the comprehensive data sets [93]. Except
Samplecollection(urine, blood,
feces......)
Sampleanalysis
(NMR, LC/MS,GC/MS......)
Data analysis(PCA, PLS/DA,
OPLS/DA,correlation......)
Validation(potential markers)
Nutrients 2015, 7 4882 technical challenges, intrinsic (e.g., genotype, gender, age, health status) and extrinsic (e.g., diet, drug, physical activity) factors that influence the metabolome also challenge the development of metabolomics in dietary nutrition studies [94].
4.4. Metabolomics Applied to Identify Biomarkers Related to Dairy Intake
Metabolomics in combination with data analysis can potentially identify biomarkers, fingerprints, and associated models that can assess dairy intake quantitatively. However, only a few studies have applied metabolomics with main focus on the identification of biomarkers related to the intake of dairy products. In order to review current metabolomics studies on dairy products intake, we did a systematic literature search using the databases, PubMed [95], EMBASE [96] and SCOPUS [97], from 1995 to May 2015 by using the following search terms: (“dairy” OR “milk” OR “cheese” OR “butter” OR “casein” OR “whey”) AND (“metabolomic” OR “metabonomic” OR “metabolic profiling” OR “metabolite” OR “metabolomic” OR “mass spectrometry” OR “nuclear magnetic resonance” OR “LC MS” OR “GC MS” OR “NMR”) AND (“random” OR “andomly” OR “randomized” OR “control” OR “controlled” OR “cross over” OR “intervention” OR “trial”) AND (“urine” OR “urinary” OR “blood” OR “plasma” OR “serum” OR “feces” OR “faeces” OR “fecal”). The selected literature was published in English and conducted in human subjects.
Metabolomics was applied to identify dietary biomarkers in an epidemiologic study by Guertin et al. [98]. In this study, serum metabolites were measured using MS-based metabolomics and intake of 36 different dietary groups was recorded through the FFQ method. Using a correlation analysis between the MS-based metabolome and the FFQ data, Guertin et al. [98] found that serum 15:0, 16:0, and 10-undecenoate levels were directly correlated with butter consumption. However, the disadvantage of the FFQ such as under- or over-reporting of food consumption should be taken into account in this study.
4.5. Metabolomics Applied to Elucidate Metabolic Impact of Dairy Intake
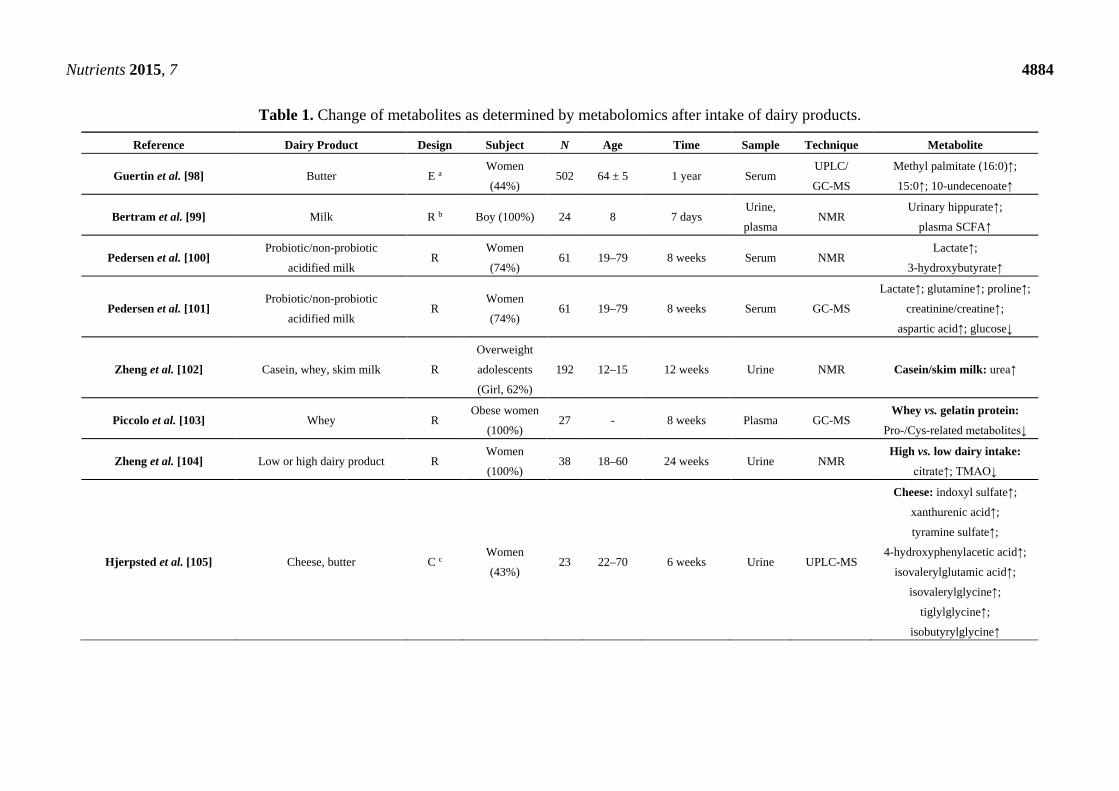
Metabolomics has been applied for the assessment of both whole product and dairy protein intake under different experimental designs. Table 1 shows changes in metabolites detected as a function of dairy intake by metabolomics. These metabolites may be potential markers for quantitative assessment of dairy consumption. Metabolomics has also been applied to examine the change of metabolites after dairy intake in controlled intervention trials. Bertram et al. [99] investigated the metabolic response of milk and meat intake in 8-year-old boys for seven days using NMR-based metabolomics and found that milk consumption reduced urinary hippurate excretion and increased serum SCFA level. Both GC-MS and NMR-based serum metabolomics failed to discriminate between intake of probiotic and non-probiotic acidified milk in the subjects aged from 18–79 years, while an increase in lactate, glutamine, proline, creatinine/creatine, aspartic acid, and 3-hydroxybutyrate, as well as a reduced glucose level were observed after the 8-week intervention of both acidified milk drinks [100,101]. Moreover, NMR-based urine metabolomics was applied to elucidate the different responses to casein and whey consumption in 12–15 year old overweight adolescents during a 12-week intervention period and a significant increase in urinary urea excretion was found after casein intake but not after whey intake [102]. Piccolo et al. [103] revealed that whey protein supplementation in obese women resulted
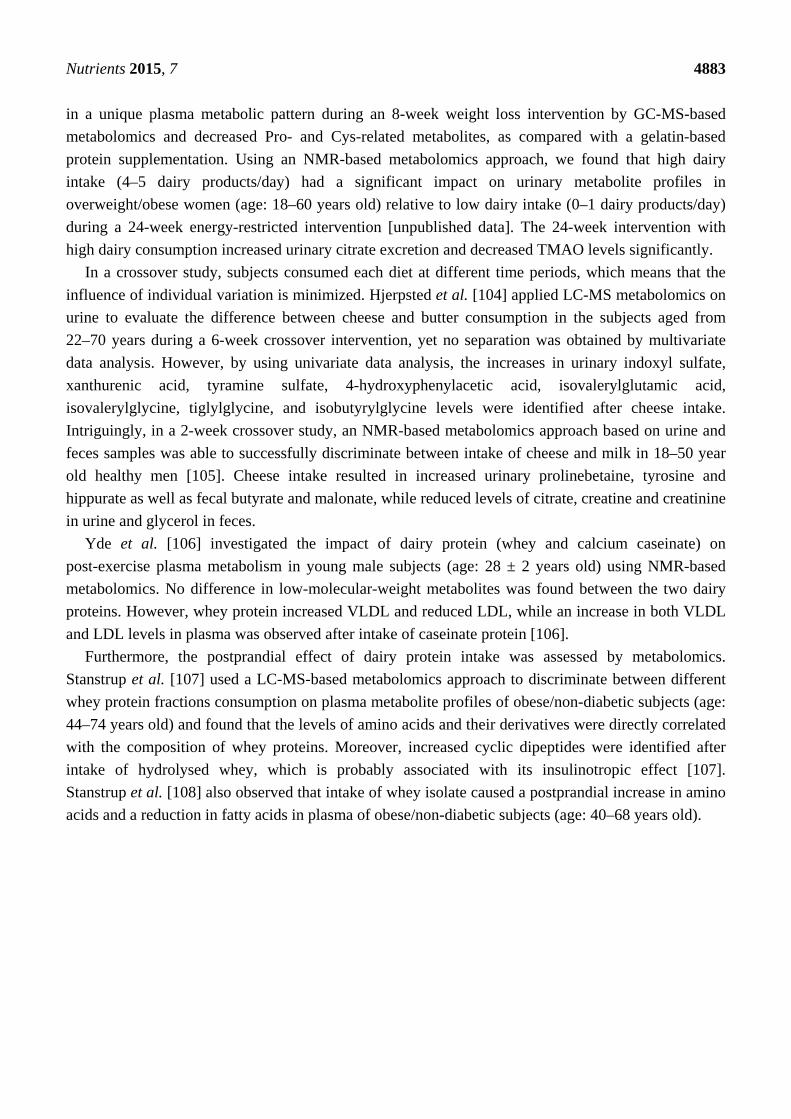
Nutrients 2015, 7 4883 in a unique plasma metabolic pattern during an 8-week weight loss intervention by GC-MS-based metabolomics and decreased Pro- and Cys-related metabolites, as compared with a gelatin-based protein supplementation. Using an NMR-based metabolomics approach, we found that high dairy intake (4–5 dairy products/day) had a significant impact on urinary metabolite profiles in overweight/obese women (age: 18–60 years old) relative to low dairy intake (0–1 dairy products/day) during a 24-week energy-restricted intervention [unpublished data]. The 24-week intervention with high dairy consumption increased urinary citrate excretion and decreased TMAO levels significantly.
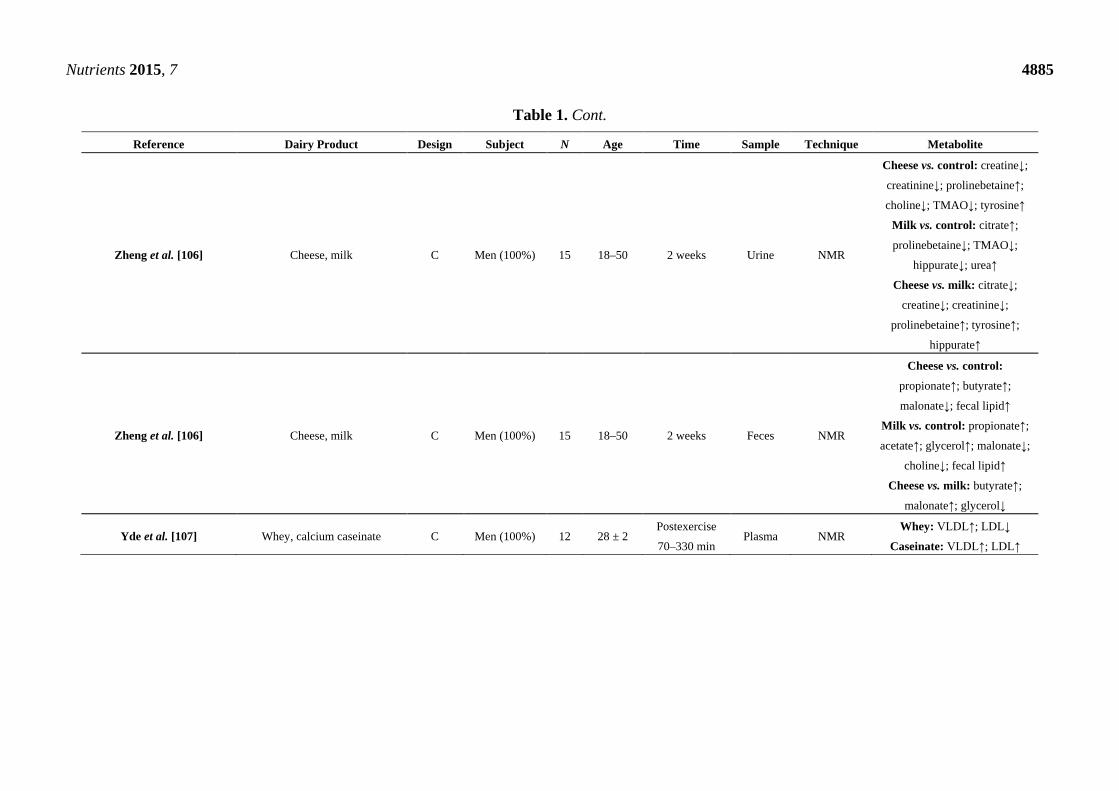
In a crossover study, subjects consumed each diet at different time periods, which means that the influence of individual variation is minimized. Hjerpsted et al. [104] applied LC-MS metabolomics on urine to evaluate the difference between cheese and butter consumption in the subjects aged from 22–70 years during a 6-week crossover intervention, yet no separation was obtained by multivariate data analysis. However, by using univariate data analysis, the increases in urinary indoxyl sulfate, xanthurenic acid, tyramine sulfate, 4-hydroxyphenylacetic acid, isovalerylglutamic acid, isovalerylglycine, tiglylglycine, and isobutyrylglycine levels were identified after cheese intake. Intriguingly, in a 2-week crossover study, an NMR-based metabolomics approach based on urine and feces samples was able to successfully discriminate between intake of cheese and milk in 18–50 year old healthy men [105]. Cheese intake resulted in increased urinary prolinebetaine, tyrosine and hippurate as well as fecal butyrate and malonate, while reduced levels of citrate, creatine and creatinine in urine and glycerol in feces.
Yde et al. [106] investigated the impact of dairy protein (whey and calcium caseinate) on post-exercise plasma metabolism in young male subjects (age: 28 ± 2 years old) using NMR-based metabolomics. No difference in low-molecular-weight metabolites was found between the two dairy proteins. However, whey protein increased VLDL and reduced LDL, while an increase in both VLDL and LDL levels in plasma was observed after intake of caseinate protein [106].
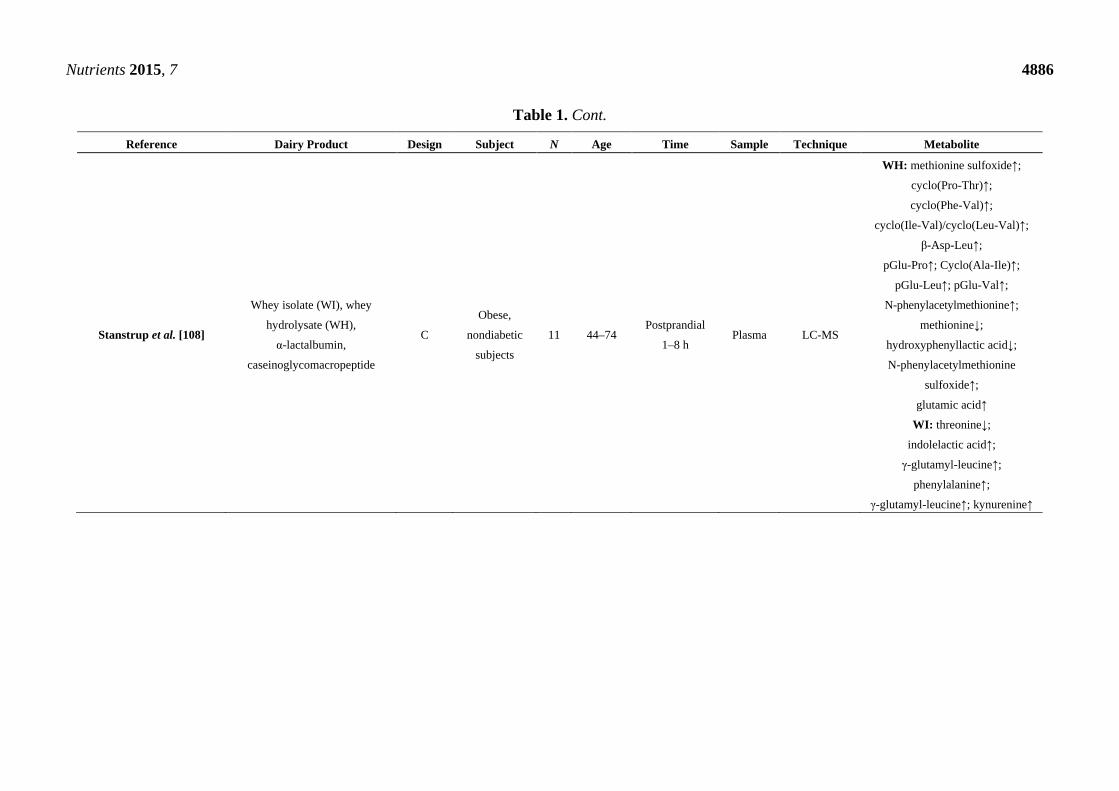
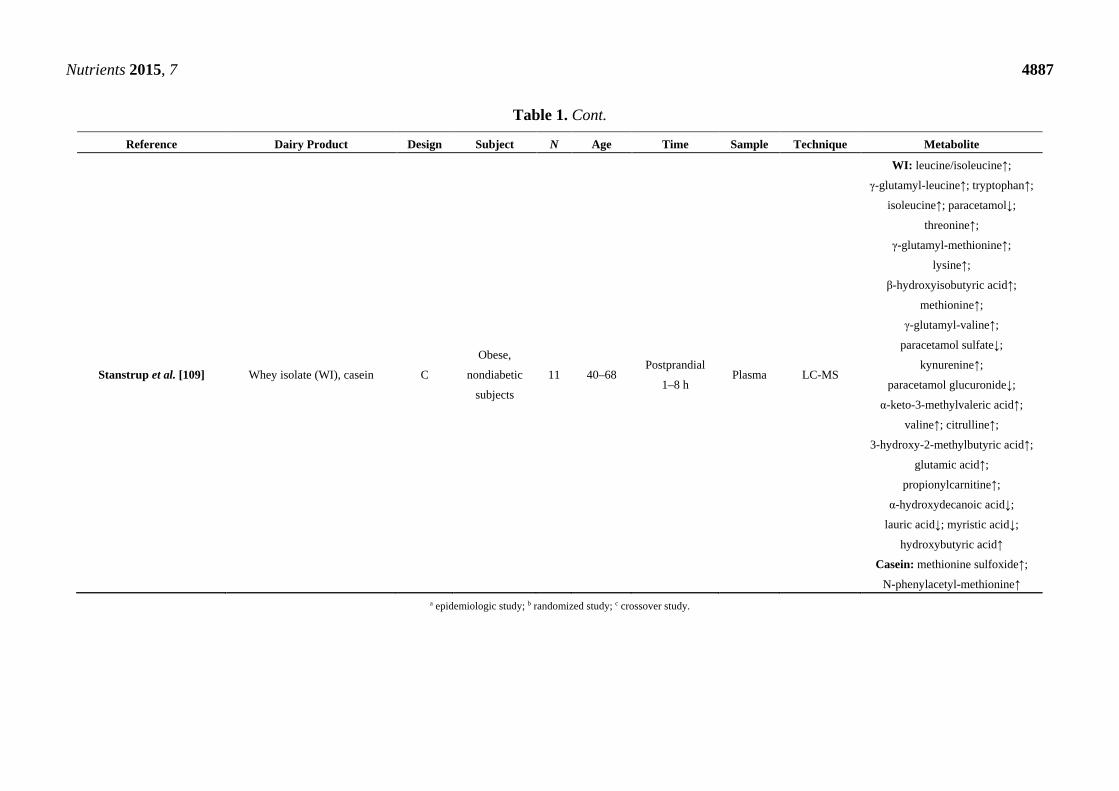
Furthermore, the postprandial effect of dairy protein intake was assessed by metabolomics. Stanstrup et al. [107] used a LC-MS-based metabolomics approach to discriminate between different whey protein fractions consumption on plasma metabolite profiles of obese/non-diabetic subjects (age: 44–74 years old) and found that the levels of amino acids and their derivatives were directly correlated with the composition of whey proteins. Moreover, increased cyclic dipeptides were identified after intake of hydrolysed whey, which is probably associated with its insulinotropic effect [107]. Stanstrup et al. [108] also observed that intake of whey isolate caused a postprandial increase in amino acids and a reduction in fatty acids in plasma of obese/non-diabetic subjects (age: 40–68 years old).
Nutrients 2015, 7 4884
Table 1. Change of metabolites as determined by metabolomics after intake of dairy products.
Reference Dairy Product Design Subject N Age Time Sample Technique Metabolite
Guertin et al. [98] Butter E a Women
(44%) 502 64 ± 5 1 year Serum
UPLC/
GC-MS
Methyl palmitate (16:0)↑;
15:0↑; 10-undecenoate↑
Bertram et al. [99] Milk R b Boy (100%) 24 8 7 days Urine,
plasma NMR
Urinary hippurate↑;
plasma SCFA↑
Pedersen et al. [100] Probiotic/non-probiotic
acidified milk R
Women
(74%) 61 19–79 8 weeks Serum NMR
Lactate↑;
3-hydroxybutyrate↑
Pedersen et al. [101] Probiotic/non-probiotic
acidified milk R
Women
(74%) 61 19–79 8 weeks Serum GC-MS
Lactate↑; glutamine↑; proline↑;
creatinine/creatine↑;
aspartic acid↑; glucose↓
Zheng et al. [102] Casein, whey, skim milk R
Overweight
adolescents
(Girl, 62%)
192 12–15 12 weeks Urine NMR Casein/skim milk: urea↑
Piccolo et al. [103] Whey R Obese women
(100%) 27 - 8 weeks Plasma GC-MS
Whey vs. gelatin protein:
Pro-/Cys-related metabolites↓
Zheng et al. [104] Low or high dairy product R Women
(100%) 38 18–60 24 weeks Urine NMR
High vs. low dairy intake:
citrate↑; TMAO↓
Hjerpsted et al. [105] Cheese, butter C c Women
(43%) 23 22–70 6 weeks Urine UPLC-MS
Cheese: indoxyl sulfate↑;
xanthurenic acid↑;
tyramine sulfate↑;
4-hydroxyphenylacetic acid↑;
isovalerylglutamic acid↑;
isovalerylglycine↑;
tiglylglycine↑;
isobutyrylglycine↑
Nutrients 2015, 7 4885
Table 1. Cont.
Reference Dairy Product Design Subject N Age Time Sample Technique Metabolite
Zheng et al. [106] Cheese, milk C Men (100%) 15 18–50 2 weeks Urine NMR
Cheese vs. control: creatine↓;
creatinine↓; prolinebetaine↑;
choline↓; TMAO↓; tyrosine↑
Milk vs. control: citrate↑;
prolinebetaine↓; TMAO↓;
hippurate↓; urea↑
Cheese vs. milk: citrate↓;
creatine↓; creatinine↓;
prolinebetaine↑; tyrosine↑;
hippurate↑
Zheng et al. [106] Cheese, milk C Men (100%) 15 18–50 2 weeks Feces NMR
Cheese vs. control:
propionate↑; butyrate↑;
malonate↓; fecal lipid↑
Milk vs. control: propionate↑;
acetate↑; glycerol↑; malonate↓;
choline↓; fecal lipid↑
Cheese vs. milk: butyrate↑;
malonate↑; glycerol↓
Yde et al. [107] Whey, calcium caseinate C Men (100%) 12 28 ± 2 Postexercise
70–330 min Plasma NMR
Whey: VLDL↑; LDL↓
Caseinate: VLDL↑; LDL↑
Nutrients 2015, 7 4886
Table 1. Cont.
Reference Dairy Product Design Subject N Age Time Sample Technique Metabolite
Stanstrup et al. [108]
Whey isolate (WI), whey
hydrolysate (WH),
α-lactalbumin,
caseinoglycomacropeptide
C
Obese,
nondiabetic
subjects
11 44–74 Postprandial
1–8 h Plasma LC-MS
WH: methionine sulfoxide↑;
cyclo(Pro-Thr)↑;
cyclo(Phe-Val)↑;
cyclo(Ile-Val)/cyclo(Leu-Val)↑;
β-Asp-Leu↑;
pGlu-Pro↑; Cyclo(Ala-Ile)↑;
pGlu-Leu↑; pGlu-Val↑;
N-phenylacetylmethionine↑;
methionine↓;
hydroxyphenyllactic acid↓;
N-phenylacetylmethionine
sulfoxide↑;
glutamic acid↑
WI: threonine↓;
indolelactic acid↑;
γ-glutamyl-leucine↑;
phenylalanine↑;
γ-glutamyl-leucine↑; kynurenine↑
Nutrients 2015, 7 4887
Table 1. Cont.
Reference Dairy Product Design Subject N Age Time Sample Technique Metabolite
Stanstrup et al. [109] Whey isolate (WI), casein C
Obese,
nondiabetic
subjects
11 40–68 Postprandial
1–8 h Plasma LC-MS
WI: leucine/isoleucine↑;
γ-glutamyl-leucine↑; tryptophan↑;
isoleucine↑; paracetamol↓;
threonine↑;
γ-glutamyl-methionine↑;
lysine↑;
β-hydroxyisobutyric acid↑;
methionine↑;
γ-glutamyl-valine↑;
paracetamol sulfate↓;
kynurenine↑;
paracetamol glucuronide↓;
α-keto-3-methylvaleric acid↑;
valine↑; citrulline↑;
3-hydroxy-2-methylbutyric acid↑;
glutamic acid↑;
propionylcarnitine↑;
α-hydroxydecanoic acid↓;
lauric acid↓; myristic acid↓;
hydroxybutyric acid↑
Casein: methionine sulfoxide↑;
N-phenylacetyl-methionine↑ a epidemiologic study; b randomized study; c crossover study.
Nutrients 2015, 7 4888
Overall, metabolomics has been applied for qualitative assessment of dairy intake under different experimental conditions, where many factors including individual difference, intervention dose and duration as well as daily diet and physical activity may affect the human metabolome. Thus, care should be taken when comparing the results from different studies. In addition, the potential of these metabolites as biomarkers needs to be further established in other intervention or cohort studies before they can be used as valid markers for quantitatively evaluating dairy consumption and for exploring the association between dairy intake and human health.
5. Conclusions
A reliable dairy intake assessment method is essential to better explore the impact of dairy products on human health. Metabolomics as a qualitative assessment tool has shown a potential to discriminate between consumption of different dairy products. Furthermore, metabolomics identified several potential metabolites related to dairy intake, but further validations are required to establish valid biomarkers for quantitative assessment of dairy consumption. Currently the most prominent biomarkers candidates include the 14:1 and 17:1 fatty acids and serum 15:0 cholesteryl esters [83].
Metabolomics could be used as an assessment tool of dairy intake, yet further studies are needed to confirm its usefulness and to expand its application in this research area. In addition, a number of suggestions need to be addressed. Metabolomics studies related to dairy consumption have primarily focused on discriminating between intake of different dairy products, but the quantitative association between metabolite profiles and dairy intake have still not been examined. Since different dairy products have different compositions and therefore may exert different metabolic effects, it would be attractive to investigate different types of dairy products separately when evaluating their consumption. Measuring the composition of dairy products may facilitate identification and analysis of exogenous biomarkers in metabolomics datasets obtained from biological samples. It is suggested to further identify and validate exogenous biomarkers, especially more specific biomarkers, as indicators of dairy intake instead of the FFQ method in the dairy nutrition research. Combined biomarkers could be more reliable and valid for dairy intake assessment than a single marker. Finally, biomarkers need to be validated in clinical trials.
Acknowledgments
The authors would like to thank the Danish Council for Strategic Research, Arla Foods, and the Danish Dairy Research Foundation for financial support through the project “FIAF-Milk in regulating lipid metabolism and overweight; Uncovering milk’s ability to increase expression and activity of fasting-induced adipose factor”.
Author Contributions
Hong Zheng and Hanne C. Bertram designed and wrote the manuscript. All authors read, revised, and approved the final manuscript.
Nutrients 2015, 7 4889 Conflicts of Interest
The authors declare no conflict of interest.
References
1. Miller, G.D.; Jarvis, J.K.; McBean, L.D. Handbook of Dairy Foods and Nutrition, 3rd ed.; CRC Press: Boca Raton, FL, USA, 2007.
2. Visioli, F.; Strata, A. Milk, dairy products, and their functional effects in humans: A narrative review of recent evidence. Adv. Nutr. 2014, 5, 131–143.
3. O’Sullivan, A.; Gibney, M.J.; Brennan, L. Dietary intake patterns are reflected in metabolomic profiles: Potential role in dietary assessment studies. Am. J. Clin. Nutr. 2011, 93, 314–321.
4. O’Gorman, A.; Gibbons, H.; Brennan, L. Metabolomics in the identification of biomarkers of dietary intake. Comput. Struct. Biotechnol. J. 2013, 4, 1–7.
5. Favé, G.; Beckmann, M.E.; Draper, J.H.; Mathers, J.C. Measurement of dietary exposure: A challenging problem which may be overcome thanks to metabolomics? Genes Nutr. 2009, 4, 135–141.
6. Walstra, P.; Wouters, J.T.M.; Geurts, T.J. Dairy Science and Technology, 2nd ed.; CRC Press: Boca Raton, FL, USA, 2006.
7. Henning, D.R.; Baer, R.J.; Hassan, A.N.; Dave, R. Major advances in concentrated and dry milk products, cheese, and milk fat-based spreads 1. J. Dairy Sci. 2006, 89, 1179–1188.
8. Adolfsson, O.; Meydani, S.N.; Russell, R.M. Yogurt and gut function. Am. J. Clin. Nutr. 2004, 80, 245–256.
9. Stevens, G.A.; Singh, G.M.; Lu, Y.; Danaei, G.; Lin, J.K.; Finucane, M.M.; Bahalim, A.N.; McIntire, R.K.; Gutierrez, H.R.; Cowan, M.; et al. National, regional, and global trends in adult overweight and obesity prevalences. Popul. Health Metr. 2012, 10, 22.
10. Louie, J.C.Y.; Flood, V.M.; Hector, D.J.; Rangan, A.M.; Gill, T.P. Dairy consumption and overweight and obesity: A systematic review of prospective cohort studies. Obes. Rev. 2011, 12, e582–e592.
11. Abargouei, A.S.; Janghorbani, M.; Salehi-Marzijarani, M.; Esmaillzadeh, A. Effect of dairy consumption on weight and body composition in adults: A systematic review and meta-analysis of randomized controlled clinical trials. Int. J. Obes. 2012, 36, 1485–1493.
12. Chen, M.; Pan, A.; Malik, V.S.; Hu, F.B. Effects of dairy intake on body weight and fat: A meta-analysis of randomized controlled trials. Am. J. Clin. Nutr. 2012, 96, 735–747.
13. Kratz, M.; Baars, T.; Guyenet, S. The relationship between high-fat dairy consumption and obesity, cardiovascular, and metabolic disease. Eur. J. Nutr. 2013, 52, 1–24.
14. Zemel, M.B. The role of dairy foods in weight management. J. Am. Coll. Nutr. 2005, 24, 537S–546S.
15. Christensen, R.; Lorenzen, J.K.; Svith, C.R.; Bartels, E.M.; Melanson, E.L.; Saris, W.H.; Tremblay, A.; Astrup, A. Effect of calcium from dairy and dietary supplements on faecal fat excretion: A meta-analysis of randomized controlled trials. Obes. Rev. 2009, 10, 475–486.
Nutrients 2015, 7 4890 16. Melanson, E.L.; Sharp, T.A.; Schneider, J.; Donahoo, W.T.; Grunwald, G.K.; Hill, J.O. Relation
between calcium intake and fat oxidation in adult humans. Int. J. Obes. Relat. Metab. Disord. 2003, 27, 196–203.
17. Nielsen, S.D.; Young, J.F.; Mortensen, G.; Petersen, R.K.; Kristiansen, K.; Dalsgaard, T.K. Activation of the angiopoietin-like 4 (ANGPLT4) gene by milk fat and casein. Int. Dairy J. 2014, 36, 136–142.
18. Nielsen, S.D.; Amer, B.; Young, J.F.; Mortensen, G.; Petersen, R.K.; Kristiansen, K.; Dalsgaard, T.K. Medium chain fatty acids from milk induce angiopoietin-like 4 (ANGPTL4) gene expression. Int. Dairy J. 2015, 42, 34–41.
19. Mattijssen, F.; Alex, S.; Swarts, H.J.; Groen, A.K.; van Schothorst, E.M.; Kersten, S. Angptl4 serves as an endogenous inhibitor of intestinal lipid digestion. Mol. Metable 2014, 3, 135–144.
20. Luhovyy, B.L.; Akhavan, T.; Anderson, G.H. Whey proteins in the regulation of food intake and satiety. J. Am. Coll. Nutr. 2007, 26, 704S–712S.
21. Brehm, B.J.; Spang, S.E.; Lattin, B.L.; Seeley, R.J.; Daniels, S.R.; D’Alessio, D.A. The role of energy expenditure in the differential weight joss in obese women on low-fat and low-carbohydrate diets. J. Clin. Endocrinol. Metable 2005, 90, 1475–1482.
22. Morifuji, M.; Sakai, K.; Sanbongi, C.; Sugiura, K. Dietary whey protein down regulates fatty acid synthesis in the liver, but up regulates it in skeletal muscle of exercise-trained rats. Nutrition 2005, 21, 1052–1058.
23. St-Onge, M.P.; Farnworth, E.R.; Jones, P.J. Consumption of fermented and nonfermented dairy products: Effects on cholesterol concentrations and metabolism. Am. J. Clin. Nutr. 2000, 71, 674–681.
24. DiBaise, J.K.; Zhang, H.; Crowell, M.D.; Krajmalnik-Brown, R.; Decker, G.A.; Rittmann, B.E. Gut microbiota and its possible relationship with obesity. Mayo Clin. Proc. 2008, 83, 460–469.
25. Pittas, A.G.; Lau, J.; Hu, F.B.; Dawson-Hughes, B. The role of vitamin D and calcium in type 2 diabetes. A systematic review and meta-analysis. J. Clin. Endocrinol. Metable 2007, 92, 2017–2029.
26. Elwood, P.C.; Givens, D.I.; Beswick, A.D.; Fehily, A.M.; Pickering, J.E.; Gallacher, J. The survival advantage of milk and dairy consumption: An overview of evidence from cohort studies of vascular diseases, diabetes and cancer. J. Am. Coll. Nutr. 2008, 27, 723S–734S.
27. Tong, X.; Dong, J.Y.; Wu, Z.W.; Li, W.; Qin, L.Q. Dairy consumption and risk of type 2 diabetes mellitus: A meta-analysis of cohort studies. Eur. J. Clin. Nutr. 2011, 65, 1027–1031.
28. Aune, D.; Norat, T.; Romundstad, P.; Vatten, L.J. Dairy products and the risk of type 2 diabetes: A systematic review and dose-response meta-analysis of cohort studies. Am. J. Clin. Nutr. 2013, doi: 10.3945/ajcn.113.059030.
29. Gao, D.; Ning, N.; Wang, C.; Wang, Y.; Li, Q.; Meng, Z.; Liu, Y.; Li, Q. Dairy products consumption and risk of type 2 diabetes: Systematic review and dose-response meta-analysis. PLoS ONE 2013, 8, e73965.
30. Chen, M.; Sun, Q.; Giovannucci, E.; Mozaffarian, D.; Manson, J.E.; Willett, W.C.; Hu, F.B. Dairy consumption and risk of type 2 diabetes: 3 cohorts of US adults and an updated meta-analysis. BMC Med. 2014, 12, 215.
Nutrients 2015, 7 4891 31. Turner, K.M.; Keogh, J.B.; Clifton, P.M. Dairy consumption and insulin sensitivity: A systematic
review of short-and long-term intervention studies. Nutr. Metab. Cardiovasc. Dis. 2015, 25, 3–8. 32. Ma, B.; Lawson, A.B.; Liese, A.D.; Bell, R.A.; Mayer-Davis, E.J. Dairy, magnesium, and
calcium intake in relation to insulin sensitivity: approaches to modeling a dose-dependent association. Am. J. Epidemiol. 2006, 164, 449–458.
33. Larsson, S.C.; Wolk, A. Magnesium intake and risk of type 2 diabetes: A meta-analysis. J. Intern. Med. 2007, 262, 208–214.
34. George, P.S.; Pearson, E.R.; Witham, M.D. Effect of vitamin D supplementation on glycaemic control and insulin resistance: A systematic review and meta-analysis. Diabetic Med. 2012, 29, e142–e150.
35. Jakubowicz, D.; Froy, O. Biochemical and metabolic mechanisms by which dietary whey protein may combat obesity and Type 2 diabetes. J. Nutr. Biochem. 2013, 24, 1–5.
36. Itoh, Y.; Kawamata, Y.; Harada, M.; Kobayashi, M.; Fujii, R.; Fukusumi, S.; Ogi, K.; Hosoya, M.; Tanaka, Y.; Uejima, H.; et al. Free fatty acids regulate insulin secretion from pancreatic β cells through GPR40. Nature 2003, 422, 173–176.
37. Mozaffarian, D.; de Oliveira Otto, M.C.; Lemaitre, R.N.; Fretts, A.M.; Hotamisligil, G.; Tsai, M.Y.; Siscovick, D.S.; Nettleton, J.A. trans-Palmitoleic acid, other dairy fat biomarkers, and incident diabetes: The Multi-Ethnic Study of Atherosclerosis (MESA). Am. J. Clin. Nutr. 2013, 97, 854–861.
38. Ralston, R.A.; Lee, J.H.; Truby, H.; Palermo, C.E.; Walker, K.Z. A systematic review and meta-analysis of elevated blood pressure and consumption of dairy foods. J. Hum. Hypertens. 2012, 26, 3–13.
39. Soedamah-Muthu, S.S.; Verberne, L.D.; Ding, E.L.; Engberink, M.F.; Geleijnse, J.M. Dairy consumption and incidence of hypertension a dose-response meta-analysis of prospective cohort studies. Hypertension 2012, 60, 1131–1137.
40. Dong, J.Y.; Szeto, I.M.Y.; Makinen, K.; Gao, Q.; Wang, J.; Qin, L.Q.; Zhao, Y. Effect of probiotic fermented milk on blood pressure: A meta-analysis of randomised controlled trials. Br. J. Nutr. 2013, 110, 1188–1194.
41. Neter, J.E.; Stam, B.E.; Kok, F.J.; Grobbee, D.E.; Geleijnse, J.M. Influence of weight reduction on blood pressure a meta-analysis of randomized controlled trials. Hypertension 2003, 42, 878–884.
42. Allender, P.S.; Cutler, J.A.; Follmann, D.; Cappuccio, F.P.; Pryer, J.; Elliott, P. Dietary calcium and blood pressure: A meta-analysis of randomized clinical trials. Ann. Intern. Med. 1996, 124, 825–831.
43. Bucher, H.C.; Cook, R.J.; Guyatt, G.H.; Lang J.D.; Cook, D.J.; Hatala, R.; Hunt, D.L. Effects of dietary calcium supplementation on blood pressure: A meta-analysis of randomized controlled trials. JAMA 1996, 275, 1016–1022.
44. Mizushima, S.; Cappuccio, F.P.; Nichols, R.; Elliott, P. Dietary magnesium intake and blood pressure: A qualitative overview of the observational studies. J. Hum. Hypertens. 1998, 12, 447–453.

Nutrients 2015, 7 4892 45. Griffith, L.E.; Guyatt, G.H.; Cook, R.J.; Bucher, H.C.; Cook, D.J. The influence of dietary and
nondietary calcium supplementation on blood pressure: An updated metaanalysis of randomized controlled trials. Am. J. Hypertens. 1999, 12, 84–92.
46. Geleijnse, J.M.; Kok, F.J.; Grobbee, D.E. Blood pressure response to changes in sodium and potassium intake: A metaregression analysis of randomised trials. J. Hum. Hypertens. 2003, 17, 471–480.
47. Nakamura, T.; Mizutani, J.; Sasaki, K.; Yamamoto, N.; Takazawa, K. Beneficial potential of casein hydrolysate containing Val-Pro-Pro and Ile-Pro-Pro on central blood pressure and hemodynamic index: A preliminary study. J. Med. Food 2009, 12, 1221–1226.
48. Nakamura, T.; Mizutani, J.; Ohki, K.; Yamada, K.; Yamamoto, N.; Takeshi, M.; Takazawa, K. Casein hydrolysate containing Val-Pro-Pro and Ile-Pro-Pro improves central blood pressure and arterial stiffness in hypertensive subjects: A randomized, double-blind, placebo-controlled trial. Atherosclerosis 2011, 219, 298–303.
49. Ishida, Y.; Shibata, Y.; Fukuhara, I.; Yano, Y.; Takehara, I.; Kaneko, K. Effect of an excess intake of casein hydrolysate containing Val-Pro-Pro and Ile-Pro-Pro in subjects with normal blood pressure, high-normal blood pressure, or mild hypertension. Biosci. Biotechnol. Biochem. 2011, 75, 427–433.
50. Meisel, H.; Schlimme, E. Inhibitors of angiotensinconverting-enzyme derived from bovine casein (casokinins). In β-Casomorphins and Related Peptides: Recent Developments; Wiley-Blackwell: Weinheim, Germany, 1994.
51. Cadée, J.A.; Chang, C.Y.; Chen, C.W.; Huang, C.N.; Chen, S.L.; Wang, C.K. Bovine casein hydrolysate (C12 peptide) reduces blood pressure in prehypertensive subjects. Am. J. Hypertens. 2007, 20, 1–5.
52. Cicero, A.F.G.; Gerocarni, B.; Laghi, L.; Borghi, C. Blood pressure lowering effect of lactotripeptides assumed as functional foods: A meta-analysis of current available clinical trials. J. Hum. Hypertens. 2011, 25, 425–436.
53. FitzGerald, R.J.; Meisel, H. Lactokinins: Whey protein-derived ACE inhibitory peptides. Food/Nahrung 1999, 43, 165–167.
54. Maes, W.; van Camp, J.; Vermeirssen, V.; Hemeryck, M.; Ketelslegers, J.M.; Schrezenmeir, J.; Oostveldt, P.V.; Huyghebaert, A. Influence of the lactokinin Ala-Leu-Pro-Met-His-Ile-Arg (ALPMHIR) on the release of endothelin-1 by endothelial cells. Reg. Peptides 2004, 118, 105.
55. Alonso, A.; Nettleton, J.A.; Ix, J.H.; de Boer, I.H.; Folsom, A.R.; Bidulescu, A.; Kestenbaum, B.R.; Chambless, L.E.; Jacobs, D.R., Jr. Dietary phosphorus, blood pressure, and incidence of hypertension in the atherosclerosis risk in communities study and the multi-ethnic study of atherosclerosis. Hypertension 2010, 55, 776–784.
56. Aune, D.; Lau, R.; Chan, D.S.M.; Vieira, R.; Greenwood, D.C.; Kampman, E.; Norat, T. Dairy products and colorectal cancer risk: A systematic review and meta-analysis of cohort studies. Ann. Oncol. 2012, 23, 37–45.
57. Aune, D.; Navarro Rosenblatt, D.A.; Chan, D.S.; Vieira, A.R.; Vieira, R.; Greenwood, D.C.; Vatten, L.J.; Norat, T. Dairy products, calcium, and prostate cancer risk: A systematic review and meta-analysis of cohort studies. Am. J. Clin. Nutr. 2015, doi:10.3945/ajcn.113.067157.
Nutrients 2015, 7 4893 58. Dong, J.Y.; Zhang, L.; He, K.; Qin, L.Q. Dairy consumption and risk of breast cancer: A
meta-analysis of prospective cohort studies. Breast Cancer Res. Treat. 2011, 127, 23–31. 59. Genkinger, J.M.; Wang, M.; Li, R.; Albanes, D.; Anderson, K.E.; Bernstein, L.;
van den Brandt, P.A.; English, D.R.; Freudenheim, J.L.; Fuchs, C.S.; et al. Dairy products and pancreatic cancer risk: A pooled analysis of 14 cohort studies. Ann. Oncol. 2014, 25, 1106–1115.
60. Liu, J.; Tang, W.; Sang, L.; Dai, X.; Wei, D.; Luo, Y.; Zhang, J. Milk, yogurt, and lactose intake and ovarian cancer risk: A meta-analysis. Nutr. Cancer 2014, 67, 68–72.
61. Li, F.; An, S.L.; Zhou, Y.; Liang, Z.K.; Jiao, Z.J.; Jing, Y.M.; Wan, P.; Shi, X.J.; Tan, W.L. Milk and dairy consumption and risk of bladder cancer: A meta-analysis. Urology 2011, 78, 1298–1305.
62. Mao, Q.Q.; Dai, Y.; Lin, Y.W.; Qin, J.; Xie, L.P.; Zheng, X.Y. Milk consumption and bladder cancer risk: A meta-analysis of published epidemiological studies. Nutr. Cancer 2011, 63, 1263–1271.
63. Gallagher, E.J.; LeRoith, D. Minireview: IGF, insulin, and cancer. Endocrinology 2011, 152, 2546–2551.
64. Cohen, D.H.; LeRoith, D. Obesity, type 2 diabetes, and cancer: The insulin and IGF connection. Endocr. Relat. Cancer 2012, 19, F27–F45.
65. Qin, L.Q.; He, K.; Xu, J.Y. Milk consumption and circulating insulin-like growth factor-I level: A systematic literature review. Int. J. Food Sci. Nutr. 2009, 60, 330–340.
66. Peterlik, M.; Grant, W.B.; Cross, H.S. Calcium, vitamin D and cancer. Anticancer Res. 2009, 29, 3687–3698.
67. Parodi, P.W. A role for milk proteins and their peptides in cancer prevention. Curr. Pharm. Des. 2007, 13, 813–828.
68. Tsuda, H.; Sekine, K.; Ushida, Y.; Kuhara, T.; Takasuka, N.; Iigo, M.; Han, B.S.; Moore, M.A. Milk and dairy products in cancer prevention: Focus on bovine lactoferrin. Mutation Res. 2000, 462, 227–233.
69. Lee, K.W.; Lee, H.J.; Cho, H.Y.; Kim, Y.J. Role of the conjugated linoleic acid in the prevention of cancer. Crit. Rev. Food Sci. Nutr. 2005, 45, 135–144.
70. Lampe, J.W. Dairy products and cancer. J. Am. Coll. Nutr. 2011, 30, 464S–470S. 71. Hu, D.; Huang, J.; Wang, Y.; Zhang, D.; Qu, Y. Dairy foods and risk of stroke: A meta-analysis
of prospective cohort studies. Nutr. Metab. Cardiovasc. Dis. 2014, 24, 460–469. 72. Strazzullo, P.; D’Elia, L.; Cairella, G.; Garbagnati, F.; Cappuccio, F.P.; Scalfi, L. Excess body
weight and incidence of stroke meta-analysis of prospective studies with 2 million participants. Stroke 2010, 41, e418–e426.
73. Massey, L.K. Dairy food consumption, blood pressure and stroke. J. Nutr. 2001, 131, 1875–1878.
74. Caroli, A.; Poli, A.; Ricotta, D.; Banfi, G.; Cocchi, D. Invited review: Dairy intake and bone health: A viewpoint from the state of the art. J. Dairy Sci. 2011, 94, 5249–5262.
75. Rizzoli, R. Dairy products, yogurts, and bone health. Am. J. Clin. Nutr. 2014, 99, 1256S–1262S. 76. Hedrick, V.E.; Dietrich, A.M.; Estabrooks, P.A.; Savla, J.; Serrano, E.; Davy, B.M. Dietary
biomarkers: Advances, limitations and future directions. Nutr. J. 2012, 11, 109. 77. Strimbu, K.; Tavel, J.A. What are biomarkers? Curr. Opin. HIV/AIDS 2010, 5, 463–466.

Nutrients 2015, 7 4894 78. Wolk, A.; Vessby, B.; Ljung, H.; Barrefors, P. Evaluation of a biological marker of dairy fat
intake. Am. J. Clin. Nutr. 1998, 68, 291–295. 79. Smedman, A.E.; Gustafsson, I.B.; Berglund, L.G.; Vessby, B.O. Pentadecanoic acid in serum as
a marker for intake of milk fat: Relations between intake of milk fat and metabolic risk factors. Am. J. Clin. Nutr. 1999, 69, 22–29.
80. Wolk, A.; Furuheim, M.; Vessby, B. Fatty acid composition of adipose tissue and serum lipids are valid biological markers of dairy fat intake in men. J. Nutr. 2001, 131, 828–833.
81. Brevik, A.; Veierod, M.B.; Drevon, C.A.; Andersen, L.F. Evaluation of the odd fatty acids 15:0 and 17:0 in serum and adipose tissue as markers of intake of milk and dairy fat. Eur. J. Clin. Nutr. 2005, 59, 1417–1422.
82. Biong, A.S.; Berstad, P.; Pedersen, J.I. Biomarkers for intake of dairy fat and dairy products. Eur. J. Lipid Sci. Technol. 2006, 108, 827–834.
83. Sun, Q.; Ma, J.; Campos, H.; Hu, F.B. Plasma and erythrocyte biomarkers of dairy fat intake and risk of ischemic heart disease. Am. J. Clin. Nutr. 2007, 86, 929–937.
84. Warensjö, E.; Jansson, J.H.; Cederholm, T.; Boman, K.; Eliasson, M.; Hallmans, G.; Johansson, I.; Sjögren, P. Biomarkers of milk fat and the risk of myocardial infarction in men and women: A prospective, matched case-control study. Am. J. Clin. Nutr. 2010, 92, 194–202.
85. Aslibekyan, S.; Campos, H.; Baylin, A. Biomarkers of dairy intake and the risk of heart disease. Nutr. Metab. Cardiovasc. Dis. 2012, 22, 1039–1045.
86. de Oliveira Otto, M.C.; Nettleton, J.A.; Lemaitre, R.N.; M. Steffen, L.; Kromhout, D.; Rich, S.S.; Tsai, M.Y.; Jacobs, D.R.; Mozaffarian, D. Biomarkers of dairy fatty acids and risk of cardiovascular disease in the multi-ethnic study of atherosclerosis. J. Am. Heart Assoc. 2013, 2, e000092.
87. Santaren, I.D.; Watkins, S.M.; Liese, A.D.; Wagenknecht, L.E.; Rewers, M.J.; Haffner, S.M.; Lorenzo, C.; Hanley, A.J. Serum pentadecanoic acid (15:0), a short-term marker of dairy food intake, is inversely associated with incident type 2 diabetes and its underlying disorders. Am. J. Clin. Nutr. 2014, 100, 1532–1540.
88. Yakoob, M.Y.; Shi, P.; Hu, F.B.; Campos, H.; Rexrode, K.M.; Orav, E.J.; Willett, W.C.; Mozaffarian, D. Circulating biomarkers of dairy fat and risk of incident stroke in U.S. men and women in 2 large prospective cohorts. Am. J. Clin. Nutr. 2014, 100, 1437–1447.
89. Ratnayake, W.N. Concerns about the use of 15:0, 17:0, and trans-16:1n-7 as biomarkers of dairy fat intake in recent observational studies that suggest beneficial effects of dairy food on incidence of diabetes and stroke. Am. J. Clin. Nutr. 2015, 101, 1102–1103.
90. Lankinen, M.; Schwab, U. Biomarkers of dairy fat. Am. J. Clin. Nutr. 2015, 101, 1101–1102. 91. Tholstrup, T.; Høy, C.E.; Andersen, L.N.; Christensen, R.D.K.; Sandström, B. Does fat in milk,
butter and cheese affect blood lipids and cholesterol differently? J. Am. Coll. Nutr. 2004, 23, 169–176.
92. Hjerpsted, J.; Leedo, E.; Tholstrup, T. Cheese intake in large amounts lowers LDL-cholesterol concentrations compared with butter intake of equal fat content. Am. J. Clin. Nutr. 2011, 94, 1479–1484.
93. Gibney, M.J.; Walsh, M.; Brennan, L.; Roche, H.M.; German, B.; van Ommen, B. Metabolomics in human nutrition: Opportunities and challenges. Am. J. Clin. Nutr. 2005, 82, 497–503.
Nutrients 2015, 7 4895 94. Zheng, H.; Yde, C.C.; Arnberg, K.; Mølgaard, C.; Michaelsen, K.F.; Larnkjær, A.; Bertram, H.C.
NMR-based metabolomic profiling of overweight adolescents: An elucidation of the effects of inter-/intraindividual differences, gender, and pubertal development. BioMed. Res. Int. 2014, doi:10.1155/2014/537157.
95. PubMed. Available online: http://www.ncbi.nlm.nih.gov-pubmed (accessed on 7 May 2015). 96. EMBASE. Available online: http://www.embase.com (accessed on 7 May 2015). 97. SCOPUS. Available online: http://www.scopus.com (accessed on 7 May 2015). 98. Guertin, K.A.; Moore, S.C.; Sampson, J.N.; Huang, W.Y.; Xiao, Q.; Stolzenberg-Solomon, R.Z.;
Sinha, R.; Cross, A.J. Metabolomics in nutritional epidemiology: Identifying metabolites associated with diet and quantifying their potential to uncover diet-disease relations in populations. Am. J. Clin. Nutr. 2014, doi:10.3945/ajcn.113.078758.
99. Bertram, H.C.; Hoppe, C.; Petersen, B.O.; Duus, J.Ø.; Mølgaard, C.; Michaelsen, K.F. An NMR-based metabonomic investigation on effects of milk and meat protein diets given to 8-year-old boys. Br. J. Nutr. 2007, 97, 758–763.
100. Pedersen, S.M.; Nielsen, N.C.; Andersen, H.J.; Olsson, J.; Simrén, M.; Öhman, L.; Svensson, U.; Malmendal, A.; Bertram, H.C. The serum metabolite response to diet intervention with probiotic acidified milk in irritable bowel syndrome patients is indistinguishable from that of non-probiotic acidified milk by 1H NMR-based metabonomic analysis. Nutrients 2010, 2, 1141–1155.
101. Pedersen, S.M.M.; Nebel, C.; Nielsen, N.C.; Andersen, H.J.; Olsson, J.; Simrén, M.; Öhman, L.; Svensson, U.; Bertram, H.C.; Malmendal, A. A GC-MS-based metabonomic investigation of blood serum from irritable bowel syndrome patients undergoing intervention with acidified milk products. Eur. Food Res. Technol. 2011, 233, 1013–1021.
102. Zheng, H.; Yde, C.C.; Dalsgaard, T.K.; Arnberg, K.; Mølgaard, C.; Michaelsen, K.; Larnkjær, A.; Bertram, H.C. Nuclear magnetic resonance-based metabolomics reveals that dairy protein fractions affect urinary urea excretion differently in overweight adolescents. Eur. Food Res. Technol. 2015, 240, 489–497.
103. Piccolo, B.D.; Comerford, K.B.; Karakas, S.E.; Knotts, T.A.; Fiehn, O.; Adams, S.H. Whey protein supplementation does not alter plasma branched-chained amino acid profiles but results in unique metabolomics patterns in obese women enrolled in an 8-week weight loss trial. J. Nutr. 2015, 145, 691–700.
104. Zheng, H.; Lorenzen, J.K.; Astrup, A.; Larsen, L.H.; Yde, C.C.; Clausen, M.R.; Bertram, H.C. Aarhus University, Aarslev, Denmark. Unpublished work, 2015.
105. Hjerpsted, J.; Ritz, C.; Schou, S.; Tholstrup, T.; Dragsted, L. Effect of cheese and butter intake on metabolites in urine using an untargeted metabolomics approach. Metabolomics 2014, 10, 1176–1185.
106. Zheng, H.; Yde, C.C.; Clausen, M.R.; Kristensen, M.; Lorenzen, J.; Astrup, A.; Bertram, H.C. Metabolomics investigation to shed light on cheese as a possible piece in the French paradox puzzle. J. Agric. Food Chem. 2015, 63, 2830–2839.
107. Yde, C.C.; Ditlev, D.B.; Reitelseder, S.; Bertram, H.C. Metabonomic response to milk proteins after a single bout of heavy resistance exercise elucidated by 1H nuclear magnetic resonance spectroscopy. Metabolites 2013, 3, 33–46.

Nutrients 2015, 7 4896 108. Stanstrup, J.; Rasmussen, J.; Ritz, C.; Holmer-Jensen, J.; Hermansen, K.; Dragsted, L. Intakes of
whey protein hydrolysate and whole whey proteins are discriminated by LC-MS metabolomics. Metabolomics 2014, 10, 719–736.
109. Stanstrup, J.; Schou, S.S.; Holmer-Jensen, J.; Hermansen, K.; Dragsted, L.O. Whey protein delays gastric emptying and suppresses plasma fatty acids and their metabolites compared to casein, gluten, and fish protein. J. Proteome Res. 2014, 13, 2396–2408.
© 2015 by the authors; licensee MDPI, Basel, Switzerland. This article is an open access article distributed under the terms and conditions of the Creative Commons Attribution license (http://creativecommons.org/licenses/by/4.0/).
Related Documents